Embed Size (px)
Citation preview

FINAL REPORT TO THE UNIVERSITY OF HAWAIʻI AT HILO
Temporal variation in recruitment & condition of cabezon (Scorpaenichthys
marmoratus) along the Oregon Coast
Aliona Megedyuk
Marine Science Department
University Of Hawaiʻi at Hilo
2018 Hatfield Marine Science Center REU Intern
INTERNSHIP ADVISOR
Lisa Parr
Marine Science Department
University Of Hawaiʻi at Hilo
INTERNSHIP MENTORS
Megan Wilson
Ph.D Candidate
Department of Integrative Biology
Oregon State University
Will Fennie
Ph.D Student
Department of Integrative Biology
Oregon State University
Dr. Su Sponaugle
Professor
Department of Integrative Biology
Oregon State University

1
Abstract
Research on survivorship of marine fish larvae is challenging due to the small size and rarity of
larvae, thus drivers of fluctuations in recruitment magnitude are largely unknown. Plausible
causes for fluctuations could be varying sea surface temperatures (SST) and diet. Previous
research has suggested that analyzing otoliths (ear stones) can be used to understand fish
condition as otoliths are used for motility and stability. The objective for this study was to
determine if diet contributed to an increase or decrease of larval fish settlement. Newly settled
cabezon juveniles collected weekly from Standard Monitoring Units for the Recruitment of
Fishes (SMURFs) were used to examine how recruitment varies relative to the local
oceanographic indices like SST, North Copepod Abundance and Copepod Community Index.
Furthermore, condition of juveniles was estimated from a comparison of asymmetry by imaging
50 sagittall otoliths using ImagePro software and transcribing images into 12 harmonics (for
98.5% shape accuracy) that generated 45 Normalized Ellipictical Fourier coefficients for all
otoliths using shapeR. A significant relationship showed that mean and max recruitment rate was
proportional to the annual index of SST. There was no significant relationship between otolith
asymmetry shape discriptors and oceanographic indicies, however, analysis of otolith shape
using Fast Fourier techniques shows potential for tracing fish condition for underlying ocean
conditions. Our non-significant trend suggests cabezon recruit in greater volume in wamer SST,
however, fast growth could lead to malnutrition in cabezon resulting in mortalilty after the
settling stages. This study was the first to examine the relationship of recruitment magnitude and
recruit condition, and determining oceanographic conditions most responsible in affecting larval
survival. This research can further help investivigate recruitment sucess for a variety of fish
populations and creating sustainable fish stocks as SST rises due to anthropogenic climate
change. Furthermore, additional time series and otolith microstructure analysis are planned to
disentangle larval growth from condition under variable oceanographic conditions.
Keywords: Recruitment rate, otolith asymmetry, larval fish mortality, developmental success,
cabezon
2
Introduction
Research on larval fish is difficult due to many unknowns about survival, diet, dispersal,
and recruitment. Early life history stages in fish experience the highest mortality, where any
variation in oceanographic conditions can drastically affect recruitment rates and habitat
selection, thus affecting population in coastal fisheries (Houde 1987; Halpern & Waren 2002;
Cowen & Sponaugle 2009). Over the past century, a suite of hypotheses have suggested that the
primary causes of larval mortality are: starvation, low prey abundance, and unstable, unfavorable
oceanographic conditions (Hjort 1914; Cushing 1975; Lasker 1975; 1978). Other hypotheses
suggest that increased survival is correlated with higher levels of upwelling, highly turbulent
events, and the coincidence of spawning events with suitable oceanographic conditions (Houde
1987). Upwelling occurs when warm surface waters near coasts are displaced offshore via
Ekman transport, causing cooler, nutrient-rich subsurface waters to be brought into the near-
shore photic zone (Huyer 1983). The influx of nutrients stimulates phytoplankton growth which
translates up the food web and increases prey availability for pelagic larvae.
There can be significant variability in an upwelling system with consequences for larval
success. For example, particular portions of an upwelling system can sustain high levels of
consistent upwelling, while upwelling in other portions of a coast can be highly seasonal,
creating differences in larval survival and recruitment rates across the larger system. For
decades, researchers have hypothesized that larval distribution patterns can be predicted in areas
with intermittent upwelling; however, recent research suggests that this hypothesis is
questionable, and that biological indicators of oceanography can be used to predict variability in
settlement magnitude (Shanks & Morgan 2017).

3
Copepod abundance, copepod community structure, and sea surface temperature (SST) all
impact larval feeding and growth rates because their short life cycles allow them to reflect event-
scale changes in climate or predator-prey distributions (Hooff & Peterson 2006). Copepod
abundance can determine whether larval fish survive solely due to the amount of food that is
present at that given time. Copepod biodiversity or community structure in a particular water
mass can indicate from where the water mass was transported (Peterson 2009). SST also reflects
water mass origin and often has a direct effect on larval success due to the relationship between
temperature, development, and growth rates (Sponaugle et al. 2006). Assuming access to
abundant prey, organisms that experience higher temperatures have faster growth and
developmental rates, allowing them to settle sooner than expected. While higher temperatures
can increase recruitment rates and population connectivity for some species, such temperatures
can also have a negative effect on larvae that are dependent on cold water temperatures (Quinn &
Rochette 2015). It is often difficult to examine the oceanographic conditions that have significant
impacts on settlement magnitude; however, we can obtain some indications about events
occurring during the life of larval fishes through the examination of their otoliths (ear stones)
(Sponaugle 2010).
One measure of organism condition is via the study of symmetry. Symmetry is viewed as
an ideal form while asymmetry is seen as impurities to the ideal form (Somarakis et al. 1997).
Comparison of the paired otoliths of a fish enables the calculation of the degree of asymmetry,
which can reveal discrepancies in bilateral symmetry. In fish, environmental stress can affect
larvae as they are dispersed offshore, influencing their ability to settle. Previous studies have
found a direct relationship between environmental stress and biological change, e.g., food
availability, temperature, and predator-prey distributions, as reflected in higher levels of

4
asymmetry (Escós et al. 1995; Somarakis et al. 1997). Lemberget & McCormick (2009) found
that asymmetry in the Caribbean lizardfish, Saurida suspicio (family Synodontidae), was
strongly correlated with recruitment fluctuations. While previous research has shown that stress
can induce asymmetry, it remains unclear which oceanographic processes induce higher degrees
of asymmetry, and whether such asymmetry influences recruitment magnitude.
In the present study we explored the relationship between recruitment magnitude,
asymmetry, and oceanographic indices. We hypothesized that annual mean cabezon recruitment
and condition will be higher during years with higher proportions of high quality copepods.
Lipid-rich copepods are usually found in cooler upwelled waters, thus providing a higher
nutritional source for the pelagic food web that includes cabezon, whereas warmer waters
support copepods with lower lipid reserves (Peterson et al. 2012). Thus, we expected recruitment
of cabezon to be higher during low SSTs and to have higher condition.
Methods
Study Species: Scorpaenichthys marmoratus
We selected cabezon, Scorpaenichthy marmoratus, for this study because it recruits
regularly to the coast of Oregon each spring-summer recruitment season, providing a robust
time-series for analysis. Cabezon spawn throughout the year; spawning commences in October,
peaks in January, and continues until April (Lauth 1988). Currents can displace the larvae in
pelagic waters roughly 200 miles offshore while downwelling conditions can cause post-
larvae to appear in near-shore habitats such as tidepools and kelp beds. Larvae prey upon
barnacle larvae, nauplii, amphipods, decapods, euphusiids, and larval fish prior to settlement

5
(Barraclough 1967). Cabezon recruit back to settlement areas annually from April to September
(Lauth 1988).
Study Sites
The California Current System (CCS) is an eastern boundary current system that spans
coastal waters beginning from southern Alaska (~50°N) and flowing toward Baja California
(~15-25°N). The CCS is characterized by seasonal productivity driven by wind-driven (Ekman
transport) upwelling in spring and summer periods, and is limited to narrow coastal bands
ranging from 10-25 km wide. In the Northern CCS, upwelling is more variable than the southern
parts of the CCS; instead of occurring strongly for an entire season like in the southern CCS,
upwelling occurs for a short period of time (a few days) followed by a relaxation event
throughout the upwelling season (Huyer 1983; Checkley & Barth 2009).
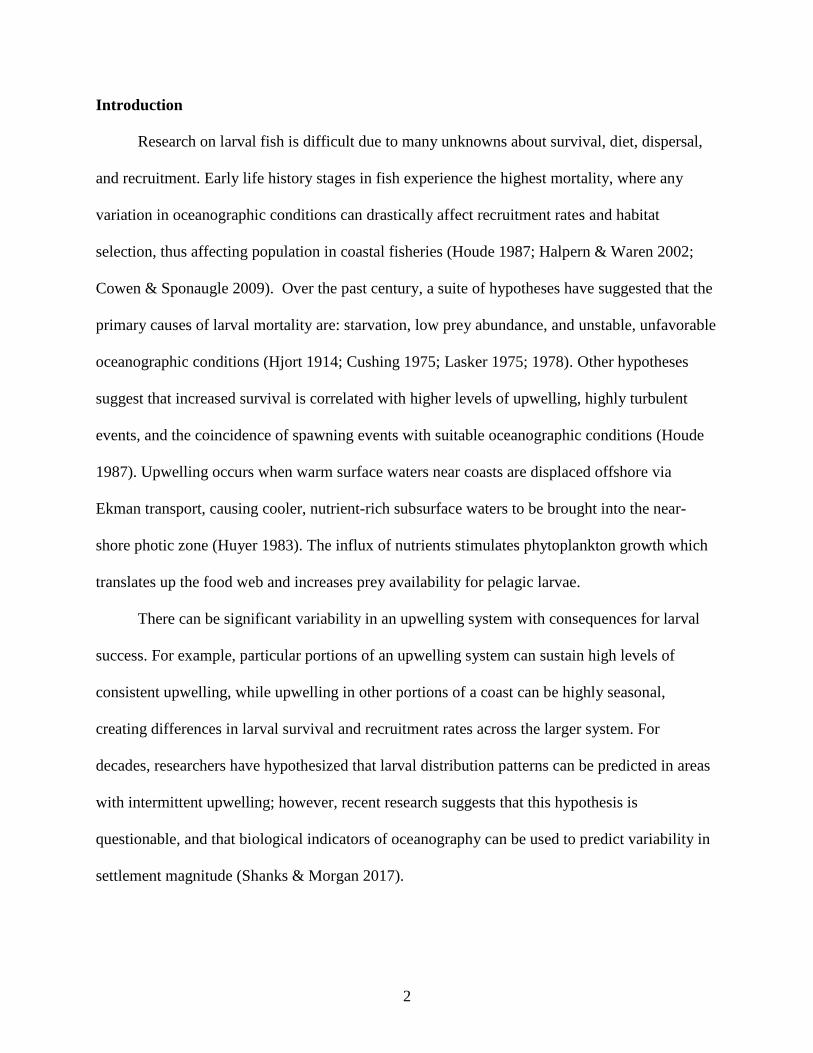
Fish recruitment was monitored along the Oregon coast in two central locations (Fig. 1):
Otter Rock (44°42’34.73” N, 124°04’53.74” W) and Cape Foulweather (44°46’21.00” N,
124°04’33.57” W) over 6 years (2012-2017) via access to the R/V Gracie Lynn . Both Otter
Rock and Cape Foulweather have rocky intertidal habitats, emergent rocks, have patches of kelp,
and are subject to relatively low pressures from fisheries. Due to their central location, they
experience more variable upwelling conditions.
Patterns of recruitment
Four Standard Monitoring Units for the Recruitment of Fishes (SMURFs) were placed at
each location to measure recruitment of all benthic fishes including cabezon from April to
September of each year (Fig. 2). SMURFs imitate areas of suitable settlement habitats (e.g. kelp

6
fronds), thereby attracting young fish during the transition from their pelagic to benthic life
stages. Methodology and construction were based on established SMURF design (Ammann
2004).
The SMURFs, retrieved by snorkeling, were sampled approximately every two weeks
throughout the sampling season. Removal involved encasing the SMURF with a Benthic
Ichthyofauna Net for Coral/Kelp Environments (BINCKE) and then the SMURF was detached
where it was brought on board and water was poured onto the SMURF while shaking to release
any trapped fish or invertebrates and into the BINCKE. All fish species were collected and were
humainly euthanized using MS-222, an anesthetic used for muscle relaxation in fish . Later, fish
were identified to species or species complex using the methods described by Matarese (1989),
and their standard lengths were measured to the nearest hundredth of a millimeter. SMURF
collections were made from 2012-2018, however 2018 collections were not used in the analysis
because the recruitment season was not completed.
Recruitment Analysis
Recruitment rate (fish/SMURF/day) was calculated and annual oceanographic indices
obtained (Peterson et al. 2017;
www.nwfsc.noaa.gov/research/divisions/fe/estuarine/oeip/documents/Annual_Report_2017.pdf)
for each of the 6 years. For the purposes of this study, we used three primary indices: northern
copepod abundance, copepod community index, and SST. The relationships between annual
mean and max rates of recruitment and these three oceanographic indices (Table 1) were
modeled using linear regression.

7
Otolith Asymmetry Analysis
Given time constraints, otolith asymmetry was examined for individuals from both
central sites combined. Otoliths from 10 individuals were analyzed from each of 6 years
spanning variable oceanographic conditions. Otolith dissection involved an incision made ~5
mm above their eyes to near the beginning of the dorsal fin. Otoliths were extracted and placed
in a Petri dish where they were cleaned using a dissecting microscope and placed in a labeled
vial with 1 mL of 95% ethanol solution. The right and left sagittal otoliths of each individual
were imaged using a dissecting microscope and Image Pro Plus 10.
The package shapeR, written in the programming language R, was used to outline otolith
images and measure otolith shape descriptors including perimeter, area, length, width. Fast
Fourier harmonics were used to describe the shape of the otolith (Libungan & Pálsson 2015).
Fourier analysis is a complex waveform expressed as a series of sinusoidal functions where the
frequencies form a harmonic series. The addition of harmonics increases detail of the description
of the shape; however, it is best to describe the shape best as possible with the fewest number of
terms (Campana & Casselman, 1999). Each otolith shape descriptor was recorded for the right
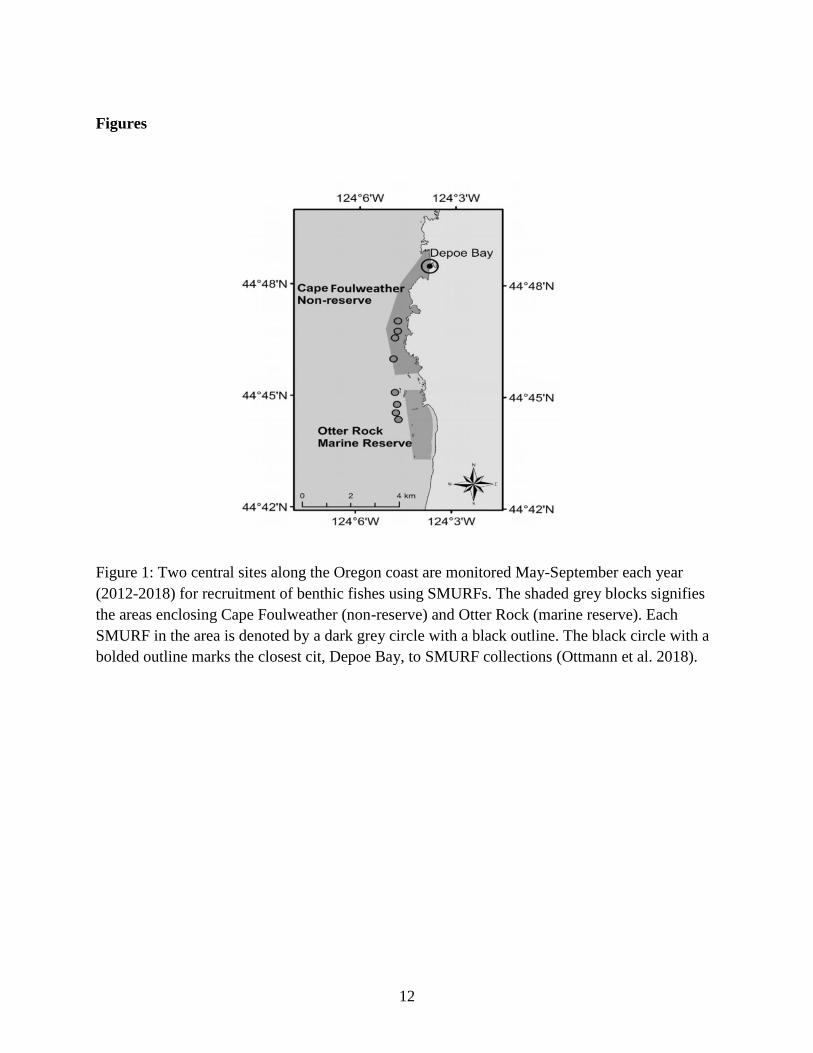
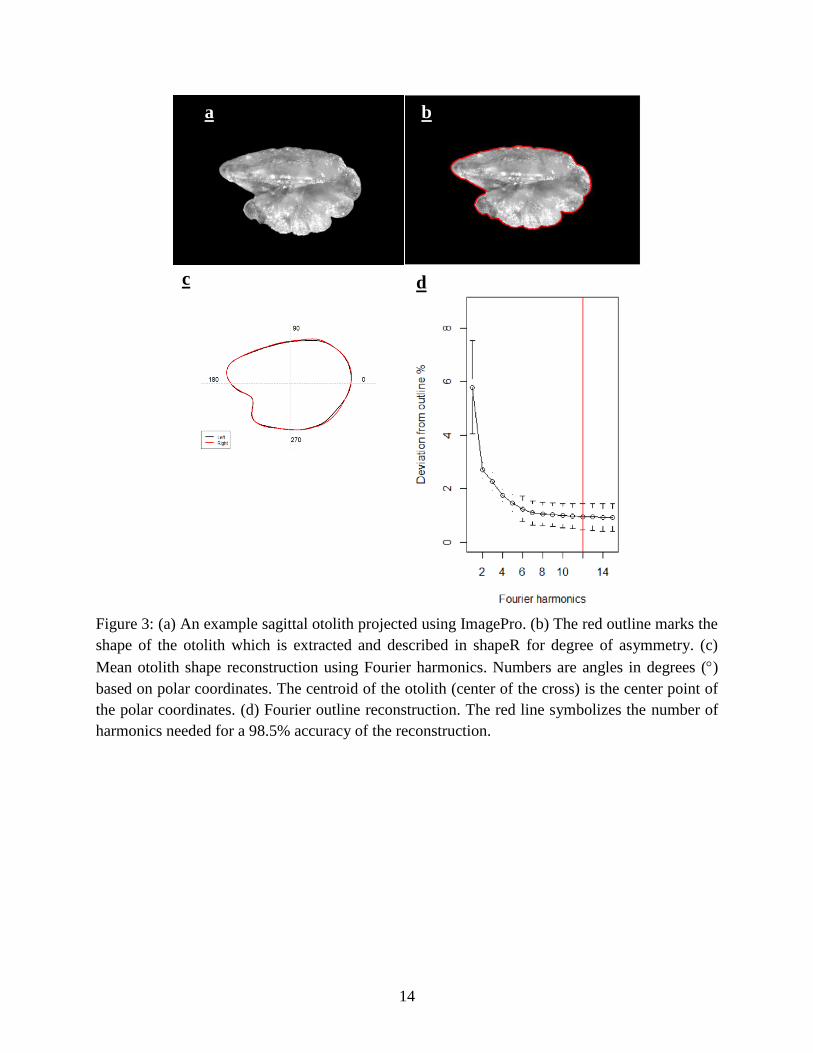
and left otolith (Fig. 3a). Twelve harmonics generated 48 Elliptic Fourier coefficients in shapeR
(Fig. 3d), where the first three were omitted due to standardization of size, rotation, and starting
point, leaving 45 Normalized Elliptic Fourier coefficients (Libungan & Pálsson 2015). In
shapeR, the Fourier analysis contoured the otolith (Fig. 3b), and the outline was extracted. The
values for the first 12 harmonics were then summed for each descriptor, and the degree of
asymmetry calculated by finding the absolute value of the difference between the right and left
descriptors. Otoliths that the shape analysis program failed to accurately outline were removed
from our analysis resulting in a total sample size of 50 otoliths. Finally, an ANOVA was used to

8
model the relationship between degree of asymmetry (as perimeter, area, length, width), and 12
Fourier harmonics were used to describe the shape comparing degrees of asymmetry to SST,
north copepod abundance, and copepod community index.
Results
Cabezon recruitment rate varied across the six years of the study (Fig. 4) and appeared to
generally track the oceanographic indices (Fig. 5); however, there was no significant relationship
between recruitment rate and two of the indices: northern copepod abundance and copepod
community index (Table 1). Recruitment rate increased significantly with SST (Fig. 6; P =
0.0382; R2
= 0.699, respectively).
Twelve Fourier harmonics were used to obtain a 98.5% confidence interval (Fig. 3d).
None of the four otolith descriptors were significantly related to any of the oceanographic indices
(Table 2). Otolith shape as described by the 12 Fourier harmonics performed the most
consistently across the three oceanographic indices (Fig. 7).
Discussion
Cabezon recruitment rate varied over the 6-year period, and was highest in 2015 and
2016. Compared to previous years (Ottmann et al. 2018), recruitment of cabezon in 2017 was
very low. High recruitment corresponded to years of high SST and this was evident in significant
relationships between both mean and maximum recruitment and SST. High water temperatures
may increase reproductive output of spawning cabezon as has been shown for other species
(Laurel et al. 2008) Alternatively, survival of larvae may be enhanced in warm waters. High
temperatures are known to increase growth rates in poikilothermic organisms such as fish.
Assuming larvae have access to sufficient food, these high growth rates would result in larger

9
sizes as a given age and shorter pelagic larval durations, both of which generally reduce
predation mortality (Anderson 1988, Houde 1989), and would lead to higher recruitment. We do
not have access to data on daily growth to test this hypothesis, but used otolith asymmetry as a
proxy for condition.
Although the relationships between otolith asymmetry (via each shape descriptor) and
oceanographic conditions were not significant, each descriptor showed a trend with one of the
oceanographic indices; however, the models including Fourier descriptors consistently
performed better than models with other shape descriptors. That is, the degree of asymmetry
calculated with Fourier descriptors more closely aligned with all three of the oceanographic
indices. If more data confirmed this non-significant trend, the data would suggest that years with
high cabezon recruitment and higher SST correspond to years with a higher degree of asymmetry
for cabezon (and thus poorer condition individuals). This is somewhat contradictory to what fast
growth might suggest, but it is possible that fast growth during these warm years is only barely
sustained and that the supply or quality of prey items may be insufficient to produce high-
condition individuals. Under this hypothesis, in years of high SST, individuals sacrifice better
condition for faster growth. Indeed, previous studies have confirmed this phenomenon for other
species (Leggett & Debloise 1994). For cabezon in our system, more sampling years and higher
resolution oceanographic indices are required to fully test this hypothesis.
If this trend is found to be significant, these data could be used to improve our
understanding of the factors that are conductive to successful recruitment and condition, and
ultimately, to better predict population dynamics. High pulses of recruitment may not contribute
as much to sustaining the population if recruits are of low condition and do not survive early
benthic life. Thus, measuring recruitment and recruit condition together with oceanographic

10
conditions should provide a more robust measurement of population replenishment. Inclusion of
otolith microstructure analysis to examine growth simultaneously with condition would also
greatly improve our ability to distinguish the processes occurring during the early life of
cabezon.
In summary, cabezon appear to recruit in greater numbers during years of warmer water
temperatures, but the mechanism behind this observation is unclear. Otolith asymmetry data are
suggestive that while recruits are more abundant, their condition may be lower. More sampling
years and otolith microstructure analysis are required to further test this concept. This study was
the first attempt to examine recruitment magnitude together with individual recruit condition and
shows promise for revealing the oceanographic conditions most important in influencing
recruitment success.
Acknowledgements
This project was funded by the Department of Defense and the 2018 NSF- REU program hosted
at OSU- Hatfield Marine Science Center. I would like to sincerely thank Megan Wilson and Su
Sponaugle for their guidance and help throughout the project. I would also like to thank Will
Fennie for field assistance, and the entire community of Hatfield Marine Science Center for their
constant support and abundant resources.

11
Tables
Table 1: Data rank score derived from Peterson et al. (2012) based on long-term time-series of
oceanographic and plankton sampling. Data rank scores of Sea Surface Temperature, North
Copepod Abundance, and Copepod Community Index where values 1-10 reflect good
conditions, 11-15 reflect intermediate conditions, and 16-20 reflect poor oceanographic
conditions. Cabezon abundance shows the yield of juvenile cabezon caught in SMURFs for each
year.
Table 2: Results for otolith asymmetry analysis depicting the P and R2
for North Copepod
Abundance, Copepod Community Index, and Sea Surface Temperature. The bolded values
indicate a significant difference.
t
Year SST N. Copepod Abundance Copepod Community Index Cabezon Abundance
2012 12 2 8 24
2013 13 4 4 127
2014 14 5 11 65
2015 19 16 18 241
2016 18 20 20 268
2017 6 17 16 46
P R2 P R
2 P R2
Recruitment Rate 0.18 0.074 0.118 0.074 0.034 0.174
Otolith Perimeter 0.76 0.026 0.882 0.006 0.255 0.306
Otolith Width 0.15 0.446 0.334 0.232 0.82 0.17
Otolith Length 0.39 0.188 0.135 0.466 0.927 0.002
Otolith Area 0.84 0.012 0.464 0.141 0.61 0.071
Otolith Fourier 0.12 0.494 0.127 0.479 0.186 0.388
North Copepod Abundance Copepod Community Index SST
12
Figures
Figure 1: Two central sites along the Oregon coast are monitored May-September each year
(2012-2018) for recruitment of benthic fishes using SMURFs. The shaded grey blocks signifies
the areas enclosing Cape Foulweather (non-reserve) and Otter Rock (marine reserve). Each
SMURF in the area is denoted by a dark grey circle with a black outline. The black circle with a
bolded outline marks the closest cit, Depoe Bay, to SMURF collections (Ottmann et al. 2018).

13
Figure 2: (a) A SMURF resembling an artificial kelp bed used for measuring recruitment in
Cape Foulweather and Otter Rock. (b) Diagram of SMURF deployment in the water column
(Ammann 2004).
a
b a
a b
14
Figure 3: (a) An example sagittal otolith projected using ImagePro. (b) The red outline marks the
shape of the otolith which is extracted and described in shapeR for degree of asymmetry. (c)
Mean otolith shape reconstruction using Fourier harmonics. Numbers are angles in degrees ()
based on polar coordinates. The centroid of the otolith (center of the cross) is the center point of
the polar coordinates. (d) Fourier outline reconstruction. The red line symbolizes the number of
harmonics needed for a 98.5% accuracy of the reconstruction.
c
a
b
d

15
Figure 4: Time-series of mean annual recruitment of cabezon over the period 2012-2017 as
measured by the number of individuals arriving to replicate SMURFs deployed along the central
Oregon coast.
0
0.2
0.4
0.6
0.8
1
1.2
2012 2013 2014 2015 2016 2017
Mea
n R
ecru
itm
ent
Rat
e (F
ish/S
MR
UF
/Day
)

16
Figure 5: Time-series of annual mean and maximum cabezon recruitment rate together with
annual variations in oceanographic indices (Peterson et al. 2017; from NOAA;
www.nwfsc.noaa.gov/research/divisions/fe/estuarine/oeip/documents/Annual_Report_2017.pdf).
0
0.2
0.4
0.6
0.8
1
2012 2013 2014 2015 2016 2017
Mea
n R
ecru
itm
ent
Rat
e (F
ish/S
MU
RF
/Day
)
0
5
10
15
20
25
2012 2013 2014 2015 2016 2017
Co
pep
od
Co
mm
unit
y I
nd
ex
0
5
10
15
20
25
2012 2013 2014 2015 2016 2017
Nort
h C
opep
od
Abun
dan
ce
0
5
10
15
20
25
2012 2013 2014 2015 2016 2017
SS
T

17
Figure 6: Mean annual cabezon recruitment rate to the central Oregon coast as a function of SST
index. (Peterson et al. 2017; from NOAA;
www.nwfsc.noaa.gov/research/divisions/fe/estuarine/oeip/documents/Annual_Report_2017.pdf).
0
0.1
0.2
0.3
0.4
0.5
0.6
0.7
0.8
0.9
1
0 5 10 15 20
Mea
n R
ecru
itm
ent
Rat
e
(fis
h/S
MU
RF
/day
)
SST
P = 0.0382 R2
= 0.699

18
0
0.05
0.1
0.15
0.2
0.25
0.3
0.35
0 5 10 15 20 25
Fo
uri
er A
sym
met
ry
North Copepod Abundance
0
0.05
0.1
0.15
0.2
0.25
0.3
0.35
0 5 10 15 20
Fo
uri
er A
sym
met
ry
SST
0
0.05
0.1
0.15
0.2
0.25
0.3
0.35
0 5 10 15 20 25
Fo
uri
er A
sym
met
ry
Copepod Community Index
Figure 7: Relationship between the mean otolith asymmetry values from Fourier harmonics and
(a) copepod community index (b) northern copepod abundance (c) SST. No relationship was
significant; a non-significant trend line is shown for visual purposes only.
R² = 0.5523 P = 0.127
R² = 0.5421 P = 0.113
R² = 0.2808 P = 0.1862
a b
c

19
References
Anderson JT (1988) A review of size dependent survival during pre-recruit stages of fishes in
relation to recruitment. Journal of Northwest Atlantic Fishery Science 8:55–66
Ammann AJ (2004) SMURFs: standard monitoring units for the recruitment of temperate reef
fishes. Journal of Experimental Marine Biology and Ecology 299:135–154
Barraclough WE (1967) Number, size and food of larval and juvenile fish caught with an Isaacs-
Kidd trawl in the surface waters of the Strait of Georgia April 25- 29, 196D. Fisheries
Research Board of Canada Manuscript Report Series No. 926, 79 p.
Campana SE, Casselman JM (1993) Stock discrimination using otolith shape analysis. Canadian
Journal of Fisheries and Aquatic Sciences 50:1062–1083
Checkley DM, Barth JA (2009) Patterns and processes in the California Current System.
Progress in Oceanography 83:49–64
Cowen RK, Sponaugle S (2009) Larval dispersal and marine population connectivity. Annual
Review of Marine Science 1:443–466
Cushing DH (1975) Marine ecology and fisheries. Cambridge University Press, Cambridge
Escós J, Alados CL, Emlen JM, Alderstein S (1995) Developmental instability in the Pacific
Hake parasitized by Myxosporeans Kudoa spp. Transactions of the American Fisheries
Society 124:943–945
Gagliano M, McCormick M (2004) Feeding history influences otolith shape in tropical fish.
Marine Ecology Progress Series 278:291–296
Grebel J, Cailliet G (2010) Age, growth, and maturity of cabezon (Scorpaenichthys marmoratus)
in California. California Fish and Game 96:36–52

20
Halpern BS, Warner RR (2002) Marine reserves have rapid and lasting effects. Ecology Letters
5:361–366
Hjort J (1914) Fluctuations in the great fisheries of Northern Europe, viewed in the light of
biological research. Høst, Copenhague
Hooff RC, Peterson WT (2006) Copepod biodiversity as an indicator of changes in ocean and
climate conditions of the northern California current ecosystem. Limnology and
Oceanography 51:2607–2620
Houde ED (1987) Fish early life dynamics and recruitment variability. American Fisheries
Society Symposium 2:1729
Houde ED (1989) Subtleties and episodes in the early life of fishes. Journal of Fish Biology
35:29–38
Huyer A (1983) Coastal upwelling in the California current system. Progress in Oceanography
12:259–284
Lasker R (1975) Field criteria for survival of anchovy larvae: the relation between inshore
chlorophyll maximum layers and successful first feeding. U.S. Fishery Bulletin 73:453-462.
Lasker R, Zweifel JR (1978) Growth and survival of first-feeding northern anchovy larvae
(Engraulis mordax) in patches containing different proportions of large and small prey.
Spatial Pattern in Plankton Communities 329–354
Laurel BJ, Hurst TP, Copeman LA, Davis MW (2008) The role of temperature on the growth
and survival of early and late hatching Pacific cod larvae (Gadus macrocephalus). Journal
of Plankton Research 30:1051–1060

21
Lauth R (1988) Spawning ecology and nesting behavior of the cabezon, Scorpaenichthys
marmoratus (Ayres) in Puget Sound, Washington. MS thesis, University of Washington,
Seattle, WA.
Lemberget T, McCormick MI, Wilson DT (2009) Environmental influences on the
replenishment of lizardfish (family Synodontidae) in Caribbean Panama. Coral Reefs
28:737–750
Libungan LA, Pálsson S (2015) ShapeR: An R package to study otolith shape variation among
fish populations. Plos One 10
Matarese AC (1989) Laboratory guide to early life history stages of Northeast Pacific fishes.
U.S. Dept. of Commerce, National Oceanic and Atmospheric Administration, National
Marine Fisheries Service, Seattle, WA
Ottmann D, Grorud-Colvert K, Huntington B, Sponaugle S (2018) Interannual and regional
variability in settlement of groundfishes to protected and fished nearshore waters of Oregon,
USA. Marine Ecology Progress Series 598:131–145
Peterson W (2009) Copepod species richness as an indicator of long-term changes in the coastal
ecosystem of the Northern California Current. California Cooperative Oceanic Fisheries
Investigations Reports 50
Peterson WT, Morgan CA, Peterson JO, Fisher JL, Burke BJ, Fresh K, Marine N, Service F, East
MB (2017) Ocean ecosystem indicators of salmon marine survival in the Northern
California Current. Newport Research Station.
Quinn BK, Rochette R (2015) Potential effect of variation in water temperature on development
time of American lobster larvae. ICES Journal of Marine Science: Journal du Conseil
72:i79–i90

22
Shanks AL, Morgan SG (2017) Testing the intermittent upwelling hypothesis: upwelling,
downwelling, and subsidies to the intertidal zone. Ecological Monographs 88:22–35
Somarakis S, Kostikas I, Tsimenides N (1997) Fluctuating asymmetry in the otoliths of larval
fish as an indicator of condition: conceptual and methodological aspects. Journal of Fish
Biology 51:30–38
Sponaugle S (2010) Otolith microstructure reveals ecological and oceanographic processes
important to ecosystem-based management. Environmental Biology of Fishes 89:221–238
Sponaugle S, Grorud-Colvert K, Pinkard D (2006) Temperature-mediated variation in early life
history traits and recruitment success of the coral reef fish Thalassoma bifasciatum in the
Florida Keys. Marine Ecology Progress Series 308:1–15