Embed Size (px)
Citation preview
1
Final Report San Diego County Eye Gnat Research and
Education Project 2014-15 Escondido
Detection and Monitoring of the Eye Gnat Liohippelates collusor and Associated Studies
James A. Bethke, Bryan Vander Mey and Lea Corkidi
University of California Cooperative Extension, San Diego 9335 Hazard Way, Suite 201
San Diego, CA 92123
2
CONTENTS PROJECT LEADERS, OBJECTIVES, AND BACKGROUND 3 INTRODUCTION 4 EXECUTIVE SUMMARY 5 ADULT EYE GNAT POPULATION DENSITY STUDY IN ESCONDIDO 6-8 ADULT EYE GNAT POPULATION SOUTH OF THE FARM DURING THE MONTH OF OCTOBER 9-11 ADULT EYE GNAT ATTRACTION OF DIFFERENT EGG BAIT PRODUCTS 12 EFFECTIVENESS OF SCREENING MATERIAL USED AS A FENCE TO BLOCK ADULT EYE GNAT MOVEMENT 13-14 EXTENSION ACTIVITY 15 APPENDIX I Figures and Photos 16-19 APPENDIX II Weather data 20-24

3
PROJECT LEADERS:
James A. Bethke, Floriculture and Nursery Farm Advisor, UCCE San Diego
Bryan Vander Mey, Staff Research Associate, UCCE San Diego
Lea Corkidi, Agricultural Technician, UCCE San Diego
RESEARCH PROJECT GOALS 2014-15 - ESCONDIDO
• Continue laboratory /greenhouse trials on the biology and control of eye gnats • Continue grid trapping to document the population dynamics • Conduct studies on the effectiveness of different barriers • Education by providing pertinent publications and information • Provide additional services as needed on eye gnat related issues
BACKGROUND
Eye gnats are prevalent in the Southern United States, primarily in parts of California and Arizona. In San Diego County, especially in the Jacumba and Escondido areas, they have been a problem for many years and are the source of numerous citizen complaints to Departments of Environmental Health - Vector Control, and Agriculture Weights and Measures. Research has determined that local agriculture is the source of the problem, and the community residents are looking to the County for a solution. Eye gnats are problems in other agricultural areas in Southern California and have been extensively studied for more than a century. These nuisance problems have been successfully addressed by identifying the source, altering land management practices, implementing integrated pest management (IPM), and conducting a sound public outreach and education program.
Benefit to the County
In utilizing our technical and expert resources with UCCE, we can more efficiently offer the County’s residents easier access to current and applicable information and educational opportunities to understand and manage the eye gnat problem. Increased awareness of this problem, its causes and possible solutions will assist county departments in dealing with citizen complaints.

4
Introduction The eye gnat (Liohippelates and Hippelates spp.) has been a nuisance pest since the turn of
the 20th century. Liohippelates collusor (Townsend), formerly known as Hippelates collusor in the scientific literature is the primary species in southern California and was implicated in an epidemic of bacterial conjunctivitis (pinkeye) in the Coachella Valley California and in the southern U.S. (Anonymous 1929, Buehler et al. 1983). There is no scientific evidence, however, to substantiate the inference. Eye gnats created problems in other cultivated areas, however, such as the Imperial and San Joaquin valleys of California. In addition, they are present in many desert areas of California, such as the Mojave Desert, and could create problems if and when such areas are intensively cultivated and irrigated.
Problems are heightened when irrigated agriculture is in close proximity to urban areas. Research has shown that irrigated agriculture provides good reproductive potential for eye gnat production (Mulla 1963). However, female gnats need a protein food source (mucus, blood, scabs, etc.) in order to produce their young and that protein source is largely unavailable in agriculture. Therefore, since eye gnats can disperse approximately 4 miles both upwind and downwind, humans and domesticated animals living in close proximity to eye gnat producing areas can become a food source.

5
EXECUTIVE SUMMARY
Introduction All of the research was conducted off Be Wise Ranch property during the 2014-15.
Trials were completed with the help of the City of San Diego, San Dieguito River Park, Evergreen Nursery, The Pinery, and the Center for Applied Horticultural Research in Vista, CA. ADULT EYE GNAT POPULATION DENSITY STUDY IN ESCONDIDO
• Higher numbers of adult eye gnats were trapped close to the farm with dwindling numbers further away repeating the same trends as previous years.
ADULT EYE GNAT POPULATION DENSITY SOUTH OF THE FARM DURING THE MONTH OF OCTOBER
• Higher numbers of adult eye gnats were trapped close to the farm with dwindling numbers further away. No correlation was found as to why this region saw a surge in eye gnat numbers during the 2014 season.
EYE GNAT ATTRACTION OF DIFFERENT EGG PRODUCTS OVER TIME
• Powdered eggs, as compared to real and egg substitutes, provided the best attractant for adult eye gnats.
EFFECTIVENESS OF SCREENING MATERIAL USED AS A FENCE TO BLOCK ADULT EYE GNAT MOVEMENT
• Fencing/screening is an effective way in controlling the movement of adult eye gnats. EYE GNAT TRAPPING IN ESCONDIDO 2015 (RANCHO DEL SOL)
• The intention of this study is to investigate why the populations of eye gnats persist at high levels in a canyon adjacent to the Sonata homeowners in Escondido. Surveys demonstrated that adult eye gnats do persist at high levels in the canyon. Future studies in 2015-16 will determine if there is an eye gnat producing area in the canyon and whether mitigations measures can be employed.
EXTENSION ACTIVITY
• Meetings were attended and data shared to community leaders, the farm, and the county. Information was made available on the Internet.
6
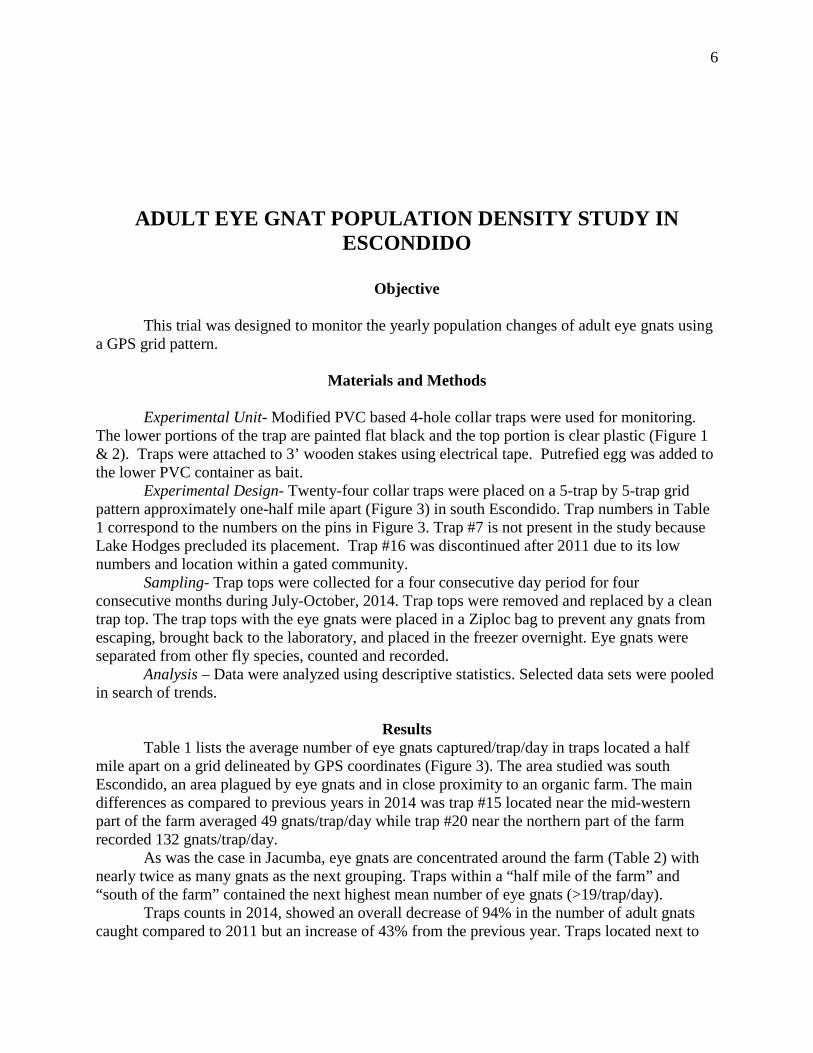
ADULT EYE GNAT POPULATION DENSITY STUDY IN ESCONDIDO
Objective
This trial was designed to monitor the yearly population changes of adult eye gnats using
a GPS grid pattern.
Materials and Methods
Experimental Unit- Modified PVC based 4-hole collar traps were used for monitoring. The lower portions of the trap are painted flat black and the top portion is clear plastic (Figure 1 & 2). Traps were attached to 3’ wooden stakes using electrical tape. Putrefied egg was added to the lower PVC container as bait. Experimental Design- Twenty-four collar traps were placed on a 5-trap by 5-trap grid pattern approximately one-half mile apart (Figure 3) in south Escondido. Trap numbers in Table 1 correspond to the numbers on the pins in Figure 3. Trap #7 is not present in the study because Lake Hodges precluded its placement. Trap #16 was discontinued after 2011 due to its low numbers and location within a gated community. Sampling- Trap tops were collected for a four consecutive day period for four consecutive months during July-October, 2014. Trap tops were removed and replaced by a clean trap top. The trap tops with the eye gnats were placed in a Ziploc bag to prevent any gnats from escaping, brought back to the laboratory, and placed in the freezer overnight. Eye gnats were separated from other fly species, counted and recorded. Analysis – Data were analyzed using descriptive statistics. Selected data sets were pooled in search of trends.
Results Table 1 lists the average number of eye gnats captured/trap/day in traps located a half mile apart on a grid delineated by GPS coordinates (Figure 3). The area studied was south Escondido, an area plagued by eye gnats and in close proximity to an organic farm. The main differences as compared to previous years in 2014 was trap #15 located near the mid-western part of the farm averaged 49 gnats/trap/day while trap #20 near the northern part of the farm recorded 132 gnats/trap/day.
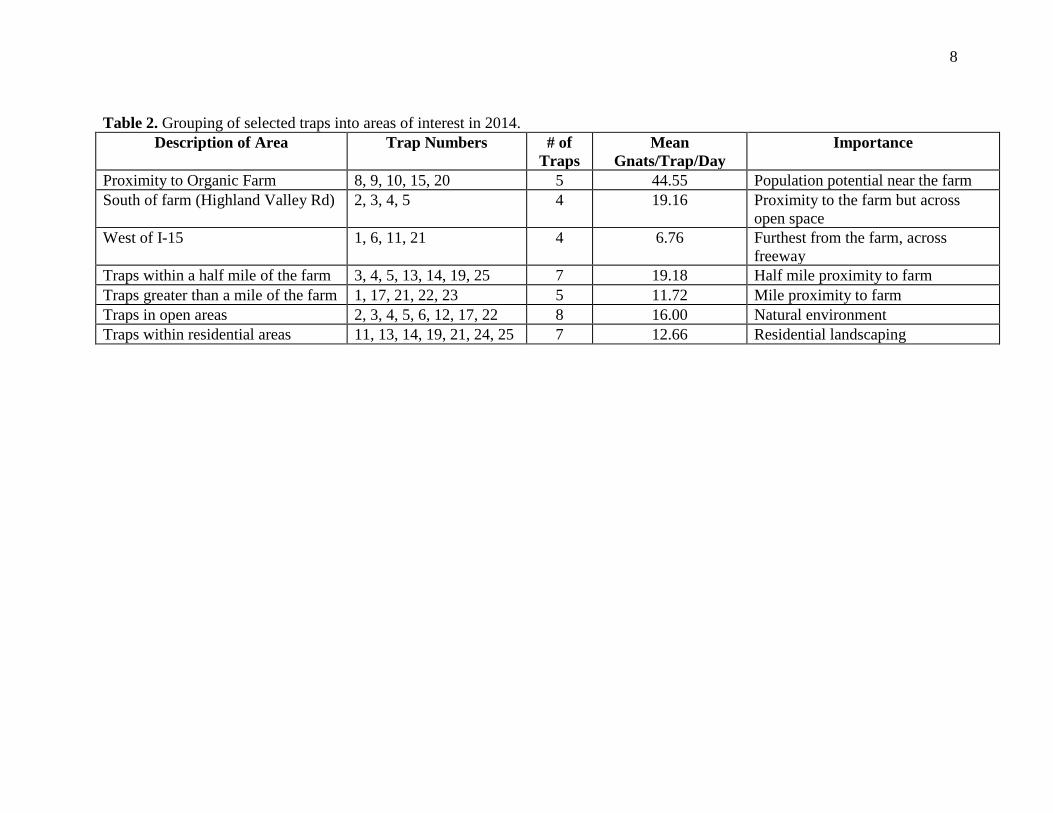
As was the case in Jacumba, eye gnats are concentrated around the farm (Table 2) with nearly twice as many gnats as the next grouping. Traps within a “half mile of the farm” and “south of the farm” contained the next highest mean number of eye gnats (>19/trap/day).
Traps counts in 2014, showed an overall decrease of 94% in the number of adult gnats caught compared to 2011 but an increase of 43% from the previous year. Traps located next to
7
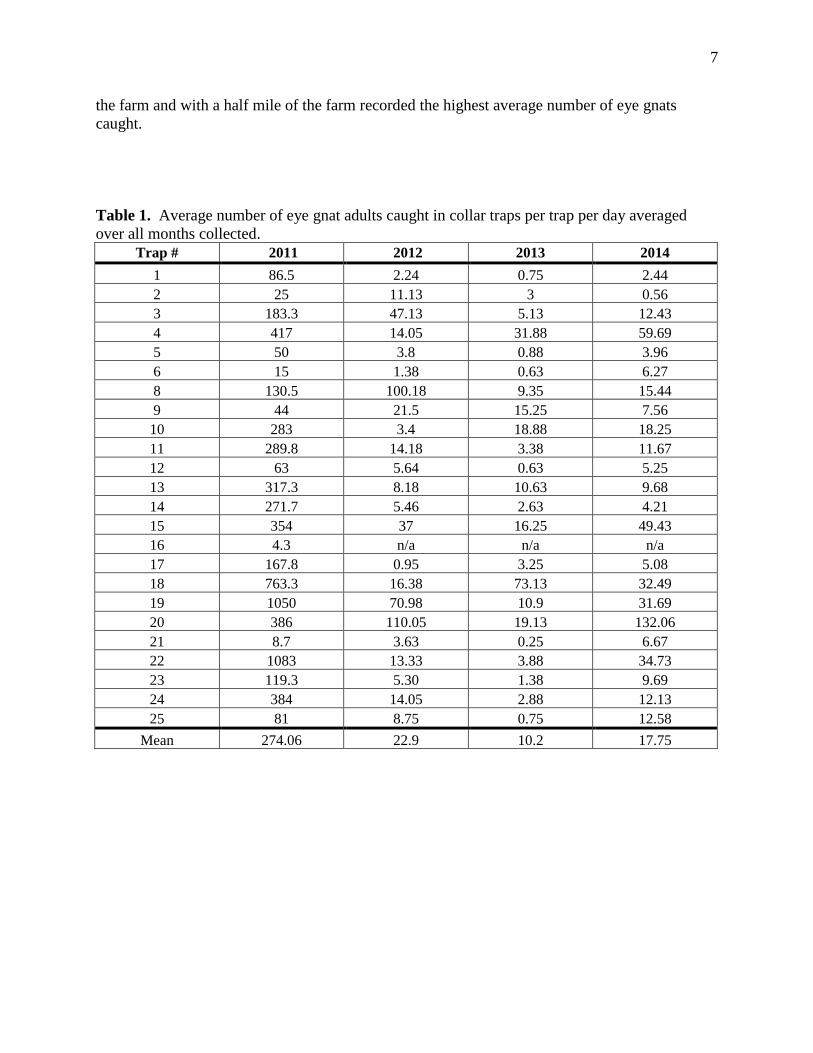
the farm and with a half mile of the farm recorded the highest average number of eye gnats caught. Table 1. Average number of eye gnat adults caught in collar traps per trap per day averaged over all months collected.
Trap # 2011 2012 2013 2014 1 86.5 2.24 0.75 2.44 2 25 11.13 3 0.56 3 183.3 47.13 5.13 12.43 4 417 14.05 31.88 59.69 5 50 3.8 0.88 3.96 6 15 1.38 0.63 6.27 8 130.5 100.18 9.35 15.44 9 44 21.5 15.25 7.56
10 283 3.4 18.88 18.25 11 289.8 14.18 3.38 11.67 12 63 5.64 0.63 5.25 13 317.3 8.18 10.63 9.68 14 271.7 5.46 2.63 4.21 15 354 37 16.25 49.43 16 4.3 n/a n/a n/a 17 167.8 0.95 3.25 5.08 18 763.3 16.38 73.13 32.49 19 1050 70.98 10.9 31.69 20 386 110.05 19.13 132.06 21 8.7 3.63 0.25 6.67 22 1083 13.33 3.88 34.73 23 119.3 5.30 1.38 9.69 24 384 14.05 2.88 12.13 25 81 8.75 0.75 12.58
Mean 274.06 22.9 10.2 17.75
8
Table 2. Grouping of selected traps into areas of interest in 2014.
Description of Area Trap Numbers # of Traps
Mean Gnats/Trap/Day
Importance
Proximity to Organic Farm 8, 9, 10, 15, 20 5 44.55 Population potential near the farm South of farm (Highland Valley Rd) 2, 3, 4, 5 4 19.16 Proximity to the farm but across
open space West of I-15 1, 6, 11, 21 4 6.76 Furthest from the farm, across
freeway Traps within a half mile of the farm 3, 4, 5, 13, 14, 19, 25 7 19.18 Half mile proximity to farm Traps greater than a mile of the farm 1, 17, 21, 22, 23 5 11.72 Mile proximity to farm Traps in open areas 2, 3, 4, 5, 6, 12, 17, 22 8 16.00 Natural environment Traps within residential areas 11, 13, 14, 19, 21, 24, 25 7 12.66 Residential landscaping
9
ADULT EYE GNAT POPULATION DENSITY SOUTH OF THE FARM DURING THE MONTH OF OCTOBER
Objective
This trial was designed to monitor adult eye gnat populations using a GPS grid pattern
near the southeastern section of the farm where an above average number of gnats were being caught.
Materials and Methods
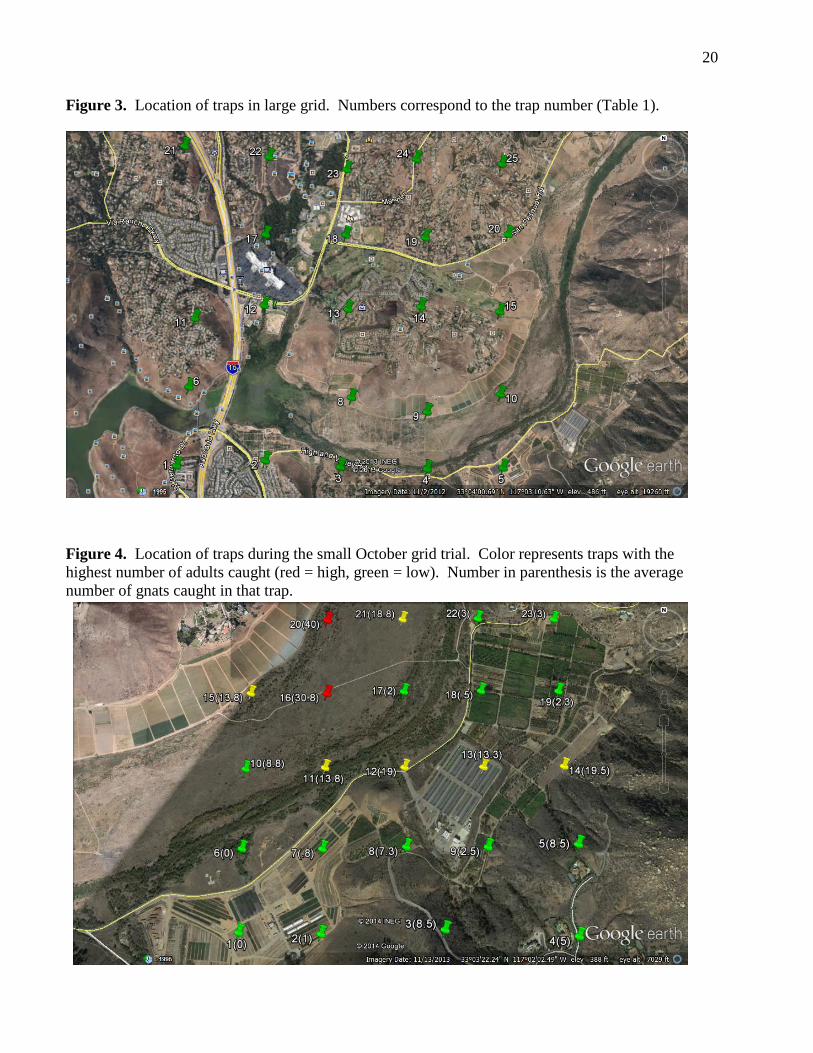
Experimental Unit- Modified PVC based 4-hole collar traps were used for monitoring. The lower portions of the trap are painted flat black and the top portion is clear plastic (Figure 1 & 2). Traps were attached to 3’ wooden stakes using electrical tape. Putrefied egg was added to the lower PVC container as bait. Experimental Design- Twenty-four collar traps were placed on a 5-trap by 5-trap grid pattern approximately one-half mile apart (Figure 4) in south Escondido. Trap numbers in Table 3 correspond to the numbers on the pins in Figure 4.
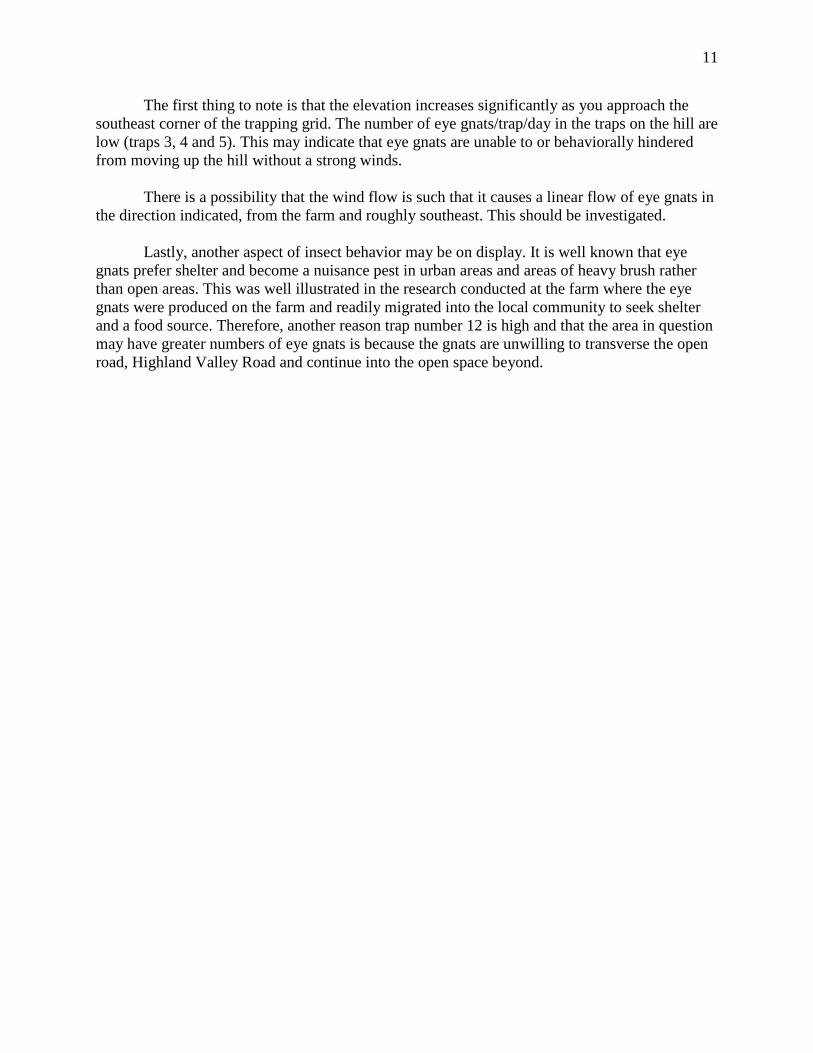
Study Area- The traps were placed in an area of south Escondido, in the Lake Hodges area (Figure 4). The coordinates of the four points of the grid were located as follows: 1) northwest corner - 33°03’ 42.89”N by 117°02’ 23.37”W, elevation 329’; 2) northeast corner - 33°03’ 43.80”N by 117°01’ 35.51”W, elevation 352’; 3) southwest corner - 33°03’ 03.87”N by 117°02’ 23.22”W, elevation 339’; and 4) southeast corner - 33°03’ 03.64”N by 117°01’ 35.72”W, elevation 674’. Two points on the grid did not contain traps due to inaccessibility, one on the farm and one on private property. The traps located in the southeast corner of the grid were place in an area of increasing elevation up to 670’. All other traps were at ground level and at approximately 340’ elevation. The north side of the grid was adjacent to the farm and the south side of the grid was south of Highland Valley Road. The majority of the traps were south and east of Highland Valley Road and many of those traps were located in two nurseries, The Pinery and Evergreen Nursery. Both nurseries are woody ornamental nurseries dominated by large boxed trees and palms. Both nurseries have been studied as possible sources of eye gnats and have been excluded as sources.
Experimental Design and Sampling- Twenty-three traps arranged in roughly a 5X5 pattern (two were missing from the grid due to inaccessibility) and 1000 feet (305 meters) apart (Figure 4). Traps were placed on Oct 7 and removed on Oct 10. Eye gnats were counted from each trap on a daily basis from Oct 7-10. The data were averaged by trap to use the standard measure we have used in other trials, the number of eye gnats/trap/day (N=4 days).
10
Table 3. Number of adult eye gnats caught per trap per day in small grid located south of the farm. See Figure 4 for trap locations.
Trap Number Average number of gnats 1 0 2 1 3 8.5 4 5 5 8.5 6 0 7 0.75 8 7.25 9 2.5
10 8.75 11 13.75 12 19 13 13.25 14 19.5 15 13.75 16 30.75 17 2 18 0.5 19 2.333333 20 40 21 18.75 22 3 23 3
Results
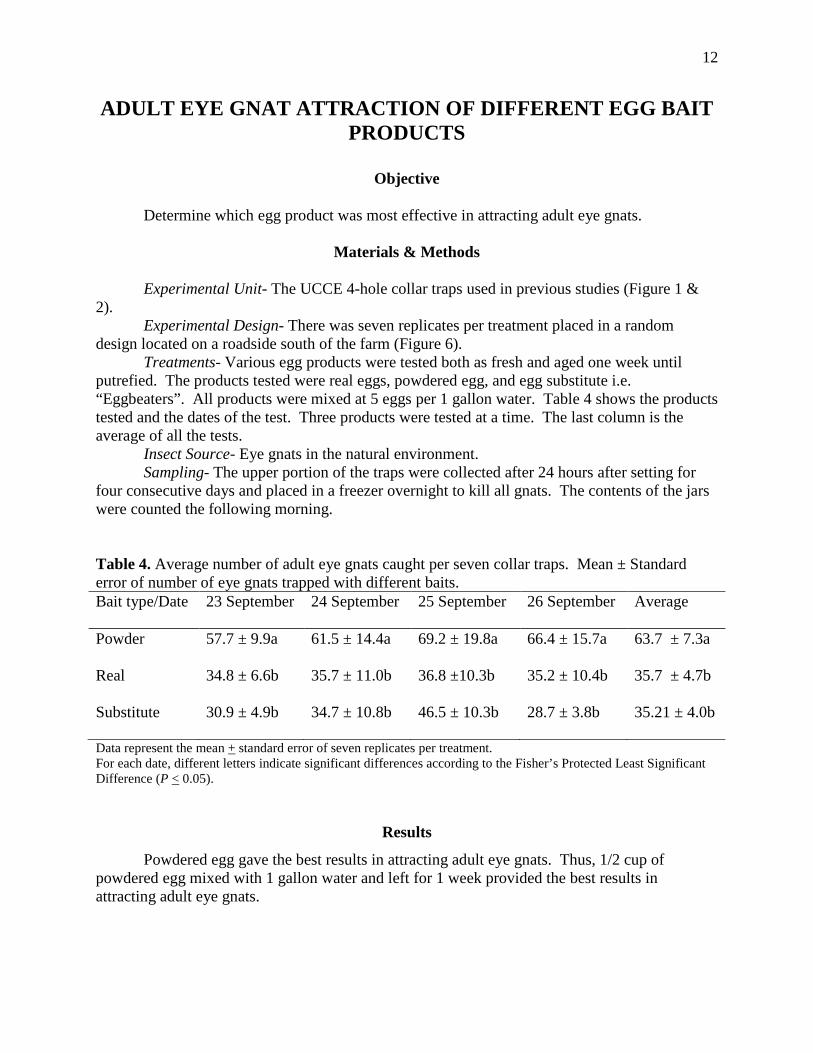
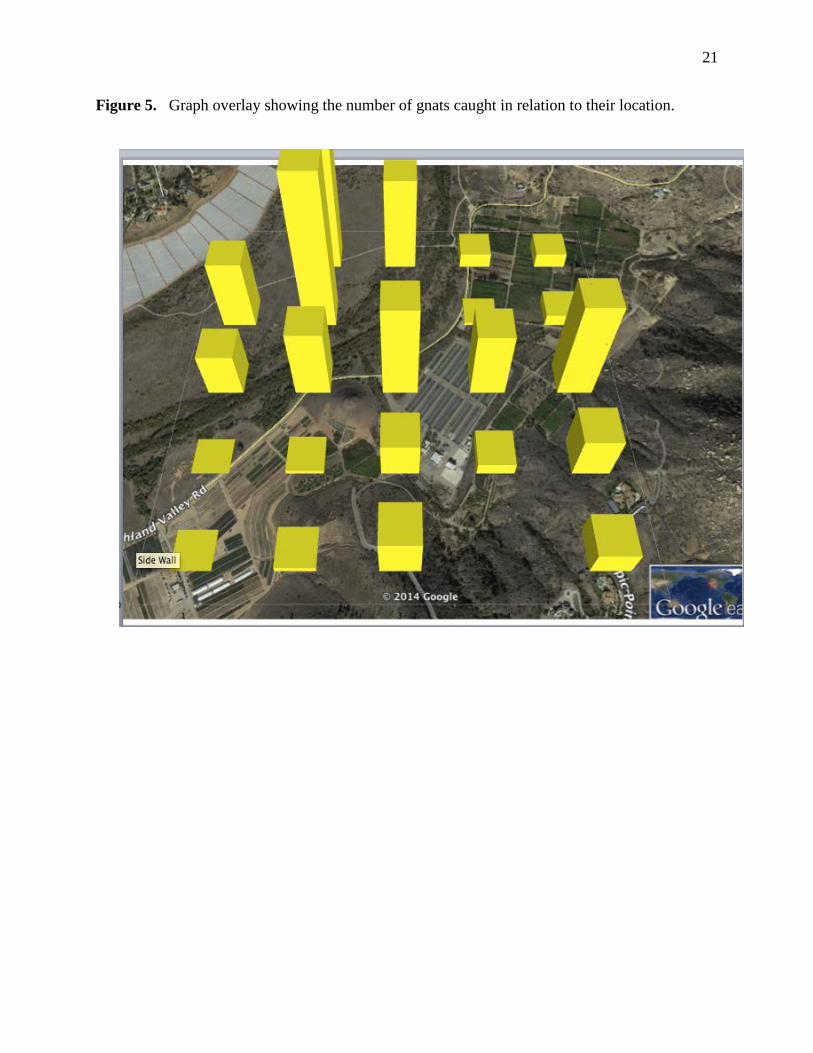
Table 3 illustrates where the trap was located and the trap number followed by the average number of eye gnats/trap/day in parenthesis. The data is further illustrated using bars in Figure 5.
Trap numbers to the northeast and southwest are very low; whereas, traps adjacent to the farm and in roughly a straight line between the farm and the area in question have significantly greater numbers. The linear regression of eye gnat numbers from the farm to the southeast is roughly illustrated by the following trap numbers: 15 and 20; 10, 16 and 21; 11 and 12; and 5, 13 and 14. The numbers are greatest in the traps closest to the farm (20, 21, 15 and 16) and reduce as they transverse the area until they reach the hill in trap number 14. First, it has been demonstrated in past that the farm is a major eye gnat producer. Second, the area in question, as well as the area surrounding it, have been studied at length and no major eye gnat-producing source has been detected. Therefore, we believe that there are a number of potential reasons for the greater numbers in the area in question.
11
The first thing to note is that the elevation increases significantly as you approach the southeast corner of the trapping grid. The number of eye gnats/trap/day in the traps on the hill are low (traps 3, 4 and 5). This may indicate that eye gnats are unable to or behaviorally hindered from moving up the hill without a strong winds.
There is a possibility that the wind flow is such that it causes a linear flow of eye gnats in the direction indicated, from the farm and roughly southeast. This should be investigated.
Lastly, another aspect of insect behavior may be on display. It is well known that eye gnats prefer shelter and become a nuisance pest in urban areas and areas of heavy brush rather than open areas. This was well illustrated in the research conducted at the farm where the eye gnats were produced on the farm and readily migrated into the local community to seek shelter and a food source. Therefore, another reason trap number 12 is high and that the area in question may have greater numbers of eye gnats is because the gnats are unwilling to transverse the open road, Highland Valley Road and continue into the open space beyond.
12
ADULT EYE GNAT ATTRACTION OF DIFFERENT EGG BAIT PRODUCTS
Objective
Determine which egg product was most effective in attracting adult eye gnats.
Materials & Methods
Experimental Unit- The UCCE 4-hole collar traps used in previous studies (Figure 1 &
2). Experimental Design- There was seven replicates per treatment placed in a random
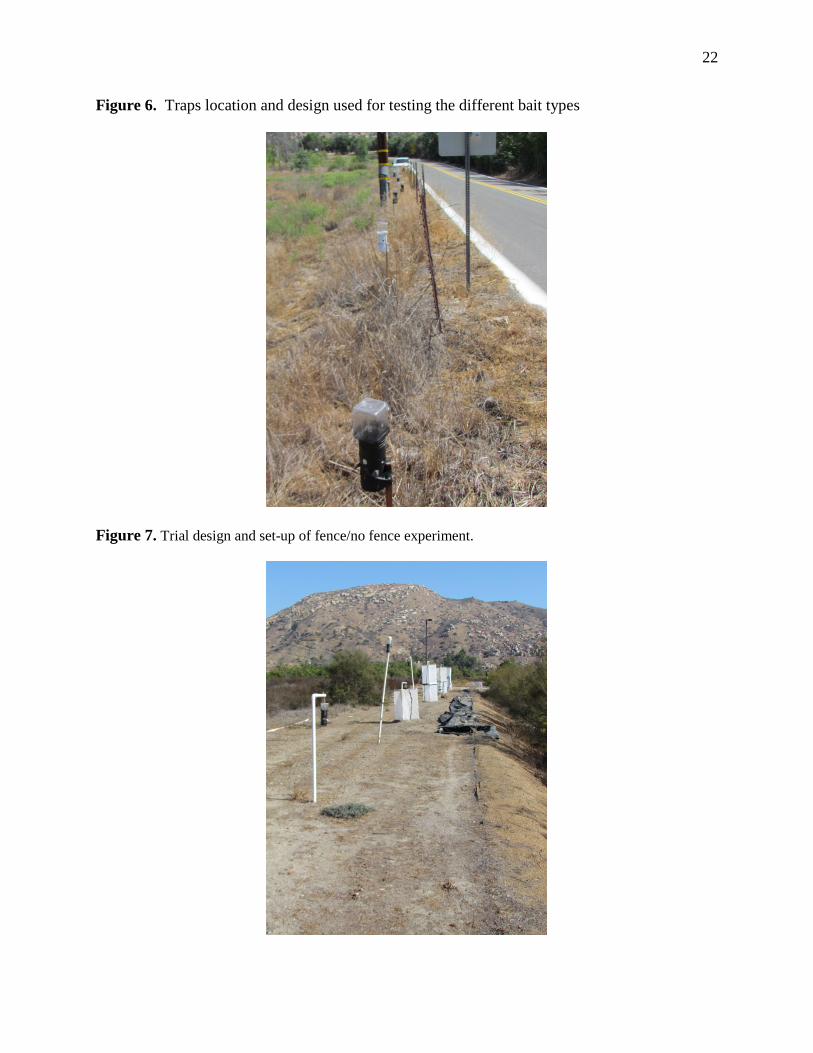
design located on a roadside south of the farm (Figure 6). Treatments- Various egg products were tested both as fresh and aged one week until
putrefied. The products tested were real eggs, powdered egg, and egg substitute i.e. “Eggbeaters”. All products were mixed at 5 eggs per 1 gallon water. Table 4 shows the products tested and the dates of the test. Three products were tested at a time. The last column is the average of all the tests.
Insect Source- Eye gnats in the natural environment. Sampling- The upper portion of the traps were collected after 24 hours after setting for
four consecutive days and placed in a freezer overnight to kill all gnats. The contents of the jars were counted the following morning.
Table 4. Average number of adult eye gnats caught per seven collar traps. Mean ± Standard error of number of eye gnats trapped with different baits. Bait type/Date 23 September 24 September 25 September 26 September Average
Powder 57.7 ± 9.9a 61.5 ± 14.4a 69.2 ± 19.8a 66.4 ± 15.7a 63.7 ± 7.3a
Real 34.8 ± 6.6b 35.7 ± 11.0b 36.8 ±10.3b 35.2 ± 10.4b 35.7 ± 4.7b
Substitute 30.9 ± 4.9b 34.7 ± 10.8b 46.5 ± 10.3b 28.7 ± 3.8b 35.21 ± 4.0b
Data represent the mean + standard error of seven replicates per treatment. For each date, different letters indicate significant differences according to the Fisher’s Protected Least Significant Difference (P < 0.05).
Results
Powdered egg gave the best results in attracting adult eye gnats. Thus, 1/2 cup of powdered egg mixed with 1 gallon water and left for 1 week provided the best results in attracting adult eye gnats.

13
EFFECTIVNESS OF SCREENING MATERIAL USED AS A FENCE TO BLOCK ADULT EYE GNAT MOVEMENT
Objective
Determine if a fence of 4 and 8 feet tall could effectively block adult eye gnat movement.
Materials & Methods
Experimental Unit- The UCCE 4-hole collar traps used in previous studies (Figure 1 &
2). Experimental Design- There was four replicates per treatment placed in a random design
located in an abandon city property south of the farm. Treatments- PVC framed boxes were assembled with heights of either 4 or 8 feet. A
white screening material was wrapped and attached around the PVC frame. A UCCE 4-hole collar traps was hung from a stand located in the center of the box. Traps were also hung on stands without fencing to compare against the fenced traps (Figure 7).
Insect Source- Eye gnats in the natural environment. Sampling- The upper portion of the traps were collected after 24 hours for four
consecutive days and placed in a freezer overnight to kill all gnats. The contents of the jars were counted the following morning. Table 5. Mean + standard error of number of eye gnats in traps located at 4 feet high Fence
height (ft)
October 21 October 22 October 23 October 24 October 25 Total
No fence 7.3 ± 2.7a 4.0 ± 0.709a 20.7 ± 2.5a 19.0 ± 7.5a 22.3 ± 8.0a 14.7 ± 2.7a
Fenced 1.8 ± 0.9b 0.8 ± 0.3b 16.0 ± 3.7a 12.5 ± 2.9a 11.3 ± 5.2a 8.5 ± 1.9b
Data represent the mean + standard error of four replicates per treatment. Data were log (x+1) transformed prior to statistical analysis. For each date, different letters indicate significant differences between black and white traps, according to the Student’s T test (P < 0.05).
Traps located at ground level tended to capture more eye gnats than those located at 4 feet, but the differences were only statistically significant at two of the five dates evaluated (October 21 and October 22).
14
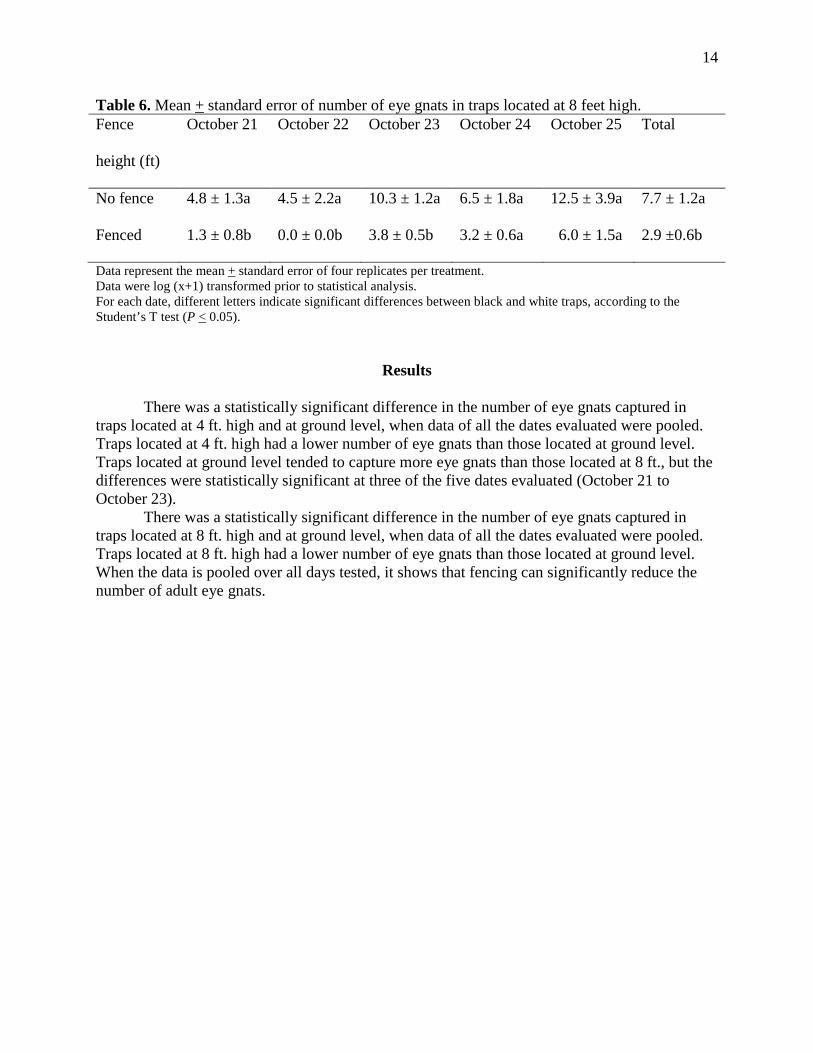
Table 6. Mean + standard error of number of eye gnats in traps located at 8 feet high. Fence
height (ft)
October 21 October 22 October 23 October 24 October 25 Total
No fence 4.8 ± 1.3a 4.5 ± 2.2a 10.3 ± 1.2a 6.5 ± 1.8a 12.5 ± 3.9a 7.7 ± 1.2a
Fenced 1.3 ± 0.8b 0.0 ± 0.0b 3.8 ± 0.5b 3.2 ± 0.6a 6.0 ± 1.5a 2.9 ±0.6b
Data represent the mean + standard error of four replicates per treatment. Data were log (x+1) transformed prior to statistical analysis. For each date, different letters indicate significant differences between black and white traps, according to the Student’s T test (P < 0.05).
Results
There was a statistically significant difference in the number of eye gnats captured in traps located at 4 ft. high and at ground level, when data of all the dates evaluated were pooled. Traps located at 4 ft. high had a lower number of eye gnats than those located at ground level. Traps located at ground level tended to capture more eye gnats than those located at 8 ft., but the differences were statistically significant at three of the five dates evaluated (October 21 to October 23).
There was a statistically significant difference in the number of eye gnats captured in traps located at 8 ft. high and at ground level, when data of all the dates evaluated were pooled. Traps located at 8 ft. high had a lower number of eye gnats than those located at ground level. When the data is pooled over all days tested, it shows that fencing can significantly reduce the number of adult eye gnats.
15
Eye Gnat Trapping in Escondido 2015 (Rancho Del Sol)
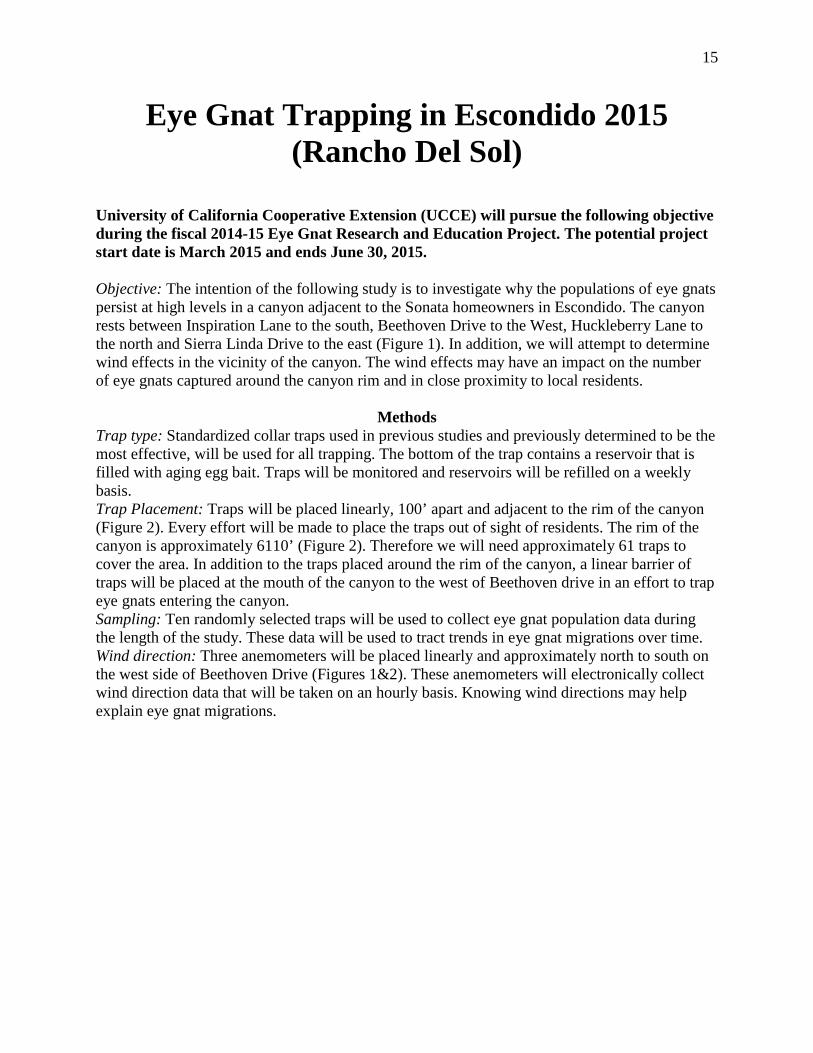
University of California Cooperative Extension (UCCE) will pursue the following objective during the fiscal 2014-15 Eye Gnat Research and Education Project. The potential project start date is March 2015 and ends June 30, 2015. Objective: The intention of the following study is to investigate why the populations of eye gnats persist at high levels in a canyon adjacent to the Sonata homeowners in Escondido. The canyon rests between Inspiration Lane to the south, Beethoven Drive to the West, Huckleberry Lane to the north and Sierra Linda Drive to the east (Figure 1). In addition, we will attempt to determine wind effects in the vicinity of the canyon. The wind effects may have an impact on the number of eye gnats captured around the canyon rim and in close proximity to local residents.
Methods Trap type: Standardized collar traps used in previous studies and previously determined to be the most effective, will be used for all trapping. The bottom of the trap contains a reservoir that is filled with aging egg bait. Traps will be monitored and reservoirs will be refilled on a weekly basis. Trap Placement: Traps will be placed linearly, 100’ apart and adjacent to the rim of the canyon (Figure 2). Every effort will be made to place the traps out of sight of residents. The rim of the canyon is approximately 6110’ (Figure 2). Therefore we will need approximately 61 traps to cover the area. In addition to the traps placed around the rim of the canyon, a linear barrier of traps will be placed at the mouth of the canyon to the west of Beethoven drive in an effort to trap eye gnats entering the canyon. Sampling: Ten randomly selected traps will be used to collect eye gnat population data during the length of the study. These data will be used to tract trends in eye gnat migrations over time. Wind direction: Three anemometers will be placed linearly and approximately north to south on the west side of Beethoven Drive (Figures 1&2). These anemometers will electronically collect wind direction data that will be taken on an hourly basis. Knowing wind directions may help explain eye gnat migrations.

16
Figure 1. General outline of the study area.
Northern edge of Be Wise Ranch

17
18
Extension Activity
ADDITIONS TO THE SAN DIEGO EYE GNAT RESEARCH AND EDUCATION PROJECT WEB SITE (http://ucanr.org/eyegnats) County Eye Gnat Report Research Report, 2011-13 Eye Gnat Research and Education Symposium, 2012 EYE GNAT PRESENTATIONS AND PUBLICATIONS Bethke, J. A., Vander Mey, A., and I. DeBonis. Final Report: San Diego County Eye Gnat Research and Education Project 2011. In fulfillment of San Diego County Contract #532716. 36pgs. Available online: http://ucanr.org/eyegnats Bethke, J. A., Vander Mey, A., and S. Zambrano. Final Report: San Diego County Eye Gnat Research and Education Project 2012. In fulfillment of San Diego County Contract #532716. 29pgs. Available online: http://ucanr.org/eyegnats Bethke, J. A., Vander Mey, A., and S. Zambrano. Final Report: San Diego County Eye Gnat Research and Education Project 2013. In fulfillment of San Diego County Contract #532716. 21pgs. Available online: http://ucanr.org/eyegnats SELECTED REFERENCES
Mulla, M. S. 1963. An ecological basis for suppression of Hippelates eye gnats. Journal of
Economic Entomology. 56(6): 768
19
APPENDIX I Photo Images
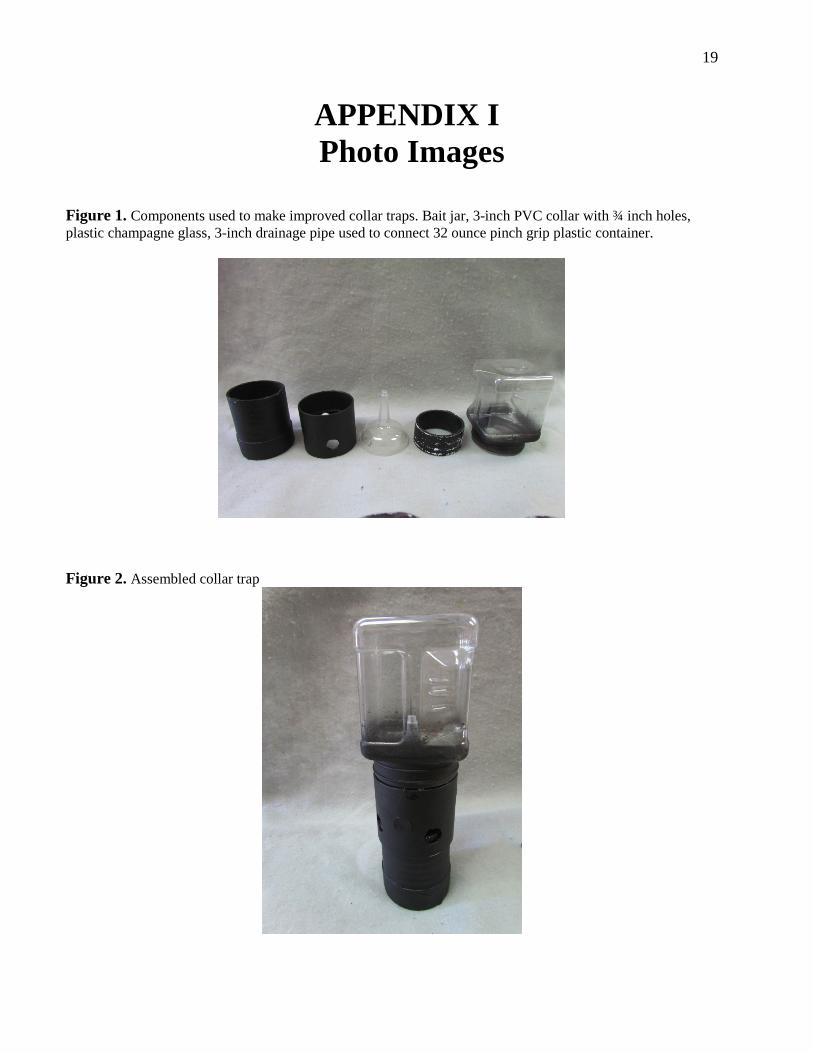
Figure 1. Components used to make improved collar traps. Bait jar, 3-inch PVC collar with ¾ inch holes, plastic champagne glass, 3-inch drainage pipe used to connect 32 ounce pinch grip plastic container.
Figure 2. Assembled collar trap
20
Figure 3. Location of traps in large grid. Numbers correspond to the trap number (Table 1).
Figure 4. Location of traps during the small October grid trial. Color represents traps with the highest number of adults caught (red = high, green = low). Number in parenthesis is the average number of gnats caught in that trap.
21
Figure 5. Graph overlay showing the number of gnats caught in relation to their location.
22
Figure 6. Traps location and design used for testing the different bait types
Figure 7. Trial design and set-up of fence/no fence experiment.
23
APPENDIX II
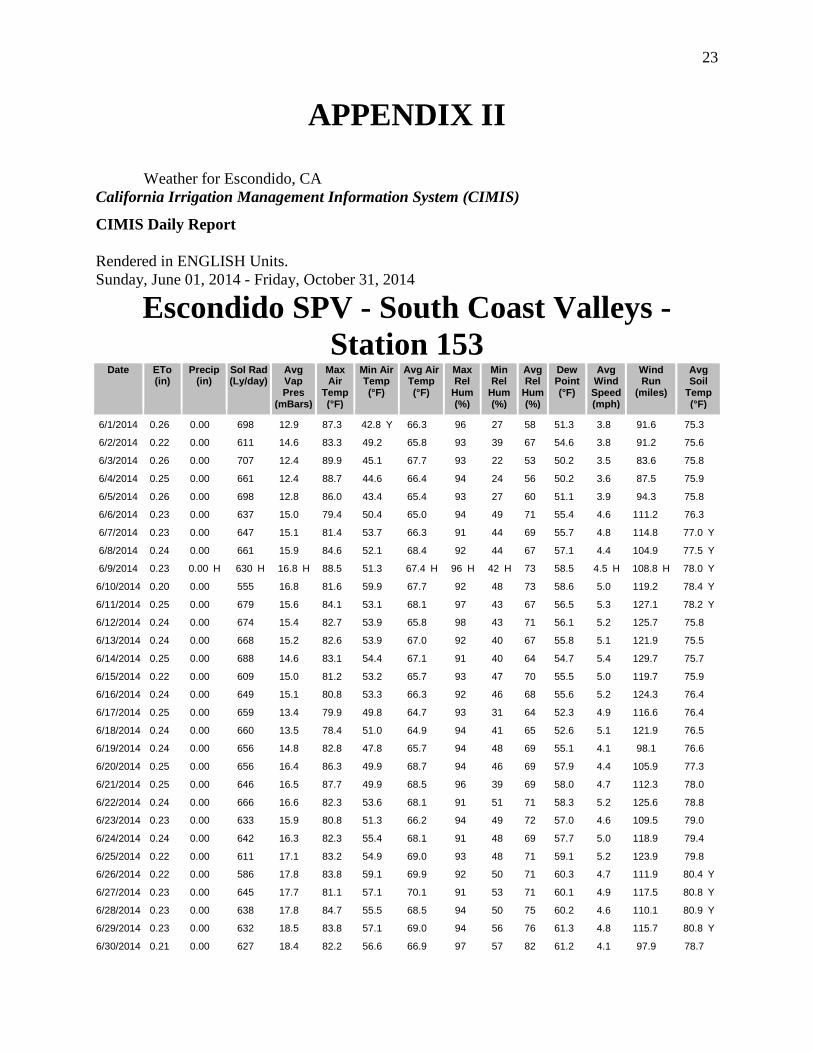
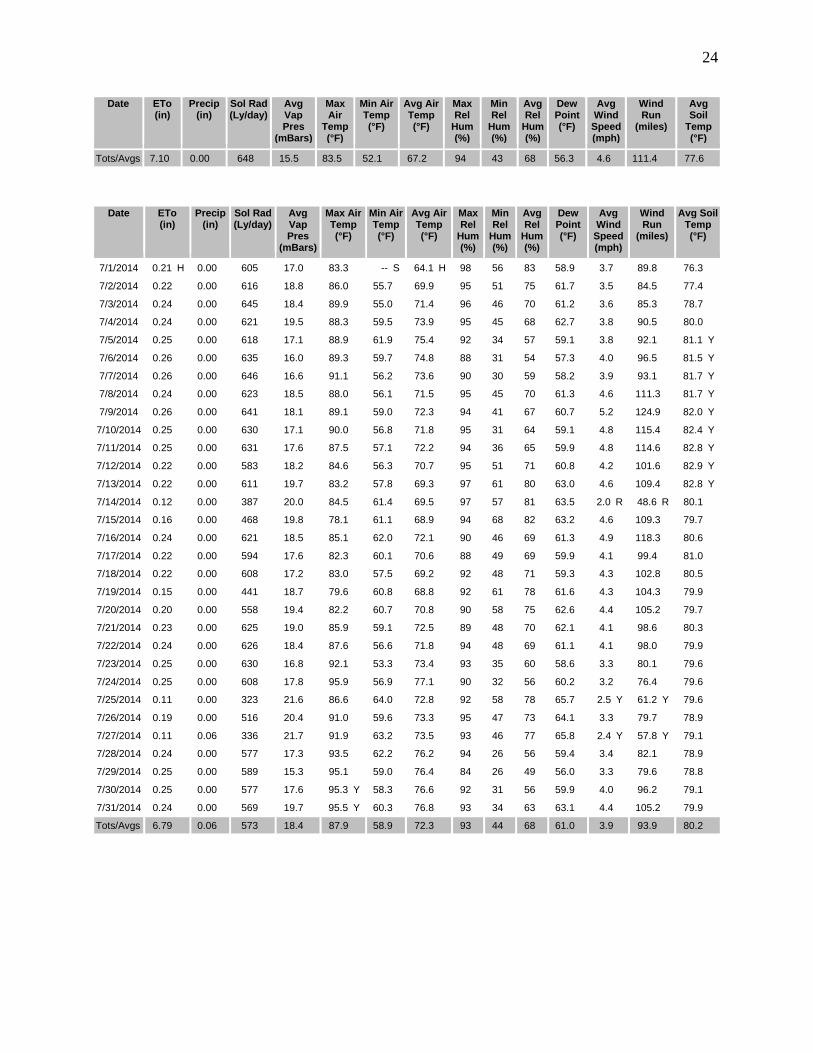
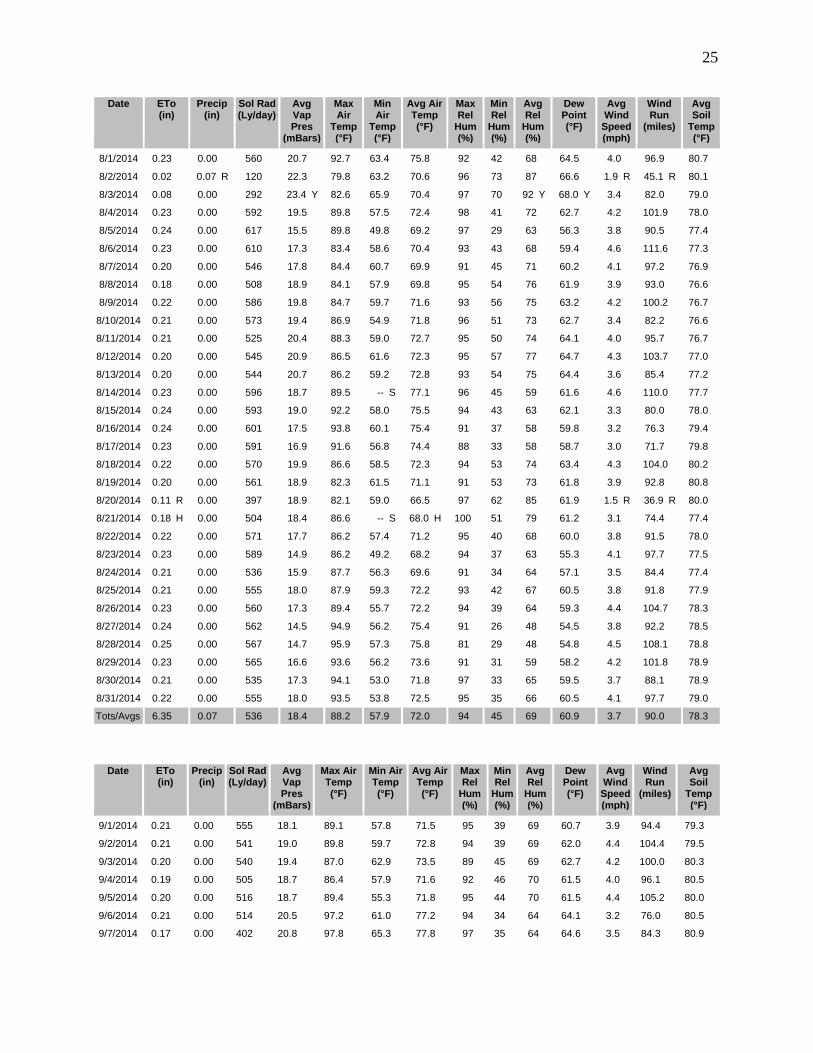
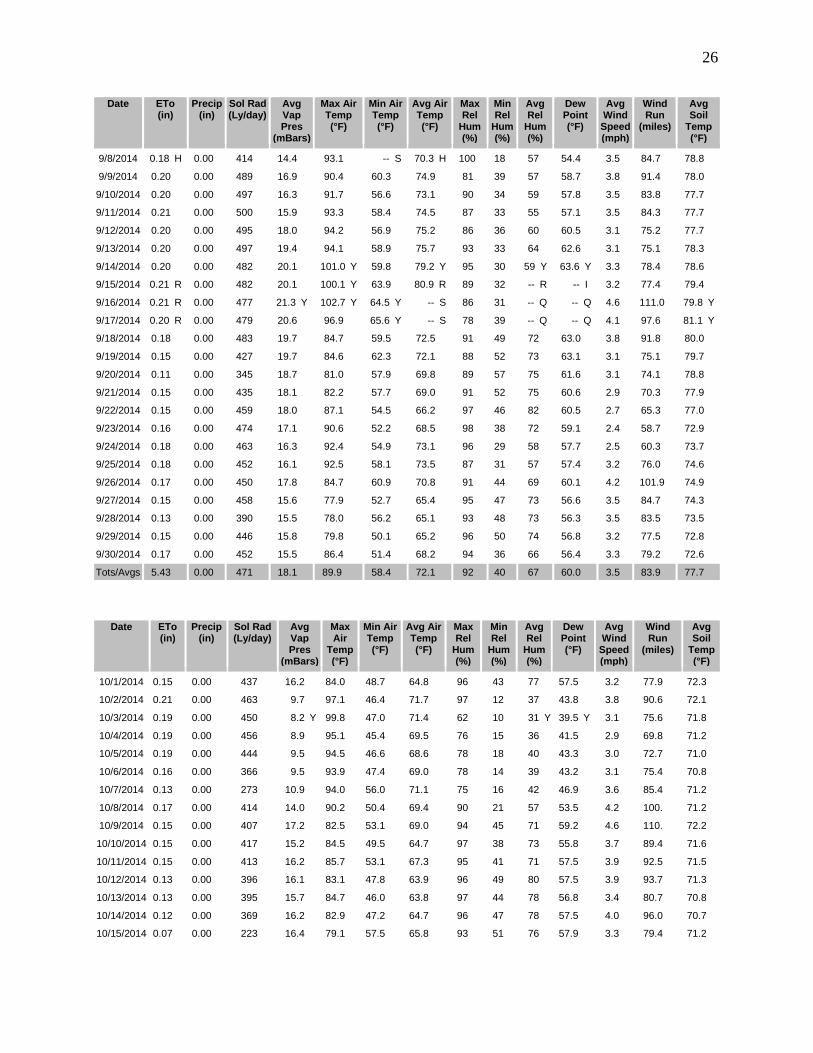
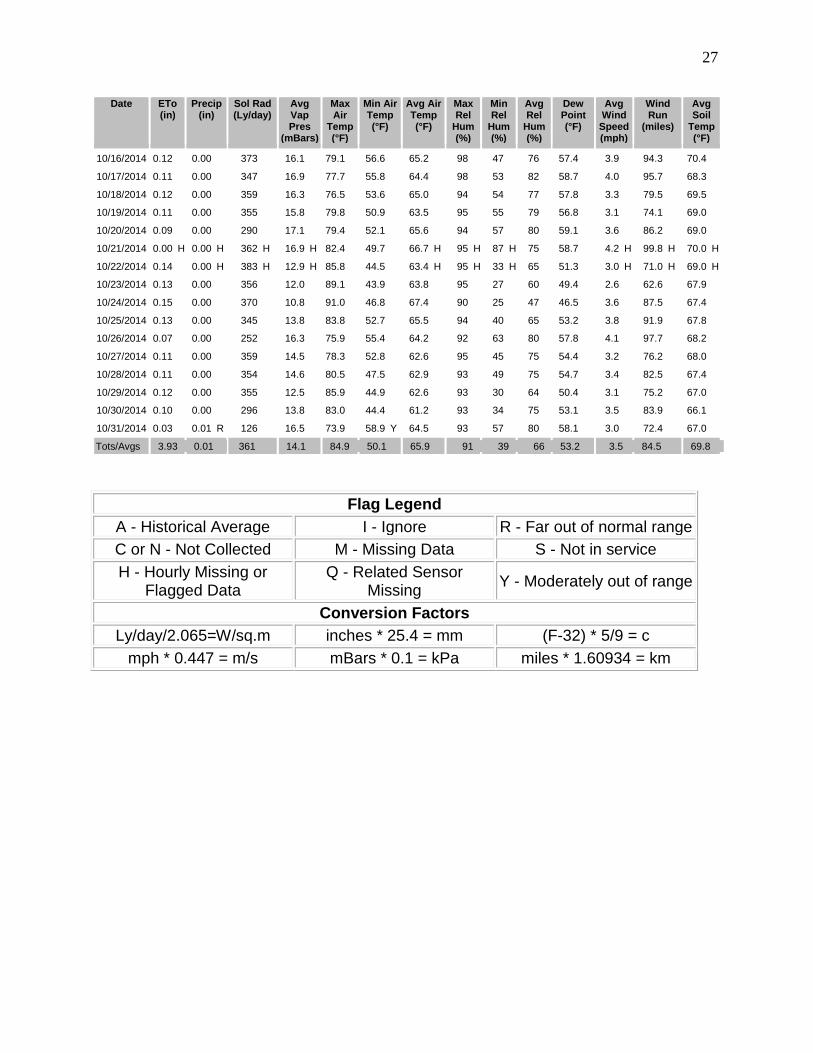
Weather for Escondido, CA
California Irrigation Management Information System (CIMIS)
CIMIS Daily Report
Rendered in ENGLISH Units. Sunday, June 01, 2014 - Friday, October 31, 2014
Escondido SPV - South Coast Valleys - Station 153
Date ETo (in)
Precip (in)
Sol Rad (Ly/day)
Avg Vap Pres
(mBars)
Max Air
Temp (°F)
Min Air Temp (°F)
Avg Air Temp (°F)
Max Rel
Hum (%)
Min Rel
Hum (%)
Avg Rel
Hum (%)
Dew Point (°F)
Avg Wind Speed (mph)
Wind Run
(miles)
Avg Soil
Temp (°F)
6/1/2014 0.26
0.00
698
12.9
87.3
42.8 Y
66.3
96
27
58
51.3
3.8
91.6
75.3
6/2/2014 0.22
0.00
611
14.6
83.3
49.2
65.8
93
39
67
54.6
3.8
91.2
75.6
6/3/2014 0.26
0.00
707
12.4
89.9
45.1
67.7
93
22
53
50.2
3.5
83.6
75.8
6/4/2014 0.25
0.00
661
12.4
88.7
44.6
66.4
94
24
56
50.2
3.6
87.5
75.9
6/5/2014 0.26
0.00
698
12.8
86.0
43.4
65.4
93
27
60
51.1
3.9
94.3
75.8
6/6/2014 0.23
0.00
637
15.0
79.4
50.4
65.0
94
49
71
55.4
4.6
111.2
76.3
6/7/2014 0.23
0.00
647
15.1
81.4
53.7
66.3
91
44
69
55.7
4.8
114.8
77.0 Y
6/8/2014 0.24
0.00
661
15.9
84.6
52.1
68.4
92
44
67
57.1
4.4
104.9
77.5 Y
6/9/2014 0.23
0.00 H
630 H
16.8 H
88.5
51.3
67.4 H
96 H
42 H
73
58.5
4.5 H
108.8 H
78.0 Y
6/10/2014 0.20
0.00
555
16.8
81.6
59.9
67.7
92
48
73
58.6
5.0
119.2
78.4 Y
6/11/2014 0.25
0.00
679
15.6
84.1
53.1
68.1
97
43
67
56.5
5.3
127.1
78.2 Y
6/12/2014 0.24
0.00
674
15.4
82.7
53.9
65.8
98
43
71
56.1
5.2
125.7
75.8
6/13/2014 0.24
0.00
668
15.2
82.6
53.9
67.0
92
40
67
55.8
5.1
121.9
75.5
6/14/2014 0.25
0.00
688
14.6
83.1
54.4
67.1
91
40
64
54.7
5.4
129.7
75.7
6/15/2014 0.22
0.00
609
15.0
81.2
53.2
65.7
93
47
70
55.5
5.0
119.7
75.9
6/16/2014 0.24
0.00
649
15.1
80.8
53.3
66.3
92
46
68
55.6
5.2
124.3
76.4
6/17/2014 0.25
0.00
659
13.4
79.9
49.8
64.7
93
31
64
52.3
4.9
116.6
76.4
6/18/2014 0.24
0.00
660
13.5
78.4
51.0
64.9
94
41
65
52.6
5.1
121.9
76.5
6/19/2014 0.24
0.00
656
14.8
82.8
47.8
65.7
94
48
69
55.1
4.1
98.1
76.6
6/20/2014 0.25
0.00
656
16.4
86.3
49.9
68.7
94
46
69
57.9
4.4
105.9
77.3
6/21/2014 0.25
0.00
646
16.5
87.7
49.9
68.5
96
39
69
58.0
4.7
112.3
78.0
6/22/2014 0.24
0.00
666
16.6
82.3
53.6
68.1
91
51
71
58.3
5.2
125.6
78.8
6/23/2014 0.23
0.00
633
15.9
80.8
51.3
66.2
94
49
72
57.0
4.6
109.5
79.0
6/24/2014 0.24
0.00
642
16.3
82.3
55.4
68.1
91
48
69
57.7
5.0
118.9
79.4
6/25/2014 0.22
0.00
611
17.1
83.2
54.9
69.0
93
48
71
59.1
5.2
123.9
79.8
6/26/2014 0.22
0.00
586
17.8
83.8
59.1
69.9
92
50
71
60.3
4.7
111.9
80.4 Y
6/27/2014 0.23
0.00
645
17.7
81.1
57.1
70.1
91
53
71
60.1
4.9
117.5
80.8 Y
6/28/2014 0.23
0.00
638
17.8
84.7
55.5
68.5
94
50
75
60.2
4.6
110.1
80.9 Y
6/29/2014 0.23
0.00
632
18.5
83.8
57.1
69.0
94
56
76
61.3
4.8
115.7
80.8 Y
6/30/2014 0.21
0.00
627
18.4
82.2
56.6
66.9
97
57
82
61.2
4.1
97.9
78.7
24
Date ETo (in)
Precip (in)
Sol Rad (Ly/day)
Avg Vap Pres
(mBars)
Max Air
Temp (°F)
Min Air Temp (°F)
Avg Air Temp (°F)
Max Rel
Hum (%)
Min Rel
Hum (%)
Avg Rel
Hum (%)
Dew Point (°F)
Avg Wind Speed (mph)
Wind Run
(miles)
Avg Soil
Temp (°F)
Tots/Avgs 7.10
0.00
648
15.5
83.5
52.1
67.2
94
43
68
56.3
4.6
111.4
77.6
Date ETo
(in) Precip
(in) Sol Rad (Ly/day)
Avg Vap Pres
(mBars)
Max Air Temp (°F)
Min Air Temp (°F)
Avg Air Temp (°F)
Max Rel
Hum (%)
Min Rel
Hum (%)
Avg Rel
Hum (%)
Dew Point (°F)
Avg Wind
Speed (mph)
Wind Run
(miles)
Avg Soil Temp (°F)
7/1/2014 0.21 H
0.00
605
17.0
83.3
-- S
64.1 H
98
56
83
58.9
3.7
89.8
76.3
7/2/2014 0.22
0.00
616
18.8
86.0
55.7
69.9
95
51
75
61.7
3.5
84.5
77.4
7/3/2014 0.24
0.00
645
18.4
89.9
55.0
71.4
96
46
70
61.2
3.6
85.3
78.7
7/4/2014 0.24
0.00
621
19.5
88.3
59.5
73.9
95
45
68
62.7
3.8
90.5
80.0
7/5/2014 0.25
0.00
618
17.1
88.9
61.9
75.4
92
34
57
59.1
3.8
92.1
81.1 Y
7/6/2014 0.26
0.00
635
16.0
89.3
59.7
74.8
88
31
54
57.3
4.0
96.5
81.5 Y
7/7/2014 0.26
0.00
646
16.6
91.1
56.2
73.6
90
30
59
58.2
3.9
93.1
81.7 Y
7/8/2014 0.24
0.00
623
18.5
88.0
56.1
71.5
95
45
70
61.3
4.6
111.3
81.7 Y
7/9/2014 0.26
0.00
641
18.1
89.1
59.0
72.3
94
41
67
60.7
5.2
124.9
82.0 Y
7/10/2014 0.25
0.00
630
17.1
90.0
56.8
71.8
95
31
64
59.1
4.8
115.4
82.4 Y
7/11/2014 0.25
0.00
631
17.6
87.5
57.1
72.2
94
36
65
59.9
4.8
114.6
82.8 Y
7/12/2014 0.22
0.00
583
18.2
84.6
56.3
70.7
95
51
71
60.8
4.2
101.6
82.9 Y
7/13/2014 0.22
0.00
611
19.7
83.2
57.8
69.3
97
61
80
63.0
4.6
109.4
82.8 Y
7/14/2014 0.12
0.00
387
20.0
84.5
61.4
69.5
97
57
81
63.5
2.0 R
48.6 R
80.1
7/15/2014 0.16
0.00
468
19.8
78.1
61.1
68.9
94
68
82
63.2
4.6
109.3
79.7
7/16/2014 0.24
0.00
621
18.5
85.1
62.0
72.1
90
46
69
61.3
4.9
118.3
80.6
7/17/2014 0.22
0.00
594
17.6
82.3
60.1
70.6
88
49
69
59.9
4.1
99.4
81.0
7/18/2014 0.22
0.00
608
17.2
83.0
57.5
69.2
92
48
71
59.3
4.3
102.8
80.5
7/19/2014 0.15
0.00
441
18.7
79.6
60.8
68.8
92
61
78
61.6
4.3
104.3
79.9
7/20/2014 0.20
0.00
558
19.4
82.2
60.7
70.8
90
58
75
62.6
4.4
105.2
79.7
7/21/2014 0.23
0.00
625
19.0
85.9
59.1
72.5
89
48
70
62.1
4.1
98.6
80.3
7/22/2014 0.24
0.00
626
18.4
87.6
56.6
71.8
94
48
69
61.1
4.1
98.0
79.9
7/23/2014 0.25
0.00
630
16.8
92.1
53.3
73.4
93
35
60
58.6
3.3
80.1
79.6
7/24/2014 0.25
0.00
608
17.8
95.9
56.9
77.1
90
32
56
60.2
3.2
76.4
79.6
7/25/2014 0.11
0.00
323
21.6
86.6
64.0
72.8
92
58
78
65.7
2.5 Y
61.2 Y
79.6
7/26/2014 0.19
0.00
516
20.4
91.0
59.6
73.3
95
47
73
64.1
3.3
79.7
78.9
7/27/2014 0.11
0.06
336
21.7
91.9
63.2
73.5
93
46
77
65.8
2.4 Y
57.8 Y
79.1
7/28/2014 0.24
0.00
577
17.3
93.5
62.2
76.2
94
26
56
59.4
3.4
82.1
78.9
7/29/2014 0.25
0.00
589
15.3
95.1
59.0
76.4
84
26
49
56.0
3.3
79.6
78.8
7/30/2014 0.25
0.00
577
17.6
95.3 Y
58.3
76.6
92
31
56
59.9
4.0
96.2
79.1
7/31/2014 0.24
0.00
569
19.7
95.5 Y
60.3
76.8
93
34
63
63.1
4.4
105.2
79.9
Tots/Avgs 6.79
0.06
573
18.4
87.9
58.9
72.3
93
44
68
61.0
3.9
93.9
80.2
25
Date ETo (in)
Precip (in)
Sol Rad (Ly/day)
Avg Vap Pres
(mBars)
Max Air
Temp (°F)
Min Air
Temp (°F)
Avg Air Temp (°F)
Max Rel
Hum (%)
Min Rel
Hum (%)
Avg Rel
Hum (%)
Dew Point (°F)
Avg Wind
Speed (mph)
Wind Run
(miles)
Avg Soil
Temp (°F)
8/1/2014 0.23
0.00
560
20.7
92.7
63.4
75.8
92
42
68
64.5
4.0
96.9
80.7
8/2/2014 0.02
0.07 R
120
22.3
79.8
63.2
70.6
96
73
87
66.6
1.9 R
45.1 R
80.1
8/3/2014 0.08
0.00
292
23.4 Y
82.6
65.9
70.4
97
70
92 Y
68.0 Y
3.4
82.0
79.0
8/4/2014 0.23
0.00
592
19.5
89.8
57.5
72.4
98
41
72
62.7
4.2
101.9
78.0
8/5/2014 0.24
0.00
617
15.5
89.8
49.8
69.2
97
29
63
56.3
3.8
90.5
77.4
8/6/2014 0.23
0.00
610
17.3
83.4
58.6
70.4
93
43
68
59.4
4.6
111.6
77.3
8/7/2014 0.20
0.00
546
17.8
84.4
60.7
69.9
91
45
71
60.2
4.1
97.2
76.9
8/8/2014 0.18
0.00
508
18.9
84.1
57.9
69.8
95
54
76
61.9
3.9
93.0
76.6
8/9/2014 0.22
0.00
586
19.8
84.7
59.7
71.6
93
56
75
63.2
4.2
100.2
76.7
8/10/2014 0.21
0.00
573
19.4
86.9
54.9
71.8
96
51
73
62.7
3.4
82.2
76.6
8/11/2014 0.21
0.00
525
20.4
88.3
59.0
72.7
95
50
74
64.1
4.0
95.7
76.7
8/12/2014 0.20
0.00
545
20.9
86.5
61.6
72.3
95
57
77
64.7
4.3
103.7
77.0
8/13/2014 0.20
0.00
544
20.7
86.2
59.2
72.8
93
54
75
64.4
3.6
85.4
77.2
8/14/2014 0.23
0.00
596
18.7
89.5
-- S
77.1
96
45
59
61.6
4.6
110.0
77.7
8/15/2014 0.24
0.00
593
19.0
92.2
58.0
75.5
94
43
63
62.1
3.3
80.0
78.0
8/16/2014 0.24
0.00
601
17.5
93.8
60.1
75.4
91
37
58
59.8
3.2
76.3
79.4
8/17/2014 0.23
0.00
591
16.9
91.6
56.8
74.4
88
33
58
58.7
3.0
71.7
79.8
8/18/2014 0.22
0.00
570
19.9
86.6
58.5
72.3
94
53
74
63.4
4.3
104.0
80.2
8/19/2014 0.20
0.00
561
18.9
82.3
61.5
71.1
91
53
73
61.8
3.9
92.8
80.8
8/20/2014 0.11 R
0.00
397
18.9
82.1
59.0
66.5
97
62
85
61.9
1.5 R
36.9 R
80.0
8/21/2014 0.18 H
0.00
504
18.4
86.6
-- S
68.0 H
100
51
79
61.2
3.1
74.4
77.4
8/22/2014 0.22
0.00
571
17.7
86.2
57.4
71.2
95
40
68
60.0
3.8
91.5
78.0
8/23/2014 0.23
0.00
589
14.9
86.2
49.2
68.2
94
37
63
55.3
4.1
97.7
77.5
8/24/2014 0.21
0.00
536
15.9
87.7
56.3
69.6
91
34
64
57.1
3.5
84.4
77.4
8/25/2014 0.21
0.00
555
18.0
87.9
59.3
72.2
93
42
67
60.5
3.8
91.8
77.9
8/26/2014 0.23
0.00
560
17.3
89.4
55.7
72.2
94
39
64
59.3
4.4
104.7
78.3
8/27/2014 0.24
0.00
562
14.5
94.9
56.2
75.4
91
26
48
54.5
3.8
92.2
78.5
8/28/2014 0.25
0.00
567
14.7
95.9
57.3
75.8
81
29
48
54.8
4.5
108.1
78.8
8/29/2014 0.23
0.00
565
16.6
93.6
56.2
73.6
91
31
59
58.2
4.2
101.8
78.9
8/30/2014 0.21
0.00
535
17.3
94.1
53.0
71.8
97
33
65
59.5
3.7
88.1
78.9
8/31/2014 0.22
0.00
555
18.0
93.5
53.8
72.5
95
35
66
60.5
4.1
97.7
79.0
Tots/Avgs 6.35
0.07
536
18.4
88.2
57.9
72.0
94
45
69
60.9
3.7
90.0
78.3
Date ETo
(in) Precip
(in) Sol Rad (Ly/day)
Avg Vap Pres
(mBars)
Max Air Temp (°F)
Min Air Temp (°F)
Avg Air Temp (°F)
Max Rel
Hum (%)
Min Rel
Hum (%)
Avg Rel
Hum (%)
Dew Point (°F)
Avg Wind Speed (mph)
Wind Run
(miles)
Avg Soil
Temp (°F)
9/1/2014 0.21
0.00
555
18.1
89.1
57.8
71.5
95
39
69
60.7
3.9
94.4
79.3
9/2/2014 0.21
0.00
541
19.0
89.8
59.7
72.8
94
39
69
62.0
4.4
104.4
79.5
9/3/2014 0.20
0.00
540
19.4
87.0
62.9
73.5
89
45
69
62.7
4.2
100.0
80.3
9/4/2014 0.19
0.00
505
18.7
86.4
57.9
71.6
92
46
70
61.5
4.0
96.1
80.5
9/5/2014 0.20
0.00
516
18.7
89.4
55.3
71.8
95
44
70
61.5
4.4
105.2
80.0
9/6/2014 0.21
0.00
514
20.5
97.2
61.0
77.2
94
34
64
64.1
3.2
76.0
80.5
9/7/2014 0.17
0.00
402
20.8
97.8
65.3
77.8
97
35
64
64.6
3.5
84.3
80.9
26
Date ETo (in)
Precip (in)
Sol Rad (Ly/day)
Avg Vap Pres
(mBars)
Max Air Temp (°F)
Min Air Temp (°F)
Avg Air Temp (°F)
Max Rel
Hum (%)
Min Rel
Hum (%)
Avg Rel
Hum (%)
Dew Point (°F)
Avg Wind Speed (mph)
Wind Run
(miles)
Avg Soil
Temp (°F)
9/8/2014 0.18 H
0.00
414
14.4
93.1
-- S
70.3 H
100
18
57
54.4
3.5
84.7
78.8
9/9/2014 0.20
0.00
489
16.9
90.4
60.3
74.9
81
39
57
58.7
3.8
91.4
78.0
9/10/2014 0.20
0.00
497
16.3
91.7
56.6
73.1
90
34
59
57.8
3.5
83.8
77.7
9/11/2014 0.21
0.00
500
15.9
93.3
58.4
74.5
87
33
55
57.1
3.5
84.3
77.7
9/12/2014 0.20
0.00
495
18.0
94.2
56.9
75.2
86
36
60
60.5
3.1
75.2
77.7
9/13/2014 0.20
0.00
497
19.4
94.1
58.9
75.7
93
33
64
62.6
3.1
75.1
78.3
9/14/2014 0.20
0.00
482
20.1
101.0 Y
59.8
79.2 Y
95
30
59 Y
63.6 Y
3.3
78.4
78.6
9/15/2014 0.21 R
0.00
482
20.1
100.1 Y
63.9
80.9 R
89
32
-- R
-- I
3.2
77.4
79.4
9/16/2014 0.21 R
0.00
477
21.3 Y
102.7 Y
64.5 Y
-- S
86
31
-- Q
-- Q
4.6
111.0
79.8 Y
9/17/2014 0.20 R
0.00
479
20.6
96.9
65.6 Y
-- S
78
39
-- Q
-- Q
4.1
97.6
81.1 Y
9/18/2014 0.18
0.00
483
19.7
84.7
59.5
72.5
91
49
72
63.0
3.8
91.8
80.0
9/19/2014 0.15
0.00
427
19.7
84.6
62.3
72.1
88
52
73
63.1
3.1
75.1
79.7
9/20/2014 0.11
0.00
345
18.7
81.0
57.9
69.8
89
57
75
61.6
3.1
74.1
78.8
9/21/2014 0.15
0.00
435
18.1
82.2
57.7
69.0
91
52
75
60.6
2.9
70.3
77.9
9/22/2014 0.15
0.00
459
18.0
87.1
54.5
66.2
97
46
82
60.5
2.7
65.3
77.0
9/23/2014 0.16
0.00
474
17.1
90.6
52.2
68.5
98
38
72
59.1
2.4
58.7
72.9
9/24/2014 0.18
0.00
463
16.3
92.4
54.9
73.1
96
29
58
57.7
2.5
60.3
73.7
9/25/2014 0.18
0.00
452
16.1
92.5
58.1
73.5
87
31
57
57.4
3.2
76.0
74.6
9/26/2014 0.17
0.00
450
17.8
84.7
60.9
70.8
91
44
69
60.1
4.2
101.9
74.9
9/27/2014 0.15
0.00
458
15.6
77.9
52.7
65.4
95
47
73
56.6
3.5
84.7
74.3
9/28/2014 0.13
0.00
390
15.5
78.0
56.2
65.1
93
48
73
56.3
3.5
83.5
73.5
9/29/2014 0.15
0.00
446
15.8
79.8
50.1
65.2
96
50
74
56.8
3.2
77.5
72.8
9/30/2014 0.17
0.00
452
15.5
86.4
51.4
68.2
94
36
66
56.4
3.3
79.2
72.6
Tots/Avgs 5.43
0.00
471
18.1
89.9
58.4
72.1
92
40
67
60.0
3.5
83.9
77.7
Date ETo
(in) Precip
(in) Sol Rad (Ly/day)
Avg Vap Pres
(mBars)
Max Air
Temp (°F)
Min Air Temp (°F)
Avg Air Temp (°F)
Max Rel
Hum (%)
Min Rel
Hum (%)
Avg Rel
Hum (%)
Dew Point (°F)
Avg Wind
Speed (mph)
Wind Run
(miles)
Avg Soil
Temp (°F)
10/1/2014 0.15
0.00
437
16.2
84.0
48.7
64.8
96
43
77
57.5
3.2
77.9
72.3
10/2/2014 0.21
0.00
463
9.7
97.1
46.4
71.7
97
12
37
43.8
3.8
90.6
72.1
10/3/2014 0.19
0.00
450
8.2 Y
99.8
47.0
71.4
62
10
31 Y
39.5 Y
3.1
75.6
71.8
10/4/2014 0.19
0.00
456
8.9
95.1
45.4
69.5
76
15
36
41.5
2.9
69.8
71.2
10/5/2014 0.19
0.00
444
9.5
94.5
46.6
68.6
78
18
40
43.3
3.0
72.7
71.0
10/6/2014 0.16
0.00
366
9.5
93.9
47.4
69.0
78
14
39
43.2
3.1
75.4
70.8
10/7/2014 0.13
0.00
273
10.9
94.0
56.0
71.1
75
16
42
46.9
3.6
85.4
71.2
10/8/2014 0.17
0.00
414
14.0
90.2
50.4
69.4
90
21
57
53.5
4.2
100.
71.2
10/9/2014 0.15
0.00
407
17.2
82.5
53.1
69.0
94
45
71
59.2
4.6
110.
72.2
10/10/2014 0.15
0.00
417
15.2
84.5
49.5
64.7
97
38
73
55.8
3.7
89.4
71.6
10/11/2014 0.15
0.00
413
16.2
85.7
53.1
67.3
95
41
71
57.5
3.9
92.5
71.5
10/12/2014 0.13
0.00
396
16.1
83.1
47.8
63.9
96
49
80
57.5
3.9
93.7
71.3
10/13/2014 0.13
0.00
395
15.7
84.7
46.0
63.8
97
44
78
56.8
3.4
80.7
70.8
10/14/2014 0.12
0.00
369
16.2
82.9
47.2
64.7
96
47
78
57.5
4.0
96.0
70.7
10/15/2014 0.07
0.00
223
16.4
79.1
57.5
65.8
93
51
76
57.9
3.3
79.4
71.2
27
Date ETo (in)
Precip (in)
Sol Rad (Ly/day)
Avg Vap Pres
(mBars)
Max Air
Temp (°F)
Min Air Temp (°F)
Avg Air Temp (°F)
Max Rel
Hum (%)
Min Rel
Hum (%)
Avg Rel
Hum (%)
Dew Point (°F)
Avg Wind
Speed (mph)
Wind Run
(miles)
Avg Soil
Temp (°F)
10/16/2014 0.12
0.00
373
16.1
79.1
56.6
65.2
98
47
76
57.4
3.9
94.3
70.4
10/17/2014 0.11
0.00
347
16.9
77.7
55.8
64.4
98
53
82
58.7
4.0
95.7
68.3
10/18/2014 0.12
0.00
359
16.3
76.5
53.6
65.0
94
54
77
57.8
3.3
79.5
69.5
10/19/2014 0.11
0.00
355
15.8
79.8
50.9
63.5
95
55
79
56.8
3.1
74.1
69.0
10/20/2014 0.09
0.00
290
17.1
79.4
52.1
65.6
94
57
80
59.1
3.6
86.2
69.0
10/21/2014 0.00 H
0.00 H
362 H
16.9 H
82.4
49.7
66.7 H
95 H
87 H
75
58.7
4.2 H
99.8 H
70.0 H
10/22/2014 0.14
0.00 H
383 H
12.9 H
85.8
44.5
63.4 H
95 H
33 H
65
51.3
3.0 H
71.0 H
69.0 H
10/23/2014 0.13
0.00
356
12.0
89.1
43.9
63.8
95
27
60
49.4
2.6
62.6
67.9
10/24/2014 0.15
0.00
370
10.8
91.0
46.8
67.4
90
25
47
46.5
3.6
87.5
67.4
10/25/2014 0.13
0.00
345
13.8
83.8
52.7
65.5
94
40
65
53.2
3.8
91.9
67.8
10/26/2014 0.07
0.00
252
16.3
75.9
55.4
64.2
92
63
80
57.8
4.1
97.7
68.2
10/27/2014 0.11
0.00
359
14.5
78.3
52.8
62.6
95
45
75
54.4
3.2
76.2
68.0
10/28/2014 0.11
0.00
354
14.6
80.5
47.5
62.9
93
49
75
54.7
3.4
82.5
67.4
10/29/2014 0.12
0.00
355
12.5
85.9
44.9
62.6
93
30
64
50.4
3.1
75.2
67.0
10/30/2014 0.10
0.00
296
13.8
83.0
44.4
61.2
93
34
75
53.1
3.5
83.9
66.1
10/31/2014 0.03
0.01 R
126
16.5
73.9
58.9 Y
64.5
93
57
80
58.1
3.0
72.4
67.0
Tots/Avgs 3.93
0.01
361
14.1
84.9
50.1
65.9
91
39
66
53.2
3.5
84.5
69.8
Flag Legend A - Historical Average I - Ignore R - Far out of normal range C or N - Not Collected M - Missing Data S - Not in service H - Hourly Missing or
Flagged Data Q - Related Sensor
Missing Y - Moderately out of range
Conversion Factors Ly/day/2.065=W/sq.m inches * 25.4 = mm (F-32) * 5/9 = c
mph * 0.447 = m/s mBars * 0.1 = kPa miles * 1.60934 = km