Embed Size (px)
Citation preview

FINAL REPORT
I. PROJECT TITLE: Formation of volatile sulfur compounds in Pinot noir post-fermentation. #2015-1545
II. PRINCIPAL INVESTIGATORS:
J.P. Osborne. Extension Enologist, Department of Food Science and Technology, Oregon State
University, Corvallis, OR.97331, ph 541-737-6494; email [email protected]
M. Qian, Department of Food Science and Technology, Oregon State University, Corvallis,
OR.97331, ph 541-737-9114; email: [email protected]
INDUSTRY COLLABORATERS:
Tresider Burns, Associate Winemaker Brittan Vineyards; [email protected]
Elizabeth Clark, Winemaker, Airlie; [email protected]
Dave Paige, Winemaker, AdelsheimVineyards;[email protected]
III. SUMMARY:
Development of volatile sulfur compounds (VSCs) post-fermentation can be a significant issue
during both red and white winemaking. Unfortunately our understanding of factors or conditions
that impact VSCs is limited due in part to the complexity of their formation. This study focused
on the development of VSCs in Pinot noir during post-fermentation aging. During the first year
of the study the impact of wine lees levels and composition on formation of VSCs was
determined. Although lees levels and yeast strain impacted the concentration of sulfur containing
amino acids and glutathione (pre-cursors for the formation of VSCs) in the wines, this did not
correlate to an increase in the formation of VSCs during the nine month duration of the
experiment. Wine samples supplied by wineries who noted early formation of VSCs contained
predominately H2S and not mercaptans and disulfides. This indicated that the early formation of
reductive smells soon after going to barrel were most likely due to H2S rather than the formation
of more complex volatile sulfur compounds.Based on these results the focus of the project
shifted to identifying what factors may impact the late formation of H2S during fermentation
and/or the formation of H2S post-fermentation.
Experiments in synthetic grape juice demonstrated that variations in yeast assimilable nitrogen
(YAN) concentration as well as whether YAN was derived from amino acids or diammonium
phosphate (DAP) impacted H2S production during fermentation as well the concentration of
otherVSCs post-fermentation. In particular, DAP supplementation increased the amount of H2S
formed late in fermentation and resulted in the highest amount of methyl thioacetate(MeSOAc)
in the wines post-fermentation. Fermentations conducted using Pinot noir grapes where different
concentrations of elemental sulfur (S0) were added resulted in increased H2S formation during
alcoholic fermentation by both a high H2S producing yeast (UCD522) and a no-H2S producing
yeast (P1Y2) demonstrating the impact of S0
on yeast produced and non-yeast produced H2S.
H2S production was higher in fermentations conducted by UCD522 with increasing amounts of
S0
resulting in increasing production of H2S. In addition, higher S0
concentrations resulted in
higher H2S production late in fermentation. This is particularly important as H2S formation late
in fermentation is more likely to be retained in the wine due to the reduced production of CO2 by

yeast. Higher S0
also resulted in wines containing higher concentrations of MeSOAcpost-
fermentation. Both of these findings suggest an important role for elemental sulfur in the
formation of VSCs during and after fermentation.Additional experiments using Pinot noir grapes
showed that H2S production during fermentation was also impacted by the type of nitrogen
present. DAP additions caused an increase in H2S formation while addition of amino acid
decreased H2S formation regardless of whether S0 was added or not. Fermentations where DAP
and S0
were both added produced the highest amount of total H2S with 35-45% more H2S being
produced in these ferments than produced in ferments where S0 or DAP additions were made
individually. Post-fermentation, YAN concentration and composition as well as S0
impacted the
concentration of VSCs other than H2S. In particular, S0
and high YAN increased the
concentration of MeSOAc in the wines post-fermentation. The type of nitrogen added
(ammonium vs. amino acid) had less of an impact on MeSOAc concentration then the increase in
YAN. This may be related to the mechanism by which MeSOAC is formed during fermentation
as well as the formation of methanethiol. These results indicate that the type and amount of
nitrogen present during fermentation can impact formation of VSCs as can the presence of S0. In
particular, DAP additions led to increased H2S formation during fermentation while high YAN
resulted in elevated MeSOAC in the wines post-fermentation.
Because of the known role of elemental sulfur in the formation of VSCs, the concentration of
this compound on Willamette Valley grapes at harvest was assessed as were techniques to reduce
the amount of S0 on red grapes pre-fermentation. For the two years that S
0 content on grapes was
measured only low levels were noted. Only three out of the forty one samples analyzed contained
S0 concentrations greater than 1 ug/g. This may have been related to the warm, dry vintages in
which these samples were collected from (2014 & 2015). Experiments conducted to explore
ways to reduce the amount of S0on red grapes prior to fermentation showed that cold soaking of
Pinot noir grapes followed by draining off the juice reduced the amount of S0on the remaining
grapes. Cold settling the juice followed by racking and addition of the racked juice back to the
original grapes allowed minimal loss of volume.
IV. OBJECTIVES AND EXPERIMENTS CONDUCTED TO MEET STATED
OBJECTIVES:
Objective 1.Determine the effect of wine lees level and contact time on formation of volatile
sulfur compounds and volatile sulfur compound pre-cursors during aging of Pinot noir
wine.
Initial experiments have been undertaken where Pinot noir wines were be produced using grapes
from the Oregon State University vineyard. Grapes were harvested and stored overnight at 4 C
before being destemmed and dispensed into 100 L stainless steel tanks. Samples were taken and
assessed for pH, TA, Brix and yeast assimilable nitrogen. Additional grape samples were frozen
and will be assessed for amino acid and glutathione content by HPLC according to Lee and
Schriener (2010) and Park et al. (2000). The grape must underwent a 5 day cold soak (8-9 C)
before being warmed and inoculated with one of two commercial yeast cultures. To one set of
tanks (3 tanks) the low/no H2S producing yeast strain Saccharomyces cerevisiae P1Y2 was
added while to another set of tanks the yeast Saccharomyces cerevisiaeRC212 was added.

Fermentations were undertaken at 27 C and Brix and temperature were monitored. At the
completion of alcoholic fermentation wines were pressed and split into three different lees
treatments based on settling time (0, 24, and 72 hrs settling at 4 C). Wine turbidity was
measured by a turbidity meter to help quantify the effectiveness of settling to remove lees. Initial
samples were taken and assessed for volatile sulfur compounds by HS-SPME-GC-PFPD as
described by Fang and Qian (2005). Separate samples were collected and frozen for later
analysis of glutathione and amino acids by HPLC. After appropriate settling the wines were
dispensed into three gallon carboys fully topped and closed with an airlock and 50 mg/L SO2 was
added before being stored at 13C. Large stir bars were placed in the carboys to allow stirring to
occur prior to sampling while minimizing exposure of the wine to air. These wines were stored at
13C and sampled after 1, 2, 3, 6, and 9 months. Samples were assessed by the Osborne lab for
amino acid content by HPLC according to Lee and Schriener (2010). Wine samples were also
analyzed for volatile sulfur compounds by the Dr. Michael Qian‟s lab as part of a separately
funded project. Volatile sulfur compounds were assessed by HS-SPME-GC-PFPD.
Objective 2.Investigate the impact of grape amino acid composition and concentration on
formation of volatile sulfur compounds and volatile sulfur compound pre-cursors during
aging.
Volatile sulfur compounds in winery samples
Wine samples were collected from collaborating wineries who noted volatile sulfur formation in
wines soon after wine was placed in barrel. Wineries were instructed to take wine samples after
pressing and after 2 and 4 weeks in barrel. Samples were assessed for volatile sulfur compounds
by HS-SPME-GC-PFPD.
Role of nitrogen concentration and composition
A synthetic grape juice was utilized where concentration and composition of the nitrogen in the
juice could be tightly controlled. Synthetic grape juice composition was based on Osborne and
Edwards (2006). However, the amino acid content of the juice was modified to better reflect the
amino acid content of Oregon Pinot noir grapes as reported by Lee and Schriener (2010). The
yeast available content of the juice was manipulated by altering the amino acid and ammonia
content of the juices. Three juices were prepared with three different YAN compositions (Table
5). Low amino acid juice contained a total of 112 mg/L YAN where 81 mg/L YAN was derived
from primary amino acids while the remaining 31 mg/L was derived from ammonia (added as
diammonium phosphate (DAP)). The high amino acid juice contained 346 mg/L YAN where
primary amino acids provided 315 mg/L while ammonia again provided 31 mg/L YAN. In the
high DAP juice the YAN content was 350 mg/L but the majority of the YAN was provided by
ammonia (269 mg/L). Aside from nitrogen composition and concentration, all other components
were identical between the three synthetic juices. The basic parameters of the juices were 23
Brix, pH 3.40, and 0.65 g/100 mL titratable acid. The synthetic juice was sterile filtered and 2.5
L dispensed into sterilized 4 L Erlenmeyer flasks. Two different yeast strains were used for the
fermentations. In one set of juices (high amino acids, low amino acids, high DAP) the non-H2S
producing yeast strain S. cerevisiae P1Y2 was inoculated while in another set of juices S.
cerevisiae UCD522 was inoculated. UCD522 is reported to produce high amounts of H2S during
fermentation (Spiropoulos et al. 2000; Edwards and Bohlscheid 2007). All treatments were
prepared in triplicate. After inoculation the flasks were stoppered with a modified fermentation

lock where fermentation gases were forced to pass through an H2S detection tube (Gastec 4H
tubes). These tubes can be used to quantify H2S gas by the reaction between lead acetate and H2S
which causes a color change in the tube. H2S concentration was determined by relating the
distance of color change on the detection tube to that observed for calibration standards (Ugliano
and Henschke 2010). Tubes were regularly changed out during the course of the alcoholic
fermentation in order to determine the production of H2S over time. Fermentations were
conducted at 21C in a temperature controlled room. Brix was monitored daily using an Anton-
Paar DMA 35N Density Meter while samples were also taken daily and plated on YPD media to
determine yeast viable cells. At the completion of alcoholic fermentation samples were taken for
amino acid and volatile sulfur compound analysis. Wines were then transferred to smaller
sterilized Erlenmeyer flasks so as to remove headspace. Wines were stored at 13C, sampled
after 1 and 3 months, and analyzed for volatile sulfur compounds by by HS-SPME-GC-
PFPD.Amino acids were assessed by HPLC-DAD.
Role of elemental sulfur
Pinot noir wines were produced using grapes from the Oregon State University vineyard
(Woodhall Vineyard, Alpine, OR). After destemming, three kilograms of grapes were placed in
four liter red wine microfermenters as described by Takush and Osborne (2011). The
microfermenters were modified so that the original fermentation lock was replaced with a
fermentation lock where fermentation gases were forced to pass through an H2S detection tube
(Gastec 4H tubes). Basic grape parameters were 22.5Brix, pH 3.20, 0.84 g/100 mL titratable
acid and 80 mg/L YAN. All fruit received an addition of 0.2 g/L Fermaid K as well as an
addition of 0.25 g/L DAP to raise the YAN content to approximately 150 mg/L. Elemental sulfur
was added in different amounts to each treatment. In one set of fermenters no S0 was added, to
another set of fermenters 5 g/g of S0
was added, while to a third set of fermenters 15 g/g of S0
was added. The original residual S0content of the Pinot noir grapes was measured utilizing the
method outlined by Kwasniewski et al (2011) and no S0 was detected on the grapes. Two
different yeast strains were used for the fermentations. In one set of fermenters (0, 5, 15 g/g S0)
the non-H2S producing yeast strain S. cerevisiae P1Y2 was inoculated while in another set of
fermenters S. cerevisiae UCD522 was inoculated. After inoculation the fermenters were placed
in a temperature controlled room held at 27C.Brix was monitored daily using a density meter
and H2S detection tubes were regularly changed out during the course of the alcoholic
fermentation in order to determine the production of H2S over time. At the completion of
alcoholic fermentation the wines were pressed and settled. Fourteen days post-pressing samples
were taken for amino acid and volatile sulfur compound analysis. Wines were then transferred to
2 L carboys and topped fully to prevent any headspace. Wines were stored at 13C, sampled after
1 and 3 months, and analyzed for volatile sulfur compounds by HS-SPME-GC-PFPD and amino
acids were assessed by HPLC-DAD. Glutathione was assessed by LC-MS/MS according to
Roland and Schneider (2015). Glutathione analysis was performed in collaboration with the
Oxidative/Nitrative Stress Core Laboratory (ONSL) facility housed in the Linus Pauling Institute
at Oregon State University.
Combined impact of nitrogen composition and concentration, and elemental sulfur
A set of experiments investigating the impact of S0, yeast strain, and concentration and
composition of YAN on H2S and VSC formation during and after fermentation was conducted
using Pinot noir grapes harvested in September 2015 (Woodhall Vineyard, Alpine, OR). After

destemming, one kg of grapes was placed in four liter red wine microfermenters as described by
Takush and Osborne (2011). The microfermenters were modified so that the original
fermentation lock was replaced with a fermentation lock where fermentation gases were forced
to pass through an H2S detection tube (Gastec 4H tubes). Basic grape parameters were 24.8Brix,
pH 3.42, 0.64 g/100 mL titratable acid and 110 mg/L YAN (78 mg N/L α-amino, 32 mg N/L
NH4+). The following treatments were conducted in triplicate and fermented using either S.
cerevisiae UCD 522 (high H2S producing strain) or P1Y2 (no H2S producing strain):
1) UCD522 Control
2) UCD522 + 10 ug/g S0
3) UCD522 + DAP to achieve 250 mg N/L YAN
4) UCD522+ DAP + 10 ug/g S0
5) UCD522 + amino acid mixture to achieve 250 mg N/L YAN
6) UCD522 + amino acid mixture + 10 ug/g S0
7) P1Y2 Control
8) P1Y2 + 10 ug/g S0
9) P1Y2 + DAP + 10 ug/g S0
The amino acid mixture added to treatments 5 & 6 was based on the concentration of the
individual amino acids in Pinot noir grapes (Lee and Schriener 2010). After inoculation
fermenters were placed in a temperature controlled room held at 27C.Brix was monitored daily
using a density meter (DMA) and Gastec 4H H2S detection tubes were regularly changed out
during the course of the alcoholic fermentation in order to determine production of H2S over
time. At the completion of alcoholic fermentation wines were pressed and settled. Samples were
taken for VSC analysis by HS-SPME-GC-PFPD as described by Fang and Qian (2005).
Elemental sulfur on Willamette Valley grapes at harvest
The role of S0
in the formation of VSCs in Oregon wines was investigated by the Osborne lab
through the assessment of residual S0
content of grapes at harvest. Grape samples from wineries
in the Willamette Valley were solicited with wineries instructed to take a 2-3 cluster sample from
vineyard lots that traditionally had problems with reduction during winemaking as well as any
lots where later season sulfur sprays were applied. Samples were frozen at the wineries before
being collected and transported to the Osborne lab at OSU. Residual S0
content of the grapes was
measured according to Kwasniewski et al (2011). In brief, grape samples were blended, heated in
PEG 400 (to aid in solubilizing S0), diluted with water, and de-aerated and pH adjusted to pH 6
by the addition of an antacid tablet (Alka-Seltzer). Following de-aeration, a reducing agent
(dithiothreitol) was added to reduce S0 to H2S. The H2S was sparged through a Gastec 4M H2S
detection tube via addition of two additional antacid tablets. H2S concentration was determined
by relating the distance of color change on the detection tube to that observed for calibration
standards.
Methods to reduce the amount of S0
on red grapes prior to fermentation were explored. While
Kwasniewski et al. (2014) demonstrated that cold settling of white grape juice could reduce
elemental sulfur levels by up to 95%; no method to reduce elemental sulfur content on red grapes
has been described. Wettable or microthiol sulfur was applied at 5 lbs/acre to Pinot noir grapes at
Woodhall vineyard (Alpine, OR) six days prior to harvest. Sulfur was applied using a hand

sprayer and a sticker (R56) was used. After harvest (by hand) grapes were destemmed and placed
in 100 L stainless steel tanks. Grapes were split into two tanks per sulfur treatment (wettable and
microthiol). Samples were taken prior to destemming and assessed for elemental sulfur content
as previously described. Once grapes were placed in the tanks they were mixed and an inert gas
(N2) was blanketed on top before lids were securely placed onto the tanks. Each tank contained
approximately 35 kg of fruit. Tanks were placed in a cold room set to 8C and allowed to cold
soak for seven days. After seven days the juice in each tank was drained from the bottom valve
into a carboy. The S0
content of the juice as well as the grapes left in the tanks was measured as
previously described. For each treatment, 2 L of the drained off juice was placed in a cold room
at 4C for 24hrs. After this time the juice was racked off of the lees. The S0
content of the racked
juice as well as the lees was assessed.
One kg fermentations of each treatment were performed to determine the impact on H2S
production. The following treatments were conducted in triplicate using grapes treated with
either wettable or microthiol sulfur:
1) Control – no removal of juice
2) Saignee grapes (juice removed after seven days cold soak)
3) Saignee grapes + cold settled juice (reconstituted to initial grape/juice ratio)
All treatments were fermented using the no-H2S producing S. cerevisiae strain P1Y2 so that any
H2S produced could be attributed to S0. After inoculation the fermenters were placed in a
temperature controlled room held at 27C.Brix was monitored daily using a density meter and
Gastec 4H H2S detection tubes were regularly changed out during the course of the alcoholic
fermentation in order to determine the production of H2S over time. At the completion of
alcoholic fermentation the wines were pressed and settled. Samples were taken for VSC analysis
by HS-SPME-GC-PFPD as described by Fang and Qian (2005). Wines were assessed for free
and bound H2S using the TCEP method as previously described.
Investigating “bound” or “releasable” H2S
It has been proposed that H2S at the end of fermentation can be present bound to as yet unknown
compound(s). This form of H2S is no longer volatile and so will not be detected by smell.
However, under reductive conditions (such as those present in a barrel or bottle) H2S may be
reduced back to its free form and become detectable by smell again. In order to test this
hypothesis, Pinot noir wine previously produced from experiments investigating the impact of S0
on H2S production were assessed for free and “bound” H2S. These wines were used as they
represented wines where a range of H2S was produced during fermentation. Free and “bound”
H2S was measured using a method based on the analysis of S0
on grapes (Kwasniewski et al
2011). In brief, 20 mLs of wine was placed in a 250 mL Erlenmeyer flask along with 60 mL DI
water. An antacid tablet (Alka-Seltzer) was added and any free H2S sparged from the wine was
measured by passing the gas through a Gastec 4LT H2S detection tube. H2S concentrations were
determined by relating the distance of color change on the detection tube to that observed for
calibration standards (Ugliano and Henschke 2010). To measure “bound” H2S a strong reducing
agent, tris-2-carboxyethyl phosphine (TCEP), was added to the sample. After 5 minutes an
antacid tablet was added and any released H2S was measured by passing the gas through a 4LT
H2S detection tube. A second antacid tablet was added after 2 minutes. TCEP was used as a

reducing agent rather than dithiothreitol (as used for S0
analysis) as using dithiothreitol in wine
can result in false positives due to reactions with reduced and oxidized glutathione present in
wine (Rothwarf and Scheraga 1992).
V.SUMMARY OF MAJOR RESEARCH ACCOMPLISHMENTS AND RESULTS:
After processing, Pinot grapes were distributed into tanks and samples were taken and assessed
for basic chemical parameters (Table 1). Wines fermented by RC212 had lower ethanol and free
amino acid concentrations than wines fermented by P1Y2 and all wines have low residual
ammonia (Table 2). Wines were prepared with different levels of lees by settling for various
times. This resulted in wines with different turbidities (Table 3) where unsettled wine had very
high turbidity while settling for 24rs resulted in a large reduction in turbidity. Settling wine for
an additional 48 hrs did not result in a large difference in turbidity.
Table 1.2013 Pinot noir grape chemistry. n=6
Brix Titratable acidity
(g/100 ml)
pH Ammonia (mg/L) Free amino acids (mg/L)
23.3 ± 0.5 0.56 ± 0.02 3.51 ± 0.21 28.2 ± 2.3 122.7 ± 5.2
Table 2.Basic chemistry of Pinot noir wines produced by two different S. cerevisiae commercial
yeast. n=3
Titratable acidity
(g/100 ml)
pH Ammonia
(mg/L)
Free amino
acids (mg/L)
Ethanol
(% v/v)
RC212 0.67 ± 0.04 3.66 ± 0.01 5.8 ± 0.4 50.4 ± 1.9 12.6 ± 0.2
P1Y2 0.64 ± 0.01 3.70 ± 0.02 5.7 ± 0.6 61.7 ± 3.3 13.2 ± 0.1
Table 3.Turbidity (NTU) of Pinot noir wines made with two different S. cerevisiae commercial
yeast after set periods of settling at 4 C. n=3 0 hrs settling 24 hrs settling 72 hrs settling
RC212 > 10,0000 800 600
P1Y2 > 10,0000 800 600
Table 4.Concentrations of ammonia and free amino nitrogen in Pinot noir wines aged three
months on heavy, medium, or light lees after fermentation by S. cerevisiae RC212 or S.
cerevisiae P1Y2. n=3
Ammonia (mg/L) Free amino nitrogen (mg/L)
RC212 Heavy lees 1.5 ± 0.7 61.6 ± 2.6
RC212 Medium lees 0.9 ± 0.2 49.5 ± 0.7
RC212 Light lees 2.6 ± 0.8 48.4 ± 0.6
P1Y2 Heavy lees 0.4 ± 0.4 67.9 ± 0.8
P1Y2 Medium lees 0.8 ± 0.8 56.4 ± 0.7
P1Y2 Light lees 2.5 ± 0.3 52.7 ± 0.7

Initial concentrations of free amino nitrogen after pressing were different between the yeast
strains with wines fermented by P1Y2 having almost 62 mg/L while RC212 fermented wines
contained 50.4 mg/L FAN (Table 2). Considering that the initial grape FAN content was 122.7
mg/L, the amount of FAN still remaining in the wine after fermentation is quite high. After 3
months of aging on the lees the concentrations of FAN had increased in all wines with the
concentration being the highest in the heavy lees treatments not matter what yeast was used
(Table 4.). This is likely due to yeast autolysis and release of amino acids into the wine. There
was very little ammonia remaining in the wine at this point. Settling the wines after pressing
reduced the amount of FAN present in the wines during aging although the concentrations
present are still > 50 mg/L. Settling for longer than 24hrs did not make a significant difference to
the amount of FAN or YAN in the yeast lees. Data from this study suggests that a 24 hr settling
time was sufficient to significantly reduce turbidity (and overall lees content) as well as decrease
the concentration of FAN present.
Amino acid content of the wines was assessed after 14, 30, 60, 180, and 270 days. While the
concentrations of all amino acids were assessed, only the concentrations of the sulfur containing
amino acids, cysteine and methionine, will be discussed in this report. Aside from an initial
decrease in methionine and cysteine concentrations after fermentation (Figures 1 and 2),
concentrations of methionine and cysteine generally increased as storage time increased.
Differences between lees levels and yeast strains were also noted. For both yeast strains,
increasing lees levels resulted in higher amounts of methionine and cysteine being present in the
wine. In addition, methionine and cysteine were higher in wines fermented by yeast strain P1Y2
than in wines fermented by RC212 at each lees level. After nine months storage wine fermented
by RC212 and aged on light lees contained the lowest levels of methionine (2.6 mg/L) and
cysteine (0.6 mg/L) while wines fermented by P1Y2 and aged on heavy lees contained the
highest amount of methionine (5.9 mg/L) and cysteine (1.3 mg/L). Sulfur containing amino acids
can be a source of volatile sulfur compounds such as methanethiol, ethanethiol,
dimethyldisulfide, and dimethyltrisulfide.

Figure 1.Concentration of methionine in Pinot noir wines fermented by S. cerevisiae strain
RC212 (closed symbols) or strain P1Y2 (open symbols) and aged on light, medium, or heavy
lees.
Figure 2.Concentration of cysteine in Pinot noir wines fermented by S. cerevisiae strain RC212
(closed symbols) or strain P1Y2 (open symbols) and aged on light, medium, or heavy lees.
0
1
2
3
4
5
6
7
8
0 50 100 150 200 250 300
Co
nce
ntr
ati
on
(m
g/L
)
Time (days)
RC212 Low lees
RC212 Medium lees
RC212 High lees
P1Y2 Low lees
P1Y2 Medium lees
P1Y2 High lees
0
0.2
0.4
0.6
0.8
1
1.2
1.4
0 50 100 150 200 250 300
Con
cen
trati
on
(m
g/L
)
Time (days)
RC212 Low lees
RC212 medium lees
RC212 High lees
P1Y2 Low lees
P1Y2 Medium lees
P1Y2 High lees

In addition to the concentration of sulfur containing amino acids, the concentration of the sulfur
containing tri-peptide, glutathione, was measured in wines aged with different levels of lees.
While glutathione can represent a large pool of sulfur containing compounds in wine post-
fermentation (Marchand and de Revel 2010), its‟ concentration in red wines and the impact of
grape nitrogen content and lees composition is relatively unknown. The concentration of
glutathione (GSH) in Pinot noir aged on heavy or light lees is shown in Figure 3. Overall, the
GSH levels were low compared to previously published work (Roland and Schneider 2015;
Marchand& de Revel 2010). After 0 days aging the GSH levels were very similar between wines
fermented by the two different yeast and at the two lees levels. However, after 30 days aging
there was a higher concentration of GSH in wines aged on the heavy lees with the highest levels
being measured in wines fermented by RC212 (Figure 3). The concentration of the oxidized
form of glutathione (GSSG) was also assessed. Glutathione is easily oxidized and so often the
oxidized form is more prevalent in wine. The results of this analysis are shown in Figure 4.
GSSG concentrations were significantly lower than corresponding GSH levels in the wines. At
day 0 of aging, wines fermented by RC212 contained higher concentrations of GSSG than wines
fermented by P1Y2. As seen with GSH levels, aging the wine on heavy lees resulted in elevated
GSSG levels. However, unlike the GSH levels GSSG levels only increased in wines fermented
by RC212 (Figure 4).
Figure 3.Concentration (mg/L) of glutatione (GSH) in Pinot noir wines fermented by S.
cerevisiae P1Y2 or RC212 aged on light or heavy lees for 0 or 30 days.
0
0.1
0.2
0.3
0.4
0.5
0.6
0.7
P1Y2 Day 0 P1Y2 Day 30 RC212 Day 0 RC212 Day 30
GS
H (
mg/L
)
GSH Heavy lees
GSH Light lees

Figure 4.Concentration (ug/L) of oxidized glutatione (GSSG) in Pinot noir wines fermented by
S. cerevisiae P1Y2 or RC212 aged on light or heavy lees for 0 or 30 days.
While yeast strain and lees levels impact the concentration of sulfur containing amino acids and
glutathione, the increase in these compounds did not alter the formation of volatile sulfur
compounds significantly during aging. H2S was present in all wines after pressing with the
highest amount in wines produced by RC212 (Table 5). Settling the wines reduced the amount of
H2S in the case of RC212 produced wines. For RC212 the highest amount of H2S measured
during the aging process was after 14 days aging on high lees (Table 5). For all other treatments
the highest concentrations of H2S were measured after 30 days aging. After 270 days aging on
the lees there was no detectable H2S in any of the wines (Table 5). While concentrations of
methanethiol (MeSH) (Table 6) and dimethyl sulfide (DMS) (Table 7) were very similar
between all the wine treatments, larger differences were noted for methyl thioacetate (MeSOAc)
(Table 8). MeSOAc concentrations were significantly higher in wines produced by RC212 than
in wines produced by P1Y2 (Table 8). These differences were present at every time point
independent of the lees level. This trend was also apparent for methionol (Table 9) where except
for samples measured after 60 days aging the wines fermented by RC212 contained significantly
higher methionol than wines produced by P1Y2. Again, very little differences were noted
between methionol concentrations at the three different lees levels (Table 9). Based on this data
it is likely that other factorsbesidesjust the presence of sulfur containing amino acids drive the
formation of volatile sulfur compounds in wine during aging. In support, 2013 wine samples
collected from wineries contained predominately H2S when sampled early during barrel aging
rather than more complex sulfur compounds typically derived from methionine and cysteine
(Table 10).
Based on results from the first years studies the focus of the project shifted towards H2S
production during alcoholic fermentation with an emphasis on late formation of H2S that may
0
10
20
30
40
50
60
70
P1Y2 Day 0 P1Y2 Day 30 RC212 Day 0 RC212 Day 30
GS
SG
(u
g/L
)GSSG Heavy lees
GSSG Light lees

lead to high H2S in wines going to barrel. Initial experiments explored the role of nitrogen
concentration and composition on formation of volatile sulfur compounds using a synthetic grape
juice. Synthetic grape juices with varying YAN concentrations and compositions were inoculated
with either a high (UCD522) or low (P1Y2) H2S producing yeast strain. Fermentations
proceeded well with yeast populations reaching at least 1 x 10⁸cfu/mL (Figure 5). During the
course of the fermentation H2S production was measured using H2S detection tubes. Total H2S
produced during fermentation is shown in Figure 6. No H2S was produced by yeast strain P1Y2
during fermentation in any of the treatments and so Figure 6 illustrates production by yeast strain
UCD522. The highest production of H2S occurred in fermentations of synthetic juice containing
high amino acids (346 mg/LYAN) or high DAP (350 mg/L YAN). Fermentation of the low YAN
juice (low amino acids) resulted in a lower amount of total H2S being produced. The timing of
H2S production was also followed. While the majority of the H2S was produced during early to
mid-fermentation, some late production of H2S was observed. The highest amount of late H2S
formation occurred in fermentations of high DAP juice (Figure 6). This is important because
while H2S produced early in fermentation is typically „blown off‟ by CO2, late formation of H2S
when CO2 production is minimal may result in higher levels of H2S in the wine post-
fermentation. However, when the wines were assessed for volatile sulfur compounds post-
fermentation there was very little H2S present in the wines. This lack of correlation between H2S
produced during fermentation and H2S in the wines post-fermentation has been reported by
others (Ugliano et al. 2009) and is usually attributed to the low solubility and high volatility of
H2S. In contrast, the concentrations of other volatile sulfur compounds did correlate to H2S
production during fermentation. For example, wines produced from the high DAP juice where

Table 5. Concentration of H2S (ug/L) in Pinot noir wine fermented by S. cerevisiae strain RC212 or strain P1Y2 during aging at
13C on heavy, medium, or low lees
Treatment 0 days1
14 days 30 days 60 days 90 days 180 days 270 days
RC212 Low 2.66
2.15±0.32ab*
5.63±0.37ab
2.68±0.44a
2.24±0.68a
1.20±0.18a
ND
Medium 2.33
3.64±0.68b
4.23±0.10b
2.91±0.41a
2.45±0.45a
0.95±0.11a
ND
High 7.06
7.46±0.95c
4.92±0.89ab
1.87±0.25a
1.51±0.14a
1.35±0.64a
ND
P1Y2 Low 1.94
1.88±0.21a
6.83±1.14a
3.75±0.53a
2.98±0.54a
1.31±0.22a
ND
Medium 2.47
2.38±0.20b
3.52±0.72b
2.17±0.33a
2.01±0.19a
1.47±0.24a
ND
High 2.61
2.74±0.12b
4.89±0.23ab
2.15±0.27a
1.78±0.23a
1.30±0.07a
ND
*Values represent the means of three replicate ferments. Mean values with different superscript letters within a column were
significantly different at p≤0.05 1Values from day 0 represent a single sample from a pooled tank of wine for each treatment
ND = not detectable
Table 6. Concentration of MeSH (ug/L) in Pinot noir wine fermented by S. cerevisiae strain RC212 or strain P1Y2 during aging at
13C on heavy, medium, or low lees
Treatment 0 days1
14 days 30 days 60 days 90 days 180 days 270 days
RC212 Low 1.49
1.63±0.05ab*
1.54±0.06a
1.45±0.12a
1.93±0.14ab
1.69±0.18a
1.40±0.16a
Medium 1.10
1.62±0.04ab
1.56±0.10a
1.19±0.20a
1.32±0.22ab
0.55±0.06a
ND
High 1.42
1.70±0.01ab
1.55±0.14a
1.64±0.13a
1.44±0.20ab
0.75±0.11a
0.72±0.10a
P1Y2 Low 1.00
1.38±0.19a
1.33±0.22a
2.45±0.45a
2.04±0.33ab
1.78±0.11a
1.15±0.15a
Medium 1.00
1.33±0.13a
1.28±0.10a
1.68±0.30a
2.15±0.18a
1.84±0.05a
1.81±0.22a
High 0.84
1.89±0.26b
1.39±0.08a
1.08±0.08a
1.22±0.13b
0.85±0.12a
0.67±0.14a
*Values represent the means of three replicate ferments. Mean values with different superscript letters within a column were
significantly different at p≤0.05 1Values from day 0 represent a single sample from a pooled tank of wine for each treatment
ND = not detectable

Table 7. Concentration of DMS (ug/L) in Pinot noir wine fermented by S. cerevisiae strain RC212 or strain P1Y2 during aging at
13C on heavy, medium, or low lees
Treatment 0 days1
14 days 30 days 60 days 90 days 180 days 270 days
RC212 Low 1.89
2.07±0.10a*
1.79±0.08a
3.17±0.37a
3.20±0.28a
2.66±0.12a
5.53±0.22b
Medium 1.88
2.01±0.13a
1.79±0.13a
2.95±0.59a
2.96±0.37a
2.49±0.20a
5.70±0.53ab
High 1.82
2.70±0.14b
2.71±0.18b
4.62±0.12bc
4.51±0.18b
3.77±0.24b
7.10±0.86a
P1Y2 Low 1.59
1.94±0.22a
1.91±0.16a
3.75±0.34ab
3.25±0.11a
2.76±0.07a
5.98±0.24a
Medium 1.10
2.02±0.15a
1.81±0.14a
3.69±0.22ab
3.26±0.19a
2.94±0.25a
6.03±0.56a
High 1.97
2.95±0.08b
2.60±0.05b
4.77±0.10c
4.65±0.21b
3.69±0.02b
6.95±0.36a
*Values represent the means of three replicate ferments. Mean values with different superscript letters within a column were
significantly different at p≤0.05 1Values from day 0 represent a single sample from a pooled tank of wine for each treatment
Table 8. Concentration of MeSOAc (ug/L) in Pinot noir wine fermented by S. cerevisiae strain RC212 or strain P1Y2 during aging
at 13C on heavy, medium, or low lees
Treatment 0 days1
14 days 30 days 60 days 90 days 180 days 270 days
RC212 Low 3.61
4.09±0.10b*
3.23±0.07bc
4.12±0.17bc
4.06±0.17b
3.66±0.03c
3.24±0.07bc
Medium 3.35
3.75±0.66b
3.36±0.13c
4.69±0.07c
3.97±0.07b
3.66±0.09c
3.61±0.15c
High 3.25
4.54±0.09b
3.10±0.08b
3.73±0.11b
3.48±0.11b
2.98±0.06b
2.37±0.07b
P1Y2 Low ND
0.67±0.01a
0.58±0.03a
0.66±0.04a
0.94±0.10a
0.66±0.05a
0.35±0.03a
Medium ND
0.44±0.15a
0.58±0.09a
0.55±0.09a
0.52±0.05a
0.74±0.07a
0.33±0.02a
High 0.40
0.83±0.05a
0.56±0.04a
0.56±0.10a
0.49±0.08a
0.64±0.08a
0.35±0.03a
*Values represent the means of three replicate ferments. Mean values with different superscript letters within a column were
significantly different at p≤0.05 1Values from day 0 represent a single sample from a pooled tank of wine for each treatment
ND = not detectable

Table 9. Concentration of Methionol (mg/L) in Pinot noir wine fermented by S. cerevisiae strain RC212 or strain P1Y2 during
aging at 13C on heavy, medium, or low lees
Treatment 0 days1
14 days 30 days 60 days 90 days 180 days 270 days
RC212 Low 3.30
3.06±0.21b*
2.84±0.26d
2.80±0.08c
2.69±0.04b
2.26±0.16b
2.26±0.20b
Medium 3.11
2.93±0.12b
2.80±0.12cd
2.79±0.10c
2.76±0.09b
2.35±0.14b
2.06±0.07b
High 3.58
2.99±0.07b
2.93±0.14d
2.91±0.14bc
2.87±0.11b
2.37±0.04b
2.11±0.08b
P1Y2 Low 1.74
1.94±0.16a
1.64±0.05ab
1.59±0.11ab
1.49±0.08a
1.36±0.00a
1.34±0.01a
Medium 1.85
1.67±0.05a
1.76±0.19ac
1.58±0.07a
1.45±0.05a
1.31±0.08a
1.35±0.00a
High 2.54
1.73±0.04a
1.71±0.29b
1.65±0.12a
1.56±0.05a
1.31±0.07a
1.32±0.09a
*Values represent the means of three replicate ferments. Mean values with different superscript letters within a column were
significantly different at p≤0.05 1Values from day 0 represent a single sample from a pooled tank of wine for each treatment
Table 10.Concentration of volatile sulfur compounds (g/L) in Pinot noir wine barrel samples from commercial wineries in the
Willamette Valley. Winery
Code H2S MeSH CS2 DMS DES MeSOAc DMDS EtSOAc DEDS DMTS Methionol
117 27.03 2.62 0.04 2.49 N.D. 13.82 0.05 0.82 N.D. 0.04 7.66
643 24.14 1.94 0.04 1.45 N.D. 12.30 0.04 0.55 N.D. 0.08 4.19
463 23.24 2.49 0.27 2.49 N.D. 10.43 0.09 0.49 N.D. 0.14 4.53
629 18.61 2.30 0.04 2.07 N.D. 8.85 0.04 0.58 N.D. 0.10 3.33
439 26.83 1.90 0.04 2.34 N.D. 17.39 0.00 0.93 N.D. 0.06 4.05
751 9.45 1.91 0.22 4.17 N.D. 8.84 0.03 0.43 N.D. 0.04 3.25
108 57.43 3.26 0.28 3.94 N.D. 15.80 0.05 1.29 N.D. 0.11 3.55
336 96.22 4.03 0.31 4.21 N.D. 20.29 0.18 1.17 N.D. 0.27 4.08
117 8.55 3.49 0.19 3.58 N.D. 16.92 0.37 1.18 N.D. 1.14 1.65 N.D = non-detectable

Figure 5. Growth of S.cerevisiae strain P1Y2 (open symbols) or UCD522 (closed symbols) in
synthetic grape juice containing different concentrations of amino acids and/or diammonium
phosphate (DAP).
Figure 6.Total H2S production by S. cerevisiae strain UCD522 during fermentation of synthetic
grape juice containing different concentrations of amino acids and/or diammonium phosphate
(DAP).
1.E+02
1.E+03
1.E+04
1.E+05
1.E+06
1.E+07
1.E+08
1.E+09
0 5 10 15 20 25 30 35
Via
ble
cel
ls (
CF
U/m
L)
Time (days)
P1Y2 Low amino acidsP1Y2 High DAPP1Y2 High amino acidsUCD522 Low amino acidsUCD522 High DAPUCD522 High amino acids
468.1428.0
329.3
28.451.4
24.0
0
100
200
300
400
500
600
High amino acids High DAP Low amino acids
H2S
(u
g/L
)
< 3 Brix23 to 3 Brix
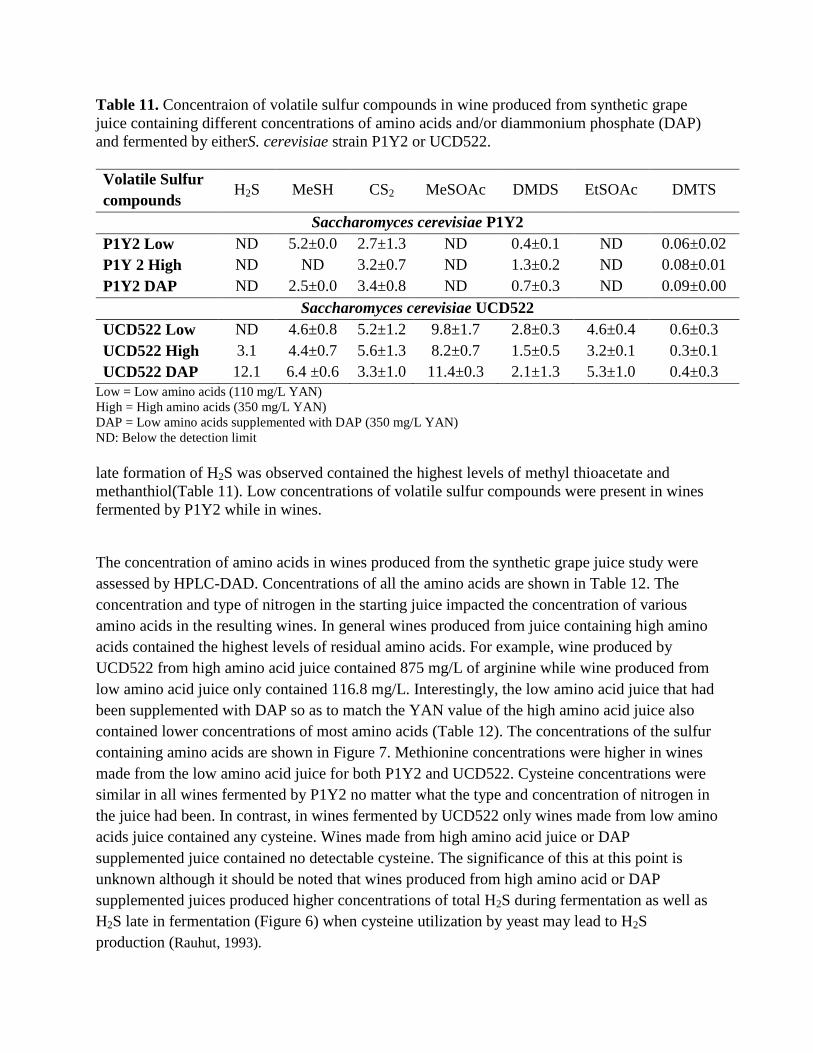
Table 11. Concentraion of volatile sulfur compounds in wine produced from synthetic grape
juice containing different concentrations of amino acids and/or diammonium phosphate (DAP)
and fermented by eitherS. cerevisiae strain P1Y2 or UCD522.
Volatile Sulfur
compounds H2S MeSH CS2 MeSOAc DMDS EtSOAc DMTS
Saccharomyces cerevisiae P1Y2
P1Y2 Low ND 5.2±0.0 2.7±1.3 ND 0.4±0.1 ND 0.06±0.02
P1Y 2 High ND ND 3.2±0.7 ND 1.3±0.2 ND 0.08±0.01
P1Y2 DAP ND 2.5±0.0 3.4±0.8 ND 0.7±0.3 ND 0.09±0.00
Saccharomyces cerevisiae UCD522
UCD522 Low ND 4.6±0.8 5.2±1.2 9.8±1.7 2.8±0.3 4.6±0.4 0.6±0.3
UCD522 High 3.1 4.4±0.7 5.6±1.3 8.2±0.7 1.5±0.5 3.2±0.1 0.3±0.1
UCD522 DAP 12.1 6.4 ±0.6 3.3±1.0 11.4±0.3 2.1±1.3 5.3±1.0 0.4±0.3
Low = Low amino acids (110 mg/L YAN)
High = High amino acids (350 mg/L YAN)
DAP = Low amino acids supplemented with DAP (350 mg/L YAN)
ND: Below the detection limit
late formation of H2S was observed contained the highest levels of methyl thioacetate and
methanthiol(Table 11). Low concentrations of volatile sulfur compounds were present in wines
fermented by P1Y2 while in wines.
The concentration of amino acids in wines produced from the synthetic grape juice study were
assessed by HPLC-DAD. Concentrations of all the amino acids are shown in Table 12. The
concentration and type of nitrogen in the starting juice impacted the concentration of various
amino acids in the resulting wines. In general wines produced from juice containing high amino
acids contained the highest levels of residual amino acids. For example, wine produced by
UCD522 from high amino acid juice contained 875 mg/L of arginine while wine produced from
low amino acid juice only contained 116.8 mg/L. Interestingly, the low amino acid juice that had
been supplemented with DAP so as to match the YAN value of the high amino acid juice also
contained lower concentrations of most amino acids (Table 12). The concentrations of the sulfur
containing amino acids are shown in Figure 7. Methionine concentrations were higher in wines
made from the low amino acid juice for both P1Y2 and UCD522. Cysteine concentrations were
similar in all wines fermented by P1Y2 no matter what the type and concentration of nitrogen in
the juice had been. In contrast, in wines fermented by UCD522 only wines made from low amino
acids juice contained any cysteine. Wines made from high amino acid juice or DAP
supplemented juice contained no detectable cysteine. The significance of this at this point is
unknown although it should be noted that wines produced from high amino acid or DAP
supplemented juices produced higher concentrations of total H2S during fermentation as well as
H2S late in fermentation (Figure 6) when cysteine utilization by yeast may lead to H2S
production (Rauhut, 1993).

Table 12.Concentrations (mg/L) of amino acids in wine made from synthetic grape juice
containing low amino acids, high amino acids, or low amino acids and diammonium phosphate
(DAP). Ferments were conducted by S. cerevisiae strain P1Y2 or strain UCD522.
P1Y2 Low aa P1Y2 DAP P1Y2 High aa UCD522 Low aa UCD522 DAP UCD522 High aa
ASP 6.62 9.44 54.29 8.36 8.77 54.12
GLU 12.19 55.26 342.47 34.08 53.90 339.54
ASN 2.64 18.67 15.78 5.05 45.23 19.01
SER 7.69 13.35 39.87 9.16 12.25 40.41
GLN 3.26 9.93 43.88 7.60 23.96 52.53
CIT 4.98 6.11 31.33 17.92 4.93 40.68
HIS 18.73 28.09 30.79 20.59 41.67 34.52
GLY 3.10 3.00 14.02 3.75 3.36 15.82
THR 5.62 5.48 18.01 8.83 7.88 22.48
ARG 119.27 315.94 588.97 116.79 488.71 875.70
ALA 37.46 69.68 130.61 30.37 62.26 124.19
TYR 5.55 5.14 10.53 5.67 3.93 11.34
CY 0.97 1.12 0.85 1.40 0.00 0.00
VAL 14.89 15.88 49.20 27.97 25.53 66.30
MET 4.46 4.39 3.44 3.81 2.43 1.78
TRP 12.31 18.42 19.12 24.79 55.54 21.88
PHE 7.01 6.14 19.94 6.67 15.21 27.64
ILE 12.01 3.61 6.20 22.96 4.28 13.10
LEU 9.20 10.85 17.32 9.45 3.20 25.51
LYS 9.46 6.52 8.56 6.41 10.91 3.39
Glutatione and oxidized glutathione concentrations were also assessed in the synthetic wines
produced by different yeast from synthetic juice containing different nitrogen concentrations and
composition. The results are shown in Figures 8 and 9. Interestingly there was higher GSH in the
synthetic wines than previously measured in the Pinot noir wines (Figure3). Considering that a
portion of the GSH in the Pinot noir wines would have been derived from GSH in the grapes
while the GSH in the synthetic wines is exclusively derived from the yeast this was surprising.
Unlike in the Pinot noir wines, yeast strain had an impact on GSH concentration as wines
fermented with UCD522 had higher GSH concentrations than wines fermented by P1Y2. The
concentration and type of nitrogen had less of an impact on GSG (Figure 8) then it did on GSSG
levels (Figure 9).
In addition to nitrogen content, elemental sulfur was also investigated as a cause of the formation
of volatile sulfur compounds post-fermentation. An addition of elemental sulfur was made to
Pinot noir grapes which were then fermented by either a high (UCD522) or low (P1Y2) H2S
producing yeast strain. The amount of elemental sulfur added (either 5 or 15 g/g) was based on
a recent publication (Kwasniewski et al. 2014) that reported levels of residual sulfur on grapes in
the Finger Lakes area (NY) ranged from 0 – 40 g /g depending on harvest year and date of last
spray application. These are significantly higher residual elemental sulfur levels than those
previously reported by studies conducted in California (Thomas et al. 1993a). However, given
the climate and vineyard disease pressures in the Finger Lakes area, the higher residual elemental
sulfur levels may better reflect potential levels on Oregon grapes.

Figure 7.Concentration of cysteine and methionine in wine made from synthetic grape juice
containing low amino acids, high amino acids, or low amino acids and diammonium phosphate
(DAP). Ferments were conducted by S. cerevisiae strain P1Y2 or strain UCD522.
All fermentations were complete in less than seven days. Fermentations conducted by UCD522
that contained the highest concentration of elemental S0 took the longest time to complete
(Figure 10). H2S production peaked during the first 48-72 hrs of fermentation with the highest
rate of production occurring in fermentations containing 15g/g S0conducted by UCD522
(Figure 11). As expected, UCD522 produced H2S at a higher rate during fermentation than the
no-H2S producing strain P1Y2. However, H2S was still produced in fermentations conducted by
P1Y2 when S0 was added to the fermentations. Total H2S produced during the fermentations is
shown in Figure 12. No H2S was measured in fermentations conducted by P1Y2 when no S0 was
added and only a low level was measured (<35 g/L) when 5 g/g S0 was added. However,
when 15g/g S0
was added a higher amount of H2S was produced in ferments conducted by
P1Y2 (620 g/L). The highest total H2S production occurred in UCD522 fermentations where 15
g/g S0 had been added (2700 g/L)
While the majority of H2S was produced during early and mid-fermentation (Figure 11), a
significant amount of H2S was produced near the end of the fermentations containing high S0. As
noted previously, late production of H2S is more problematic for wine quality as this H2S is less
likely to be „blown off‟ by CO2 and so may be retained in the wine post-fermentation. Increased
0
1
2
3
4
5
6
7
P1Y2 Low aa P1Y2 DAP P1Y2 High aa UCD522 Low aa UCD522 DAP UCD522 High aa
mg/L
Cys
Met

Figure 8.Concentration (mg/L) of glutathione (GSH) in wine made from synthetic grape juice
containing low amino acids, high amino acids, or low amino acids and diammonium phosphate
(DAP). Ferments were conducted by S. cerevisiae strain P1Y2 or strain UCD522.
Figure 9.Concentration (ug/L) of oxidized glutathione (GSSG) in wine made from synthetic
grape juice containing low amino acids, high amino acids, or low amino acids and diammonium
phosphate (DAP). Ferments were conducted by S. cerevisiae strain P1Y2 or strain UCD522.
0
0.5
1
1.5
2
2.5
3
P1Y2 low aa P1Y2 DAP P1Y2 High aa UCD Low aa UCD DAP UCD High aa
GS
H (
mg
/L)
0
1
2
3
4
5
6
7
8
9
10
P1Y2 low aa P1Y2 DAP P1Y2 High aa UCD Low aa UCD DAP UCD High aa
GS
SG
(u
g/L
)

Figure 10. Change in Brix during fermentation by S. cerevisiae strain UCD522 or strain P1Y2 of
Pinot noir grapes containing 0, 5, or 15 g/g elemental sulfur.
Figure 11. Production per hour of H2S by S. cerevisiae strain UCD522 (closed symbols) or
strain P1Y2 (open symbols) during fermentation of Pinot noir grapes with the addition of 0, 5, or
15 g/g elemental sulfur.
0
5
10
15
20
25
0 24 48 72 96 120 144 168 192
Bri
x
Time (hrs)
UCD522 0 ug/g SUCD522 5 ug/g SUCD522 15 ug/gP1Y2 0 ug/g SP1Y2 5 ug/g SP1Y2 15 ug/g S
0
10
20
30
40
50
60
0 24 48 72 96 120 144 168 192 216
H2S
pro
du
ced
(u
g/h
r)
Time (hrs)
P1Y2 - 0 ug/g S
P1Y2 - 5 ug/g S
P1Y2 - 15 ug/g S
UCD522 - 0 ug/g S
UCD522 - 5 ug/g S
UCD522 - 15 ug/g S

Figure 12. Total H2S produced by S. cerevisiae strain UCD522 or strain P1Y2 during
fermentation of Pinot noir grapes with the addition of 0, 5, or 15 ug/g elemental sulfur.
formation of H2S late in fermentation has previously not thought to be related to S0 content and
was thought to be due most likely to breakdown of S-containing amino acids or release of H2S
from yeast as they die and breakdown (Rauhut 1993). The results from this study demonstrate
that S0 may contribute to formation of H2Slate in fermentation which could contribute to
reduction issues post-fermentation.
A number of volatile sulfur compounds were assesed in the Pinot noir wines. Of these
compounds only two, carbon disulfide (CS2) and methyl thioacetate (MeSOAc) were present in
detectable amounts (Table 13). As was seen with the synthetic grape fermentations, H2S
formation during fermentation did not correlate with H2S concentration in the wines post-
fermentation. The exact reason for this is unknown but as previously noted this lack of
correlation has been reported by others (Ugliano et al. 2009) and is usually attributed to the low
solubility and high volatility of H2S. In addition, because of the high reactivity of H2S in wine
the time between pressing the wines and sampling could have resulted in loss of H2S. While H2S
produced during fermentation did not correlate with H2S in the wines post-fermentation, it did
correlate with the presence of MeSOAc. Wines where the highest H2S was produced during
fermentation contained higher amounts of MeSOAc. In addition, S0 also impacted the
concentration of MeSOAc as higher MeSOAc concentrations were present in wines produced
483.1
2,574.7
136.8
221.8
0
500
1000
1500
2000
2500
3000
P1Y
2 0
ug/g
S
P1Y
2 5
ug/g
S
P1Y
2 1
5
ug/g
S
UC
D522
0 u
g/g
S
UC
D522
5 u
g/g
S
UC
D522
15 u
g/g
S
H2S
(u
g/L
)
<1 °Brix
>1 °Brix

from grapes where high S0 additions were made (Table 13). This may be related to the higher
amount of H2S formed late in fermentations where high S0 had been added. The mechanism by
which some of these volatile sulfur compounds are produced and the factors that drive their
formation are still not well understood. However, our data suggest elemental sulfur may
contribute to their formation either directly or indirectly by causing an increased formation of
H2S late in fermentation.
Table 13. Concentraion of volatile sulfur compounds (g/L) in Pinot noir wines produced from
grapes containing 0, 5, or 15 g/g elemental sulfur (S0) and fermented by eitherS. cerevisiae
strain P1Y2 or UCD522. Wines were assessed fourteen days post-pressing.
Sulfur compounds CS2 MeSOAc
Saccharomyces cerevisiae P1Y2
P1Y2 0 g/g S0
0.04±0.01 ND
P1Y 2 5 g/g S0 0.08±0.01 2.3±0.2
P1Y2 15 g/g S0 0.11±0.01 11.9±0.9
Saccharomyces cerevisiae UCD522
UCD522 0 g/g S0 0.09±0.00 ND
UCD522 5 g/g S0 0.06±0.00 2.1±1.0
UCD522 15 g/g S0 0.08±0.02 8.0±1.2
ND: Below detection limit
The amino acid content of the Pinot noir wines fermented with different levels of S0 was
measured after pressing and after 30 days aging on the lees at 13C. Wines fermented by P1Y2
with 0 ug/g S0 contained the highest methionine concentrations (Figure 14) followed by wines
fermented by UCD522 that also contained no elemental sulfur (Figure 14). Cysteine
concentrations were similar for wines produced with varying S0 although concentrations were
higher in wines fermented by P1Y2 (Figure 14). While cysteine levels increased very little after
30 days aging, methionine levels increased (Figure 14).
In year three of the study interactions between nitrogen content, composition, and
S0concentration on H2S production was investigated using Pinot noir fermentations. While all
fermentations completed to sugar dryness (< 0.5 g/L) fermentations where no additions were
made to the grapes took the longest to complete (Figure 15A). This was likely due to the
relatively low YAN content of the Pinot noir grape must (110 mg/L). The treatment that
completed fermentation the fastest was that where amino acids were added to boost the YAN to
approx. 250 mg/L. This was followed by the treatment where DAP was added to also reach 250
mg/L YAN (Figure 15A). The addition of nitrogen and/or S0
also impacted the production of H2S
during the fermentation. For all treatments H2S production peaked during days 2-3 of the
fermentation (Figure 15B). By the end of the fermentation H2S production was only detectable in
the treatments where DAP and S0
had been added to the grapes. Total H2S production during the
fermentation was also impacted by the amount and type of nitrogen present as well as elemental

Figure 14.Concentration of cysteine and methionine in Pinot noir wine fermented by S.
cerevisiae strain P1Y2 or strain UCD522 with the addition of 0, 5, or 15 ug/g elemental sulfur.
Wines were assessed after pressing and after 30 days storage at 13C.
sulfur (Figure 16). In wines fermented by UCD 522 the lowest amount of H2S produced was in
fermentations where amino acid had been added while the highest amount measured was in
fermentations where DAP and S0
had been added. Interestingly, the amount of H2S produced in
ferments containing S0
increased if DAP was also added while it decreased if amino acids were
added instead. Furthermore, adding only DAP to the grape must increased the amount of H2S
produced compared to the control ferment where no additions were made and where the starting
YAN was relatively low. These results are supported by the recent findings of Uglanio et al
(2009) where addition of DAP to a final YAN of 250 or 400 mg/L resulted in increased
formation of H2S compared to a non-supplemented fermentation with 100 mg/L YAN. While
Uglanio et al (2009) only used DAP as a nitrogen supplement, the current study also compared
the impact of adding amino acids on H2S production. Our results suggest that it was not
necessarily the increase in YAN that led to the higher amount of H2S but rather the type of
nitrogen added. For example, the addition of amino acids to the same YAN as the DAP
supplementation resulted in lower H2S production. This has implications for nitrogen
supplementation of grape musts as both the type of nitrogen as well as the quantity must be
considered if H2S production is to be minimized.
0
2
4
6
8
10
12
CYS MET CYS 30 days MET 30 days
mg/L
P1Y2 0 ug/g S
P1Y2 5 ug/g S
P1Y2 15 ug/g S
UCD522 0 ug/g S
UCD522 5 ug/g S
UCD522 15 ug/g S

Figure 15. Change in Brix (A) and H2S production per hour (B) during fermentation of Pinot
noir grapes by S. cerevisiae UCD 522 with the addition of 10 ug/g elemental sulfur (S),
diammonium phosphate (DAP) and/or amino acids (AA).
.
0
5
10
15
20
25B
rix
Control10 ug/g SDAPDAP + 10 ug/g SAmino acidsAmino acids + 10 ug/g S
A
0
10
20
30
40
50
60
0 24 48 72 96 120 144 168
H2S
(u
g/L
/hr)
Time (hrs)
B

Figure 16.Total production of H2S during fermentation of Pinot noir grapes by either S.
cerevisiae P1Y2 or UCD 522 with the addition of 10 ug/g elemental sulfur (S), diammonium
phosphate (DAP) and/or amino acids (AA).
While it was not surprising that the addition of S0 at 10 ug/g resulted in elevated H2S production,
the large increase in H2S production if DAP was also added was unexpected and this interaction
has not been reported previously. The addition of DAP appears to only impact yeast produced
H2S as the same trend was not observed for the non-H2S producing yeast P1Y2 where any H2S
produced was due to the non-enzymatic reduction of elemental sulfur. In this case the addition of
DAP to grape must containing elemental sulfur did not result in higher H2S production compared
to fermentations containing only elemental sulfur (Figure 16).
Pinot noir wines were also assessed for a number of other volatile sulfur compounds by GC-MS
(Table 14). All wines contained VSCs aside from H2S with methanethiol(MeSH), carbon
disulfide (CS2), and methyl thioacetate (MeSOAc) being present in all wines no matter the
treatment. Wines fermented by UCD522 had higher MeSHcontent than P1Y2 fermented wines
with concentrations above the reported sensory threshold for this cooked cabbage and rotten egg
smelling compound (Rauhut 1993). While yeast strain was the dominant factor determining the
concentration of VSCs, S0
and YAN also played a role. For MeSH, the addition of S0
did
notimpact its concentration but increasing YAN, either through addition of DAP or amino acids,
0
500
1000
1500
2000
2500
P1Y2 + S P1Y2 +
DAP + S
UCD UCD + S UC + DAP UC + DAP
+ S
UC + AA UC + AA +
S
Tota
l H
2S
(u
g/L
)

Table 14. Concentration (g/L) of volatile sulfur compounds in Pinot noir wines fermented by
either S. cerevisiae P1Y2 or UCD 522 with the addition of 10 ug/g elemental sulfur (S),
diammonium phosphate (DAP) and/or amino acids (AA). H2S MeSH CS2 DMS DES MeSOAc DMDS EtSOAc DEDS DMTS
P1Y2 +
S 3.72 0.00 0.13 N.D N.D 1.75 N.D N.D N.D N.D
P1Y2 +
DAP +
S 7.41 0.40 0.22 N.D N.D 4.73 N.D N.D N.D N.D
UCD N.D 0.83 0.16 N.D N.D 2.88 N.D N.D N.D N.D
UCD +
S 1.25 0.53 0.24 N.D N.D 6.83 N.D N.D N.D N.D
UCD +
DAP 0.00 1.54 0.16 N.D N.D 11.76 N.D N.D N.D N.D
UCD +
DAP +
S 2.60 1.75 0.15 N.D N.D 16.08 N.D 0.71 N.D N.D
UCD +
AA 8.55 1.97 0.17 N.D N.D 15.09 N.D 0.35 N.D N.D
UCD +
AA + S 5.70 1.66 0.26 N.D N.D 16.50 N.D 0.93 N.D N.D
resulted in higher MeSH concentrations in the wine (Figure 17A). MeSH is thought to be
produced via sulfur-containing amino acids (Rauhut 1993) so an increase in YAN during
fermentation may have led to increased formation of these amino acids and subsequent formation
of MeSH.
The addition of S0
and/or YAN (DAP or amino acids) impacted the concentration of MeSOAc in
the wines (Figure 17B). In wines fermented by the no-H2S producing yeast strain P1Y2 the
addition of DAP resulted in higher MeSOAc concentrations (Figure 17B). This trend was seen
more dramatically in wines fermented by UCD522 where the addition of just DAP increased
MeSOAc concentrations from 2.88 ug/L to 11.76 ug/L while the addition of amino acids resulted
in 15.09 ug/L MeSOAc. The addition of S0
resulted in an increase in MeSOAc when DAP has
also added but not when amino acids were added (Figure 17B). MeSOAc is thought to be
produced via the reaction of methanethiol with acetyl-CoA and elevated formation of MeSOAc
has been correlated with the production of high levels of H2S by some yeast strains (Rauhut
1993). In the present study, high concentrations of MeSOAc in the wines did not necessarily
correlate with high H2S production during the fermentation. For example, while very similar
amounts of MeSOAc were measured in wines fermented by UCD522 with the addition of either
DAP or amino acids, very different amounts of H2S were produced during fermentation (>2000
ug/L for DAP vs. <1000 ug/L for amino acids) (Figure 16). In general, the increase in YAN
rather than the type of nitrogen was more predictive of whether wines would contain high
concentrations of MeSOAc. This is in contrast to H2S production where the type of nitrogen
rather than YAN concentration had the largest impact (Figure 16). While the concentrations of

Figure 17.Concentration of methanethiol (A) and methyl thioacetate (B) in Pinot noir wines
fermented by either S. cerevisiae P1Y2 or UCD 522 with the addition of 10 ug/g elemental sulfur
(S), diammonium phosphate (DAP) and/or amino acids (AA).
0.00
0.50
1.00
1.50
2.00
2.50
A
0.00
5.00
10.00
15.00
20.00
25.00
P1Y2 + SP1Y2 + DAP + SUCD UCD + S UCD + DAPUCD + DAP + SUCD + AA UCD + AA + S
B
Con
cen
trati
on
(u
g/L
)

MeSOAc in the wines was below the reported sensory threshold (> 20 ug/L) (Rauhut 1993), this
compound can hydrolyse during aging back to MeSH which has a much lower sensory threshold
(1.0–2.0 ug/L). Furthermore, MeSOAc cannot be removed by copper fining making it an
important pre-cursor for sulfur off-odors in wine during aging.
The presence of a “bound” or “releasable” form of H2S was assessed using Pinot noir wines
produced from grapes containing different levels of S0
and fermented by either a high or low H2S
producing yeast. All wines contained H2S that was only detectable after treatment with a strong
reducing agent (releasable H2S). The amount of releasable H2S differed between treatments
(Figure 18). Wines produced from grapes where 15 ug/g S0had been added containing the
highest concentration (Figure 18) regardless of what yeast conducted the alcoholic fermentation.
The amount of releasable H2S did not necessarily correlate to the total amount of H2S produced
during fermentation. For example, wines fermented by UCD522 or P1Y2 where 15 ug/g S0
had
been added contained the same amount of releasable H2S despite the fact that UCD522 produced
over four times the amount of H2S during the fermentation (Figure 12). Instead, the amount of
releasable H2S in the wines was more linked to late production of H2S during fermentation and
the concentration of methyl thioacetate (MeSOAc) in the wines. For example, wines produced
from grapes containing 15 ug/gS0
had very similar amounts of MeSOAc whether fermented by
UCD 522 or P1Y2 (8.0 and 11.9 ug/L respectively) despite large difference in the total amount
of H2S produced during fermentation. These results indicate that late formation of H2S during
fermentation and the concentration of MeSOAc play a larger role in the concentration of
releasable H2S in the wines then the total amount of H2S produced during fermentation.
Because of the role that elemental sulfur could play in the formation of volatile sulfur, grapes
were collected at harvest in 2014 and 2015 and assessed for elemental sulfur content. The goal is
to assess grape samples over a number of seasons so as to begin to determine exactly how much
elemental sulfur may be on grapes when they enter the winery to be fermented. Because residual
S0 will be impacted greatly by season and vineyard spray regimes (Kwasniewski et al. 2014) a
large number of samples over a number of seasons will need to be assessed before any trends or
conclusions can be observed or made. Low levels of elemental sulfur were measured on most
grape samples in 2014 and 2015 (Table 15). The majority of samples contained little to no
elemental sulfur with only two samples containing over 1g/g of elemental sulfur. The
concentration of elemental sulfur on grapes that may cause H2S issues has not been agreed upon
by researchers. This is due mainly to the many variables aside from elemental S that can impact
H2S formation. Recently proposed values are < 1 g/g for reds and < 3 g/g for whites
(Kwasniewski et al. 2014) but this will be highly dependent on other variables such as yeast
strain, grape nutrient content, and fermentation conditions.
Methods to reduce the amount of residual S0
on red grapes prior to fermentation were
investigated. At harvest, Pinot noir grapes where either wettable or microthiol sulfur had been
applied contained 2.6 or 2.8ug/g elemental sulfur (Figure 19). The amount of residual S0
on the
grapes was surprisingly low given that 5 lbs/acre of S0
was applied only six days prior to harvest.
This may be due to the period of hot weather that occurred during and after the S0
had been
applied as temperature is known to impact the persistence of sulfur on grapes (Bettiga et al
2013). Destemmed grapes were cold soaked for seven days at 8C before the juice was drained
from the bottom of the tank. The concentration of S0 in the juice was higher than that on the

original grapes (Figure 19) indicating that a portion of the S0
originally on the grape skins was
now present in the juice. Decreased levels of S0
were measured on the remaining grapes (Figure
19). Grapes treated with wettable or microthiol sulfur originally contained 2.6 or 2.8 ug/g S0
respectively while after the cold soak/saignee treatment grapes contained only 0.8 or 1.0 ug/g. A
large reduction in the amount of S0
in the juice was also achieved by setting the juice for 24 hrs
at 4C and then racking off the lees (Figure 19). From a practical point of view this would allow
a winemaker to drain juice from a tank, cold settle, rack, and then return the juice to the original
grapes. This would minimize any loss of volume as in the current experiment the juice removed
represented approximately 20% of the total weight of grapes. Alternatively, the settled juice
could be utilized to produce a Rose while the original grapes could be fermented separately. In
both cases the amount of S0
present on the grapes could be reduced.
Figure 18. Releasable H2S in Pinot noir wine produced from Pinot noir grapes where an addition
of 0, 5, or 15 ug/g elemental sulfur (S)had been made. Fermentations were conducted by either S.
cerevisiae UCD 522 or S. cerevisiae P1Y2. Columns with different letters are significantly
different at p≤0.05.
0
10
20
30
40
50
60
UCD 15 ug/g S P1Y2 15 ug/g S UCD 5 ug/g S P1Y2 5 ug/g S UCD 0 ug/g S P1Y2 0 ug/g S
H2S
(u
g/L
)
A
A
B
B
CC

Table 15.Concentration of elemental sulfur on Willamette Valley grapes at harvest in 2014 and
2015. 2014 samples 2015 samples
Grape Sample ID Elemental sulfur (ug/g) Grape Sample ID Elemental sulfur (ug/g)
111 0.2 503 0
445 0 533 0
696 0.1 763 0
378 0 450 1.6
553 0 959 0
211 0 858 0.2
539 0 397 0.8
460 0 694 2
464 0 613 0
933 0 298 0.4
631 0 427 0
959 0 961 0
831 0 987 0
267 0 539 0
928 0 728 0
840 0 237 0
278 0.1 418 0
398 0.1 103 0
552 0 691 0.3
781 0.7
444 1.3
111 0.2

Figure 19.Concentration of elemental sulfur in Pinot noir grape and juice samples. “Initial”
indicates grapes prior to cold soak and saignee treatments; “Juice” indicates juice removed by
saignee after seven day cold soak; “Grapes” indicates grapes remaining after saignee; “Juice
after settling” indicates juice removed by saignee and settled 24hrs at 4C; “Juice lees after
settling” indicates lees remaining after juice removed by settling for 24hrs at 4C.
Figure 20.Total production of H2S by S. cerevisiae P1Y2 during fermentation of Pinot noir
grapes. “Control” indicates grapes that underwent cold soak but no juice was removed; “Saignee
Grapes” indicates grapes where juice was removed at the end of a seven day cold soak; “Saignee
grapes + settled juice” indicates grapes where juice was removed after a seven day cold soak and
cold settled for 24hrs at 4C before being returned.
0
2
4
6
8
10
12
14
16
Initial Juice Grapes Juice after settling Juice lees after
settling
Ele
men
tal
sulf
ur
(ug/g
)
MicrothiolWettable
0
20
40
60
80
100
120
140
160
Control
(Wettable)
Control
(Microthiol)
Saigne Grapes
(Wettable)
Saignee Grapes
(Microthiol)
Saignee grapes
+ Settled juice
(Wettable)
Saignee grapes
+ Settled juice
(Microthiol)
H2S
(u
g/L
per
kg g
rap
es)

The impact on H2S formation by reducing the amount of S0
present on the Pinot noir grapes can
be seen in Figure 20. While fermentation of the original grapes containing wettable or microthiol
sulfur resulted in high levels of H2S production, lower amounts of H2S were produced during
fermentation of the grapes where the juice had been drained off (Figure 20). Low H2S production
was also noted where the drained off juice was returned to the fermenter after cold settling to
remove S0 (Figure 20).
VI. OUTSIDE PRESENTATIONS OF RESEARCH
Two poster presentations were given at the OWRI “Grape Days” research symposium (Corvallis,
March 31st) and the annual American Society of Enology and Viticulture national meeting in
Portland (June 17th
– 18th
). In addition, results have been shared and discussed with both the
Willamette Valley and Southern Oregon Enology Technical groups. Results from this project
were presented to Southern Oregon growers and winemakers during the OWRI Field Day on
July 28th
held at Del Rio Vineyards. Results were also presented to Willamette Valley growers
and winemakers during a LIVE vineyard Field Day held on August 12th
. Three manuscripts
based on this study are currently in preparation.
Kraft, D.N., Zhou, Q., Qian, M.C., and Osborne, J.P. 2015. Impact of elemental sulfur and
nitrogen on volatile sulfur compound formation during and after alcoholic fermentation In:
Proceedings of Oregon Wine Research Institute “Grape Days”, Corvallis, OR. March 31st.
Kraft, D.N., Zhou, Q., Qian, M.C., and Osborne, J.P. 2015.Impact of wine lees levels and
composition on formation of volatile sulfur compounds during aging of Pinot noir wine. In:
Proceedings of Oregon Wine Research Institute “Grape Days”, Corvallis, OR. March 31st.
Kraft, D.N., Zhou, Q., Qian, M.C., and Osborne, J.P. 2015.Impact of elemental sulfur and
nitrogen on volatile sulfur compound formation during and after alcoholic
fermentation.Proceedings of the American Society of Enology and Viticulture Annual Meeting,
June 17th
-18th
, Portland, OR.
Kraft, D.N., Zhou, Q., Qian, M.C., and Osborne, J.P. 2015.Impact of wine lees levels and
composition on formation of volatile sulfur compounds during aging of Pinot noir
wine.Proceedings of the American Society of Enology and Viticulture Annual Meeting, June
17th
-18th
, Portland, OR.
Daniel Kraft, an MS student working on this research project successfully defended his thesis on
August 25th
, 2015. His thesis is available online through the Oregon State University library:
(https://ir.library.oregonstate.edu/xmlui/bitstream/handle/1957/57242/KraftDanielN2015.pdf?seq
uence=1).
VII. RESEARCH SUCCESS STATEMENTS:
Development of volatile sulfur compounds (VSCs) post-fermentation can be a significant issue
during both red and white winemaking. This study focused on the development of VSCs in Pinot
noir during post-fermentation aging. Results from this study have demonstrated that while higher
amounts of lees in a wine post-fermentation increases the amount of VSC pre-cursors such as
cysteine and glutathione, this alone does not result in increased formation of VSCs. Instead, the
early formation of VSCs soon after wines go to barrel is more likely due to H2S produced late in
fermentation. Some of this H2S may be present in a “bound” or “releasable” H2S that is no longer
volatile and so will not be detected by smell. However, under reductive conditions (such as those
present in a barrel or bottle) H2S may be reduced back to its free form and become detectable by
smell again. The type and concentration of nitrogen present during fermentation as well as
elemental sulfur impacts the formation of H2S during fermentation as well as the concentration
of MeSOAc in the wines post-fermentation. Of particular note is the finding that addition of
DAP caused increased H2S formation by S. cerevisiae UCD522 while the addition of the same
amount of YAN as amino acids did not cause an increase in H2S production. Post-fermentation,
the dominant VSC compound in the wines was MeSOAc. High H2S production during
fermentation resulted in high MeSOAc in the wines post-fermentation but there were conditions
under which high MeSOAc was present in wines even though high H2S was not produced during
fermentation. In these cases the wines a high YAN content was achieved by the addition of DAP
or amino acids. These results suggest that while the presence of elemental sulfur is one factor in
the formation of VSCs post-fermentation, high YAN concentrations can also be problematic.
At this point it is too early to conclude much regarding the amount of elemental sulfur present on
Oregon grapes at harvest. The assessment of grapes at harvest will continue and be expanded
over the next few years so that a more complete picture can be developed. However, if high
levels of residual sulfur are present on red grapes at harvest, cold soaking of the grapes followed
by draining off of the juice could reduce the amount of elemental sulfur on the grapes. Cold
settling of the juice followed by racking and addition back to the original grapes allows minimal
loss of volume. Overall, based on results from this study the best strategy to prevent formation of
VSCs in wine is to firstly minimize the amount of residual elemental sulfur on grapes. Secondly,
use a low H2S producing yeast. Thirdly, measure YANs and do not add high amounts of DAP if
supplementation is needed (use a mixture of DAP and organic nitrogen supplements). Lastly,
settle wines post-fermentation to reduce the amount of lees present when going to barrel. reduce
the amount of lees post-fermentation is important to prevent the formation of VSCs post-
fermentation, managing YAN and using low H2S producing strains is also recommended.
VIII. FUND STATUS:
The majority of the funds to date have been spent on salary and supplies for the graduate
students performing the research. Funds have also been spent for, winemaking, equipment and
HPLC supplies for amino acid analysis, supplies and service costs for glutathione analysis and
supplies and equipment for GC-MS analysis of VSCs. The majority of remaining funds are
allocated for salary and supplies to support an undergraduate student researcher and a PhD
student who are currently completing work on experiments that began during the 2015 harvest as
well as preparing manuscripts for publication.
LITERATURE CITED:
Bettiga, L.J., Gubler, WD., and Leavitt, GM. “Powdery Mildew” In: Grape Pest Management:
Third edition. Leavitt, G.M (Ed). 2014
Edwards, C.G., and Bohlscheid, J.C. (2007).Impact of pantothenic acid addition on H2S
production by Saccharomyces under fermentative conditions.Enz. Microbial Technol. 41: 1-
4.
Fang, Y., and Qian, M.C. (2005). Sensitive quantification of sulfur compounds in wine by
headspace solid-phase microextraction technique. J. Chromatogr. A 1080: 177-185.
Kwasniewski, M.T., Allison, R.B., Wilcox, W.F., and Sacks, G.L. (2011).Convenient,
inexpensive quantification of elemental sulfur by simultaneous in situ reduction and
colorimetric detection.Anal.Chim.Acta. 703: 52-57.
Kwasniewski, M.T., Sacks, G.L., and Wilcox, W.F. (2014). Persistence of elemental sulfur spray
residue on grapes during ripening and vinification. Am. J. Enol. Vitic. 65: 453-462
Lee, J., Schreiner, P.R. (2010). Free amino acid profiles from „Pinot noir‟ grapes are influenced
by vine N-status and sample preparartion method. Food Chem. 119: 484-489.
Marchand, S., and de Revel, G. (2010).A HPLC fluorescence-based method for glutathione
deriviatives quantification in musts and wine.Anal.Chim.Acta. 660: 158-163.
Osborne, J. P., and Edwards.C.G. (2006).Inhibition of malolactic fermentation by
Saccharomyces during alcoholic fermentation under low and high nitrogen conditions.
Aust. J. Grape and Wine Res. 12, 69-78.
Rauhut, D. (1993). Yeast production of sulfur compounds. In: Wine Microbiology and
Biotechnology. Fleet, G.H. (ed). Harwood Academic Publishers, Chur, Switzerland.
Roland, A., and Schneider, R. (2015). Development and validation of a high-throughput analysis
of glutathione in grapes, musts, and wines by stable isotope dilution assay and LC-
MS/MS. Food Chem. 177: 152-157.
Rothwarf, D.M. and Scheraga, H.A. 1992. Equilibrium and kinetic constants for the thiol-
disulfide interchange reaction between glutathione and dithiothreitol. Proc Natl AcadSci U S
A. 89: 7944–7948.
Spiropoulos, A., Tanaka, J., Flerianos, I., and Bisson, L.F. (2000). Characterization of hydrogen
sulfide formation in commercial and natural wine isolates of Saccharomyces. Am. J.
Enol. Vitic. 51: 233-248.
Takush, D.T., and Osborne, J.P. (2011).Investigating high hydrostatic pressure processing as a
tool for studying yeast during red winemaking. Am. J. Enol. Vitic.Enol. 62: 536-541.
Thomas, C.S., Gubler, D.W., Silacci, M.W., and Miller, R. (1993a). Changes in elemental sulfur
residue on Pinot noir and Cabernet sauvignon grape berries during the growing season.
Am. J. Enol. Vitic. 44: 205-210.
Thomas, C.S., Boutlon, R.B., Silacci, M.W., and Gubler, D.W. (1993b). The effect of elemental
sulfur, yeast strain, and fermentation medium on hydrogen sulfide production during
fermentation. Am. J. Enol. Vitic. 44: 211-216.
Ugliano, M., and Henschke, P.A. (2010).Comparison of three methods for accurate
quantification of hydrogen sulfide during fermentation.Anal.Chim.Acta. 660: 87-91.
Ugliano, M., Fedrizzi, B., Siebert, T., Travis, B., Magno, F., Versini, G.,andHenschke, (2009).
Effect of nitrogen supplementation and Saccharomyces species on hydrogen sulfide and
other volatile sulfur compounds in Shiraz fermentation and wine. J. Agric. Food Chem. 57:
4948-4955.