Embed Size (px)
Citation preview
Final Report On
Assessment of Fatigue in Train and Engine Employees of the Union Pacific Railroad in the
San Antonio Area
Patrick Sherry, Ph.D. University of Denver
July 6, 2005

San Antonio Fatigue Study
Executive Summary
This study was conducted with Union Pacific Railroad Train and Engine employees reporting for duty to the San Antonio Kirby Yard from November 3rd through November 8th 2004. During that time, questionnaire assessment of 283 Train and Engine employees (out of a possible 356 who reported for duty) occurred, yielding a response rate of 79.5%. The sample consisted of 137 Engineers and 128 Conductors. In addition, in consultation with labor and management, a total of 40 Engineers and Conductors were identified from several Pools and Extraboards to wear actigraphs during a 30 day period. Results of the Epworth Sleepiness Scale, a self-report measure of sleepiness, indicated that a substantial portion of the respondents scored in the high to very high range for sleepiness (50.5%) while 49.5% of respondents scored in the normal range. Scores on this instrument were significantly higher than scores obtained by two other, previously studied, railroad locations. Actigraph measurements were obtained for 33 study participants due to missing data resulting from equipment malfunction and individual decisions to withdraw from the study. The results of the actigraph assessment indicate that the average amount of sleep per 24 hour period was 6.32 (±1.68) ranging from a low of 2.75 average hours of sleep to a high of 10.02. It was estimated that as many as 45.5% of the individuals averaged less than 5.93 hours of sleep per 24 hour period and 39% averaged less than 5.5 hours of sleep per 24 hour period during the assessment. Actigraph results indicate that Engineers and Conductors obtained 6 hours of sleep or less per 24 hour period 67% of the time. These results suggest that a little over a third of the work force is obtaining less sleep than the average shift worker in the US (NSF, 2002) and that the chances are 6.7 out of 10 that on any given day an Engineer and/or Conductor will get less than 6 hours of sleep. Further inspection of the data revealed statistically significant differences between the average amount of sleep obtained for various work groups. Members of the Conductors Pool (XT30) obtained significantly less sleep (t=2.4, df=8, p<.05) than that of the Engineer’s Extraboard (XE40) (5.45hrs vs. 7.90hrs respectively).
Sherry – 2005 2

San Antonio Fatigue Study
Table of Contents
Background................................................................................................................. 6 Fatigue............................................................................................................. 6 Measures of Fatigue........................................................................................ 7
Methodology............................................................................................................... 8 Procedures....................................................................................................... 8 Study Participants ........................................................................................... 9
Results of Self Report Measures of Fatigue ............................................................. 10 Epworth Sleepiness Scale ................................................................................. 10 Pittsburgh Sleep Quality Index ......................................................................... 13 Emotional Distress ............................................................................................ 15 Additional Measures ......................................................................................... 17
Results of Actigraphy Studies................................................................................... 21 Individual Profiles............................................................................................. 22 Sleep Debt......................................................................................................... 24
Lineup Accuracy....................................................................................................... 26 Del Rio .......................................................................................................... 27 Houston ......................................................................................................... 28 Taylor-Hearne ............................................................................................... 29 Laredo ........................................................................................................... 30
Summary of Line-Up Analyses ........................................................................ 30 Trip Start Times ........................................................................................................ 31 Focus Groups ............................................................................................................ 32 Discussion................................................................................................................. 35 Study Limitations...................................................................................................... 40 Conclusions............................................................................................................... 41 Recommendations..................................................................................................... 42 Glossary of Terms and Acronyms ............................................................................ 46 References................................................................................................................. 48
Sherry – 2005 3

San Antonio Fatigue Study
List of Figures Figure 1. Distribution of San Antonio Epworth Scores................................................... 11 Figure 2. Epworth Scores of San Antonio and other locations........................................ 12 Figure 3. Distribution of Pool Epworth Scores............................................................... 13 Figure 4. Severity of Epworth Scores for Extraboard and Pool Employees.................... 13 Figure 5. PSQI Severity Classification. ........................................................................... 14 Figure 6. PSQI Scores for Craft and Assignment to Extraboard and Pool. .................... 15 Figure 7. GHQ-12 Scores for San Antonio...................................................................... 16 Figure 8. GHQ Scores for Craft and Extraboard Assignment. ........................................ 17 Figure 9. Average Daily Hours of Sleep for Study Participants from Actigraphs. ........ 21 Figure 10. Average Hours of Sleep for Pool or Extraboard. ............................................ 22 Figure 11. Extraboard Conductor #1 Hours of Sleep per day.......................................... 23 Figure 12. Extraboard Conductor #2 Hours of Sleep per day.......................................... 23 Figure 13. Pool Engineer Hours of Sleep per day. .......................................................... 24 Figure 14. Estimates of Sleep Debt.................................................................................. 25 Figure 15. Del Rio Line up Estimates.............................................................................. 27 Figure 16. Houston Line-up estimates. ............................................................................ 28 Figure 17. Hearne Line-up estimates. .............................................................................. 29 Figure 18. Laredo Line-up estimates. .............................................................................. 30
Sherry – 2005 4

San Antonio Fatigue Study
List of Tables Table 1. Demographic characteristics of the participants in the study. .................. 9 Table 2. Participants in Pools and Extraboards ...................................................... 10 Table 3. Epworth Cutoffs ............................................................................................ 12 Table 4. Group comparisons on selected measures by Craft. ............................. 19 Table 5. Independent t-tests of selected variables by Assignment (Extraboard
vs. Pool). .................................................................................................................. 20 Table 6. Actigraph Average Hours of Sleep Descriptive Statistics by Pool or
Extraboard (EB)...................................................................................................... 21 Table 7. Percentage of time sleep debt occurred in San Antonio data set. ........ 25
Sherry – 2005 5

San Antonio Fatigue Study
Background
This project was requested and commissioned by the Federal Railroad Administration (FRA) and was conducted in San Antonio, Texas, to serve as a general assessment of fatigue in the workforce of train and engine employees of the Union Pacific Railroad (UP). For the purposes of this report, the term ‘workforce’ pertains to train and engine employees located in the San Antonio area and not to employees associated with other crafts. As a point of reference, the “San Antonio area” refers to employees reporting for duty at the UP Kirby Yard and the South San Antonio Yard to work in the Laredo, Houston, Taylor-Hearne, and Del Rio Pools as well as the Northeast and Southeast Extraboards.
The question of the impact of operator fatigue on railroad safety has been a concern of the National Transportation Safety Board (NTSB) since 1989 (Sherry, 2003). The Association of American Railroads (AAR) began an in-depth study of fatigue issues in its industry in 1992 and the US Government Accounting Office (GAO) issued a report on the fatigue of railroad locomotive Engineers in 1992 that focused attention on the variability of work shift start times (GAO, 1992). The NTSB has urged the Federal Railroad Administration (FRA) to consider changes to the hours of service rules that affect railroad operating employees (Hall, 1998). The recent incident on June 28, 2004, involving the collision of UP freight train MHOTU-23 and BNSF Railway (BNSF) freight train MEAPTUL-126D has also raised questions about the fatigue of locomotive Engineers. According to the public hearing convened by the National Transportation Safety Board (NTSB, 2005) this collision resulted in the death of the UP Conductor, two nearby residents, and the treatment of more than 40 people at local hospitals for the inhalation of chlorine gas. Thirty-five freight cars (19 UP and 16 BNSF) and four UP locomotives derailed, resulting in the release of chlorine, a poisonous gas.
Since some concerns were raised by FRA about the possibility of fatigue in the workforce as a contributing factor to the Macdona accident, the present study was undertaken in an effort to understand the factors affecting the situation in San Antonio. The FRA asked the University of Denver team to conduct a survey of the UP workforce to gather additional information on employee’s reports of fatigue.
Fatigue
The issue of fatigue is complicated and subject to considerable misunderstanding. Fatigue has been the subject of a number of scientific investigations and it should be noted that the term fatigue is one that most people can relate to. However, the definition of fatigue, from a scientific standpoint is somewhat less clear. Sherry (2003) noted that in an attempt to understand fatigue, investigators have used several different measures including physiological, behavioral, cognitive, and self-report of mood or subjective
Sherry – 2005 6

San Antonio Fatigue Study
experience. Michielson, De Vries, Van Heck, Van de Vijer, and Sijtsma (2004) suggested that “due to complex interactions between physical and mental elements in task and job demands and consequences of effort, it is difficult to separate” the mental and physical components of fatigue (p. 40). Generally, fatigue in the railroad industry has been taken to mean that an individual suffers a loss of alertness, a loss of mental or cognitive capacity, a reduction in alertness, and a propensity to report feeling sleepy prior to falling asleep.
Measures of Fatigue
A variety of self-report measures have been developed to study fatigue, sleepiness, and alertness. These measures are easy to administer and readily accepted by study participants. The Stanford Sleepiness Scale, perhaps the most widely used measure of subjective sleepiness, (SSS; Hoddes, Zarcone, Smythe, Phillips, Dement, 1973) consists of seven statements ranging from “wide awake” to “cannot stay awake”. The scale has been validated against performance measures as a function of sleep deprivation. . Another widely used subjective self-report technique has been that of mood descriptors. The typical measure of this sort is one in which a series of adjectives, that indicate a variety of different mood states, are listed and then endorsed by a respondent if they are accurate. The Thayer Activation-Deactivation Adjective Checklist (Thayer, 1967, 1978) has been used extensively and consists of adjectives that describe both active arousal states as well as deactivation states. In addition, other adjective checklists have been used such as the Profile of Mood States (McNair & Lorr, 1964, 1971) and the Denver Adjective Checklist (Sherry, 2003).
Since there is no consensus regarding the definition of fatigue, researchers have taken to attempting to study the problem by considering it a multidimensional construct. However, this too has been questioned and Ahsberg (2000) determined that while there were a number of dimensions of fatigue in occupational samples there appeared to be a single dimension or latent construct that might simply be termed lack of energy. Interestingly, Maslach and Jackson (1984) defined a measure of emotional exhaustion in their work with human services professionals.
At any rate, most current thinking has attempted to address the role of sleep and restricted sleep on the development of a number of phenomena which are generally termed fatigue. When studying shiftwork, researchers typically include both objective and subjective measures thought to be related to the construct of fatigue. For example, previous studies of fatigue in the transportation industry (Wiley, 1996) have included measures of physiological processes, as well as subjective and objective measures. Van Dongen, Maislin, Mullington, Dinges (2003) examined the differential effects of restricted work schedules on various indicators of fatigue using actigraphs, self-report sleep logs, and measures of cognitive performance, such as reaction time and visual tracking.
The use of physiological measures such as electroencephalogram (EEGs) or electrooculogram (EOGs) is difficult in a field setting due to the lack of controlled
Sherry – 2005 7

San Antonio Fatigue Study
conditions and an environment adverse to the utilization of such sensitive equipment. Researchers have had more success with the use of actigraphy as a behavioral measure of activity which can be used to infer sleep and wakefulness. These devices, most commonly known as actigraphs, are small wrist-watch size devices that monitor activity and store data for over 60 days. Data from these devices are then available for analysis by standard statistical programs. Actigraph data have been used to obtain reliable and valid measures of sleep and sleep quality. (Sadeh, Alster, Urbach, & Lavie, 1989; Sadeh et al., 1991). The use of actigraph data has been used to differentiate between normal and disturbed sleep-wake patterns of adults, young children, and infants and to assess changes in infant sleep following behavioral interventions. (e.g., Cole, Kripke, Gruen, Mullaney, & Gillin, 1992; Sadeh, Acebo, Seifer, Aytur, & Carskadon, 1995; Sadeh, Hauri, Kripke, & Lavie, 1995; Sadeh, Lavie, Scher, Tirosh, & Epstein, 1991; Sadeh, Sharkey, & Carskadon, 1994). Actigraphy measurements and sleep wake algorithms have also been validated by demonstrating significant correlations with polysomnographic measures (r=.90) (Cole-Kripke, et. al., 1992) as well as agreement on ratings of sleep-wake states ranging from 85% to 95% for both normal and clinical samples (Sadeh, Acebo, et al., 1995; Sadeh, Hauri, et al., 1995; Sadeh et al., 1991; Sadeh, Sharkey, Carskadon, 1994; Sadeh, Raviv, Gruber, 2000).
The present study was designed to utilize subjective self-report measures of fatigue and sleep as well as objective actigraphy to determine the perceptions of the UP workforce relative to fatigue in the San Antonio area.
Methodology
Following initial conversations with representatives of the FRA, the labor unions in the San Antonio area, and the officials of the UP the study was submitted to the Institutional Review Board (IRB) of the University of Denver. The research team obtained IRB approval of the protocol, methodology, and consent form administered to the potential participants. It was determined that all of the train and engine road employees that were listed on the employee rosters were to be invited to participate in the study. These rosters were obtained jointly from representatives of the respective labor organizations [e.g., United Transportation Union (UTU) and Brotherhood of Locomotive Engineers and Trainmen (BLET)] and the cooperation of the officials of the UP. It was determined that as many as 356 employees from the Laredo, Houston, Del Rio, and Hearn Pools and Extraboards could have reported for duty at the Kirby Yard during the week that the researchers were on site administering the self-report measures and distributing the actigraphs.
Procedures Participants were recruited to participate in the study when they reported for duty at the Kirby Yard November 3rd through November 8th 2004. Accompanied by local labor representatives, researchers from the team were introduced to employees. These potential participants were given the consent form and a verbal explanation of the study
Sherry – 2005 8

San Antonio Fatigue Study
requirements. Participants were then asked if they agreed to participate, and if so, were given instructions on how to complete the questionnaires.
Study Participants
As previously indicated, the participants for the current study comprise the workforce that operates out of the UP Kirby Yard in San Antonio Texas. This workforce consisted of a total of 356 possible employees who were eligible to report to duty at Kirby Yard November 3 through November 8, 2004. A total of 356 surveys were administered and 283 completed surveys were returned, yielding a response rate of 79.5%.
Table 1. Demographic characteristics of the participants in the study.
Number of Participants
Gender Male 283 Female 0
Race Caucasian 178 African American 16 Hispanic 56 Asian-Pacific Islander
0
Native American 2 Other 5 Not Reported 26
Craft Engineers 137 Conductors 128 Not Reported 18 Job Extraboard 91 Other 149 Not Reported 43
Average age of the survey respondents was 42 years and mean educational attainment was 13.4 years.
In addition to the completion of survey packets, 40 individuals were asked to wear actigraphs for a one-month period. Due to the expense of actigraph rentals, and the limited number of actigraphs available from the manufacturer, it was determined that the selection of forty participants would be the number that would be practical within budget constraints and allow a sampling of the different Pools and Extraboards. Following discussions with union and management officials, key Pools and Extraboards to be studied using the actigraphs were identified. The Pools and Extraboards were selected by
Sherry – 2005 9
San Antonio Fatigue Study
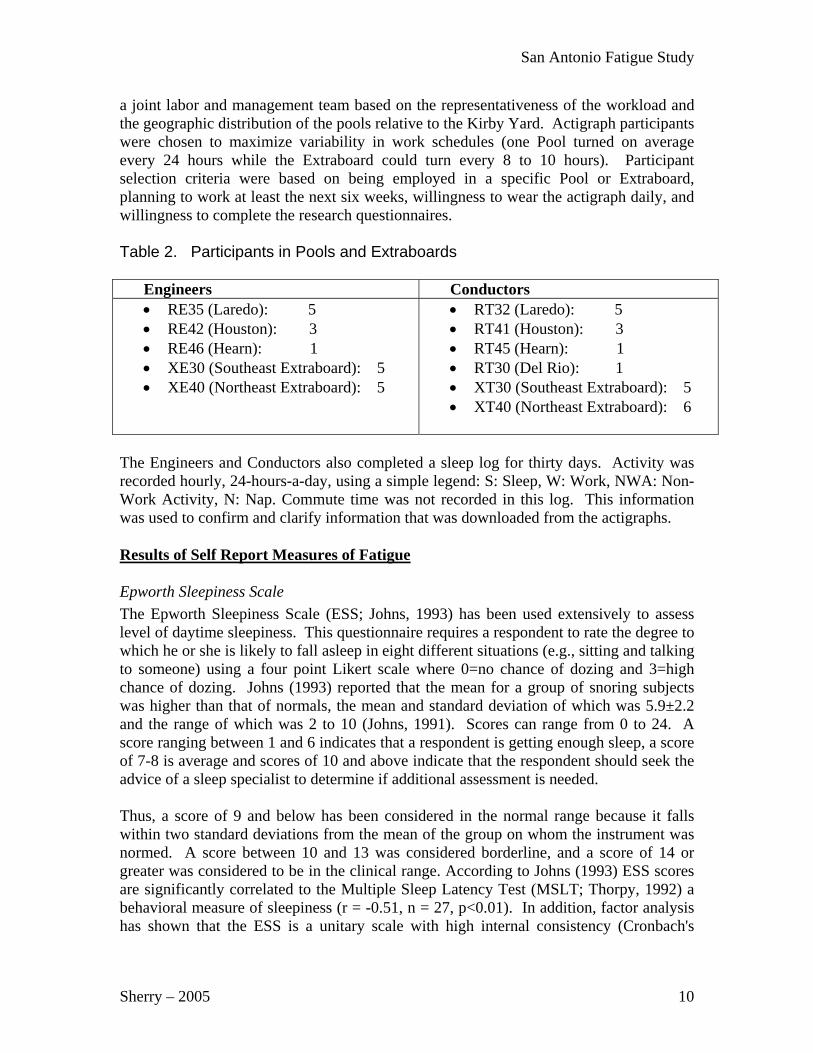
a joint labor and management team based on the representativeness of the workload and the geographic distribution of the pools relative to the Kirby Yard. Actigraph participants were chosen to maximize variability in work schedules (one Pool turned on average every 24 hours while the Extraboard could turn every 8 to 10 hours). Participant selection criteria were based on being employed in a specific Pool or Extraboard, planning to work at least the next six weeks, willingness to wear the actigraph daily, and willingness to complete the research questionnaires. Table 2. Participants in Pools and Extraboards
Engineers Conductors • RE35 (Laredo): 5 • RE42 (Houston): 3 • RE46 (Hearn): 1 • XE30 (Southeast Extraboard): 5 • XE40 (Northeast Extraboard): 5
• RT32 (Laredo): 5 • RT41 (Houston): 3 • RT45 (Hearn): 1 • RT30 (Del Rio): 1 • XT30 (Southeast Extraboard): 5 • XT40 (Northeast Extraboard): 6
The Engineers and Conductors also completed a sleep log for thirty days. Activity was recorded hourly, 24-hours-a-day, using a simple legend: S: Sleep, W: Work, NWA: Non-Work Activity, N: Nap. Commute time was not recorded in this log. This information was used to confirm and clarify information that was downloaded from the actigraphs.
Results of Self Report Measures of Fatigue
Epworth Sleepiness Scale The Epworth Sleepiness Scale (ESS; Johns, 1993) has been used extensively to assess level of daytime sleepiness. This questionnaire requires a respondent to rate the degree to which he or she is likely to fall asleep in eight different situations (e.g., sitting and talking to someone) using a four point Likert scale where 0=no chance of dozing and 3=high chance of dozing. Johns (1993) reported that the mean for a group of snoring subjects was higher than that of normals, the mean and standard deviation of which was 5.9±2.2 and the range of which was 2 to 10 (Johns, 1991). Scores can range from 0 to 24. A score ranging between 1 and 6 indicates that a respondent is getting enough sleep, a score of 7-8 is average and scores of 10 and above indicate that the respondent should seek the advice of a sleep specialist to determine if additional assessment is needed. Thus, a score of 9 and below has been considered in the normal range because it falls within two standard deviations from the mean of the group on whom the instrument was normed. A score between 10 and 13 was considered borderline, and a score of 14 or greater was considered to be in the clinical range. According to Johns (1993) ESS scores are significantly correlated to the Multiple Sleep Latency Test (MSLT; Thorpy, 1992) a behavioral measure of sleepiness (r = -0.51, n = 27, p<0.01). In addition, factor analysis has shown that the ESS is a unitary scale with high internal consistency (Cronbach's
Sherry – 2005 10
San Antonio Fatigue Study
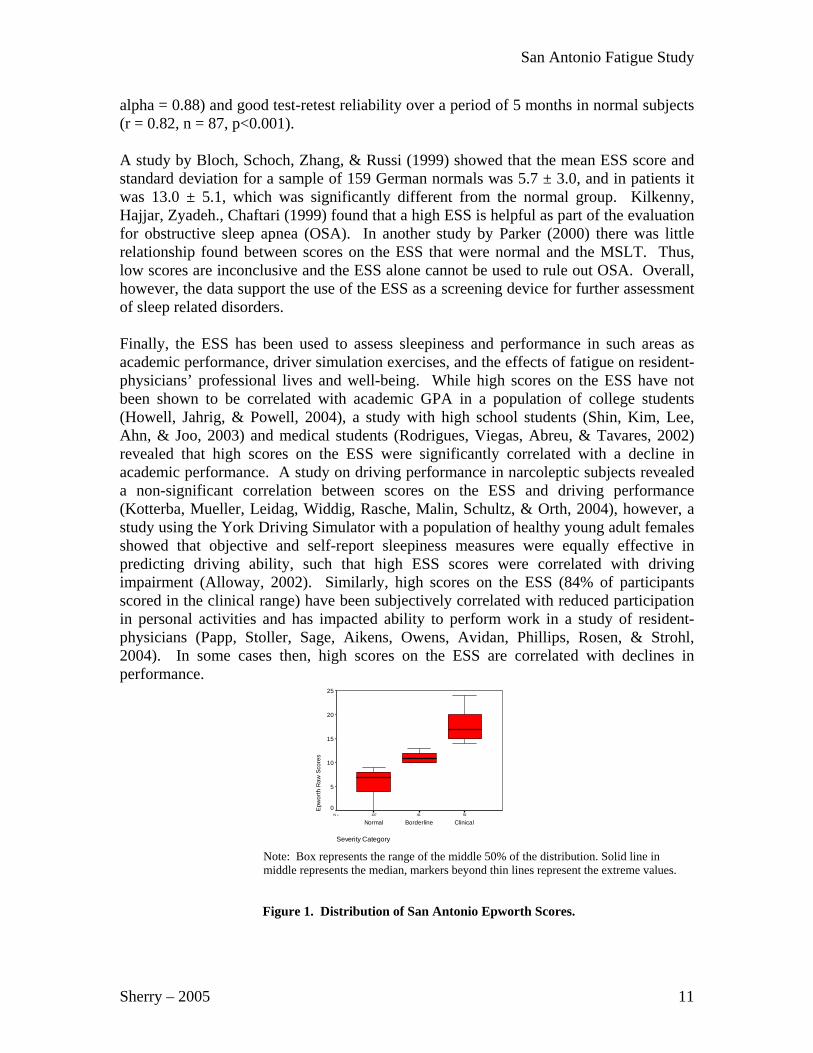
alpha = 0.88) and good test-retest reliability over a period of 5 months in normal subjects (r = 0.82, n = 87, p<0.001). A study by Bloch, Schoch, Zhang, & Russi (1999) showed that the mean ESS score and standard deviation for a sample of 159 German normals was 5.7 ± 3.0, and in patients it was 13.0 ± 5.1, which was significantly different from the normal group. Kilkenny, Hajjar, Zyadeh., Chaftari (1999) found that a high ESS is helpful as part of the evaluation for obstructive sleep apnea (OSA). In another study by Parker (2000) there was little relationship found between scores on the ESS that were normal and the MSLT. Thus, low scores are inconclusive and the ESS alone cannot be used to rule out OSA. Overall, however, the data support the use of the ESS as a screening device for further assessment of sleep related disorders. Finally, the ESS has been used to assess sleepiness and performance in such areas as academic performance, driver simulation exercises, and the effects of fatigue on resident-physicians’ professional lives and well-being. While high scores on the ESS have not been shown to be correlated with academic GPA in a population of college students (Howell, Jahrig, & Powell, 2004), a study with high school students (Shin, Kim, Lee, Ahn, & Joo, 2003) and medical students (Rodrigues, Viegas, Abreu, & Tavares, 2002) revealed that high scores on the ESS were significantly correlated with a decline in academic performance. A study on driving performance in narcoleptic subjects revealed a non-significant correlation between scores on the ESS and driving performance (Kotterba, Mueller, Leidag, Widdig, Rasche, Malin, Schultz, & Orth, 2004), however, a study using the York Driving Simulator with a population of healthy young adult females showed that objective and self-report sleepiness measures were equally effective in predicting driving ability, such that high ESS scores were correlated with driving impairment (Alloway, 2002). Similarly, high scores on the ESS (84% of participants scored in the clinical range) have been subjectively correlated with reduced participation in personal activities and has impacted ability to perform work in a study of resident-physicians (Papp, Stoller, Sage, Aikens, Owens, Avidan, Phillips, Rosen, & Strohl, 2004). In some cases then, high scores on the ESS are correlated with declines in performance.
5981137N =
Severity Category
ClinicalBorderlineNormal
Epw
orth
Raw
Sco
res
25
20
15
10
5
0
Note: Box represents the range of the middle 50% of the distribution. Solid line in middle represents the median, markers beyond thin lines represent the extreme values.
Figure 1. Distribution of San Antonio Epworth Scores.
Sherry – 2005 11
San Antonio Fatigue Study
For the present study the results for the ESS indicate that the mean for the entire San Antonio sample was 10.06±5.04. Based on published normative data then, these results suggest that the study participants would likely be in the borderline-normal sleepiness and in the clinical setting would warrant further study. The data presented in Figure 1 and described further in Table 3 indicate that a substantial portion of the San Antonio respondents are in the clinical range (21.3%), followed by borderline (29.2%), and normal (49.5%). Given that we know that the population has irregular shift schedules we suspect that these results indicate the presence of borderline sleepiness in the population.
Table 3. Epworth Cutoffs
Frequency Percent Valid
Percent aCumulative
Percent Normal (<10) 137 48.4 49.5 49.5 Borderline (10 to 13) 81 28.6 29.2 78.7 Clinical (>13) 59 20.8 21.3 100.0
N 277 97.9 100.0 Missing 6 2.1 Total N 283 100.0
a Not including Missing data.
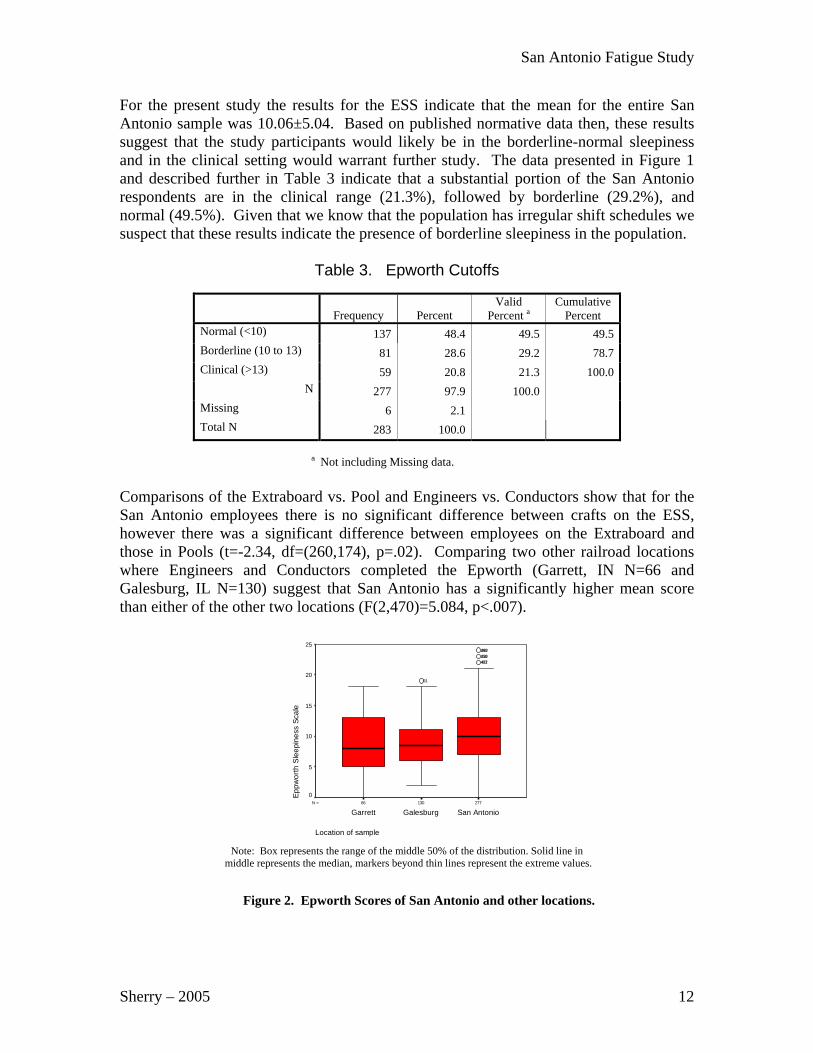
Comparisons of the Extraboard vs. Pool and Engineers vs. Conductors show that for the San Antonio employees there is no significant difference between crafts on the ESS, however there was a significant difference between employees on the Extraboard and those in Pools (t=-2.34, df=(260,174), p=.02). Comparing two other railroad locations where Engineers and Conductors completed the Epworth (Garrett, IN N=66 and Galesburg, IL N=130) suggest that San Antonio has a significantly higher mean score than either of the other two locations (F(2,470)=5.084, p<.007).
27713066N =
Location of sample
San AntonioGalesburgGarrett
Eppw
orth
Sle
epin
ess
Scal
e
25
20
15
10
5
0
477462450218460293
91
Note: Box represents the range of the middle 50% of the distribution. Solid line in
middle represents the median, markers beyond thin lines represent the extreme values.
Figure 2. Epworth Scores of San Antonio and other locations.
Sherry – 2005 12

San Antonio Fatigue Study
As can be seen in Figure 3, and as mentioned above, there is no difference in sleepiness between the Engineers and Conductors (F(1,260)=0.204, ns) however, there is a significantly greater level of sleepiness in the Extraboard participants (F(1,260)=5.51, p<.05).
Epworth Scores for Extraboard vs. Pool
91171N =
Extraboard
YesNo
Epw
orth
Raw
Sco
res
25
20
15
10
5
0
17519018023179
Note: Box represents the range of the middle 50% of the distribution. Solid line in middle represents the median, markers beyond thin lines represent the extreme values.
Figure 3. Distribution of Pool Epworth Scores.
The distribution of the Extraboard and Pool participants by severity of scores is displayed in Figure 4. As can be seen, a higher percentage of Extraboard respondents scored in the Clinical range. Slightly more than 57% of the Extraboard score in the Borderline to Clinical range as compared to 45% of the participants operating Pool turns. However, based on these scores, we surmise that a substantial portion of the employees in both the Extraboard and the Pool condition were excessively sleepy.
Epworth Scores of Extraboard vs Non-Extraboard Employees
0
10
20
30
40
50
60
Normal Borderline Clinical
Perc
ent o
f Sam
ple
ExtraB
Non-Extra
Figure 4. Severity of Epworth Scores for Extraboard and Pool Employees.
Pittsburgh Sleep Quality Index
Sherry – 2005 13

San Antonio Fatigue Study
The Pittsburgh Sleep Quality Index (PSQI; Buyesse, Monk, Reynolds, Berman, & Kupfer, 1989) was also administered to the San Antonio employees. The original validation study indicated that a global PSQI score greater than 5 had a sensitivity of 89.6% and specificity of 86.5% in distinguishing good versus poor sleepers. Results of a study by Fichtenberg, Putnam, Mann, Zafonte, & Millard (2001) determined that sensitivity and specificity rates for the diagnosis of insomnia were 93% and 100%, respectively, for a PSQI Global Score of greater than or equal to 8. In the present study scoring was modified slightly for railroad employees due to the fact that they do not have a standard bedtime. The Global PSQI score is calculated from seven different components comprising different items in the questionnaire. In the present study, the score for component 3 was set at 75% for overall amount of time in bed and could underestimate the possibility of insomnia. Similarly, the score for component 2 was set equal to item 5a due to the fact that railroad employees do not have a definite time for going to sleep which could also underestimate the presence of insomnia slightly. The average score for the San Antonio employees on the PSQI was 8.1±3.7, noticeably higher than the cutoff reported by the scale authors. The percentage of the population above the cutoff (>5) was 78.4% (see Figure 5a - Liberal Cutoff). Similarly, the percentage of the San Antonio sample scoring above the more restrictive cutoff (>8) was 49.5% (see Figure 5b - Conservative Cutoff). Thus, the majority of the San Antonio Engineers and Conductors would likely be considered highly fatigued in comparison to normal and even clinical populations.
Figure 5a. - PSQI – Liberal Cutoff Figure 5b. PSQI – Conservative Cutoff
22261N =
PSQI Severity (>5)
ClinicalNormal
PSQ
I Raw
Sco
re
20
15
10
5
0
140143N =
PSQI Severity (>8)
ClinicalNormal
PSQ
I Raw
Sco
re
20
15
10
5
0
Note: Box represents the range of the middle 50% of the distribution. Solid line in middle represents the median, markers beyond thin lines represent the extreme values.
Figure 5. PSQI Severity Classification.
Additional comparisons suggested that the average score for the Extraboard was 8.88±3.8 while the average score for the participants in Pools was 7.80±3.44 (see Figure 6) which was statistically significant (F(1,263)=6.617, P<.05). Comparisons between Engineers and Conductors were also significant with Engineers scoring at 8.72±3.6 and Conductors at 7.58±3.54 ((F(1,263)=7.24, P<.01). Again, these results suggest a high level of
Sherry – 2005 14

San Antonio Fatigue Study
sleepiness compared to a normal population. On a cautionary note, while statistically significant, the practical significance of these findings in this population are not fully known due to the lack of utilization of this instrument with the railroad population.
Non-Extraboard (Pool) vs. Extraboard Engineers vs. Conductors
89172N =
Extraboard
ExtraboardNon-Extraboard
PSQ
I Raw
Sco
re
20
15
10
5
0
127134N =
Craft or Position
ConductorEngineer
PSQ
I Raw
Sco
re
20
15
10
5
0
Note: Box represents the range of the middle 50% of the distribution. Solid line in middle represents the median, markers beyond thin lines represent the extreme values
Figure 6. PSQI Scores for Craft and Assignment to Extraboard and Pool.
These scores are difficult to interpret given the fact that we have limited data available from railroad populations using this instrument. However, it should be noted that this instrument was included in the survey packet because it is used by UP management when working with the railroad employees who are thought to have sleep related difficulties. Thus, although we are unable to determine the extent to which the variable shift schedule truly influences the magnitude to these scores, we are clear that there is a strong indication of the presence of sleepiness greater than what would be expected in the typical normal population.
Emotional Distress It is sometimes argued that elevations on measures of fatigue are simply an artifact of the level of emotional distress (Harrison, Smith, & Sykes, 2002; Korszun, Young, Engleberg, Brucksch, Greden, & Crofford, 2002) that respondents are experiencing due to various factors, including those associated with their immediate work environment. To assess the possibility that level of emotional distress was also a factor in the experience of railroad employees in the San Antonio area a popular screening device designed to assess for the presence of emotional distress was administered. A modified version of the General Health Questionnaire (GHQ-12; Goldberg, 1972), which was designed to detect the presence of emotional distress and has been used in several large scale epidemiological studies, was administered to the San Antonio employees. The GHQ-12 has been used to assess levels of depression, anxiety, sleep
Sherry – 2005 15

San Antonio Fatigue Study
disturbance and happiness in the general population. A GHQ12 score of 4 or more indicates a high level of psychological distress. Hardy, Shapir, Haynes, & Rick (1999) used the Likert scoring method to validate the GHQ-12 on a sample of 551 National Health Services Staff workers and found that the mean GHQ-12 score was 1.27 (SD=0.52). Adlaf, Gliksman, Demers, and Newton-Taylor (2001) found that in a sample of 7800 college students that the average response was 1.045±1.05. The mean and standard deviation for the men in the sample was 0.96 ±.73. Research on the use of the GHQ-12 as a screening device for detecting mental and emotional disorders in various populations has determined that a difference cutoff is sometimes needed depending upon the population. For example, Hardy, Shapiro, and Haynes (1999) found that the cutoff score with the best Receiver Operating Characteristics (ROC; a graphical representation of the trade off between the false negative and false positive rates for every possible cut off), of sensitivity of .69 and specificity of .88 was ¾. Meaning that the absence of mental problems was found if the score was below three and the presence was found if the score was above 4. The results of the GHQ-12 for the San Antonio sample was .88±.54, suggesting that the level of psychological or emotional distress for the population was within normal limits. It should be noted however, that while the population did not meet the criteria for overall emotional distress a total of 6.7% of the San Antonio population scored higher than either the college or the National Health Services worker norms. Comparisons between Engineers and Conductors as well as Extraboard and Pool indicated that there were no significant differences between these groups or the various locations or Pools that employees were assigned to on these measures.
GHQ
3.002.75
2.502.25
2.001.75
1.501.25
1.00.75
.50.25
0.00
GHQ
Freq
uenc
y
80
60
40
20
0
Std. Dev = .55 Mean = .89
N = 282.00
Figure 7. GHQ-12 Scores for San Antonio.
Sherry – 2005 16

San Antonio Fatigue Study
Non-Extraboard (Pool) vs. Extraboard Engineers vs. Conductors
89171N =
Extraboard
ExtraboardNon-Extraboard
GH
Q R
aw S
core
s3.5
3.0
2.5
2.0
1.5
1.0
.5
0.0
278232
229
1803612610813464
127133N =
Craft or Position
ConductorEngineer
GH
Q R
aw S
core
s
3.5
3.0
2.5
2.0
1.5
1.0
.5
0.0
278180126
134
23236
108
64
229
Note: Box represents the range of the middle 50% of the distribution. Solid line in middle represents the median, markers beyond thin lines represent the extreme values.
Figure 8. GHQ Scores for Craft and Extraboard Assignment.
Additional Measures Several additional findings from the self-report data are also worthy of note. These measures are in some cases single item measures (e.g., how many hours of sleep did you have in the last 24) that are not normally distributed. Different statistical tests are required for normal and non-normally distributed data. In many cases kurtosis and skewness are not viewed as major threats to the t-test if the two populations (for an independent samples test) are symmetrical and skewness is in the same direction. Also, the Welch’s t-test can be used if variances are not equal. The following analyses first use the Student’s t-test, followed by the Welch’s t, the Mann-Whitney and finally, the Kolmogorov-Smirnov tests. As noted previously, significant differences were found between Engineers and Conductors on the PSQI but not on the Epworth. Significant differences existed between Extraboard and Non-Extraboard or Pool employees on the Epworth and the PSQI, suggesting higher levels of fatigue for Extraboard employees. Work Related Stress. This scale consisted of four items measuring respondents’ perception of work related stress. A five point Likert response format was used (1= not at all/5 = very great degree). Reliability estimates were computed using Cronbach’s alpha which was .83. Both the t-test and the Mann-Whitney non-parametric tests revealed slightly greater levels of stress at work for the Engineers as compared to the Conductors (t=2.255, df=(1,263), p<.025). No differences between groups were noted for Extraboard versus Non-Extraboard or Pool employees. Unexpected Calls. Engineers reported being called to work unexpectedly almost two times more frequently than Conductors (3.93 to 2.08 unexpected calls per week, respectively) which was a statistically significant difference (t=5.07, df=247, p<.001). Interestingly, this variable is non-normally distributed so non-parametric tests were used
Sherry – 2005 17
San Antonio Fatigue Study
which also indicate there were significant differences between Engineers and Conductors on this measure. Self Report Hours of Sleep. Respondents were asked to report the number of hours of sleep they had obtained in the last 24. There was a significant difference in the amount of sleep obtained between Extraboard (6.8 hours) and Pool (7.5 hours) (t=2.01, df= 1, 255, p<.019). The distribution was not normally distributed, therefore the Mann-Whitney (p<.03) and the Kolmogorov-Smirnov (p<.04) tests were run and these results also indicated a significant difference between the two groups. Number of Shifts Worked. Respondents were asked to report the number of shifts they had worked in the last 24 and 72 hours. Due to the non-normal nature of the distribution, non-parametric tests were used. Results indicated that significant differences were found between Engineers and Conductors on the Mann-Whitney and Kolmogorov-Smirnov (KS) test for shifts worked in the last 24 hours but only the Mann-Whitney was significant for shifts worked in last 72 hours. In other words, Engineers reported working a slightly higher number of shifts than Conductors. This difference was more pronounced for Extraboard as compared to Non-Extraboard or Pool employees (t=-2.3, df=(1,253), p<.021) for 24 hours and 72 hours (t=-3.22, df=(1,253), p<.001), which was confirmed with non-parametric tests as well. Number of Naps and Minutes Napped. Respondents were asked to indicate whether they had napped during the last trip as well as during the last three trips and to report the average number of minutes they had napped. Conflicting results were obtained in that a t-test indicated that there were no differences between groups of Engineers and Conductors or Extraboard and Pool on these measures. While the number of naps in the last three trips was found to be significantly different using the Mann-Whitney test (p<.04). The non-parametric test is probably the more appropriate test under these circumstances. These comparisons are very close and suggest at least a trend towards a difference. Table 4 presents comparisons between Engineers and Conductors on the fatigue instruments in the questionnaire packet. Significant results are highlighted in yellow.
Sherry – 2005 18

San Antonio Fatigue Study
Table 4. Group comparisons on selected measures by Craft.
Craft or Position N Mean
Std. Deviation
t Test p<
Mann Whitney
p< KS p<
1. Epworth Engineer 137 10.1387 4.96337 .65 .56 .99
Conductor 125 9.8560 5.15361
2. Pittsburgh Sleep Quality Engineer 137 8.7132 3.57152 .01 .01 .02
Conductor 125 7.5334 3.56171
3. GHQ-12 Engineer 136 .9305 .55382 .10 .10 .43
Conductor 128 .8202 .52839
4. Work Related Stress Engineer 137 12.5036 4.51814 .03 .02 .14
Conductor 128 11.3047 4.10791
5. Hours of Sleep in Last 24 hrs Engineer 134 7.1604 2.29301 .24 .24 .18
Conductor 123 7.4715 1.92939
6. # Unexpected Calls in Last Week Engineer 130 3.93 3.25 .01 .01 .01
Conductor 119 2.08 2.403
7. Average Hours of Sleep in the Past Week Engineer 130 6.19 1.619 .10 .21 .65
Conductor 114 6.45 1.482
8. # Shifts in Last 24hrs Engineer 132 1.5227 .92022 .11 .03 .03
Conductor 124 1.3427 .86100
9. # Shifts in last 72hrs Engineer 132 3.0076 1.49041 .14 .05 .29
Conductor 123 2.7561 1.18281
10. # Naps Last Trip Engineer 132 1.1894 1.39318 .14 .17 .84
Conductor 121 .9504 1.16083
11. # Naps in Last 3 Trips Engineer 132 3.0606 3.16652 .06 .04 .20
Conductor 122 2.3607 2.66618
12. Average # Minutes Napped Engineer 131 19.8397 24.4297 .76 .41 .94
Conductor 121 21.0083 36.1993
Sherry – 2005 19

San Antonio Fatigue Study
Table 5 presents a similar comparison of Extraboard vs. Pool employees. Significant results are highlighted in yellow.
Table 5. Independent t-tests of selected variables by Assignment (Extraboard
vs. Pool).
Extraboard N Mean Std. Deviation t Test
p<
Mann Whitney
p< KS p<
Epworth No 171 9.4737 4.86683 .020 .03 .29
Yes 91 10.9890 5.16719 Pittsburgh Sleep Quality No 172 15.3663 8.09950 .10 .02 .05
Yes 90 17.1444 8.35122
GHQ-12 No 173 .8650 .55134 .41 .49 .70
Yes 91 .9240 .55106 Work Related Stress No 174 11.8966 4.33439 .61 .72 .64
Yes 91 12.1868 4.57508 Hours of Sleep in Last 24 hrs No 168 7.5060 2.01491 .02 .03 .04
Yes 89 6.8652 2.19344 # Unexpected Calls in Last Week
No 163 2.88 3.331 .14 .02 .27
Yes 86 3.51 2.873 # Shifts Worked in Last 24hrs No 166 1.3434 .91760 .02 .01 .36
Yes 89 1.6124 .81795 # Shifts Worked in Last 72hrs No 166 2.6928 1.31962 .01 .01 .04
Yes 88 3.2500 1.29765
Naps Last Shift No 164 1.0366 1.32411 .56 .31 .71
Yes 89 1.1348 1.22652 # Naps in Last 3 Trips No 164 2.7012 3.11178 .99 .43 .84
Yes 89 2.7079 2.60333 Average Minutes Napped No 162 21.0556 33.33516 .70 .69 .87
Yes 89 19.4944 24.98232
Sherry – 2005 20

San Antonio Fatigue Study
Results of Actigraphy Studies
The use of Actigraphy as a means of determining a person’s level of activity as well as sleep is common practice. The present study sought to determine the amount of sleep obtained by a sample of 40 railroad Engineers and Conductors who were asked to wear actigraphs for a total of 30 days. Actigraph results for the entire sample are displayed in Figure 9. Useable data were obtained for only 33 study participants due to missing data, equipment malfunction, and individual’s decision to withdraw from the study.
Average Daily Hours of Sleep for Study Participants
-
2.00
4.00
6.00
8.00
10.00
12.00
xe40-24
xe40-21re3
5-1
xe40-23
rt41-15
re42-8
xe30-17re3
5-5Xe30
rt32-11
rt30-10
xe30-20re3
5-2
xt30-30re4
2-7
xe40-22
xe30-19re3
5-3
xt40-34
rt32-13
rt45-16
xt30-27
rt32-12
rt41-14
xt30-31re3
5-6
xe40-25
xt30-26
xt30-29
xt40-33
xt40-32
re46-9
xe30-18
Study Participant ID
Hou
rs
Figure 9. Average Daily Hours of Sleep for Study Participants from Actigraphs.
The average amount of sleep per 24 hour period for the entire group of 33 individuals was 6.32±1.68 ranging from a low of 2.75 average hours of sleep per 24 hour period to a high as 10.02 hours of sleep. Using this method then we estimate that as many as 45.5% of the individuals averaged less than 5.93 hours of sleep during the assessment period. The average amount of sleep for the Pool and Extraboard actigraph wearers is listed in Table 6.
Table 6. Actigraph Average Hours of Sleep Descriptive Statistics by Pool or
Extraboard (EB).
Pool or Extraboard # Participants Hours of Sleep Mean (Std Dev)
Engineer-EB (XE40) 5 7.91 (2.13)Houston-Eng (RE42) 2 7.19 (0.71)Del Rio – Cond (RT30) 1 7.03 (--)Laredo-Eng (RE35) 5 6.95 (1.41)Houston-Cond (RT41) 2 6.55 (1.75)Engineer-EB (XE30) 5 6.22 (2.01)Laredo-Cond (RT32) 3 6.12 (1.06)Hearn-Cond (RT45) 1 5.49 (--)Conductor-EB (XT30) 5 5.44 (.84)Conductor-EB (XT40) 3 4.64 (1.15)Hearn-Eng (RE46) 1 3.710 (3.71)
Total 33
Sherry – 2005 21

San Antonio Fatigue Study
Hours of Sleep
0123456789
Engine
er-EB (X
E40)
Houston
-Eng
(RE42
)
Del Rio – C
ond (
RT30)
Lared
o-Eng
(RE35
)
Houston
-Con
d (RT41
)
Engine
er-EB (X
E30)
Lared
o-Cond
(RT32)
Hearn-C
ond (
RT45)
Conduc
tor-E
B (XT30)
Conduc
tor-E
B (XT40)
Hearn-E
ng (RE46
)
Pool or Extraboard
Hou
rs
Figure 10. Average Hours of Sleep for Pool or Extraboard.
Before interpreting Figure 10 please note the sample sizes for the various Pools and Extraboards listed in Table 6. This bar chart indicates that the average amount of sleep obtained by the XT30 (5.45hrs) group is significantly lower (t=2.4,df=8,p<.05) than that of the XE40 (7.90hrs) group. Persons in the XT30/40 Extraboard had an average of about 5 hours of sleep per night in a 30 day period as compared to 7.9 hours of sleep for the Engineer Extraboard XE40 or the Engineer Laredo Pool RE35 (6.9hrs). The RE35 group obtains an amount of sleep, on average, that is consistent with what most workers in the US obtain (NSF, 2005). The average amount of sleep obtained by the RT32, XE30, and RT41 groups are closer to what one would expect from shift workers working a midnight shift. Thus, eight out of eleven work groups were found to obtain amounts of sleep about equal to or less than shift workers in other industries (NSF, 2002). However, RE46, RT45, XT30, and XT40 are lower than 6 hours of sleep per night. Most likely a sleep debt has been built up in these groups.
Individual Profiles
Three individual work schedule profiles, that are representative of the larger group of participants, have been selected for review. The first is the profile of a Conductor on the Extraboard, as can be seen from Figure 11, it is clear that this individual obtained an average of only 4.75±1.87 hours of sleep during the 26 days that this individual wore the actigraph. Please note that while the actual study period was 30 days individual participants wore the actigraphs for a greater or lesser number of days depending on their work schedule. For example, if a person returned to the Kirby Yard office one or two days prior to the end of the study period the individual may have turned in their actigraph at that time. Similarly, in the next two profiles the individual was assigned first one watch, and then a second due to mechanical problems with the actigraph. This individual
Sherry – 2005 22

San Antonio Fatigue Study
wore the first watch for a 14 day period and then a second for a 16 day period. So, in some cases, the actual data profiled may not be a full thirty days. Note that the standard deviation is 1.87 or a little over one and three quarters hours. Thus, the person is occasionally going with as little as 3 hours of sleep or as much as 6.5 hours of sleep. Overall, however, this individual slept less than 6 hours per night 84.6% of the time and 30% of the time he obtained 4 hours of sleep per night or less.
Extraboard ConductorHours of Sleep per 24 hr period
-
2.00
4.00
6.00
8.00
10.00
1 2 3 4 5 6 7 8 9 10 11 12 13 14 15 16 17 18 19 20 21 22 23 24 25 26
Day in Study
Hour
s
Figure 11. Extraboard Conductor #1 Hours of Sleep per day.
Another participant, also an Extraboard Conductor, pictured below, averaged 4.76 hours of sleep with a standard deviation of 2.62. Both of these individuals from the Extraboards would be likely to have a noticeable sleep debt. The participant in Figure 12 paid back a sleep debt on the fourth day of the study, but no evidence of pay back or recuperation is present during the remaining 10 days of the study period. This individual slept less than 6 hours per night 71% of the time and 50% of the time he obtained 4 hours of sleep per night or less.
Extraboard Conductor
Hours of Sleep per 24 hour period
-
2
4
6
8
10
12
1 2 3 4 5 6 7 8 9 10 11 12 13 14
Day in Study
Hour
s
Figure 12. Extraboard Conductor #2 Hours of Sleep per day.
A profile from a Pool Engineer is depicted in figure 13, as can be seen this person slept an average of 6.86±2.35 hrs per 24hr period. Note that despite the higher
Sherry – 2005 23

San Antonio Fatigue Study
average number of hours of sleep, this person has a variability of 2.35 hours. Nevertheless, this person appears to have been able to have repaid his/her sleep debt on several occasions. This individual slept less than 6 hours per night 35% of the time and 20% of the time he obtained less than 4.5 hours of sleep per night.
Pool EngineerHours of Sleep per 24 hour period
0
2
4
6
8
10
12
14
1 2 3 4 5 6 7 8 9 10 11 12 13 14 15 16 17 18 19 20 21 22 23 24 25 26 27 28 29
Day in Study
Hou
rs o
f Sle
ep
Figure 13. Pool Engineer Hours of Sleep per day.
From these data it is apparent that even in a Pool with a higher overall average amount of sleep, there are several occasions where the persons are operating on severely limited amounts of sleep. Moreover, the variability in the amount of sleep, at least for the individuals studied, ranged from a low of 1.8 to a high of 2.6, yielding a range of a 1 ½ hours to 2 ½ hours of sleep variability per day.
Sleep Debt
A sleep debt is thought to occur if a person obtains 6 hours of sleep or less and does not have a full night’s sleep the following day to recover (Van Dongen, Rogers, & Dinges, 2003). In a recent study Van Dongen, Maislin, Mullington, and Dinges, 2003 concluded that, “Since chronic restriction of sleep to 6 h or less per night produced cognitive performance deficits equivalent to up to 2 nights of total sleep deprivation, it appears that even relatively moderate sleep restriction can seriously impair waking neurobehavioral functions in healthy adults”. Examining the 875 work days available in the data collected in the San Antonio study, and the number of days for which persons could have had consecutive nights with less than 6 hours of sleep plus a recovery day we can estimate the amount of time people are operating with a sleep debt and the severity of the sleep debt. This is done by dividing the number of times individuals had sets of consecutive days with less than 6 hours of
Sherry – 2005 24

San Antonio Fatigue Study
sleep by the same number of consecutive days plus a recovery day. The following list shows the results of this analysis:
• 18% of participants went 6 or more days in a row with less than 6 hours of sleep
per day • 6% of participants went 5 days in a row with less than 6 hours of sleep per day • 6% of participants went 4 days in a row with less than 6 hours of sleep per day • 10% of participants went 3 days in a row with less than 6 hours of sleep per day • 13% of participants went 2 days in a row with less than 6 hours of sleep per day You could say then that 40% (40%=18%+6%+6%+10%) of participants had a moderate to severe sleep debt (3 or more days of less than 6 hours sleep). Looking at each individual separately, 67% of the time participants obtained less than 6 hours of sleep per day. This is slightly different, but not inconsistent with, the finding that the average amount of sleep per 24 hour time period was 5.93 and that 45.5% of the individuals obtained less than 6 hours of sleep, because the distribution is skewed. In other words, the average takes into account the high and the low amounts of sleep and determines a point of central tendency. The actual frequency of days that individuals slept less than 6 hours is higher than the percentage of individuals who slept less than an average of 5.93 hours.
Consecutive Days with Less Than 6 hours of Sleep per day
0%
5%
10%
15%
20%
6 or more 5 days 4 days 3 days 2 days
Figure 14. Estimates of Sleep Debt.
Table 7. Percentage of time sleep debt occurred in San Antonio data set.
Sherry – 2005 25

San Antonio Fatigue Study
Consecutive days with 6 hrs sleep or less
Number of times this set occurs
Percentage
6 days <6hrs 22 18% 5 days <6hrs 9 6% 4 days <6hrs 11 6% 3 days <6hrs 21 10% 2 days <6hrs 37 13% # of single days < 6hrs 582 Total Days 875
The number of times that a set of 6 days, with 6 hours of sleep or less occurred was computed in this analysis. Next, the number of times that a series of six days, plus one day for recovery could have occurred in the 875 days available to the study participants was determined (875 ÷7). These two numbers became the numerator and denominator respectively, yielding the ratio: 22/ (875/7) = .18 or 18% with 6 days or more of 6 hours of sleep or less. The denominator is calculated by taking the total number of days (875) and dividing by 7, which is the number of consecutive days of 8hr sleep the person could have obtained plus one for a recovery day. The result is the percentage of time the set of consecutive days of less than six hours of sleep occurred out of the possible sets of consecutive six days plus a recovery day. It is not possible to make definitive statements regarding an employee’s readiness to work or their alertness on the job. To do this it would be necessary to match the specific work schedules and work activities of the employee to a specific day and time. Nevertheless, the data obtained point to the extent to which individuals in this study were active during twenty-four hour after having had little sleep.
Lineup Accuracy
Based on input from labor and management, it was decided that an examination of the accuracy of line-up information would be helpful. Accordingly, during the week that the research team was on site the labor representatives gathered the line-up information for two Pools. Line-up information contains the estimated departure time for a train crew or Pool turn. A Pool turn consists of an Engineer and a Conductor that are assigned to the next available departing train. Typically, a Pool turn assumes responsibility for the train traffic that appears at a terminal.
Engineers and Conductors consult the line-up to determine when they can expect to depart. In addition, they can look at the line up several hours in advance and hope to plan their activities such as eating, sleeping, running errands, and the like.
Sherry – 2005 26

San Antonio Fatigue Study
In addition to line-ups, information was available regarding when the employees actually signed in for duty and began their tour. Such information is then useful in determining when the person actually begins work and departs.
Line-up information was gathered every 4-hours for 28 consecutive hours, and then twice a day for each of the next three days. The data from the line-ups’ estimated departure times were compared to the Engineers’ actual departure times to determine how well Engineers could predict when to sleep and what their schedules would be. The comparisons were based on the estimated departure time of the first train out on the line-up available to the individual at the time they consulted it. Individuals were not matched to specific trains, rather, in our study individuals were expected to take the first train available. Based on this information, the following was determined:
Del Rio • The estimated departure time was exact in one instance, and as far away as 49
hours and 33 minutes in another. • The average estimated departure times ranged from 0:13:00 to 42:30:00. • The estimated departure times were both earlier and later than the times the
Engineers actually left. • The estimated departure time was not consistently more accurate the later it was
checked, indicating that there was little predictability based on the time the line-up was checked.
• The total average difference between actual and estimated departure times was 4:28:13.
• The frequency of the average time differences appears below:
Frequency of Differences between Actual and Estimated Departure Times
Del Rio
0
5
10
15
20
25
30
0:13
:00
4:03
:38
7:54
:16
11:4
4:55
15:3
5:33
19:2
6:11
23:1
6:49
27:0
7:27
30:5
8:05
34:4
8:44
38:3
9:22
Mor
e
Average Time Difference
Freq
uenc
Figure 15. Del Rio Line up Estimates.
Sherry – 2005 27

San Antonio Fatigue Study
Houston • The estimated departure time was as close as 7 minutes in one instance, and as far
away as 21 hours and 10 minutes in another. • The average estimated departure times ranged from 0:27:30 to 20:44:30. • The estimated departure times were both earlier and later than the times the
Engineers actually left. • The estimated departure time was not consistently more accurate the later it was
checked, indicating that there was little predictability based on the time the line-up was checked.
• The total average difference between actual and estimated departure times was 4:36:18.
• The frequency of the average time differences appears below:
Frequency of Differences between Estimated and Actual Departure Time
Houston
0
5
10
15
0:27:3
0
2:29:1
2
4:30:5
4
6:32:3
6
8:34:1
8
10:36
:00
12:37
:42
14:39
:24
16:41
:06
18:42
:48More
Average Time Difference
Freq
uenc
Figure 16. Houston Line-up estimates.
Sherry – 2005 28

San Antonio Fatigue Study
Taylor-Hearne • The estimated departure time was as exact in one instance, and as far away as 15
hours and 20 minutes in another. • The average estimated departure times ranged from 0:15:00 to 13:25:00. • The estimated departure times were both earlier and later than the times the
Engineers actually left. • The estimated departure time was not consistently more accurate the later it was
checked, indicating that there was little predictability based on the time the line-up was checked.
• The total average difference between actual and estimated departure times was 3:15:34.
• The frequency of the average time differences appears below:
Frequency of Difference Between Estimated and Actual Departure Time Taylor-Hearne
0
5
10
15
20
25
0:15
:00
1:20
:50
2:26
:40
3:32
:30
4:38
:20
5:44
:10
6:50
:00
7:55
:50
9:01
:40
10:0
7:30
11:1
3:20
12:1
9:10
Mor
e
Average Time Difference
Freq
uenc
Figure 17. Hearne Line-up estimates.
Sherry – 2005 29

San Antonio Fatigue Study
Laredo • The estimated departure time was as exact in one instance, and as far away as 20
hours and 30 minutes in another. • The average estimated departure times ranged from 0:12:00 to 15:45:00. • The estimated departure times were both earlier and later than the times the
Engineers actually left. • The estimated departure time was not consistently more accurate the later it was
checked, indicating that there was little predictability based on the time the line-up was checked.
• The total average difference between actual and estimated departure times was 2:32:36.
• The frequency of the average time differences appears below:
Frequency of Difference Between Estimated and Actual Departure Time
Laredo
0
5
10
15
20
0:12:0
0
2:08:3
7
4:05:1
5
6:01:5
2
7:58:3
0
9:55:0
7
11:51
:45
13:48
:22More
Average Time Difference
Freq
uenc
Figure 18. Laredo Line-up estimates.
Summary of Line-Up Analyses These analyses indicate that there is substantial variability in the accuracy of the estimated departure times for the four Pools studied. The average difference for the actual and estimated departure times for the Laredo Pool was 2h:32m:36s, for the Taylor-Hearne Pool 3h:15m:34s, for the Del Rio Pool 4h:28m:13s, and for the Houston Pool 4h:36m:18s. Interpreting these differences is speculative at this point. Little comparative data exists for additional analyses. Logic suggests however, that the greater the magnitude of the difference the poorer the prediction. The data from the Del Rio Pool indicates that differences of 7 hours and 54 minutes or more occurred 39% of the time. Data from the Houston Pool indicates that differences of 6 hours and 33 minutes or more
Sherry – 2005 30

San Antonio Fatigue Study
occurred 47% of the time. Data from the Laredo Pool suggests that inaccuracies as large as 4 hours or more occurred 39% of the time. Finally, data from the Taylor-Hearne Pool indicate that inaccuracies of 4:38 hours or more occurred 29% of the time. Clearly, an inaccuracy of more than 5 or 6 hours would make it difficult to plan a days worth of activity. Additional problems occur if these inaccuracies involve shortening the anticipated amount of sleep that could be obtained.
Trip Start Times
Shift start times were looked at for 6 different groups, including both Extraboards and Pools, to see if there were disproportionately more shift starts between the hours of midnight and 5AM. Shift information was collected from 12/17/04 through 2/16/05, for a total of 62 days. If the shift starts were evenly distributed throughout the 24 hour period, 20.83% of the start times would occur between midnight and 5AM.
The lowest percentage of start times between midnight and 5AM occurred on the XE40 Extra Board. There were 1800 total shifts from that board during the 62 days, with 297 of them starting between midnight and 5AM, or 16.50%. This is 4.33% lower than would be expected if the start times were evenly distributed.
The XE30 Extra Board had the next lowest percentage of start times between midnight and 5AM. On this board, there were 1740 total shifts during the 62 days, with 310 of them starting between midnight and 5AM, or 17.82%. This is 3.01% lower than expected if the start times were evenly distributed. .
Of the regular Pools, the Taylor-Hearne Pool, RE46, had the lowest percentage of start times between midnight and 5AM. During the 62 days, there were 1739 total shifts, with 312 of them starting between midnight and 5AM, or 17.94%. This is 2.89% lower than expected if the start times were evenly distributed. .
The Del Rio Pool, RE33, was the only other Pool with a lower percentage of start times between midnight and 5AM than expected. There were 1396 total shifts from that Pool during the 62 days, with 289 of them starting between midnight and 5AM, or 20.70%. This is 0.13% lower than expected if the start times were evenly distributed. .
The Laredo Pool, RE35, had the highest occurrence of shifts starting between midnight and 5AM. During the 62 days, there were 1068 total shifts, with 260 of them starting between midnight and 5AM, or 24.34%. This is 3.51% higher than expected if the start times were evenly distributed. .
Overall, there were 7743 total shifts among all the Pools and Extraboards, with 1468 of them starting between midnight and 5AM, or 18.95%. This is 1.88% lower than expected if the start times were evenly distributed. Therefore, there are not a disproportionately large percentage of shifts starting between midnight and 5AM. In fact, there are slightly fewer start times than would be expected, though it is relatively close to what would be expected if the start times were evenly distributed. During the time data was collected,
Sherry – 2005 31

San Antonio Fatigue Study
the Laredo Pool had the highest chance of a start time between midnight and 5AM, and the two Extraboards had the least chance of starting during those hours.
Focus Groups
A total of six focus groups were held with employees reporting for work during the week that the investigators were on site. The individuals that were selected to participate in the focus groups were chosen on the basis of convenience so as not to disrupt railroad operations. Three weeks later, individual meetings were held with 10 railroad supervisors at various locations in the San Antonio area and similar questions were asked. The individuals participating in the focus groups were not identified and no record was kept of their background or years of experience for confidentiality purposes. However, in order to put their comments in context, they were asked to identify their craft. They were also asked to complete the research questionnaire and sign the consent form. Persons who signed the consent form were invited to participate in the focus group. The format of the focus groups followed the same procedure. Participants were asked five questions. Interviewers took note and listened to their answers. The five questions were:
1. What is your craft? 2. Describe your sleep patterns over the past few weeks. 3. What do you think is the main problem contributing to fatigue /scheduling issues? 4. What needs to be done to change the situation? 5. What are some other factors that might contribute to this problem? The comments obtained are grouped into several themes and presented below. Work Load Focus group participants indicated that they felt that they would work as much as they could. Generally, they reported feeling that “it was a fight to get laid off”. The focus group participants also indicated that there was a feeling that if a person reported being “too tired you might get fired” suggesting that if they reported that they were too tired to work they might be disciplined and laid off. Many of the respondents working as Conductors felt that they were called as soon as their undisturbed rest was over. In reality, one person reported that while he might have eight hours off he might only get 3 or 4 hours of sleep. Several participants reported feeling “overworked” and particularly concerned about “rolling the board” (a practice of calling everyone on the board, regardless of seniority or order of readiness, to find someone willing to take a train). Some individuals, working as Conductors reported being able to get 10 hours undisturbed rest only when they had worked 12 hours or up to the limit imposed by the hours of service. One individual stated that the “frustration level has gotten to the danger point”.
Sherry – 2005 32

San Antonio Fatigue Study
Individuals on some of the boards reported never having their boards “rolled” and of having sufficient time to rest and recover. In addition, several individuals indicated that they were not concerned about fatigue as a problem. They reported that if you “focused on work alone” and didn’t try to do a lot of other things (e.g., social and family life) that there was sufficient time to obtain rest. This was repeated by several different individuals and indicates that some employees are not concerned about fatigue. Thus, comments about fatigue were both pro and con. Despite the remarks of some individuals noted above, others indicated that they were comfortable with the situation and not concerned with fatigue. Thus, the impression that the interviewers formed was that the perception of fatigue problems were not necessarily widespread and may reflect individual preferences and differences.. Causes of Fatigue and Scheduling Problems Many explanations were offered in an effort to explain the current situation. Several people commented on the need for more employees. They acknowledged that the UP had hired a number of people in the last few months but that it still took time to get them trained and ready to work independently. The presence of new hires in the workforce was also described as a source of stress due to the need to supervise the new workers to avoid being injured as a result of mistakes they might make. Another source of fatigue was thought to be the line-ups. Several individuals commented on the fact that the line-ups were inaccurate and that the inaccuracies prevented them from being able to properly plan their rest periods. The comments were such that the line-ups were not updated in a timely fashion and that they contained trains that did not exist. These were common complaints. Another theme that emerged from the comments was the notion that management viewed the employees as “robots” who were expected to work long periods of time without time off for families and social matters. One individual indicated that he had worked for 19 days straight and was having trouble getting time off. Several individuals commented on the fact that fatigue and safety issues were not concerns until the Macdona accident occurred. According to comments that were made the young Conductor that was killed was well-liked and respected and his death was considered a tragedy.
Sherry – 2005 33

San Antonio Fatigue Study
Suggested Remedies The most frequently heard suggestion was the desire that employees could lay off for 10, 12 or even 18-20 hours rest on a request basis. Apparently, the Engineers had a provision in their contract that allowed them to take 10 hours off undisturbed. This was not available to the Conductors at the time we were interviewing the San Antonio employees. The comment was made that “people need to kick more than 12 hours” suggesting that at times it is necessary, after working hard for several days, to take more time off than is available. Regularly scheduled days off was another suggestion. Some people recommended a 7 and 3 work schedule, others a 6 and 4. The desire was to clearly have an alternative to the current situation. One individual commented that it would be desirable to “turn fast and then have a few days off”. The concern that a person “must call in sick to lay off” was heard. Again, the notion of scheduled days off was offered as a remedy to this situation. Apparently, there are some financial incentives that work to increase the likelihood that employees will stay marked up for long periods of time. These incentives require a person to stay marked up for 15 days (on the Extraboard) in order to get a bonus. The suggestion was that if there was an incentive to work weekends or holidays that more people would be available. Again, improving the accuracy of the line-ups was also a major suggestion. One person commented that “even when things change, keep the line-up updated”. Similarly, the need for more employees with better and longer training was also heard from several employees.
Focus Group Summary These comments presented by members of the focus groups appear to be summarized in the following:
1. Some employees are working “on their rest” and thus are not able to obtain their rest.
2. Some employees are not experiencing unusual difficulties and felt that things were acceptable.
3. Some persons reported that the practice of “rolling the boards” created difficulty in obtaining adequate rest.
4. Some persons felt that there was a need for longer lay off periods on request (e.g., 10, 12, or even 18-20 hours undisturbed, as needed). 5. Some persons felt that there was a need for more employees. 6. Some employees reported that the line-ups were inaccurate and prevented them
from be able to adequately plan their rest. 7. Some persons reported a need for longer and more in-depth training of new hires.
Sherry – 2005 34

San Antonio Fatigue Study
8. Some employees suggested that required and planned days off would be very beneficial.
9. Suggestions were made about having a 7 and 3 or a 6 and 4 work period. 10. Some employees indicated that financial pressures prevented them from laying off
even when they were tired.
Discussion
The present study was designed to assess the current level of fatigue in the workforce of Engineers and Conductors in the San Antonio area. Results of these analyses suggest that, on average, the San Antonio workforce was higher than would be expected for a so-called normal population with respect to self-reported sleepiness and significantly more elevated than that found in other similar railroad employee populations. Extraboard employees scored significantly higher on measures of sleepiness and sleep quality compared to Pool respondents. Slightly more than 57% of the Extraboard scored in the Borderline to Clinical range on the ESS as compared to 45% for the Pools. It is not possible to determine the exact cause of this elevation. Interestingly, seven out of eleven work groups were found to obtain amounts of sleep about equal to shift workers in other industries. According to the 2002 “Sleep in America Poll” shift workers average 6.5 hours of sleep in a 24-hour work day period (NSF, 2002) and report more difficulty falling asleep and feeling refreshed upon waking compared to day workers. While these results are based on data obtained from San Antonio work groups (Extraboards and Pools), with varying numbers of participants, it should nevertheless be recognized that some of the work groups are, on average, reporting less than six hours of sleep per 24hr period. However, because this is an average, not all of the San Antonio Engineers and Conductors are experiencing a significant sleep debt. This notion was corroborated by comments from focus group participants. In fact, several comments were obtained which suggested that indeed the Engineers were able to lay off for 10 hours undisturbed rest. At the present time all UTU employees are able to have 10 hours undisturbed rest following a work period. While some of the BLET groups have this option, not all have agreed to it, and discussions are currently underway for all BLET members to have this option. The present results suggest that the 10 hours undisturbed rest period may have contributed to higher levels of average hours of sleep in a 24hr period for some of the work groups. Further, it suggests that the provision of 10 hours undisturbed rest may be a useful counter measure for fatigue. At any rate, it suggests the need for further study of the work groups that are obtaining about the same amount of sleep as shift workers in other industries to determine what may be useful or effective practices in increasing the amount of sleep received.
One possible cause for elevations in sleepiness and fatigue might be high levels of emotional distress, which are often associated with changes in mood and difficulty sleeping. This hypothesis was tested, and there was no indication of an excessive level of emotional distress in this particular workforce as indicated by scores falling within the normal range on the GHQ-12, a standard instrument used for measuring overall emotional distress in other epidemiological studies. Engineers reported a statistically
Sherry – 2005 35
San Antonio Fatigue Study
significant and slightly higher elevation on a measure of work related stress as compared with Conductors. Several participants in the focus groups did mention the death of a fellow employee (i.e. From Macdona) and critical incidents that had occurred. These events were not described specifically but suggest that employees may be experiencing some distress related to the Macdona accident. Further investigation of this possibility may be warranted. Germain, Busse, Shear, Fayyad, & Austin (2004) noted that there is “growing evidence that comorbid sleep disorders including insomnia, nightmares, and sleep disordered breathing are frequent in a significant portion of PTSD [added - post-traumatic stress disorder] patients” (pg. 477). In other words, sleep disturbances and possibly sleep disorders are more likely to occur together in individuals who have had a traumatic experience such as a motor vehicle accident. Moreover, given the fact that the Macdona accident would qualify as a traumatic event, coupled with a perceived increase in safety related incidents in the San Antonio area in the months preceding this study, the possibility of heightened concerns over safety, and a possible increase in PTSD related symptoms associated with the critical incident (i.e., Macdona) may have contributed to sleep difficulties in the work force. Again, no data exists to support this hypothesis, but, further study may be warranted. There was no indication that there were high levels of emotional distress in the overall population, however, PTSD was not the focus of this investigation. A considerable body of research on job stress and emotional exhaustion suggests that the degree of personal control an individual experiences plays a significant role in managing and dealing with job related stress. Theorell & Karasek (1996) have proposed a theory of job control and job decision latitude as significant variables determining ones level of stress and emotional exhaustion. A large scale European study showed a significant relationship between lack of control and increases in coronary heart disease, to the extent that workers in jobs that give them little latitude in decision-making had a 50 percent higher rate of coronary heart disease than those with high job control (Marmot, 1998). Again, these data provide suggestive evidence for the importance of predictability in start times as an important component of psychological and physical health. While we may not be able to establish that there is a direct link between predictability and amount of sleep obtained, there is considerable evidence that lack of perceived control over work related tasks is associated with higher levels of distress which can also lead to feelings of exhaustion and fatigue. Analysis of the actigraph results suggest that participants who wore actigraphs slept less than 6 hours 67% of the time per 24 hr period, as indicated when reviewing each individual actigraph report separately. The study began by distributing 40 actigraphs to participants who consented to participate in the study. Attrition in the study resulted in useable actigraph data for 33 individuals. Comparisons of the actigraph data by Pool or Extraboard revealed that the RT45, RE46, XT30 and XT40 work groups averaged less than six hours of sleep per night during the study period, indicating the likelihood that a sleep debt has built up in these Engineers and Conductors. Examining the actigraphs of three select individuals from work groups obtaining above and below an average of six hours of sleep per night revealed that a participant from the
Sherry – 2005 36

San Antonio Fatigue Study
Conductor’s Extraboard obtained only 4 hours of sleep a day approximately 30% of the time, another participant from the Conductor’s Extraboard slept less than 4 hours per night 50% of the time and a Pool Engineer slept less than 6 hours per night 35% of the time and less than 4.5 hours a night 20% of the time. An analysis of the complete actigraph data indicated that 67% of the time study participants obtained less than 6 hours of sleep per 24 hour period. Furthermore, 18% of the participants went 6 days or more in a row with less than 6 hours of sleep per day.
Data provided by FRA suggest that the Engineer involved in the Macdona accident had worked extensively in the days before the accident and may have developed a sleep debt. Recall that the UP crew had gone on duty at San Antonio at 2:45 a.m. and had been on duty about 2 hours and 18 minutes at the time of the collision. The UP Engineer was off duty for 14 hours and 15 minutes before reporting for work on the day of the accident. The Conductor of the UP train had been off duty for almost 28 hours before reporting for duty. Thus, it is unclear if the off-duty time was used for sleep or other activities. The amount of time off may have permitted the individual to obtain 8 hours of rest. The Engineer may have had time to sleep and from a circadian standpoint would likely have had a physiological inclination to do so between the hours of 10 pm and 1 am. However, if the Engineer fell asleep at 10 pm and received a two hour call at approximately 12:45 a.m. he may not have obtained a full 8 hours rest. It is difficult to determine the answers to these speculations. However, the issue of personal responsibility for properly utilizing off-duty time to obtain rest is of concern here.
The UP health and safety staff provided the research team with brochures and pamphlets that were distributed to railroad employees and railroad supervisors in January of 2003. These materials are well designed and cover such topics as “Good Sleep Habits” and a “Guide to Alertness.” The employee’s ability to utilize this information, support in the work environment to put the information to use and the individual’s willingness to use the information must all be considered as factors that may have contributed to how the individual spent their time before going on duty. Many factors contribute to the degree of fatigue or alertness that a given individual will report at a specific time.
The significance of these findings must be viewed in light of recent studies which have demonstrated that restricted sleep schedules of 6 hours a day over a one week period resulted in significant declines in performance on simple cognitive tasks (Van Dongen, et. al., 2003). The steady decline in cognitive performance associated with restricted sleep raises questions about employee’s alertness and performance capabilities in the workplace. However, due to the fact that performance measures were not included in the study, and no comparable performance data are available, the implications of these results are purely speculative at this time.
Variability in duration of sleep obtained was also assessed for individuals wearing actigraphs. Variability in the amount of sleep obtained, at least for the individuals studied, ranged from a low of 1.8 to a high of 2.6. In other words, variability in average daily amount of sleep obtained ranged from 90 minutes to a little over two and half hours. This variability is of concern due to the likely decrease in quality sleep. Lower sleep
Sherry – 2005 37

San Antonio Fatigue Study
quality has been associated with poorer performance on cognitive tasks (Dinges, Pack, Williams, Gillen, Powell, Ott, Aptowicz, & Pack 1997; Falleti, Maruff, Collie, Darby, & McStephen, 2003; Incalzi, Marra, Salvigni, Petrone, Gemma, Selvaggio, & Mormile, 2004).
Accuracy of line-ups was found to vary considerably. Line up information gathered over a four and a half day period revealed that line-up inaccuracies of almost 8 hours were present in the Houston Pool at least 39% of the time. The most “accurate” line-up predictions occurred in the Taylor-Hearne Pool where inaccuracies of 4h:38m occurred 29% of the time. While there has been no study that has demonstrated that such uncertainty in ones work schedule is related to fatigue it is widely known that a person needs to plan and prepare for work activities, especially those involving safety sensitive tasks. Clearly, planning one’s daily rest and activity would be difficult with these levels of uncertainty. The results also indicated that Engineers reported being called unexpectedly over twice as many times as Conductors and also working more shifts than Conductors. Not surprisingly, this pattern held for the Extraboard as well who report working more shifts than Pool. Clearly, there are some differences between the work groups here which may be contributing to their ability obtain needed rest. Line-up inaccuracies create difficulties for planning rest and sleep, as well as other social activities, and are likely further compounded by the interaction with the individual’s circadian rhythm. Monk & Folkard (1992) note that due to the fact that the circadian rhythms in REM sleep propensity continue to cycle to prior routines, the shift worker is often expected to work and be alert at times when the “circadian system is calling for sleep and asked to sleep when the circadian system is calling for wakefulness” (pg. 11). Thus, when line-ups are inaccurate, the individual must also take into account the fact that even though he or she is aware of the need to be rested at a later time, the body may not be willing to sleep. Consequently, the person, through no willful act, is unable to sleep prior to going on duty. Lengthening the off-duty time may be necessary in some cases, while shortening it may be required in others, to synchronize with the body’s natural sleep and wake cycle. The circadian rhythms also affect the likelihood that a person will be alert at certain times of the day. Accordingly, even though a person has been able to sleep for 8 hours after completing a tour of duty if they are called to report for duty 12 to 16 hours after having slept, they may be at the peak of fatigue levels during the middle and end of their work shift. Data provided by the FRA indicated that the Conductor involved in the Macdona accident worked six (6) tours of duty prior to the accident. These duty periods generally began in the mid-morning and lasted until approximately 22:00h. Most likely the Conductor had adapted to this pattern of working predominantly days and sleeping most likely between midnight and 7am. Such a pattern could very possibly have established a circadian pattern of sleep and wakefulness that would have increased the homeostatic pressure to sleep during times he was expected to perform (i.e. the time of the accident). While the present study did not obtain detailed work histories for all employees in the
Sherry – 2005 38

San Antonio Fatigue Study
San Antonio area, further investigation of the extent to which employees work schedules are in conflict with circadian patterns and homeostatic pressures for sleep could be warranted. Depending on these findings, it may be necessary to adjust the order in which individuals are called for duty to take into account the likelihood that they will be rested and alert during their on-duty periods. Such a practice could go against the traditional seniority system in calling persons for duty. However, a system based on these principles was established and maintained for several years by the Canadian Pacific (CP) at their Calgary location. Sherry (2000) reported that on the CP in Calgary employee work Pools were designed to minimize the likelihood that a person would be working in a time period that was in conflict with the propensity of their natural circadian rhythm to require sleep. So called “Protected Zones” were designed with the intent of minimizing the impact on a person’s natural circadian rhythm. These zones were thought to be the time at which the person would most likely be sleeping and therefore, the most likely time for a person to receive recuperative sleep. Conversely, these zones were also thought to be the times when individuals were most likely to be least alert when on duty and therefore to be avoided if at all possible. To prevent and protect employees from being on duty at a time during which they would usually be sleeping, employees who had not had at least 3 hours of rest during their recuperative period were required to complete their trip prior to the time of the Protected Zone. Thus, the Protected Zone was the time that was established as being the most likely recuperative period for the employee. While these practices may not be entirely feasible in the US, the principles apply and possibly could be modified as general “calling principles.” The present analyses did not find any evidence that railroad start times were disproportionately loaded towards the midnight to 5AM time period. Such a finding could have exacerbated the effects of the restricted sleep schedules that have been mentioned. This is useful information and suggests that indeed the work schedules and start times are distributed fairly evenly across the 24 hour day. Data on napping by Engineers and Conductors suggests that Engineers reported significantly more naps than Conductors (see Table 4). Comments from employees in focus groups suggest that napping does occur on locomotives during duty. The UP health and safety staff reported that policies are in place to permit napping. In addition, written brochures and video tapes that have been presented to the employees discuss the appropriate use of napping as a fatigue countermeasure. However, if the employees are experiencing considerable sleep debts they may need to be encouraged to be more proactive in addressing potential sleep debt through napping. This may be even more important during times of high service demand. While UP has developed a napping policy the need for additional education for labor and management on improving the attitude towards sleep, fatigue, and napping may be needed. Since the UP has expended considerable time and resources in training and education of Train and Engine employees regarding fatigue issues, it may be that the railroad culture will need to be addressed regarding this practice. Training programs for supervisors have identified the signs and symptoms of fatigue. Nevertheless, in some cases managers and supervisors may need to
Sherry – 2005 39

San Antonio Fatigue Study
include the instruction to nap as part of their safety job briefings in order to appropriately guide and direct employees to maintain high levels of alertness. Research has documented the benefits of napping as a means of increasing alertness and cognitive performance following sleep deprivation (Dinges, Whitehouse, Orne, & Orne, 1988; Neri, Oyung, Colletti, Mallis, Tam, & Dinges, 2002). According to UP health and safety staff materials (brochures and videos) concerning napping policies were distributed to supervisors recently. These materials were also sent to the research team. However, further study may be needed on how to increase the likelihood that the napping policy is maintained and used to effectively facilitate alertness and maximize performance.
Study Limitations
This study, like many field studies, has a methodology which, due to the fact that it is not conducted under controlled laboratory conditions, has limitations which prevent generalizations to a wider range of circumstances and conclusions. One major limitation of the current study is the fact that the data collected for the analyses occurred approximately four months after the Macdona accident. Since that time, changes have been made to the railroad operations in San Antonio. There have also been changes in personnel and in the amount of undisturbed time off between work shifts for train and engine employees. Thus, the present results must be interpreted with extreme caution when considering the causes or factors contributing to the occurrence of the accident. There is no causal link between data obtained four months after the accident and the occurrence of the accident. Consequently, attributing causality for the accident from anything determined at such a late date is highly questionable. It should be noted that one of the limitations of this study is the fact that a well defined normative group is not available for comparison. This is a serious limitation of the study in terms of the ability to determine if the conditions observed in San Antonio are significantly different from those in other railroad locations. At the present time the best comparison data available are those from other railroad studies that have been reported in Sherry (2000) as well as other data from the National Sleep Foundation (NSF) on the amount of time that most shift workers sleep. Several comparisons were made with results obtained at other railroad locations. However, the ideal control group would be the San Antonio work force studied over time and monitored repeatedly for changes in average amount of sleep, performance, and safety. Comparisons made over time, with the individuals themselves as controls would offer the best measure of improved or diminished capacity associated with work schedules and fatigue. At the outset of the study it was intended that comparison measures would be obtained from another location on the UP property. However, the availability of a true comparison group is unlikely due to the fact that different conditions, traffic, mileage, etc exist in the various locations across a given railroad. Nevertheless, reparations are underway to begin collecting data on a comparable section of UP rail road that would provide more definite comparisons.
Sherry – 2005 40

San Antonio Fatigue Study
Another limitation of the study is the fact that the amount of sleep reported by the railroad employees both from self report and actigraph data, as well as the level of sleepiness observed on the various self-report measures could be attributable to the presence of un-diagnosed sleep disorders. These conditions could produce similar findings and not be the result of schedule or work patterns.
One other limitation that should be considered when attempting to understand the data and the results of this study concerns the role of individual differences and so-called “outliers.” Recent research has suggested that some individuals are more able to tolerate shift work schedules and sleep deprivation than others (Van Dongen, et. al., 2003). These individual differences contribute to make some people more sensitive than others to the effects of changes in sleep schedules and lack of sleep. The present study made no effort to screen out those persons who were high or low in their ability to tolerate the effects of sleep schedules and sleep restriction or sleep deprivation. The presence of differential degrees of tolerance of the effects of shift schedules and sleep restriction by individuals participating in the study could have contributed to either the inflation of the scores on the sleepiness scales or decreased the average amounts of sleep recorded by certain individuals, or both. Thus, these individual differences could have either inflated the extent to which the data suggest that people are tired or, as is equally likely, the need for less sleep in some individuals could have decreased the average number of hours of sleep reported. These differences may or may not be associated with a performance decrement or other unfavorable consequence. At any rate, the extent of these possibilities are unknown. Consequently, some degree of error could have been introduced into the findings due to these uncertainties.
Conclusions
1. Results of these analyses suggest that, on average, the San Antonio workforce was higher than would be expected for a so-called normal population with respect to self-reported sleepiness.
2. Results of these analyses suggest that, on average, the San Antonio workforce reported a significantly higher mean sleepiness score than Engineers and Conductors in Garrett Indiana or Galesburg Illinois (F(2,470)=5.084, p<.007) on the Epworth Sleepiness Scale. Differences may be due to non-equivalent job demands.
3. Several work groups obtained sleep that was similar to that of shift workers in other industries.
4. There was no indication that there was an excessive level of emotional distress in this particular workforce, which may have accounted for these higher levels of sleepiness, when using a standard instrument that has been used in other studies. However, some evidence suggests that Engineers experience higher levels of work-related stress as compared to Conductors.
5. Results of actigraph studies suggest that 67% of the time persons slept less than 6 hours per 24 hour period.
6. Study participants worked 6 days or more in a row with less than 6 hours of sleep per day 18% of the time.
Sherry – 2005 41

San Antonio Fatigue Study
7. Selected individuals in various Pools were found to sleep less than 4 hours per night 50% of the time that they were in the study.
8. Variability in average amount of daily sleep obtained ranged from 1 ½ to 2 ½ hours.
9. Average differences in estimated versus actual departure time of almost 8 hours were present in the Houston Pool almost 39% of the time.
10. There was no evidence that trip start times occurred disproportionately between the hours of 12 midnight and 5AM.
Recommendations
1. Data suggest that a majority of participants obtain an average of 6.3 ± 1.68 hours
of sleep per 24 hour period. In other words, on the whole, the group obtains the amount of sleep that most shift workers in the US obtain (NSF, 2005). For example, the Engineer Extraboard (XE40) obtained on the average 7.91 hours of sleep and the Laredo Engineer Pool (RE35) obtained on the average 6.95 hours of sleep. Therefore, some of the work schedules and work arrangements in San Antonio are comparable to the rest of the US work force and would appear to be adequate. The 10 hours undisturbed rest afforded the Engineers appears to work well and seems to have provided them with sufficient time to average closer to 8 hours of sleep per 24hr period. Thus, the fact that not all of the work groups were below 6 hours of sleep per 24hr period suggests that practices in these operations may need to be emulated in other locations. These work schedules and arrangements should be studied and maintained.
2. Several work groups appear to be well below what is commonly recognized as an adequate amount of sleep. Conductors working on the Extraboards are averaging less than 6 hours of sleep per 24 hour period. These short (8hr) rest periods, when the person is called back to work immediately upon being rested, do not permit even the most limited attention to family, health, and social needs not to mention commute time. Opportunities to increase the amount of sleep obtained should be increased. Comments from study participants’ indicated a desire for periods of 10 hours undisturbed rest, if not greater.
3. Many railroads have adopted a napping policy for employees on duty. Due to the high degree of sleep restriction being observed in the San Antonio population it is recommended that a more aggressive effort to encourage employees to nap may be needed. In other words, supervisors and dispatchers may need to be more proactive in advising employees of times when it is a good idea to nap. Given the railroad culture, which was noted in focus group comments, railroad employees may be reluctant to utilize napping opportunities. Supervisors may need to include instructions for napping in job briefings. For example, dispatchers are in a unique position to know that a crew will be placed in a siding. The dispatcher and supervisors should advise crews in advance of times for 30 – 40 minute naps and encourage them to use those opportunities.
Sherry – 2005 42

San Antonio Fatigue Study
4. The work schedule data suggest that a large number of employees are working several consecutive work days which may limit the opportunity to recover from sleep debts. While this is certainly needed in some emergency situations there may be a need to monitor the maximum number of days that an employee would be able to work getting less than 6 hours of sleep per night. The best research available at this point (Van Dongen, et. al. 2003) suggests that three days in a row obtaining less than five hours of sleep per night reduces a persons cognitive performance by over 10%, and over a period of four days, cognitive performance is decreased by over 15% from baseline. As mentioned above, 18% went 6 or more days with less than 6 hours of sleep, 6% went 5 days with less than 6 hours, and 6% went 4 days with less than 6 hours of sleep. Therefore, efforts should be made to limit the number of consecutive days that an employee works under a restricted sleep regimen.
5. Adequate recovery time from sleep debt should be included in a work schedule. For example, persons working 4 or 5 consecutive 12 hour shifts may need to have a definite number of days off to recover from restricted sleep. One good example is the BNSF overlay program of 7 days on with 3 optional days off. This program could be optimized to include mandatory days off. However, the 7-3 schedule would work if the individual was able to obtain at least 6 hours of sleep per 24 hour period. If the individual goes below 6 hours of sleep per 24 hours, then the 3 days off might need to occur earlier – it might be useful to use a 6 and 2 or 5 and 2 schedule under these circumstances.
6. Additional resources may need to be made available for employees to be able to rest/sleep in the locomotive cabs. Special equipment, such as reclining cab seats, could increase the likelihood that crews can obtain high quality rest if the opportunity arrives. For example, when crews have exceeded the hours of service, but have not been relieved from the train, opportunities and facilities for sleeping may be needed.
7. Supervisors and employees have received educational materials and videos on the topic of fatigue, sleep hygiene, and napping, however, efforts to educate managers and supervisors of train engine and yard employees as to the risks associated with sleep deprivation, restricted sleep, and sleep debt need to increase. While most supervisors have first hand experience with the conditions associated with shift work, knowledge of the scientific validity of commonly held assumptions and beliefs may be in need of continued reinforcement and clarification. Supervisors, crew managers, dispatchers, and human resources professionals may require more in-depth information in order to make more informed decisions. Stronger efforts to change the railroad culture may take considerable time and even more effort. Additional efforts to educate top-level, middle, and first line managers could contribute to changing perceptions of employees who may erroneously fear that they may be “fired for being tired.” Perhaps efforts to educate top level government and labor officials in these areas would also contribute, albeit indirectly, to wide-spread understanding and eventual acceptance of the issues.
8. Training, education, and information on an individual’s likely cognitive performance and alertness at a specific point in time are needed for train crews to make the best decisions on obtaining sleep and rest. Training and education
Sherry – 2005 43

San Antonio Fatigue Study
programs for operating crafts need to continue. However, most have already been exposed to the general sleep hygiene material. The question that remains is; “What can be done to help railroad employees make better decisions about how to use their time off productively and to the best advantage from a safety and fatigue perspective”? Continued efforts by supervisors to monitor employees for the signs of fatigue and the development of technological aides (e.g. Performance feedback actigraphs) are needed to ensure that employees are given the best tools possible to make good decisions about getting rest and preparing for work. Consequently, more specific information about cognitive and physiological readiness may be needed to increase employees ability utilize opportunities for rest and to take thoughtful preventative actions to counteract the effects of fatigue. Logical decision making is impaired when individuals are sleep deprived. Thus, the effects of education may be limited when employees are sleep deprived. The continued development of technological aids that can assist employees in making productive decisions in sleep deprived conditions may be needed. The use of Performance Actigraphs or other methods of providing real time estimates of cognitive functioning would alert individuals to potential high risk situations likely to result if adequate sleep and rest were not obtained (Sherry, Philbrick, & Szylowicz, 2004). While problematic, the fact that both rail labor (i.e. Conductors and Engineers) and railroad supervisors may choose monetary rewards or productivity over obtaining sleep could perhaps be counteracted by a technological aid.
9. Further study of the line-up information is needed. While it may not be practical to improve this information at this time it should be acknowledged that the large discrepancies between anticipated and actual departure times create additional challenges for the work force. Developing a set of decision rules that can be used to decide whether or not a person should be allowed to work may need to be put in place. A menu of rules that can be followed when selecting individuals for work should be developed. Specifically, the following may be needed:
a. A person is rested and ready for duty if all of the following are present: i. The person has had at least 6 hours of sleep in the past 24 hours.
ii. The beginning of the work shift is not at the end of a 24 hour period in which the person obtained 6 hours of sleep or less.
iii. The person who is being called for work has had a sufficient opportunity to obtain rest prior to the start of the work shift such that they are expected to work into a period of time where they will have been awake more than 19 hours.
iv. The person being called for work is not expected to work into a period of time where they would have been awake for more than 20 hours without obtaining the necessary 6 hours of sleep in a 24 hour period.
10. Decisions on calling people who are rested and available for work (“rolling the board”) should be based on the rules listed in item #9. Decision rules that take into account the effects of time of day and circadian rhythms needs to be incorporated into decisions to call and accept employees for duty. Readiness for duty can not be determined simply by the amount of time off an employee has
Sherry – 2005 44

San Antonio Fatigue Study
had. Considerations for the employee’s level of alertness throughout the duty period must be considered. A good example of the attempt to incorporate these facts into crew calling are those that were put in place in the original CANALERT project and then modified for more practical application on the Canadian Pacific in Calgary (as discussed in Sherry, 2000).
11. Further investigation of the impact of work stress and critical incidents on fatigue and alertness needs to be examined. Conversations with employees in focus groups suggest that there was little awareness of the impact of critical incidents on psychological functioning and sleep disorders. This is not surprising due to the fact that only recently have researchers begun to report on these relationships. Nevertheless, in a high service demand situation with a fatality and additional safety concerns the interaction between stress and fatigue may be more pronounced. While speculative, this possibility warrants further consideration. At the very least, training and education efforts to address the possible symptoms and their effect on sleep may be needed.
12. Additional longitudinal measurements on sleep, fatigue, and napping of the San Antonio workforce are needed to draw firm conclusions on the impact of work/rest cycles on safety and performance. Without a properly designed longitudinal study monitoring the same individuals over time it will be difficult to determine if work/rest and operating practices changes (i.e. 10 hours undisturbed) have actually had the desired effect. The ideal control group would be the San Antonio work force studied over time and monitored repeatedly for changes in average amount of sleep, performance, and safety. Comparisons made over time, with the individuals themselves as controls, would offer the best measure of improved or diminished capacity associated with work schedules and fatigue.
Sherry – 2005 45

San Antonio Fatigue Study
Glossary of Terms and Acronyms
1. Boxplot: A boxplot plots the 25th percentile, the median (the 50th percentile), the 75th percentile, and outlying or extreme values. The length of the box represents the difference between the 25th and 75th percentiles. The horizontal line inside the box represents the median. The “Whiskers” are lines drawn from the ends of the box to the largest and smallest values that are not outliers. The extreme values are cases with the values more than 3 box-lengths from the 75th percentile or 25th percentile. The larger the box, the greater the spread of the data
2. Electroencephalogram (EEG): A recording of electrical signals from the brain made by hooking up electrodes to the subjects scalp. EEGs allow researchers to follow electrical impulses across the surface of the brain and observe changes over split seconds of time. In sleep studies, the EEG allows a researcher to determine how stages of sleep change during the night.
3. Electrooculogram (EOG): Movement of the eye which allows a researcher to distinguish REM (rapid eye movement) sleep from non REM sleep using electrodes placed around the eyes.
4. Epworth Sleepiness Scale (ESS): An instrument used to help determine the
likelihood of falling asleep in certain situations. Scores can be used to help an individual determine if he or she needs to seek the advice of a sleep specialist.
5. General Health Questionnaire (GHQ-12): An instrument used to assess levels
of depression, anxiety, sleep disturbance, and happiness. 6. Multiple Sleep latency Test (MSLT): A series of recordings to monitor a
person’s sleep patterns. Electrodes are placed on the face and head to record eye movement, muscle tone, and brain waves. An MSLT is used to evaluate excessive daytime sleepiness and narcolepsy (sudden and uncontrollable onsets of sleep).
7. Obstructive Sleep Apnea (OSA): A disorder in which a person experiences
recurrent episodes during sleep when their throat closes and they cannot suck air into their lungs (apnea).
8. Pittsburgh Sleep Quality Index (PSQI): A self rated instrument used to provide
a brief, clinically useful assessment of a variety of sleep disturbances that might affect sleep quality. The PSQI differentiates “poor” from “good” sleep by measuring seven areas: subjective sleep quality, sleep latency, sleep duration, habitual sleep efficiency, sleep disturbances, use of sleep medication, and daytime dysfunction over the last month.
Sherry – 2005 46

San Antonio Fatigue Study
9. Rapid Eye Movement (REM): A mentally active period during which dreams occur. REM gives scientists a marker for changes in the brain during sleep.
10. Stanford Sleepiness Scale (SSS): Rates an individual’s perception of sleepiness
during the day on a scale from 1 to 7. A rating of one means the person is fully alert, while a rating of 7 means he or she is struggling to stay awake.
Sherry – 2005 47

San Antonio Fatigue Study
References
1. Adlaf, E.M., Gliksman, L., Demers, A., & Newton-Taylor, B. (2001). The
prevalence of elevated psychological distress among Canadian undergraduates: Findings from the 1998 Canadian Campus Survey. Journal of American College Health, 50 (2), 67.
2. Åhsberg, E. (2000). Dimensions of fatigue in different working populations. Scandinavian Journal of Psychology, 41, 231-241.
3. Alloway, C.E. (2002). Self-report sleepiness measures, objective sleepiness measures and simulated driving performance in controls and patients with obstructive sleep apnea. Dissertation Abstracts International;: Section B: The Sciences and Engineering, 63(6-B), 3057.
4. Bloch, K.E., Schoch, O.D., Zhang, J.N, Russi, R.W. (1999). German Version of the Epworth Sleepiness Scale. Respiration, 66:440-447.
5. Buysse, D.J., Reynolds, C.F. Monk, T.H., Berman, S.R.,& Kupfer, D.J. (1989). The Pittsburgh Sleep Quality Index: a new instrument for psychiatric practice and research. Psychiatry Res, 28, 193–213.
6. Cole, R.J., Kripke, D.F., Gruen, W.F., Mullaney, D.J., & Gillin, J.C. (1992). Automatic sleep/wake identification from wrist activity. Sleep,15, 461-469.
7. Dinges, D.F., Pack, F., Williams, K., Gillen, K.A., Powell, J.A., Ott, G.E., Aptowicz, C., & Pack, A. (1997). Cumulative sleepiness, mood disturbance and psychomotor vigilance performance decrements during a week of sleep restricted to 4-5 hours per night. Sleep, 20(4), 267-277.
8. Dinges, D. F.; Whitehouse, W. G.; Orne, E. C.; Orne, M. T. (1988). The benefits of a nap during prolonged work and wakefulness. Work & Stress, 2, 139-153.
9. Falleti, M.G., Maruff, P., Collie, A., Darby, D.G., & McStephen, M. (2003). Qualitative similarities in cognitive impairment associated with 24h of sustained wakefulness and a blood alcohol concentration of 0.05%. Journal of Sleep Research, 12(4), 265-274.
10. Fichtenberg, N.L., Putnam, S.H., Mann, N.R., Zafonte, R.D., & Millard, A. (2001). Insomnia screening in post acute traumatic brain injury: Utility and validity of the Pittsburgh Sleep Quality Index. American Journal of Phyl Med Rehabilitation, 80, 339-45.
11. GAO, (1992). Railroad safety: Engineer work shift length and schedule variability. US Government Accounting Office (GAO/RCED-92-133, Apr. 20, 1992).
12. Germain, A., Buysse, D. J., Shear, M. K., Fayyad, R., & Austin, C. (2004). Clinical correlates of poor sleep quality in posttraumatic stress disorder. Journal of Traumatic Stress, 17, 477-484.
13. Goldberg, D. P. (1972). The detection of psychiatric illness by questionnaire (Maudsley Monograph No. 21). Oxford, England: Oxford University Press.
14. Hall, J. (1998). Remarks of Jim Hall, Chairman National Transportation Safety Board before the Association of American Railroads Damage Prevention and Freight Claim Committee Washington, D.C., July 8, 1998. http://www.ntsb.gov/speeches/former/hall/jh980708.htm
Sherry – 2005 48

San Antonio Fatigue Study
15. Hardy, G. E., Shapiro, D. A., Haynes, C. E., & Rick, J. E. (1999). Validation of the General Health Questionnaire-12: Using a sample of employees from England's health care services. Psychological Assessment, 11, 159-165.
16. Harrison, S., Smith, A., & Sykes, R. (2002). Residential rehabilitation courses in the self-directed management of chronic fatigue syndrome: A preliminary evaluation. Journal of Chronic Fatigue Syndrome, 10(2), 59-65.
17. Hoddes, E., Zarcone, V., Smythe, H., Phillips, R., & Dement, W.C. (1973). Quantification of sleepiness: A new approach. Psychophysiology;10, 431-436.
18. Howell, A.J., Jahrig, J.C., & Powell, R.A. (2004). Sleep quality, sleep propensity, and academic performance. Perceptual & Motor Skills, 99(2),525-535.
19. Incalzi, R.A., Marra, C., Salvigni, B.L., Petrone, A., Gemma, A., Selvaggio, D., & Mormile, F. (2004). Does cognitive dysfunction conform to a distinctive pattern in obstructive sleep apnea syndrome. Journal of Sleep Research, 13(1), 79-86.
20. Johns, M. W. (1991). A new method for measuring daytime sleepiness: The Eppworth sleepiness scale. Sleep,1(14), 540-545.
21. Johns, M.W. (1993). Daytime sleepiness, snoring, and obstructive sleep apnea. The Epworth Sleepiness Scale. Chest,103, 30-36.
22. Kilkenny, T.M., Hajjar, A., Zyadeh, N., & Chaftari, P. (1999). The usefulness of the Epworth Sleepiness Scores alone as a preditor of sleep study outcomes. Chest,116 (4), 391.
23. Korszun, A., Young, E.A., Engleberg, N.C., Brucksch, C.B., Greden, J.F., & Crofford, L.A. (2002). Use of actigraphy for morning sleep and activity levels in patients with fibromyalgia and depression. Journal of Psychosomatic Research, 52(6), 439-443.
24. Kotterba, S., Mueller, N., Leidag, M., Widdig, W., Rasche, K., Malin, J., Schultze-Werninghaus, G., & Orth, M. (2004). Comparison of driving simulator performance and neuropsychological testing in Narcolepsy. Clinical Neurology & Neurosurgery, 196(4), 275-279.
25. McNair, D. M., & Lorr, M. (1964). An analysis of mood in neurotics. Journal of Abnormal and Social Psychology,69, 620–627.
26. McNair, D. M., Lorr, M., & Droppleman, L. F. (1971).Manual for the Profile of Mood States (POMS). San Diego, CA: Educational and Industrial Testing Service.
27. Marmot, MG. (1998). "Improvement of Social Environment to Improve Health." Lancet, 331: 57-60
28. Maslach, C., & Jackson, S. E. (1984). Burnout in organizational settings. Applied Social Psychology Annual, 5, 133-153.
29. Michielsen, H. J.; De Vries, J.; Van Heck, G. L.; Van de Vijver, F. J.R.; Sijtsma, K. (2004). Examination of the Dimensionality of Fatigue: The Construction of the Fatigue Assessment Scale (FAS). European Journal of Psychological Assessment, 20, 39-48.
30. Monk, T., & Folkard, S. (1992). Making Shiftwork Tolerable. London: Taylor and Francis.
Sherry – 2005 49

San Antonio Fatigue Study
31. Neri, D. F.; Oyung, R. L.; Colletti, L. M.; Mallis, M. M.; Tam, P. Y.; Dinges, D. F. (2002). Controlled breaks as a fatigue countermeasure on the flight deck. Aviation, Space, & Environmental Medicine, 73, 654-664.
32. NSF (2002). 2005: Sleep in America Poll. National Sleep Foundation, www.sleepfoundation.org.
33. NSF (2005). 2005: Sleep in America Poll. National Sleep Foundation, www.sleepfoundation.org.
34. Papp, K.K., Stoller, E.P., Sage, P., Aikens, J,.E., Owens, J., Avidan, A., Phillips, B., Rosen, R., & Strohl, K.P. (2004). The effects of sleep loss and fatigue on resident-physicians: A multi-institutional, mixed-method study. Academic Medicine, 79(5), 394-406.
35. Rodrigues, R.N., Viegas, C.A., Abreu, A., & Tavares, P. (2002). Daytime sleepiness and academic performance in medical students. Arquivos de Neuro-Psiquiatria, 60(1), 6-11.
36. Sadeh, A., Raviv, A., & Gruber, R. (2000). Sleep patterns and sleep disruptions in school age children. Developmental Psychology, 36, 3, 291-301.
37. Sadeh, A., Acebo, C., Seifer, R., Aytur, S., & Carskadon, M.A. (1995). Activity-based assessment of sleep–wake patterns during the first year of life. Infant Behavior and Development, 18, 329-337.
38. Sadeh, A., Alster, J., Urbach, D., & Lavie, P. (1989). Actigraphically based automatic bedtime sleep–wake scoring: Validity and clinical applications. Journal of Ambulatory Monitoring, 2, 209-216.
39. Sadeh, A., Hauri, P., Kripke, D., & Lavie, P. (1995). The role of actigraphy in sleep medicine. Sleep, 18, 288-302.
40. Sadeh, A., Lavie, P., Scher, A., Tirosh, E., & Epstein, R. (1991). Actigraphic home-monitoring of sleep-disturbed and control infants and young children: A new method for pediatric assessment of sleep–wake patterns. Pediatrics, 87, 494-499.
41. Sadeh, A., Sharkey, K., & Carskadon, M. A. (1994). Activity-based sleep–wake identification: An empirical study of methodological issues. Sleep, 17, 201-207.
42. Sherry, P. (2000). Fatigue and job stress countermeasures in the railroad industry: Past and current status. Monograph published by the American Association of Railroads.
43. Sherry, P. (2003). Fatigue in transportation. Clinics in Occupational and Environmental Medicine, 3, 131-148.
44. Sherry, P., Philbrick, K, & Szyliowicz, J. (2004). Individualized feedback on fatigue related performance effectiveness using Ambulatory Wrist Monitoring Actigraphy. In V. Thamizh Arasan (Ed.), Transportation Systems Planning and Operation, Vol II, (pp. 263-273). Chennai, India: Allied Publishers Pvt., Ltd.
45. Shin, C., Kim, J., Lee, S., Ahn, Y., & Joo, S. (2003). Sleep habits, excessive daytime sleepiness and school performance in high school students. Psychiatry & Clinical Neurosciences, 57 (4), 451-453.
46. Thayer, R.E. (1967). Measurement of activation through self-report. Psychological Reports,20, 663-668.
Sherry – 2005 50

San Antonio Fatigue Study
47. Thayer, R. E. (1978). Factor analytic and reliability studies on the Activation-Deactivation Adjective Check List. Psychological Reports, 42, 747-756.
48. Theorell, T.; Karasek, R. A. (1996). Current issues relating to psychosocial job strain and cardiovascular disease research. Journal of Occupational Health Psychology, 1, 9-26.
49. Thorpy M.J. (1992). The clinical use of the multiple sleep latency test: The Standards of Practice Committee of the American Sleep Disorders Association. Sleep,15(3), 268-276.
50. Van Dongen, H. P., Maislin, G., Mullington, J. M., & Dinges, D. F. (2003). The cumulative cost of additional wakefulness: Dose-response effects on neurobehavioral functions and sleep physiology from chronic sleep restriction and total sleep deprivation. Sleep: Journal of Sleep & Sleep Disorders Research, 26, 117-126.
51. Van Dongen, H. P., Rogers, N.L., & Dinges, D. F. (2003). Sleep debt: Theoretical and empirical issues. Sleep and Biological Rhythms, 1, 1, 5.
Sherry – 2005 51


![[3] Fatigue on engine pistons – A compendium of case studies](https://img.pdfslide.us/doc/110x75/5530cccf55034681738b487d/3-fatigue-on-engine-pistons-a-compendium-of-case-studies.jpg)