Embed Size (px)
Citation preview
Final Report of the Study of Increasing
and Declining Enrollment in Maryland Public Schools
Prepared for
Maryland State Department of Education
By
William Hartman & Robert Schoch
Education Finance Decisions
Submitted by APA Consulting
Revised November 16, 2015
Final Report of the Study of Increasing and Declining Enrollment in Maryland Public Schools
i
The Maryland General Assembly enacted Chapter 288, Acts of 2002 – the Bridge to Excellence in Public Schools Act, which established new primary state education aid formulas based on adequacy cost studies using the professional judgment and successful schools methods and other education finance analyses that were conducted in 2000 and 2001 under the purview of the Commission on Education Finance, Equity and Excellence. State funding to implement the Bridge to Excellence Act was phased in over six years, reaching full implementation in fiscal year 2008. Chapter 288 required a follow up study of the adequacy of education funding in the State to be undertaken approximately 10 years after its enactment. The study must include, at a minimum, adequacy cost studies that identify a base funding level for students without special needs and per pupil weights for students with special needs to be applied to the base funding level, and an analysis of the effects of concentrations of poverty on adequacy targets. The adequacy cost study will be based on the Maryland College and Career-Ready Standards (MCCRS) adopted by the State Board of Education and will include two years of results from new state assessments aligned with the standards, which are scheduled to be administered beginning in the 2014-2015 school year.
There are several additional components mandated to be included in the study. These components include evaluations of the following: the impact of school size, the Supplemental Grants program, the use of Free and Reduced-Price Meal eligibility as the proxy for identifying economic disadvantage, the federal Community Eligibility Program in Maryland, prekindergarten services and funding, the current wealth calculation, and the impact of increasing and decreasing enrollment on local school systems. The study must also include an update of the Maryland Geographic Cost of Education Index.
APA Consulting (APA), in partnership with Picus, Odden and Associates (POA), and the Maryland Equity Project (MEP) at the University of Maryland, will submit a final report to the State no later than October 31, 2016.
This report, required under Section 3.2.3.4 of the Request for Proposals (RFP R00R4402342), presents the findings of the study on increasing and decreasing enrollment. This report examines the impacts of changing enrollment in local Maryland school systems. The scope of the study includes analysis of enrollment trends and their relationship to local school system characteristics, and transportation and operational costs. Transportation was singled out for additional study to evaluate the transportation costs in conjunction with the numbers and types of students served, operating characteristics, and state funding.
Suggested Citation: Hartman, W. & Schoch, R. (2015). Final Report of the Study of Increasing and Declining Enrollment in Maryland Public Schools. Denver, CO: APA Consulting.
Final Report of the Study of Increasing and Declining Enrollment in Maryland Public Schools
ii
Contents
Introduction .................................................................................................................................................. 1
Methodology ................................................................................................................................................. 1
Enrollment Change ....................................................................................................................................... 2
Trends in Total Enrollment Over the Past 10 Years .................................................................................. 2
Trends in Grade-Level Enrollment ............................................................................................................ 7
Prekindergarten Enrollment ................................................................................................................. 7
Kindergarten Enrollment ...................................................................................................................... 8
Grades One through Six Enrollment ..................................................................................................... 9
Grades Seven through 12 Enrollment ................................................................................................... 9
Projected Enrollment Over the Next 10 Years .......................................................................................... 9
District Enrollment .................................................................................................................................. 10
Birth Rates and Kindergarten and Grade One Enrollment ..................................................................... 11
Trends in Special Program Enrollment .................................................................................................... 14
Special Education ................................................................................................................................ 15
English Language Learners .................................................................................................................. 16
Title I Program ..................................................................................................................................... 17
Conclusions from Enrollment Data Analysis ........................................................................................... 18
Recommendations on Enrollment Data and Analysis ............................................................................. 19
Change in Operating Factors ....................................................................................................................... 19
Changes in the Number of Schools ......................................................................................................... 19
Conclusions on Changes in the Number of Schools ............................................................................ 23
Recommendations on Changes in the Number of Schools ................................................................. 24
Changes in the Number of Staff .............................................................................................................. 24
Instructional Staff ................................................................................................................................ 24
Non-Instructional Staff ........................................................................................................................ 26
Final Report of the Study of Increasing and Declining Enrollment in Maryland Public Schools
iii
Conclusions on Changes in the Number of Staff .................................................................................... 28
Recommendations on Changes in the Number of Staff ......................................................................... 29
Transportation ............................................................................................................................................ 29
Number of Pupils Transported ................................................................................................................ 29
Transportation Costs ............................................................................................................................... 31
Implications of Enrollment Change on the State Transportation Subsidy .............................................. 34
Conclusions from Transportation Data Analysis ..................................................................................... 41
Transportation Subsidy Analysis ................................................................................................................. 42
Maryland’s Current Transportation Funding System ............................................................................. 42
Transportation Funding in Other States ................................................................................................. 42
Determining Eligibility for School Transportation Funding ..................................................................... 43
Reimbursement Levels ............................................................................................................................ 43
Population Density and Sparsity ............................................................................................................. 44
Promoting Efficiency ............................................................................................................................... 44
Impact of Local School System Policies/Guidelines ................................................................................ 44
Number of transportation-eligible students. ...................................................................................... 44
Maximum ride time. ........................................................................................................................... 44
Seating capacity. ................................................................................................................................. 45
Door-side-only stops. .......................................................................................................................... 45
Routing buses based on ridership. ...................................................................................................... 45
Conclusions on Transportation Funding and Operations ....................................................................... 48
Recommendations on Transportation Funding and Operations ............................................................ 48
Adjusting to Changing Enrollment .............................................................................................................. 49
Fixed and Variable Costs ......................................................................................................................... 49
Conclusions for Enrollment Changes, Operating Costs, and Funding Formulas ........................................ 52
Final Report of the Study of Increasing and Declining Enrollment in Maryland Public Schools
iv
Enrollment Changes ................................................................................................................................ 52
Operating Costs ....................................................................................................................................... 52
Funding Formulas .................................................................................................................................... 52
Recommendations ...................................................................................................................................... 53
Enrollment Change ................................................................................................................................. 53
Operating Costs ....................................................................................................................................... 53
Funding Formulas .................................................................................................................................... 53
General Education Foundation Formula ............................................................................................. 53
Student Transportation Funding Formula .......................................................................................... 54
Summary Conclusion .................................................................................................................................. 55
Appendix: Data Tables ................................................................................................................................ 57
Final Report of the Study of Increasing and Declining Enrollment in Maryland Public Schools
1
Introduction The purpose of this study is to review the effects of enrollment changes on district operations in Maryland. This study includes analyses of various aspects of district operations:
• enrollment trends, by grade level and special program type;
• transportation trends, including characteristics of students being transported, district transportation system operating features, and costs to transport students;
• trends in district operating cost factors such as the number of schools and staff;
• relationship of enrollment changes on transportation operations and expenditures, and on key district operating factors; and
• recommendations for improvements in general education and student transportation subsidies for districts with decreasing enrollment.
Methodology The analyses described in this report are derived from numerous datasets provided by the Maryland State Department of Education (MSDE) for the period from 2005 to 2014. The research team obtained additional enrollment and demographic information from the Maryland Department of Planning’s Public School Enrollment Report (September, 2014)1.
The research team carried out multiple analyses to examine enrollment trends from 2004-05 to 2013-14. The team examined enrollment changes over time at the district and state levels, both in terms of the numbers of students served and in terms of percentage changes in enrollment numbers. The team also performed analyses of enrollment across grade-level groupings ranging from prekindergarten to grades 7-12 and for several different program populations: special education program students, English Language Learners (ELL), and students served by Title I programs (participation in Title I programs is used as a measure of poverty in this report).
The research team also analyzed the relationship between enrollment and other district operating areas and examined the effects of enrollment changes on some of the key drivers of costs in districts, including the number of schools by level and the number of staff by type of position (both instructional and non-instructional). Particular attention was paid to the results for small enrollment but geographically large districts.
To illustrate the impact of enrollment changes on district operations and efficiencies, the team developed a descriptive cost model at the school level to accompany the analytical results. This model presents fixed and variable costs to demonstrate which of the cost elements in a school remain constant amidst
1 Maryland Department of Planning. (2014). Public School Enrollment Projections 2014-2023. Baltimore, MD: Author
Final Report of the Study of Increasing and Declining Enrollment in Maryland Public Schools
2
reasonable enrollment changes and which may change in response to changes in enrollment. The model provides a useful tool to help state and district decision makers to understand the interactions between enrollment changes and resource levels in schools and the options available to administrators in responding to changing enrollment. Examples are also provided to demonstrate the fixed and variable costs of district level functions, such as transportation, and district level decisions such as the closing of schools.
This study also included a review of public school transportation in the state, focusing on factors (e.g. number of students transported and miles traveled) influencing transportation operations, costs, and levels of state funding. The analysis examined transportation for general education students as well as for students with special transportation needs (e.g. disabled students). The analysis also looked at a variety of district transportation operating practices and other factors influencing transportation costs. The research team conducted phone interviews with transportation directors from a sample of four districts to collect additional information on district transportation operating policies and practices influencing costs and efficiencies. As a part of the transportation analysis, the research team also reviewed the Maryland Transportation Subsidy funding formula, including examinations of the key components of the subsidy, trends in funding over time, the effects of enrollment changes on the subsidy, the impact of the subsidy on district budgets, and recommendations for improvement.
Enrollment Change The following section provides a detailed analysis on enrollment trends in the state between 2005 and 2014. The analysis examines changes in total state and district enrollment, enrollment by grade level, enrollment by special programs, and projections of enrollment over the next decade.
Trends in Total Enrollment Over the Past 10 Years
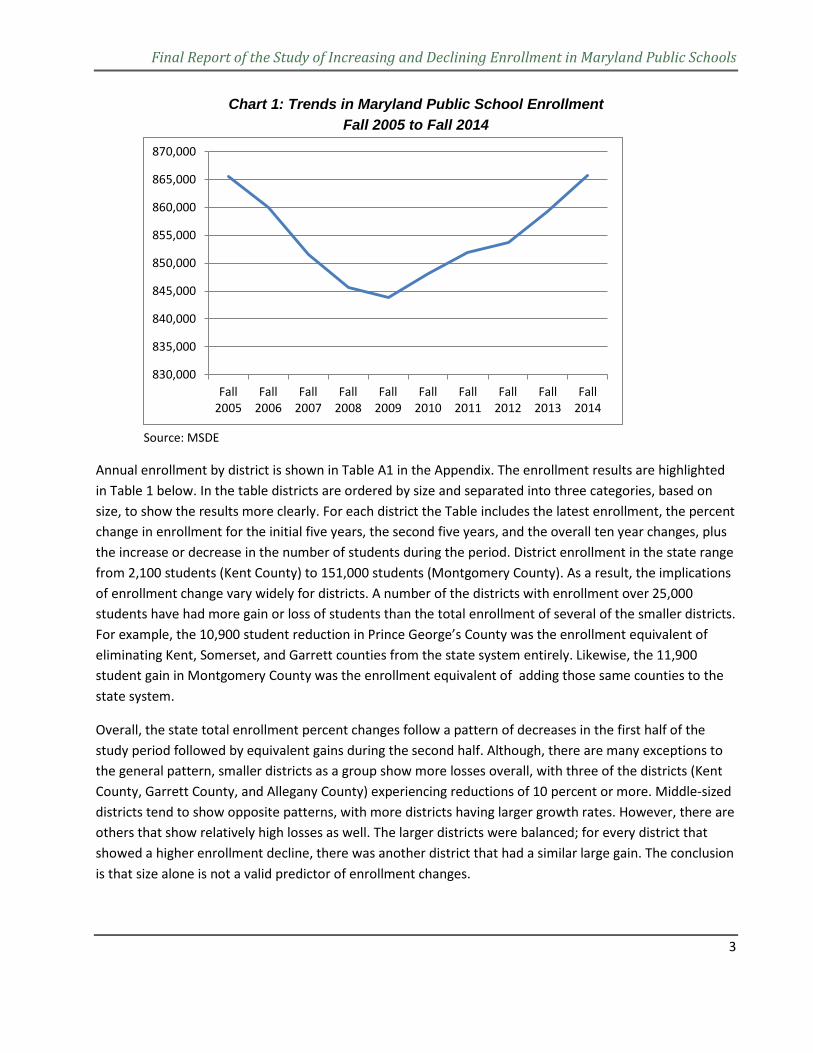
Looking only at 2005 and 2014, it would seem that overall enrollment in the Maryland school system have been exceedingly stable with only a 207 student difference between 2005 enrollments and 2014 enrollment. However, this is a misleading picture. Enrollment in the state represent two significantly different time periods. During the first five years, school systems in Maryland have experienced a decline of more than 20,000 students, reaching a low of 844,000 students in 2009, followed by an increase of more than 20,000 students over the next five-year period. The trend in total enrollment from 2005 to 2014 is shown in Chart 1, below.
Final Report of the Study of Increasing and Declining Enrollment in Maryland Public Schools
3
Chart 1: Trends in Maryland Public School Enrollment Fall 2005 to Fall 2014
Source: MSDE
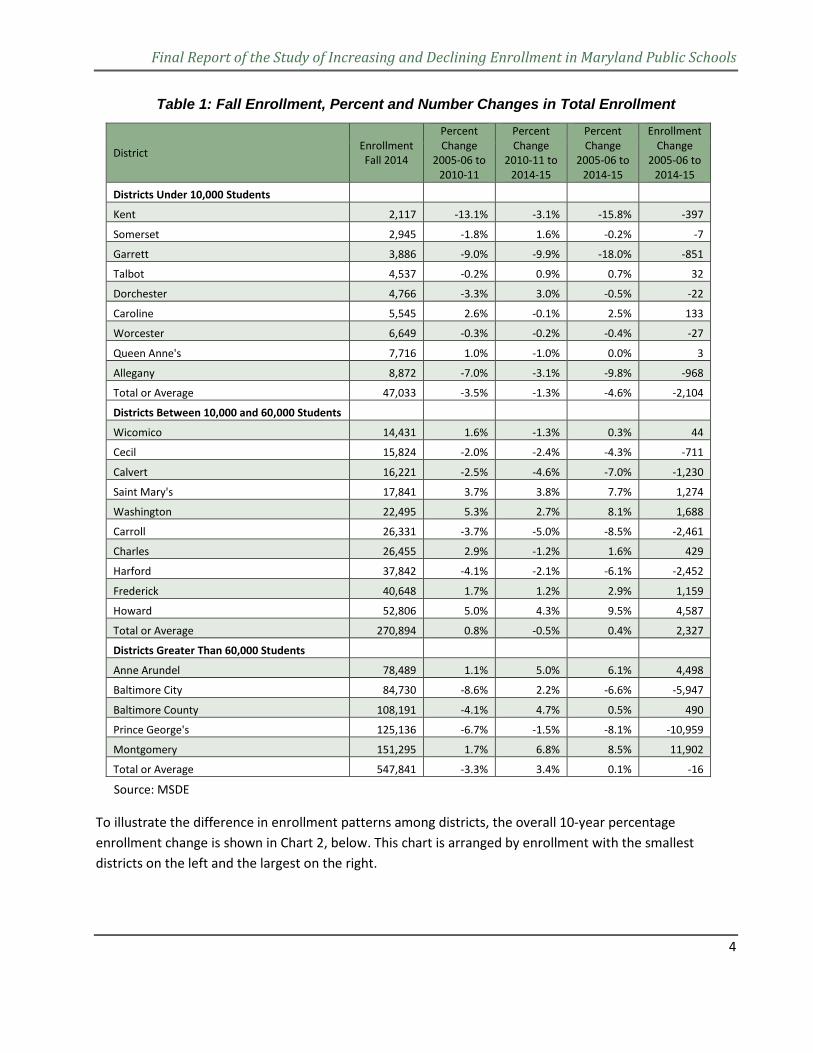
Annual enrollment by district is shown in Table A1 in the Appendix. The enrollment results are highlighted in Table 1 below. In the table districts are ordered by size and separated into three categories, based on size, to show the results more clearly. For each district the Table includes the latest enrollment, the percent change in enrollment for the initial five years, the second five years, and the overall ten year changes, plus the increase or decrease in the number of students during the period. District enrollment in the state range from 2,100 students (Kent County) to 151,000 students (Montgomery County). As a result, the implications of enrollment change vary widely for districts. A number of the districts with enrollment over 25,000 students have had more gain or loss of students than the total enrollment of several of the smaller districts. For example, the 10,900 student reduction in Prince George’s County was the enrollment equivalent of eliminating Kent, Somerset, and Garrett counties from the state system entirely. Likewise, the 11,900 student gain in Montgomery County was the enrollment equivalent of adding those same counties to the state system.
Overall, the state total enrollment percent changes follow a pattern of decreases in the first half of the study period followed by equivalent gains during the second half. Although, there are many exceptions to the general pattern, smaller districts as a group show more losses overall, with three of the districts (Kent County, Garrett County, and Allegany County) experiencing reductions of 10 percent or more. Middle-sized districts tend to show opposite patterns, with more districts having larger growth rates. However, there are others that show relatively high losses as well. The larger districts were balanced; for every district that showed a higher enrollment decline, there was another district that had a similar large gain. The conclusion is that size alone is not a valid predictor of enrollment changes.
830,000
835,000
840,000
845,000
850,000
855,000
860,000
865,000
870,000
Fall2005
Fall2006
Fall2007
Fall2008
Fall2009
Fall2010
Fall2011
Fall2012
Fall2013
Fall2014
Final Report of the Study of Increasing and Declining Enrollment in Maryland Public Schools
4
Table 1: Fall Enrollment, Percent and Number Changes in Total Enrollment
District Enrollment Fall 2014
Percent Change
2005-06 to 2010-11
Percent Change
2010-11 to 2014-15
Percent Change
2005-06 to 2014-15
Enrollment Change
2005-06 to 2014-15
Districts Under 10,000 Students
Kent 2,117 -13.1% -3.1% -15.8% -397
Somerset 2,945 -1.8% 1.6% -0.2% -7
Garrett 3,886 -9.0% -9.9% -18.0% -851
Talbot 4,537 -0.2% 0.9% 0.7% 32
Dorchester 4,766 -3.3% 3.0% -0.5% -22
Caroline 5,545 2.6% -0.1% 2.5% 133
Worcester 6,649 -0.3% -0.2% -0.4% -27
Queen Anne's 7,716 1.0% -1.0% 0.0% 3
Allegany 8,872 -7.0% -3.1% -9.8% -968
Total or Average 47,033 -3.5% -1.3% -4.6% -2,104
Districts Between 10,000 and 60,000 Students
Wicomico 14,431 1.6% -1.3% 0.3% 44
Cecil 15,824 -2.0% -2.4% -4.3% -711
Calvert 16,221 -2.5% -4.6% -7.0% -1,230
Saint Mary's 17,841 3.7% 3.8% 7.7% 1,274
Washington 22,495 5.3% 2.7% 8.1% 1,688
Carroll 26,331 -3.7% -5.0% -8.5% -2,461
Charles 26,455 2.9% -1.2% 1.6% 429
Harford 37,842 -4.1% -2.1% -6.1% -2,452
Frederick 40,648 1.7% 1.2% 2.9% 1,159
Howard 52,806 5.0% 4.3% 9.5% 4,587
Total or Average 270,894 0.8% -0.5% 0.4% 2,327
Districts Greater Than 60,000 Students
Anne Arundel 78,489 1.1% 5.0% 6.1% 4,498
Baltimore City 84,730 -8.6% 2.2% -6.6% -5,947
Baltimore County 108,191 -4.1% 4.7% 0.5% 490
Prince George's 125,136 -6.7% -1.5% -8.1% -10,959
Montgomery 151,295 1.7% 6.8% 8.5% 11,902
Total or Average 547,841 -3.3% 3.4% 0.1% -16
Source: MSDE
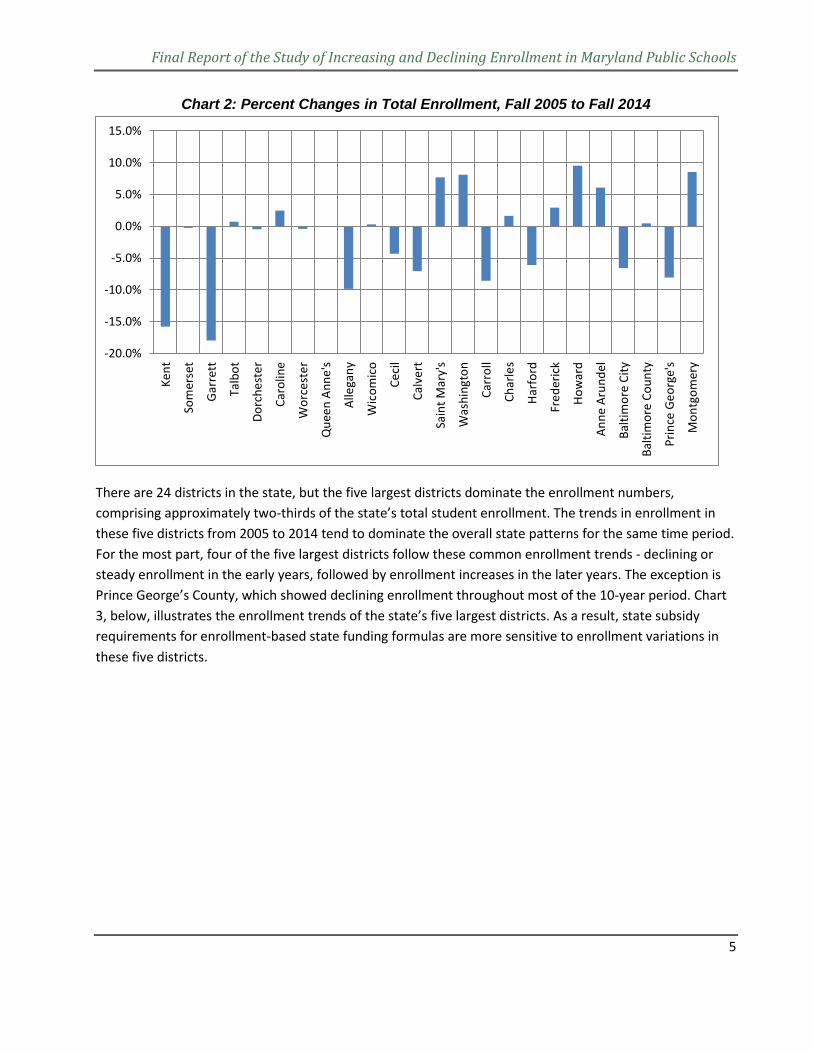
To illustrate the difference in enrollment patterns among districts, the overall 10-year percentage enrollment change is shown in Chart 2, below. This chart is arranged by enrollment with the smallest districts on the left and the largest on the right.
Final Report of the Study of Increasing and Declining Enrollment in Maryland Public Schools
5
Chart 2: Percent Changes in Total Enrollment, Fall 2005 to Fall 2014
There are 24 districts in the state, but the five largest districts dominate the enrollment numbers, comprising approximately two-thirds of the state’s total student enrollment. The trends in enrollment in these five districts from 2005 to 2014 tend to dominate the overall state patterns for the same time period. For the most part, four of the five largest districts follow these common enrollment trends - declining or steady enrollment in the early years, followed by enrollment increases in the later years. The exception is Prince George’s County, which showed declining enrollment throughout most of the 10-year period. Chart 3, below, illustrates the enrollment trends of the state’s five largest districts. As a result, state subsidy requirements for enrollment-based state funding formulas are more sensitive to enrollment variations in these five districts.
-20.0%
-15.0%
-10.0%
-5.0%
0.0%
5.0%
10.0%
15.0%
Kent
Som
erse
t
Gar
rett
Talb
ot
Dorc
hest
er
Caro
line
Wor
cest
er
Que
en A
nne'
s
Alle
gany
Wic
omic
o
Ceci
l
Calv
ert
Sain
t Mar
y's
Was
hing
ton
Carr
oll
Char
les
Harf
ord
Fred
eric
k
How
ard
Anne
Aru
ndel
Balti
mor
e Ci
ty
Balti
mor
e Co
unty
Prin
ce G
eorg
e's
Mon
tgom
ery
Final Report of the Study of Increasing and Declining Enrollment in Maryland Public Schools
6
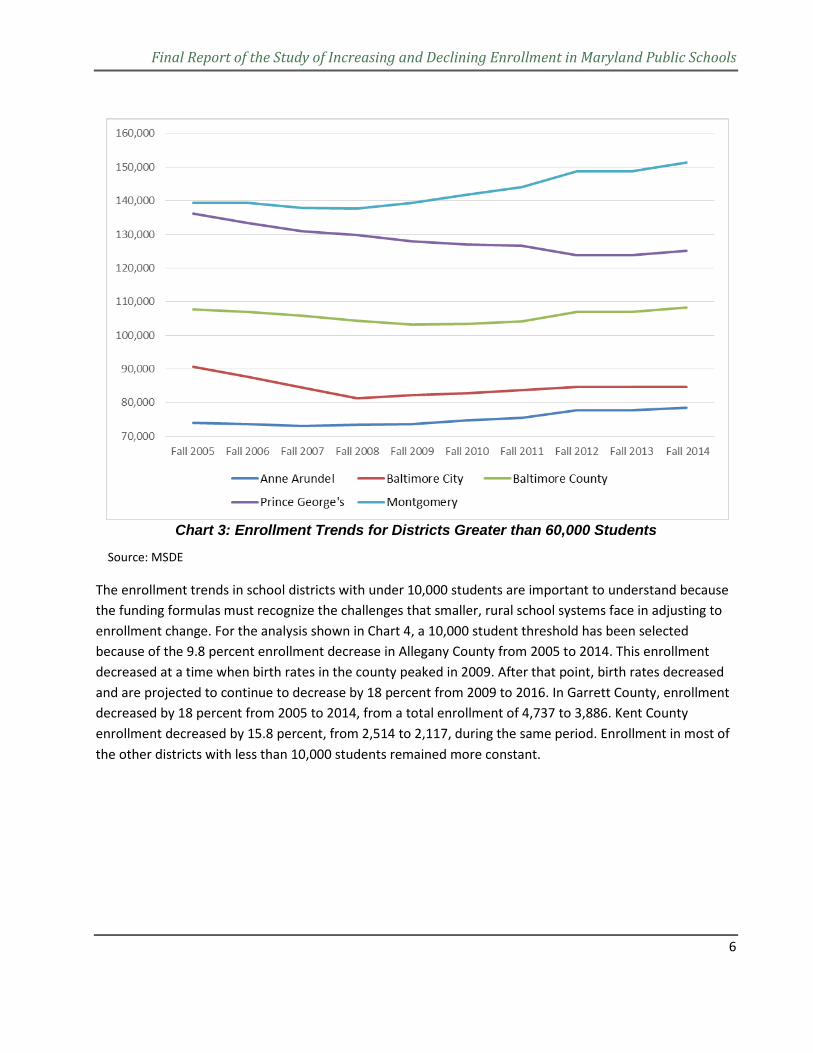
Chart 3: Enrollment Trends for Districts Greater than 60,000 Students
Source: MSDE
The enrollment trends in school districts with under 10,000 students are important to understand because the funding formulas must recognize the challenges that smaller, rural school systems face in adjusting to enrollment change. For the analysis shown in Chart 4, a 10,000 student threshold has been selected because of the 9.8 percent enrollment decrease in Allegany County from 2005 to 2014. This enrollment decreased at a time when birth rates in the county peaked in 2009. After that point, birth rates decreased and are projected to continue to decrease by 18 percent from 2009 to 2016. In Garrett County, enrollment decreased by 18 percent from 2005 to 2014, from a total enrollment of 4,737 to 3,886. Kent County enrollment decreased by 15.8 percent, from 2,514 to 2,117, during the same period. Enrollment in most of the other districts with less than 10,000 students remained more constant.
Final Report of the Study of Increasing and Declining Enrollment in Maryland Public Schools
7
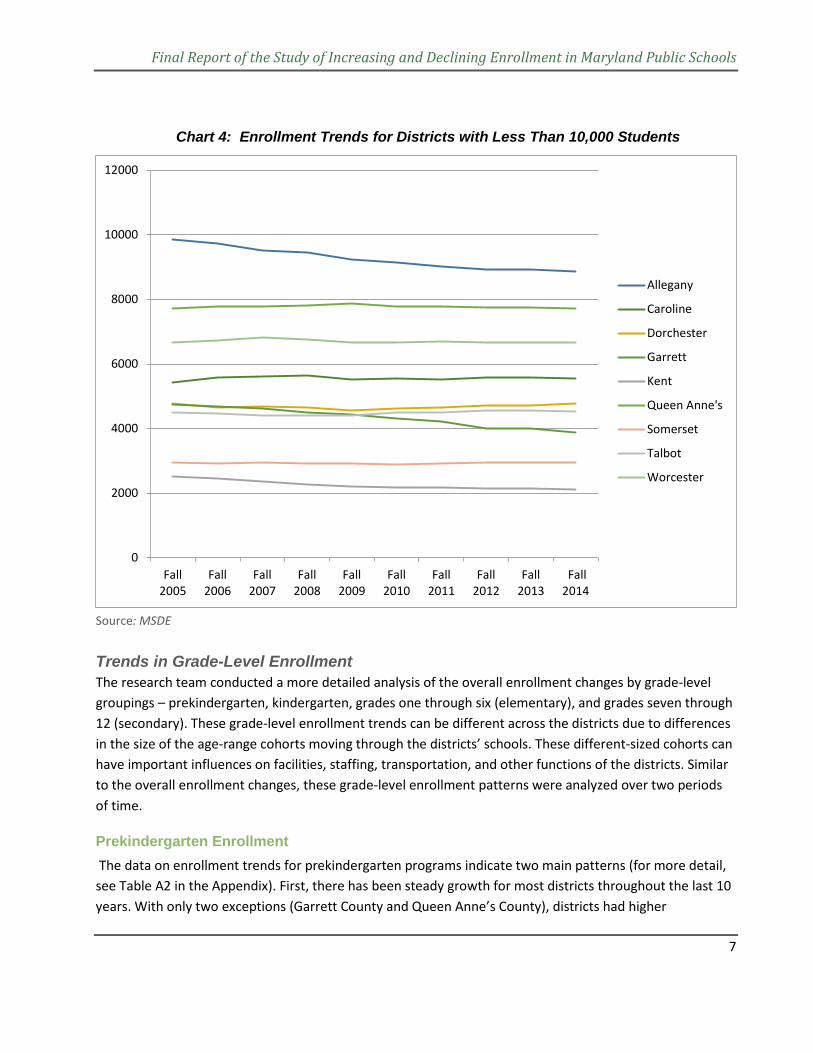
Chart 4: Enrollment Trends for Districts with Less Than 10,000 Students
Source: MSDE Trends in Grade-Level Enrollment The research team conducted a more detailed analysis of the overall enrollment changes by grade-level groupings – prekindergarten, kindergarten, grades one through six (elementary), and grades seven through 12 (secondary). These grade-level enrollment trends can be different across the districts due to differences in the size of the age-range cohorts moving through the districts’ schools. These different-sized cohorts can have important influences on facilities, staffing, transportation, and other functions of the districts. Similar to the overall enrollment changes, these grade-level enrollment patterns were analyzed over two periods of time.
Prekindergarten Enrollment The data on enrollment trends for prekindergarten programs indicate two main patterns (for more detail, see Table A2 in the Appendix). First, there has been steady growth for most districts throughout the last 10 years. With only two exceptions (Garrett County and Queen Anne’s County), districts had higher
0
2000
4000
6000
8000
10000
12000
Fall2005
Fall2006
Fall2007
Fall2008
Fall2009
Fall2010
Fall2011
Fall2012
Fall2013
Fall2014
Allegany
Caroline
Dorchester
Garrett
Kent
Queen Anne's
Somerset
Talbot
Worcester
Final Report of the Study of Increasing and Declining Enrollment in Maryland Public Schools
8
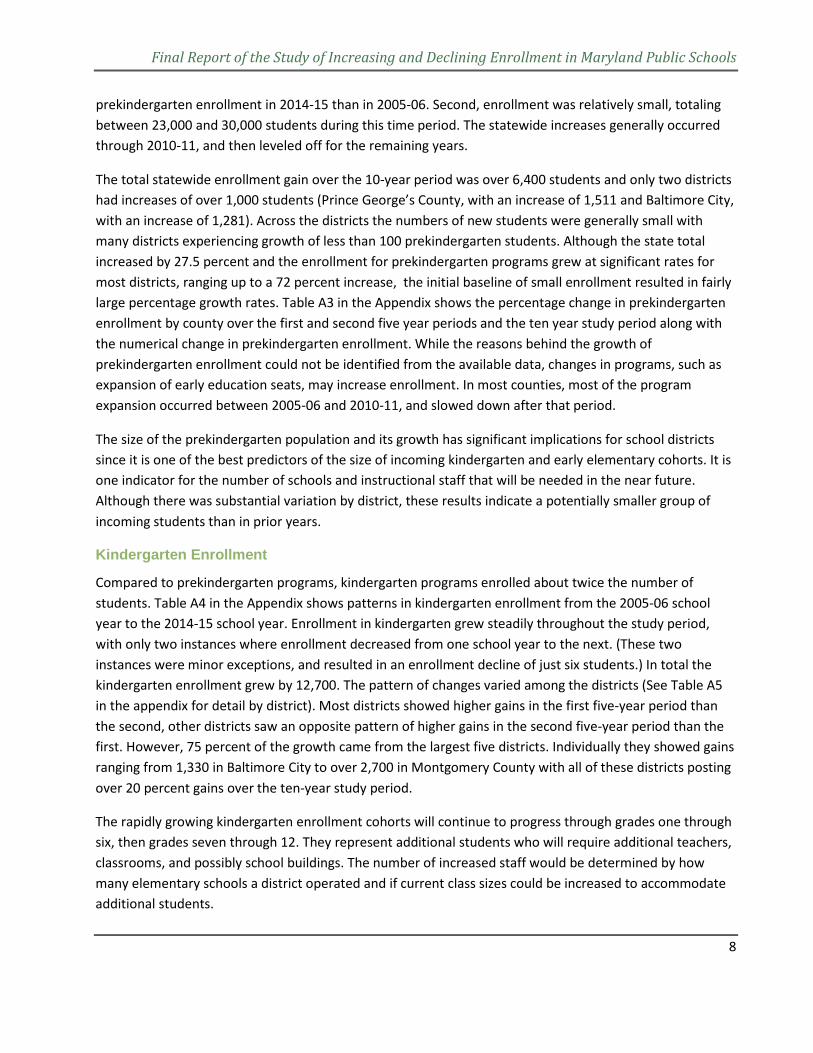
prekindergarten enrollment in 2014-15 than in 2005-06. Second, enrollment was relatively small, totaling between 23,000 and 30,000 students during this time period. The statewide increases generally occurred through 2010-11, and then leveled off for the remaining years.
The total statewide enrollment gain over the 10-year period was over 6,400 students and only two districts had increases of over 1,000 students (Prince George’s County, with an increase of 1,511 and Baltimore City, with an increase of 1,281). Across the districts the numbers of new students were generally small with many districts experiencing growth of less than 100 prekindergarten students. Although the state total increased by 27.5 percent and the enrollment for prekindergarten programs grew at significant rates for most districts, ranging up to a 72 percent increase, the initial baseline of small enrollment resulted in fairly large percentage growth rates. Table A3 in the Appendix shows the percentage change in prekindergarten enrollment by county over the first and second five year periods and the ten year study period along with the numerical change in prekindergarten enrollment. While the reasons behind the growth of prekindergarten enrollment could not be identified from the available data, changes in programs, such as expansion of early education seats, may increase enrollment. In most counties, most of the program expansion occurred between 2005-06 and 2010-11, and slowed down after that period.
The size of the prekindergarten population and its growth has significant implications for school districts since it is one of the best predictors of the size of incoming kindergarten and early elementary cohorts. It is one indicator for the number of schools and instructional staff that will be needed in the near future. Although there was substantial variation by district, these results indicate a potentially smaller group of incoming students than in prior years.
Kindergarten Enrollment
Compared to prekindergarten programs, kindergarten programs enrolled about twice the number of students. Table A4 in the Appendix shows patterns in kindergarten enrollment from the 2005-06 school year to the 2014-15 school year. Enrollment in kindergarten grew steadily throughout the study period, with only two instances where enrollment decreased from one school year to the next. (These two instances were minor exceptions, and resulted in an enrollment decline of just six students.) In total the kindergarten enrollment grew by 12,700. The pattern of changes varied among the districts (See Table A5 in the appendix for detail by district). Most districts showed higher gains in the first five-year period than the second, other districts saw an opposite pattern of higher gains in the second five-year period than the first. However, 75 percent of the growth came from the largest five districts. Individually they showed gains ranging from 1,330 in Baltimore City to over 2,700 in Montgomery County with all of these districts posting over 20 percent gains over the ten-year study period.
The rapidly growing kindergarten enrollment cohorts will continue to progress through grades one through six, then grades seven through 12. They represent additional students who will require additional teachers, classrooms, and possibly school buildings. The number of increased staff would be determined by how many elementary schools a district operated and if current class sizes could be increased to accommodate additional students.
Final Report of the Study of Increasing and Declining Enrollment in Maryland Public Schools
9
Grades One through Six Enrollment
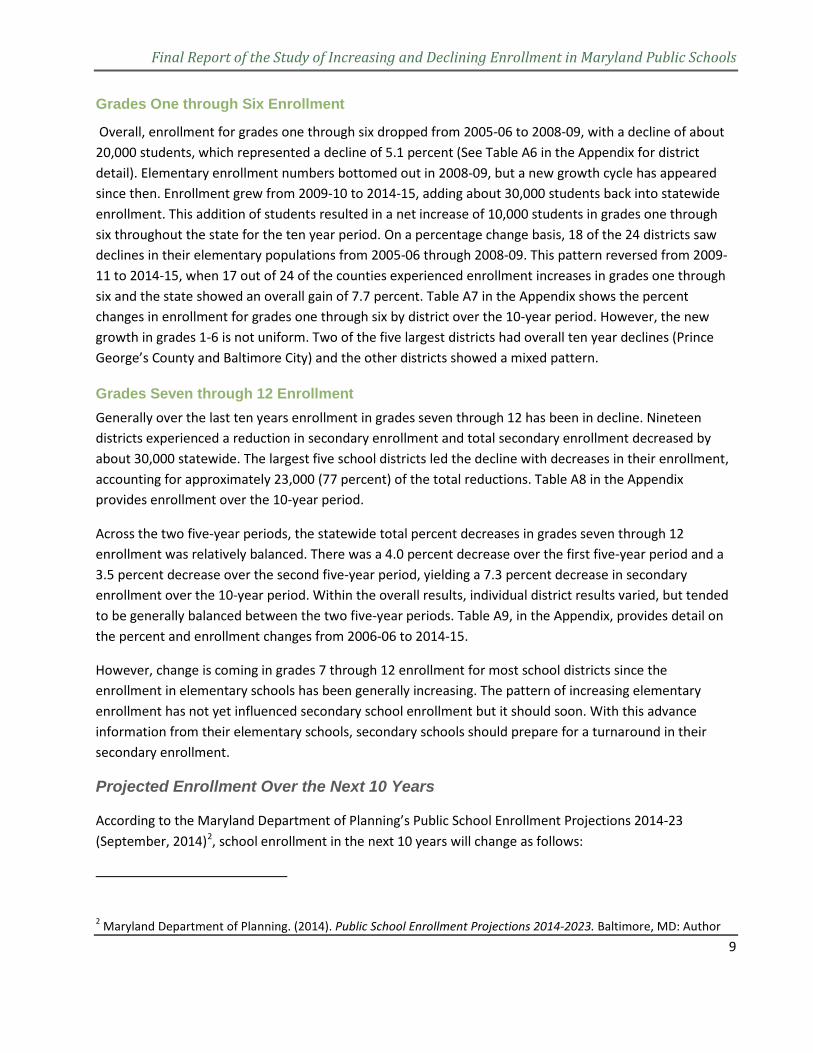
Overall, enrollment for grades one through six dropped from 2005-06 to 2008-09, with a decline of about 20,000 students, which represented a decline of 5.1 percent (See Table A6 in the Appendix for district detail). Elementary enrollment numbers bottomed out in 2008-09, but a new growth cycle has appeared since then. Enrollment grew from 2009-10 to 2014-15, adding about 30,000 students back into statewide enrollment. This addition of students resulted in a net increase of 10,000 students in grades one through six throughout the state for the ten year period. On a percentage change basis, 18 of the 24 districts saw declines in their elementary populations from 2005-06 through 2008-09. This pattern reversed from 2009-11 to 2014-15, when 17 out of 24 of the counties experienced enrollment increases in grades one through six and the state showed an overall gain of 7.7 percent. Table A7 in the Appendix shows the percent changes in enrollment for grades one through six by district over the 10-year period. However, the new growth in grades 1-6 is not uniform. Two of the five largest districts had overall ten year declines (Prince George’s County and Baltimore City) and the other districts showed a mixed pattern.
Grades Seven through 12 Enrollment Generally over the last ten years enrollment in grades seven through 12 has been in decline. Nineteen districts experienced a reduction in secondary enrollment and total secondary enrollment decreased by about 30,000 statewide. The largest five school districts led the decline with decreases in their enrollment, accounting for approximately 23,000 (77 percent) of the total reductions. Table A8 in the Appendix provides enrollment over the 10-year period.
Across the two five-year periods, the statewide total percent decreases in grades seven through 12 enrollment was relatively balanced. There was a 4.0 percent decrease over the first five-year period and a 3.5 percent decrease over the second five-year period, yielding a 7.3 percent decrease in secondary enrollment over the 10-year period. Within the overall results, individual district results varied, but tended to be generally balanced between the two five-year periods. Table A9, in the Appendix, provides detail on the percent and enrollment changes from 2006-06 to 2014-15.
However, change is coming in grades 7 through 12 enrollment for most school districts since the enrollment in elementary schools has been generally increasing. The pattern of increasing elementary enrollment has not yet influenced secondary school enrollment but it should soon. With this advance information from their elementary schools, secondary schools should prepare for a turnaround in their secondary enrollment.
Projected Enrollment Over the Next 10 Years
According to the Maryland Department of Planning’s Public School Enrollment Projections 2014-23 (September, 2014)2, school enrollment in the next 10 years will change as follows:
2 Maryland Department of Planning. (2014). Public School Enrollment Projections 2014-2023. Baltimore, MD: Author
Final Report of the Study of Increasing and Declining Enrollment in Maryland Public Schools
10
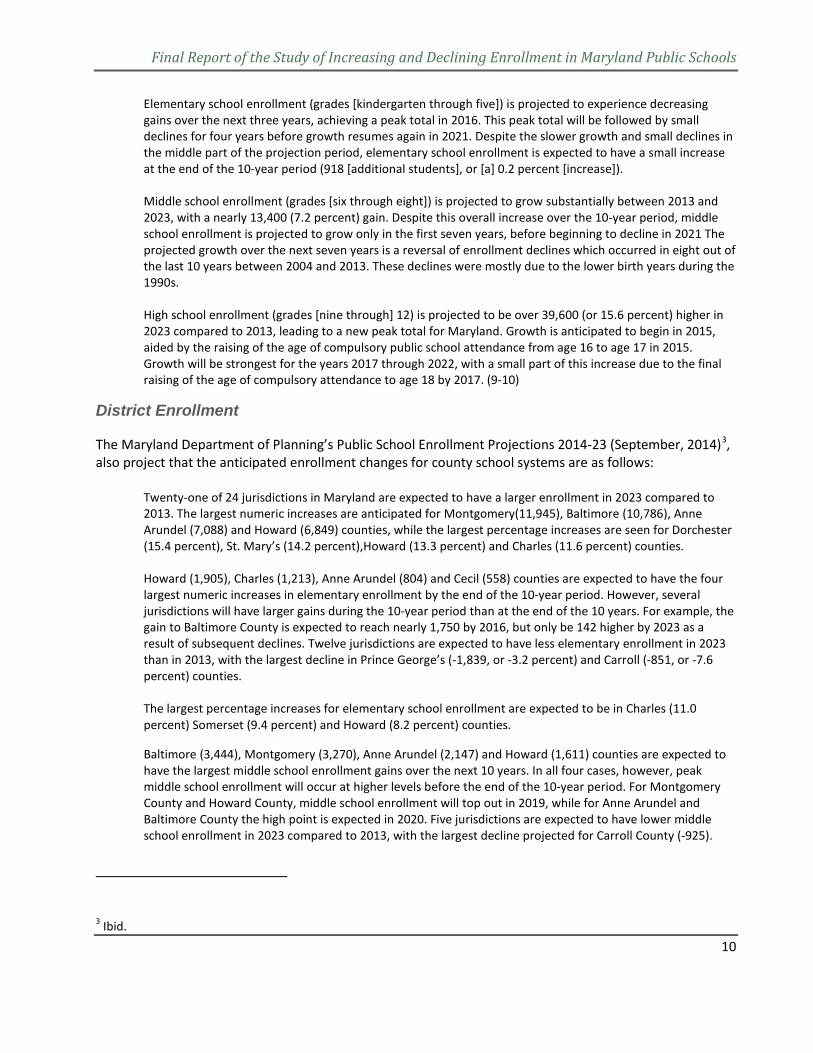
Elementary school enrollment (grades [kindergarten through five]) is projected to experience decreasing gains over the next three years, achieving a peak total in 2016. This peak total will be followed by small declines for four years before growth resumes again in 2021. Despite the slower growth and small declines in the middle part of the projection period, elementary school enrollment is expected to have a small increase at the end of the 10-year period (918 [additional students], or [a] 0.2 percent [increase]). Middle school enrollment (grades [six through eight]) is projected to grow substantially between 2013 and 2023, with a nearly 13,400 (7.2 percent) gain. Despite this overall increase over the 10-year period, middle school enrollment is projected to grow only in the first seven years, before beginning to decline in 2021 The projected growth over the next seven years is a reversal of enrollment declines which occurred in eight out of the last 10 years between 2004 and 2013. These declines were mostly due to the lower birth years during the 1990s. High school enrollment (grades [nine through] 12) is projected to be over 39,600 (or 15.6 percent) higher in 2023 compared to 2013, leading to a new peak total for Maryland. Growth is anticipated to begin in 2015, aided by the raising of the age of compulsory public school attendance from age 16 to age 17 in 2015. Growth will be strongest for the years 2017 through 2022, with a small part of this increase due to the final raising of the age of compulsory attendance to age 18 by 2017. (9-10)
District Enrollment
The Maryland Department of Planning’s Public School Enrollment Projections 2014-23 (September, 2014)3, also project that the anticipated enrollment changes for county school systems are as follows:
Twenty-one of 24 jurisdictions in Maryland are expected to have a larger enrollment in 2023 compared to 2013. The largest numeric increases are anticipated for Montgomery(11,945), Baltimore (10,786), Anne Arundel (7,088) and Howard (6,849) counties, while the largest percentage increases are seen for Dorchester (15.4 percent), St. Mary’s (14.2 percent),Howard (13.3 percent) and Charles (11.6 percent) counties. Howard (1,905), Charles (1,213), Anne Arundel (804) and Cecil (558) counties are expected to have the four largest numeric increases in elementary enrollment by the end of the 10-year period. However, several jurisdictions will have larger gains during the 10-year period than at the end of the 10 years. For example, the gain to Baltimore County is expected to reach nearly 1,750 by 2016, but only be 142 higher by 2023 as a result of subsequent declines. Twelve jurisdictions are expected to have less elementary enrollment in 2023 than in 2013, with the largest decline in Prince George’s (-1,839, or -3.2 percent) and Carroll (-851, or -7.6 percent) counties. The largest percentage increases for elementary school enrollment are expected to be in Charles (11.0 percent) Somerset (9.4 percent) and Howard (8.2 percent) counties.
Baltimore (3,444), Montgomery (3,270), Anne Arundel (2,147) and Howard (1,611) counties are expected to have the largest middle school enrollment gains over the next 10 years. In all four cases, however, peak middle school enrollment will occur at higher levels before the end of the 10-year period. For Montgomery County and Howard County, middle school enrollment will top out in 2019, while for Anne Arundel and Baltimore County the high point is expected in 2020. Five jurisdictions are expected to have lower middle school enrollment in 2023 compared to 2013, with the largest decline projected for Carroll County (-925).
3 Ibid.
Final Report of the Study of Increasing and Declining Enrollment in Maryland Public Schools
11
The largest percentage increases for middle school enrollment between 2013 and 2023 are anticipated for St. Mary’s (19.6 percent), Dorchester (18.2 percent) and Baltimore (15.0 percent) counties. For all three counties, the largest cumulative percentage gains actually come prior to 2023, with Dorchester and Baltimore peaking in 2020 and St. Mary’s in 2022.
The four largest numeric increases in high school enrollment over the 10-year projection period are seen for Montgomery (8,848), Baltimore (7,200) and Prince George’s (4,976) counties and Baltimore City (4,218). Unlike middle school enrollment gains, however, the largest gains will occur at the end of the projection period. And, for all four jurisdictions, the bulk of the increases will be during the 2017 to 2022 period as larger middle school cohorts work their way into their high school years. Three jurisdictions are expected to have smaller high school enrollments at the end of the 10-year projection period, with the largest declines anticipated for Carroll County (-643).
The largest percentage increases in high school enrollment are projected for Dorchester (34.3 percent), St. Mary’s (29.1 percent) and Caroline (26.6 percent) counties. (12-13)
Birth Rates and Kindergarten and Grade One Enrollment
Prior year birth rates provide an important leading indicator of school systems’ future enrollment. Most children born in a given year will enter kindergarten five years later. For example, children born in 2010 will enroll in kindergarten in 2015. Not all children will follow the five-year pattern, and there will also be some migration of children into and out of the state. Nonetheless, the bulk of children who will enter schools between the 2015-16 school year and the 2019-20 school year have already been born. This provides districts with important information to plan for future operations. Declining birth rates will lead to fewer students in schools in future years and these lower student numbers will persist as students move from one grade to the next over their 13 years of attending school.
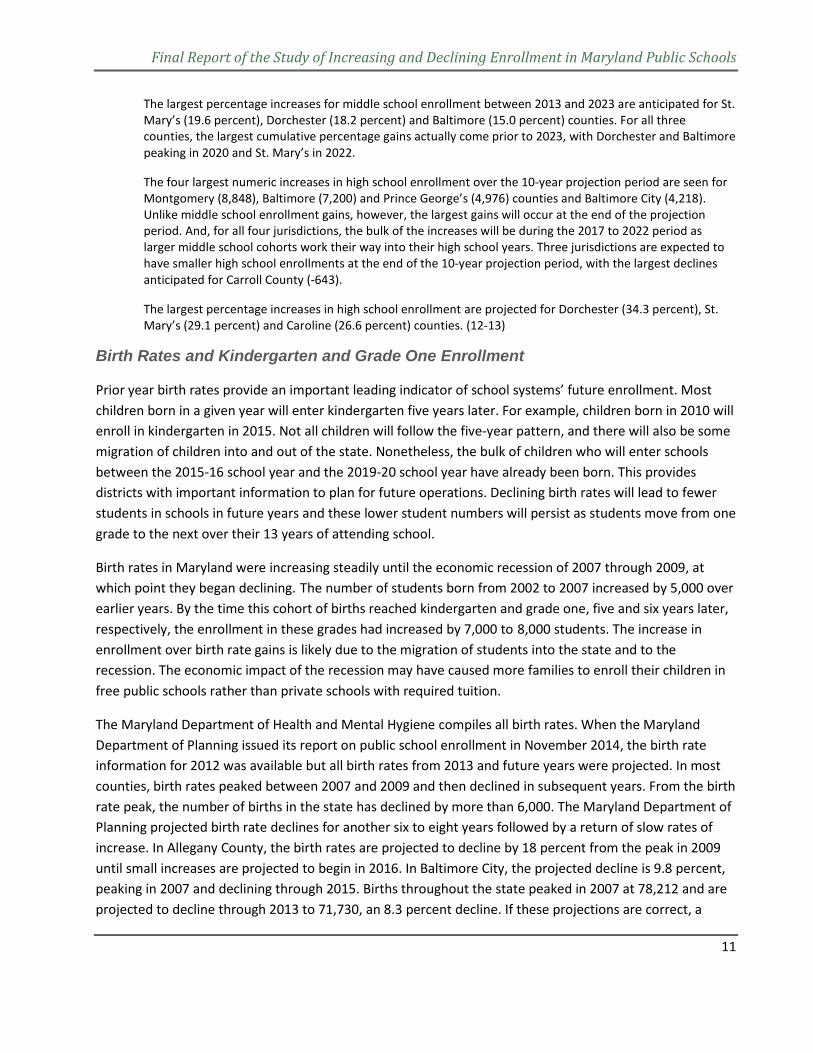
Birth rates in Maryland were increasing steadily until the economic recession of 2007 through 2009, at which point they began declining. The number of students born from 2002 to 2007 increased by 5,000 over earlier years. By the time this cohort of births reached kindergarten and grade one, five and six years later, respectively, the enrollment in these grades had increased by 7,000 to 8,000 students. The increase in enrollment over birth rate gains is likely due to the migration of students into the state and to the recession. The economic impact of the recession may have caused more families to enroll their children in free public schools rather than private schools with required tuition.
The Maryland Department of Health and Mental Hygiene compiles all birth rates. When the Maryland Department of Planning issued its report on public school enrollment in November 2014, the birth rate information for 2012 was available but all birth rates from 2013 and future years were projected. In most counties, birth rates peaked between 2007 and 2009 and then declined in subsequent years. From the birth rate peak, the number of births in the state has declined by more than 6,000. The Maryland Department of Planning projected birth rate declines for another six to eight years followed by a return of slow rates of increase. In Allegany County, the birth rates are projected to decline by 18 percent from the peak in 2009 until small increases are projected to begin in 2016. In Baltimore City, the projected decline is 9.8 percent, peaking in 2007 and declining through 2015. Births throughout the state peaked in 2007 at 78,212 and are projected to decline through 2013 to 71,730, an 8.3 percent decline. If these projections are correct, a
Final Report of the Study of Increasing and Declining Enrollment in Maryland Public Schools
12
reduction of approximately 6,500 students will be experienced, and if all grade levels are affected as these lower birth rates progress through the system, enrollment declines of over 90,000 students will occur.
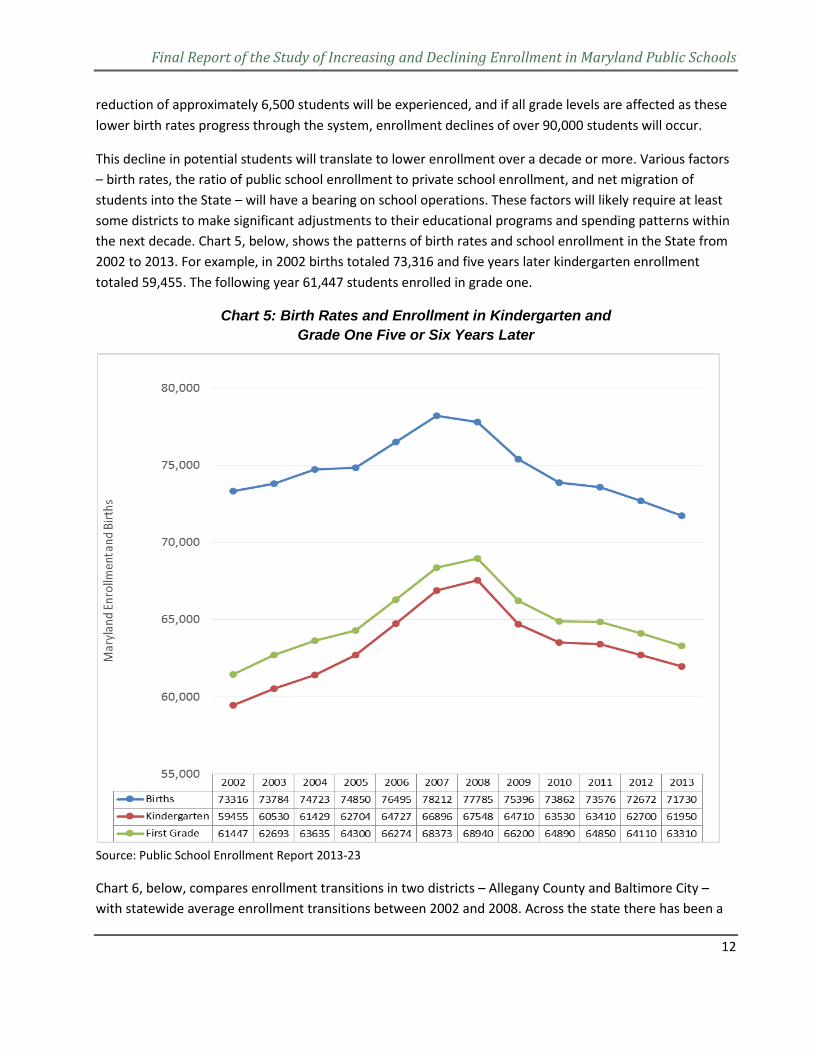
This decline in potential students will translate to lower enrollment over a decade or more. Various factors – birth rates, the ratio of public school enrollment to private school enrollment, and net migration of students into the State – will have a bearing on school operations. These factors will likely require at least some districts to make significant adjustments to their educational programs and spending patterns within the next decade. Chart 5, below, shows the patterns of birth rates and school enrollment in the State from 2002 to 2013. For example, in 2002 births totaled 73,316 and five years later kindergarten enrollment totaled 59,455. The following year 61,447 students enrolled in grade one.
Chart 5: Birth Rates and Enrollment in Kindergarten and Grade One Five or Six Years Later
Source: Public School Enrollment Report 2013-23
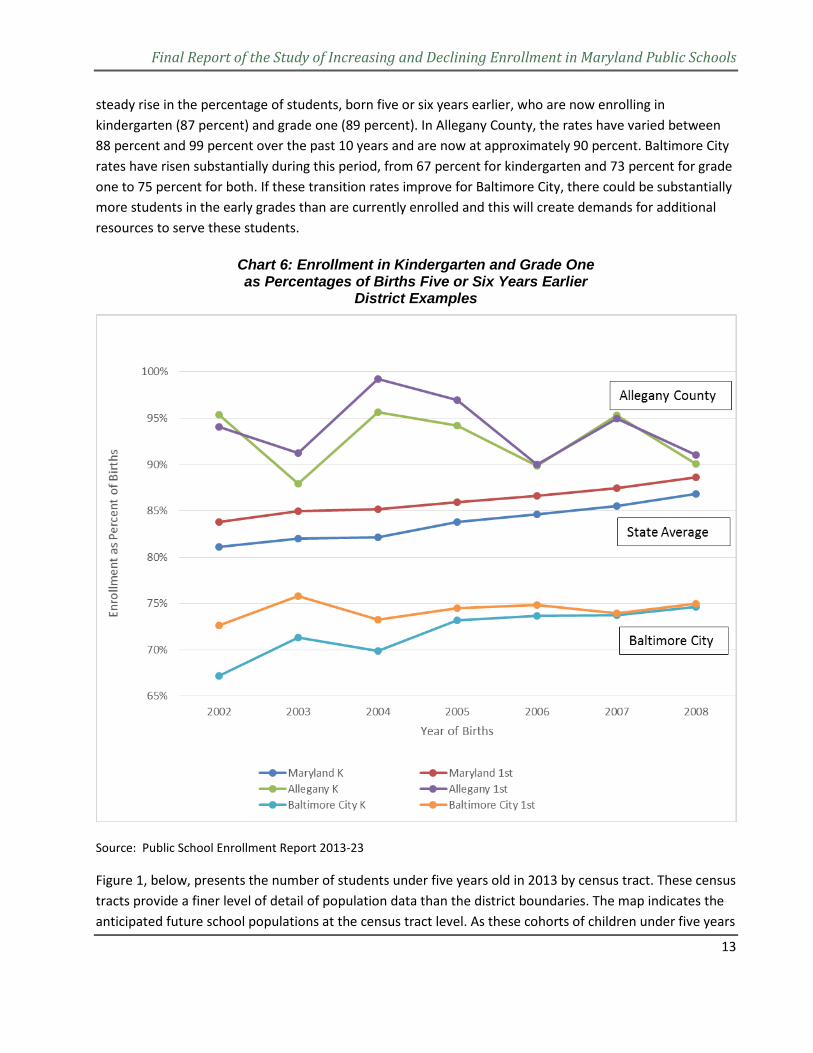
Chart 6, below, compares enrollment transitions in two districts – Allegany County and Baltimore City – with statewide average enrollment transitions between 2002 and 2008. Across the state there has been a
Final Report of the Study of Increasing and Declining Enrollment in Maryland Public Schools
13
steady rise in the percentage of students, born five or six years earlier, who are now enrolling in kindergarten (87 percent) and grade one (89 percent). In Allegany County, the rates have varied between 88 percent and 99 percent over the past 10 years and are now at approximately 90 percent. Baltimore City rates have risen substantially during this period, from 67 percent for kindergarten and 73 percent for grade one to 75 percent for both. If these transition rates improve for Baltimore City, there could be substantially more students in the early grades than are currently enrolled and this will create demands for additional resources to serve these students.
Chart 6: Enrollment in Kindergarten and Grade One as Percentages of Births Five or Six Years Earlier
District Examples
Source: Public School Enrollment Report 2013-23
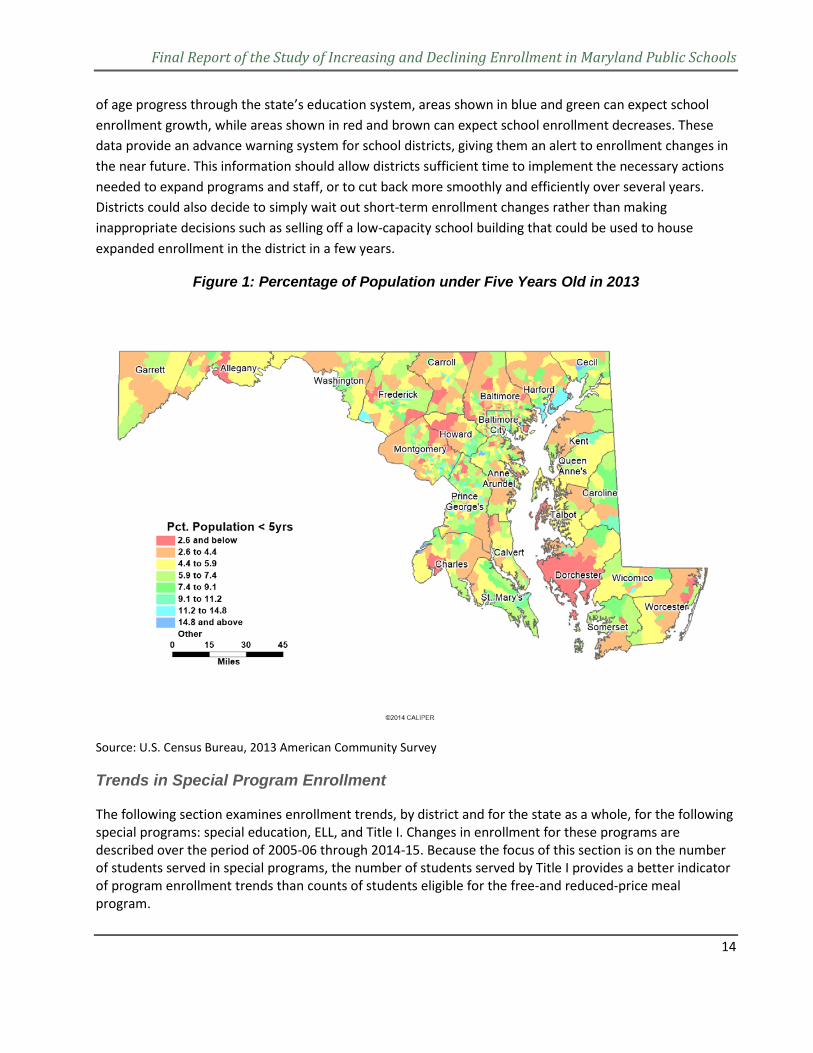
Figure 1, below, presents the number of students under five years old in 2013 by census tract. These census tracts provide a finer level of detail of population data than the district boundaries. The map indicates the anticipated future school populations at the census tract level. As these cohorts of children under five years
Final Report of the Study of Increasing and Declining Enrollment in Maryland Public Schools
14
of age progress through the state’s education system, areas shown in blue and green can expect school enrollment growth, while areas shown in red and brown can expect school enrollment decreases. These data provide an advance warning system for school districts, giving them an alert to enrollment changes in the near future. This information should allow districts sufficient time to implement the necessary actions needed to expand programs and staff, or to cut back more smoothly and efficiently over several years. Districts could also decide to simply wait out short-term enrollment changes rather than making inappropriate decisions such as selling off a low-capacity school building that could be used to house expanded enrollment in the district in a few years.
Figure 1: Percentage of Population under Five Years Old in 2013
Source: U.S. Census Bureau, 2013 American Community Survey
Trends in Special Program Enrollment
The following section examines enrollment trends, by district and for the state as a whole, for the following special programs: special education, ELL, and Title I. Changes in enrollment for these programs are described over the period of 2005-06 through 2014-15. Because the focus of this section is on the number of students served in special programs, the number of students served by Title I provides a better indicator of program enrollment trends than counts of students eligible for the free-and reduced-price meal program.
Final Report of the Study of Increasing and Declining Enrollment in Maryland Public Schools
15
Special Education
Special education enrollment totaled approximately 100,000 students in the state in 2014-15. Special education enrollment by county are shown by district over the ten year period in Table A10 in the Appendix. The highest concentrations of special education students can be found in the larger districts. The five largest districts have two-thirds of the state’s special education enrollment. The state lost a total of 6,450 special education students over the past decade, representing a 6.2 percent decrease in overall special education enrollment. Only six districts across the state saw increases over this time. This statewide trend can be attributed to declines in special education enrollment in the smaller districts, since the larger districts, with one exception, have maintained stable enrollment over this time period.
For individual districts, the percent changes in special education enrollment from 2005-06 to 2014-15 range from a percent increase of 34.3 (Somerset County) to a percent decrease of 37.7 (Garrett County). The numerical changes range from an increase of 453 (Montgomery County) to a decrease of 2,052 (Anne Arundel County). Table A11 in the Appendix shows the percent changes and numerical changes in special education enrollment over the last 10 years.
One measure of the significance for special education enrollment is the percentage of special education students of the total student population. Across districts, percentages of special education students are fairly similar, with a few outliers. From 2005-06 to 2014-15, most districts experienced a percent change of between 11 percent and 13 percent, with a few outliers above and below this range. The highest percentages of special education enrollment in 2014-15 were in Somerset County (15.6 percent), Baltimore City (15.3 percent), and Allegany County (14.6 percent). On the other end of the range, those with the lowest percentage were Calvert County (8.3 percent), Howard County (8.6 percent), and Washington County (8.9 percent). Over the past 10 years, there has been little change across districts in terms of the proportions of special education enrollment to total enrollment. The average change during this period was a decrease of 0.9 percent, though some districts saw decreases or increases in the four percent range. Table A12 in the Appendix provides additional detail on special education enrollment as a percentage of total enrollment.
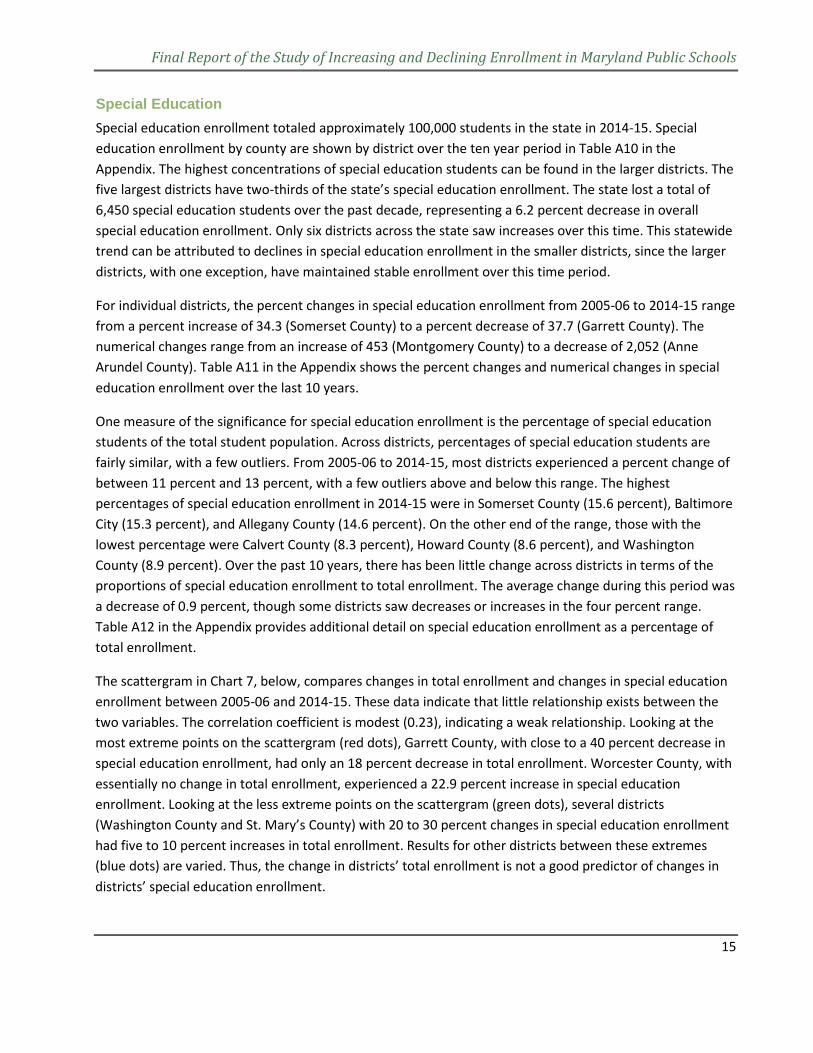
The scattergram in Chart 7, below, compares changes in total enrollment and changes in special education enrollment between 2005-06 and 2014-15. These data indicate that little relationship exists between the two variables. The correlation coefficient is modest (0.23), indicating a weak relationship. Looking at the most extreme points on the scattergram (red dots), Garrett County, with close to a 40 percent decrease in special education enrollment, had only an 18 percent decrease in total enrollment. Worcester County, with essentially no change in total enrollment, experienced a 22.9 percent increase in special education enrollment. Looking at the less extreme points on the scattergram (green dots), several districts (Washington County and St. Mary’s County) with 20 to 30 percent changes in special education enrollment had five to 10 percent increases in total enrollment. Results for other districts between these extremes (blue dots) are varied. Thus, the change in districts’ total enrollment is not a good predictor of changes in districts’ special education enrollment.

Final Report of the Study of Increasing and Declining Enrollment in Maryland Public Schools
16
Chart 7: Relationship Between Changes in Special Education Enrollment and Changes in Total Enrollment (Correlation Coefficient = 0.42)
Source: MSDE
English Language Learners English language learner enrollment is highly concentrated in two districts (Montgomery County and Prince George’s County). When combined, these districts contain two-thirds of the State’s total ELL enrollment. Maryland’s ELL population has doubled in the past 10 years, increasing from approximately 30,000 ELL students in 2005-06 to more than 60,000 in 2014-15. Table A13 in the Appendix shows enrollment of ELL students for each county and for the State from 2005-06 through 2014-15.
Statewide, the number of ELL students increased by 107 percent over the past 10 years (See Table A14 in the Appendix for percent and number changes for ELL students by county). Seven counties saw increases of more than 100 percent, and another seven saw increases of more than 50 percent. The greatest increases occurred in the first five-year period. The two districts with the largest numbers of ELL students (Montgomery County and Prince George’s County) each added approximately 10,000 new ELL students over the past decade. Other districts with relatively large increases in ELL enrollment (Anne Arundel
-40.0%
-30.0%
-20.0%
-10.0%
0.0%
10.0%
20.0%
30.0%
-20.0% -15.0% -10.0% -5.0% 0.0% 5.0% 10.0% 15.0%
Perc
ent
Chan
ge in
Spe
cial
Edu
catio
n En
rollm
ent 2
005-
06 to
20
13-1
4
Percent Change in Total Enrollment 2005-06 to 2013-14
Worcester
Somerset
Washington
St. Mary's
Final Report of the Study of Increasing and Declining Enrollment in Maryland Public Schools
17
County, Baltimore City, Baltimore County, and Howard County) each added more than 2,000 ELL students, leaving an increase of fewer than 2,000 ELL students in all of the other districts combined. If this population continues to increase, substantial new resources will be required to serve them adequately. State funding to districts to support these students will come through the LEP formula calculation, which is tied directly to the LEP enrollment of the prior year and adjusted by a district wealth per pupil factor. A minimum grant is available and it was applied in 2014-15 to four districts of varying sizes (Anne Arundel County, Garrett County, Kent County, Montgomery County, Talbot County, and Worcester County).
Because of confidentiality regulations, the State does not report the number of ELL students when it is fewer than five students. As a result, calculation of ELL students as a percentage of total enrolled students was not possible for some districts for some years. Statewide, the majority of ELL students in 2014 were in elementary schools (10.6 percent average of total enrollment). Middle schools and high schools had lower percentages of ELL students, at 4.1 percent and 3.5 percent respectively. Enrollment in Montgomery and Prince George’s Counties clearly represent the pattern of higher elementary ELL enrollment. In both of these districts, ELL students accounted for over 20 percent of elementary students in 2014. The ELL student percentages in Montgomery and Prince George’s Counties’ middle and high schools are lower, at about nine percent for middle schools and seven percent for high schools. Table A15 in the Appendix provides detail on the percentages of ELL students in districts at the elementary, middle, and high school levels in 2014 by district.
Title I Program Similar to special education and ELL enrollment, Title I program students are concentrated in the larger districts. When combined, the four districts with largest numbers of Title I enrollment (Baltimore City, Prince George’s County, Baltimore County, and Montgomery County) account for 75 percent of all Title I students in the state. Over the past 10 years the number of Title I students in the state has varied from a low of 145,000 (2009-10) to a high of 171,000 (2014-15). Annual swings of plus or minus 10,000 to 15,000 were not unusual. No clear enrollment trends were apparent. Table A16 in the Appendix provides detail on Title I program enrollment for each school year from 2005-06 to 2014-15
Free- and reduced-price meal counts are used to establish funding levels for several federal funding programs. In 2005, the percentage of students eligible for free- and reduced- priced meals ranged from a low of 9.4 percent of total enrollment in Carroll County to a high of 75.6 percent in Baltimore City. In 2005, the state average was 32.5 percent amounting to 278,905 students. By 2014, Carroll County’s percentage had more than doubled to 19.8 county of total enrollment, but still remained the lowest percentage in the state. Baltimore City’s percentage remained the highest at 85.7 percent, an increase of 10.1 percent from 2005 to 2014. The state average increased by 12.8 percent to 45.3 percent, which was an increase of 113,620 eligible students. By 2014, 392,525 students were eligible for free- and reduced-price meals.
Across districts, there was no definite pattern in the percent change in Title I program enrollment over either five-year period. Some districts experienced large percent decreases, while others had large percent increases. Even the statewide percentages were mixed and did not show patterns over either five-year period. There was a statewide decrease (-3.2 percent) over the first five-year period and a statewide
Final Report of the Study of Increasing and Declining Enrollment in Maryland Public Schools
18
increase (14.0 percent) over the second five-year period. Combined, these two five-year periods resulted in a statewide increase (10.4 percent, or a net addition of 16,179 Title I students) from 2005-06 to 2014-15. Table A17 in the Appendix provides details on the changes in Title I enrollment from 2005-06 to 2014-15. As was the case with ELL student data, some Title I student data (i.e. data on Title I students as percentages of total district enrollment) was suppressed due to the small number of students. For those districts where Title I student data were fully available at the elementary, middle, and high school levels, Title I students were most concentrated at the elementary level, followed by the middle school level and then the high school level. Table A18 in the Appendix provides detail on the number of Title I students as a percentage of total enrollment where data were available.
Conclusions from Enrollment Data Analysis
All of the district enrollment data analyzed – total enrollment, enrollment by grade level, and special population enrollment (e.g. special education, ELL, and Title I enrollment) – indicate significant variation among districts. Many districts have experienced both increases and decreases in enrollment at some point during the past 10 years. Even if the changes in enrollment numbers had been predictable, adjusting to the changes would l have been difficult for these districts. When enrollment increases, it is relatively easy to justify added expenditures. When enrollment decreases, however, it is more difficult to justify reductions in expenditures due to the fixed nature of some expenditures (fixed costs, variable costs, and overall expenditures, are explained in more detail in the Adjusting to Changing Enrollment section). Until enrollment decreases are confirmed as longer-term phenomena, district administrators tend to be reluctant to reduce expenditures, especially when this requires reductions in staff or closing schools.
Enrollment projections indicate that the increase in birth rates that occurred prior to the 2007-2009 economic recession will lead to growing secondary enrollment in the future. In the next 10 years, secondary enrollment will reach the highest levels ever. At the same time, the decrease in birth rates that occurred in the wake of the economic recession will influence elementary enrollment. In the next 10 years, elementary enrollment will decrease. As these birth rate trends begin to influence different grade levels, school systems may face difficult operational decisions (e.g. staff cuts and/or additions, changes in attendance boundaries, and/or school closures).
The recession’s impact on birth rates varies among districts, making future enrollment projections uncertain. The prevalent enrollment projection methodology – grade progression or cohort survival – forecasts trends of the recent past into the future. Cohort survival projections may not adequately react to rapid changes in birth rates. For example, when birth rates that had been steadily rising suddenly declined due to the economic uncertainty of the recession, enrollment projections became much less certain. As another example, if birth rates were to increase due to an economic rebound, then enrollment projections might become similarly uncertain. Thus, it is critically important that birth rates and enrollment projections are regularly calculated, monitored, and analyzed over the next few years. It is also critically important that these calculations and analyses are communicated to district administrators.
Final Report of the Study of Increasing and Declining Enrollment in Maryland Public Schools
19
Recommendations on Enrollment Data and Analysis
The economic recession of 2007 through 2009 had a number of impacts on school enrollment in Maryland. In many areas of the state birth rates declined. Many people chose to remain in their homes rather than purchase new homes, so construction of new homes slowed dramatically. As the economy improves birth rates should also increase. Additionally, demand for new housing could increase. Potential increases in birth rates and in housing demand could have significant impacts on school enrollment and school attendance boundaries, particularly at the elementary level. This potential for population growth and migration across communities is another factor that needs to be monitored and assessed regularly in the next few years. Enrollment projections can be enhanced using the latest versions of Geographic Information Systems (GIS) software. Enhanced projections could better take into account factors such as neighborhood population change and its impact on enrollment at the school attendance area level.
Change in Operating Factors
Over time, districts are expected to adjust their operations to account for changes in enrollment. As enrollment increases, additional resources are needed; as enrollment declines, some portion of resources may be reduced. The following analysis examines district responses from 2005-06 through 2014-15 to enrollment changes as they relate to several key school system operating measures: number of schools, number of instructional staff, and number of non-instructional staff.
Changes in the Number of Schools
For the purposes of this analysis, a school is defined as a program with enrolled students that has an MSDE-assigned school number. This broad definition is necessary given the challenges of defining a school in exact terms. For example, limiting the definition of a school to a single school building fails to account for arrangements where multiple schools are co-located in a single building. Alternative school programs present another challenge. Maryland’s districts operate a number of alternative schools designed to serve students who struggle in traditional school settings. In some cases, an alternative school program is housed in its own building. In other cases, an alternative school program is housed in a building along with a traditional school program. A more narrow definition of school would consider the alternative program a school in the first case, but not second.
Districts take a variety of approaches to housing school programs and the definition presented above is the most straightforward and objective definition available to the research team. This count also includes charter schools located in a district, because charters (1) primarily serve students residing within specific districts and (2) were authorized by county boards of education. However, in several districts – especially Baltimore City and Prince George’s County (which house 37 charter schools and eight charter schools,
Final Report of the Study of Increasing and Declining Enrollment in Maryland Public Schools
20
respectively)4 – the inclusion or exclusion of charters under the definition of school will have effects on the current analysis. These effects are noted where appropriate.
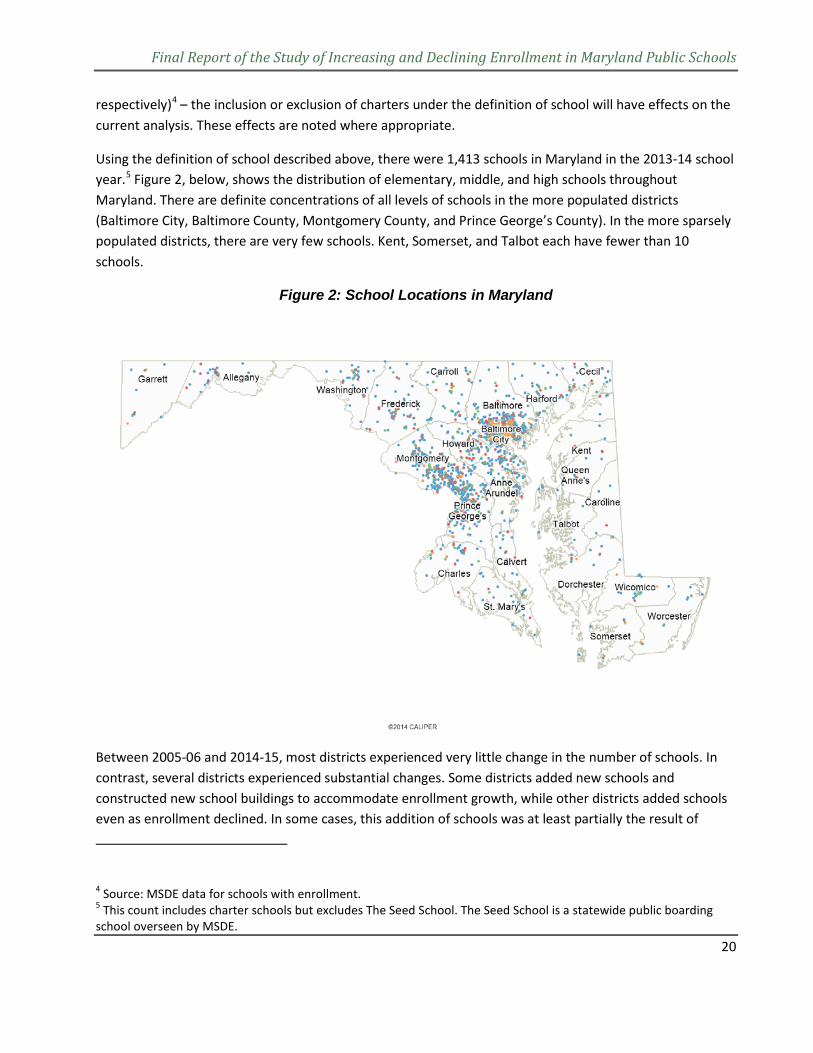
Using the definition of school described above, there were 1,413 schools in Maryland in the 2013-14 school year.5 Figure 2, below, shows the distribution of elementary, middle, and high schools throughout Maryland. There are definite concentrations of all levels of schools in the more populated districts (Baltimore City, Baltimore County, Montgomery County, and Prince George’s County). In the more sparsely populated districts, there are very few schools. Kent, Somerset, and Talbot each have fewer than 10 schools.
Figure 2: School Locations in Maryland
Between 2005-06 and 2014-15, most districts experienced very little change in the number of schools. In contrast, several districts experienced substantial changes. Some districts added new schools and constructed new school buildings to accommodate enrollment growth, while other districts added schools even as enrollment declined. In some cases, this addition of schools was at least partially the result of
4 Source: MSDE data for schools with enrollment. 5 This count includes charter schools but excludes The Seed School. The Seed School is a statewide public boarding school overseen by MSDE.
Final Report of the Study of Increasing and Declining Enrollment in Maryland Public Schools
21
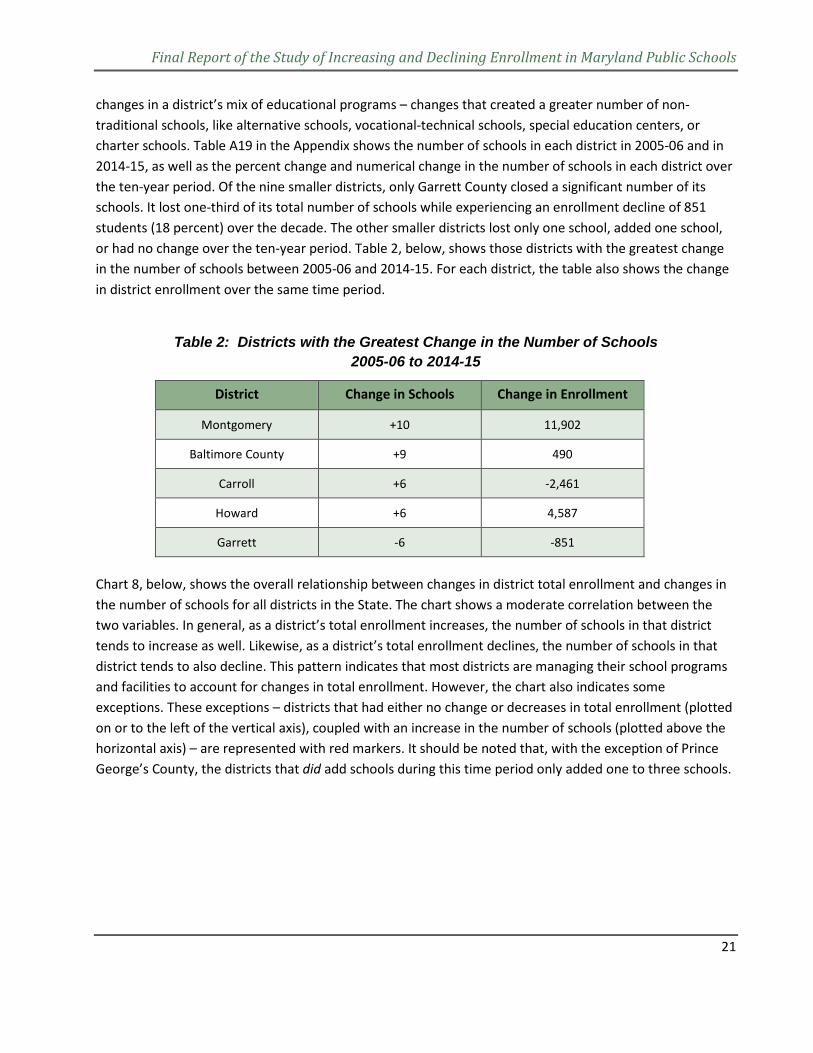
changes in a district’s mix of educational programs – changes that created a greater number of non-traditional schools, like alternative schools, vocational-technical schools, special education centers, or charter schools. Table A19 in the Appendix shows the number of schools in each district in 2005-06 and in 2014-15, as well as the percent change and numerical change in the number of schools in each district over the ten-year period. Of the nine smaller districts, only Garrett County closed a significant number of its schools. It lost one-third of its total number of schools while experiencing an enrollment decline of 851 students (18 percent) over the decade. The other smaller districts lost only one school, added one school, or had no change over the ten-year period. Table 2, below, shows those districts with the greatest change in the number of schools between 2005-06 and 2014-15. For each district, the table also shows the change in district enrollment over the same time period.
Table 2: Districts with the Greatest Change in the Number of Schools
2005-06 to 2014-15
District Change in Schools Change in Enrollment
Montgomery +10 11,902
Baltimore County +9 490
Carroll +6 -2,461
Howard +6 4,587
Garrett -6 -851
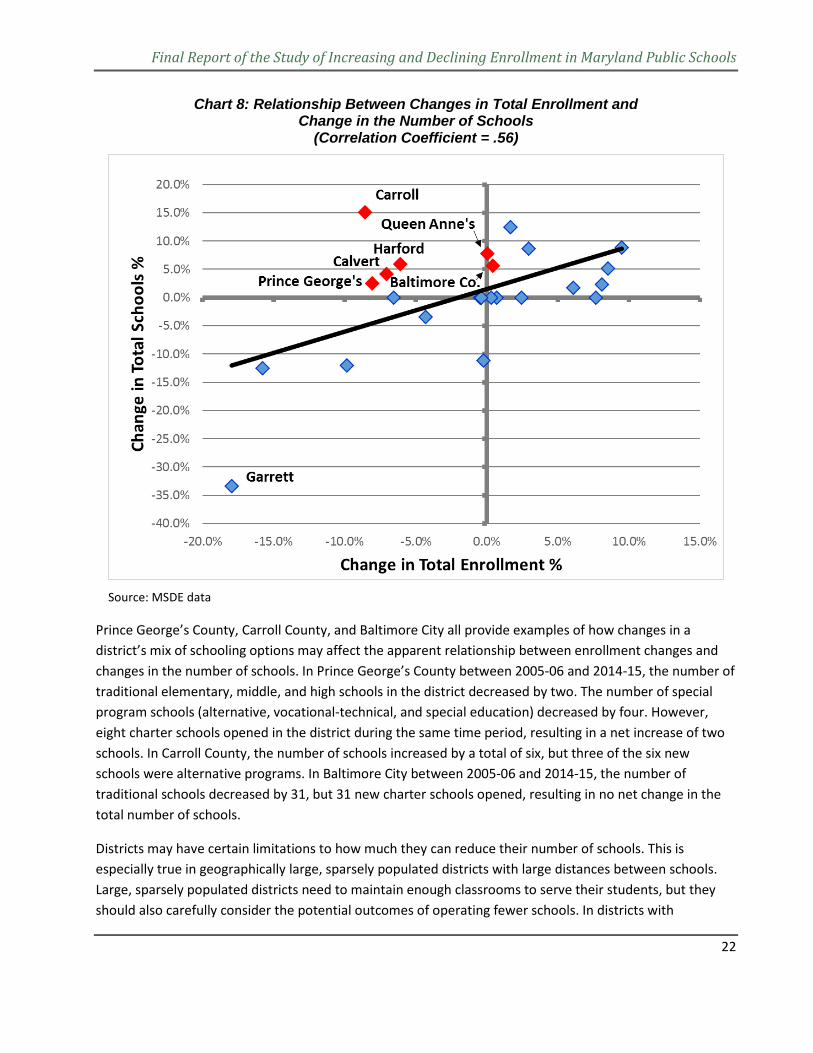
Chart 8, below, shows the overall relationship between changes in district total enrollment and changes in the number of schools for all districts in the State. The chart shows a moderate correlation between the two variables. In general, as a district’s total enrollment increases, the number of schools in that district tends to increase as well. Likewise, as a district’s total enrollment declines, the number of schools in that district tends to also decline. This pattern indicates that most districts are managing their school programs and facilities to account for changes in total enrollment. However, the chart also indicates some exceptions. These exceptions – districts that had either no change or decreases in total enrollment (plotted on or to the left of the vertical axis), coupled with an increase in the number of schools (plotted above the horizontal axis) – are represented with red markers. It should be noted that, with the exception of Prince George’s County, the districts that did add schools during this time period only added one to three schools.
Final Report of the Study of Increasing and Declining Enrollment in Maryland Public Schools
22
Chart 8: Relationship Between Changes in Total Enrollment and Change in the Number of Schools
(Correlation Coefficient = .56)
Source: MSDE data
Prince George’s County, Carroll County, and Baltimore City all provide examples of how changes in a district’s mix of schooling options may affect the apparent relationship between enrollment changes and changes in the number of schools. In Prince George’s County between 2005-06 and 2014-15, the number of traditional elementary, middle, and high schools in the district decreased by two. The number of special program schools (alternative, vocational-technical, and special education) decreased by four. However, eight charter schools opened in the district during the same time period, resulting in a net increase of two schools. In Carroll County, the number of schools increased by a total of six, but three of the six new schools were alternative programs. In Baltimore City between 2005-06 and 2014-15, the number of traditional schools decreased by 31, but 31 new charter schools opened, resulting in no net change in the total number of schools.
Districts may have certain limitations to how much they can reduce their number of schools. This is especially true in geographically large, sparsely populated districts with large distances between schools. Large, sparsely populated districts need to maintain enough classrooms to serve their students, but they should also carefully consider the potential outcomes of operating fewer schools. In districts with
Final Report of the Study of Increasing and Declining Enrollment in Maryland Public Schools
23
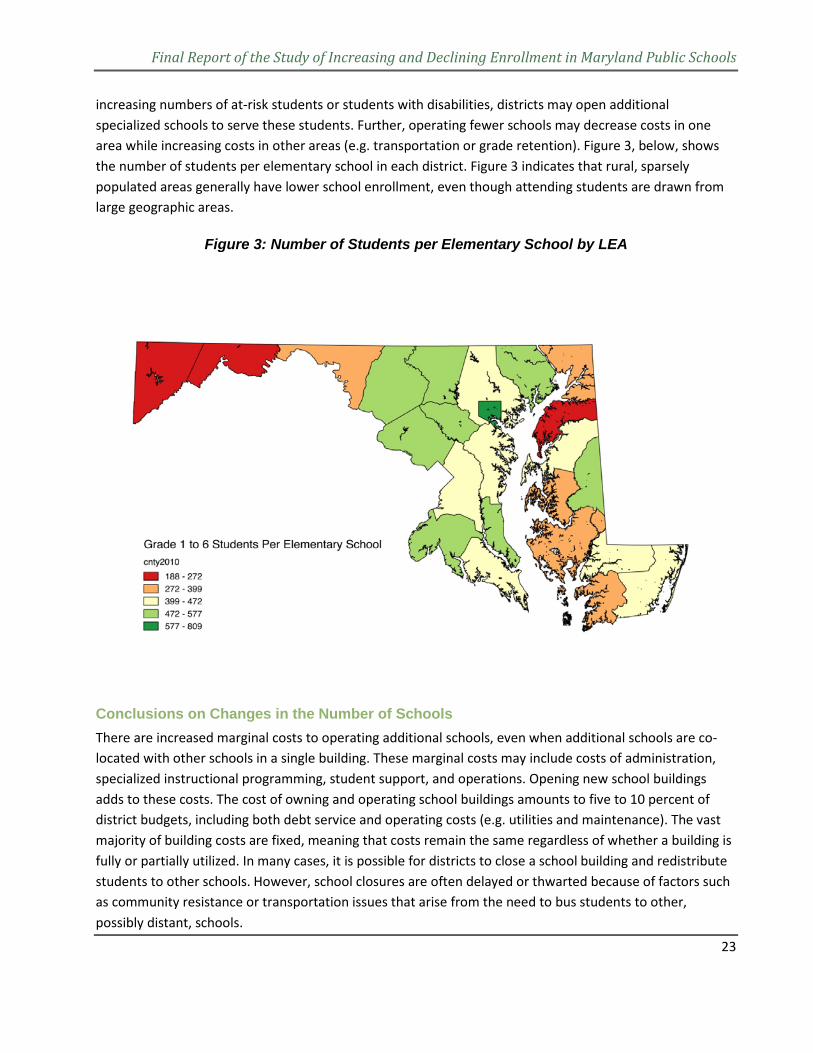
increasing numbers of at-risk students or students with disabilities, districts may open additional specialized schools to serve these students. Further, operating fewer schools may decrease costs in one area while increasing costs in other areas (e.g. transportation or grade retention). Figure 3, below, shows the number of students per elementary school in each district. Figure 3 indicates that rural, sparsely populated areas generally have lower school enrollment, even though attending students are drawn from large geographic areas.
Figure 3: Number of Students per Elementary School by LEA
Conclusions on Changes in the Number of Schools There are increased marginal costs to operating additional schools, even when additional schools are co-located with other schools in a single building. These marginal costs may include costs of administration, specialized instructional programming, student support, and operations. Opening new school buildings adds to these costs. The cost of owning and operating school buildings amounts to five to 10 percent of district budgets, including both debt service and operating costs (e.g. utilities and maintenance). The vast majority of building costs are fixed, meaning that costs remain the same regardless of whether a building is fully or partially utilized. In many cases, it is possible for districts to close a school building and redistribute students to other schools. However, school closures are often delayed or thwarted because of factors such as community resistance or transportation issues that arise from the need to bus students to other, possibly distant, schools.
Final Report of the Study of Increasing and Declining Enrollment in Maryland Public Schools
24
Since 2008, birth rates have been declining in many areas across Maryland. These declines in birth rates will lead to commensurate declines in school enrollment, opening up the possibility that a number of school programs and buildings will be underutilized for a number of years. This possibility exists even though the economy may begin to rebound, and birth rates may begin to rebound along with it. Over the next several years, district administrators should monitor birth rates and elementary school attendance to determine whether birth rates are beginning to rise. If districts do carry out school building closures, it may be wise for districts to retain school buildings, rather than sell them, in the event that an economic rebound results in increasing birth rates. This is particularly true for secondary schools. If birth rates and, subsequently, school enrollment numbers increase to prior levels over time, then the school buildings will be available to accommodate the increased numbers of students.
Recommendations on Changes in the Number of Schools School program and building capacities should be calculated with the needs of students and a contemporary school program in mind. Enrollment projections should be updated annually and measured against school building capacities. Socioeconomic and demographic factors that affect ELL program requirements should also be researched and monitored because an increasing number of immigrant students entering Maryland schools would require higher-capacity school buildings as well as higher numbers of specialized programs and staff to serve ELL students. School systems may need technical assistance to help create and analyze detailed enrollment projections, based on both school attendance areas and student subgroups (e.g. Title I, ELL, and special education). During this especially uncertain period of birth rate fluctuation, other state agencies should make efforts to collect and share relevant information as quickly as possible. If these enrollment projections warrant redistricting and/or school closures, then school systems may need additional technical assistance to implement these difficult changes.
Changes in the Number of Staff
This section examines the relationship between enrollment and staffing levels at the state and district levels. The analysis covers both instructional and non-instructional staff.
Instructional Staff Instructional staff are at the core of district operations. They provide both teaching and direct academic support services for students. The total number of instructional staff in the state has remained fairly stable since the 2005-06 school year, ranging from about 78,000 to 80,000 between 2005-06 and 2013-14. However, among individual districts, numbers of instructional staff have varied. Instructional staff numbers in some districts have remained constant, while numbers of staff in other districts have increased in some cases, decreased in others, or fluctuated between increases and decreases over time (See Table A20 in the Appendix for more details).
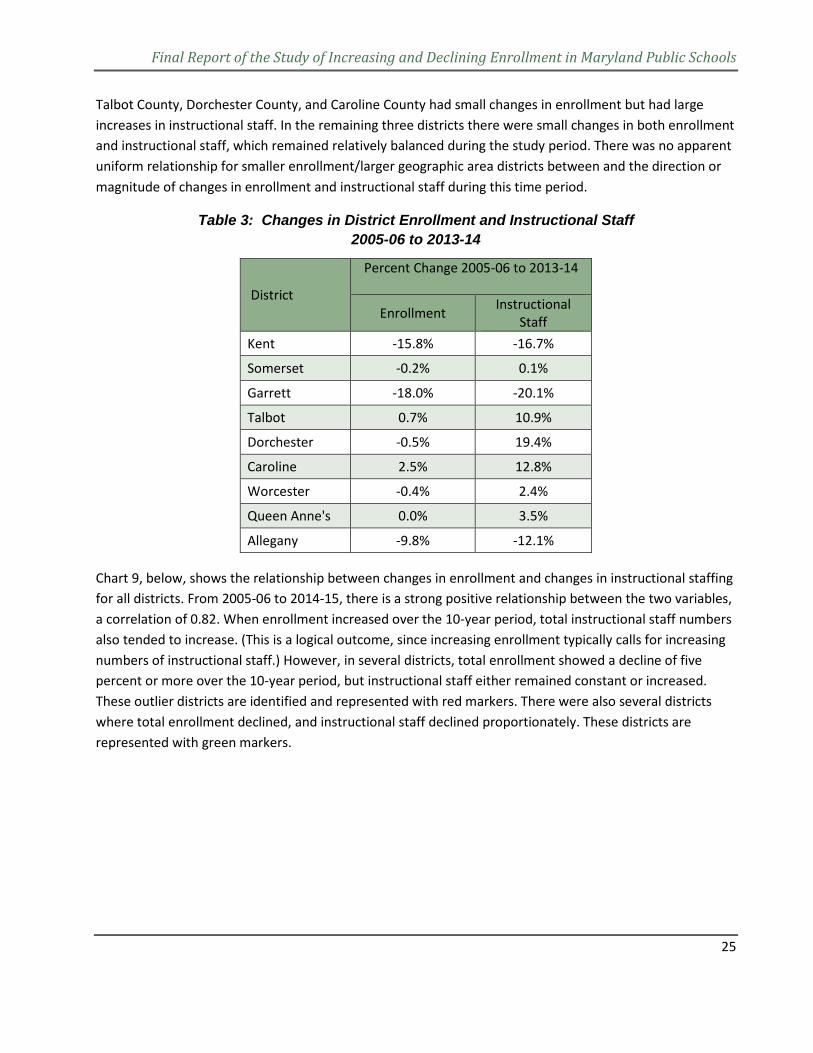
Table 3 below focuses on the smaller enrollment/larger geographic area districts to compare their changes in enrollment with the changes in instructional staff over the period 2005-06 to 2013-14. There are no clear patterns across the nine districts. Three districts, Kent County, Garrett County, and Allegany County, showed responsiveness to changing conditions, e.g. as their enrollment declined so did instructional staff.
Final Report of the Study of Increasing and Declining Enrollment in Maryland Public Schools
25
Talbot County, Dorchester County, and Caroline County had small changes in enrollment but had large increases in instructional staff. In the remaining three districts there were small changes in both enrollment and instructional staff, which remained relatively balanced during the study period. There was no apparent uniform relationship for smaller enrollment/larger geographic area districts between and the direction or magnitude of changes in enrollment and instructional staff during this time period.
Table 3: Changes in District Enrollment and Instructional Staff 2005-06 to 2013-14
District
Percent Change 2005-06 to 2013-14
Enrollment Instructional Staff
Kent -15.8% -16.7%
Somerset -0.2% 0.1%
Garrett -18.0% -20.1%
Talbot 0.7% 10.9%
Dorchester -0.5% 19.4%
Caroline 2.5% 12.8%
Worcester -0.4% 2.4%
Queen Anne's 0.0% 3.5%
Allegany -9.8% -12.1%
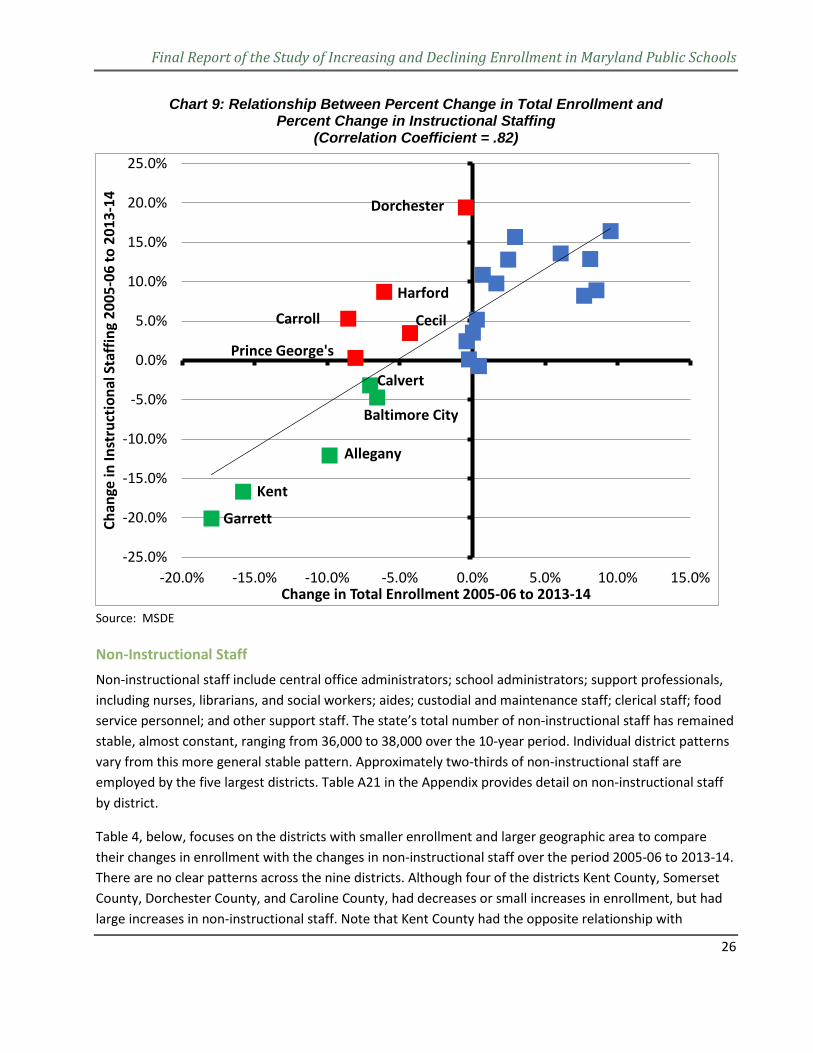
Chart 9, below, shows the relationship between changes in enrollment and changes in instructional staffing for all districts. From 2005-06 to 2014-15, there is a strong positive relationship between the two variables, a correlation of 0.82. When enrollment increased over the 10-year period, total instructional staff numbers also tended to increase. (This is a logical outcome, since increasing enrollment typically calls for increasing numbers of instructional staff.) However, in several districts, total enrollment showed a decline of five percent or more over the 10-year period, but instructional staff either remained constant or increased. These outlier districts are identified and represented with red markers. There were also several districts where total enrollment declined, and instructional staff declined proportionately. These districts are represented with green markers.
Final Report of the Study of Increasing and Declining Enrollment in Maryland Public Schools
26
Chart 9: Relationship Between Percent Change in Total Enrollment and Percent Change in Instructional Staffing
(Correlation Coefficient = .82)
Source: MSDE
Non-Instructional Staff Non-instructional staff include central office administrators; school administrators; support professionals, including nurses, librarians, and social workers; aides; custodial and maintenance staff; clerical staff; food service personnel; and other support staff. The state’s total number of non-instructional staff has remained stable, almost constant, ranging from 36,000 to 38,000 over the 10-year period. Individual district patterns vary from this more general stable pattern. Approximately two-thirds of non-instructional staff are employed by the five largest districts. Table A21 in the Appendix provides detail on non-instructional staff by district.
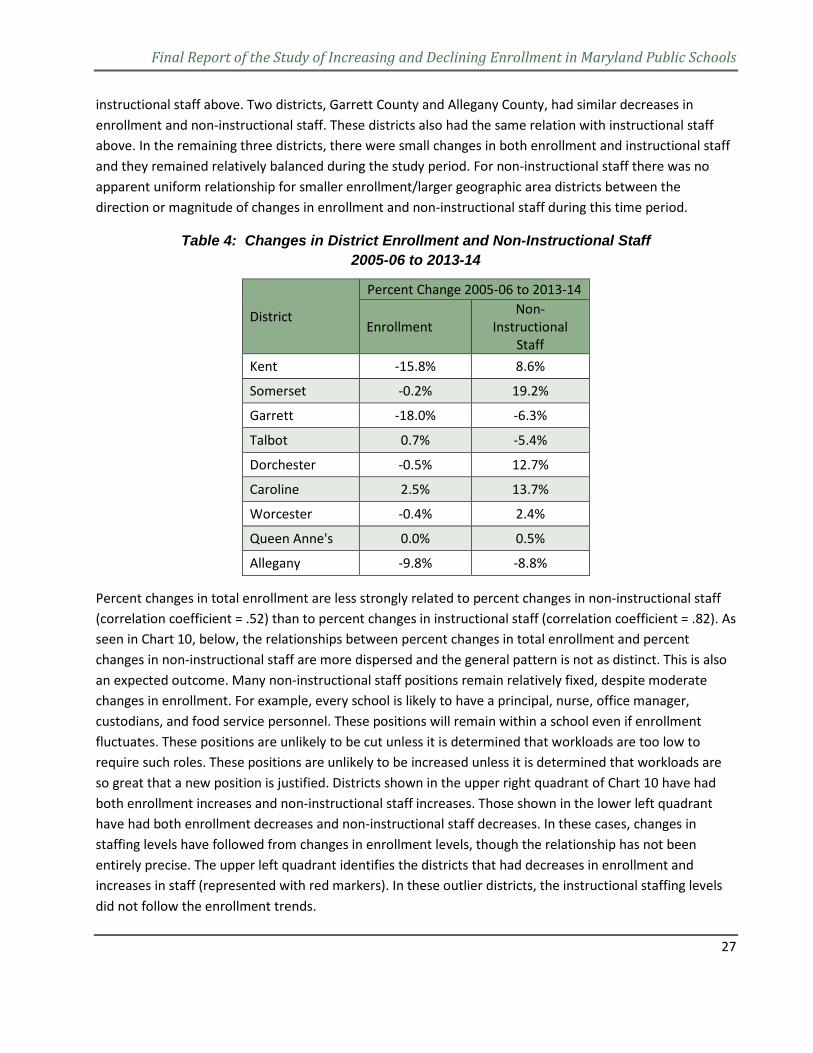
Table 4, below, focuses on the districts with smaller enrollment and larger geographic area to compare their changes in enrollment with the changes in non-instructional staff over the period 2005-06 to 2013-14. There are no clear patterns across the nine districts. Although four of the districts Kent County, Somerset County, Dorchester County, and Caroline County, had decreases or small increases in enrollment, but had large increases in non-instructional staff. Note that Kent County had the opposite relationship with
-25.0%
-20.0%
-15.0%
-10.0%
-5.0%
0.0%
5.0%
10.0%
15.0%
20.0%
25.0%
-20.0% -15.0% -10.0% -5.0% 0.0% 5.0% 10.0% 15.0%
Chan
ge in
Inst
ruct
iona
l Sta
ffin
g 20
05-0
6 to
201
3-14
Change in Total Enrollment 2005-06 to 2013-14
Dorchester
Harford
Cecil Carroll
Prince George's
Calvert
Baltimore City
Allegany
Kent
Garrett
Final Report of the Study of Increasing and Declining Enrollment in Maryland Public Schools
27
instructional staff above. Two districts, Garrett County and Allegany County, had similar decreases in enrollment and non-instructional staff. These districts also had the same relation with instructional staff above. In the remaining three districts, there were small changes in both enrollment and instructional staff and they remained relatively balanced during the study period. For non-instructional staff there was no apparent uniform relationship for smaller enrollment/larger geographic area districts between the direction or magnitude of changes in enrollment and non-instructional staff during this time period.
Table 4: Changes in District Enrollment and Non-Instructional Staff 2005-06 to 2013-14
District
Percent Change 2005-06 to 2013-14
Enrollment Non-
Instructional Staff
Kent -15.8% 8.6%
Somerset -0.2% 19.2%
Garrett -18.0% -6.3%
Talbot 0.7% -5.4%
Dorchester -0.5% 12.7%
Caroline 2.5% 13.7%
Worcester -0.4% 2.4%
Queen Anne's 0.0% 0.5%
Allegany -9.8% -8.8%
Percent changes in total enrollment are less strongly related to percent changes in non-instructional staff (correlation coefficient = .52) than to percent changes in instructional staff (correlation coefficient = .82). As seen in Chart 10, below, the relationships between percent changes in total enrollment and percent changes in non-instructional staff are more dispersed and the general pattern is not as distinct. This is also an expected outcome. Many non-instructional staff positions remain relatively fixed, despite moderate changes in enrollment. For example, every school is likely to have a principal, nurse, office manager, custodians, and food service personnel. These positions will remain within a school even if enrollment fluctuates. These positions are unlikely to be cut unless it is determined that workloads are too low to require such roles. These positions are unlikely to be increased unless it is determined that workloads are so great that a new position is justified. Districts shown in the upper right quadrant of Chart 10 have had both enrollment increases and non-instructional staff increases. Those shown in the lower left quadrant have had both enrollment decreases and non-instructional staff decreases. In these cases, changes in staffing levels have followed from changes in enrollment levels, though the relationship has not been entirely precise. The upper left quadrant identifies the districts that had decreases in enrollment and increases in staff (represented with red markers). In these outlier districts, the instructional staffing levels did not follow the enrollment trends.
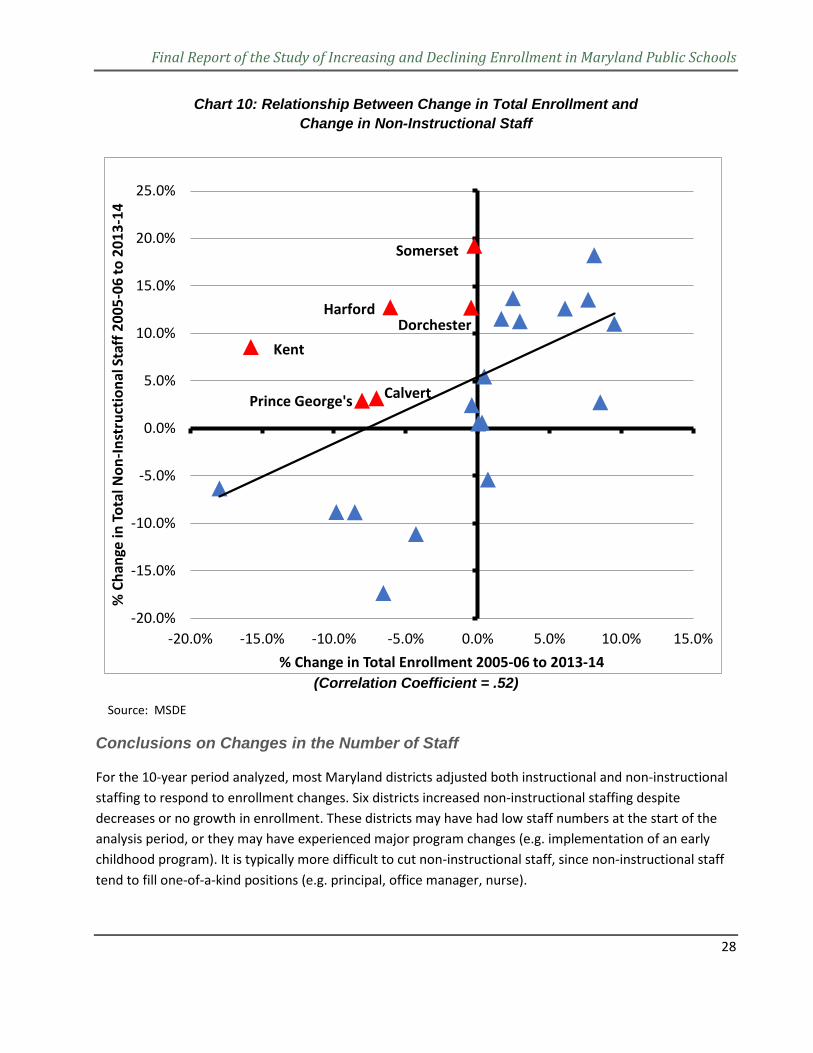
Final Report of the Study of Increasing and Declining Enrollment in Maryland Public Schools
28
Chart 10: Relationship Between Change in Total Enrollment and Change in Non-Instructional Staff
(Correlation Coefficient = .52)
Source: MSDE
Conclusions on Changes in the Number of Staff
For the 10-year period analyzed, most Maryland districts adjusted both instructional and non-instructional staffing to respond to enrollment changes. Six districts increased non-instructional staffing despite decreases or no growth in enrollment. These districts may have had low staff numbers at the start of the analysis period, or they may have experienced major program changes (e.g. implementation of an early childhood program). It is typically more difficult to cut non-instructional staff, since non-instructional staff tend to fill one-of-a-kind positions (e.g. principal, office manager, nurse).
-20.0%
-15.0%
-10.0%
-5.0%
0.0%
5.0%
10.0%
15.0%
20.0%
25.0%
-20.0% -15.0% -10.0% -5.0% 0.0% 5.0% 10.0% 15.0%
% C
hang
e in
Tota
l Non
-Inst
ruct
iona
l Sta
ff 2
005-
06 to
201
3-14
% Change in Total Enrollment 2005-06 to 2013-14
Somerset
Harford
Calvert Prince George's
Kent Dorchester
Final Report of the Study of Increasing and Declining Enrollment in Maryland Public Schools
29
Recommendations on Changes in the Number of Staff
School funding should maintain a direct relationship to enrollment, though revenue adjustments could be used in select cases to lessen the fiscal impact of enrollment declines. Changes in the State’s funding formula calculations could be implemented to give districts additional time to adjust to enrollment decreases. For example, the student count used in the foundation formula could incorporate a multi-year rolling average so that decreases in enrollment are spread out over several years. The State should provide technical assistance to school systems that must make difficult decisions due to declining enrollment. This technical assistance would involve strategies for enhancing the accuracy of district enrollment projections that more accurately forecast the impacts of declining birth rates and changes to program enrollment. It would also be beneficial to provide technical assistance for decision making on staffing level adjustments and the relationship to school facility utilization and redistricting of attendance boundaries. Modern geographic information system (GIS) software could be very useful in helping forecast enrollment and subsequent staffing adjustments.
Transportation
Transportation expenditures amounted to 5.3 percent of total public school spending in 2012-13.6 Overall transportation costs are determined by the number of pupils transported, driver compensation, maintenance costs, vehicle fuel costs, and other operating costs. The population density of a district influences costs because areas with lower population densities tend to require buses to drive more miles than areas with higher population densities. Even with longer miles, the need to maintain reasonable ride times may not allow the seating capacity to be used fully. In urbanized areas traffic congestion may also require longer drive times at higher labor rates. More strategic travel routes and better utilization of available seats can influence bus route efficiency.
Number of Pupils Transported
Statewide, the total number of non-disabled pupils being transported declined only slightly between 2005-06 and 2014-15. However, significant changes have occurred at the district level. Some of these changes have resulted from changes in school system policies and practices that have made more students eligible for transportation services. Shifts in district total enrollment have also driven changes at the district level.
Statewide, there was a 2.7 percent decrease in the number of regular students transported. However, two districts experienced large changes. Calvert County experienced a 25.7 percent decrease (a reduction of 4,430 pupils), while Talbot County saw a 58.8 percent increase (a gain of 1,599 pupils). Other districts that also saw large decreases in numbers, but not percentages included Baltimore City (-1,372), Carroll County (2,380), Frederick County (5,046), Harford County (3,292), and Prince George’s County (7,115).
6 The most recent year of data available at the time of these analyses.
Final Report of the Study of Increasing and Declining Enrollment in Maryland Public Schools
30
For more detailed information on the numbers of non-disabled pupils transported by district between 2005-06 and 2014-15 and the percent changes in the number of students transported over this same period, see Table A22 and Table A23 in the Appendix.
Transportation of disabled pupils is often very expensive. Disabled students tend to be placed in highly specialized programs in distant locations. These students may require wheelchair-accessible vehicles or other specialized vehicles. The passenger capacity of such vehicles is typically low. In recent years, some large districts have experienced decreases in the number of disabled pupils requiring transportation from the school system. Meanwhile, some smaller districts have experienced significant increases in the number of disabled pupils requiring transportation from the school system. Table A24 in the Appendix shows the number of disabled pupils transported for the years 2005-06 through 2013-14. Over this period, six districts (Charles County, Queen Anne’s County, St. Mary’s County, Somerset County, Talbot County, and Worcester County) have seen the numbers of disabled pupils requiring transportation increase by 30 percent or more. In other districts, the numbers of disabled pupils requiring transportation are very small. Additionally, Table A25 in the Appendix shows the changes in percent and number of disabled students transported by districts over this time period.
Chart 11, below, is a scattergram indicating a weak relationship between special education enrollment and number of disabled pupils transported. Over the last 10 years, most districts have experienced both a decrease in special education enrollment and an increase in numbers of disabled pupils transported. For example, in Talbot County, special education enrollment decreased by more than 10 percent, while the number of disabled pupils transported increased by 100 percent.
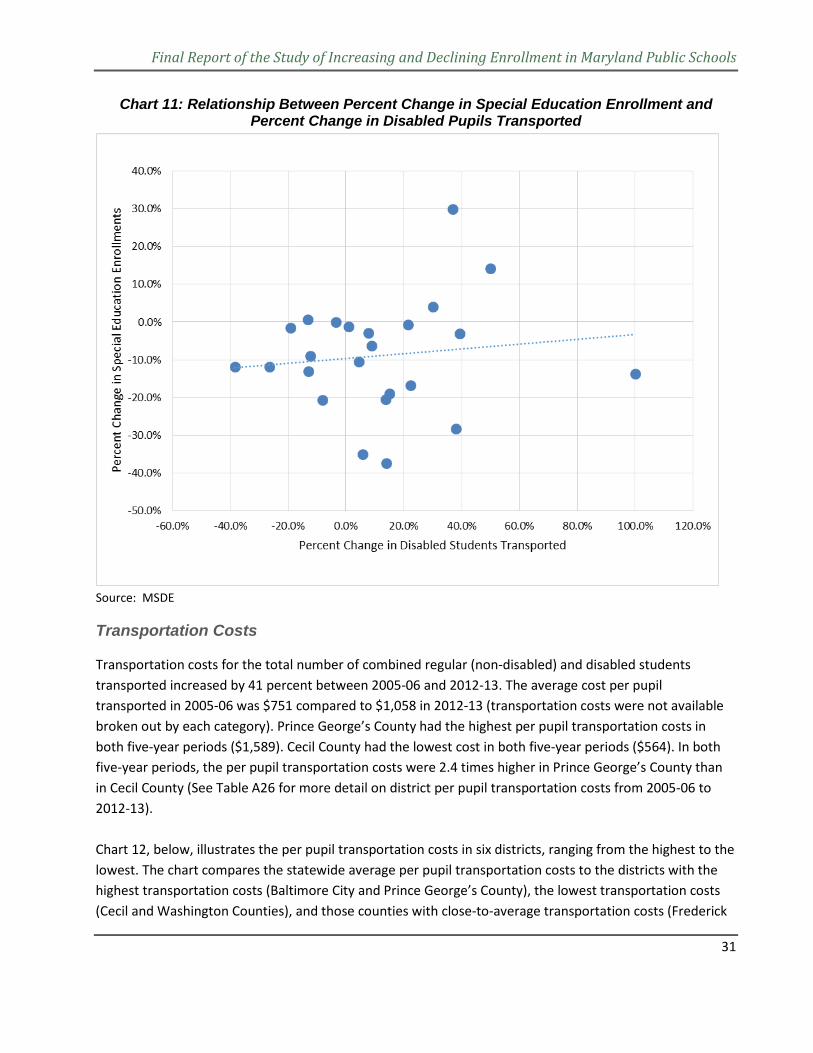
Final Report of the Study of Increasing and Declining Enrollment in Maryland Public Schools
31
Chart 11: Relationship Between Percent Change in Special Education Enrollment and Percent Change in Disabled Pupils Transported
Source: MSDE
Transportation Costs
Transportation costs for the total number of combined regular (non-disabled) and disabled students transported increased by 41 percent between 2005-06 and 2012-13. The average cost per pupil transported in 2005-06 was $751 compared to $1,058 in 2012-13 (transportation costs were not available broken out by each category). Prince George’s County had the highest per pupil transportation costs in both five-year periods ($1,589). Cecil County had the lowest cost in both five-year periods ($564). In both five-year periods, the per pupil transportation costs were 2.4 times higher in Prince George’s County than in Cecil County (See Table A26 for more detail on district per pupil transportation costs from 2005-06 to 2012-13). Chart 12, below, illustrates the per pupil transportation costs in six districts, ranging from the highest to the lowest. The chart compares the statewide average per pupil transportation costs to the districts with the highest transportation costs (Baltimore City and Prince George’s County), the lowest transportation costs (Cecil and Washington Counties), and those counties with close-to-average transportation costs (Frederick
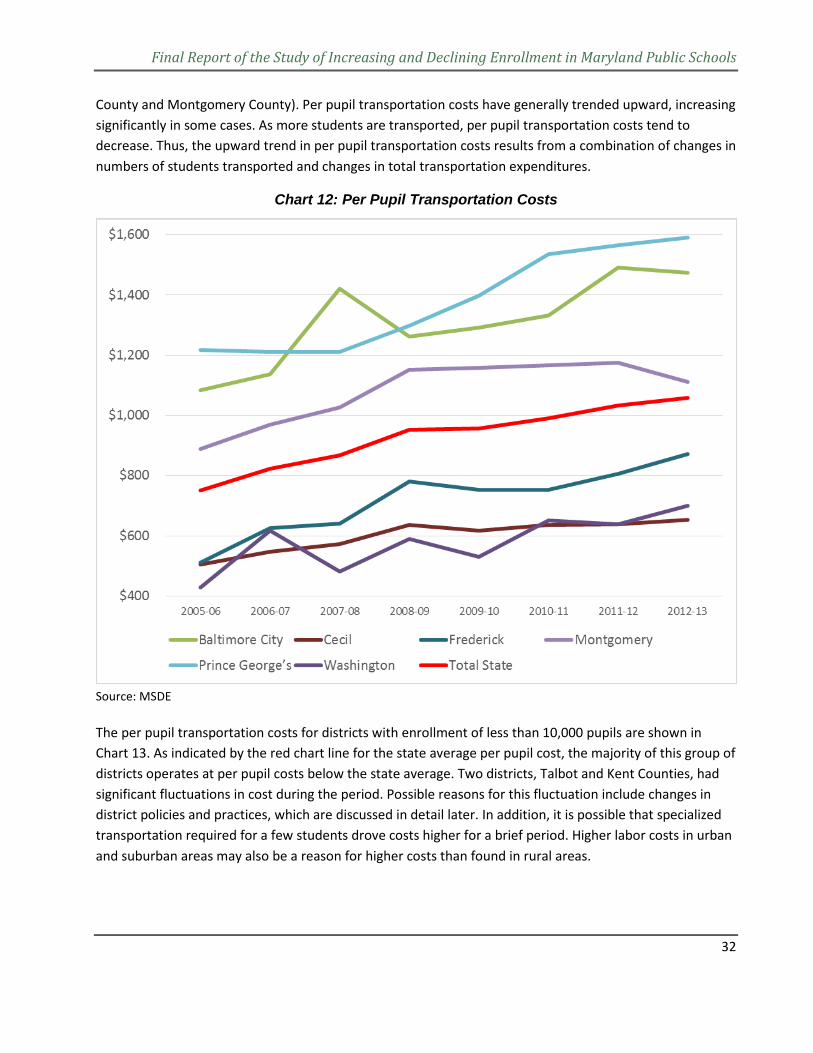
Final Report of the Study of Increasing and Declining Enrollment in Maryland Public Schools
32
County and Montgomery County). Per pupil transportation costs have generally trended upward, increasing significantly in some cases. As more students are transported, per pupil transportation costs tend to decrease. Thus, the upward trend in per pupil transportation costs results from a combination of changes in numbers of students transported and changes in total transportation expenditures.
Chart 12: Per Pupil Transportation Costs
Source: MSDE
The per pupil transportation costs for districts with enrollment of less than 10,000 pupils are shown in Chart 13. As indicated by the red chart line for the state average per pupil cost, the majority of this group of districts operates at per pupil costs below the state average. Two districts, Talbot and Kent Counties, had significant fluctuations in cost during the period. Possible reasons for this fluctuation include changes in district policies and practices, which are discussed in detail later. In addition, it is possible that specialized transportation required for a few students drove costs higher for a brief period. Higher labor costs in urban and suburban areas may also be a reason for higher costs than found in rural areas.
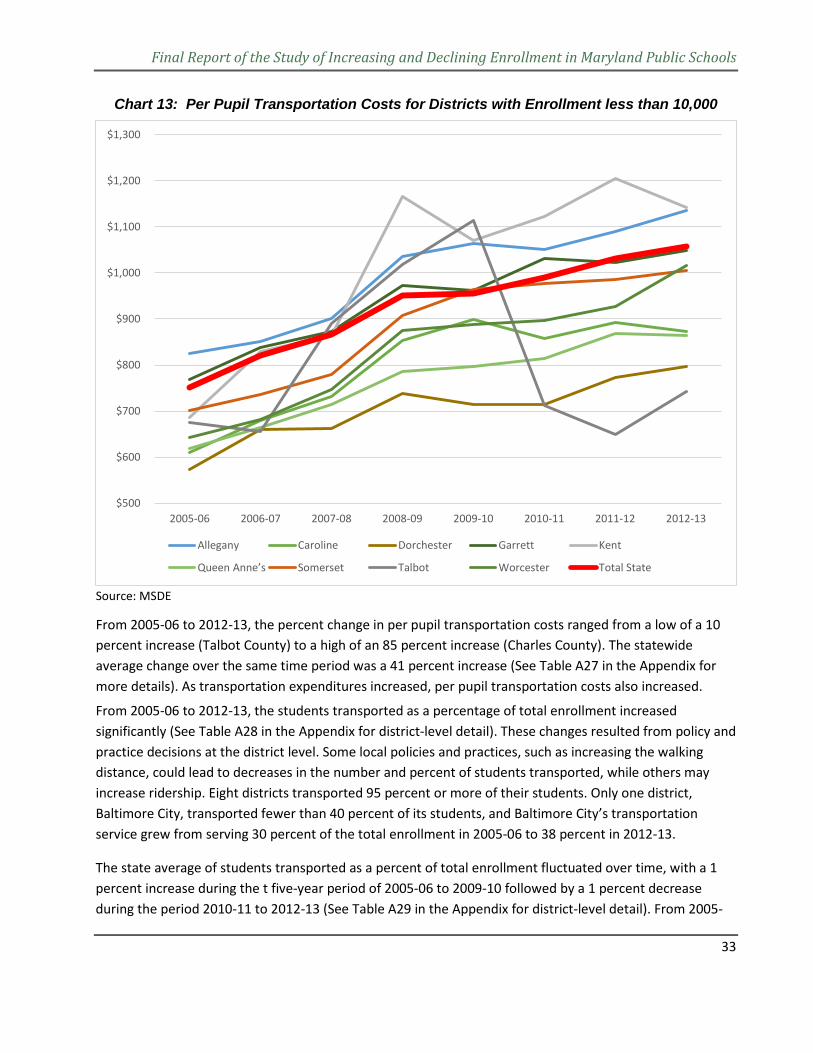
Final Report of the Study of Increasing and Declining Enrollment in Maryland Public Schools
33
Chart 13: Per Pupil Transportation Costs for Districts with Enrollment less than 10,000
Source: MSDE
From 2005-06 to 2012-13, the percent change in per pupil transportation costs ranged from a low of a 10 percent increase (Talbot County) to a high of an 85 percent increase (Charles County). The statewide average change over the same time period was a 41 percent increase (See Table A27 in the Appendix for more details). As transportation expenditures increased, per pupil transportation costs also increased. From 2005-06 to 2012-13, the students transported as a percentage of total enrollment increased significantly (See Table A28 in the Appendix for district-level detail). These changes resulted from policy and practice decisions at the district level. Some local policies and practices, such as increasing the walking distance, could lead to decreases in the number and percent of students transported, while others may increase ridership. Eight districts transported 95 percent or more of their students. Only one district, Baltimore City, transported fewer than 40 percent of its students, and Baltimore City’s transportation service grew from serving 30 percent of the total enrollment in 2005-06 to 38 percent in 2012-13.
The state average of students transported as a percent of total enrollment fluctuated over time, with a 1 percent increase during the t five-year period of 2005-06 to 2009-10 followed by a 1 percent decrease during the period 2010-11 to 2012-13 (See Table A29 in the Appendix for district-level detail). From 2005-
$500
$600
$700
$800
$900
$1,000
$1,100
$1,200
$1,300
2005-06 2006-07 2007-08 2008-09 2009-10 2010-11 2011-12 2012-13
Allegany Caroline Dorchester Garrett Kent
Queen Anne’s Somerset Talbot Worcester Total State
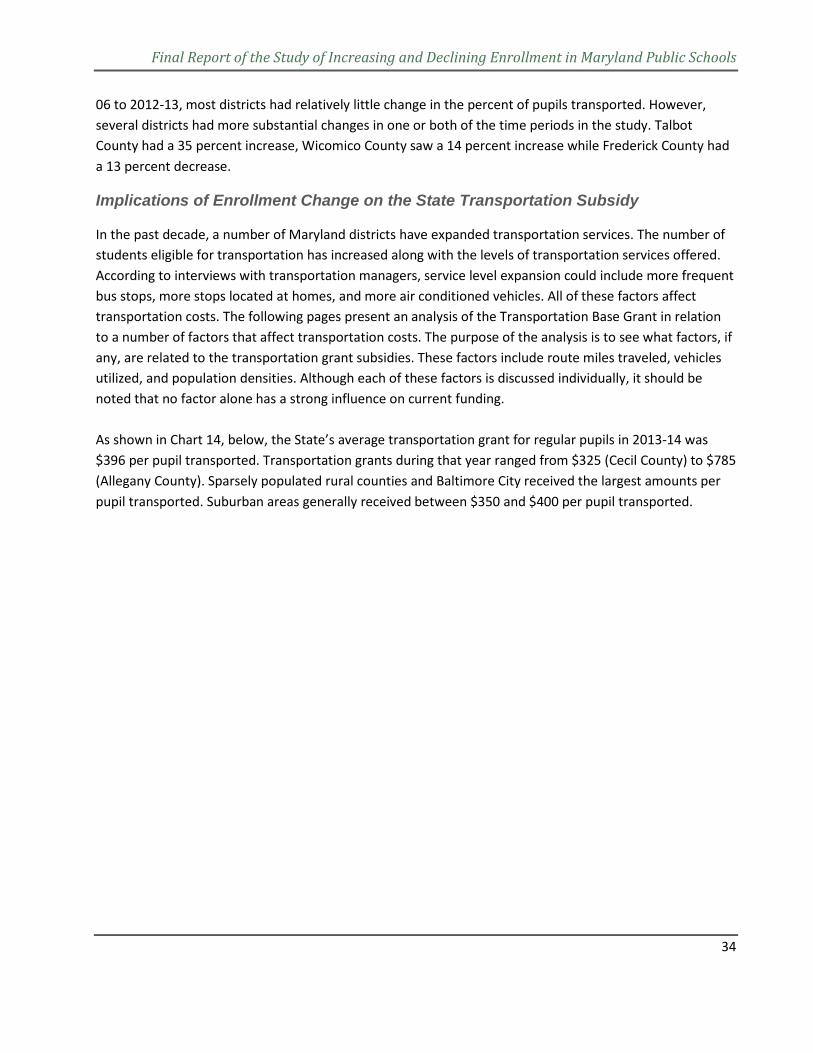
Final Report of the Study of Increasing and Declining Enrollment in Maryland Public Schools
34
06 to 2012-13, most districts had relatively little change in the percent of pupils transported. However, several districts had more substantial changes in one or both of the time periods in the study. Talbot County had a 35 percent increase, Wicomico County saw a 14 percent increase while Frederick County had a 13 percent decrease.
Implications of Enrollment Change on the State Transportation Subsidy
In the past decade, a number of Maryland districts have expanded transportation services. The number of students eligible for transportation has increased along with the levels of transportation services offered. According to interviews with transportation managers, service level expansion could include more frequent bus stops, more stops located at homes, and more air conditioned vehicles. All of these factors affect transportation costs. The following pages present an analysis of the Transportation Base Grant in relation to a number of factors that affect transportation costs. The purpose of the analysis is to see what factors, if any, are related to the transportation grant subsidies. These factors include route miles traveled, vehicles utilized, and population densities. Although each of these factors is discussed individually, it should be noted that no factor alone has a strong influence on current funding. As shown in Chart 14, below, the State’s average transportation grant for regular pupils in 2013-14 was $396 per pupil transported. Transportation grants during that year ranged from $325 (Cecil County) to $785 (Allegany County). Sparsely populated rural counties and Baltimore City received the largest amounts per pupil transported. Suburban areas generally received between $350 and $400 per pupil transported.
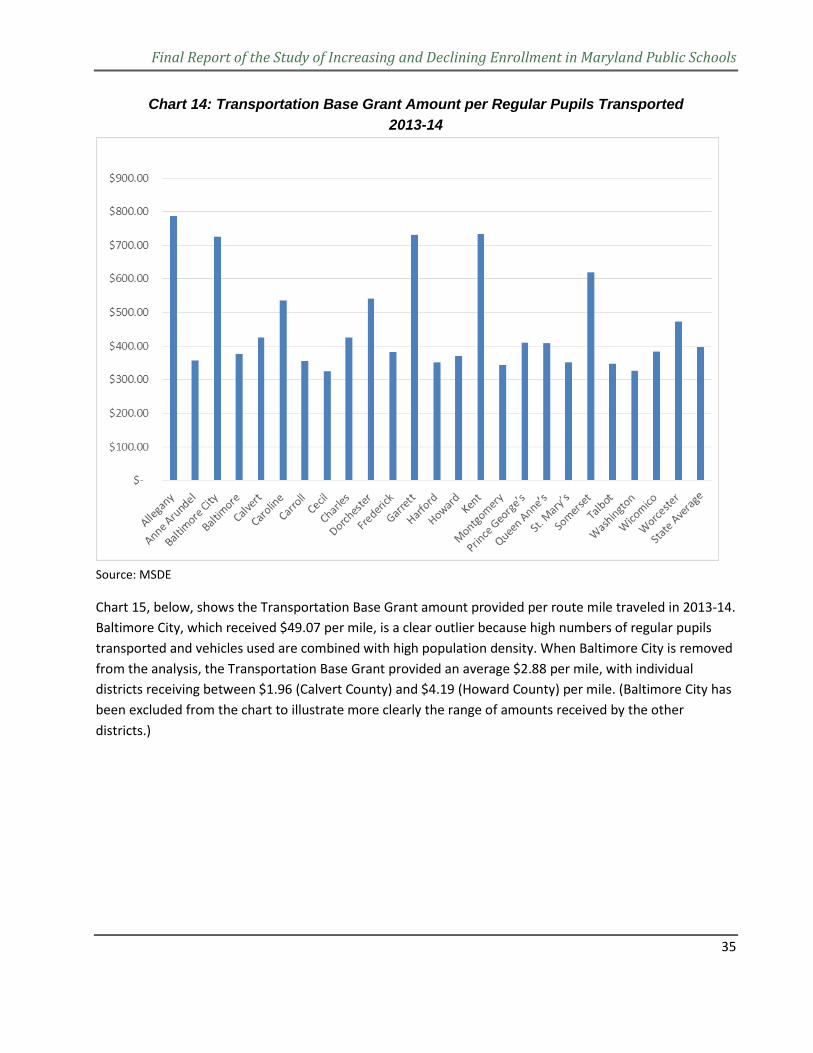
Final Report of the Study of Increasing and Declining Enrollment in Maryland Public Schools
35
Chart 14: Transportation Base Grant Amount per Regular Pupils Transported 2013-14
Source: MSDE
Chart 15, below, shows the Transportation Base Grant amount provided per route mile traveled in 2013-14. Baltimore City, which received $49.07 per mile, is a clear outlier because high numbers of regular pupils transported and vehicles used are combined with high population density. When Baltimore City is removed from the analysis, the Transportation Base Grant provided an average $2.88 per mile, with individual districts receiving between $1.96 (Calvert County) and $4.19 (Howard County) per mile. (Baltimore City has been excluded from the chart to illustrate more clearly the range of amounts received by the other districts.)
Final Report of the Study of Increasing and Declining Enrollment in Maryland Public Schools
36
Chart 15: Transportation Base Grant Amount per Route Mile Traveled 2013-14
Source: MSDE
Chart 16, below, illustrates the Transportation Base Grant amount provided per route vehicle utilized in 2013-14. The Transportation Base Grant provides a state average of $32,034 per route vehicle utilized, with individual districts receiving between $25,635 (Harford County) and $54,462 (Kent County).
$0.00
$0.50
$1.00
$1.50
$2.00
$2.50
$3.00
$3.50
$4.00
$4.50
0Al
lega
nyAn
ne A
rund
elBa
ltim
ore
City
Balti
mor
eCa
lver
tCa
rolin
eCa
rrol
lCe
cil
Char
les
Dorc
hest
erFr
eder
ick
Gar
rett
Harf
ord
How
ard
Kent
Mon
tgom
ery
Prin
ce …
Q
ueen
Ann
e’s
St. M
ary’
s So
mer
set
Talb
otW
ashi
ngto
nW
icom
ico
Wor
cest
erSt
ate
Base
Gra
nt A
mou
nt p
er R
oute
Mile
Tra
vele
d
Baltimore City excluded at $49.07/mile
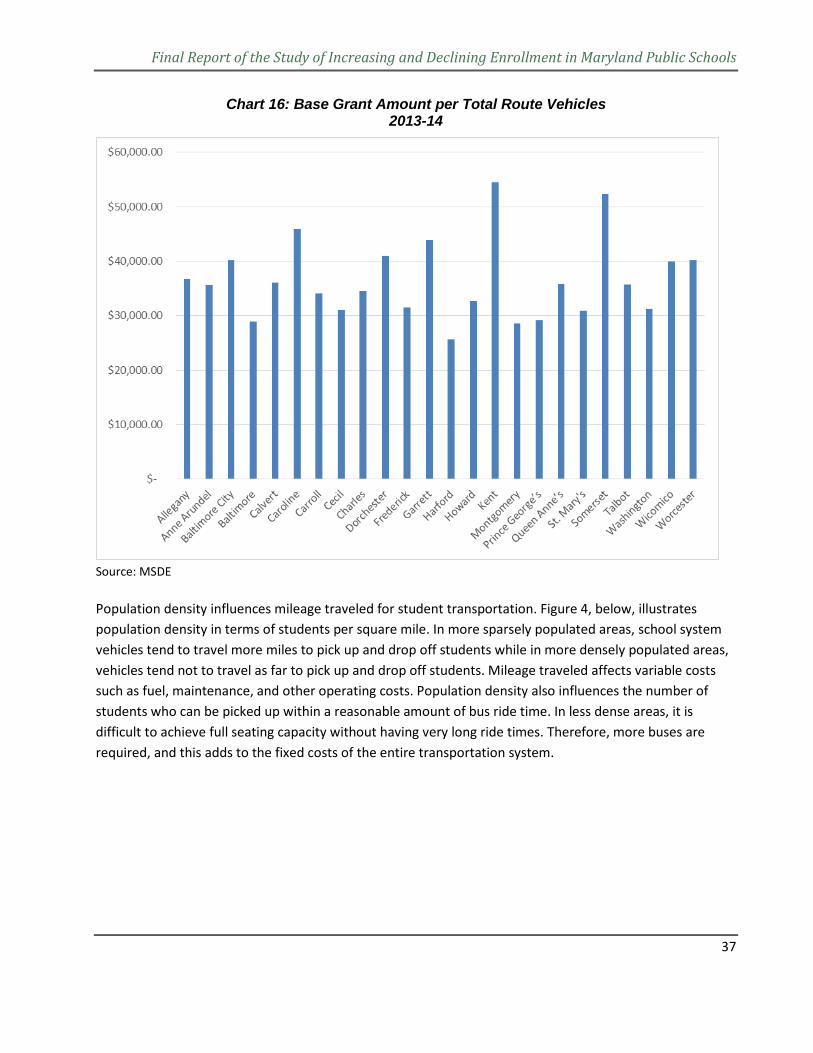
Final Report of the Study of Increasing and Declining Enrollment in Maryland Public Schools
37
Chart 16: Base Grant Amount per Total Route Vehicles 2013-14
Source: MSDE Population density influences mileage traveled for student transportation. Figure 4, below, illustrates population density in terms of students per square mile. In more sparsely populated areas, school system vehicles tend to travel more miles to pick up and drop off students while in more densely populated areas, vehicles tend not to travel as far to pick up and drop off students. Mileage traveled affects variable costs such as fuel, maintenance, and other operating costs. Population density also influences the number of students who can be picked up within a reasonable amount of bus ride time. In less dense areas, it is difficult to achieve full seating capacity without having very long ride times. Therefore, more buses are required, and this adds to the fixed costs of the entire transportation system.
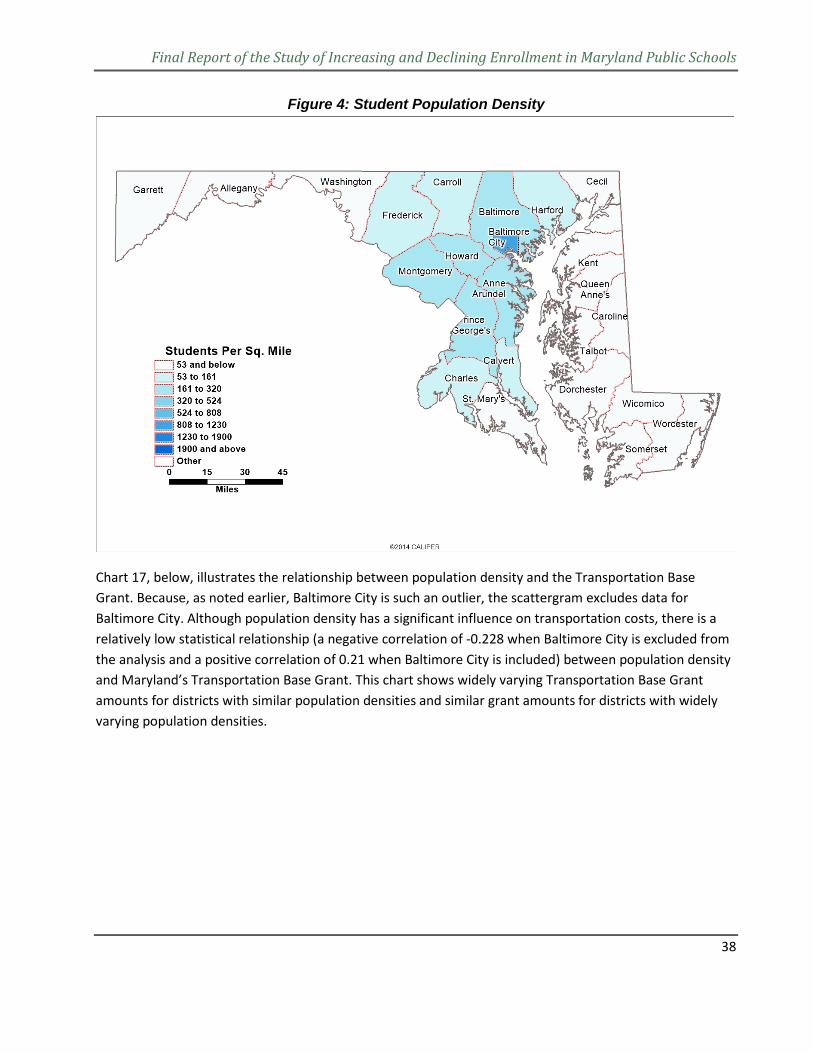
Final Report of the Study of Increasing and Declining Enrollment in Maryland Public Schools
38
Figure 4: Student Population Density
Chart 17, below, illustrates the relationship between population density and the Transportation Base Grant. Because, as noted earlier, Baltimore City is such an outlier, the scattergram excludes data for Baltimore City. Although population density has a significant influence on transportation costs, there is a relatively low statistical relationship (a negative correlation of -0.228 when Baltimore City is excluded from the analysis and a positive correlation of 0.21 when Baltimore City is included) between population density and Maryland’s Transportation Base Grant. This chart shows widely varying Transportation Base Grant amounts for districts with similar population densities and similar grant amounts for districts with widely varying population densities.
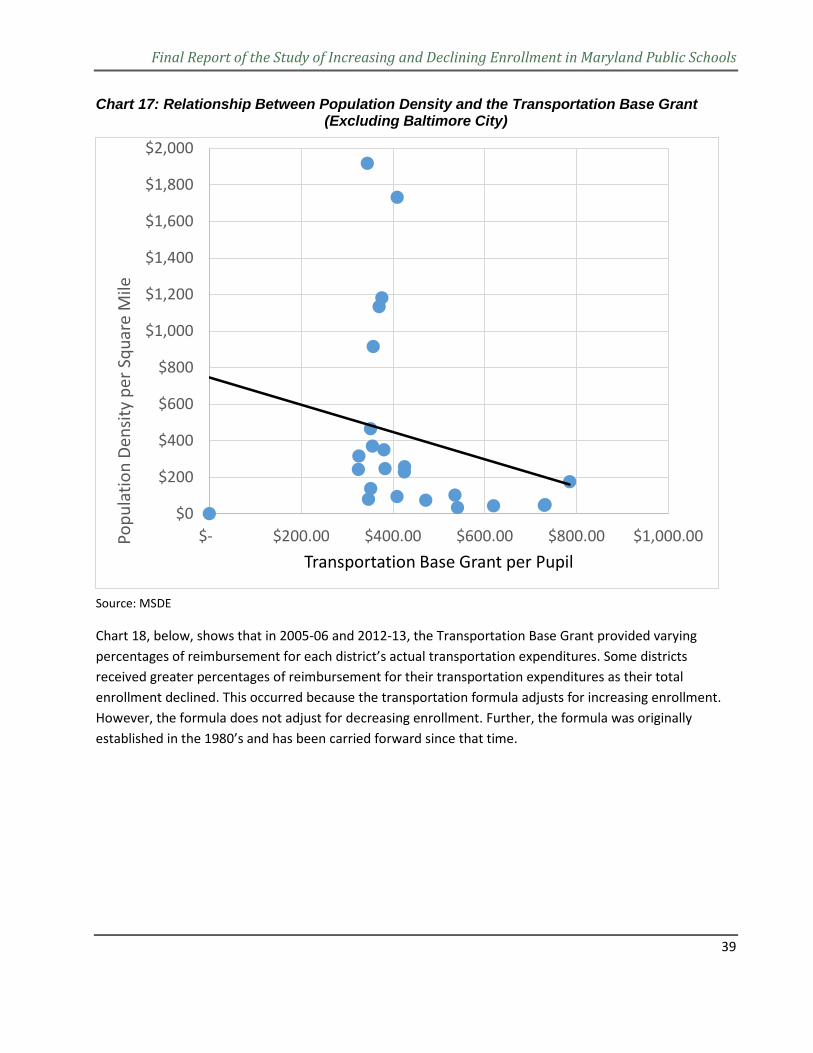
Final Report of the Study of Increasing and Declining Enrollment in Maryland Public Schools
39
Chart 17: Relationship Between Population Density and the Transportation Base Grant (Excluding Baltimore City)
Source: MSDE
Chart 18, below, shows that in 2005-06 and 2012-13, the Transportation Base Grant provided varying percentages of reimbursement for each district’s actual transportation expenditures. Some districts received greater percentages of reimbursement for their transportation expenditures as their total enrollment declined. This occurred because the transportation formula adjusts for increasing enrollment. However, the formula does not adjust for decreasing enrollment. Further, the formula was originally established in the 1980’s and has been carried forward since that time.
$0
$200
$400
$600
$800
$1,000
$1,200
$1,400
$1,600
$1,800
$2,000
$- $200.00 $400.00 $600.00 $800.00 $1,000.00Popu
latio
n De
nsity
per
Squ
are
Mile
Transportation Base Grant per Pupil
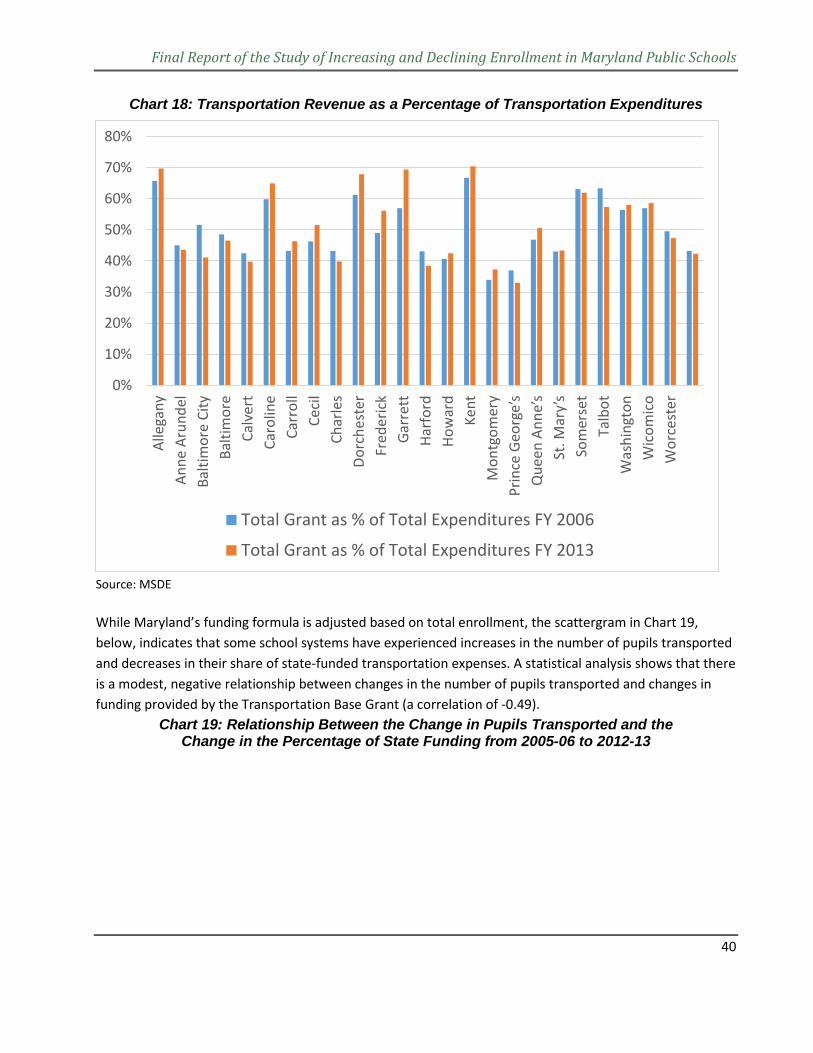
Final Report of the Study of Increasing and Declining Enrollment in Maryland Public Schools
40
Chart 18: Transportation Revenue as a Percentage of Transportation Expenditures
Source: MSDE While Maryland’s funding formula is adjusted based on total enrollment, the scattergram in Chart 19, below, indicates that some school systems have experienced increases in the number of pupils transported and decreases in their share of state-funded transportation expenses. A statistical analysis shows that there is a modest, negative relationship between changes in the number of pupils transported and changes in funding provided by the Transportation Base Grant (a correlation of -0.49).
Chart 19: Relationship Between the Change in Pupils Transported and the Change in the Percentage of State Funding from 2005-06 to 2012-13
0%
10%
20%
30%
40%
50%
60%
70%
80%Al
lega
nyAn
ne A
rund
elBa
ltim
ore
City
Balti
mor
eCa
lver
tCa
rolin
eCa
rrol
lCe
cil
Char
les
Dorc
hest
erFr
eder
ick
Garr
ett
Harf
ord
How
ard
Kent
Mon
tgom
ery
Prin
ce G
eorg
e’s
Que
en A
nne’
s St
. Mar
y’s
Som
erse
tTa
lbot
Was
hing
ton
Wic
omic
oW
orce
ster
Total Grant as % of Total Expenditures FY 2006
Total Grant as % of Total Expenditures FY 2013
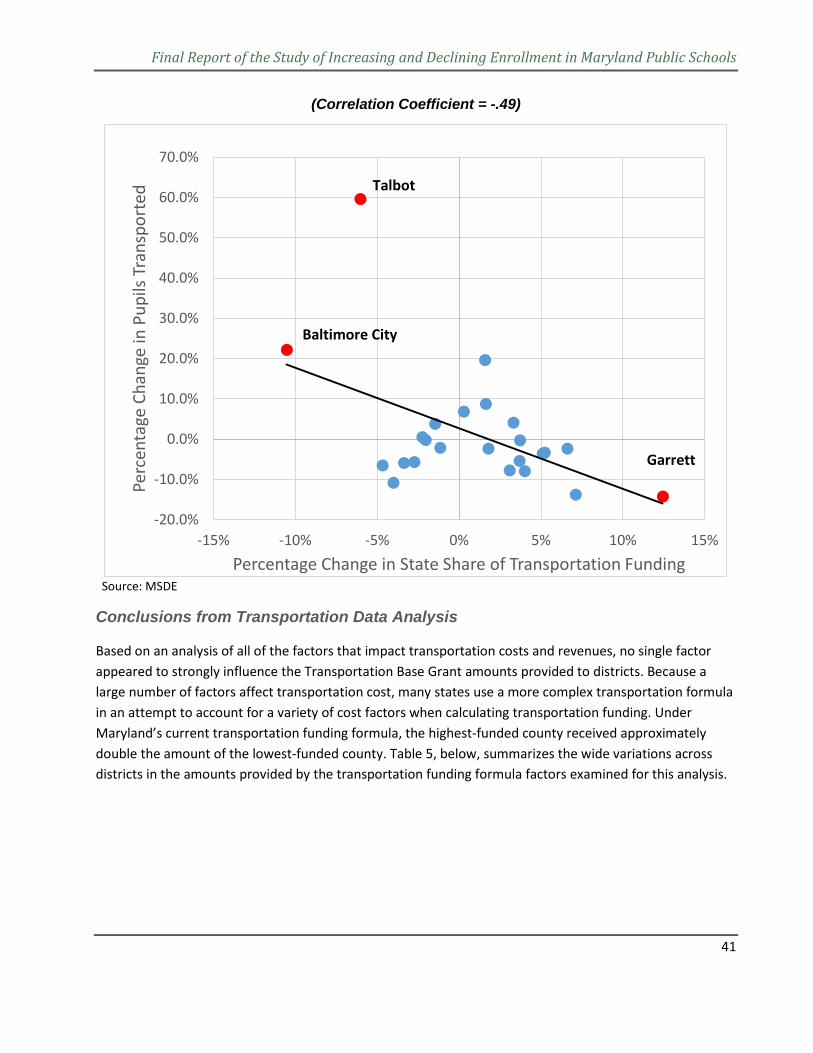
Final Report of the Study of Increasing and Declining Enrollment in Maryland Public Schools
41
(Correlation Coefficient = -.49)
Source: MSDE
Conclusions from Transportation Data Analysis
Based on an analysis of all of the factors that impact transportation costs and revenues, no single factor appeared to strongly influence the Transportation Base Grant amounts provided to districts. Because a large number of factors affect transportation cost, many states use a more complex transportation formula in an attempt to account for a variety of cost factors when calculating transportation funding. Under Maryland’s current transportation funding formula, the highest-funded county received approximately double the amount of the lowest-funded county. Table 5, below, summarizes the wide variations across districts in the amounts provided by the transportation funding formula factors examined for this analysis.
-20.0%
-10.0%
0.0%
10.0%
20.0%
30.0%
40.0%
50.0%
60.0%
70.0%
-15% -10% -5% 0% 5% 10% 15%
Perc
enta
ge C
hang
e in
Pup
ils T
rans
port
ed
Percentage Change in State Share of Transportation Funding
Talbot
Baltimore City
Garrett
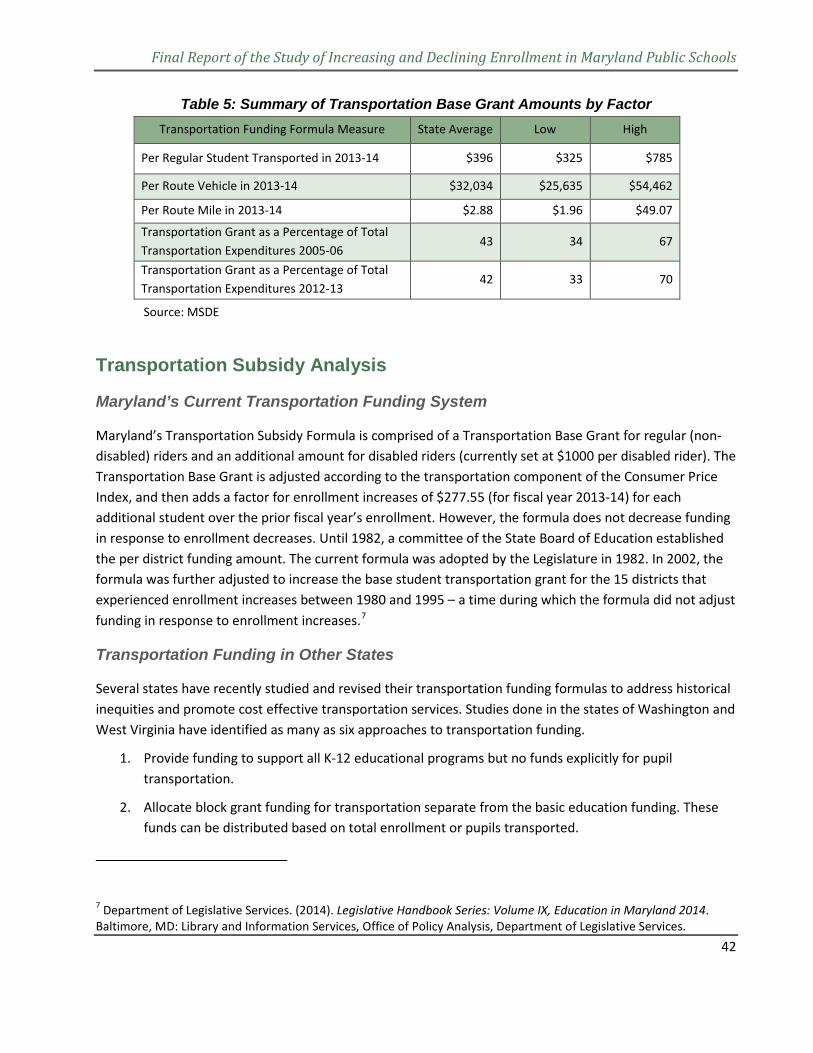
Final Report of the Study of Increasing and Declining Enrollment in Maryland Public Schools
42
Table 5: Summary of Transportation Base Grant Amounts by Factor
Transportation Funding Formula Measure State Average Low High
Per Regular Student Transported in 2013-14 $396 $325 $785
Per Route Vehicle in 2013-14 $32,034 $25,635 $54,462
Per Route Mile in 2013-14 $2.88 $1.96 $49.07
Transportation Grant as a Percentage of Total Transportation Expenditures 2005-06
43 34 67
Transportation Grant as a Percentage of Total Transportation Expenditures 2012-13
42 33 70
Source: MSDE
Transportation Subsidy Analysis
Maryland’s Current Transportation Funding System
Maryland’s Transportation Subsidy Formula is comprised of a Transportation Base Grant for regular (non-disabled) riders and an additional amount for disabled riders (currently set at $1000 per disabled rider). The Transportation Base Grant is adjusted according to the transportation component of the Consumer Price Index, and then adds a factor for enrollment increases of $277.55 (for fiscal year 2013-14) for each additional student over the prior fiscal year’s enrollment. However, the formula does not decrease funding in response to enrollment decreases. Until 1982, a committee of the State Board of Education established the per district funding amount. The current formula was adopted by the Legislature in 1982. In 2002, the formula was further adjusted to increase the base student transportation grant for the 15 districts that experienced enrollment increases between 1980 and 1995 – a time during which the formula did not adjust funding in response to enrollment increases.7
Transportation Funding in Other States
Several states have recently studied and revised their transportation funding formulas to address historical inequities and promote cost effective transportation services. Studies done in the states of Washington and West Virginia have identified as many as six approaches to transportation funding.
1. Provide funding to support all K-12 educational programs but no funds explicitly for pupil transportation.
2. Allocate block grant funding for transportation separate from the basic education funding. These funds can be distributed based on total enrollment or pupils transported.
7 Department of Legislative Services. (2014). Legislative Handbook Series: Volume IX, Education in Maryland 2014. Baltimore, MD: Library and Information Services, Office of Policy Analysis, Department of Legislative Services.
Final Report of the Study of Increasing and Declining Enrollment in Maryland Public Schools
43
3. Allocate state funds based on approved costs, identifying each specific type of expenditure that will be reimbursed. States may reimburse all or a percentage of approved costs.
4. Provide per unit funding for specified and measurable units. The units used vary from the total miles driven, the number of pupils transported, the number of trips per day, and other measurable units related to costs.
5. Allocate funds based on expected costs. A set of factors defining demographic and geographic differences as well as transportation activities is analyzed with a multivariate statistical methodology that computes the expected costs for each district. The state then funds a district’s expected, rather than actual, costs. These formulas are intended to promote certain transportation service levels and efficiencies.
6. Provide funding levels based on efficiency and best practice. This approach provides adjustments for factors beyond the control of local school districts.
Typically, transportation funding formulas aim to provide transportation funding that: (1) is understandable, (2) rewards efficiency or penalizes inefficiency, (3) promotes student safety, and (4) accommodates special circumstances. The most sophisticated formulas incorporate statistical analyses of the factors influencing transportation costs into their financial models. In this way, these formulas determine the appropriate state and local shares of transportation funding. Using formulas effectively requires accurate data, usually transportation operations information from the prior school year.
Determining Eligibility for School Transportation Funding
Many states establish restrictions on approved transportation costs (i.e. transportation costs that are eligible for state funding or reimbursement). Generally, states will not fund transportation for students who live close to their school. States usually establish mileage thresholds at which students become eligible for state-funded school transportation. These mileage thresholds vary depending on the age of the student, but are often set at within one or two miles from home. Most states offer exceptions for students whose routes to school are deemed hazardous, based on subjective evaluations of hazard or risk.
States have various policies regarding which students will be eligible for state-funded transportation. For example, some states fund transportation for students in private schools (in addition to funding for students in public schools, charter schools, and/or special education programs). Transportation for these private school students is usually limited by distance factors (e.g. students 10 miles beyond district boundaries may not be eligible for state-funded transportation).
Reimbursement Levels
Reimbursement levels depend on a state’s specific legislative policies. Some states limit the maximum local contribution to the school system’s transportation program. Some states establish maximum amounts of funding per mile, depending on the type of school served. Some states reimburse for bus replacement either directly or through formulas that favor newer buses. Formulas often reimburse for either actual costs or reimburse up to a specified, per mile limit – whichever is less. States use various methods to
Final Report of the Study of Increasing and Declining Enrollment in Maryland Public Schools
44
calculate the number of students transported, including counting the number of riders on a monthly basis, a quarterly basis, and/or at a specified date. Many of the state formulas adjust funding annually based on a transportation cost index.
Population Density and Sparsity
A number of states provide additional funding for low-density, sparsely populated school systems. These states may establish maximum local contributions, so that when school systems reach the maximum contribution, state funding is provided to cover excess costs. States may define density in terms of students per square mile rather than total population per square mile, in terms of linear student density (or the number of students per mile of roadway), in terms of student proximity to school, or in terms of other factors.
Promoting Efficiency
States use a variety of approaches to promote efficient transportation services. States may limit reimbursement to loaded mileage rather than total mileage to encourage more efficient routing and assignment of bus runs to routes. Utilization of seating capacity can also affect the amount of reimbursement states offer. Funding methods can also promote newer, more fuel efficient vehicles. Some transportation funding systems provide special funding for shared, regional cooperative transportation services, while other funding systems support the use of public transit.
Impact of Local School System Policies/Guidelines
Transportation costs are influenced by local decisions regarding the level of transportation services provided. These decisions, which can be included in school board policies, often reflect guidelines and practices that reflect historic decisions of the school board and administration that are not evaluated on a regular basis. These guidelines govern items such as the following:
Number of transportation-eligible students. Local decisions establish walking distances to schools. The greater the acceptable walking distance, the fewer buses the local school system will require. Most school systems designate different maximum distances for elementary and secondary students. Most school systems also define criteria for hazardous walking areas. Some schools have utilized the Safe Routes to Schools Program and the Walking School Bus Program to increase the number of students who walk to school. Criteria for establishing hazardous walking areas generally include the absence of sidewalks, high speed limits for vehicles, narrow road widths, restricted sight distances, and high traffic volumes. Certain school sites (e.g. school sites in large, open areas outside of existing residential areas) may require the transportation of nearly all students. The locations used for providing special education services can also affect school transportation costs, resulting in transportation costs that can exceed program revenues.
Maximum ride time. Maximum ride times can vary depending on age of student (where younger students tend to have shorter maximum ride times) and depending on population density (where students in more
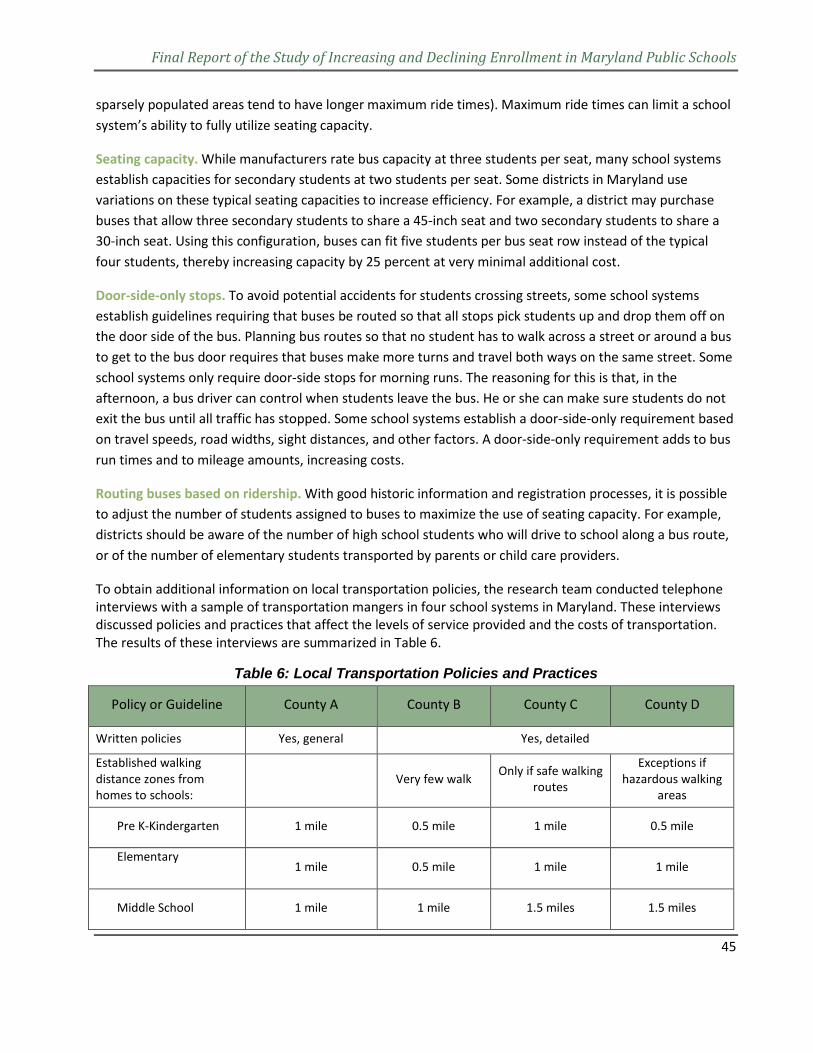
Final Report of the Study of Increasing and Declining Enrollment in Maryland Public Schools
45
sparsely populated areas tend to have longer maximum ride times). Maximum ride times can limit a school system’s ability to fully utilize seating capacity.
Seating capacity. While manufacturers rate bus capacity at three students per seat, many school systems establish capacities for secondary students at two students per seat. Some districts in Maryland use variations on these typical seating capacities to increase efficiency. For example, a district may purchase buses that allow three secondary students to share a 45-inch seat and two secondary students to share a 30-inch seat. Using this configuration, buses can fit five students per bus seat row instead of the typical four students, thereby increasing capacity by 25 percent at very minimal additional cost.
Door-side-only stops. To avoid potential accidents for students crossing streets, some school systems establish guidelines requiring that buses be routed so that all stops pick students up and drop them off on the door side of the bus. Planning bus routes so that no student has to walk across a street or around a bus to get to the bus door requires that buses make more turns and travel both ways on the same street. Some school systems only require door-side stops for morning runs. The reasoning for this is that, in the afternoon, a bus driver can control when students leave the bus. He or she can make sure students do not exit the bus until all traffic has stopped. Some school systems establish a door-side-only requirement based on travel speeds, road widths, sight distances, and other factors. A door-side-only requirement adds to bus run times and to mileage amounts, increasing costs.
Routing buses based on ridership. With good historic information and registration processes, it is possible to adjust the number of students assigned to buses to maximize the use of seating capacity. For example, districts should be aware of the number of high school students who will drive to school along a bus route, or of the number of elementary students transported by parents or child care providers.
To obtain additional information on local transportation policies, the research team conducted telephone interviews with a sample of transportation mangers in four school systems in Maryland. These interviews discussed policies and practices that affect the levels of service provided and the costs of transportation. The results of these interviews are summarized in Table 6.
Table 6: Local Transportation Policies and Practices
Policy or Guideline County A County B County C County D
Written policies Yes, general Yes, detailed
Established walking distance zones from homes to schools:
Very few walk Only if safe walking routes
Exceptions if hazardous walking
areas
Pre K-Kindergarten 1 mile 0.5 mile 1 mile 0.5 mile
Elementary
1 mile 0.5 mile 1 mile 1 mile
Middle School 1 mile 1 mile 1.5 miles 1.5 miles
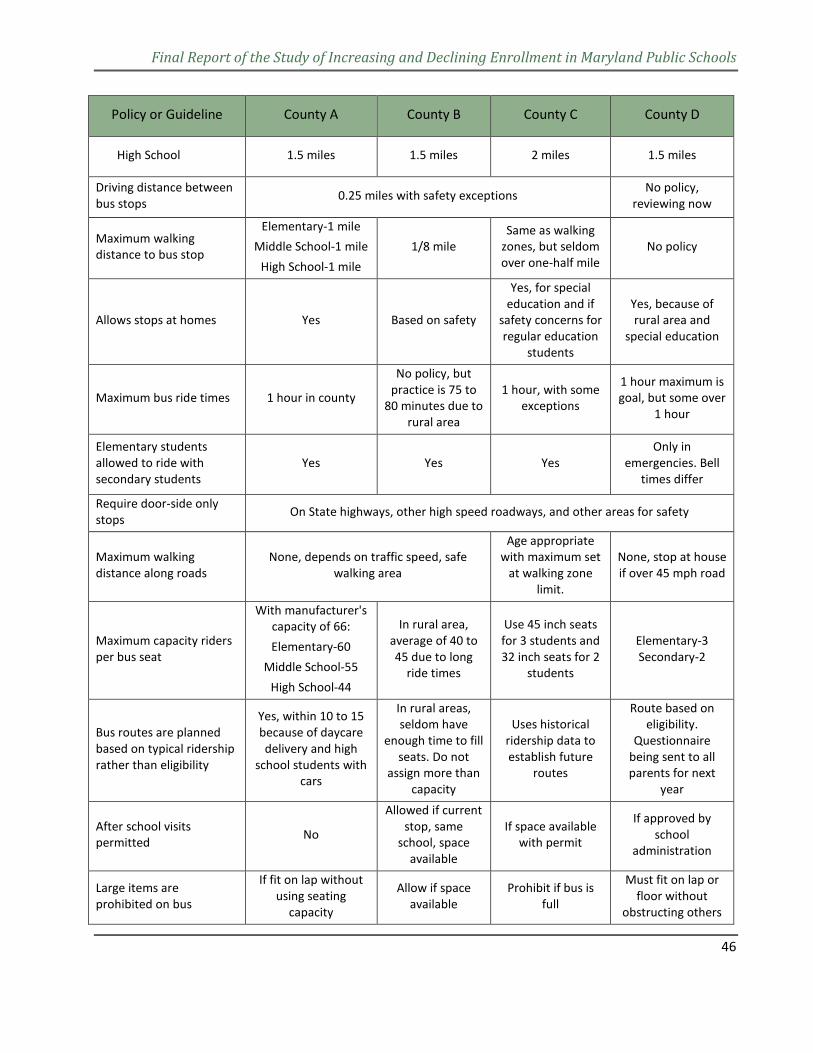
Final Report of the Study of Increasing and Declining Enrollment in Maryland Public Schools
46
Policy or Guideline County A County B County C County D
High School 1.5 miles 1.5 miles 2 miles 1.5 miles
Driving distance between bus stops 0.25 miles with safety exceptions No policy,
reviewing now
Maximum walking distance to bus stop
Elementary-1 mile Middle School-1 mile
High School-1 mile 1/8 mile
Same as walking zones, but seldom over one-half mile
No policy
Allows stops at homes Yes Based on safety
Yes, for special education and if
safety concerns for regular education
students
Yes, because of rural area and
special education
Maximum bus ride times 1 hour in county
No policy, but practice is 75 to
80 minutes due to rural area
1 hour, with some exceptions
1 hour maximum is goal, but some over
1 hour
Elementary students allowed to ride with secondary students
Yes Yes Yes Only in
emergencies. Bell times differ
Require door-side only stops On State highways, other high speed roadways, and other areas for safety
Maximum walking distance along roads
None, depends on traffic speed, safe walking area
Age appropriate with maximum set
at walking zone limit.
None, stop at house if over 45 mph road
Maximum capacity riders per bus seat
With manufacturer's capacity of 66: Elementary-60
Middle School-55 High School-44
In rural area, average of 40 to 45 due to long
ride times
Use 45 inch seats for 3 students and 32 inch seats for 2
students
Elementary-3 Secondary-2
Bus routes are planned based on typical ridership rather than eligibility
Yes, within 10 to 15 because of daycare delivery and high
school students with cars
In rural areas, seldom have
enough time to fill seats. Do not
assign more than capacity
Uses historical ridership data to establish future
routes
Route based on eligibility.
Questionnaire being sent to all parents for next
year
After school visits permitted No
Allowed if current stop, same
school, space available
If space available with permit
If approved by school
administration
Large items are prohibited on bus
If fit on lap without using seating
capacity
Allow if space available
Prohibit if bus is full
Must fit on lap or floor without
obstructing others
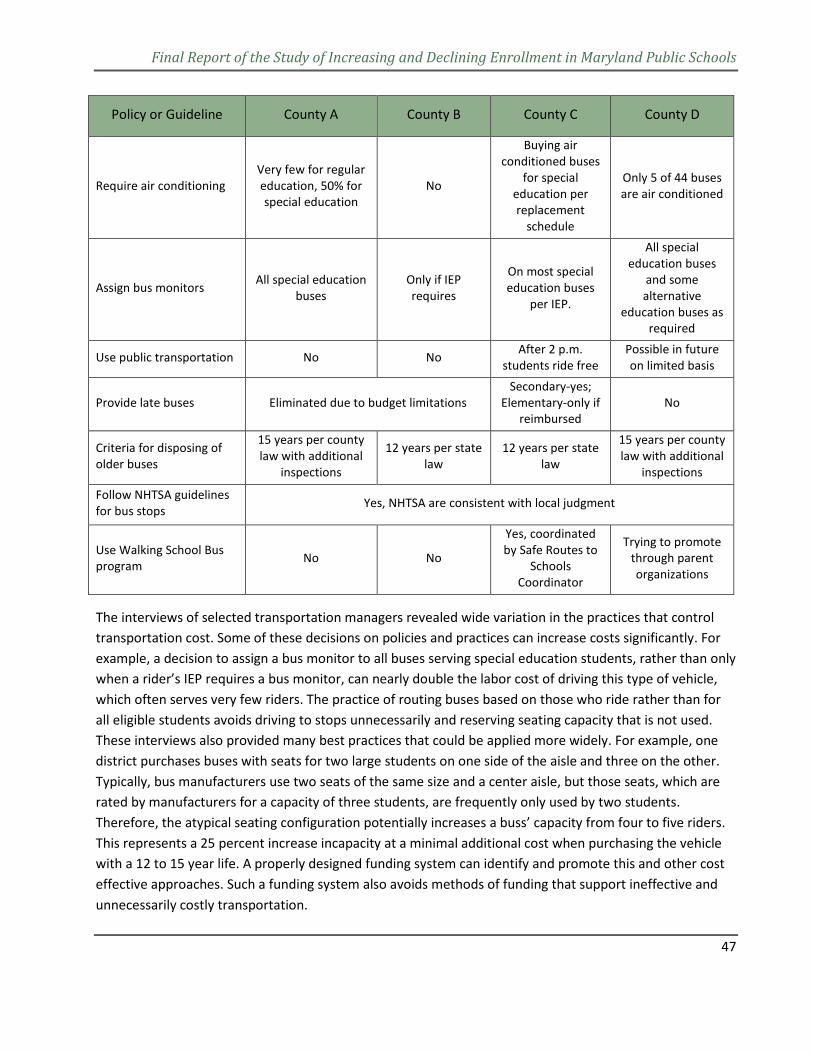
Final Report of the Study of Increasing and Declining Enrollment in Maryland Public Schools
47
Policy or Guideline County A County B County C County D
Require air conditioning Very few for regular education, 50% for special education
No
Buying air conditioned buses
for special education per replacement
schedule
Only 5 of 44 buses are air conditioned
Assign bus monitors All special education buses
Only if IEP requires
On most special education buses
per IEP.
All special education buses
and some alternative
education buses as required
Use public transportation No No After 2 p.m. students ride free
Possible in future on limited basis
Provide late buses Eliminated due to budget limitations Secondary-yes;
Elementary-only if reimbursed
No
Criteria for disposing of older buses
15 years per county law with additional
inspections
12 years per state law
12 years per state law
15 years per county law with additional
inspections
Follow NHTSA guidelines for bus stops Yes, NHTSA are consistent with local judgment
Use Walking School Bus program No No
Yes, coordinated by Safe Routes to
Schools Coordinator
Trying to promote through parent organizations
The interviews of selected transportation managers revealed wide variation in the practices that control transportation cost. Some of these decisions on policies and practices can increase costs significantly. For example, a decision to assign a bus monitor to all buses serving special education students, rather than only when a rider’s IEP requires a bus monitor, can nearly double the labor cost of driving this type of vehicle, which often serves very few riders. The practice of routing buses based on those who ride rather than for all eligible students avoids driving to stops unnecessarily and reserving seating capacity that is not used. These interviews also provided many best practices that could be applied more widely. For example, one district purchases buses with seats for two large students on one side of the aisle and three on the other. Typically, bus manufacturers use two seats of the same size and a center aisle, but those seats, which are rated by manufacturers for a capacity of three students, are frequently only used by two students. Therefore, the atypical seating configuration potentially increases a buss’ capacity from four to five riders. This represents a 25 percent increase incapacity at a minimal additional cost when purchasing the vehicle with a 12 to 15 year life. A properly designed funding system can identify and promote this and other cost effective approaches. Such a funding system also avoids methods of funding that support ineffective and unnecessarily costly transportation.
Final Report of the Study of Increasing and Declining Enrollment in Maryland Public Schools
48
Conclusions on Transportation Funding and Operations
Maryland’s transportation costs vary widely based on geographic and spatial factors, including population density and school location. These factors should be of primary consideration in any kind of transportation funding formula. Some local decisions greatly affect transportation costs. For example, districts influence their transportation costs depending on whether they: (1) fully utilize bus capacity, (2) specify threshold walking distances, (3) specify maximum ride times, and (4) specify which transportation services will be state-provided. The research team’s interviews of several transportation managers identified variations in these local decisions. Factors that depend on local school system decisions should not be as important to the transportation funding formula as factors that are beyond the control of the local school systems. If the state places more importance on factors outside of local control, then it will be able to fund districts transportation services more equitably.
Maryland’s funding formula does not incorporate some of the features that other states commonly use to promote efficiency. For example, unlike some state formulas, Maryland’s formula increases funding when total enrollment increases, but does not decrease funding when total enrollment declines. In addition, the formula was developed in the 1980s using the experience and knowledge of a committee of the State Board of Education. This was at a time before modern computing capabilities were available to help make better and more cost effective decisions on complex systems like school transportation. For these reasons, the State’s funding formula does not provide the most equitable transportation funding across districts and should be modernized to support and promote the safest and most cost effective transportation possible.
Recommendations on Transportation Funding and Operations
Maryland should consider modifying its current funding formula to better incorporate factors that impact the costs of providing transportation services. Several states are using sophisticated, multivariate statistical analyses and financial modeling to inform their funding systems. These systems can determine the cost of transporting students based on all factors affecting transportation services in each district. Many of the factors in a transportation cost index, applicable in different amounts for regular and disabled transportation, will be incorporated by the statistical analyses. Costs that are affected by local decisions regarding transportation service levels should be given less weight than those beyond the control of districts in a new funding formula because these factors may create inequity in funding and inefficiency in operations.
Implementation of a new transportation system will require careful planning and a transition period. Districts will need to provide extensive data on transportation services. These data generally reside in transportation software used by most school systems and could be provided by data reporting and data exchange software that will need to be developed and tested. A multivariate statistical model will need to be selected based on experiences in other states with such formulas, several of which have geographical and operational characteristics similar to Maryland. Experienced transportation planners from other sectors could also provide assistance in this selection. Once the model is run to determine the costs of transportation in each district, the difference between current funding and the model’s funding level may
Final Report of the Study of Increasing and Declining Enrollment in Maryland Public Schools
49
require a phase-in period to give districts time to align their transportation systems with the components of the new formula.
Adjusting to Changing Enrollment
Numerous factors affect a district’s ability to adjust to either increasing or decreasing enrollment. School expenditures include both fixed and variable costs. Little adjustment is possible if costs are fixed. Some costs vary directly with enrollment changes. Other costs are subject to increments reflecting capacities such as school enrollment capacity, class size capacity, bus seat capacity, caseload limits, and other factors. The following sections define fixed and variable costs and how each is impacted differently by enrollment changes and describe the options and limitations districts face when experiencing enrollment changes.
Fixed and Variable Costs
Fixed costs in schools are independent of enrollment or the level of educational services provided. Fixed costs include buildings, equipment, most utilities, grounds keeping, and many service contracts. Variable costs are costs that vary with the number of students served or programs provided.
The operating costs of districts include a mix of both fixed and variable costs.
Examples of fixed costs in education include
• one-of-a-kind positions (principal, school building secretary, school custodian, school nurse, librarian, etc.);
• school building construction debt service; • school building utilities (heating/cooling fuels, electricity, water/sewer, etc.); • contracted maintenance services (HVAC maintenance, fire and security alarm maintenance, etc.); • grounds keeping costs (mowing, landscaping maintenance, snow removal, etc.); • bus transportation costs when ride times would be excessive if all seats were filled to capacity; • textbook series purchased for maximum enrollment; • library books; and • computer lab equipment.
Examples of typical variable costs in education, that is, those that can be adjusted with enrollment changes include
• teaching staff for both regular and special education students;
• instructional aides/assistants/paraprofessionals; and
• consumable instructional supplies.
However, even some variable costs are difficult to adjust over short periods of time. These costs include changes that occur in one-unit increments, such as personnel changes based on caseload regulations or
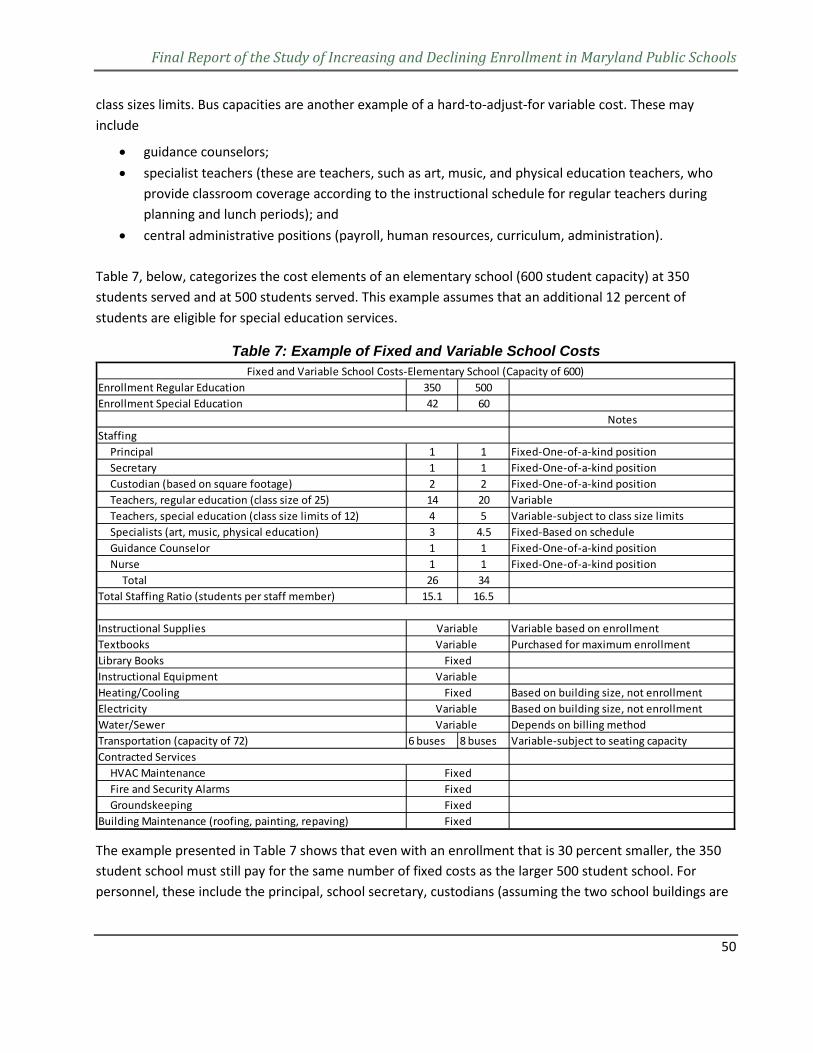
Final Report of the Study of Increasing and Declining Enrollment in Maryland Public Schools
50
class sizes limits. Bus capacities are another example of a hard-to-adjust-for variable cost. These may include
• guidance counselors; • specialist teachers (these are teachers, such as art, music, and physical education teachers, who
provide classroom coverage according to the instructional schedule for regular teachers during planning and lunch periods); and
• central administrative positions (payroll, human resources, curriculum, administration).
Table 7, below, categorizes the cost elements of an elementary school (600 student capacity) at 350 students served and at 500 students served. This example assumes that an additional 12 percent of students are eligible for special education services.
Table 7: Example of Fixed and Variable School Costs
The example presented in Table 7 shows that even with an enrollment that is 30 percent smaller, the 350 student school must still pay for the same number of fixed costs as the larger 500 student school. For personnel, these include the principal, school secretary, custodians (assuming the two school buildings are
Enrollment Regular Education 350 500Enrollment Special Education 42 60
Notes
Principal 1 1 Fixed-One-of-a-kind position Secretary 1 1 Fixed-One-of-a-kind position Custodian (based on square footage) 2 2 Fixed-One-of-a-kind position Teachers, regular education (class size of 25) 14 20 Variable Teachers, special education (class size limits of 12) 4 5 Variable-subject to class size limits Specialists (art, music, physical education) 3 4.5 Fixed-Based on schedule Guidance Counselor 1 1 Fixed-One-of-a-kind position Nurse 1 1 Fixed-One-of-a-kind position Total 26 34Total Staffing Ratio (students per staff member) 15.1 16.5
Instructional Supplies Variable based on enrollmentTextbooks Purchased for maximum enrollmentLibrary BooksInstructional EquipmentHeating/Cooling Based on building size, not enrollmentElectricity Based on building size, not enrollmentWater/Sewer Depends on billing methodTransportation (capacity of 72) 6 buses 8 buses Variable-subject to seating capacity
HVAC Maintenance Fire and Security Alarms GroundskeepingBuilding Maintenance (roofing, painting, repaving)
Variable
FixedFixedFixedFixed
Fixed and Variable School Costs-Elementary School (Capacity of 600)
Staffing
Contracted Services
Variable Variable
FixedVariable
FixedVariable
Final Report of the Study of Increasing and Declining Enrollment in Maryland Public Schools
51
of similar size), and one-of-a-kind support staff such as a guidance counselor and school nurse. Also fixed are costs for library books, utilities, and building-related maintenance and services.
In this example, the fixed personnel costs make up about 15 percent of all personnel costs and most of the non-personnel costs are also fixed. As a result, if the school had to reduce its budget by 30 percent – the same amount as the difference in enrollment – most of the reductions would have to come from personnel who make up the school’s personnel variable costs, including instructional staff such as classroom teachers, special education teachers, and specialist teachers. But, even the reduction of “variable” cost personnel may not be entirely possible. This will depend in part on how students are distributed across the grade levels. In some grade levels, the number of students may not allow for the reduction of a teacher. For example, if the maximum capacity of a school’s classroom is 30 students and the school had 50 students in grade four in the prior year, but only 40 in the current year, the school cannot reduce its teaching staff by one teacher and consolidate all 40 students into a single classroom. It must still pay for two grade four teachers.
At the district level, the same percentage change in enrollment provides large districts more options to adjust costs than small districts. The examples that follow assume that school functions are operating at capacity for facilities, buses, class size, caseloads, and other factors. A 10 percent change in a 5,000 student district amounts to 500 students while a 10 percent change in a 100,000 student district amounts to 10,000 students. Assuming 14 grade levels (Prekindergarten, Kindergarten, and Grades 1 to 12), the smaller district would have 36 students per grade level while the larger district would have 714 per grade level. For a prekindergarten to grade six elementary school configuration, the smaller district would have a total of 288 students, which is generally not enough to change the number of school buildings needed. If the 288 students are distributed evenly across six elementary buildings, the 48 students at each school are not enough to change the number of 72 passenger buses needed. At each of the six elementary schools, 48 students amounts to six students per grade level, not enough to adjust the number of regular education teachers or classrooms at typical ratios of one teacher for every 20 to 25 students. If 10 percent of the students require special services, including special education or ELL services, a change of five students are more likely to require additional staff due to class size and caseload regulations than it is likely to result in a reduction of staff.
In contrast to the 5,000 student district, which tend to be rural and sparsely populated, a 10 percent change in a 100,000 student district amounts to 10,000 students, or 714 per grade level, assuming the change is equally distributed across grade levels. In a school district with Prekindergarten to grade six elementary schools, the total across the eight grade levels amounts to 5,712 elementary students. This is enough to adjust approximately 10 elementary schools. It is also enough to adjust nearly 80 elementary bus runs or approximately 228 teachers at a ratio of one regular education teacher for each 25 students. In more densely populated areas, the logistical difficulties of adjusting the number of schools or buses is less difficult.
Final Report of the Study of Increasing and Declining Enrollment in Maryland Public Schools
52
Conclusions for Enrollment Changes, Operating Costs, and Funding Formulas
Enrollment Changes
Enrollment changes vary significantly for districts across the state in total enrollment, in grade level enrollment, and in program enrollment. Over the period between 2005 and 2014, total enrollment in the state declined by 20,000 students but then rebounded by roughly the same amount. The economic recession of 2007 to 2009 affected birth rates in many communities, which will likely lead to lower enrollment in most districts over time. It is possible that it may take a decade or more for enrollment to rebound to prior levels. If this is correct, school systems could face a prolonged period of lower enrollment. As mentioned earlier, the enrollment projection method used in recent public school enrollment projections has difficulty incorporating rapid change such as the turnaround in birth rates caused by the economic downturn.
Operating Costs
Operating costs for schools include staffing, supplies, equipment, contracted services for education and operation, transportation, facility maintenance, and debt service. Some of these costs are fixed while others are variable and can be adjusted with changing enrollment or program configuration. A third category of costs depends on building capacities, class size regulations, buses, and other items that require an additional unit (e.g. an additional teacher, bus, or building) when enrollment increases by the required amount, or when additional educational program choices are needed. Because of the different types of costs, the ability to adjust to changing enrollment depends heavily on how fully capacities were utilized before the enrollment or programmatic change. It is easy to justify adding costs when enrollment increases, or when the need for program options changes. However, it is difficult to predict decreases in enrollment or changes in the need for different types of programs. It is often risky to reduce costs in advance, without actually knowing the amount of change that will transpire. For this reason, delays in implementing cost reductions can be expected, especially if birth rate and enrollment projection information is not updated and communicated regularly.
Funding Formulas
Maryland’s formula for school funding adjusts directly with enrollment changes because it is driven by pupil counts. Additional supplements for at-risk students are also adjusted by enrollment in those subgroups. The transportation funding formula adjusts only with increasing total enrollment, but not with decreasing total enrollment. This may be one reason why the amount of transportation costs funded varies substantially across districts.
Based on birth rate decreases from the economic downturn, a number of school systems will face decreasing enrollment, and thus state support, in future years. In the past, very limited transitional funding
Final Report of the Study of Increasing and Declining Enrollment in Maryland Public Schools
53
has been provided to a few school systems that met the criteria for decreasing enrollment. This provision recognized the difficulty for school systems to adjust costs based on unpredictable enrollment decreases.
Recommendations
Enrollment Change
The economic effects of the 2007-2009 recession resulted in significant impacts on birth rates in the past few years. School enrollment should be monitored carefully for each school system and each attendance area as the impact will vary by geography and socioeconomic factors. The standard methods of projecting school enrollment, cohort survival or grade progression, typically fail to account for these impacts during periods of declining birth rates and will not adjust quickly enough in the event of a rebound in birth rates. Therefore, more sophisticated enrollment projection methods are recommended to better understand these changes. Geographic Information Systems (GIS) can enhance the standard enrollment projection methodologies with valuable information on neighborhood change, mobility, and changing socioeconomic and demographic factors. GIS capabilities should be utilized by Maryland to help understand the impacts of recessions on birth rates as well as mobility and neighborhood change. Maryland should also provide technical assistance to districts on the difficult decisions regarding school closings, redistricting of school attendance areas, transportation efficiency, and staffing changes. For example, if continued monitoring of recent birth rates indicates a sustained rebound after a full economic recovery, it would be best that buildings that may be unused for a few years are maintained for future reuse rather than sold.
Operating Costs
Given the birth rate decline of the recent past, a number of school systems will experience enrollment declines as well as a decline in state funding under the current funding methods. The economic downturn caused most school systems to reduce spending on staff and in some cases on buildings. At this point, further reductions may present a challenge for some districts, requiring more sophisticated approaches to reducing spending. A financial model and set of best practices should be developed and provided to school systems to assist with these difficult decisions.
Funding Formulas
During the uncertainties of this period, it is important that funding formulas are based on a realistic understanding of the ability to economize to decreasing enrollment. The recommendations for funding formulas include suggestions for both the general education foundation formula for general operations and the student transportation funding formula.
General Education Foundation Formula Maryland’s general education foundation formula currently does not have a “built-in” mechanism for accommodating declining enrollment in districts. Currently, the State provides for grants to districts with declining enrollment. Total funding for this program was $593,055 in fiscal year 2014-15.
Final Report of the Study of Increasing and Declining Enrollment in Maryland Public Schools
54
Under this program, districts were provided a grant equal to 50 percent of the decrease in education aid if they meet the following three criteria: (1) a district’s full-time equivalent enrollment is less than 5,000, (2) a district’s full-time equivalent enrollment in the current fiscal year is less than it was in the prior year, and (3) a district’s total education aid in the current fiscal year decreases by more than 1 percent from its prior year’s education aid. At this time, only two districts, Garrett and Kent counties, are eligible for the grant under these three criteria.
Given this study’s findings regarding the future outlook for declining enrollment, and the possibility that the number of districts facing the fiscal challenges presented by declining enrollment will increase over the next decade, Maryland should consider adopting a more permanent, and automatic, mechanism for giving districts temporary relief from revenue reductions driven by falling enrollment.
A survey of states’ general education funding formulas found that states take a number of different approaches to addressing the funding consequences of school enrollment declines.8 These policies typically aim to buffer school districts from drastic funding decreases resulting from declining enrollment. The strategies used by different states include providing supplemental grant funding, using prior year student counts to determine funding, and adjusting the formula to calculate funding based on enrollment covering several years, or providing a hold harmless provision that guarantees funding at previous levels regardless of the enrollment. Sixteen states, as of December 2014, had no provisions to accommodate declining enrollment in their funding formulas.
The approach suggested here is to change the student count used in the foundation formula calculations to a multi-year rolling average of the full-time equivalent enrollment count currently used. This rolling average, which would average a district’s full-time equivalent enrollment count over several years (the most common periods used in other states’ funding formulas range from two to four years), would work to temporarily reduce the funding impact of declining enrollment to give districts the time needed to make necessary changes to their operating costs (e.g. reducing staff, closing school buildings, or adopting other cost saving or efficiency strategies). As an example, a three-year rolling average student count would take the three most recent counts, for example counts from the fall of 2012, 2013, and 2014, average them, and then use the greater of the actual fall 2014 count or the three-year average count. Using the higher of the two numbers prevents penalizing districts experiencing enrollment growth. The formula count used in the next fiscal year would be the higher of the fall 2015 count or the average of the 2013, 2014, and 2015 counts.
Student Transportation Funding Formula Serious consideration should be given to modernizing the State’s transportation funding formula. The current formula does not appear to account for many of the major factors that drive transportation costs in
8 Atherton, M. J. and Rubado, M. E. (December, 2014). Policy Brief Hold Harmless Education Finance Policies in the U.S.: A Survey. Center on Regional Politics, Temple University: Philadelphia, PA.
Final Report of the Study of Increasing and Declining Enrollment in Maryland Public Schools
55
districts. It also only adjusts funding amounts when district enrollment is increasing, but provides no adjustment when enrollment declines. The current formula was developed in the 1980’s at a time when modern computer systems had not been applied widely to operational and financial issues in the public sector. Since then, public transit systems have expanded in some areas. Roads have become more congested and commuting patterns are much different in many areas. Vehicle navigation systems did not exist. Special education services were not as extensive. For all of these reasons, a modernization of the transportation funding formula is recommended.
A number of examples of state transportation formulas are currently in use that take into account relevant cost factors and unique local circumstances beyond the control of districts. North Carolina and Washington State provide two examples of such formulas in states with similar urban and rural geographic and socioeconomic factors. Some of the measures found in these and other states’ transportation formulas may be particularly relevant to the rural, sparsely populated districts found in Maryland, as well as the more urban districts with high population densities and access to extensive public transit systems.
Implementing a more sophisticated funding formula will require timely submission of extensive data on transportation cost factors. In addition, the model may result in a significant redistribution of funding. For both of the reasons, a transition period will be required. The data collection will be much easier if software programs currently used by school systems can provide the information directly without additional manual effort. Software programs may need a year or more to provide that capability. Another year should be anticipated to review and improve data quality. At that time, the model will be ready to provide valid estimates of transportation costs in each school district. Comparing those estimates with existing funding levels for each district may indicate the need for a period of transition from current to new funding levels.
Summary Conclusion
In conclusion, this report has documented significant changes in enrollment faced by districts in Maryland. Further, the changes in enrollment documented impact districts differently, leading to the conclusion that any one measure or adjustment method is not likely to completely solve the challenges faced by districts experiencing enrollment declines. It is also true that the declining enrollment grant offered by Maryland today is limited and not dynamic enough to address the challenges many districts are facing.
Two formula adjustments are suggested here, the first to the general operating formula and the second to the transportation funding formula. For the general operating funding formula, a more transparent and multi-year adjustment is recommended. There are several good options used in other states that should be given consideration. The second recommendation is to modernize the transportation funding structure. A multivariate statistical model provides the most comprehensive and effective approach to account for distinctions between densely populated urban areas and more rural or sparsely populated districts in an effort to equalize the allocation process. Reporting features allow comparative analysis among districts and provide methods to measure compliance with state laws, regulations and policies concerning school bus
Final Report of the Study of Increasing and Declining Enrollment in Maryland Public Schools
56
transportation. In addition, the extensive data required to operate these models provide an opportunity to research and disseminate information on best practices in cost effective transportation.
Final Report of the Study of Increasing and Declining Enrollment in Maryland Public Schools
57
Appendix: Data Tables
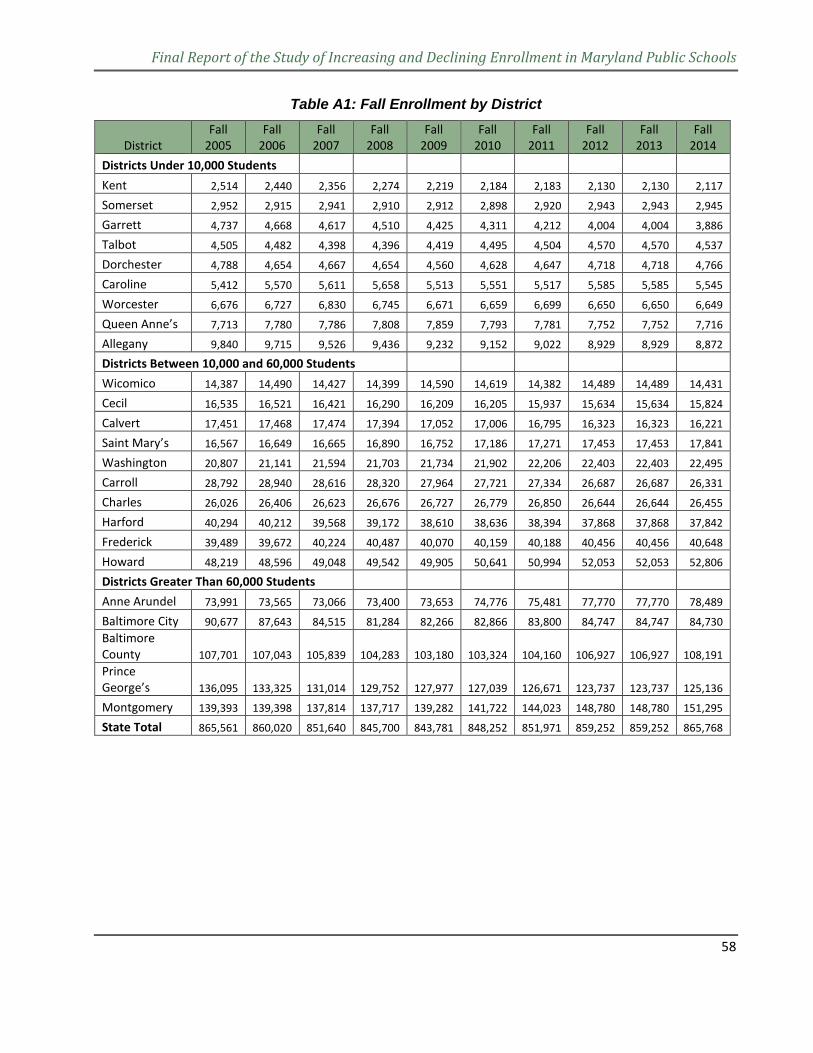
Final Report of the Study of Increasing and Declining Enrollment in Maryland Public Schools
58
Table A1: Fall Enrollment by District
District Fall
2005 Fall
2006 Fall
2007 Fall
2008 Fall
2009 Fall
2010 Fall
2011 Fall
2012 Fall
2013 Fall
2014 Districts Under 10,000 Students
Kent 2,514 2,440 2,356 2,274 2,219 2,184 2,183 2,130 2,130 2,117
Somerset 2,952 2,915 2,941 2,910 2,912 2,898 2,920 2,943 2,943 2,945
Garrett 4,737 4,668 4,617 4,510 4,425 4,311 4,212 4,004 4,004 3,886
Talbot 4,505 4,482 4,398 4,396 4,419 4,495 4,504 4,570 4,570 4,537
Dorchester 4,788 4,654 4,667 4,654 4,560 4,628 4,647 4,718 4,718 4,766
Caroline 5,412 5,570 5,611 5,658 5,513 5,551 5,517 5,585 5,585 5,545
Worcester 6,676 6,727 6,830 6,745 6,671 6,659 6,699 6,650 6,650 6,649
Queen Anne’s 7,713 7,780 7,786 7,808 7,859 7,793 7,781 7,752 7,752 7,716
Allegany 9,840 9,715 9,526 9,436 9,232 9,152 9,022 8,929 8,929 8,872
Districts Between 10,000 and 60,000 Students Wicomico 14,387 14,490 14,427 14,399 14,590 14,619 14,382 14,489 14,489 14,431
Cecil 16,535 16,521 16,421 16,290 16,209 16,205 15,937 15,634 15,634 15,824
Calvert 17,451 17,468 17,474 17,394 17,052 17,006 16,795 16,323 16,323 16,221
Saint Mary’s 16,567 16,649 16,665 16,890 16,752 17,186 17,271 17,453 17,453 17,841
Washington 20,807 21,141 21,594 21,703 21,734 21,902 22,206 22,403 22,403 22,495
Carroll 28,792 28,940 28,616 28,320 27,964 27,721 27,334 26,687 26,687 26,331
Charles 26,026 26,406 26,623 26,676 26,727 26,779 26,850 26,644 26,644 26,455
Harford 40,294 40,212 39,568 39,172 38,610 38,636 38,394 37,868 37,868 37,842
Frederick 39,489 39,672 40,224 40,487 40,070 40,159 40,188 40,456 40,456 40,648
Howard 48,219 48,596 49,048 49,542 49,905 50,641 50,994 52,053 52,053 52,806
Districts Greater Than 60,000 Students Anne Arundel 73,991 73,565 73,066 73,400 73,653 74,776 75,481 77,770 77,770 78,489
Baltimore City 90,677 87,643 84,515 81,284 82,266 82,866 83,800 84,747 84,747 84,730 Baltimore County 107,701 107,043 105,839 104,283 103,180 103,324 104,160 106,927 106,927 108,191 Prince George’s 136,095 133,325 131,014 129,752 127,977 127,039 126,671 123,737 123,737 125,136
Montgomery 139,393 139,398 137,814 137,717 139,282 141,722 144,023 148,780 148,780 151,295
State Total 865,561 860,020 851,640 845,700 843,781 848,252 851,971 859,252 859,252 865,768
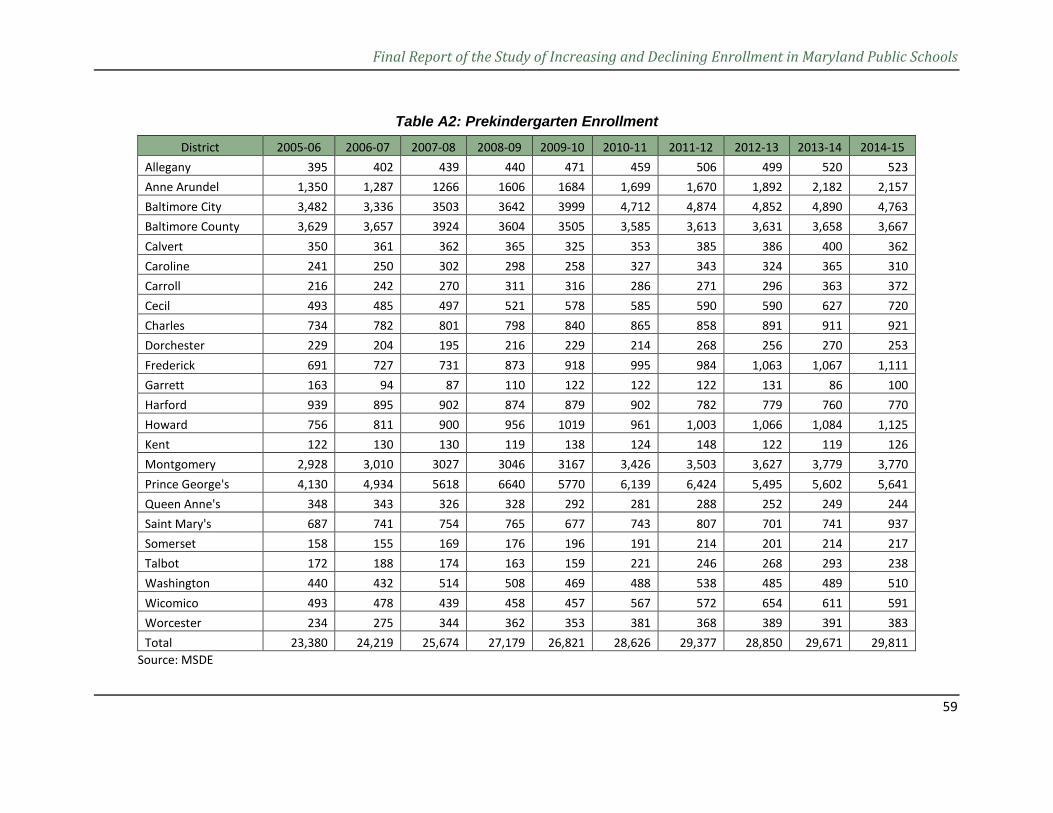
Final Report of the Study of Increasing and Declining Enrollment in Maryland Public Schools
59
Table A2: Prekindergarten Enrollment
Source: MSDE
District 2005-06 2006-07 2007-08 2008-09 2009-10 2010-11 2011-12 2012-13 2013-14 2014-15 Allegany 395 402 439 440 471 459 506 499 520 523 Anne Arundel 1,350 1,287 1266 1606 1684 1,699 1,670 1,892 2,182 2,157 Baltimore City 3,482 3,336 3503 3642 3999 4,712 4,874 4,852 4,890 4,763 Baltimore County 3,629 3,657 3924 3604 3505 3,585 3,613 3,631 3,658 3,667 Calvert 350 361 362 365 325 353 385 386 400 362 Caroline 241 250 302 298 258 327 343 324 365 310 Carroll 216 242 270 311 316 286 271 296 363 372 Cecil 493 485 497 521 578 585 590 590 627 720 Charles 734 782 801 798 840 865 858 891 911 921 Dorchester 229 204 195 216 229 214 268 256 270 253 Frederick 691 727 731 873 918 995 984 1,063 1,067 1,111 Garrett 163 94 87 110 122 122 122 131 86 100 Harford 939 895 902 874 879 902 782 779 760 770 Howard 756 811 900 956 1019 961 1,003 1,066 1,084 1,125 Kent 122 130 130 119 138 124 148 122 119 126 Montgomery 2,928 3,010 3027 3046 3167 3,426 3,503 3,627 3,779 3,770 Prince George's 4,130 4,934 5618 6640 5770 6,139 6,424 5,495 5,602 5,641 Queen Anne's 348 343 326 328 292 281 288 252 249 244 Saint Mary's 687 741 754 765 677 743 807 701 741 937 Somerset 158 155 169 176 196 191 214 201 214 217 Talbot 172 188 174 163 159 221 246 268 293 238 Washington 440 432 514 508 469 488 538 485 489 510 Wicomico 493 478 439 458 457 567 572 654 611 591 Worcester 234 275 344 362 353 381 368 389 391 383 Total 23,380 24,219 25,674 27,179 26,821 28,626 29,377 28,850 29,671 29,811
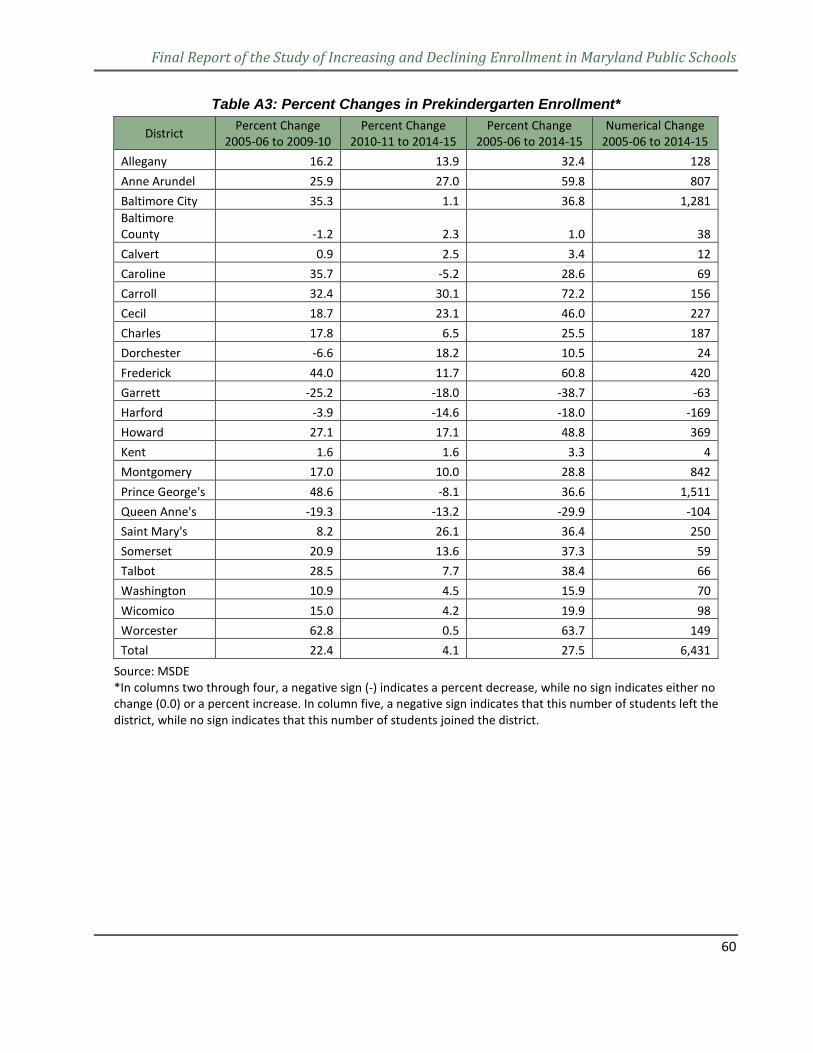
Final Report of the Study of Increasing and Declining Enrollment in Maryland Public Schools
60
Table A3: Percent Changes in Prekindergarten Enrollment*
District Percent Change 2005-06 to 2009-10
Percent Change 2010-11 to 2014-15
Percent Change 2005-06 to 2014-15
Numerical Change 2005-06 to 2014-15
Allegany 16.2 13.9 32.4 128 Anne Arundel 25.9 27.0 59.8 807 Baltimore City 35.3 1.1 36.8 1,281 Baltimore County -1.2 2.3 1.0 38 Calvert 0.9 2.5 3.4 12 Caroline 35.7 -5.2 28.6 69 Carroll 32.4 30.1 72.2 156 Cecil 18.7 23.1 46.0 227 Charles 17.8 6.5 25.5 187 Dorchester -6.6 18.2 10.5 24 Frederick 44.0 11.7 60.8 420 Garrett -25.2 -18.0 -38.7 -63 Harford -3.9 -14.6 -18.0 -169 Howard 27.1 17.1 48.8 369 Kent 1.6 1.6 3.3 4 Montgomery 17.0 10.0 28.8 842 Prince George's 48.6 -8.1 36.6 1,511 Queen Anne's -19.3 -13.2 -29.9 -104 Saint Mary's 8.2 26.1 36.4 250 Somerset 20.9 13.6 37.3 59 Talbot 28.5 7.7 38.4 66 Washington 10.9 4.5 15.9 70 Wicomico 15.0 4.2 19.9 98 Worcester 62.8 0.5 63.7 149 Total 22.4 4.1 27.5 6,431
Source: MSDE *In columns two through four, a negative sign (-) indicates a percent decrease, while no sign indicates either no change (0.0) or a percent increase. In column five, a negative sign indicates that this number of students left the district, while no sign indicates that this number of students joined the district.
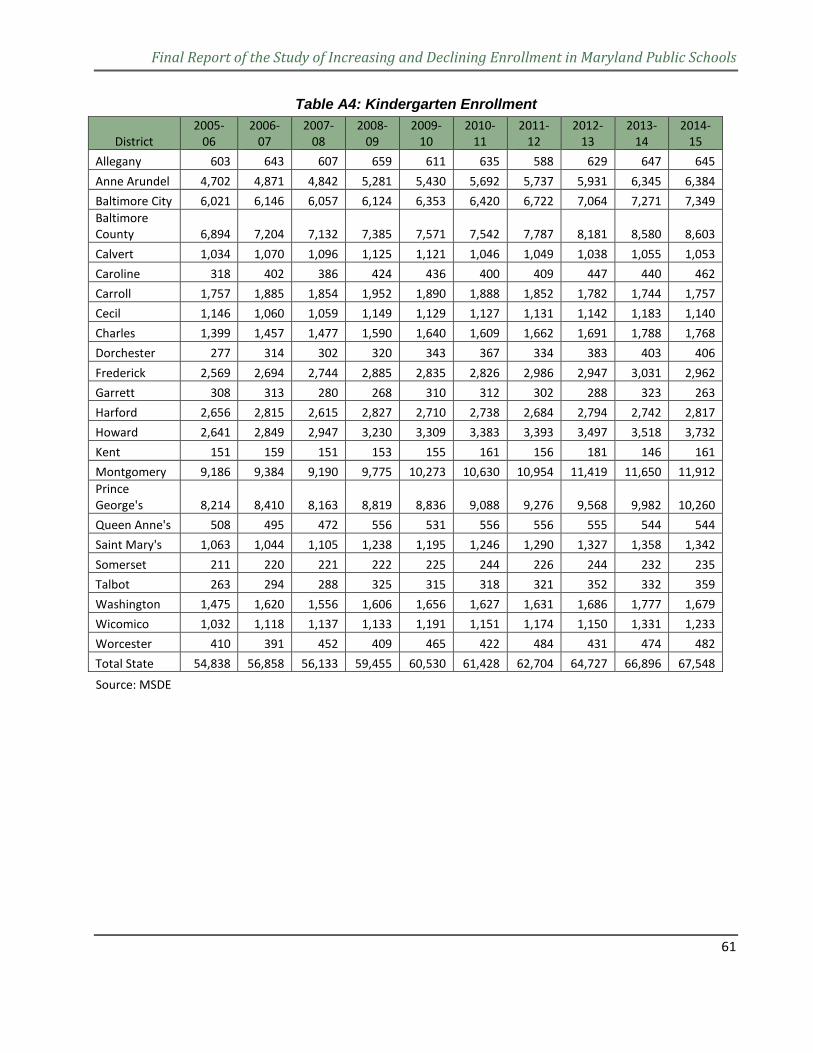
Final Report of the Study of Increasing and Declining Enrollment in Maryland Public Schools
61
Table A4: Kindergarten Enrollment
District 2005-
06 2006-
07 2007-
08 2008-
09 2009-
10 2010-
11 2011-
12 2012-
13 2013-
14 2014-
15 Allegany 603 643 607 659 611 635 588 629 647 645 Anne Arundel 4,702 4,871 4,842 5,281 5,430 5,692 5,737 5,931 6,345 6,384 Baltimore City 6,021 6,146 6,057 6,124 6,353 6,420 6,722 7,064 7,271 7,349 Baltimore County 6,894 7,204 7,132 7,385 7,571 7,542 7,787 8,181 8,580 8,603 Calvert 1,034 1,070 1,096 1,125 1,121 1,046 1,049 1,038 1,055 1,053 Caroline 318 402 386 424 436 400 409 447 440 462 Carroll 1,757 1,885 1,854 1,952 1,890 1,888 1,852 1,782 1,744 1,757 Cecil 1,146 1,060 1,059 1,149 1,129 1,127 1,131 1,142 1,183 1,140 Charles 1,399 1,457 1,477 1,590 1,640 1,609 1,662 1,691 1,788 1,768 Dorchester 277 314 302 320 343 367 334 383 403 406 Frederick 2,569 2,694 2,744 2,885 2,835 2,826 2,986 2,947 3,031 2,962 Garrett 308 313 280 268 310 312 302 288 323 263 Harford 2,656 2,815 2,615 2,827 2,710 2,738 2,684 2,794 2,742 2,817 Howard 2,641 2,849 2,947 3,230 3,309 3,383 3,393 3,497 3,518 3,732 Kent 151 159 151 153 155 161 156 181 146 161 Montgomery 9,186 9,384 9,190 9,775 10,273 10,630 10,954 11,419 11,650 11,912 Prince George's 8,214 8,410 8,163 8,819 8,836 9,088 9,276 9,568 9,982 10,260 Queen Anne's 508 495 472 556 531 556 556 555 544 544 Saint Mary's 1,063 1,044 1,105 1,238 1,195 1,246 1,290 1,327 1,358 1,342 Somerset 211 220 221 222 225 244 226 244 232 235 Talbot 263 294 288 325 315 318 321 352 332 359 Washington 1,475 1,620 1,556 1,606 1,656 1,627 1,631 1,686 1,777 1,679 Wicomico 1,032 1,118 1,137 1,133 1,191 1,151 1,174 1,150 1,331 1,233 Worcester 410 391 452 409 465 422 484 431 474 482 Total State 54,838 56,858 56,133 59,455 60,530 61,428 62,704 64,727 66,896 67,548
Source: MSDE
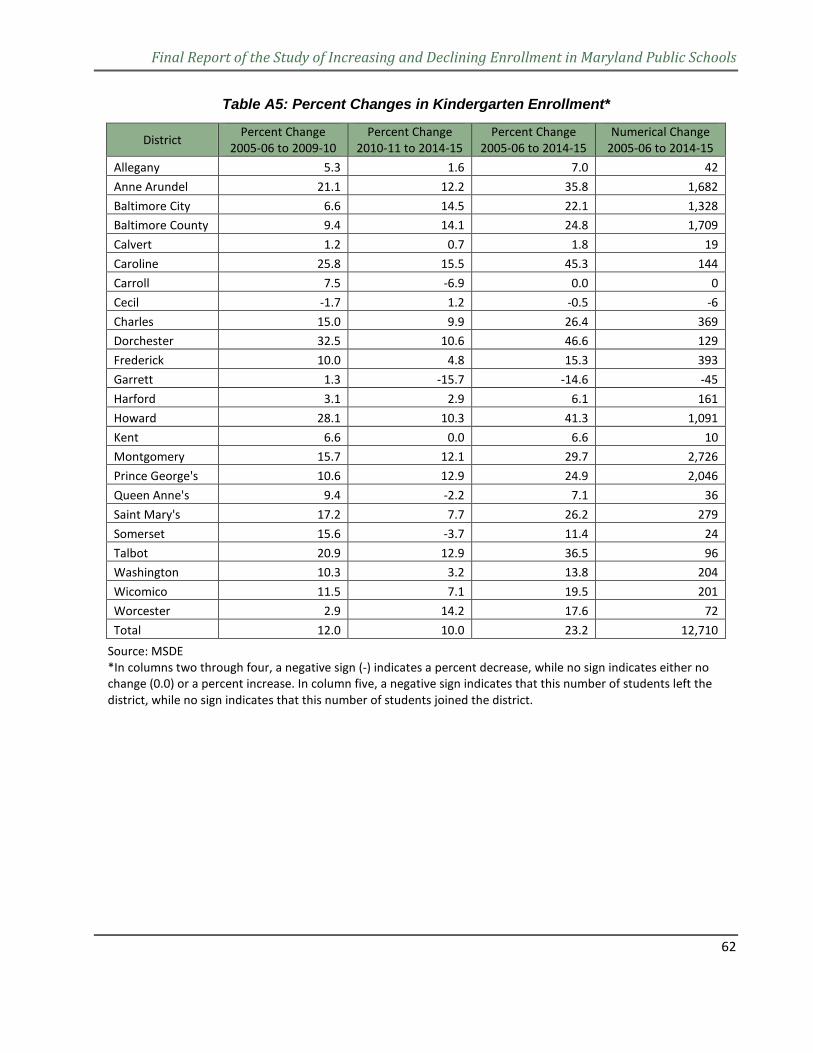
Final Report of the Study of Increasing and Declining Enrollment in Maryland Public Schools
62
Table A5: Percent Changes in Kindergarten Enrollment*
District Percent Change 2005-06 to 2009-10
Percent Change 2010-11 to 2014-15
Percent Change 2005-06 to 2014-15
Numerical Change 2005-06 to 2014-15
Allegany 5.3 1.6 7.0 42 Anne Arundel 21.1 12.2 35.8 1,682 Baltimore City 6.6 14.5 22.1 1,328 Baltimore County 9.4 14.1 24.8 1,709 Calvert 1.2 0.7 1.8 19 Caroline 25.8 15.5 45.3 144 Carroll 7.5 -6.9 0.0 0 Cecil -1.7 1.2 -0.5 -6 Charles 15.0 9.9 26.4 369 Dorchester 32.5 10.6 46.6 129 Frederick 10.0 4.8 15.3 393 Garrett 1.3 -15.7 -14.6 -45 Harford 3.1 2.9 6.1 161 Howard 28.1 10.3 41.3 1,091 Kent 6.6 0.0 6.6 10 Montgomery 15.7 12.1 29.7 2,726 Prince George's 10.6 12.9 24.9 2,046 Queen Anne's 9.4 -2.2 7.1 36 Saint Mary's 17.2 7.7 26.2 279 Somerset 15.6 -3.7 11.4 24 Talbot 20.9 12.9 36.5 96 Washington 10.3 3.2 13.8 204 Wicomico 11.5 7.1 19.5 201 Worcester 2.9 14.2 17.6 72 Total 12.0 10.0 23.2 12,710
Source: MSDE *In columns two through four, a negative sign (-) indicates a percent decrease, while no sign indicates either no change (0.0) or a percent increase. In column five, a negative sign indicates that this number of students left the district, while no sign indicates that this number of students joined the district.
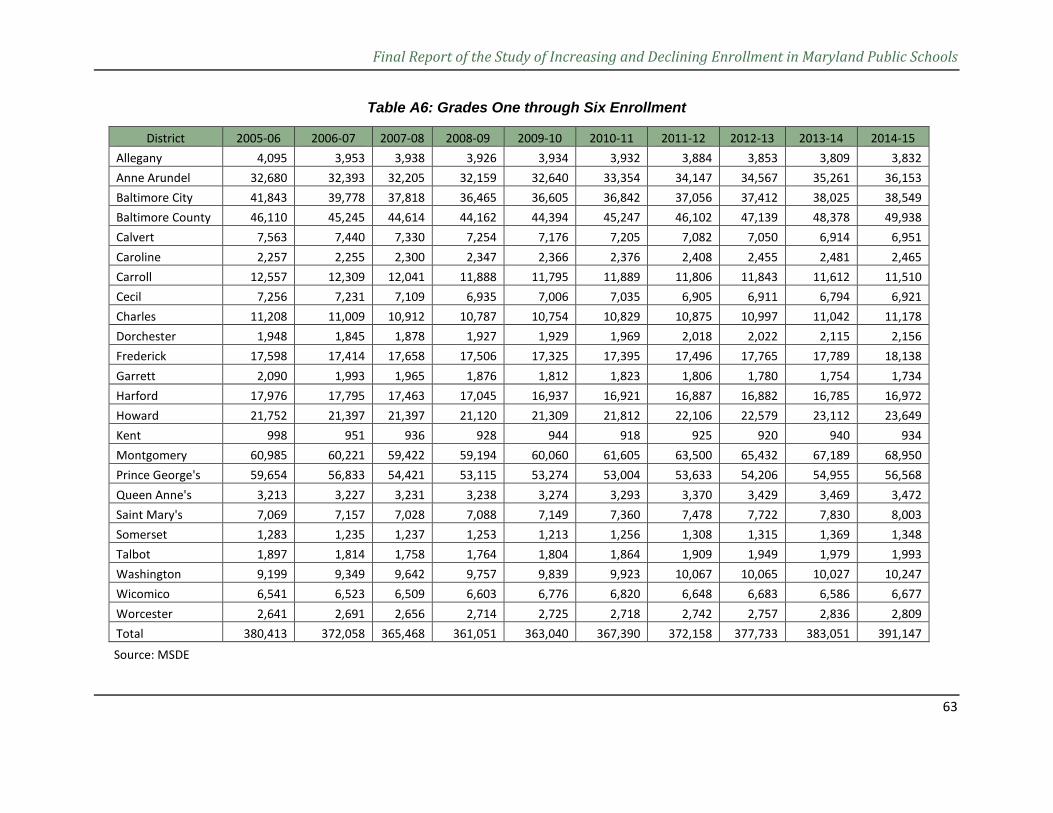
Final Report of the Study of Increasing and Declining Enrollment in Maryland Public Schools
63
Table A6: Grades One through Six Enrollment
District 2005-06 2006-07 2007-08 2008-09 2009-10 2010-11 2011-12 2012-13 2013-14 2014-15 Allegany 4,095 3,953 3,938 3,926 3,934 3,932 3,884 3,853 3,809 3,832 Anne Arundel 32,680 32,393 32,205 32,159 32,640 33,354 34,147 34,567 35,261 36,153 Baltimore City 41,843 39,778 37,818 36,465 36,605 36,842 37,056 37,412 38,025 38,549 Baltimore County 46,110 45,245 44,614 44,162 44,394 45,247 46,102 47,139 48,378 49,938 Calvert 7,563 7,440 7,330 7,254 7,176 7,205 7,082 7,050 6,914 6,951 Caroline 2,257 2,255 2,300 2,347 2,366 2,376 2,408 2,455 2,481 2,465 Carroll 12,557 12,309 12,041 11,888 11,795 11,889 11,806 11,843 11,612 11,510 Cecil 7,256 7,231 7,109 6,935 7,006 7,035 6,905 6,911 6,794 6,921 Charles 11,208 11,009 10,912 10,787 10,754 10,829 10,875 10,997 11,042 11,178 Dorchester 1,948 1,845 1,878 1,927 1,929 1,969 2,018 2,022 2,115 2,156 Frederick 17,598 17,414 17,658 17,506 17,325 17,395 17,496 17,765 17,789 18,138 Garrett 2,090 1,993 1,965 1,876 1,812 1,823 1,806 1,780 1,754 1,734 Harford 17,976 17,795 17,463 17,045 16,937 16,921 16,887 16,882 16,785 16,972 Howard 21,752 21,397 21,397 21,120 21,309 21,812 22,106 22,579 23,112 23,649 Kent 998 951 936 928 944 918 925 920 940 934 Montgomery 60,985 60,221 59,422 59,194 60,060 61,605 63,500 65,432 67,189 68,950 Prince George's 59,654 56,833 54,421 53,115 53,274 53,004 53,633 54,206 54,955 56,568 Queen Anne's 3,213 3,227 3,231 3,238 3,274 3,293 3,370 3,429 3,469 3,472 Saint Mary's 7,069 7,157 7,028 7,088 7,149 7,360 7,478 7,722 7,830 8,003 Somerset 1,283 1,235 1,237 1,253 1,213 1,256 1,308 1,315 1,369 1,348 Talbot 1,897 1,814 1,758 1,764 1,804 1,864 1,909 1,949 1,979 1,993 Washington 9,199 9,349 9,642 9,757 9,839 9,923 10,067 10,065 10,027 10,247 Wicomico 6,541 6,523 6,509 6,603 6,776 6,820 6,648 6,683 6,586 6,677 Worcester 2,641 2,691 2,656 2,714 2,725 2,718 2,742 2,757 2,836 2,809 Total 380,413 372,058 365,468 361,051 363,040 367,390 372,158 377,733 383,051 391,147
Source: MSDE
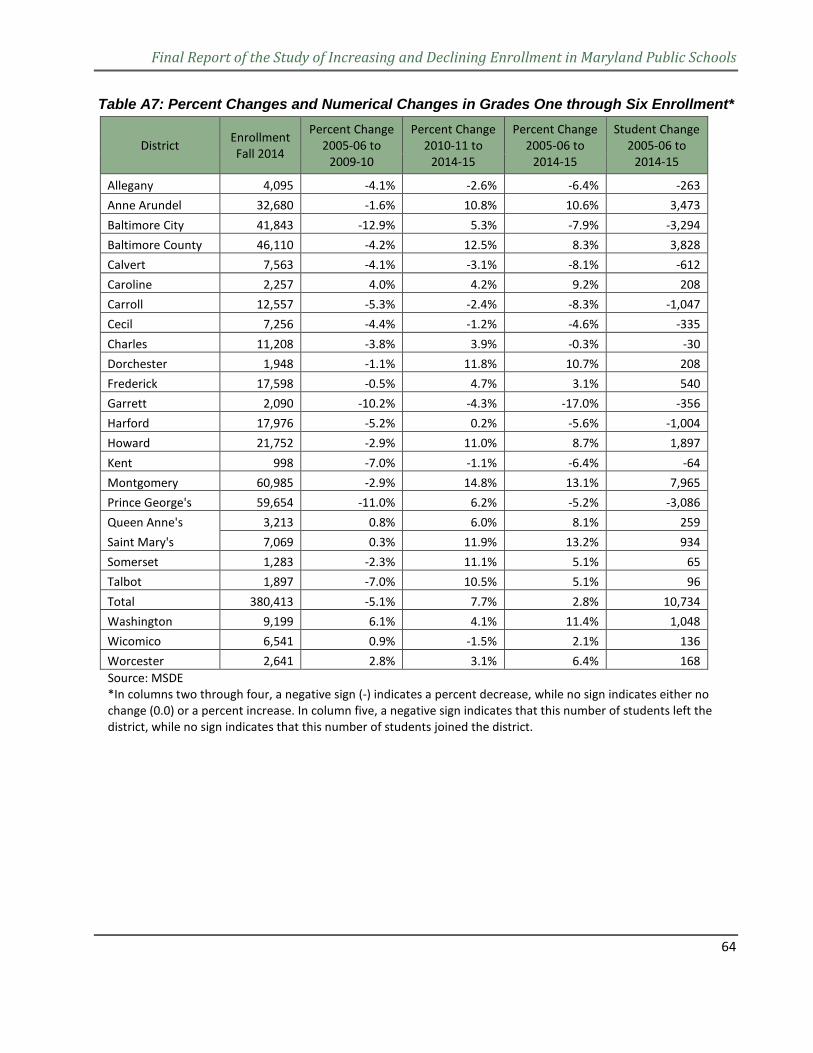
Final Report of the Study of Increasing and Declining Enrollment in Maryland Public Schools
64
Table A7: Percent Changes and Numerical Changes in Grades One through Six Enrollment*
District Enrollment Fall 2014
Percent Change 2005-06 to
2009-10
Percent Change 2010-11 to
2014-15
Percent Change 2005-06 to
2014-15
Student Change 2005-06 to
2014-15
Allegany 4,095 -4.1% -2.6% -6.4% -263 Anne Arundel 32,680 -1.6% 10.8% 10.6% 3,473 Baltimore City 41,843 -12.9% 5.3% -7.9% -3,294 Baltimore County 46,110 -4.2% 12.5% 8.3% 3,828 Calvert 7,563 -4.1% -3.1% -8.1% -612 Caroline 2,257 4.0% 4.2% 9.2% 208 Carroll 12,557 -5.3% -2.4% -8.3% -1,047 Cecil 7,256 -4.4% -1.2% -4.6% -335 Charles 11,208 -3.8% 3.9% -0.3% -30 Dorchester 1,948 -1.1% 11.8% 10.7% 208 Frederick 17,598 -0.5% 4.7% 3.1% 540 Garrett 2,090 -10.2% -4.3% -17.0% -356 Harford 17,976 -5.2% 0.2% -5.6% -1,004 Howard 21,752 -2.9% 11.0% 8.7% 1,897 Kent 998 -7.0% -1.1% -6.4% -64 Montgomery 60,985 -2.9% 14.8% 13.1% 7,965 Prince George's 59,654 -11.0% 6.2% -5.2% -3,086 Queen Anne's 3,213 0.8% 6.0% 8.1% 259 Saint Mary's 7,069 0.3% 11.9% 13.2% 934 Somerset 1,283 -2.3% 11.1% 5.1% 65 Talbot 1,897 -7.0% 10.5% 5.1% 96 Total 380,413 -5.1% 7.7% 2.8% 10,734 Washington 9,199 6.1% 4.1% 11.4% 1,048 Wicomico 6,541 0.9% -1.5% 2.1% 136 Worcester 2,641 2.8% 3.1% 6.4% 168 Source: MSDE *In columns two through four, a negative sign (-) indicates a percent decrease, while no sign indicates either no change (0.0) or a percent increase. In column five, a negative sign indicates that this number of students left the district, while no sign indicates that this number of students joined the district.
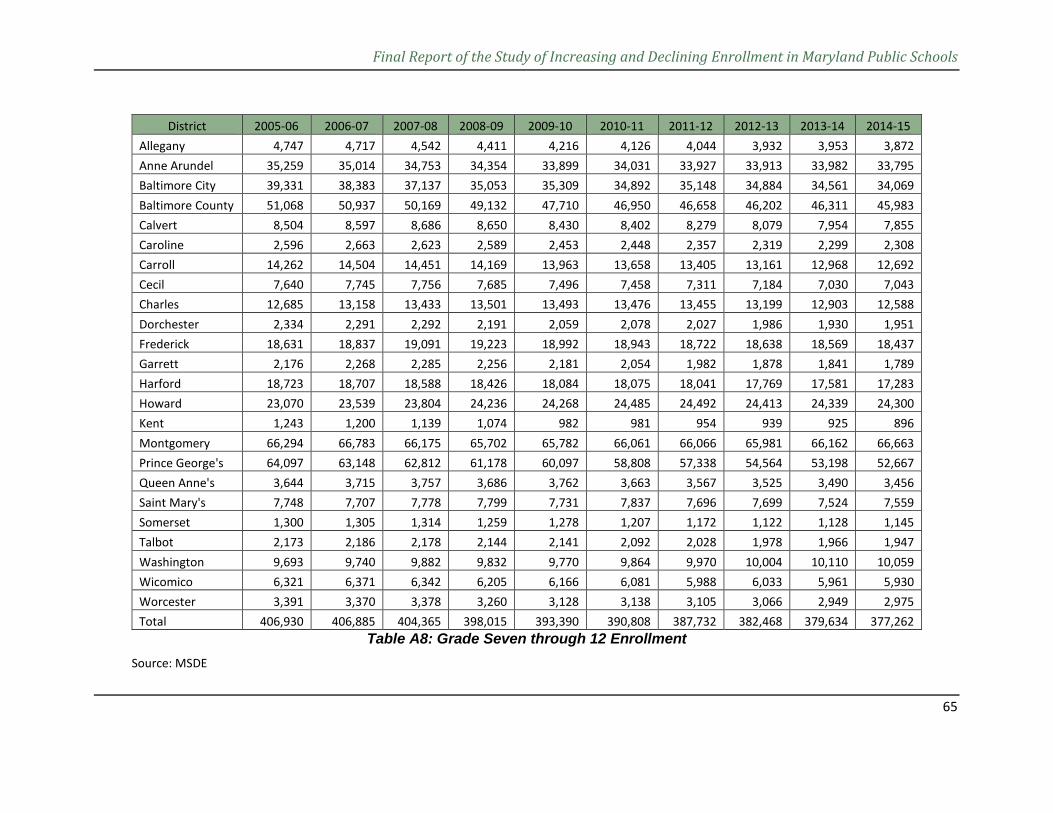
Final Report of the Study of Increasing and Declining Enrollment in Maryland Public Schools
65
Table A8: Grade Seven through 12 Enrollment Source: MSDE
District 2005-06 2006-07 2007-08 2008-09 2009-10 2010-11 2011-12 2012-13 2013-14 2014-15 Allegany 4,747 4,717 4,542 4,411 4,216 4,126 4,044 3,932 3,953 3,872 Anne Arundel 35,259 35,014 34,753 34,354 33,899 34,031 33,927 33,913 33,982 33,795 Baltimore City 39,331 38,383 37,137 35,053 35,309 34,892 35,148 34,884 34,561 34,069 Baltimore County 51,068 50,937 50,169 49,132 47,710 46,950 46,658 46,202 46,311 45,983 Calvert 8,504 8,597 8,686 8,650 8,430 8,402 8,279 8,079 7,954 7,855 Caroline 2,596 2,663 2,623 2,589 2,453 2,448 2,357 2,319 2,299 2,308 Carroll 14,262 14,504 14,451 14,169 13,963 13,658 13,405 13,161 12,968 12,692 Cecil 7,640 7,745 7,756 7,685 7,496 7,458 7,311 7,184 7,030 7,043 Charles 12,685 13,158 13,433 13,501 13,493 13,476 13,455 13,199 12,903 12,588 Dorchester 2,334 2,291 2,292 2,191 2,059 2,078 2,027 1,986 1,930 1,951 Frederick 18,631 18,837 19,091 19,223 18,992 18,943 18,722 18,638 18,569 18,437 Garrett 2,176 2,268 2,285 2,256 2,181 2,054 1,982 1,878 1,841 1,789 Harford 18,723 18,707 18,588 18,426 18,084 18,075 18,041 17,769 17,581 17,283 Howard 23,070 23,539 23,804 24,236 24,268 24,485 24,492 24,413 24,339 24,300 Kent 1,243 1,200 1,139 1,074 982 981 954 939 925 896 Montgomery 66,294 66,783 66,175 65,702 65,782 66,061 66,066 65,981 66,162 66,663 Prince George's 64,097 63,148 62,812 61,178 60,097 58,808 57,338 54,564 53,198 52,667 Queen Anne's 3,644 3,715 3,757 3,686 3,762 3,663 3,567 3,525 3,490 3,456 Saint Mary's 7,748 7,707 7,778 7,799 7,731 7,837 7,696 7,699 7,524 7,559 Somerset 1,300 1,305 1,314 1,259 1,278 1,207 1,172 1,122 1,128 1,145 Talbot 2,173 2,186 2,178 2,144 2,141 2,092 2,028 1,978 1,966 1,947 Washington 9,693 9,740 9,882 9,832 9,770 9,864 9,970 10,004 10,110 10,059 Wicomico 6,321 6,371 6,342 6,205 6,166 6,081 5,988 6,033 5,961 5,930 Worcester 3,391 3,370 3,378 3,260 3,128 3,138 3,105 3,066 2,949 2,975 Total 406,930 406,885 404,365 398,015 393,390 390,808 387,732 382,468 379,634 377,262
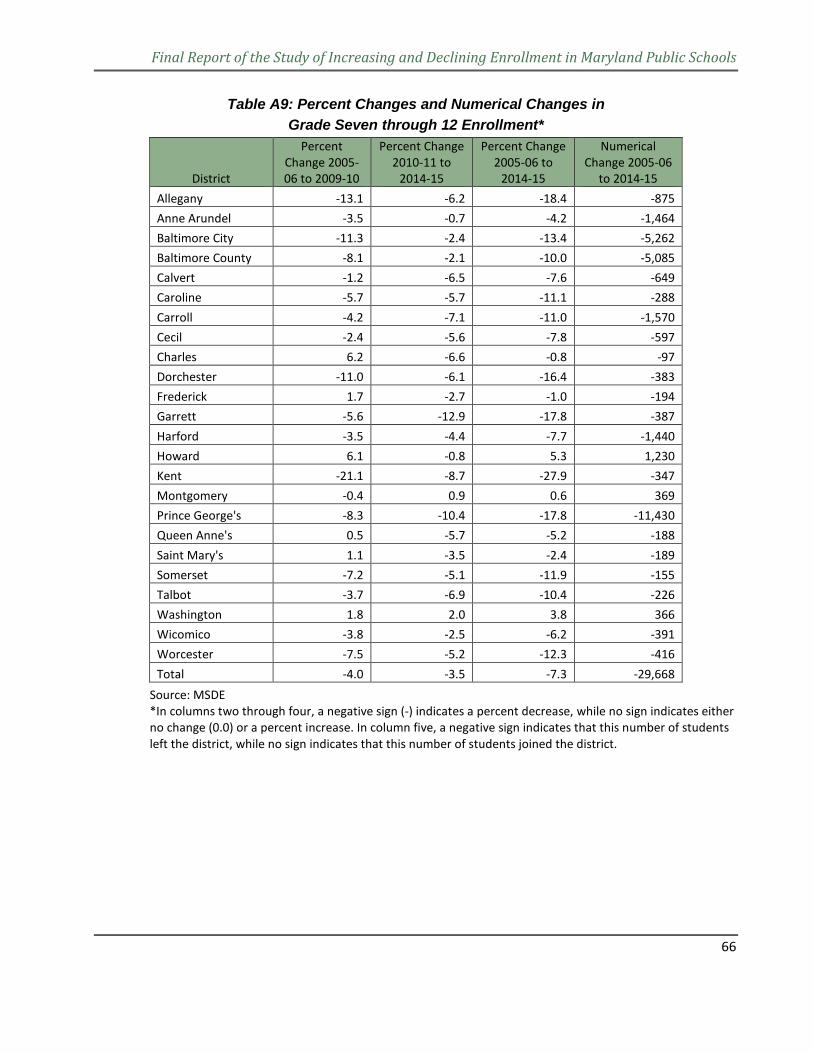
Final Report of the Study of Increasing and Declining Enrollment in Maryland Public Schools
66
Table A9: Percent Changes and Numerical Changes in Grade Seven through 12 Enrollment*
District
Percent Change 2005-06 to 2009-10
Percent Change 2010-11 to
2014-15
Percent Change 2005-06 to
2014-15
Numerical Change 2005-06
to 2014-15
Allegany -13.1 -6.2 -18.4 -875 Anne Arundel -3.5 -0.7 -4.2 -1,464 Baltimore City -11.3 -2.4 -13.4 -5,262 Baltimore County -8.1 -2.1 -10.0 -5,085 Calvert -1.2 -6.5 -7.6 -649 Caroline -5.7 -5.7 -11.1 -288 Carroll -4.2 -7.1 -11.0 -1,570 Cecil -2.4 -5.6 -7.8 -597 Charles 6.2 -6.6 -0.8 -97 Dorchester -11.0 -6.1 -16.4 -383 Frederick 1.7 -2.7 -1.0 -194 Garrett -5.6 -12.9 -17.8 -387 Harford -3.5 -4.4 -7.7 -1,440 Howard 6.1 -0.8 5.3 1,230 Kent -21.1 -8.7 -27.9 -347 Montgomery -0.4 0.9 0.6 369 Prince George's -8.3 -10.4 -17.8 -11,430 Queen Anne's 0.5 -5.7 -5.2 -188 Saint Mary's 1.1 -3.5 -2.4 -189 Somerset -7.2 -5.1 -11.9 -155 Talbot -3.7 -6.9 -10.4 -226 Washington 1.8 2.0 3.8 366 Wicomico -3.8 -2.5 -6.2 -391 Worcester -7.5 -5.2 -12.3 -416 Total -4.0 -3.5 -7.3 -29,668
Source: MSDE *In columns two through four, a negative sign (-) indicates a percent decrease, while no sign indicates either no change (0.0) or a percent increase. In column five, a negative sign indicates that this number of students left the district, while no sign indicates that this number of students joined the district.
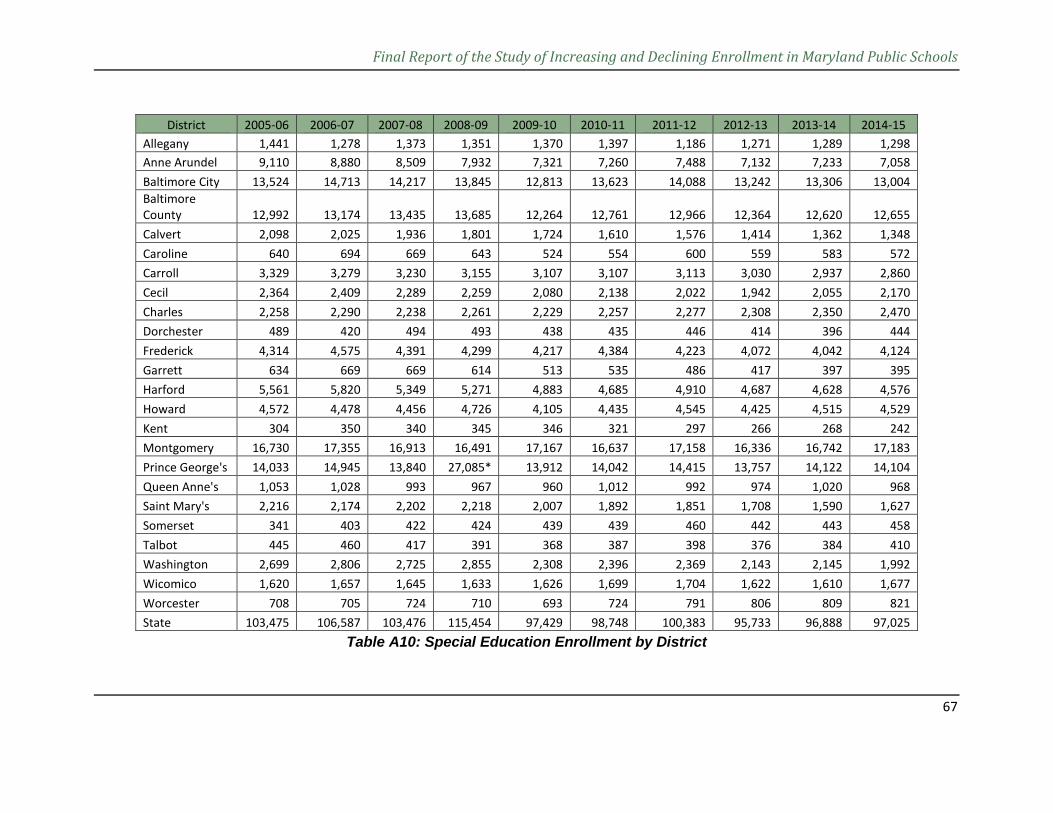
Final Report of the Study of Increasing and Declining Enrollment in Maryland Public Schools
67
Table A10: Special Education Enrollment by District
District 2005-06 2006-07 2007-08 2008-09 2009-10 2010-11 2011-12 2012-13 2013-14 2014-15 Allegany 1,441 1,278 1,373 1,351 1,370 1,397 1,186 1,271 1,289 1,298 Anne Arundel 9,110 8,880 8,509 7,932 7,321 7,260 7,488 7,132 7,233 7,058 Baltimore City 13,524 14,713 14,217 13,845 12,813 13,623 14,088 13,242 13,306 13,004 Baltimore County 12,992 13,174 13,435 13,685 12,264 12,761 12,966 12,364 12,620 12,655 Calvert 2,098 2,025 1,936 1,801 1,724 1,610 1,576 1,414 1,362 1,348 Caroline 640 694 669 643 524 554 600 559 583 572 Carroll 3,329 3,279 3,230 3,155 3,107 3,107 3,113 3,030 2,937 2,860 Cecil 2,364 2,409 2,289 2,259 2,080 2,138 2,022 1,942 2,055 2,170 Charles 2,258 2,290 2,238 2,261 2,229 2,257 2,277 2,308 2,350 2,470 Dorchester 489 420 494 493 438 435 446 414 396 444 Frederick 4,314 4,575 4,391 4,299 4,217 4,384 4,223 4,072 4,042 4,124 Garrett 634 669 669 614 513 535 486 417 397 395 Harford 5,561 5,820 5,349 5,271 4,883 4,685 4,910 4,687 4,628 4,576 Howard 4,572 4,478 4,456 4,726 4,105 4,435 4,545 4,425 4,515 4,529 Kent 304 350 340 345 346 321 297 266 268 242 Montgomery 16,730 17,355 16,913 16,491 17,167 16,637 17,158 16,336 16,742 17,183 Prince George's 14,033 14,945 13,840 27,085* 13,912 14,042 14,415 13,757 14,122 14,104 Queen Anne's 1,053 1,028 993 967 960 1,012 992 974 1,020 968 Saint Mary's 2,216 2,174 2,202 2,218 2,007 1,892 1,851 1,708 1,590 1,627 Somerset 341 403 422 424 439 439 460 442 443 458 Talbot 445 460 417 391 368 387 398 376 384 410 Washington 2,699 2,806 2,725 2,855 2,308 2,396 2,369 2,143 2,145 1,992 Wicomico 1,620 1,657 1,645 1,633 1,626 1,699 1,704 1,622 1,610 1,677 Worcester 708 705 724 710 693 724 791 806 809 821 State 103,475 106,587 103,476 115,454 97,429 98,748 100,383 95,733 96,888 97,025
Final Report of the Study of Increasing and Declining Enrollment in Maryland Public Schools
68
Source: MSDE *The large increase in special education enrollment in 2008-09 followed by a significant decrease in 2009-10 may be the result of an error in the data in Prince George’s County reported to MSDE.
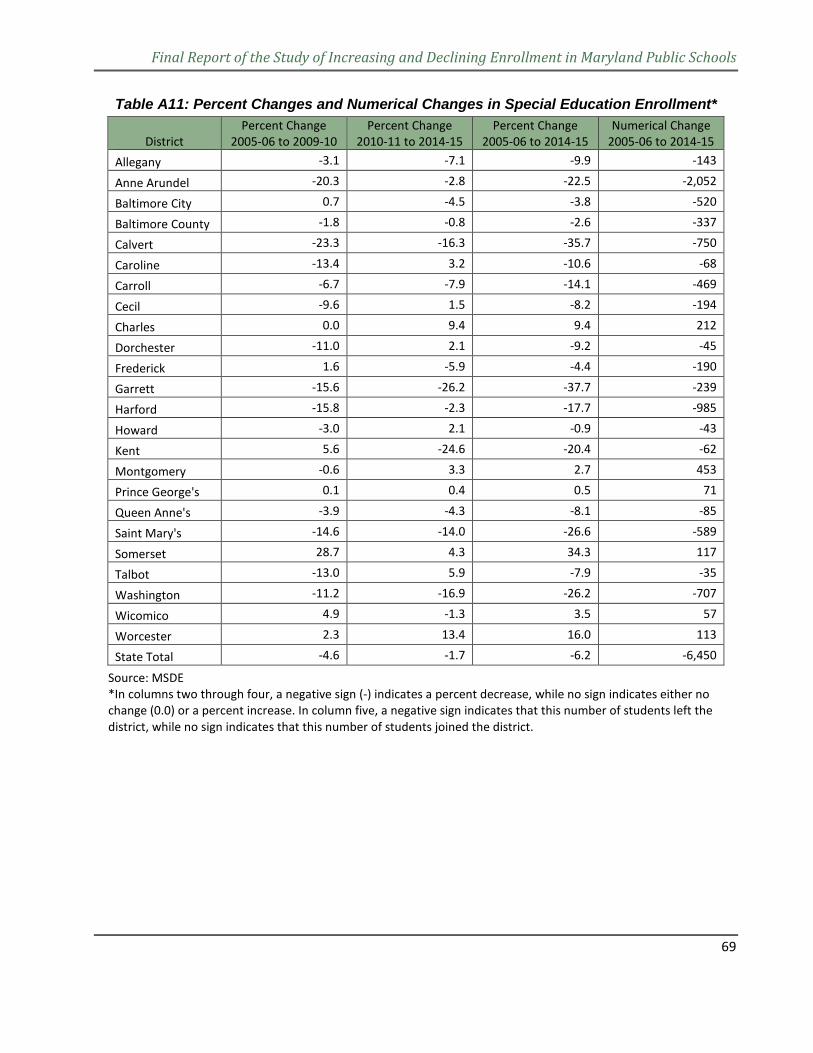
Final Report of the Study of Increasing and Declining Enrollment in Maryland Public Schools
69
Table A11: Percent Changes and Numerical Changes in Special Education Enrollment*
District Percent Change
2005-06 to 2009-10 Percent Change
2010-11 to 2014-15 Percent Change
2005-06 to 2014-15 Numerical Change
2005-06 to 2014-15
Allegany -3.1 -7.1 -9.9 -143
Anne Arundel -20.3 -2.8 -22.5 -2,052
Baltimore City 0.7 -4.5 -3.8 -520
Baltimore County -1.8 -0.8 -2.6 -337
Calvert -23.3 -16.3 -35.7 -750
Caroline -13.4 3.2 -10.6 -68
Carroll -6.7 -7.9 -14.1 -469
Cecil -9.6 1.5 -8.2 -194
Charles 0.0 9.4 9.4 212
Dorchester -11.0 2.1 -9.2 -45
Frederick 1.6 -5.9 -4.4 -190
Garrett -15.6 -26.2 -37.7 -239
Harford -15.8 -2.3 -17.7 -985
Howard -3.0 2.1 -0.9 -43
Kent 5.6 -24.6 -20.4 -62
Montgomery -0.6 3.3 2.7 453
Prince George's 0.1 0.4 0.5 71
Queen Anne's -3.9 -4.3 -8.1 -85
Saint Mary's -14.6 -14.0 -26.6 -589
Somerset 28.7 4.3 34.3 117
Talbot -13.0 5.9 -7.9 -35
Washington -11.2 -16.9 -26.2 -707
Wicomico 4.9 -1.3 3.5 57
Worcester 2.3 13.4 16.0 113
State Total -4.6 -1.7 -6.2 -6,450
Source: MSDE *In columns two through four, a negative sign (-) indicates a percent decrease, while no sign indicates either no change (0.0) or a percent increase. In column five, a negative sign indicates that this number of students left the district, while no sign indicates that this number of students joined the district.
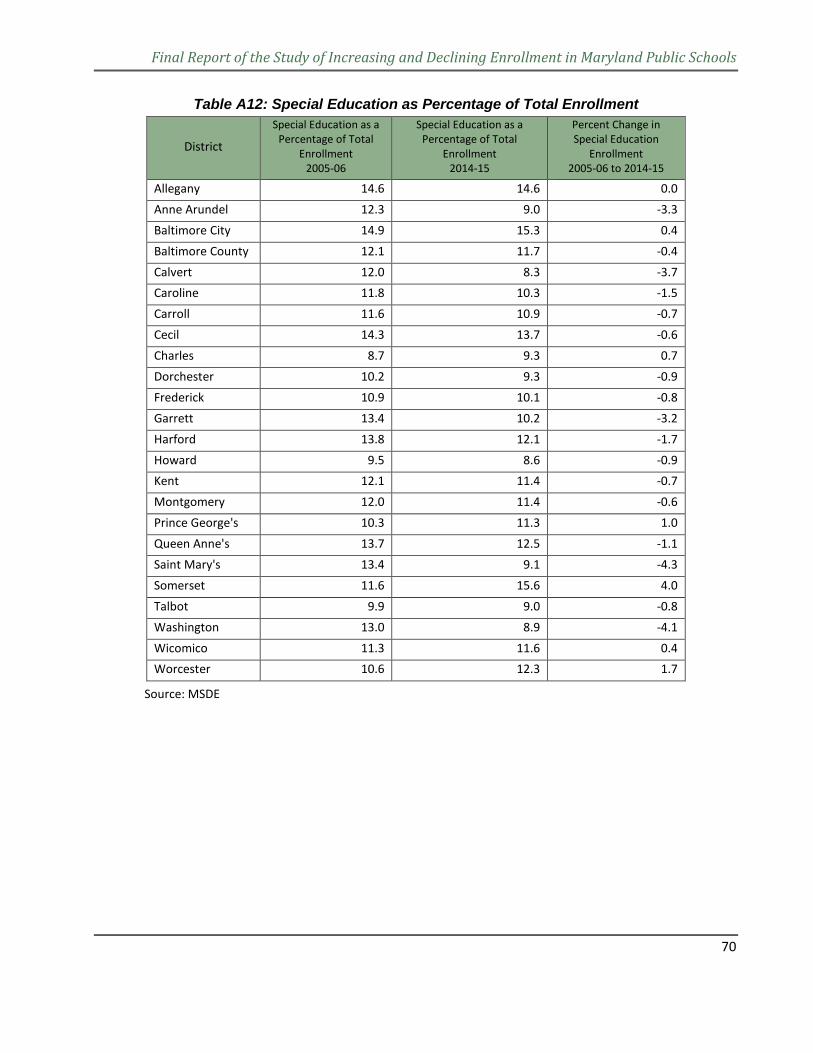
Final Report of the Study of Increasing and Declining Enrollment in Maryland Public Schools
70
Table A12: Special Education as Percentage of Total Enrollment
District
Special Education as a Percentage of Total
Enrollment 2005-06
Special Education as a Percentage of Total
Enrollment 2014-15
Percent Change in Special Education
Enrollment 2005-06 to 2014-15
Allegany 14.6 14.6 0.0 Anne Arundel 12.3 9.0 -3.3 Baltimore City 14.9 15.3 0.4 Baltimore County 12.1 11.7 -0.4 Calvert 12.0 8.3 -3.7 Caroline 11.8 10.3 -1.5 Carroll 11.6 10.9 -0.7 Cecil 14.3 13.7 -0.6 Charles 8.7 9.3 0.7 Dorchester 10.2 9.3 -0.9 Frederick 10.9 10.1 -0.8 Garrett 13.4 10.2 -3.2 Harford 13.8 12.1 -1.7 Howard 9.5 8.6 -0.9 Kent 12.1 11.4 -0.7 Montgomery 12.0 11.4 -0.6 Prince George's 10.3 11.3 1.0 Queen Anne's 13.7 12.5 -1.1 Saint Mary's 13.4 9.1 -4.3 Somerset 11.6 15.6 4.0 Talbot 9.9 9.0 -0.8 Washington 13.0 8.9 -4.1 Wicomico 11.3 11.6 0.4 Worcester 10.6 12.3 1.7
Source: MSDE
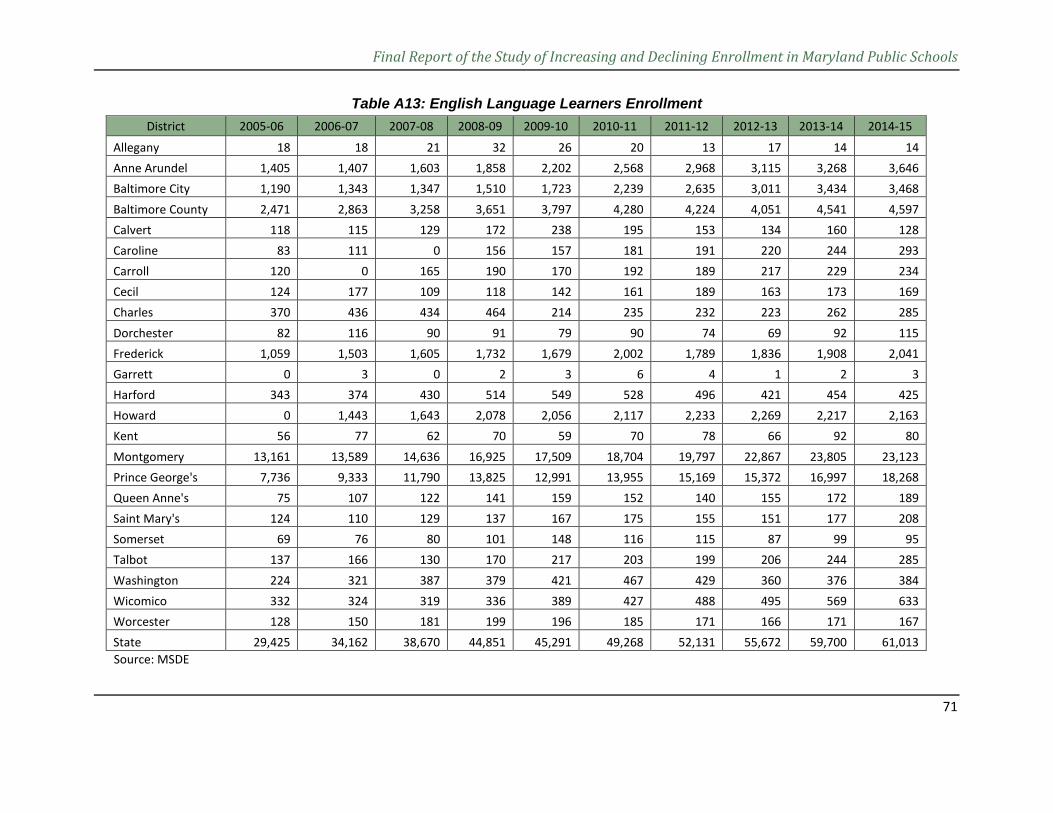
Final Report of the Study of Increasing and Declining Enrollment in Maryland Public Schools
71
Table A13: English Language Learners Enrollment District 2005-06 2006-07 2007-08 2008-09 2009-10 2010-11 2011-12 2012-13 2013-14 2014-15
Allegany 18 18 21 32 26 20 13 17 14 14 Anne Arundel 1,405 1,407 1,603 1,858 2,202 2,568 2,968 3,115 3,268 3,646 Baltimore City 1,190 1,343 1,347 1,510 1,723 2,239 2,635 3,011 3,434 3,468 Baltimore County 2,471 2,863 3,258 3,651 3,797 4,280 4,224 4,051 4,541 4,597 Calvert 118 115 129 172 238 195 153 134 160 128 Caroline 83 111 0 156 157 181 191 220 244 293 Carroll 120 0 165 190 170 192 189 217 229 234 Cecil 124 177 109 118 142 161 189 163 173 169 Charles 370 436 434 464 214 235 232 223 262 285 Dorchester 82 116 90 91 79 90 74 69 92 115 Frederick 1,059 1,503 1,605 1,732 1,679 2,002 1,789 1,836 1,908 2,041 Garrett 0 3 0 2 3 6 4 1 2 3 Harford 343 374 430 514 549 528 496 421 454 425 Howard 0 1,443 1,643 2,078 2,056 2,117 2,233 2,269 2,217 2,163 Kent 56 77 62 70 59 70 78 66 92 80 Montgomery 13,161 13,589 14,636 16,925 17,509 18,704 19,797 22,867 23,805 23,123 Prince George's 7,736 9,333 11,790 13,825 12,991 13,955 15,169 15,372 16,997 18,268 Queen Anne's 75 107 122 141 159 152 140 155 172 189 Saint Mary's 124 110 129 137 167 175 155 151 177 208 Somerset 69 76 80 101 148 116 115 87 99 95 Talbot 137 166 130 170 217 203 199 206 244 285 Washington 224 321 387 379 421 467 429 360 376 384 Wicomico 332 324 319 336 389 427 488 495 569 633 Worcester 128 150 181 199 196 185 171 166 171 167 State 29,425 34,162 38,670 44,851 45,291 49,268 52,131 55,672 59,700 61,013 Source: MSDE
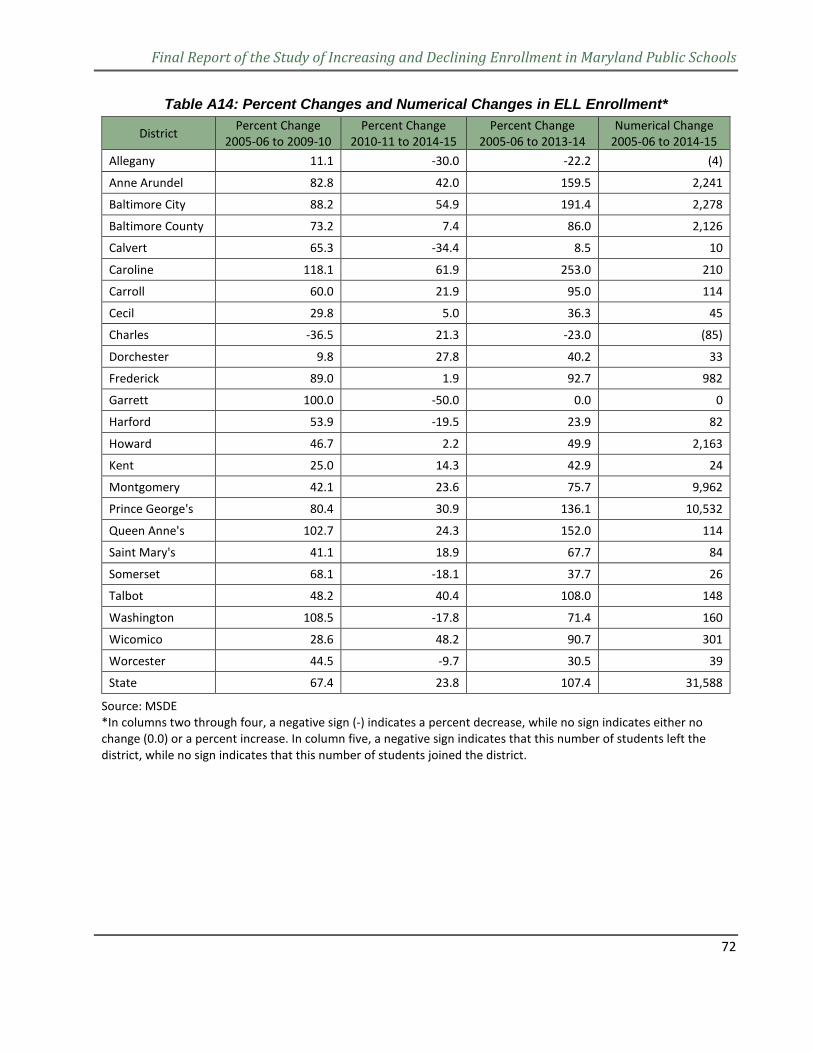
Final Report of the Study of Increasing and Declining Enrollment in Maryland Public Schools
72
Table A14: Percent Changes and Numerical Changes in ELL Enrollment*
District Percent Change 2005-06 to 2009-10
Percent Change 2010-11 to 2014-15
Percent Change 2005-06 to 2013-14
Numerical Change 2005-06 to 2014-15
Allegany 11.1 -30.0 -22.2 (4)
Anne Arundel 82.8 42.0 159.5 2,241
Baltimore City 88.2 54.9 191.4 2,278
Baltimore County 73.2 7.4 86.0 2,126
Calvert 65.3 -34.4 8.5 10
Caroline 118.1 61.9 253.0 210
Carroll 60.0 21.9 95.0 114
Cecil 29.8 5.0 36.3 45
Charles -36.5 21.3 -23.0 (85)
Dorchester 9.8 27.8 40.2 33
Frederick 89.0 1.9 92.7 982
Garrett 100.0 -50.0 0.0 0
Harford 53.9 -19.5 23.9 82
Howard 46.7 2.2 49.9 2,163
Kent 25.0 14.3 42.9 24
Montgomery 42.1 23.6 75.7 9,962
Prince George's 80.4 30.9 136.1 10,532
Queen Anne's 102.7 24.3 152.0 114
Saint Mary's 41.1 18.9 67.7 84
Somerset 68.1 -18.1 37.7 26
Talbot 48.2 40.4 108.0 148
Washington 108.5 -17.8 71.4 160
Wicomico 28.6 48.2 90.7 301
Worcester 44.5 -9.7 30.5 39
State 67.4 23.8 107.4 31,588
Source: MSDE *In columns two through four, a negative sign (-) indicates a percent decrease, while no sign indicates either no change (0.0) or a percent increase. In column five, a negative sign indicates that this number of students left the district, while no sign indicates that this number of students joined the district.
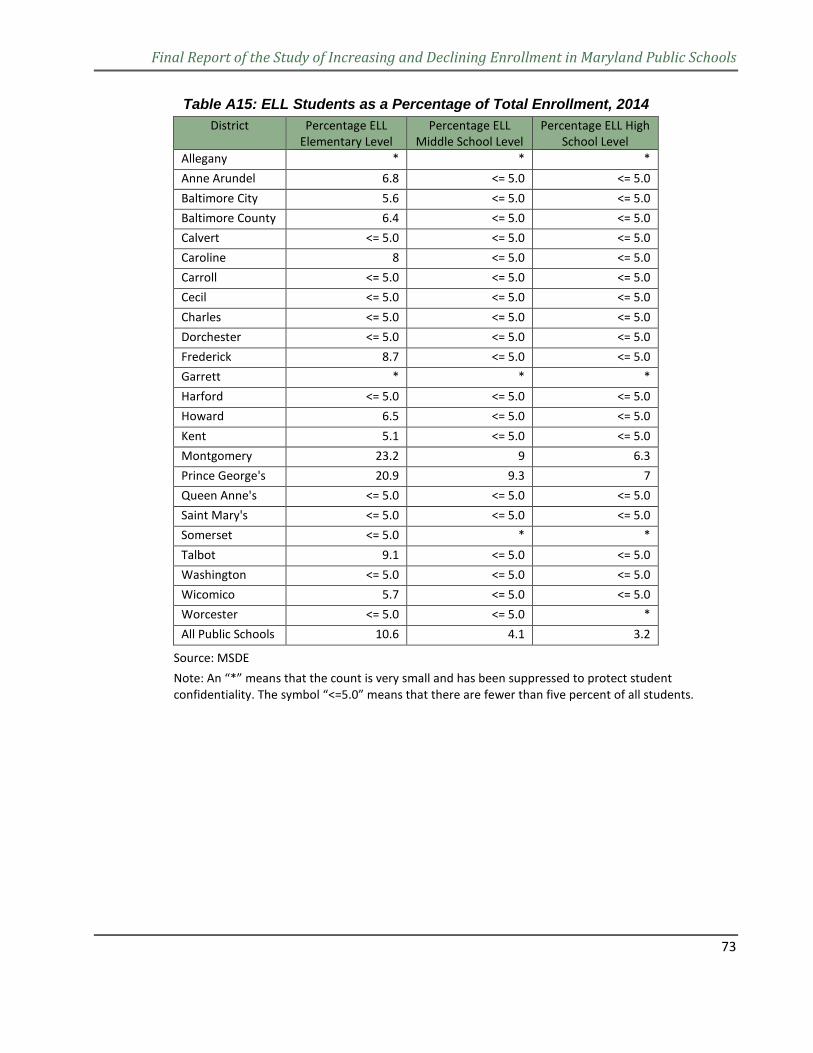
Final Report of the Study of Increasing and Declining Enrollment in Maryland Public Schools
73
Table A15: ELL Students as a Percentage of Total Enrollment, 2014 District Percentage ELL
Elementary Level Percentage ELL
Middle School Level Percentage ELL High
School Level Allegany * * * Anne Arundel 6.8 <= 5.0 <= 5.0 Baltimore City 5.6 <= 5.0 <= 5.0 Baltimore County 6.4 <= 5.0 <= 5.0 Calvert <= 5.0 <= 5.0 <= 5.0 Caroline 8 <= 5.0 <= 5.0 Carroll <= 5.0 <= 5.0 <= 5.0 Cecil <= 5.0 <= 5.0 <= 5.0 Charles <= 5.0 <= 5.0 <= 5.0 Dorchester <= 5.0 <= 5.0 <= 5.0 Frederick 8.7 <= 5.0 <= 5.0 Garrett * * * Harford <= 5.0 <= 5.0 <= 5.0 Howard 6.5 <= 5.0 <= 5.0 Kent 5.1 <= 5.0 <= 5.0 Montgomery 23.2 9 6.3 Prince George's 20.9 9.3 7 Queen Anne's <= 5.0 <= 5.0 <= 5.0 Saint Mary's <= 5.0 <= 5.0 <= 5.0 Somerset <= 5.0 * * Talbot 9.1 <= 5.0 <= 5.0 Washington <= 5.0 <= 5.0 <= 5.0 Wicomico 5.7 <= 5.0 <= 5.0 Worcester <= 5.0 <= 5.0 * All Public Schools 10.6 4.1 3.2
Source: MSDE Note: An “*” means that the count is very small and has been suppressed to protect student confidentiality. The symbol “<=5.0” means that there are fewer than five percent of all students.
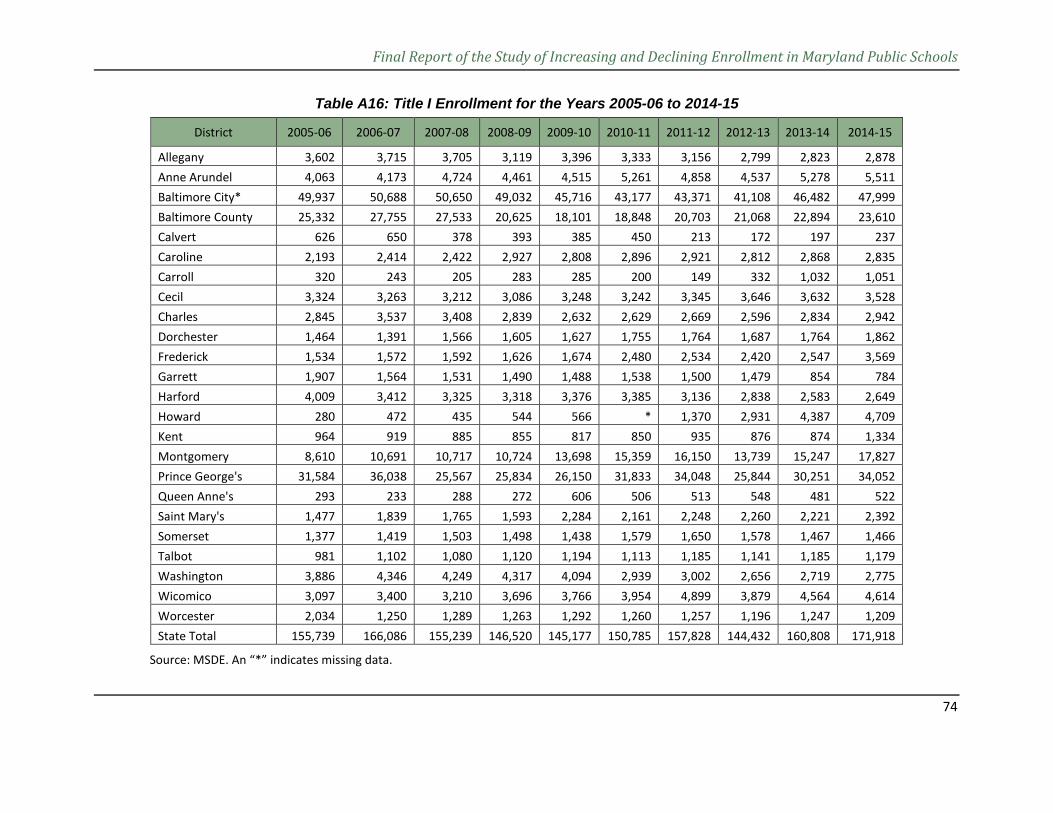
Final Report of the Study of Increasing and Declining Enrollment in Maryland Public Schools
74
Table A16: Title I Enrollment for the Years 2005-06 to 2014-15
Source: MSDE. An “*” indicates missing data.
District 2005-06 2006-07 2007-08 2008-09 2009-10 2010-11 2011-12 2012-13 2013-14 2014-15
Allegany 3,602 3,715 3,705 3,119 3,396 3,333 3,156 2,799 2,823 2,878 Anne Arundel 4,063 4,173 4,724 4,461 4,515 5,261 4,858 4,537 5,278 5,511 Baltimore City* 49,937 50,688 50,650 49,032 45,716 43,177 43,371 41,108 46,482 47,999 Baltimore County 25,332 27,755 27,533 20,625 18,101 18,848 20,703 21,068 22,894 23,610 Calvert 626 650 378 393 385 450 213 172 197 237 Caroline 2,193 2,414 2,422 2,927 2,808 2,896 2,921 2,812 2,868 2,835 Carroll 320 243 205 283 285 200 149 332 1,032 1,051 Cecil 3,324 3,263 3,212 3,086 3,248 3,242 3,345 3,646 3,632 3,528 Charles 2,845 3,537 3,408 2,839 2,632 2,629 2,669 2,596 2,834 2,942 Dorchester 1,464 1,391 1,566 1,605 1,627 1,755 1,764 1,687 1,764 1,862 Frederick 1,534 1,572 1,592 1,626 1,674 2,480 2,534 2,420 2,547 3,569 Garrett 1,907 1,564 1,531 1,490 1,488 1,538 1,500 1,479 854 784 Harford 4,009 3,412 3,325 3,318 3,376 3,385 3,136 2,838 2,583 2,649 Howard 280 472 435 544 566 * 1,370 2,931 4,387 4,709 Kent 964 919 885 855 817 850 935 876 874 1,334 Montgomery 8,610 10,691 10,717 10,724 13,698 15,359 16,150 13,739 15,247 17,827 Prince George's 31,584 36,038 25,567 25,834 26,150 31,833 34,048 25,844 30,251 34,052 Queen Anne's 293 233 288 272 606 506 513 548 481 522 Saint Mary's 1,477 1,839 1,765 1,593 2,284 2,161 2,248 2,260 2,221 2,392 Somerset 1,377 1,419 1,503 1,498 1,438 1,579 1,650 1,578 1,467 1,466 Talbot 981 1,102 1,080 1,120 1,194 1,113 1,185 1,141 1,185 1,179 Washington 3,886 4,346 4,249 4,317 4,094 2,939 3,002 2,656 2,719 2,775 Wicomico 3,097 3,400 3,210 3,696 3,766 3,954 4,899 3,879 4,564 4,614 Worcester 2,034 1,250 1,289 1,263 1,292 1,260 1,257 1,196 1,247 1,209 State Total 155,739 166,086 155,239 146,520 145,177 150,785 157,828 144,432 160,808 171,918
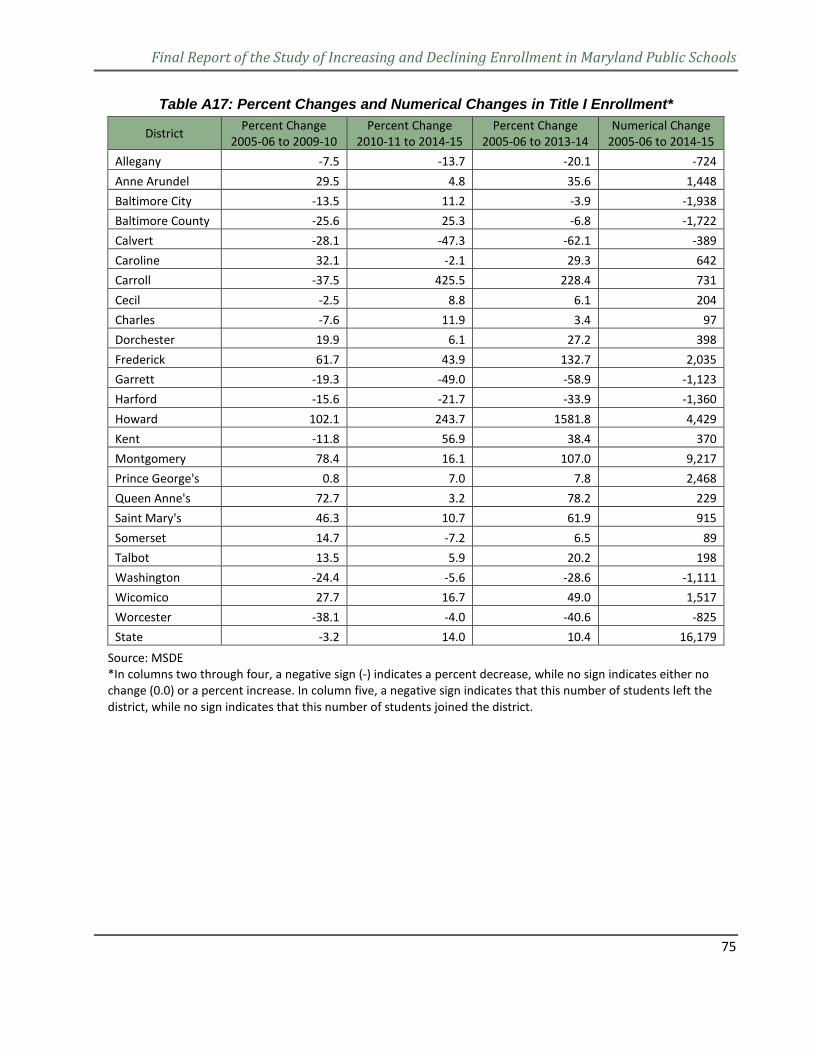
Final Report of the Study of Increasing and Declining Enrollment in Maryland Public Schools
75
Table A17: Percent Changes and Numerical Changes in Title I Enrollment*
District Percent Change 2005-06 to 2009-10
Percent Change 2010-11 to 2014-15
Percent Change 2005-06 to 2013-14
Numerical Change 2005-06 to 2014-15
Allegany -7.5 -13.7 -20.1 -724 Anne Arundel 29.5 4.8 35.6 1,448 Baltimore City -13.5 11.2 -3.9 -1,938 Baltimore County -25.6 25.3 -6.8 -1,722 Calvert -28.1 -47.3 -62.1 -389 Caroline 32.1 -2.1 29.3 642 Carroll -37.5 425.5 228.4 731 Cecil -2.5 8.8 6.1 204 Charles -7.6 11.9 3.4 97 Dorchester 19.9 6.1 27.2 398 Frederick 61.7 43.9 132.7 2,035 Garrett -19.3 -49.0 -58.9 -1,123 Harford -15.6 -21.7 -33.9 -1,360 Howard 102.1 243.7 1581.8 4,429 Kent -11.8 56.9 38.4 370 Montgomery 78.4 16.1 107.0 9,217 Prince George's 0.8 7.0 7.8 2,468 Queen Anne's 72.7 3.2 78.2 229 Saint Mary's 46.3 10.7 61.9 915 Somerset 14.7 -7.2 6.5 89 Talbot 13.5 5.9 20.2 198 Washington -24.4 -5.6 -28.6 -1,111 Wicomico 27.7 16.7 49.0 1,517 Worcester -38.1 -4.0 -40.6 -825 State -3.2 14.0 10.4 16,179
Source: MSDE *In columns two through four, a negative sign (-) indicates a percent decrease, while no sign indicates either no change (0.0) or a percent increase. In column five, a negative sign indicates that this number of students left the district, while no sign indicates that this number of students joined the district.
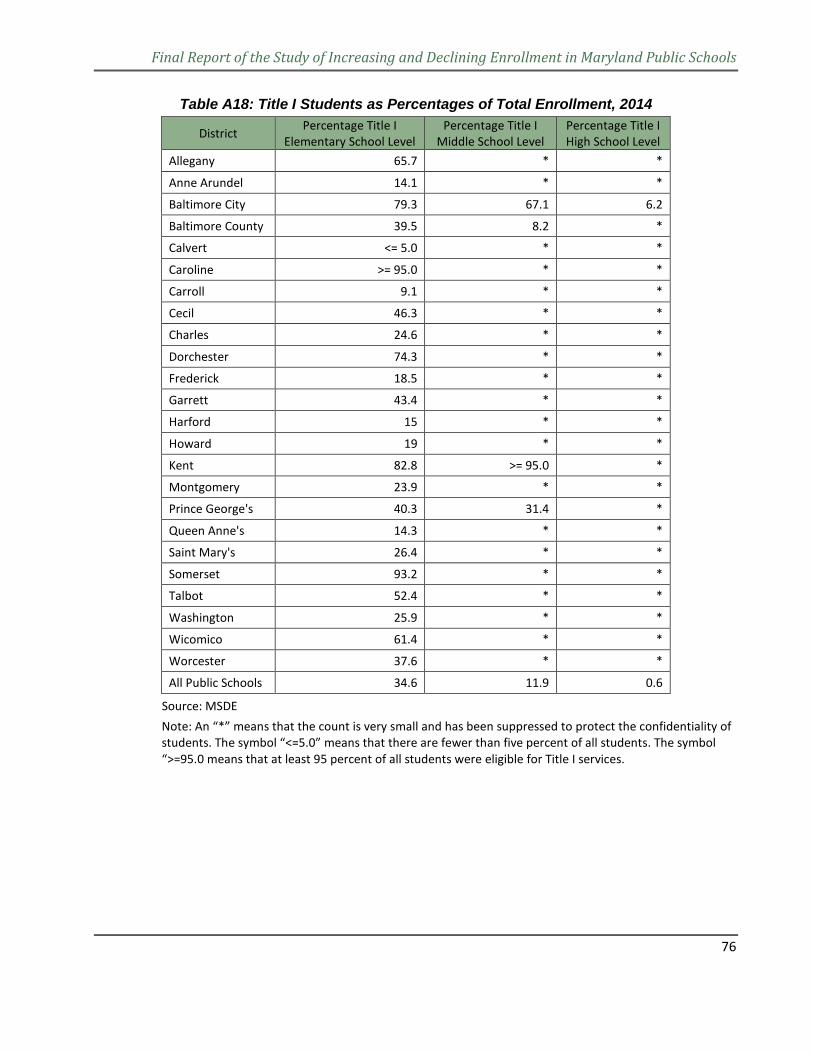
Final Report of the Study of Increasing and Declining Enrollment in Maryland Public Schools
76
Table A18: Title I Students as Percentages of Total Enrollment, 2014
District Percentage Title I Elementary School Level
Percentage Title I Middle School Level
Percentage Title I High School Level
Allegany 65.7 * *
Anne Arundel 14.1 * *
Baltimore City 79.3 67.1 6.2
Baltimore County 39.5 8.2 *
Calvert <= 5.0 * *
Caroline >= 95.0 * *
Carroll 9.1 * *
Cecil 46.3 * *
Charles 24.6 * *
Dorchester 74.3 * *
Frederick 18.5 * *
Garrett 43.4 * *
Harford 15 * *
Howard 19 * *
Kent 82.8 >= 95.0 *
Montgomery 23.9 * *
Prince George's 40.3 31.4 *
Queen Anne's 14.3 * *
Saint Mary's 26.4 * *
Somerset 93.2 * *
Talbot 52.4 * *
Washington 25.9 * *
Wicomico 61.4 * *
Worcester 37.6 * *
All Public Schools 34.6 11.9 0.6
Source: MSDE Note: An “*” means that the count is very small and has been suppressed to protect the confidentiality of students. The symbol “<=5.0” means that there are fewer than five percent of all students. The symbol “>=95.0 means that at least 95 percent of all students were eligible for Title I services.
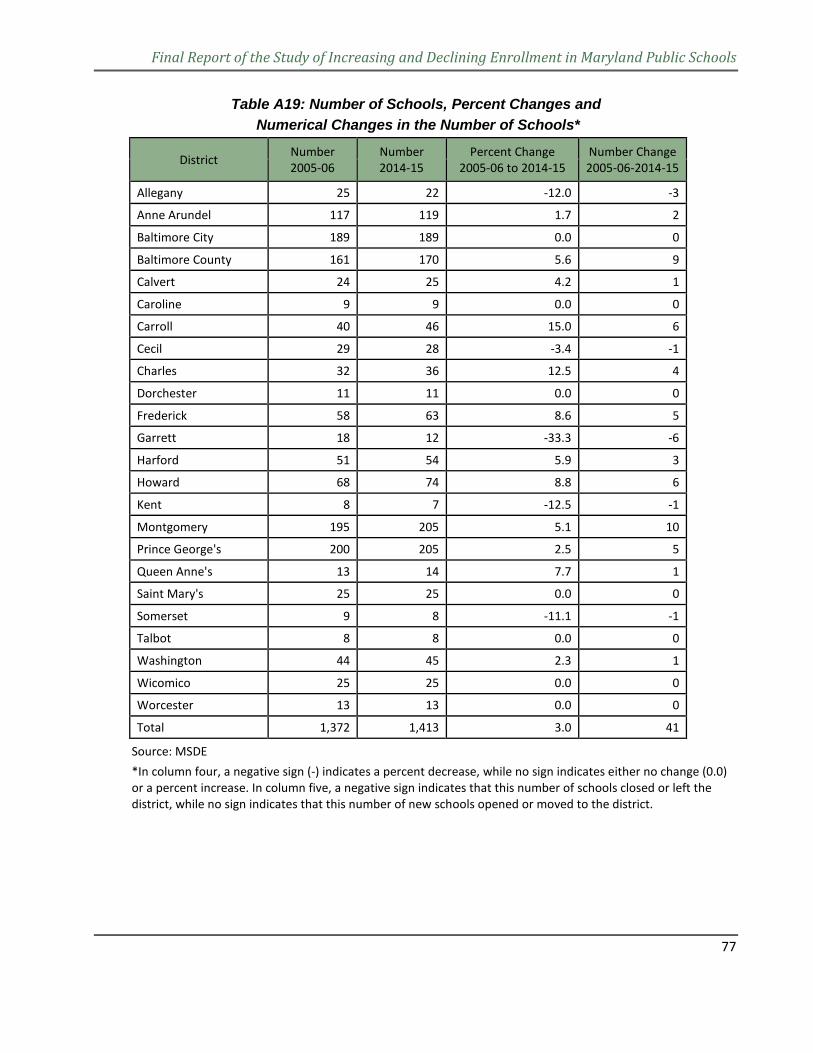
Final Report of the Study of Increasing and Declining Enrollment in Maryland Public Schools
77
Table A19: Number of Schools, Percent Changes and Numerical Changes in the Number of Schools*
District Number 2005-06
Number 2014-15
Percent Change 2005-06 to 2014-15
Number Change 2005-06-2014-15
Allegany 25 22 -12.0 -3
Anne Arundel 117 119 1.7 2
Baltimore City 189 189 0.0 0
Baltimore County 161 170 5.6 9
Calvert 24 25 4.2 1
Caroline 9 9 0.0 0
Carroll 40 46 15.0 6
Cecil 29 28 -3.4 -1
Charles 32 36 12.5 4
Dorchester 11 11 0.0 0
Frederick 58 63 8.6 5
Garrett 18 12 -33.3 -6
Harford 51 54 5.9 3
Howard 68 74 8.8 6
Kent 8 7 -12.5 -1
Montgomery 195 205 5.1 10
Prince George's 200 205 2.5 5
Queen Anne's 13 14 7.7 1
Saint Mary's 25 25 0.0 0
Somerset 9 8 -11.1 -1
Talbot 8 8 0.0 0
Washington 44 45 2.3 1
Wicomico 25 25 0.0 0
Worcester 13 13 0.0 0
Total 1,372 1,413 3.0 41
Source: MSDE *In column four, a negative sign (-) indicates a percent decrease, while no sign indicates either no change (0.0) or a percent increase. In column five, a negative sign indicates that this number of schools closed or left the district, while no sign indicates that this number of new schools opened or moved to the district.
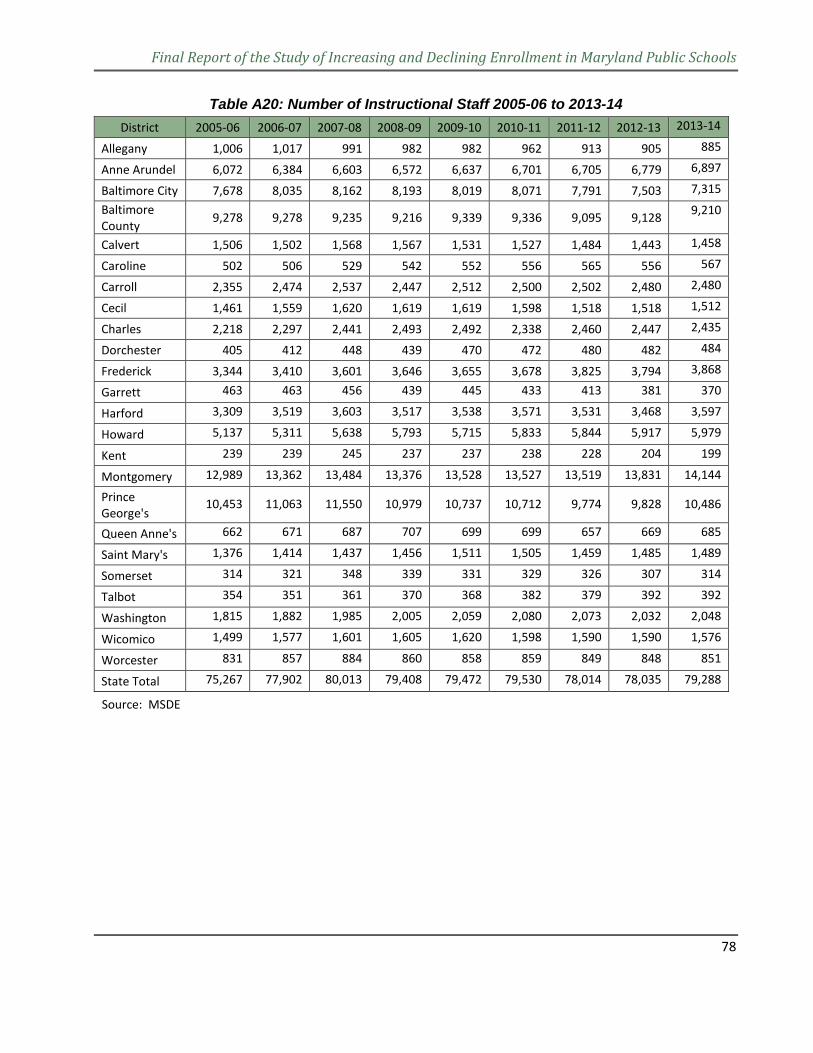
Final Report of the Study of Increasing and Declining Enrollment in Maryland Public Schools
78
Table A20: Number of Instructional Staff 2005-06 to 2013-14 District 2005-06 2006-07 2007-08 2008-09 2009-10 2010-11 2011-12 2012-13 2013-14
Allegany 1,006 1,017 991 982 982 962 913 905 885
Anne Arundel 6,072 6,384 6,603 6,572 6,637 6,701 6,705 6,779 6,897
Baltimore City 7,678 8,035 8,162 8,193 8,019 8,071 7,791 7,503 7,315 Baltimore County 9,278 9,278 9,235 9,216 9,339 9,336 9,095 9,128 9,210
Calvert 1,506 1,502 1,568 1,567 1,531 1,527 1,484 1,443 1,458
Caroline 502 506 529 542 552 556 565 556 567
Carroll 2,355 2,474 2,537 2,447 2,512 2,500 2,502 2,480 2,480
Cecil 1,461 1,559 1,620 1,619 1,619 1,598 1,518 1,518 1,512
Charles 2,218 2,297 2,441 2,493 2,492 2,338 2,460 2,447 2,435
Dorchester 405 412 448 439 470 472 480 482 484
Frederick 3,344 3,410 3,601 3,646 3,655 3,678 3,825 3,794 3,868
Garrett 463 463 456 439 445 433 413 381 370
Harford 3,309 3,519 3,603 3,517 3,538 3,571 3,531 3,468 3,597
Howard 5,137 5,311 5,638 5,793 5,715 5,833 5,844 5,917 5,979
Kent 239 239 245 237 237 238 228 204 199
Montgomery 12,989 13,362 13,484 13,376 13,528 13,527 13,519 13,831 14,144
Prince George's
10,453 11,063 11,550 10,979 10,737 10,712 9,774 9,828 10,486
Queen Anne's 662 671 687 707 699 699 657 669 685
Saint Mary's 1,376 1,414 1,437 1,456 1,511 1,505 1,459 1,485 1,489
Somerset 314 321 348 339 331 329 326 307 314
Talbot 354 351 361 370 368 382 379 392 392
Washington 1,815 1,882 1,985 2,005 2,059 2,080 2,073 2,032 2,048
Wicomico 1,499 1,577 1,601 1,605 1,620 1,598 1,590 1,590 1,576
Worcester 831 857 884 860 858 859 849 848 851
State Total 75,267 77,902 80,013 79,408 79,472 79,530 78,014 78,035 79,288
Source: MSDE
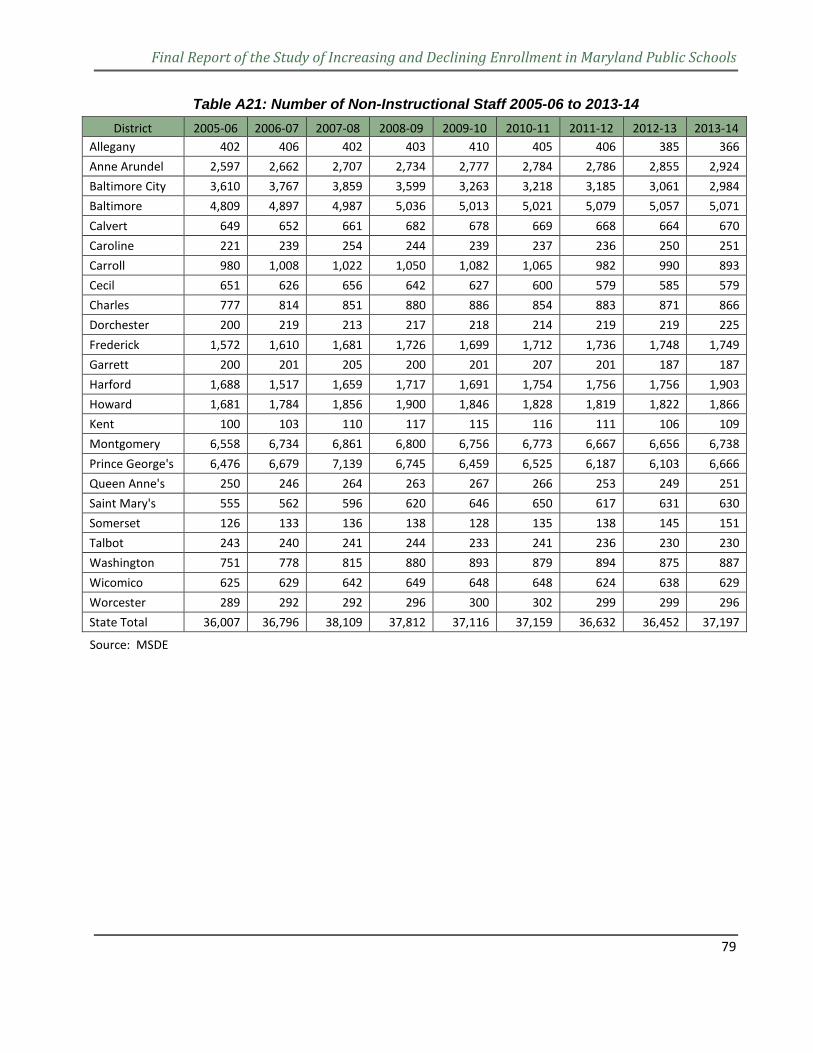
Final Report of the Study of Increasing and Declining Enrollment in Maryland Public Schools
79
Table A21: Number of Non-Instructional Staff 2005-06 to 2013-14 District 2005-06 2006-07 2007-08 2008-09 2009-10 2010-11 2011-12 2012-13 2013-14
Allegany 402 406 402 403 410 405 406 385 366 Anne Arundel 2,597 2,662 2,707 2,734 2,777 2,784 2,786 2,855 2,924 Baltimore City 3,610 3,767 3,859 3,599 3,263 3,218 3,185 3,061 2,984 Baltimore 4,809 4,897 4,987 5,036 5,013 5,021 5,079 5,057 5,071 Calvert 649 652 661 682 678 669 668 664 670 Caroline 221 239 254 244 239 237 236 250 251 Carroll 980 1,008 1,022 1,050 1,082 1,065 982 990 893 Cecil 651 626 656 642 627 600 579 585 579 Charles 777 814 851 880 886 854 883 871 866 Dorchester 200 219 213 217 218 214 219 219 225 Frederick 1,572 1,610 1,681 1,726 1,699 1,712 1,736 1,748 1,749 Garrett 200 201 205 200 201 207 201 187 187 Harford 1,688 1,517 1,659 1,717 1,691 1,754 1,756 1,756 1,903 Howard 1,681 1,784 1,856 1,900 1,846 1,828 1,819 1,822 1,866 Kent 100 103 110 117 115 116 111 106 109 Montgomery 6,558 6,734 6,861 6,800 6,756 6,773 6,667 6,656 6,738 Prince George's 6,476 6,679 7,139 6,745 6,459 6,525 6,187 6,103 6,666 Queen Anne's 250 246 264 263 267 266 253 249 251 Saint Mary's 555 562 596 620 646 650 617 631 630 Somerset 126 133 136 138 128 135 138 145 151 Talbot 243 240 241 244 233 241 236 230 230 Washington 751 778 815 880 893 879 894 875 887 Wicomico 625 629 642 649 648 648 624 638 629 Worcester 289 292 292 296 300 302 299 299 296 State Total 36,007 36,796 38,109 37,812 37,116 37,159 36,632 36,452 37,197
Source: MSDE
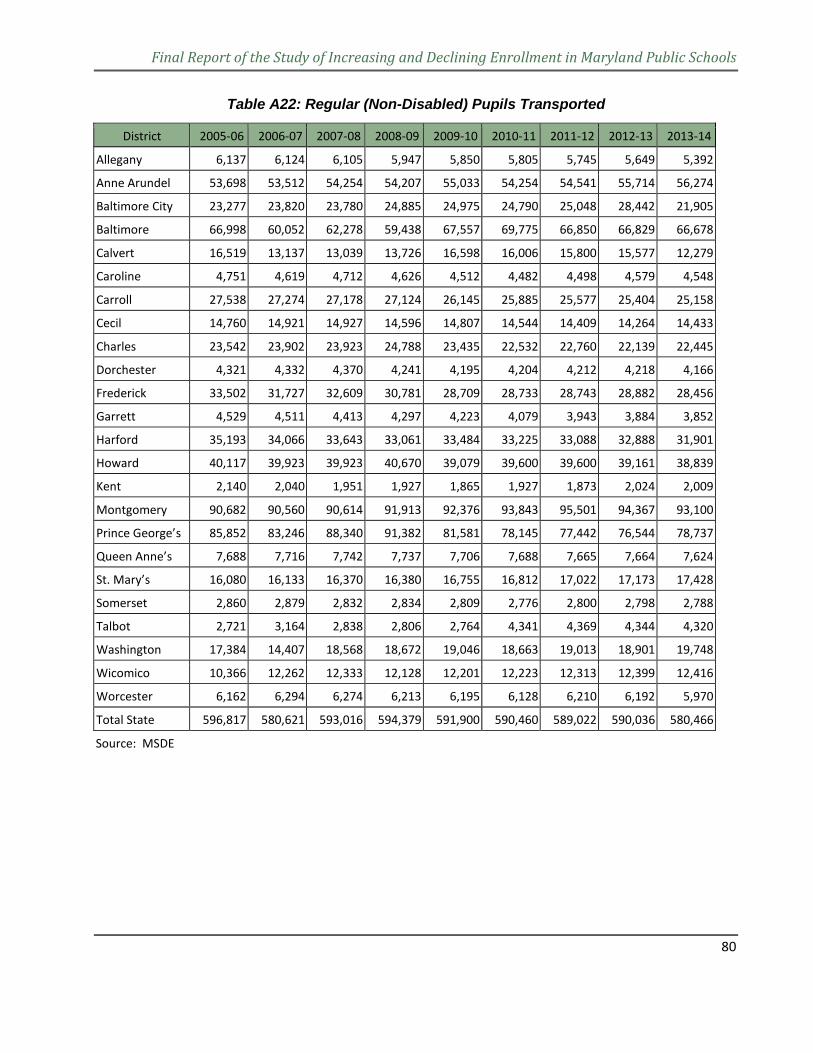
Final Report of the Study of Increasing and Declining Enrollment in Maryland Public Schools
80
Table A22: Regular (Non-Disabled) Pupils Transported
District 2005-06 2006-07 2007-08 2008-09 2009-10 2010-11 2011-12 2012-13 2013-14
Allegany 6,137 6,124 6,105 5,947 5,850 5,805 5,745 5,649 5,392
Anne Arundel 53,698 53,512 54,254 54,207 55,033 54,254 54,541 55,714 56,274
Baltimore City 23,277 23,820 23,780 24,885 24,975 24,790 25,048 28,442 21,905
Baltimore 66,998 60,052 62,278 59,438 67,557 69,775 66,850 66,829 66,678
Calvert 16,519 13,137 13,039 13,726 16,598 16,006 15,800 15,577 12,279
Caroline 4,751 4,619 4,712 4,626 4,512 4,482 4,498 4,579 4,548
Carroll 27,538 27,274 27,178 27,124 26,145 25,885 25,577 25,404 25,158
Cecil 14,760 14,921 14,927 14,596 14,807 14,544 14,409 14,264 14,433
Charles 23,542 23,902 23,923 24,788 23,435 22,532 22,760 22,139 22,445
Dorchester 4,321 4,332 4,370 4,241 4,195 4,204 4,212 4,218 4,166
Frederick 33,502 31,727 32,609 30,781 28,709 28,733 28,743 28,882 28,456
Garrett 4,529 4,511 4,413 4,297 4,223 4,079 3,943 3,884 3,852
Harford 35,193 34,066 33,643 33,061 33,484 33,225 33,088 32,888 31,901
Howard 40,117 39,923 39,923 40,670 39,079 39,600 39,600 39,161 38,839
Kent 2,140 2,040 1,951 1,927 1,865 1,927 1,873 2,024 2,009
Montgomery 90,682 90,560 90,614 91,913 92,376 93,843 95,501 94,367 93,100
Prince George’s 85,852 83,246 88,340 91,382 81,581 78,145 77,442 76,544 78,737
Queen Anne’s 7,688 7,716 7,742 7,737 7,706 7,688 7,665 7,664 7,624
St. Mary’s 16,080 16,133 16,370 16,380 16,755 16,812 17,022 17,173 17,428
Somerset 2,860 2,879 2,832 2,834 2,809 2,776 2,800 2,798 2,788
Talbot 2,721 3,164 2,838 2,806 2,764 4,341 4,369 4,344 4,320
Washington 17,384 14,407 18,568 18,672 19,046 18,663 19,013 18,901 19,748
Wicomico 10,366 12,262 12,333 12,128 12,201 12,223 12,313 12,399 12,416
Worcester 6,162 6,294 6,274 6,213 6,195 6,128 6,210 6,192 5,970
Total State 596,817 580,621 593,016 594,379 591,900 590,460 589,022 590,036 580,466
Source: MSDE
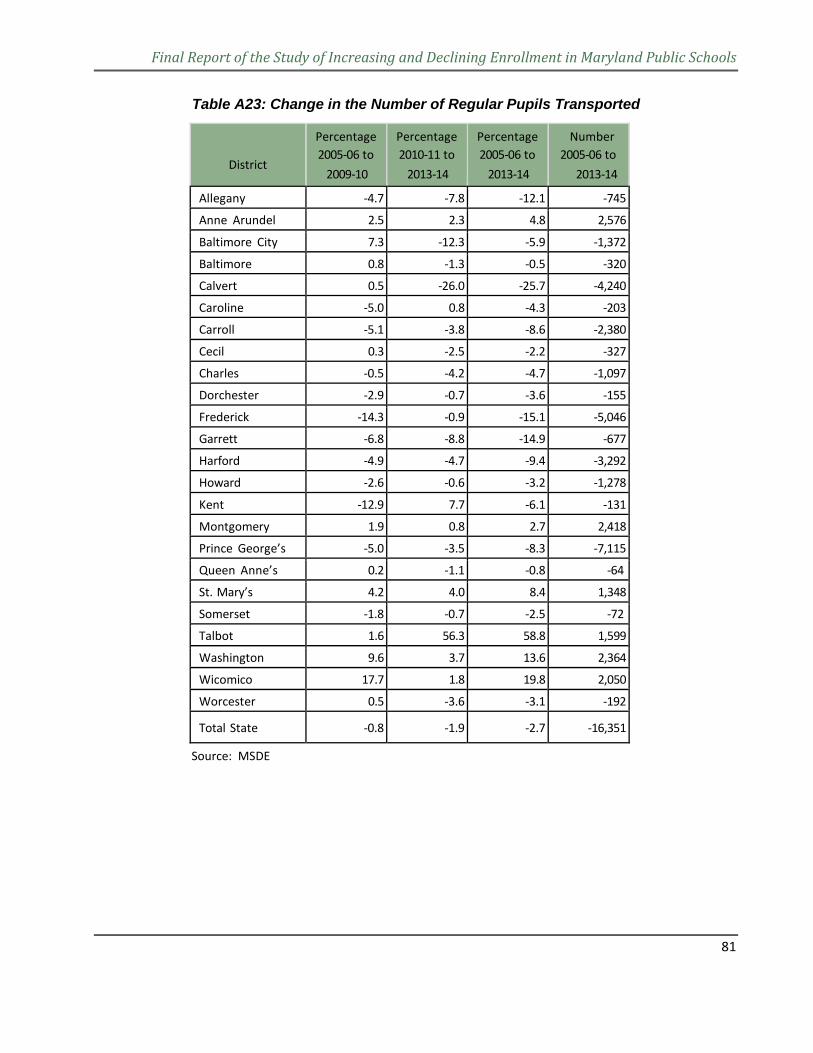
Final Report of the Study of Increasing and Declining Enrollment in Maryland Public Schools
81
Table A23: Change in the Number of Regular Pupils Transported
District
Percentage 2005-06 to
2009-10
Percentage 2010-11 to
2013-14
Percentage 2005-06 to
2013-14
Number 2005-06 to
2013-14
Allegany -4.7 -7.8 -12.1 -745
Anne Arundel 2.5 2.3 4.8 2,576
Baltimore City 7.3 -12.3 -5.9 -1,372
Baltimore 0.8 -1.3 -0.5 -320
Calvert 0.5 -26.0 -25.7 -4,240
Caroline -5.0 0.8 -4.3 -203
Carroll -5.1 -3.8 -8.6 -2,380
Cecil 0.3 -2.5 -2.2 -327
Charles -0.5 -4.2 -4.7 -1,097
Dorchester -2.9 -0.7 -3.6 -155
Frederick -14.3 -0.9 -15.1 -5,046
Garrett -6.8 -8.8 -14.9 -677
Harford -4.9 -4.7 -9.4 -3,292
Howard -2.6 -0.6 -3.2 -1,278
Kent -12.9 7.7 -6.1 -131
Montgomery 1.9 0.8 2.7 2,418
Prince George’s -5.0 -3.5 -8.3 -7,115
Queen Anne’s 0.2 -1.1 -0.8 -64
St. Mary’s 4.2 4.0 8.4 1,348
Somerset -1.8 -0.7 -2.5 -72
Talbot 1.6 56.3 58.8 1,599
Washington 9.6 3.7 13.6 2,364
Wicomico 17.7 1.8 19.8 2,050
Worcester 0.5 -3.6 -3.1 -192
Total State -0.8 -1.9 -2.7 -16,351
Source: MSDE
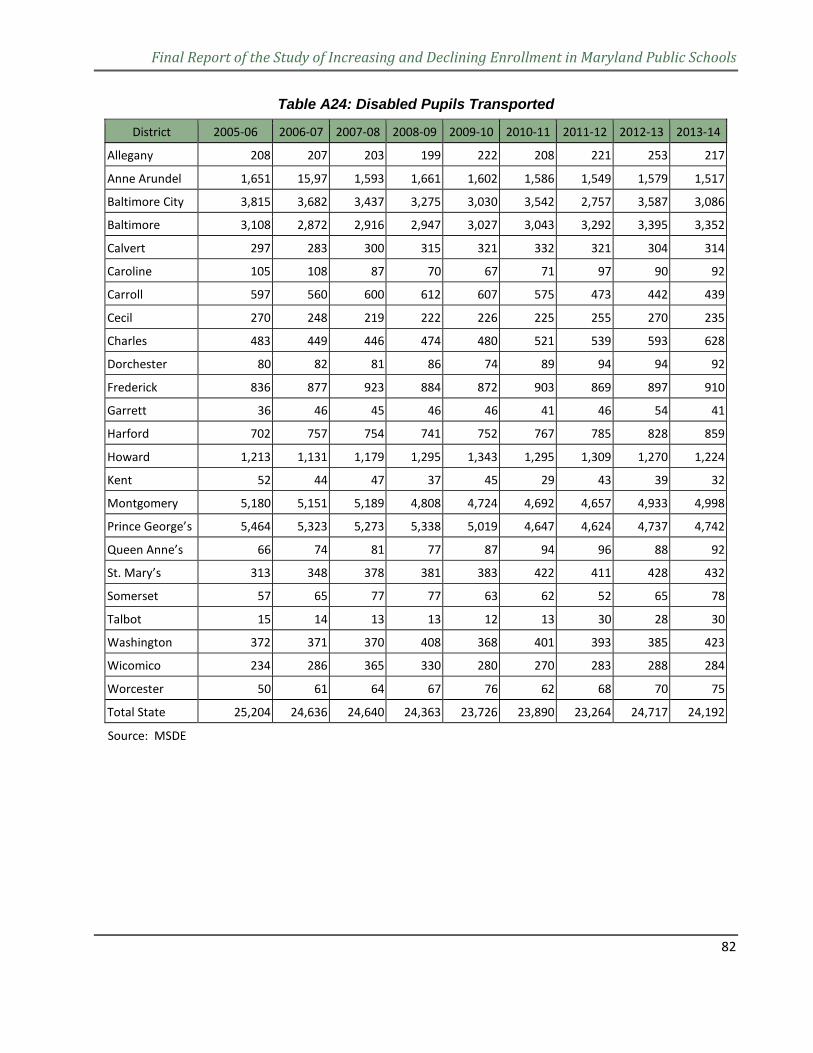
Final Report of the Study of Increasing and Declining Enrollment in Maryland Public Schools
82
Table A24: Disabled Pupils Transported
District 2005-06 2006-07 2007-08 2008-09 2009-10 2010-11 2011-12 2012-13 2013-14
Allegany 208 207 203 199 222 208 221 253 217
Anne Arundel 1,651 15,97 1,593 1,661 1,602 1,586 1,549 1,579 1,517
Baltimore City 3,815 3,682 3,437 3,275 3,030 3,542 2,757 3,587 3,086
Baltimore 3,108 2,872 2,916 2,947 3,027 3,043 3,292 3,395 3,352
Calvert 297 283 300 315 321 332 321 304 314
Caroline 105 108 87 70 67 71 97 90 92
Carroll 597 560 600 612 607 575 473 442 439
Cecil 270 248 219 222 226 225 255 270 235
Charles 483 449 446 474 480 521 539 593 628
Dorchester 80 82 81 86 74 89 94 94 92
Frederick 836 877 923 884 872 903 869 897 910
Garrett 36 46 45 46 46 41 46 54 41
Harford 702 757 754 741 752 767 785 828 859
Howard 1,213 1,131 1,179 1,295 1,343 1,295 1,309 1,270 1,224
Kent 52 44 47 37 45 29 43 39 32
Montgomery 5,180 5,151 5,189 4,808 4,724 4,692 4,657 4,933 4,998
Prince George’s 5,464 5,323 5,273 5,338 5,019 4,647 4,624 4,737 4,742
Queen Anne’s 66 74 81 77 87 94 96 88 92
St. Mary’s 313 348 378 381 383 422 411 428 432
Somerset 57 65 77 77 63 62 52 65 78
Talbot 15 14 13 13 12 13 30 28 30
Washington 372 371 370 408 368 401 393 385 423
Wicomico 234 286 365 330 280 270 283 288 284
Worcester 50 61 64 67 76 62 68 70 75
Total State 25,204 24,636 24,640 24,363 23,726 23,890 23,264 24,717 24,192
Source: MSDE
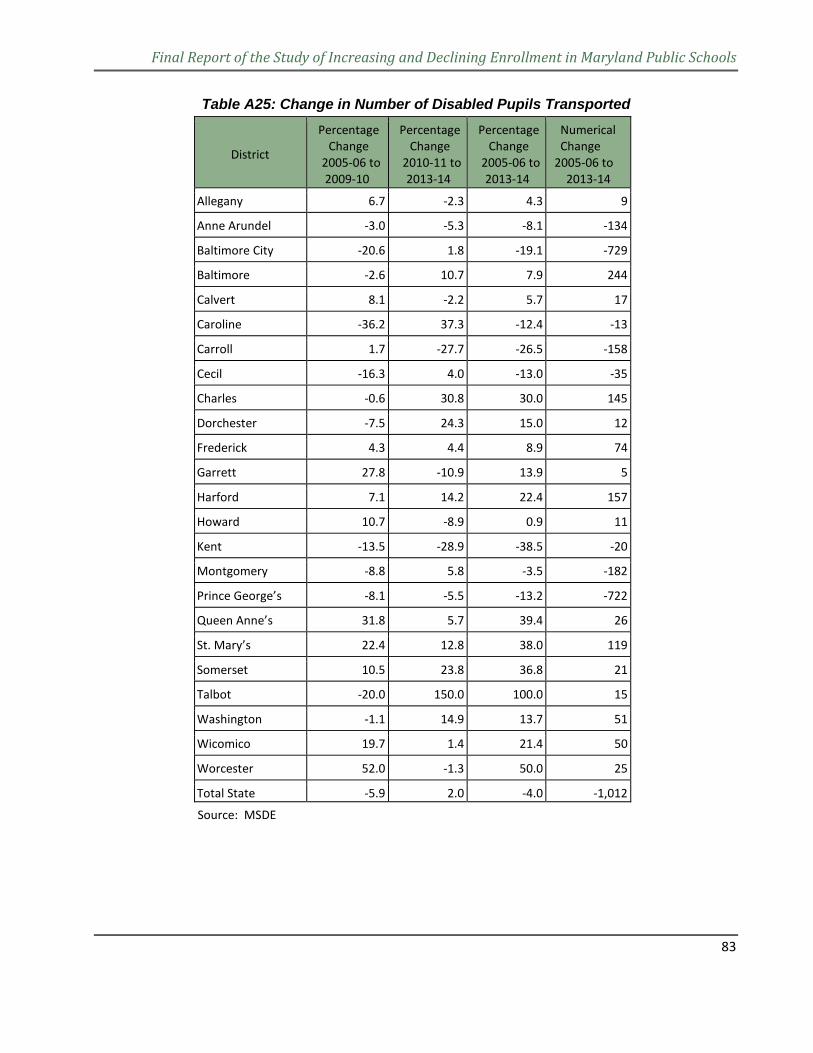
Final Report of the Study of Increasing and Declining Enrollment in Maryland Public Schools
83
Table A25: Change in Number of Disabled Pupils Transported
District
Percentage Change
2005-06 to 2009-10
Percentage Change
2010-11 to 2013-14
Percentage Change
2005-06 to 2013-14
Numerical Change
2005-06 to 2013-14
Allegany 6.7 -2.3 4.3 9
Anne Arundel -3.0 -5.3 -8.1 -134
Baltimore City -20.6 1.8 -19.1 -729
Baltimore -2.6 10.7 7.9 244
Calvert 8.1 -2.2 5.7 17
Caroline -36.2 37.3 -12.4 -13
Carroll 1.7 -27.7 -26.5 -158
Cecil -16.3 4.0 -13.0 -35
Charles -0.6 30.8 30.0 145
Dorchester -7.5 24.3 15.0 12
Frederick 4.3 4.4 8.9 74
Garrett 27.8 -10.9 13.9 5
Harford 7.1 14.2 22.4 157
Howard 10.7 -8.9 0.9 11
Kent -13.5 -28.9 -38.5 -20
Montgomery -8.8 5.8 -3.5 -182
Prince George’s -8.1 -5.5 -13.2 -722
Queen Anne’s 31.8 5.7 39.4 26
St. Mary’s 22.4 12.8 38.0 119
Somerset 10.5 23.8 36.8 21
Talbot -20.0 150.0 100.0 15
Washington -1.1 14.9 13.7 51
Wicomico 19.7 1.4 21.4 50
Worcester 52.0 -1.3 50.0 25
Total State -5.9 2.0 -4.0 -1,012
Source: MSDE
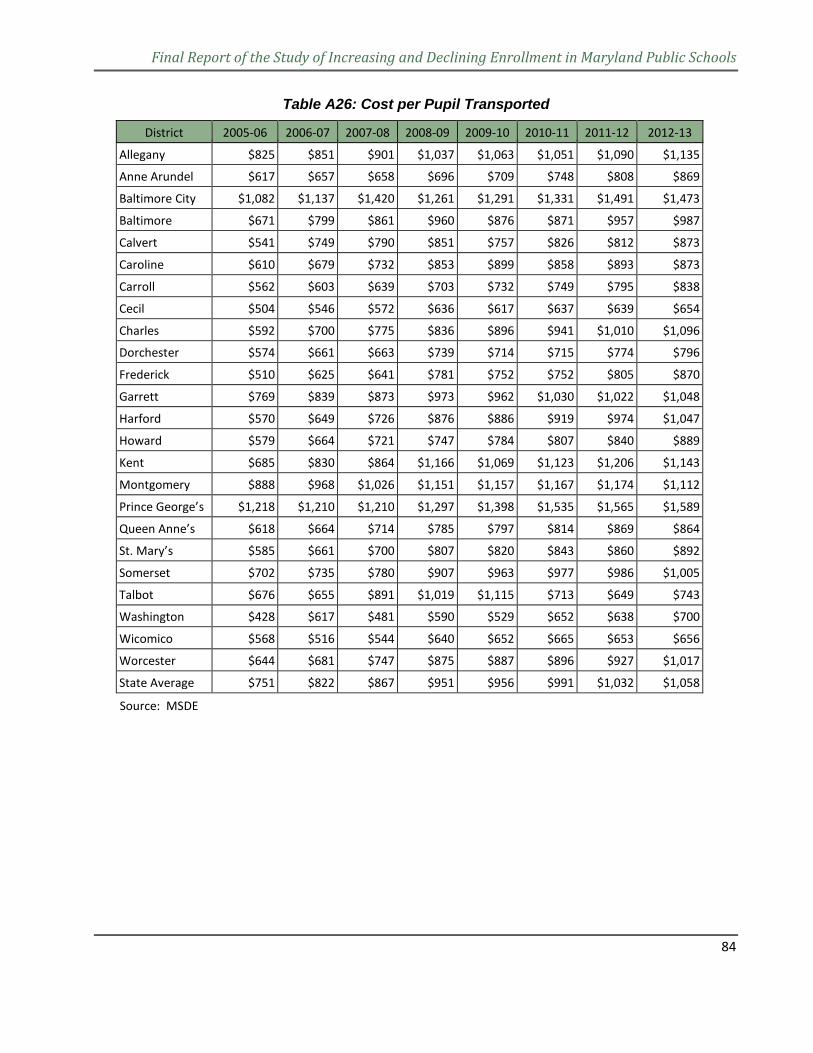
Final Report of the Study of Increasing and Declining Enrollment in Maryland Public Schools
84
Table A26: Cost per Pupil Transported
District 2005-06 2006-07 2007-08 2008-09 2009-10 2010-11 2011-12 2012-13
Allegany $825 $851 $901 $1,037 $1,063 $1,051 $1,090 $1,135
Anne Arundel $617 $657 $658 $696 $709 $748 $808 $869
Baltimore City $1,082 $1,137 $1,420 $1,261 $1,291 $1,331 $1,491 $1,473
Baltimore $671 $799 $861 $960 $876 $871 $957 $987
Calvert $541 $749 $790 $851 $757 $826 $812 $873
Caroline $610 $679 $732 $853 $899 $858 $893 $873
Carroll $562 $603 $639 $703 $732 $749 $795 $838
Cecil $504 $546 $572 $636 $617 $637 $639 $654
Charles $592 $700 $775 $836 $896 $941 $1,010 $1,096
Dorchester $574 $661 $663 $739 $714 $715 $774 $796
Frederick $510 $625 $641 $781 $752 $752 $805 $870
Garrett $769 $839 $873 $973 $962 $1,030 $1,022 $1,048
Harford $570 $649 $726 $876 $886 $919 $974 $1,047
Howard $579 $664 $721 $747 $784 $807 $840 $889
Kent $685 $830 $864 $1,166 $1,069 $1,123 $1,206 $1,143
Montgomery $888 $968 $1,026 $1,151 $1,157 $1,167 $1,174 $1,112
Prince George’s $1,218 $1,210 $1,210 $1,297 $1,398 $1,535 $1,565 $1,589
Queen Anne’s $618 $664 $714 $785 $797 $814 $869 $864
St. Mary’s $585 $661 $700 $807 $820 $843 $860 $892
Somerset $702 $735 $780 $907 $963 $977 $986 $1,005
Talbot $676 $655 $891 $1,019 $1,115 $713 $649 $743
Washington $428 $617 $481 $590 $529 $652 $638 $700
Wicomico $568 $516 $544 $640 $652 $665 $653 $656
Worcester $644 $681 $747 $875 $887 $896 $927 $1,017
State Average $751 $822 $867 $951 $956 $991 $1,032 $1,058
Source: MSDE
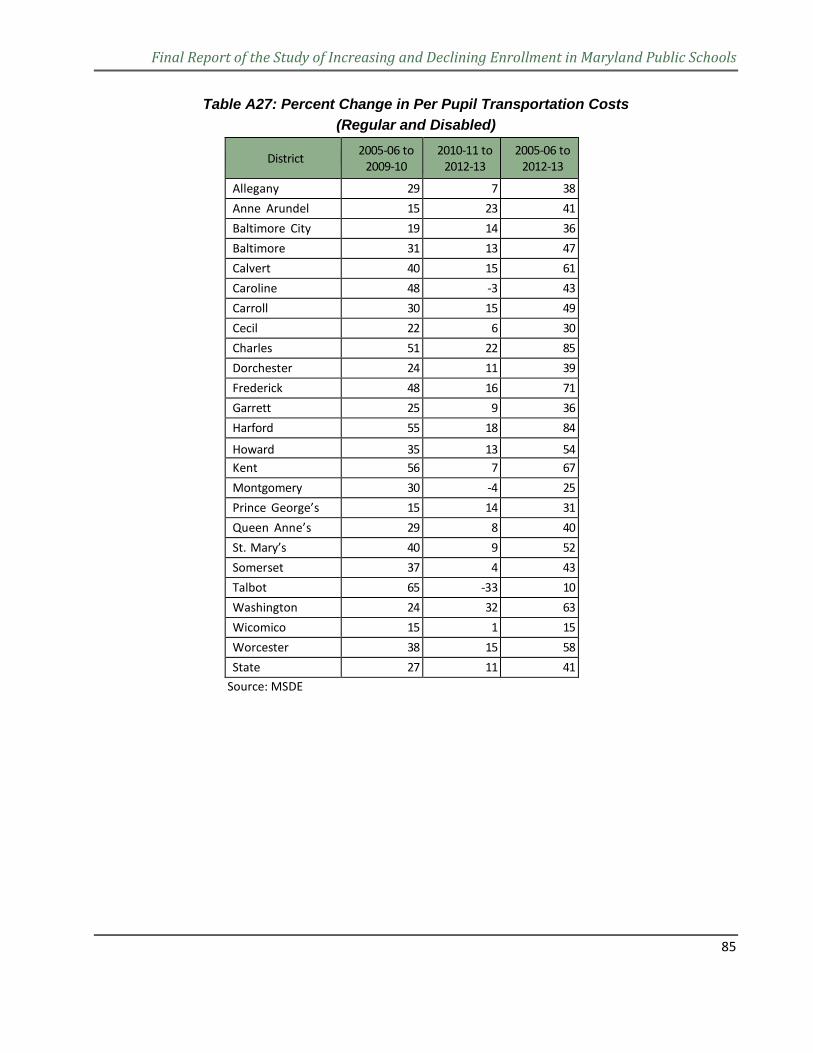
Final Report of the Study of Increasing and Declining Enrollment in Maryland Public Schools
85
Table A27: Percent Change in Per Pupil Transportation Costs (Regular and Disabled)
District 2005-06 to 2009-10
2010-11 to 2012-13
2005-06 to 2012-13
Allegany 29 7 38 Anne Arundel 15 23 41 Baltimore City 19 14 36 Baltimore 31 13 47 Calvert 40 15 61 Caroline 48 -3 43 Carroll 30 15 49 Cecil 22 6 30 Charles 51 22 85 Dorchester 24 11 39 Frederick 48 16 71 Garrett 25 9 36 Harford 55 18 84
Howard 35 13 54 Kent 56 7 67 Montgomery 30 -4 25 Prince George’s 15 14 31 Queen Anne’s 29 8 40 St. Mary’s 40 9 52 Somerset 37 4 43 Talbot 65 -33 10 Washington 24 32 63 Wicomico 15 1 15 Worcester 38 15 58 State 27 11 41
Source: MSDE
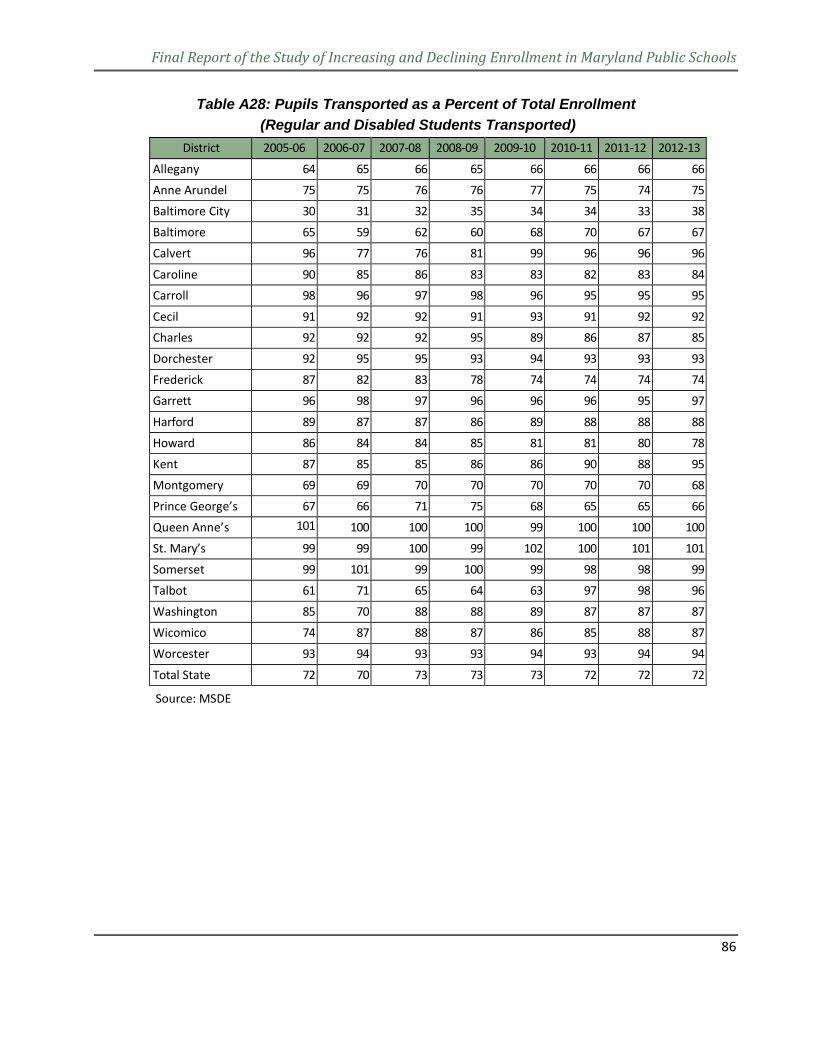
Final Report of the Study of Increasing and Declining Enrollment in Maryland Public Schools
86
Table A28: Pupils Transported as a Percent of Total Enrollment (Regular and Disabled Students Transported)
District 2005-06 2006-07 2007-08 2008-09 2009-10 2010-11 2011-12 2012-13
Allegany 64 65 66 65 66 66 66 66
Anne Arundel 75 75 76 76 77 75 74 75
Baltimore City 30 31 32 35 34 34 33 38
Baltimore 65 59 62 60 68 70 67 67
Calvert 96 77 76 81 99 96 96 96
Caroline 90 85 86 83 83 82 83 84 Carroll 98 96 97 98 96 95 95 95
Cecil 91 92 92 91 93 91 92 92 Charles 92 92 92 95 89 86 87 85
Dorchester 92 95 95 93 94 93 93 93
Frederick 87 82 83 78 74 74 74 74
Garrett 96 98 97 96 96 96 95 97
Harford 89 87 87 86 89 88 88 88
Howard 86 84 84 85 81 81 80 78
Kent 87 85 85 86 86 90 88 95
Montgomery 69 69 70 70 70 70 70 68
Prince George’s 67 66 71 75 68 65 65 66
Queen Anne’s 101
100 100 100 99 100 100 100
St. Mary’s 99 99 100 99 102 100 101 101
Somerset 99 101 99 100 99 98 98 99
Talbot 61 71 65 64 63 97 98 96
Washington 85 70 88 88 89 87 87 87
Wicomico 74 87 88 87 86 85 88 87
Worcester 93 94 93 93 94 93 94 94
Total State 72 70 73 73 73 72 72 72
Source: MSDE
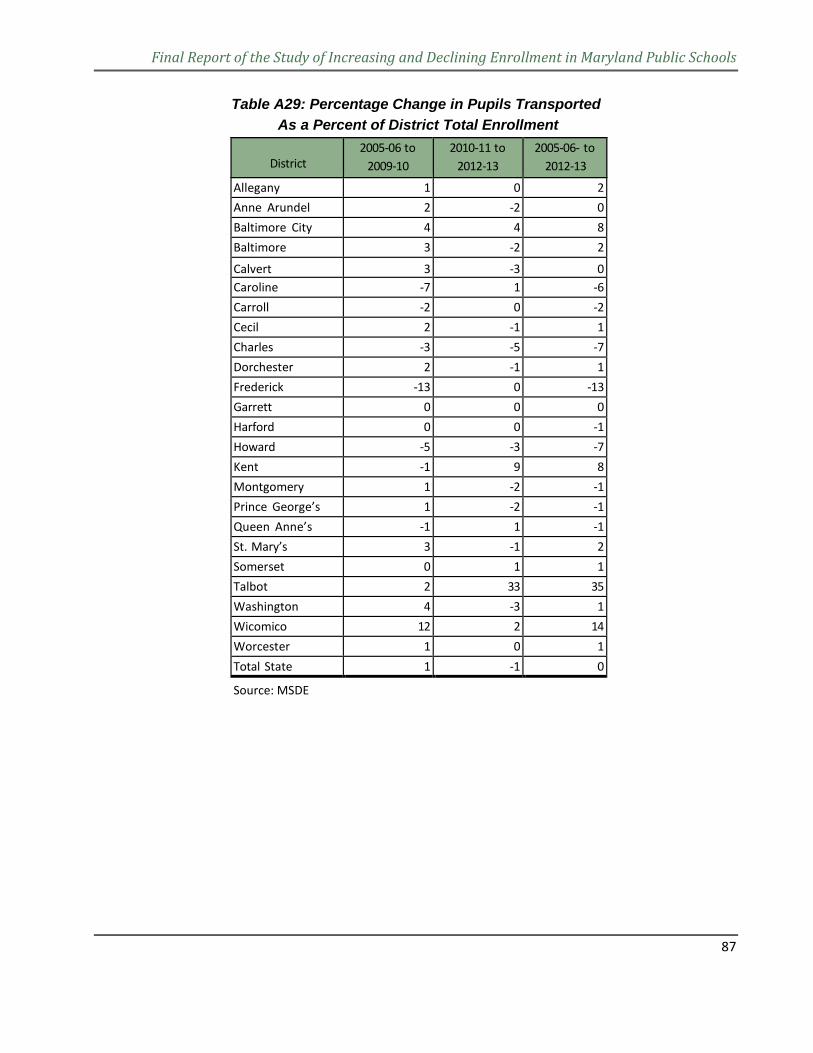
Final Report of the Study of Increasing and Declining Enrollment in Maryland Public Schools
87
Table A29: Percentage Change in Pupils Transported As a Percent of District Total Enrollment
District
2005-06 to 2009-10
2010-11 to 2012-13
2005-06- to 2012-13
Allegany 1 0 2 Anne Arundel 2 -2 0 Baltimore City 4 4 8 Baltimore 3 -2 2
Calvert 3 -3 0 Caroline -7 1 -6 Carroll -2 0 -2 Cecil 2 -1 1 Charles -3 -5 -7 Dorchester 2 -1 1 Frederick -13 0 -13 Garrett 0 0 0 Harford 0 0 -1 Howard -5 -3 -7 Kent -1 9 8 Montgomery 1 -2 -1 Prince George’s 1 -2 -1 Queen Anne’s -1 1 -1 St. Mary’s 3 -1 2 Somerset 0 1 1 Talbot 2 33 35 Washington 4 -3 1 Wicomico 12 2 14 Worcester 1 0 1 Total State 1 -1 0
Source: MSDE