Embed Size (px)
Citation preview
Final Report - Link Euromet-CCEM.RF-K8.doc 1/26
Final Report
LINKING EUROMET PROJECT 633
To CCEM.RF-K8.CL
“CALIBRATION FACTOR OF THERMISTOR MOUNTS”
Jan P.M. de Vreede
Department of Electricity, Radiation and Length NMi Van Swinden Laboratorium
Thijsseweg 11, 2629 JA Delft, the Netherlands e-mail: [email protected]
September 2006

Final Report - Link Euromet-CCEM.RF-K8.doc 2/26
Table of Contents 1. Introduction p. 3 2. Participants p. 3 3. Transfer standard and required measurements p. 4 4. Results of the comparisons p. 4 4.1. CCEM comparison p. 4 4.2. Euromet 633 p. 4 4.3. comparing the results p. 5 5. The linking process for Type-N devices p. 5 6. The linking process for PC7 devices p. 22 7. Summary of results on measurement of Calibration factor p. 25 8. Conclusion p. 25 9. References p. 26
Final Report - Link Euromet-CCEM.RF-K8.doc 3/26
1. Introduction During the European round of CCEM.RF-K8.CL the Euromet experts concluded that a small follow-up would be useful: - the results from METAS most likely showed a systematic deviation at higher frequencies; - IEN suspected some discrepancies at certain frequencies; - and the stated uncertainties of NPL were quite large due to the measurement procedure followed. This follow-up is the Euromet project 633. After announcement of this project another three laboratories expressed the wish to participate in this project. The Euromet Technical chairman decided that the project should be a key comparison as one participant wants to use this project to create a link to the CCEM comparison, and one wanted to extend its range. It was decided that the same laboratory (NMi Van Swinden Laboratorium: VSL) would act as pilot in the Euromet 633 project, also known under its KCDB code EUROMET.EM.RF-K8.CL. The results of the two comparisons are presented in [1] and [2]. The latter comparison indicates significantly smaller uncertainties for NPL and no significant deviations of METAS results at higher frequencies. However, the results of IEN led often to doubts at higher frequencies, while for NRC this is limited to the lowest frequency of 10 MHz. This paper is limited to a discussion how to link Euromet 633 to the CCEM key comparison. The linking is somewhat difficult as NRC and IEN participated as they suspected problems in the first comparison. It seems for IEN that these problems have not been solved during the second comparison. Hence the number of independent realisations of the measurand is sometimes limited to the contributions from only two laboratories.
2. Participants In the comparison CCEM.RF-K8.CL 21 laboratories participated of which 11 have an independent realisation of the quantity RF power. For the comparison EUROMET.EM.RF-K8.CL (Euromet 633) 7 laboratories participated, of which 4 have an independent realisation of this quantity.
Table 1. List of participants in both comparisons
Acronym
National Metrology Institute Country
Participation in both
comparisons
Independent realisation of
primary power
standard
NMi-VSL NMi Van Swinden
Laboratorium - Pilot
The Netherlands
Yes Yes
NPL National Physical Laboratory
United Kingdom
Yes Yes
IENGF Istituto Elettrotecnico
Nazionale Galileo Ferraris
Italy Yes
Yes
METAS Swiss Office of Metrology Switzerland Yes
NRC National Research Council Canada Yes Yes
SMU Slovak Institute of Metrology
Slovak Republic
Yes
SP SP Sveriges Provnings- och Forskninginstitut Sweden
In Table 1 an overview is given of the participants. In the table is indicated which laboratories took part in both comparisons. Also is indicated which laboratories have an independent realisation of the primary standard for power. Results from the last group of laboratories are used in the linking process.
Final Report - Link Euromet-CCEM.RF-K8.doc 4/26
3. Transfer Standard and required measurements On purpose similar devices were used in the two comparisons: a thermistor mount with Type-N connector and one with PC7-connector. An adapter was provided to “convert” the PC7 device into another Type-N thermistor mount. The quantity under investigation in the comparisons is the calibration factor K, which is defined by:
K= PDC/Pinc with: PDC - the DC substitution power determined by the thermistor bridge of the participant and Pinc - the RF power incident to the thermistor mount (DUT) at the measurement frequency.
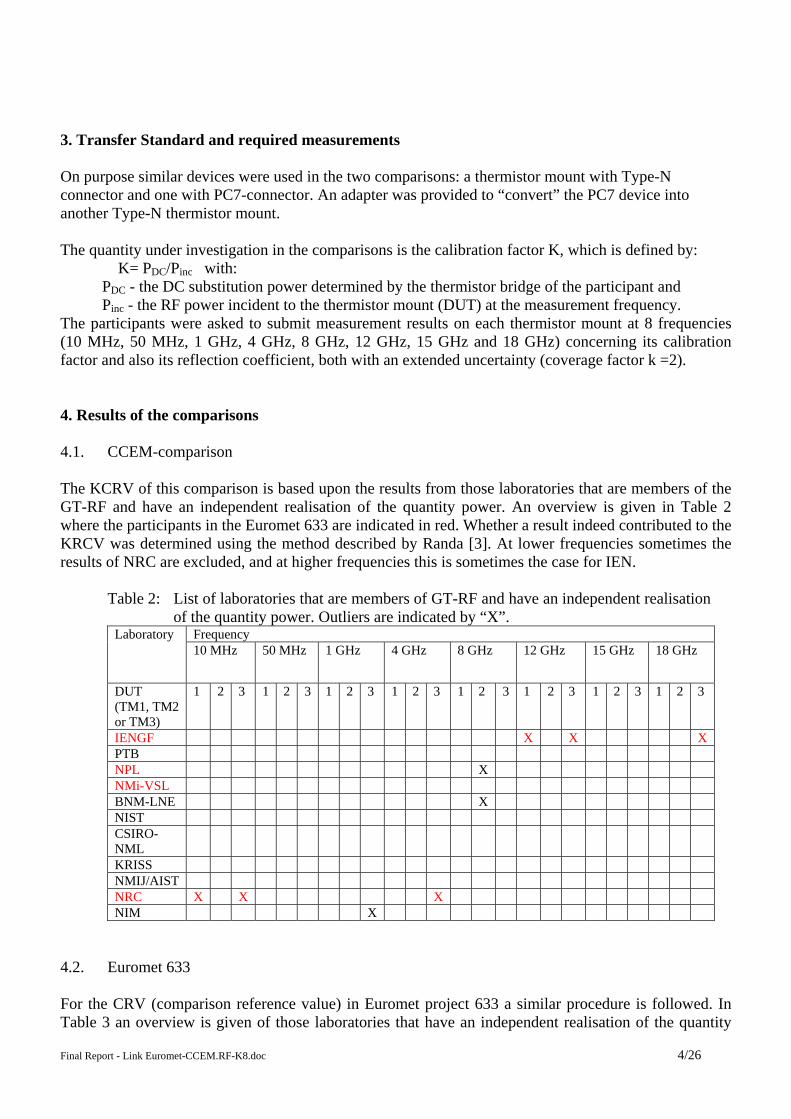
The participants were asked to submit measurement results on each thermistor mount at 8 frequencies (10 MHz, 50 MHz, 1 GHz, 4 GHz, 8 GHz, 12 GHz, 15 GHz and 18 GHz) concerning its calibration factor and also its reflection coefficient, both with an extended uncertainty (coverage factor k =2). 4. Results of the comparisons 4.1. CCEM-comparison The KCRV of this comparison is based upon the results from those laboratories that are members of the GT-RF and have an independent realisation of the quantity power. An overview is given in Table 2 where the participants in the Euromet 633 are indicated in red. Whether a result indeed contributed to the KRCV was determined using the method described by Randa [3]. At lower frequencies sometimes the results of NRC are excluded, and at higher frequencies this is sometimes the case for IEN.
Table 2: List of laboratories that are members of GT-RF and have an independent realisation of the quantity power. Outliers are indicated by “X”.
Frequency Laboratory
10 MHz 50 MHz 1 GHz 4 GHz 8 GHz 12 GHz 15 GHz 18 GHz
DUT (TM1, TM2 or TM3)
1 2 3 1 2 3 1 2 3 1 2 3 1 2 3 1 2 3 1 2 3 1 2 3
IENGF X X X PTB NPL X NMi-VSL BNM-LNE X NIST CSIRO-NML
KRISS NMIJ/AIST NRC X X X NIM X
4.2. Euromet 633 For the CRV (comparison reference value) in Euromet project 633 a similar procedure is followed. In Table 3 an overview is given of those laboratories that have an independent realisation of the quantity
Final Report - Link Euromet-CCEM.RF-K8.doc 5/26
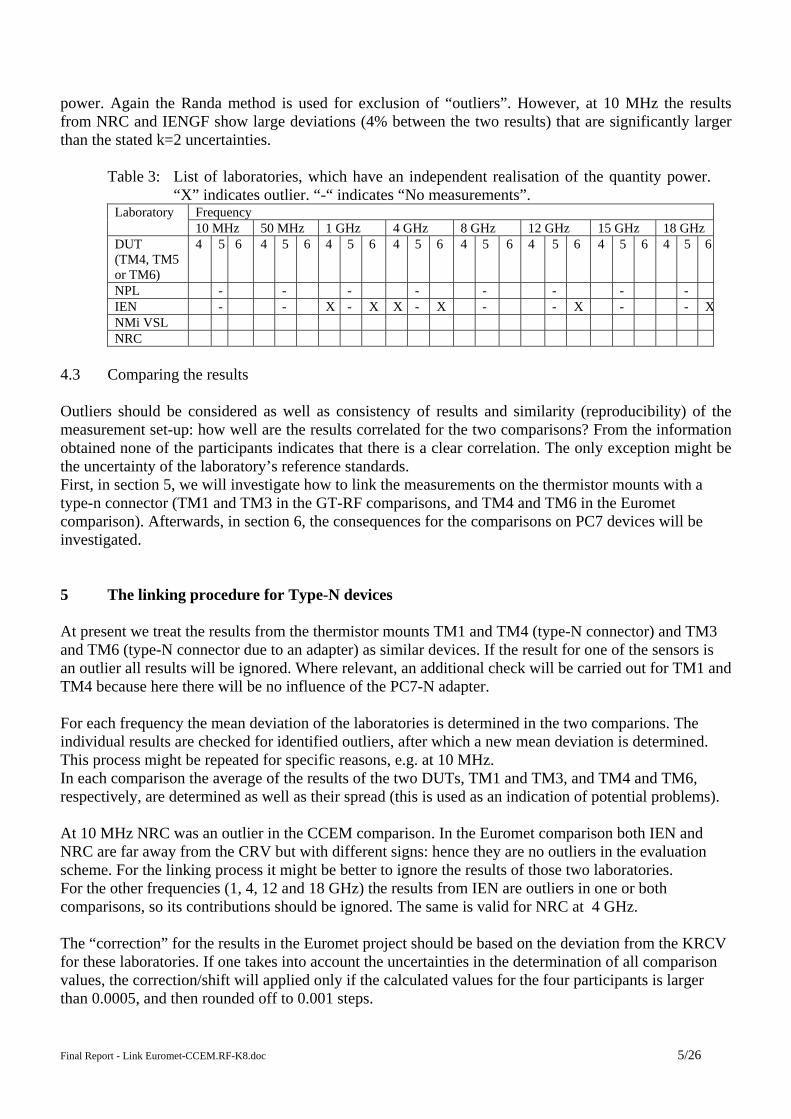
power. Again the Randa method is used for exclusion of “outliers”. However, at 10 MHz the results from NRC and IENGF show large deviations (4% between the two results) that are significantly larger than the stated k=2 uncertainties.
Table 3: List of laboratories, which have an independent realisation of the quantity power. “X” indicates outlier. “-“ indicates “No measurements”.
Frequency Laboratory 10 MHz 50 MHz 1 GHz 4 GHz 8 GHz 12 GHz 15 GHz 18 GHz
DUT (TM4, TM5 or TM6)
4 5 6 4 5 6 4 5 6 4 5 6 4 5 6 4 5 6 4 5 6 4 5 6
NPL - - - - - - - - IEN - - X - X X - X - - X - - XNMi VSL NRC
4.3 Comparing the results Outliers should be considered as well as consistency of results and similarity (reproducibility) of the measurement set-up: how well are the results correlated for the two comparisons? From the information obtained none of the participants indicates that there is a clear correlation. The only exception might be the uncertainty of the laboratory’s reference standards. First, in section 5, we will investigate how to link the measurements on the thermistor mounts with a type-n connector (TM1 and TM3 in the GT-RF comparisons, and TM4 and TM6 in the Euromet comparison). Afterwards, in section 6, the consequences for the comparisons on PC7 devices will be investigated. 5 The linking procedure for Type-N devices At present we treat the results from the thermistor mounts TM1 and TM4 (type-N connector) and TM3 and TM6 (type-N connector due to an adapter) as similar devices. If the result for one of the sensors is an outlier all results will be ignored. Where relevant, an additional check will be carried out for TM1 and TM4 because here there will be no influence of the PC7-N adapter. For each frequency the mean deviation of the laboratories is determined in the two comparions. The individual results are checked for identified outliers, after which a new mean deviation is determined. This process might be repeated for specific reasons, e.g. at 10 MHz. In each comparison the average of the results of the two DUTs, TM1 and TM3, and TM4 and TM6, respectively, are determined as well as their spread (this is used as an indication of potential problems). At 10 MHz NRC was an outlier in the CCEM comparison. In the Euromet comparison both IEN and NRC are far away from the CRV but with different signs: hence they are no outliers in the evaluation scheme. For the linking process it might be better to ignore the results of those two laboratories. For the other frequencies (1, 4, 12 and 18 GHz) the results from IEN are outliers in one or both comparisons, so its contributions should be ignored. The same is valid for NRC at 4 GHz. The “correction” for the results in the Euromet project should be based on the deviation from the KRCV for these laboratories. If one takes into account the uncertainties in the determination of all comparison values, the correction/shift will applied only if the calculated values for the four participants is larger than 0.0005, and then rounded off to 0.001 steps.
Final Report - Link Euromet-CCEM.RF-K8.doc 6/26
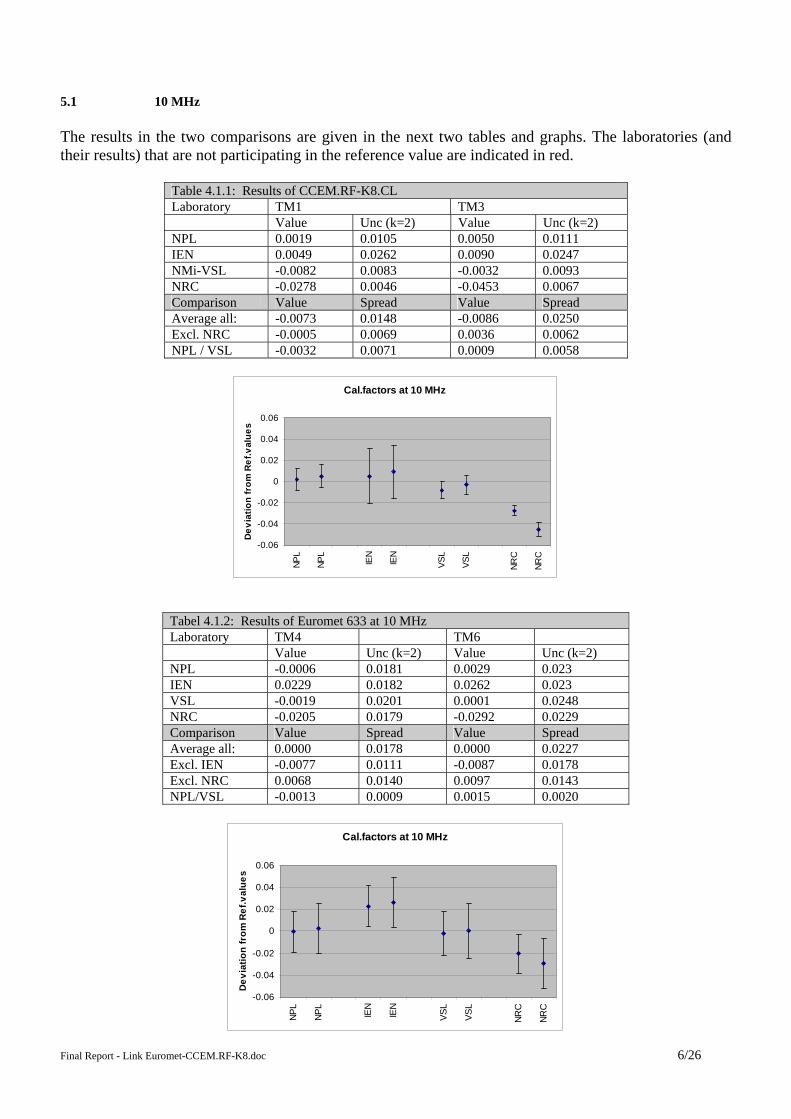
5.1 10 MHz The results in the two comparisons are given in the next two tables and graphs. The laboratories (and their results) that are not participating in the reference value are indicated in red.
Table 4.1.1: Results of CCEM.RF-K8.CL Laboratory TM1 TM3 Value Unc (k=2) Value Unc (k=2) NPL 0.0019 0.0105 0.0050 0.0111 IEN 0.0049 0.0262 0.0090 0.0247 NMi-VSL -0.0082 0.0083 -0.0032 0.0093 NRC -0.0278 0.0046 -0.0453 0.0067 Comparison Value Spread Value Spread Average all: -0.0073 0.0148 -0.0086 0.0250 Excl. NRC -0.0005 0.0069 0.0036 0.0062 NPL / VSL -0.0032 0.0071 0.0009 0.0058
Cal.factors at 10 MHz
-0.06
-0.04
-0.02
0
0.02
0.04
0.06
NPL
NPL
IEN
IEN
VSL
VSL
NRC
NRC
Dev
iatio
n fr
om R
ef.v
alue
s
Tabel 4.1.2: Results of Euromet 633 at 10 MHz Laboratory TM4 TM6 Value Unc (k=2) Value Unc (k=2) NPL -0.0006 0.0181 0.0029 0.023 IEN 0.0229 0.0182 0.0262 0.023 VSL -0.0019 0.0201 0.0001 0.0248 NRC -0.0205 0.0179 -0.0292 0.0229 Comparison Value Spread Value Spread Average all: 0.0000 0.0178 0.0000 0.0227 Excl. IEN -0.0077 0.0111 -0.0087 0.0178 Excl. NRC 0.0068 0.0140 0.0097 0.0143 NPL/VSL -0.0013 0.0009 0.0015 0.0020
Cal.factors at 10 MHz
-0.06
-0.04
-0.02
0
0.02
0.04
0.06
NPL
NPL
IEN
IEN
VSL
VSL
NRC
NRC
Dev
iatio
n fr
om R
ef.v
alue
s
Final Report - Link Euromet-CCEM.RF-K8.doc 7/26
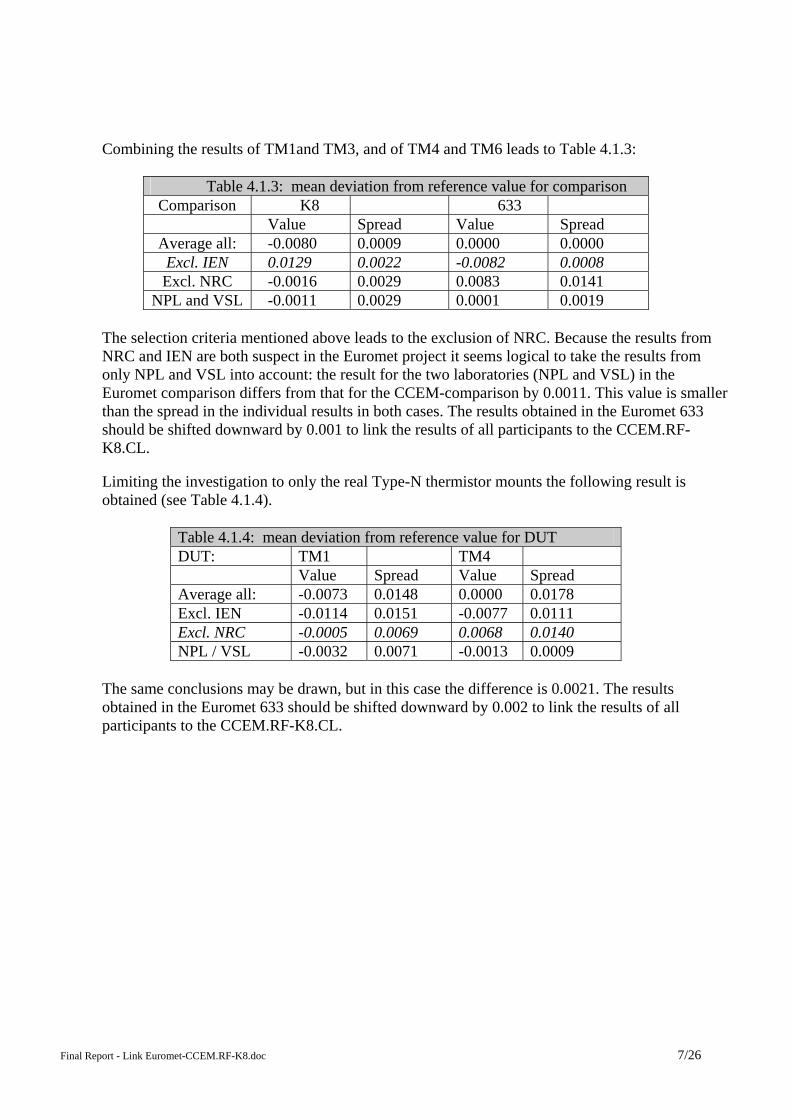
Combining the results of TM1and TM3, and of TM4 and TM6 leads to Table 4.1.3:
Table 4.1.3: mean deviation from reference value for comparison Comparison K8 633
Value Spread Value Spread Average all: -0.0080 0.0009 0.0000 0.0000
Excl. IEN 0.0129 0.0022 -0.0082 0.0008 Excl. NRC -0.0016 0.0029 0.0083 0.0141
NPL and VSL -0.0011 0.0029 0.0001 0.0019 The selection criteria mentioned above leads to the exclusion of NRC. Because the results from NRC and IEN are both suspect in the Euromet project it seems logical to take the results from only NPL and VSL into account: the result for the two laboratories (NPL and VSL) in the Euromet comparison differs from that for the CCEM-comparison by 0.0011. This value is smaller than the spread in the individual results in both cases. The results obtained in the Euromet 633 should be shifted downward by 0.001 to link the results of all participants to the CCEM.RF-K8.CL. Limiting the investigation to only the real Type-N thermistor mounts the following result is obtained (see Table 4.1.4).
Table 4.1.4: mean deviation from reference value for DUT DUT: TM1 TM4 Value Spread Value Spread Average all: -0.0073 0.0148 0.0000 0.0178 Excl. IEN -0.0114 0.0151 -0.0077 0.0111 Excl. NRC -0.0005 0.0069 0.0068 0.0140 NPL / VSL -0.0032 0.0071 -0.0013 0.0009
The same conclusions may be drawn, but in this case the difference is 0.0021. The results obtained in the Euromet 633 should be shifted downward by 0.002 to link the results of all participants to the CCEM.RF-K8.CL.
Final Report - Link Euromet-CCEM.RF-K8.doc 8/26
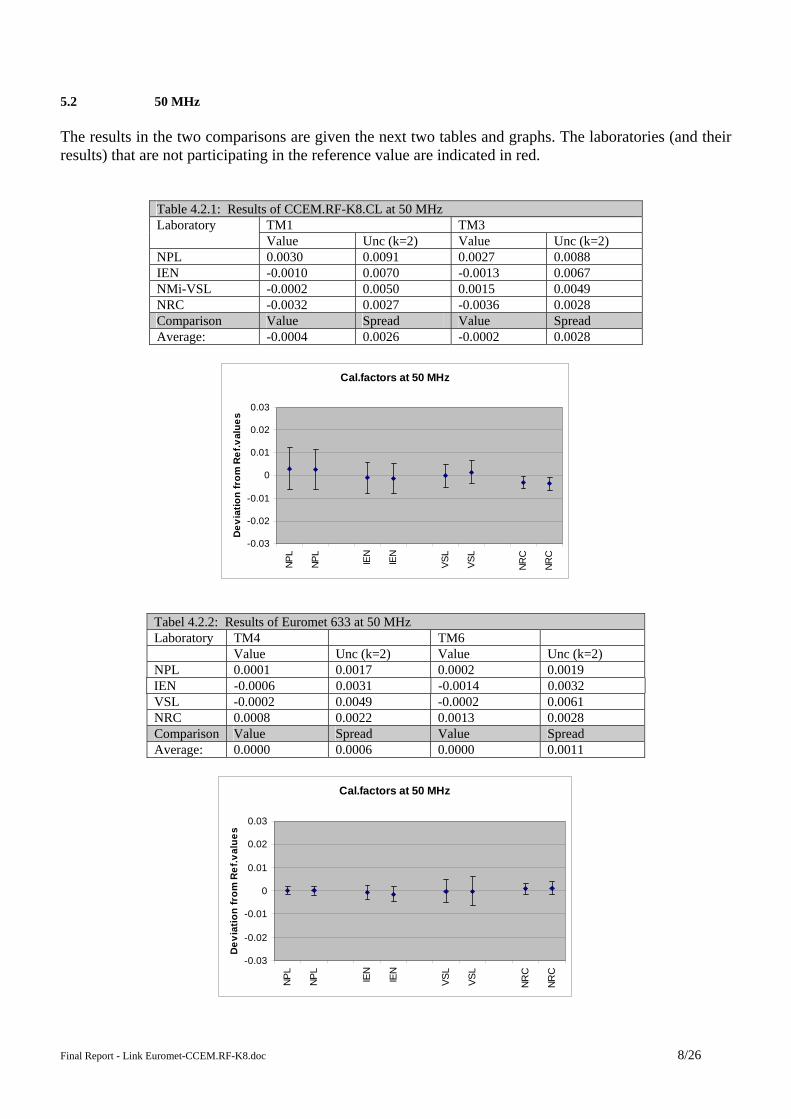
5.2 50 MHz The results in the two comparisons are given the next two tables and graphs. The laboratories (and their results) that are not participating in the reference value are indicated in red.
Table 4.2.1: Results of CCEM.RF-K8.CL at 50 MHz TM1 TM3 Laboratory Value Unc (k=2) Value Unc (k=2)
NPL 0.0030 0.0091 0.0027 0.0088 IEN -0.0010 0.0070 -0.0013 0.0067 NMi-VSL -0.0002 0.0050 0.0015 0.0049 NRC -0.0032 0.0027 -0.0036 0.0028 Comparison Value Spread Value Spread Average: -0.0004 0.0026 -0.0002 0.0028
Cal.factors at 50 MHz
-0.03
-0.02
-0.01
0
0.01
0.02
0.03
NPL
NPL
IEN
IEN
VSL
VSL
NRC
NRC
Dev
iatio
n fr
om R
ef.v
alue
s
Tabel 4.2.2: Results of Euromet 633 at 50 MHz Laboratory TM4 TM6 Value Unc (k=2) Value Unc (k=2) NPL 0.0001 0.0017 0.0002 0.0019 IEN -0.0006 0.0031 -0.0014 0.0032 VSL -0.0002 0.0049 -0.0002 0.0061 NRC 0.0008 0.0022 0.0013 0.0028 Comparison Value Spread Value Spread Average: 0.0000 0.0006 0.0000 0.0011
Cal.factors at 50 MHz
-0.03
-0.02
-0.01
0
0.01
0.02
0.03
NPL
NPL
IEN
IEN
VSL
VSL
NRC
NRC
Dev
iatio
n fr
om R
ef.v
alue
s
Final Report - Link Euromet-CCEM.RF-K8.doc 9/26
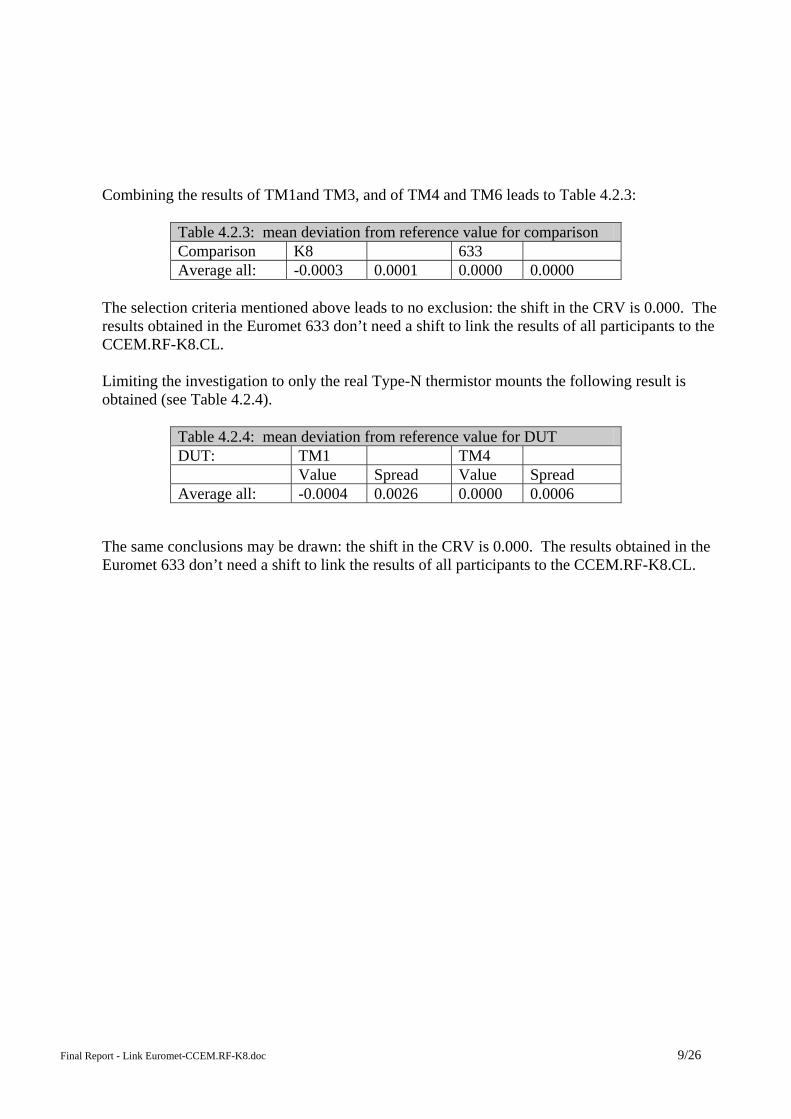
Combining the results of TM1and TM3, and of TM4 and TM6 leads to Table 4.2.3:
Table 4.2.3: mean deviation from reference value for comparison Comparison K8 633 Average all: -0.0003 0.0001 0.0000 0.0000
The selection criteria mentioned above leads to no exclusion: the shift in the CRV is 0.000. The results obtained in the Euromet 633 don’t need a shift to link the results of all participants to the CCEM.RF-K8.CL. Limiting the investigation to only the real Type-N thermistor mounts the following result is obtained (see Table 4.2.4).
Table 4.2.4: mean deviation from reference value for DUT DUT: TM1 TM4 Value Spread Value Spread Average all: -0.0004 0.0026 0.0000 0.0006
The same conclusions may be drawn: the shift in the CRV is 0.000. The results obtained in the Euromet 633 don’t need a shift to link the results of all participants to the CCEM.RF-K8.CL.
Final Report - Link Euromet-CCEM.RF-K8.doc 10/26
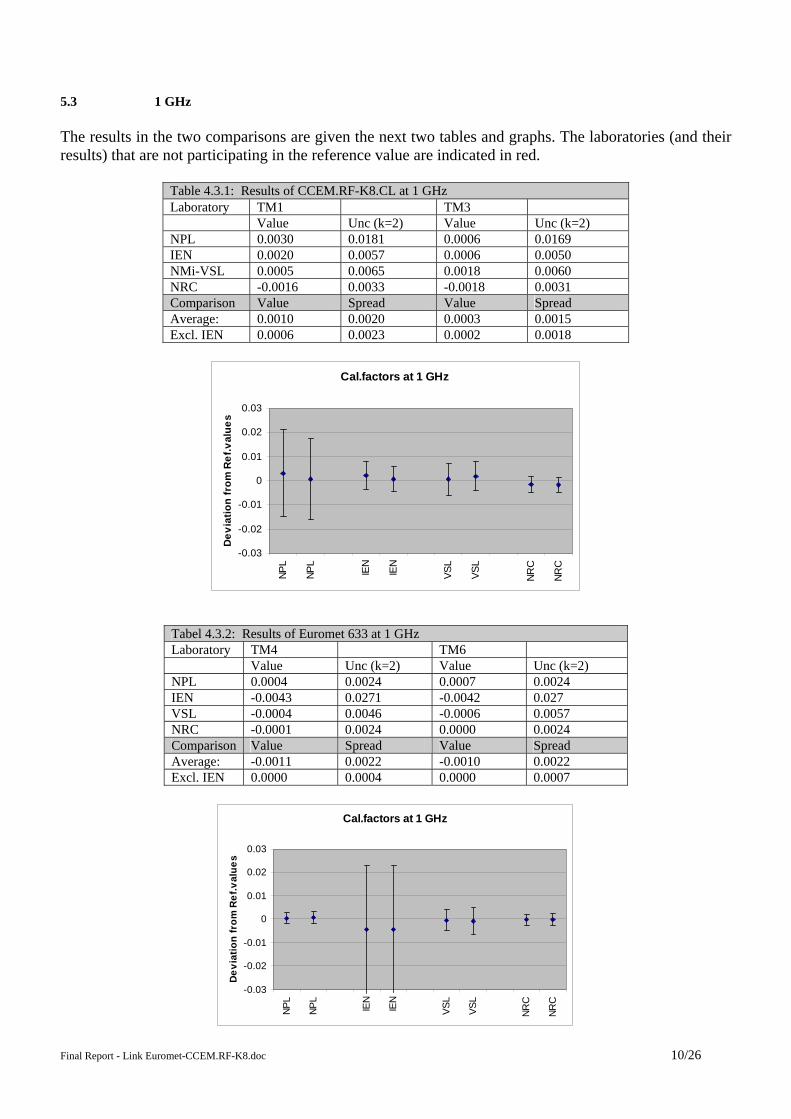
5.3 1 GHz The results in the two comparisons are given the next two tables and graphs. The laboratories (and their results) that are not participating in the reference value are indicated in red.
Table 4.3.1: Results of CCEM.RF-K8.CL at 1 GHz Laboratory TM1 TM3 Value Unc (k=2) Value Unc (k=2) NPL 0.0030 0.0181 0.0006 0.0169 IEN 0.0020 0.0057 0.0006 0.0050 NMi-VSL 0.0005 0.0065 0.0018 0.0060 NRC -0.0016 0.0033 -0.0018 0.0031 Comparison Value Spread Value Spread Average: 0.0010 0.0020 0.0003 0.0015 Excl. IEN 0.0006 0.0023 0.0002 0.0018
Cal.factors at 1 GHz
-0.03
-0.02
-0.01
0
0.01
0.02
0.03
NPL
NPL
IEN
IEN
VSL
VSL
NRC
NRC
Dev
iatio
n fr
om R
ef.v
alue
s
Tabel 4.3.2: Results of Euromet 633 at 1 GHz Laboratory TM4 TM6 Value Unc (k=2) Value Unc (k=2) NPL 0.0004 0.0024 0.0007 0.0024 IEN -0.0043 0.0271 -0.0042 0.027 VSL -0.0004 0.0046 -0.0006 0.0057 NRC -0.0001 0.0024 0.0000 0.0024 Comparison Value Spread Value Spread Average: -0.0011 0.0022 -0.0010 0.0022 Excl. IEN 0.0000 0.0004 0.0000 0.0007
Cal.factors at 1 GHz
-0.03
-0.02
-0.01
0
0.01
0.02
0.03
NPL
NPL
IEN
IEN
VSL
VSL
NRC
NRC
Dev
iatio
n fr
om R
ef.v
alue
s
Final Report - Link Euromet-CCEM.RF-K8.doc 11/26
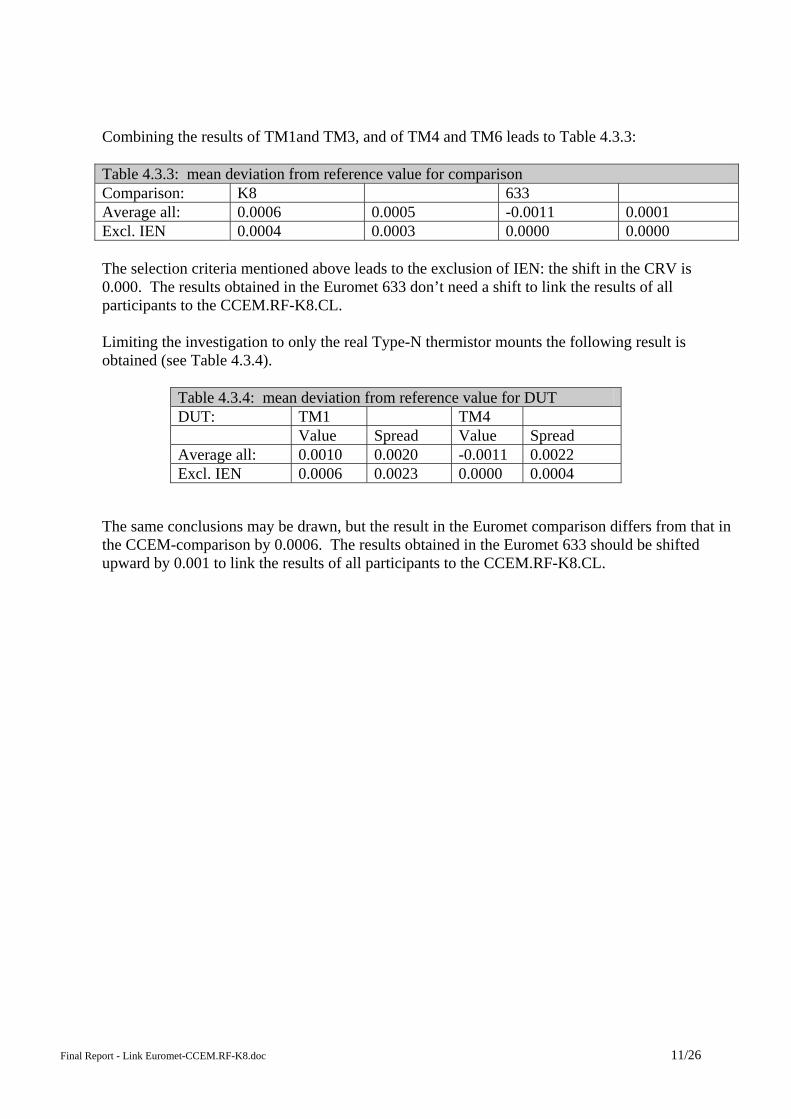
Combining the results of TM1and TM3, and of TM4 and TM6 leads to Table 4.3.3: Table 4.3.3: mean deviation from reference value for comparison Comparison: K8 633 Average all: 0.0006 0.0005 -0.0011 0.0001 Excl. IEN 0.0004 0.0003 0.0000 0.0000 The selection criteria mentioned above leads to the exclusion of IEN: the shift in the CRV is 0.000. The results obtained in the Euromet 633 don’t need a shift to link the results of all participants to the CCEM.RF-K8.CL. Limiting the investigation to only the real Type-N thermistor mounts the following result is obtained (see Table 4.3.4).
Table 4.3.4: mean deviation from reference value for DUT DUT: TM1 TM4 Value Spread Value Spread Average all: 0.0010 0.0020 -0.0011 0.0022 Excl. IEN 0.0006 0.0023 0.0000 0.0004
The same conclusions may be drawn, but the result in the Euromet comparison differs from that in the CCEM-comparison by 0.0006. The results obtained in the Euromet 633 should be shifted upward by 0.001 to link the results of all participants to the CCEM.RF-K8.CL.
Final Report - Link Euromet-CCEM.RF-K8.doc 12/26
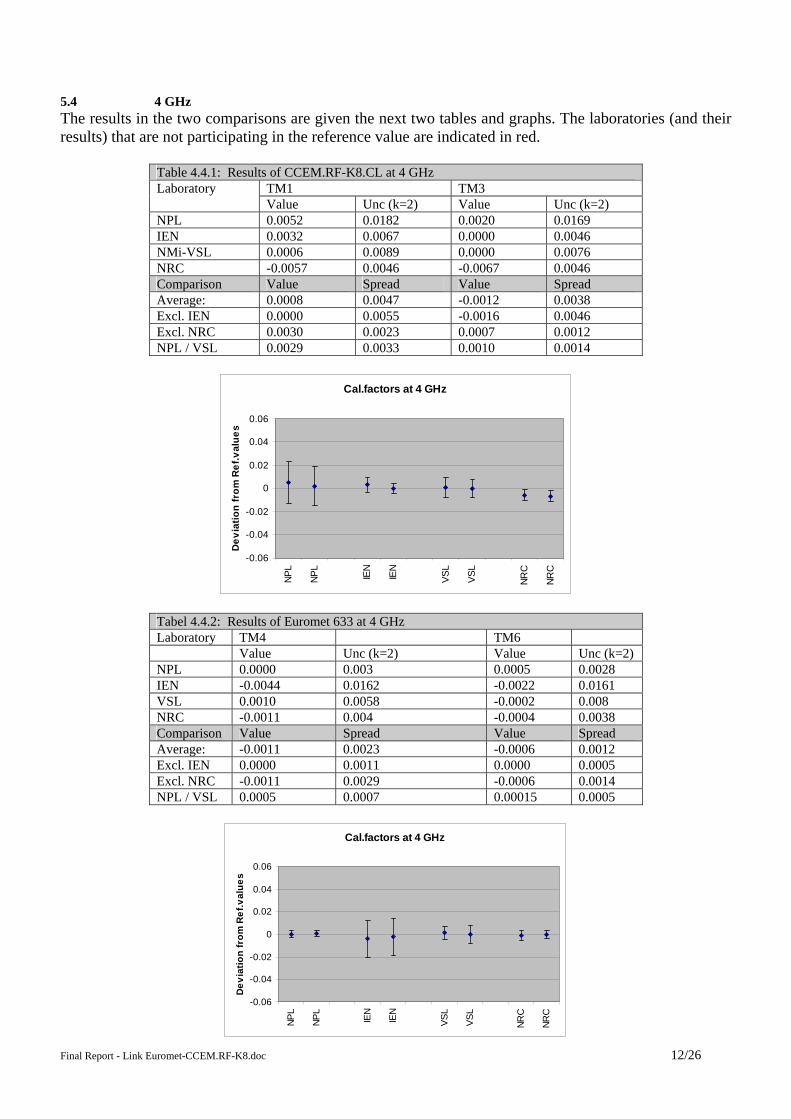
5.4 4 GHz The results in the two comparisons are given the next two tables and graphs. The laboratories (and their results) that are not participating in the reference value are indicated in red.
Table 4.4.1: Results of CCEM.RF-K8.CL at 4 GHz TM1 TM3 Laboratory Value Unc (k=2) Value Unc (k=2)
NPL 0.0052 0.0182 0.0020 0.0169 IEN 0.0032 0.0067 0.0000 0.0046 NMi-VSL 0.0006 0.0089 0.0000 0.0076 NRC -0.0057 0.0046 -0.0067 0.0046 Comparison Value Spread Value Spread Average: 0.0008 0.0047 -0.0012 0.0038 Excl. IEN 0.0000 0.0055 -0.0016 0.0046 Excl. NRC 0.0030 0.0023 0.0007 0.0012 NPL / VSL 0.0029 0.0033 0.0010 0.0014
Cal.factors at 4 GHz
-0.06
-0.04
-0.02
0
0.02
0.04
0.06
NPL
NPL
IEN
IEN
VSL
VSL
NRC
NRC
Dev
iatio
n fr
om R
ef.v
alue
s
Tabel 4.4.2: Results of Euromet 633 at 4 GHz Laboratory TM4 TM6 Value Unc (k=2) Value Unc (k=2) NPL 0.0000 0.003 0.0005 0.0028 IEN -0.0044 0.0162 -0.0022 0.0161 VSL 0.0010 0.0058 -0.0002 0.008 NRC -0.0011 0.004 -0.0004 0.0038 Comparison Value Spread Value Spread Average: -0.0011 0.0023 -0.0006 0.0012 Excl. IEN 0.0000 0.0011 0.0000 0.0005 Excl. NRC -0.0011 0.0029 -0.0006 0.0014 NPL / VSL 0.0005 0.0007 0.00015 0.0005
Cal.factors at 4 GHz
-0.06
-0.04
-0.02
0
0.02
0.04
0.06
NPL
NPL
IEN
IEN
VSL
VSL
NRC
NRC
Dev
iatio
n fr
om R
ef.v
alue
s
Final Report - Link Euromet-CCEM.RF-K8.doc 13/26
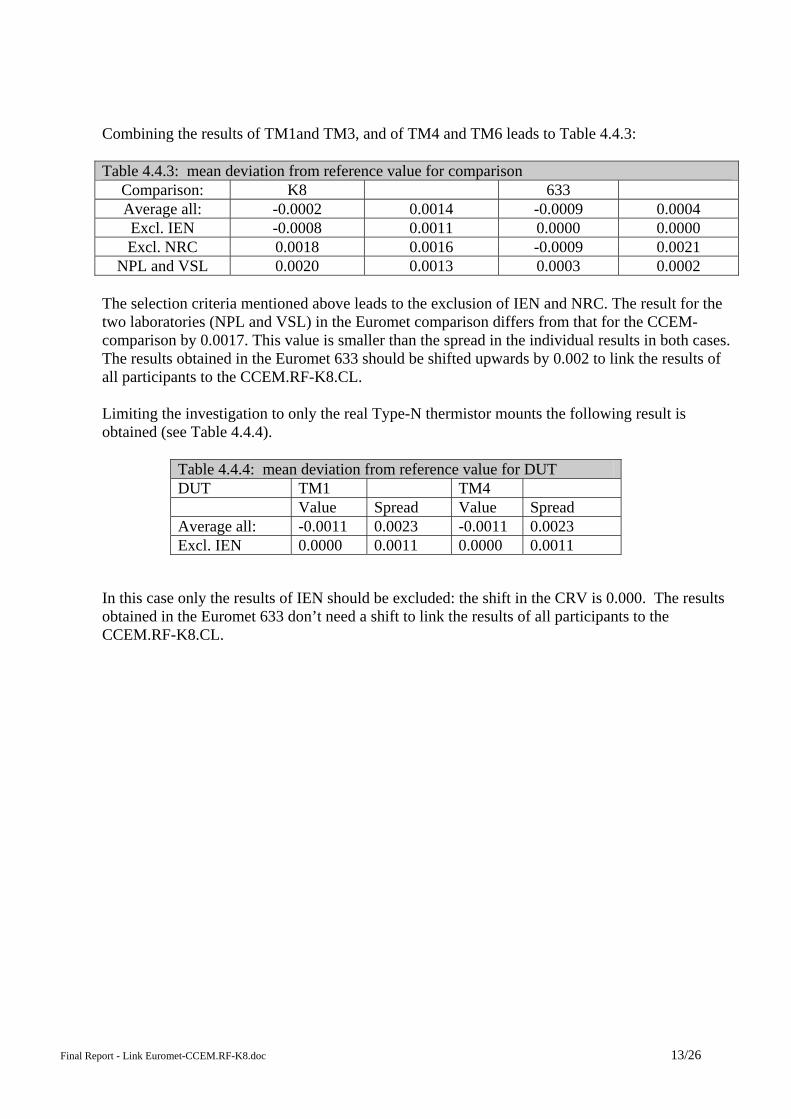
Combining the results of TM1and TM3, and of TM4 and TM6 leads to Table 4.4.3: Table 4.4.3: mean deviation from reference value for comparison
Comparison: K8 633 Average all: -0.0002 0.0014 -0.0009 0.0004 Excl. IEN -0.0008 0.0011 0.0000 0.0000 Excl. NRC 0.0018 0.0016 -0.0009 0.0021
NPL and VSL 0.0020 0.0013 0.0003 0.0002 The selection criteria mentioned above leads to the exclusion of IEN and NRC. The result for the two laboratories (NPL and VSL) in the Euromet comparison differs from that for the CCEM-comparison by 0.0017. This value is smaller than the spread in the individual results in both cases. The results obtained in the Euromet 633 should be shifted upwards by 0.002 to link the results of all participants to the CCEM.RF-K8.CL. Limiting the investigation to only the real Type-N thermistor mounts the following result is obtained (see Table 4.4.4).
Table 4.4.4: mean deviation from reference value for DUT DUT TM1 TM4 Value Spread Value Spread Average all: -0.0011 0.0023 -0.0011 0.0023 Excl. IEN 0.0000 0.0011 0.0000 0.0011
In this case only the results of IEN should be excluded: the shift in the CRV is 0.000. The results obtained in the Euromet 633 don’t need a shift to link the results of all participants to the CCEM.RF-K8.CL.
Final Report - Link Euromet-CCEM.RF-K8.doc 14/26
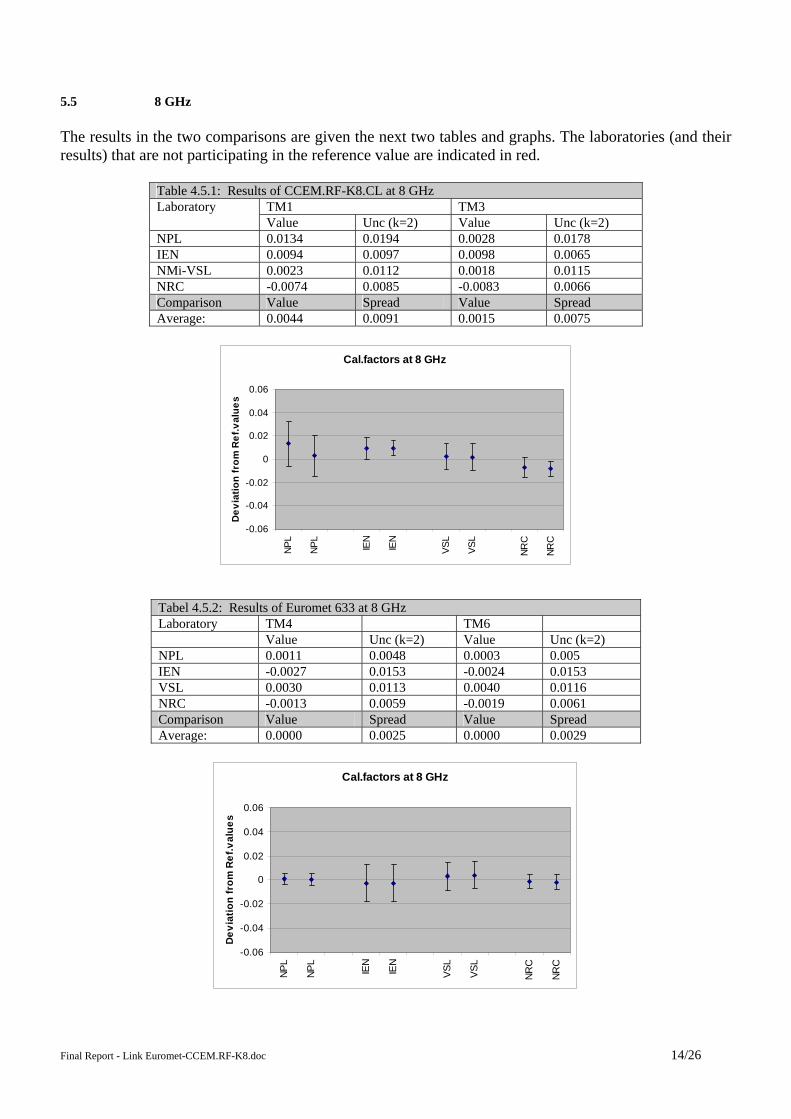
5.5 8 GHz The results in the two comparisons are given the next two tables and graphs. The laboratories (and their results) that are not participating in the reference value are indicated in red.
Table 4.5.1: Results of CCEM.RF-K8.CL at 8 GHz TM1 TM3 Laboratory Value Unc (k=2) Value Unc (k=2)
NPL 0.0134 0.0194 0.0028 0.0178 IEN 0.0094 0.0097 0.0098 0.0065 NMi-VSL 0.0023 0.0112 0.0018 0.0115 NRC -0.0074 0.0085 -0.0083 0.0066 Comparison Value Spread Value Spread Average: 0.0044 0.0091 0.0015 0.0075
Cal.factors at 8 GHz
-0.06
-0.04
-0.02
0
0.02
0.04
0.06
NPL
NPL
IEN
IEN
VSL
VSL
NRC
NRC
Dev
iatio
n fr
om R
ef.v
alue
s
Tabel 4.5.2: Results of Euromet 633 at 8 GHz Laboratory TM4 TM6 Value Unc (k=2) Value Unc (k=2) NPL 0.0011 0.0048 0.0003 0.005 IEN -0.0027 0.0153 -0.0024 0.0153 VSL 0.0030 0.0113 0.0040 0.0116 NRC -0.0013 0.0059 -0.0019 0.0061 Comparison Value Spread Value Spread Average: 0.0000 0.0025 0.0000 0.0029
Cal.factors at 8 GHz
-0.06
-0.04
-0.02
0
0.02
0.04
0.06
NPL
NPL
IEN
IEN
VSL
VSL
NRC
NRC
Dev
iatio
n fr
om R
ef.v
alue
s

Final Report - Link Euromet-CCEM.RF-K8.doc 15/26
Combining the results of TM1and TM3, and of TM4 and TM6 leads to Table 4.5.3 Table 4.5.3: mean deviation from reference value for comparison Comparison: K8 633 Average all 0.0030 0.0021 0.0000 0.0000 The selection criteria mentioned above leads to no exclusion. The result in the Euromet comparison differs from that for the CCEM-comparison by 0.0030. This value is smaller than the spread in the individual results in both cases. The results obtained in the Euromet 633 should be shifted upwards by 0.003 to link the results of all participants to the CCEM.RF-K8.CL. Limiting the investigation to only the real Type-N thermistor mounts the following result is obtained (see Table 4.5.4).
Table 4.5.4: mean deviation from reference value for DUT DUT: TM1 TM4 Value Spread Value Spread Average all: 0.0044 0.0091 0.0000 0.0025
The same conclusions may be drawn, but the result in the Euromet comparison differs from that in the CCEM-comparison by 0.0044. The results obtained in the Euromet 633 should be shifted upward by 0.004 to link the results of all participants to the CCEM.RF-K8.CL.
Final Report - Link Euromet-CCEM.RF-K8.doc 16/26
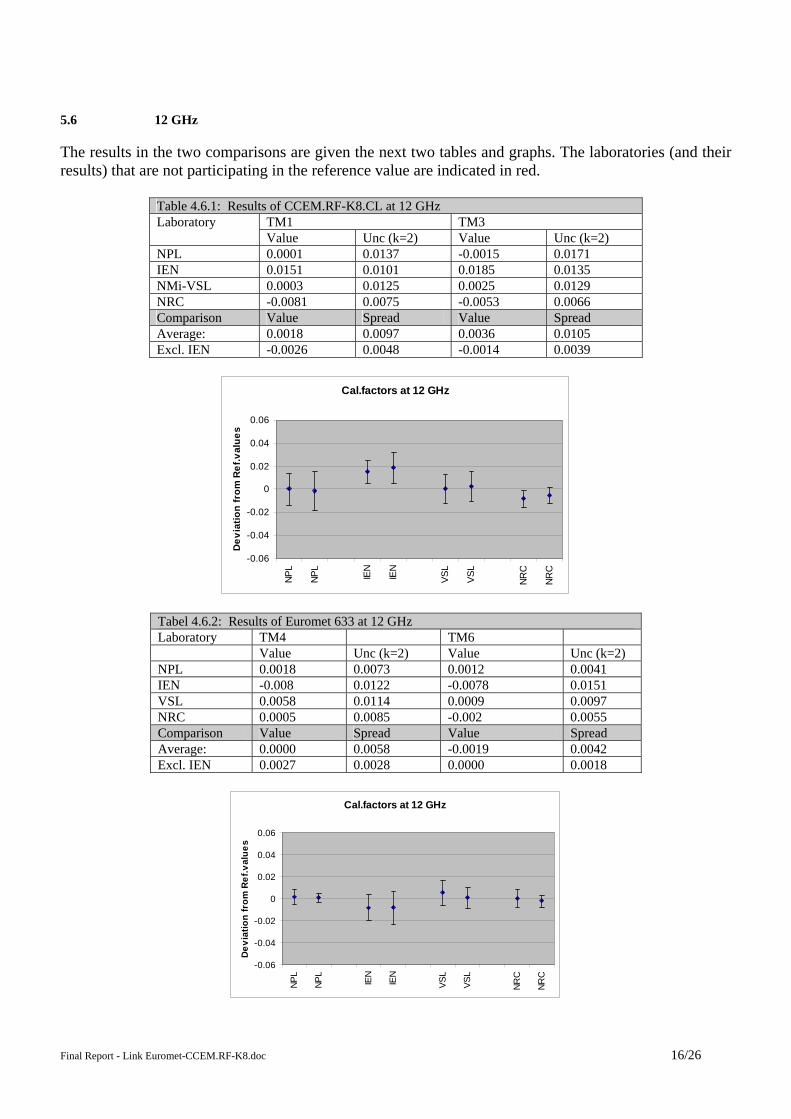
5.6 12 GHz
The results in the two comparisons are given the next two tables and graphs. The laboratories (and their results) that are not participating in the reference value are indicated in red.
Table 4.6.1: Results of CCEM.RF-K8.CL at 12 GHz TM1 TM3 Laboratory Value Unc (k=2) Value Unc (k=2)
NPL 0.0001 0.0137 -0.0015 0.0171 IEN 0.0151 0.0101 0.0185 0.0135 NMi-VSL 0.0003 0.0125 0.0025 0.0129 NRC -0.0081 0.0075 -0.0053 0.0066 Comparison Value Spread Value Spread Average: 0.0018 0.0097 0.0036 0.0105 Excl. IEN -0.0026 0.0048 -0.0014 0.0039
Cal.factors at 12 GHz
-0.06
-0.04
-0.02
0
0.02
0.04
0.06
NPL
NPL
IEN
IEN
VSL
VSL
NRC
NRC
Dev
iatio
n fr
om R
ef.v
alue
s
Tabel 4.6.2: Results of Euromet 633 at 12 GHz Laboratory TM4 TM6 Value Unc (k=2) Value Unc (k=2) NPL 0.0018 0.0073 0.0012 0.0041 IEN -0.008 0.0122 -0.0078 0.0151 VSL 0.0058 0.0114 0.0009 0.0097 NRC 0.0005 0.0085 -0.002 0.0055 Comparison Value Spread Value Spread Average: 0.0000 0.0058 -0.0019 0.0042 Excl. IEN 0.0027 0.0028 0.0000 0.0018
Cal.factors at 12 GHz
-0.06
-0.04
-0.02
0
0.02
0.04
0.06
NPL
NPL
IEN
IEN
VSL
VSL
NRC
NRC
Dev
iatio
n fr
om R
ef.v
alue
s
Final Report - Link Euromet-CCEM.RF-K8.doc 17/26
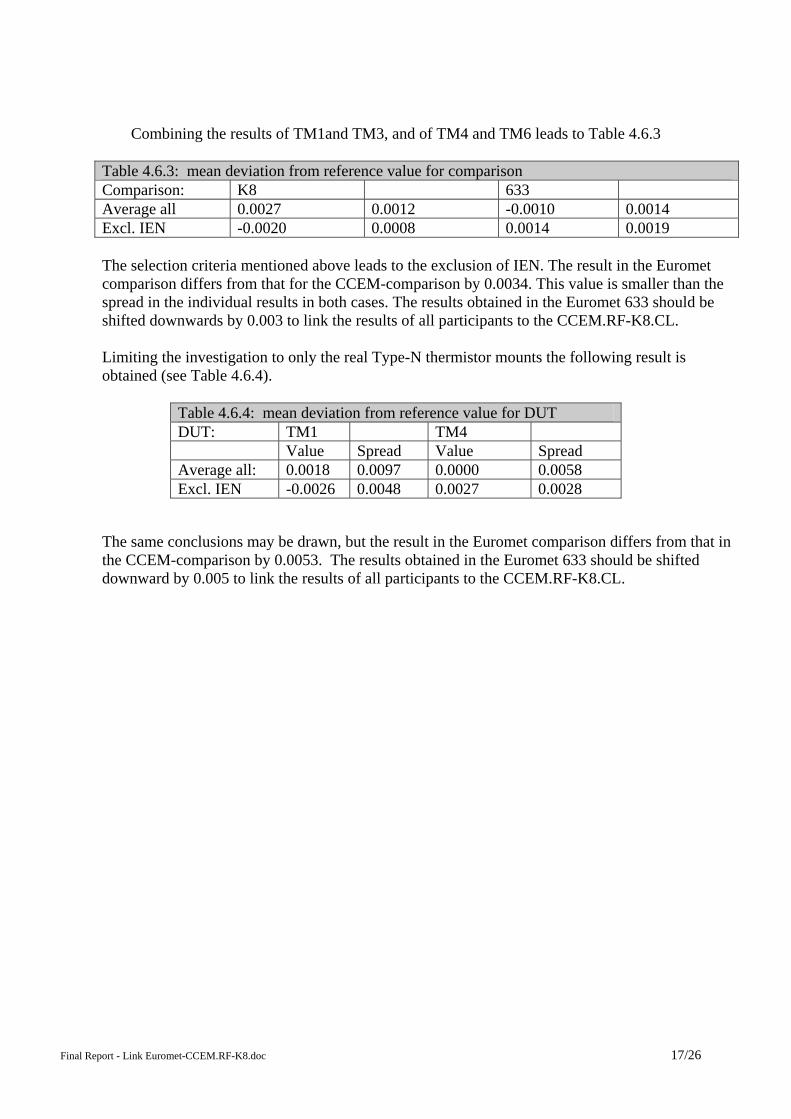
Combining the results of TM1and TM3, and of TM4 and TM6 leads to Table 4.6.3
Table 4.6.3: mean deviation from reference value for comparison Comparison: K8 633 Average all 0.0027 0.0012 -0.0010 0.0014 Excl. IEN -0.0020 0.0008 0.0014 0.0019 The selection criteria mentioned above leads to the exclusion of IEN. The result in the Euromet comparison differs from that for the CCEM-comparison by 0.0034. This value is smaller than the spread in the individual results in both cases. The results obtained in the Euromet 633 should be shifted downwards by 0.003 to link the results of all participants to the CCEM.RF-K8.CL. Limiting the investigation to only the real Type-N thermistor mounts the following result is obtained (see Table 4.6.4).
Table 4.6.4: mean deviation from reference value for DUT DUT: TM1 TM4 Value Spread Value Spread Average all: 0.0018 0.0097 0.0000 0.0058 Excl. IEN -0.0026 0.0048 0.0027 0.0028
The same conclusions may be drawn, but the result in the Euromet comparison differs from that in the CCEM-comparison by 0.0053. The results obtained in the Euromet 633 should be shifted downward by 0.005 to link the results of all participants to the CCEM.RF-K8.CL.
Final Report - Link Euromet-CCEM.RF-K8.doc 18/26
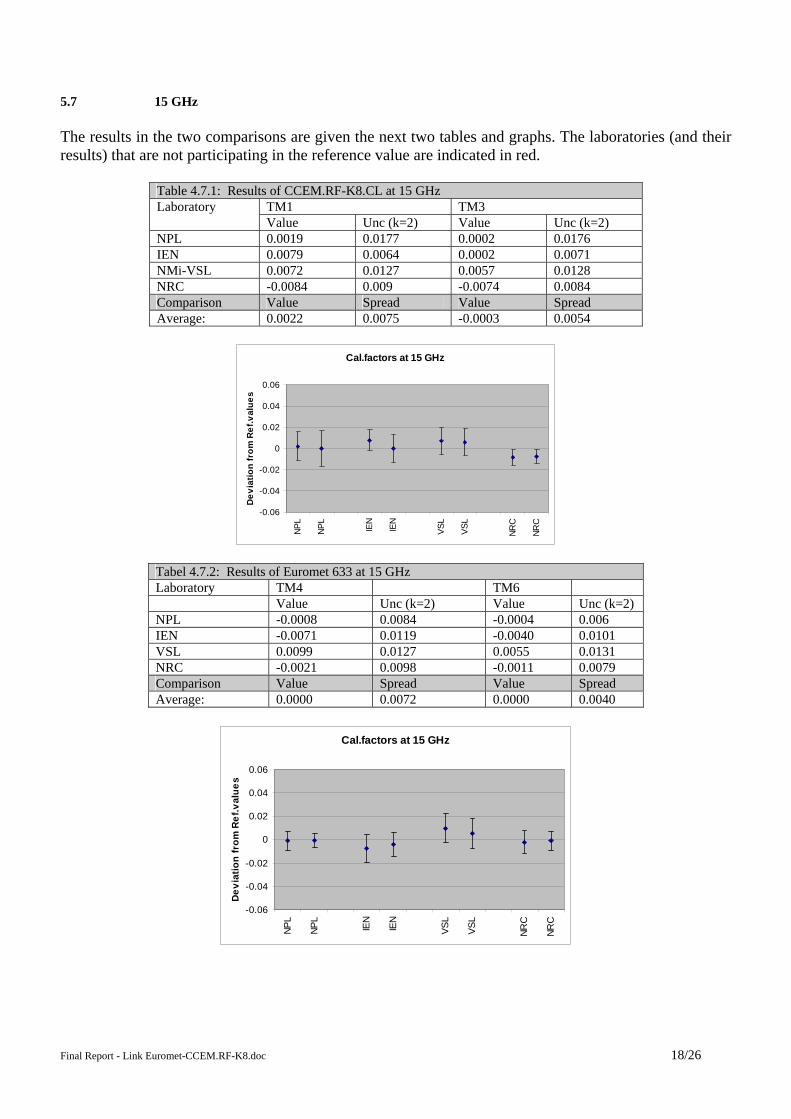
5.7 15 GHz The results in the two comparisons are given the next two tables and graphs. The laboratories (and their results) that are not participating in the reference value are indicated in red.
Table 4.7.1: Results of CCEM.RF-K8.CL at 15 GHz TM1 TM3 Laboratory Value Unc (k=2) Value Unc (k=2)
NPL 0.0019 0.0177 0.0002 0.0176 IEN 0.0079 0.0064 0.0002 0.0071 NMi-VSL 0.0072 0.0127 0.0057 0.0128 NRC -0.0084 0.009 -0.0074 0.0084 Comparison Value Spread Value Spread Average: 0.0022 0.0075 -0.0003 0.0054
Cal.factors at 15 GHz
-0.06
-0.04
-0.02
0
0.02
0.04
0.06
NPL
NPL
IEN
IEN
VSL
VSL
NRC
NRC
Dev
iatio
n fr
om R
ef.v
alue
s
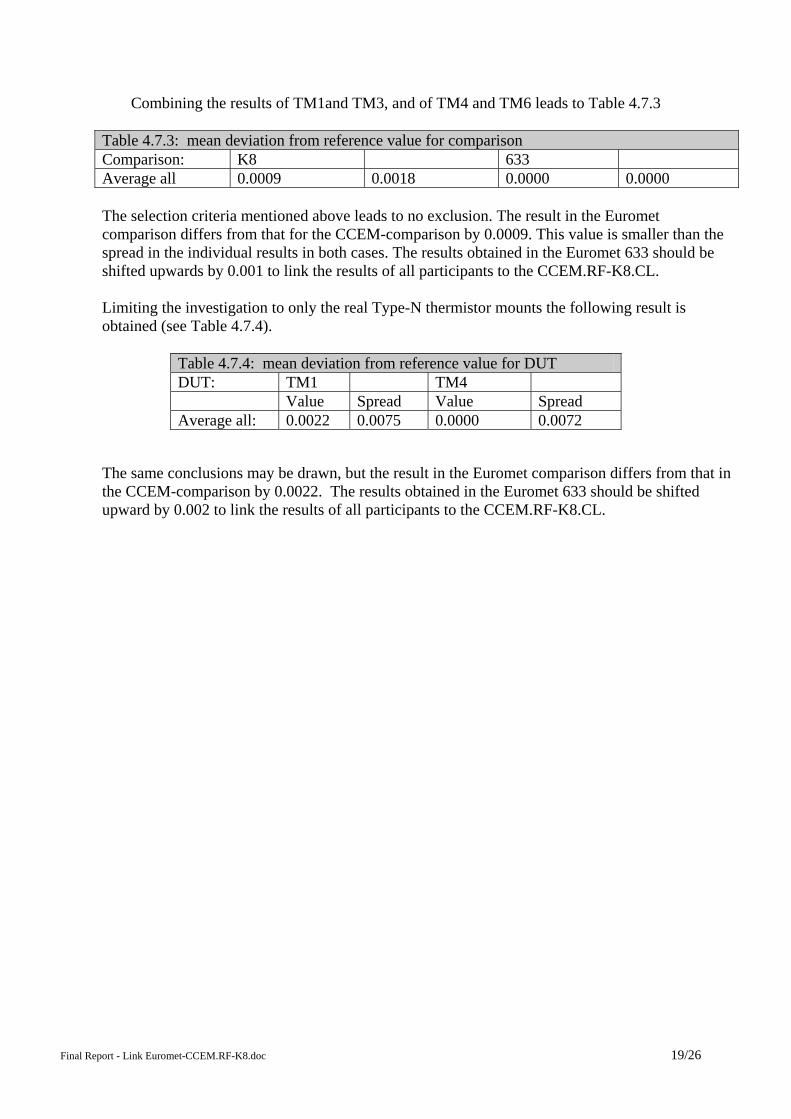
Tabel 4.7.2: Results of Euromet 633 at 15 GHz Laboratory TM4 TM6 Value Unc (k=2) Value Unc (k=2) NPL -0.0008 0.0084 -0.0004 0.006 IEN -0.0071 0.0119 -0.0040 0.0101 VSL 0.0099 0.0127 0.0055 0.0131 NRC -0.0021 0.0098 -0.0011 0.0079 Comparison Value Spread Value Spread Average: 0.0000 0.0072 0.0000 0.0040
Cal.factors at 15 GHz
-0.06
-0.04
-0.02
0
0.02
0.04
0.06
NPL
NPL
IEN
IEN
VSL
VSL
NRC
NRC
Dev
iatio
n fr
om R
ef.v
alue
s
Final Report - Link Euromet-CCEM.RF-K8.doc 19/26
Combining the results of TM1and TM3, and of TM4 and TM6 leads to Table 4.7.3
Table 4.7.3: mean deviation from reference value for comparison Comparison: K8 633 Average all 0.0009 0.0018 0.0000 0.0000 The selection criteria mentioned above leads to no exclusion. The result in the Euromet comparison differs from that for the CCEM-comparison by 0.0009. This value is smaller than the spread in the individual results in both cases. The results obtained in the Euromet 633 should be shifted upwards by 0.001 to link the results of all participants to the CCEM.RF-K8.CL. Limiting the investigation to only the real Type-N thermistor mounts the following result is obtained (see Table 4.7.4).
Table 4.7.4: mean deviation from reference value for DUT DUT: TM1 TM4 Value Spread Value Spread Average all: 0.0022 0.0075 0.0000 0.0072
The same conclusions may be drawn, but the result in the Euromet comparison differs from that in the CCEM-comparison by 0.0022. The results obtained in the Euromet 633 should be shifted upward by 0.002 to link the results of all participants to the CCEM.RF-K8.CL.
Final Report - Link Euromet-CCEM.RF-K8.doc 20/26
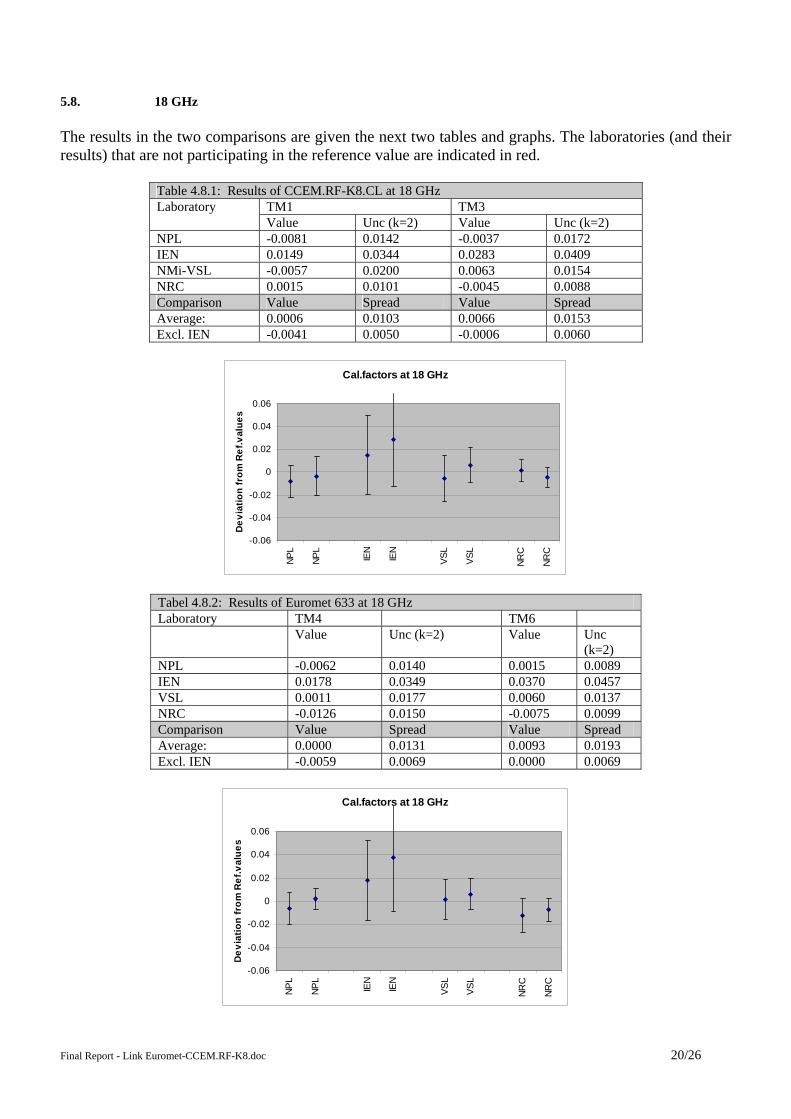
5.8. 18 GHz The results in the two comparisons are given the next two tables and graphs. The laboratories (and their results) that are not participating in the reference value are indicated in red.
Table 4.8.1: Results of CCEM.RF-K8.CL at 18 GHz TM1 TM3 Laboratory Value Unc (k=2) Value Unc (k=2)
NPL -0.0081 0.0142 -0.0037 0.0172 IEN 0.0149 0.0344 0.0283 0.0409 NMi-VSL -0.0057 0.0200 0.0063 0.0154 NRC 0.0015 0.0101 -0.0045 0.0088 Comparison Value Spread Value Spread Average: 0.0006 0.0103 0.0066 0.0153 Excl. IEN -0.0041 0.0050 -0.0006 0.0060
Cal.factors at 18 GHz
-0.06
-0.04
-0.02
0
0.02
0.04
0.06
NPL
NPL
IEN
IEN
VSL
VSL
NRC
NRC
Dev
iatio
n fr
om R
ef.v
alue
s
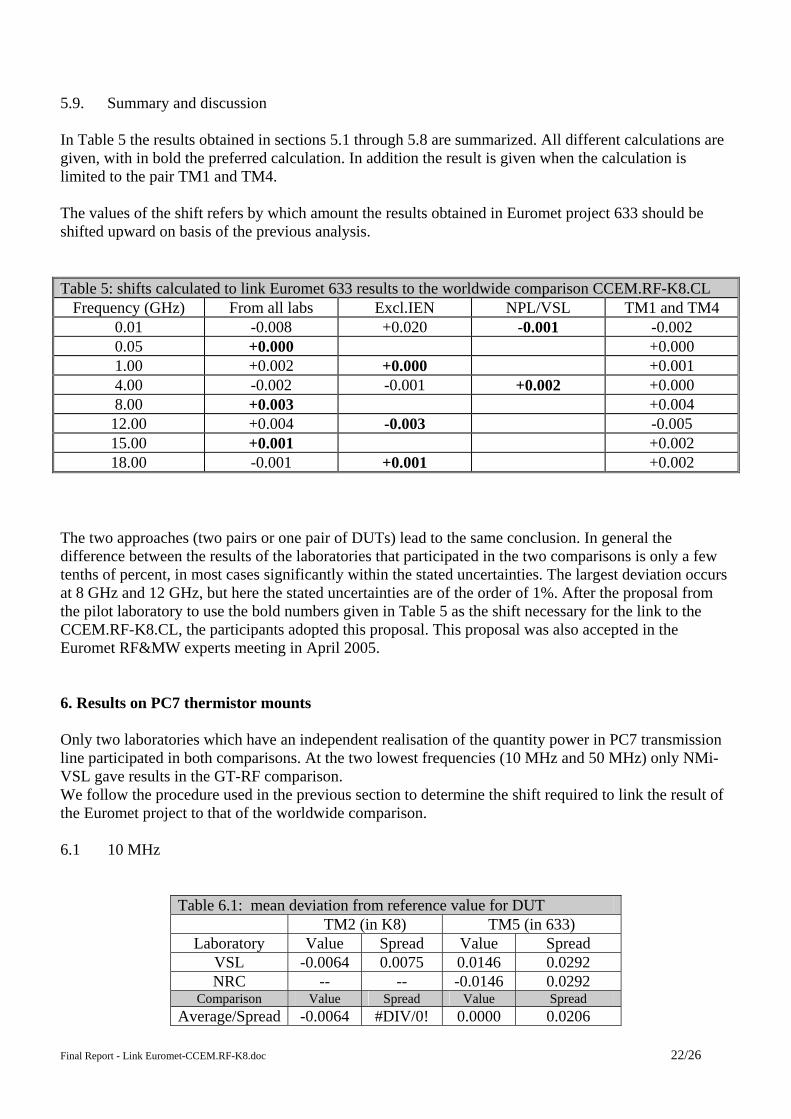
Tabel 4.8.2: Results of Euromet 633 at 18 GHz Laboratory TM4 TM6 Value Unc (k=2) Value Unc
(k=2) NPL -0.0062 0.0140 0.0015 0.0089 IEN 0.0178 0.0349 0.0370 0.0457 VSL 0.0011 0.0177 0.0060 0.0137 NRC -0.0126 0.0150 -0.0075 0.0099 Comparison Value Spread Value Spread Average: 0.0000 0.0131 0.0093 0.0193 Excl. IEN -0.0059 0.0069 0.0000 0.0069
Cal.factors at 18 GHz
-0.06
-0.04
-0.02
0
0.02
0.04
0.06
NPL
NPL
IEN
IEN
VSL
VSL
NRC
NRC
Dev
iatio
n fr
om R
ef.v
alue
s

Final Report - Link Euromet-CCEM.RF-K8.doc 21/26
Combining the results of TM1and TM3, and of TM4 and TM6 leads to Table 4.8.3.
Table 4.8.3: mean deviation from reference value for comparison Comparison: K8 633 Average all 0.0036 0.0042 0.0046 0.0065 Excl.IEN -0.0024 0.0025 -0.0030 0.0042 The selection criteria mentioned above leads to the exclusion of IEN. The result in the Euromet comparison differs from that for the CCEM-comparison by 0.0006. This value is smaller than the spread in the individual results in both cases. The results obtained in the Euromet 633 should be shifted upwards by 0.001 to link the results of all participants to the CCEM.RF-K8.CL. Limiting the investigation to only the real Type-N thermistor mounts the following result is obtained (see Table 4.8.4).
Table 4.8.4: mean deviation from reference value for DUT DUT: TM1 TM4 Value Spread Value Spread Average all: 0.0006 0.0103 0.0000 0.0131 Excl. IEN -0.0041 0.0050 -0.0059 0.0069
The same conclusions may be drawn, but the result in the Euromet comparison differs from that in the CCEM-comparison by 0.0018. The results obtained in the Euromet 633 should be shifted upward by 0.002 to link the results of all participants to the CCEM.RF-K8.CL.
Final Report - Link Euromet-CCEM.RF-K8.doc 22/26
5.9. Summary and discussion In Table 5 the results obtained in sections 5.1 through 5.8 are summarized. All different calculations are given, with in bold the preferred calculation. In addition the result is given when the calculation is limited to the pair TM1 and TM4. The values of the shift refers by which amount the results obtained in Euromet project 633 should be shifted upward on basis of the previous analysis. Table 5: shifts calculated to link Euromet 633 results to the worldwide comparison CCEM.RF-K8.CL
Frequency (GHz) From all labs Excl.IEN NPL/VSL TM1 and TM4 0.01 -0.008 +0.020 -0.001 -0.002 0.05 +0.000 +0.000 1.00 +0.002 +0.000 +0.001 4.00 -0.002 -0.001 +0.002 +0.000 8.00 +0.003 +0.004
12.00 +0.004 -0.003 -0.005 15.00 +0.001 +0.002 18.00 -0.001 +0.001 +0.002
The two approaches (two pairs or one pair of DUTs) lead to the same conclusion. In general the difference between the results of the laboratories that participated in the two comparisons is only a few tenths of percent, in most cases significantly within the stated uncertainties. The largest deviation occurs at 8 GHz and 12 GHz, but here the stated uncertainties are of the order of 1%. After the proposal from the pilot laboratory to use the bold numbers given in Table 5 as the shift necessary for the link to the CCEM.RF-K8.CL, the participants adopted this proposal. This proposal was also accepted in the Euromet RF&MW experts meeting in April 2005. 6. Results on PC7 thermistor mounts Only two laboratories which have an independent realisation of the quantity power in PC7 transmission line participated in both comparisons. At the two lowest frequencies (10 MHz and 50 MHz) only NMi-VSL gave results in the GT-RF comparison. We follow the procedure used in the previous section to determine the shift required to link the result of the Euromet project to that of the worldwide comparison. 6.1 10 MHz
Table 6.1: mean deviation from reference value for DUT TM2 (in K8) TM5 (in 633)
Laboratory Value Spread Value Spread VSL -0.0064 0.0075 0.0146 0.0292 NRC -- -- -0.0146 0.0292
Comparison Value Spread Value Spread Average/Spread -0.0064 #DIV/0! 0.0000 0.0206
Final Report - Link Euromet-CCEM.RF-K8.doc 23/26
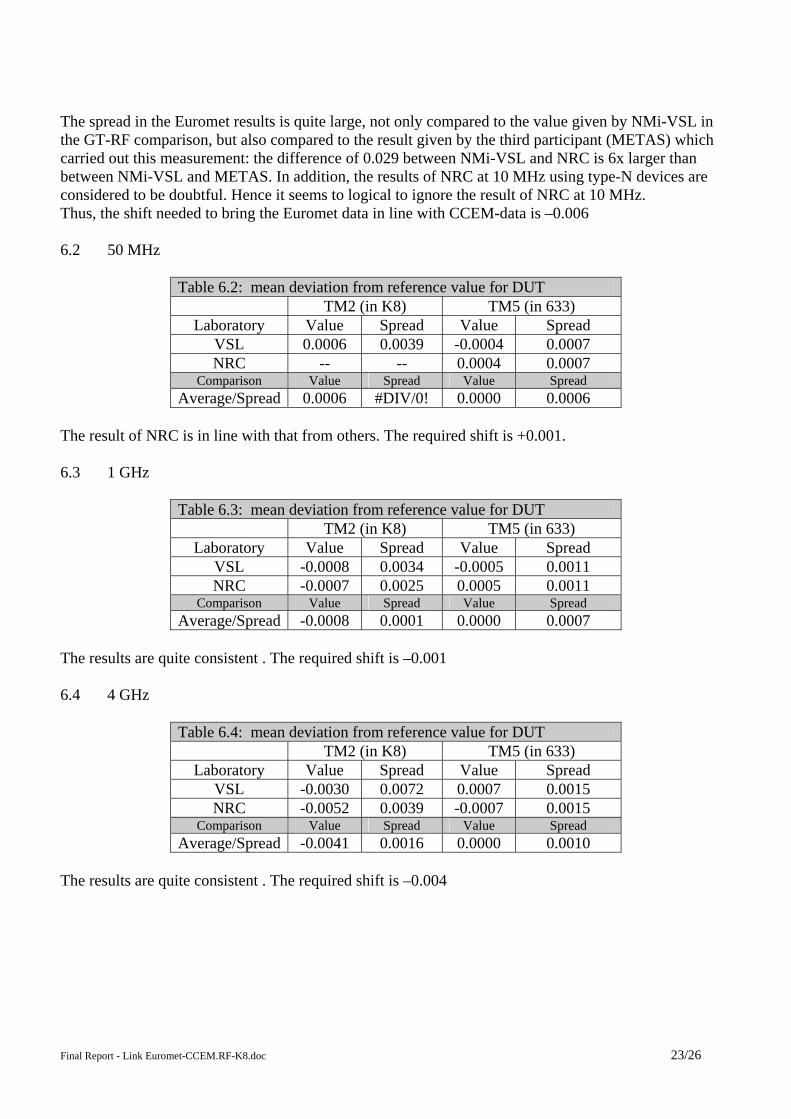
The spread in the Euromet results is quite large, not only compared to the value given by NMi-VSL in the GT-RF comparison, but also compared to the result given by the third participant (METAS) which carried out this measurement: the difference of 0.029 between NMi-VSL and NRC is 6x larger than between NMi-VSL and METAS. In addition, the results of NRC at 10 MHz using type-N devices are considered to be doubtful. Hence it seems to logical to ignore the result of NRC at 10 MHz. Thus, the shift needed to bring the Euromet data in line with CCEM-data is –0.006 6.2 50 MHz
Table 6.2: mean deviation from reference value for DUT
TM2 (in K8) TM5 (in 633) Laboratory Value Spread Value Spread
VSL 0.0006 0.0039 -0.0004 0.0007 NRC -- -- 0.0004 0.0007
Comparison Value Spread Value Spread Average/Spread 0.0006 #DIV/0! 0.0000 0.0006
The result of NRC is in line with that from others. The required shift is +0.001. 6.3 1 GHz
Table 6.3: mean deviation from reference value for DUT
TM2 (in K8) TM5 (in 633) Laboratory Value Spread Value Spread
VSL -0.0008 0.0034 -0.0005 0.0011 NRC -0.0007 0.0025 0.0005 0.0011
Comparison Value Spread Value Spread Average/Spread -0.0008 0.0001 0.0000 0.0007
The results are quite consistent . The required shift is –0.001 6.4 4 GHz
Table 6.4: mean deviation from reference value for DUT
TM2 (in K8) TM5 (in 633) Laboratory Value Spread Value Spread
VSL -0.0030 0.0072 0.0007 0.0015 NRC -0.0052 0.0039 -0.0007 0.0015
Comparison Value Spread Value Spread Average/Spread -0.0041 0.0016 0.0000 0.0010
The results are quite consistent . The required shift is –0.004
Final Report - Link Euromet-CCEM.RF-K8.doc 24/26
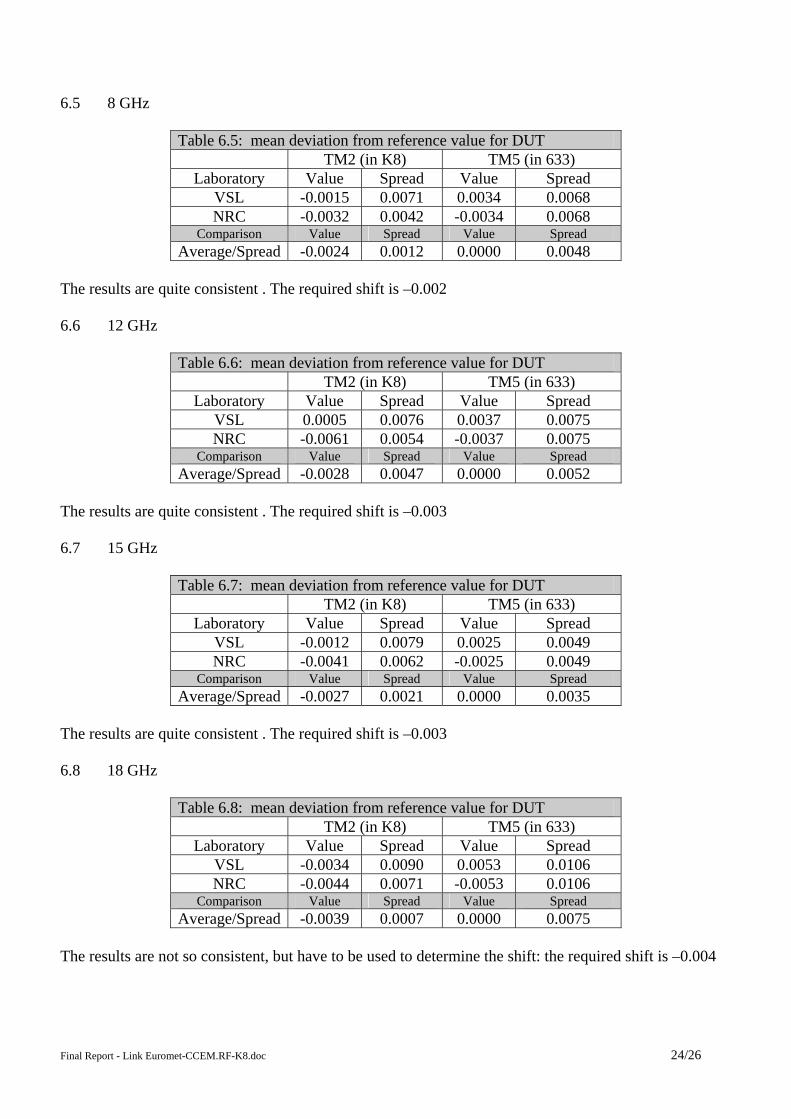
6.5 8 GHz
Table 6.5: mean deviation from reference value for DUT TM2 (in K8) TM5 (in 633)
Laboratory Value Spread Value Spread VSL -0.0015 0.0071 0.0034 0.0068 NRC -0.0032 0.0042 -0.0034 0.0068
Comparison Value Spread Value Spread Average/Spread -0.0024 0.0012 0.0000 0.0048
The results are quite consistent . The required shift is –0.002 6.6 12 GHz
Table 6.6: mean deviation from reference value for DUT
TM2 (in K8) TM5 (in 633) Laboratory Value Spread Value Spread
VSL 0.0005 0.0076 0.0037 0.0075 NRC -0.0061 0.0054 -0.0037 0.0075
Comparison Value Spread Value Spread Average/Spread -0.0028 0.0047 0.0000 0.0052
The results are quite consistent . The required shift is –0.003 6.7 15 GHz
Table 6.7: mean deviation from reference value for DUT
TM2 (in K8) TM5 (in 633) Laboratory Value Spread Value Spread
VSL -0.0012 0.0079 0.0025 0.0049 NRC -0.0041 0.0062 -0.0025 0.0049
Comparison Value Spread Value Spread Average/Spread -0.0027 0.0021 0.0000 0.0035
The results are quite consistent . The required shift is –0.003 6.8 18 GHz
Table 6.8: mean deviation from reference value for DUT
TM2 (in K8) TM5 (in 633) Laboratory Value Spread Value Spread
VSL -0.0034 0.0090 0.0053 0.0106 NRC -0.0044 0.0071 -0.0053 0.0106
Comparison Value Spread Value Spread Average/Spread -0.0039 0.0007 0.0000 0.0075
The results are not so consistent, but have to be used to determine the shift: the required shift is –0.004
Final Report - Link Euromet-CCEM.RF-K8.doc 25/26
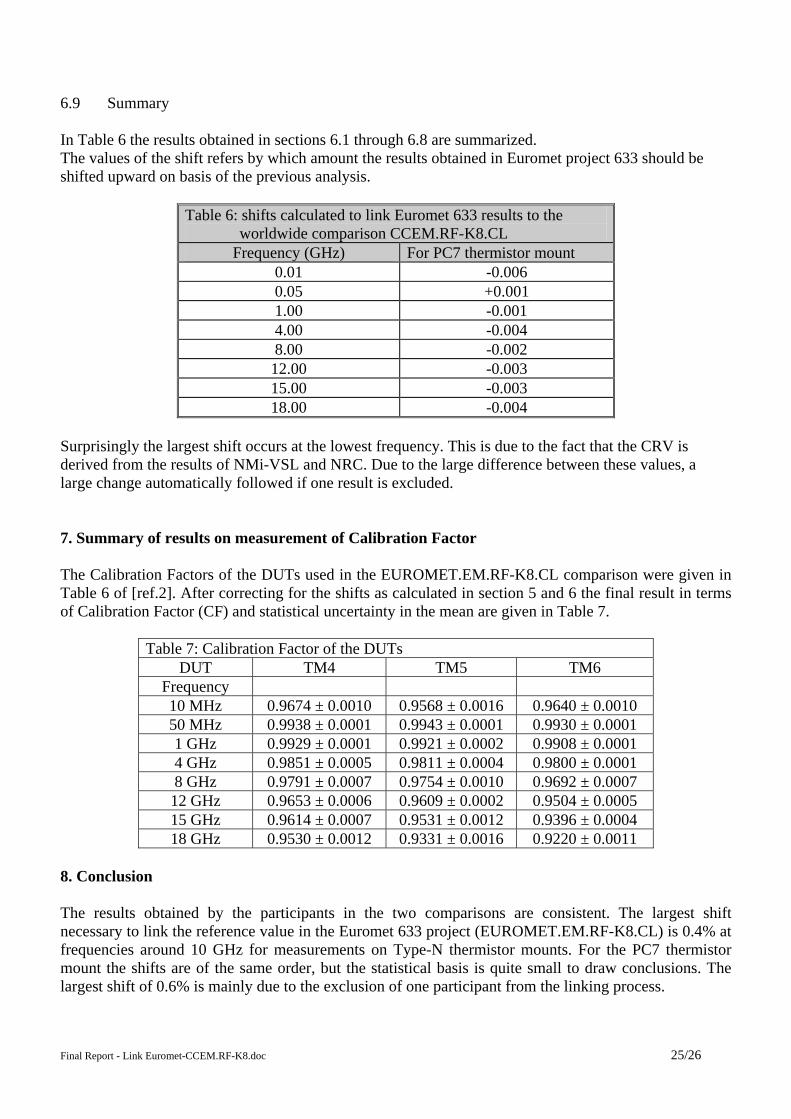
6.9 Summary In Table 6 the results obtained in sections 6.1 through 6.8 are summarized. The values of the shift refers by which amount the results obtained in Euromet project 633 should be shifted upward on basis of the previous analysis.
Table 6: shifts calculated to link Euromet 633 results to the
worldwide comparison CCEM.RF-K8.CL Frequency (GHz) For PC7 thermistor mount
0.01 -0.006 0.05 +0.001 1.00 -0.001 4.00 -0.004 8.00 -0.002
12.00 -0.003 15.00 -0.003 18.00 -0.004
Surprisingly the largest shift occurs at the lowest frequency. This is due to the fact that the CRV is derived from the results of NMi-VSL and NRC. Due to the large difference between these values, a large change automatically followed if one result is excluded. 7. Summary of results on measurement of Calibration Factor The Calibration Factors of the DUTs used in the EUROMET.EM.RF-K8.CL comparison were given in Table 6 of [ref.2]. After correcting for the shifts as calculated in section 5 and 6 the final result in terms of Calibration Factor (CF) and statistical uncertainty in the mean are given in Table 7.
Table 7: Calibration Factor of the DUTs DUT TM4 TM5 TM6
Frequency 10 MHz 0.9674 ± 0.0010 0.9568 ± 0.0016 0.9640 ± 0.0010 50 MHz 0.9938 ± 0.0001 0.9943 ± 0.0001 0.9930 ± 0.0001 1 GHz 0.9929 ± 0.0001 0.9921 ± 0.0002 0.9908 ± 0.0001 4 GHz 0.9851 ± 0.0005 0.9811 ± 0.0004 0.9800 ± 0.0001 8 GHz 0.9791 ± 0.0007 0.9754 ± 0.0010 0.9692 ± 0.0007
12 GHz 0.9653 ± 0.0006 0.9609 ± 0.0002 0.9504 ± 0.0005 15 GHz 0.9614 ± 0.0007 0.9531 ± 0.0012 0.9396 ± 0.0004 18 GHz 0.9530 ± 0.0012 0.9331 ± 0.0016 0.9220 ± 0.0011
8. Conclusion The results obtained by the participants in the two comparisons are consistent. The largest shift necessary to link the reference value in the Euromet 633 project (EUROMET.EM.RF-K8.CL) is 0.4% at frequencies around 10 GHz for measurements on Type-N thermistor mounts. For the PC7 thermistor mount the shifts are of the same order, but the statistical basis is quite small to draw conclusions. The largest shift of 0.6% is mainly due to the exclusion of one participant from the linking process.
Final Report - Link Euromet-CCEM.RF-K8.doc 26/26
9. References
[1] Jan P.M. de Vreede, Final Report: “CCEM.RF-K8.CL COMPARISON - CALIBRATION FACTOR OF THERMISTOR MOUNTS”, May 2005
[2] Jan P.M. de Vreede, Final Report: “EUROMET.EM.RF-K8.CL COMPARISON - CALIBRATION FACTOR OF THERMISTOR MOUNTS September 2006”
[3] J. Randa, "Proposal for KCRV & Degree of Equivalence for GTRF Key Comparisons", Document of the Working Group on radio frequency quantities of the CCEM, GT-RF/2000-12, September 2000.