Embed Size (px)
Citation preview
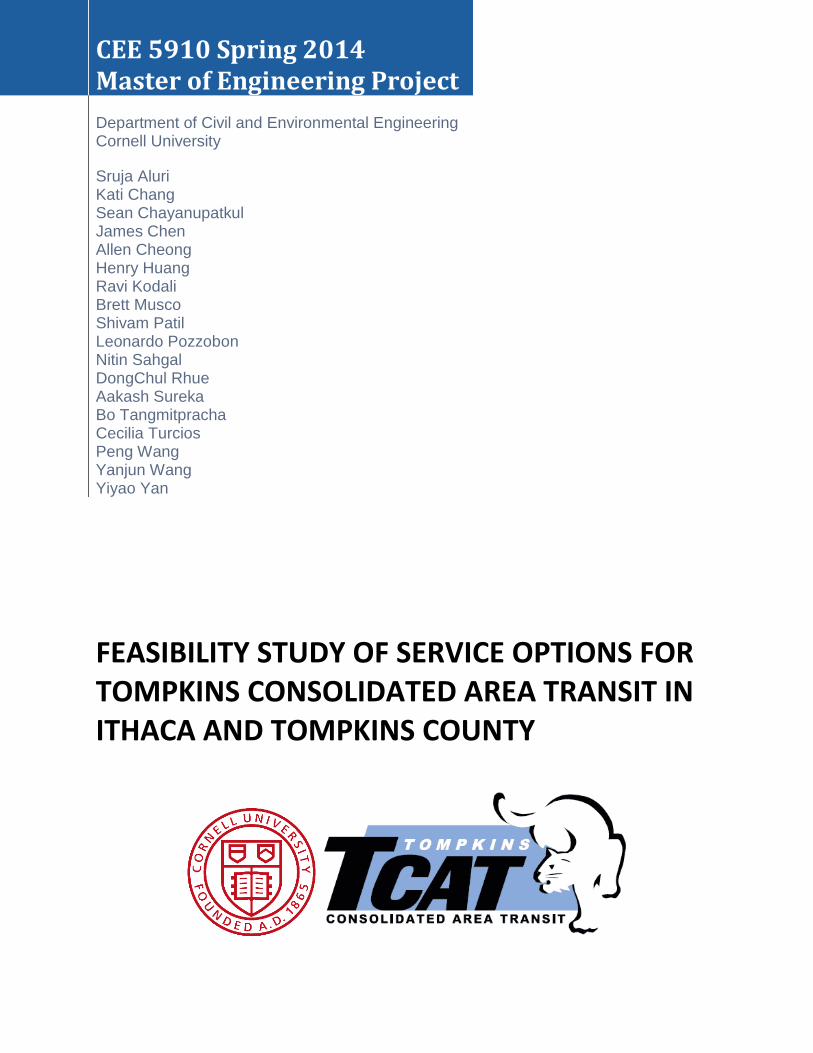
CEE 5910 Spring 2014 Master of Engineering Project
Department of Civil and Environmental Engineering Cornell University
Sruja Aluri Kati Chang Sean Chayanupatkul James Chen Allen Cheong Henry Huang Ravi Kodali Brett Musco Shivam Patil Leonardo Pozzobon Nitin Sahgal DongChul Rhue Aakash Sureka Bo Tangmitpracha Cecilia Turcios Peng Wang Yanjun Wang Yiyao Yan
FEASIBILITY STUDY OF SERVICE OPTIONS FOR TOMPKINS CONSOLIDATED AREA TRANSIT IN ITHACA AND TOMPKINS COUNTY

Executive Summary 1
Feasibility Study of Service Options for Tompkins Consolidated Area Transit in Ithaca and Tompkins County
Executive Summary
In order to improve bus services provided by Tompkins Consolidated Area Transit (TCAT) for
Ithaca and the rest of Tompkins County, problem areas were identified in their existing system.
Our study proposes various techniques which can be used which will allow TCAT to improve its
efficiency, run cost-effective bus routes, reduce emissions into the local environment, and
provide a better customer experience for Ithaca and the surrounding communities. This technical
report focuses on six primary topics: addressing the issues in current TCAT operations,
switching to buses which use modern green technology, implementing a bus route with a higher
level of service, implementing bus rapid transit, improving system capacity with larger
articulated buses, and using simulation to determine optimum setups of bus operations.
In addressing issues with TCAT’s current system, we proposed a morning bus route which will
be more effective than an existing route with low ridership. Direction-bound naming of routes
will remove the ambiguity in many of TCAT’s current route names. In addition, technological
innovations such as Google Transit and HASTUS can be utilized to provide customers with real-
time information on buses and assist TCAT in optimizing its driver assignments, respectively.
The composition of the current bus fleet was also addressed, and new types of bus technology
could be used to improve services. Through a study of various alternative fuel sources for buses,
we have determined that biodiesel may be the best option for TCAT’s fleet in terms of
environmental impact and cost-effectiveness. Additionally, the implementation of articulated
buses, particularly those which run on green technology, can simultaneously improve bus
capacity while reducing emissions.
Infrastructural and network changes can significantly decrease travel time at relatively low costs.
In a study of buses with a high level of service, express routing and reduced dwell time proves to
be an effective method of improving the customer experience in a cost-effective manner. Bus
rapid transit, an innovation which allows buses to operate like a rail network, can be
implemented at a reduced scale to achieve similar results with the use of off-board fare collection
and level-platform boarding.
Assessing the effects of current or proposed services can be made possible with computer
simulations. Using ProModel, this feasibility study assessed the system performance by
simulating the elements of various bus network configurations and identifying optimal cases.
By applying these innovations to the existing TCAT system, the provided bus services can be
dramatically improved and have significant positive benefits for the company, on the local
environment, and the community.
Advisor’s Foreword 2
Feasibility Study of Service Options for Tompkins Consolidated Area Transit in Ithaca and Tompkins County
Advisor’s Foreword
This report summarizes the findings of a one-semester project analyzing the feasibility of
technology and service changes at TCAT in Ithaca and Tompkins County, New York State. The
project was carried out by a team of students from the 1-year Master of Engineering in
Engineering Management program in the School of Civil and Environmental Engineering (CEE)
at Cornell University, and advised by me in my capacity as Senior Lecturer in the School.
The genesis of the project topic comes from an agreement in 2013 with Doug Swarts, service
development manager at TCAT, to offer a research project on public transportation and TCAT in
particular in our engineering management program. M.Eng teams have in the past studied a
range of sustainability related projects from renewable energy systems and alternative fuels for
transportation to green building, and public transportation fits very well within this range of
possible topics. Also, the mission of the M.Eng in engineering management projects is to mix
engineering and management, and technology with the contemporary context for pursuing
environmental protection and sustainability, so the projects that I advise are carried out with that
objective in mind.
The students join the project not by creating the topic themselves but by choosing from among
several projects that are offered by CEE faculty each year. Once the project starts, however, the
student team quickly enters into a leadership role and the advisor steps back into the position of
explaining the broad parameters of the project and providing feedback and technical insight. It is
up to the team to take the syllabus that is provided to them at the beginning of the semester and
create from it a proposal and scope of work that is approved by the advisor and partner
organization (TCAT in this case), as well as their own team management structure. Once the
proposal is approved, the team carries out the work and delivers both a final oral presentation,
which took place at the TCAT offices on May 9, 2014, and the final report that follows. Since
the organization and content of the report is the responsibility of the team (with input from
myself advisor), feedback and comments on the project compiled by myself and Doug in a post-
project closeout meeting appear in Appendix B, and the interested reader is referred to these
comments in addition to the findings within the report.
In closing, I would like to thank TCAT and Doug for providing this opportunity. While their
input is much appreciated, the contents of the report do not reflect the opinions of TCAT, Doug
Swarts, or Cornell University, and responsibility for errors rests with the team and myself as
advisor.
Respectfully submitted,
Francis M Vanek, PhD
Senior Lecturer and Research Associate
June 13, 2014
Table of Contents 3
Feasibility Study of Service Options for Tompkins Consolidated Area Transit in Ithaca and Tompkins County
Table of Contents
Executive Summary ........................................................................................................................ 1
Advisor’s Foreword ........................................................................................................................ 2
Table of Contents ............................................................................................................................ 3
List of Figures and Tables............................................................................................................. 10
List of Abbreviations .................................................................................................................... 13
I. Introduction ............................................................................................................................... 14
Motivation ............................................................................................................................... 14
Scope of the Project ................................................................................................................ 14
Service Improvements ...................................................................................................... 14
Service Expansion ............................................................................................................. 15
Limitations of the Project Scope ....................................................................................... 15
Feasibility .................................................................................................................... 15
Environmental Impact ................................................................................................. 15
Other Factors ............................................................................................................... 15
Good Faith .................................................................................................................. 15
Assumptions ................................................................................................................ 15
Team Structure ........................................................................................................................ 15
Team Members ................................................................................................................. 16
Sub-Teams ........................................................................................................................ 20
Current System & System Improvements................................................................... 20
Environmentally-Friendly Buses ................................................................................ 20
Buses with a High Level of Service ............................................................................ 20
Bus Rapid Transit ....................................................................................................... 21
Articulated Buses ........................................................................................................ 21
Simulation ................................................................................................................... 21
Team Liaisons ............................................................................................................. 21
Metrics for Use in the Project ................................................................................................. 22
TCAT ...................................................................................................................................... 22
History............................................................................................................................... 22
Bus Routes and Systems ................................................................................................... 22
Recent Improvements in Routes, Buses, Service Hours ................................................... 24
Future Plans ...................................................................................................................... 25
Table of Contents 4
Feasibility Study of Service Options for Tompkins Consolidated Area Transit in Ithaca and Tompkins County
Data ......................................................................................................................................... 26
Timeline .................................................................................................................................. 26
II. TCAT Current System Improvements ..................................................................................... 28
Introduction ............................................................................................................................. 28
Declining Route 13 Ridership and High Morning Demand ................................................... 28
Declining Route 13 Ridership ........................................................................................... 28
High Morning Demand ..................................................................................................... 29
Proposed Solution: High Performance Campus Route (Route 84) ................................... 31
Lack of Real-Time Information for Passengers ...................................................................... 34
Proposed Solution: Incorporate into Google Transit ........................................................ 37
Technical Functioning of Google Transit ................................................................... 39
Ambiguous Naming System ................................................................................................... 41
Proposed Solution: Direction-bound Naming System ...................................................... 41
Scheduling Buses and Drivers ................................................................................................ 43
Proposed Solution: HASTUS ........................................................................................... 44
Conclusion .............................................................................................................................. 46
III. Environmentally-Friendly Buses ............................................................................................ 47
Introduction ............................................................................................................................. 47
Motivation ......................................................................................................................... 47
Pollutants........................................................................................................................... 47
Fuels .................................................................................................................................. 48
Parameters for Evaluation ................................................................................................. 48
Bus Types................................................................................................................................ 49
Electric Buses.................................................................................................................... 49
Types of Electric Buses in Use ................................................................................... 50
Cost and Feasibility..................................................................................................... 50
Environmental Impact of Electric Buses .................................................................... 50
Future Prospects .......................................................................................................... 51
Hybrid Buses ..................................................................................................................... 51
Technology ................................................................................................................. 51
Adoption ..................................................................................................................... 51
Benefits ....................................................................................................................... 52
Cons ............................................................................................................................ 52
In the Future ................................................................................................................ 52
Table of Contents 5
Feasibility Study of Service Options for Tompkins Consolidated Area Transit in Ithaca and Tompkins County
Hydrogen Buses ................................................................................................................ 52
Current Trends in the Technology .............................................................................. 53
Cost ............................................................................................................................. 53
Advantages and Limitations ....................................................................................... 54
Future of Hydrogen Buses .......................................................................................... 54
Emission and Cost Analysis of Alternate Fuel Type Buses ................................................... 54
Cost Analysis .................................................................................................................... 55
Emission Analysis ............................................................................................................. 57
Route 30: Emission and Cost Analysis for Alternate Fuel Type Buses ........................... 59
Monte Carlo Simulation .......................................................................................................... 61
Vehicle Substitution ................................................................................................................ 62
Conclusion .............................................................................................................................. 64
IV. Buses with a High Level of Service ....................................................................................... 65
Introduction ............................................................................................................................. 65
Background Information ................................................................................................... 65
Case Studies ...................................................................................................................... 66
BusPlus in Albany, New York .................................................................................... 66
Lundalänken in Lund, Sweden ................................................................................... 68
Differences with Bus Rapid Transit .................................................................................. 69
Area of Focus .......................................................................................................................... 69
Express Routing ................................................................................................................ 70
Rear Door Exiting ............................................................................................................. 70
Branding ............................................................................................................................ 70
Current Routes ........................................................................................................................ 71
Route 30 ............................................................................................................................ 71
Route 15 ............................................................................................................................ 72
Proposed Route and Service ................................................................................................... 72
Ridership Calculations ...................................................................................................... 73
Time Savings .................................................................................................................... 75
Monte Carlo Simulation .............................................................................................. 75
Branding ............................................................................................................................ 76
Cost Analysis .................................................................................................................... 77
Benefits ............................................................................................................................. 78
Environmental Impact ................................................................................................. 78
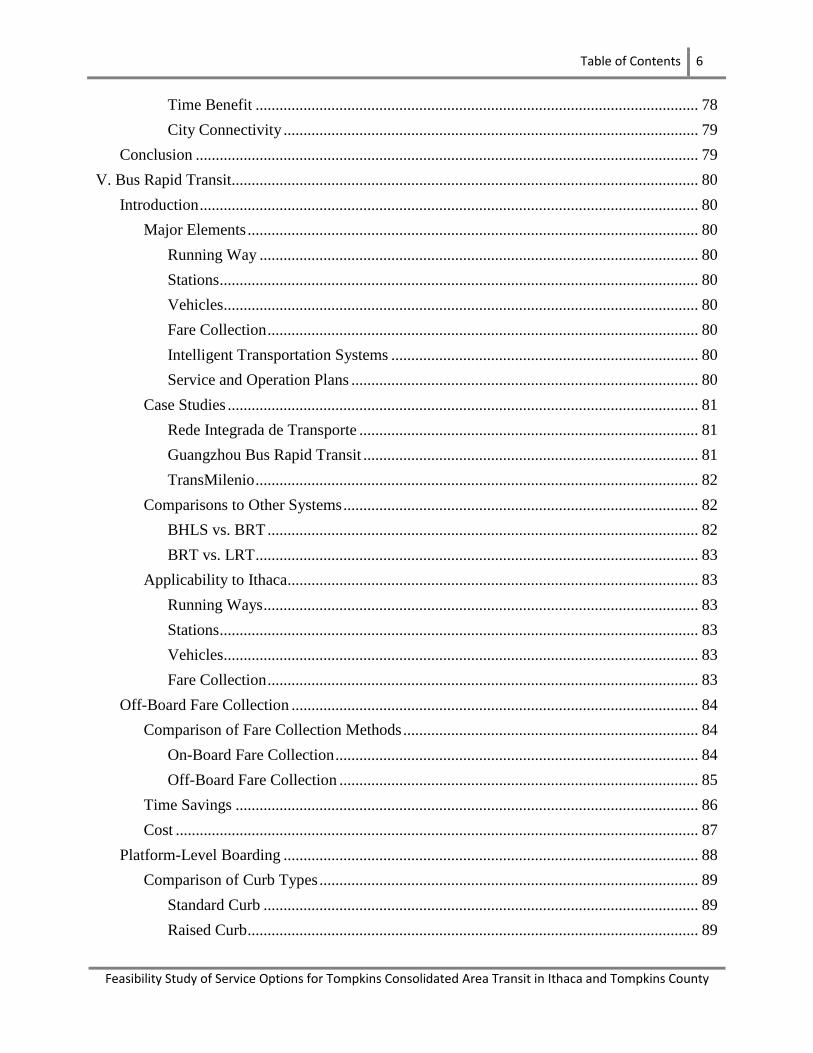
Table of Contents 6
Feasibility Study of Service Options for Tompkins Consolidated Area Transit in Ithaca and Tompkins County
Time Benefit ............................................................................................................... 78
City Connectivity ........................................................................................................ 79
Conclusion .............................................................................................................................. 79
V. Bus Rapid Transit..................................................................................................................... 80
Introduction ............................................................................................................................. 80
Major Elements ................................................................................................................. 80
Running Way .............................................................................................................. 80
Stations ........................................................................................................................ 80
Vehicles....................................................................................................................... 80
Fare Collection ............................................................................................................ 80
Intelligent Transportation Systems ............................................................................. 80
Service and Operation Plans ....................................................................................... 80
Case Studies ...................................................................................................................... 81
Rede Integrada de Transporte ..................................................................................... 81
Guangzhou Bus Rapid Transit .................................................................................... 81
TransMilenio ............................................................................................................... 82
Comparisons to Other Systems ......................................................................................... 82
BHLS vs. BRT ............................................................................................................ 82
BRT vs. LRT ............................................................................................................... 83
Applicability to Ithaca....................................................................................................... 83
Running Ways ............................................................................................................. 83
Stations ........................................................................................................................ 83
Vehicles....................................................................................................................... 83
Fare Collection ............................................................................................................ 83
Off-Board Fare Collection ...................................................................................................... 84
Comparison of Fare Collection Methods .......................................................................... 84
On-Board Fare Collection ........................................................................................... 84
Off-Board Fare Collection .......................................................................................... 85
Time Savings .................................................................................................................... 86
Cost ................................................................................................................................... 87
Platform-Level Boarding ........................................................................................................ 88
Comparison of Curb Types ............................................................................................... 89
Standard Curb ............................................................................................................. 89
Raised Curb ................................................................................................................. 89
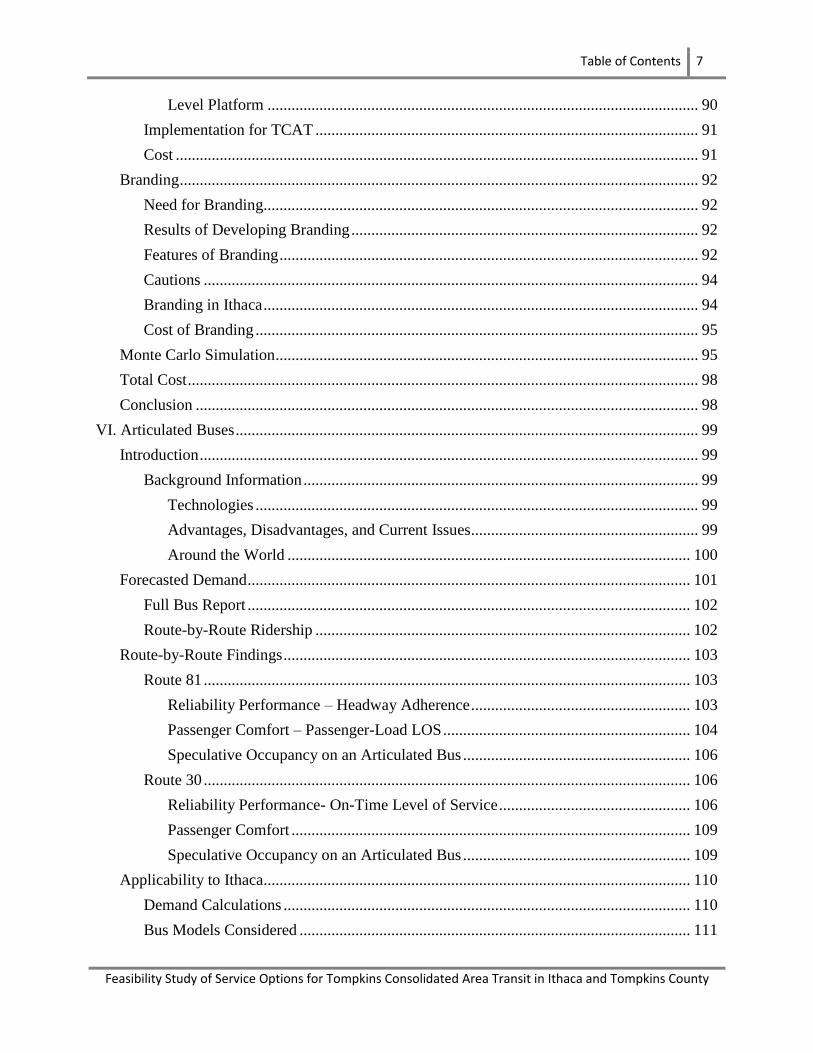
Table of Contents 7
Feasibility Study of Service Options for Tompkins Consolidated Area Transit in Ithaca and Tompkins County
Level Platform ............................................................................................................ 90
Implementation for TCAT ................................................................................................ 91
Cost ................................................................................................................................... 91
Branding .................................................................................................................................. 92
Need for Branding............................................................................................................. 92
Results of Developing Branding ....................................................................................... 92
Features of Branding ......................................................................................................... 92
Cautions ............................................................................................................................ 94
Branding in Ithaca ............................................................................................................. 94
Cost of Branding ............................................................................................................... 95
Monte Carlo Simulation .......................................................................................................... 95
Total Cost ................................................................................................................................ 98
Conclusion .............................................................................................................................. 98
VI. Articulated Buses .................................................................................................................... 99
Introduction ............................................................................................................................. 99
Background Information ................................................................................................... 99
Technologies ............................................................................................................... 99
Advantages, Disadvantages, and Current Issues......................................................... 99
Around the World ..................................................................................................... 100
Forecasted Demand ............................................................................................................... 101
Full Bus Report ............................................................................................................... 102
Route-by-Route Ridership .............................................................................................. 102
Route-by-Route Findings ...................................................................................................... 103
Route 81 .......................................................................................................................... 103
Reliability Performance – Headway Adherence ....................................................... 103
Passenger Comfort – Passenger-Load LOS .............................................................. 104
Speculative Occupancy on an Articulated Bus ......................................................... 106
Route 30 .......................................................................................................................... 106
Reliability Performance- On-Time Level of Service ................................................ 106
Passenger Comfort .................................................................................................... 109
Speculative Occupancy on an Articulated Bus ......................................................... 109
Applicability to Ithaca........................................................................................................... 110
Demand Calculations ...................................................................................................... 110
Bus Models Considered .................................................................................................. 111

Table of Contents 8
Feasibility Study of Service Options for Tompkins Consolidated Area Transit in Ithaca and Tompkins County
Economic Analysis ............................................................................................................... 114
Environmental Considerations .............................................................................................. 117
Conclusion ............................................................................................................................ 117
VII. Simulation ........................................................................................................................... 119
Introduction ........................................................................................................................... 119
Background Information ................................................................................................. 119
Comparison of Software ................................................................................................. 119
Why ProModel? ........................................................................................................ 120
Assumptions .......................................................................................................................... 120
Model .................................................................................................................................... 122
Elements .......................................................................................................................... 122
Entities ...................................................................................................................... 122
Resources .................................................................................................................. 122
Locations ................................................................................................................... 122
Variables ................................................................................................................... 122
Processing ................................................................................................................. 122
Arrivals ..................................................................................................................... 122
Incorporated Simulation Elements ............................................................................ 123
Simulation Logic - Algorithm ......................................................................................... 123
Arrivals Distribution ....................................................................................................... 124
Fitting Distributions .................................................................................................. 125
Limitations ...................................................................................................................... 125
Results ................................................................................................................................... 126
Case 1 – Two Buses per Hour......................................................................................... 126
Case 2 – Three Buses per Hour....................................................................................... 127
Case 3 – Four Buses per Hour ........................................................................................ 127
Comparison ..................................................................................................................... 128
Conclusion ............................................................................................................................ 129
VIII. Conclusion ......................................................................................................................... 130
Future Studies ....................................................................................................................... 130
References ................................................................................................................................... 131
Appendix ..................................................................................................................................... 134
Literature Review of Unconsidered Service Options ........................................................... 134
Light Rail Transit ............................................................................................................ 134
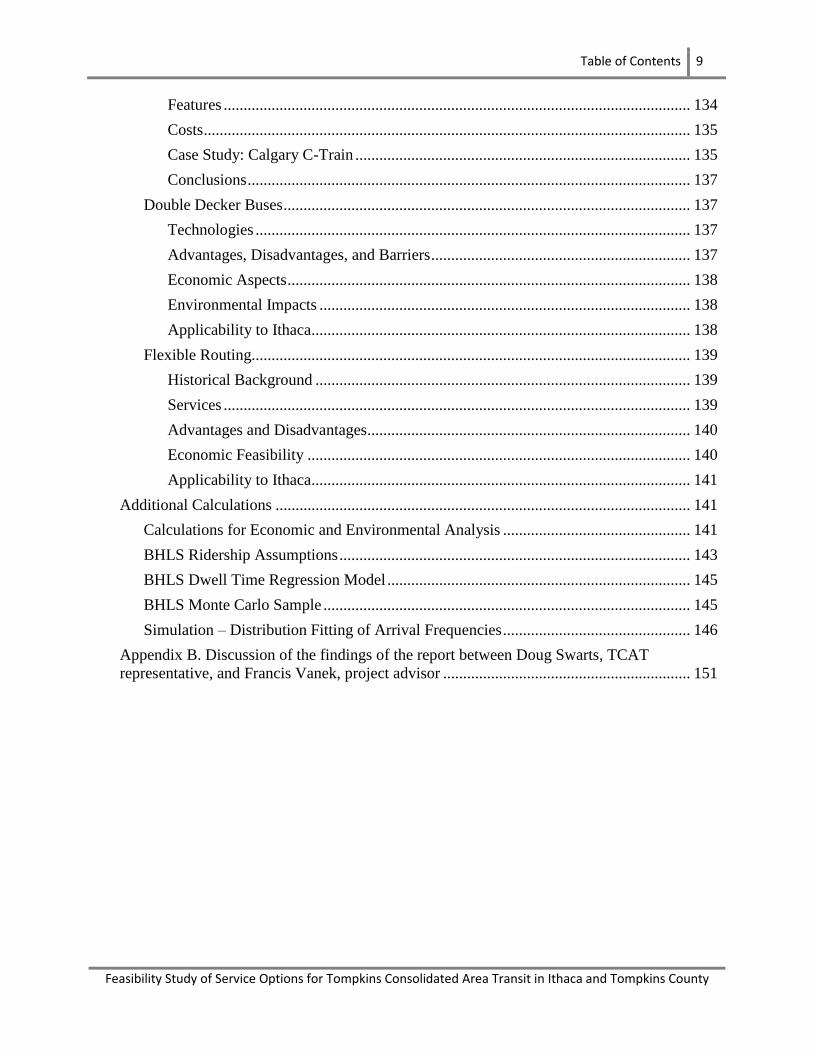
Table of Contents 9
Feasibility Study of Service Options for Tompkins Consolidated Area Transit in Ithaca and Tompkins County
Features ..................................................................................................................... 134
Costs .......................................................................................................................... 135
Case Study: Calgary C-Train .................................................................................... 135
Conclusions ............................................................................................................... 137
Double Decker Buses ...................................................................................................... 137
Technologies ............................................................................................................. 137
Advantages, Disadvantages, and Barriers ................................................................. 137
Economic Aspects ..................................................................................................... 138
Environmental Impacts ............................................................................................. 138
Applicability to Ithaca............................................................................................... 138
Flexible Routing.............................................................................................................. 139
Historical Background .............................................................................................. 139
Services ..................................................................................................................... 139
Advantages and Disadvantages ................................................................................. 140
Economic Feasibility ................................................................................................ 140
Applicability to Ithaca............................................................................................... 141
Additional Calculations ........................................................................................................ 141
Calculations for Economic and Environmental Analysis ............................................... 141
BHLS Ridership Assumptions ........................................................................................ 143
BHLS Dwell Time Regression Model ............................................................................ 145
BHLS Monte Carlo Sample ............................................................................................ 145
Simulation – Distribution Fitting of Arrival Frequencies ............................................... 146
Appendix B. Discussion of the findings of the report between Doug Swarts, TCAT
representative, and Francis Vanek, project advisor .............................................................. 151

List of Figures and Tables 10
Feasibility Study of Service Options for Tompkins Consolidated Area Transit in Ithaca and Tompkins County
List of Figures and Tables
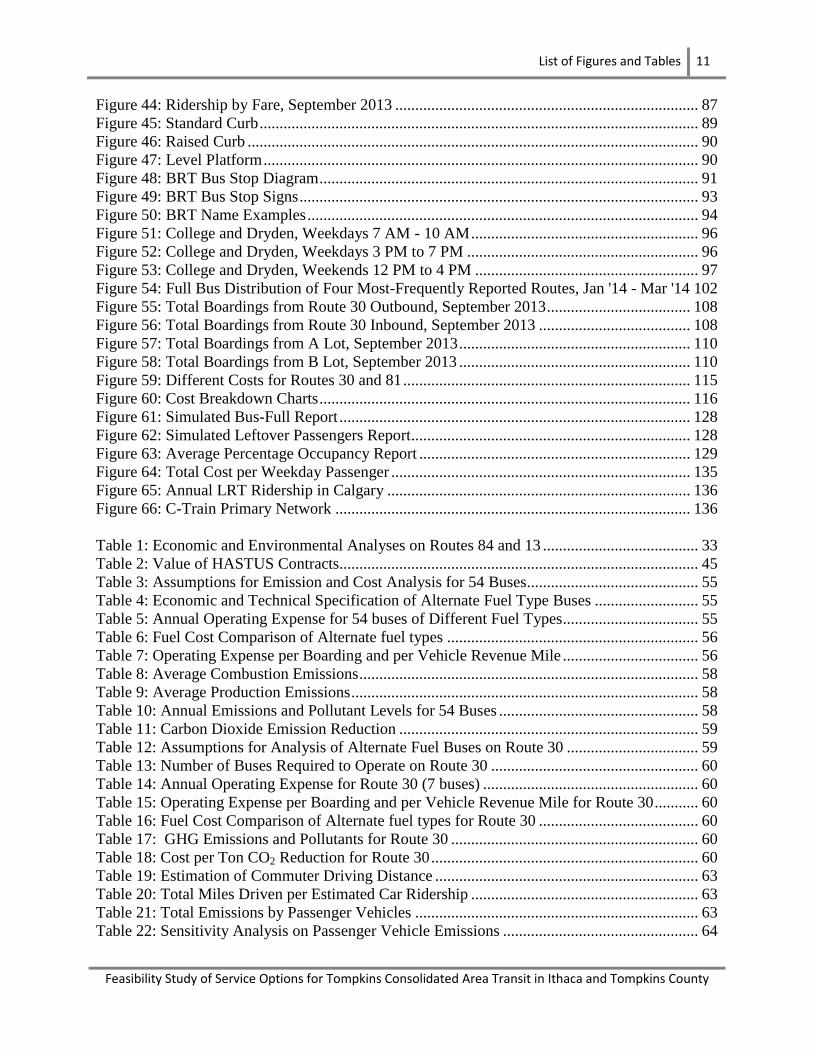
Figure 1: Ridership by Route Type, 2002-2012 ........................................................................... 23 Figure 2: Map of Service Zones .................................................................................................... 24 Figure 3: Declining Ridership for Route 13, 2011-2013 .............................................................. 29 Figure 4: Routes Sorted by Ridership Gain, 2010-2012 ............................................................... 30 Figure 5: Morning Boardings (8 AM - 11 AM) Denied per Weekday ......................................... 31
Figure 6: Proposed New Campus Route - "Route 84" .................................................................. 32 Figure 7: Hourly Ridership Comparison for Routes 84 and 13 .................................................... 33 Figure 8: Screenshot of TCAT Website........................................................................................ 35 Figure 9: Screenshot of Route 30 Bus Schedule ........................................................................... 35 Figure 10: Bus Arrivals at Balch Bus Stop Using the Stops Tab ................................................. 36
Figure 11: Trip Planner ................................................................................................................. 36
Figure 12: Ride14850 ................................................................................................................... 37 Figure 13: Change in Overall Satisfaction with Public Transit .................................................... 38 Figure 14: Google Maps - Trip Breakdown .................................................................................. 38
Figure 15: Google Map - Map View............................................................................................. 39 Figure 16: Comparison of Times by Different Routes ................................................................. 39
Figure 17: Processing of Information in Google Transit .............................................................. 39 Figure 18: Example GTFS Feed with Route Information ............................................................ 40 Figure 19: Example GTFS Real-Time Alert Feed ........................................................................ 40 Figure 20: Route 20 and Route 30 with Inbound and Outbound Naming .................................... 41 Figure 21: Route 20 and Route 30 with Direction-Bound Naming .............................................. 42 Figure 22: HASTUS Work Calendar and Schedules .................................................................... 45
Figure 23: Annual Operating Expense per Fuel Type of Bus Fleet .............................................. 56
Figure 24: Percentage Cost Breakdown of Alternate Fuel Type Buses for Entire Fleet .............. 57 Figure 25: Annual Emission and Pollutant Comparison of Different Fuel Types ........................ 58 Figure 26: Cost per Ton CO2 Reduction ....................................................................................... 59
Figure 27: Simulation Result for Hybrid Buses ............................................................................ 61 Figure 28: Simulation Result for Hydrogen Buses ....................................................................... 61
Figure 29: Simulation Result for CNG Buses............................................................................... 62 Figure 30: Simulation Result for Biodiesel Buses ........................................................................ 62
Figure 31: Annual Boardings per TCAT Stop .............................................................................. 65 Figure 32: Proportions of Fare Type Use ..................................................................................... 66 Figure 33: Distinctive Branding of a BusPlus Stop ...................................................................... 67 Figure 34: Lundalanken Layout and Extension to City Periphery ............................................... 68 Figure 35: Rear Door Exiting in Portland, OR ............................................................................. 70
Figure 36: Route 30 Map .............................................................................................................. 71 Figure 37: Route 15 Map .............................................................................................................. 72
Figure 38: Proposed BHLS Route ................................................................................................ 73 Figure 39: BRT Lanes in Guangzhou ........................................................................................... 81 Figure 40: TransMilenio Image and System Map ........................................................................ 82 Figure 41: Fare Collection Types ................................................................................................. 84 Figure 42: Example Off-Board Fare Collection ........................................................................... 85 Figure 43: Example BRT Stop in Collegetown ............................................................................ 86
List of Figures and Tables 11
Feasibility Study of Service Options for Tompkins Consolidated Area Transit in Ithaca and Tompkins County
Figure 44: Ridership by Fare, September 2013 ............................................................................ 87
Figure 45: Standard Curb .............................................................................................................. 89 Figure 46: Raised Curb ................................................................................................................. 90 Figure 47: Level Platform ............................................................................................................. 90
Figure 48: BRT Bus Stop Diagram ............................................................................................... 91 Figure 49: BRT Bus Stop Signs .................................................................................................... 93 Figure 50: BRT Name Examples .................................................................................................. 94 Figure 51: College and Dryden, Weekdays 7 AM - 10 AM ......................................................... 96 Figure 52: College and Dryden, Weekdays 3 PM to 7 PM .......................................................... 96
Figure 53: College and Dryden, Weekends 12 PM to 4 PM ........................................................ 97 Figure 54: Full Bus Distribution of Four Most-Frequently Reported Routes, Jan '14 - Mar '14 102 Figure 55: Total Boardings from Route 30 Outbound, September 2013 .................................... 108 Figure 56: Total Boardings from Route 30 Inbound, September 2013 ...................................... 108
Figure 57: Total Boardings from A Lot, September 2013 .......................................................... 110 Figure 58: Total Boardings from B Lot, September 2013 .......................................................... 110
Figure 59: Different Costs for Routes 30 and 81 ........................................................................ 115 Figure 60: Cost Breakdown Charts ............................................................................................. 116
Figure 61: Simulated Bus-Full Report ........................................................................................ 128 Figure 62: Simulated Leftover Passengers Report...................................................................... 128 Figure 63: Average Percentage Occupancy Report .................................................................... 129
Figure 64: Total Cost per Weekday Passenger ........................................................................... 135 Figure 65: Annual LRT Ridership in Calgary ............................................................................ 136
Figure 66: C-Train Primary Network ......................................................................................... 136
Table 1: Economic and Environmental Analyses on Routes 84 and 13 ....................................... 33
Table 2: Value of HASTUS Contracts.......................................................................................... 45
Table 3: Assumptions for Emission and Cost Analysis for 54 Buses........................................... 55 Table 4: Economic and Technical Specification of Alternate Fuel Type Buses .......................... 55 Table 5: Annual Operating Expense for 54 buses of Different Fuel Types.................................. 55
Table 6: Fuel Cost Comparison of Alternate fuel types ............................................................... 56 Table 7: Operating Expense per Boarding and per Vehicle Revenue Mile .................................. 56
Table 8: Average Combustion Emissions ..................................................................................... 58 Table 9: Average Production Emissions ....................................................................................... 58
Table 10: Annual Emissions and Pollutant Levels for 54 Buses .................................................. 58 Table 11: Carbon Dioxide Emission Reduction ........................................................................... 59 Table 12: Assumptions for Analysis of Alternate Fuel Buses on Route 30 ................................. 59 Table 13: Number of Buses Required to Operate on Route 30 .................................................... 60 Table 14: Annual Operating Expense for Route 30 (7 buses) ...................................................... 60
Table 15: Operating Expense per Boarding and per Vehicle Revenue Mile for Route 30 ........... 60 Table 16: Fuel Cost Comparison of Alternate fuel types for Route 30 ........................................ 60
Table 17: GHG Emissions and Pollutants for Route 30 .............................................................. 60 Table 18: Cost per Ton CO2 Reduction for Route 30 ................................................................... 60 Table 19: Estimation of Commuter Driving Distance .................................................................. 63 Table 20: Total Miles Driven per Estimated Car Ridership ......................................................... 63 Table 21: Total Emissions by Passenger Vehicles ....................................................................... 63 Table 22: Sensitivity Analysis on Passenger Vehicle Emissions ................................................. 64
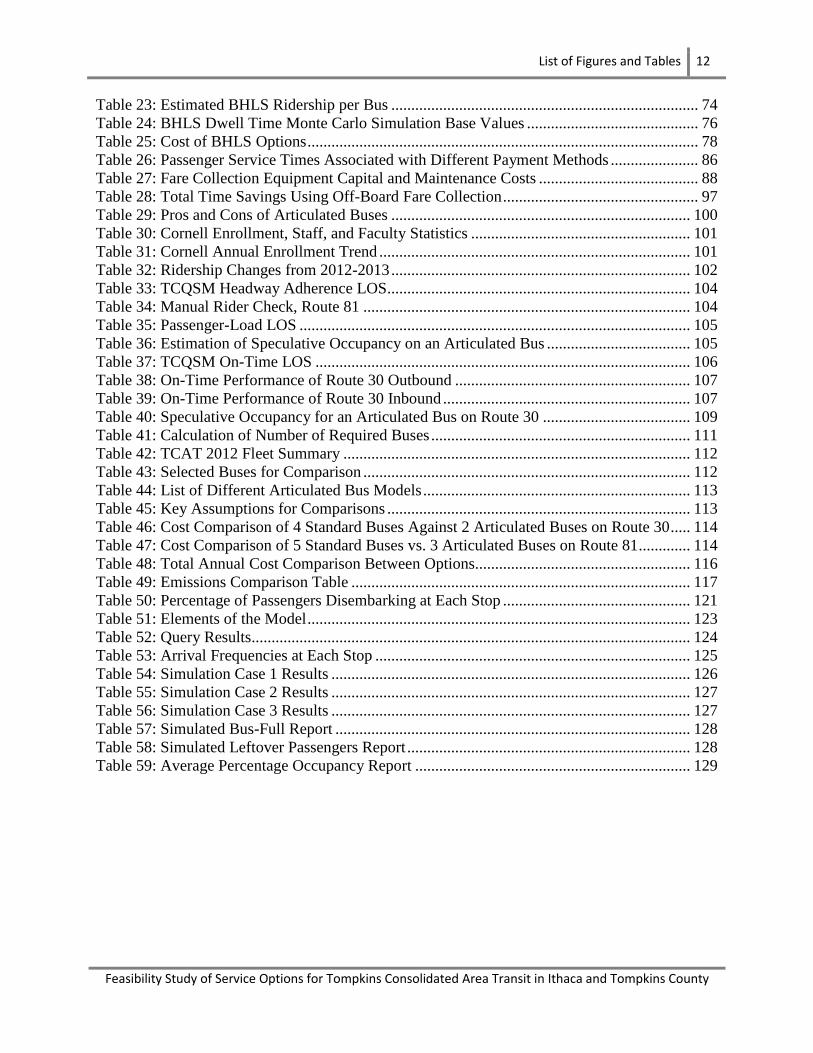
List of Figures and Tables 12
Feasibility Study of Service Options for Tompkins Consolidated Area Transit in Ithaca and Tompkins County
Table 23: Estimated BHLS Ridership per Bus ............................................................................. 74
Table 24: BHLS Dwell Time Monte Carlo Simulation Base Values ........................................... 76 Table 25: Cost of BHLS Options .................................................................................................. 78 Table 26: Passenger Service Times Associated with Different Payment Methods ...................... 86
Table 27: Fare Collection Equipment Capital and Maintenance Costs ........................................ 88 Table 28: Total Time Savings Using Off-Board Fare Collection ................................................. 97 Table 29: Pros and Cons of Articulated Buses ........................................................................... 100 Table 30: Cornell Enrollment, Staff, and Faculty Statistics ....................................................... 101 Table 31: Cornell Annual Enrollment Trend .............................................................................. 101
Table 32: Ridership Changes from 2012-2013 ........................................................................... 102 Table 33: TCQSM Headway Adherence LOS............................................................................ 104 Table 34: Manual Rider Check, Route 81 .................................................................................. 104 Table 35: Passenger-Load LOS .................................................................................................. 105
Table 36: Estimation of Speculative Occupancy on an Articulated Bus .................................... 105 Table 37: TCQSM On-Time LOS .............................................................................................. 106
Table 38: On-Time Performance of Route 30 Outbound ........................................................... 107 Table 39: On-Time Performance of Route 30 Inbound .............................................................. 107
Table 40: Speculative Occupancy for an Articulated Bus on Route 30 ..................................... 109 Table 41: Calculation of Number of Required Buses ................................................................. 111 Table 42: TCAT 2012 Fleet Summary ....................................................................................... 112
Table 43: Selected Buses for Comparison .................................................................................. 112 Table 44: List of Different Articulated Bus Models ................................................................... 113
Table 45: Key Assumptions for Comparisons ............................................................................ 113 Table 46: Cost Comparison of 4 Standard Buses Against 2 Articulated Buses on Route 30 ..... 114 Table 47: Cost Comparison of 5 Standard Buses vs. 3 Articulated Buses on Route 81 ............. 114
Table 48: Total Annual Cost Comparison Between Options...................................................... 116
Table 49: Emissions Comparison Table ..................................................................................... 117 Table 50: Percentage of Passengers Disembarking at Each Stop ............................................... 121 Table 51: Elements of the Model ................................................................................................ 123
Table 52: Query Results.............................................................................................................. 124 Table 53: Arrival Frequencies at Each Stop ............................................................................... 125
Table 54: Simulation Case 1 Results .......................................................................................... 126 Table 55: Simulation Case 2 Results .......................................................................................... 127
Table 56: Simulation Case 3 Results .......................................................................................... 127 Table 57: Simulated Bus-Full Report ......................................................................................... 128 Table 58: Simulated Leftover Passengers Report ....................................................................... 128 Table 59: Average Percentage Occupancy Report ..................................................................... 129
List of Abbreviations 13
Feasibility Study of Service Options for Tompkins Consolidated Area Transit in Ithaca and Tompkins County
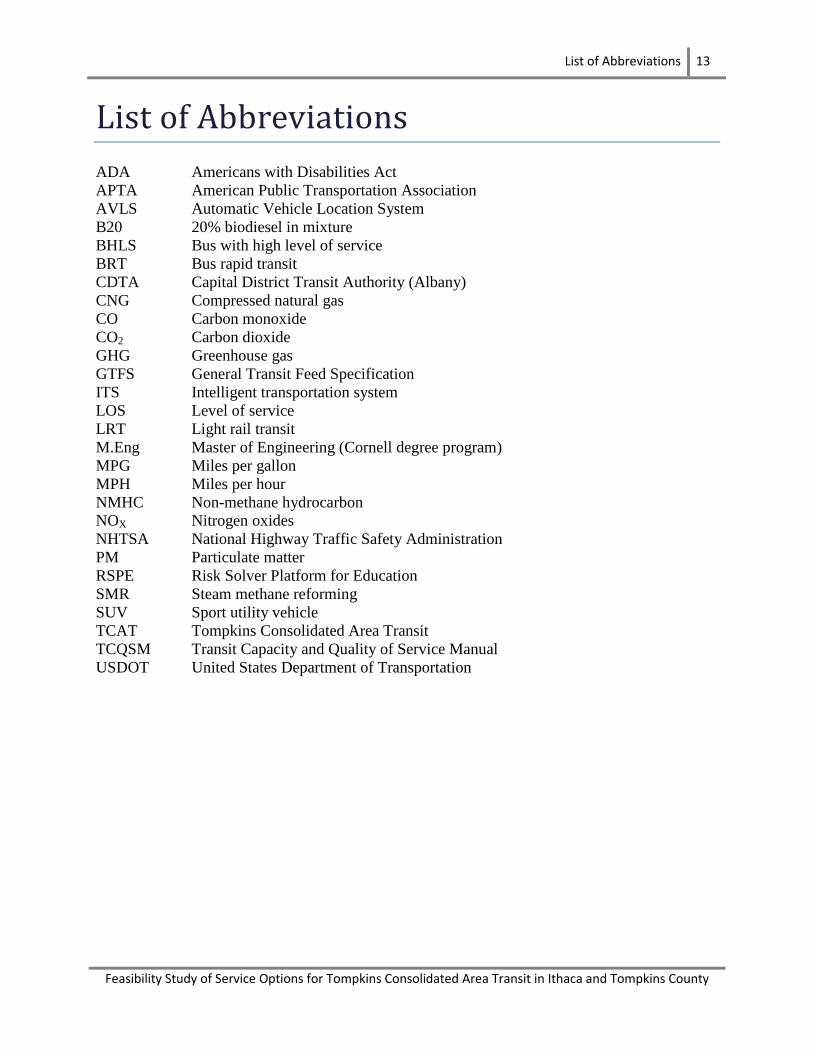
List of Abbreviations
ADA Americans with Disabilities Act
APTA American Public Transportation Association
AVLS Automatic Vehicle Location System
B20 20% biodiesel in mixture
BHLS Bus with high level of service
BRT Bus rapid transit
CDTA Capital District Transit Authority (Albany)
CNG Compressed natural gas
CO Carbon monoxide
CO2 Carbon dioxide
GHG Greenhouse gas
GTFS General Transit Feed Specification
ITS Intelligent transportation system
LOS Level of service
LRT Light rail transit
M.Eng Master of Engineering (Cornell degree program)
MPG Miles per gallon
MPH Miles per hour
NMHC Non-methane hydrocarbon
NOX Nitrogen oxides
NHTSA National Highway Traffic Safety Administration
PM Particulate matter
RSPE Risk Solver Platform for Education
SMR Steam methane reforming
SUV Sport utility vehicle
TCAT Tompkins Consolidated Area Transit
TCQSM Transit Capacity and Quality of Service Manual
USDOT United States Department of Transportation
I. Introduction 14
Feasibility Study of Service Options for Tompkins Consolidated Area Transit in Ithaca and Tompkins County
I. Introduction
Motivation In recent decades, the United States has faced increasing economic, environmental, and energy
challenges. Improving public transportation can help to mitigate these challenges and provide a
better quality of life to most, if not all, segments of society. A number of cities have risen to the
challenge of improving public transportation systems over the past two decades, which has
resulted overall in a 34% increase in ridership nationwide (American Public Transportation
Association 2014). Economically, improving public transportation results in a direct increase in
jobs, provides an affordable alternative to driving, and reduces the overall consumption of gas. It
is estimated that households using public transportation could save $9,700 per year on the
average cost to maintain a personal automobile. Further economies can be attributed to greater
fuel efficiency per passenger compared to single passenger vehicle transportation. In addition,
public transit helps to reduce congestion on roadways, furthering fuel efficiency as well as time
efficiency that are otherwise compromised in traffic. Finally, public transportation increases
personal mobility and the independence of many segments in society, including the elderly,
disabled, children, and those who cannot afford a personal vehicle.
Tompkins Consolidated Area Transit (TCAT) has been operating a bus service in the region
since 1998. The system provides affordable and reliable transportation throughout Tompkins
County in both rural and urbanized area. The system also services Cornell University and Ithaca
College, whose students account for more than 70% of the system’s boardings. In recent years,
the system has seen significant growth, including more than four million boardings in 2012 to
classify it as a medium sized transit system according to the APTA. Despite this growth, driving
solo in an automobile still remains the most common method of commuting to work in
Tompkins County. Bus service accounts for only 7% of commuters (Tompkins County 2014). As
a result, TCAT is continuously trying to improve their service to meet the needs of their current
users and to further its growth. This project will focus on what changes to the current system and
what new technology can be utilized to increase ridership, improve the level of service, and
reduce fuel consumption and carbon dioxide (CO2) emissions of the current system.
Scope of the Project
Service Improvements The first and foremost way of improving the TCAT experience is to focus on service
improvements. Several service improvement measures have been identified to focus in the
Tompkins County area, which cover a wide range of possibilities. These include focusing on
current system improvements (without large infrastructural change), adding bus rapid transit,
buses with a high level of service, articulated buses, flexible routes, and environmentally friendly
buses. The scope of the project is to conduct a feasibility study and would focus on the cost-
effectiveness or expanded capacity of service measures. The effectiveness of the service may be
explained through a modeled simulation of the impact of the service.
I. Introduction 15
Feasibility Study of Service Options for Tompkins Consolidated Area Transit in Ithaca and Tompkins County
Service Expansion Public transit systems have the benefit of reducing emissions based on the number of passengers
on the bus as compared to a car. The higher the number of passengers in public transit, the lower
the environmental emissions per person. Therefore, the scope of the project includes an
environmental impact assessment for the service measure under consideration, and may include
ecological benefits of retaining or increasing ridership, through expanded service.
Limitations of the Project Scope
Feasibility For all of the identified service improvement measures, a feasibility study shall be done. To do
so, some basic assumptions about the components of these measures shall be taken. The
feasibility study should include initial costs of the service improvement measures, operational
revenues, and expenses. It is also preliminary in nature, and any options recommended by the
study would require a detailed feasibility study before final adoption.
Environmental Impact For each of the service areas, an environmental impact assessment shall be undertaken. Carbon
dioxide will be the primary focus of all greenhouse gas (GHG) emissions, unless a specific
technology has a substantially different type of emission. The assessment will be limited to the
operational stage of the life cycle of the technology under consideration, and will not include any
other stage such as manufacturing, installation, etc.
Other Factors The main goals of this project are technical and economical in nature. It does not take into
account political and social barriers. However, if such barriers do exist in the respective areas,
they must be identified and stated. The technical aspects of the project do not include hardware
design or design changes to the technology required for a solution, and must focus on existing
technologies.
Good Faith The cost or performance characteristics of all systems considered by the project will be truthfully
stated, based on the assumptions.
Assumptions These assumptions include the lifespan of a bus is twelve years, and a 7% discount rate is
assumed for the time value of money. To be conservative, the salvage value of a bus is assumed
to be zero. The fuel economy of a standard diesel bus is assumed to be 3.85 miles per gallon.
Team Structure This project is the collaborative work of eighteen graduate students at Cornell University, under
the advisory of Dr. Francis Vanek, a faculty member in the Department of Civil and
Environmental Engineering. These eighteen team members come from a variety of educational,
professional, and cultural backgrounds. The project team will use its range of knowledge and
expertise to effectively carry out the tasks of this project.

I. Introduction 16
Feasibility Study of Service Options for Tompkins Consolidated Area Transit in Ithaca and Tompkins County
In order to examine the various service measures, the team divided into six sub-teams, each
composed of three members. Each sub-team is in charge of reviewing the feasibility of a service
measure, as well as its economic and environmental impact. The exception is the software sub-
team, which is responsible for developing a model which will analyze and visually present the
impacts of the proposed services.
Additionally, the team assigned administrative roles to certain members in order to facilitate
project activities, streamline communicate, and compile project deliverables.
Team Members Sruja Aluri was born and raised in the southern part of India. She completed her undergraduate
studies at the Birla Institute of Technology & Science, Pilani, in Hyderabad, majoring in
computer science. Before arriving at Cornell, she worked for a year with Microsoft in India as a
software developer. With an inclination towards management, she enrolled in the engineering
management program at Cornell. She enjoys spending her time with friends, singing and dancing
whenever time permits. She is currently working as part of the simulation sub-team of the TCAT
project and given her background and her interests, she would like to explore the area of
simulation more and contribute best to the project.
Mengzhe “Kati” Chang is an M.Eng student in engineering management from Beijing, China.
She obtained her B.S. in operations research and information engineering from Cornell
University in May 2013. Kati has taken several courses in transportation engineering and
information science (extracting valuable information from vast data) during her undergraduate
studies. She has high interest in public transit systems, especially the social and environmental
impacts of transit systems.
I. Introduction 17
Feasibility Study of Service Options for Tompkins Consolidated Area Transit in Ithaca and Tompkins County
Pawit “Sean” Chayanupatkul is from Bangkok, Thailand. Currently, he is studying for his
M.Eng in engineering management at Cornell. Previously, he studied operations research and
information engineering at Cornell. He has previous professional experiences as a business
analyst in supply chain management at Chevron and as a sales intern at Nestle. He has always
been interested in applying data analytics to solving complex problems, particularly in
manufacturing and supply chains. After graduation, he hopes to join a leading firm in supply
chain solutions to explore his interests further. In his free time, he enjoys playing tennis and
travel photography.
Chih-Horng “James” Chen grew up in Thailand and is of Taiwanese descent. He pursued a
B.Eng in electrical engineering and graduated from McGill University in 2013. He has worked
with BlackBerry as a camera development engineer. James has worked on the latest technologies
and has substantial experiences in data analysis. Currently, James is pursuing an M.Eng at
Cornell University in engineering management. He does not have prior experience in
transportation systems but is ready to put his skills into practice. Ultimately, he has been
enthusiastic about this learning opportunity and excited to be part of this project team.
Allen Cheong is currently in the M.Eng program in civil engineering at Cornell, specializing in
transportation systems engineering. He is originally from the San Francisco Bay Area in
California. He attended the University of California, Berkeley, graduating in 2012 with a B.S. in
civil and environmental engineering. While at Berkeley, he had an internship in road design and
a research position in developing intelligent transportation systems. Prior to graduate school at
Cornell, he worked for a year in construction management of public roadways in San Francisco.
After completion of graduate school, he hopes to work in design and construction of large-scale
transportation infrastructure projects. In his free time, he enjoys watching football and basketball,
traveling, and photography.
Yicheng “Henry” Huang is from Liuzhou, China, the “City of Bridges.” He graduated from
Tongji University with B.S. in civil engineering and is currently an M.Eng student in engineering
management at Cornell University. Henry has worked as a research assistant at Tongji, focusing
on bridge construction and bridge design. His research included structural analysis and
engineering management processes. He has internship experiences in construction management,
structural design, and even the food industry. Henry enjoys learning and mastering skills from
different fields. He likes to apply different skills to try to solve individual problems. He plays
sports like basketball, tennis and swimming. He also enjoys reading, cooking, watching movies,
and traveling, having been to France, Norway and several states in United States.
Ravi Kodali was born in Hyderabad, India. He received his bachelor’s degree in electronics and
communication engineering from Jawaharlal Nehru Technological University in 2010. Over the
course of his studies, however, he had become more interested in software development. Before
joining Cornell for his M.Eng in engineering management, he worked as a software developer
for three years at Tata Consultancy Services. He enjoys traveling and likes listening to music. He
is currently working in the simulation sub-team of the TCAT project given his interest in
exploring new technologies.
I. Introduction 18
Feasibility Study of Service Options for Tompkins Consolidated Area Transit in Ithaca and Tompkins County
Brett Musco completed his undergraduate studies at Cornell University in civil engineering and
is currently continuing his education, pursuing an M.Eng in transportation systems engineering.
As an undergraduate, he spent two summers working close to his hometown of Hope, Rhode
Island with the Rhode Island Department of Transportation, in the road design and traffic
engineering divisions. In addition, he was involved in research related to freight transportation
and OD estimation during his time at Cornell. He is looking forward to completing his M. Eng
this spring and hopefully finding a job in the northeast.
Shivam Patil was born and raised in India, and graduated from University of Pune, India with a
B.E. in computer engineering. With a desire to learn and develop technical and management-
related interdisciplinary skills, he is currently pursuing an M.Eng in engineering management at
Cornell University. He is pursuing courses that amalgamate management and software
engineering skills. His hobbies are trekking, reading and traveling.
Leonardo Pozzobon, from Caracas, Venezuela, is studying for an M.Eng in engineering
management at Cornell University, after graduating with a degree in manufacturing engineering
in 2008 from Universidad Simon Bolivar. He worked for two years in strategic planning and
budgeting in a city government, supervising community projects during that time. In 2011, he
joined a grain storage operation, supervising the construction and tuning of a new storage facility.
In the fall of 2012, he was assigned to another facility as plant manager, and in 2013 he left his
job to pursue his master’s degree. He will stay another year at Cornell to pursue a one-year MBA.
Nitin Sagar Sahgal is an M.Eng student at Cornell University, majoring in engineering
management. He holds a B.E. in instrumentation technology from Rashtreeya Vidyalaya College
of Engineering in Bangalore, India. Prior to joining Cornell University, he was employed with
Larsen & Toubro in India for two years, where he designed field instruments for thermal power
plants. He plans to work as a technology consultant after graduation. He enjoys swimming and
playing chess in his free time.
DongChul Rhue is an M.Eng student in transportation systems engineering. He grew up in a
small town, Changwon, in South Korea, and came to the United States when he was fourteen. He
did his undergraduate studies at Washington University in St. Louis, where he graduated with his
B.S. in mechanical engineering. From 2009 to 2011, he served in the Tiger Division of the
Korean military, where he served as a driver and a dispatcher. This experience made him
interested in transportation systems, so he decided to study transportation engineering at Cornell.
His goal in this TCAT project is to learn how to design and improve a public transportation
system by working and coordinating with other team members, an academic advisor, and a
current service manager from an actual transportation company. His professional goal is to find a
job related to transportation which will train and prepare him to become a licensed Professional
Engineer.
Aakash Sureka is a student from Calcutta, India. He studied civil engineering with a minor in
applied economics and management during his undergraduate education in Cornell University
and graduated in three years. He is currently pursuing an M.Eng in engineering management. He
interned with two civil engineering companies in the past few years, gaining experience in
project management, project scheduling, and quality control. He plans to work as a manager in a
I. Introduction 19
Feasibility Study of Service Options for Tompkins Consolidated Area Transit in Ithaca and Tompkins County
construction firm in Calcutta in the short term and pursue an MBA later on. He hopes to head his
own construction firm someday. In his free time he enjoys swimming and playing the piano and
the guitar.
Kunrawee “Bo” Tangmitpracha was born in the northeast region of Thailand, in a province
with a surprisingly long name, Ubon Ratchathani. After earning a bachelor’s degree in civil
engineering with a focus in transportation and a minor in real estate from Cornell University, she
is now pursuing an M.Eng in engineering management. During her undergraduate studies, she
interned at the Siam Cement Group, the largest construction material company in Thailand, as a
supply chain engineer, responsible for a project to reduce the total supply chain cost for the
company’s subdivision that develops roof tiles, Smart Board, and SmartWood. She has a strong
passion in culinary arts and patisserie. Because of that, she is determined to develop her own
business that will allow her to pursue her dream to become a patissier, utilize her skills in real
estate, and make good use of her knowledge in engineering, management and finance––she
hopes to run a global chain restaurant focusing on modern pastries. Bo plans to attend a business
school in Japan after her graduation in May.
Cecilia Turcios was born and raised in Alexandria, Virginia. She went to Cornell for a B.S. in
chemical engineering and is currently working towards her M.Eng in engineering management at
Cornell. Her past internships were in the consumer products and industrial gases industries but
she decided that she did not want to go into typical engineering. Therefore, she will work in
financial services industry upon graduation. Cecilia enjoys baking and running outdoors.
Peng Wang was born and raised in Beijing, China, and graduated from Southeast University in
Nanjing, China with a B.S. in transportation engineering. During this period, she took part in a
national program for new technology and independently published a research paper. She is
currently pursuing an M.S. in transportation systems engineering at Cornell University with a
minor in operations research and information engineering. She is interested in transportation
engineering, transportation planning and network optimization. Her hobbies are music, movies,
reading, and dancing.
Yanjun Wang, born in Shanghai, is currently an MPA student at the Cornell Institute for Public
Affairs. He obtained his bachelor’s degree in public administration from Fudan University in
China. He has worked in several public departments in the United States and China. As an
affiliate to the Cornell Program in Infrastructure Policy, he has interests in railway network
planning, public-private partnership, and transportation policy. He will pursue a transportation
engineering program at the University of Tokyo, Japan upon graduating in 2014.
Yiyao “Ina” Yan, from Shanghai, China, is an M.Eng student in engineering management at
Cornell University. She has a bachelor’s degree in automotive engineering from Tsinghua
University in Beijing, China. She had a summer internship in R&D at Shanghai General Motors
two years ago. She is interested in taking a position in operation management later in her career.
She loves traveling.
Dr. Francis Vanek, faculty advisor to this project, is originally from Ithaca, New York. He has
undergraduate degrees in mechanical engineering and Asian studies from Cornell (1991), and a
I. Introduction 20
Feasibility Study of Service Options for Tompkins Consolidated Area Transit in Ithaca and Tompkins County
PhD in systems engineering from the University of Pennsylvania (1998). He has taught at
Cornell since 2001, and his professional interests include sustainable transportation, energy
efficiency, renewable energy, and green building. He enjoys piano, yoga, and physical fitness.
Sub-Teams
Current System & System Improvements Members: DongChul Rhue, Aakash Sureka, Cecilia Turcios
The purpose of this sub-team is to identify the trouble areas for TCAT and develop suggestions
for improvement given their resource and budget constraints. TCAT grew in ridership for six
straight years and crossed four million riders in 2012. The sub-team explored the following
topics: Route 13, real-time passenger information, and the Cornell campus morning bus routes.
The average percentage change in ridership from 2011 to 2012 is +4.7%; however, for Route 13
the ridership dropped by 11.5%. This is the reason why the sub-team evaluated Route 13 and
explored ways for optimization. Another topic that the sub-team explored was that TCAT
currently does not have a real-time passenger information system in place. There are only fixed
timings and passengers are not informed of any delays or out-of-service routes. Lastly, the
Cornell campus morning routes are in high demand, causing buses to be over capacity and riders
to miss the bus. The sub-team explored ways to improve the service of these stops. The team also
evaluated and suggested a different naming system for TCAT’s current inconsistent bus and
naming system. The team also explored a way to optimize TCAT’s scheduling needs.
Environmentally-Friendly Buses Members: Leonardo Pozzobon, Nitin Sahgal, Yiyao Yan
The world is becoming increasingly concerned about global warming and the United States has
committed to Greenhouse Gas Cuts under the Copenhagen Climate Accord. The sub-team
studied relative amounts of greenhouse gases saved by different scenarios. In this project,
exploration of greenhouse gas emissions focused on CO2 at the end-use stage of the life cycle.
The cost-effectiveness of the options in terms of dollars per ton of CO2 was calculated as well.
CO2 reduction was calculated based on emissions avoided when existing riders use transit instead
of driving a private automobile and when diesel buses in TCAT fleet are replaced by hybrid
diesel-electric/hydrogen/electric or biodiesel buses. According to TCAT Yearbook 2012, a
hybrid diesel/electric engine increases fuel efficiency from the typical 3.85 mpg of a diesel bus to
4.31 mpg, an improvement of about 12%. However, hybrid diesel/electric buses cost $100,000 to
$200,000 more than non-hybrid ones, and the fuel cost savings do not cover the increased
purchase cost. The sub-team also took economic feasibility into consideration when giving
suggestions on environmentally-friendly buses.
Buses with a High Level of Service Members: Allen Cheong, Brett Musco, Yanjun Wang
The goal of the BLHS sub-team’s research was to study the feasibility of a BLHS system in the
Ithaca area. The research focused on the benefits and cost of a BHLS system based on the current
local situation. The sub-team learned from existing examples from other cities and discussed
how these can be applied to the Ithaca region. Some transportation policy research were also
included in the study, so the sub-team also looked back on related regulations from previous
experiences and the communication between public transportation companies and local
governments.
I. Introduction 21
Feasibility Study of Service Options for Tompkins Consolidated Area Transit in Ithaca and Tompkins County
Bus Rapid Transit Members: Henry Huang, Shivam Patil, Peng Wang
This part of the project aimed to study the feasibility of a BRT system in Ithaca. By comparing
similar cases in different countries, the sub-team was able to summarize the major features and
requirements for implementing the BRT. Based on the multi-criteria analysis of local conditions,
the team gave its own judgment of the feasibility of BRT features in Ithaca. The sub-team
proposed a “modified BRT system” that is better suited to the local area. After evaluating
requirements and determining strategies, a system model was built with data provided by TCAT,
and costs and revenues were assessed accordingly.
Articulated Buses Members: Kati Chang, Sean Chayanupatkul, Bo Tangmitpracha
Among all types of high capacity transit vehicles, articulated buses are operated in a few
metropolitan areas in North America. Some applications include peak-demand services, serving
on BRT systems, high-demand special events, and commuter express service. As a part of the
project, the feasibility of introducing articulated buses to the existing service was investigated.
The benefits and the tradeoffs involving the level of service, the effects on dwell and running
times, the capital investment, the maintenance, as well as other operating issues were taken into
consideration.
Simulation Members: Sruja Aluri, James Chen, Ravi Kodali
Currently, TCAT does their scheduling manually and many bus routes may not be fully
optimized for different situations, such as peak hours, off-season, weekends, etc. The team built
a simulation model for one bus route that displayed the current schedule’s effectiveness by
showing the data of average bus capacity at any given point, number of bus-full cases, and
passenger wait times. The model was also used to test the need for a change in schedule, to
suggest alternate schedules effectively if needed, and to show the analysis through the model.
The sub-team did this by collecting the historical data that was available from TCAT. This model
was designed to be flexible and be able to incorporate any changes which TCAT may consider
implementing into its system, such as the service options discussed in this project.
Team Liaisons In addition to the sub-teams described above, the project team also assigned liaison roles for two
members for improved coordination between the advisor and the client.
The Advisor Liaison (Allen Cheong) was responsible for meeting with the advisor, Dr. Vanek,
and keeping him updated on project activities. He stayed informed of progress and issues for
each sub-team. In addition, he served as the chief editor of the technical report and other
deliverables of the project.
The TCAT Liaison (Brett Musco) was responsible for streamlined communication with
representatives at TCAT, primarily Doug Swarts. Whenever a sub-team required data or
information from TCAT, the liaison sent the request to the client and provided this information
to the sub-team when received. This was to reduce the number of emails sent to the client, as
many sub-teams requested the same information.
I. Introduction 22
Feasibility Study of Service Options for Tompkins Consolidated Area Transit in Ithaca and Tompkins County
Metrics for Use in the Project The following metrics were of interest:
1. Life cycle cost of service improvements, including capital and ongoing non-capital costs.
2. Estimated tons per year of CO2 emissions avoided.
3. Cost per ton of emissions reduction.
4. Confidence interval on answers using Monte Carlo simulation in RSPE or @Risk.
TCAT
History Tompkins Consolidated Area Transit (TCAT), founded in 1998, is a consolidated transit service
that serves Tompkins County, the City of Ithaca, and Cornell University. Before 1998, there
were three separate public transit systems: TOMTRAN serving Tompkins County, CU Transit
serving Cornell University, and Ithaca Transit serving the City of Ithaca. Because of
inefficiencies in the service and operation of the separate transit systems, TCAT was born.
This transit system has flourished over the years. In 2012, annual TCAT ridership increased to
over four million, giving it a new size category (4 to 30 million riders per year) for the American
Public Transportation Association (APTA). There are 33 bus routes, 32 of which are fixed and
one route with a demand-response component. These routes utilize a fleet of 54 vehicles
consisting of 50 transit buses and four mini-buses. In 2012, this fleet operated about 1.6 million
revenue miles for about 120,000 revenue hours.
TCAT became a non-profit corporation in 2005 and is funded by the State Transit Operating
Assistance Fund, which provides funding based on the annual ridership and annual miles
traveled. TCAT’s sources of income, ranging from highest percentage to lowest, are state funds,
cash fares, City of Ithaca, Tompkins County, Cornell University, and federal funds. In recent
years, TCAT has been struggling with a tight budget and have made several measures to help
trim their budget, such as increasing rural fares, freezing wage salaries, and making route cuts.
Bus Routes and Systems The 33 bus routes can be divided into three main categories: urban, rural and campus.
Urban (non-campus) routes include Routes 10, 11, 13, 14, 15, 17, 30, 31, 32, 51, 70, and 72.
Ridership of these urban routes has steadily increased from 2003 to 2012. The consistent
ridership is heavily influenced by patterns of campus life at Cornell University and Ithaca
College. By looking at the table of Routes Sorted by Ridership Gain, 2010-2012 in the TCAT
2012 Yearbook, Route 10 (C.U. – Commons), Route 81 (C.U. Weekday), Route 82 (C.U.
Weekday) take 10.65% (439,494), 13.3% (548,907), and 9.5% (394,849) of the total 2012 TCAT
ridership (4,128,240) respectively. Also, Route 30 (Commons – Mall), which many students take
for shopping, dining, and other activities, takes 17.15 % (707,805) of the total ridership.
Rural routes can be divided into two sub-categories: minimum service and large market. Rural
minimum service routes have few peak hour trips and perhaps one mid-day trip, and these routes
include Routes 20, 22, 36, 37, 40, 53, 65, 74, 75 and 77. Large market routes generally serve
outlying villages and these include Routes 21 (Trumansburg), 41 (Freeville/Etna), 43 (Dryden),
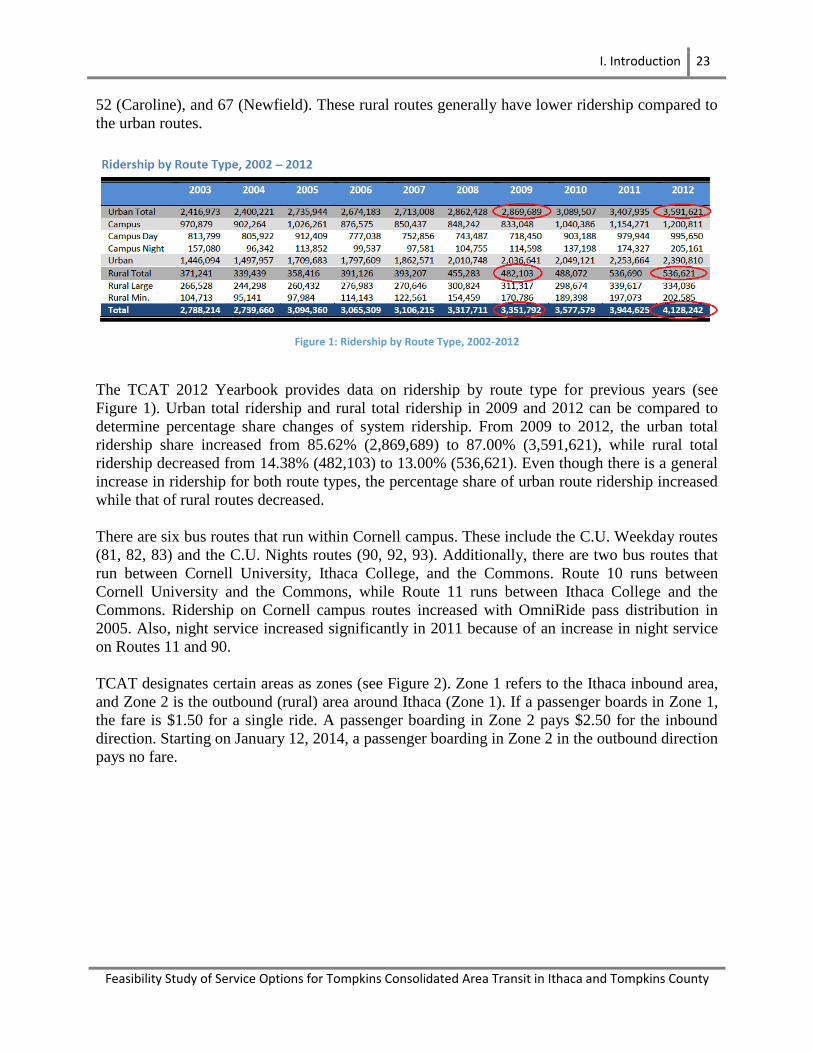
I. Introduction 23
Feasibility Study of Service Options for Tompkins Consolidated Area Transit in Ithaca and Tompkins County
52 (Caroline), and 67 (Newfield). These rural routes generally have lower ridership compared to
the urban routes.
Figure 1: Ridership by Route Type, 2002-2012
The TCAT 2012 Yearbook provides data on ridership by route type for previous years (see
Figure 1). Urban total ridership and rural total ridership in 2009 and 2012 can be compared to
determine percentage share changes of system ridership. From 2009 to 2012, the urban total
ridership share increased from 85.62% (2,869,689) to 87.00% (3,591,621), while rural total
ridership decreased from 14.38% (482,103) to 13.00% (536,621). Even though there is a general
increase in ridership for both route types, the percentage share of urban route ridership increased
while that of rural routes decreased.
There are six bus routes that run within Cornell campus. These include the C.U. Weekday routes
(81, 82, 83) and the C.U. Nights routes (90, 92, 93). Additionally, there are two bus routes that
run between Cornell University, Ithaca College, and the Commons. Route 10 runs between
Cornell University and the Commons, while Route 11 runs between Ithaca College and the
Commons. Ridership on Cornell campus routes increased with OmniRide pass distribution in
2005. Also, night service increased significantly in 2011 because of an increase in night service
on Routes 11 and 90.
TCAT designates certain areas as zones (see Figure 2). Zone 1 refers to the Ithaca inbound area,
and Zone 2 is the outbound (rural) area around Ithaca (Zone 1). If a passenger boards in Zone 1,
the fare is $1.50 for a single ride. A passenger boarding in Zone 2 pays $2.50 for the inbound
direction. Starting on January 12, 2014, a passenger boarding in Zone 2 in the outbound direction
pays no fare.

I. Introduction 24
Feasibility Study of Service Options for Tompkins Consolidated Area Transit in Ithaca and Tompkins County
Figure 2: Map of Service Zones
Recent Improvements in Routes, Buses, Service Hours Over the past decade, TCAT has been focused on trying to refine their system to increase
efficiency and better meet public demand. Three times a year (August, January, and May) TCAT
will make small adjustments to their schedules, refining the frequency and hours of operations
along different routes. More major revisions are done through Transit Development Plans
(TDPs), which are completed approximately every five years. These plans analyze the service
provided and seek to rearrange, discontinue, and add routes. The last one of these plans was
completed in 2009 and implemented in 2010. This plan included the extension of the Route 82
bus from Cornell campus to East Hill Plaza via the Maplewood Apartments. This change is
associated with nearly a 25% increase in campus ridership.
Also introduced in 2010 was Route 41, the first demand-response route, which does not have a
fixed route but rather serves a larger area based on demand. For the route to pick up a passenger,
they must all in in advance. Currently the 41 serves the general areas of Sapsucker Woods and
Etna on weekdays (this region is served by the fixed Route 74 on weekends). While the 41 is
TCAT’s first experiment in demand-response routes, this method could be implemented in the
near future to serve other low density neighborhoods.
Along with these two significant route changes, TCAT has also been introducing new ways for
riders to pay for the bus. One of the biggest changes was in 2005 when Cornell reached an
agreement with TCAT to provide all students with OmniRide passes. This caused an overall
increase in ridership of 13%. Two years later, this was revised to only include new students to
the school, but current students could purchase a pass significantly discounted. The same year,
students began to scan there cards on the buses via new electronic fair collection systems that
I. Introduction 25
Feasibility Study of Service Options for Tompkins Consolidated Area Transit in Ithaca and Tompkins County
had been installed. Further improvements were made in 2010, when the Green Street station was
opened, including a coffee shop and indoor waiting area. An electronic fare box was also
installed in the station, which enables riders to purchase passes for various number of rides or
days, better suiting individual needs. Today, the Green Street station remains the center of the
TCAT network, handling more boardings than any other stop.
Finally, TCAT has been working to update their fleet of vehicles to new, cleaner technology.
Due to federal regulations, once TCAT purchases a vehicle, they must use it for 12 years before
it can be retired and replaced. As a result, starting in 2006 TCAT began to replace some of its
retiring vehicle with new hybrid vehicles that can be used in the urban area more efficiently. In
total, the TCAT fleet now features eight hybrid-diesel buses. Furthermore, over the past decade,
TCAT has switched almost all of the fleet from standard high floor buses to more accessible low
floor buses. This change not only makes boarding easier for disabled passenger, but also
increases the rate at which all passengers can board.
Future Plans TCAT is assessing its information technology and data management needs in several areas.
When the study is complete, TCAT plans to implement a system that can export service data in
General Transit Feed Specification (GTFS) format for Google Transit. This would enable
smartphone apps and other third party technologies to easily convey transit data, including real
time information to alert passengers about such things as weather related, sudden traffic delays,
where the buses are in real time, and the estimated arrival time of the bus to a bus stop of a
particular route.
Another technology project is the implementation of the Informational Technology/Intelligent
Transportation Systems Study, completed in 2012, that is providing a path which will allow
streamlining many of the administrative and maintenance tasks TCAT performs daily. New
software for route and service changes is on the way for TCAT, saving time on manual work for
the route and service changes taking place thrice a year. In fact, with the help of the new
software, changes will be very easy and their results will be available quickly. Manually creating
schedules requires three people working on the route and service changes for three weeks, and
the software will definitely save time and human effort.
Demand-responsive transit responds to the needs of riders not served by a fixed-route bus line by
giving them more individualized, on-demand, curb-side service. Because of this flexibility,
demand-response service is capable of covering larger areas of lower density development than a
fixed-route bus. In the future, TCAT can run more of these services. After the studying the
response of the currently implemented system, if required, instead of a full-scale implementation
for a route, demand-response can act as the feeder for the high-ridership main routes.
The "What's a Bus Stop?" Project seeks to clearly establish TCAT's bus stops in urban and
suburban areas, which will clarify TCAT service to riders, improve conditions for drivers and
provide a basis for real-time information initiatives such as expected arrival time of the bus and
its route number. TCAT can retire the 2002 New Flyers and 2001 Nova buses as soon as they
reach retirement age of twelve years and replacement buses have been procured. TCAT is going
to add one hydrogen buses to its fleet as a trial, which will result in fewer greenhouse gas
emissions and air pollutants. If successful, more hydrogen buses will be added to the fleet. There
I. Introduction 26
Feasibility Study of Service Options for Tompkins Consolidated Area Transit in Ithaca and Tompkins County
are plans to have new garages for bus storage at Seneca Street and Green Street because the
current garage is over its capacity.
Data The data used in this report were based on average ridership data compiled by TCAT for
September of 2013. This data was provided for Routes 82, 81, 13, 15, 41, and 30 in Excel format.
Each Excel file contained a table of average hourly boardings and total boardings during the
month, aggregated at each designated time point along the routes. The data was further broken
out into weekday, Saturday, and Sunday averages. One important note is that the data does not
contain boarding for each individual stop; rather, TCAT aggregates the data from multiple stops
into time points, which are major stops defined by TCAT to represent that particular stop as well
as the subsequent stops until the next major one. After a bus passes a time point, all boarding at
future stops are counted as accounting to that time point until the bus reaches the next time point.
In addition to the compiled average data file, we were also given access to the raw data, which
records each individual fare payment.
While the average ridership file was our primary source of data, some analysis was also
performed using timing studies conducted during the fall of 2013, as well as bus full reports from
January to March 2014. The timing studies calculate the average deviation from the scheduled
arrival time of the bus at a given stop. This gives insight into what routes struggle with on-time
performance during peak hours. The bus full logs are a record of every time a driver reports a
bus as being full and has to turn down riders. These reports have to be individually called in by
the drivers at the time of the occurrence. The drivers also estimate how many passengers are left
behind and note any obvious cause for the overcrowding. Other data was taken directly for
TCAT’s publicly available yearbooks. Additionally, some numbers were found manually
through our own observations, by riding the bus and through everyday experiences.
Timeline In order for this project to be completed within an academic semester, the project team followed
many deadlines for deliverables throughout the course of the project. Throughout the project,
deadlines deviated from their original dates in order to overcome scheduling challenges.
12/10/13 The project team met for the first time with Dr. Vanek to learn the purpose of the
project and a general overview of what is expected of the team in the following
semester.
1/28/14 The team attended two courses presented by Dr. Vanek which introduced many
transportation engineering concepts to those who were unfamiliar with this field
of engineering. Project information was covered in greater detail. The team
members were given an assignment on calculating costs and emissions for sample
transportation systems.
2/6/14 The team began holding weekly meetings to coordinate project activities.
2/7/14 Each team member submitted personal goals for the project.
2/18/14 In addition to weekly internal meetings, the team began meeting weekly with Dr.
Vanek to discuss project status and deliverables.
I. Introduction 27
Feasibility Study of Service Options for Tompkins Consolidated Area Transit in Ithaca and Tompkins County
2/21/14 The team met with Doug Swarts at TCAT’s office in Ithaca and became more
familiar with its operations and procedures.
3/4/14 The team completed its literature review and draft proposal.
3/11/14 The team submitted its final proposal.
3/25/14 The team evaluated its performance and progress, and submitted a midterm
management report.
3/28/14 The team members evaluated each other’s participation and contributions to the
project to date and submitted these evaluations to Dr. Vanek.
4/29/14 The team gave an informal presentation of their findings to Dr. Vanek and some
graduate students who will be participating in a Master of Engineering project
next semester.
5/9/14 The team gave its final presentation to TCAT, presenting the studies they have
conducted and their recommendations on the chosen service measures. This took
place at TCAT’s office.
5/14/14 The team submitted a draft of their technical report.
5/21/14 The team submitted its completed technical report.
II. TCAT Current System Improvements 28
Feasibility Study of Service Options for Tompkins Consolidated Area Transit in Ithaca and Tompkins County
II. TCAT Current System Improvements
Introduction TCAT has experienced substantial growth over the last 10 years, where just in 2013 alone there
was a 6.3% increase in ridership from 2012. As with any system, it is important to always look
for ways to improve the system and TCAT is no exception. With the ridership increasing to 4.4
million in 2013 (about a 300,000 increase from 2012), it is important to identify ways for TCAT
to better serve the community and their internal infrastructure.
The purpose of TCAT Current System Improvements sub-team is to analyze both the internal
and external system of TCAT and identify which areas are important to explore, given the time
and resource constraints.
The following are the problem areas we identified for TCAT:
• Route 13 has steadily decreased in ridership over the years.
• The increased morning demand on North Campus has exceeded the capacity of the buses,
therefore leaving unsatisfied riders.
• There is currently no real-time passenger information system for TCAT customers and it
is important to incorporate that into TCAT.
• The current TCAT naming system of “Inbound” and “Outbound” has ambiguous
meanings depending on route and direction the bus is headed.
• Currently, there is no set optimization program for TCAT assignment of bus drivers and
vehicles.
The following sections will expand on each other problem areas and suggest possible solutions to
address those problems.
Declining Route 13 Ridership and High Morning Demand
Declining Route 13 Ridership Route 13 is a route that runs from Ithaca Mall to Ithaca Commons with stops at TCAT offices,
Ithaca High School, Stewart Park, etc. When we first came to visit TCAT offices as a group
earlier in the semester, we rode Route 13 to get to TCAT, and we realized that there was only
one passenger other than our group on the bus that morning.
To get a better understanding of Route 13, TCAT provided data for the average ridership of
Route 13, and as expected, the daily average of Route 13 was very low. Its weekday daily
average ridership was about 152 while the other routes, such as Route 30, had over 3,500 per day.
As we looked into more detail about Route 13, we also realized that it is not very efficient, time-
wise and distance-wise. In total, Route 13 is about twelve miles long, but there are only seven
stops, which means that the distance between each stops are long. Route 13 also changes to
Route 31 as it approaches the Commons area, and then continues to serve other areas. This

II. TCAT Current System Improvements 29
Feasibility Study of Service Options for Tompkins Consolidated Area Transit in Ithaca and Tompkins County
makes too long of a trip for buses that serve Route 13 and 31, which also consumes large
quantities of fuel.
What makes this issue worse is that the annual average ridership of Route 13 has been decreasing
over the past few years. Since 2011 to 2013, the average ridership has decreased about 10-15%
every year. With declining ridership and low distance-wise efficiency, we concluded that Route
13 does not seem very profitable to TCAT.
Figure 3: Declining Ridership for Route 13, 2011-2013
High Morning Demand Another issue identified was the high morning demand of the Cornell campus routes. Currently,
Routes 30, 81 and 82, which serve Cornell’s north and central campus areas, are the major
sources of TCAT’s total ridership, and these three routes have shown consistent increase in
ridership over the past years.
64,215
56,821 52,824
0
10,000
20,000
30,000
40,000
50,000
60,000
70,000
2011 2012 2013
Rid
ers
hip
Year
Declining Ridership for Route 13
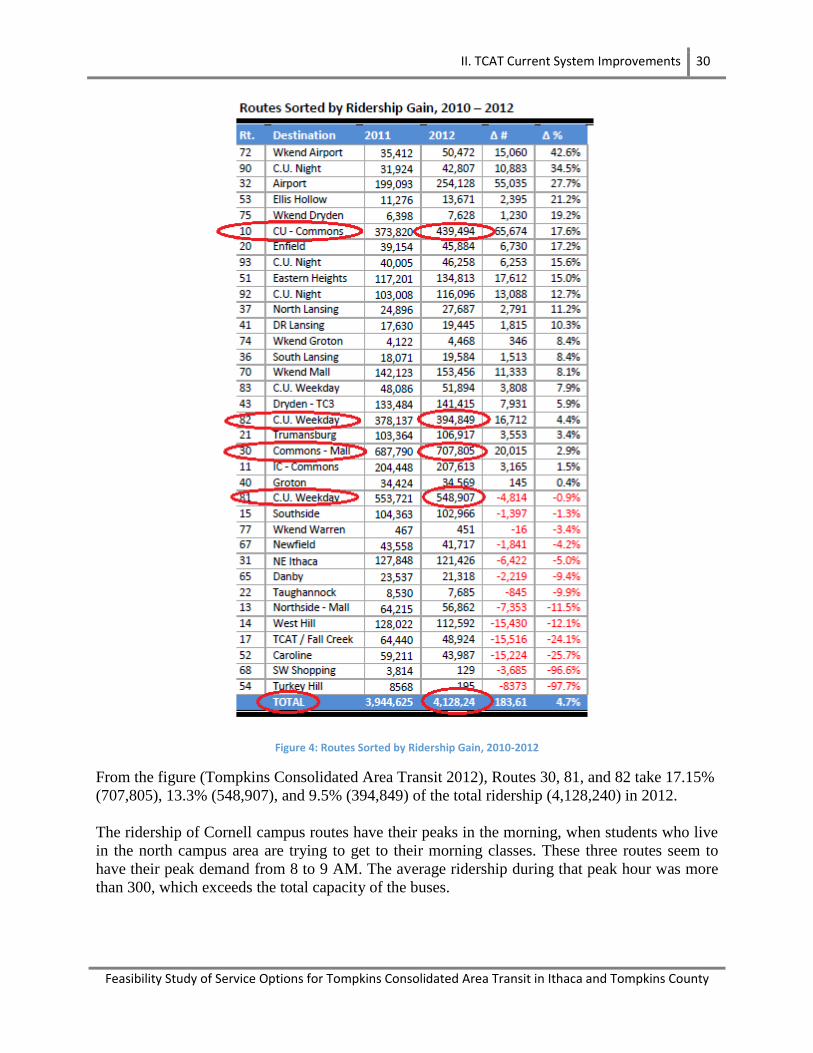
II. TCAT Current System Improvements 30
Feasibility Study of Service Options for Tompkins Consolidated Area Transit in Ithaca and Tompkins County
Figure 4: Routes Sorted by Ridership Gain, 2010-2012
From the figure (Tompkins Consolidated Area Transit 2012), Routes 30, 81, and 82 take 17.15%
(707,805), 13.3% (548,907), and 9.5% (394,849) of the total ridership (4,128,240) in 2012.
The ridership of Cornell campus routes have their peaks in the morning, when students who live
in the north campus area are trying to get to their morning classes. These three routes seem to
have their peak demand from 8 to 9 AM. The average ridership during that peak hour was more
than 300, which exceeds the total capacity of the buses.
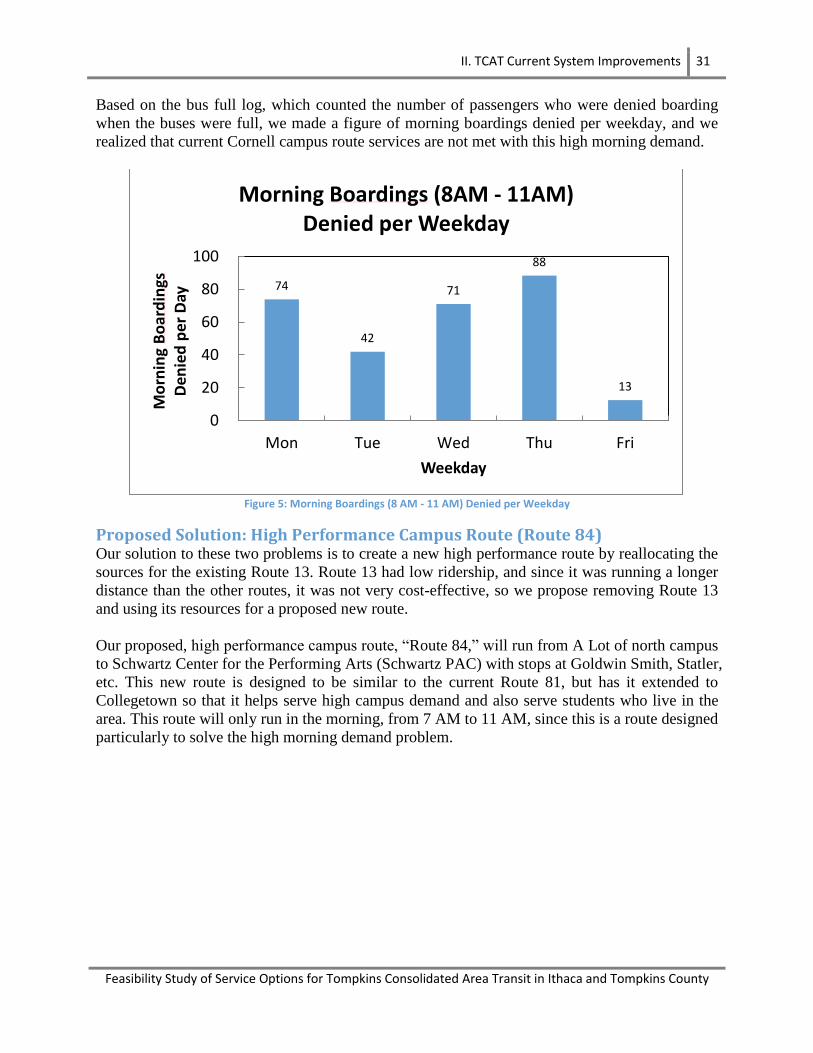
II. TCAT Current System Improvements 31
Feasibility Study of Service Options for Tompkins Consolidated Area Transit in Ithaca and Tompkins County
Based on the bus full log, which counted the number of passengers who were denied boarding
when the buses were full, we made a figure of morning boardings denied per weekday, and we
realized that current Cornell campus route services are not met with this high morning demand.
Figure 5: Morning Boardings (8 AM - 11 AM) Denied per Weekday
Proposed Solution: High Performance Campus Route (Route 84) Our solution to these two problems is to create a new high performance route by reallocating the
sources for the existing Route 13. Route 13 had low ridership, and since it was running a longer
distance than the other routes, it was not very cost-effective, so we propose removing Route 13
and using its resources for a proposed new route.
Our proposed, high performance campus route, “Route 84,” will run from A Lot of north campus
to Schwartz Center for the Performing Arts (Schwartz PAC) with stops at Goldwin Smith, Statler,
etc. This new route is designed to be similar to the current Route 81, but has it extended to
Collegetown so that it helps serve high campus demand and also serve students who live in the
area. This route will only run in the morning, from 7 AM to 11 AM, since this is a route designed
particularly to solve the high morning demand problem.
74
42
71
88
13
0
20
40
60
80
100
Mon Tue Wed Thu Fri
Mo
rnin
g B
oar
din
gs
Den
ied
pe
r D
ay
Weekday
Morning Boardings (8AM - 11AM) Denied per Weekday

II. TCAT Current System Improvements 32
Feasibility Study of Service Options for Tompkins Consolidated Area Transit in Ithaca and Tompkins County
Figure 6: Proposed New Campus Route - "Route 84"
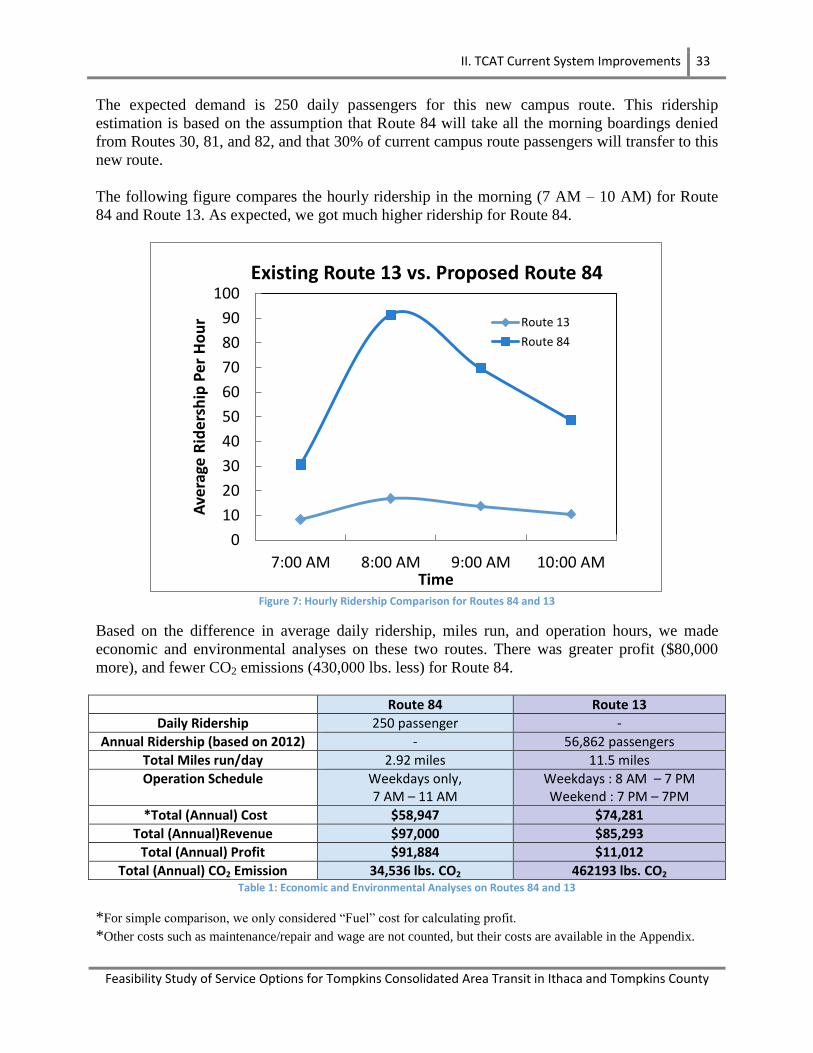
II. TCAT Current System Improvements 33
Feasibility Study of Service Options for Tompkins Consolidated Area Transit in Ithaca and Tompkins County
The expected demand is 250 daily passengers for this new campus route. This ridership
estimation is based on the assumption that Route 84 will take all the morning boardings denied
from Routes 30, 81, and 82, and that 30% of current campus route passengers will transfer to this
new route.
The following figure compares the hourly ridership in the morning (7 AM – 10 AM) for Route
84 and Route 13. As expected, we got much higher ridership for Route 84.
Figure 7: Hourly Ridership Comparison for Routes 84 and 13
Based on the difference in average daily ridership, miles run, and operation hours, we made
economic and environmental analyses on these two routes. There was greater profit ($80,000
more), and fewer CO2 emissions (430,000 lbs. less) for Route 84.
Route 84 Route 13
Daily Ridership 250 passenger -
Annual Ridership (based on 2012) - 56,862 passengers
Total Miles run/day 2.92 miles 11.5 miles
Operation Schedule Weekdays only, 7 AM – 11 AM
Weekdays : 8 AM – 7 PM Weekend : 7 PM – 7PM
*Total (Annual) Cost $58,947 $74,281
Total (Annual)Revenue $97,000 $85,293
Total (Annual) Profit $91,884 $11,012
Total (Annual) CO2 Emission 34,536 lbs. CO2 462193 lbs. CO2 Table 1: Economic and Environmental Analyses on Routes 84 and 13
*For simple comparison, we only considered “Fuel” cost for calculating profit.
*Other costs such as maintenance/repair and wage are not counted, but their costs are available in the Appendix.
0
10
20
30
40
50
60
70
80
90
100
7:00 AM 8:00 AM 9:00 AM 10:00 AM
Ave
rage
Rid
ers
hip
Per
Ho
ur
Time
Existing Route 13 vs. Proposed Route 84
Route 13
Route 84

II. TCAT Current System Improvements 34
Feasibility Study of Service Options for Tompkins Consolidated Area Transit in Ithaca and Tompkins County
From the performance comparison figure, the proposed Route 84 will be able to run more
efficiently than the current Route 13. However, TCAT should not completely get rid of the
current Route 13. Even though their numbers are small compared to other routes’ ridership, there
are still people who use Route 13, and they still need this service. We suggest that TCAT switch
to the minibuses for Route 13, and have fewer stops by removing unnecessary ones, such as the
TCAT office, which is already served by Route 17.
Due to infeasibility, Route 13 resources are recommended to be used with Route 84. This
recommendation does not take into account community acceptance, which is beyond the scope of
the project and does not include approval procedures. However, this recommendation is justified
based on the fact that Route 84 would serve more people as compared to Route 13 (which has a
steeply declining ridership that is already low in the first place). Route 13 stops can also be
accessed with one or two transfers using routes like Route 30, 17, etc. The resources used for
Route 84 can return to Route 13 services in the afternoon, since the Route 84 service is only in
the morning during the weekdays. For instance, people can either take Route 18, then transfer to
Route 30 to get to the mall, or they can wait until the afternoon to take Route 13 straight to the
mall. This recommendation was also based on the view that the needs of the many outweigh the
needs of the few, and Route 84 was a lot more convenient. Furthermore, we do not anticipate a
complete loss of Route 13 revenue, as passengers would use a slightly longer route instead.
However, setting aside all considerations, the feasibility of community acceptance was not
addressed as a separate problem.
Lack of Real-Time Information for Passengers
One of the major conveniences that TCAT provides its passengers is information on bus
schedules and routes. This is a very important service, as it allows the passengers to know when
a bus, on a particular route, would depart from which stop. This way, a passenger can plan his or
her trip beforehand, rather than wait at the stop without knowledge of the bus schedule. TCAT
provides this information to its passengers in very conventional ways.
The most orthodox way in which TCAT provides bus schedules is by pasting the schedules at the
stops. A passenger waiting at the stop shall then have access to the schedule directly. It is not the
most convenient or widely used method of planning trips. However, a major benefit of providing
information this way is that it eliminates the need of technology, and provides the information as
a hard copy.
The most widely used method of finding bus schedules for TCAT is using the internet to access
the main TCAT website. The TCAT website consists of all information one requires about
TCAT, but is mostly used to find bus schedules. The website consists of two convenient ways of
finding bus and route schedules.
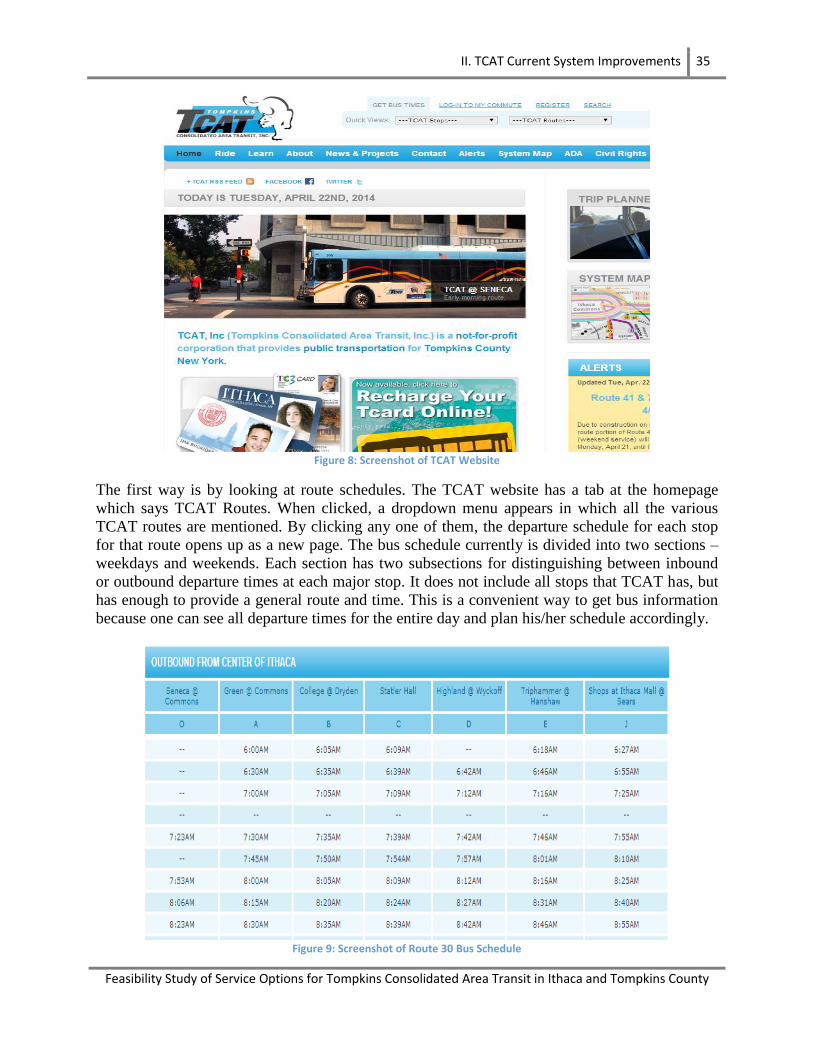
II. TCAT Current System Improvements 35
Feasibility Study of Service Options for Tompkins Consolidated Area Transit in Ithaca and Tompkins County
Figure 8: Screenshot of TCAT Website
The first way is by looking at route schedules. The TCAT website has a tab at the homepage
which says TCAT Routes. When clicked, a dropdown menu appears in which all the various
TCAT routes are mentioned. By clicking any one of them, the departure schedule for each stop
for that route opens up as a new page. The bus schedule currently is divided into two sections –
weekdays and weekends. Each section has two subsections for distinguishing between inbound
or outbound departure times at each major stop. It does not include all stops that TCAT has, but
has enough to provide a general route and time. This is a convenient way to get bus information
because one can see all departure times for the entire day and plan his/her schedule accordingly.
Figure 9: Screenshot of Route 30 Bus Schedule
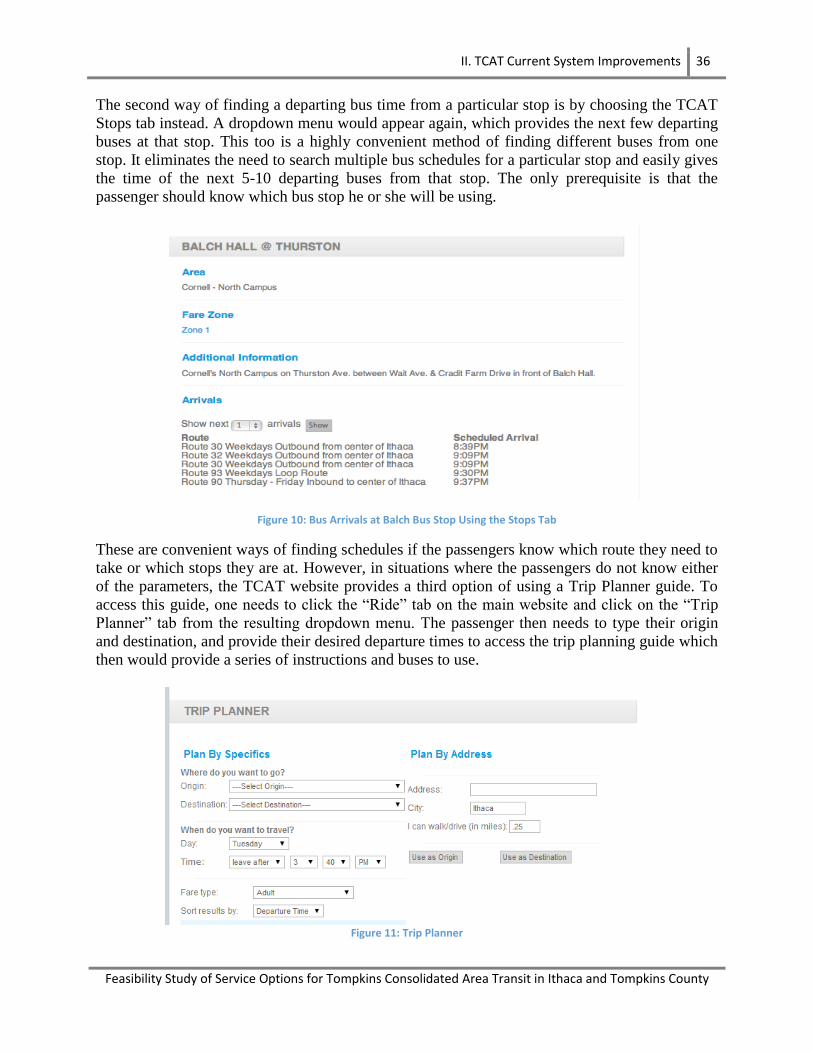
II. TCAT Current System Improvements 36
Feasibility Study of Service Options for Tompkins Consolidated Area Transit in Ithaca and Tompkins County
The second way of finding a departing bus time from a particular stop is by choosing the TCAT
Stops tab instead. A dropdown menu would appear again, which provides the next few departing
buses at that stop. This too is a highly convenient method of finding different buses from one
stop. It eliminates the need to search multiple bus schedules for a particular stop and easily gives
the time of the next 5-10 departing buses from that stop. The only prerequisite is that the
passenger should know which bus stop he or she will be using.
Figure 10: Bus Arrivals at Balch Bus Stop Using the Stops Tab
These are convenient ways of finding schedules if the passengers know which route they need to
take or which stops they are at. However, in situations where the passengers do not know either
of the parameters, the TCAT website provides a third option of using a Trip Planner guide. To
access this guide, one needs to click the “Ride” tab on the main website and click on the “Trip
Planner” tab from the resulting dropdown menu. The passenger then needs to type their origin
and destination, and provide their desired departure times to access the trip planning guide which
then would provide a series of instructions and buses to use.
Figure 11: Trip Planner
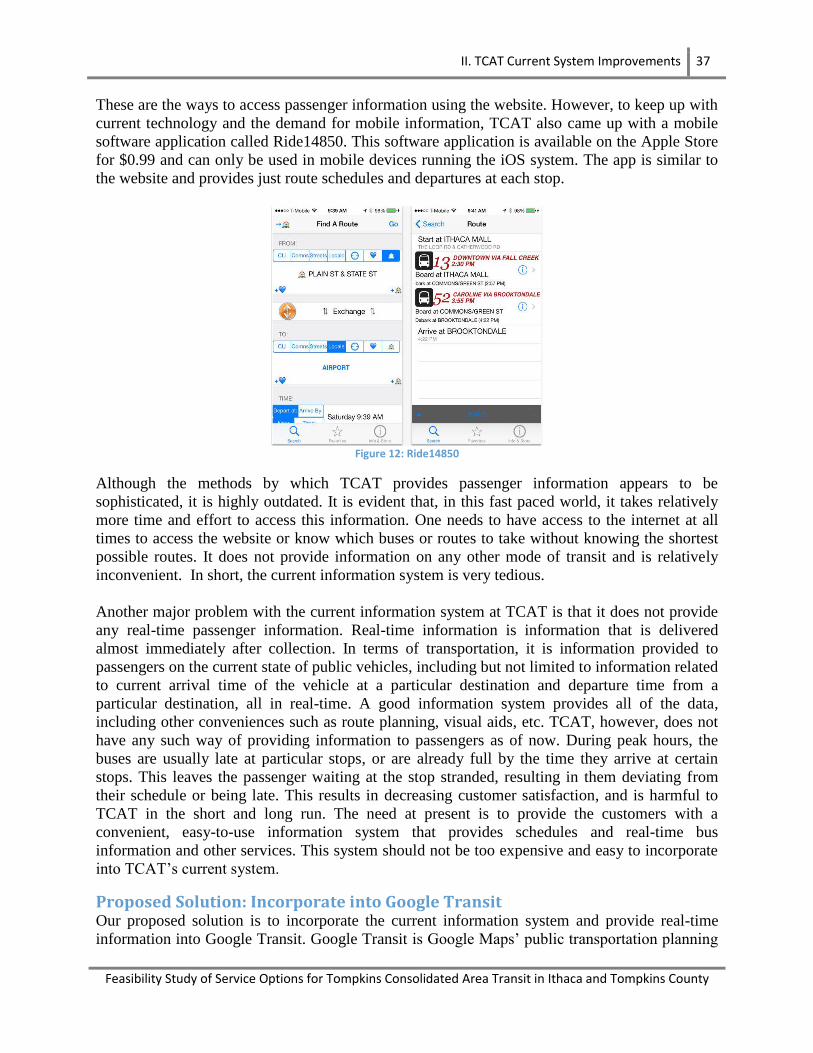
II. TCAT Current System Improvements 37
Feasibility Study of Service Options for Tompkins Consolidated Area Transit in Ithaca and Tompkins County
These are the ways to access passenger information using the website. However, to keep up with
current technology and the demand for mobile information, TCAT also came up with a mobile
software application called Ride14850. This software application is available on the Apple Store
for $0.99 and can only be used in mobile devices running the iOS system. The app is similar to
the website and provides just route schedules and departures at each stop.
Figure 12: Ride14850
Although the methods by which TCAT provides passenger information appears to be
sophisticated, it is highly outdated. It is evident that, in this fast paced world, it takes relatively
more time and effort to access this information. One needs to have access to the internet at all
times to access the website or know which buses or routes to take without knowing the shortest
possible routes. It does not provide information on any other mode of transit and is relatively
inconvenient. In short, the current information system is very tedious.
Another major problem with the current information system at TCAT is that it does not provide
any real-time passenger information. Real-time information is information that is delivered
almost immediately after collection. In terms of transportation, it is information provided to
passengers on the current state of public vehicles, including but not limited to information related
to current arrival time of the vehicle at a particular destination and departure time from a
particular destination, all in real-time. A good information system provides all of the data,
including other conveniences such as route planning, visual aids, etc. TCAT, however, does not
have any such way of providing information to passengers as of now. During peak hours, the
buses are usually late at particular stops, or are already full by the time they arrive at certain
stops. This leaves the passenger waiting at the stop stranded, resulting in them deviating from
their schedule or being late. This results in decreasing customer satisfaction, and is harmful to
TCAT in the short and long run. The need at present is to provide the customers with a
convenient, easy-to-use information system that provides schedules and real-time bus
information and other services. This system should not be too expensive and easy to incorporate
into TCAT’s current system.
Proposed Solution: Incorporate into Google Transit Our proposed solution is to incorporate the current information system and provide real-time
information into Google Transit. Google Transit is Google Maps’ public transportation planning
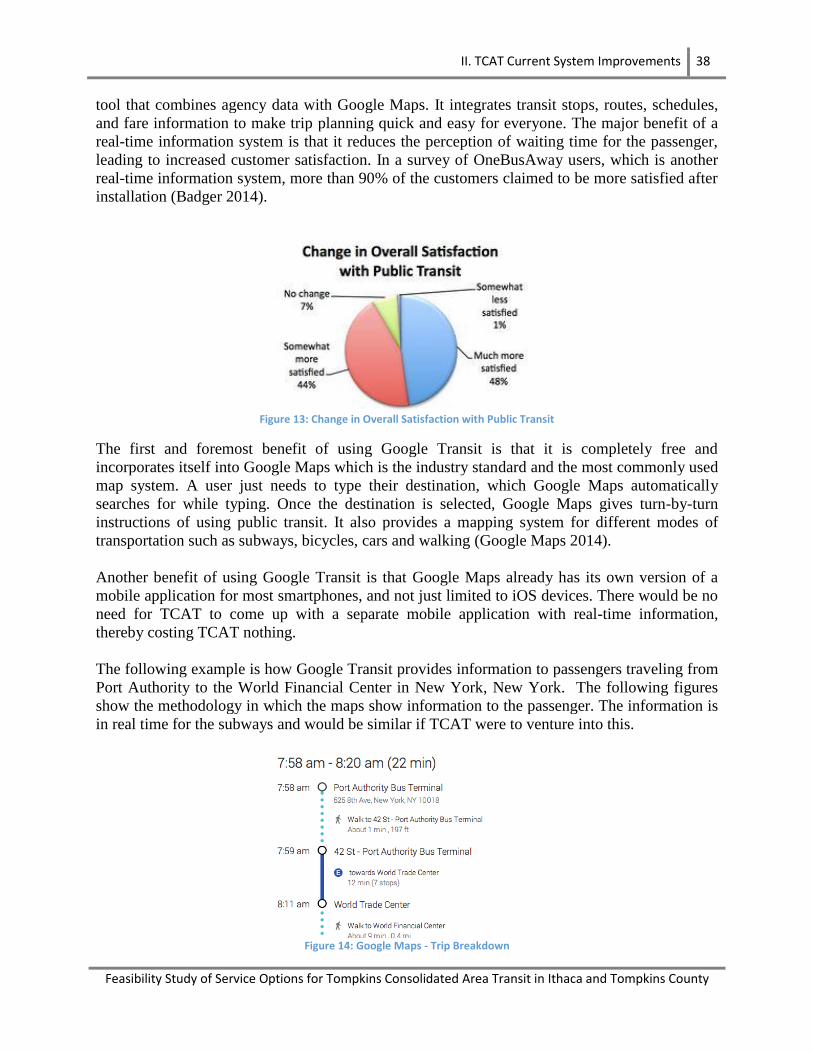
II. TCAT Current System Improvements 38
Feasibility Study of Service Options for Tompkins Consolidated Area Transit in Ithaca and Tompkins County
tool that combines agency data with Google Maps. It integrates transit stops, routes, schedules,
and fare information to make trip planning quick and easy for everyone. The major benefit of a
real-time information system is that it reduces the perception of waiting time for the passenger,
leading to increased customer satisfaction. In a survey of OneBusAway users, which is another
real-time information system, more than 90% of the customers claimed to be more satisfied after
installation (Badger 2014).
Figure 13: Change in Overall Satisfaction with Public Transit
The first and foremost benefit of using Google Transit is that it is completely free and
incorporates itself into Google Maps which is the industry standard and the most commonly used
map system. A user just needs to type their destination, which Google Maps automatically
searches for while typing. Once the destination is selected, Google Maps gives turn-by-turn
instructions of using public transit. It also provides a mapping system for different modes of
transportation such as subways, bicycles, cars and walking (Google Maps 2014).
Another benefit of using Google Transit is that Google Maps already has its own version of a
mobile application for most smartphones, and not just limited to iOS devices. There would be no
need for TCAT to come up with a separate mobile application with real-time information,
thereby costing TCAT nothing.
The following example is how Google Transit provides information to passengers traveling from
Port Authority to the World Financial Center in New York, New York. The following figures
show the methodology in which the maps show information to the passenger. The information is
in real time for the subways and would be similar if TCAT were to venture into this.
Figure 14: Google Maps - Trip Breakdown
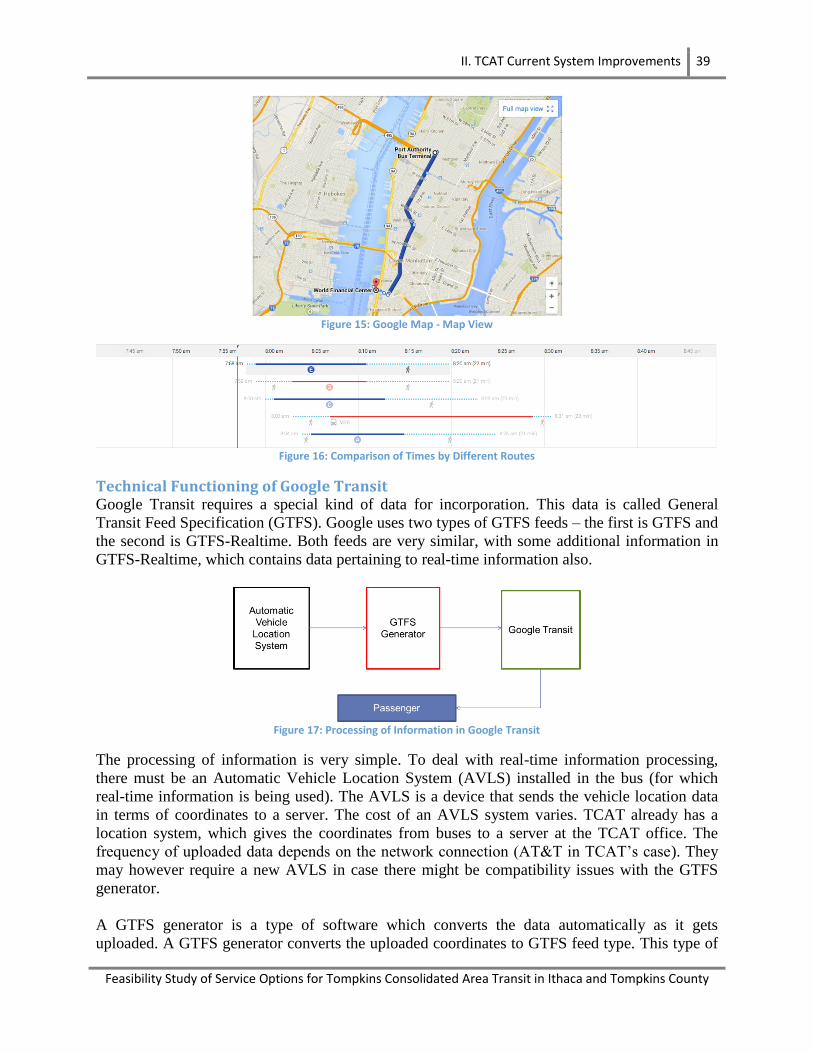
II. TCAT Current System Improvements 39
Feasibility Study of Service Options for Tompkins Consolidated Area Transit in Ithaca and Tompkins County
Figure 15: Google Map - Map View
Figure 16: Comparison of Times by Different Routes
Technical Functioning of Google Transit Google Transit requires a special kind of data for incorporation. This data is called General
Transit Feed Specification (GTFS). Google uses two types of GTFS feeds – the first is GTFS and
the second is GTFS-Realtime. Both feeds are very similar, with some additional information in
GTFS-Realtime, which contains data pertaining to real-time information also.
Figure 17: Processing of Information in Google Transit
The processing of information is very simple. To deal with real-time information processing,
there must be an Automatic Vehicle Location System (AVLS) installed in the bus (for which
real-time information is being used). The AVLS is a device that sends the vehicle location data
in terms of coordinates to a server. The cost of an AVLS system varies. TCAT already has a
location system, which gives the coordinates from buses to a server at the TCAT office. The
frequency of uploaded data depends on the network connection (AT&T in TCAT’s case). They
may however require a new AVLS in case there might be compatibility issues with the GTFS
generator.
A GTFS generator is a type of software which converts the data automatically as it gets
uploaded. A GTFS generator converts the uploaded coordinates to GTFS feed type. This type of
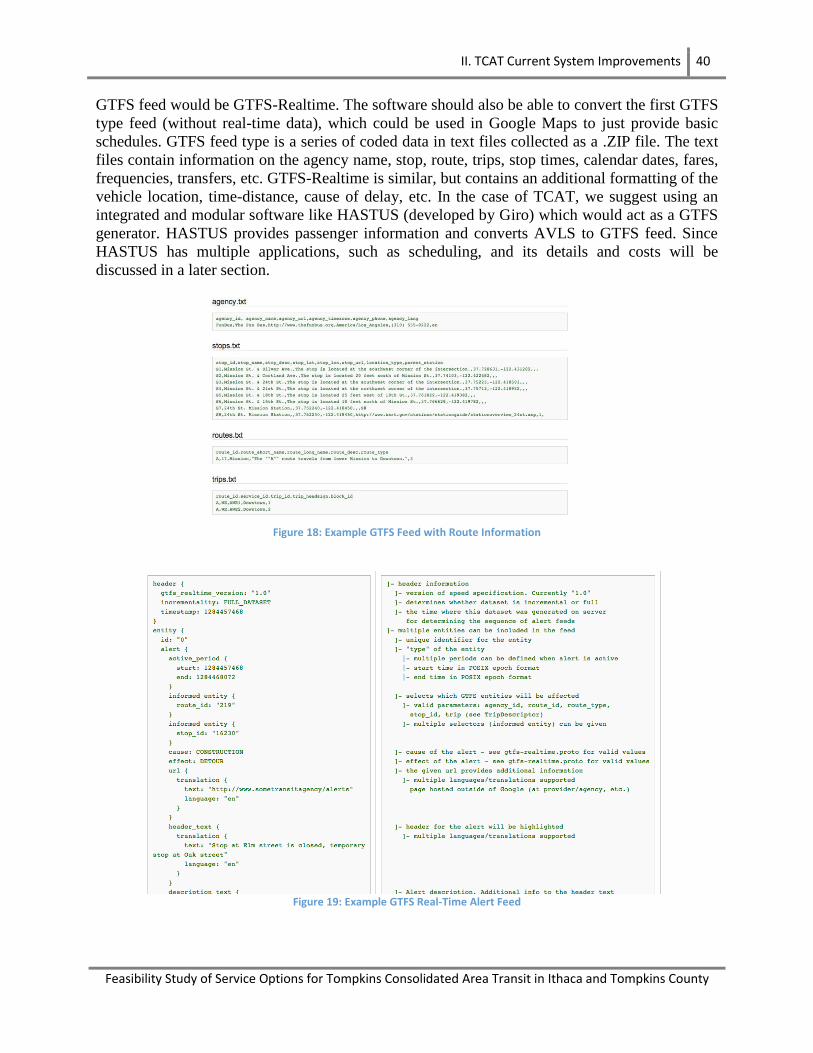
II. TCAT Current System Improvements 40
Feasibility Study of Service Options for Tompkins Consolidated Area Transit in Ithaca and Tompkins County
GTFS feed would be GTFS-Realtime. The software should also be able to convert the first GTFS
type feed (without real-time data), which could be used in Google Maps to just provide basic
schedules. GTFS feed type is a series of coded data in text files collected as a .ZIP file. The text
files contain information on the agency name, stop, route, trips, stop times, calendar dates, fares,
frequencies, transfers, etc. GTFS-Realtime is similar, but contains an additional formatting of the
vehicle location, time-distance, cause of delay, etc. In the case of TCAT, we suggest using an
integrated and modular software like HASTUS (developed by Giro) which would act as a GTFS
generator. HASTUS provides passenger information and converts AVLS to GTFS feed. Since
HASTUS has multiple applications, such as scheduling, and its details and costs will be
discussed in a later section.
Figure 18: Example GTFS Feed with Route Information
Figure 19: Example GTFS Real-Time Alert Feed

II. TCAT Current System Improvements 41
Feasibility Study of Service Options for Tompkins Consolidated Area Transit in Ithaca and Tompkins County
The last step in the process is uploading the .ZIP file containing the GTFS feed files to Google
Transit. All the generator needs to do is upload the .ZIP file to hosted server. Google will
automatically fetch the .ZIP file from this server. To set up this relationship with Google, the
agency would have to contact the Google Transit team. The feed then automatically gets
incorporated to Google Maps. The agencies can preview the working of their feed privately
before opening to the public. Details of steps of incorporation are available in the Google Maps
website (Google Maps 2014).
Once the data is in Google Maps, all the passenger needs to do is use Google Maps on a normal
browser or on his or her smartphone, free of cost. This way, real-time information would be
provided to passengers, leading to a higher customer satisfaction.
Ambiguous Naming System The current TCAT naming system for bus routes has ambiguous meanings depending on the
route and direction of the bus. For the routes that are not a loop, TCAT employs an “inbound”
and “outbound” naming system. “Inbound” generally means that the bus is headed to downtown
Ithaca and “outbound” means that the bus is headed away from downtown Ithaca.
Figure 20: Route 20 and Route 30 with Inbound and Outbound Naming
Route 20 and Route 30, for example, demonstrate the ambiguity of the “inbound” and “outbound”
naming system. For Route 20, inbound means that the bus is headed to the College of Veterinary
Medicine at Cornell when coming from Enfield, but for Route 30 inbound means that the bus is
headed to downtown Ithaca when coming from Ithaca Mall. Inbound naming is inconsistent
across all routes that use this naming system.
Proposed Solution: Direction-bound Naming System Our solution is to have a direction-bound naming system that could easily identify where the bus
is headed. The direction-bound naming clearly shows which direction the bus headed and is
consistent across all routes.
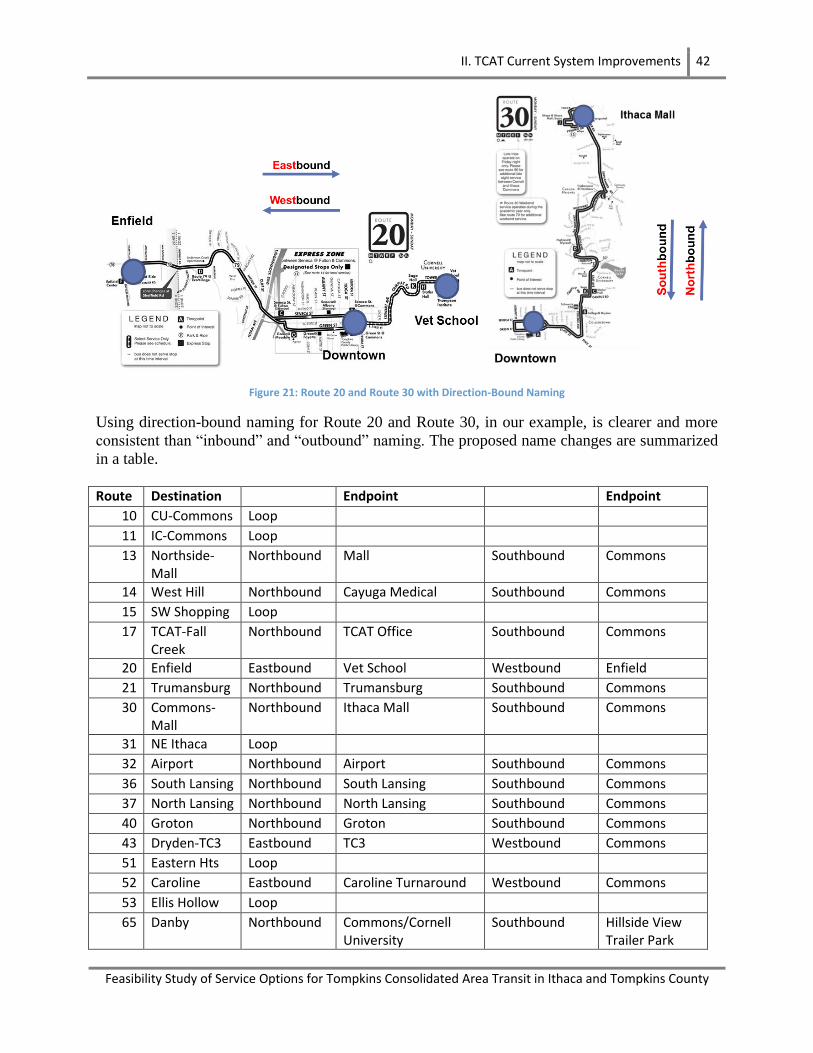
II. TCAT Current System Improvements 42
Feasibility Study of Service Options for Tompkins Consolidated Area Transit in Ithaca and Tompkins County
Figure 21: Route 20 and Route 30 with Direction-Bound Naming
Using direction-bound naming for Route 20 and Route 30, in our example, is clearer and more
consistent than “inbound” and “outbound” naming. The proposed name changes are summarized
in a table.
Route Destination Endpoint Endpoint
10 CU-Commons Loop
11 IC-Commons Loop
13 Northside-Mall
Northbound Mall Southbound Commons
14 West Hill Northbound Cayuga Medical Southbound Commons
15 SW Shopping Loop
17 TCAT-Fall Creek
Northbound TCAT Office Southbound Commons
20 Enfield Eastbound Vet School Westbound Enfield
21 Trumansburg Northbound Trumansburg Southbound Commons
30 Commons-Mall
Northbound Ithaca Mall Southbound Commons
31 NE Ithaca Loop
32 Airport Northbound Airport Southbound Commons
36 South Lansing Northbound South Lansing Southbound Commons
37 North Lansing Northbound North Lansing Southbound Commons
40 Groton Northbound Groton Southbound Commons
43 Dryden-TC3 Eastbound TC3 Westbound Commons
51 Eastern Hts Loop
52 Caroline Eastbound Caroline Turnaround Westbound Commons
53 Ellis Hollow Loop
65 Danby Northbound Commons/Cornell University
Southbound Hillside View Trailer Park
II. TCAT Current System Improvements 43
Feasibility Study of Service Options for Tompkins Consolidated Area Transit in Ithaca and Tompkins County
67 Newfield Northbound Commons/Cornell University
Southbound Newfield
70 Weekend Mall
Northbound Ithaca Mall Southbound Commons
72 Weekend Airport
Northbound Airport Southbound Commons
74 Weekend Groton
Northbound Groton Southbound Commons
75 Weekend Dryden
Eastbound TC3 Westbound Commons
81 C.U. Wkday Loop
82 C.U. Wkday Loop
83 C.U. Wkday Loop
90 C.U. Night Loop
92 C.U. Night Loop
93 C.U. Night Loop
One of the limitations of this solution is that if the current TCAT riders are already accustomed
to “inbound” and “outbound” naming system, then it will be difficult for them to understand this
new naming system.
A few routes, such as Routes 81 through 93 on the table above, are considered loops in the
current naming system, even though they do not run in a circular route. Although this is
ambiguous, there is no proposed change to these routes. This took into account the fact that these
routes are relatively shorter than other routes and do not have a clear direction for their stops. For
example, Route 81 starts at A Lot in the north, goes south and takes a turn towards B Lot in the
east, and returns to A Lot along the same path. Because of this, naming these routes either
Northbound or Eastbound would be confusing. Furthermore, these routes are already name as
loops, which are how most passengers know them, and are comfortable with them. This would
not contradict the proposed naming system.
Scheduling Buses and Drivers There is no software at TCAT dedicated for driver and vehicle scheduling. The current process
involves using Microsoft Excel and a long, tedious process of trial and error to have bus drivers
have their 40-hour work week, ensuring all the routes at TCAT are covered, and complying with
union rules. The staff may get a solution from Excel that may not be the optimal solution.
Because this scheduling method is done manually, it is not easy to make changes to one driver’s
schedule and immediately see the effects of these changes. Driver and vehicle scheduling is very
critical to any transit company because it is important to optimize their resources (their drivers
and vehicles) and to also reduce staff time for scheduling processes.
According to Torrance et al.’s paper, “Vehicle and Driver Scheduling for Public Transit,” there
are four steps to driver and vehicle scheduling:
II. TCAT Current System Improvements 44
Feasibility Study of Service Options for Tompkins Consolidated Area Transit in Ithaca and Tompkins County
1. Trip building: This step determines time tables for scheduling vehicles to arrive at
specified locations at specified times. This will help determine the master schedule.
2. Blocking: This step involves creating a sequence of trips made by a single bus. The
blocks can then be divided among different drivers.
3. Runcutting: This step assigns drivers to vehicles, determining the number of drivers that
the transit agency will need in order to operate in compliance with the master schedule.
4. Rostering: This step involves grouping daily operator runs into a weekly run package and
finding individual drivers to fulfill each role. (Torrance, Haire and Machemehl 2009)
This may seem pretty straightforward, but there are constraints with driver and vehicle
scheduling that make scheduling a challenge. With drivers, they need to have a legal set of shifts
that also cover the blocks of the vehicle schedule. On top this, there are local and national rules
that need to be considered such as total work hours, days off per week, meal breaks per shift, etc.
The goal of driver scheduling is to minimize the amount of changes made.
With vehicles, there are problems with determining span of service, assigning vehicles to routes,
and ensuring that the vehicles have recovery time and that the blocks are satisfied. Also, there are
challenges with vehicle scheduling especially when there are changes in services between
weekdays and weekends. The goal of vehicle scheduling is to maximize the number of hours the
vehicles would transport passengers.
Proposed Solution: HASTUS Our solution to the manual driver and vehicle scheduling system is to employ software that
automatically does this. Torrance et al. found that the 20 largest transit companies in the US,
based on data of annual passenger trips, used two programs for transit scheduling. The two
programs are TRAPEZE, developed by the Trapeze Group, and HASTUS, developed by Giro,
Inc. in Montreal. The goal of both of these programs is to minimize the costs with the drivers and
the vehicles required to operate a transit service. Both programs try to solve the same problem
but have slightly different methods to solve it.
The benefits of using software such as TRAPEZE or HASTUS are that more efficient schedules
will be created which reduces costs, less staff time will be allocated to driver and vehicle
scheduling, and there could be more flexibility in scheduling.
We propose using HASTUS over TRAPEZE for TCAT. It is used over by 250 bus and rail
companies, which include New York City Transit (MTA NYCT), Chicago Transit Authority
(CTA), and Santa Cruz METRO (California Transit). The optimization tool, developed over 25
years ago, has evolved to adapt to the needs of individual transit companies. A great feature
about this software is that it can solve vehicle and driver scheduling problems jointly or
separately. It cuts blocks into pieces of work, matches pieces of work to form drivers’ schedules,
assigns the actual operators, and finally improves the solution heuristically.
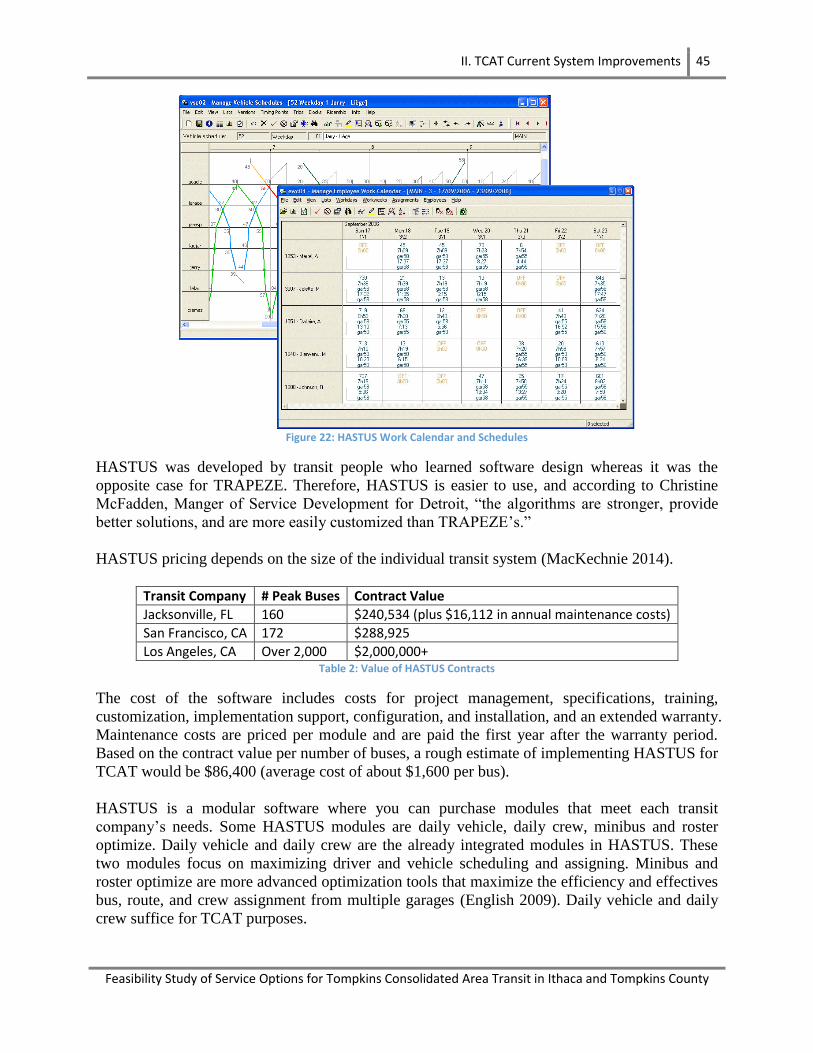
II. TCAT Current System Improvements 45
Feasibility Study of Service Options for Tompkins Consolidated Area Transit in Ithaca and Tompkins County
Figure 22: HASTUS Work Calendar and Schedules
HASTUS was developed by transit people who learned software design whereas it was the
opposite case for TRAPEZE. Therefore, HASTUS is easier to use, and according to Christine
McFadden, Manger of Service Development for Detroit, “the algorithms are stronger, provide
better solutions, and are more easily customized than TRAPEZE’s.”
HASTUS pricing depends on the size of the individual transit system (MacKechnie 2014).
Transit Company # Peak Buses Contract Value
Jacksonville, FL 160 $240,534 (plus $16,112 in annual maintenance costs)
San Francisco, CA 172 $288,925
Los Angeles, CA Over 2,000 $2,000,000+ Table 2: Value of HASTUS Contracts
The cost of the software includes costs for project management, specifications, training,
customization, implementation support, configuration, and installation, and an extended warranty.
Maintenance costs are priced per module and are paid the first year after the warranty period.
Based on the contract value per number of buses, a rough estimate of implementing HASTUS for
TCAT would be $86,400 (average cost of about $1,600 per bus).
HASTUS is a modular software where you can purchase modules that meet each transit
company’s needs. Some HASTUS modules are daily vehicle, daily crew, minibus and roster
optimize. Daily vehicle and daily crew are the already integrated modules in HASTUS. These
two modules focus on maximizing driver and vehicle scheduling and assigning. Minibus and
roster optimize are more advanced optimization tools that maximize the efficiency and effectives
bus, route, and crew assignment from multiple garages (English 2009). Daily vehicle and daily
crew suffice for TCAT purposes.

II. TCAT Current System Improvements 46
Feasibility Study of Service Options for Tompkins Consolidated Area Transit in Ithaca and Tompkins County
Further analysis needs to be done to see if the benefits from using this software outweigh the
potential costs of a HASTUS contract.
Conclusion In summary, our recommended solutions to each problem we identified are as follows.
Declining Route 13 ridership and high morning demand
- A new high performance campus route, “Route 84”
No real-time information
- Google Transit
Ambiguous naming system
- Simple direction-bound naming system
No concrete driver and vehicle scheduling program
- HASTUS
The next step is for TCAT to determine which proposed solutions would be the best for them
within their budget constraints and with greatest ease of implementation. Further inquiry needs to
be put into Google Transit and HASTUS to obtain more accurate estimates for the cost of
integrating the systems into TCAT and the time it will take to implement them. What will be
important for this upcoming August is to figure out how to tackle morning demand as this school
year is coming to a close and there will be even more Cornell students who would like to use
TCAT to get to their classes.
It is important for TCAT to always look for ways to improve their internal infrastructure to not
only better serve themselves but most importantly their riders. We believe that these proposed
solutions would benefit all the stakeholders for TCAT and would improve their current system.
III. Environmentally-Friendly Buses 47
Feasibility Study of Service Options for Tompkins Consolidated Area Transit in Ithaca and Tompkins County
III. Environmentally-Friendly Buses
Introduction Every day new technology appears: new devices, new products, new airplanes, and new cars. In
this fast-paced technologically advancing world we discover new ways to harness energy. The
scientific community also comes up with new discoveries concerning health issues and how
vehicle exhaust gases affect our health and well-being. With these factors in mind, we chose to
study the new powertrain technologies that are promising to cut greenhouse gases and other
pollutants in public transport systems. Many fuel systems exist that use the same basic principles
of internal combustion engines, others have been developed to provide electricity to electric
motors, and others have now been developed as turbines. Not all of these fuel systems are
technically viable though, and on our study we have focused onto four fuel systems that are in
current use or in active development, with promising results. These are biodiesel, hybrid diesel
electric, compressed natural gas and hydrogen fuel cells.
Motivation Conventional engines cause pollution and emit greenhouse gases in large quantities, as can be
seen in large cities, and eventually cause health hazards. We believe that people in Ithaca would
prefer to stay out of that list of polluted cities, and TCAT can help by exploring new
technologies that reduce emissions. Currently, in the US there are tax breaks for low emission
passenger vehicles. These are unlikely to apply to buses, but in the future there may be similar
tax breaks placed for low emission buses. Another motive to explore these options is the fact that
waste can and is used to generate biofuels in many places around the country, and synergy
between waste disposal companies and TCAT could lead to fuel cost cutting for TCAT.
Improvements in fuel efficiency can also lead to fuel cost reduction, as well as emissions
reductions. In all, many positive aspects can be found in exploring new technologies that would
make it worthwhile.
Pollutants Carbon dioxide (CO2) is the most important greenhouse gas emission worldwide. It is produced
by combustion from almost every fossil fuel, and is a major cause of climate change.
Nitrogen oxides (NOx) are polluting gases, produced by high temperatures found inside a diesel
engine. They cause ground level ozone, which is a harmful pollutant gas.
Non-methane hydrocarbons (NMHC) are highly harmful gases, often carcinogens, products of
gas leaks, volatile products in petroleum derivates and incomplete combustion inside engines.
Some of these gases have also been linked with the greenhouse effect.
Carbon monoxide (CO) is also a very harmful gas, poisonous for humans in high quantities, and
also an important factor in the formation of ground level ozone, which is harmful to lungs.
III. Environmentally-Friendly Buses 48
Feasibility Study of Service Options for Tompkins Consolidated Area Transit in Ithaca and Tompkins County
Particulate matter (PM) are solid particles formed inside the combustion chamber that become
suspended in the atmosphere in highly polluted cities. It is highly related to serious health
hazards, including lung cancer and other cardiopulmonary affections.
Fuels Biodiesel is actually oil derived from animal or plants, usually mixed with mineral diesel
between 5% and up to 100% biodiesel. The percentage of the mixture is represented as a capital
B followed by a number, representing the percentage of biodiesel in the mixture. For our study,
we evaluated the effect of 20% biodiesel, which is represented as B20.
Hybrid diesel electric vehicles have an electric motor and a battery, which work in conjunction
with a conventional diesel engine to improve its efficiency, mileage and range. Various hybrid
systems exist in cars and buses, with positive results in miles per gallon (mpg) and emissions
reductions for both.
Compressed natural gas (CNG) is currently used in power generation all around the world, and is
also used in several parts of the world as a fuel for vehicles, mainly due to its low price and its
reduced CO2 emissions compared to diesel and gasoline.
Hydrogen fuel cells are a relatively new system that uses hydrogen atoms to power an electric
motor, and this system produces water vapor as the only exhaust emissions, which means the
only emissions come from the production of pure hydrogen.
Each of these alternative fuels promise benefits, which certainly will come at a cost, and we will
analyze the experience of other public transport operators to come up with alternatives for TCAT.
Parameters for Evaluation Switching an entire bus fleet of 54 buses from one fuel system to another would mean incurring
in purchasing costs, fuel costs, maintenance costs, amongst others. It would also mean change in
the amount of emissions, potential fuel cost savings and an entirely new required price scheme
for TCAT to be able to pay its bills. We have considered the aforementioned factors and grouped
them in the following parameters to evaluate what the best option would be for TCAT.
Yearly cost of operation: The costs of operation will include labor costs, operation costs as
computed by other bus operators, fuel costs, and purchasing costs, spread over a 12 year period
with a 7% discount rate.
Operating expense per boarding: The total yearly costs of operation previously calculated will be
divided by the number of passengers served yearly by TCAT, to estimate the cost of each
passenger, and therefore the price TCAT would have to charge for it to break even in costs and
revenues.
Operating expense per revenue mile: The same yearly costs of operation previously calculated,
this time divided by the total amount of revenue miles, so as to have an estimation on what each
revenue mile (miles traveled by each passenger) to know what the cost of carrying a passenger
over one mile is for TCAT.

III. Environmentally-Friendly Buses 49
Feasibility Study of Service Options for Tompkins Consolidated Area Transit in Ithaca and Tompkins County
Fuel cost savings or expenses vs. diesel: This parameter will compare total savings (or expenses)
in fuel costs, compared to the conventional diesel bus system. Some fuel systems may be cheaper,
others may be more efficient.
Total annual emissions (combustion and production) for CO2, NOX, PM, NMHC, CO: Through
this parameter we will compare the total emissions by each fuel type, for a hypothetical entire
fleet. With this, we will compare the reduction in emissions compared to the current diesel fleet.
Cost per ton of CO2 reduction: With this parameter, we will compare the costs of operating the
current diesel fleet with each of the other fleets and the CO2 emissions, and come up with a
figure that will describe the hypothetical price TCAT would be paying for each ton of CO2 not
emitted with the current Diesel fleet. This factor could come in handy if in the near future, as
state or federal governments offer subsidies based on CO2 emissions reductions.
Bus Types
Electric Buses The concept of electric vehicles has existed over a century, with numerous inventions adding to
its credit. In 1891, William Morrison built what is considered the first successful electric vehicle
in the United States. Morrison’s car was equipped with a 4 horsepower motor, and a power
supply which consisted of a 24-cell battery. The car was capable of traveling at approximately 22
km per hour, or 13 miles per hour. The first large scale U.S. manufacturer of electric vehicles
was the Pope Manufacturing Company of Hartford, Connecticut, whose car was capable of
traveling at 22 km per hour, with a range of 48 km per charge (Monaco 2011). Because these
cars had a short range, they were not widely popular.
Gas powered vehicles became the standard with the mass production of Henry Ford’s Model T,
along with Charles Kettering’s electric automobile starter, which eliminated the need to hand
crank. In the 1960s and 1970s, further research and development of electric vehicles became
more prominent because of the rise in fuel costs and fear of exhausting fuel supplies. In the late
1990s, General Motors began producing the EV1, the first electric car of the modern era to be
mass produced, but was also extremely expensive (Romero 2009). The Tesla Roadster,
manufactured by Tesla Motors in California and first became available in 2006, started at
$90,000, which shocked many consumers. With a lithium-ion battery, the vehicle could travel
245 miles (Kelty, et al. 2006).
It comes to the same situation when it concerns buses. The oldest kind of electric buses that can
be seen are trolleybuses. These buses are powered by overhead electric wires than run
throughout the route of the bus. The first demonstration was done in 1882, in Berlin. After that,
Leeds and Bradford in Great Britain introduced the trolleybus in 1911. Trolley buses are
uncommon in the United States today, although cities such as Philadelphia and Seattle do operate
them. They still exist in Europe and Asia (Dubar 1967).
Battery-powered electric buses were introduced in America after the research in battery storage
increased. With the improvement of lithium-ion batteries, it became viable for electric buses to
III. Environmentally-Friendly Buses 50
Feasibility Study of Service Options for Tompkins Consolidated Area Transit in Ithaca and Tompkins County
come to service. Major success of electric buses can be seen in Chattanooga, Tennessee (U.S.
Department of Energy 1997).
They have 16 electric buses which have been in operation since 1992 and have a range of 45 to
60 miles. Since September 2010 in the US, the first battery-electric, fast-charge bus has been in
operation in Pomona, California. The buses use lithium-titanate and are able to fast-charge in
fewer than ten minutes (Proterra Inc. 2010).
Types of Electric Buses in Use The two major types of autonomous electric buses available are the battery powered buses, and
the supercapacitor powered buses. Battery powered buses use chemical energy in the
rechargeable batteries to power the buses. These buses have a short range, and need to be
recharged for a long time at the recharge stations. Instead of recharging the bus, fully charged
batteries can be replaced after every charge cycle. In 2008, during the Beijing Olympics, 50
lithium-ion battery powered buses were used with a drive range of almost 120 km with a
replacement of battery after every 24 hours of charge (Sun 2007).
The supercapacitor-powered buses, also known as capabuses, have an extremely short range.
The supercapacitors are able to store only about 5% of the power lithium-ion batteries could
store. However, they have an extremely short recharge time, which makes them a convenient and
plausible solution (Hamilton 2009). Because of the low capacity, the capabuses need to charge
their batteries every few miles of operation (as low as 3.5 miles). Therefore, every such distance,
there is a stop that acts as a recharge point. The buses are recharged at these stops, giving them
enough energy to reach the next recharge stop. At each recharge point, the charger touches the
vehicle on top, and recharges it quickly. Recently, wireless induction charging of the ultra-
capacitors is being tested, where the charger is embedded in the ground in front of the bus stops,
quickly recharging the batteries. This is a very upcoming technology with major research being
done in this area, with some claiming that the research is moving faster than batteries (IDTechEx
2013). Sinautec Automobile Technologies in Virginia, in collaboration with its Chinese partner,
Shanghai Aowei Technology Development Company, has spent the past three years
demonstrating the approach of capabus technology with 17 forty-one seat municipal buses on the
outskirts of Shanghai (Hamilton 2009).
Cost and Feasibility The feasibility of electric vehicles has been increasing as research improves. The major concern
in terms of cost of electric vehicles is the high initial cost. However, it has great implications in
terms of fuel and maintenance savings. The electric buses in Chattanooga, Tennessee cost
$160,000 to $180,000 for the 22 feet and 31 feet vehicles respectively (U.S. Department of
Energy 1997). Proterra, a leading manufacturer of electric buses, estimates a total of $430,000 in
fuel savings, and another $75,000 to $150,000 in maintenance savings. Its estimated initial cost
for the Proterra EcoRide may exceed $950,000 (Proterra Inc. 2012). An additional cost for the
charging stations may be included, which might drive costs higher.
Environmental Impact of Electric Buses In the early 1990s, Oxford, England ran a test fleet of four electric minibuses and showed a
reduction of 21% CO2, 98% CO and a reduction of more than 95% particulates when compared
to diesel fueled buses (Smiler 2013). Capabuses also have a major environmental benefit. The
III. Environmentally-Friendly Buses 51
Feasibility Study of Service Options for Tompkins Consolidated Area Transit in Ithaca and Tompkins County
supercapacitors themselves are 70% recyclable. An assessment of capabuses in Beijing showed
that there was more than 25% reduction in CO2 levels and 80% NO2 levels when compared to
diesel fuel buses (Supercapacitor Buses 2012). Thus, assessment shows great improvement in air
quality and long lasting environmental benefits when compared to diesel fueled buses.
Future Prospects The future of electric vehicles depends on advancements in battery and charging technology. The
range, performance, price, reliability, and convenience factor must be at that of the gasoline-
powered automobile, if not superior, in order for them to become successful. Affordable all-
electric vehicles may become the standard if this technology advances.
Hybrid Buses Hybrid vehicle technology is not new; in fact it is very old. The first hybrid electric vehicle ever
was designed by Belgium carmaker Pieper in 1899 (Bouchat 2005). Not much later than that, the
Fischer Motor Vehicle Company designed the first hybrid electric omnibus in 1905. Due to mass
adoption of gasoline vehicles, hybrid vehicles fell into disuse until late in the twentieth century,
until various Asian and American companies manufacturing diesel-electric hybrid buses in the
1990s. Since then, gas prices and environmental awareness has caused manufacturers to flood
the market with different models of hybrid cars and buses.
Technology Hybrid-electric vehicles use one internal combustion engine and one electric engine in different
configurations to power the wheels. There are three different arrangements for hybrids: a parallel
system, where both the electric and the combustion engine are connected to the wheels; the series
system, where the internal combustion engine powers a generator that recharges a battery that in
turn powers the electric motor that turns the wheels; and a mixtures of both systems called series-
parallel hybrid that can split power from both sources and couple or decouple both engines from
the wheels as needed by the driver. In heavy vehicles (e.g. buses, trucks), an internal combustion
engine is used to power a generator that will power one or more electric motors connected to the
wheels. With this configuration, engines can be run at optimum efficiency and weight can be
saved by dispensing with very large gearboxes, greatly increasing fuel efficiency. Another
technology currently used in hybrids is regenerative braking, which means that when slowing
down or going down a slope, the electric engines can recover energy from the momentum of the
bus and recharge the batteries. These technologies have greatly increased fuel efficiency in
hybrid buses compared to conventional buses. Some new models have traded the internal
combustion diesel engine for gas turbines, which produce very little polluting particulate matter.
Adoption Car makers have been manufacturing hybrid vehicles since the beginning of the 21
st century, and
the sector has grown massively, reaching 2.2% of all car sales in the United States and 17.1% in
Japan in 2011. Many car makers have been releasing hybrid versions of their standard models
and this has helped increase adoption in the US and Europe. However, due to the increased
complexity of the drivetrain and the cost of the battery and extra electrical system, hybrid cars
turn out to be much more expensive than their conventional counterparts, both in manufacturing
and maintenance, and this has been one of the major barriers holding back this technology.
Hybrid systems for mass transit do not escape from these problems. The goal of hybrid bus
III. Environmentally-Friendly Buses 52
Feasibility Study of Service Options for Tompkins Consolidated Area Transit in Ithaca and Tompkins County
manufacturers is to surpass these hurdles by offering very efficient vehicles that save money on
fuel for adopters and offer cleaner emissions for citizens.
Currently, hybrid buses had been adopted by 69 transit authorities in different cities in the US
and more than 45 cities worldwide (Federal Transit Administration 2005). Different agencies
worldwide fund the deployment of hybrid buses, namely the Department of Energy in the United
States and the Green Bus Fund in the United Kingdom. Some of these cities do not have full
deployment of hybrids, and in other cities hybrid buses are deployed as test units.
Benefits Due to the nature of the diesel engine cycle, which uses high compression to spontaneously
combust fuel, high polluting nitrous oxides and carbon monoxide and dioxide are released
through the exhaust pipe, together with particulate matter produced by impurities in the diesel
fuel. Thanks to the increased efficiency on which combustion engines can run on hybrid systems,
particulate matter emissions can be cut by 90%, NOx emissions can be reduced by 50%, and
carbon emissions are reduced proportionally to fuel consumption reduction; however, these
numbers will vary depending on driving habits. Bus tests in London have claimed fuel savings of
30% (Transport for London 2014), and manufacturers like Volvo claim similar numbers. The
most impressive numbers (Volvo 2011), however, have been shown in tests in Sweden, where
hybrid buses with plug-in capability (where batteries can be recharged by directly connecting the
bus to the electrical grid) have shown decreased fuel consumption by 81%, for a total of 11 liters
per 100 km (21 mpg), where standard numbers for buses are 3 to 4 mpg.
Cons As mentioned before, the increased complexity in hybrid systems, coupled with all the
technological developments required for feasible hybrids, dramatically increase bus prices.
According to one study for a city in the state of Indiana, US, conventional buses can cost around
$335,000 and the price for hybrids is $540,000. Also, as the powertrain of buses becomes more
complex, it becomes harder and more expensive to maintain and repair. When considering the
purchase of hybrid buses, transit agencies must account for these increased costs and balance
with fuel savings and cleaner emissions. Batteries are one of the main components on hybrid
vehicles, and the new generation of hybrids uses mostly NiMH and lithium-ion batteries.
Lithium is being mined extensively to satisfy the increasing demand for batteries around the
world, but there are few places where this metal can be found. This makes it subject to
geopolitical conflict and volatile prices.
In the Future With mass deployment of hybrid buses, economies of scale can be achieved and manufacturers
will be able to greatly decrease prices for these buses. However, in the future, the internal
combustion engine will still be emitting high polluting gases, so hybrids are a short and mid-term
solution to pollution and climate change issues. On the other hand, other technologies require
great investments in infrastructure, which is not the case with hybrid systems, so this technology
will be massively deployed in the next decades while the current generation depends on fossil
fuels.
Hydrogen Buses Hydrogen buses exist in the market today in different design configurations, including hydrogen
III. Environmentally-Friendly Buses 53
Feasibility Study of Service Options for Tompkins Consolidated Area Transit in Ithaca and Tompkins County
fueled internal combustion engines and many variants of fuel cells. Fuel cells are
electromechanical conversion devices that use a chemical reaction between oxygen, hydrogen
and a catalyst (usually platinum) to produce water and electricity. Unlike batteries which die out
when the energy within it depletes, fuel cells continue to produce a charge as long as fuel is
supplied.
Modern fuel cell systems used in automobiles are based on Proton Exchange Membrane (PEM)
stacks. Each fuel cell designed for use in these vehicles produces 1.6V of electricity, which is far
from sufficient to power a vehicle. As a result, multiple fuel cells are arranged in a stack. The
power output of a fuel cell stack depends on the number and the size of individual fuel cells
assembled in the stack (U.S. Department of Energy 2014). Energy storage systems of these
vehicles are generally based on battery packs (NiMH or Li-ion) and ultra-capacitors. Hydrogen
storage systems are generally based on Type III cylinder technology, storing compressed
hydrogen at a pressure of 350 bar. Liquid cooled systems with radiators to dissipate the heat are
used to cool the fuel cells by most manufacturers (Zaetta and Madden 2011).
In a hydrogen internal combustion engine, hydrogen is burnt instead of gasoline and the energy
released in the form of heat is made to do useful work by pushing a piston. These engines can be
either cylindrical or rotary. The energy efficiency of a hydrogen ICE is 20 to 25% better than a
gasoline engine due to a leaner air-to-fuel and compression ratios.
Current Trends in the Technology “Hydrogen fueled buses: The Bavarian fuel cell bus project” by Gruber et al. provides details of
the impact of the prototype hydrogen bus that was implemented in the city of Munich, Germany
for public passenger transport. The report states that the drive system of these buses was found to
be superior to their diesel counterparts when utilized at 75% of its designed capacity. The fuel
efficiency was also found to be better when compared with heavy duty vehicles. The drivers also
observed no difference in the handling of these buses compared with diesel buses (Gruber and
Wurster n.d.).
Recently, the BC Transit fleet in Whistler, British Columbia with 20 hydrogen fuel-cell buses is
reported to have reduced carbon dioxide emissions by more than 4,400 tons over five years.
However, due to high cost to fuel and maintain these buses, BC Transit is replacing its hydrogen
bus fleet with diesel buses (Zeidler 2013).
In the HyFLEET:CUTE (Clean Urban Transport for Europe) project implemented across nine
cities globally, a fleet of 33 buses achieved an average speeds of 10.2 miles per hour and a fuel
consumption of 21.9 kg per 100 km, or 9.94 mpg for a diesel equivalent. On the negative side,
the project observed degradation of the performance of the fuel stack with time due to the
increased levels of pollutants in the hydrogen fuel. One of the interesting facts reported was that
given a choice between a conventional bus and a hydrogen bus, the majority of people preferred
the hydrogen bus option (HyFLEET:CUTE 2009). This suggests a growing acceptance of this
technology among the general public.
Cost Each of the hydrogen fuel cell buses costs close to two million dollars, which is almost four
times of what the conventional diesel buses cost. The hydrogen fuel cells cost $2.28 per km,
III. Environmentally-Friendly Buses 54
Feasibility Study of Service Options for Tompkins Consolidated Area Transit in Ithaca and Tompkins County
which is three times the cost of diesel. The maintenance cost for these buses is $1.00 per km as
opposed to 65 cents per km for diesel buses (Sinoski 2013). However, these comparisons should
be kept in context, since the hydrogen buses are at a prototype stage and prices could be expected
to fall if they are mass-produced.
Advantages and Limitations Hydrogen buses have the following advantages.
• Improved fuel efficiency, 2 to 3 times more fuel efficient than combustion engines.
• Greenhouse gas emission reductions.
• Air quality is improved by a decrease of NOX emissions and particulate matter in the air.
• Better rider experience, as the fuel cells are silent.
• Hydrogen is an abundant, clean and renewable resource.
However, there are still various technical and commercial constraints that ail this technology.
• Fill time of hydrogen bus vehicles is around ten minutes as compared to three minutes for
diesel buses, which poses a hindrance for bus operators with large fleets.
• The lack of high availability of hydrogen fueling stations.
• The total cost of operating a hydrogen bus is significantly higher than that of a diesel bus.
• Higher maintenance cost.
Future of Hydrogen Buses The recent advancements in alternate fuel technology is fast beckoning a paradigm shift in the
transportation system. The hydrogen bus performance and fuel cell system durability have
continued to demonstrate improvements; however, there are still barriers that restrict the fuel cell
technology from becoming a viable commercial product. Increasing the reliability of components
and lowering capital and operating costs are some of the areas in which the industry needs to
focus (Eudy and Gikakis 2013).
The cost of hydrogen and capital investment is likely to go down with the start of mass
production and increased spread of hydrogen vehicles. The PEM fuel cell price is expected to
drop significantly as the production of these fuel cells increases. Despite the challenges that
remain in hydrogen vehicle technology, the hydrogen buses continue to show progress towards
meeting the technical targets for commercialization.
Emission and Cost Analysis of Alternate Fuel Type Buses The purpose of this study was to evaluate the alternate fuel type buses that TCAT could look
towards procuring in the future that would be financially viable and environmentally friendly at
the same time. This report presents emission and cost analysis, comparing diesel buses with its
diesel-hybrid, hydrogen fuel cell, CNG, and biodiesel counter parts.
As of 2012 the TCAT fleet consisted of a total of 54 buses comprising of 42 diesel, eight hybrid,
and four gasoline operated buses. To assess the potential environmental and financial impacts of
the alternate fuel type buses, the study assumed an entire fleet of 54 buses of the different fuel
technologies. Table 4 lists a detail account of assumptions of the report.
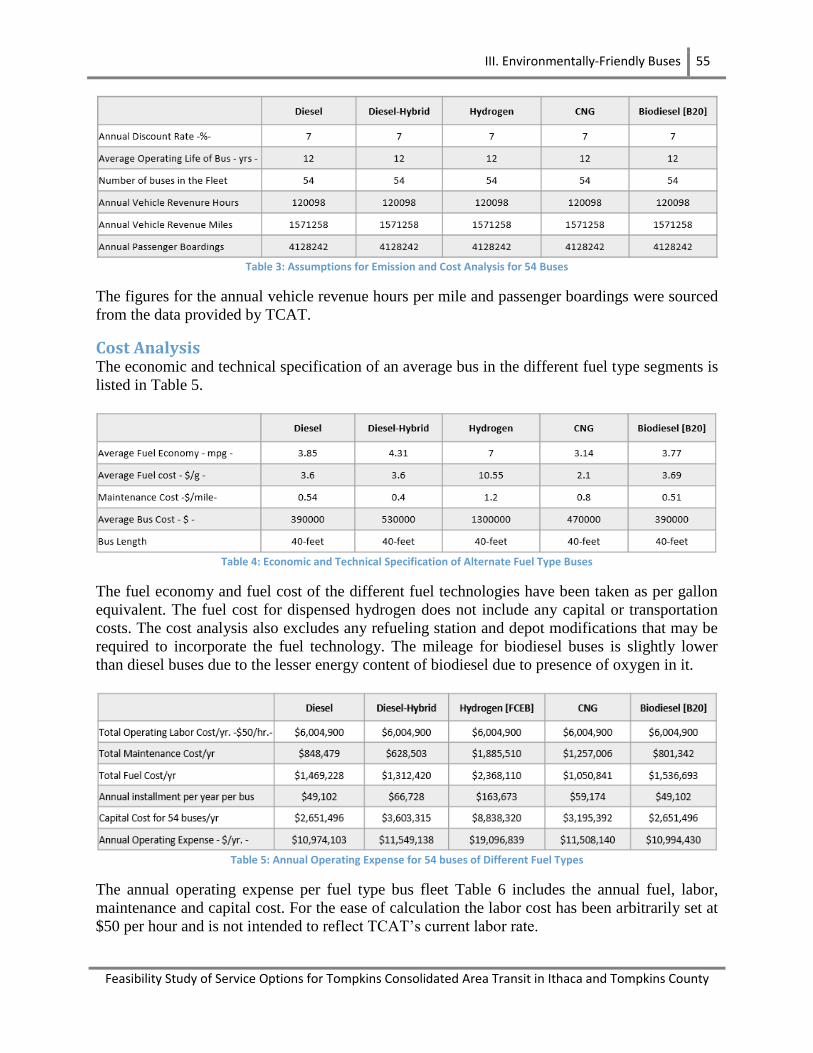
III. Environmentally-Friendly Buses 55
Feasibility Study of Service Options for Tompkins Consolidated Area Transit in Ithaca and Tompkins County
Table 3: Assumptions for Emission and Cost Analysis for 54 Buses
The figures for the annual vehicle revenue hours per mile and passenger boardings were sourced
from the data provided by TCAT.
Cost Analysis The economic and technical specification of an average bus in the different fuel type segments is
listed in Table 5.
Table 4: Economic and Technical Specification of Alternate Fuel Type Buses
The fuel economy and fuel cost of the different fuel technologies have been taken as per gallon
equivalent. The fuel cost for dispensed hydrogen does not include any capital or transportation
costs. The cost analysis also excludes any refueling station and depot modifications that may be
required to incorporate the fuel technology. The mileage for biodiesel buses is slightly lower
than diesel buses due to the lesser energy content of biodiesel due to presence of oxygen in it.
Table 5: Annual Operating Expense for 54 buses of Different Fuel Types
The annual operating expense per fuel type bus fleet Table 6 includes the annual fuel, labor,
maintenance and capital cost. For the ease of calculation the labor cost has been arbitrarily set at
$50 per hour and is not intended to reflect TCAT’s current labor rate.
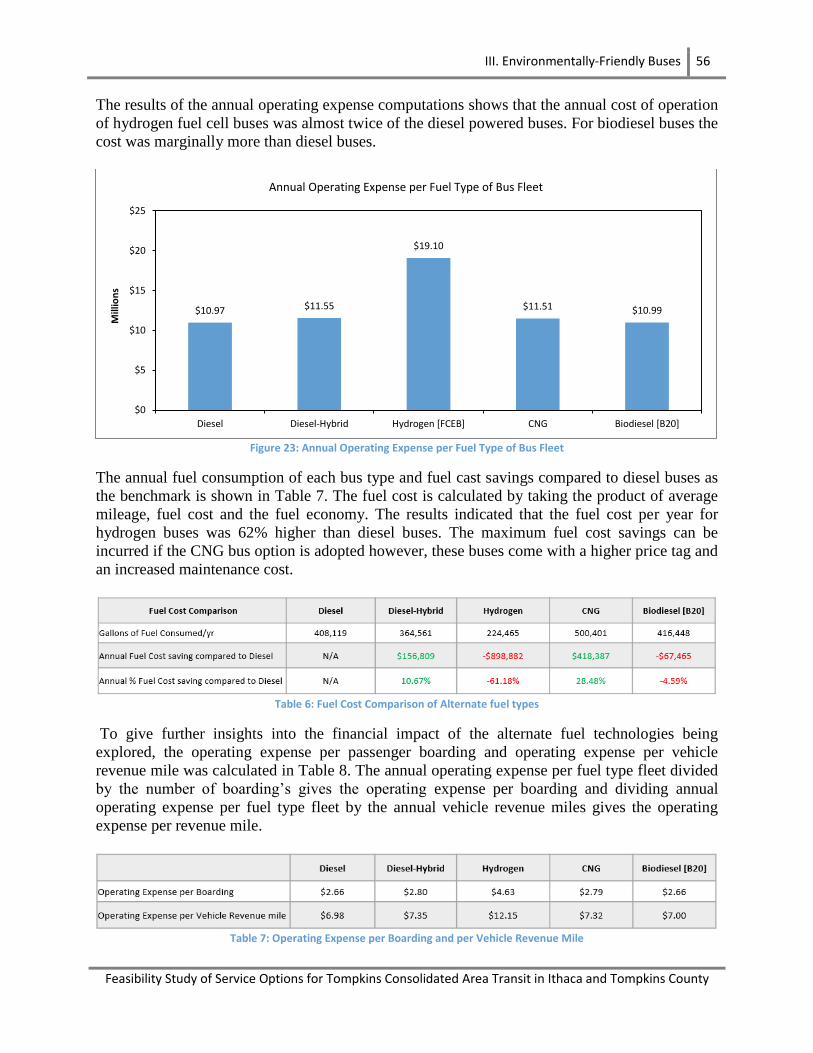
III. Environmentally-Friendly Buses 56
Feasibility Study of Service Options for Tompkins Consolidated Area Transit in Ithaca and Tompkins County
The results of the annual operating expense computations shows that the annual cost of operation
of hydrogen fuel cell buses was almost twice of the diesel powered buses. For biodiesel buses the
cost was marginally more than diesel buses.
Figure 23: Annual Operating Expense per Fuel Type of Bus Fleet
The annual fuel consumption of each bus type and fuel cast savings compared to diesel buses as
the benchmark is shown in Table 7. The fuel cost is calculated by taking the product of average
mileage, fuel cost and the fuel economy. The results indicated that the fuel cost per year for
hydrogen buses was 62% higher than diesel buses. The maximum fuel cost savings can be
incurred if the CNG bus option is adopted however, these buses come with a higher price tag and
an increased maintenance cost.
Table 6: Fuel Cost Comparison of Alternate fuel types
To give further insights into the financial impact of the alternate fuel technologies being
explored, the operating expense per passenger boarding and operating expense per vehicle
revenue mile was calculated in Table 8. The annual operating expense per fuel type fleet divided
by the number of boarding’s gives the operating expense per boarding and dividing annual
operating expense per fuel type fleet by the annual vehicle revenue miles gives the operating
expense per revenue mile.
Table 7: Operating Expense per Boarding and per Vehicle Revenue Mile
$10.97 $11.55
$19.10
$11.51 $10.99
$0
$5
$10
$15
$20
$25
Diesel Diesel-Hybrid Hydrogen [FCEB] CNG Biodiesel [B20]
Mill
ion
s
Annual Operating Expense per Fuel Type of Bus Fleet
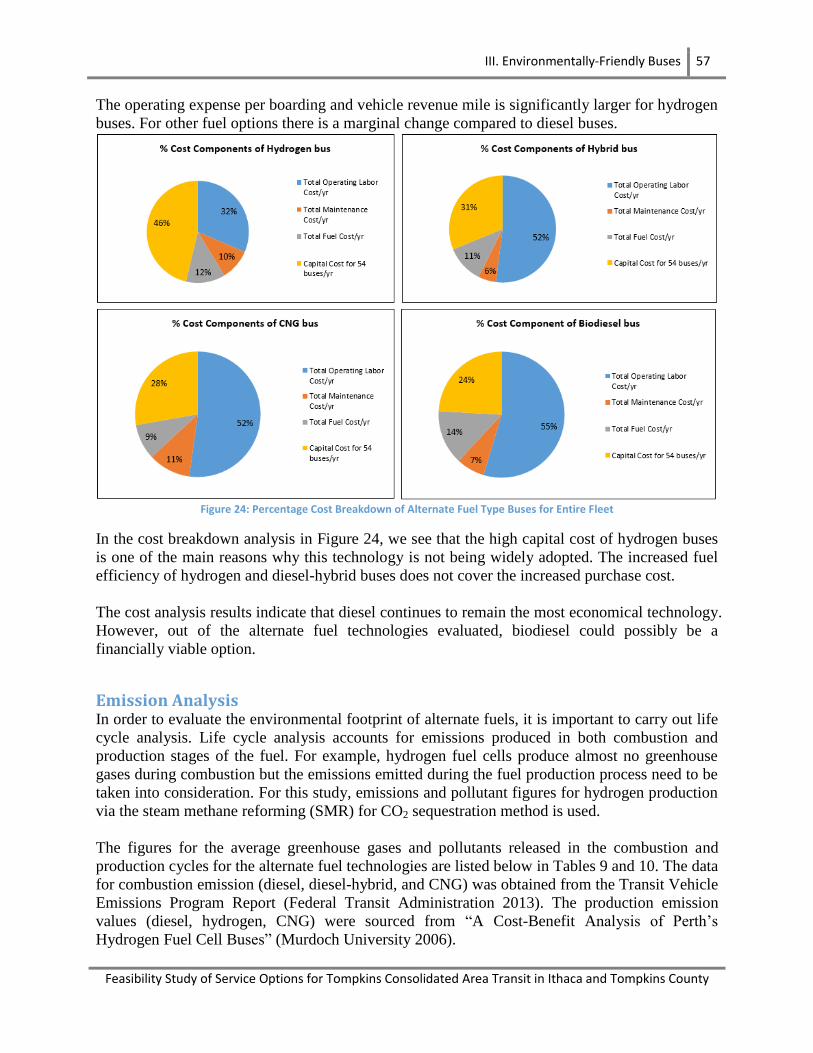
III. Environmentally-Friendly Buses 57
Feasibility Study of Service Options for Tompkins Consolidated Area Transit in Ithaca and Tompkins County
The operating expense per boarding and vehicle revenue mile is significantly larger for hydrogen
buses. For other fuel options there is a marginal change compared to diesel buses.
Figure 24: Percentage Cost Breakdown of Alternate Fuel Type Buses for Entire Fleet
In the cost breakdown analysis in Figure 24, we see that the high capital cost of hydrogen buses
is one of the main reasons why this technology is not being widely adopted. The increased fuel
efficiency of hydrogen and diesel-hybrid buses does not cover the increased purchase cost.
The cost analysis results indicate that diesel continues to remain the most economical technology.
However, out of the alternate fuel technologies evaluated, biodiesel could possibly be a
financially viable option.
Emission Analysis In order to evaluate the environmental footprint of alternate fuels, it is important to carry out life
cycle analysis. Life cycle analysis accounts for emissions produced in both combustion and
production stages of the fuel. For example, hydrogen fuel cells produce almost no greenhouse
gases during combustion but the emissions emitted during the fuel production process need to be
taken into consideration. For this study, emissions and pollutant figures for hydrogen production
via the steam methane reforming (SMR) for CO2 sequestration method is used.
The figures for the average greenhouse gases and pollutants released in the combustion and
production cycles for the alternate fuel technologies are listed below in Tables 9 and 10. The data
for combustion emission (diesel, diesel-hybrid, and CNG) was obtained from the Transit Vehicle
Emissions Program Report (Federal Transit Administration 2013). The production emission
values (diesel, hydrogen, CNG) were sourced from “A Cost-Benefit Analysis of Perth’s
Hydrogen Fuel Cell Buses” (Murdoch University 2006).
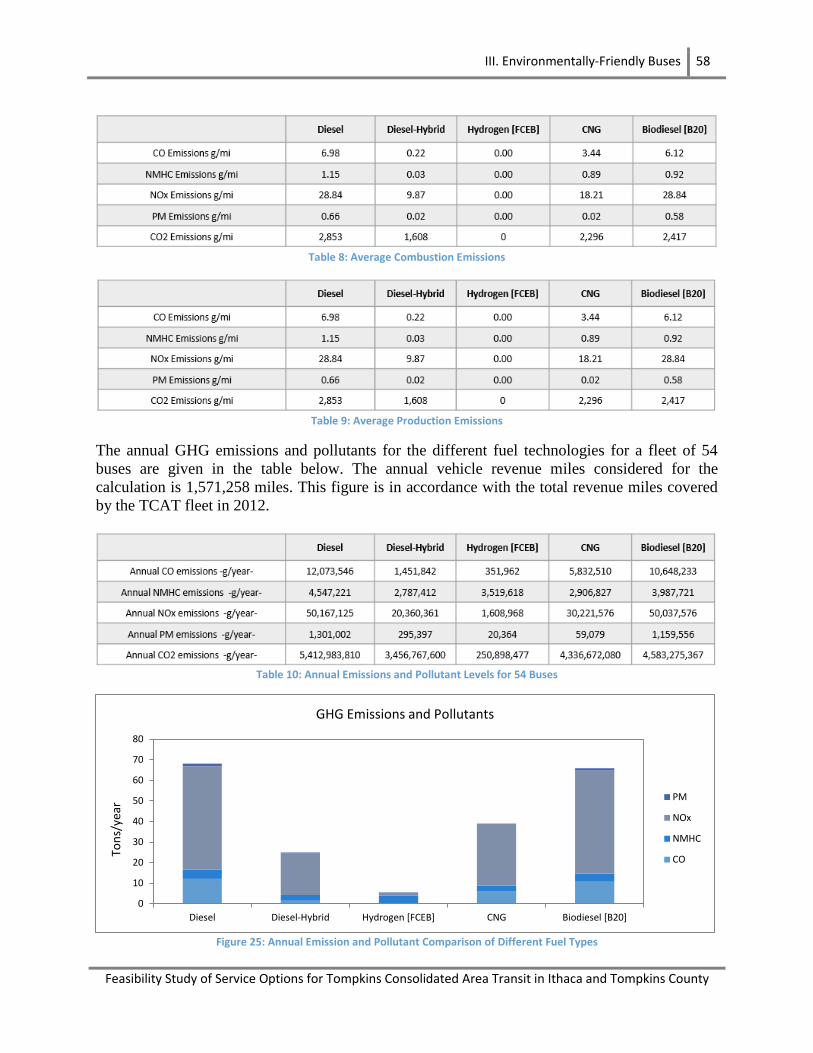
III. Environmentally-Friendly Buses 58
Feasibility Study of Service Options for Tompkins Consolidated Area Transit in Ithaca and Tompkins County
Table 8: Average Combustion Emissions
Table 9: Average Production Emissions
The annual GHG emissions and pollutants for the different fuel technologies for a fleet of 54
buses are given in the table below. The annual vehicle revenue miles considered for the
calculation is 1,571,258 miles. This figure is in accordance with the total revenue miles covered
by the TCAT fleet in 2012.
Table 10: Annual Emissions and Pollutant Levels for 54 Buses
Figure 25: Annual Emission and Pollutant Comparison of Different Fuel Types
0
10
20
30
40
50
60
70
80
Diesel Diesel-Hybrid Hydrogen [FCEB] CNG Biodiesel [B20]
Ton
s/ye
ar
GHG Emissions and Pollutants
PM
NOx
NMHC
CO
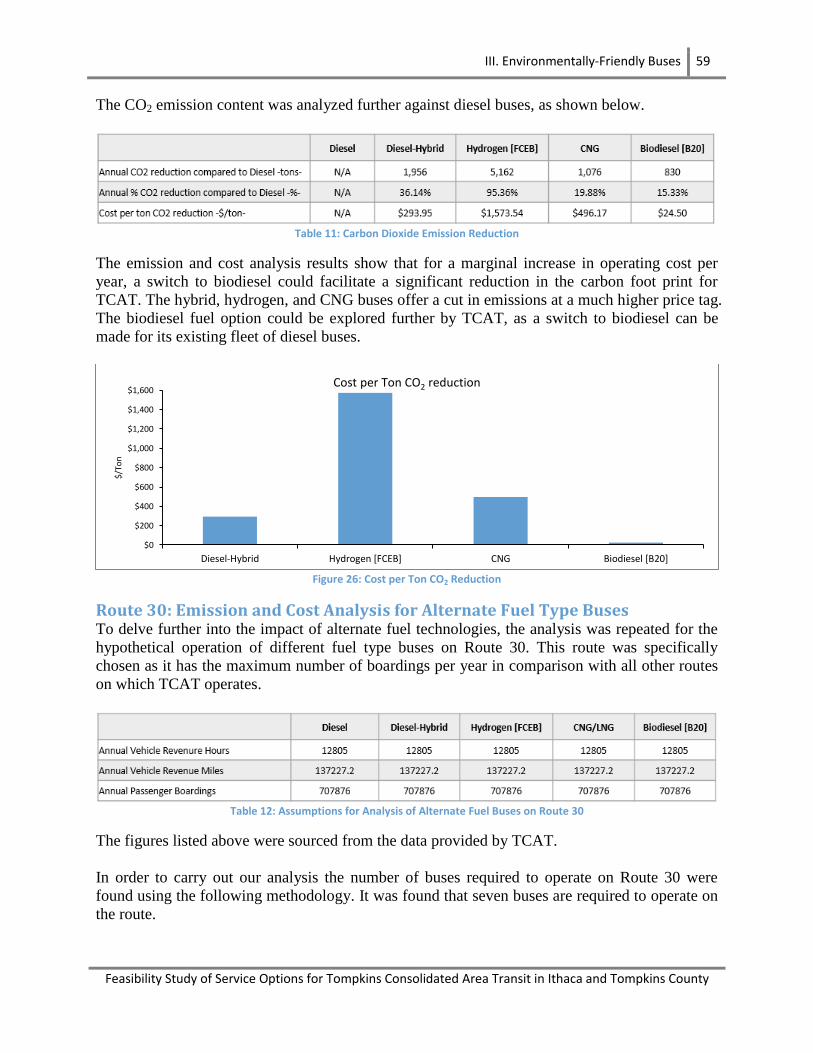
III. Environmentally-Friendly Buses 59
Feasibility Study of Service Options for Tompkins Consolidated Area Transit in Ithaca and Tompkins County
The CO2 emission content was analyzed further against diesel buses, as shown below.
Table 11: Carbon Dioxide Emission Reduction
The emission and cost analysis results show that for a marginal increase in operating cost per
year, a switch to biodiesel could facilitate a significant reduction in the carbon foot print for
TCAT. The hybrid, hydrogen, and CNG buses offer a cut in emissions at a much higher price tag.
The biodiesel fuel option could be explored further by TCAT, as a switch to biodiesel can be
made for its existing fleet of diesel buses.
Figure 26: Cost per Ton CO2 Reduction
Route 30: Emission and Cost Analysis for Alternate Fuel Type Buses To delve further into the impact of alternate fuel technologies, the analysis was repeated for the
hypothetical operation of different fuel type buses on Route 30. This route was specifically
chosen as it has the maximum number of boardings per year in comparison with all other routes
on which TCAT operates.
Table 12: Assumptions for Analysis of Alternate Fuel Buses on Route 30
The figures listed above were sourced from the data provided by TCAT.
In order to carry out our analysis the number of buses required to operate on Route 30 were
found using the following methodology. It was found that seven buses are required to operate on
the route.
$0
$200
$400
$600
$800
$1,000
$1,200
$1,400
$1,600
Diesel-Hybrid Hydrogen [FCEB] CNG Biodiesel [B20]
$/To
n
Cost per Ton CO2 reduction
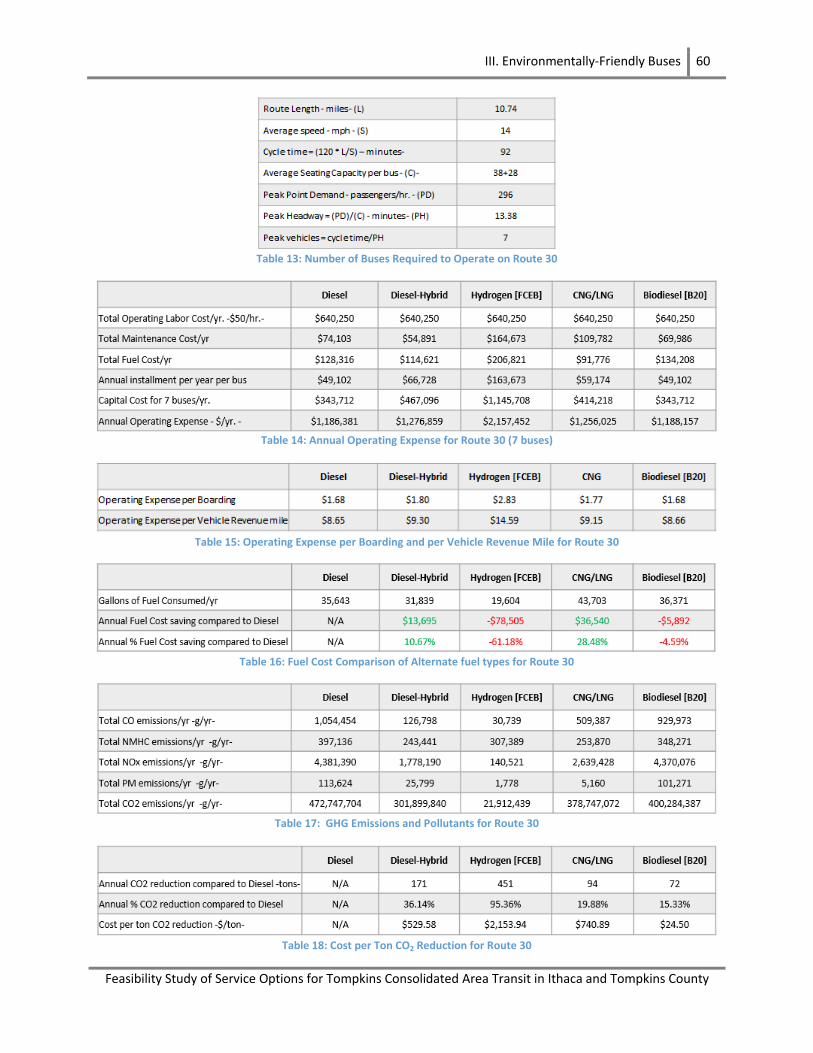
III. Environmentally-Friendly Buses 60
Feasibility Study of Service Options for Tompkins Consolidated Area Transit in Ithaca and Tompkins County
Table 13: Number of Buses Required to Operate on Route 30
Table 14: Annual Operating Expense for Route 30 (7 buses)
Table 15: Operating Expense per Boarding and per Vehicle Revenue Mile for Route 30
Table 16: Fuel Cost Comparison of Alternate fuel types for Route 30
Table 17: GHG Emissions and Pollutants for Route 30
Table 18: Cost per Ton CO2 Reduction for Route 30
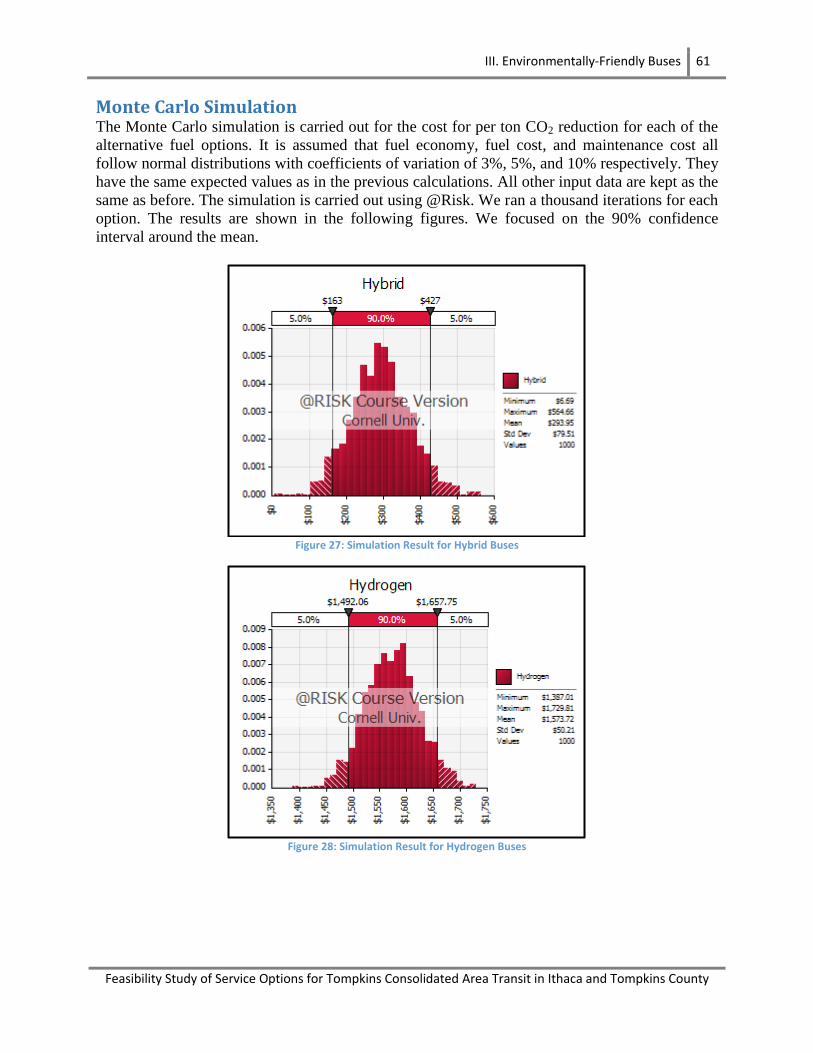
III. Environmentally-Friendly Buses 61
Feasibility Study of Service Options for Tompkins Consolidated Area Transit in Ithaca and Tompkins County
Monte Carlo Simulation The Monte Carlo simulation is carried out for the cost for per ton CO2 reduction for each of the
alternative fuel options. It is assumed that fuel economy, fuel cost, and maintenance cost all
follow normal distributions with coefficients of variation of 3%, 5%, and 10% respectively. They
have the same expected values as in the previous calculations. All other input data are kept as the
same as before. The simulation is carried out using @Risk. We ran a thousand iterations for each
option. The results are shown in the following figures. We focused on the 90% confidence
interval around the mean.
Figure 27: Simulation Result for Hybrid Buses
Figure 28: Simulation Result for Hydrogen Buses
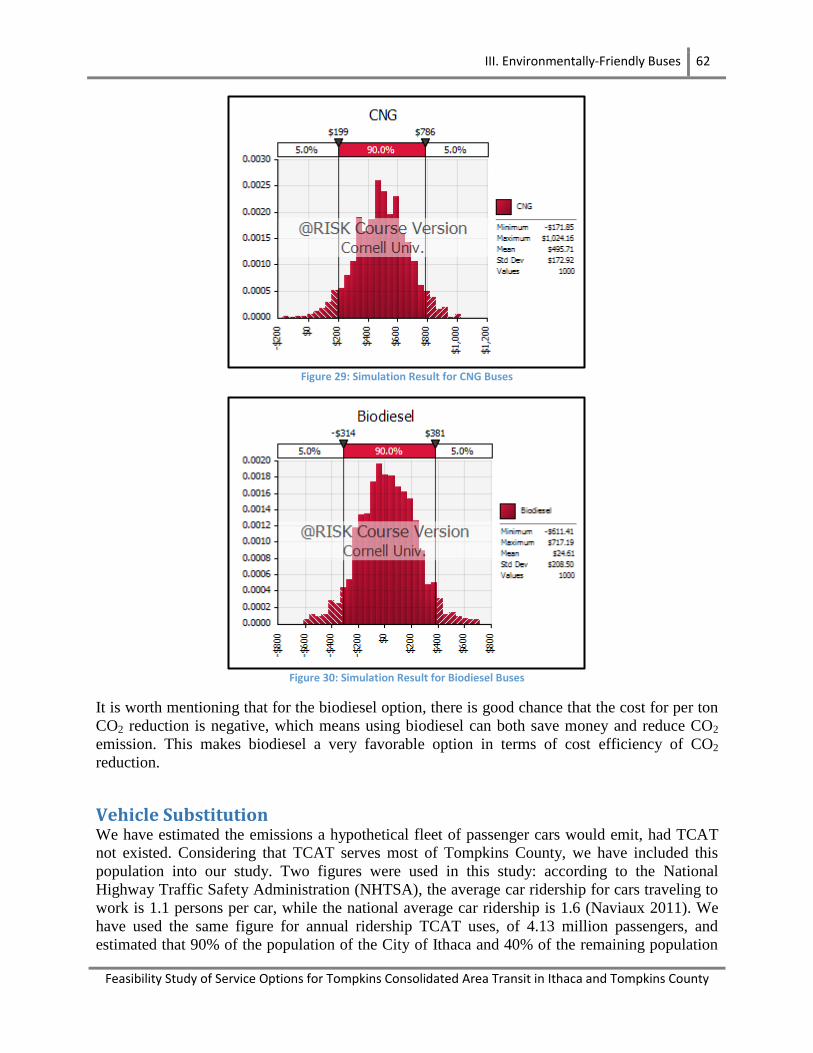
III. Environmentally-Friendly Buses 62
Feasibility Study of Service Options for Tompkins Consolidated Area Transit in Ithaca and Tompkins County
Figure 29: Simulation Result for CNG Buses
Figure 30: Simulation Result for Biodiesel Buses
It is worth mentioning that for the biodiesel option, there is good chance that the cost for per ton
CO2 reduction is negative, which means using biodiesel can both save money and reduce CO2
emission. This makes biodiesel a very favorable option in terms of cost efficiency of CO2
reduction.
Vehicle Substitution We have estimated the emissions a hypothetical fleet of passenger cars would emit, had TCAT
not existed. Considering that TCAT serves most of Tompkins County, we have included this
population into our study. Two figures were used in this study: according to the National
Highway Traffic Safety Administration (NHTSA), the average car ridership for cars traveling to
work is 1.1 persons per car, while the national average car ridership is 1.6 (Naviaux 2011). We
have used the same figure for annual ridership TCAT uses, of 4.13 million passengers, and
estimated that 90% of the population of the City of Ithaca and 40% of the remaining population

III. Environmentally-Friendly Buses 63
Feasibility Study of Service Options for Tompkins Consolidated Area Transit in Ithaca and Tompkins County
of Tompkins County is served by TCAT, and that both these groups of people have different
average miles traveled, as shown in Table 20.
Table 19: Estimation of Commuter Driving Distance
An average distance of 6.57 miles in all would be the commuting distance per person. Switching
off the entire bus transit for this exercise means that the 4.13 million rides in the bus system are
translated into car rides averaging 6.57 miles. Table 21 shows the estimated passenger vehicle
miles driven, with both vehicle ridership values.
Table 20: Total Miles Driven per Estimated Car Ridership
Depending on actual car ridership figures, passenger vehicles will travel between 2.58 and 3.75
million miles per year. According to recent research, the average fuel consumption nationwide
for new cars sold has reached 24.6 mpg (Ingram 2013). This number includes gas-guzzling sport
utility vehicles (SUV) and pickup trucks, which are not common in Ithaca, but also does not
include old cars with lower mpg values, so we consider this number to be accurate enough.
Finally, one gallon of gasoline will produce 19.6 pounds of CO2. These are all the assumptions,
contained in Table 22.
Table 21: Total Emissions by Passenger Vehicles
Ithaca Tompkins
Population 30,014 101,564
Density (/sq mi) 5,364 221
Area (sq mi) 6.1 476
Assumed square 2.5 21.8
Average distance 2.5 15.4
% population 30% 70%
Commuters 27,013 28,620
% commuters 90% 28%
Weighted avg. dist. 2.22 4.35
Est. Driving Distance 6.57 miles
TCAT
Annual Ridership 4,128,242 passengers
Average distance 6.57 miles/person
Commute (1.1/car, mi) 3,752,947 car rides
Commute (1.6/car, mi) 2,580,151 car rides
CARS miles per trip, 2 trips per day
Passengers per car 1.10 1.60 occ
Rides per year 3,752,947 2,580,151 car rides
CO2 emissions 19.60 19.60 lbs CO2/gal gasoline
Fuel economy mpg
Miles traveled 24,657,325 16,951,911 total miles
Fuel consumed 1,002,330 689,102 total gallons
Total emissions per year 19,645,674 13,506,401 lbs CO2
BUSES
Total emissions per year lbs CO2
Percentage increase in emissions 99% 37%
6.57
24.6
9,882,880
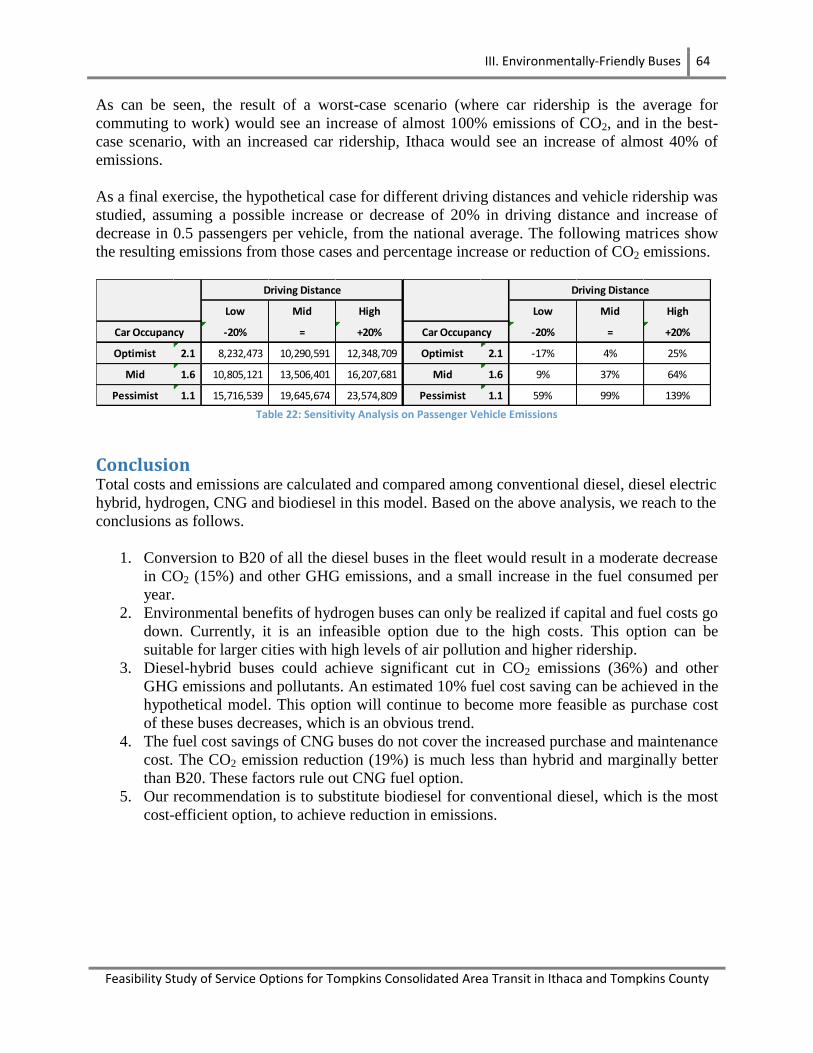
III. Environmentally-Friendly Buses 64
Feasibility Study of Service Options for Tompkins Consolidated Area Transit in Ithaca and Tompkins County
As can be seen, the result of a worst-case scenario (where car ridership is the average for
commuting to work) would see an increase of almost 100% emissions of CO2, and in the best-
case scenario, with an increased car ridership, Ithaca would see an increase of almost 40% of
emissions.
As a final exercise, the hypothetical case for different driving distances and vehicle ridership was
studied, assuming a possible increase or decrease of 20% in driving distance and increase of
decrease in 0.5 passengers per vehicle, from the national average. The following matrices show
the resulting emissions from those cases and percentage increase or reduction of CO2 emissions.
Table 22: Sensitivity Analysis on Passenger Vehicle Emissions
Conclusion Total costs and emissions are calculated and compared among conventional diesel, diesel electric
hybrid, hydrogen, CNG and biodiesel in this model. Based on the above analysis, we reach to the
conclusions as follows.
1. Conversion to B20 of all the diesel buses in the fleet would result in a moderate decrease
in CO2 (15%) and other GHG emissions, and a small increase in the fuel consumed per
year.
2. Environmental benefits of hydrogen buses can only be realized if capital and fuel costs go
down. Currently, it is an infeasible option due to the high costs. This option can be
suitable for larger cities with high levels of air pollution and higher ridership.
3. Diesel-hybrid buses could achieve significant cut in CO2 emissions (36%) and other
GHG emissions and pollutants. An estimated 10% fuel cost saving can be achieved in the
hypothetical model. This option will continue to become more feasible as purchase cost
of these buses decreases, which is an obvious trend.
4. The fuel cost savings of CNG buses do not cover the increased purchase and maintenance
cost. The CO2 emission reduction (19%) is much less than hybrid and marginally better
than B20. These factors rule out CNG fuel option.
5. Our recommendation is to substitute biodiesel for conventional diesel, which is the most
cost-efficient option, to achieve reduction in emissions.
Low Mid High
-20% = +20%
Optimist 2.1 8,232,473 10,290,591 12,348,709
Mid 1.6 10,805,121 13,506,401 16,207,681
Pessimist 1.1 15,716,539 19,645,674 23,574,809
Driving Distance
Car Occupancy
Low Mid High
-20% = +20%
Optimist 2.1 -17% 4% 25%
Mid 1.6 9% 37% 64%
Pessimist 1.1 59% 99% 139%
Driving Distance
Car Occupancy
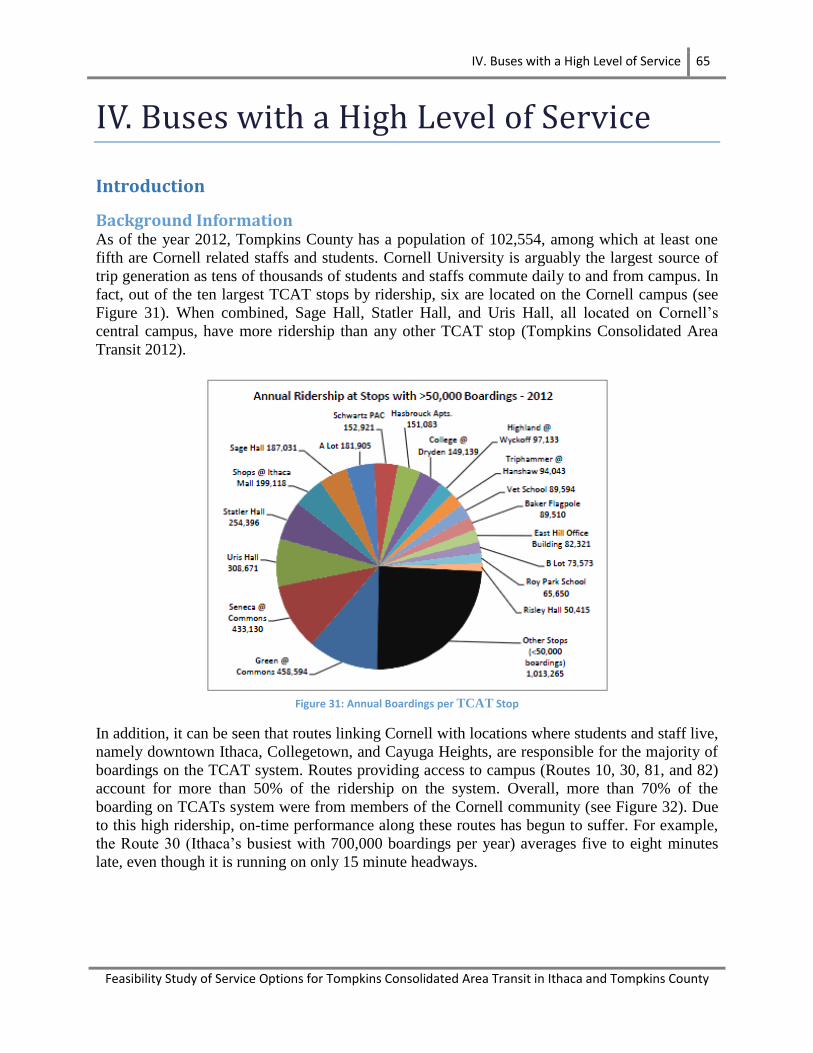
IV. Buses with a High Level of Service 65
Feasibility Study of Service Options for Tompkins Consolidated Area Transit in Ithaca and Tompkins County
IV. Buses with a High Level of Service
Introduction
Background Information As of the year 2012, Tompkins County has a population of 102,554, among which at least one
fifth are Cornell related staffs and students. Cornell University is arguably the largest source of
trip generation as tens of thousands of students and staffs commute daily to and from campus. In
fact, out of the ten largest TCAT stops by ridership, six are located on the Cornell campus (see
Figure 31). When combined, Sage Hall, Statler Hall, and Uris Hall, all located on Cornell’s
central campus, have more ridership than any other TCAT stop (Tompkins Consolidated Area
Transit 2012).
Figure 31: Annual Boardings per TCAT Stop
In addition, it can be seen that routes linking Cornell with locations where students and staff live,
namely downtown Ithaca, Collegetown, and Cayuga Heights, are responsible for the majority of
boardings on the TCAT system. Routes providing access to campus (Routes 10, 30, 81, and 82)
account for more than 50% of the ridership on the system. Overall, more than 70% of the
boarding on TCATs system were from members of the Cornell community (see Figure 32). Due
to this high ridership, on-time performance along these routes has begun to suffer. For example,
the Route 30 (Ithaca’s busiest with 700,000 boardings per year) averages five to eight minutes
late, even though it is running on only 15 minute headways.
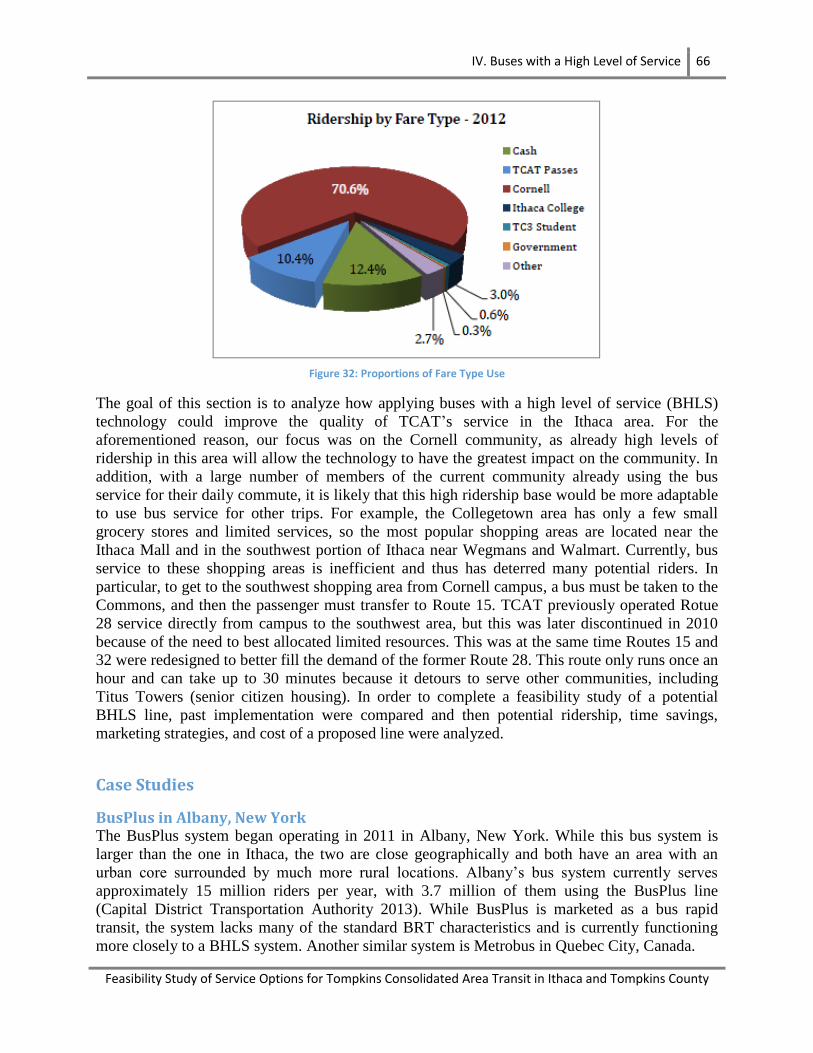
IV. Buses with a High Level of Service 66
Feasibility Study of Service Options for Tompkins Consolidated Area Transit in Ithaca and Tompkins County
Figure 32: Proportions of Fare Type Use
The goal of this section is to analyze how applying buses with a high level of service (BHLS)
technology could improve the quality of TCAT’s service in the Ithaca area. For the
aforementioned reason, our focus was on the Cornell community, as already high levels of
ridership in this area will allow the technology to have the greatest impact on the community. In
addition, with a large number of members of the current community already using the bus
service for their daily commute, it is likely that this high ridership base would be more adaptable
to use bus service for other trips. For example, the Collegetown area has only a few small
grocery stores and limited services, so the most popular shopping areas are located near the
Ithaca Mall and in the southwest portion of Ithaca near Wegmans and Walmart. Currently, bus
service to these shopping areas is inefficient and thus has deterred many potential riders. In
particular, to get to the southwest shopping area from Cornell campus, a bus must be taken to the
Commons, and then the passenger must transfer to Route 15. TCAT previously operated Rotue
28 service directly from campus to the southwest area, but this was later discontinued in 2010
because of the need to best allocated limited resources. This was at the same time Routes 15 and
32 were redesigned to better fill the demand of the former Route 28. This route only runs once an
hour and can take up to 30 minutes because it detours to serve other communities, including
Titus Towers (senior citizen housing). In order to complete a feasibility study of a potential
BHLS line, past implementation were compared and then potential ridership, time savings,
marketing strategies, and cost of a proposed line were analyzed.
Case Studies
BusPlus in Albany, New York The BusPlus system began operating in 2011 in Albany, New York. While this bus system is
larger than the one in Ithaca, the two are close geographically and both have an area with an
urban core surrounded by much more rural locations. Albany’s bus system currently serves
approximately 15 million riders per year, with 3.7 million of them using the BusPlus line
(Capital District Transportation Authority 2013). While BusPlus is marketed as a bus rapid
transit, the system lacks many of the standard BRT characteristics and is currently functioning
more closely to a BHLS system. Another similar system is Metrobus in Quebec City, Canada.
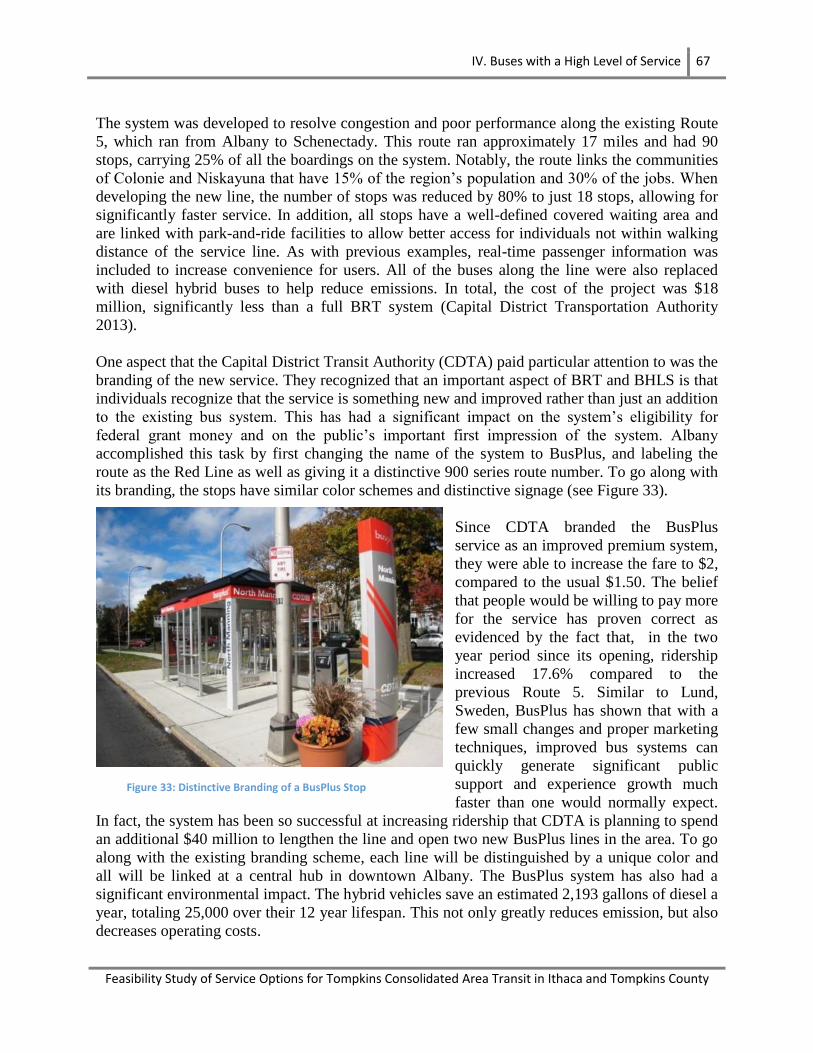
IV. Buses with a High Level of Service 67
Feasibility Study of Service Options for Tompkins Consolidated Area Transit in Ithaca and Tompkins County
The system was developed to resolve congestion and poor performance along the existing Route
5, which ran from Albany to Schenectady. This route ran approximately 17 miles and had 90
stops, carrying 25% of all the boardings on the system. Notably, the route links the communities
of Colonie and Niskayuna that have 15% of the region’s population and 30% of the jobs. When
developing the new line, the number of stops was reduced by 80% to just 18 stops, allowing for
significantly faster service. In addition, all stops have a well-defined covered waiting area and
are linked with park-and-ride facilities to allow better access for individuals not within walking
distance of the service line. As with previous examples, real-time passenger information was
included to increase convenience for users. All of the buses along the line were also replaced
with diesel hybrid buses to help reduce emissions. In total, the cost of the project was $18
million, significantly less than a full BRT system (Capital District Transportation Authority
2013).
One aspect that the Capital District Transit Authority (CDTA) paid particular attention to was the
branding of the new service. They recognized that an important aspect of BRT and BHLS is that
individuals recognize that the service is something new and improved rather than just an addition
to the existing bus system. This has had a significant impact on the system’s eligibility for
federal grant money and on the public’s important first impression of the system. Albany
accomplished this task by first changing the name of the system to BusPlus, and labeling the
route as the Red Line as well as giving it a distinctive 900 series route number. To go along with
its branding, the stops have similar color schemes and distinctive signage (see Figure 33).
Since CDTA branded the BusPlus
service as an improved premium system,
they were able to increase the fare to $2,
compared to the usual $1.50. The belief
that people would be willing to pay more
for the service has proven correct as
evidenced by the fact that, in the two
year period since its opening, ridership
increased 17.6% compared to the
previous Route 5. Similar to Lund,
Sweden, BusPlus has shown that with a
few small changes and proper marketing
techniques, improved bus systems can
quickly generate significant public
support and experience growth much
faster than one would normally expect.
In fact, the system has been so successful at increasing ridership that CDTA is planning to spend
an additional $40 million to lengthen the line and open two new BusPlus lines in the area. To go
along with the existing branding scheme, each line will be distinguished by a unique color and
all will be linked at a central hub in downtown Albany. The BusPlus system has also had a
significant environmental impact. The hybrid vehicles save an estimated 2,193 gallons of diesel a
year, totaling 25,000 over their 12 year lifespan. This not only greatly reduces emission, but also
decreases operating costs.
Figure 33: Distinctive Branding of a BusPlus Stop

IV. Buses with a High Level of Service 68
Feasibility Study of Service Options for Tompkins Consolidated Area Transit in Ithaca and Tompkins County
Lundalänken in Lund, Sweden Lund, Sweden provides an interesting comparison to Ithaca, NY as it is similar in size and has a
similar demographic. The city itself is relatively small with 100,000 in the metropolitan area, of
which the majority (42,000) is students or employees associated with the local university. The
city is also closely linked with Copenhagen, which is only an hour away via high speed train. In
2003, the city opened its first BHLS line name Lundalänken, or “Lund Link.”
One challenge faced when seeking to improve the bus system in the city was that the city center
was very constrained for space so operating a full scale bus rapid transit system was not possible.
As a result, Lund turned to the European idea of BHLS to provide better service. New, improved
service was provided along a six kilometer corridor that links Lund’s central station, its largest
working district, the university, and new residential and developing areas. To improve service,
the new BHLS system focused on providing the best operating conditions for the bus on the
existing infrastructure (Finn, Heddebaut and Rabuel, et al. 2010). Buses run in bus-only lanes for
large segments of the route and use signal prioritization. This means that the bus can signal when
it is approaching a red light so that it will turn green, thereby saving the bus time and wasted
energy in having to stop. In fact, a 600 meter bus-only road near the university was the only
infrastructure that had to be constructed, giving the project a total cost of approximately 20
million euros (UITP 2009).
The biggest lesson learned from the Lundalänken is that even small improvements to existing
bus systems can make them a more competitive form of transportation and cause significant
modal shifts. While the system largely operates like a standard bus, improved operating
conditions have helped to improve comfort, speed, and reliability along the corridor. Since
opening in 2003, ridership along the corridor has doubled and it is estimated that 20% of the new
riders have shifted away from commuting via cars (Finn, Heddebaut and Kerkhof, et al. 2011).
Another aspect of the service was to extend it to the periphery of the city to some undeveloped
agricultural land that was owned by the city (UITP 2009).
Figure 34: Lundalanken Layout and Extension to City Periphery
IV. Buses with a High Level of Service 69
Feasibility Study of Service Options for Tompkins Consolidated Area Transit in Ithaca and Tompkins County
This extension has cause a significant increase in the value of this undeveloped land, increasing
the economic feasibility of its development. Furthermore, since the land is being developed
around a high performing transit service, it is likely to be developed in a manner that maximizes
its use. This means that future development will likely be more sustainable and have a much
higher transit share from the onset. This contrasts with many peripheral developments in the
United States which often become reliant on automobiles due to underperforming transit service.
Finally, Lund has seen a significant amount of money invested into rehabilitating communities
along the BHLS line, particularly in the university and science park area.
Differences with Bus Rapid Transit Buses with a high level of service (BHLS), is a term which originated in France to describe bus
systems with more comprehensive and effective methods to improve bus priority. BHLS is based
on improved operating environments, higher quality vehicles, infrastructure upgrades, customer
service improvements, and marketing techniques (Finn, Heddebaut and Rabuel, et al. 2010).
Whereas BRT systems normally try to provide a mass transit or rapid transit and thus are
competitive with metro and light rail, BHLS tries to provide the best operating conditions for
current bus systems to allow them to operate at their peak efficiency. This is normally coupled
with improving customer service, marketing, vehicle quality, and system image. BHLS is often
used in cities which have limited space and do not have the finances to build more expensive
transit options. Features may include:
• Dedicated bus roads
• Bus priority lanes
• Short bus-only links
• Priority at traffic signals
• Network redesign
• Increased service levels, extended hours of operation, night services
• Advanced operations management and control (ITS-based)
• High quality bus shelters
• Park-and-ride facilities
• High quality buses
• Branding, marketing, and repositioning of the bus product
• Improved customer support services
• Advanced and integrated ticketing and fare collection
• Real-time passenger information
Area of Focus For this feasibility study, this list of factors was simplified down to those that were reasonable
for Ithaca. As a result of space constraints, installing bus-only roads and lanes was determined to
be infeasible. Furthermore, TCAT does not have the funding to undertake a project the size of
BusPlus. Thus, the proposed solution sought to minimize large scale infrastructure changes in
order to minimize capital cost. Due to the small size of Ithaca and the majority of trips occurring
during the morning and afternoon peaks it was determined that the proposed solution should aim
toward reducing strain on the network and improving customer service. In the end it was
determined that a BHLS solution for the Ithaca area should focus on express routing and route
redesign, dwell time reduction techniques, and branding and marketing of the new improved
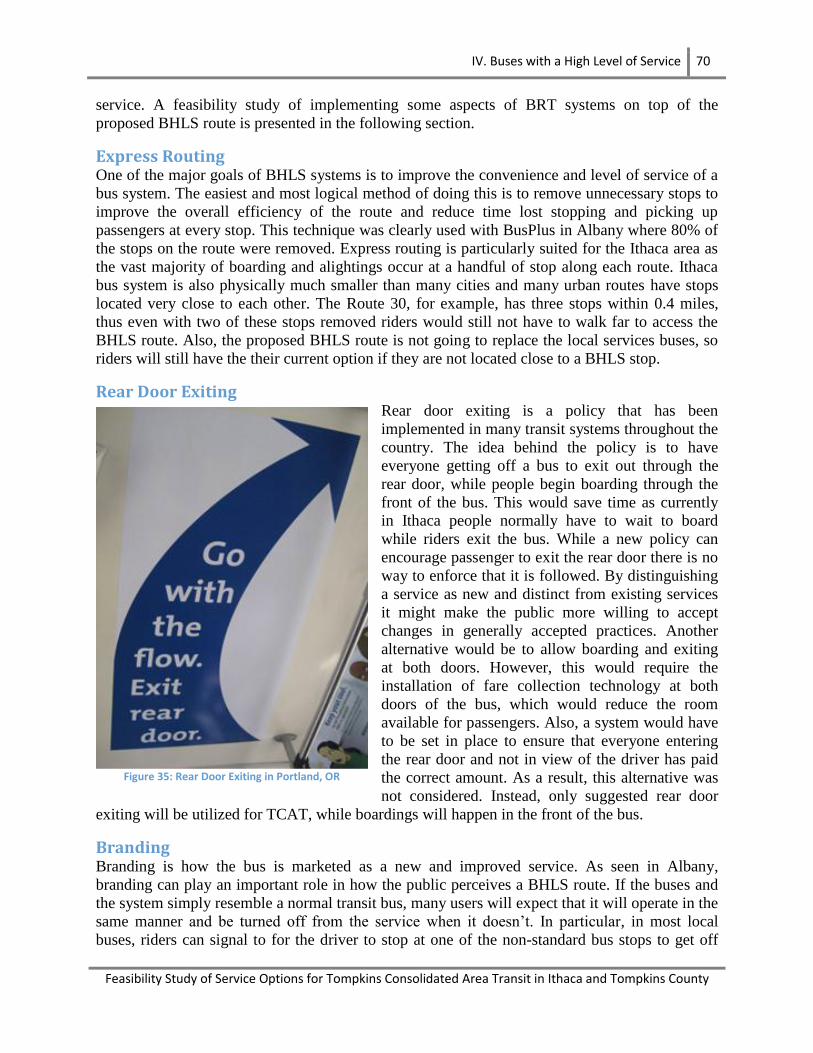
IV. Buses with a High Level of Service 70
Feasibility Study of Service Options for Tompkins Consolidated Area Transit in Ithaca and Tompkins County
service. A feasibility study of implementing some aspects of BRT systems on top of the
proposed BHLS route is presented in the following section.
Express Routing One of the major goals of BHLS systems is to improve the convenience and level of service of a
bus system. The easiest and most logical method of doing this is to remove unnecessary stops to
improve the overall efficiency of the route and reduce time lost stopping and picking up
passengers at every stop. This technique was clearly used with BusPlus in Albany where 80% of
the stops on the route were removed. Express routing is particularly suited for the Ithaca area as
the vast majority of boarding and alightings occur at a handful of stop along each route. Ithaca
bus system is also physically much smaller than many cities and many urban routes have stops
located very close to each other. The Route 30, for example, has three stops within 0.4 miles,
thus even with two of these stops removed riders would still not have to walk far to access the
BHLS route. Also, the proposed BHLS route is not going to replace the local services buses, so
riders will still have the their current option if they are not located close to a BHLS stop.
Rear Door Exiting Rear door exiting is a policy that has been
implemented in many transit systems throughout the
country. The idea behind the policy is to have
everyone getting off a bus to exit out through the
rear door, while people begin boarding through the
front of the bus. This would save time as currently
in Ithaca people normally have to wait to board
while riders exit the bus. While a new policy can
encourage passenger to exit the rear door there is no
way to enforce that it is followed. By distinguishing
a service as new and distinct from existing services
it might make the public more willing to accept
changes in generally accepted practices. Another
alternative would be to allow boarding and exiting
at both doors. However, this would require the
installation of fare collection technology at both
doors of the bus, which would reduce the room
available for passengers. Also, a system would have
to be set in place to ensure that everyone entering
the rear door and not in view of the driver has paid
the correct amount. As a result, this alternative was
not considered. Instead, only suggested rear door
exiting will be utilized for TCAT, while boardings will happen in the front of the bus.
Branding Branding is how the bus is marketed as a new and improved service. As seen in Albany,
branding can play an important role in how the public perceives a BHLS route. If the buses and
the system simply resemble a normal transit bus, many users will expect that it will operate in the
same manner and be turned off from the service when it doesn’t. In particular, in most local
buses, riders can signal to for the driver to stop at one of the non-standard bus stops to get off
Figure 35: Rear Door Exiting in Portland, OR
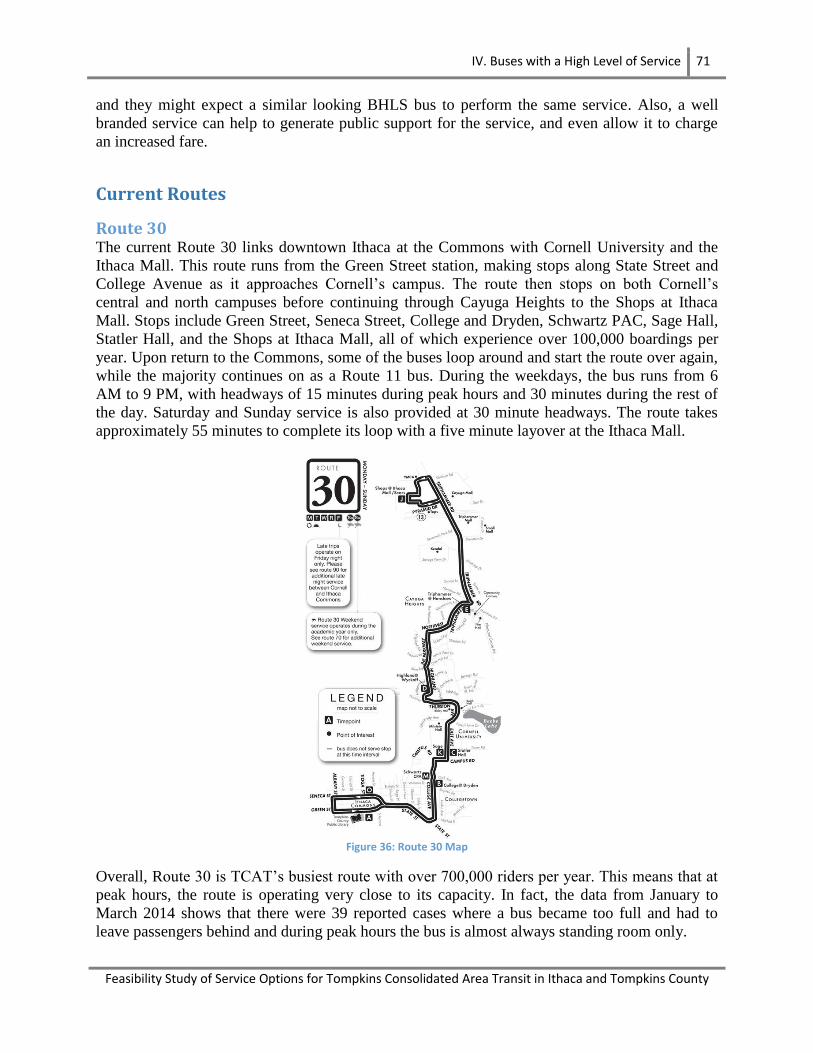
IV. Buses with a High Level of Service 71
Feasibility Study of Service Options for Tompkins Consolidated Area Transit in Ithaca and Tompkins County
and they might expect a similar looking BHLS bus to perform the same service. Also, a well
branded service can help to generate public support for the service, and even allow it to charge
an increased fare.
Current Routes
Route 30 The current Route 30 links downtown Ithaca at the Commons with Cornell University and the
Ithaca Mall. This route runs from the Green Street station, making stops along State Street and
College Avenue as it approaches Cornell’s campus. The route then stops on both Cornell’s
central and north campuses before continuing through Cayuga Heights to the Shops at Ithaca
Mall. Stops include Green Street, Seneca Street, College and Dryden, Schwartz PAC, Sage Hall,
Statler Hall, and the Shops at Ithaca Mall, all of which experience over 100,000 boardings per
year. Upon return to the Commons, some of the buses loop around and start the route over again,
while the majority continues on as a Route 11 bus. During the weekdays, the bus runs from 6
AM to 9 PM, with headways of 15 minutes during peak hours and 30 minutes during the rest of
the day. Saturday and Sunday service is also provided at 30 minute headways. The route takes
approximately 55 minutes to complete its loop with a five minute layover at the Ithaca Mall.
Figure 36: Route 30 Map
Overall, Route 30 is TCAT’s busiest route with over 700,000 riders per year. This means that at
peak hours, the route is operating very close to its capacity. In fact, the data from January to
March 2014 shows that there were 39 reported cases where a bus became too full and had to
leave passengers behind and during peak hours the bus is almost always standing room only.
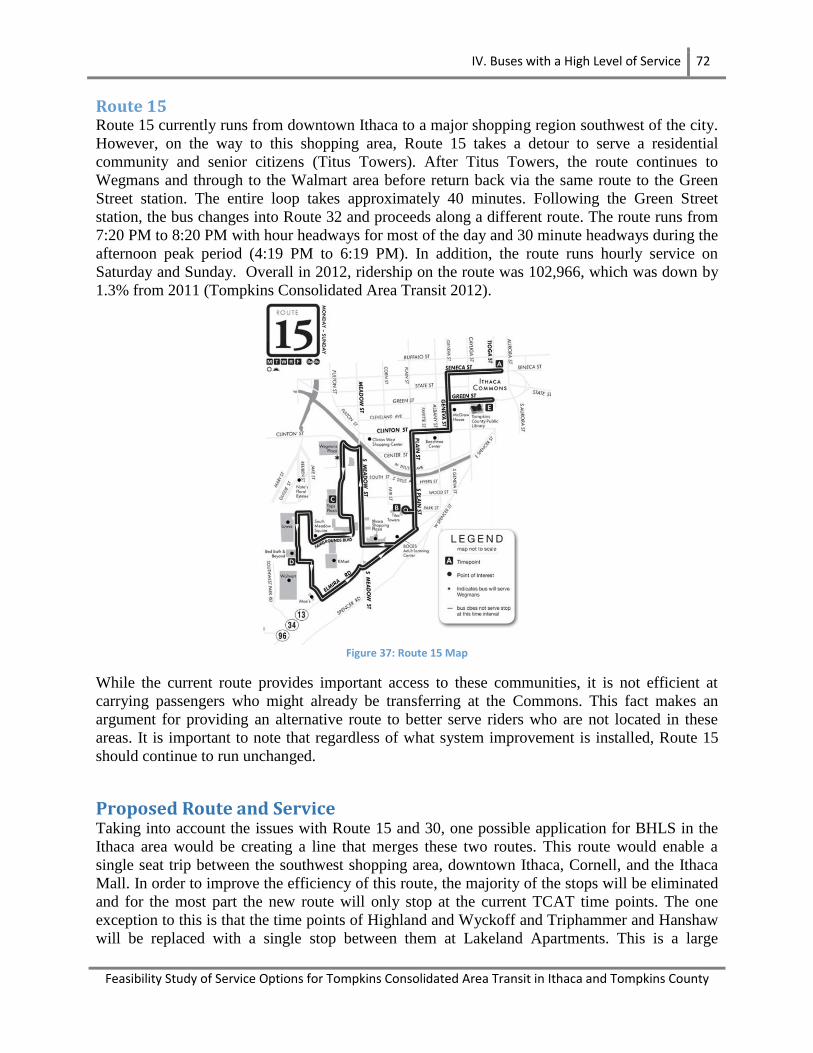
IV. Buses with a High Level of Service 72
Feasibility Study of Service Options for Tompkins Consolidated Area Transit in Ithaca and Tompkins County
Route 15 Route 15 currently runs from downtown Ithaca to a major shopping region southwest of the city.
However, on the way to this shopping area, Route 15 takes a detour to serve a residential
community and senior citizens (Titus Towers). After Titus Towers, the route continues to
Wegmans and through to the Walmart area before return back via the same route to the Green
Street station. The entire loop takes approximately 40 minutes. Following the Green Street
station, the bus changes into Route 32 and proceeds along a different route. The route runs from
7:20 PM to 8:20 PM with hour headways for most of the day and 30 minute headways during the
afternoon peak period (4:19 PM to 6:19 PM). In addition, the route runs hourly service on
Saturday and Sunday. Overall in 2012, ridership on the route was 102,966, which was down by
1.3% from 2011 (Tompkins Consolidated Area Transit 2012).
Figure 37: Route 15 Map
While the current route provides important access to these communities, it is not efficient at
carrying passengers who might already be transferring at the Commons. This fact makes an
argument for providing an alternative route to better serve riders who are not located in these
areas. It is important to note that regardless of what system improvement is installed, Route 15
should continue to run unchanged.
Proposed Route and Service Taking into account the issues with Route 15 and 30, one possible application for BHLS in the
Ithaca area would be creating a line that merges these two routes. This route would enable a
single seat trip between the southwest shopping area, downtown Ithaca, Cornell, and the Ithaca
Mall. In order to improve the efficiency of this route, the majority of the stops will be eliminated
and for the most part the new route will only stop at the current TCAT time points. The one
exception to this is that the time points of Highland and Wyckoff and Triphammer and Hanshaw
will be replaced with a single stop between them at Lakeland Apartments. This is a large
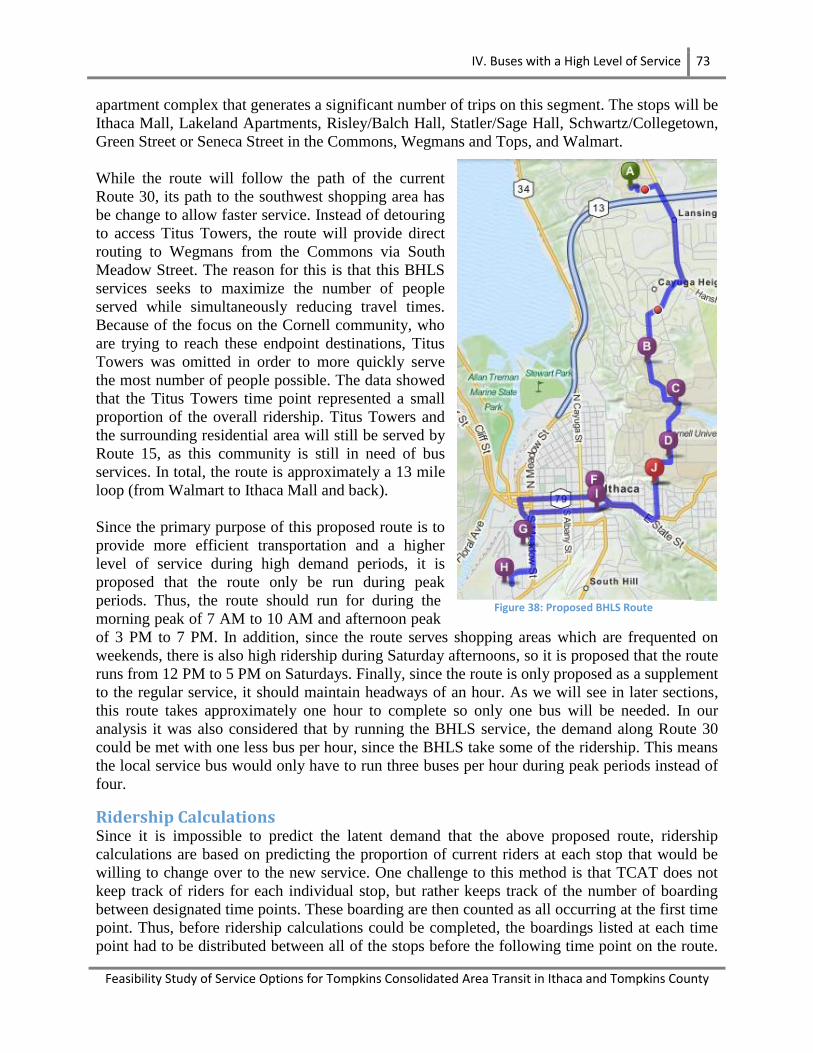
IV. Buses with a High Level of Service 73
Feasibility Study of Service Options for Tompkins Consolidated Area Transit in Ithaca and Tompkins County
apartment complex that generates a significant number of trips on this segment. The stops will be
Ithaca Mall, Lakeland Apartments, Risley/Balch Hall, Statler/Sage Hall, Schwartz/Collegetown,
Green Street or Seneca Street in the Commons, Wegmans and Tops, and Walmart.
While the route will follow the path of the current
Route 30, its path to the southwest shopping area has
be change to allow faster service. Instead of detouring
to access Titus Towers, the route will provide direct
routing to Wegmans from the Commons via South
Meadow Street. The reason for this is that this BHLS
services seeks to maximize the number of people
served while simultaneously reducing travel times.
Because of the focus on the Cornell community, who
are trying to reach these endpoint destinations, Titus
Towers was omitted in order to more quickly serve
the most number of people possible. The data showed
that the Titus Towers time point represented a small
proportion of the overall ridership. Titus Towers and
the surrounding residential area will still be served by
Route 15, as this community is still in need of bus
services. In total, the route is approximately a 13 mile
loop (from Walmart to Ithaca Mall and back).
Since the primary purpose of this proposed route is to
provide more efficient transportation and a higher
level of service during high demand periods, it is
proposed that the route only be run during peak
periods. Thus, the route should run for during the
morning peak of 7 AM to 10 AM and afternoon peak
of 3 PM to 7 PM. In addition, since the route serves shopping areas which are frequented on
weekends, there is also high ridership during Saturday afternoons, so it is proposed that the route
runs from 12 PM to 5 PM on Saturdays. Finally, since the route is only proposed as a supplement
to the regular service, it should maintain headways of an hour. As we will see in later sections,
this route takes approximately one hour to complete so only one bus will be needed. In our
analysis it was also considered that by running the BHLS service, the demand along Route 30
could be met with one less bus per hour, since the BHLS take some of the ridership. This means
the local service bus would only have to run three buses per hour during peak periods instead of
four.
Ridership Calculations Since it is impossible to predict the latent demand that the above proposed route, ridership
calculations are based on predicting the proportion of current riders at each stop that would be
willing to change over to the new service. One challenge to this method is that TCAT does not
keep track of riders for each individual stop, but rather keeps track of the number of boarding
between designated time points. These boarding are then counted as all occurring at the first time
point. Thus, before ridership calculations could be completed, the boardings listed at each time
point had to be distributed between all of the stops before the following time point on the route.
Figure 38: Proposed BHLS Route
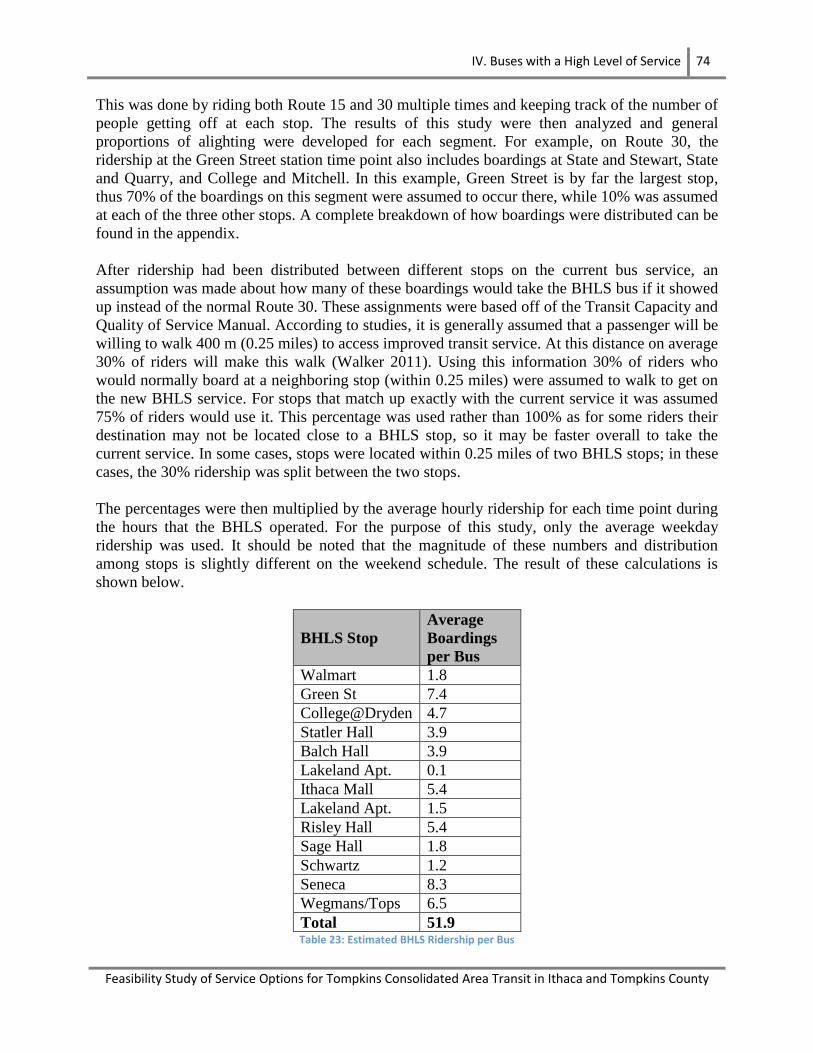
IV. Buses with a High Level of Service 74
Feasibility Study of Service Options for Tompkins Consolidated Area Transit in Ithaca and Tompkins County
This was done by riding both Route 15 and 30 multiple times and keeping track of the number of
people getting off at each stop. The results of this study were then analyzed and general
proportions of alighting were developed for each segment. For example, on Route 30, the
ridership at the Green Street station time point also includes boardings at State and Stewart, State
and Quarry, and College and Mitchell. In this example, Green Street is by far the largest stop,
thus 70% of the boardings on this segment were assumed to occur there, while 10% was assumed
at each of the three other stops. A complete breakdown of how boardings were distributed can be
found in the appendix.
After ridership had been distributed between different stops on the current bus service, an
assumption was made about how many of these boardings would take the BHLS bus if it showed
up instead of the normal Route 30. These assignments were based off of the Transit Capacity and
Quality of Service Manual. According to studies, it is generally assumed that a passenger will be
willing to walk 400 m (0.25 miles) to access improved transit service. At this distance on average
30% of riders will make this walk (Walker 2011). Using this information 30% of riders who
would normally board at a neighboring stop (within 0.25 miles) were assumed to walk to get on
the new BHLS service. For stops that match up exactly with the current service it was assumed
75% of riders would use it. This percentage was used rather than 100% as for some riders their
destination may not be located close to a BHLS stop, so it may be faster overall to take the
current service. In some cases, stops were located within 0.25 miles of two BHLS stops; in these
cases, the 30% ridership was split between the two stops.
The percentages were then multiplied by the average hourly ridership for each time point during
the hours that the BHLS operated. For the purpose of this study, only the average weekday
ridership was used. It should be noted that the magnitude of these numbers and distribution
among stops is slightly different on the weekend schedule. The result of these calculations is
shown below.
BHLS Stop
Average
Boardings
per Bus
Walmart 1.8
Green St 7.4
College@Dryden 4.7
Statler Hall 3.9
Balch Hall 3.9
Lakeland Apt. 0.1
Ithaca Mall 5.4
Lakeland Apt. 1.5
Risley Hall 5.4
Sage Hall 1.8
Schwartz 1.2
Seneca 8.3
Wegmans/Tops 6.5
Total 51.9 Table 23: Estimated BHLS Ridership per Bus
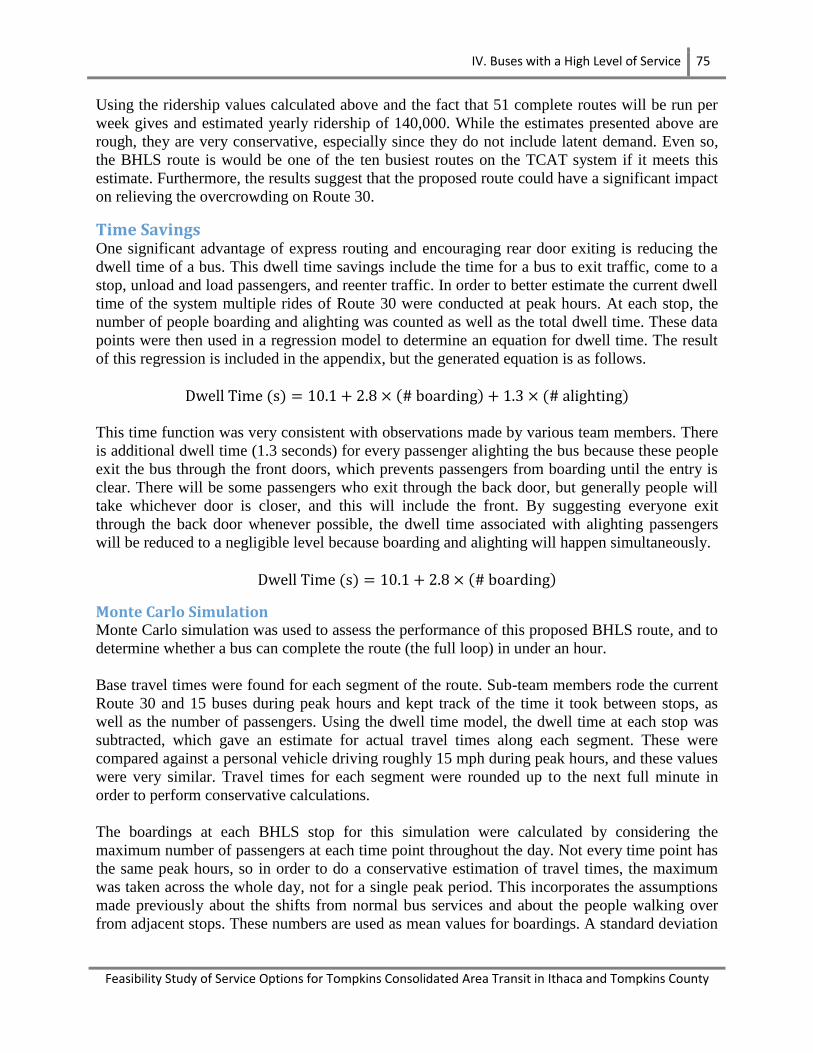
IV. Buses with a High Level of Service 75
Feasibility Study of Service Options for Tompkins Consolidated Area Transit in Ithaca and Tompkins County
Using the ridership values calculated above and the fact that 51 complete routes will be run per
week gives and estimated yearly ridership of 140,000. While the estimates presented above are
rough, they are very conservative, especially since they do not include latent demand. Even so,
the BHLS route is would be one of the ten busiest routes on the TCAT system if it meets this
estimate. Furthermore, the results suggest that the proposed route could have a significant impact
on relieving the overcrowding on Route 30.
Time Savings One significant advantage of express routing and encouraging rear door exiting is reducing the
dwell time of a bus. This dwell time savings include the time for a bus to exit traffic, come to a
stop, unload and load passengers, and reenter traffic. In order to better estimate the current dwell
time of the system multiple rides of Route 30 were conducted at peak hours. At each stop, the
number of people boarding and alighting was counted as well as the total dwell time. These data
points were then used in a regression model to determine an equation for dwell time. The result
of this regression is included in the appendix, but the generated equation is as follows.
This time function was very consistent with observations made by various team members. There
is additional dwell time (1.3 seconds) for every passenger alighting the bus because these people
exit the bus through the front doors, which prevents passengers from boarding until the entry is
clear. There will be some passengers who exit through the back door, but generally people will
take whichever door is closer, and this will include the front. By suggesting everyone exit
through the back door whenever possible, the dwell time associated with alighting passengers
will be reduced to a negligible level because boarding and alighting will happen simultaneously.
Monte Carlo Simulation Monte Carlo simulation was used to assess the performance of this proposed BHLS route, and to
determine whether a bus can complete the route (the full loop) in under an hour.
Base travel times were found for each segment of the route. Sub-team members rode the current
Route 30 and 15 buses during peak hours and kept track of the time it took between stops, as
well as the number of passengers. Using the dwell time model, the dwell time at each stop was
subtracted, which gave an estimate for actual travel times along each segment. These were
compared against a personal vehicle driving roughly 15 mph during peak hours, and these values
were very similar. Travel times for each segment were rounded up to the next full minute in
order to perform conservative calculations.
The boardings at each BHLS stop for this simulation were calculated by considering the
maximum number of passengers at each time point throughout the day. Not every time point has
the same peak hours, so in order to do a conservative estimation of travel times, the maximum
was taken across the whole day, not for a single peak period. This incorporates the assumptions
made previously about the shifts from normal bus services and about the people walking over
from adjacent stops. These numbers are used as mean values for boardings. A standard deviation
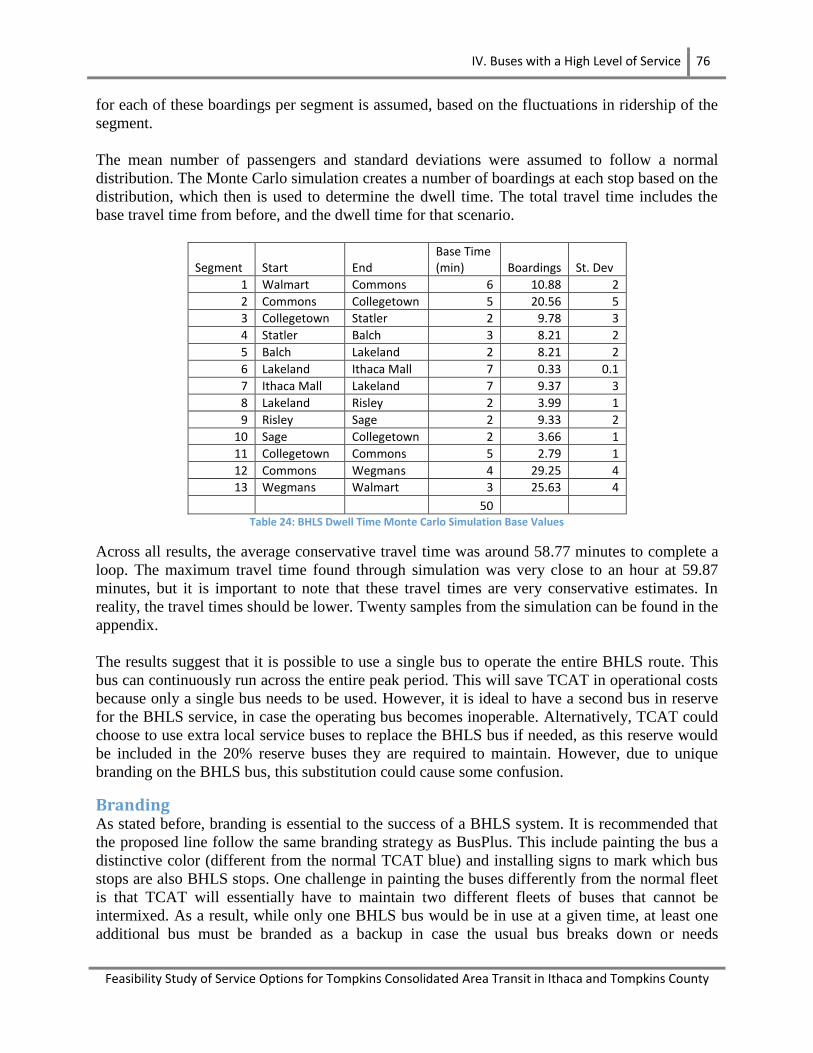
IV. Buses with a High Level of Service 76
Feasibility Study of Service Options for Tompkins Consolidated Area Transit in Ithaca and Tompkins County
for each of these boardings per segment is assumed, based on the fluctuations in ridership of the
segment.
The mean number of passengers and standard deviations were assumed to follow a normal
distribution. The Monte Carlo simulation creates a number of boardings at each stop based on the
distribution, which then is used to determine the dwell time. The total travel time includes the
base travel time from before, and the dwell time for that scenario.
Segment Start End Base Time (min) Boardings St. Dev
1 Walmart Commons 6 10.88 2
2 Commons Collegetown 5 20.56 5
3 Collegetown Statler 2 9.78 3
4 Statler Balch 3 8.21 2
5 Balch Lakeland 2 8.21 2
6 Lakeland Ithaca Mall 7 0.33 0.1
7 Ithaca Mall Lakeland 7 9.37 3
8 Lakeland Risley 2 3.99 1
9 Risley Sage 2 9.33 2
10 Sage Collegetown 2 3.66 1
11 Collegetown Commons 5 2.79 1
12 Commons Wegmans 4 29.25 4
13 Wegmans Walmart 3 25.63 4
50 Table 24: BHLS Dwell Time Monte Carlo Simulation Base Values
Across all results, the average conservative travel time was around 58.77 minutes to complete a
loop. The maximum travel time found through simulation was very close to an hour at 59.87
minutes, but it is important to note that these travel times are very conservative estimates. In
reality, the travel times should be lower. Twenty samples from the simulation can be found in the
appendix.
The results suggest that it is possible to use a single bus to operate the entire BHLS route. This
bus can continuously run across the entire peak period. This will save TCAT in operational costs
because only a single bus needs to be used. However, it is ideal to have a second bus in reserve
for the BHLS service, in case the operating bus becomes inoperable. Alternatively, TCAT could
choose to use extra local service buses to replace the BHLS bus if needed, as this reserve would
be included in the 20% reserve buses they are required to maintain. However, due to unique
branding on the BHLS bus, this substitution could cause some confusion.
Branding As stated before, branding is essential to the success of a BHLS system. It is recommended that
the proposed line follow the same branding strategy as BusPlus. This include painting the bus a
distinctive color (different from the normal TCAT blue) and installing signs to mark which bus
stops are also BHLS stops. One challenge in painting the buses differently from the normal fleet
is that TCAT will essentially have to maintain two different fleets of buses that cannot be
intermixed. As a result, while only one BHLS bus would be in use at a given time, at least one
additional bus must be branded as a backup in case the usual bus breaks down or needs
IV. Buses with a High Level of Service 77
Feasibility Study of Service Options for Tompkins Consolidated Area Transit in Ithaca and Tompkins County
maintenance. In a small system like TCAT, this can pose a problem, as dedicating at least two
buses for a route that is only run 51 hours a week is a significant capital investment for the actual
usage time. However, since the buses themselves are the same, it might be possible for TCAT to
simply retrofit two existing buses so entirely new vehicles do not have to be bought.
Cost Analysis To calculate the cost of the proposed BHLS service, the hourly and per mile cost of operating a
bus had to be calculated. This was done based off of TCAT’s 2012 budget, which provided
figures for revenue miles, revenue hours, wages and benefits, fuel cost, maintenance cost, and
repair costs. These values were then used to calculate a direct hourly cost from wages and
benefits of $42.53 per revenue hour and $1.50 per mile. The per mile cost includes fuel, fluids,
maintenance and repairs.
Combining these values with the fact that the BHLS route is proposed to be run 51 times a week,
taking one hour each time and totaling 13 miles we can calculate the total yearly operating cost
as follows.
[ ]
As far as capital cost it was estimated that signage per stop would cost about $500, so for 13
stops, $6,500 was allocated. The cost of the bus depended on whether it was bought new or
retrofitted; a new bus cost $390,000, while it would cost about $10,000 to paint an existing bus.
All of these capital cost were discounted at the standard 7% over the 12 year life span of a bus
(with no salvage value assumed).
Furthermore, the potential operating cost savings of running one less local Route 30 bus per hour
were calculated. This operating cost was calculated similar to the above calculation but using a
route length of 10.7 miles. As for hourly cost, running one less bus per hour equated to 51 hours
of cost savings. Note that no savings are calculated for the Route 15. This is because since Route
15 runs on hourly headways for most of the day, one cannot reduce the number of buses without
canceling the service.
[ ]
The result of the cost analysis is presented in the table below. The results are presented for three
scenarios: buying two new buses, buying one and retrofitting one, and retrofitting two buses. The
final row represents the increased yearly cost for TCAT if they institute the BHLS route and
reduce Route 30 by one bus during peak hours (“potential savings”).
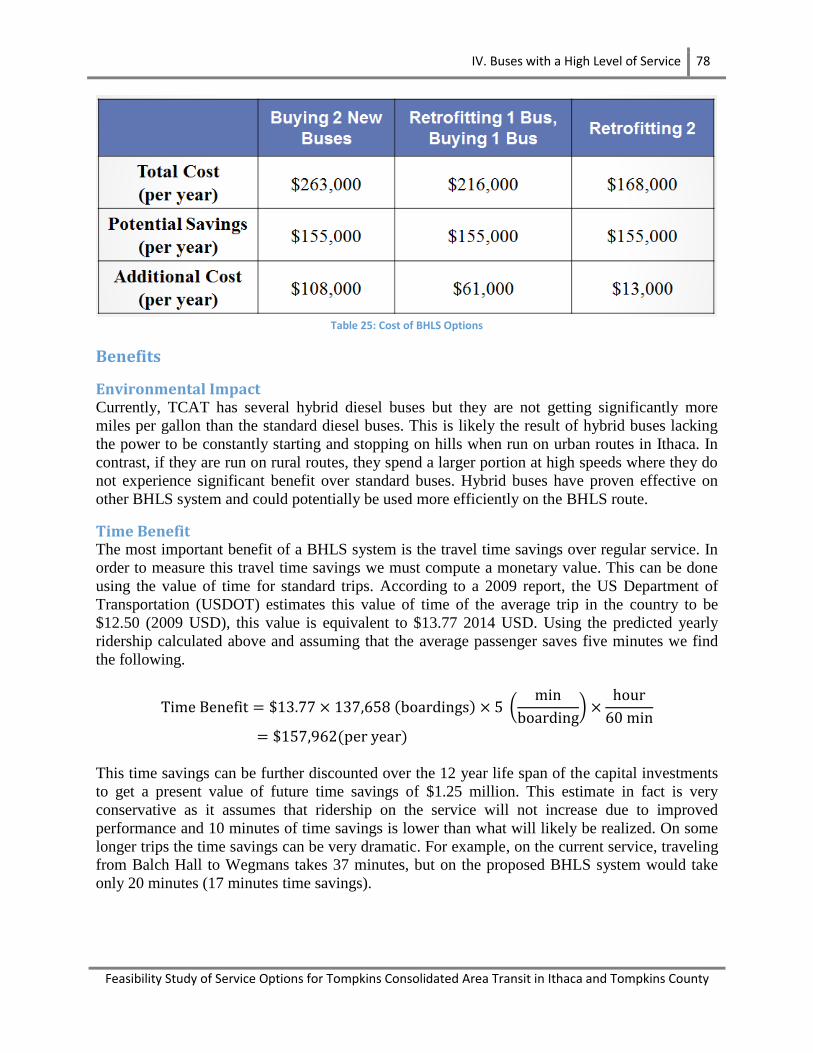
IV. Buses with a High Level of Service 78
Feasibility Study of Service Options for Tompkins Consolidated Area Transit in Ithaca and Tompkins County
Table 25: Cost of BHLS Options
Benefits
Environmental Impact Currently, TCAT has several hybrid diesel buses but they are not getting significantly more
miles per gallon than the standard diesel buses. This is likely the result of hybrid buses lacking
the power to be constantly starting and stopping on hills when run on urban routes in Ithaca. In
contrast, if they are run on rural routes, they spend a larger portion at high speeds where they do
not experience significant benefit over standard buses. Hybrid buses have proven effective on
other BHLS system and could potentially be used more efficiently on the BHLS route.
Time Benefit The most important benefit of a BHLS system is the travel time savings over regular service. In
order to measure this travel time savings we must compute a monetary value. This can be done
using the value of time for standard trips. According to a 2009 report, the US Department of
Transportation (USDOT) estimates this value of time of the average trip in the country to be
$12.50 (2009 USD), this value is equivalent to $13.77 2014 USD. Using the predicted yearly
ridership calculated above and assuming that the average passenger saves five minutes we find
the following.
(
)
This time savings can be further discounted over the 12 year life span of the capital investments
to get a present value of future time savings of $1.25 million. This estimate in fact is very
conservative as it assumes that ridership on the service will not increase due to improved
performance and 10 minutes of time savings is lower than what will likely be realized. On some
longer trips the time savings can be very dramatic. For example, on the current service, traveling
from Balch Hall to Wegmans takes 37 minutes, but on the proposed BHLS system would take
only 20 minutes (17 minutes time savings).
IV. Buses with a High Level of Service 79
Feasibility Study of Service Options for Tompkins Consolidated Area Transit in Ithaca and Tompkins County
City Connectivity In recent years there has been increasing vacancy at storefronts both in Collegetown and in the
Ithaca Commons. A new BHLS will help to connect residential and commercial areas of Ithaca,
thus making these locations more attractive for stores. As seen in Lund, Sweden, improved
transit services can have a dramatic impact on the rehabilitation and development of economic
centers.
Conclusion From our analysis, it is easy to see that in the worst case cost scenario, if TCAT has to buy two
new buses, the additional year cost on the system will be greatly exceeded by the benefit to the
greater Ithaca community. Furthermore, the benefit could have long term benefits for TCAT in
letting the system continue to grow, without being stifled by their current capacity. However,
before a service would be implements there are a few challenges that TCAT would have to
overcome. One would be getting the initial funding to pay for setup on the service. It is likely
that the federal government would subsidize some of the capital cost, but a significant portion
would have to be raised by TCAT. One option would be to try and foster public support and buy
in to the system. For example, Cleveland, Ohio was able to sell the naming rights of their new
BRT service, raising $6.25 million (Litt 2009). Another challenge will be public pushback of the
service. Since the service is only being implemented on one specific line, many members of the
public would be unlikely to support an expensive project that will not directly benefit them. This
is a challenge faced in almost all transit projects and would have to be addressed through
education of the public about the secondary benefits, which are not limited to just the riders of
the BHLS line. Overall, BHLS is a feasible way for Ithaca to upgrade their current bus system,
offering higher capacity and improved customer service for relatively little additional costs. If
these initial challenges could be overcome, it is recommended the TCAT pursue this option.
V. Bus Rapid Transit 80
Feasibility Study of Service Options for Tompkins Consolidated Area Transit in Ithaca and Tompkins County
V. Bus Rapid Transit
Introduction Bus rapid transit (BRT) is an enhanced bus system that operates on bus lanes or other transit
ways in order to combine the flexibility of buses with the efficiency of rail. A true BRT system
generally has specialized design, services and infrastructure to improve system quality and
remove the typical causes of delay. BRT operates at faster speeds, and provides greater service
reliability and increased customer convenience. It also utilizes a combination of advanced
technologies, infrastructure, and operational investments that provide significantly better service
than traditional bus services.
Major Elements There are six major elements of BRT systems, including running ways, stations, vehicles, fare
collection, intelligent transportation systems (ITS), and service and operation plans (Federal
Transit Administration 2009).
Running Way Running ways are the most significant element in determining the speed and reliability of BRT
services. The level of separation from other traffic affects the quality of BRT services. Options
range from mixed flow lanes to fully grade-separated exclusive rights-of-way.
Stations Stations are the important connections among passengers, BRT systems and other public transit
services. The design of stations affects the accessibility, comfort and safety of the BRT services.
Primary characteristics of stations include basic station type, platform height, platform layout,
passing capacity and station access.
Vehicles Vehicles have a direct impact on speed, capacity, environmental friendliness and comfort. The
options of BRT vehicles range from standard buses to specialized BRT vehicles.
Fare Collection Fare collection influences the convenience, accessibility, dwell time of vehicles, service
reliability, and passenger security. Fare collection methods range from traditional pay-on-board
methods to pre-payment methods.
Intelligent Transportation Systems A wide variety of ITS technologies could be applied to improve the BRT services in terms of
travel times, reliability, convenience, safety, and operational efficiency.
Service and Operation Plans The design of service plans affects system capacity, service reliability and travel times. When
designing service and operation plans, characteristics including route length, route structure,
service span, service frequency, and station spacing should be taken into consideration.
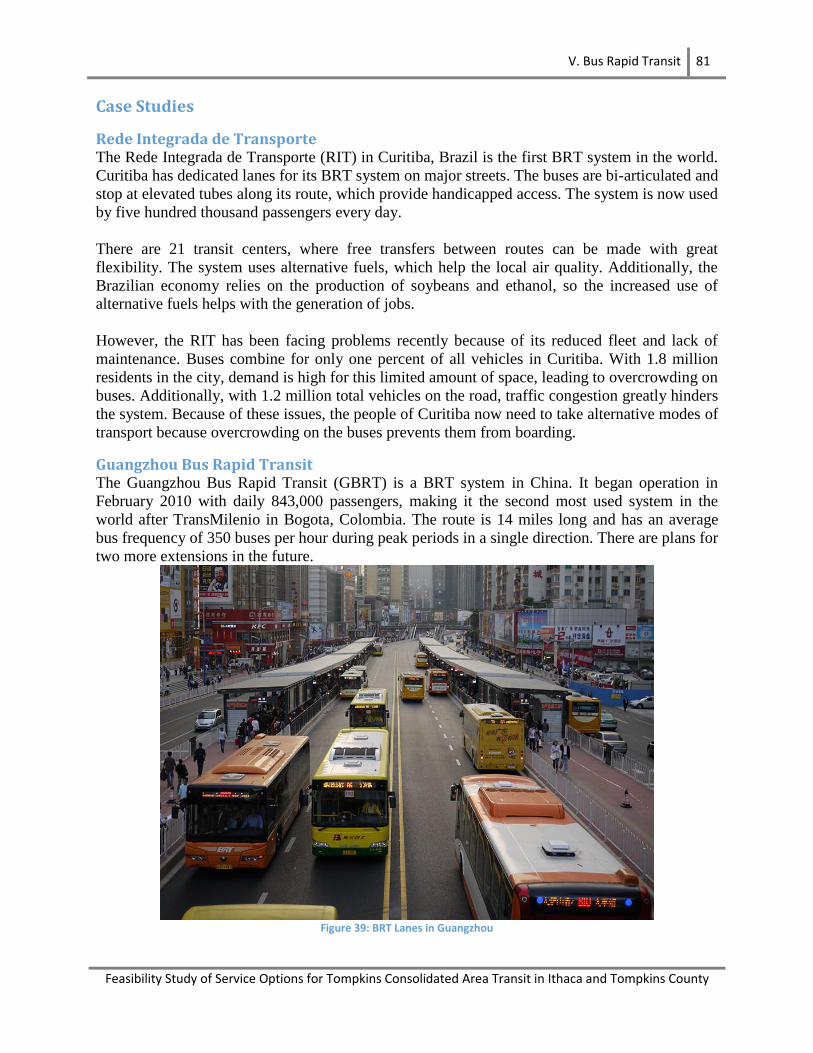
V. Bus Rapid Transit 81
Feasibility Study of Service Options for Tompkins Consolidated Area Transit in Ithaca and Tompkins County
Case Studies
Rede Integrada de Transporte The Rede Integrada de Transporte (RIT) in Curitiba, Brazil is the first BRT system in the world.
Curitiba has dedicated lanes for its BRT system on major streets. The buses are bi-articulated and
stop at elevated tubes along its route, which provide handicapped access. The system is now used
by five hundred thousand passengers every day.
There are 21 transit centers, where free transfers between routes can be made with great
flexibility. The system uses alternative fuels, which help the local air quality. Additionally, the
Brazilian economy relies on the production of soybeans and ethanol, so the increased use of
alternative fuels helps with the generation of jobs.
However, the RIT has been facing problems recently because of its reduced fleet and lack of
maintenance. Buses combine for only one percent of all vehicles in Curitiba. With 1.8 million
residents in the city, demand is high for this limited amount of space, leading to overcrowding on
buses. Additionally, with 1.2 million total vehicles on the road, traffic congestion greatly hinders
the system. Because of these issues, the people of Curitiba now need to take alternative modes of
transport because overcrowding on the buses prevents them from boarding.
Guangzhou Bus Rapid Transit The Guangzhou Bus Rapid Transit (GBRT) is a BRT system in China. It began operation in
February 2010 with daily 843,000 passengers, making it the second most used system in the
world after TransMilenio in Bogota, Colombia. The route is 14 miles long and has an average
bus frequency of 350 buses per hour during peak periods in a single direction. There are plans for
two more extensions in the future.
Figure 39: BRT Lanes in Guangzhou
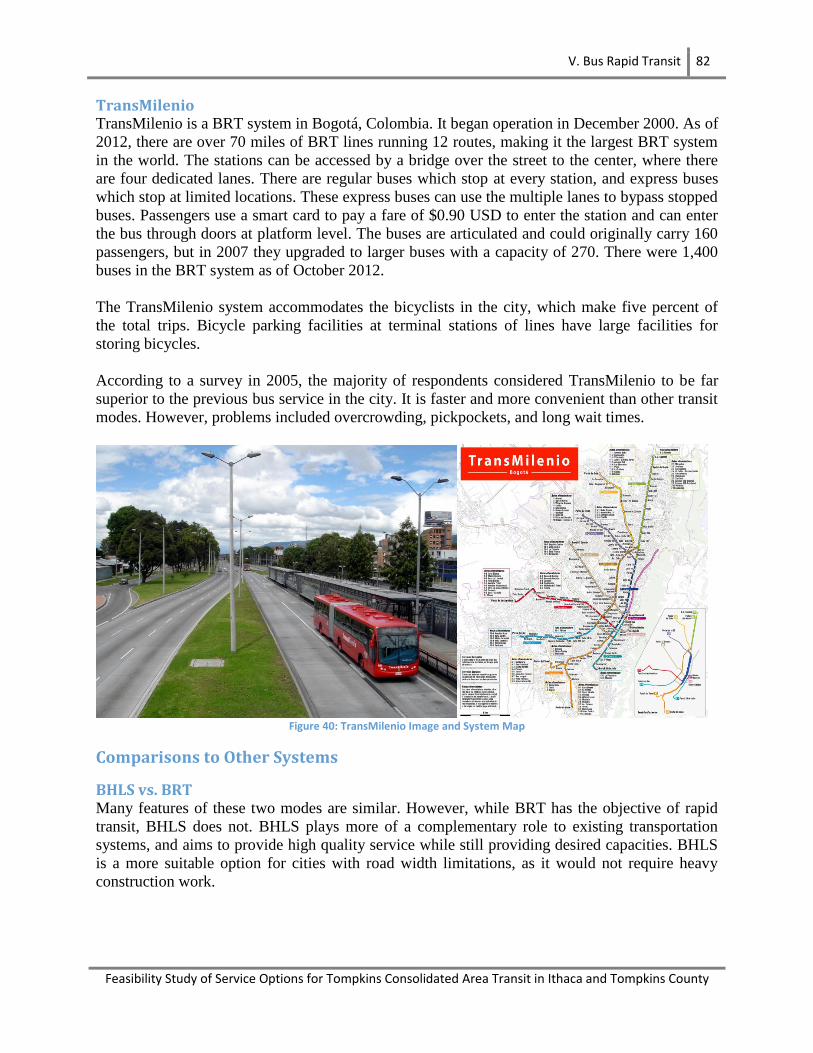
V. Bus Rapid Transit 82
Feasibility Study of Service Options for Tompkins Consolidated Area Transit in Ithaca and Tompkins County
TransMilenio TransMilenio is a BRT system in Bogotá, Colombia. It began operation in December 2000. As of
2012, there are over 70 miles of BRT lines running 12 routes, making it the largest BRT system
in the world. The stations can be accessed by a bridge over the street to the center, where there
are four dedicated lanes. There are regular buses which stop at every station, and express buses
which stop at limited locations. These express buses can use the multiple lanes to bypass stopped
buses. Passengers use a smart card to pay a fare of $0.90 USD to enter the station and can enter
the bus through doors at platform level. The buses are articulated and could originally carry 160
passengers, but in 2007 they upgraded to larger buses with a capacity of 270. There were 1,400
buses in the BRT system as of October 2012.
The TransMilenio system accommodates the bicyclists in the city, which make five percent of
the total trips. Bicycle parking facilities at terminal stations of lines have large facilities for
storing bicycles.
According to a survey in 2005, the majority of respondents considered TransMilenio to be far
superior to the previous bus service in the city. It is faster and more convenient than other transit
modes. However, problems included overcrowding, pickpockets, and long wait times.
Figure 40: TransMilenio Image and System Map
Comparisons to Other Systems
BHLS vs. BRT Many features of these two modes are similar. However, while BRT has the objective of rapid
transit, BHLS does not. BHLS plays more of a complementary role to existing transportation
systems, and aims to provide high quality service while still providing desired capacities. BHLS
is a more suitable option for cities with road width limitations, as it would not require heavy
construction work.
V. Bus Rapid Transit 83
Feasibility Study of Service Options for Tompkins Consolidated Area Transit in Ithaca and Tompkins County
BRT vs. LRT BRT is more flexible than light rail transit (LRT), and can be used as an interim system. Stations
do not need to be completed before buses begin operation, and future expansions or
improvements can be phased in without restricting current operations. BRT systems can respond
to changes in land use or changes in community patterns. Buses can be rerouted because they are
not restricted to rails. LRT, on the other hand, must have the necessary infrastructure in place
before it can be used. It is also associated with a bias by local agencies to continue developing
rail lines within the city instead of developing other modes. However, LRT is associated with
increased economic development and a better community image. New businesses and residential
developers are more likely to develop within proximity to LRT lines.
Applicability to Ithaca Due to the limitations of space as well as budget, a standard BRT system, which includes
elements such as busway alignment, dedicated right-of-way, and intersection treatments, cannot
be implemented in Ithaca. Therefore, a “modified BRT system” that applies some of the BRT
features to current transit system has been proposed to improve the service quality.
Running Ways The most critical issue in planning BRT running ways is the availability of an exclusive right-of-
way. Exclusive lanes are preferred for standard BRT system since they have the greatest level of
separation. However, most roads in Ithaca do not meet the conditions to set exclusive lanes for
BRT buses. Also, running ways are the most significant cost item in the entire BRT system.
Based on these reasons, the modified BRT system would operate on current mixed flow lanes.
Stations Most stations in Ithaca consist of a basic transit stop with a simple shelter to protect waiting
passengers from the weather. The platform layouts of most stations are single vehicle length
platforms. This is the shortest platform length necessary for the entry and exit of one bus at a
time at a station. Platform-level boarding is an essential feature of BRT service. Having the bus
station platform level with the bus floor is one of the most important ways of reducing boarding
and alighting times per passenger and affecting the safety and convenience of service. Therefore,
we would apply this feature to the modified BRT system.
Vehicles Current buses are conventional standard vehicles that have two doors and a rapidly deployable
ramp for wheelchair-bound and other mobility-impaired customers. Vehicle configuration would
remain for the modified BRT system.
Fare Collection Transit in Ithaca has a pay-on-board system. Passengers board through the front door and pay the
fare by cash or smartcard as they enter. This fare collection process results in large dwell time on
busy routes. Off-board fare collection, as another essential element of BRT service, is one of the
most important factors in reducing travel time and improving the customer experience. This
feature would be considered in the modified BRT system.

V. Bus Rapid Transit 84
Feasibility Study of Service Options for Tompkins Consolidated Area Transit in Ithaca and Tompkins County
Off-Board Fare Collection Fare payment aboard transit vehicles is often a source of delay for operators. For that reason,
many transit providers find off-vehicle fare payment (sometimes called a proof of payment
system) improves reliability and reduces dwell time at stops. Off-vehicle fare payment may take
the form of pre-payment online or purchasing a ticket at a ticket vending machine. This practice
is very common on North American light rail systems and has gained popularity as a way to
improve service for many BRT systems. For this particular project, aiming to improve the bus
system of TCAT in Ithaca, the long dwell time and crowded inflow of passengers could be
solved by applying this BRT feature.
Comparison of Fare Collection Methods In general, there are two generations of fare collection methods for buses. They can be grouped
as traditional on-board fare collection and off-board fare collection.
On-Board Fare Collection We can further group these by the types of machines they use.
• Mechanical, non-electrical
• Cashless fare boxes
• Full featured
Mechanical systems only use coins and bills. The
advantages for this are that they are small,
inexpensive, reliable, secure, easy to maintain, and
well suited for their application, while the
disadvantages are troublesome manual cash counting,
limited amount of cash capacity, manual passenger
counting, and no interfaces.
Cashless fare boxes use smart cards and magnetic
cards. The advantages are that they are easy to
install, less expensive than full featured fare boxes,
able to process all types of electronic fare media,
able to interface to other devices, reliable, and
configurable. Their disadvantages are that they
require separate devices for accepting cash, and
ridership or revenue reports are separate from cash
counting and reporting.
Generally speaking, on board fare collection is simple to operate and straightforward to use.
Most importantly, using this method can save capital cost. However, this system will not work as
well in a busier condition. For the stops with frequent and a high level of ridership, this system
can slow the inflow of passengers leading to serious delay of the bus. For a relatively mature bus
transit system, the off-board fare collection system can optimize the boarding time.
Figure 41: Fare Collection Types
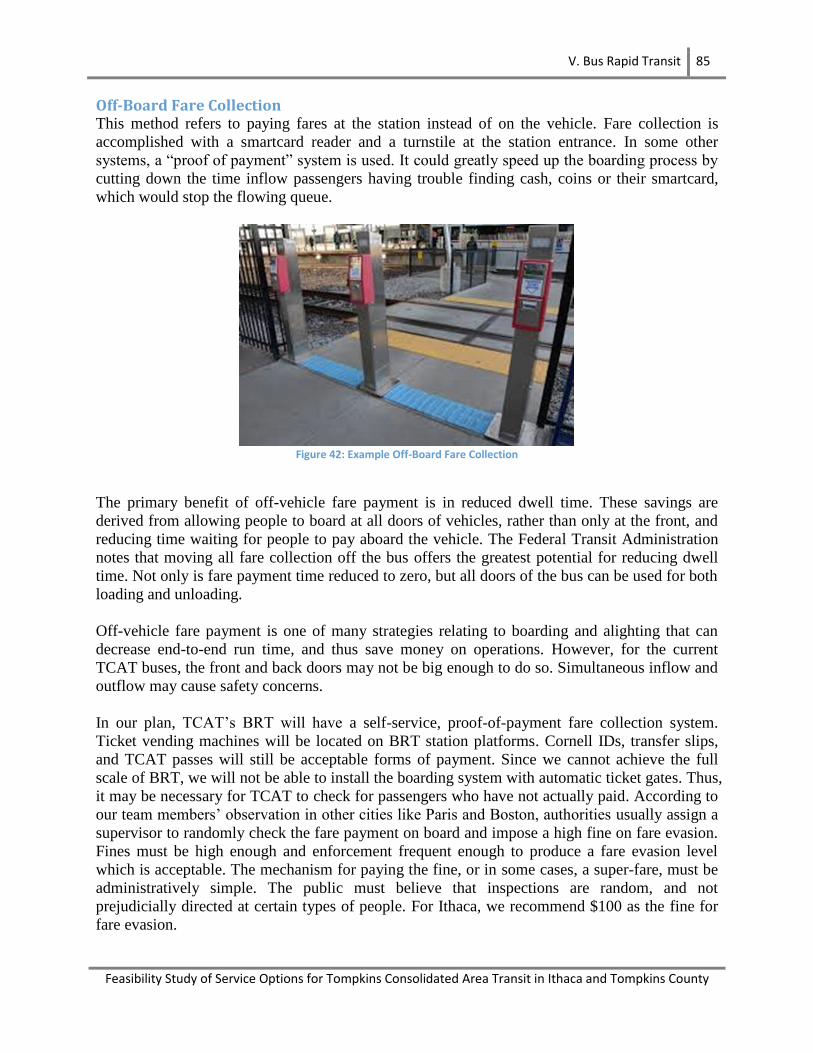
V. Bus Rapid Transit 85
Feasibility Study of Service Options for Tompkins Consolidated Area Transit in Ithaca and Tompkins County
Off-Board Fare Collection This method refers to paying fares at the station instead of on the vehicle. Fare collection is
accomplished with a smartcard reader and a turnstile at the station entrance. In some other
systems, a “proof of payment” system is used. It could greatly speed up the boarding process by
cutting down the time inflow passengers having trouble finding cash, coins or their smartcard,
which would stop the flowing queue.
Figure 42: Example Off-Board Fare Collection
The primary benefit of off-vehicle fare payment is in reduced dwell time. These savings are
derived from allowing people to board at all doors of vehicles, rather than only at the front, and
reducing time waiting for people to pay aboard the vehicle. The Federal Transit Administration
notes that moving all fare collection off the bus offers the greatest potential for reducing dwell
time. Not only is fare payment time reduced to zero, but all doors of the bus can be used for both
loading and unloading.
Off-vehicle fare payment is one of many strategies relating to boarding and alighting that can
decrease end-to-end run time, and thus save money on operations. However, for the current
TCAT buses, the front and back doors may not be big enough to do so. Simultaneous inflow and
outflow may cause safety concerns.
In our plan, TCAT’s BRT will have a self-service, proof-of-payment fare collection system.
Ticket vending machines will be located on BRT station platforms. Cornell IDs, transfer slips,
and TCAT passes will still be acceptable forms of payment. Since we cannot achieve the full
scale of BRT, we will not be able to install the boarding system with automatic ticket gates. Thus,
it may be necessary for TCAT to check for passengers who have not actually paid. According to
our team members’ observation in other cities like Paris and Boston, authorities usually assign a
supervisor to randomly check the fare payment on board and impose a high fine on fare evasion.
Fines must be high enough and enforcement frequent enough to produce a fare evasion level
which is acceptable. The mechanism for paying the fine, or in some cases, a super-fare, must be
administratively simple. The public must believe that inspections are random, and not
prejudicially directed at certain types of people. For Ithaca, we recommend $100 as the fine for
fare evasion.
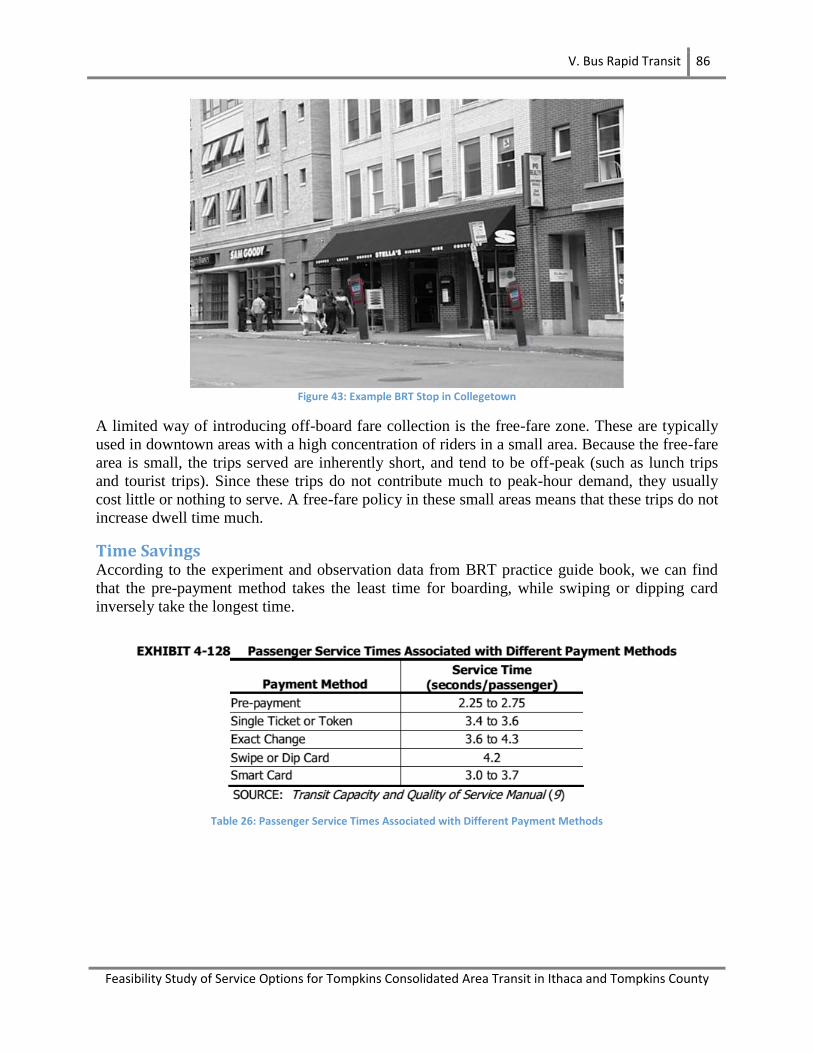
V. Bus Rapid Transit 86
Feasibility Study of Service Options for Tompkins Consolidated Area Transit in Ithaca and Tompkins County
Figure 43: Example BRT Stop in Collegetown
A limited way of introducing off-board fare collection is the free-fare zone. These are typically
used in downtown areas with a high concentration of riders in a small area. Because the free-fare
area is small, the trips served are inherently short, and tend to be off-peak (such as lunch trips
and tourist trips). Since these trips do not contribute much to peak-hour demand, they usually
cost little or nothing to serve. A free-fare policy in these small areas means that these trips do not
increase dwell time much.
Time Savings According to the experiment and observation data from BRT practice guide book, we can find
that the pre-payment method takes the least time for boarding, while swiping or dipping card
inversely take the longest time.
Table 26: Passenger Service Times Associated with Different Payment Methods
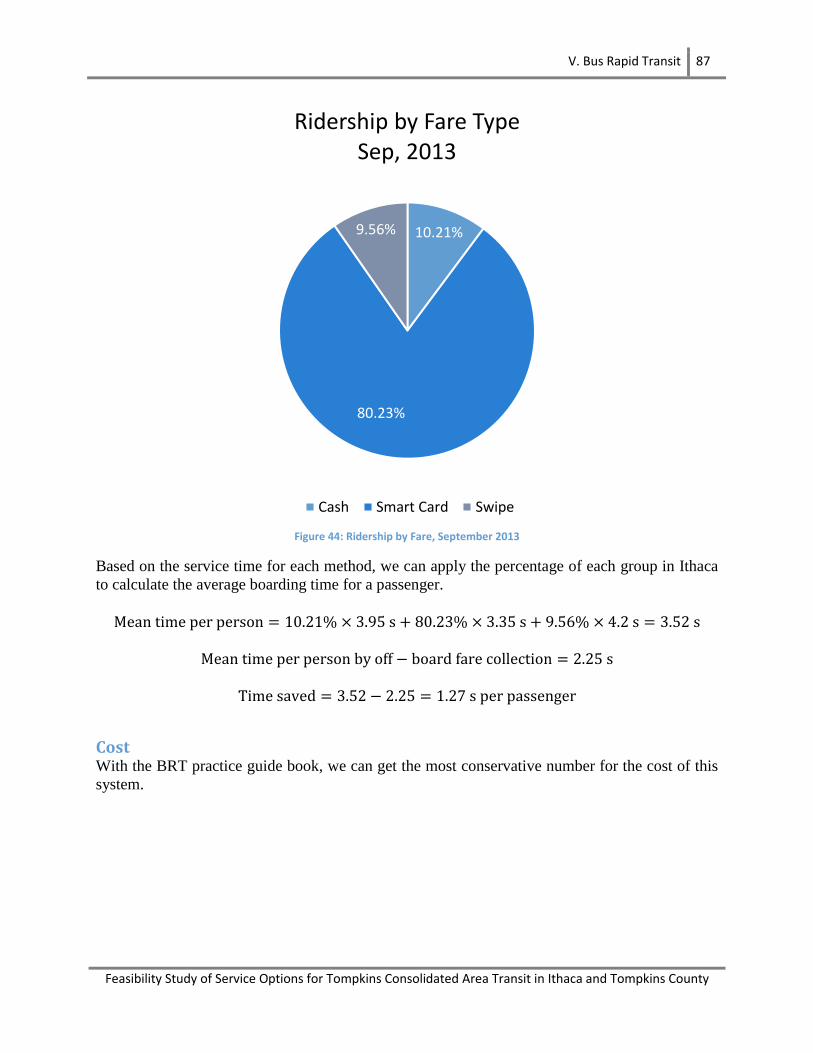
V. Bus Rapid Transit 87
Feasibility Study of Service Options for Tompkins Consolidated Area Transit in Ithaca and Tompkins County
Figure 44: Ridership by Fare, September 2013
Based on the service time for each method, we can apply the percentage of each group in Ithaca
to calculate the average boarding time for a passenger.
Cost With the BRT practice guide book, we can get the most conservative number for the cost of this
system.
10.21%
80.23%
9.56%
Ridership by Fare Type Sep, 2013
Cash Smart Card Swipe
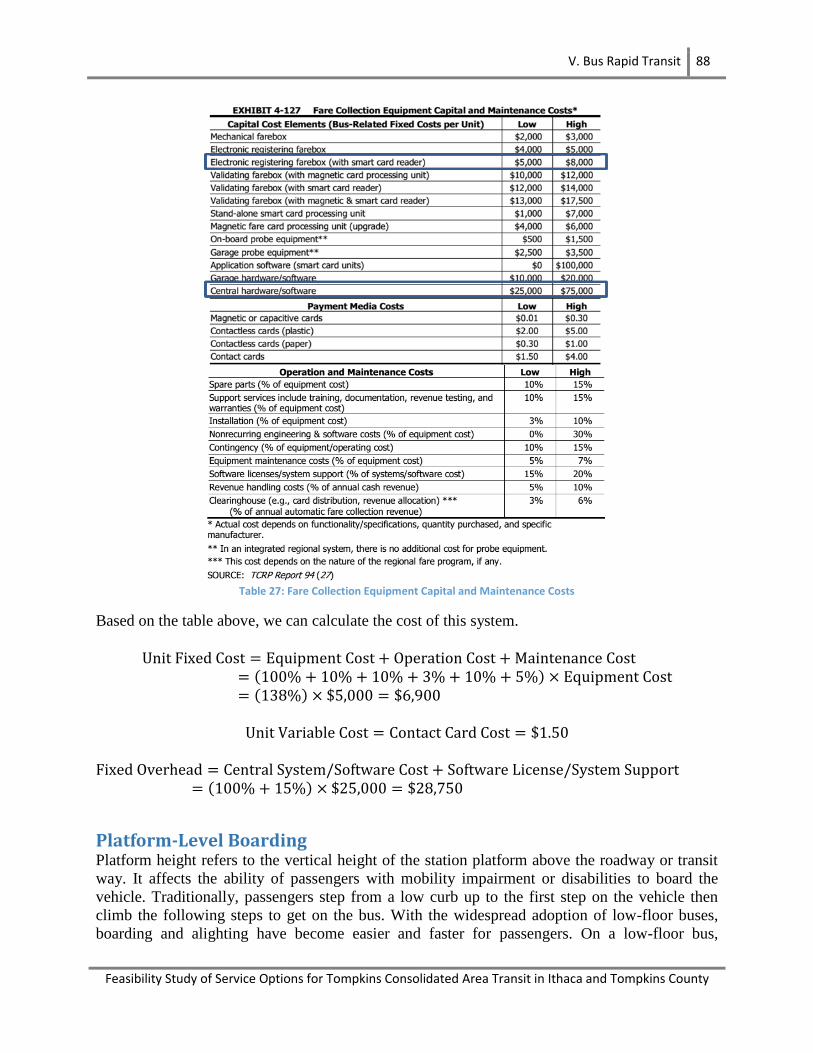
V. Bus Rapid Transit 88
Feasibility Study of Service Options for Tompkins Consolidated Area Transit in Ithaca and Tompkins County
Table 27: Fare Collection Equipment Capital and Maintenance Costs
Based on the table above, we can calculate the cost of this system.
Platform-Level Boarding Platform height refers to the vertical height of the station platform above the roadway or transit
way. It affects the ability of passengers with mobility impairment or disabilities to board the
vehicle. Traditionally, passengers step from a low curb up to the first step on the vehicle then
climb the following steps to get on the bus. With the widespread adoption of low-floor buses,
boarding and alighting have become easier and faster for passengers. On a low-floor bus,
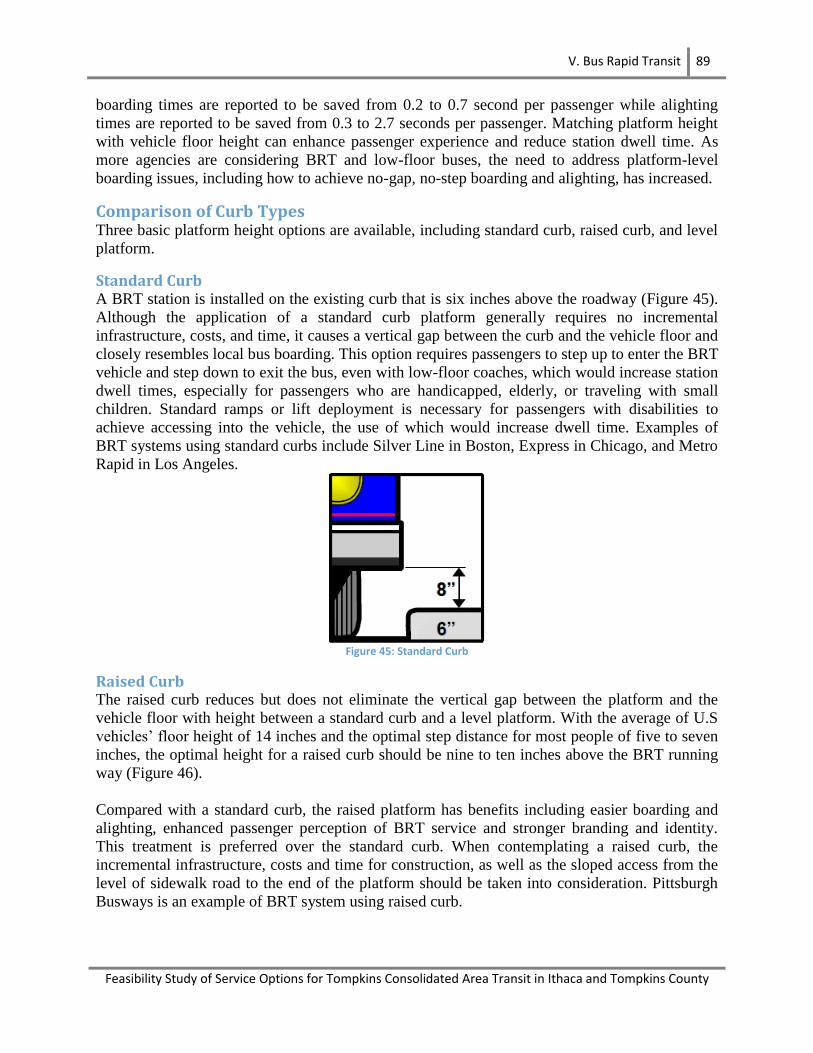
V. Bus Rapid Transit 89
Feasibility Study of Service Options for Tompkins Consolidated Area Transit in Ithaca and Tompkins County
boarding times are reported to be saved from 0.2 to 0.7 second per passenger while alighting
times are reported to be saved from 0.3 to 2.7 seconds per passenger. Matching platform height
with vehicle floor height can enhance passenger experience and reduce station dwell time. As
more agencies are considering BRT and low-floor buses, the need to address platform-level
boarding issues, including how to achieve no-gap, no-step boarding and alighting, has increased.
Comparison of Curb Types Three basic platform height options are available, including standard curb, raised curb, and level
platform.
Standard Curb A BRT station is installed on the existing curb that is six inches above the roadway (Figure 45).
Although the application of a standard curb platform generally requires no incremental
infrastructure, costs, and time, it causes a vertical gap between the curb and the vehicle floor and
closely resembles local bus boarding. This option requires passengers to step up to enter the BRT
vehicle and step down to exit the bus, even with low-floor coaches, which would increase station
dwell times, especially for passengers who are handicapped, elderly, or traveling with small
children. Standard ramps or lift deployment is necessary for passengers with disabilities to
achieve accessing into the vehicle, the use of which would increase dwell time. Examples of
BRT systems using standard curbs include Silver Line in Boston, Express in Chicago, and Metro
Rapid in Los Angeles.
Figure 45: Standard Curb
Raised Curb The raised curb reduces but does not eliminate the vertical gap between the platform and the
vehicle floor with height between a standard curb and a level platform. With the average of U.S
vehicles’ floor height of 14 inches and the optimal step distance for most people of five to seven
inches, the optimal height for a raised curb should be nine to ten inches above the BRT running
way (Figure 46).
Compared with a standard curb, the raised platform has benefits including easier boarding and
alighting, enhanced passenger perception of BRT service and stronger branding and identity.
This treatment is preferred over the standard curb. When contemplating a raised curb, the
incremental infrastructure, costs and time for construction, as well as the sloped access from the
level of sidewalk road to the end of the platform should be taken into consideration. Pittsburgh
Busways is an example of BRT system using raised curb.
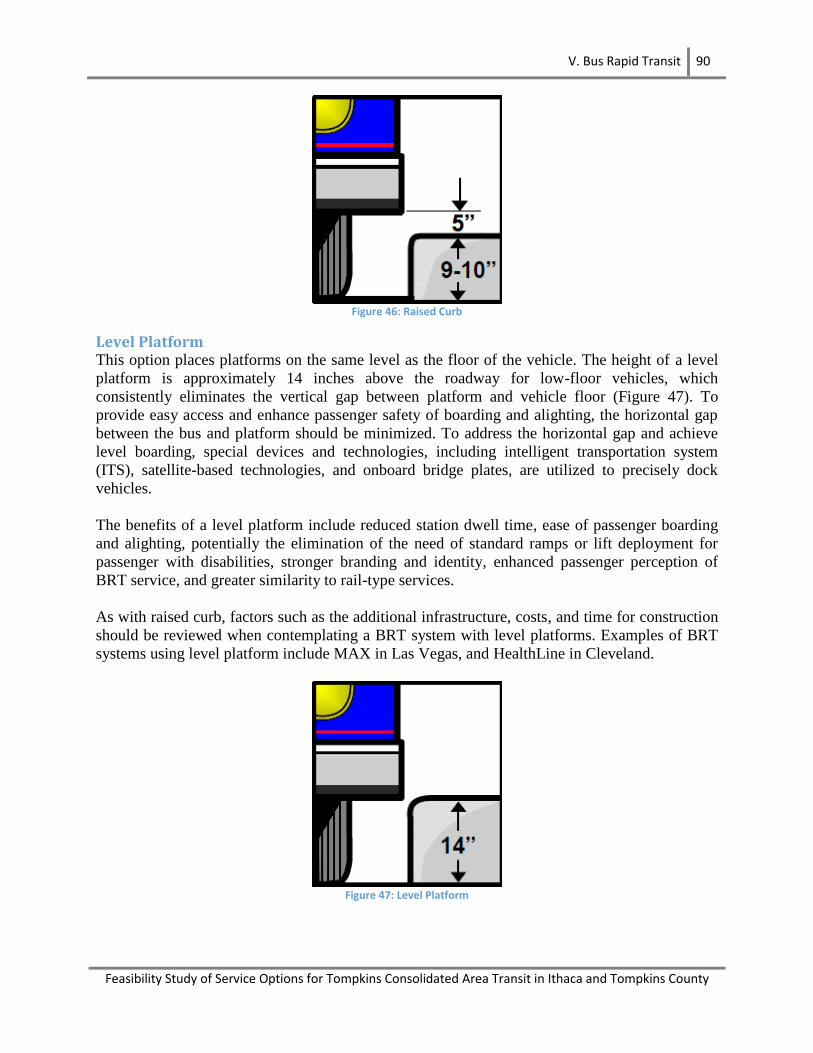
V. Bus Rapid Transit 90
Feasibility Study of Service Options for Tompkins Consolidated Area Transit in Ithaca and Tompkins County
Figure 46: Raised Curb
Level Platform
This option places platforms on the same level as the floor of the vehicle. The height of a level
platform is approximately 14 inches above the roadway for low-floor vehicles, which
consistently eliminates the vertical gap between platform and vehicle floor (Figure 47). To
provide easy access and enhance passenger safety of boarding and alighting, the horizontal gap
between the bus and platform should be minimized. To address the horizontal gap and achieve
level boarding, special devices and technologies, including intelligent transportation system
(ITS), satellite-based technologies, and onboard bridge plates, are utilized to precisely dock
vehicles.
The benefits of a level platform include reduced station dwell time, ease of passenger boarding
and alighting, potentially the elimination of the need of standard ramps or lift deployment for
passenger with disabilities, stronger branding and identity, enhanced passenger perception of
BRT service, and greater similarity to rail-type services.
As with raised curb, factors such as the additional infrastructure, costs, and time for construction
should be reviewed when contemplating a BRT system with level platforms. Examples of BRT
systems using level platform include MAX in Las Vegas, and HealthLine in Cleveland.
Figure 47: Level Platform

V. Bus Rapid Transit 91
Feasibility Study of Service Options for Tompkins Consolidated Area Transit in Ithaca and Tompkins County
In summary, the standard curb is the easiest one to implement since no additional infrastructure,
costs, and time is required, while raising the curb to a raised platform or level platform provide
improvements in passenger convenience and safety.
Implementation for TCAT To create a safe, easy, and efficient manner of passenger boarding and alighting, level platform is
preferred compared to standard curb and raised curb. This treatment applies only to stations with
high ridership due to the limitations of space and budget.
A few assumptions have been made to determine the construction area of each station. Since
most stations in Ithaca are installed on the existing sidewalk and the minimum width of sidewalk
is three feet, we assume the width of level platform is three feet.
The length of a platform consists of the lengths of entrance taper, deceleration lane, stopping
area, acceleration lane, and exit taper (Figure 48). Since most passengers get on or get down the
vehicle in the areas of deceleration lane, stopping area, and acceleration lane, we assume that the
length of level platform only includes these three parts. The length of stopping area should be 50
feet for each standard 40 foot bus. Assuming that the through speed of vehicle is 35 miles per
hour (mph) and the entering speed is 25 mph. Then, for the location and design of bus stops, the
length of the acceleration lane is 250 feet while the length of the deceleration lane is 184 feet.
Figure 48: BRT Bus Stop Diagram
Based on above assumptions, the width of the level platform is 3 feet while the length of the
level platform is 484 feet. The area of a level platform is 1,452 square feet.
Cost Implementing a level platform requires an additional eight inches of concrete depth with
additional infrastructure cost. According to Generic Cost Estimating Tool, the unit cost of
concrete paving sidewalk (scored) is from $8 to $10 per square foot. We assume the unit cost of
material is $9 per square foot. Given the area of a level platform of 1,452 square feet, the
infrastructure cost of level platform is $13,068 per station.

V. Bus Rapid Transit 92
Feasibility Study of Service Options for Tompkins Consolidated Area Transit in Ithaca and Tompkins County
Branding
Need for Branding BRT systems are developed incrementally. Images and marketing are necessary for the success
of BRT. A distinct identity is necessary for the promotion of BRT, e.g. distinct identity is a
hallmark of Europe’s BRT systems. It is necessary as a means to distinguish high-quality bus
services from regular ones. In order to distinguish BRT in the public and media’s perception, it is
important to brand the system as different and as better than the existing system. This requires a
strong communications and marketing plan leading up to system launch, as well as high quality
branding that will touch all elements of the system, from communications products to signage to
maps and the buses themselves.
First impressions can make or break a new BRT project. In Los Angeles and Las Vegas, both of
which have already implemented BRT plans, the news media and the public’s first impressions
of the system at opening helped define the slant of subsequent coverage for months, if not years.
In Las Vegas, the BRT system opened to great fanfare and praise, and benefited from the
negative attention of the city’s trouble-prone monorail project. Los Angeles’s BRT system
opened late, over budget, had a series of collisions with automobiles, and brought with it a batch
of service cuts on parallel bus routes. High ridership volumes and free rides were not enough to
overcome the Orange Line’s troubled start.
Future BRT lines and networks can build on initial successes. The consistent use of certain
messages, particularly early on, can help shape long-term public perception of a project.
There should be strong positioning of BRT as much more than a regular bus service. The system
should be sold as modern and efficient, something locals could be proud of and as
groundbreaking and cost-effective.
Results of Developing Branding There will be great public support and enthusiasm. Public buy-in to the system can be achieved
by various means, such as naming contests. Las Vegas officials used a contest as a way to build
public awareness and interest. Although that did open the door to the publication of critical
names like The Bust, it did engage the community members early on in the development process.
The pride that this kind of early buy-in engendered was fostered through the opening weeks of
the system.
Strong business and political can also be achieved. Seeing the popularity of the system, the
business and political community tend to lend support to it. This is an important step towards
federal grant eligibility. Branding can also lead to positive media, which leads to more people
using the system, potentially increasing the ridership by 15 to 20%.
Improved and new-generation transit systems like BRT act as a catalyst for economic
development. The brand helps in increase in property values around the new system. BRT
branding also increases ridership, which help generate more revenue for the transit authorities.
Features of Branding Branding should be applied system-wide and should include the following items
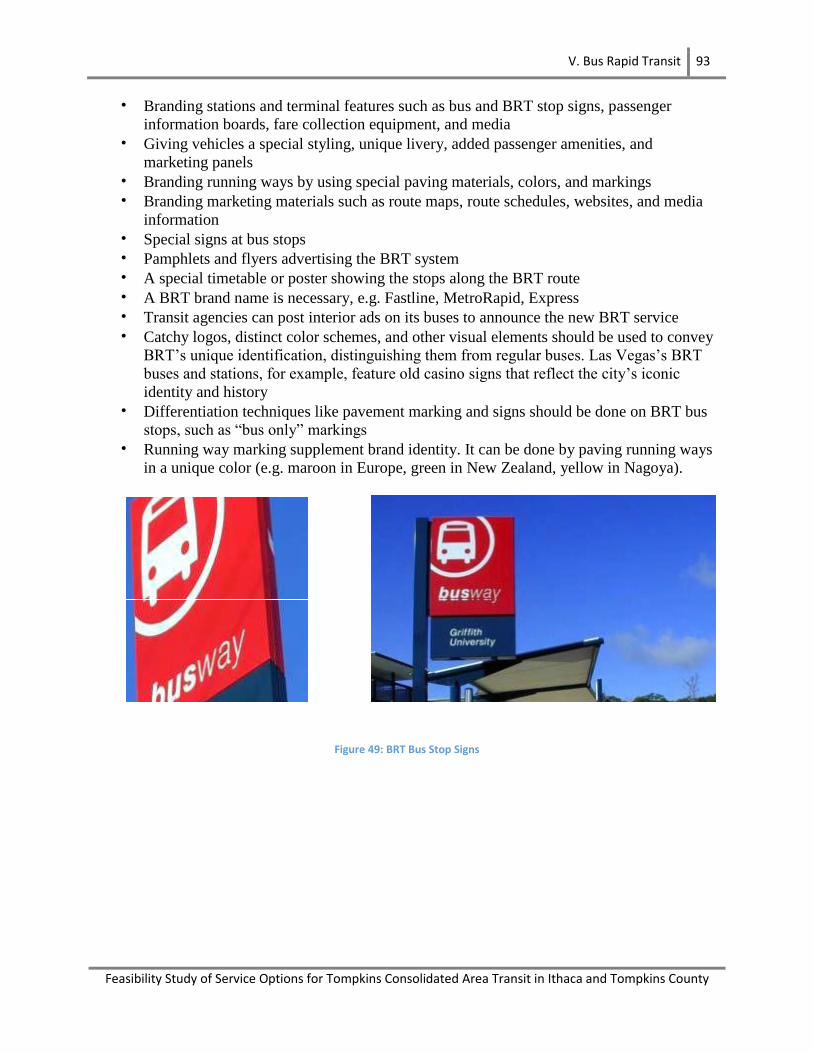
V. Bus Rapid Transit 93
Feasibility Study of Service Options for Tompkins Consolidated Area Transit in Ithaca and Tompkins County
• Branding stations and terminal features such as bus and BRT stop signs, passenger
information boards, fare collection equipment, and media
• Giving vehicles a special styling, unique livery, added passenger amenities, and
marketing panels
• Branding running ways by using special paving materials, colors, and markings
• Branding marketing materials such as route maps, route schedules, websites, and media
information
• Special signs at bus stops
• Pamphlets and flyers advertising the BRT system
• A special timetable or poster showing the stops along the BRT route
• A BRT brand name is necessary, e.g. Fastline, MetroRapid, Express
• Transit agencies can post interior ads on its buses to announce the new BRT service
• Catchy logos, distinct color schemes, and other visual elements should be used to convey
BRT’s unique identification, distinguishing them from regular buses. Las Vegas’s BRT
buses and stations, for example, feature old casino signs that reflect the city’s iconic
identity and history
• Differentiation techniques like pavement marking and signs should be done on BRT bus
stops, such as “bus only” markings
• Running way marking supplement brand identity. It can be done by paving running ways
in a unique color (e.g. maroon in Europe, green in New Zealand, yellow in Nagoya).
Figure 49: BRT Bus Stop Signs
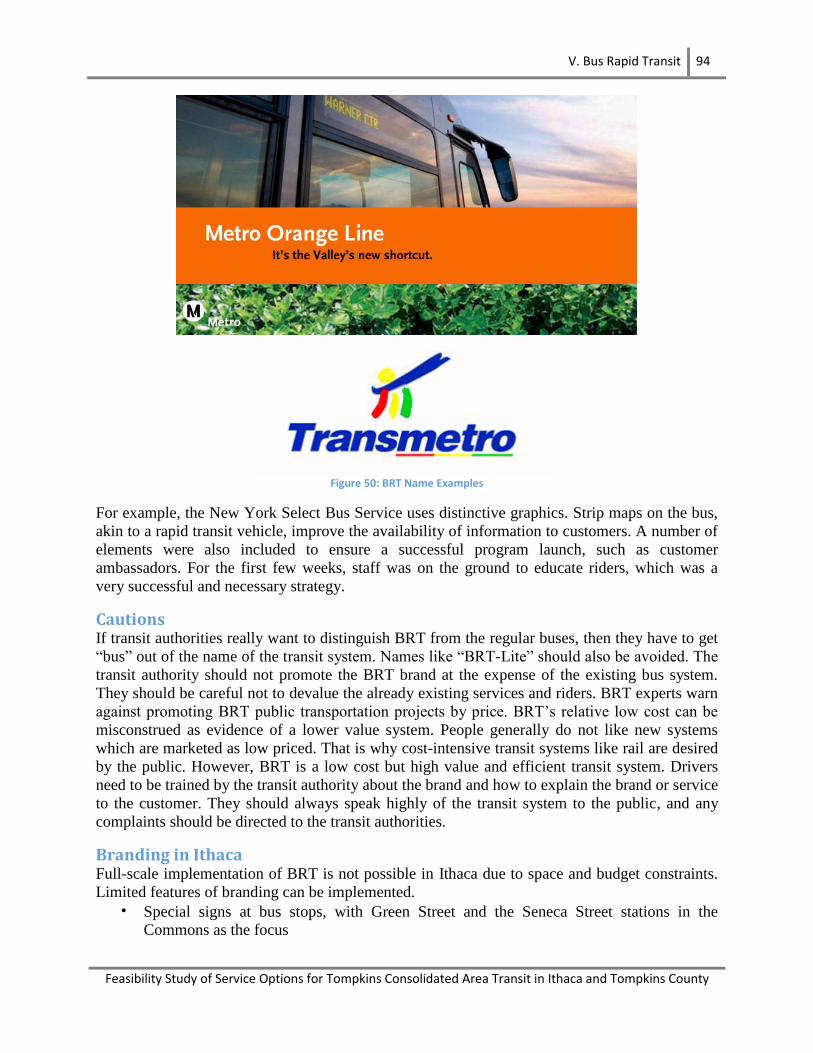
V. Bus Rapid Transit 94
Feasibility Study of Service Options for Tompkins Consolidated Area Transit in Ithaca and Tompkins County
Figure 50: BRT Name Examples
For example, the New York Select Bus Service uses distinctive graphics. Strip maps on the bus,
akin to a rapid transit vehicle, improve the availability of information to customers. A number of
elements were also included to ensure a successful program launch, such as customer
ambassadors. For the first few weeks, staff was on the ground to educate riders, which was a
very successful and necessary strategy.
Cautions If transit authorities really want to distinguish BRT from the regular buses, then they have to get
“bus” out of the name of the transit system. Names like “BRT-Lite” should also be avoided. The
transit authority should not promote the BRT brand at the expense of the existing bus system.
They should be careful not to devalue the already existing services and riders. BRT experts warn
against promoting BRT public transportation projects by price. BRT’s relative low cost can be
misconstrued as evidence of a lower value system. People generally do not like new systems
which are marketed as low priced. That is why cost-intensive transit systems like rail are desired
by the public. However, BRT is a low cost but high value and efficient transit system. Drivers
need to be trained by the transit authority about the brand and how to explain the brand or service
to the customer. They should always speak highly of the transit system to the public, and any
complaints should be directed to the transit authorities.
Branding in Ithaca Full-scale implementation of BRT is not possible in Ithaca due to space and budget constraints.
Limited features of branding can be implemented.
• Special signs at bus stops, with Green Street and the Seneca Street stations in the
Commons as the focus
V. Bus Rapid Transit 95
Feasibility Study of Service Options for Tompkins Consolidated Area Transit in Ithaca and Tompkins County
• A special timetable showing the stops on the BRT route to be affixed on the off-board
fare collection machines
• Due to the limited availability of buses with TCAT, we do not suggest special livery or
logos to be painted on the buses
• Buses will have electronic sign boards with special route numbers to indicate BRT
service
• Pamphlets and flyers advertising the BRT system, especially on stops on proposed
express Route 30
• Painting running ways with a unique color at bus stops with the stops of Green Street and
Seneca Street in the Common and at Ithaca Mall
• “BRT Only” markings on the pavement at bus stops
• Logo and BRT names will be decided by the citizens of Ithaca
Cost of Branding The population of Cleveland is 390,928. In Cleveland, the money spent for branding is $1.2
million. In Santa Clara, California for the Valley Transportation Authority 522 Rapid, the cost of
branding is $135,000. For the Los Angeles BRT, the transit authority started the advertising
budget at approximately $80,000. After deciding to have an in-house public relations unit, the
budget rose to close to $3.5 million but currently it has shrank to $1.5 – 2 million. Considering
that the population of Ithaca is 30,331, we expect the cost of branding for the proposed BRT
system is $80,000.
Monte Carlo Simulation The Monte Carlo simulation was carried out for the ridership for certain stops which we chose to
apply the off-board fare collection feature. We can use the ridership data to calculate the time
spent at these stops compared to the original time spent to see how much time a passenger can
save by applying the BRT features.
In our simulation process, we used @Risk as our analysis tool. We used the fitted distribution
function to analyze the original data of each stop to fit the ridership distribution. We ran 500
iterations for each stop to get the simulated ridership distribution. By applying the percentage
and the standard time spent at each fare payment method, we can get the time using the
distribution. We will be able to calculate the mean time spent at each stop and the mean time
saving from off-board fare collection.
There are differences in the effects of features at different peak periods. We considered fitting
the distribution and running the simulation by different time periods. We divided a weekday into
three parts: morning rush hour, afternoon rush hour, and others, while for weekends, the day can
be divided into rush hour and others.
The following figures show the results for the boarding times from the stop at College and
Dryden at different times of the day.
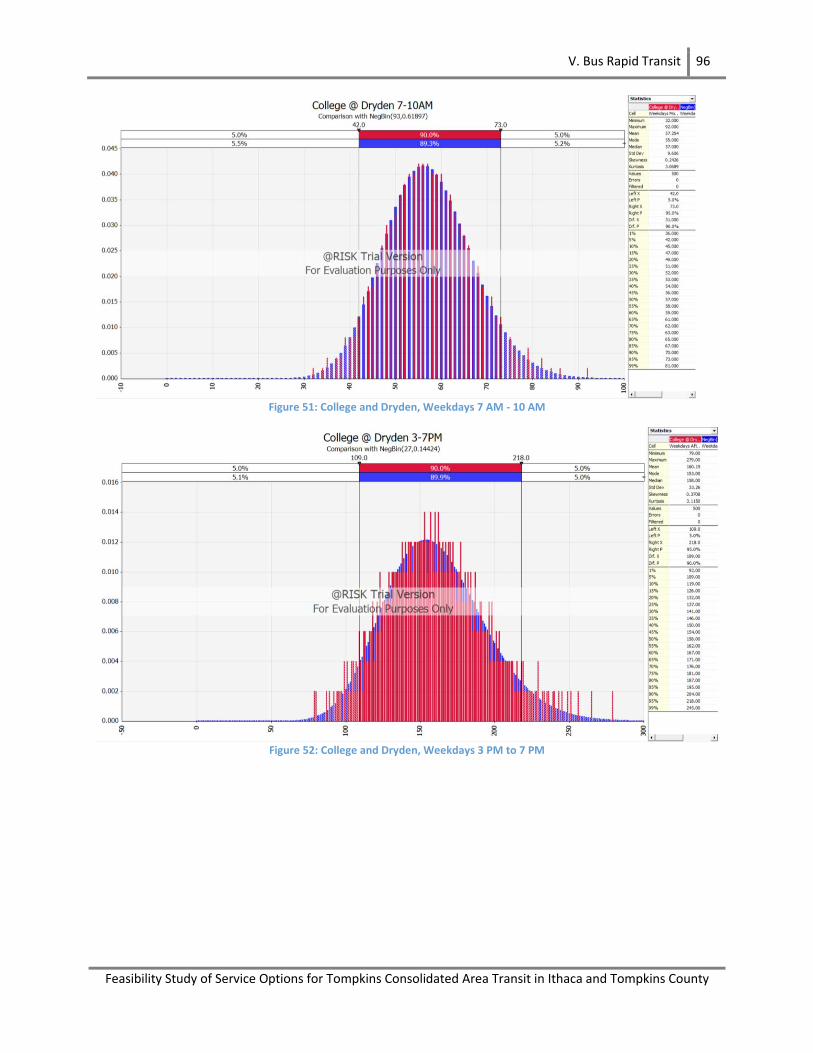
V. Bus Rapid Transit 96
Feasibility Study of Service Options for Tompkins Consolidated Area Transit in Ithaca and Tompkins County
Figure 51: College and Dryden, Weekdays 7 AM - 10 AM
Figure 52: College and Dryden, Weekdays 3 PM to 7 PM

V. Bus Rapid Transit 97
Feasibility Study of Service Options for Tompkins Consolidated Area Transit in Ithaca and Tompkins County
Figure 53: College and Dryden, Weekends 12 PM to 4 PM
The following table is a summary of time savings for all of the stops of Route 30 through
weekdays and weekends using BRT features.
Table 28: Total Time Savings Using Off-Board Fare Collection
From the results above, we find by applying the BRT features, it does save time for each stop,
but it is far less than other improvement methods. However, considering the other effects like
branding and rider experience, it may be considered a convenient and time-saving experience.
V. Bus Rapid Transit 98
Feasibility Study of Service Options for Tompkins Consolidated Area Transit in Ithaca and Tompkins County
Total Cost Among stops that have annual ridership of more than 50,000 boardings in 2012, nine of the
eighteen stops belong to Route 30. Along Route 30, stops with annual ridership of more than
100,000 boardings are selected to implement BRT features. That is, we would apply off-board
fare collection and level platform features to seven stops, including Green at Commons, Seneca
at Commons, Statler Hall, Ithaca Mall, Sage Hall, Schwartz PAC, and College and Dryden.
The unit cost of implementing off-board fare collection is $28,750 per stop. The unit cost of
implementing level-platform is $13,068 per stop. The total cost of apply these two features is
$292,726. Combined with the cost of branding, the cost for implementing BRT services in Ithaca
will be $372,726.
Conclusion In summary, we reach the following conclusions. A standard BRT system cannot be
implemented due to the limitations of space and budget. Instead, a “modified BRT system” has
been proposed, which applies limited BRT features including off-board fare collection, level
platform, and branding, to current transit system. For off-board fare collection, a self-service,
proof-of-payment fare collection method would be recommended. Ticket vending machines
would be located on station platforms. Current forms of payment, including paying with Cornell
IDs, transfer slips, and TCAT passes, would be kept. A supervisor would be assigned to
randomly check the fare payment on board. A penalty of $100 would be charged for skipping the
ticketing. For platform height, a level platform is preferred compared to standard curbs and
raised curbs. The area of a level platform would be 1,452 square feet based on assumptions of
the width and length of the platform. For branding, we suggest to have special signs at stops of
Green Street and Seneca Street in the Commons, and a BRT route timetable to be affixed on the
ticket vending machine. Buses with electronic signboards would display the BRT service with
special route numbers. Running ways of stops of Green Street Station and Seneca Street in the
Commons and Ithaca Mall would be painted with a unique color. Also, “BRT Bus Only” would
be marked on the pavement at BRT bus stations.
These features would be applied to seven stops along Route 30. The combined cost of all
features would be $372,726. Through implementation of these features, it will be possible for
users to save time and find the BRT experience to be an improvement over existing services.

VI. Articulated Buses 99
Feasibility Study of Service Options for Tompkins Consolidated Area Transit in Ithaca and Tompkins County
VI. Articulated Buses
Introduction TCAT has experienced an increasing number of full buses during peak-hour services. Full buses
incur an opportunity cost associated with the unserved demand, and lower passenger satisfaction.
One among numerous options to improve the quality of transit service on high-demand routes is
the use of high-capacity transit vehicles. The goal of this study is to evaluate the feasibility of
operating articulated buses on high-demand routes. The fixed-routes with high current demands,
upward demand trends, and are frequently reported full during peak services are the focus of the
analysis. Two representative routes are chosen accordingly.
Background Information Articulated buses have a long history in North America. In 1938, Twin Coach Company
manufactured the first articulated bus for Baltimore, Maryland. However, at that time, the
articulated bus was not successful due to the large turning radius. On the west coast, AC Transit
in California started operating the experimental commuter coach named XMC 77 in the mid-
1960s. During the early stages, articulated buses were eventually withdrawn from service due to
the expensive maintenance. Nowadays, thanks to the high passenger capacity, articulated buses
are used as part of BRT systems.
In addition to BRT, other applications include peak-only services on trunk routes, commuter
express services to park-and-ride lots, trippers that experience overloads, replacement service for
rail shutdowns, and high-demand special events.
Technologies Typical articulated buses are approximately 59 feet in length, with a standard rigid-construction
from 36 to 46 feet. Some variations include the bi-articulated bus and the double-decker
articulated bus. The bus capacity is usually about 200 passengers. Articulated buses come in two
configurations – pusher or puller. In the pusher configuration, because rear-mounted engine
powers the rear axle of the bus while the longitudinal stability is maintained by hydraulics, the
buses can be built without steps. With this configuration, the pushers can be built with low floors
and without steps, which enhance the accessibility of the passengers. The pullers, on the other
hand, have the engines mounted in the front area, preventing lower floors and creating
discomfort to the passengers because of the noise and the vibration. However, the pullers
outperform the pushers in low temperature or freezing conditions. Diesel engines are common
among articulated buses. Nevertheless, there are also diesel-electric hybrids and others that are
propelled by compressed natural gas.
Advantages, Disadvantages, and Current Issues Articulated buses have a few attractive features. Aside from their high capacity, articulated buses
enable more rapid, simultaneous boarding and disembarkation through more and larger doors.
The bus dimensions translate to a lower center of gravity and, therefore, more stability. The
lower center of gravity also allows the bus to turn at a smaller turning radius. Unlike the double-
decker buses, the smaller frontal area of the articulated one results in less air resistance and, thus,
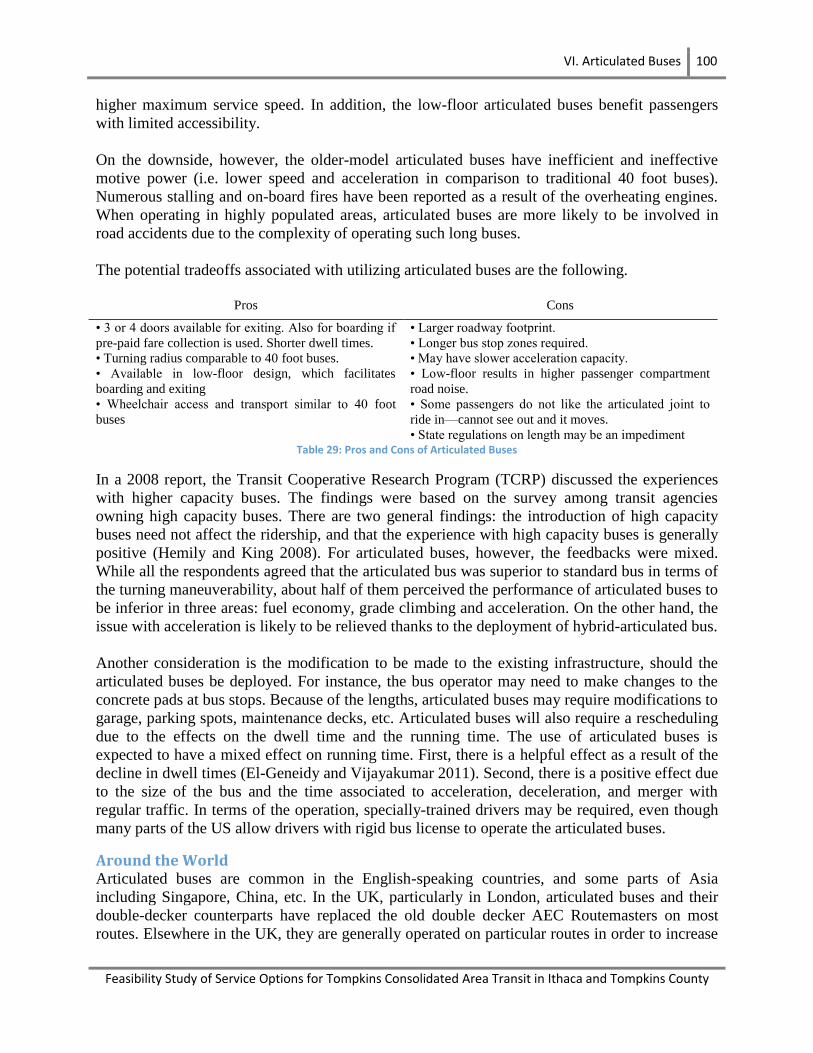
VI. Articulated Buses 100
Feasibility Study of Service Options for Tompkins Consolidated Area Transit in Ithaca and Tompkins County
higher maximum service speed. In addition, the low-floor articulated buses benefit passengers
with limited accessibility.
On the downside, however, the older-model articulated buses have inefficient and ineffective
motive power (i.e. lower speed and acceleration in comparison to traditional 40 foot buses).
Numerous stalling and on-board fires have been reported as a result of the overheating engines.
When operating in highly populated areas, articulated buses are more likely to be involved in
road accidents due to the complexity of operating such long buses.
The potential tradeoffs associated with utilizing articulated buses are the following.
Pros Cons
• 3 or 4 doors available for exiting. Also for boarding if
pre-paid fare collection is used. Shorter dwell times.
• Turning radius comparable to 40 foot buses.
• Available in low-floor design, which facilitates
boarding and exiting
• Wheelchair access and transport similar to 40 foot
buses
• Larger roadway footprint.
• Longer bus stop zones required.
• May have slower acceleration capacity.
• Low-floor results in higher passenger compartment
road noise.
• Some passengers do not like the articulated joint to
ride in––cannot see out and it moves.
• State regulations on length may be an impediment Table 29: Pros and Cons of Articulated Buses
In a 2008 report, the Transit Cooperative Research Program (TCRP) discussed the experiences
with higher capacity buses. The findings were based on the survey among transit agencies
owning high capacity buses. There are two general findings: the introduction of high capacity
buses need not affect the ridership, and that the experience with high capacity buses is generally
positive (Hemily and King 2008). For articulated buses, however, the feedbacks were mixed.
While all the respondents agreed that the articulated bus was superior to standard bus in terms of
the turning maneuverability, about half of them perceived the performance of articulated buses to
be inferior in three areas: fuel economy, grade climbing and acceleration. On the other hand, the
issue with acceleration is likely to be relieved thanks to the deployment of hybrid-articulated bus.
Another consideration is the modification to be made to the existing infrastructure, should the
articulated buses be deployed. For instance, the bus operator may need to make changes to the
concrete pads at bus stops. Because of the lengths, articulated buses may require modifications to
garage, parking spots, maintenance decks, etc. Articulated buses will also require a rescheduling
due to the effects on the dwell time and the running time. The use of articulated buses is
expected to have a mixed effect on running time. First, there is a helpful effect as a result of the
decline in dwell times (El-Geneidy and Vijayakumar 2011). Second, there is a positive effect due
to the size of the bus and the time associated to acceleration, deceleration, and merger with
regular traffic. In terms of the operation, specially-trained drivers may be required, even though
many parts of the US allow drivers with rigid bus license to operate the articulated buses.
Around the World Articulated buses are common in the English-speaking countries, and some parts of Asia
including Singapore, China, etc. In the UK, particularly in London, articulated buses and their
double-decker counterparts have replaced the old double decker AEC Routemasters on most
routes. Elsewhere in the UK, they are generally operated on particular routes in order to increase
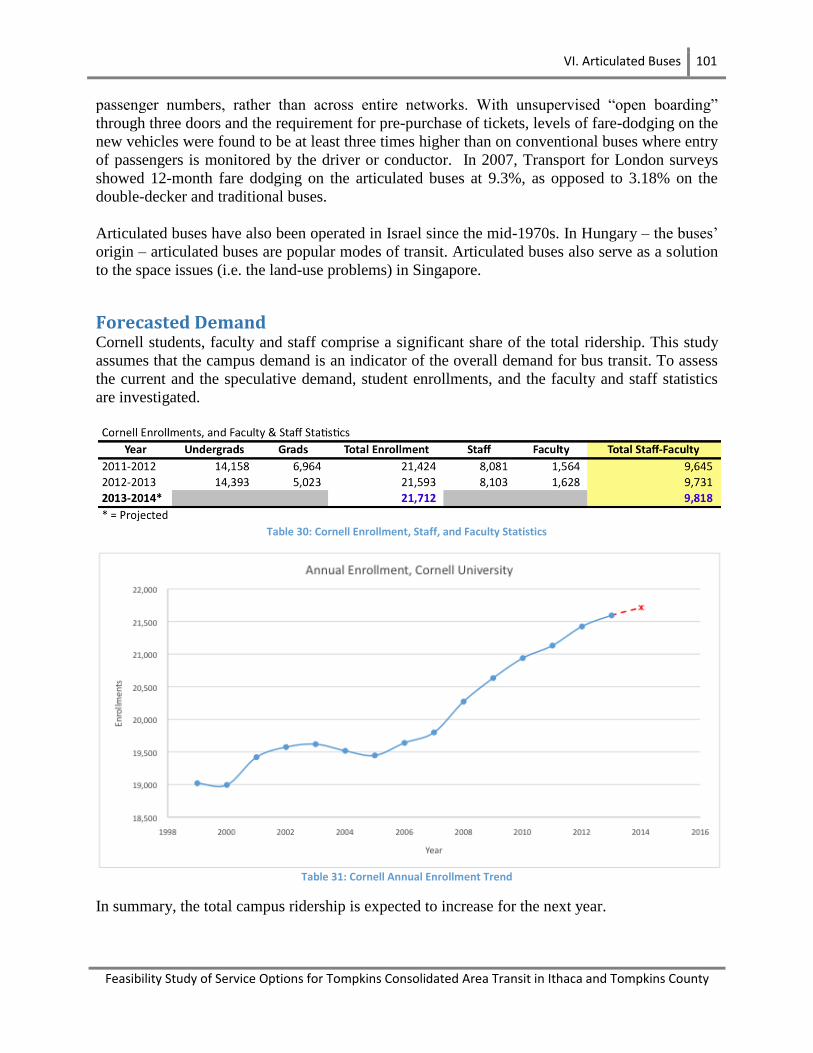
VI. Articulated Buses 101
Feasibility Study of Service Options for Tompkins Consolidated Area Transit in Ithaca and Tompkins County
passenger numbers, rather than across entire networks. With unsupervised “open boarding”
through three doors and the requirement for pre-purchase of tickets, levels of fare-dodging on the
new vehicles were found to be at least three times higher than on conventional buses where entry
of passengers is monitored by the driver or conductor. In 2007, Transport for London surveys
showed 12-month fare dodging on the articulated buses at 9.3%, as opposed to 3.18% on the
double-decker and traditional buses.
Articulated buses have also been operated in Israel since the mid-1970s. In Hungary – the buses’
origin – articulated buses are popular modes of transit. Articulated buses also serve as a solution
to the space issues (i.e. the land-use problems) in Singapore.
Forecasted Demand Cornell students, faculty and staff comprise a significant share of the total ridership. This study
assumes that the campus demand is an indicator of the overall demand for bus transit. To assess
the current and the speculative demand, student enrollments, and the faculty and staff statistics
are investigated.
Table 30: Cornell Enrollment, Staff, and Faculty Statistics
Table 31: Cornell Annual Enrollment Trend
In summary, the total campus ridership is expected to increase for the next year.
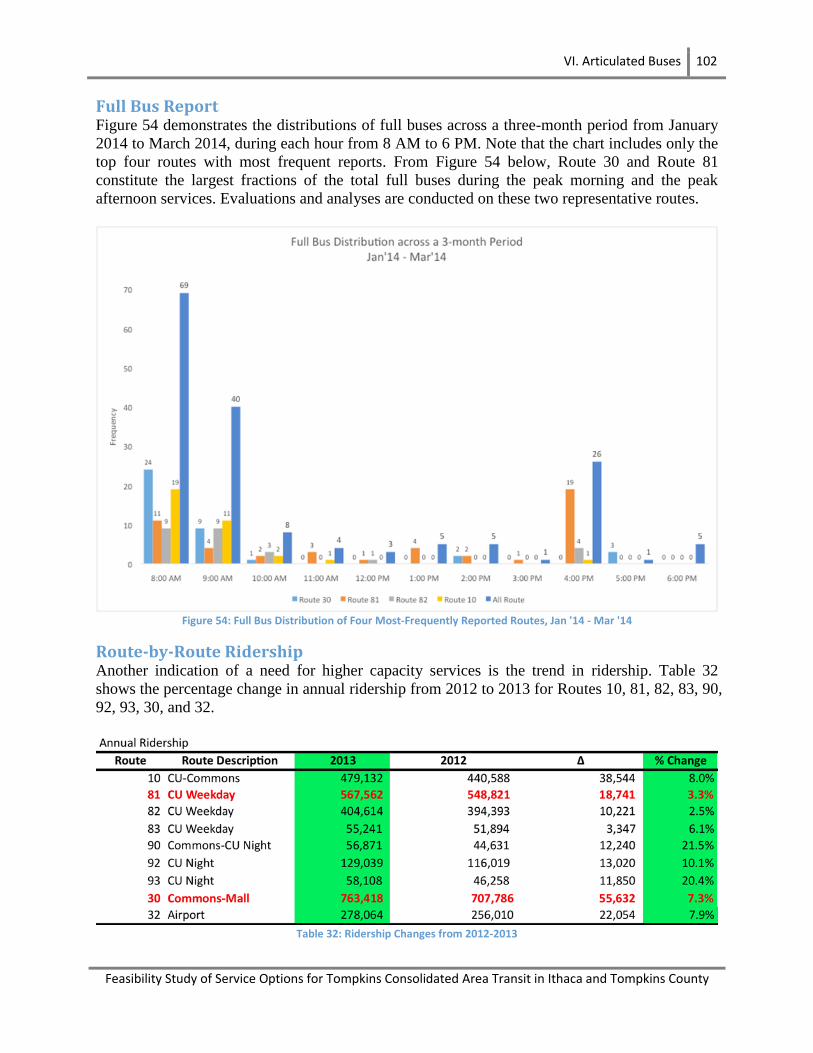
VI. Articulated Buses 102
Feasibility Study of Service Options for Tompkins Consolidated Area Transit in Ithaca and Tompkins County
Full Bus Report Figure 54 demonstrates the distributions of full buses across a three-month period from January
2014 to March 2014, during each hour from 8 AM to 6 PM. Note that the chart includes only the
top four routes with most frequent reports. From Figure 54 below, Route 30 and Route 81
constitute the largest fractions of the total full buses during the peak morning and the peak
afternoon services. Evaluations and analyses are conducted on these two representative routes.
Figure 54: Full Bus Distribution of Four Most-Frequently Reported Routes, Jan '14 - Mar '14
Route-by-Route Ridership Another indication of a need for higher capacity services is the trend in ridership. Table 32
shows the percentage change in annual ridership from 2012 to 2013 for Routes 10, 81, 82, 83, 90,
92, 93, 30, and 32.
Table 32: Ridership Changes from 2012-2013
VI. Articulated Buses 103
Feasibility Study of Service Options for Tompkins Consolidated Area Transit in Ithaca and Tompkins County
The figures associated with Route 30 and Route 81 contradict what would have been expected
based on the full-bus findings. Since both routes have high demands during peak hours, the
increase in ridership from 2012 to 2013 should have been more aggressive. However, both routes
experienced mediocre increases—7.3% for Route 30, and 3.3% for Route 81. The observation
implies that the increase in ridership is limited by the service capacity constraint.
Route-by-Route Findings Since the perceived quality of service depends upon passenger’s perception, the performance is
evaluated subject to the following measures:
1. Passenger loads
2. Reliability performance
3. Current and speculative transit vehicle occupancy
The first measure, passenger loads, follows the guideline stated in Transit Capacity and Quality
of Service Manual (TCQSM). Since the passenger’s comfort is the main concern, TCQSM uses
seating capacity, instead of total bus capacity, in calculating the load factor. For the purpose of
the analysis, 38 seating and 28 standing spaces per bus, totaling 66 passengers per bus, is
assumed.
Reliability performance for Route 81 is different from that of Route 30—the on-time
performance. Because Route 81 operates on ten minute headway, on-time performance is not
appropriate for assessing its reliability performance. Instead, headway evenness is a more
indicative measure for services with headways less than or equal to 10 minutes.
Finally, the current occupancy indicates how actively the service is utilized. The speculative
occupancy assumes that the NOVA articulated bus replaces the existing 40 foot model. The
articulated bus has a total capacity of 120 passengers per bus (or 101 with 20% spare ratio). The
speculative occupancy is a rough estimation of whether the articulated fleet will be effectively
utilized.
Route 81
Reliability Performance – Headway Adherence The Goldwin Smith Hall time point is selected for assessing the headway evenness, as the stop at
Goldwin Smith Hall is the busiest stop during peak hours. From the time stamps during
September 2013, the latitude-longitude coordination at Goldwin Smith Hall is identified. The
data is narrowed down to include only the peak-AM boardings. The underlying assumption is
that the long elapse time between any two boardings is an approximation of the actual headway.
After the data is extracted, the aberration from the scheduled headway is calculated by
subtracting the mean scheduled headway of 10 minutes from the observed headway. To use the
TCQSM reliability measure, the coefficient of headway deviation is calculated according to the
following equation:
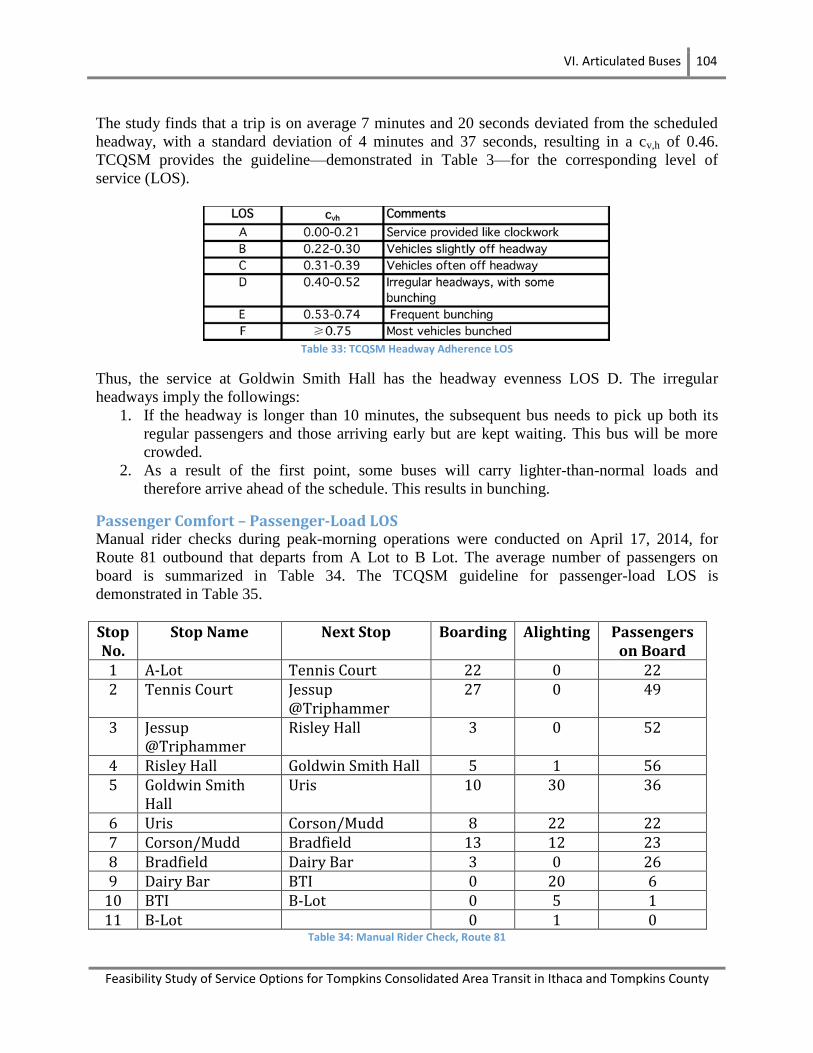
VI. Articulated Buses 104
Feasibility Study of Service Options for Tompkins Consolidated Area Transit in Ithaca and Tompkins County
The study finds that a trip is on average 7 minutes and 20 seconds deviated from the scheduled
headway, with a standard deviation of 4 minutes and 37 seconds, resulting in a cv,h of 0.46.
TCQSM provides the guideline—demonstrated in Table 3—for the corresponding level of
service (LOS).
Table 33: TCQSM Headway Adherence LOS
Thus, the service at Goldwin Smith Hall has the headway evenness LOS D. The irregular
headways imply the followings:
1. If the headway is longer than 10 minutes, the subsequent bus needs to pick up both its
regular passengers and those arriving early but are kept waiting. This bus will be more
crowded.
2. As a result of the first point, some buses will carry lighter-than-normal loads and
therefore arrive ahead of the schedule. This results in bunching.
Passenger Comfort – Passenger-Load LOS Manual rider checks during peak-morning operations were conducted on April 17, 2014, for
Route 81 outbound that departs from A Lot to B Lot. The average number of passengers on
board is summarized in Table 34. The TCQSM guideline for passenger-load LOS is
demonstrated in Table 35.
Stop No.
Stop Name Next Stop Boarding Alighting Passengers on Board
1 A-Lot Tennis Court 22 0 22 2 Tennis Court Jessup
@Triphammer 27 0 49
3 Jessup @Triphammer
Risley Hall 3 0 52
4 Risley Hall Goldwin Smith Hall 5 1 56 5 Goldwin Smith
Hall Uris 10 30 36
6 Uris Corson/Mudd 8 22 22 7 Corson/Mudd Bradfield 13 12 23 8 Bradfield Dairy Bar 3 0 26 9 Dairy Bar BTI 0 20 6
10 BTI B-Lot 0 5 1 11 B-Lot 0 1 0
Table 34: Manual Rider Check, Route 81
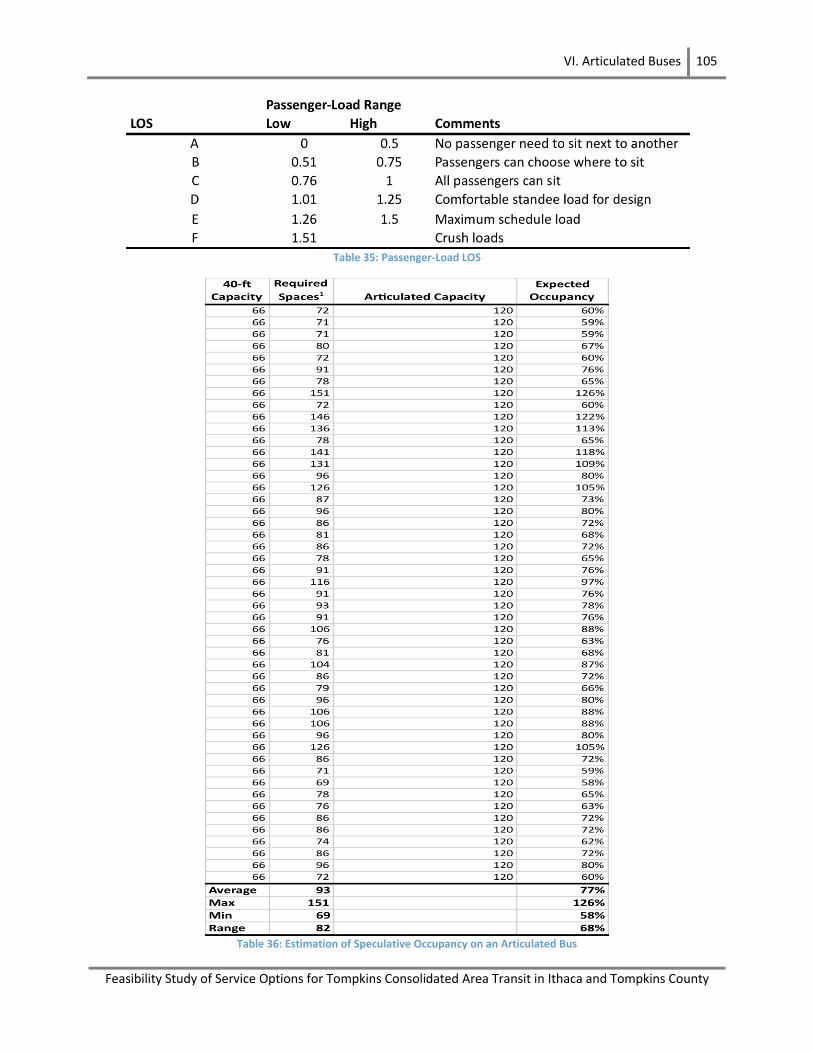
VI. Articulated Buses 105
Feasibility Study of Service Options for Tompkins Consolidated Area Transit in Ithaca and Tompkins County
Table 35: Passenger-Load LOS
Table 36: Estimation of Speculative Occupancy on an Articulated Bus
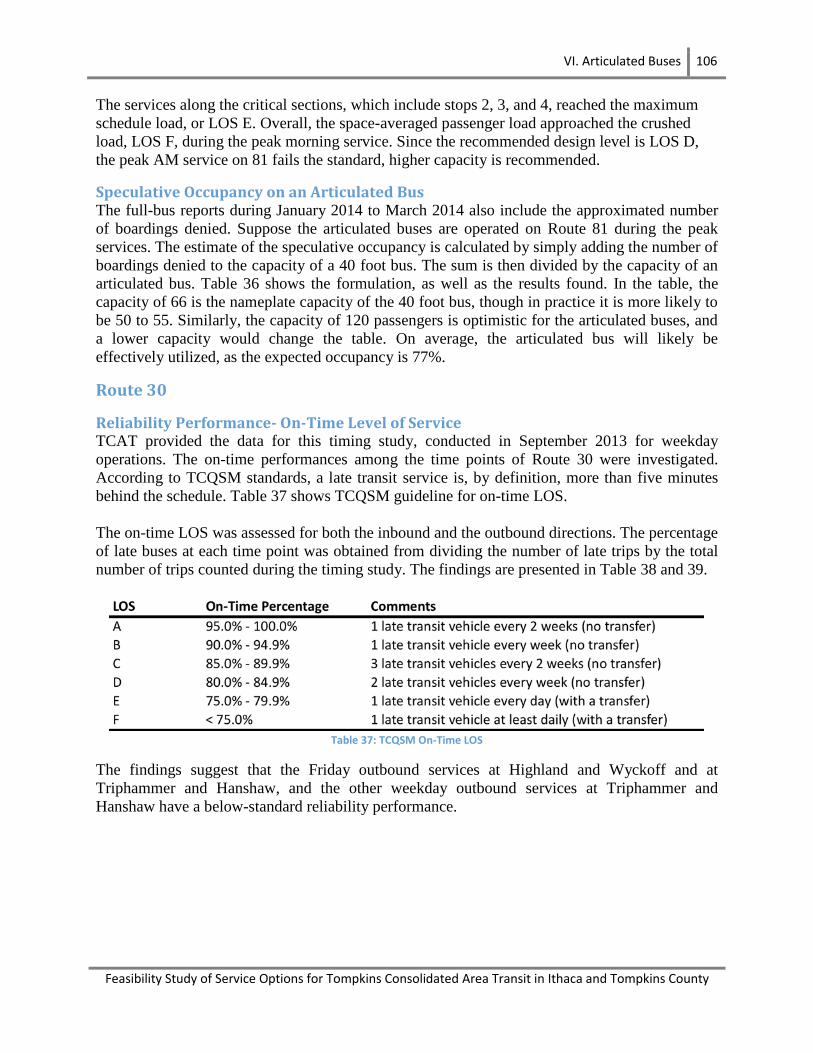
VI. Articulated Buses 106
Feasibility Study of Service Options for Tompkins Consolidated Area Transit in Ithaca and Tompkins County
The services along the critical sections, which include stops 2, 3, and 4, reached the maximum
schedule load, or LOS E. Overall, the space-averaged passenger load approached the crushed
load, LOS F, during the peak morning service. Since the recommended design level is LOS D,
the peak AM service on 81 fails the standard, higher capacity is recommended.
Speculative Occupancy on an Articulated Bus The full-bus reports during January 2014 to March 2014 also include the approximated number
of boardings denied. Suppose the articulated buses are operated on Route 81 during the peak
services. The estimate of the speculative occupancy is calculated by simply adding the number of
boardings denied to the capacity of a 40 foot bus. The sum is then divided by the capacity of an
articulated bus. Table 36 shows the formulation, as well as the results found. In the table, the
capacity of 66 is the nameplate capacity of the 40 foot bus, though in practice it is more likely to
be 50 to 55. Similarly, the capacity of 120 passengers is optimistic for the articulated buses, and
a lower capacity would change the table. On average, the articulated bus will likely be
effectively utilized, as the expected occupancy is 77%.
Route 30
Reliability Performance- On-Time Level of Service TCAT provided the data for this timing study, conducted in September 2013 for weekday
operations. The on-time performances among the time points of Route 30 were investigated.
According to TCQSM standards, a late transit service is, by definition, more than five minutes
behind the schedule. Table 37 shows TCQSM guideline for on-time LOS.
The on-time LOS was assessed for both the inbound and the outbound directions. The percentage
of late buses at each time point was obtained from dividing the number of late trips by the total
number of trips counted during the timing study. The findings are presented in Table 38 and 39.
Table 37: TCQSM On-Time LOS
The findings suggest that the Friday outbound services at Highland and Wyckoff and at
Triphammer and Hanshaw, and the other weekday outbound services at Triphammer and
Hanshaw have a below-standard reliability performance.
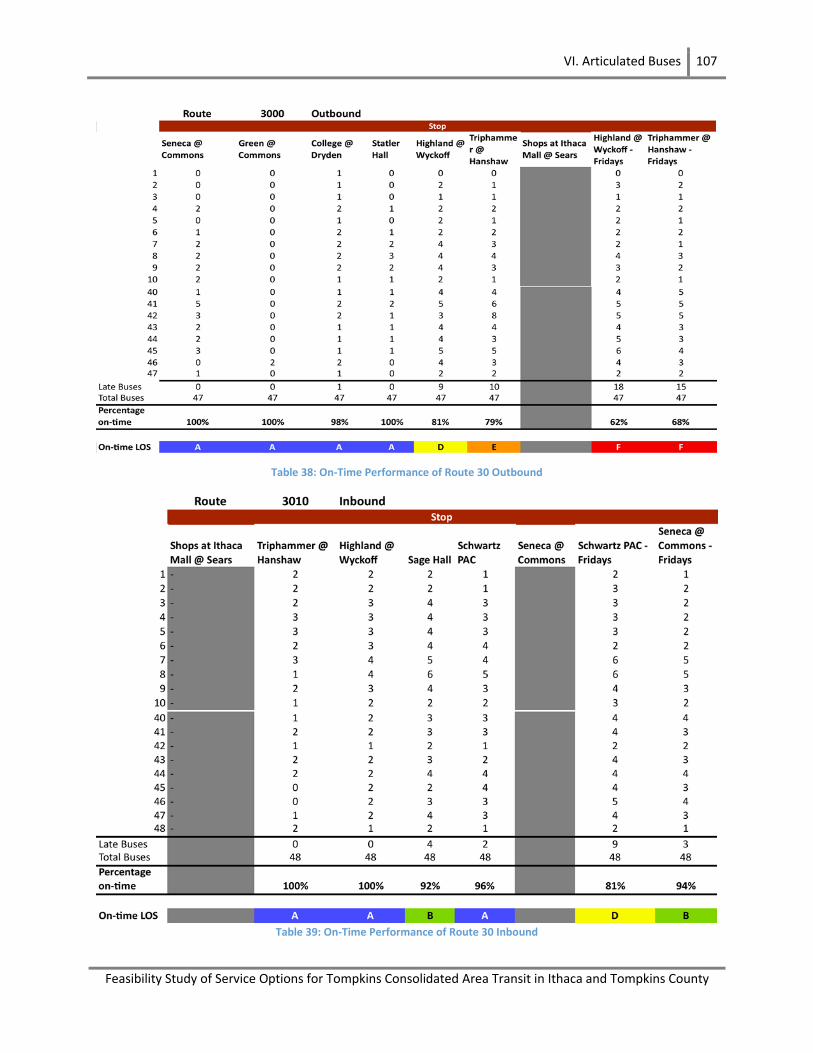
VI. Articulated Buses 107
Feasibility Study of Service Options for Tompkins Consolidated Area Transit in Ithaca and Tompkins County
Table 38: On-Time Performance of Route 30 Outbound
Table 39: On-Time Performance of Route 30 Inbound
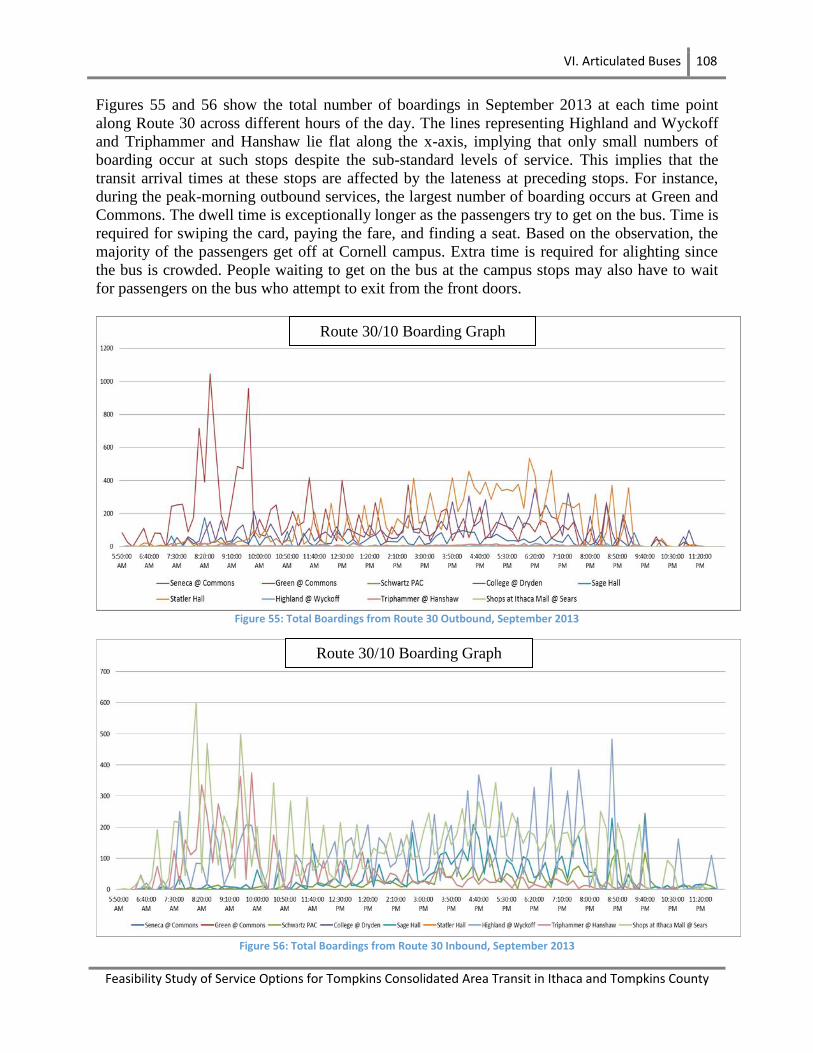
VI. Articulated Buses 108
Feasibility Study of Service Options for Tompkins Consolidated Area Transit in Ithaca and Tompkins County
Figures 55 and 56 show the total number of boardings in September 2013 at each time point
along Route 30 across different hours of the day. The lines representing Highland and Wyckoff
and Triphammer and Hanshaw lie flat along the x-axis, implying that only small numbers of
boarding occur at such stops despite the sub-standard levels of service. This implies that the
transit arrival times at these stops are affected by the lateness at preceding stops. For instance,
during the peak-morning outbound services, the largest number of boarding occurs at Green and
Commons. The dwell time is exceptionally longer as the passengers try to get on the bus. Time is
required for swiping the card, paying the fare, and finding a seat. Based on the observation, the
majority of the passengers get off at Cornell campus. Extra time is required for alighting since
the bus is crowded. People waiting to get on the bus at the campus stops may also have to wait
for passengers on the bus who attempt to exit from the front doors.
Figure 55: Total Boardings from Route 30 Outbound, September 2013
Figure 56: Total Boardings from Route 30 Inbound, September 2013
Route 30/10 Boarding Graph
Route 30/10 Boarding Graph
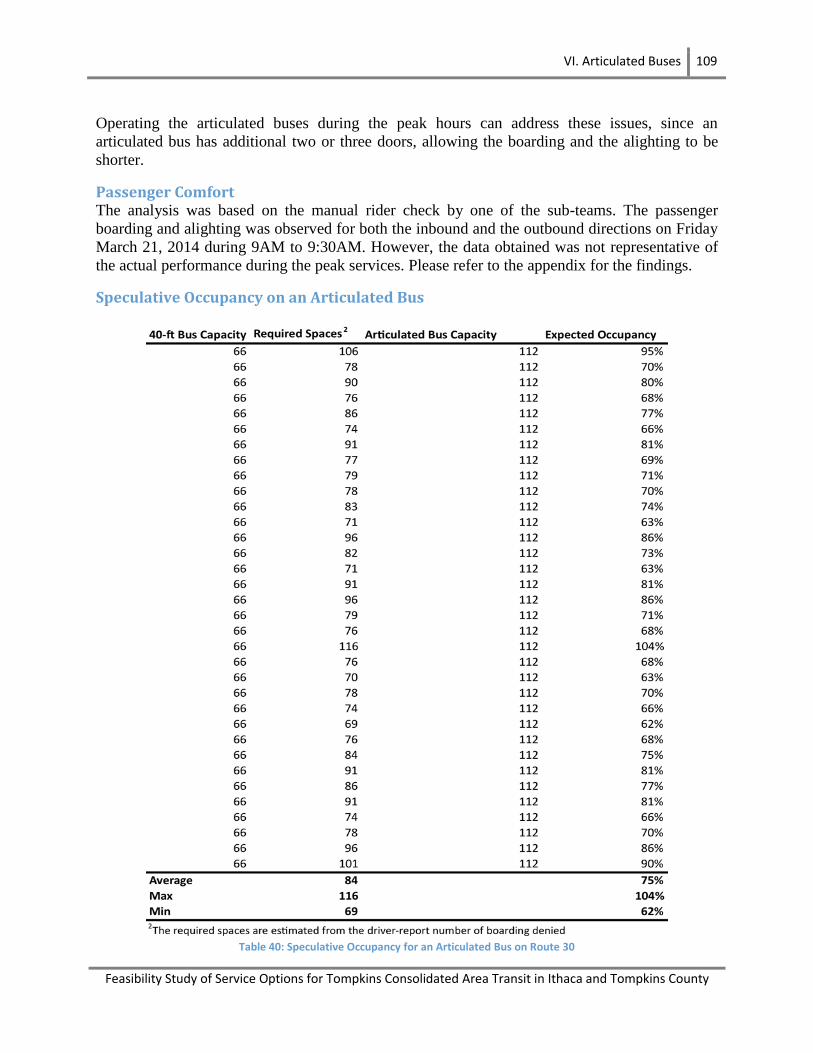
VI. Articulated Buses 109
Feasibility Study of Service Options for Tompkins Consolidated Area Transit in Ithaca and Tompkins County
Operating the articulated buses during the peak hours can address these issues, since an
articulated bus has additional two or three doors, allowing the boarding and the alighting to be
shorter.
Passenger Comfort The analysis was based on the manual rider check by one of the sub-teams. The passenger
boarding and alighting was observed for both the inbound and the outbound directions on Friday
March 21, 2014 during 9AM to 9:30AM. However, the data obtained was not representative of
the actual performance during the peak services. Please refer to the appendix for the findings.
Speculative Occupancy on an Articulated Bus
Table 40: Speculative Occupancy for an Articulated Bus on Route 30
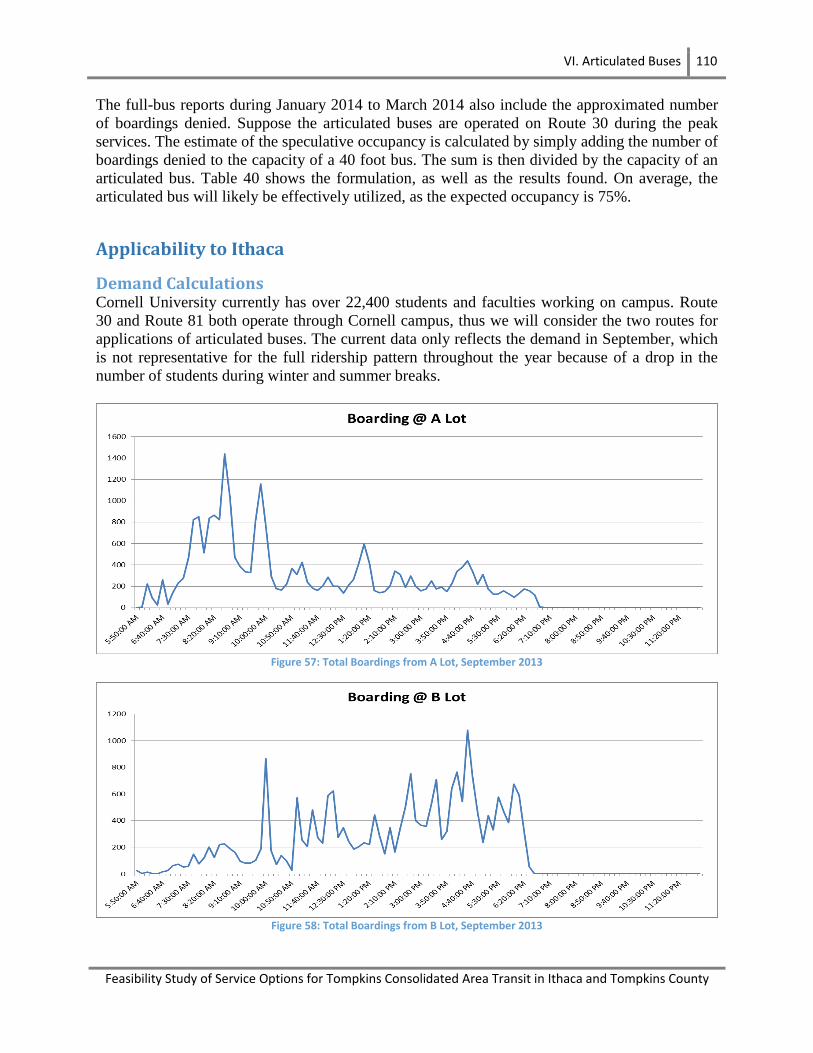
VI. Articulated Buses 110
Feasibility Study of Service Options for Tompkins Consolidated Area Transit in Ithaca and Tompkins County
The full-bus reports during January 2014 to March 2014 also include the approximated number
of boardings denied. Suppose the articulated buses are operated on Route 30 during the peak
services. The estimate of the speculative occupancy is calculated by simply adding the number of
boardings denied to the capacity of a 40 foot bus. The sum is then divided by the capacity of an
articulated bus. Table 40 shows the formulation, as well as the results found. On average, the
articulated bus will likely be effectively utilized, as the expected occupancy is 75%.
Applicability to Ithaca
Demand Calculations Cornell University currently has over 22,400 students and faculties working on campus. Route
30 and Route 81 both operate through Cornell campus, thus we will consider the two routes for
applications of articulated buses. The current data only reflects the demand in September, which
is not representative for the full ridership pattern throughout the year because of a drop in the
number of students during winter and summer breaks.
Figure 57: Total Boardings from A Lot, September 2013
Figure 58: Total Boardings from B Lot, September 2013
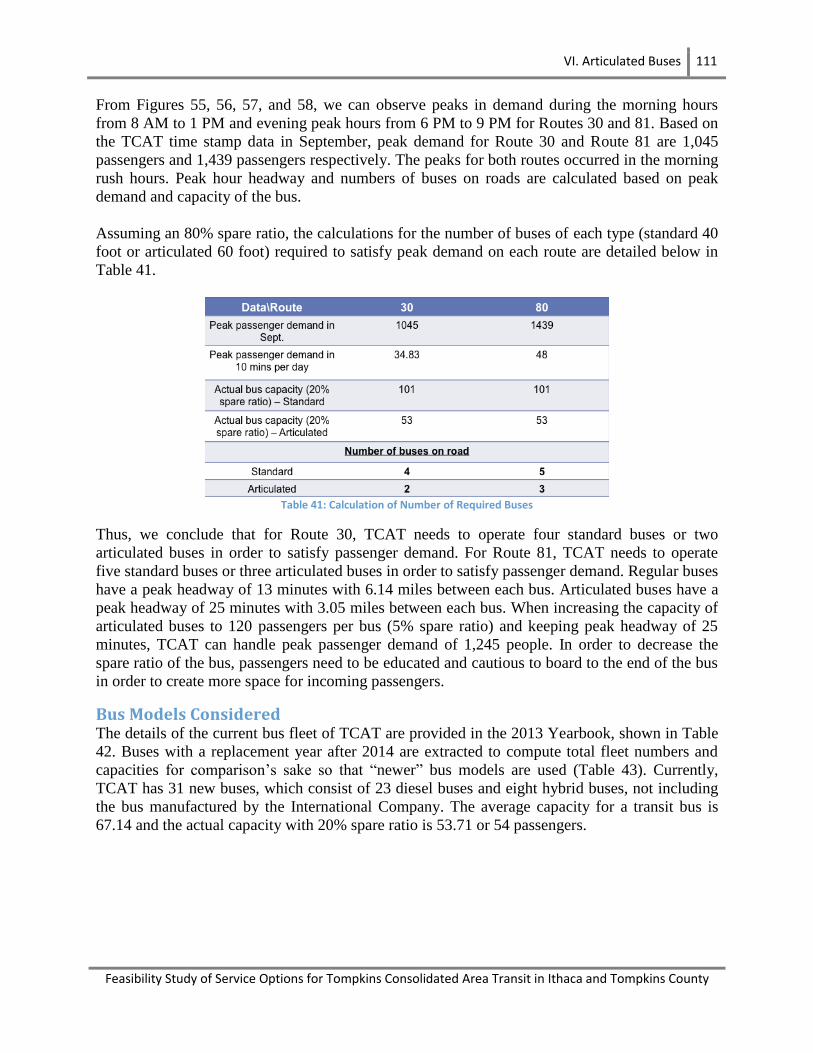
VI. Articulated Buses 111
Feasibility Study of Service Options for Tompkins Consolidated Area Transit in Ithaca and Tompkins County
From Figures 55, 56, 57, and 58, we can observe peaks in demand during the morning hours
from 8 AM to 1 PM and evening peak hours from 6 PM to 9 PM for Routes 30 and 81. Based on
the TCAT time stamp data in September, peak demand for Route 30 and Route 81 are 1,045
passengers and 1,439 passengers respectively. The peaks for both routes occurred in the morning
rush hours. Peak hour headway and numbers of buses on roads are calculated based on peak
demand and capacity of the bus.
Assuming an 80% spare ratio, the calculations for the number of buses of each type (standard 40
foot or articulated 60 foot) required to satisfy peak demand on each route are detailed below in
Table 41.
Table 41: Calculation of Number of Required Buses
Thus, we conclude that for Route 30, TCAT needs to operate four standard buses or two
articulated buses in order to satisfy passenger demand. For Route 81, TCAT needs to operate
five standard buses or three articulated buses in order to satisfy passenger demand. Regular buses
have a peak headway of 13 minutes with 6.14 miles between each bus. Articulated buses have a
peak headway of 25 minutes with 3.05 miles between each bus. When increasing the capacity of
articulated buses to 120 passengers per bus (5% spare ratio) and keeping peak headway of 25
minutes, TCAT can handle peak passenger demand of 1,245 people. In order to decrease the
spare ratio of the bus, passengers need to be educated and cautious to board to the end of the bus
in order to create more space for incoming passengers.
Bus Models Considered The details of the current bus fleet of TCAT are provided in the 2013 Yearbook, shown in Table
42. Buses with a replacement year after 2014 are extracted to compute total fleet numbers and
capacities for comparison’s sake so that “newer” bus models are used (Table 43). Currently,
TCAT has 31 new buses, which consist of 23 diesel buses and eight hybrid buses, not including
the bus manufactured by the International Company. The average capacity for a transit bus is
67.14 and the actual capacity with 20% spare ratio is 53.71 or 54 passengers.
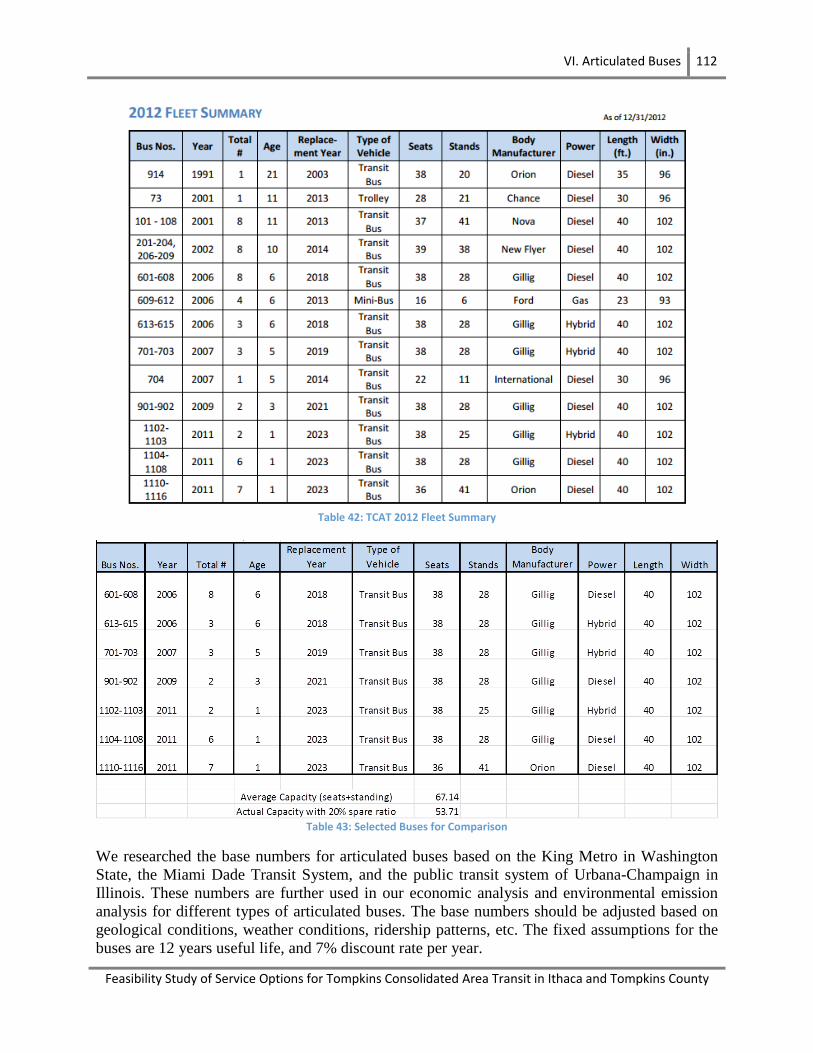
VI. Articulated Buses 112
Feasibility Study of Service Options for Tompkins Consolidated Area Transit in Ithaca and Tompkins County
Table 42: TCAT 2012 Fleet Summary
Table 43: Selected Buses for Comparison
We researched the base numbers for articulated buses based on the King Metro in Washington
State, the Miami Dade Transit System, and the public transit system of Urbana-Champaign in
Illinois. These numbers are further used in our economic analysis and environmental emission
analysis for different types of articulated buses. The base numbers should be adjusted based on
geological conditions, weather conditions, ridership patterns, etc. The fixed assumptions for the
buses are 12 years useful life, and 7% discount rate per year.
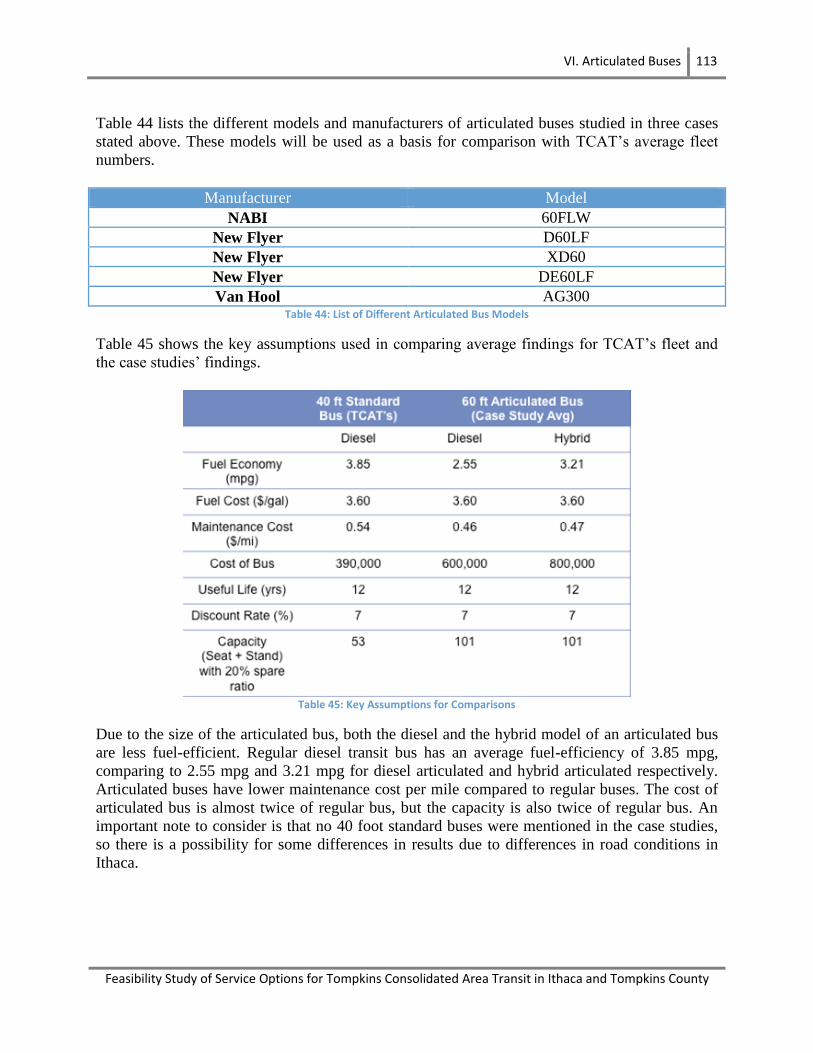
VI. Articulated Buses 113
Feasibility Study of Service Options for Tompkins Consolidated Area Transit in Ithaca and Tompkins County
Table 44 lists the different models and manufacturers of articulated buses studied in three cases
stated above. These models will be used as a basis for comparison with TCAT’s average fleet
numbers.
Manufacturer Model
NABI 60FLW
New Flyer D60LF
New Flyer XD60
New Flyer DE60LF
Van Hool AG300 Table 44: List of Different Articulated Bus Models
Table 45 shows the key assumptions used in comparing average findings for TCAT’s fleet and
the case studies’ findings.
Table 45: Key Assumptions for Comparisons
Due to the size of the articulated bus, both the diesel and the hybrid model of an articulated bus
are less fuel-efficient. Regular diesel transit bus has an average fuel-efficiency of 3.85 mpg,
comparing to 2.55 mpg and 3.21 mpg for diesel articulated and hybrid articulated respectively.
Articulated buses have lower maintenance cost per mile compared to regular buses. The cost of
articulated bus is almost twice of regular bus, but the capacity is also twice of regular bus. An
important note to consider is that no 40 foot standard buses were mentioned in the case studies,
so there is a possibility for some differences in results due to differences in road conditions in
Ithaca.

VI. Articulated Buses 114
Feasibility Study of Service Options for Tompkins Consolidated Area Transit in Ithaca and Tompkins County
Economic Analysis All costs are evaluated using the discounted cash flow method in 12 years with a 7% discount
rate. The major costs of operating articulated buses in Ithaca are broken down to four categories
that include fuel cost, capital cost, maintenance cost, and labor cost.
Tables 46 and 47 show the details for cost calculations and a comparison between each type of
bus for Routes 30 and 81, respectively.
Table 46: Cost Comparison of 4 Standard Buses vs. 2 Articulated Buses on Route 30
Table 47: Cost Comparison of 5 Standard Buses vs. 3 Articulated Buses on Route 81
The following equations were used in determining the values in the tables above.
Diesel Hybrid CNG/LNG Diesel Hybrid
Average Fuel Economy - mpg - 3.85 4.31 3.14 2.55 3.21
Average Fuel cost - $/g - 3.60$ 3.60$ 2.10$ 3.60$ 3.60$
Maintenance Cost -$/mile- 0.54$ 0.40$ 0.80$ 0.46$ 0.47$
Total number of boardings per year for the route 707,786 707,786 707,786 707,786 707,786
Average Bus Cost - $ - 390,000$ 530,000$ 470,000$ 600,000$ $800,000
Discounted Rate -%- 7 7 7 7 7
Average Operating Life of Bus - yrs - 12 12 12 12 12
Number of buses for Route 4 4 4 2 2
Total Operating Hrs/yr 12,805.00 12,805.00 12,805.00 12,805.00 12,805.00
Total Operating Labor Cost/yr -$50/hr- 640,250.00$ 640,250.00$ 640,250.00$ 640,250.00$ 640,250.00$
Total Maintenance Cost/yr 74,102.69$ 54,890.88$ 109,781.76$ 63,124.97$ 64,497.72$
Total Revenue Miles/yr -from yrbook- 137,227.20 137,227.20 137,227.20 137,228.20 137,229.20
Total Fuel Cost/yr 128,316.34$ 114,621.33$ 91,776.15$ 193,733.93$ 153,901.91$
Annual installment cost per year per bus 49,101.78$ 66,728.05$ 59,173.93$ 75,541.19$ 100,721.59$
Capital Cost for the buses/yr 196,407.10$ 266,912.22$ 236,695.74$ 151,082.39$ 201,443.18$
Total Cost per year - $/yr - 1,039,076.13$ 1,076,674.42$ 1,078,503.65$ 1,048,191.29$ 1,060,092.81$
Average cost per boarding 1.47$ 1.52$ 1.52$ 1.48$ 1.50$
Operating Expense per Revenue mile 7.57$ 7.85$ 7.86$ 7.64$ 7.72$
Gallons of Fuel Consumed/yr 35,643.43 31,839.26 43,702.93 53,814.98 42,750.53
Annual Fuel Cost saving compared to Diesel - 13,695.02 36,540.19 - 39,832.02
Annual % Fuel Cost saving compared to Diesel - 10.67% 28.48% - 20.56%
Standard 40-ft Bus 60-ft Articulated Bus
Diesel Hybrid CNG/LNG Diesel Hybrid
Average Fuel Economy - mpg - 3.85 4.31 3.14 2.55 3.21
Average Fuel cost - $/g - 3.60$ 3.60$ 2.10$ 3.60$ 3.60$
Maintenance Cost -$/mile- 0.54$ 0.40$ 0.80$ 0.46$ 0.47$
Total number of boardings per year for the route 548,907 548,907 548,907 548,907 548,907
Average Bus Cost - $ - 390,000$ 530,000$ 470,000$ 600,000$ $800,000
Discounted Rate -%- 7 7 7 7 7
Average Operating Life of Bus - yrs - 12 12 12 12 12
Number of buses for Route 5 5 5 3 3
Total Operating Hrs/yr 12,571.00 12,571.00 12,571.00 12,571.00 12,571.00
Total Operating Labor Cost/yr -$50/hr- 628,550.00$ 628,550.00$ 628,550.00$ 628,550.00$ 628,550.00$
Total Maintenance Cost/yr 48,753.90$ 36,114.00$ 72,228.00$ 41,531.10$ 42,433.95$
Total Revenue Miles/yr -from yrbook- 90,285 90,285 90,285 90,285 90,285
Total Fuel Cost/yr 84,422.34$ 75,412.06$ 60,381.69$ 127,461.18$ 101,254.21$
Annual installment cost per year per bus 49,101.78$ 66,728.05$ 59,173.93$ 75,541.19$ 100,721.59$
Capital Cost for the buses/yr 245,508.88$ 333,640.27$ 295,869.67$ 226,623.58$ 302,164.77$
Total Cost per year - $/yr - 1,007,235.12$ 1,073,716.33$ 1,057,029.36$ 1,024,165.86$ 1,074,402.93$
Average cost per boarding 1.83$ 1.96$ 1.93$ 1.87$ 1.96$
Operating Expense per Revenue mile 11.16$ 11.89$ 11.71$ 11.34$ 11.90$
Gallons of Fuel Consumed/yr 23,450.65 20,947.80 28,753.18 35,405.88 28,126.17
Annual Fuel Cost saving compared to Diesel - 9,010.27 24,040.65 - 26,206.97
Annual % Fuel Cost saving compared to Diesel - 10.67% 28.48% - 20.56%
Standard 40-ft Bus 60-ft Articulated Bus

VI. Articulated Buses 115
Feasibility Study of Service Options for Tompkins Consolidated Area Transit in Ithaca and Tompkins County
Figure 59 below shows the cost of different types of buses for Route 30 and Route 81. We can
conclude that there is no single type of bus that has an absolute cost advantage. Regular diesel
buses have low fuel cost, but have high maintenance cost. Diesel articulated buses have high fuel
cost, but have low in maintenance cost. Hybrid articulated buses have high capital cost, but low
maintenance cost.
Figure 59: Different Costs for Routes 30 and 81
After analyzing the characteristics of each type of cost, we concluded that capital cost and labor
cost, which are indicated in the blue and brown sections in the pie charts on Figure 60, contribute
over 80% of the total operating cost for both regular buses and articulated buses. Capital cost of
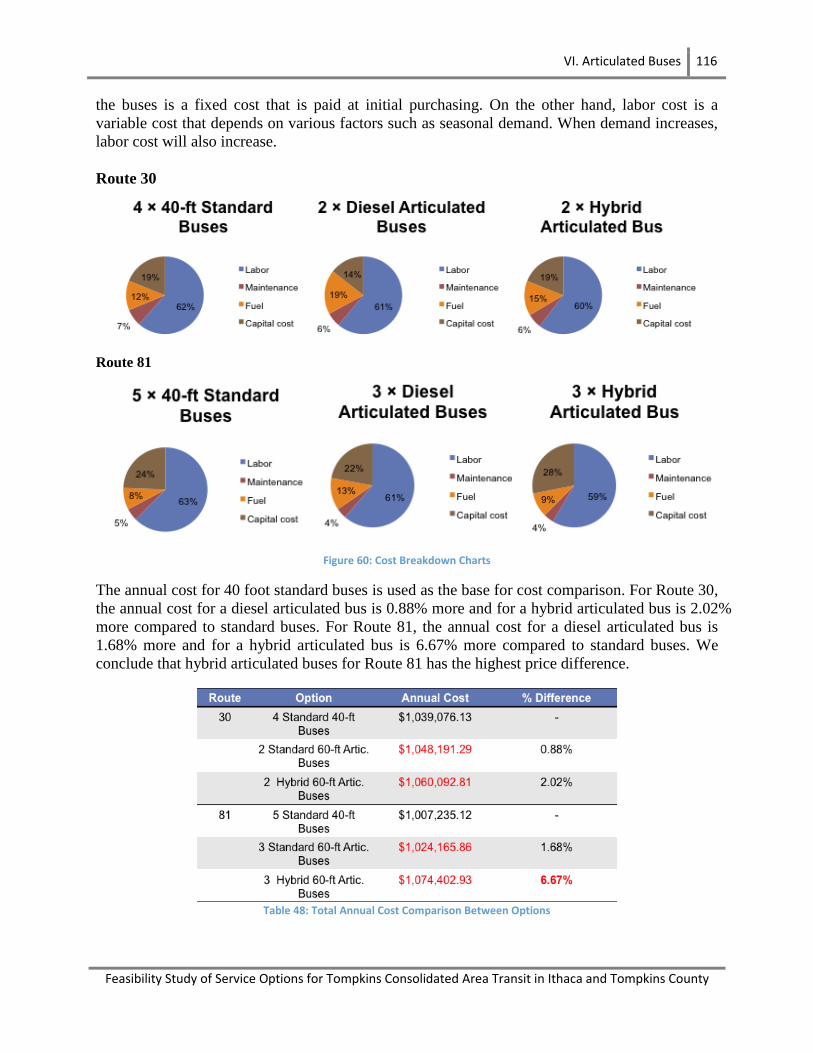
VI. Articulated Buses 116
Feasibility Study of Service Options for Tompkins Consolidated Area Transit in Ithaca and Tompkins County
the buses is a fixed cost that is paid at initial purchasing. On the other hand, labor cost is a
variable cost that depends on various factors such as seasonal demand. When demand increases,
labor cost will also increase.
Route 30
Route 81
Figure 60: Cost Breakdown Charts
The annual cost for 40 foot standard buses is used as the base for cost comparison. For Route 30,
the annual cost for a diesel articulated bus is 0.88% more and for a hybrid articulated bus is 2.02%
more compared to standard buses. For Route 81, the annual cost for a diesel articulated bus is
1.68% more and for a hybrid articulated bus is 6.67% more compared to standard buses. We
conclude that hybrid articulated buses for Route 81 has the highest price difference.
Table 48: Total Annual Cost Comparison Between Options
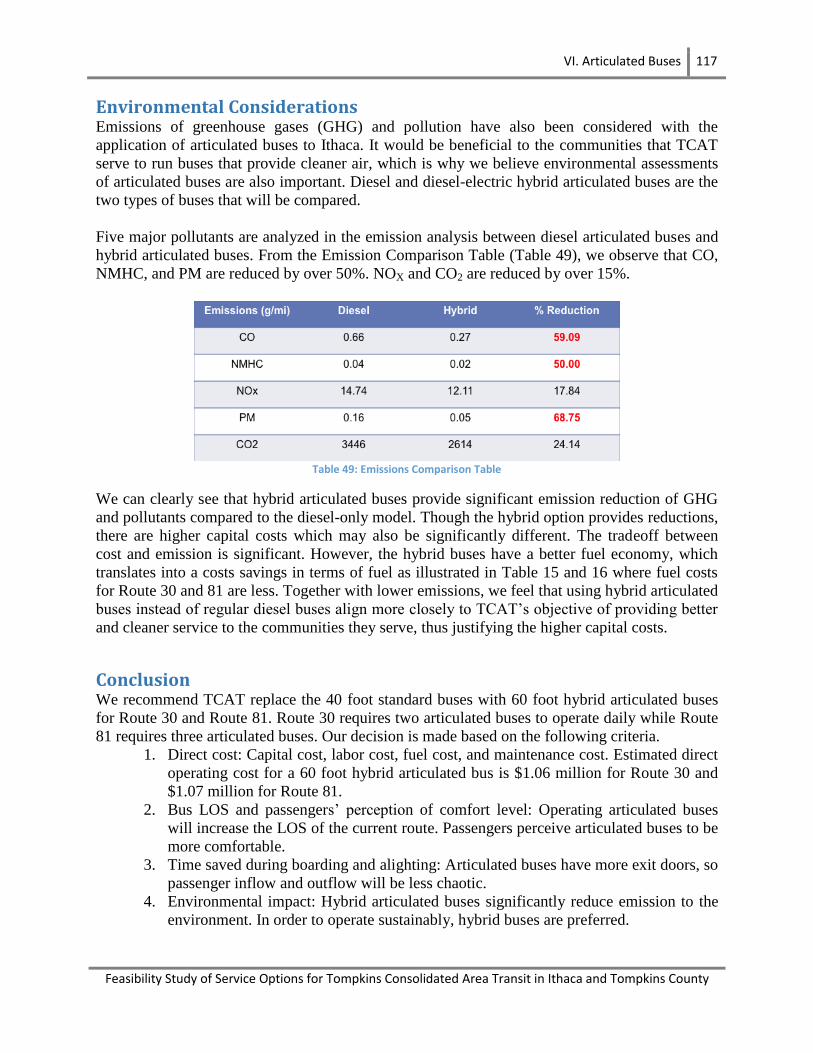
VI. Articulated Buses 117
Feasibility Study of Service Options for Tompkins Consolidated Area Transit in Ithaca and Tompkins County
Environmental Considerations Emissions of greenhouse gases (GHG) and pollution have also been considered with the
application of articulated buses to Ithaca. It would be beneficial to the communities that TCAT
serve to run buses that provide cleaner air, which is why we believe environmental assessments
of articulated buses are also important. Diesel and diesel-electric hybrid articulated buses are the
two types of buses that will be compared.
Five major pollutants are analyzed in the emission analysis between diesel articulated buses and
hybrid articulated buses. From the Emission Comparison Table (Table 49), we observe that CO,
NMHC, and PM are reduced by over 50%. NOX and CO2 are reduced by over 15%.
Table 49: Emissions Comparison Table
We can clearly see that hybrid articulated buses provide significant emission reduction of GHG
and pollutants compared to the diesel-only model. Though the hybrid option provides reductions,
there are higher capital costs which may also be significantly different. The tradeoff between
cost and emission is significant. However, the hybrid buses have a better fuel economy, which
translates into a costs savings in terms of fuel as illustrated in Table 15 and 16 where fuel costs
for Route 30 and 81 are less. Together with lower emissions, we feel that using hybrid articulated
buses instead of regular diesel buses align more closely to TCAT’s objective of providing better
and cleaner service to the communities they serve, thus justifying the higher capital costs.
Conclusion We recommend TCAT replace the 40 foot standard buses with 60 foot hybrid articulated buses
for Route 30 and Route 81. Route 30 requires two articulated buses to operate daily while Route
81 requires three articulated buses. Our decision is made based on the following criteria.
1. Direct cost: Capital cost, labor cost, fuel cost, and maintenance cost. Estimated direct
operating cost for a 60 foot hybrid articulated bus is $1.06 million for Route 30 and
$1.07 million for Route 81.
2. Bus LOS and passengers’ perception of comfort level: Operating articulated buses
will increase the LOS of the current route. Passengers perceive articulated buses to be
more comfortable.
3. Time saved during boarding and alighting: Articulated buses have more exit doors, so
passenger inflow and outflow will be less chaotic.
4. Environmental impact: Hybrid articulated buses significantly reduce emission to the
environment. In order to operate sustainably, hybrid buses are preferred.
VI. Articulated Buses 118
Feasibility Study of Service Options for Tompkins Consolidated Area Transit in Ithaca and Tompkins County
In our research for Route 81, we learned that the bus is often fully loaded in the north campus
area because all freshmen live there, and take free bus to get to central campus for class in the
morning peak hours. Leftover passengers occur often at stations after residential areas. The bus
carries fewer passengers from central campus to B Lot. Future research could focus on bridging
Route 81 with lower-occupancy routes and reduce the turnaround time for Route 81. One other
focus could be potentially allowing Route 81 to turn around and pick up left behind passengers.
An important note to consider regarding deploying articulated buses is that the public might not
welcome the idea, given high capital costs, changes in level of service, and perceived negative
consequences of large buses on other traffic, pedestrians, and neighborhoods. This study on
community acceptance was not directly addressed as part of the feasibility study. Further studies
can be conducted to convince the community that articulated buses are not only worth their costs,
but also lead to better levels of service.
VII. Simulation 119
Feasibility Study of Service Options for Tompkins Consolidated Area Transit in Ithaca and Tompkins County
VII. Simulation
Introduction
Background Information Simulation modeling is the discipline of developing a model of an actual or theoretical physical
system, executing the model on a computer and analyzing the execution output. This enables us
to see how the system would behave in the same way as the real process. In short, it is the
imitation of a real phenomenon with a set of mathematical formulas or testing new theories or
operation of a real world system over time.
Today, simulation is used widely to reduce the probability of failure of a project, such as
simulating new technologies for performance optimization, safety engineering, testing, training
and many more. Simulation can easily illustrate the eventual real causes of alternative conditions
and courses of action, even though many constraints are assumed negligible. Furthermore,
simulations are used when the real system cannot be engaged because it is inaccessible,
dangerous, inexistent, or unacceptable to engage.
The key problem today with simulation is that in many situations, it is difficult or impossible to
acquire valid sources of data and information of relevant characteristics and behaviors. This is
because most natural phenomena are subject to an infinite number of influences. Thus, the use of
assumptions and approximations are often made within simulation for reliability and validity of
the simulation. Ultimately, in simulations, designers usually determine which factors are the
most important and take them into account meaningfully.
Comparison of Software There is an extensive availability of software for discrete event simulation. We have tried our
hands on various open source software:
JaamSim: Java based open-source simulation with drag-drop UI and interactive 3-D graphics.
However, entity options are very limited but can be added as it is open-source.
SimPy: Simulation software written in Python. It is based on Simula, a simulation programming
language concept. The complexity of the software makes it not very usable for the current project.
SystemC: A set of C++ classes and macros which provide an event-driven simulation kernel in
C++. The complexity of the software makes it not very usable for the current project.
We have also considered commercial software: Arena, FlexSim, and ProModel.
In the process of studying these software, we realized that open source software, although
available for free, requires much time modifying or coding as per our requirements. Instead, we
decided to use commercial software where we can focus more on adding additional constraints
VII. Simulation 120
Feasibility Study of Service Options for Tompkins Consolidated Area Transit in Ithaca and Tompkins County
and conditions to our problem in hand and making the model more realistic. For this project, we
have chosen to use ProModel.
Why ProModel? We used ProModel as it is one of the leading commercial software for discrete event simulation
and is also used as the simulation software for a class at Cornell University. This made it easy to
get the required licenses and the installation support. We planned to use modeling software
rather than program the model from the scratch, as software makes it easier to model the problem
which would leave us with more time to develop the model and add more constraints.
The simulation team used the existing entities available in ProModel to build the model and see
its fit for the simulation requirements of the project. One of the main reasons for us to use
ProModel is its ability to replicate real-world TCAT and transportation models with their
inherent variability and interdependency and to conduct performance analysis which would help
optimize the system.
Assumptions Due to the complex nature of reality, we are forced to make several key assumptions for the
process of building a simulation model for TCAT Route 30. In this section, we discuss in detail
the necessary assumptions that are incorporated to complete the design.
First, on the TCAT program, only the schedule for key bus stops is given. Therefore, all of the
stops in between these key stops are not given in the program. To be consistent with the TCAT
data, our team decided to accumulate all the passengers arriving at the sub-stops to the key bus
stops adjacent from them and simulate only the key bus stops as provided in the TCAT program.
Our team has carried out an investigation to see the average time for a person to enter and exit
the bus. To make the data consistent with the route that we are simulating, we took the bus on
Route 30 at peak hours, 8 AM to 10 AM. From our observations, it shows that, on average, it
takes about four seconds per person to enter the bus. The predicted time may sound quite long;
however, considering the person to step up onto the bus, to swipe the card and some people
looking for cash, four seconds per person on average is ideal to be used in the simulation.
Furthermore, from our observations for people getting off the bus, we estimated an average of
0.5 seconds per person. The estimated time may sound short, but incorporating the time people
exiting from the front and back while people are waiting to get on the bus, this time is considered
conservative for the model. Note that the estimation of dwell time is slightly different from that
on page 73, as this model does not account for the time it takes to pull in and out of the stop, and
accounts for an overlap in passengers alighting at both exits.
For the distances from one bus stop to another, there are no accurate distances provided by
TCAT. Since the route of the bus is constant, we used the aid of Google Maps to attain the
distances between each bus stop for our simulation model.
Our team believes that the speed TCAT provides in its yearbook for the average speed of a bus is
unsuitable for our model because Route 30 runs on the hills, and the speed varies significantly.
Therefore, our team decided to manipulate the arrival times found in the TCAT bus program.

VII. Simulation 121
Feasibility Study of Service Options for Tompkins Consolidated Area Transit in Ithaca and Tompkins County
With the distance found from Google Maps and the time stamps from one station to another, we
could derive a better estimation of the speed of the bus for each segment of the path.
TCAT states that the average capacity for transit buses that they run for their routes is 67.14
passengers; on average, 38 passenger seats and 28 standing. At many occurrences, passengers do
not move to the end of the buses, which leads to an inability of reaching the maximum capacity
of the bus. To be conservative, and through observations, it is ideal for use around 80% of the
stated bus capacity as a less optimistic value. Hence, we have used a maximum capacity of 54
passengers per bus for the simulation model.
There was no data provided from TCAT about the number of passengers on the bus that exits at
each bus stop. From our investigation data, we have made close assumptions of the number of
passengers who would exit at each bus stop. One key point is that we decided to use a percentage
of passengers on the bus that exit at each bus stop; the details of the percentages used are
illustrated in the table below:
Bus Stop
(0 – outbound, 1- inbound)
Percentage of passengers
on the bus that exit
0/1 Ithaca Mall 100%
0 Triphammer @ Hanshaw 15%
0 Highland @ Wyckoff 20%
0 Sage 50%
0 Schwartz CPA 30%
0 Tioga St 90%
0 Tompkins County 100%
1 College @ Dryden 60%
1 Statler Hall 90%
1 Highland @ Wyckoff 20%
1 Triphammer @ Hanshaw 15%
Table 50: Percentage of Passengers Disembarking at Each Stop
Ultimately, it is important to note that the collected results from the investigation were from the
spring semester and during the day with good weather conditions. Therefore, the calculations
may not be adaptable for different weather condition or a different season due to varying demand.
VII. Simulation 122
Feasibility Study of Service Options for Tompkins Consolidated Area Transit in Ithaca and Tompkins County
Model
Elements To build a complete simulation model, the system must contain various building blocks called
elements. In the section, we discuss the different options of elements that could be used to create
a simulation model in the ProModel software, and we give a summary of what elements were
implemented in the final design.
Entities An entity is described as an object of interest in the system. These are usually dynamic objects in
the model that get created, moved around, changes status, affect and are affected by other entities
and may get destroyed in the system. Furthermore, entities usually have multiple realizations
floating around and can have different types of entities concurrently.
Resources Resources are what entities compete for in a system. An entity seizes a resource, uses it, and
releases it. A resource is usually a person or equipment used with set functions. Resources
usually transport entities and perform operations and maintenance on entities at locations.
Moreover, resources may have downtimes and could move along a path network or stay static.
Locations Locations in the system are entities designed for processing, storage, or activities for decision
making. Usually locations represent the important areas in the design where something happens.
Locations can be queues, conveyors, or other work locations; typically location elements are
used to model elements such as delivery locations or warehouse locations.
Variables Variables are used to keep track of information that is not tied to entities. There are two types of
variables: global variables and local variables. Global variables are tags defined to represent the
changing numeric values. Local variables are tags used that are available only within the logic
that declared them. These variables can be designed to be either real numbers or integers to be
used for recording information. For the implementation of the design, we will use the global
variables to identify characteristics of the system as a whole and use the global variables for
entities to communicate with each other.
Processing Processing defines the operations that take place at each location they enter and routing of
entities through the system. Subsequently, whenever entities enter the simulation model, as
defined in the arrivals modeling, the process logic specifies what happens to them until they exit
the system.
Arrivals Arrivals could be implemented whenever new entities are introduced into the simulation model.
An arrival record is defined by the number and frequency of new entities per arrival, the time and
place of arrival, and the total occurrences of the arrival. Furthermore, an entity could be designed
to arrive at a particular location, and the frequency of the arrival elements can be fitted to the
distribution pattern that repeats over time.
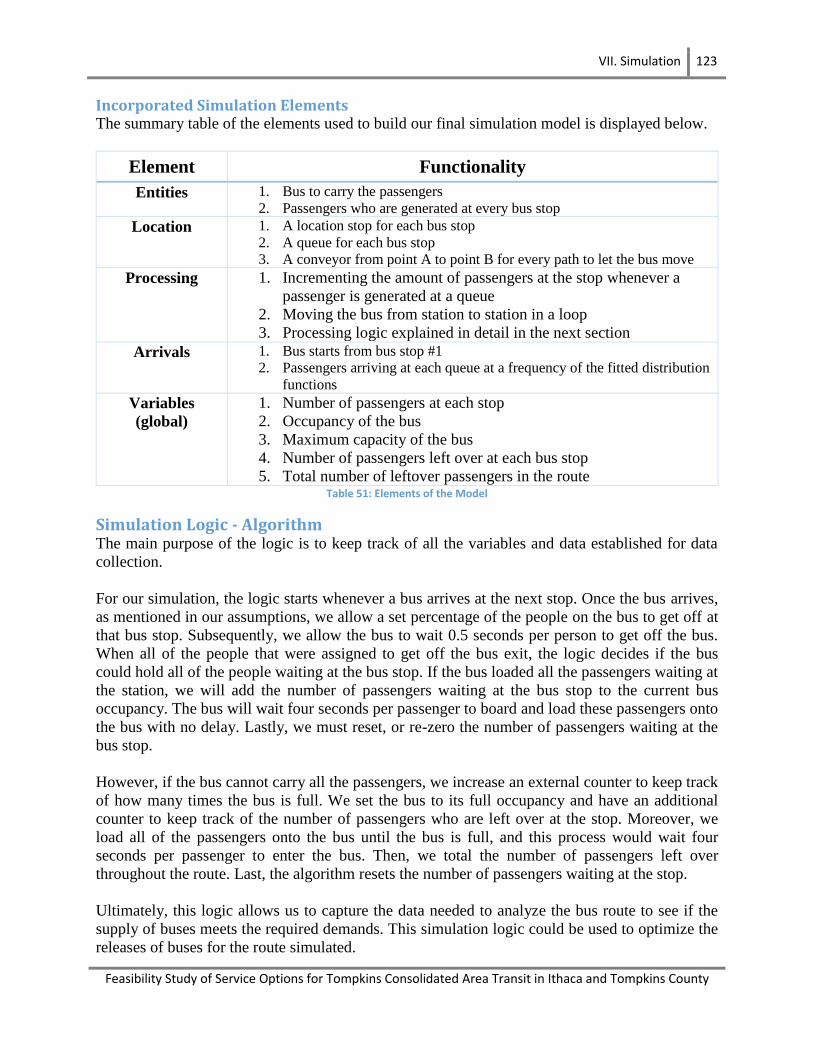
VII. Simulation 123
Feasibility Study of Service Options for Tompkins Consolidated Area Transit in Ithaca and Tompkins County
Incorporated Simulation Elements The summary table of the elements used to build our final simulation model is displayed below.
Element Functionality
Entities 1. Bus to carry the passengers
2. Passengers who are generated at every bus stop
Location 1. A location stop for each bus stop
2. A queue for each bus stop
3. A conveyor from point A to point B for every path to let the bus move
Processing 1. Incrementing the amount of passengers at the stop whenever a
passenger is generated at a queue
2. Moving the bus from station to station in a loop
3. Processing logic explained in detail in the next section
Arrivals 1. Bus starts from bus stop #1
2. Passengers arriving at each queue at a frequency of the fitted distribution
functions
Variables
(global)
1. Number of passengers at each stop
2. Occupancy of the bus
3. Maximum capacity of the bus
4. Number of passengers left over at each bus stop
5. Total number of leftover passengers in the route Table 51: Elements of the Model
Simulation Logic - Algorithm The main purpose of the logic is to keep track of all the variables and data established for data
collection.
For our simulation, the logic starts whenever a bus arrives at the next stop. Once the bus arrives,
as mentioned in our assumptions, we allow a set percentage of the people on the bus to get off at
that bus stop. Subsequently, we allow the bus to wait 0.5 seconds per person to get off the bus.
When all of the people that were assigned to get off the bus exit, the logic decides if the bus
could hold all of the people waiting at the bus stop. If the bus loaded all the passengers waiting at
the station, we will add the number of passengers waiting at the bus stop to the current bus
occupancy. The bus will wait four seconds per passenger to board and load these passengers onto
the bus with no delay. Lastly, we must reset, or re-zero the number of passengers waiting at the
bus stop.
However, if the bus cannot carry all the passengers, we increase an external counter to keep track
of how many times the bus is full. We set the bus to its full occupancy and have an additional
counter to keep track of the number of passengers who are left over at the stop. Moreover, we
load all of the passengers onto the bus until the bus is full, and this process would wait four
seconds per passenger to enter the bus. Then, we total the number of passengers left over
throughout the route. Last, the algorithm resets the number of passengers waiting at the stop.
Ultimately, this logic allows us to capture the data needed to analyze the bus route to see if the
supply of buses meets the required demands. This simulation logic could be used to optimize the
releases of buses for the route simulated.

VII. Simulation 124
Feasibility Study of Service Options for Tompkins Consolidated Area Transit in Ithaca and Tompkins County
Arrivals Distribution We need the arrival frequencies of passengers at various stops to model the passenger arrivals.
These frequencies determine how many people are waiting at each stop for the bus.
TCAT provided an Excel file containing September 2013 ridership data. September 2013 had
over 200,000 boardings, but due to the enormous size of the Excel file, and Excel’s limited
computational capabilities, we decided to import the data into a MySQL database.
We have queried the database for the number of passengers in each stop who have taken Route
30 between 8 AM and 10 AM each day in the month of September using the following query.
The following is the example used for the stop at Highland and Wyckoff. A similar query was
used for the remaining stops in the route.
SELECT DISTINCT `ride_time` , Count( * )
FROM `table 1`
WHERE route2 =30
AND (time LIKE '8% AM' OR time LIKE '9% AM')
AND stop_name = "Highland @ Wycoff"
AND route = 3000
GROUP BY `ride_time`
ORDER BY `table 1`.`ride_time` ASC
The following is the result set from the above query.
Ride Time Count
9/10/2013 99
9/11/2013 75
9/12/2013 78
9/13/2013 76
9/16/2013 63
9/17/2013 82
9/18/2013 46
9/19/2013 75
9/2/2013 7
9/20/2013 77
9/23/2013 56
9/24/2013 72
9/25/2013 52
9/26/2013 76
9/27/2013 56
9/3/2013 72
9/30/2013 63
9/4/2013 61
9/5/2013 50
9/6/2013 61
9/9/2013 37 Table 52: Query Results
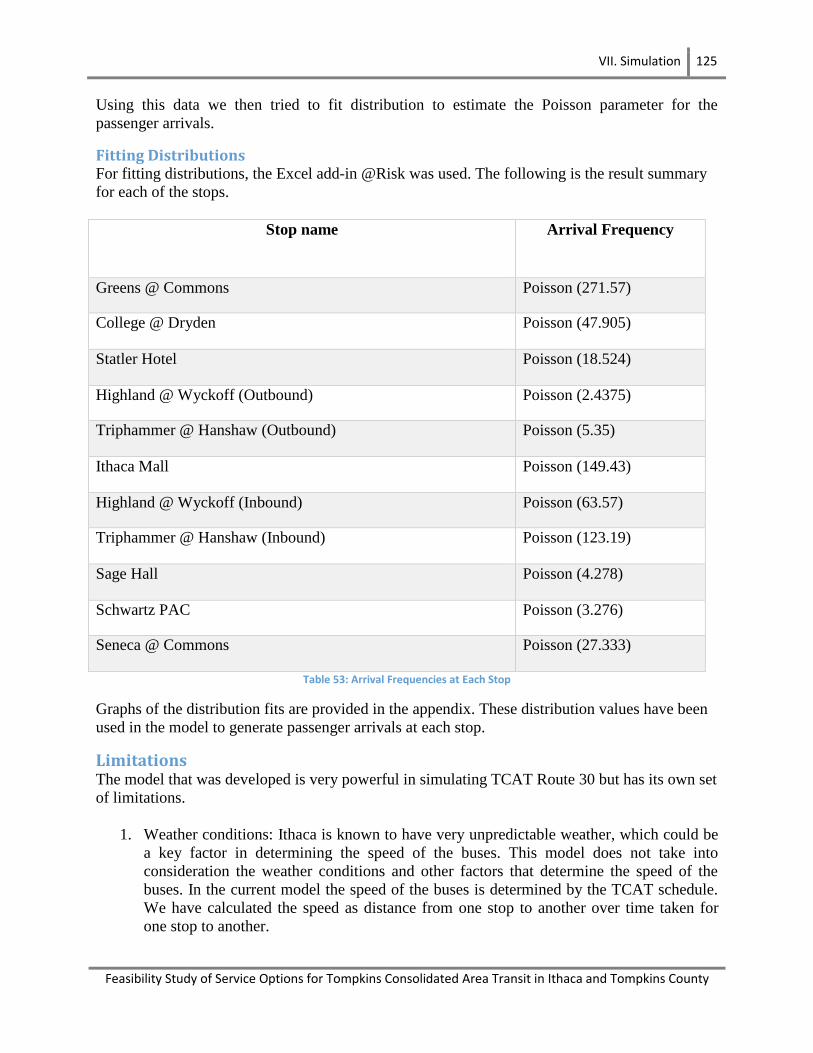
VII. Simulation 125
Feasibility Study of Service Options for Tompkins Consolidated Area Transit in Ithaca and Tompkins County
Using this data we then tried to fit distribution to estimate the Poisson parameter for the
passenger arrivals.
Fitting Distributions For fitting distributions, the Excel add-in @Risk was used. The following is the result summary
for each of the stops.
Stop name Arrival Frequency
Greens @ Commons Poisson (271.57)
College @ Dryden Poisson (47.905)
Statler Hotel Poisson (18.524)
Highland @ Wyckoff (Outbound) Poisson (2.4375)
Triphammer @ Hanshaw (Outbound) Poisson (5.35)
Ithaca Mall Poisson (149.43)
Highland @ Wyckoff (Inbound) Poisson (63.57)
Triphammer @ Hanshaw (Inbound) Poisson (123.19)
Sage Hall Poisson (4.278)
Schwartz PAC Poisson (3.276)
Seneca @ Commons Poisson (27.333)
Table 53: Arrival Frequencies at Each Stop
Graphs of the distribution fits are provided in the appendix. These distribution values have been
used in the model to generate passenger arrivals at each stop.
Limitations The model that was developed is very powerful in simulating TCAT Route 30 but has its own set
of limitations.
1. Weather conditions: Ithaca is known to have very unpredictable weather, which could be
a key factor in determining the speed of the buses. This model does not take into
consideration the weather conditions and other factors that determine the speed of the
buses. In the current model the speed of the buses is determined by the TCAT schedule.
We have calculated the speed as distance from one stop to another over time taken for
one stop to another.
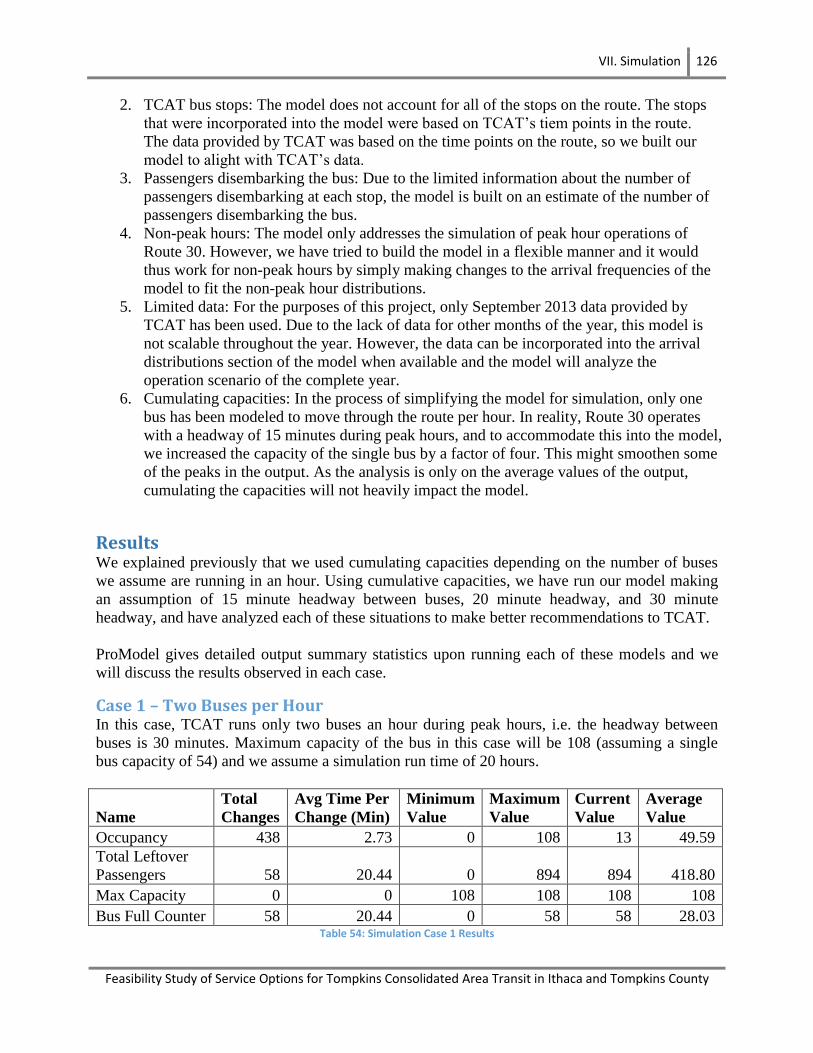
VII. Simulation 126
Feasibility Study of Service Options for Tompkins Consolidated Area Transit in Ithaca and Tompkins County
2. TCAT bus stops: The model does not account for all of the stops on the route. The stops
that were incorporated into the model were based on TCAT’s tiem points in the route.
The data provided by TCAT was based on the time points on the route, so we built our
model to alight with TCAT’s data.
3. Passengers disembarking the bus: Due to the limited information about the number of
passengers disembarking at each stop, the model is built on an estimate of the number of
passengers disembarking the bus.
4. Non-peak hours: The model only addresses the simulation of peak hour operations of
Route 30. However, we have tried to build the model in a flexible manner and it would
thus work for non-peak hours by simply making changes to the arrival frequencies of the
model to fit the non-peak hour distributions.
5. Limited data: For the purposes of this project, only September 2013 data provided by
TCAT has been used. Due to the lack of data for other months of the year, this model is
not scalable throughout the year. However, the data can be incorporated into the arrival
distributions section of the model when available and the model will analyze the
operation scenario of the complete year.
6. Cumulating capacities: In the process of simplifying the model for simulation, only one
bus has been modeled to move through the route per hour. In reality, Route 30 operates
with a headway of 15 minutes during peak hours, and to accommodate this into the model,
we increased the capacity of the single bus by a factor of four. This might smoothen some
of the peaks in the output. As the analysis is only on the average values of the output,
cumulating the capacities will not heavily impact the model.
Results We explained previously that we used cumulating capacities depending on the number of buses
we assume are running in an hour. Using cumulative capacities, we have run our model making
an assumption of 15 minute headway between buses, 20 minute headway, and 30 minute
headway, and have analyzed each of these situations to make better recommendations to TCAT.
ProModel gives detailed output summary statistics upon running each of these models and we
will discuss the results observed in each case.
Case 1 – Two Buses per Hour In this case, TCAT runs only two buses an hour during peak hours, i.e. the headway between
buses is 30 minutes. Maximum capacity of the bus in this case will be 108 (assuming a single
bus capacity of 54) and we assume a simulation run time of 20 hours.
Name
Total
Changes
Avg Time Per
Change (Min)
Minimum
Value
Maximum
Value
Current
Value
Average
Value
Occupancy 438 2.73 0 108 13 49.59
Total Leftover
Passengers 58 20.44 0 894 894 418.80
Max Capacity 0 0 108 108 108 108
Bus Full Counter 58 20.44 0 58 58 28.03 Table 54: Simulation Case 1 Results

VII. Simulation 127
Feasibility Study of Service Options for Tompkins Consolidated Area Transit in Ithaca and Tompkins County
From the above table we observe that once every 20.44 min the bus becomes full and there are
leftover passengers on the route. The bus was full 58 times in 20 hours, which means it was full
almost three times an hour. In the 20 hours that the simulation was run, there were about 894
passengers who were denied boarding into the bus as the bus was full. This clearly indicates a
poor level of service for TCAT.
Case 2 – Three Buses per Hour In this case, TCAT runs only three buses an hour during peak hours, i.e. the headway between
buses is 20 minutes. Maximum capacity of the bus in this case will be 162 (assuming a single
bus capacity of 54) and we assume a simulation run time of 20 hours.
Name
Total
Changes
Avg Time Per
Change (Min)
Minimum
Value
Maximum
Value
Current
Value
Average
Value
Occupancy 334 3.58 0 162 152 84.82
Total Leftover
Passengers 12 94.14 0 18 18 8.36
Max Capacity 0 0 162 162 162 162
Bus Full Counter 12 94.14 0 12 12 5.52 Table 55: Simulation Case 2 Results
From the above table we observe that once every 94.14 min the bus becomes full and there are
leftover passengers on the route. The bus was full 12 times in 20 hours, which means it was full
around 0.6 times an hour, each time denying boarding to only one to two passengers. In the 20
hours that the simulation was run, there were 18 passengers who were denied boarding into the
bus as the bus was full. This indicates a substantial improvement over running just two buses an
hour.
Case 3 – Four Buses per Hour In this case, TCAT runs four buses an hour during peak hours like the current real-time scenario,
i.e. the headway between buses is 15 minutes. Maximum capacity of the bus in this case will be
216 (assuming a single bus capacity of 54) and we assume a simulation run time of 20 hours.
Name
Total
Changes
Avg Time Per
Change (Min)
Minimum
Value
Maximum
Value
Current
Value
Average
Value
Occupancy 320 3.74 0 171 23 91.47
Total Leftover
Passengers 0 0 0 0 0 0
Max Capacity 0 0 216 216 216 216
Bus Full
Counter 0 0 0 0 0 0 Table 56: Simulation Case 3 Results
From the above table we observe that the bus never gets full when there are four buses running
an hour and there are no leftover passengers on the route. In the 20 hours that the simulation was
run, the average occupancy of the bus was 91.47, which is almost 42% of the maximum capacity
of the bus. This is a very ideal way of running the bus, where absolutely no passenger is ever
denied boarding.

VII. Simulation 128
Feasibility Study of Service Options for Tompkins Consolidated Area Transit in Ithaca and Tompkins County
Comparison The following tables and graphs show the number of times the bus is full and leaves behind
passengers in each of the simulated cases.
Case Number of
Buses
Maximum
Capacity
Bus Full
Counter per
Hour
1 2 108 3
2 3 162 0.6
3 4 216 0
Table 57: Simulated Bus-Full Report
Figure 61: Simulated Bus-Full Report
Case Number of
Buses
Maximum
Capacity
Number of Leftover
Passengers per Hour
1 2 108 44.7
2 3 162 1.5
3 4 216 0
Table 58: Simulated Leftover Passengers Report
Figure 62: Simulated Leftover Passengers Report
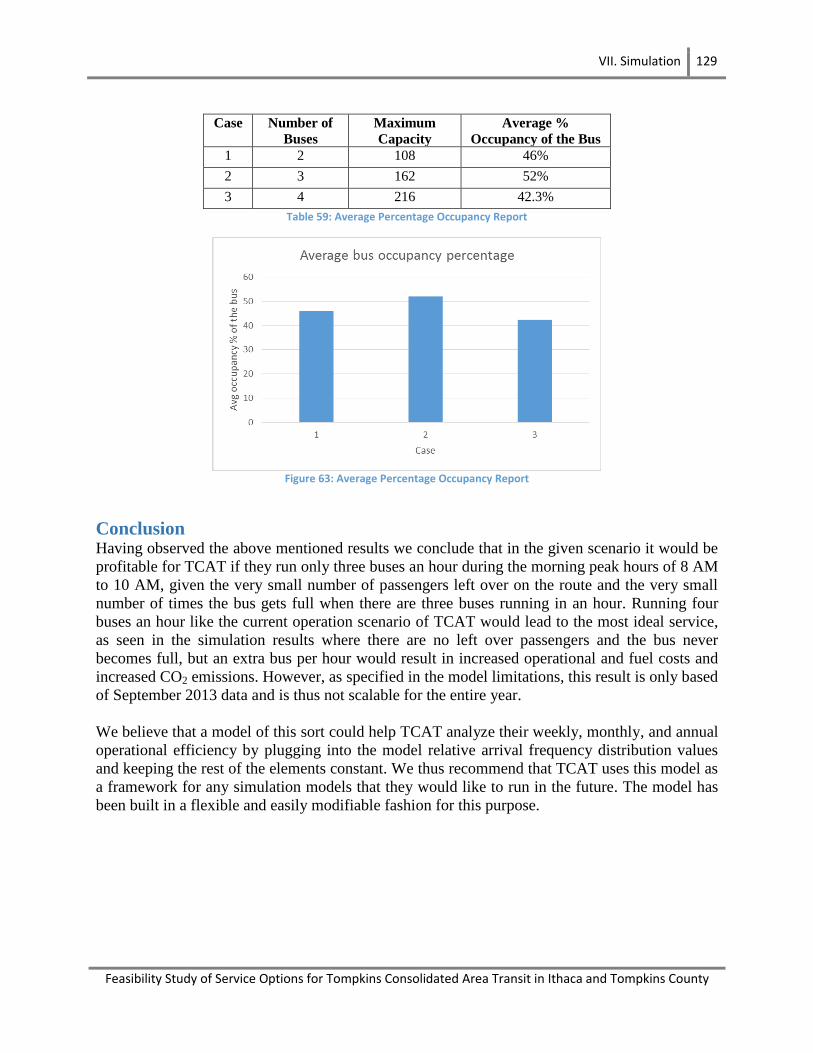
VII. Simulation 129
Feasibility Study of Service Options for Tompkins Consolidated Area Transit in Ithaca and Tompkins County
Case Number of
Buses
Maximum
Capacity
Average %
Occupancy of the Bus
1 2 108 46%
2 3 162 52%
3 4 216 42.3%
Table 59: Average Percentage Occupancy Report
Figure 63: Average Percentage Occupancy Report
Conclusion Having observed the above mentioned results we conclude that in the given scenario it would be
profitable for TCAT if they run only three buses an hour during the morning peak hours of 8 AM
to 10 AM, given the very small number of passengers left over on the route and the very small
number of times the bus gets full when there are three buses running in an hour. Running four
buses an hour like the current operation scenario of TCAT would lead to the most ideal service,
as seen in the simulation results where there are no left over passengers and the bus never
becomes full, but an extra bus per hour would result in increased operational and fuel costs and
increased CO2 emissions. However, as specified in the model limitations, this result is only based
of September 2013 data and is thus not scalable for the entire year.
We believe that a model of this sort could help TCAT analyze their weekly, monthly, and annual
operational efficiency by plugging into the model relative arrival frequency distribution values
and keeping the rest of the elements constant. We thus recommend that TCAT uses this model as
a framework for any simulation models that they would like to run in the future. The model has
been built in a flexible and easily modifiable fashion for this purpose.
VIII. Conclusion 130
Feasibility Study of Service Options for Tompkins Consolidated Area Transit in Ithaca and Tompkins County
VIII. Conclusion
As TCAT is growing steadily every year, already exceeding four million riders per year, it is
important for TCAT to always look for ways to better serve their community. In this paper we
have presented various methods that TCAT could approach to improving its current bus system.
We have taken several different perspectives to improve TCAT services: analyzing current
practices, conducting feasibility studies on buses with high levels of service, bus rapid transit,
articulated buses, and environmentally-friendly buses, and using simulation identify profitable
scenarios. These suggested improvements can help make TCAT’s system more efficient,
decrease its emissions to the local environment, increase customer service, and provided better
analyses of service performance. Overall, TCAT’s current system has been effectively handling
Ithaca’s demand, but to maintain this performance and to allow the system to continue to grow,
significant investment and changes will have to be made in the coming years. Furthermore,
Ithaca has always been a forward-thinking community, with TCAT often at the head of that
progress. This makes the region ideal to implement and demonstrate the advantages and
feasibility of new technology.
Despite the benefits detailed in this feasibility study, TCAT must be ready to overcome
significant challenges. First and foremost is obtaining the funding required for projects of this
scale. This is particularly a challenge as transit projects often require significant investment in a
short period of time, yet the true impact of this investment can take many years to realize.
Furthermore, being a non-profit agency in a small town makes receiving funding even more
difficult and it is likely that TCAT will have to find creative ideas and methods of funding future
projects. Second, before any project is implemented and for that project to be successful, TCAT
must generate public support and buy-in to the proposal. Public backlash against improper or
unfair development of transportation services such as TCAT is always expected to happen. This
will require education of the public and communal input in order to make the system provide the
greatest benefit for the greatest number of people in the community.
Future Studies This feasibility study discussed many options which TCAT may pursue in order to improve its
services. However, TCAT and Ithaca are not limited to the projects discussed in this report.
Around the world, other bus systems have proved effective, such as light rail transit, airport
shuttles, flexible routing, double-decker buses, and cable cars. Flexible routing may be effective
on the north side of Ithaca where demand is lower, as well as along the perimeters of the city,
away from the universities and commercial areas. Express buses to the airport could also be used
for travel to the business park adjacent to it in order to provide those employees faster service to
that area. While some of these are not appropriate options for Ithaca given its geographical and
financial constraints, they are options which can be explored further in addition to the ones
analyzed in this study.

References 131
Feasibility Study of Service Options for Tompkins Consolidated Area Transit in Ithaca and Tompkins County
References
American Public Transportation Association. Public Transportation Benefits. 2014.
http://www.apta.com/mediacenter/ptbenefits/Pages/default.aspx (accessed March 2014).
Badger, Emily. "How to Make Waiting for the Bus Feel Much, Much Shorter." The Atlantic
Cities. January 22, 2014. http://www.theatlanticcities.com/commute/2014/01/why-
technology-forever-changing-psychology-waiting-bus/8158/.
Boorse, Jack W. This Is Light Rail Transit. Washington, D.C.: Transportation Research Board,
2000.
Bouchat, Christian. Les Voitures Hybrides Dans L'histoire. December 20, 2005.
http://www.automania.be/fr/auto/automobilia/automobilia-historiques/les-voitures-
hybrides-dans-l-histoire.html.
Bryson, Martin Alexiou. "Transportation-Focused Generic Environmental Impact Statement (t-
GEIS) - Travel Survey Results." 2007.
Capital District Transportation Authority. "2012-2013 Annual Report." Albany, NY, 2013.
City of Santa Clarita Transit. "Commuter and Supplemental School Day Service Review." 2008.
Dubar, Charles S. "Buses, Trolleys, and Trams." 1967.
El-Geneidy, Ahmed M., and Nithya Vijayakumar. "The Effects of Articulated Buses on Dwell
and Running Times." 2011.
English, Dan. "Award - Purchase of HASTUS Modules, Sole Source." Halifax, 2009.
Eudy, Leslie, and Christina Gikakis. "Fuel Cell Buses in U.S. Transit Fleets - Current Status
2013." 2013.
Farwell, Randall. "Evaluation of Omnilink Demand Driven Transit Operations: Flex-Route
Services." 2003.
Federal Transit Administration. "Analysis of Electric drive Technologies for Transit
Applications: Battery-Electric, Hybrid-Electric, and Fuel Cells." 2005.
Federal Transit Administration. "Characteristics of Bus Rapid Transit for Decision-Making."
2009.
Federal Transit Administration. Transit Vehicle Emissions Program. Federal Transit
Administration, 2013.
Federal Transit Administration. "Vehicle Catalog - A Compendium of Vehicles and Powertrain
Systems for Bus Rapid Transit Service." 2006.
Finn, Brendan, Odile Heddebaut, Arno Kerkhof, Francois Rambaud, Oscar Sbert Lozano, and
Claude Soulas. Buses with High Level of Service. European Cooperative in Science and
Technology, 2011.
Finn, Brendan, Odile Heddebaut, Sebastien Rabuel, David Van der Spek, and Colin Brader.
"Buses with High Level of Service (BHLS) - Operational, regulatory, and contractural
Dimensions." Built Enviroment Vol36 (Delft University of Technology), 2010: 307-316.
Google Maps. Add your transit data to Google Maps. 2014.
http://maps.google.com/help/maps/mapcontent/transit/participate.html (accessed May 9th,
2014).
—. Google Transit Partner Program. 2014.
http://maps.google.com/help/maps/mapcontent/transit/ (accessed May 9th, 2014).
Gruber, Christian, and Reinhold Wurster. "Hydrogen-Fueled Buses: The Bavarian Fuel Cell Bus
Project." n.d.

References 132
Feasibility Study of Service Options for Tompkins Consolidated Area Transit in Ithaca and Tompkins County
Hamilton, Tyler. Next Stop: Ultracapacitor Buses. MIT Technology Review, 2009.
Hemily, Brendon, and Rolland D. King. "TCRP Synthesis 75 - Uses of Higher Capacity Buses in
Transit Service." 2008.
Higgins, Christopher D. "The North American Light Rail Experience: Insights for Hamilton."
2012.
Higgins, Laura L., and Linda K. Cherrington. Experience with Flex Route Transit Service in
Texas. Texas Transportation Institute, Texas A&M University System, 2005.
HyFLEET:CUTE. "Hydrogen Transports - Bus Technology & Fuel for TODAY and for a
Sustainable Future." 2009.
IDTechEx. Supercapacitors improving faster than batteries. March 22, 2013.
http://www.idtechex.com/research/articles/supercapacitors-improving-faster-than-
batteries-00005281.asp.
Ingram, Antony. Average fuel economy of US cars reaches an all-time high. The Christian
Science Monitor, 2013.
Kelty, Kurt, J.B. Straubel, Erik Toomre, and Gene Berdichevsky. "Tesla Roadster Battery
System." Tesla Motors. August 2006.
http://webarchive.teslamotors.com/display_data/TeslaRoadsterBatterySystem.pdf.
Litt, Steven. RTA's Euclid Avenue Health Line is faring well in ridership, innovation. November
29, 2009.
http://blog.cleveland.com/architecture/2009/11/rtas_euclid_avenue_healthline.html
(accessed May 4, 2014).
MacKechnie, Christopher. Software Used in the Public Transit Industry: Hastus by GIRO. 2014.
http://publictransport.about.com/od/Transit_Technology/a/Software-Used-In-The-Public-
Transit-Industry-Hastus-By-Giro.htm.
McKendrick, Neil. "Calgary's C Train - Effective Capital Utilization." 2005.
Miami-Dade Transit. "Transit Development Plan - Annual Administrative Update." 2013.
Monaco, Ania. "A Road Trip Through Time." The Institute. September 9, 2011.
http://theinstitute.ieee.org/technology-focus/technology-history/a-road-trip-through-time.
Murdoch University. A Cost-Benefit Analysis of Perth’s Hydrogen Fuel Cell Buses . Murdoch
University, 2006.
National Renewable Energy Laboratory. "King County Metro Transit Hybrid Articulated Buses:
Interim Evaluation Results." 2006.
Naviaux, John D. From Cars to Buses: Using OCTA Ridership to Analyze the Emission Benefits
of Bus Transportation. The UC Irvine Undergraduate Research Journal, 2011.
Proterra Inc. "Proterra launches first deployment of all electric zero emission buses." Proterra.
September 2010.
http://www.proterra.com/index.php/mediacenter/companynews/proterra_launches_first_d
eployment_of_all-electric_zero-emission_buses/.
—. Value Proposition. 2012. http://www.proterra.com/index.php/products/productDetail/C29/.
Romero, Frances. "The Electric Car." Time. January 13, 2009.
http://www.time.com/time/business/article/0,8599,1871282,00.html.
Sinoski, Kelly. Whistler’s hydrogen fuel cell bus program in jeopardy. November 25, 2013.
http://www.vancouversun.com/technology/Whistler+hydrogen+fuel+cell+program+jeopa
rdy/9212028/story.html.
Smiler, Simon P. Buses - Clean and Green, Electric Buses. 2013.
http://citytransport.info/Electbus.htm.
References 133
Feasibility Study of Service Options for Tompkins Consolidated Area Transit in Ithaca and Tompkins County
Sun, Yunlong. Beijing Olympics to use 50 Li-ion battery powered buses. July 30, 2007.
http://news.xinhuanet.com/english/2007-07/30/content_6449449.htm.
Supercapacitor Buses. Environmetal Impacts. 2012.
http://sites.duke.edu/supercapacitors/business-plan/environmental-impacts/.
Tompkins Consolidated Area Transit. "2012 Yearbook." Ithaca, NY, 2012.
Tompkins County. Ithaca-Tompkins County Transporation Council - Statistics. 2014.
http://tompkinscountyny.gov/itctc/statistics (accessed March 2014).
Torrance, Kristen, Ashley R. Haire, and Randy B. Machemehl. Vehicle and Driver Scheduling
for Public Transit. August 2009.
Transport for London. "Corporate Social Responsibility." 2014.
Transport for London. "New Routemaster." 2013.
Transport NSW. "Double Deck - Two Door City Bus - Bus Specification." 2010.
Transportation Research Board. Track Design Handbook for Light Rail Transit. Washington,
D.C.: Transportation Research Board, 2012.
Transportation Research Board. "Transit Capacity and Quality of Service." 2003.
U.S. Department of Energy. "Electric Buses Electrify Downtown Chattanooga." 1997.
—. How Fuel Cells Work. 2014. https://www.fueleconomy.gov/feg/fcv_PEM.shtml.
UITP. "Lundalanken - "The Lund Link"." May 13, 2009.
Volvo. Volvo 7700 Hybrid bus – 30% lower fuel consumption and emissions. 2011.
Walker, Jarret. Human Transit. April 24, 2011. http://www.humantransit.org/2011/04/basics-
walking-distance-to-transit.html (accessed 5 May, 2014).
Zaetta, R., and B. Madden. "Hydrogen Fuel Cell Bus Technology State of the Art Review." 2011.
Zeidler, Maryse. Whistler’s hydrogen buses to be scrapped, replaced by diesel. December 12,
2013. http://www.theglobeandmail.com/news/british-columbia/whistlers-hydrogen-
buses-to-be-scrapped-replaced-by-diesel/article15900241/.

Appendix 134
Feasibility Study of Service Options for Tompkins Consolidated Area Transit in Ithaca and Tompkins County
Appendix
Literature Review of Unconsidered Service Options
Light Rail Transit Light rail transit (LRT) is an alternative transit mode evolved from streetcar technology, and
emerged in North America in the 1970s. Many regions around the world are considering
developing an LRT system. Current systems can be classified into two types: “first generation”
systems, which were transformed from earlier trolley and tramway lines; and “second generation”
systems that were built afresh, utilizing parts of abandoned trolley or railroad lines occasionally
(Boorse 2000).
LRT, according to the American Public Transportation Association (APTA), is defined as “an
electric railway system characterized by its ability to operate single or multiple cars, runs along
exclusive rights-of-way at ground level, on aerial structures, in subways or in streets, able to
board and discharge passengers at station platforms or at street, track, or car-floor level and
normally powered by overhead electrical wires” (Transportation Research Board 2012). To make
both the definition and the functionality of LRT more flexible, the system can be categorized into
three types (C. D. Higgins 2012):
• Streetcars, with all or most tracks in mixed-traffic lanes
• Classic LRT lines using a mix of at-grade and separated alignments
• LRT routes that offer rapid transit service through private right-of-ways with no more than a
handful of streets crossing the tracks at grade.
Features The following are advantages of LRT.
• Attracts more riders who leave cars at home (discretionary riders).
• Provides superior service quality, including great comfort due to large space per passenger
and a smooth and quiet ride.
• Greater capacity.
• Relatively low operating costs per passenger-mile compared with other modes when transit
demand is high.
• Has positive impact on land use.
• Increases property values near transit stations.
• Less air and noise pollution, particularly when electric-powered.
• Rail stations tend to be more pleasant than bus stations, so rail is preferred where many
transit vehicles congregate.
• Helps preserve and revitalize downtown areas of major U.S. cities.
• More investment in LRT.
• Great travel speed and reliability.
• Improves community image.
However, LRT has the following disadvantages.
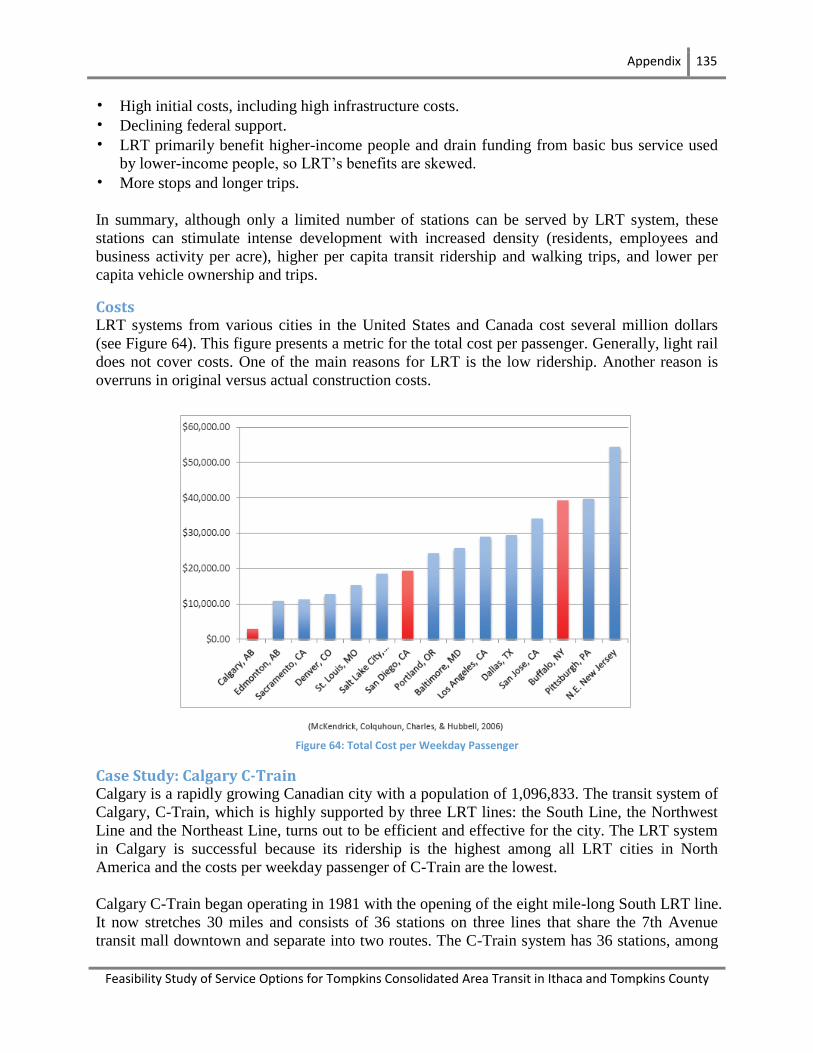
Appendix 135
Feasibility Study of Service Options for Tompkins Consolidated Area Transit in Ithaca and Tompkins County
• High initial costs, including high infrastructure costs.
• Declining federal support.
• LRT primarily benefit higher-income people and drain funding from basic bus service used
by lower-income people, so LRT’s benefits are skewed.
• More stops and longer trips.
In summary, although only a limited number of stations can be served by LRT system, these
stations can stimulate intense development with increased density (residents, employees and
business activity per acre), higher per capita transit ridership and walking trips, and lower per
capita vehicle ownership and trips.
Costs LRT systems from various cities in the United States and Canada cost several million dollars
(see Figure 64). This figure presents a metric for the total cost per passenger. Generally, light rail
does not cover costs. One of the main reasons for LRT is the low ridership. Another reason is
overruns in original versus actual construction costs.
Figure 64: Total Cost per Weekday Passenger
Case Study: Calgary C-Train Calgary is a rapidly growing Canadian city with a population of 1,096,833. The transit system of
Calgary, C-Train, which is highly supported by three LRT lines: the South Line, the Northwest
Line and the Northeast Line, turns out to be efficient and effective for the city. The LRT system
in Calgary is successful because its ridership is the highest among all LRT cities in North
America and the costs per weekday passenger of C-Train are the lowest.
Calgary C-Train began operating in 1981 with the opening of the eight mile-long South LRT line.
It now stretches 30 miles and consists of 36 stations on three lines that share the 7th Avenue
transit mall downtown and separate into two routes. The C-Train system has 36 stations, among
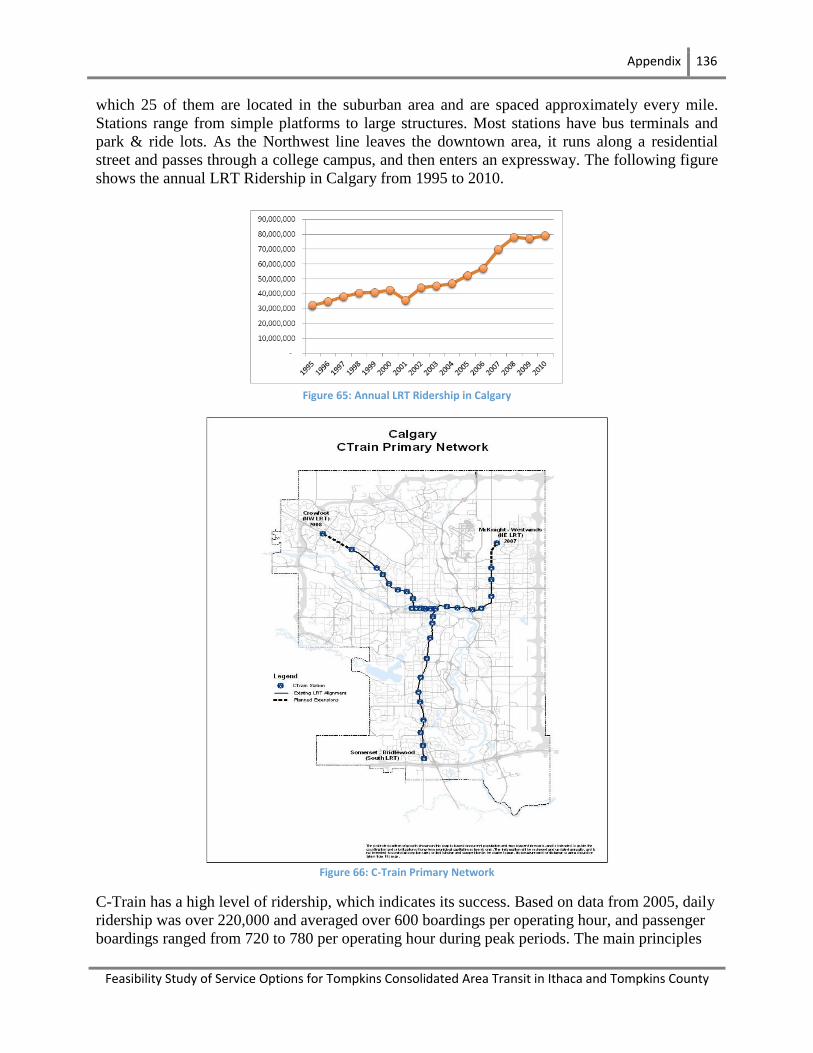
Appendix 136
Feasibility Study of Service Options for Tompkins Consolidated Area Transit in Ithaca and Tompkins County
which 25 of them are located in the suburban area and are spaced approximately every mile.
Stations range from simple platforms to large structures. Most stations have bus terminals and
park & ride lots. As the Northwest line leaves the downtown area, it runs along a residential
street and passes through a college campus, and then enters an expressway. The following figure
shows the annual LRT Ridership in Calgary from 1995 to 2010.
Figure 65: Annual LRT Ridership in Calgary
Figure 66: C-Train Primary Network
C-Train has a high level of ridership, which indicates its success. Based on data from 2005, daily
ridership was over 220,000 and averaged over 600 boardings per operating hour, and passenger
boardings ranged from 720 to 780 per operating hour during peak periods. The main principles
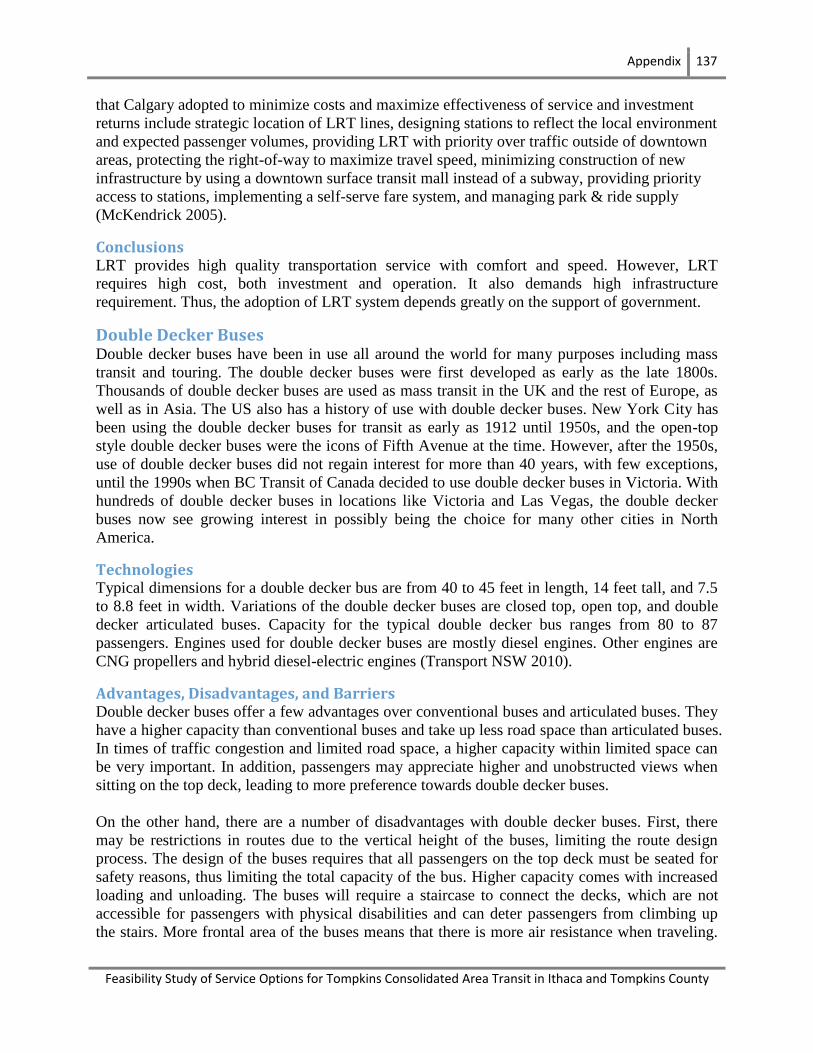
Appendix 137
Feasibility Study of Service Options for Tompkins Consolidated Area Transit in Ithaca and Tompkins County
that Calgary adopted to minimize costs and maximize effectiveness of service and investment
returns include strategic location of LRT lines, designing stations to reflect the local environment
and expected passenger volumes, providing LRT with priority over traffic outside of downtown
areas, protecting the right-of-way to maximize travel speed, minimizing construction of new
infrastructure by using a downtown surface transit mall instead of a subway, providing priority
access to stations, implementing a self-serve fare system, and managing park & ride supply
(McKendrick 2005).
Conclusions LRT provides high quality transportation service with comfort and speed. However, LRT
requires high cost, both investment and operation. It also demands high infrastructure
requirement. Thus, the adoption of LRT system depends greatly on the support of government.
Double Decker Buses Double decker buses have been in use all around the world for many purposes including mass
transit and touring. The double decker buses were first developed as early as the late 1800s.
Thousands of double decker buses are used as mass transit in the UK and the rest of Europe, as
well as in Asia. The US also has a history of use with double decker buses. New York City has
been using the double decker buses for transit as early as 1912 until 1950s, and the open-top
style double decker buses were the icons of Fifth Avenue at the time. However, after the 1950s,
use of double decker buses did not regain interest for more than 40 years, with few exceptions,
until the 1990s when BC Transit of Canada decided to use double decker buses in Victoria. With
hundreds of double decker buses in locations like Victoria and Las Vegas, the double decker
buses now see growing interest in possibly being the choice for many other cities in North
America.
Technologies Typical dimensions for a double decker bus are from 40 to 45 feet in length, 14 feet tall, and 7.5
to 8.8 feet in width. Variations of the double decker buses are closed top, open top, and double
decker articulated buses. Capacity for the typical double decker bus ranges from 80 to 87
passengers. Engines used for double decker buses are mostly diesel engines. Other engines are
CNG propellers and hybrid diesel-electric engines (Transport NSW 2010).
Advantages, Disadvantages, and Barriers Double decker buses offer a few advantages over conventional buses and articulated buses. They
have a higher capacity than conventional buses and take up less road space than articulated buses.
In times of traffic congestion and limited road space, a higher capacity within limited space can
be very important. In addition, passengers may appreciate higher and unobstructed views when
sitting on the top deck, leading to more preference towards double decker buses.
On the other hand, there are a number of disadvantages with double decker buses. First, there
may be restrictions in routes due to the vertical height of the buses, limiting the route design
process. The design of the buses requires that all passengers on the top deck must be seated for
safety reasons, thus limiting the total capacity of the bus. Higher capacity comes with increased
loading and unloading. The buses will require a staircase to connect the decks, which are not
accessible for passengers with physical disabilities and can deter passengers from climbing up
the stairs. More frontal area of the buses means that there is more air resistance when traveling.
Appendix 138
Feasibility Study of Service Options for Tompkins Consolidated Area Transit in Ithaca and Tompkins County
Combined with a higher center of gravity from the height, double-decker buses operating in
winter conditions and high winds can be an important concern.
The 2008 TCRP report on double decker buses show that the issue with vertical clearance can be
resolved with modifications in infrastructure given the conditions of most roads in the US. In
addition, a review of regulations reveals that double decker buses satisfy the height limits of 21
states.
A possible barrier to obtaining double decker buses in the US is the Buy America Act, which,
according to the Department of Transportation, dictates that transportation infrastructure projects
with federal funding are all constructed with products made in the US. Major manufacturers of
high quality and mass numbers of double decker buses are located in Europe, such as Alexander
Dennis and AEC of Leyland Motors in the UK and Van Hool in Belgium. However, the
Enviro500 model from Alexander Dennis is assembled in the US and is compliant with Buy
America, indicating that it is possible to have international brands assembled within the US to
ensure compliance with the Buy America Act.
Economic Aspects Based on the TCRP report, the cost of a typical double decker bus from Alexander Dennis with
capacity of 81 costs $600,000 while the cost of an articulated double decker from Van Hool is in
the low $600,000s as of January 2007 (Hemily and King 2008). Other sources suggest that a
double decker bus can cost around $500,000, which leads to the estimate that a typical double
decker bus has a cost that ranges from $500,000 to $650,000. Based on the Transport for New
South Wales’ specifications of its new set of double decker buses, each bus is expected to last up
to 25 years, more than the expected useful life of current TCAT buses.
Another major cost to consider for double decker buses is the cost to modify facilities and
infrastructure. Removal of overhead obstructions, larger door openings, portable lifts purchases,
modifications to garage and washing facilities are some extra costs with double decker buses.
The TCRP’s sample modification cost calculation from a bus agency sums up to be around
$700,000.
Environmental Impacts Transport for London’s new set of iconic red AEC Routemaster double decker buses is reported
to have a fuel efficiency of 6.1 mpg for hybrid buses and 5.3 mpg for diesel buses (Transport for
London 2013). Measurements of eight prototypes of the new Routemasters for eight months
show a significant improvement in bus emissions: 2.048g/km of nitrogen oxide, 690.23 g/km of
CO2, and 0.012 g/km of particulate matter. The levels of nitrogen oxide and particulate matter
are 75% less than that of the current fleet average for hybrid and diesel double decker buses,
while the level of CO2 emission is less than half.
Applicability to Ithaca Double decker buses can certainly be considered for serving the Ithaca and Tompkins County
area. The extra capacity can prove to be useful in satisfying the demand level during rush hours.
In addition, the extra height of the buses should not prove to be prohibitive because there are
minor road obstructions within the areas of service, especially those that had seen high demand.
Appendix 139
Feasibility Study of Service Options for Tompkins Consolidated Area Transit in Ithaca and Tompkins County
It is important, though, to note the severe winter conditions and the steepness of roads in the
Tompkins County that may affect the safety factor of using double decker buses.
Flexible Routing Flexible transit routes combine fixed route transit service and demand-responsive service.
Flexible route vehicles travel on a general route with stops determined by prior passenger request
or when flagged by a pedestrian, or they may serve fixed stops, with periodic deviations to pick
up or drop off a passenger on a demand-response basis. Flexible routes can be a way to serve
both paratransit passengers and the general public. Flexible route services may extend the reach
of general transit service into areas where fixed route service would not be as efficient. As transit
agencies search for ways to improve efficiency and to serve new rider markets, flexible routing
may be a possible solution. Flexible transit service provides easier access than fixed route transit,
as well as provides transit in lower-density areas where fixed routes would not be possible.
Historical Background Public transportation systems have historically operated as fixed routes, predetermined stops, and
collecting passengers at scheduled times. The fixed route transit system works most efficiently
where there are high concentrations of residential areas and common destinations. For rural and
suburban areas with low population density, fixed route service is not as efficient compared to
metropolitan areas.
In order to understand flexible route services better, the Transportation Research Board
conducted a series of online surveys which indicated that the implementation of flexible public
transportation service is on a demand rise. According to the survey, different people have
different customization for flex route service. Of the respondents, 56.1% believe the service
operates route deviation for general public, 45.1% believe the service operates route deviation
for people with disabilities, and around 30% of respondents believe the service operates demand
responsive corrector, requested stops and zone routes. The major parts of the passenger base that
requires flexible route service are senior citizens and people with disabilities. They contribute to
56% of total passenger demand (Higgins and Cherrington 2005).
Services The transit demand was identified using GIS. The GIS determines the population rate, household
densities, elderly populations, youth populations, household income, and households without
automobiles. Information from census block groups is also combined into the overall database
for transit demand. There are also many other factors put into consideration when identifying the
demand for service and planning of the service. These factors include unbuilt and impassible
streets, location of common destination such as downtown areas, financial district, shopping
centers, and employment centers, location of schools and hospitals, and social service and
government centers.
The routing corridors were further refined based on public surveys and comments. Operational
considerations includes running times, operating cost, vehicle requirements, and pulse point
transfer requirements. There are also two planning strategies often acquired by agencies
providing flexible route service. The two planning strategies are
1. Buses serve all stops in the corridor on each run, and deviate when there is a passenger
required point to pick up or drop off.
Appendix 140
Feasibility Study of Service Options for Tompkins Consolidated Area Transit in Ithaca and Tompkins County
2. Buses deviate from its main route without returning to point of departure, as long as all
passengers are served along the route.
Manually dispatched flexible route services involve trip requests, taking orders, scheduling trips,
and vehicle dispatching. Flexible route services are accessible at bus stops or by calling 24 to 48
hours in advance to schedule a round trip. Riders may establish a subscription for regular
services.
Advantages and Disadvantages The following are the advantages of flexible routing.
• Whether or not flexible transit is cost-effective for a given transit provider depends on the
purpose of the program and the cost of the alternative transit service. Flexible transit can be
cost effective when comparing total costs to provide transit service.
• Total cost to provide flexible service in a specific service area, such as a low-density
residential neighborhood, may be lower than the cost to provide adequate fixed route services
for the same area.
• Flexible service can be less expensive than fixed route service when the flexible service can
meet specific customer needs with fewer hours or miles of service. Total cost for flexible
route can be lower than the cost of complementary ADA paratransit, if the flexible service
meets ADA requirements for paratransit.
However, flexible routing has its disadvantages.
• Dispatching issues: vehicle capacity limitations, transferring, and schedule adherence.
• Conveying the working of flexible routes to the public can be difficult. It requires clear
illustration of service corridor, location of time points, bus stops, landmarks, and schedule.
• Driver training is difficult.
• Flexible route passengers require an adjustment period before becoming comfortable with the
concept of a bus not following a regular route.
Economic Feasibility In terms of cost per hour, the direct cost of providing flexible services may be lower if operated
by a private contractor, but total costs may be similar. Total costs include the expense of the
transit agency for contract administration and managing the service to for customer satisfaction
and service quality. It is reasonable to assume the flexible service cost per hour is similar to fixed
route cost per hour if the transit agency administration, management, and indirect costs are not
allocated, which may show small differences. Analysis of examples showed both higher and
lower flexible costs per hour than for fixed routes. The differences may be explained the
assumptions for the allocation variables.
Cost per mile for flexible route services is higher than for fixed route services because flexible
services operate fewer miles per hour. Flexible services also carry fewer passengers per hour, so
cost per passenger is higher. As a result, cost per passenger for flexible transit is higher than for
fixed routes. Although flex-route services are less productive and efficient than fixed route
services, in lower density suburban environments, flexible route services may be the best way to
provide transit services. Omnilink flexible route service requires eight vehicles, 78 service hours
per day and cost $688,000 annually. The same level of service, if operated as fixed route services
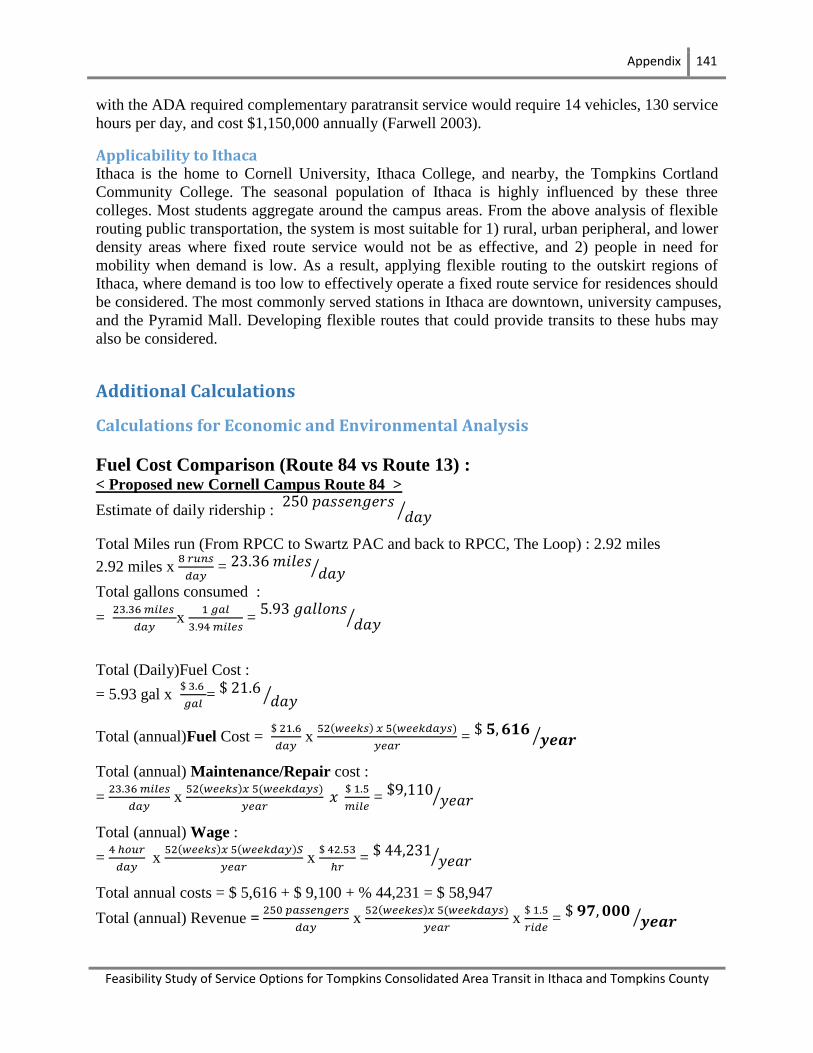
Appendix 141
Feasibility Study of Service Options for Tompkins Consolidated Area Transit in Ithaca and Tompkins County
with the ADA required complementary paratransit service would require 14 vehicles, 130 service
hours per day, and cost $1,150,000 annually (Farwell 2003).
Applicability to Ithaca Ithaca is the home to Cornell University, Ithaca College, and nearby, the Tompkins Cortland
Community College. The seasonal population of Ithaca is highly influenced by these three
colleges. Most students aggregate around the campus areas. From the above analysis of flexible
routing public transportation, the system is most suitable for 1) rural, urban peripheral, and lower
density areas where fixed route service would not be as effective, and 2) people in need for
mobility when demand is low. As a result, applying flexible routing to the outskirt regions of
Ithaca, where demand is too low to effectively operate a fixed route service for residences should
be considered. The most commonly served stations in Ithaca are downtown, university campuses,
and the Pyramid Mall. Developing flexible routes that could provide transits to these hubs may
also be considered.
Additional Calculations
Calculations for Economic and Environmental Analysis
Fuel Cost Comparison (Route 84 vs Route 13) : < Proposed new Cornell Campus Route 84 >
Estimate of daily ridership :
⁄
Total Miles run (From RPCC to Swartz PAC and back to RPCC, The Loop) : 2.92 miles
2.92 miles x
=
⁄
Total gallons consumed :
=
x
=
⁄
Total (Daily)Fuel Cost :
= 5.93 gal x
= ⁄
Total (annual)Fuel Cost =
x
= ⁄
Total (annual) Maintenance/Repair cost :
=
x
= ⁄
Total (annual) Wage :
=
x
x
= ⁄
Total annual costs = $ 5,616 + $ 9,100 + % 44,231 = $ 58,947
Total (annual) Revenue =
x
x
= ⁄

Appendix 142
Feasibility Study of Service Options for Tompkins Consolidated Area Transit in Ithaca and Tompkins County
Total (annual) Profit = $ 97,000 - $5,616
⁄ (considering only fuel cost)
< Existing Route 13 >
Annual Ridership from 2012 data table :
⁄
Total Miles run :
Weekday :
x
x 2(round trips) =
⁄
Saturday :
x
x 2 (round trips) =
⁄
Gallons consumed :
Weekday :
x
=
⁄
Saturday :
x
=
⁄
Daily Cost (considered Fuel cost only for comparison) :
Weekday :
x
= ⁄
Saturday :
x
= ⁄
Annual Fuel Cost :
Weekday :
x
= ⁄
Saturday :
x
= ⁄
Total Annual Fuel Cost : $ 600,91 + $ 141,90 = ⁄
Total Annual Maintenance/Repair Cost :
Weekday :
=
x
= ⁄
Saturday :
=
x
= ⁄
Total Annual Wage :
Weekday :
=
x
= ⁄
Saturday :
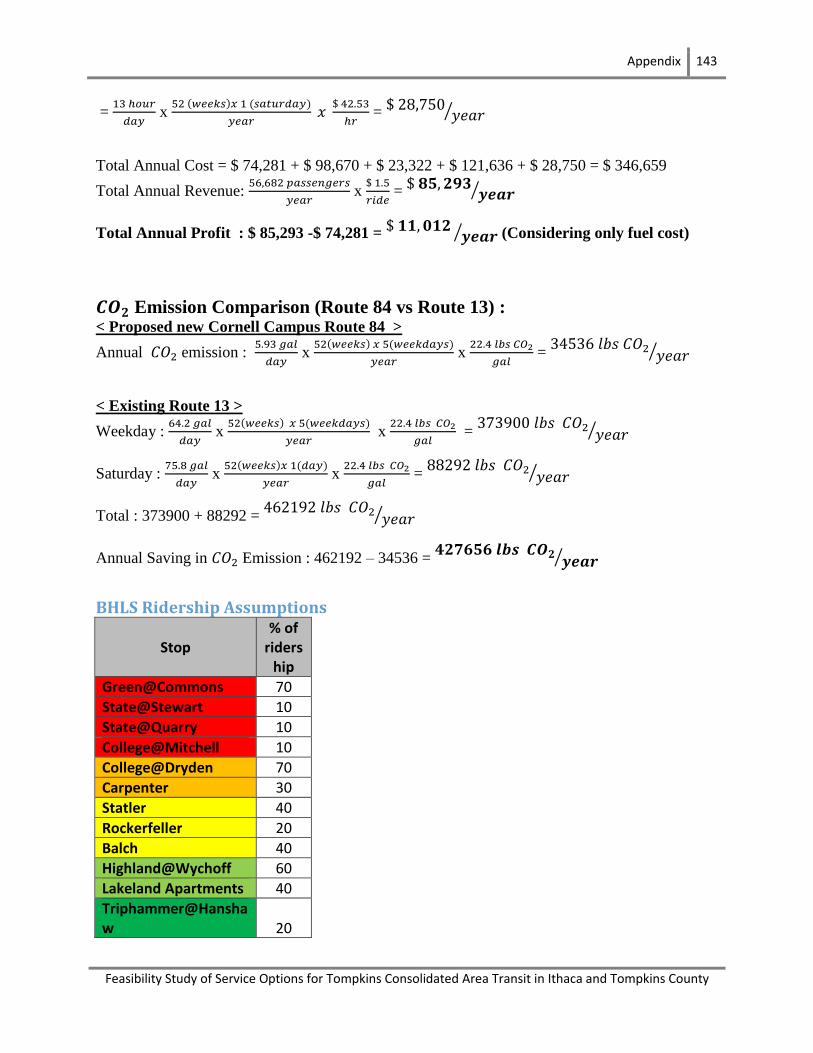
Appendix 143
Feasibility Study of Service Options for Tompkins Consolidated Area Transit in Ithaca and Tompkins County
=
x
= ⁄
Total Annual Cost = $ 74,281 + $ 98,670 + $ 23,322 + $ 121,636 + $ 28,750 = $ 346,659
Total Annual Revenue:
x
= ⁄
Total Annual Profit : $ 85,293 -$ 74,281 =
⁄ (Considering only fuel cost)
Emission Comparison (Route 84 vs Route 13) : < Proposed new Cornell Campus Route 84 >
Annual emission :
x
x
=
⁄
< Existing Route 13 >
Weekday :
x
x
=
⁄
Saturday :
x
x
=
⁄
Total : 373900 + 88292 =
⁄
Annual Saving in Emission : 462192 – 34536 =
⁄
BHLS Ridership Assumptions
Stop % of
ridership
Green@Commons 70
State@Stewart 10
State@Quarry 10
College@Mitchell 10
College@Dryden 70
Carpenter 30
Statler 40
Rockerfeller 20
Balch 40
Highland@Wychoff 60
Lakeland Apartments 40
Triphammer@Hanshaw 20
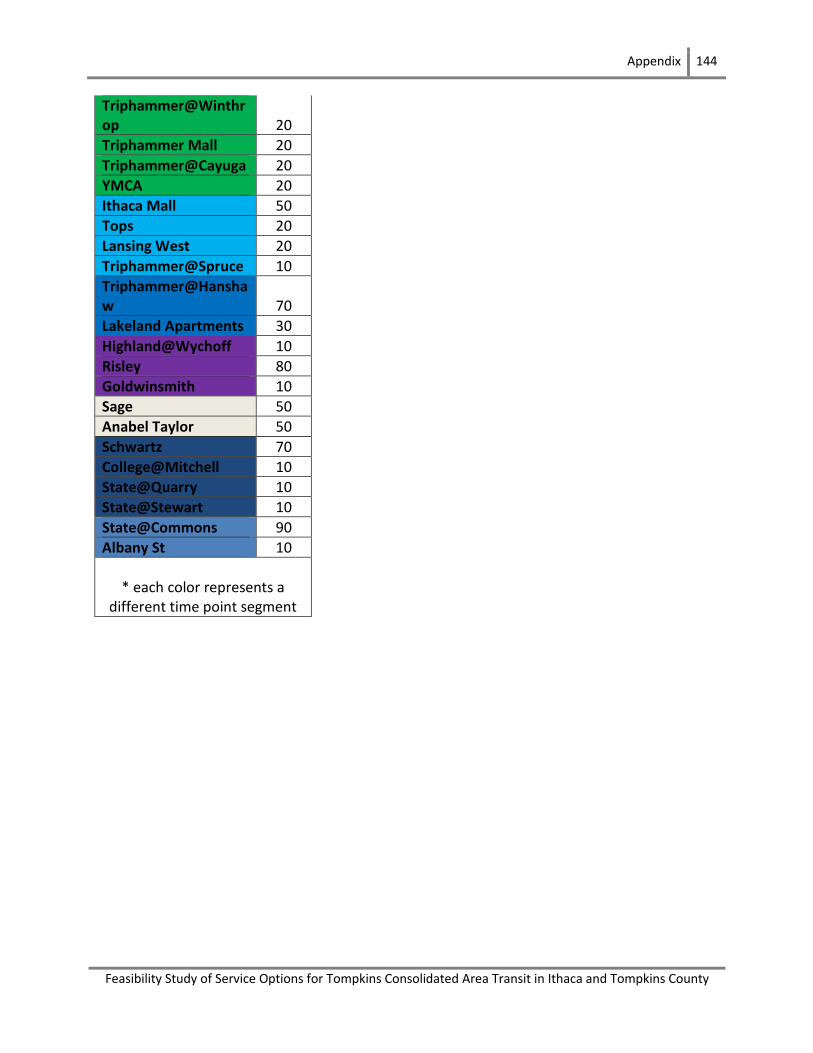
Appendix 144
Feasibility Study of Service Options for Tompkins Consolidated Area Transit in Ithaca and Tompkins County
Triphammer@Winthrop 20
Triphammer Mall 20
Triphammer@Cayuga 20
YMCA 20
Ithaca Mall 50
Tops 20
Lansing West 20
Triphammer@Spruce 10
Triphammer@Hanshaw 70
Lakeland Apartments 30
Highland@Wychoff 10
Risley 80
Goldwinsmith 10
Sage 50
Anabel Taylor 50
Schwartz 70
College@Mitchell 10
State@Quarry 10
State@Stewart 10
State@Commons 90
Albany St 10
* each color represents a
different time point segment
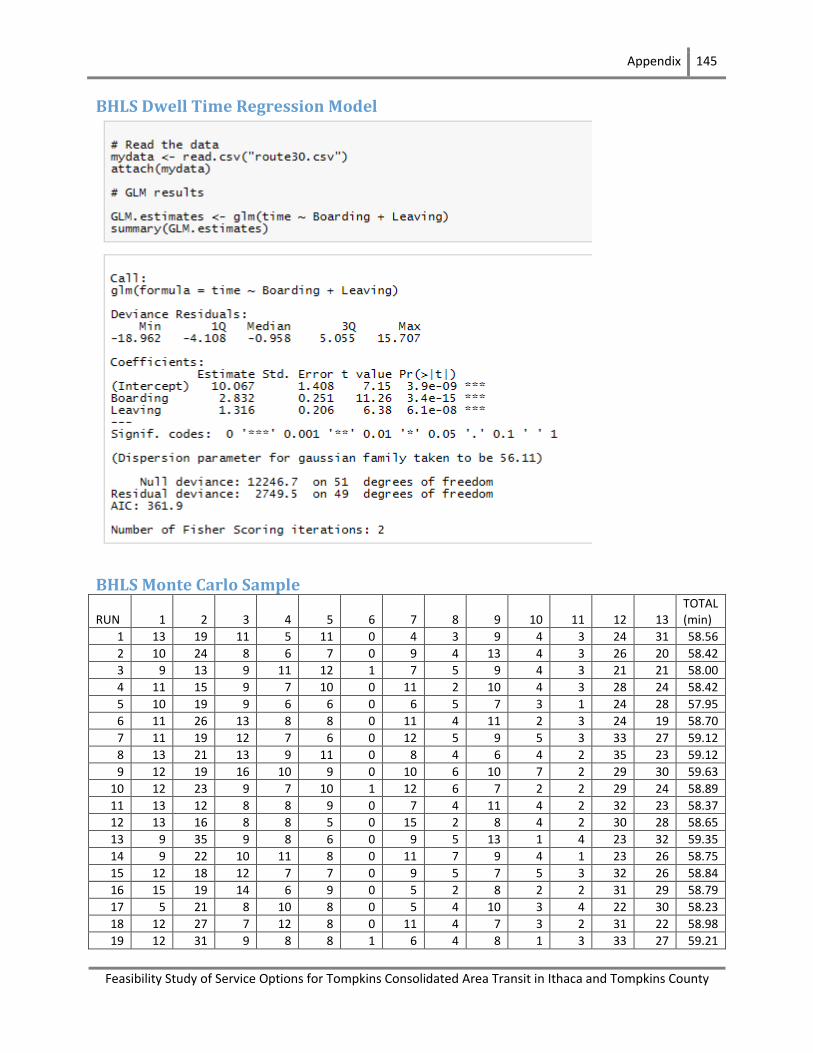
Appendix 145
Feasibility Study of Service Options for Tompkins Consolidated Area Transit in Ithaca and Tompkins County
BHLS Dwell Time Regression Model
BHLS Monte Carlo Sample
RUN 1 2 3 4 5 6 7 8 9 10 11 12 13 TOTAL (min)
1 13 19 11 5 11 0 4 3 9 4 3 24 31 58.56
2 10 24 8 6 7 0 9 4 13 4 3 26 20 58.42
3 9 13 9 11 12 1 7 5 9 4 3 21 21 58.00
4 11 15 9 7 10 0 11 2 10 4 3 28 24 58.42
5 10 19 9 6 6 0 6 5 7 3 1 24 28 57.95
6 11 26 13 8 8 0 11 4 11 2 3 24 19 58.70
7 11 19 12 7 6 0 12 5 9 5 3 33 27 59.12
8 13 21 13 9 11 0 8 4 6 4 2 35 23 59.12
9 12 19 16 10 9 0 10 6 10 7 2 29 30 59.63
10 12 23 9 7 10 1 12 6 7 2 2 29 24 58.89
11 13 12 8 8 9 0 7 4 11 4 2 32 23 58.37
12 13 16 8 8 5 0 15 2 8 4 2 30 28 58.65
13 9 35 9 8 6 0 9 5 13 1 4 23 32 59.35
14 9 22 10 11 8 0 11 7 9 4 1 23 26 58.75
15 12 18 12 7 7 0 9 5 7 5 3 32 26 58.84
16 15 19 14 6 9 0 5 2 8 2 2 31 29 58.79
17 5 21 8 10 8 0 5 4 10 3 4 22 30 58.23
18 12 27 7 12 8 0 11 4 7 3 2 31 22 58.98
19 12 31 9 8 8 1 6 4 8 1 3 33 27 59.21
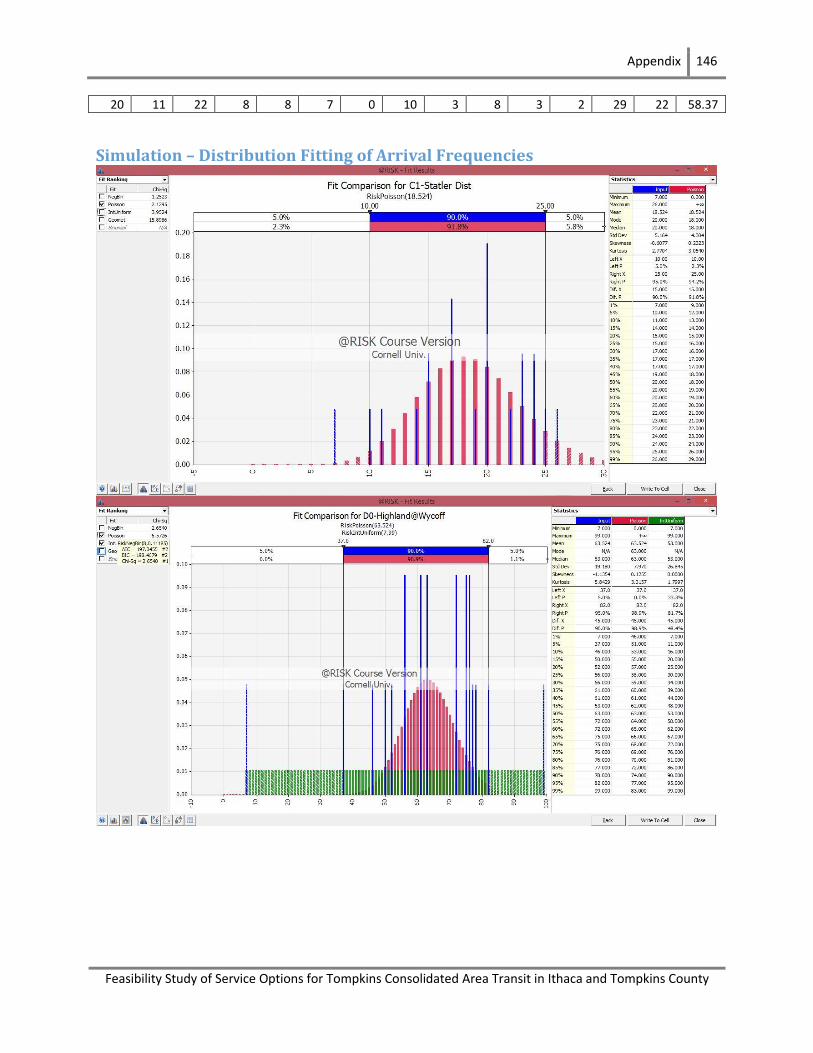
Appendix 146
Feasibility Study of Service Options for Tompkins Consolidated Area Transit in Ithaca and Tompkins County
20 11 22 8 8 7 0 10 3 8 3 2 29 22 58.37
Simulation – Distribution Fitting of Arrival Frequencies
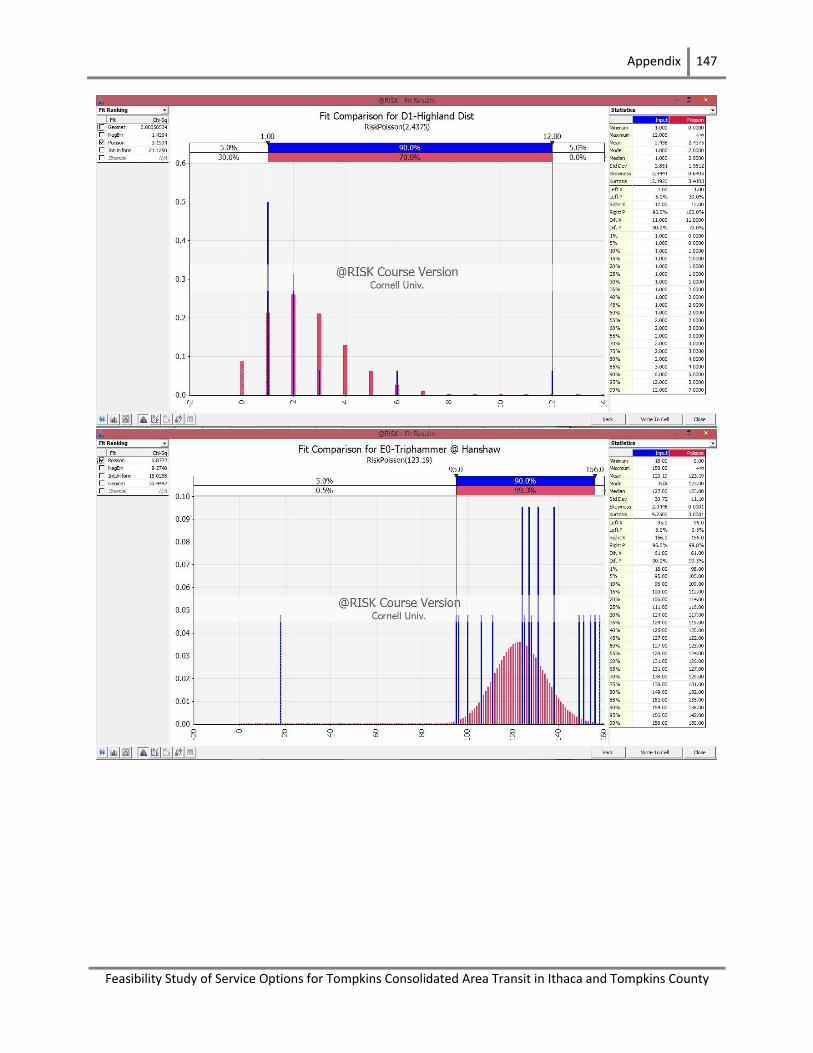
Appendix 147
Feasibility Study of Service Options for Tompkins Consolidated Area Transit in Ithaca and Tompkins County
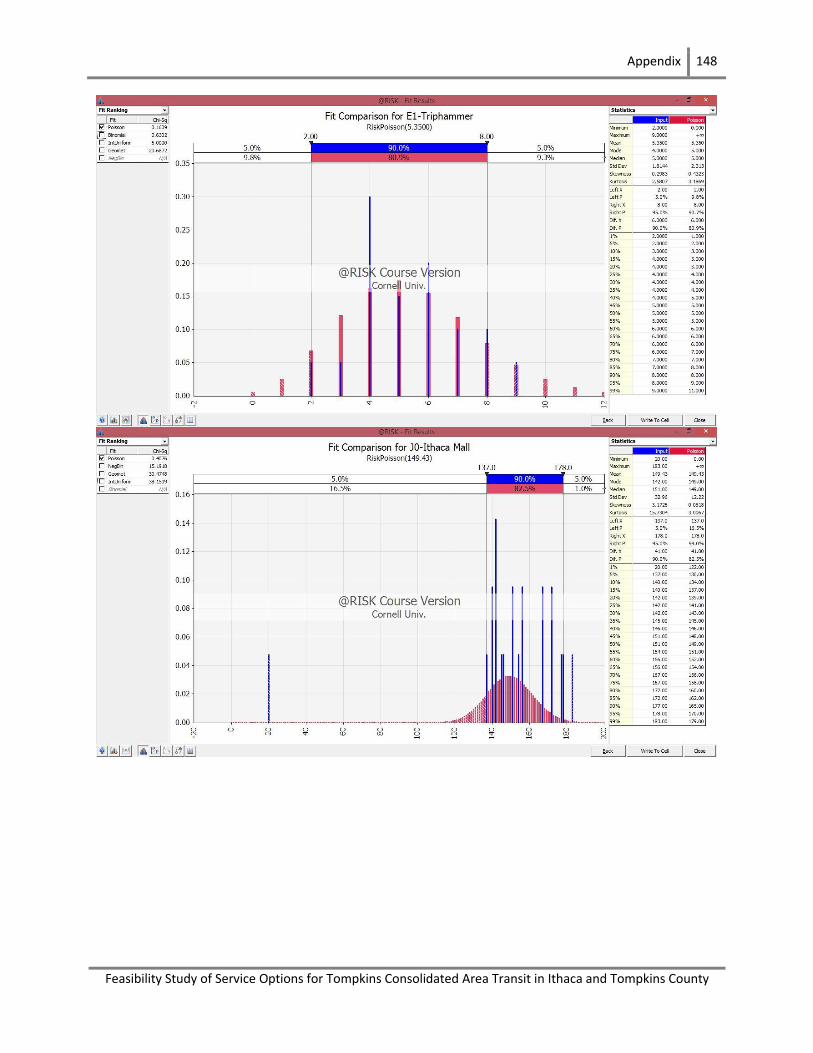
Appendix 148
Feasibility Study of Service Options for Tompkins Consolidated Area Transit in Ithaca and Tompkins County
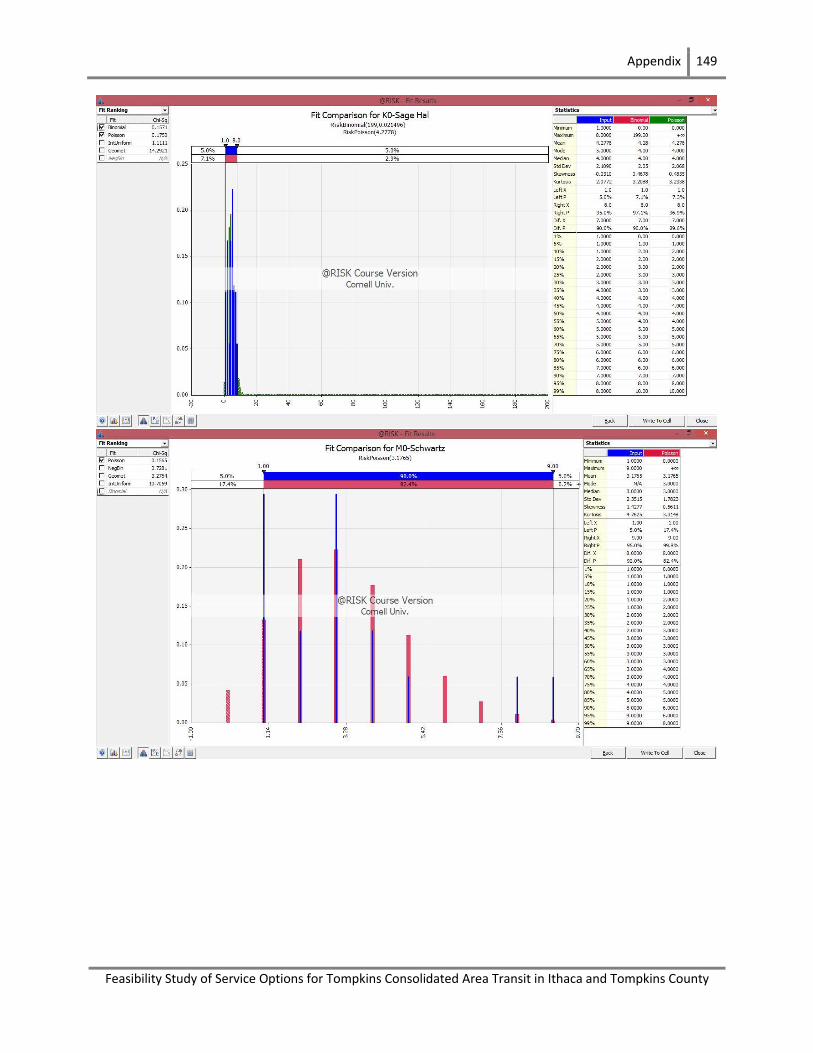
Appendix 149
Feasibility Study of Service Options for Tompkins Consolidated Area Transit in Ithaca and Tompkins County
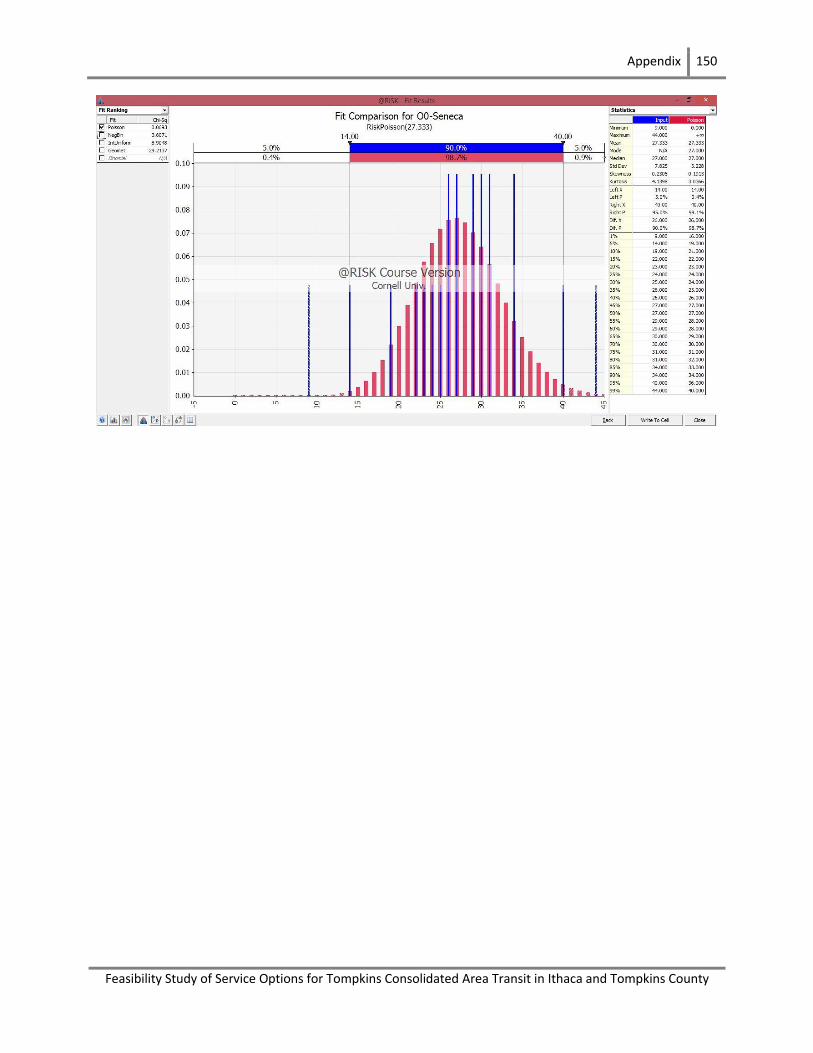
Appendix 150
Feasibility Study of Service Options for Tompkins Consolidated Area Transit in Ithaca and Tompkins County
Appendix 151
Feasibility Study of Service Options for Tompkins Consolidated Area Transit in Ithaca and Tompkins County
Appendix B. Discussion of the findings of the report between Doug Swarts, TCAT representative, and Francis Vanek, project advisor
Note: The following comments on the final report were offered by Doug Swarts from TCAT, who
represented the agency in the project, based on questions that arose at the presentation on May
9, 2014. The comments were then discussed with Francis Vanek, project advisor, in a meeting
on May 30, after the end of the project, so that they appear in an appendix rather than in the
body of the report. Hereafter, “the report” refers to information contained in the main body of
this report above, written by members of the Master of Engineering team that carried out the
research.
TCAT Route System Improvements:
Plans to cancel the route 13 and create a new route 84 on the Cornell campus raise a concern for
people who depend on route 13, including transit dependent populations on the northside of
Ithaca. These concerns are partially addressed by the explanation in the body of the report but
are further explored here.
In a real-world context, proposed changes to schedules come up against planning and politics.
One mandate of public transportation is to provide all parts of the service district with service,
which would not be met by entirely eliminating the 13.
The profit calculations comparing the 13 and 84 in the report are unrealistic in the sense that they
consider only fuel cost. The revenue figures are based on $1.49 per boarding, but this figure is
high, the average value of a boarding to TCAT is currently $1.01 given the number of reduced
cost fares collected. Also, “profit” is not the appropriate word for comparing routes, a term that
compares total revenue and cost would be more appropriate, because as a public agency the
mission of TCAT is not to be “profitable.” Instead, the public must be served in a way where
resources are used wisely. Cost is only one metric. Others include passengers boarding per hour,
passengers per mile driven, and passengers per trip. If a route fails on all metrics, then it is easy
for TCAT to discontinue it, but often decisions are more nuanced.
Another improvement that, although not considered in the report, could be applied to the
northside is some sort of flexible routing or realignment of route. A straighter route might win
more passengers if it gets them to final destinations (The commons, the Shops at Ithaca mall)
more quickly. Flexible routing and route deviation could be used judiciously to making riding
more convenient without sacrificing travel time.
Although it was not in the scope of the report, the flex routing concept could be extended to
other nearby areas on West Hill in Ithaca. Small buses capable of route deviation might serve a
hub at the West end of Ithaca and access both multi-family housing and residential
neighborhoods. A proposed road to be built by the Town of Ithaca connecting Rt.79 to the
hospital might help both fixed route busing such as the 14 and 20 and flex-route busing.
The body of the report treats the launch of the proposed route 84 and the use of articulated buses
separately, but actually the two topics can be linked. The 84 is proposed as a way to address
Appendix 152
Feasibility Study of Service Options for Tompkins Consolidated Area Transit in Ithaca and Tompkins County
denied boardings in the mornings on north campus. Articulated buses, however, might address
that need without needing to move resources from northside to campus.
Although the idea of a North-Central-Collegetown service in the morning peak is useful, the
addition of another bus route number 84 to the very large list works against the goal of
simplifying the overall roster of TCAT routes. Instead, an existing route might be short-turned
in campus in the mornings so as to avoid adding another route number.
Use of Google Transit is generally desirable, but the report does not consider the implementation
and ongoing maintenance cost of participating in the Google system. Although Google transit is
free, it is not free of charge to TCAT to participate in this service. TCAT is, however, planning
to join Google Transit as part of its larger ramping up of real-time passenger information, with a
likely launch date sometime in 2015.
The Ride14850 bus schedule app mentioned in the report does not belong to TCAT. It was
developed by a private app developer, with the prior knowledge of TCAT but without official
endorsement. The developer takes publicly available data from the TCAT website to create the
app and make schedule information available to the public, however TCAT is not responsible for
its veracity.
The proposal to replace “Inbound/Outbound” with compass directions has merit but also may
create ambiguity. A stop may be served by routes that are N/S and those that are E/W. A
northbound route may at times travel east or west. A related problem is that some stops in the
network have the same name in both directions, e.g., College & Mitchell northbound or
southbound, while others have different names but are effectively the same paired stop, e.g.,
Statler and Sage. There may not be an ideal solution.
Emissions Reductions:
Findings in this part of the report are generally consistent with TCAT’s own views on the subject.
The report finds that Hydrogen Fuel Cell are not economically feasible, although the most
environmentally friendly. One factor not considered in the report is the role of Department of
Energy financial support for capital cost of hydrogen buses, which in fact will help to deliver a
hydrogen bus to TCAT sometime in 2015, according to plans. Based on currently available data,
and depending on assumptions, conversion to B20 biodiesel would be moderately better for the
environment and be cheaper in terms of fuel cost than, for example, hydrogen. However, the
gains are limited, since the fuel is still 80% petro-diesel. Furthermore, new information currently
arriving suggests that when biofuels are considered in the broadest possible context, they may
not decrease CO2 emissions overall. So TCAT might proceed cautiously: adopt B20 based on
likely but not certain CO2 benefits, as well as benefits for the agricultural sector, or decide to
wait until the CO2 debate is better resolved. Biodiesel made from waste bio-matter streams, for
example from the Ithaca Area Waste Water Treatment Facility, although not considered in the
report, would be a more certain ecological benefit since they are not derived directly from crops.
Appendix 153
Feasibility Study of Service Options for Tompkins Consolidated Area Transit in Ithaca and Tompkins County
Buses with a High Level of Service (BHLS):
BHLS is defined as an option mid-way between regular bus service and BRT. The report
proposes a BHLS service that combines the current Rt. 30 and Rt. 15, but with limited stops.
This might be sensible, as long as the southside neighborhood and Titus Towers continues to be
served somehow. Although the report does not mention it, TCAT in fact operated the Route 28
service, which provided direct service from the Cornell campus to southwest office park
businesses such as Wegmans. The Rt.28 was discontinued in 2010 in order to provide more
resources elsewhere.
According to the report, mandatory rear-door exiting should reduce dwell time by 1.3 seconds,
but it is difficult to enforce under current conditions, for example when the aisle is crowded
with standees, or in the case of wheelchairs that must enter and exit by the back. Although it was
not included in the report, it would interesting to estimate the time savings possible from a
voluntary system where passengers alight from the rear door whenever conditions allow.
The BHLS analysis chose to focus on dwell time, reducing the number of stops, and realigning
the route. It would have been interesting to also study the time benefits of signal prioritization
and off-board fare collection, as well as the potential new ridership that might be realized with
increased service, in addition to riders shifting from other routes. Regarding signal priority, both
the city engineering department and emergency services (fire, rescue, police) are supportive of
this change if it can be funded.
The proposed BHLS would result in duplication of service along the current Rt.30 alignment
since the 30 provides service at each stop while the BHLS provides a duplicative express service.
Therefore, it might be advantageous to lengthen the Rt.30 headway to reflect the fact that the
new route will take some of the ridership.
Bus Rapid Transit (BRT):
Regarding off-board Fare payment, more work can be done to explain how proof of payment
(POP) would work. Some questions include the verification of fare payments, the person
responsible for checking compliance, and the enforcement of monetary fines that result from
unpaid fares. The costs of off-board fare payment devices may be unrealistically low. TCAT’s
own ITS strategic plan identifies $172k in capital costs for “several” vending kiosks for the
system, so this amount would likely not be enough for each station along the BRT route, as well
as $14k operating and maintenance per year.
In some cases, the cost in time and burden to collect a fare is such a large fraction of the fare’s
value that it is questionable to spend the resources. In these situations, a fare-free system could
be studied, such as the one seen in Buffalo or Portland downtown business districts. On the
other hand, at present a large fraction of TCAT’s ridership pays using passes or swipe cards, so
these approaches may be fairly efficient in terms of the total value of the fare allocated to the
direct cost of collecting the fare.
Appendix 154
Feasibility Study of Service Options for Tompkins Consolidated Area Transit in Ithaca and Tompkins County
Off-board fare collection can be done using an enclosure where the rider is confirmed to enter at
a turnstile, waits for the bus, and then boards without further examination when the bus arrives,
as is done in Curitiba or Bogota. However, this practice is capital intensive and is therefore
reserved for larger cities, unless possibly for some of the busiest stops in the TCAT system.
Otherwise, it is less expensive and complex to allow passengers to buy fares from an off-board
device, board the bus without examination, and then wait for onboard inspection to verify that
the fares have been paid. Note that this system is in widespread use in other countries but may
encounter cultural obstacles or those of expectations in the U.S.
The evaluation of Level Platform Boarding may have had some cost figures that are
unrealistically low. For instance, the platform needs to be a depth greater than 3 feet to be ADA-
compliant (5 ft minimum).
For branding, while it is reasonable to assume some level of increase in ridership will result, the
15-20% ridership increase projection in the report is not backed up with a specific location and is
somewhat speculative. Also, Table 28 leaves out some important stops but presumably
important, high ridership stops such as Risley/Balch would also be considered.
Regarding express BRT service (and BHLS also), a neighborhood will be reluctant to accept the
impact of a service passing through without also having access in the form of stops. In the case
of Cayuga Heights, the only road on which a non-stop service makes sense is Triphammer Rd,
and then only if the BRT (or BHLS) service makes a stops at the community corners (junction
Triphammer and Hanshaw).
Stops: 7 proposed stops.
Articulated Buses:
The case for articulated buses could be further made by considering that back-up buses are
currently used to accommodate peak-hour loads, meaning that one 40’ standard bus will follow
close behind another. This practice is double the labor cost and nearly double the fuel cost of a
standard bus, but was not factored into the analysis.
One question that arises with the use of the number of riders left waiting a stop when the bus is
full is whether the riders wanted that particular bus. For instance, a 30 bus may have left one or
more riders at a stop when full, yet the driver has no way to tell whether the riders wanted the 30
or e.g., and 81 bus instead.
(No comments offered about the simulation modeling chapter.)