Embed Size (px)
Citation preview

MINISTRY OF PUBLIC WORKS AND TRANSPORT
PERFORMANCE MONITORING OF
THE NEC-ADB PACAKAGE I TRIAL AND GRAVEL ROADS
SEACAP 17.02
FINAL REPORT JUNE 2009

PERFORMANCE MONITORING
OF THE NEC-ADB PACAKAGE I TRIAL AND GRAVEL ROADS
SEACAP 17.02
FINAL REPORT June 2009
Copyright LTEC Limited June 2009 This report which has been prepared for SEACAP and the Department of Roads, MPWT, is unpublished and should not be referred to in any other document or publication without the permission of SEACAP or MPWT

SEACAP 17.02Final Report
LTEC i June 2009
CONTENTS
1 Introduction 1
1.1 The Overall SEACAP Context 1 1.2 Report Objectives 1
2 Project Outline 1
2.1 Background 1 2.2 SEACAP 17.02 Project Objectives 2 2.3 Contractual Arrangements 2 2.4 Project Mobilisation 2 2.5 Summary of Work Undertaken 3
3 Task Groups 4
3.1 Task Group 1: Trials Monitoring 4 3.2 Task Group 2: Gravel Assessment Survey 5 3.3 Task Group 3: Data Management and Analysis 5
3.3.1 Review and Modify Database 5 3.3.2 Data Analysis 6
4 Trials Monitoring Discussion 10
4.1 General 10 4.2 Unsealed gravel and natural surface trials 10 4.3 Sealed flexible pavements 10 4.4 Hand-packed Stone 11 4.5 Geocells 12 4.6 Concrete blocks 13 4.7 Bamboo reinforced concrete 14
5 Gravel Assessment Programme Discussion 15
5.1 General 15 5.2 Road Geometry 15 5.3 Gravel loss 16 5.4 Road shape 17 5.5 Erosion 18
6 Conclusions 19
6.1 Trials Condition Monitoring 19 6.2 The LGAP Survey 19
Appendix A: Numeric Codes for visual assessment

SEACAP 17.02 Final Report
LTEC ii June 2009
ABBREVIATIONS & ACRONYMS
ADT Average Daily Traffic
ASEAN Association of South East Asian Nations
DBM Dry Bound Macadam
DBST Double Bituminous Surface Treatment
DPWT Department of Public Works and Transport (Province Level )
DCP Dynamic Cone Penetrometer
DfID Department for International Development
DoR Department of Roads
EADT Equivalent Average Daily Traffic
ENS Engineered Natural Surface
esa equivalent standard axles
GSAS Gravel Spot Assessment Survey
gTKP global Transport Knowledge Partnership
HQ Headquarters
ILO International Labour Organisation
Km kilometre
LRD Local Roads Division (DoR)
LVRR Low Volume Rural Road
m metre(s)
MPWT Ministry of Public Works and Transport
mm Millimetre(s)
MERLIN Machine for Evaluating Roughness using Low-cost INstrumentation
MoU Memorandum of Understanding
NUOL National University of Lao
OPWT Office of Public Works and Transport (District Level)
ORN Overseas Road Note
PAD Personnel and Administration Division (MPWT)
PTD Planning and Technical Division (DoR)
QA Quality Assurance
Ref. Reference
RRGAP Rural Road Gravel Assessment Programme (Vietnam)
SCC SEACAP Coordinating Committee
SEACAP South East Asia Community Access Programme
SIDA Swedish International Developments Cooperation Agency
SOE State Owned Enterprise
TRL Transport Research Laboratory

SEACAP 17.02Final Report
LTEC iii June 2009
UK United Kingdom
VN Vietnam
VOCs Vehicle Operating Costs
VPD Vehicles per day
WBM Water Bound Macadam
WLC Whole Life Costs

SEACAP 17.02 Final Report
LTEC 1 March 2009
1 Introduction
1.1 The Overall SEACAP Context
The SEACAP 17.02 project is part of the wider South East Asia Community Access Programme (SEACAP), whose strategic theme is ‘livelihoods of poor and vulnerable people in SE Asia - improved sustainability’. The core SEACAP concept relevant to infrastructure was defined at the SEACAP Practitioners Meeting (SPM) in Phnom Penh in June 2006 as “maximizing input of local resources; which are materials, labour, enterprise and ingenuity which ensures affordability”.
SEACAP builds on existing knowledge, but also provides a research resource for filling gaps in knowledge, particularly in the local environment. Mainstreaming ensures that these solutions are accepted, adopted and applied on a large scale. This involves a process of dissemination through participatory workshops, guideline documents, demonstrations, training and implementation.
SEACAP 17.02 will contribute to this overall objective through enhancing knowledge on the performance of a range of rural road pavements and surfaces. This knowledge will encourage a more sustainable approach to the provision and maintenance of rural access through selection and application of the most appropriate technology within the framework of the newly proposed LVRR Standards and Specifications.
1.2 Report Objectives
This document serves as final report on the SEACAP 17.02 programme in which the project activities are formally presented along with the recovered and analysed information. Comments are made on issues that have arisen during the project and recommendations are made as to the way forward.
2 Project Outline
2.1 Background
Rural poverty alleviation is a major objective for the Government of the Lao PDR within the next 10 years. A key element in the strategy to eliminate rural poverty is the development and upgrading of the rural infrastructure through the most cost-effective means. The Ministry of Public Works and Transport recognised that the effective application of up-to date rural road research would be of significant advantage in meeting the considerable technical and resource challenges posed by the need to significantly enhance Lao’s rural road network. High on the priorities of applied research singled out by the DoR within the Ministry was the need to identify suitable rural road pavement and surfacing solutions. To this end the SEACAP 17 project designed and constructed a series of trial sections along rural access roads being upgraded as part of the ADB funded section of the Northern Economic Corridor (NEC) within the Huay Xai district in Bokeo Province1
1 Roughton International, 2008. Local Resource Solutions to Problematic Rural Road Access in Lao (PDR), SEACAP 17 Rural Access Roads on Route No.3, Module 2 – Completion of Construction Report (Draft)

SEACAP 17.02Final Report
LTEC 2 June 2009
The construction these 12 trials sections and associated 7 gravel control sections was completed in August 2007. This was followed by an initial as–built condition survey which was also intended to provide the base-level data for a future condition monitoring programme.
2.2 SEACAP 17.02 Project Objectives
The development of new pavement or surfacing options requires that their performance be investigated within the road environment constraints within which they are designed to operate. Their deterioration characteristics need to be identified in order to establish both their general suitability and their Whole Life Costs and to define the limits of their appropriate usage. The regular monitoring of appropriately selected road sections in conjunction with assessments of the governing road environments is an essential part of this process.
The SEACAP 17.02 project was therefore a logical and necessary continuation of the main SEACAP 17 programme and was concerned primarily with the collection and analysis of pavement performance information from trial road sections. SEACAP 17 is a one-off data collection and assessment exercise that hopefully will be repeated with sufficient regularity so as to enable valuable lessons learnt to contribute to the sustainable development of the Lao PDR rural infrastructure.
In addition to the monitoring of the SEACAP 17 trials roads this project was also required to undertake a Lao Gravel Assessment Programme (LGAP) which, as a cut-down version of the successful SEACAP 4 (RRGAP) in Vietnam, sought to collect and analyse information on the performance of a number of unsealed roads within the NEC corridor.
2.3 Contractual Arrangements
In response to Requests for Proposals from Crown Agents for Overseas Governments and Administrations Ltd (acting as Contracting Agent for DfID), LTEC provided technical and financial proposals for carrying out the project and subsequently entered into a contractual arrangement with Crown Agents for SEACAP 17.02, signed on 20th January 2009.
LTEC is formally supported in its undertaking of this project by an associate organisation, OtB Engineering (International) Ltd, who are supplying technical advice through the services of Dr J R Cook.
2.4 Project Mobilisation
The project team was mobilised with the following key members:
• Bounta Meksavanh (LTEC) –Team Leader • Boupan (LTEC) – Road Engineer and Site Manager • Kiatiphan (LTEC) – IT Specialist • Dr J R Cook (OtB) – Technical Advisor
The programme was effectively initiated with the assembly and mobilisation of the fieldwork teams to Huay Xai on 17th February 2009, where a site office with communication and computing facilities has been established. An administration support base was also established within the LTEC offices in Vientiane.

SEACAP 17.02Final Report
LTEC 3 June 2009
TASK GROUP I
Trials Monitoring
TASK GROUP 2Gravel Spot Assessment
Survey (GSAS)
Task 1.1Review data collection
procedures
Task 1.4Training and work programme
Task 2.1Draft GSAS procedures
Task 2.5Data collection
Task 3.1Review existing database
TASK GROUP 3
Data Management
Task 3.3Data input and review
Task 3.4Data analysis
Task 3.5Recommendations
TASK GROUP 4 Reporting &
Dissemination
Task 4.1Inception report
Task 4.2Progress reporting
Task 4.3Final report, paper and ppt
presentation
Task 4.4National & regional
dissemination
Task 1.3Identify monitoring sites
Task 2.4Training and work
programme
Task 2.3Identify GSAS roads
Task 3.2Modify database
Task 1.5Data collection
Task 1.6QA data sets
Task 2.6QA GSAS data
Task 1.2Mobilisation of essential test
equipment
Task 2.2Mobilisation of essential
test equipment
2.5 Summary of Work Undertaken
The work undertaken during the SEACAP 17.02 was planned and executed within a framework of Task groups as shown in Figure 2.1
Figure 2.1, SEACAP 17.02 Task Groups

SEACAP 17.02Final Report
LTEC 4 June 2009
New Ref Old Ref From ToPavement Type Start (km) End (km) Length (m)
1011 1-1 B.Phi Mon Sine B.Chom Keo Gravel 0+600 0+700 1001013 1-3 B.Chan Sa Vang B.Si Pho Sai Gravel 1+270 1+370 100
Gravel 0+450 0+550 100Packed Stone 0+700 0+800 100Packed Stone 0+940 1+040 100Single Otta Seal 0+150 0+250 100Double Otta Seal 0+415 0+515 100Engineered Nat. Surface 0+800 0+900 100Mortared Stone 1+200 1+300 100Mortared Stone 1+300 1+400 100Gravel 1+520 1+720 200
1033 3-3 B.Nam Tin B.Phou Vane Kao Gravel 1+650 1+750 100Paving Blocks 0+950 1+050 100Paving Blocks 1+250 1+350 100Bamboo Concrete (125mm) 2+000 2+100 100Bamboo Concrete (150mm) 2+350 2+450 100Geocells (75mm) 2+800 2+900 100Geocells (100mm) 2+950 3+050 100Geocells 3+050 3+125 75Gravel 3+175 3+275 100Gravel 4+550 4+650 100Sand Seal 1+800 1+900 100Sand Seal 2+000 2+100 100Gravel 2+225 2+325 100
Total 2,475
5
8
Monitored Lengths
1032 B.Bolek B.Nam Tong Neua
Roads
2
3-2
108 B.Chom Chouk B.Nam Kham Neua
105 Gam Mining B.Houay Sala
102 B.Nam Phou Kang B.Nam Sa Mok Neua
3 Task Groups
3.1 Task Group 1: Trials Monitoring
The main fieldwork for the trials monitoring was preceded by a short review and planning period.
Following a review of data collection procedures, most of the as-built survey procedures were adopted into the current survey with the exception of the Sand Patch Test and the photograph-based visual survey. This latter approach while very visual and useful as demonstration of road condition does not lend itself to scientific analysis without significant secondary interpretation. A more numeric coded system was adopted that was derived from that used on the SEACAP trial programme in Vietnam2. Standard Sheets and Codes are included within the SC17.02 Project Inception report.
The trials monitoring survey followed-on from an initial training period and was completed during period 26th February to 27th March 2009. A total of 2.75km of trial section in 24 lengths on 7 trial roads were surveyed, listed in Table 2.1.
Table 2.1 Extent of Condition Monitoring
The following data sets were collected.
• Visual survey 2 Intech-TRL, 2007. Rural Road Pavement Construction and Supervision Guidelines. SEACAP 1 report for the MoT, Vietnam

SEACAP 17.02Final Report
LTEC 5 June 2009
Ref From To
1011 0+000 2+183 2,183 81013 0+600 3+487 2,887 8102 0+000 5+350 5,350 10
1032 0+000 6+880 6,880 131033 0+000 2+000 2,000 4105 0+000 6+093 6,093 11108 0+000 2+770 2,770 7
Sub-Total 61
1013A 0+000 0+600 600 3102A 0+000 0+800 800 3105A 0+000 3+000 3,000 8108A 0+000 0+500 500 2
Sub-Total 16
201 0+000 12+600 12,600 25202 0+000 4+126 4,126 10
Sub-Total 35Overall Total 112
Package II
Roads Number of GSA Sites Length (km)
Package I SC17 Trial Roads
Bokeo Non-Trial
• Cross sections • DCP • Roughness (MERLIN) • Mini FWD • Rut depth
3.2 Task Group 2: Gravel Assessment Survey
The contract called for a survey of the condition of NEC gravel access roads by means of “spot” assessments. This was taken to mean a survey similar in nature to SEACAP 4 carried out in Vietnam as the Rural Road Gravel Assessment Programme (RRGAP). The ToR called for a survey of a minimum of 100 sites.
The data collection procedures and forms and associated codes were derived from the SEACAP 4 project and the subsequent modification used on the recent SEACAP 19 Engineered Natural Surface roads survey in Cambodia.
The LGAP survey was completed during the period 26th March – 8th April 2009. Table 2.2 lists the extent of this survey.
Table 2.2 Gravel Spot Assessment Programme
The survey of 16 non-NEC unsealed road sites was included for control and comparison purposes.
3.3 Task Group 3: Data Management and Analysis
3.3.1 Review and Modify Database
The ToR called for recovered data to be entered into the existing SEACAP 17 database, a current version of which was held by LTEC as the local consultants involved in that project.
An initial review showed that the existing database in ACCESS format contains two principal data files; one relating to the trial roads and the second relating to the trial sections. Additional files

SEACAP 17.02Final Report
LTEC 6 June 2009
contain definitions used in these two principal files. Most of the monitoring data are contained in linked external files.
The review however has raised a number of issues.
1. The majority of the links to monitoring data sets were either inactive or missing:
2. The version of the database held by LTEC had the much of the monitoring information held in pdf files which were not amenable to analysis. (Files in XLS format were subsequently made available).
3. There are no visual condition data sets in numeric standard format.
4. A new files structure would be required to accommodate the LGAP data sets.
As a consequence of the above and the limited time available the following data holding structure has been set up:
1. All SC17-related data has been collected into a single folder (db-Lao-2009) on the LTEC server. This main folder contains two main sub-folders; LGAP holding all gravel assessment data files and TRIAL which holds all trial monitoring data files.
2. The LGAP folder comprises a central ACCESS file with all principal data and associated pdf or jpg files holding summarized DCP data for easy access. This DCP information is also held on DCP-specific software files (UKDCP).
3. The TRIALS folder currently holds the as-built and SDC17.02 data in separate sub-folders (SC 17.10 and SC17.02) the linkage between the data sets is shown within the SC17.02 ACCESS file. Principal data sets are held on mainly XLS files, although as with the LGAP folder the DCP data is held as pdf or jpg files.
3.3.2 Data Analysis
The ToR calls for a “updated performance and cost models for the trials and for gravel surfaced LVRR in Northern Laos”. There are a two significant issues impacting on the full compliance with this requirement.
1. The SEACAP 17.02 trials data collection will be only the second set of data collected within 18 months and consequently it will very difficult to identify trends
2. As noted previously there is no easily analysable base-line data for visual condition assessment
As a consequence the SEACAP 17.02 data was collated and assessed and analysed for any immediate issues that may be of significance to the development of a Lao LVRR cost model and comments made on the existing condition of each trial pavement type.
The LGAP analysis is a one-off assessment of the recovered data in which significant issues are highlighted and commented on.
The Trials data analysis and comment is largely based on interpretation of the visual survey data sets supported by MERLIN roughness and DCP-CBR information. For each pavement group a number of key factors have been identified that may be reasonably be able to represent road performance. These are listed in Table 2.3. These factors can then be analysed using the associated numeric codes to ascertain relative pavement deterioration. Appendix A contains a listing of all the key factor codes and related descriptions.

SEACAP 17.02Final Report
LTEC 7 June 2009
A total deterioration index is calculated by combining the deterioration of the key factors as percentage of total deterioration (ie all numeric codes at their maximum defect values). These indices are a percentage of the maximum deterioration possible for a single factor in trial section. As an example; a maximum deterioration for potholes is code “3”( >3 potholes in a 5 m block)– if every 5m block on a 100m trial section had this maximum deterioration this would equal 3x20 = 100% index. Note that 100% does not indicate a complete disintegration of the road, but rather an extremely serious pot-holed condition.
Table 2.3 Key Performance Indicators
Trial Group Indicative Factors
Concrete
Joint condition Crack extent Surface condition Potholes
Geocells Structural crack extent Cell condition Joint condition
Sealed Flexible Crack extent Ruts Potholes
Blocks e
Block condition Joint Condition Ruts Potholes
Hand Packed Stone
Block condition Joint Condition Depressions Potholes
Unsealed Erosion Ruts Potholes
The Road Condition Deterioration Index (RCDI) can be calculated for series of condition surveys over a number of years and the comparative deterioration of pavements can be plotted versus time or traffic (esa). Individual Condition Deterioration Indices (CDIs) for separate factors can be examined to identify the most significant deterioration modes.
The RCDI gives a measure of defect occurrence within a section but does not indicate whether this is an isolated or extensive problem. The associated Defect Extent Index (DEI) is a simple measure of the percentage of the road affected by any deterioration. This is done by simply noting how many of the 5m visual assessment blocks have a key defect. The combination of RCDI and DEI allows a rapid assessment for maintenance of deterioration seriousness and extent; for example
• A high RCDI and high DEI indicates a widespread serious defect problem • High RCDI but low DEI indicates a isolated serious defect • Low RCDI and high DEI indicates a minor widespread defect
The LGAP survey data has been analysed using key factors identified as important during the SEACAP 4 programme, such as gravel loss and erosion. Within the time constraints some assumptions have had to be made regarding the exact age of the gravel roads.

SEACAP 17.02Final Report
LTEC 8 June 2009
Road 24 hr esa Age (Months) esa to date
1011 0.72 20 432
1013 0.24 20 144
102 26.28 20 15768
1032 7.2 20 4320
1033 1.44 20 864
105 7.68 20 4608
108 1.68 20 1008
Road Ip P.075 R 2.00 PP PP v IC CBR(95%) Chain201 10 23 43 230 B 29202 13 38 43 494 A 291022 18 29 46 522 A 281013 11 25 63 275 F 28 3.0001013 10 27 62 270 F 27 1.9001013 10 22 51 220 B 28 0.8001032 16 17 63 272 F 30 3.4501032 18 11 71 198 F 26 5.5001032 19 15 70 285 F 27 4.3201032 18 29 64 522 F 27 2.2501032 17 16 67 272 F 27 6.435105 9 14 53 126 C 36 3.500105 10 54 40 540 A 40 4.500105 9 12 53 108 C 31 5.500105 8 11 51 88 C 40 0.700105 9 12 57 108 C 37 2.600105 8 13 54 104 C 33 0.9001011 9 18 59 162 C 38 2.0501011 9 23 57 207 B 32 0.5001033 9 11 62 99 F 35 1.7501033 9 12 62 108 F 33 0.800
Mix (108)+ 9 10 56 90 C 32
Three-day traffic counts were undertaken during the trials monitoring survey and the results of these have been analysed using the following conversion factors for esa.
Car/pick-up 0.1 Small bus 0.1 Large bus 1.5 Truck<5t 0.1 Truck>5t 3.0
Table 2.4 presents estimated traffic loading to date for the trial roads, all of which fall well within the LVRR envelope, with only road 102 showing significant traffic loading
Table 2.4 Trials Traffic
Materials information for the unsealed roads was obtained from the construction records held by the Consultant (Table 2.5). Some logical assumptions had to be made as to which borrow pits were used for particular road sections. It understood that the a mixed material (mix 108+) was used on roads 108 and 102 .
Table 2.5 Summary Gravel Borrow Pit Information

SEACAP 17.02Final Report
LTEC 9 June 2009
A: Good performance under wet and dry conditions B Good performance under wet conditions; corrugates in dry conditions C Lacks cohesion: rapid deterioration with trafiicD Good in dry conditions; slippery in wet; potholes/erosionE Poor in both wet and dry conditionsF Too coarse: erodes badly; difficult to maintainG Too fine; traffickability problems in wet and very dusty when dry
PP Vs Ic
0
200
400
600
800
1000
1200
0 10 20 30 40 50 60 70Ic (Retained on 2.36mm)
PP (I
p x
P0.0
75m
m)
A
B
C
F
D
E
G
Notes : (1) Ip = Plasticity; (2)P.075 = % material passing the 0.075mm sieve
(3) R2.00 = % material retained on the 2.00mm sieve = Ic
(4) PP = Plasticity Product (1) x (2)
The value of PP v Ic is an empirical figure used as standard assessment of gravel suitability, as shown in Figure 3.1
Figure 3.1 Gravel Suitability Assessment
The above plot indicates that only 6 out of the 22 approved materials sources fell into “good performance categories” and that the remaining materials could be described as being susceptible to rapid erosion. It should be noted however that figure 3.1 was originally derived for Southern African road environment conditions and may require some re-calibration for the higher and more intense rainfall environments of S E Asia. It nevertheless provides valuable relative comparison for gravel source assessment.

SEACAP 17.02Final Report
LTEC 10 June 2009
4 Trials Monitoring Discussion
4.1 General
The condition of the selected trial lengths is discussed in the following sections mainly with respect to the visual and MERLIN roughness surveys. The trial lengths are grouped under the principal pavement or surfacing types.
The RCD and DE indices are used to illustrate comparative deterioration. Individual deterioration indices are also given where appropriate to highlight key modes of deterioration.
4.2 Unsealed gravel and natural surface trials
A` total of 9 unsealed sections were surveyed; 8 gravel and one Engineered Natural Surface. Key condition summaries are shown on Table 4.1
Table 4.2 Unsealed Road Summary
Road Ref.
esa to date
Gradient
DEI% RCDI IRI (17.01)
IRI (17.02)
Material Assessment as per Figure 3.1
1011.01 400 11 100 41 8.28 9.07 C
1013.01 150 0 100 30 7.46 10.93 F
102.01 15,700 0 100 31 9.51 10.57 C
1032.06 4,300 4 100 15 9.01 7.82 F
1033.01 900 0 100 19 7.46 6.08 F
105.08 4,600 2 100 22 7.92 6.08 C
105.09 4,600 8 100 23 7.92 6.97 A
108.03 1,000 5 100 29 7.79 6.08 C
1032.03 4,300 0 100 16 6.02 6.32
Key points discussion points are:
1. The three worst performing gravel roads are those where the IRI roughness is also deteriorating. In the other 5 gravel roads the surface is apparently becoming smoother. This is likely to be at least part due to material characteristics.
2. All the unsealed roads show some deterioration over all the trial length (DEI=100%).
The performance of the unsealed roads is discussed further in Chapter 5.
4.3 Sealed flexible pavements
The four sealed flexible trial sections comprised 120mm sub-base of NEC gravel overlain by 150mm of crushed stone aggregate. Summary details are listed in Table 4.2.

SEACAP 17.02Final Report
LTEC 11 June 2009
Table 4.2 Flexible Pavement Summary
Road Ref.
Seal esa to date
DEI% RCDI IRI (17.01)
IRI (17.02)
Comment
1032.01 Single Otta seal 4,300 63 6 7.19 5.44 Steep gradient
1032.02 Double Otta seal 4,300 83 9 7.31 5.28
108.01 Sand seal 1,000 95 23 6.80 5.03
108.02 Sand seal 1,000 80 30 6.80 5.48
Key points discussion points are:
1. The principal deterioration mode in the Otta seals is minor widespread rutting (<20mm).
2. There was some evident localised damage to the surface of the Otta seals. It is not clear however whether this is construction defect. Figure 4.1
3. The significant decrease in roughness for the Otta Seals can be logically accounted for by the “bedding –in” of the sealing aggregate with use. Some of the aggregate appeared significantly oversize which also enhance initial roughness.
4. The principal deterioration on the sand seal sections is the occurrence of shallow potholes associated with localise stripping of the seal (CDI 40-50%). Figure 4.2
5. Secondary deterioration forms are minor rutting (CDI<10% ) and seal cracking (CDI<30%).
6. The defects for this group are a consequence of surface deterioration rather than structural problems.
4.4 Hand-packed Stone
Two hand-packed stone options were constructed one mortared and one non-mortared, over a gravel sub-base, Table 4.3-
Figure 4.1 Defects in Otta Seal – possibly construction related
Figure 4.1 Seal erosion and shallow potholes. Road 1032.01

SEACAP 17.02Final Report
LTEC 12 June 2009
Table 4.3 Hand-Packed Stone Summary
Road Ref.
Description esa to date
DEI% RCDI IRI (17.01)
IRI (17.02)
Comment
102.02 Non-mortared 15,700 100 20 6.59 9.96
102.03 Non-mortared 15,700 100 30 6.59 10.56
1032.04 Mortared 4,300 100 15 14.28 15.65
1032.05 Mortared 4,300 98 22 11.82 13.36 Steep Gradient
Key points discussion points are:
1. The visual appearance of both these option is poor and the evident roughness of surface is reflected in the high IRI figures. In the case of the non-mortared option the surface has evidently deteriorated significantly since construction. Figure 4.3
2. The non-mortared option shows a significant DCI of 40% surface condition with stone and inter-stone matrix conditions between 20-30% DCI.
3. The mortared option shows a similar figure for surface condition and matrix but a much better figure for stone condition (10% DCI), which may either reflect better selection of stone or that the mortared matrix is giving better support to the larger stones.
4. It was evident that because of the roughness of these options the local two-wheeled traffic was using the gravel shoulder rather than the carriageway. The result is a significant deterioration of the shoulder and an undercutting of the carriageway edge. Figure 4.4
4.5 Geocells
Three thickness of geocell were constructed over a 125mm thickness of gravel sub-base, (Table 4.4)
Table 4.4 Geocell Summary
Road Ref.
Description esa to date
DEI% RCDI IRI (17.01)
IRI (17.02)
Comment
105.05 75mm 4,600 98 16 8.12 5.68
105.06 100mm 4.600 100 22 8.12 5.03
105.07 150mm 4.600 100 23 8.12 5.68 Steep gradient
Figure 4.4 Traffic using shoulder rather than rough carriageway
Figure 4.3 Rough stone surface

SEACAP 17.02Final Report
LTEC 13 June 2009
Key points discussion points are:
1. These options were in generally good condition and the high DEI figure is largely a reflection of the widespread deterioration of the thin surface screed. It is likely that in future analyses the importance of this factor will be down-graded.
2. There is some possible evidence of deterioration at the concrete-membrane joints (DCI 20-30%). It is unclear yet whether this is significant issue or not. Figure 4.5
3. There was no evidence of structural cracking through cells. Figure 4.6
4.6 Concrete blocks
This option comprised an unsealed surface of unsealed sand jointed blocks over a gravel sub-base. sub-base, Table 4.5
Table 4.5
Road Ref. Description esa to
date DEI% RCDI IRI (17.01)
IRI (17.02) Comment
105.01 Non-mortared 4,600 100 15 9.05 6.97 Gravel sub-base
105.02 Non-mortared 4,600 98 13 9.05 5.03 Gravel sub-base
Key points discussion points are:
1. The principal deterioration issue is erosion of the unsealed sand joints - with an individual DCI of 30%, Figures 4.7 and 4.8
2. There is however a surprisingly high figure for cracked or broken blocks (DCI 15-20%). This is high in comparison with similar pavements in Vietnam which would suggest that the Bokeo concrete blocks could be below specification as regards strength.
3. The decrease in roughness probably reflects a bedding-down effect on the blocks in the sand bedding layer.
Figure 4.5 Erosion adjacent to cell boundaries
Figure 4.6 Cracks in surface screed following cell boundaries

SEACAP 17.02Final Report
LTEC 14 June 2009
4.7 Bamboo reinforced concrete
Two thickness of bamboo reinforced concrete were constructed over a 125mm thick gravel sub-base, Table 4.6
Table 4.6 Concrete Summary
Road Ref. Description esa to
date DEI% RCDI Seals CDI
IRI (17.01)
IRI (17.02) Comment
105.03 125mm 4,600 10 2 40 11.67 9.07
105.04 150mm 4,600 5 4 41 11.67 7.62
Key points discussion points are:
1. The pavement blocks are performing satisfactorily with only isolated cracks – typically at the edge of blocks. Experience from elsewhere indicates that erosion or soaking of the gravel sub-base can sometimes lead to cracking under load. Figure 4.8
2. The inter-block seal condition is shown separately as a significant deterioration factor that should be dealt with easily by routine maintenance.
Figure 4.7 Grass growing within joints may loosen blocks
Figure 4.6 Eroded badly spaced joints. One cracked block
Figure 4.8 Typical corner edge crack in concrete slab

SEACAP 17.02Final Report
LTEC 15 June 2009
Road Width (Including shoulders)
0
10
20
30
40
50
60
70
80
90
100
3 3.5 4 4.5 5 5.5 6
Width (m)
Cum
ulat
ive
%
5 Gravel Assessment Programme Discussion
5.1 General
The Lao Gravel Assessment Programme (LGAP) survey, although much smaller size and extent than the RRGAP in Vietnam, does give an opportunity to analyse unsealed road data within reasonably uniform general environment. This analysis has concentrated on key issues raised by the RRGAP, namely gravel loss and erosion, but also has focussed on how these recently constructed roads relate to the proposed LVRR Standards and Specifications.
5.2 Road Geometry
The new LVRR Geometric standards require a minimum road width (carriageway + shoulders) of 4.5m for a 2.5m wide carriageway and 5.5m for a 3.5m wide carriageway. The latter is recommended where vehicles larger than a Kao Lao are likely to use the road. A minimum shoulder with of 1.0m is recommended unless significant amounts mixed traffic require a wider 1.5m shoulder on safety grounds.
The survey indicated a significant variation in road width even with this one group of roads. The carriageway varied from 2.3m to 4.0m, with shoulders mainly from 0.5 to 0.7m. The roads were constructed at gradients from 0-15%.
It is likely that with, one possible exception, all the surveyed roads could fall within the lower category of road allowing minimum 4.5m road width. Compared to the proposed standards the carriageway widths were largely compliant with the standards provided the smaller vehicle option was used.
The overall road widths were however below standard at about 40% of the sites, largely due to the narrow shoulders, Figure 5.1. Shoulders below 1.0m are not permitted in the proposed LVRR standards.
Figure 5.1 Surveyed Road Widths

SEACAP 17.02Final Report
LTEC 16 June 2009
Gravel Loss - Gradient
0
10
20
30
40
50
60
70
80
90
100
1 10 100
Loss(mm/yr)
Cum
ulat
ive
%
>6%2-6%0-2%Poly. (>6%)Poly. (2-6%)Poly. (0-2%)
5.3 Gravel loss
The RRGAP study in Vietnam indicated that gravel losses in excess of 20mm/yr is unsustainable in an environment where periodic grading and re-gravelling were not established activities. It is clear from observation and from the survey data that little or no effective maintenance is being undertaken on the LGAP roads. Hence the 20mm/yr figure is reasonable to assume as a boundary of unsustainability for these roads.
The gravel loss figure for the LGAP roads were assessed with particular attention focussed on the 6% limit imposed by the LVRR Standards. The analysis was based on the following assumptions
• The road were constructed to a 200mm gravel thickness • The roads have an average age of 20 months • The rainfall is reasonable uniform over the area of 1500-2000m/yr
The gravel losses were calculated for 3 different gradient ranges 0-2%; 2.1-6%; and >6%, as shown in Figure 2.2.
Figure 5.2 LGAP Gravel Loss
The following key points arise out of this analysis:
1. The gravel loss figures for 0-2 and 2-6% are reasonably similar, with just over 50% having an unsustainable loss of greater than 20mm/yr.
2. However, 70% of roads with less than 6% gradient show gravel losses less than 30mm/yr which would indicate that with at least some effective shape maintenance these roads could be sustainable.
3. Roads with greater than 6% gradient show a significant increase in gravel loss, with around 75% having a loss of greater than 20mm/yr and 60% greater than 30mm/yr. These sections would not be considered sustainable.

SEACAP 17.02Final Report
LTEC 17 June 2009
5.4 Road shape
A related analysis looked at the existing shape and loss of camber on the LGAP roads. Table 5.1 summarises actual camber measurements for all the NEC roads and Table 5.2 shows loss of shape in relation to gradient, including the non NEC roads.
Table 5.1 Measured Crossfall
Measured Crossfall
Percentage of roads within this group
0-2% 41%
2.1-4% 34%
4.1-7% 25%
Table 5.2 Cross-sectional Shape
Gradient : NEC Sections Code
NEC Sections
(%)
Non NEC (%) >6% 2-6% 0-2%
1 As built 0 0 0 0 0
2 Slight deterioration of camber 91 25 70 95 100
3 Flat 0 25 0 0 0
4 Uneven 9 31 30 5 0
5 Dished - Bowl shaped 0 19 0 0 0
Key points to note are:
1. On the assumption that the roads were constructed to the specified 6-7% camber, then after just under 2 years all road sections are now below the required shape requirements.
2. On high gradients 30% of the NEC roads are significantly below shape, Figure 5.3
3. 75% of the non-NEC road sites were recorded as having a cross sectional shape incapable of effectively shedding surface water. The implication is that there is no effective maintenance procedure in place to maintain shape
Figure 5.3 Eroded gravel on steep section of NEC package II road 201. Shape prevents run-off into well constructed drain

SEACAP 17.02Final Report
LTEC 18 June 2009
5.5 Erosion
The visual assessments of surface erosion of the carriageway and shoulders (Table 5.3) confirm the impact of gradient on unsealed surface condition. It is worth noting that even on very low gradient section there are very few sections showing no evidence of erosion.
Table 5.3 Carriageway and Shoulder Erosion
Gradient Carriageway Gradient Shoulders Code Erosion Effect
>6% 2-6% 0-2% >6% 2-6% 0-2%
1 None 0 2 3 13 9 9 2 Rills <15mm deep 43 91 97 65 82 91 3 Rills 15-50 mm deep 57 7 0 22 9 0

SEACAP 17.02Final Report
LTEC 19 June 2009
6 Conclusions
6.1 Trials Condition Monitoring
The interim survey of trials road condition has raised some important issues regarding the selection and maintenance of LVRR pavement and surfacing options in Lao, namely
1. The unsealed block option with sand joints is not likely to be a sustainable option unless regular maintenance is undertaken on the joints. Mortared joints or some form of resistant bitumen-sand mix are likely to be more sustainable options. More stringent compliance with block strength requirements may be required in future use of this option.
2. The hand packed stone and mortared stone options have not been successful. Indications are that problems during construction may have contributed to their current deteriorating condition.
3. The sand sealed option is showing signs of serious deterioration and without immediate maintenance this could escalate rapidly.
4. The geocell options are performing well, although the deterioration of the surface screed and joint areas should be monitored for indication of any more serious consequential defects.
5. The concrete options require ongoing maintenance to the inter-slab seals, otherwise only occasion localised cracking is evident.
The SC17.02 survey has confirmed the need for ongoing regular monitoring of these sites if any meaningful outcomes are to be achieved from the initial outlay on this programme. Much more time needs to given to combining g the SC17.01 and SC17.02 data sets into a comprehensive working database capable of effective analysis.
6.2 The LGAP Survey
Even the limited analysis undertaken on this data set has been able to highlight some important issues:
1. The 6% gradient cut-off for gravel use in the LVRR Standards and Specifications has been shown to be logical.
2. Current unsealed road designs are below LVRR Standard as regards roadway width.
3. Unsealed gravel roads built with suitable materials can be a sustainable option if combined with some minimum road shape maintenance.
4. The combination of unsealed roads at gradients less than 6% and Spot Improvements on sections >6% can provide a Lao with major tool to address their poverty alleviation aims through improved access

SEACAP 17 Inception Report
LTEC 20 March 2009
PERFORMANCE MONITORING
OF THE NEC-ADB PACAKAGE I TRIAL AND GRAVEL ROADS
SEACAP 17.02
APPENDIX A
NUMERIC CODES FOR VISUAL ASSESSMENT

SEACAP 17.02 Inception Report
LTEC 21 March 2009
Concrete Pavements
Defect Database scale Notes
Joint Seal 0 1 2 3 4 5
Sound 0-5% cracked or missing 5-10% cracked or missing 10-25% cracked or missing 25-50% cracked or missing >50% cracked or missing
This factor calculated as a separate CDI
Crack Extent
0 1 2 3
No cracks 0-10% length or total area < 1m2 10 – 50% length or total area 1-5m2 >50% length or total area > 5m2
A score of 100 means more than 100m2 of pavement is cracked along the section. This represents about 30% of every 5m subsection.
Surface Condition
0 1 2
Good Crazed cracking Surface stripping- aggregate exposed
Potholes 0 1 2 3
None 1 pothole in 5 metre block 2 – 3 potholes >3 potholes
A score of 15 is a warning level. One pothole every 5 metres is serious therefore a score >33is serious
Geocells
Defect Database scale Notes
Structural Crack Extent
0 1 2 3
No cracks 0-10% length or total area < 1m2 10 – 50% length or total area 1-5m2 >50% length or total area > 5m2
This excludes cracking in surface screed
Cell Condition
0 1 2 3 4 5
Solid – no deterioration Minor erosion at joint edges General erosion at joints Maximum 0-10% aggregate exposed 10-50% aggregate exposed >50% aggregate exposed
These codes may require adjustment as deterioration patterns emerge with time
Joint Condition
0 1 2 3 4 5
Solid – no deterioration 0-5% Cracked or missing k 5-10% Cracked or missing >3 10-25% Cracked or missing 25-50% Cracked or missing >50% Cracked or missing
A score of 15 is a warning level. One pothole every 5 metres is serious therefore score of 33 or more is serious
SEACAP 17.02 Inception Report
LTEC 22 March 2009
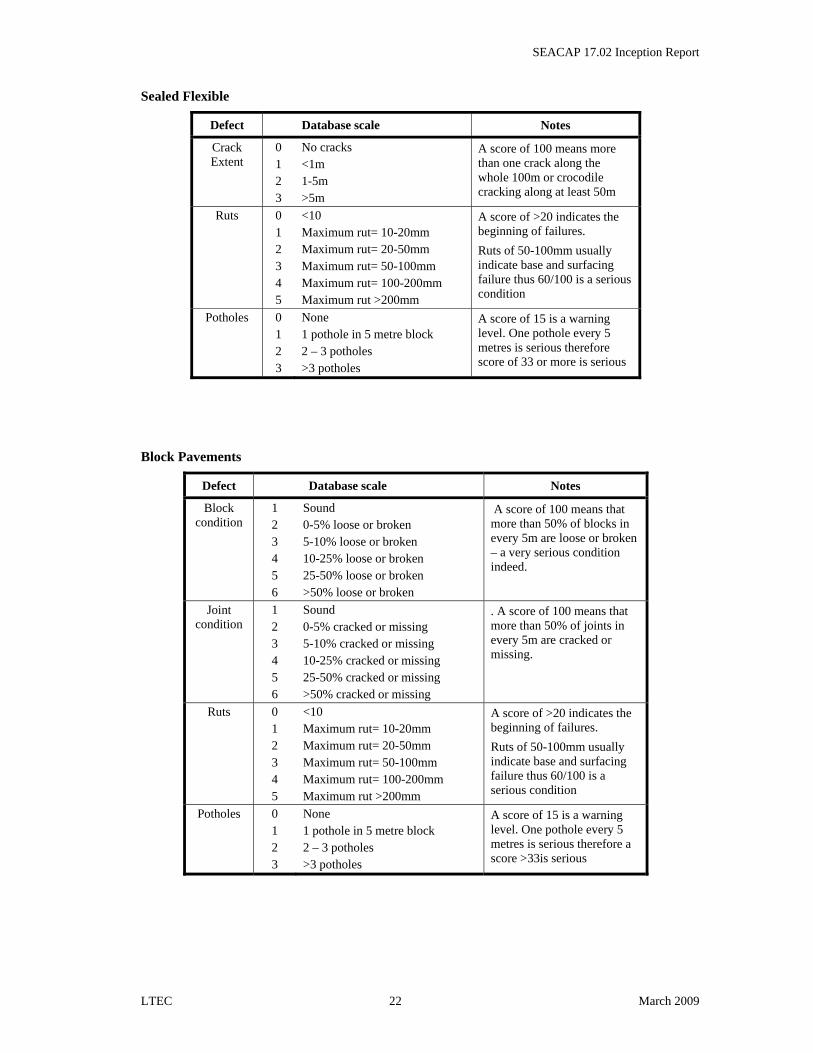
Sealed Flexible
Defect Database scale Notes
Crack Extent
0 1 2 3
No cracks <1m 1-5m >5m
A score of 100 means more than one crack along the whole 100m or crocodile cracking along at least 50m
Ruts 0 1 2 3 4 5
<10 Maximum rut= 10-20mm Maximum rut= 20-50mm Maximum rut= 50-100mm Maximum rut= 100-200mm Maximum rut >200mm
A score of >20 indicates the beginning of failures. Ruts of 50-100mm usually indicate base and surfacing failure thus 60/100 is a serious condition
Potholes 0 1 2 3
None 1 pothole in 5 metre block 2 – 3 potholes >3 potholes
A score of 15 is a warning level. One pothole every 5 metres is serious therefore score of 33 or more is serious
Block Pavements
Defect Database scale Notes
Block condition
1 2 3 4 5 6
Sound 0-5% loose or broken 5-10% loose or broken 10-25% loose or broken 25-50% loose or broken >50% loose or broken
A score of 100 means that more than 50% of blocks in every 5m are loose or broken – a very serious condition indeed.
Joint condition
1 2 3 4 5 6
Sound 0-5% cracked or missing 5-10% cracked or missing 10-25% cracked or missing 25-50% cracked or missing >50% cracked or missing
. A score of 100 means that more than 50% of joints in every 5m are cracked or missing.
Ruts 0 1 2 3 4 5
<10 Maximum rut= 10-20mm Maximum rut= 20-50mm Maximum rut= 50-100mm Maximum rut= 100-200mm Maximum rut >200mm
A score of >20 indicates the beginning of failures. Ruts of 50-100mm usually indicate base and surfacing failure thus 60/100 is a serious condition
Potholes 0 1 2 3
None 1 pothole in 5 metre block 2 – 3 potholes >3 potholes
A score of 15 is a warning level. One pothole every 5 metres is serious therefore a score >33is serious

SEACAP 17.02 Inception Report
LTEC 23 March 2009
Hand-Packed Stone
Defect Database scale Notes
Surface Condition
0 1 2 3 4 5
Compact tight as built condition 0-5% loose or missing stone 5-10% loose or missing stone 0-25% Loose or missing stone 25-50% Loose or missing stone >50% loose or missing stone
A score of 100 means that more than 50% of stone blocks in every 5m are loose or missing– a very serious condition indeed.
Block condition
0 1 2 3 4 5
Sound 0-5% loose or broken 5-10% loose or broken 10-25% loose or broken 25-50% loose or broken >50% loose or broken
A score of 100 means that more than 50% of stone blocks in every 5m are loose or broken – a very serious condition indeed.
Matrix/Joint condition
0 1 2 3 4 5
Sound 0-5% cracked or missing 5-10% cracked or missing 10-25% cracked or missing 25-50% cracked or missing >50% cracked or missing
A score of 100 means that more than 50% of the matrix or joints in every 5m are cracked or missing.
Depressions 0 1 2 3
None 1 pothole in 5 metre block 2 – 3 potholes >3 potholes
A score of 15 is a warning level. One pothole every 5 metres is serious therefore a score >33is serious
Potholes 0 1 2 3
None 1 pothole in 5 metre block 2 – 3 potholes >3 potholes
A score of 15 is a warning level. One pothole every 5 metres is serious therefore a score >33is serious

SEACAP 17.02 Inception Report
LTEC 24 March 2009
Unsealed
Defect Database scale Notes
Erosion 1 2 3 4 5
Negligible Slight (loss 5-20mm, <10% of area) Moderate (loss 5-20mm, 10-50% of area) Severe (material loss >20mm, area >10% Very severe (material loss >20mm, area >50%
A score of >100 means that significant gravel loss has occurred over more that 50% of the section
Ruts 0 1 2 3 4 5
<10 Maximum rut= 10-20mm Maximum rut= 20-50mm Maximum rut= 50-100mm Maximum rut= 100-200mm Maximum rut >200mm
A score of >20 indicates the beginning of failures. Ruts of 50-100mm usually indicate base and surfacing failure thus 60/100 is a serious condition
Potholes 0 1 2 3
None 1 pothole in 5 metre block 2 – 3 potholes >3 potholes
A score of 15 is a warning level. One pothole every 5 metres is serious therefore score of 33 or more is serious

SEACAP 17.02 Inception Report
LTEC 25 March 2009