Embed Size (px)
Citation preview
MN DNR AIS Spread Prevention Study February 2012
Page 1 of 71 ©2012TEC
FINAL REPORT to Identify Options & Costs for
Implementing Statewide Measures to Prevent the Spread of Aquatic
Invasive Species (AIS)
February 14, 2012
Prepared for: Minnesota Department of Natural Resources Division of Ecological and Water Resources
500 Lafayette Road St. Paul, MN 55155
Prepared by:
tec
Thompson
Engineering
Company
3830 Rustic Place Saint Paul, MN 55126
Tel: 651 260-0116 www.statisticsinc.com
MN DNR AIS Spread Prevention Study February 2012
Page 2 of 71 ©2012TEC
Technical Report Documentation Page
Report No. MN DNR 001-2012
Government No.
Contractor No.
Title & Subtitle: Identify Options & Costs for Implementing Statewide Measures to Prevent the Spread of Aquatic Invasive Species (AIS)
Report Date: February 14, 2012
Authors: Gregory Thompson, Todd Thompson, Wilfrid Nixon
Performing Organization No.: TEC 001-2012
Performing Organization Name & Address: Thompson Engineering Co. 3830 Rustic Place Saint Paul, MN 55126
Contract No.: 3000010748
Sponsoring Organization Name & Address: Minnesota Department of Natural Resources Division of Ecological and Water Resources Luke Skinner, Invasive Species Program Supervisor 500 Lafayette Road St. Paul, MN 55155-4032
Period Covered: 12/2011 – 02/2012
Supplementary Notes:
Abstract: The spread of aquatic invasive species (AIS) is one of the most significant challenges facing Minnesota today. AIS have the potential to cause serious problems in Minnesota. Evidence from numerous locations in North America and from around the world demonstrate that these non-native species are a threat to the state’s natural resources and local economies that depend on natural resources. Minnesota has a prevention program in place and seeks to significantly increase AIS prevention strategies. This report evaluates methods for limiting and preventing the spread of AIS by addressing this unintentional transport problem. A set of seven scenarios or “concepts” have been proposed to test the feasibility, cost, and effectiveness of different approaches. These were chosen to give an overview of the scope of the problem and educate the state’s citizens on some ways of extending our AIS prevention strategies. A cost model was developed to evaluate these concepts. Inputs for each of the concepts were determined and used to calculate an estimated cost and resources required for each concept. The concept evaluation outcomes illustrate the significance of inspection strategies, the importance of privatization, and the usefulness of technology. One of the more significant issues is how many inspection stations are needed to reduce the risk of spreading aquatic invasive species to more lakes and rivers than has already occurred. The use of privatization and technology was explored to better distribute costs and improve efficiency.
Key Words: Aquatic species, prevention, zebra mussels, natural resources, RFID, tagging, boating restrictions, public accesses,
Distribution Statement: No restriction. This report is available through the Department of Natural Resources
Classification Report: UNCLASSIFIED
Classification this Page: UNCLASSIFIED
Number of Pages: Price:
TABLE OF CONTENTS
MN DNR AIS Spread Prevention Study February 2012
Page 3 of 71 ©2012TEC
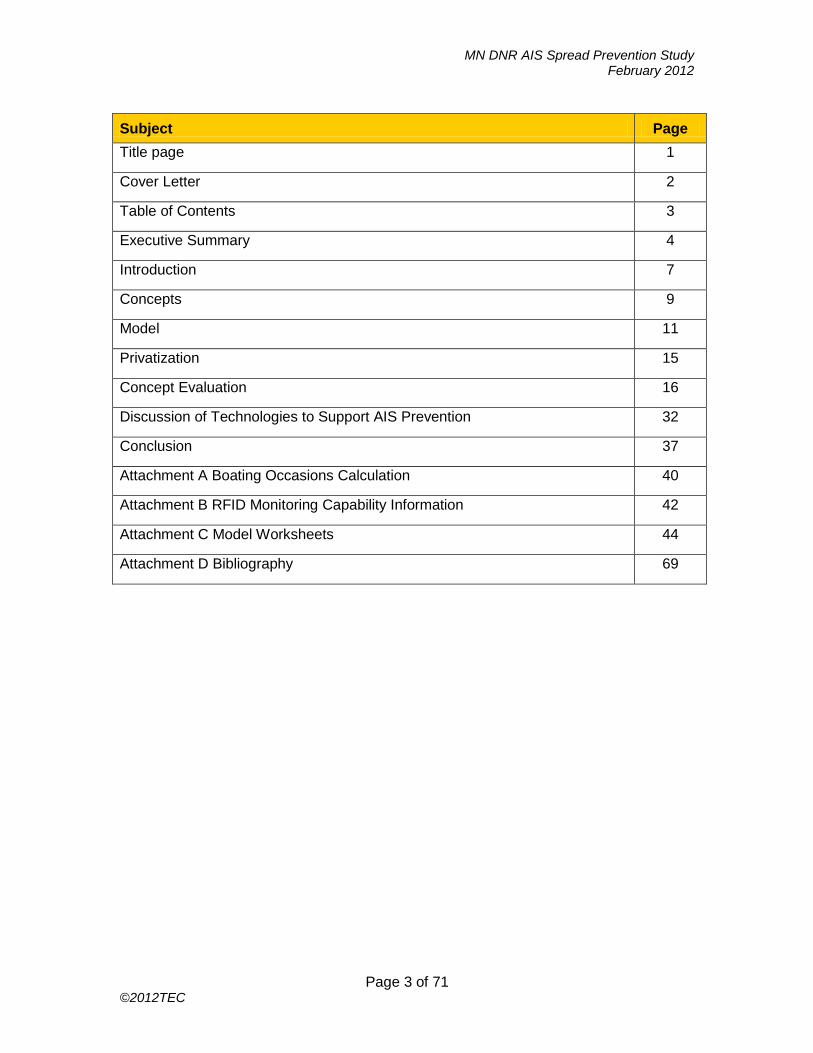
Subject Page
Title page 1
Cover Letter 2
Table of Contents 3
Executive Summary 4
Introduction 7
Concepts 9
Model 11
Privatization 15
Concept Evaluation 16
Discussion of Technologies to Support AIS Prevention 32
Conclusion 37
Attachment A Boating Occasions Calculation 40
Attachment B RFID Monitoring Capability Information 42
Attachment C Model Worksheets 44
Attachment D Bibliography 69
MN DNR AIS Spread Prevention Study February 2012
Page 4 of 71 ©2012TEC
I. EXECUTIVE SUMMARY The spread of aquatic invasive species (AIS) is one of the most significant challenges facing Minnesota today. AIS have the potential to cause serious problems in Minnesota. Evidence from numerous locations in North America and from around the world demonstrate that these non-native species are a threat to the state’s natural resources and local economies that depend on natural resources. Minnesota has a prevention program in place and seeks to significantly increase AIS prevention strategies. MN Department of Natural Resources sought assistance in preparing a report that summarizes funding requirements for selected approaches to preventing the spread of AIS. After an aquatic invasive species becomes established in our lakes and rivers, the primary means for its spread to other waters is the unintentional transport on boats, trailers, dock, boatlifts, and other recreational equipment. This report evaluates methods for limiting and preventing the spread of AIS by addressing this unintentional transport problem. The following concepts were developed to illustrate the different approaches that can be employed to address this challenge. Concepts: A set of seven scenarios or “concepts” have been proposed to test the feasibility, cost and effectiveness of different approaches. These were chosen to give an overview of the scope of the problem and educate the state’s citizens on some ways of extending our AIS prevention strategies. The seven strategies are as follows: 1. Red Lake/Blue Lake with Centralized Inspection Stations 2. Required Inspection Before Launch @ Accesses 3. Required Inspection Before Launch @ Centralized Inspection Stations 4. Required Inspection Before Launch @ Centralized Inspection Stations with High Tech
Monitoring @ Accesses 5. Required Inspections When Leaving Zebra Infested Waters 6. Containment Zones Surrounding High Use Zebra Mussel Areas 7. Self-Inspection & Certification w/DNR Oversight A cost model was developed to evaluate these concepts. Inputs for each of the concepts were determined and used to calculate an estimated cost and resources required for each concept. Cost Model: Standard model practices were used. A set of inputs were determined and entered into an algorithm that was used to calculate the output (concept cost and resources) The model starts by determining the number of public and private accesses and boating occasions (launches and/or removals) during open waters season for one year in the state of Minnesota. Then the number and type of inspections and decontaminations are determined for each concept. Then special technologies are added. Finally any privatization is factored into the scheme. At this time total cost and resources can be computed.

MN DNR AIS Spread Prevention Study February 2012
Page 5 of 71 ©2012TEC
Results: The concept evaluation outcomes illustrate the significance of inspection strategies, the importance of privatization, and the usefulness of technology. One of the more significant issues is how many inspection stations are needed to reduce the risk of spreading aquatic invasive species to more lakes and rivers than has already occurred. Table 1 illustrates the breadth of solutions available. Table 1: Comparing Selected Concepts by # of Stations and Cost
Concept # of Stations Annual Cost
Required inspections @ all accesses 3600 $610,000,000
Required inspections @ centralized stations 300 $59,000,000
Red Lake/Blue Lake @ centralized stations 120 $28,000,000
Containment zones 55 $10,000,000
From the table it is evident that the “an inspection station at every access” is not feasible from a cost perspective and that a cost effective strategy with fewer inspection stations is required. Options to accomplish this are listed below.
Centralizing the inspection stations lowers the overall resources required; but requires boaters to transport their watercraft to an inspection station. (lowering the costs per year from $610,000,000 to $59,000,000)
Only inspecting for zebra mussels and only inspecting boats going from infested to non-infested waters and boats going from non-infested waters to infested waters. (lowering the costs per year from $59,000,000 to $28,000,000)
Only inspecting boats that are leaving containment zones around key zebra mussel infested waters results in the lowest cost option. (lowering the costs per year from $28,000,000 to $10,000,000)
Each of these steps lowers the cost but also increases the level of risk and/or boater inconvenience into the strategy. Privatization: This report investigates the privatization potential for all of the concepts and for two of the concepts - costs are calculated. Privatization for this report means distributing some or all of the prevention strategies to the private sector. The advantages of privatization are apparent from the cost analysis below (see Table 2). With the bulk of the stations being run by private entities the state cost is low, but boaters would be required to purchase these services from private vendors. Table 2 illustrates this dramatic lowering of the cost to the state with privatization. It was determined that with a privatized system, there was still a need for approximately 12 publicly run inspection/decontamination stations for demonstration and training and to help with the transition to privatization.

MN DNR AIS Spread Prevention Study February 2012
Page 6 of 71 ©2012TEC
Table 2: Annual Cost Differences with Privatization:
Concept # of Stations Costs to the State
Required inspections @ centralized stations – State Operated
300 $59,000,000
Required inspections @ centralized stations - PRIVATIZED
300 $7,000,000
Containment zones – State Operated 55 $10,000,000
Containment zones - PRIVATIZED 55 $6,000,000
Free market economic forces may lower prices and would determine station locations based by demand, which would not necessarily be easily accessible for boaters using remote accesses. This could also be a revenue generating enterprise for private business, but this may require time to develop. Technology: Various types of technology can be used to automate or remotely monitor and restrict the movement of AIS from infested lakes to un-infested lakes. In selected cases, technology based solutions may offset the cost of having actual inspectors at low usage sites. An automated system can also provide an information warehouse for watercraft launchings and removals at public and private water body accesses. Several types of technology were considered for possible employment to assist in the prevention of the spread of AIS. These included radio-frequency identification (RFID) tags for each inspected boat and RFID readers at public and private accesses; wireless access, solar power, and website accessed databases for observing compliance and monitoring the system. In addition, there are several methods for of tagging watercraft to demonstrate inspection and/or decontamination is completed; such as wire tags (similar to what is used on ballot boxes) that are used in a couple of western states, red/blue tags (adhesive style), and the aforementioned RFID tags. A cellphone application and solution is described as another way to use technology in the prevention of the spread of AIS.

MN DNR AIS Spread Prevention Study February 2012
Page 7 of 71 ©2012TEC
II. INTRODUCTION A. Purpose. The three primary goals of the DNR Invasive Species Program are to:
1. Prevent introductions of new invasive species into Minnesota 2. Prevent the spread of invasive species within Minnesota
3. Reduce the impacts caused by invasive species to Minnesota’s ecology, society,
and economy.
The Minnesota Department of Natural Resources (DNR) seeks assistance in preparation of a report required by Laws of Minnesota 2011, Chapter 107, Section 106; which states: “By January 15, 2012, the commissioner of natural resources shall report to the house of representatives and senate committees with jurisdiction over environment and natural resources policy and finance on the long-term funding needed to implement and enforce Minnesota Statutes, chapter 84D, including recommendations on the appropriate amount of the watercraft surcharge.” The goal of this project is to identify options and costs for implementing statewide measures to prevent the spread of aquatic invasive species (AIS). Questions addressed in this report include:
How many inspection stations (throughout this report inspection station refers to a staffed location that can both inspect and decontaminate watercraft of all AIS) are needed to be effective in prevention?
Do all the watercraft need to be inspected for every launch or are there some efficiencies that can be used to limit the number?
How much will these prevention strategies cost?
How will boater convenience be affected by this new strategy?
Can some of the elements of this new approach be able to be privatized, handled by the commercial sector?
What technologies are available to help with this effort and how much would they cost?
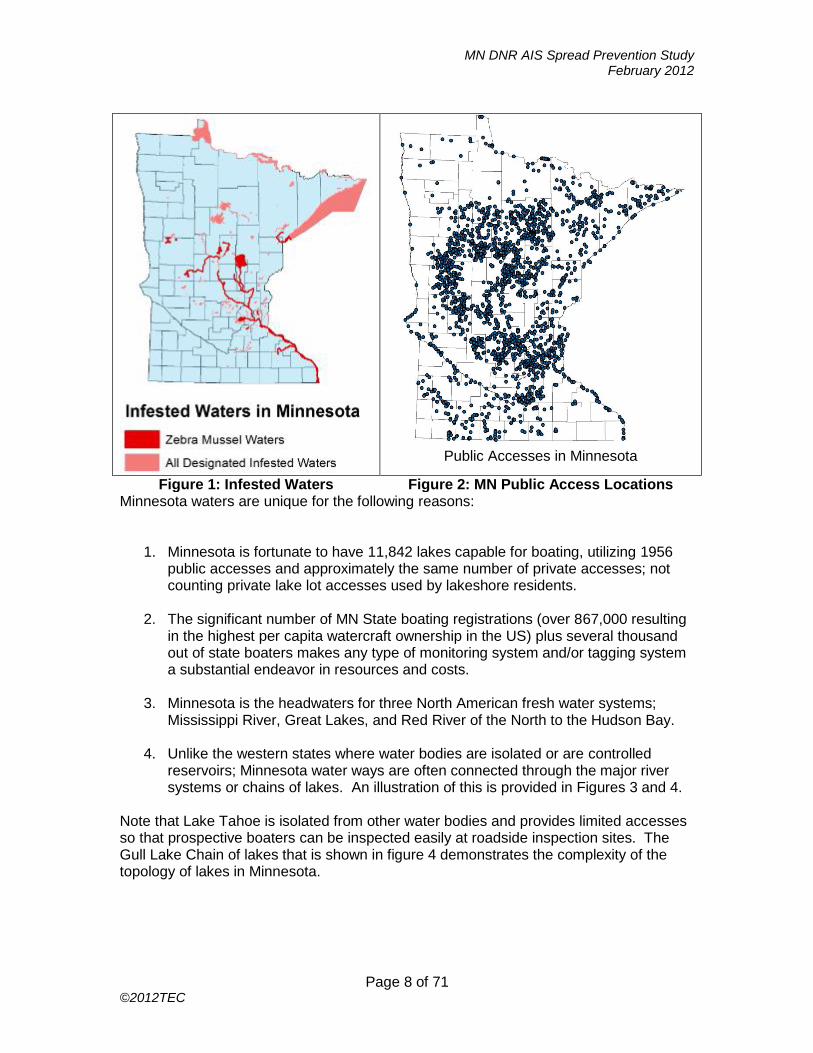
B. Minnesota Waters. The following two figures (Figures 1 and 2) below provide an illustration of the complexity, scope, and magnitude of the effort required to prevent the spread of aquatic invasive species (AIS) in Minnesota. Figure 1 shows the number of infested water bodies in the state (data from DNR). The areas marked in red and pink are infested with AIS. The red markings indicate the waters that have been infested with zebra mussels. Figure 2 provides a snapshot of the public accesses that Minnesota boaters enjoy, the illustration does not include the private/commercial accesses (resorts, marinas, etc.). Figure 2 marks over 2,000 public accesses to Minnesota water ways throughout the state.
MN DNR AIS Spread Prevention Study February 2012
Page 8 of 71 ©2012TEC
Public Accesses in Minnesota
Figure 1: Infested Waters Figure 2: MN Public Access Locations Minnesota waters are unique for the following reasons:
1. Minnesota is fortunate to have 11,842 lakes capable for boating, utilizing 1956 public accesses and approximately the same number of private accesses; not counting private lake lot accesses used by lakeshore residents.
2. The significant number of MN State boating registrations (over 867,000 resulting in the highest per capita watercraft ownership in the US) plus several thousand out of state boaters makes any type of monitoring system and/or tagging system a substantial endeavor in resources and costs.
3. Minnesota is the headwaters for three North American fresh water systems;
Mississippi River, Great Lakes, and Red River of the North to the Hudson Bay.
4. Unlike the western states where water bodies are isolated or are controlled reservoirs; Minnesota water ways are often connected through the major river systems or chains of lakes. An illustration of this is provided in Figures 3 and 4.
Note that Lake Tahoe is isolated from other water bodies and provides limited accesses so that prospective boaters can be inspected easily at roadside inspection sites. The Gull Lake Chain of lakes that is shown in figure 4 demonstrates the complexity of the topology of lakes in Minnesota.

MN DNR AIS Spread Prevention Study February 2012
Page 9 of 71 ©2012TEC
Figure 3:Lake Tahoe Inspection
Sites Figure 4:Gull Lake Chain Example Inspection Sites
III. The Concepts With all the different variables available in combating the AIS problem, criteria were needed to narrow the field of possibilities. Different approaches to preventing the spread of AIS were considered, these approaches were called concepts. The following considerations were used in determining which concepts were included in this report.
Focus on zebra mussels, yet include concepts that prevent other AIS.
Explore inspections/decontaminations before launching and after removal of watercraft (for the purposes of this report watercraft will refer to boats, canoes, boat lifts, docks, etc, any craft or equipment used in Minnesota waters)
Include models that utilize different types of inspectors; DNR employees, private vendors, and certified individuals.
Assess the convenience for users of Minnesota waters.
Explore the efficiency of centralized inspection/decontamination stations at general locations within each MN County.
The concepts were chosen based on Minnesota’s past efforts to prevent the spread of AIS. For completeness and simplicity seven different concepts are presented. The concept names were chosen to reflect (in part) the features of that particular concept. See Table 3 below.

MN DNR AIS Spread Prevention Study February 2012
Page 10 of 71 ©2012TEC
Table 3: Concepts with Descriptions
Concept Name Brief Concept Description
1. RedLake/BlueLake with Centralized Inspection Stations
Require inspection before launch when moving from a zebra mussel infested lake (red) to lakes not infested with zebra mussels (blue) and vice versa. A tagging system would be used to mark boats red and blue.
2. Required Inspection Before Launch @ all Accesses
Require inspection before launch, inspectors at all public and private accesses during open water season and daylight hours.
3. Required Inspection Before Launch @ Centralized Stations
Require inspection before launch. Inspections and decontamination conducted at centralized locations in each MN county.
4. Required Inspection Before Launch @ Centralized Stations; with High Tech Monitoring @ Accesses
Require inspection before launch. Inspections and decontamination conducted at centralized locations in each MN county Provide an active monitoring system at each public and private access. Using radio frequency identification (RFID) and remote controlled and/or automatic gates to gain or deny access for each boating launch.
5. Required Inspections When Leaving Zebra Mussel Infested Waters
Require inspection when leaving zebra mussel infested waters at public and private accesses. Inspectors stationed at all accesses on zebra mussel infested waters.
6. Containment Zones Surrounding High Use Zebra Mussel Areas
Require inspection of all boats leaving “containment zones” at centralized inspection stations located within the zone (areas designated around high use zebra mussel infested waters).
7. Self-Inspection & Certification w/DNR Oversight
MN DNR trains citizen inspectors to self-inspect boats and ensure decontamination.
The above concepts and variations were evaluated using the following approach.
The number of accesses and/or occasions and the number of necessary inspections/decontaminations were determined for each concept.
The costs for providing these services are calculated for the open water season for one year.
Where appropriate, costs were analyzed for possible privatization. The analysis employed existing boating use data and DNR geographic data including the number of accesses, water bodies, watercraft registrations, and the number of boats launched from different types of accesses. This data was used to determine the total number of boating occasions (total launches and removals of watercraft at MN accesses) estimated in the state of Minnesota each season by calendar year.
IV. The Model A model was developed that computes costs for each concept. It starts by determining the number of public and private accesses and boating occasions (launches and/or removals) during open waters season for one year in the state of Minnesota. Standard
MN DNR AIS Spread Prevention Study February 2012
Page 11 of 71 ©2012TEC
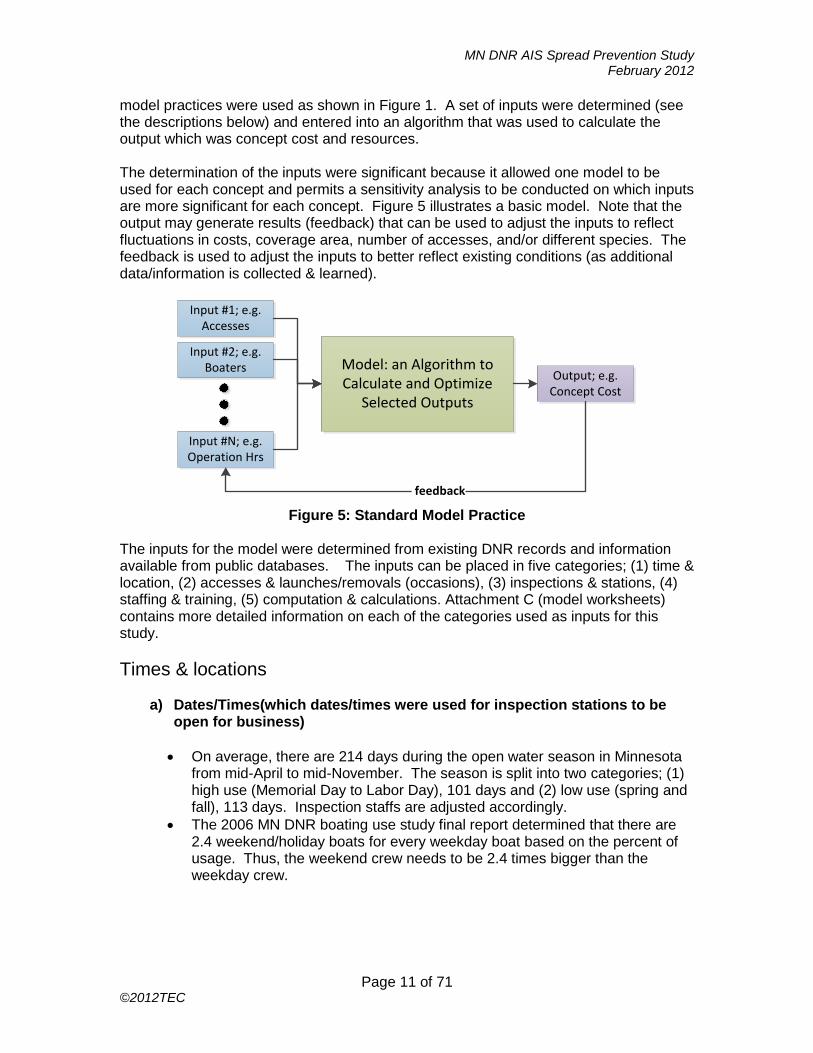
model practices were used as shown in Figure 1. A set of inputs were determined (see the descriptions below) and entered into an algorithm that was used to calculate the output which was concept cost and resources. The determination of the inputs were significant because it allowed one model to be used for each concept and permits a sensitivity analysis to be conducted on which inputs are more significant for each concept. Figure 5 illustrates a basic model. Note that the output may generate results (feedback) that can be used to adjust the inputs to reflect fluctuations in costs, coverage area, number of accesses, and/or different species. The feedback is used to adjust the inputs to better reflect existing conditions (as additional data/information is collected & learned).
Input #1; e.g. Accesses
Input #2; e.g. Boaters
Input #N; e.g. Operation Hrs
Output; e.g.Concept Cost
Model: an Algorithm to Calculate and Optimize
Selected Outputs
feedback
Figure 5: Standard Model Practice The inputs for the model were determined from existing DNR records and information available from public databases. The inputs can be placed in five categories; (1) time & location, (2) accesses & launches/removals (occasions), (3) inspections & stations, (4) staffing & training, (5) computation & calculations. Attachment C (model worksheets) contains more detailed information on each of the categories used as inputs for this study.
Times & locations
a) Dates/Times(which dates/times were used for inspection stations to be open for business)
On average, there are 214 days during the open water season in Minnesota from mid-April to mid-November. The season is split into two categories; (1) high use (Memorial Day to Labor Day), 101 days and (2) low use (spring and fall), 113 days. Inspection staffs are adjusted accordingly.
The 2006 MN DNR boating use study final report determined that there are 2.4 weekend/holiday boats for every weekday boat based on the percent of usage. Thus, the weekend crew needs to be 2.4 times bigger than the weekday crew.
MN DNR AIS Spread Prevention Study February 2012
Page 12 of 71 ©2012TEC
b) Counties
The county risk level is an algorithm used to calculate the number of inspection stations needed to service that county. The risk level of the county was based on the number of water accesses, population, and presence of invasive species.
The risk level determined for each concept is used to determine the number of potential inspection stations needed for each county.
Accesses & Launches
c) Occasions (Launches and Removals)
Boating occasions are defined as either a launching or a removal of a boat, or other aquatic equipment. It is assumed that there are an equal number of launchings and removals.
MN DNR boating use studies data (conducted from 1998 – 2011) was computed seasonally and geographically to determine the total number of boating occasions (launches and removals) whether those boating occasions were performed at a public or private access.
Lakeshore residents (also known as riparians in the MN DNR boating use studies) that have a boat launch ramp or facility were not considered in this study.
Attachment A, summarizes the calculation for determining the overall number of occasions in the state. Table 4 summarizes this calculation.
Table 4: Total Occasions for One Season (computed as an average over the period from 1998-2011) in Minnesota
Occasions Total number for one boating season
Public accesses 1,356,402
Private accesses 593,280
d) Accesses
MN DNR data (DNR’s website data deli and MN DNR boating use studies) and private resort association (Explore Minnesota) data were used to determine the number of accesses in the state and classify them as high, medium, and low usage.
Only water body accesses capable of launching and landing a watercraft via a trailer were considered. “Carry-in” accesses were not included. Table 5 summarizes the total number of accesses considered in this report.
Table 5: Total Accesses in Minnesota
Accesses Total number in the State of Minnesota
Public 1956 Private 1722

MN DNR AIS Spread Prevention Study February 2012
Page 13 of 71 ©2012TEC
Staffing & Training
e) Personnel
Each concept assumes three personnel categories for DNR staffing. Cost estimates include salary, benefits, and administrative expenses.
o Level I Inspector: $13.07/hour o Level II Inspector: $20.19/hour o Supervisor: $27.32/hour
The number of hours needed to staff inspection stations determines the number of employees required.
Add supervisors to the model at the rate of 18 workers for every supervisor.
Costs for enforcement are not included.
f) Training
Training costs for level I and level II inspectors were based on hourly rates and estimated travel expenses. The training costs for licensing and certification were also estimated for non-DNR personnel, see Section V.
o Training Level I: $385.00/student o Training Level II: $749.00/student
Inspections & Stations
g) Inspections
Maximum number of inspections that can be performed in an hour based on ideal conditions at one station (two inspectors) is approximately eight per hour (data from discussions with DNR staff and other states). Another measurement of inspection times used in this report, which is derived from previous DNR prevention projects, is approximately two water craft inspections per hour.
h) Stations Types
There are three sizes of inspection/decontamination stations; mega, medium, and minimum station. The sizes are based on staffing and the number of decontamination units. See Table 6.
Staffing of the stations are divided into two modes based on weekday usage and weekend/holiday usage.
A station consists of a level I and level II inspector plus a decontamination system. This is called the Minimum Station and is designed to service low to medium usage accesses.
The Medium and Mega Stations designed for higher use/demand areas have additional staff for weekends and summer hours.
The mega stations have special costs associated for property in some areas.
Costs for setting up a station are startup costs. Property costs were calculated only for mega stations.

MN DNR AIS Spread Prevention Study February 2012
Page 14 of 71 ©2012TEC
Table 6: Inspection Station Staffing and Equipment
Minimum Station Spring Summer Fall
Weekday 2 insp/1 decon 2 insp/1 decon 2 insp/1 decon
Weekend/holiday 2 insp/1 decon 2 insp/1 decon 2 insp/1 decon
Medium Station Spring Summer Fall
Weekday 2 insp/1 decon 4 insp/1 decon 2 insp/1 decon
Weekend/holiday 2 insp/1 decon 6 insp/2 decon 2 insp/1 decon
Mega Station Spring Summer Fall
Weekday 2 insp/1 decon 6 insp/2 decon 2 insp/1 decon
Weekend/holiday 4 insp/1 decon 10 insp/3 decon 4 insp/1 decon
i) Station Location:
Stations are placed in counties based on their risk level.
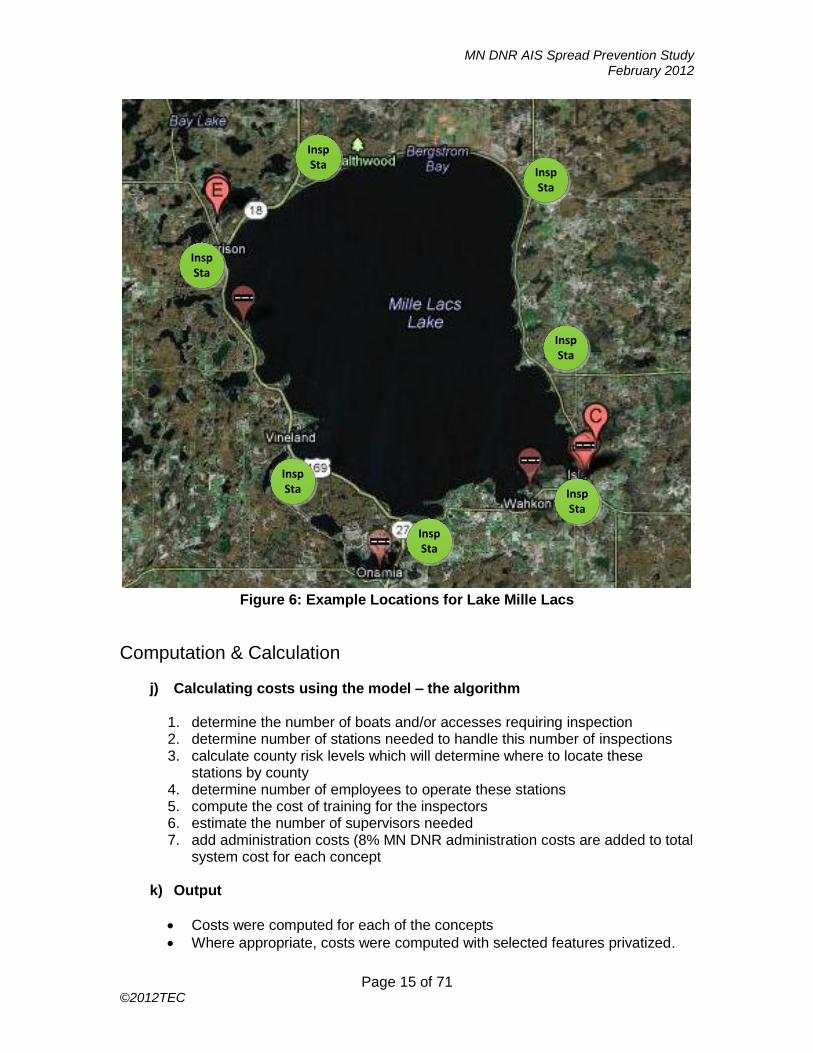
As part of this report, four high use areas (Hennepin County, Mille Lacs, Gull Lake Chain, and Lake Minnetonka) were examined and proposed locations identified, see an example for Lake Mille Lacs in Figure 6.
Projecting the placement of example inspection stations for Lake Mille Lacs were based on DNR boating use studies for Lake Mille Lacs, Minnesota Department of Transportation traffic studies, and regional DNR data.
MN DNR AIS Spread Prevention Study February 2012
Page 15 of 71 ©2012TEC
InspSta
InspSta
InspSta
InspSta
InspSta
InspSta
InspSta
Figure 6: Example Locations for Lake Mille Lacs
Computation & Calculation
j) Calculating costs using the model – the algorithm 1. determine the number of boats and/or accesses requiring inspection 2. determine number of stations needed to handle this number of inspections 3. calculate county risk levels which will determine where to locate these
stations by county 4. determine number of employees to operate these stations 5. compute the cost of training for the inspectors 6. estimate the number of supervisors needed 7. add administration costs (8% MN DNR administration costs are added to total
system cost for each concept
k) Output
Costs were computed for each of the concepts
Where appropriate, costs were computed with selected features privatized.
MN DNR AIS Spread Prevention Study February 2012
Page 16 of 71 ©2012TEC
Costs of adding technology to certain concepts was also calculated.
V. Privatization In this report privatization refers to hybrid concepts where some or all of the inspection and decontamination tasks are accomplished with stations owned and operated by the private sector. The prevention of the spread of aquatic invasive species requires the assistance of the boating public, the cooperation of the boating industry, and support of government oversight and enforcement. Thus, all entities will play a role in preventing the spread of AIS. The operation, maintenance, and cost for an effective inspection and decontamination system integrated with a pervasive monitoring and enforcement system can be accomplished by the collaboration of all three segments;
Boater cooperation and participation
Commercial or outsourced inspection teams, decontamination systems, and/or full service stations
Government monitoring, licensing, and enforcement; maintain example inspection stations and decontamination sites throughout the state.
Figure 7 attempts to describe responsibilities for each segment to increase the chances for success in this collaboration. Any of the concepts discussed previously can be privatized all or in part. This report discusses two concepts for comparison purposes. The two concepts are Required Inspections @ Centralized Stations - PRIVATIZED and Containment Zones – PRIVATIZED. All AIS programs will require funding public and private; these costs most likely will be distributed to the boating public. For example, the cost per launch and cost per inspection/decontamination can be borne by the boater and let the free market system determine pricing.

MN DNR AIS Spread Prevention Study February 2012
Page 17 of 71 ©2012TEC
MN DNR
CommercialBusiness
Boating Public
License Inspection/Decon Stations located at commercial businesses
Provide inspector/decon training plus program oversight & monitoring
Enforce regulations, respond to alerts, coordinate with other agencies
Participate in training as required
Implement inspection stations
Assemble decontamination stations
Provide competitive pricing
Attach appropriate tags, signs, codes on watercraft for identification at public/private accesses
Provide reports, log inspections, alert authorities as needed
Cooperate & participate in AIS prevention program
Respond to survey questions such as which water body and access they will use prior to watercraft launch and/or after watercraft removal
Pay fees as charged by commercial inspection stations
Maintain approximately a dozen DNR staffed inspection/decon stations as model distributed throughout the state
Comply with state AIS regulations
Figure 7: Proposed Responsibilities for Privatization Concepts
VI. Concept Evaluation As discussed above the seven concepts described here are only a representative set of all possible scenarios. They cover a broad range of possibilities and give a good idea of how cost, effectiveness and convenience can vary. In the following discussion each of the seven concepts are evaluated. A cost will be calculated and advantages, disadvantages and feasibility of privatization will be discussed. The concepts and brief descriptions are provided in the table below (see table 4). Attachment C provides detailed worksheets from the model for each of the concepts and how estimates for resources (staffing, equipment, training, etc. were formulated).

MN DNR AIS Spread Prevention Study February 2012
Page 18 of 71 ©2012TEC
Advantages and disadvantages will be categorized as follows to facilitate comparisons between the concepts and to help formulate other options and possibilities.
Comprehensive and Effective: o How well does it protect our un-infested waters? o Does it cover all AIS species? o Are out-of-state watercraft inspected? o What is the weakest point in this concept?
Impact to boaters: o Will the public understand the concept easily? o How far does one need to drive? o Do boaters have a choice?
Enforceable: o Are boat tags needed? o Does one rely mainly on boater compliance? o Is it easy to monitor?
Cost Effective and Efficient: o Are unnecessary inspections being done? o What are the costs per inspection? o Are personnel being used efficiently? o Is the overall cost feasible? o Is there a big initial cost?
The seven concepts are listed here (see Table 3 for brief description).
1. Red Lake (infested with zebra mussels)/Blue Lake (un-infested with zebra mussels) @ centralized stations – inspect only when changing colors
2. Required inspections before all launches @ all accesses 3. Required inspections before all launches @ centralized stations 4. Required inspections @ centralized stations; with high tech monitoring at
accesses 5. Required inspections when leaving zebra mussel infested waters 6. Containment zones – stations located in high boating use areas 7. Self-inspection/certification
1. Red Lake/Blue Lake Description. This concept uses color coded tags that indicate if a water craft is being used on zebra mussel infested waters (red tag) or waters that are not infested with zebra mussels (blue tag). Watercraft with red tags would be required to be inspected and receive a blue tag prior to launching on a water body that is not infested with zebra mussels. Watercraft with blue tags would be required to be inspected and receive a red tag prior to launching on a water body infested with zebra mussels. Blue tagged watercraft going to blue waters and red to red would not require an inspection. This strategy would utilize centralized inspection stations rather than inspection stations at public accesses or along roads. Estimated costs are provided in Table 5.

MN DNR AIS Spread Prevention Study February 2012
Page 19 of 71 ©2012TEC
Table 5: Estimated Costs for Red Lake/Blue Lake:
Advantages/Disadvantages: Comprehensive: It applies to all watercraft users and covers people using private and public accesses and out-of-state bloaters equally well. This concept contrasts with concepts 5 and 6 because it requires inspection before watercraft launch. A disadvantage is that it would only apply to Zebra mussel infested waters or each aquatic invasive type (milfoil, mussels, water flea) will require a different tag or sign to indicate which type of infested or un-infested water body they are coming from or going to. Impact to Boaters: Citizens would choose the time and location for inspections and are not subject to waiting in line at accesses or being pulled over on the highway. The public would need to be educated about the Red Lake/Blue Lake concept and what waters are infested. Enforceable: Spot checks by enforcement officers on lakes and at accesses would be needed. Tags would be highly visible making it easy for the public to help with enforcement. Costs: The overall cost is moderate for this concept. It is less expensive than requiring inspections prior to every launch, because inspections are not required if a person boats on only “red” or only “blue” lakes. Privatization Potential. Inspection and decontamination stations could be located at a commercial enterprise.
2. Required Inspections before Launch @ All Accesses Description: This strategy requires a mandatory inspection prior to launching a watercraft on any water body (infested or un-infested) in the state. While this concept is not likely feasible due to the high costs for staffing inspection stations at all 3,759 public
Red Lake/Blue Lake Inspect red to blue blue to red
red lake = infested with Zebra Mussels Don't inspect blue to blue red to red
blue lake = not infested with Zebra Mussels
Number of boats needing inspection
50% of all launches
487420 total launches to inspect
Six Mega Stations in Mille Lacs, St. Louis, Hennepin, Otter Tail, Crow Wing and Ramsey Counties
Have the capacity to inspect/decontaminate a total of 111919 boats
Leaving 375502 boats to inspect which will require 130 smaller stations
Number
Staffing per
station Total Staffing
Year One
Equipment
Costs
Total
Equipment
Year One
Year Two
Equipment
Costs
Year Two
Total
Equipment
Mega Stations 6 @ $327,944 equals $1,967,662 $747,455 $4,484,728 $117,455 $704,728
85.00% Minimum Stations 111 @ $101,443 equals $11,222,975 $37,227 $4,118,569 $23,727 $2,625,019
15.00% Medium Stations 20 @ $172,752 equals $3,372,737 $45,666 $891,568 $32,166 $628,000
TOTALS $16,563,373 $9,494,865 $3,957,748
Total Year One $26,058,238
Total Year Two $20,521,121
Cost per occasion
Grand Total Year One (including 8% admin costs) $28,142,897 $14.43
Grand Total Year Two (including 8% admin costs) $22,162,810 $11.37

MN DNR AIS Spread Prevention Study February 2012
Page 20 of 71 ©2012TEC
and private accesses it does provide a valuable benchmark and is the most comprehensive plan possible. Estimate costs are provided in Table 6. Table 6: Costs for Required Inspections Before Launch @ All Accesses:
Advantages/Disadvantages: Comprehensive: This is the most comprehensive concept because it covers all watercraft that use public and private accesses. However, it does not address access on private lake lots used by lakeshore owners. Impact to Boaters: This would be an easy concept to explain to the public because it applies to all watercraft using public and private accesses. Enforceable: A watercraft must pass inspection or it cannot launch. Costs: This concept is cost prohibitive ($600,000,000 annually) and inefficient. A station at every access requires a high number of inspectors. Privatization Potential: Private vendors that charge fees for inspections and decontaminations would not likely be interested in establishing operations at low volume public and private accesses.
3. Required Inspections @ Centralized Stations Description: This concept requires mandatory inspections for all boats launching on Minnesota waters, but inspection stations are at centralized locations. An algorithm using population, number of accesses, usage and to a small extent AIS species present was used to determine a number of inspection stations for each county (see Attachment C). Figure 8 is an example of how the stations could be distributed throughout the state and Figure 9 is an example of how inspection stations could be distributed in Hennepin County. Estimated costs are provided in Table 7.
Required Inspections Before Launching (all accesses)
Total number of boat accesses statewide
Public Access 1956
Private Accesses 1722
TOTAL 3678
labor costs
Year One
equipment
cost per
station
Year One Total
Equipment
Year Two
equipment cost
per station
Year Two Total
Equipment
85.12% Minimum Stations 3131 @ $101,443 equals $317,627,116 $37,227 $116,561,720 $23,727 $74,292,011
14.88% Medium Stations 547 @ $172,752 equals $94,536,263 $45,666 $24,990,240 $32,166 $17,602,561
Totals $412,163,379 $141,551,960 $91,894,572
Total Year One $553,715,339
Total Year Two $504,057,951
Cost per occasion
Grand Total Year One (including 8% admin costs) $598,012,566 $306.72
Grand Total Year Two (including 8% admin costs) $544,382,587 $279.22

MN DNR AIS Spread Prevention Study February 2012
Page 21 of 71 ©2012TEC
Table 7: Costs for Required Inspections @ Centralized Stations:
Advantages/Disadvantages: Comprehensive: This is the most comprehensive concept because it covers all watercraft that use public and private accesses. However, it does not address access on private lake lots used by lakeshore owners. Impact to Boaters: This is also easy to explain to the public. Even though there are fewer stations than in the “all accesses” concept it may be more convenient in that the public can choose what time they get inspected. Figure 9 shows example inspection station locations in Hennepin County. It illustrates the level of convenience this option provides. This option requires boaters to drive to an inspection station prior to going to the lake where they want to launch their watercraft. It is estimated and extra 10 – 15 miles would be added to their trip for boaters seeking to use water ways in Hennepin County. Enforceable: Enforcement of this concept would require some way to prove that an inspection was completed. Spot checks at accesses would be the most likely method of enforcement. Costs: This concept is more efficient than the all accesses concept, but has an estimated cost of $59,000,000 the first year and $45,000,000 for future years.
Required Inspections Before Launching (Centralized Stations)
Total number of occasions statewide Total number of launches statewide
1,949,681 974,841
Total number of stations statewide
300
labor costs
Year One
equipment
cost per
station
Year One Total
Equipment
Year Two
equipment cost
per station
Year Two Total
Equipment
80.00% Minimum Stations 240 @ $101,443 equals $24,346,320 $37,227 $8,934,530 $23,727 $5,694,530
15.00% Medium Stations 45 @ $172,752 equals $7,773,860 $45,666 $2,054,985 $32,166 $1,447,485
5.00% Mega Stations 15 @ $327,944 equals $4,919,154 $747,455 $11,211,820 $117,455 $1,761,820
Totals $32,120,180 $22,201,335 $8,903,835
Total Year One $54,321,515
Total Year Two $41,024,015
Cost per occasion
Grand Total Year One (including 8% admin costs) $58,667,236 $30.09
Grand Total Year Two (including 8% admin costs) $44,305,936 $22.72

MN DNR AIS Spread Prevention Study February 2012
Page 22 of 71 ©2012TEC
Figure 8: Required Inspections @ Centralized Stations – Station Locations In order to accommodate the number of inspections required for this concept; three hundred inspection stations are needed. Figure 8 illustrates an example distribution with the counties ranked by population, number of water bodies, and number of public and private accesses.
MN DNR AIS Spread Prevention Study February 2012
Page 23 of 71 ©2012TEC
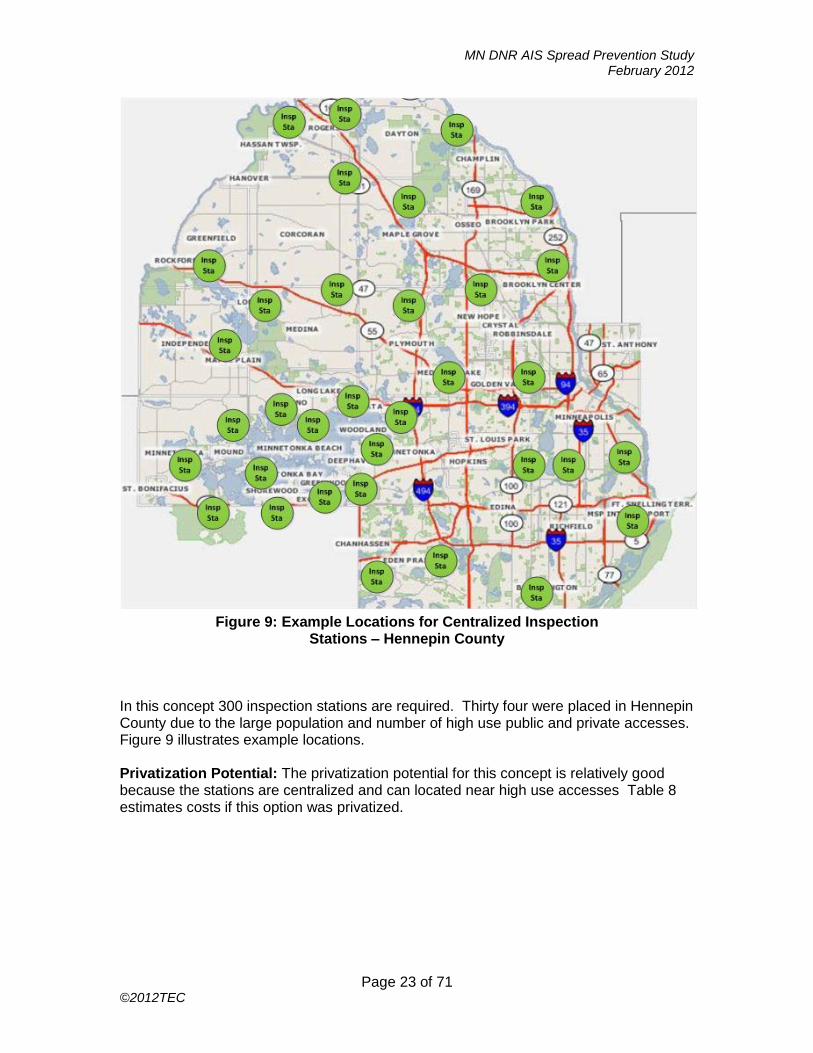
Figure 9: Example Locations for Centralized Inspection
Stations – Hennepin County
In this concept 300 inspection stations are required. Thirty four were placed in Hennepin County due to the large population and number of high use public and private accesses. Figure 9 illustrates example locations. Privatization Potential: The privatization potential for this concept is relatively good because the stations are centralized and can located near high use accesses Table 8 estimates costs if this option was privatized.

MN DNR AIS Spread Prevention Study February 2012
Page 24 of 71 ©2012TEC
Table 8: Costs for Required Inspections @ Centralized Stations - PRIVATIZED:
Privatization, general considerations:
1. Costs: The advantages of privatization are apparent from the cost analysis above. With the bulk of the stations being run by private entities the public cost is lower. But this is misleading as the cost to the boaters maybe very similar as the publicly funded approach when costs for inspection and decontamination are considered. Based on data from other states private inspections can range from $10 - $30 per inspection and decontamination can range from $40 - $80 per hour. Thus instead of a surcharge on the boat license or fishing license to fund the state’s inspection force the boater needs to pay the inspection station owner to be inspected/decontaminated.
2. Free Market: Free market economic forces may lower prices and would
determine station locations based by demand, which would not necessarily be easily accessible for boaters using remote accesses. This could also be a revenue generating enterprise for private business, but this may require time to develop.
3. Acceptance: One other uncertainty in the privatization strategy is that it will take
a while for the business community to accept and embrace this new task/enterprise. One way that this is being mitigated in this concept presented in this report, is that 12 state run inspection stations are included to model correct functionality, to provide backup, and jump start the process.
Required Inspections Before Launching (Centralized Stations) - Privatized
Total number of occasions statewide
1949681
Total number of PUBLIC stations statewide Total number of PRIVATE stations statewide
12 288
Labor for
one
station labor costs
Year One
equipment
cost per
station
Year One Total
Equipment
Year Two
equipment cost
per station
Year Two Total
Equipment
0.00% Minimum Stations 0 @ $101,443 equals $0 $37,227 $0 $23,727 $0
60.00% Medium Stations 7 @ $172,752 equals $1,243,818 $45,666 $328,798 $32,166 $231,598
40.00% Mega Stations 5 @ $327,944 equals $1,574,129 $747,455 $3,587,782 $117,455 $563,782
Totals $1,243,818 $3,916,580 $795,380
Comme
Training
Costs for
one
station
Total Training
Costs
80.00% Minimum Stations 230 @ $2,789 equals $642,649
15.00% Medium Stations 43 @ $4,750 equals $205,200
5.00% Mega Stations 14 @ $9,017 equals $129,847
Total training Costs for all stations $977,695
Total Cost Year One $5,160,398
Total Cost Year Two $2,039,198
Cost per occasion
Grand Total Year One (including 8% admin costs) $6,629,140 $3.40
Grand Total Year Two (including 8% admin costs) $3,258,244 $1.67
MN DNR AIS Spread Prevention Study February 2012
Page 25 of 71 ©2012TEC
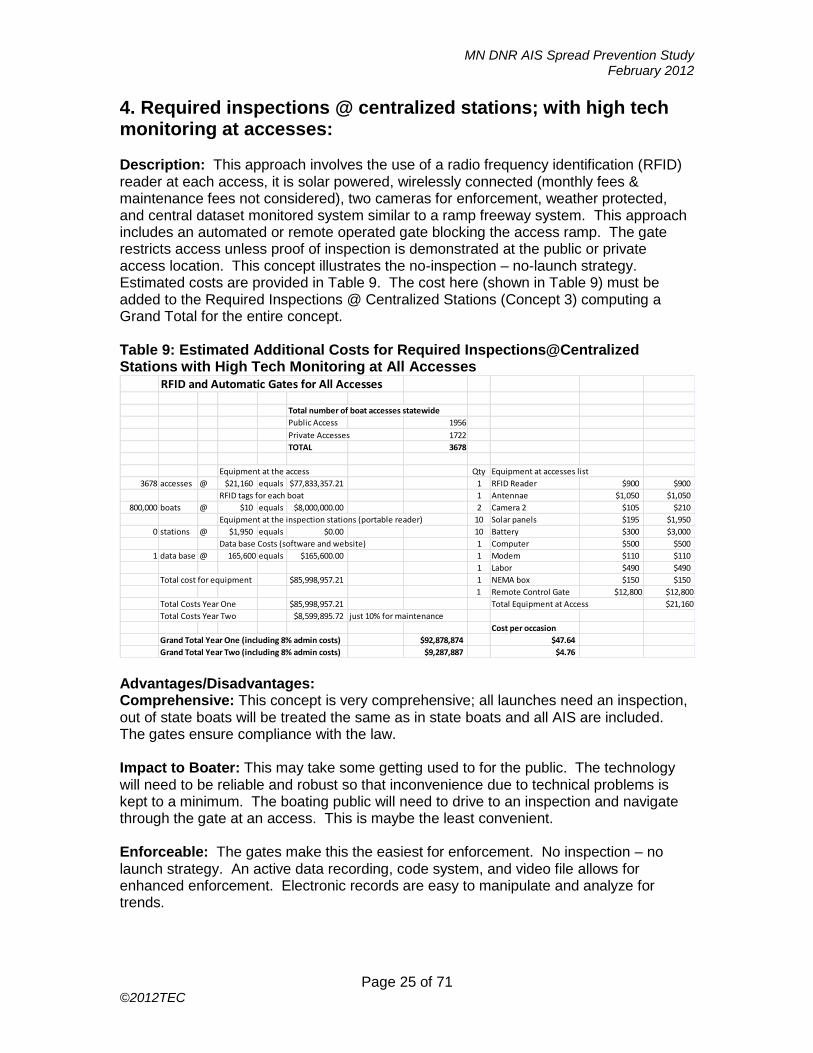
4. Required inspections @ centralized stations; with high tech monitoring at accesses: Description: This approach involves the use of a radio frequency identification (RFID) reader at each access, it is solar powered, wirelessly connected (monthly fees & maintenance fees not considered), two cameras for enforcement, weather protected, and central dataset monitored system similar to a ramp freeway system. This approach includes an automated or remote operated gate blocking the access ramp. The gate restricts access unless proof of inspection is demonstrated at the public or private access location. This concept illustrates the no-inspection – no-launch strategy. Estimated costs are provided in Table 9. The cost here (shown in Table 9) must be added to the Required Inspections @ Centralized Stations (Concept 3) computing a Grand Total for the entire concept. Table 9: Estimated Additional Costs for Required Inspections@Centralized Stations with High Tech Monitoring at All Accesses
Advantages/Disadvantages: Comprehensive: This concept is very comprehensive; all launches need an inspection, out of state boats will be treated the same as in state boats and all AIS are included. The gates ensure compliance with the law. Impact to Boater: This may take some getting used to for the public. The technology will need to be reliable and robust so that inconvenience due to technical problems is kept to a minimum. The boating public will need to drive to an inspection and navigate through the gate at an access. This is maybe the least convenient. Enforceable: The gates make this the easiest for enforcement. No inspection – no launch strategy. An active data recording, code system, and video file allows for enhanced enforcement. Electronic records are easy to manipulate and analyze for trends.
RFID and Automatic Gates for All Accesses
Total number of boat accesses statewide
Public Access 1956
Private Accesses 1722
TOTAL 3678
Equipment at the access Qty Equipment at accesses list
3678 accesses @ $21,160 equals $77,833,357.21 1 RFID Reader $900 $900
RFID tags for each boat 1 Antennae $1,050 $1,050
800,000 boats @ $10 equals $8,000,000.00 2 Camera 2 $105 $210
Equipment at the inspection stations (portable reader) 10 Solar panels $195 $1,950
0 stations @ $1,950 equals $0.00 10 Battery $300 $3,000
Data base Costs (software and website) 1 Computer $500 $500
1 data base @ 165,600 equals $165,600.00 1 Modem $110 $110
1 Labor $490 $490
Total cost for equipment $85,998,957.21 1 NEMA box $150 $150
1 Remote Control Gate $12,800 $12,800
Total Costs Year One $85,998,957.21 Total Equipment at Access $21,160
Total Costs Year Two $8,599,895.72 just 10% for maintenance
Cost per occasion
Grand Total Year One (including 8% admin costs) $92,878,874 $47.64
Grand Total Year Two (including 8% admin costs) $9,287,887 $4.76

MN DNR AIS Spread Prevention Study February 2012
Page 26 of 71 ©2012TEC
Costs: The cost for gates and RFID technology would be very high. This type of approach may work on selected bodies of water (but it would still require all watercraft to have this technology). There is a substantial amount of equipment to maintain and provide upkeep. A passive RFID where there is no gate, but only monitoring would be less expensive and still be very comprehensive, but this approach would require more enforcement to follow up on the violations manually. Privatization Potential: This concept has a high potential for privatization. The extensive use of technology lends itself well to commercialization.
5. Required inspections when leaving zebra mussel infested waters Description: This concept requires mandatory inspections for all watercraft leaving zebra mussel infested waters and would require inspectors to be stationed at all public and private accesses (total of 440 accesses) on zebra mussel infested waters. See Figure 15 for the locations of these accesses/stations on a statewide basis. Cost & Staffing. The resources estimated for this concept are provided in Table 10. Table 10: Estimated Costs for Require Inspections when Leaving Zebra Mussel Infested Waters
Advantages/Disadvantages: Comprehensive: This concept is intended to prevent the spread of zebra mussels by inspecting watercraft when they are removed from Zebra mussel infested waters. This option does not address the AIS that may be transported from out of state watercraft or other types of AIS. This concept would not require inspections for large parts of the state that do not have Zebra mussels now (see Figure 10), but it does include high use accesses and areas with large populations.
Required Inspections When Leaving Zebra Mussel Infested WatersSTATIONS AT ACCESSES
Total number of boat accesses statewide
Public Access 233
Private Accesses 207
TOTAL 440
labor costs
Year One
Equipment
Cost Per
Station
Year One
Total
Equipment
Year Two
Equipment
Cost Per
Station
Year Two
Total
Equipment
85.44% Minimum Stations 376 @ $101,443 equals $38,129,698 $37,227 $13,992,707 $23,727 $8,918,420
14.56% Medium Stations 64 @ $172,752 equals $11,062,941 $45,666 $2,924,439 $32,166 $2,059,909
Totals $49,192,638 $16,917,146 $10,978,329
Total Costs Year One $66,109,784
Total Costs Year Two $60,170,967
Cost per occasion
Grand Total Year One (including 8% admin costs) $71,398,567 $36.62
Grand Total Year Two (including 8% admin costs) $64,984,644 $33.33

MN DNR AIS Spread Prevention Study February 2012
Page 27 of 71 ©2012TEC
Figure 10: The Number of Zebra Mussel Accesses Per County for the Concept
Required Inspection when Leaving Zebra Mussel Infested Accesses Impact to Boater: Inspections are confined to zebra mussel infested waters only limiting the number of inspections to those who access these specific lakes. Enforcement: Inspections would be required for all boats leaving infested waters.
MN DNR AIS Spread Prevention Study February 2012
Page 28 of 71 ©2012TEC
Costs: This concept is relatively expensive because Zebra mussel infested waters are located in areas with high use accesses and large populations. Privatization Potential: Privatization is possible however; vendors would need to service public and private accesses.
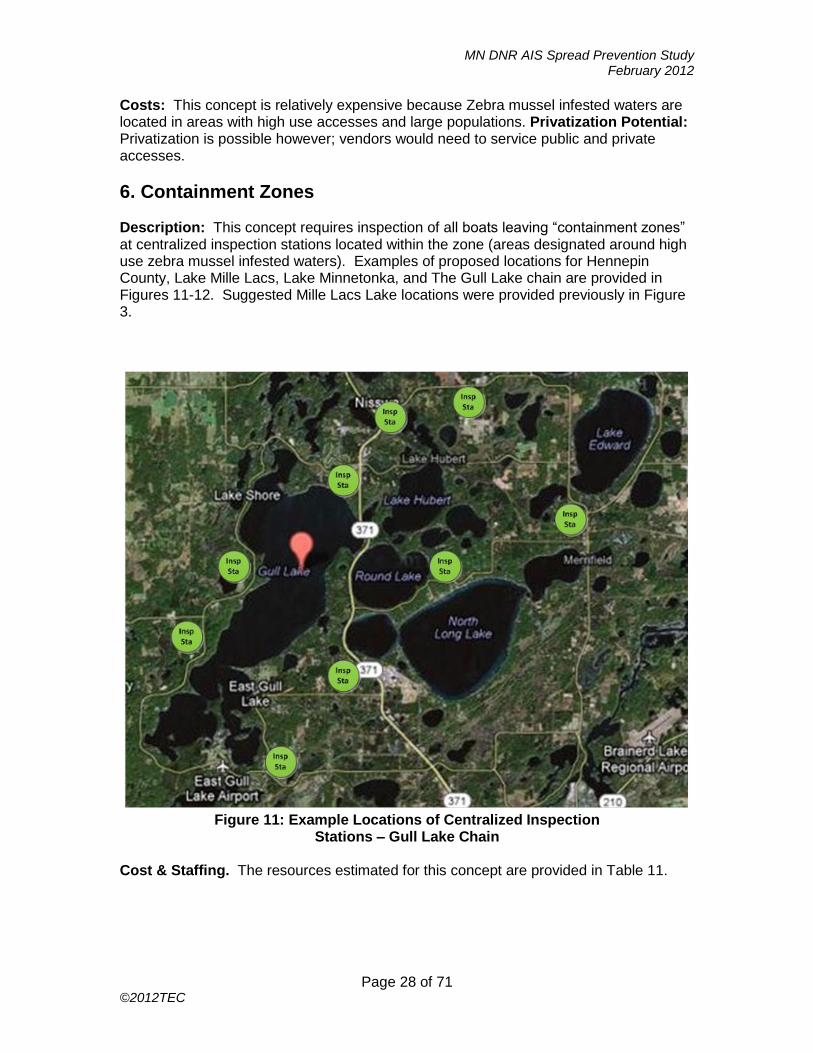
6. Containment Zones Description: This concept requires inspection of all boats leaving “containment zones” at centralized inspection stations located within the zone (areas designated around high use zebra mussel infested waters). Examples of proposed locations for Hennepin County, Lake Mille Lacs, Lake Minnetonka, and The Gull Lake chain are provided in Figures 11-12. Suggested Mille Lacs Lake locations were provided previously in Figure 3.
Figure 11: Example Locations of Centralized Inspection
Stations – Gull Lake Chain
Cost & Staffing. The resources estimated for this concept are provided in Table 11.

MN DNR AIS Spread Prevention Study February 2012
Page 29 of 71 ©2012TEC
Figure 12: Example Locations for Centralized Inspection
Stations – Lake Minnetonka Table 11: Estimated Costs for Inspect all Watercraft when Leaving Zebra Mussel Infested Waters – Containment Zones
Required Inspections When Leaving Zebra Mussel Infested Waters - Containment ZonesCONTAINMENT - CENTRALIZED STATIONS
Total number of boat accesses statewide
Public Access 233
Private Accesses 207
TOTAL 440
Containment
Zones Occasions
Stations
needed to
inspect
Total Labor
Costs
Year One
Equipment
Cost Per
Station
Year One
Total
Equipment
Year Two
Equipment
Cost Per
Station
Year Two
Total
Equipment
Lake Mille Lacs 70,398 7 medium 19 medium $3,228,027 $45,666 $853,315 $32,166 $601,055
Lake Minnetonka 113,209 12 medium
Mississippi River 79,258 14 minimum 36 minimum $3,604,622 $37,227 $1,322,812 $23,727 $843,110
Gull Lake Chain 40,000 7 minimum
Otter Tail Lake 15,000 3 minimum
Alexandria Chain 30,000 5 minimum
Prior Lake 25,000 4 minimum
Duluth 10,000 2 minimum
Douglas County 2,500 1 minimum
Extra Stations 6 minimum
TOTALS $6,832,648 $2,176,126 $1,444,165
Total Costs Year One $9,008,775
Total Costs Year Two $8,276,814
Cost per occasion
Grand Total Year One (including 8% admin costs) $9,729,477 $4.99
Grand Total Year Two (including 8% admin costs) $8,938,959 $4.58
MN DNR AIS Spread Prevention Study February 2012
Page 30 of 71 ©2012TEC
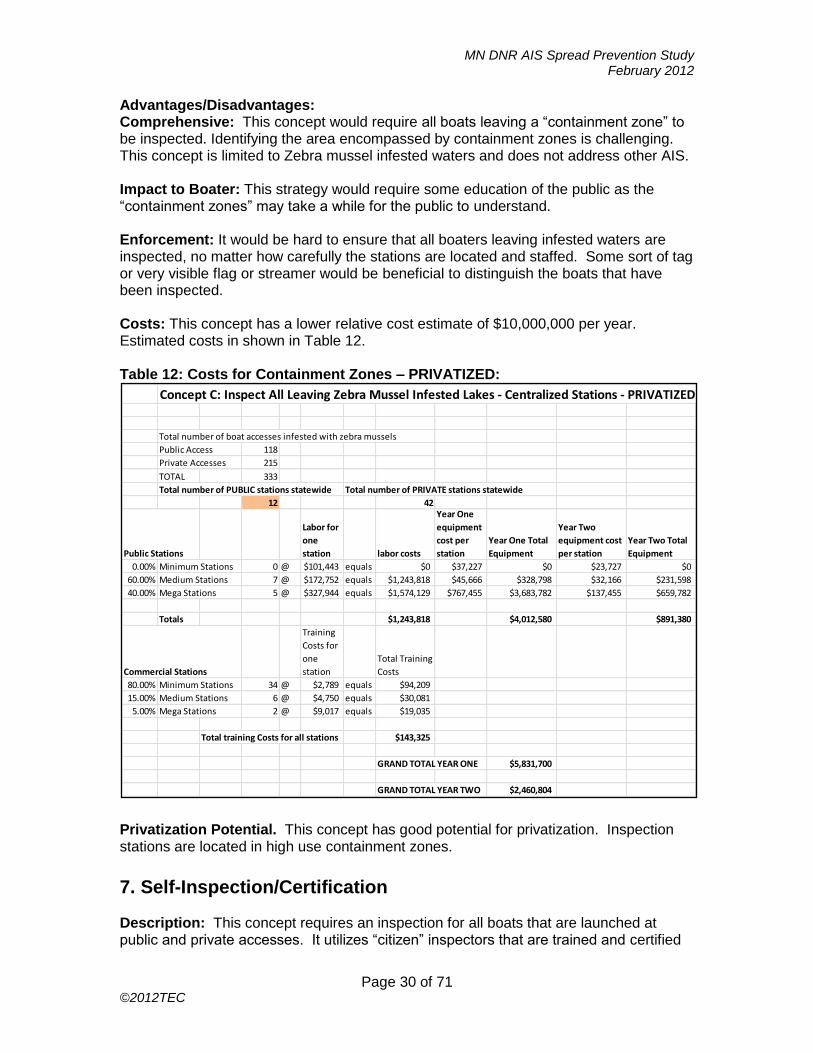
Advantages/Disadvantages: Comprehensive: This concept would require all boats leaving a “containment zone” to be inspected. Identifying the area encompassed by containment zones is challenging. This concept is limited to Zebra mussel infested waters and does not address other AIS. Impact to Boater: This strategy would require some education of the public as the “containment zones” may take a while for the public to understand. Enforcement: It would be hard to ensure that all boaters leaving infested waters are inspected, no matter how carefully the stations are located and staffed. Some sort of tag or very visible flag or streamer would be beneficial to distinguish the boats that have been inspected. Costs: This concept has a lower relative cost estimate of $10,000,000 per year. Estimated costs in shown in Table 12. Table 12: Costs for Containment Zones – PRIVATIZED:
Privatization Potential. This concept has good potential for privatization. Inspection stations are located in high use containment zones.
7. Self-Inspection/Certification Description: This concept requires an inspection for all boats that are launched at public and private accesses. It utilizes “citizen” inspectors that are trained and certified
Concept C: Inspect All Leaving Zebra Mussel Infested Lakes - Centralized Stations - PRIVATIZED
Total number of boat accesses infested with zebra mussels
Public Access 118
Private Accesses 215
TOTAL 333
Total number of PUBLIC stations statewide Total number of PRIVATE stations statewide
12 42
Public Stations
Labor for
one
station labor costs
Year One
equipment
cost per
station
Year One Total
Equipment
Year Two
equipment cost
per station
Year Two Total
Equipment
0.00% Minimum Stations 0 @ $101,443 equals $0 $37,227 $0 $23,727 $0
60.00% Medium Stations 7 @ $172,752 equals $1,243,818 $45,666 $328,798 $32,166 $231,598
40.00% Mega Stations 5 @ $327,944 equals $1,574,129 $767,455 $3,683,782 $137,455 $659,782
Totals $1,243,818 $4,012,580 $891,380
Commercial Stations
Training
Costs for
one
station
Total Training
Costs
80.00% Minimum Stations 34 @ $2,789 equals $94,209
15.00% Medium Stations 6 @ $4,750 equals $30,081
5.00% Mega Stations 2 @ $9,017 equals $19,035
Total training Costs for all stations $143,325
GRAND TOTAL YEAR ONE $5,831,700
GRAND TOTAL YEAR TWO $2,460,804
MN DNR AIS Spread Prevention Study February 2012
Page 31 of 71 ©2012TEC
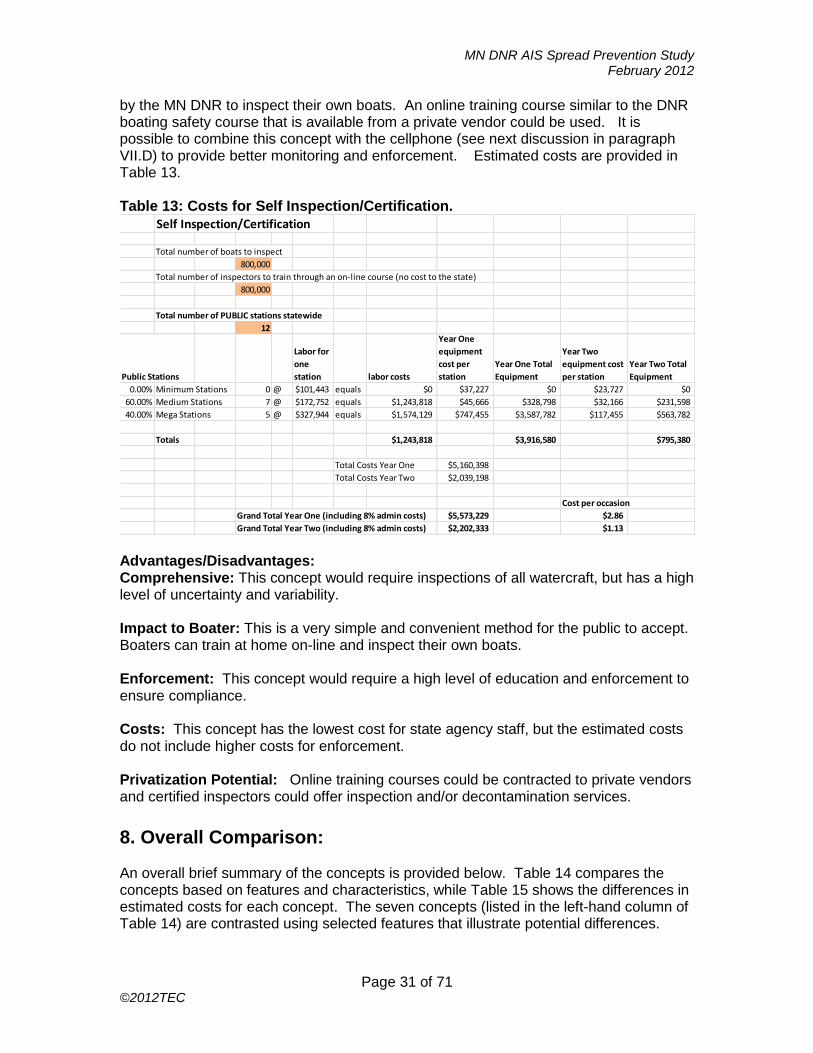
by the MN DNR to inspect their own boats. An online training course similar to the DNR boating safety course that is available from a private vendor could be used. It is possible to combine this concept with the cellphone (see next discussion in paragraph VII.D) to provide better monitoring and enforcement. Estimated costs are provided in Table 13. Table 13: Costs for Self Inspection/Certification.
Advantages/Disadvantages: Comprehensive: This concept would require inspections of all watercraft, but has a high level of uncertainty and variability. Impact to Boater: This is a very simple and convenient method for the public to accept. Boaters can train at home on-line and inspect their own boats. Enforcement: This concept would require a high level of education and enforcement to ensure compliance. Costs: This concept has the lowest cost for state agency staff, but the estimated costs do not include higher costs for enforcement. Privatization Potential: Online training courses could be contracted to private vendors and certified inspectors could offer inspection and/or decontamination services.
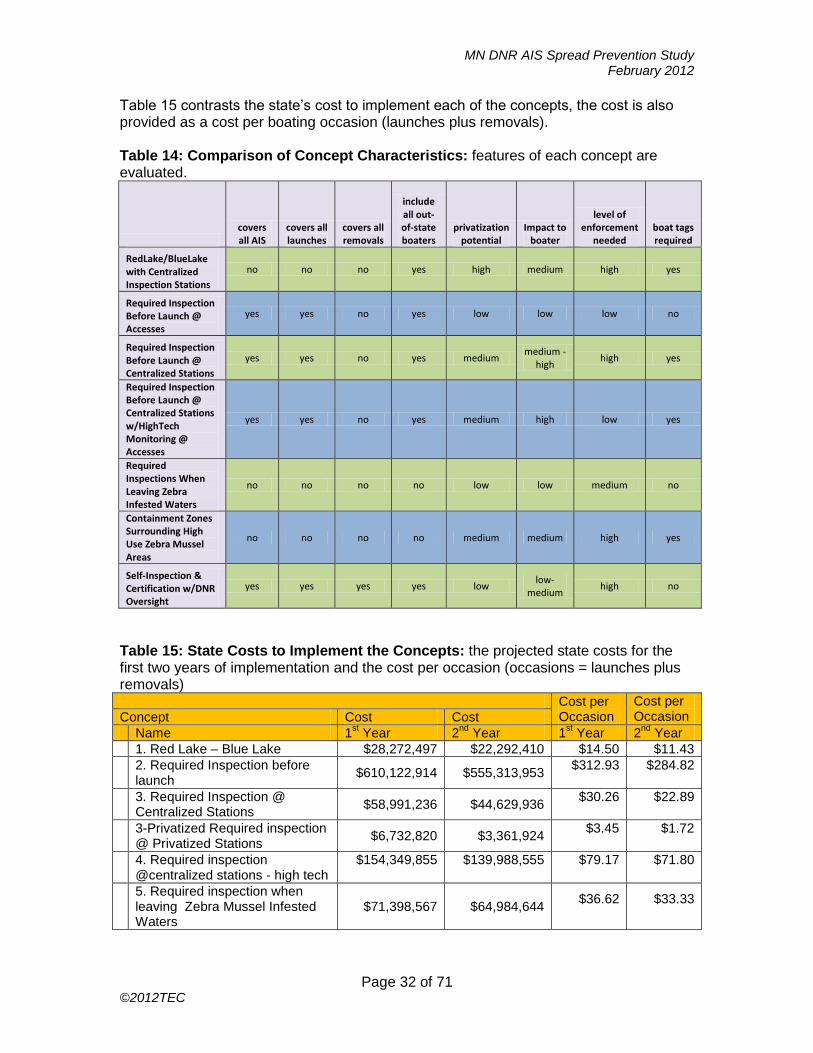
8. Overall Comparison: An overall brief summary of the concepts is provided below. Table 14 compares the concepts based on features and characteristics, while Table 15 shows the differences in estimated costs for each concept. The seven concepts (listed in the left-hand column of Table 14) are contrasted using selected features that illustrate potential differences.
Self Inspection/Certification
Total number of boats to inspect
800,000
Total number of inspectors to train through an on-line course (no cost to the state)
800,000
Total number of PUBLIC stations statewide
12
Public Stations
Labor for
one
station labor costs
Year One
equipment
cost per
station
Year One Total
Equipment
Year Two
equipment cost
per station
Year Two Total
Equipment
0.00% Minimum Stations 0 @ $101,443 equals $0 $37,227 $0 $23,727 $0
60.00% Medium Stations 7 @ $172,752 equals $1,243,818 $45,666 $328,798 $32,166 $231,598
40.00% Mega Stations 5 @ $327,944 equals $1,574,129 $747,455 $3,587,782 $117,455 $563,782
Totals $1,243,818 $3,916,580 $795,380
Total Costs Year One $5,160,398
Total Costs Year Two $2,039,198
Cost per occasion
Grand Total Year One (including 8% admin costs) $5,573,229 $2.86
Grand Total Year Two (including 8% admin costs) $2,202,333 $1.13
MN DNR AIS Spread Prevention Study February 2012
Page 32 of 71 ©2012TEC
Table 15 contrasts the state’s cost to implement each of the concepts, the cost is also provided as a cost per boating occasion (launches plus removals). Table 14: Comparison of Concept Characteristics: features of each concept are evaluated.
covers all AIS
covers all launches
covers all removals
include all out-of-state boaters
privatization potential
Impact to boater
level of enforcement
needed boat tags required
RedLake/BlueLake with Centralized Inspection Stations
no no no yes high medium high yes
Required Inspection Before Launch @ Accesses
yes yes no yes low low low no
Required Inspection Before Launch @ Centralized Stations
yes yes no yes medium medium -
high high yes
Required Inspection Before Launch @ Centralized Stations w/HighTech Monitoring @ Accesses
yes yes no yes medium high low yes
Required Inspections When Leaving Zebra Infested Waters
no no no no low low medium no
Containment Zones Surrounding High Use Zebra Mussel Areas
no no no no medium medium high yes
Self-Inspection & Certification w/DNR Oversight
yes yes yes yes low low-
medium high no
Table 15: State Costs to Implement the Concepts: the projected state costs for the first two years of implementation and the cost per occasion (occasions = launches plus removals) Cost per
Occasion
Cost per Occasion Concept Cost Cost
Name 1st Year 2
nd Year 1
st Year 2
nd Year
1. Red Lake – Blue Lake $28,272,497 $22,292,410 $14.50 $11.43
2. Required Inspection before launch
$610,122,914 $555,313,953 $312.93 $284.82
3. Required Inspection @ Centralized Stations
$58,991,236 $44,629,936 $30.26 $22.89
3-Privatized Required inspection @ Privatized Stations
$6,732,820 $3,361,924 $3.45 $1.72
4. Required inspection @centralized stations - high tech
$154,349,855 $139,988,555 $79.17 $71.80
5. Required inspection when leaving Zebra Mussel Infested Waters
$71,398,567 $64,984,644 $36.62 $33.33

MN DNR AIS Spread Prevention Study February 2012
Page 33 of 71 ©2012TEC
Cost per Occasion
Cost per Occasion Concept Cost Cost
Name 1st Year 2
nd Year 1
st Year 2
nd Year
6. Containment Zones $9,729,477 $8,938,959 $4.99 $4.58
6-Privatized Containment zones with private inspections
$5,831,700 $2,460,804 $2.99 $1.26
7. Self-Inspection/ certifications $11,220,909 $7,850,013 $5.76 $4.03
7-Privatized Self-Inspection/ certifications with Cellphone application
$360,000 $270,000 N/A N/A
VII. Discussion of Technologies to Support AIS Prevention A. Technology Based Concepts. Various types of technology can be used to automate or remotely monitor and restrict the movement of AIS from infested lakes to un-infested lakes. In selected cases, technology based solutions may offset the cost of having actual inspectors at low usage sites. An automated system can also provide an information warehouse for watercraft launchings and removals at public and private waterbody accesses. Technology improvements in radio frequency identification (RFID), wireless networks, website internet access, solar power, and video capture provide attractive options to integrate an electronic tagging and monitoring system into any of the proposed concepts. Often a hybrid system will be required where part of the system is technology based and supports another part of the monitoring and enforcement program that remains staffed by DNR personnel. Several types of technology were considered for possible employment to assist in the prevention of the spread of AIS. These included RFID tags for each inspected boat and RFID readers at public and private accesses; wireless access, solar power, and website accessed database for observing compliance and monitoring the system. This concept was priced and is included in the concept evaluation section above as “Required Inspection before Launch @ Centralized Stations w/High Tech Monitoring @ Accesses.” The high tech concept also included automatic gates at each access that would deny access unless the proper inspection had been completed. Other technologies that were investigated and would prove to be feasible are an electronic ticketing system (similar to federal and state parks), cellphone monitoring applications, and magnetic loops (similar to traffic signals at intersections) with photo eye motion sensor cameras and coded gates at selected accesses. In addition, there are several types of tagging watercraft to demonstrate inspection and/or decontamination is completed; such as wire tags (similar to what is used on ballot boxes) that are used in a couple of western states, red/blue tags (adhesive style), and the aforementioned RFID tags. For this section, a cellphone application and solution is described as another way to use technology in the prevention of the spread of AIS. All of the technology based concepts can be utilized as hybrids with the fully staffed concepts. The technologies can be tailored and matched to particular geographic or regional areas for remote accesses or high use accesses. All of the high tech systems

MN DNR AIS Spread Prevention Study February 2012
Page 34 of 71 ©2012TEC
and equipment will require testing and evaluation in the field before implementation. An evaluation period is recommended based on boater behavior and convenience measured against cost is appropriate. B. RFID & Automatic Gates. This technology requires each watercraft to have a unique radio frequency identification tag fastened to the watercraft. The tag needs to be mounted so that it can read easily by an RFID reader as the watercraft is launched or removed from the water body at a public and private/commercial access. This works similar to the MNPass system for toll roads. The information on the RFID tag identifies the watercraft and when/where the watercraft was inspected and/or decontaminated. It could also contain the water body and access from the previous use of the watercraft. The information is downloaded into a database and is transmitted to a system web site where the watercraft can be certified for access to that water body and access. If all is approved, the automatic gate is raised to allow the boat to launch. Various alerts, monitoring options, and enforcement strategies can be used to assist in the preventing uninspected or unknown boats from entering either infested waters or uninfested waters. See Attachment B for additional information. C. Tagging systems. A tag indicating proof of an inspection is attached to the watercraft and trailer. The tag is detached when the watercraft is launched. The watercraft must be inspected and receive a new tag before launching again. See Figure 14. A tagging system for a red lake/blue lake concept would involve an adhesive tag with the appropriate color that is displayed on the boat in a place that is easily visible. . The color of the tag allows non-compliant watercraft to be easily identified. An inspection and new tag would be needed to go from a red (infested) lake to a blue (uninfested) lake or from a blue lake to a red lake. To use the tag, pass sealing wire through two holes in plastic body and press plunger with hand until it clicks and the unit is sealed. Cannot be opened unless the seal is destroyed. The wire tag is shown at right (see Figure 13). It can be any color, printing on each side. They range in price from $0.40 - $1.00 each. Data and figure are from AC&M Manufacturing website. Self-Locking Plastic Seal for use with wire. The plastic seal is supplied with lettering and numbering. Made with styrene or acetyl plastic with stainless steel locking plunger.
Figure 13: Wire Tag Example

MN DNR AIS Spread Prevention Study February 2012
Page 35 of 71 ©2012TEC
D. Cellphone Application. Another method to help monitor, enforce, and gather information on boating behavior to prevent the spread of AIS is to use a cellphone application with a backend database and secure web site graphical user interface. Description: This method requires each boater to have a cellphone capable of downloading a MN DNR application (although the registration/launch requests can be done from any internet connection). The application is required to register each unique watercraft. The application walks the boater through the registration process, thereby loading the boat characteristics into a database. The boater is required to log-in and request access each time the boat is launched or removed from a Minnesota water body at a public or private access. The application then records date, time, location, point of last inspection and/or decontamination, most recent lake access, etc. At the same time, the boater can be reminded by the application of the steps necessary to complete an inspection, where the nearest inspection station or decontamination station is located, other basic information regarding that boating occasion. This method could be used as an interim measure before implementing one of the other concepts. Figure 14 below illustrates this concept.
Cellphone withApplication
Cellphone withApplication
Boating Occasion
Boater
GPS SatelliteGPS Satellite
Cell TowerCell Tower
Internet
Website AIS Application
DNR Database
Website AIS Application
DNR Database
Figure 14: Cellphone Approach
The web site can control the access by warning the boater (on the cellphone) not to use this access unless an inspection is conducted, notify the boater which invasive species are present in that water body, alert enforcement officers of a possible violation and access location. In addition, it would assist the DNR in tracking boater movement, boating occasions, and enforcement.
• Online training for the boat owners to inspect and what to do if decontamination is needed.
MN DNR AIS Spread Prevention Study February 2012
Page 36 of 71 ©2012TEC
• Cell phone app to login to the data base and input the lake & access in question. • Receive a check list of tasks to accomplish. • Send back a response and receive a confirmation to launch or a location to which
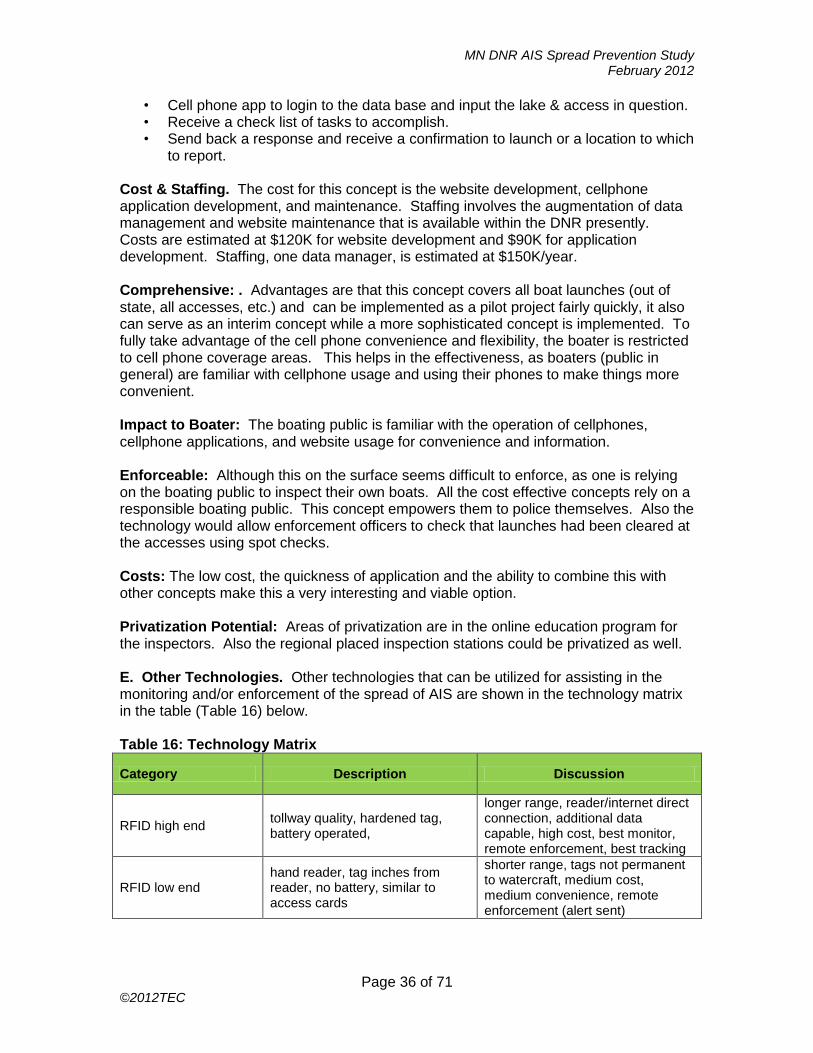
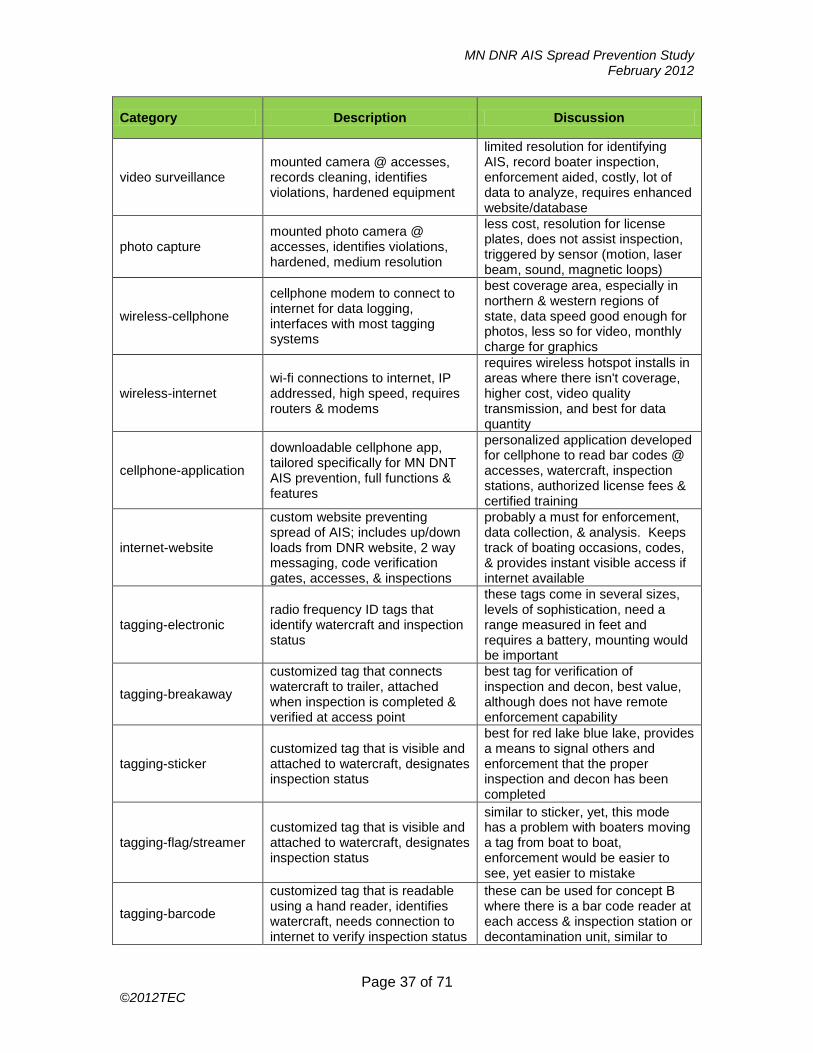
to report. Cost & Staffing. The cost for this concept is the website development, cellphone application development, and maintenance. Staffing involves the augmentation of data management and website maintenance that is available within the DNR presently. Costs are estimated at $120K for website development and $90K for application development. Staffing, one data manager, is estimated at $150K/year. Comprehensive: . Advantages are that this concept covers all boat launches (out of state, all accesses, etc.) and can be implemented as a pilot project fairly quickly, it also can serve as an interim concept while a more sophisticated concept is implemented. To fully take advantage of the cell phone convenience and flexibility, the boater is restricted to cell phone coverage areas. This helps in the effectiveness, as boaters (public in general) are familiar with cellphone usage and using their phones to make things more convenient. Impact to Boater: The boating public is familiar with the operation of cellphones, cellphone applications, and website usage for convenience and information. Enforceable: Although this on the surface seems difficult to enforce, as one is relying on the boating public to inspect their own boats. All the cost effective concepts rely on a responsible boating public. This concept empowers them to police themselves. Also the technology would allow enforcement officers to check that launches had been cleared at the accesses using spot checks. Costs: The low cost, the quickness of application and the ability to combine this with other concepts make this a very interesting and viable option. Privatization Potential: Areas of privatization are in the online education program for the inspectors. Also the regional placed inspection stations could be privatized as well. E. Other Technologies. Other technologies that can be utilized for assisting in the monitoring and/or enforcement of the spread of AIS are shown in the technology matrix in the table (Table 16) below. Table 16: Technology Matrix
Category Description Discussion
RFID high end tollway quality, hardened tag, battery operated,
longer range, reader/internet direct connection, additional data capable, high cost, best monitor, remote enforcement, best tracking
RFID low end hand reader, tag inches from reader, no battery, similar to access cards
shorter range, tags not permanent to watercraft, medium cost, medium convenience, remote enforcement (alert sent)
MN DNR AIS Spread Prevention Study February 2012
Page 37 of 71 ©2012TEC
Category Description Discussion
video surveillance mounted camera @ accesses, records cleaning, identifies violations, hardened equipment
limited resolution for identifying AIS, record boater inspection, enforcement aided, costly, lot of data to analyze, requires enhanced website/database
photo capture mounted photo camera @ accesses, identifies violations, hardened, medium resolution
less cost, resolution for license plates, does not assist inspection, triggered by sensor (motion, laser beam, sound, magnetic loops)
wireless-cellphone
cellphone modem to connect to internet for data logging, interfaces with most tagging systems
best coverage area, especially in northern & western regions of state, data speed good enough for photos, less so for video, monthly charge for graphics
wireless-internet wi-fi connections to internet, IP addressed, high speed, requires routers & modems
requires wireless hotspot installs in areas where there isn't coverage, higher cost, video quality transmission, and best for data quantity
cellphone-application
downloadable cellphone app, tailored specifically for MN DNT AIS prevention, full functions & features
personalized application developed for cellphone to read bar codes @ accesses, watercraft, inspection stations, authorized license fees & certified training
internet-website
custom website preventing spread of AIS; includes up/down loads from DNR website, 2 way messaging, code verification gates, accesses, & inspections
probably a must for enforcement, data collection, & analysis. Keeps track of boating occasions, codes, & provides instant visible access if internet available
tagging-electronic radio frequency ID tags that identify watercraft and inspection status
these tags come in several sizes, levels of sophistication, need a range measured in feet and requires a battery, mounting would be important
tagging-breakaway
customized tag that connects watercraft to trailer, attached when inspection is completed & verified at access point
best tag for verification of inspection and decon, best value, although does not have remote enforcement capability
tagging-sticker customized tag that is visible and attached to watercraft, designates inspection status
best for red lake blue lake, provides a means to signal others and enforcement that the proper inspection and decon has been completed
tagging-flag/streamer customized tag that is visible and attached to watercraft, designates inspection status
similar to sticker, yet, this mode has a problem with boaters moving a tag from boat to boat, enforcement would be easier to see, yet easier to mistake
tagging-barcode
customized tag that is readable using a hand reader, identifies watercraft, needs connection to internet to verify inspection status
these can be used for concept B where there is a bar code reader at each access & inspection station or decontamination unit, similar to

MN DNR AIS Spread Prevention Study February 2012
Page 38 of 71 ©2012TEC
Category Description Discussion
RFID except barcode
access gate code
gate has a keypad for entering a unique code for each boater assigned at an inspection station, code is entered to open the gate and launch boat
feasible, cost of gates are biggest detriment, proven technology & enforcement is easier, breaking the law would be evident by more than one boat
access gate application
necessary to keep the gate operations accurate and track movement of boaters, inspection status, number of occasions
the web site is not trivial, requires customization for DNR & AIS operation. Several options on how extensive the site is and what needs visibility
cellphone-application
requires a unique cellphone for each boat, the cellphone must be with the boat to launch and remove, app for AIS
probably one of the least expensive ways to manage boating access, app registers boats that are inspected, location, & provides boaters text information

MN DNR AIS Spread Prevention Study February 2012
Page 39 of 71 ©2012TEC
VIII. Conclusion The prevention concepts evaluated illustrate the complexity of preventing the spread of AIS. There are different types of programs such as educational, voluntary inspections, and mandatory inspections (Minnesota has all three of these) and many ways to fund these efforts (taxes, license fees, fees to boaters, etc.). The purpose of this report has been to focus on one aspect of this program, how much it would cost the state to implement specific AIS prevention strategies. The following has been learned:
An inspection station at every access or a gate at every access is cost prohibitive.
Centralizing the inspection stations lowers the overall resources required; but requires boaters to transport their watercraft to an inspection station.
A strategy for inspecting high risk boats or equipment (e.g. ones leaving zebra mussel infested waters; red lake- blue lake) has potential to be cost effective approach for individual species.
Technology can be useful and reduce costs, but its implementation must be carefully planned. For example using cell phone technology to connect citizen inspectors to a central data base and/or using online inspection instruction are very cost effective, but this strategy must be accompanied by an aggressive education program and effective enforcement.
Privatization can be an effective way to utilize the private sector, reduce State costs and use the market to keep overall costs competitive.
Preventing the spread of aquatic invasive species is a serious challenge and better understanding of potential prevention strategies and costs are needed by the state of Minnesota to combat their spread. This report was intended to provide specific information on prevention strategies as requested by the MN DNR. Attachments: Attachment A: Boating Occasions Calculation Attachment B: RFID Monitoring Capability Information Attachment C: Model Worksheets Attachment D: Bibliography

MN DNR AIS Spread Prevention Study February 2012
Page 40 of 71 ©2012TEC
ATTACHMENT A: Number of Boating Occasions Determination This attachment provides additional information on how the number of boating occasions for the open waters season in Minnesota was derived. Accesses Watercraft Occasions (launches plus removals)
In order to determine the number of inspections that are required for each of the concept solutions, it is necessary to compute the total number of boat launches and removals.
The number of accesses, public and private, along with the results of several boating use studies,were used to compute the following estimate of public and private boating occasions per open waters season in MN. See Tables A-1, A-2, and A-3.
Table A-1 uses information collected from MN DNR boating use studies to determine the number of launches and removals per public access during the three time periods during open waters season (mid-April to Memorial Day, Memorial Day to Labor Day, and Labor Day to mid-November). The boating use studies were conducted over sample water bodies from each of the regions listed in the left hand column. Once the total public access (PA) occasions (launches & removals) per access have been computed, that number can be multiplied by the number of accesses to determine an estimate of the total number of boating occasions for the open water season executed at a public access. The total number of occasions is 1,346,402 (see Table A-2) conducted at 1,956 public accesses.
Table A-2 attempts to estimate the number of boating occasions executed from a private or commercial accesses during the open waters season as well as illustrate the number of boating occasions at public accesses. Again using the data collected from boating use studies; Table A-2 provides the number of boating occasions per commercial access. Then using percent boating resulting from private or commercial access, the number of boating occasions executed from private/commercial accesses during the open waters season is 593,280.
Table A-1: Data from Boating Use Studies
Data Gathered from MN DNR
mid Apr - Memorial
Day
Memorial to Labor
Day
Labor Day - mid Nov
total PA occasions per
access
public accesses
Spring Summer Fall
Minnetonka 608 3523 1094 5225 10
Mille Lacs 342 1885 616 2843 12
Mississippi 153 886 275 1313 93
Twin Cities 183 1058 329 1569 176
West 103 597 186 886 265
North Central 92 536 166 794 230
Central 97 563 175 835 202
Northern 44 254 79 377 968
TOTALS 1,622 9,302 2,919 1,956

MN DNR AIS Spread Prevention Study February 2012
Page 41 of 71 ©2012TEC
Table A-2: Estimated Number of Watercraft Occasions per Open Waters Season
Data Gathered from MN DNR
public accesses
public access
occasions
percent public access boating
commercial access
occasions
percent commercial
access boating
Minnetonka 10 52,251 30.00% 60,959 35.00%
Mille Lacs 12 34,111 41.00% 29,119 35.00%
Mississippi 93 42,971 45.00% 36,287 38.00%
Twin Cities 176 276,206 60.00% 46,034 10.00%
West 265 234,724 37.00% 120,534 19.00%
North Central 230 182,689 28.00% 150,066 23.00%
Central 202 168,660 47.00% 21,531 6.00%
Northern 968 364,791 34.00% 128,750 12.00%
TOTALS 1956 1,356,402 593,280
Table A-3 completes the source of boating use data by providing the number of accesses that may originate from other sources, particularly lakeshore resident boating ramps.
Table A-3: Information from MN DNR 2006 Boating Use Study
Data Gathered from MN DNR
percent public access boating
percent commercial
access boating* remainder** total
Minnetonka 30.00% 35.00% 35.00% 100%
Mille Lacs 41.00% 35.00% 24.00% 100%
Mississippi 45.00% 38.00% 17.00% 100%
Twin Cities 60.00% 10.00% 30.00% 100%
West 37.00% 19.00% 44.00% 100%
North Central 28.00% 23.00% 49.00% 100%
Central 47.00% 6.00% 47.00% 100%
Northern 34.00% 12.00% 54.00% 100%
* Resorts, private campgrounds, marinas
** Mainly lakeshore resident The result of this analysis is there are approximately 1,356,402 boating occasions form public accesses and 593,280 boating occasions from private/commercial accesses each year during the open waters season in Minnesota.
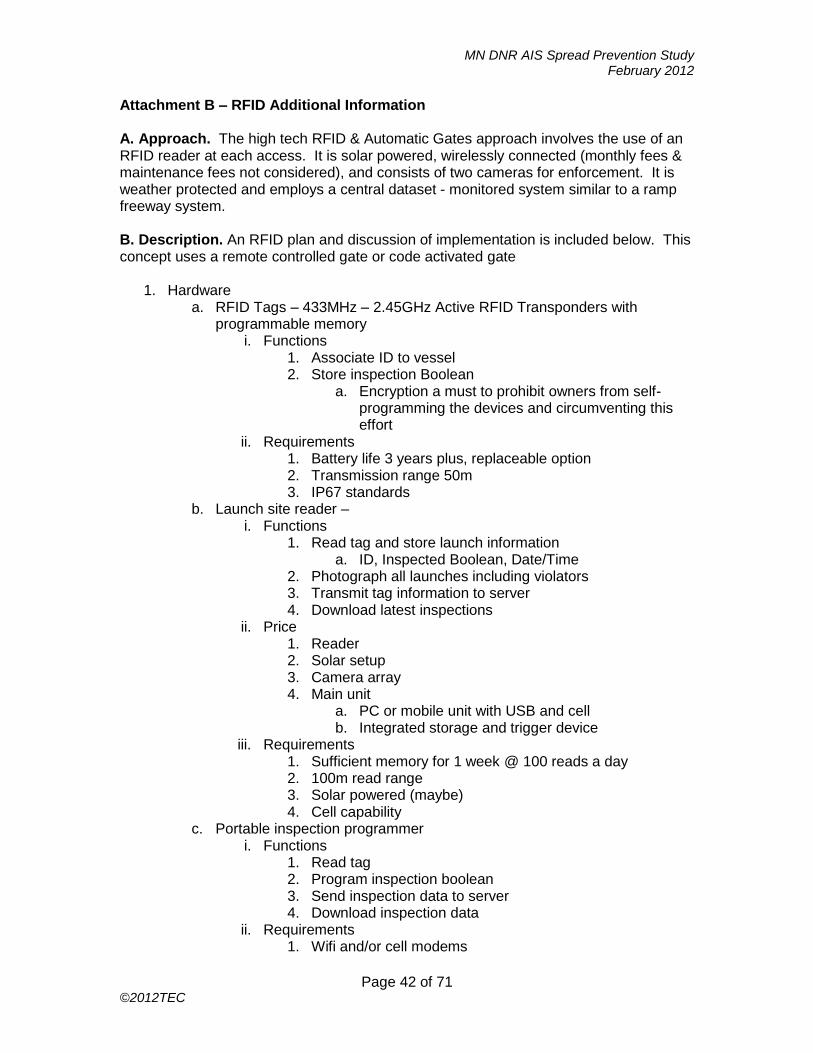
MN DNR AIS Spread Prevention Study February 2012
Page 42 of 71 ©2012TEC
Attachment B – RFID Additional Information A. Approach. The high tech RFID & Automatic Gates approach involves the use of an RFID reader at each access. It is solar powered, wirelessly connected (monthly fees & maintenance fees not considered), and consists of two cameras for enforcement. It is weather protected and employs a central dataset - monitored system similar to a ramp freeway system. B. Description. An RFID plan and discussion of implementation is included below. This concept uses a remote controlled gate or code activated gate
1. Hardware a. RFID Tags – 433MHz – 2.45GHz Active RFID Transponders with
programmable memory i. Functions
1. Associate ID to vessel 2. Store inspection Boolean
a. Encryption a must to prohibit owners from self-programming the devices and circumventing this effort
ii. Requirements 1. Battery life 3 years plus, replaceable option 2. Transmission range 50m 3. IP67 standards
b. Launch site reader – i. Functions
1. Read tag and store launch information a. ID, Inspected Boolean, Date/Time
2. Photograph all launches including violators 3. Transmit tag information to server 4. Download latest inspections
ii. Price 1. Reader 2. Solar setup 3. Camera array 4. Main unit
a. PC or mobile unit with USB and cell b. Integrated storage and trigger device
iii. Requirements 1. Sufficient memory for 1 week @ 100 reads a day 2. 100m read range 3. Solar powered (maybe) 4. Cell capability
c. Portable inspection programmer i. Functions
1. Read tag 2. Program inspection boolean 3. Send inspection data to server 4. Download inspection data
ii. Requirements 1. Wifi and/or cell modems
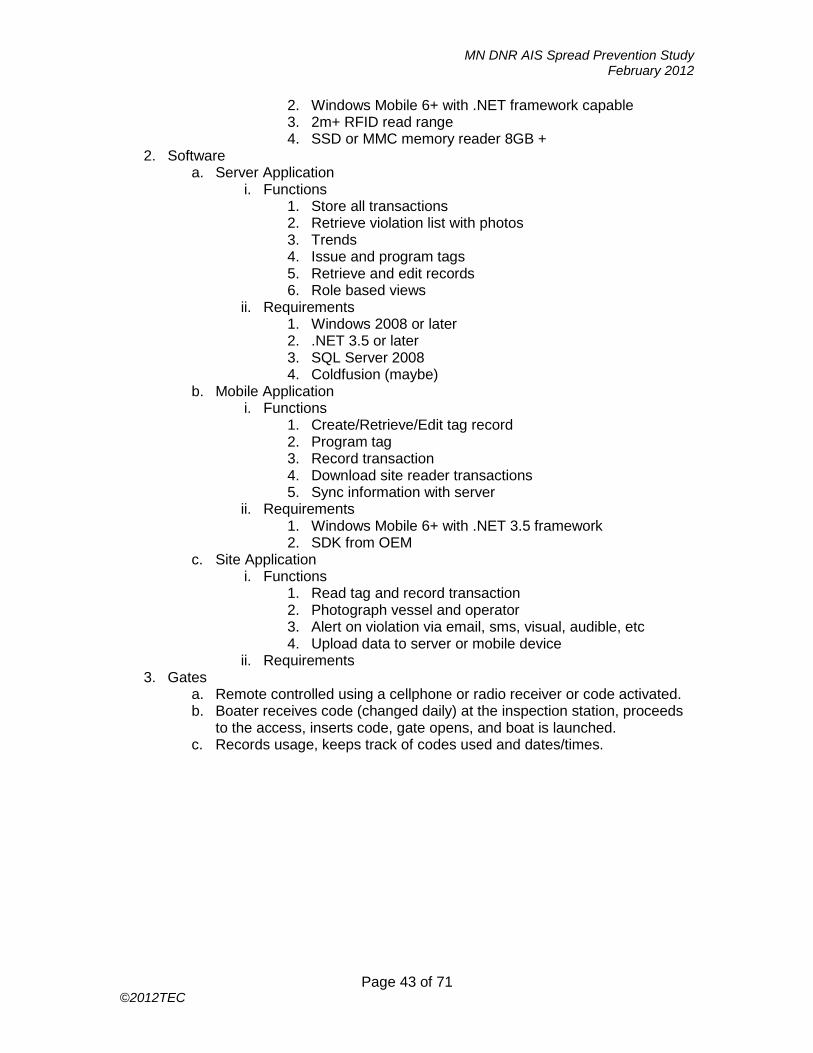
MN DNR AIS Spread Prevention Study February 2012
Page 43 of 71 ©2012TEC
2. Windows Mobile 6+ with .NET framework capable 3. 2m+ RFID read range 4. SSD or MMC memory reader 8GB +
2. Software a. Server Application
i. Functions 1. Store all transactions 2. Retrieve violation list with photos 3. Trends 4. Issue and program tags 5. Retrieve and edit records 6. Role based views
ii. Requirements 1. Windows 2008 or later 2. .NET 3.5 or later 3. SQL Server 2008 4. Coldfusion (maybe)
b. Mobile Application i. Functions
1. Create/Retrieve/Edit tag record 2. Program tag 3. Record transaction 4. Download site reader transactions 5. Sync information with server
ii. Requirements 1. Windows Mobile 6+ with .NET 3.5 framework 2. SDK from OEM
c. Site Application i. Functions
1. Read tag and record transaction 2. Photograph vessel and operator 3. Alert on violation via email, sms, visual, audible, etc 4. Upload data to server or mobile device
ii. Requirements 3. Gates
a. Remote controlled using a cellphone or radio receiver or code activated. b. Boater receives code (changed daily) at the inspection station, proceeds
to the access, inserts code, gate opens, and boat is launched. c. Records usage, keeps track of codes used and dates/times.

MN DNR AIS Spread Prevention Study February 2012
Page 44 of 71 ©2012TEC
Attachment A: MODEL
Identify Options and Costs for Implementing and Enforcing Statewide Measures to
Prevent the Spread of Aquatic Invasive Species
Prepared by
Thompson Engineering Company
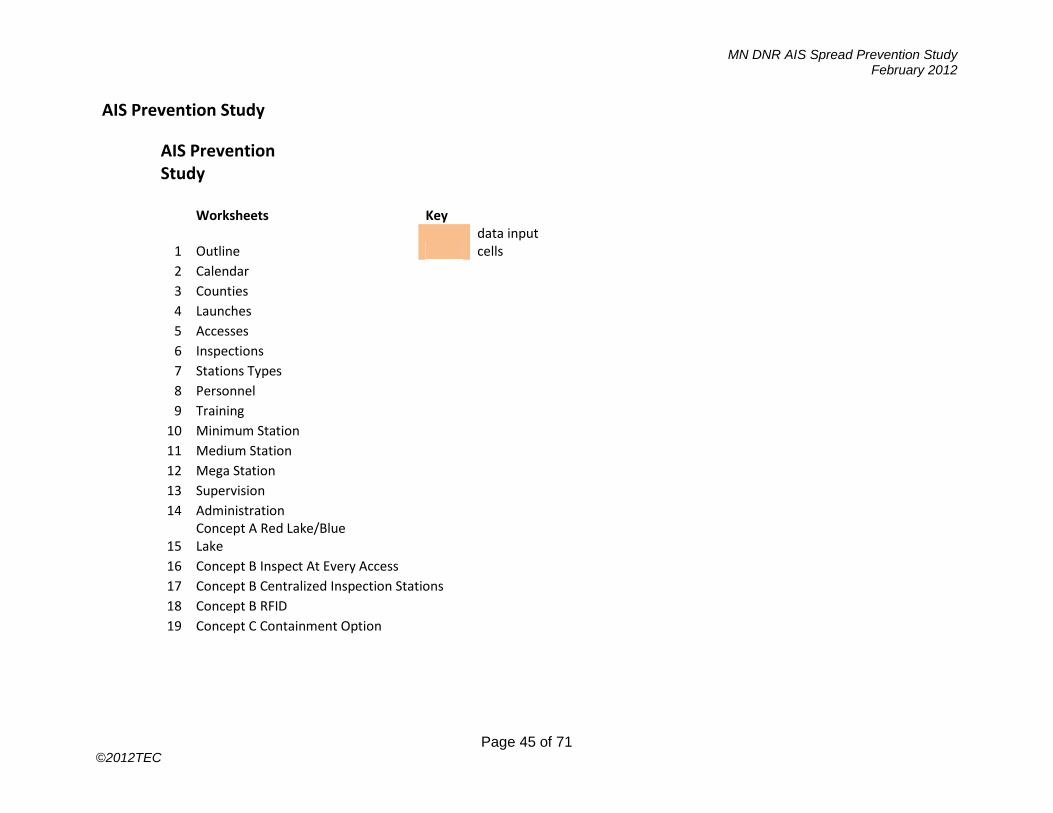
MN DNR AIS Spread Prevention Study February 2012
Page 45 of 71 ©2012TEC
AIS Prevention Study
AIS Prevention Study
Worksheets
Key
1 Outline
data input cells
2 Calendar
3 Counties
4 Launches
5 Accesses
6 Inspections
7 Stations Types
8 Personnel
9 Training
10 Minimum Station
11 Medium Station
12 Mega Station
13 Supervision
14 Administration
15
Concept A Red Lake/Blue Lake
16 Concept B Inspect At Every Access
17 Concept B Centralized Inspection Stations
18 Concept B RFID
19 Concept C Containment Option
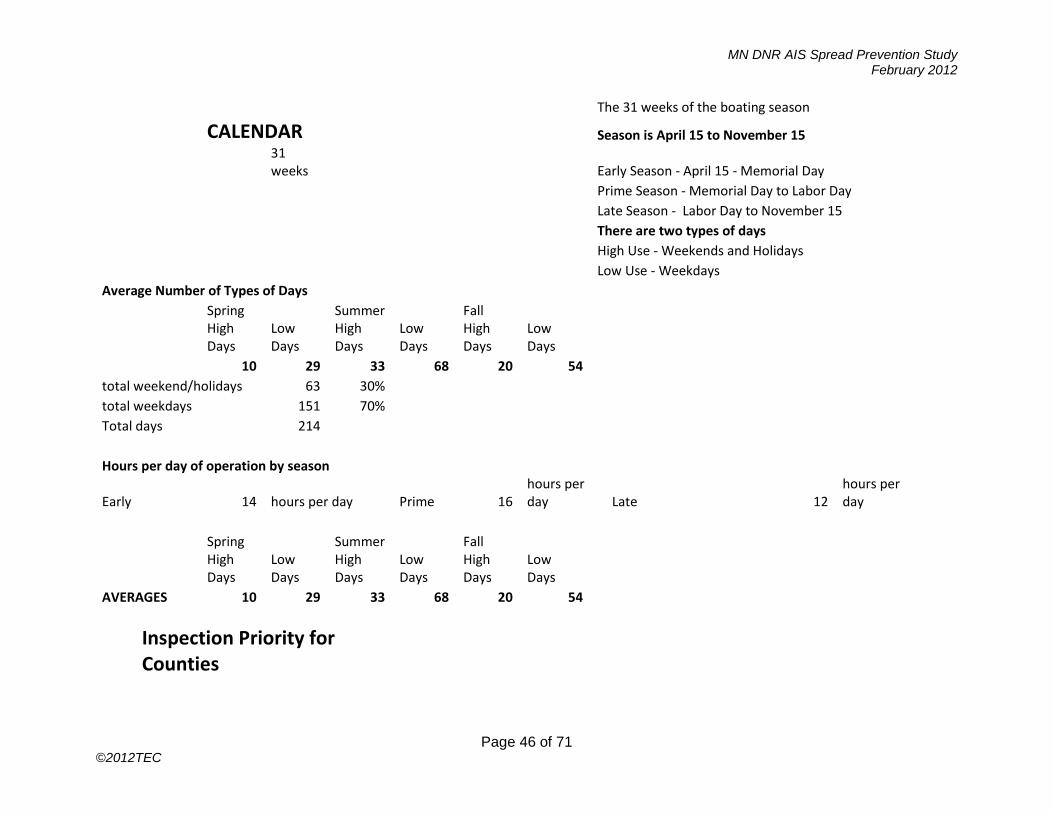
MN DNR AIS Spread Prevention Study February 2012
Page 46 of 71 ©2012TEC
The 31 weeks of the boating season
CALENDAR
Season is April 15 to November 15
31 weeks
Early Season - April 15 - Memorial Day
Prime Season - Memorial Day to Labor Day
Late Season - Labor Day to November 15
There are two types of days
High Use - Weekends and Holidays
Low Use - Weekdays
Average Number of Types of Days
Spring
Summer
Fall
High Days
Low Days
High Days
Low Days
High Days
Low Days
10 29 33 68 20 54
total weekend/holidays 63 30% total weekdays
151 70%
Total days
214
Hours per day of operation by season
Early 14 hours per day Prime 16 hours per day Late 12
hours per day
Spring
Summer
Fall
High Days
Low Days
High Days
Low Days
High Days
Low Days
AVERAGES 10 29 33 68 20 54
Inspection Priority for Counties
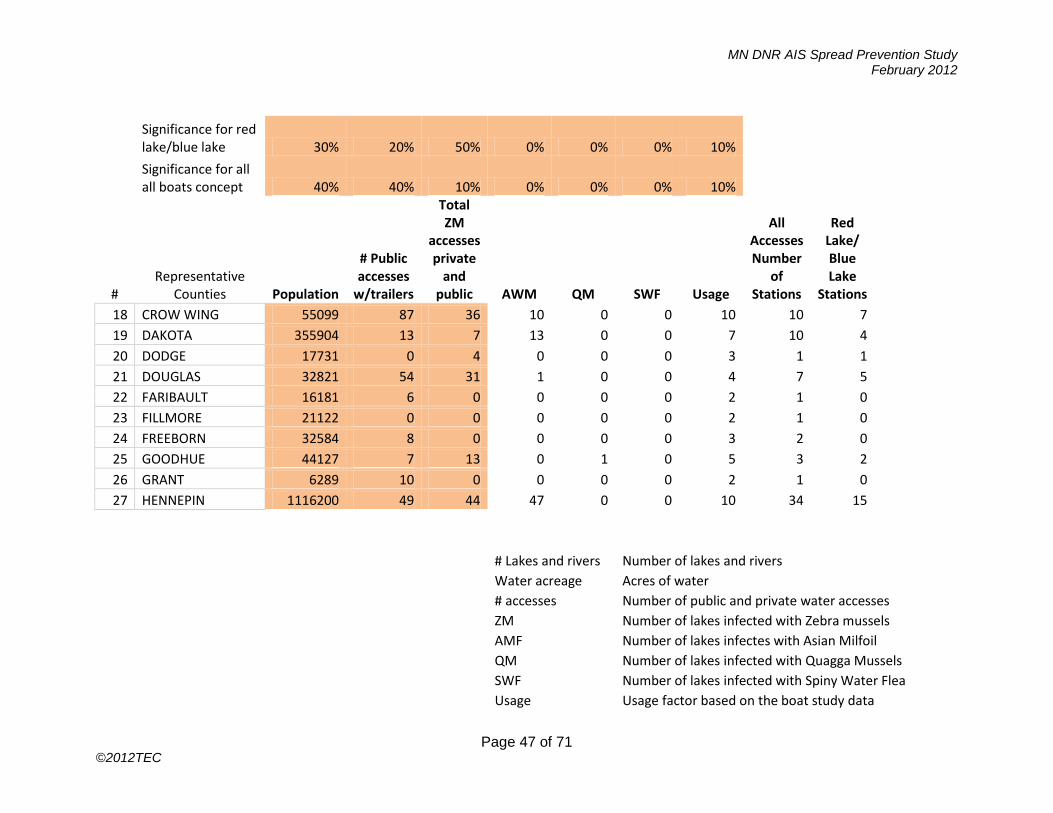
MN DNR AIS Spread Prevention Study February 2012
Page 47 of 71 ©2012TEC
Significance for red lake/blue lake 30% 20% 50% 0% 0% 0% 10%
Significance for all all boats concept 40% 40% 10% 0% 0% 0% 10%
# Representative
Counties Population
# Public accesses
w/trailers
Total ZM
accesses private
and public AWM QM SWF Usage
All Accesses Number
of Stations
Red Lake/ Blue Lake
Stations 18 CROW WING 55099 87 36 10 0 0 10 10 7 19 DAKOTA 355904 13 7 13 0 0 7 10 4 20 DODGE 17731 0 4 0 0 0 3 1 1 21 DOUGLAS 32821 54 31 1 0 0 4 7 5 22 FARIBAULT 16181 6 0 0 0 0 2 1 0 23 FILLMORE 21122 0 0 0 0 0 2 1 0 24 FREEBORN 32584 8 0 0 0 0 3 2 0 25 GOODHUE 44127 7 13 0 1 0 5 3 2 26 GRANT 6289 10 0 0 0 0 2 1 0 27 HENNEPIN 1116200 49 44 47 0 0 10 34 15
# Lakes and rivers Number of lakes and rivers
Water acreage Acres of water
# accesses Number of public and private water accesses
ZM
Number of lakes infected with Zebra mussels
AMF
Number of lakes infectes with Asian Milfoil
QM
Number of lakes infected with Quagga Mussels
SWF
Number of lakes infected with Spiny Water Flea
Usage
Usage factor based on the boat study data
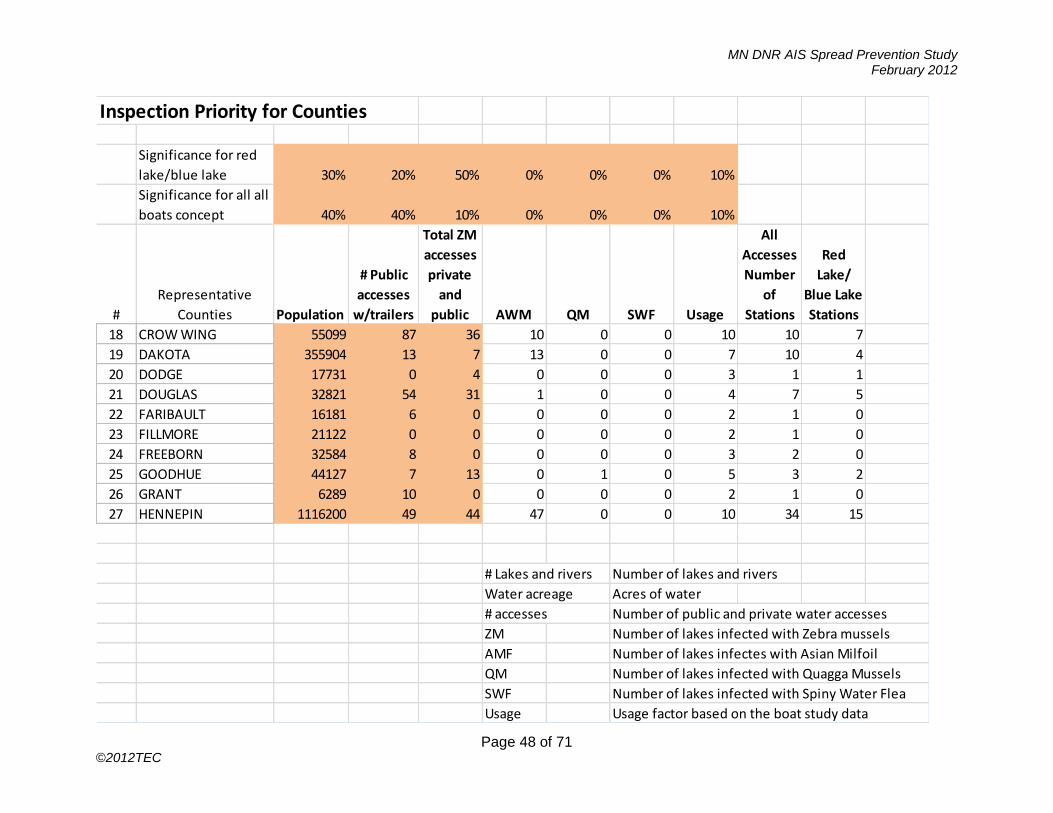
MN DNR AIS Spread Prevention Study February 2012
Page 48 of 71 ©2012TEC
Inspection Priority for Counties
Significance for red
lake/blue lake 30% 20% 50% 0% 0% 0% 10%
Significance for all all
boats concept 40% 40% 10% 0% 0% 0% 10%
#
Representative
Counties Population
# Public
accesses
w/trailers
Total ZM
accesses
private
and
public AWM QM SWF Usage
All
Accesses
Number
of
Stations
Red
Lake/
Blue Lake
Stations
18 CROW WING 55099 87 36 10 0 0 10 10 7
19 DAKOTA 355904 13 7 13 0 0 7 10 4
20 DODGE 17731 0 4 0 0 0 3 1 1
21 DOUGLAS 32821 54 31 1 0 0 4 7 5
22 FARIBAULT 16181 6 0 0 0 0 2 1 0
23 FILLMORE 21122 0 0 0 0 0 2 1 0
24 FREEBORN 32584 8 0 0 0 0 3 2 0
25 GOODHUE 44127 7 13 0 1 0 5 3 2
26 GRANT 6289 10 0 0 0 0 2 1 0
27 HENNEPIN 1116200 49 44 47 0 0 10 34 15
# Lakes and rivers Number of lakes and rivers
Water acreage Acres of water
# accesses Number of public and private water accesses
ZM Number of lakes infected with Zebra mussels
AMF Number of lakes infectes with Asian Milfoil
QM Number of lakes infected with Quagga Mussels
SWF Number of lakes infected with Spiny Water Flea
Usage Usage factor based on the boat study data

MN DNR AIS Spread Prevention Study February 2012
Page 49 of 71 ©2012TEC
Launches (or removals) at public accesses
mid Apr - Memorial
Day
Memorial to Labor
Day
Labor Day - mid Nov
total PA occasions
per access
public accesses
public access
occasions
percent public access boating
percent commercial
access boating
commercial access
occasions
Spring Summer Fall
Minnetonka 608 3523 1094 5225 10 52,251 30.00% 35.00% 60,959
Mille Lacs 342 1885 616 2843 12 34,111 41.00% 35.00% 29,119
Mississippi 153 886 275 1313 93 42,971 45.00% 38.00% 36,287
Twin Cities 183 1058 329 1569 176 276,206 60.00% 10.00% 46,034
West 103 597 186 886 265 234,724 37.00% 19.00% 120,534
North Central 92 536 166 794 230 182,689 28.00% 23.00% 150,066
Central 97 563 175 835 202 168,660 47.00% 6.00% 21,531
Northern 44 254 79 377 968 364,791 34.00% 12.00% 128,750
TOTALS 1622 9302 2919 1956 1,356,402 593,280
Percent of total 69.6%
30.4%
TOTAL OCCASIONS
1,949,681
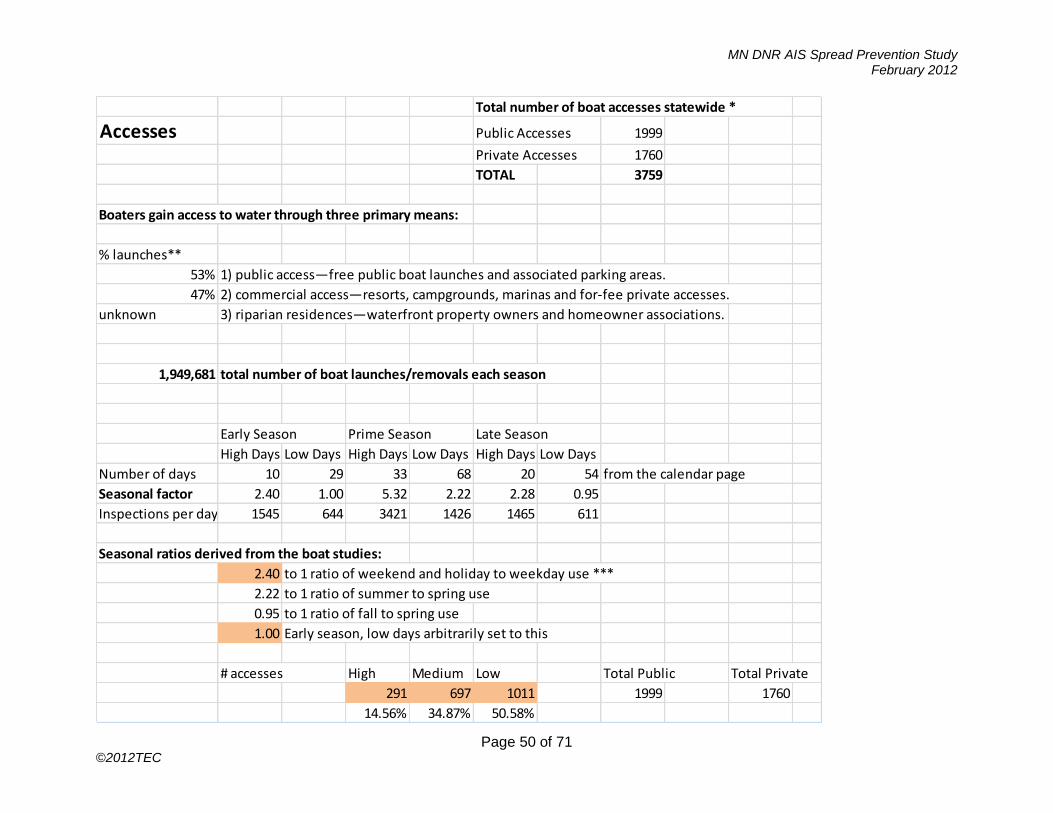
MN DNR AIS Spread Prevention Study February 2012
Page 50 of 71 ©2012TEC
Total number of boat accesses statewide *
Accesses Public Accesses 1999
Private Accesses 1760
TOTAL 3759
Boaters gain access to water through three primary means:
% launches**
53% 1) public access—free public boat launches and associated parking areas.
47% 2) commercial access—resorts, campgrounds, marinas and for-fee private accesses.
unknown 3) riparian residences—waterfront property owners and homeowner associations.
1,949,681 total number of boat launches/removals each season
Early Season Prime Season Late Season
High Days Low Days High Days Low Days High Days Low Days
Number of days 10 29 33 68 20 54 from the calendar page
Seasonal factor 2.40 1.00 5.32 2.22 2.28 0.95
Inspections per day 1545 644 3421 1426 1465 611
Seasonal ratios derived from the boat studies:
2.40 to 1 ratio of weekend and holiday to weekday use ***
2.22 to 1 ratio of summer to spring use
0.95 to 1 ratio of fall to spring use
1.00 Early season, low days arbitrarily set to this
# accesses High Medium Low Total Public Total Private
291 697 1011 1999 1760
14.56% 34.87% 50.58%
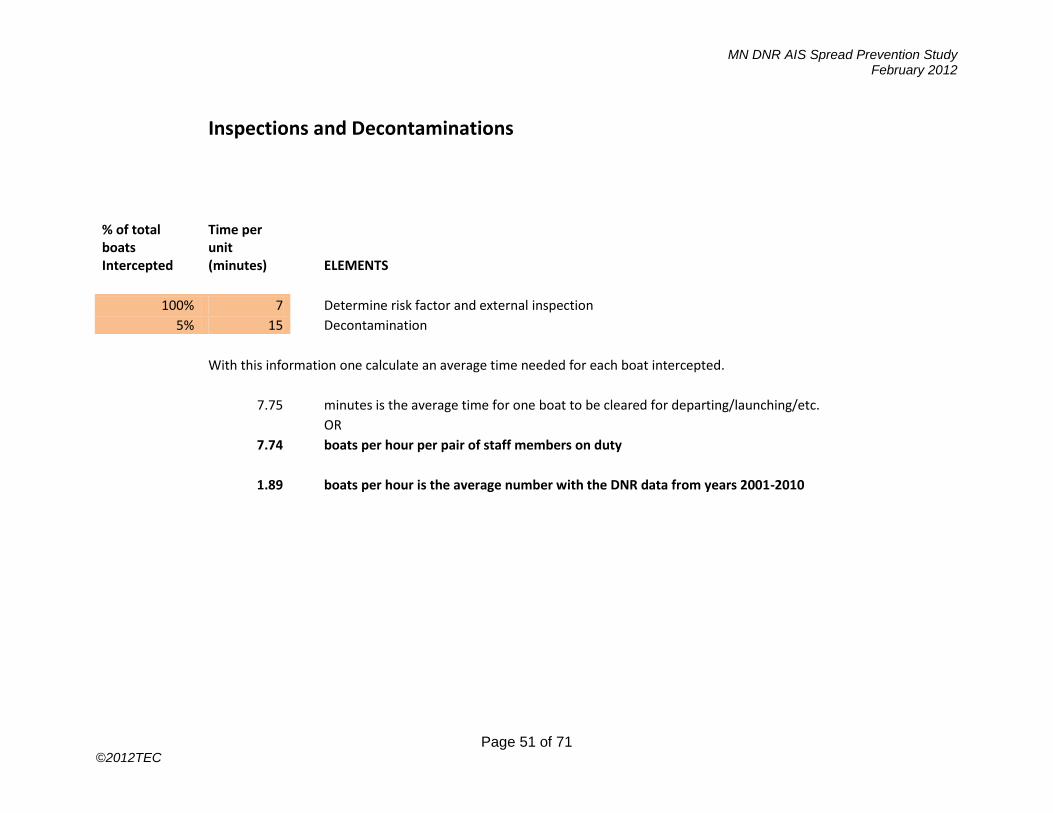
MN DNR AIS Spread Prevention Study February 2012
Page 51 of 71 ©2012TEC
Inspections and Decontaminations
% of total boats Intercepted
Time per unit (minutes)
ELEMENTS
100% 7
Determine risk factor and external inspection 5% 15
Decontamination
With this information one calculate an average time needed for each boat intercepted.
7.75
minutes is the average time for one boat to be cleared for departing/launching/etc.
OR
7.74
boats per hour per pair of staff members on duty
1.89
boats per hour is the average number with the DNR data from years 2001-2010
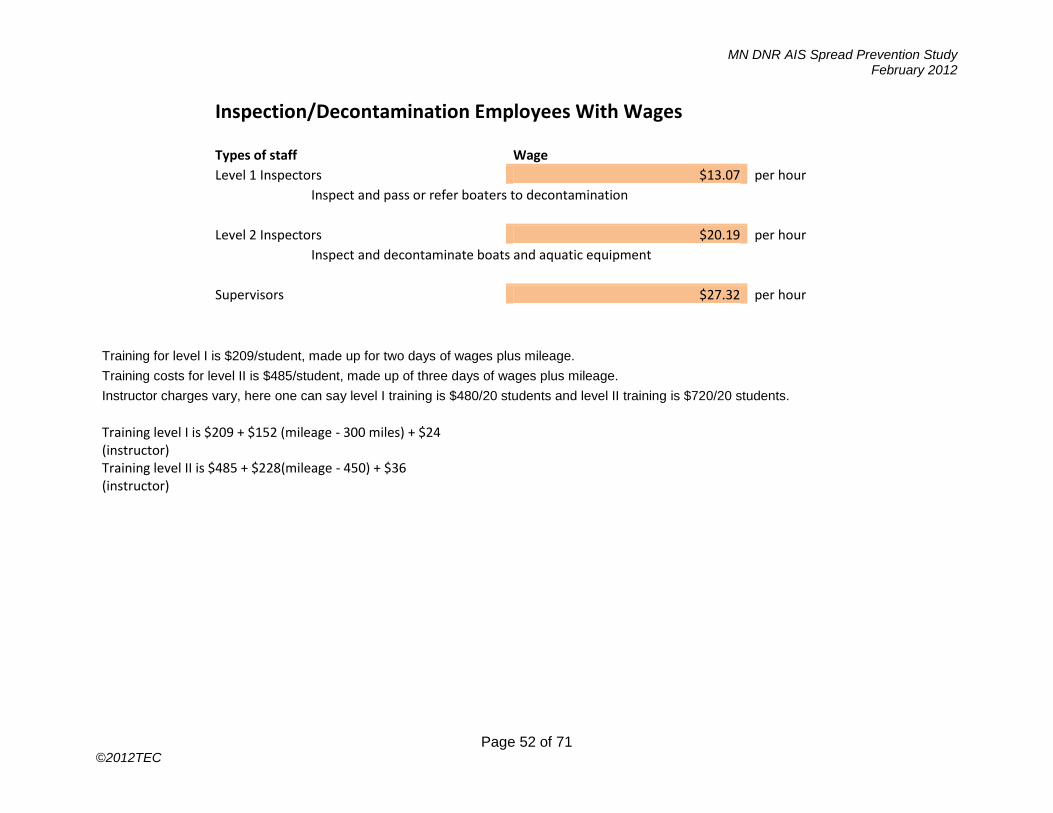
MN DNR AIS Spread Prevention Study February 2012
Page 52 of 71 ©2012TEC
Inspection/Decontamination Employees With Wages
Types of staff
Wage
Level 1 Inspectors
$13.07 per hour
Inspect and pass or refer boaters to decontamination
Level 2 Inspectors
$20.19 per hour
Inspect and decontaminate boats and aquatic equipment
Supervisors
$27.32 per hour
Training for level I is $209/student, made up for two days of wages plus mileage.
Training costs for level II is $485/student, made up of three days of wages plus mileage.
Instructor charges vary, here one can say level I training is $480/20 students and level II training is $720/20 students.
Training level I is $209 + $152 (mileage - 300 miles) + $24 (instructor)
Training level II is $485 + $228(mileage - 450) + $36 (instructor)
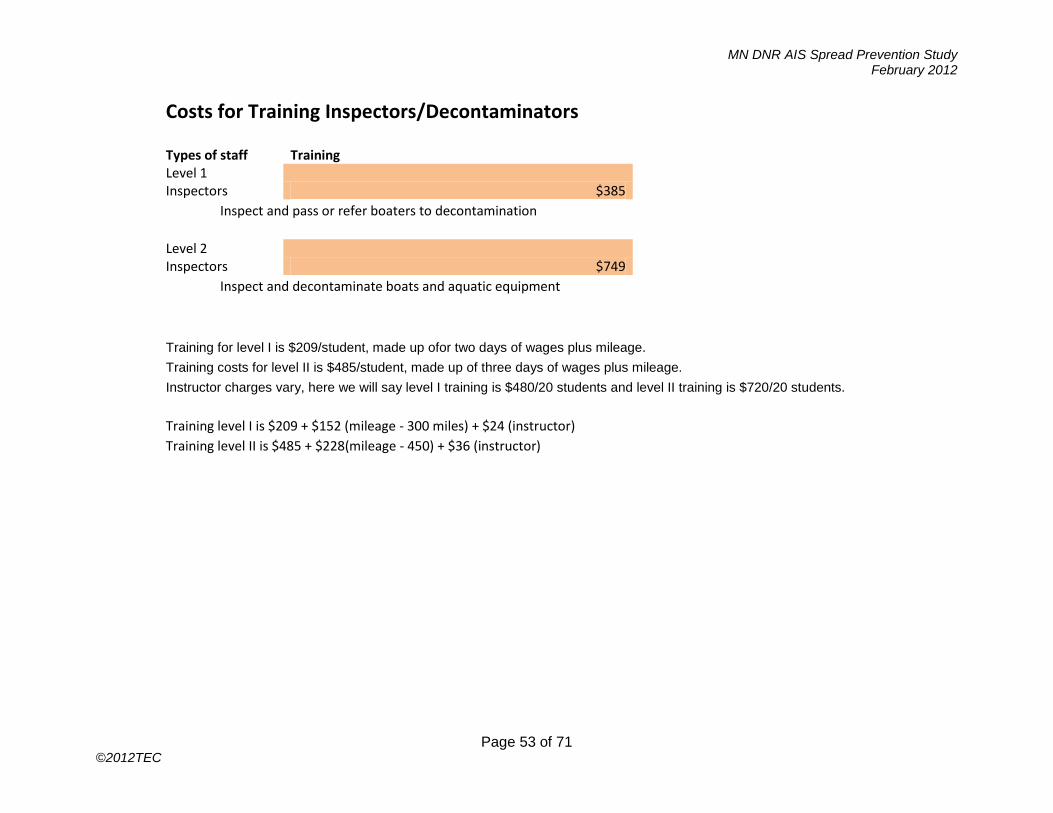
MN DNR AIS Spread Prevention Study February 2012
Page 53 of 71 ©2012TEC
Costs for Training Inspectors/Decontaminators
Types of staff
Training
Level 1 Inspectors
$385
Inspect and pass or refer boaters to decontamination
Level 2 Inspectors
$749
Inspect and decontaminate boats and aquatic equipment
Training for level I is $209/student, made up ofor two days of wages plus mileage.
Training costs for level II is $485/student, made up of three days of wages plus mileage.
Instructor charges vary, here we will say level I training is $480/20 students and level II training is $720/20 students.
Training level I is $209 + $152 (mileage - 300 miles) + $24 (instructor)
Training level II is $485 + $228(mileage - 450) + $36 (instructor)

MN DNR AIS Spread Prevention Study February 2012
Page 54 of 71 ©2012TEC
Minimum Inspection Station
One Level 1 staff member for the entire season of operation
Total boats inspected
3050 hours @ $13.07 equals $39,863.50
5,770
One Level 2 staff member for the entire season of operation
3050 hours @ $20.19 equals $61,579.50
TOTALS 6100 hours worked
$101,443.00
Total staffing costs per station

MN DNR AIS Spread Prevention Study February 2012
Page 55 of 71 ©2012TEC
Medium Station
Level 2 hours for entire season
Total boats inspected
3050 hours @ $20.19 equals $61,580 5770
Level 1 hours for entire season
3050 hours @ $13.07 equals $39,864
Level 2 hours for the summer only
1616 hours @ $20.19 equals $32,627 3057
Level 1 hours for the summer only
1616 hours @ $13.07 equals $21,121
Level 2 hours for weekend/holidays in the summer
528 hours @ $20.19 equals $10,660 999
Level 1 hours for weekend/holidays in the summer
528 hours @ $13.07 equals $6,901
10388 hours worked
$172,752
Total staffing costs per station
Total boats inspected 9826
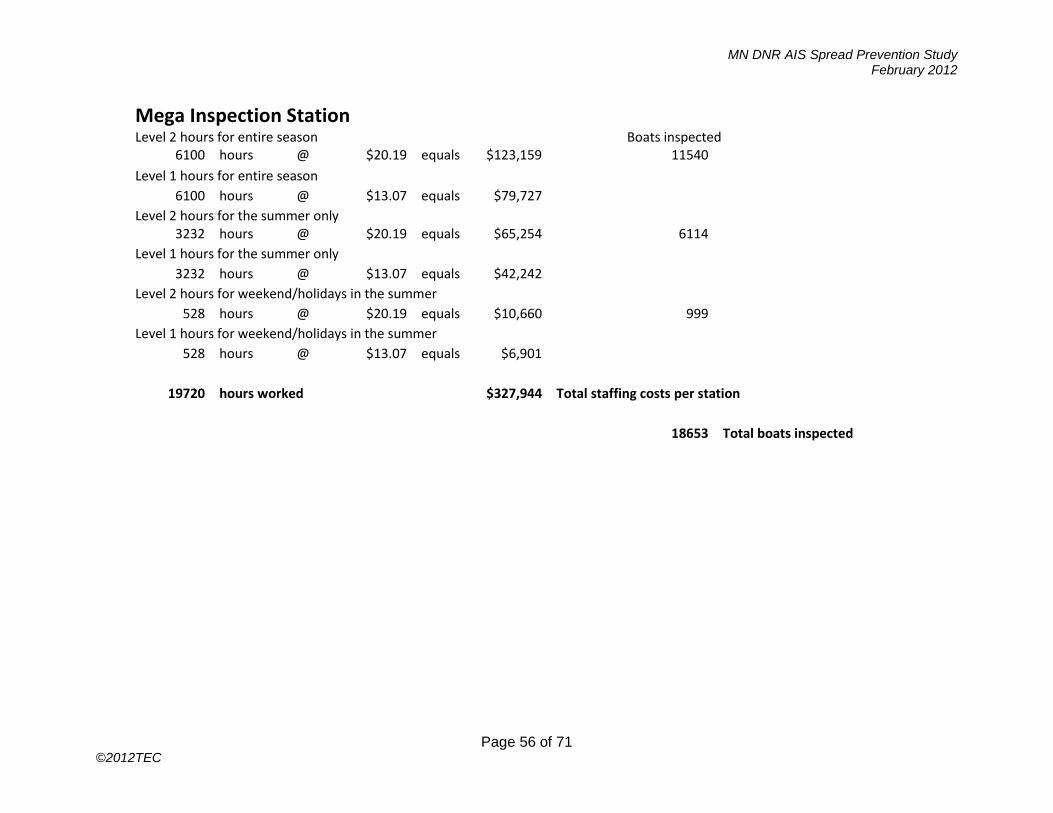
MN DNR AIS Spread Prevention Study February 2012
Page 56 of 71 ©2012TEC
Mega Inspection Station
Level 2 hours for entire season
Boats inspected
6100 hours @ $20.19 equals $123,159
11540
Level 1 hours for entire season
6100 hours @ $13.07 equals $79,727
Level 2 hours for the summer only
3232 hours @ $20.19 equals $65,254
6114
Level 1 hours for the summer only
3232 hours @ $13.07 equals $42,242
Level 2 hours for weekend/holidays in the summer
528 hours @ $20.19 equals $10,660
999
Level 1 hours for weekend/holidays in the summer
528 hours @ $13.07 equals $6,901
19720 hours worked
$327,944 Total staffing costs per station
18653 Total boats inspected
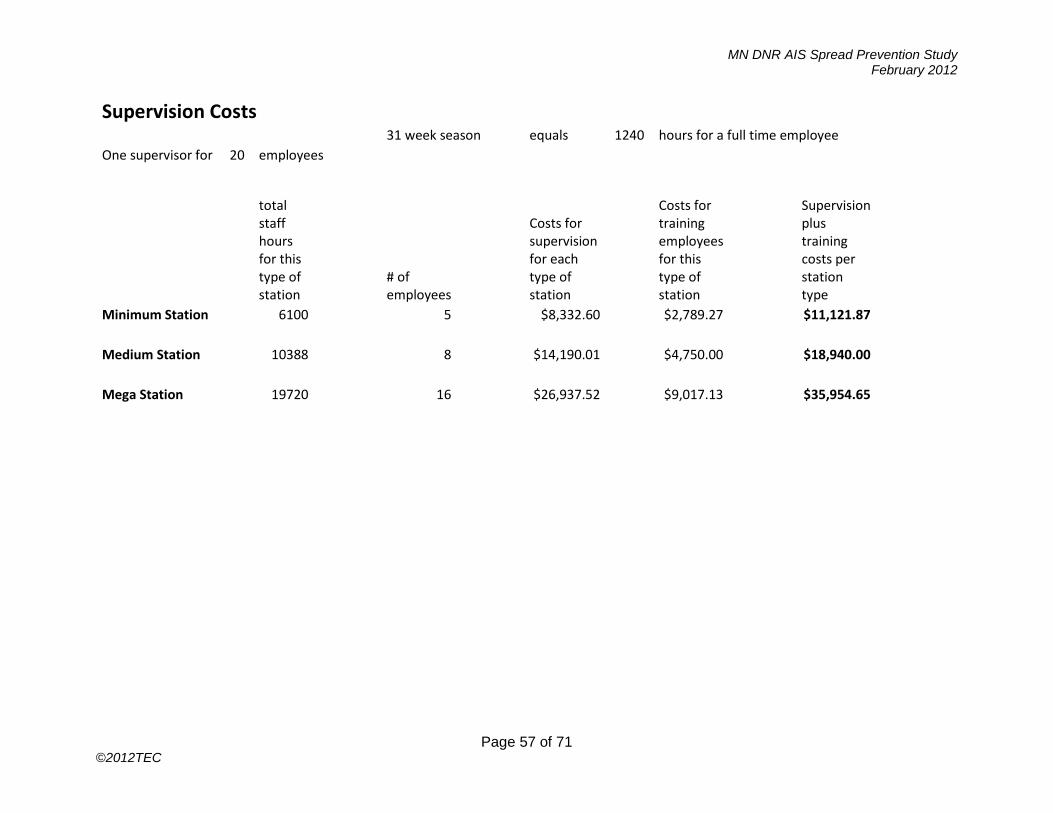
MN DNR AIS Spread Prevention Study February 2012
Page 57 of 71 ©2012TEC
Supervision Costs
31 week season equals 1240 hours for a full time employee
One supervisor for 20 employees
total staff hours for this type of station
# of employees
Costs for supervision for each type of station
Costs for training employees for this type of station
Supervision plus training costs per station type
Minimum Station
6100
5
$8,332.60
$2,789.27
$11,121.87
Medium Station
10388
8
$14,190.01
$4,750.00
$18,940.00
Mega Station
19720
16
$26,937.52
$9,017.13
$35,954.65
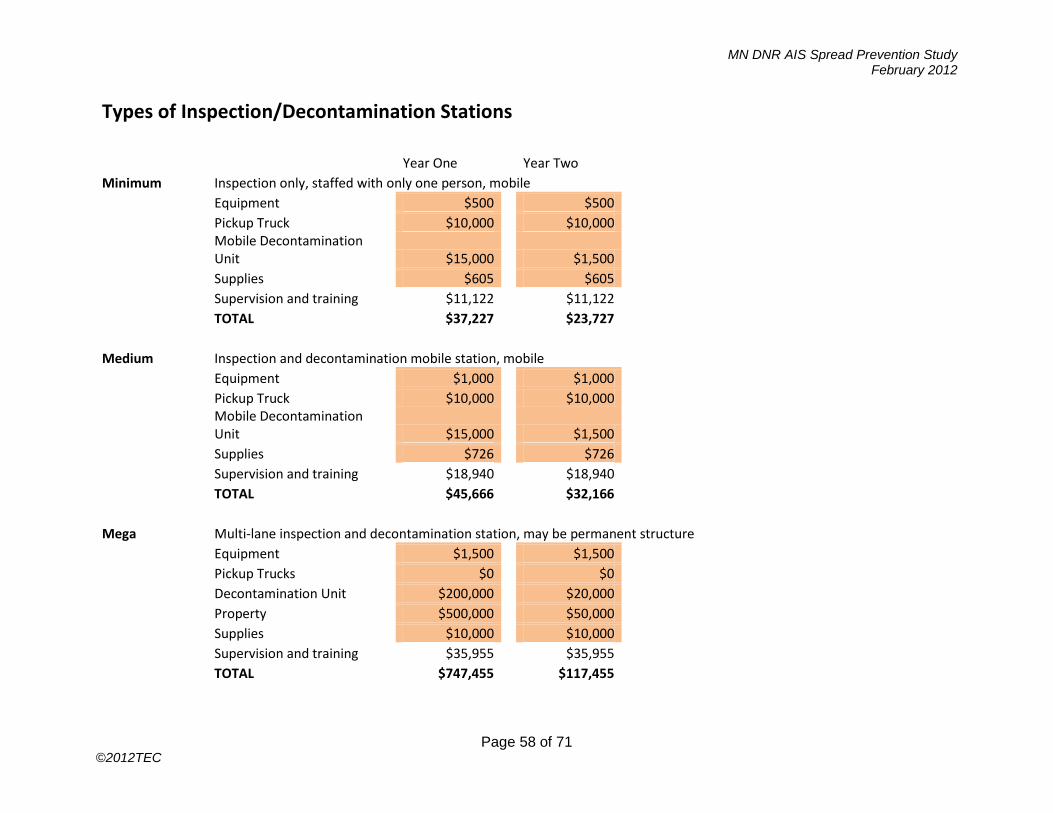
MN DNR AIS Spread Prevention Study February 2012
Page 58 of 71 ©2012TEC
Types of Inspection/Decontamination Stations
Year One
Year Two
Minimum Inspection only, staffed with only one person, mobile
Equipment
$500
$500
Pickup Truck
$10,000
$10,000
Mobile Decontamination Unit $15,000
$1,500
Supplies
$605
$605
Supervision and training $11,122
$11,122
TOTAL
$37,227
$23,727
Medium Inspection and decontamination mobile station, mobile
Equipment
$1,000
$1,000
Pickup Truck
$10,000
$10,000
Mobile Decontamination Unit $15,000
$1,500
Supplies
$726
$726
Supervision and training $18,940
$18,940
TOTAL
$45,666
$32,166
Mega Multi-lane inspection and decontamination station, may be permanent structure
Equipment
$1,500
$1,500
Pickup Trucks
$0
$0
Decontamination Unit $200,000
$20,000
Property
$500,000
$50,000
Supplies
$10,000
$10,000
Supervision and training $35,955
$35,955
TOTAL
$747,455
$117,455
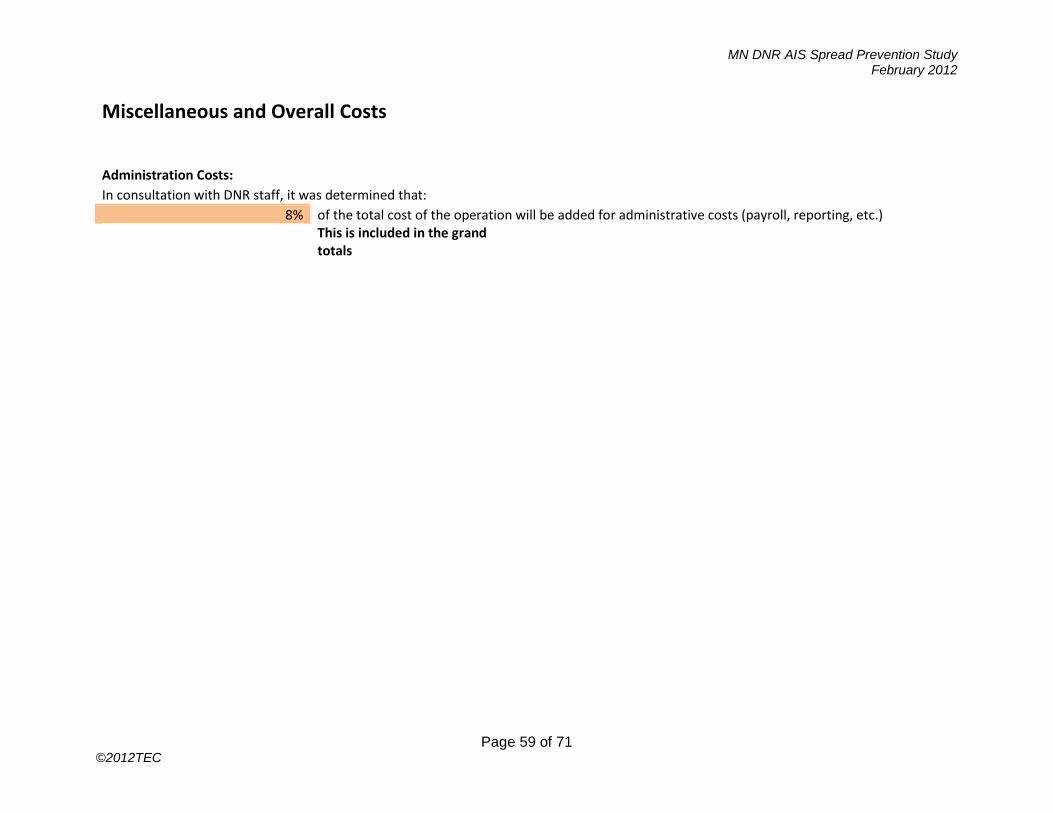
MN DNR AIS Spread Prevention Study February 2012
Page 59 of 71 ©2012TEC
Miscellaneous and Overall Costs
Administration Costs: In consultation with DNR staff, it was determined that:
8% of the total cost of the operation will be added for administrative costs (payroll, reporting, etc.)
This is included in the grand totals
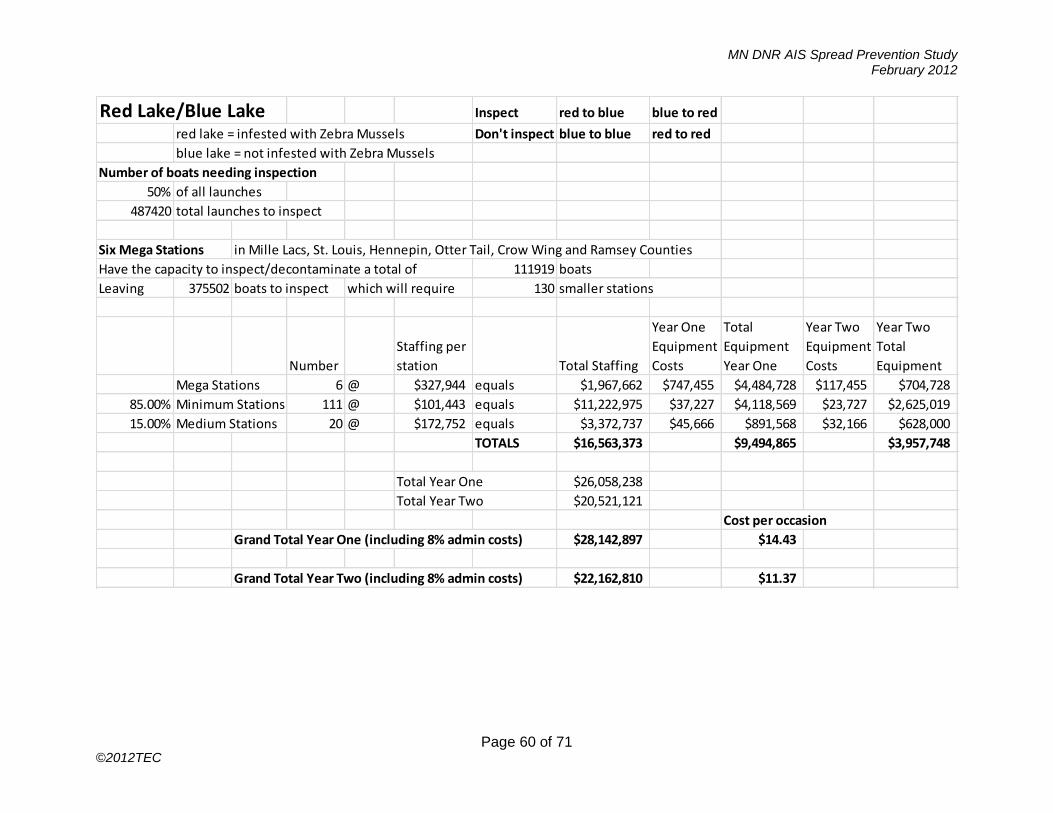
MN DNR AIS Spread Prevention Study February 2012
Page 60 of 71 ©2012TEC
Red Lake/Blue Lake Inspect red to blue blue to red
red lake = infested with Zebra Mussels Don't inspect blue to blue red to red
blue lake = not infested with Zebra Mussels
Number of boats needing inspection
50% of all launches
487420 total launches to inspect
Six Mega Stations in Mille Lacs, St. Louis, Hennepin, Otter Tail, Crow Wing and Ramsey Counties
Have the capacity to inspect/decontaminate a total of 111919 boats
Leaving 375502 boats to inspect which will require 130 smaller stations
Number
Staffing per
station Total Staffing
Year One
Equipment
Costs
Total
Equipment
Year One
Year Two
Equipment
Costs
Year Two
Total
Equipment
Mega Stations 6 @ $327,944 equals $1,967,662 $747,455 $4,484,728 $117,455 $704,728
85.00% Minimum Stations 111 @ $101,443 equals $11,222,975 $37,227 $4,118,569 $23,727 $2,625,019
15.00% Medium Stations 20 @ $172,752 equals $3,372,737 $45,666 $891,568 $32,166 $628,000
TOTALS $16,563,373 $9,494,865 $3,957,748
Total Year One $26,058,238
Total Year Two $20,521,121
Cost per occasion
Grand Total Year One (including 8% admin costs) $28,142,897 $14.43
Grand Total Year Two (including 8% admin costs) $22,162,810 $11.37
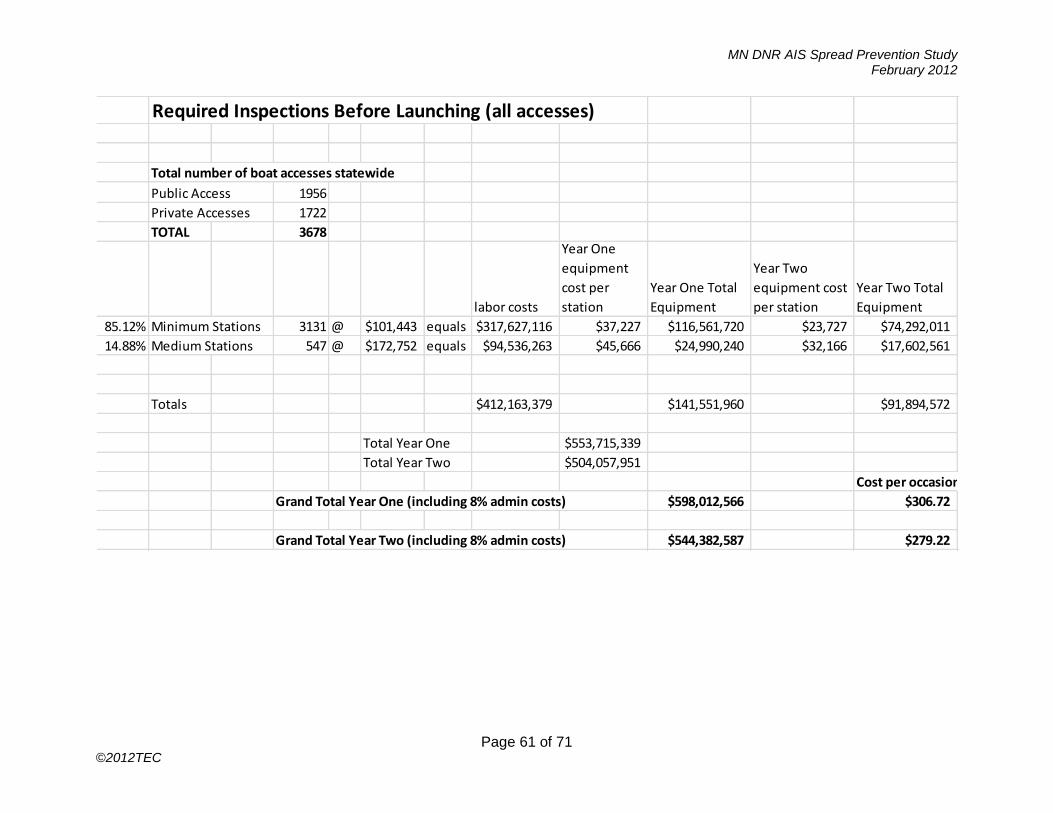
MN DNR AIS Spread Prevention Study February 2012
Page 61 of 71 ©2012TEC
Required Inspections Before Launching (all accesses)
Total number of boat accesses statewide
Public Access 1956
Private Accesses 1722
TOTAL 3678
labor costs
Year One
equipment
cost per
station
Year One Total
Equipment
Year Two
equipment cost
per station
Year Two Total
Equipment
85.12% Minimum Stations 3131 @ $101,443 equals $317,627,116 $37,227 $116,561,720 $23,727 $74,292,011
14.88% Medium Stations 547 @ $172,752 equals $94,536,263 $45,666 $24,990,240 $32,166 $17,602,561
Totals $412,163,379 $141,551,960 $91,894,572
Total Year One $553,715,339
Total Year Two $504,057,951
Cost per occasion
Grand Total Year One (including 8% admin costs) $598,012,566 $306.72
Grand Total Year Two (including 8% admin costs) $544,382,587 $279.22
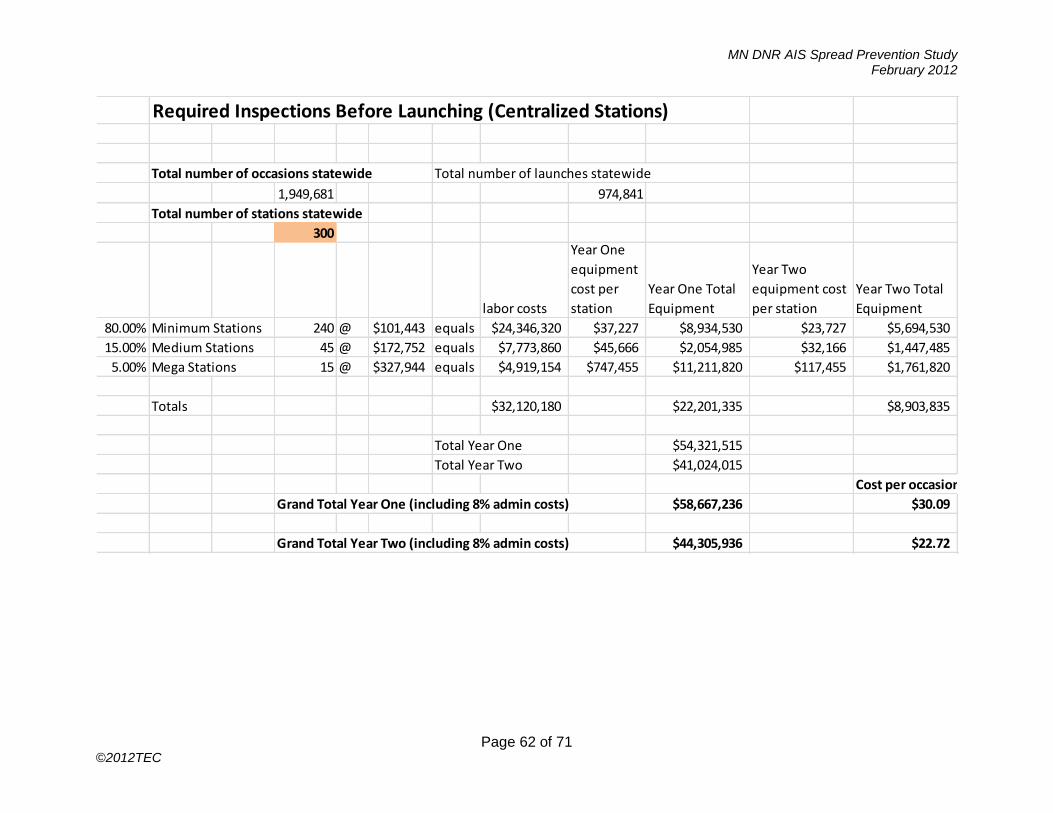
MN DNR AIS Spread Prevention Study February 2012
Page 62 of 71 ©2012TEC
Required Inspections Before Launching (Centralized Stations)
Total number of occasions statewide Total number of launches statewide
1,949,681 974,841
Total number of stations statewide
300
labor costs
Year One
equipment
cost per
station
Year One Total
Equipment
Year Two
equipment cost
per station
Year Two Total
Equipment
80.00% Minimum Stations 240 @ $101,443 equals $24,346,320 $37,227 $8,934,530 $23,727 $5,694,530
15.00% Medium Stations 45 @ $172,752 equals $7,773,860 $45,666 $2,054,985 $32,166 $1,447,485
5.00% Mega Stations 15 @ $327,944 equals $4,919,154 $747,455 $11,211,820 $117,455 $1,761,820
Totals $32,120,180 $22,201,335 $8,903,835
Total Year One $54,321,515
Total Year Two $41,024,015
Cost per occasion
Grand Total Year One (including 8% admin costs) $58,667,236 $30.09
Grand Total Year Two (including 8% admin costs) $44,305,936 $22.72
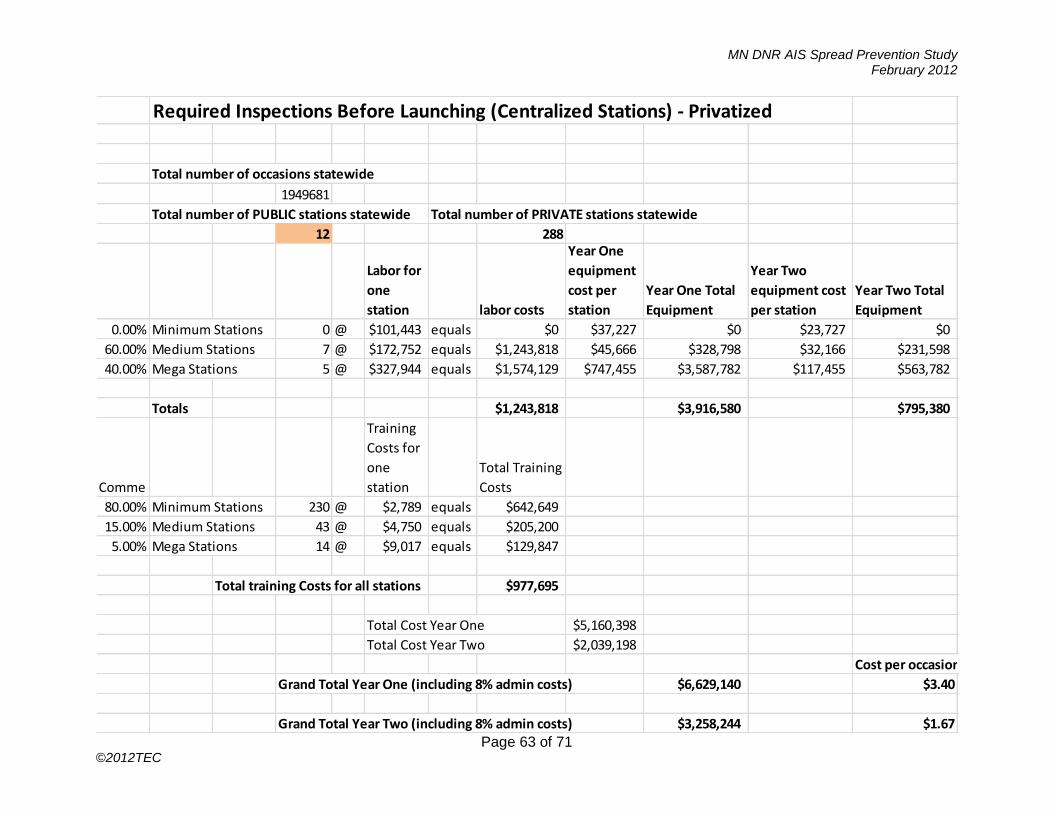
MN DNR AIS Spread Prevention Study February 2012
Page 63 of 71 ©2012TEC
Required Inspections Before Launching (Centralized Stations) - Privatized
Total number of occasions statewide
1949681
Total number of PUBLIC stations statewide Total number of PRIVATE stations statewide
12 288
Labor for
one
station labor costs
Year One
equipment
cost per
station
Year One Total
Equipment
Year Two
equipment cost
per station
Year Two Total
Equipment
0.00% Minimum Stations 0 @ $101,443 equals $0 $37,227 $0 $23,727 $0
60.00% Medium Stations 7 @ $172,752 equals $1,243,818 $45,666 $328,798 $32,166 $231,598
40.00% Mega Stations 5 @ $327,944 equals $1,574,129 $747,455 $3,587,782 $117,455 $563,782
Totals $1,243,818 $3,916,580 $795,380
Comme
Training
Costs for
one
station
Total Training
Costs
80.00% Minimum Stations 230 @ $2,789 equals $642,649
15.00% Medium Stations 43 @ $4,750 equals $205,200
5.00% Mega Stations 14 @ $9,017 equals $129,847
Total training Costs for all stations $977,695
Total Cost Year One $5,160,398
Total Cost Year Two $2,039,198
Cost per occasion
Grand Total Year One (including 8% admin costs) $6,629,140 $3.40
Grand Total Year Two (including 8% admin costs) $3,258,244 $1.67
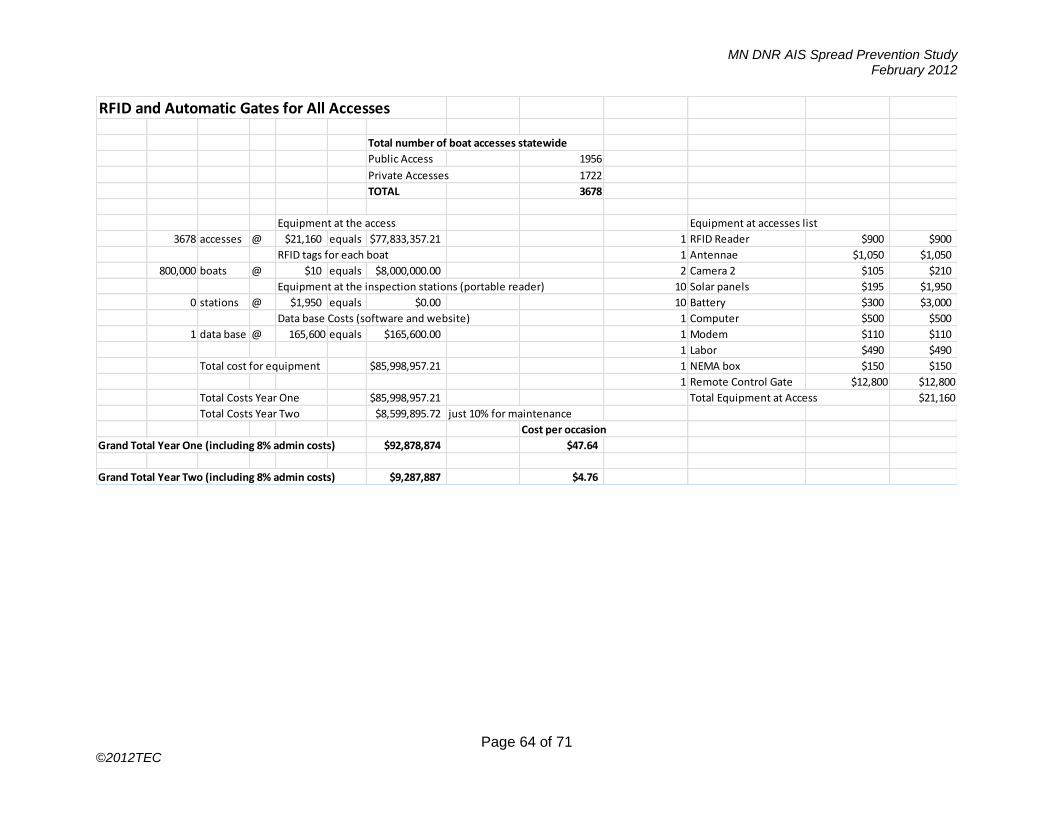
MN DNR AIS Spread Prevention Study February 2012
Page 64 of 71 ©2012TEC
RFID and Automatic Gates for All Accesses
Total number of boat accesses statewide
Public Access 1956
Private Accesses 1722
TOTAL 3678
Equipment at the access Equipment at accesses list
3678 accesses @ $21,160 equals $77,833,357.21 1 RFID Reader $900 $900
RFID tags for each boat 1 Antennae $1,050 $1,050
800,000 boats @ $10 equals $8,000,000.00 2 Camera 2 $105 $210
Equipment at the inspection stations (portable reader) 10 Solar panels $195 $1,950
0 stations @ $1,950 equals $0.00 10 Battery $300 $3,000
Data base Costs (software and website) 1 Computer $500 $500
1 data base @ 165,600 equals $165,600.00 1 Modem $110 $110
1 Labor $490 $490
Total cost for equipment $85,998,957.21 1 NEMA box $150 $150
1 Remote Control Gate $12,800 $12,800
Total Costs Year One $85,998,957.21 Total Equipment at Access $21,160
Total Costs Year Two $8,599,895.72 just 10% for maintenance
Cost per occasion
Grand Total Year One (including 8% admin costs) $92,878,874 $47.64
Grand Total Year Two (including 8% admin costs) $9,287,887 $4.76
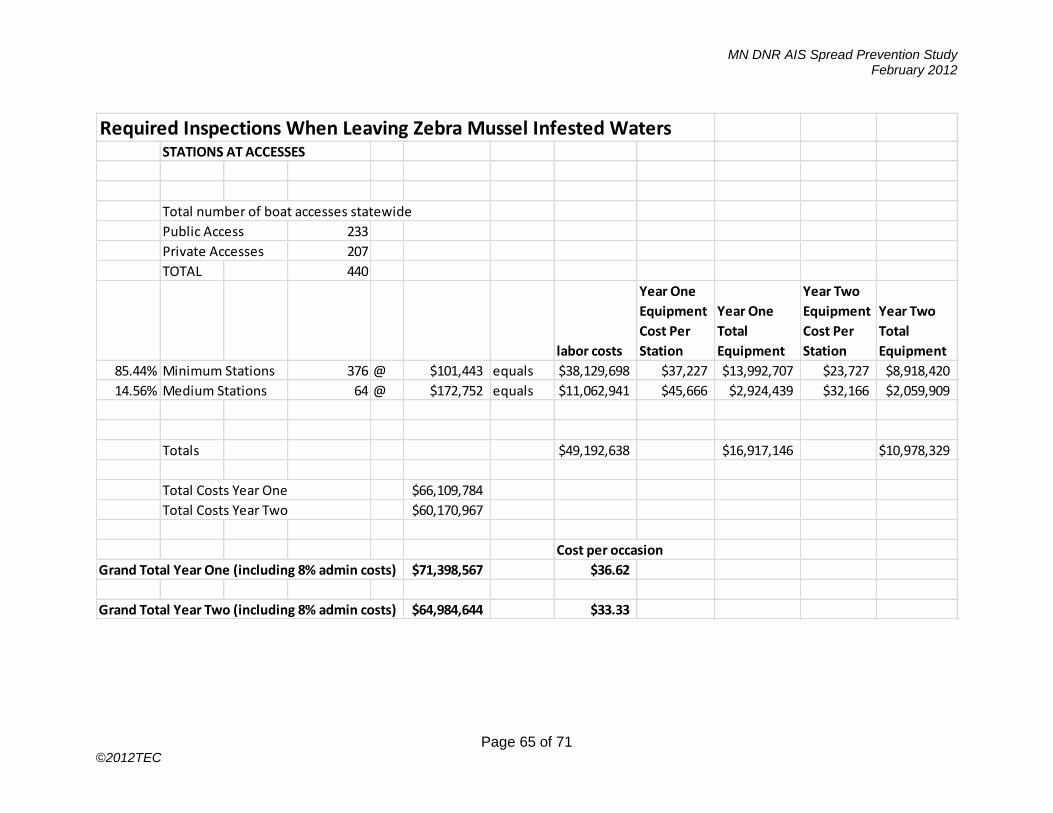
MN DNR AIS Spread Prevention Study February 2012
Page 65 of 71 ©2012TEC
Required Inspections When Leaving Zebra Mussel Infested WatersSTATIONS AT ACCESSES
Total number of boat accesses statewide
Public Access 233
Private Accesses 207
TOTAL 440
labor costs
Year One
Equipment
Cost Per
Station
Year One
Total
Equipment
Year Two
Equipment
Cost Per
Station
Year Two
Total
Equipment
85.44% Minimum Stations 376 @ $101,443 equals $38,129,698 $37,227 $13,992,707 $23,727 $8,918,420
14.56% Medium Stations 64 @ $172,752 equals $11,062,941 $45,666 $2,924,439 $32,166 $2,059,909
Totals $49,192,638 $16,917,146 $10,978,329
Total Costs Year One $66,109,784
Total Costs Year Two $60,170,967
Cost per occasion
Grand Total Year One (including 8% admin costs) $71,398,567 $36.62
Grand Total Year Two (including 8% admin costs) $64,984,644 $33.33

MN DNR AIS Spread Prevention Study February 2012
Page 66 of 71 ©2012TEC
Required Inspections When Leaving Zebra Mussel Infested Waters - Containment ZonesCONTAINMENT - CENTRALIZED STATIONS
Total number of boat accesses statewide
Public Access 233
Private Accesses 207
TOTAL 440
Containment
Zones Occasions
Stations
needed to
inspect
Total Labor
Costs
Year One
Equipment
Cost Per
Station
Year One
Total
Equipment
Year Two
Equipment
Cost Per
Station
Year Two
Total
Equipment
Lake Mille Lacs 70,398 7 medium 19 medium $3,228,027 $45,666 $853,315 $32,166 $601,055
Lake Minnetonka 113,209 12 medium
Mississippi River 79,258 14 minimum 36 minimum $3,604,622 $37,227 $1,322,812 $23,727 $843,110
Gull Lake Chain 40,000 7 minimum
Otter Tail Lake 15,000 3 minimum
Alexandria Chain 30,000 5 minimum
Prior Lake 25,000 4 minimum
Duluth 10,000 2 minimum
Douglas County 2,500 1 minimum
Extra Stations 6 minimum
TOTALS $6,832,648 $2,176,126 $1,444,165
Total Costs Year One $9,008,775
Total Costs Year Two $8,276,814
Cost per occasion
Grand Total Year One (including 8% admin costs) $9,729,477 $4.99
Grand Total Year Two (including 8% admin costs) $8,938,959 $4.58

MN DNR AIS Spread Prevention Study February 2012
Page 67 of 71 ©2012TEC
Required Inspections When Leaving Zebra Mussel Infested Waters - Containment Zones - PrivatizedTotal number of boat accesses statewide
Public Access 233
Private Accesses 207
TOTAL 440
Total number of PUBLIC stations statewide Total number of PRIVATE stations statewide
12 42
Public Stations
Labor for
one
station labor costs
Year One
equipment
cost per
station
Year One Total
Equipment
Year Two
equipment cost
per station
Year Two Total
Equipment
0.00% Minimum Stations 0 @ $101,443 equals $0 $37,227 $0 $23,727 $0
60.00% Medium Stations 7 @ $172,752 equals $1,243,818 $45,666 $328,798 $32,166 $231,598
40.00% Mega Stations 5 @ $327,944 equals $1,574,129 $747,455 $3,587,782 $117,455 $563,782
Totals $1,243,818 $3,916,580 $795,380
Commercial Stations
Training
Costs for
one
station
Total Training
Costs
80.00% Minimum Stations 34 @ $2,789 equals $94,209
15.00% Medium Stations 6 @ $4,750 equals $30,081
5.00% Mega Stations 2 @ $9,017 equals $19,035
Total training Costs for all stations $143,325
Total Costs Year One $5,303,723
Total Costs Year Two $2,182,523
Cost per occasion
Grand Total Year One (including 8% admin costs) $5,728,020 $2.94
Grand Total Year Two (including 8% admin costs) $2,357,124 $1.21

MN DNR AIS Spread Prevention Study February 2012
Page 68 of 71 ©2012TEC
Self Inspection/Certification
Total number of boats to inspect
800,000
Total number of inspectors to train through an on-line course (no cost to the state)
800,000
Total number of PUBLIC stations statewide
12
Public Stations
Labor for
one
station labor costs
Year One
equipment
cost per
station
Year One Total
Equipment
Year Two
equipment cost
per station
Year Two Total
Equipment
0.00% Minimum Stations 0 @ $101,443 equals $0 $37,227 $0 $23,727 $0
60.00% Medium Stations 7 @ $172,752 equals $1,243,818 $45,666 $328,798 $32,166 $231,598
40.00% Mega Stations 5 @ $327,944 equals $1,574,129 $747,455 $3,587,782 $117,455 $563,782
Totals $1,243,818 $3,916,580 $795,380
Total Costs Year One $5,160,398
Total Costs Year Two $2,039,198
Cost per occasion
Grand Total Year One (including 8% admin costs) $5,573,229 $2.86
Grand Total Year Two (including 8% admin costs) $2,202,333 $1.13
MN DNR AIS Spread Prevention Study February 2012
Page 69 of 71 ©2012TEC
Attachment D: Bibliography
Bibliography:
Interviews: Several interviews both telephone and in person with Minnesota DNR personnel.
Several telephone interviews with DNR personnel in other states.
Minnesota DNR Studies: Minnesota Department of Natural Resources Designation of Infested Water, October 11, 2011 http://www.dnr.state.mn.us/invasives/ais/infested.html
Boating in the Twin Cities Metropolitan Area: Current Status (1996) and Trends Since 1984 http://files.dnr.state.mn.us/aboutdnr/reports/boating/boating_metro96.pdf
Boating in North Central Minnesota: Status in 1998 and Trends Since 1985 http://files.dnr.state.mn.us/aboutdnr/reports/boating/trends_northcentral98.pdf
Boating in Central Minnesota: Status in 2001 and Trends Since 1987 http://files.dnr.state.mn.us/aboutdnr/reports/boating/boating_centralmn01.pdf
Boating on the Minnesota Portion of Lake Superior: Summer 2002 http://files.dnr.state.mn.us/aboutdnr/reports/boating/lakesuperiorboating2002.pdf
Recreational Boating Study of the Mississippi River, Pools 4 to 9, Summer 2003 http://files.dnr.state.mn.us/aboutdnr/reports/boating/mississippi2003.pdf
Boating Trends on Lake Minnetonka, 1984 to 2004 http://files.dnr.state.mn.us/aboutdnr/reports/boating/minnetonka_boatingtrends.pdf
Boating in West Central Minnesota: Status in 2005 and Trends Since 1986 http://files.dnr.state.mn.us/aboutdnr/reports/boating/boatingtrends_westcentralmn.pdf
Boating in Northern Minnesota: Summer 2006 http://files.dnr.state.mn.us/aboutdnr/reports/boating/boating_northern06.pdf
Boating in North-Central MN Report 2008 http://files.dnr.state.mn.us/aboutdnr/reports/boating/boating_ncmn_report_08.pdf
Boating in Twin Cities Metro Area Report 2009 http://files.dnr.state.mn.us/aboutdnr/reports/boating/metroboating_report2009.pdf
GIS data and data in other formats:
Data from Minnesota DNR data deli: http://deli.dnr.state.mn.us/data_catalog.html

MN DNR AIS Spread Prevention Study February 2012
Page 70 of 71 ©2012TEC
The following GIS data sets were used: From the Minnesota DNR - Division of Trails & Waterways
Water Access Sites in Minnesota From the Minnesota DNR - MIS Bureau
DNR Office Locations From the Minnesota DNR - Minerals Division/Section of Wildlife
Minnesota County Boundaries From the DNR Division of Waters Administrative Areas
Division of Waters' administrative unit boundaries From the Minnesota Department of Natural Resources / Division of Waters
DNR Waters Lakes List, extracted from database LAKES-DB From the Minnesota Department of Transportation, Survey and Mapping
Major Roads From the DNR-MIS
Populated Places Data sets directly from Minnesota DNR GIS specialist and Aquatic Species specialists
Aquatic invasive species locations, accesses public and commercial From the Minnesota Department of Transportation
AADT_1992_2010 represents current and historical AADT (Annual Average Daily Traffic) on sampled road systems in a particular given year.
Other Programs: Recommended Uniform Minimum Protocols and Standards for Watercraft Interception Programs for Dreissenid Mussels in the Western United States http://www.100thmeridian.org/Recommended-Protocols-and-Standards-for-Watercraft-Interception-Programs-for-Dreissenid-Mussels-in-the-Western-United-States.pdf http://fishing.about.com/library/weekly/blnews021218boat.htm http://tahoeboatinspections.com/inspection-locations/ http://www.tahoercd.org/uploads/documents/Watercraft_Inspection_Fees_2011.pdf http://wildlife.state.co.us/Fishing/Pages/MandatoryBoatInspections.aspx http://www.parks.state.co.us/SiteCollectionImages/parks/Programs/ParksResourceStewardship/ANS%20Inspect%20HBook%20V12.pdf Hardware: http://www.americancasting.com/info-wire-seals-psw-97.asp http://news.dnr.state.mn.us/2012/01/06/dnr-to-purchase-20-decontamination-units-in-fight-against-spread-of-aquatic-invasive-species/ http://www.alientechnology.com/docs/products/Alien-Technology-ALH-900x-Handheld-RFID-Reader.pdf http://www.alientechnology.com/docs/products/Alien-Technology-ALR-9900-Enterprise-RFID-Reader.pdf
MN DNR AIS Spread Prevention Study February 2012
Page 71 of 71 ©2012TEC
http://www.gaorfid.com/index.php?main_page=product_info&cPath=129&products_id=715 http://www.gaorfid.com/index.php?main_page=product_info&cPath=141&products_id=779 http://www.gaorfid.com/index.php?main_page=index&cPath=133 http://savi.com/products/tags_readers.aspx http://rfid-iii.savi.com/content/slin-0001aa-savi-sr-650-active-fixed-interrogator http://rfid-iii.savi.com/category/active-hand-held-rfid-interrogator http://rfid-iii.savi.com/category/active-rfid-transponders http://www.sirit.com/RFID_Inlay_Tag_Manufacturing.asp http://www.sirit.com/AVI_Products.asp http://www.sirit.com/Fixed_RFID_Readers.asp http://www.sirit.com/Embedded_RFID_Modules.asp