Embed Size (px)
Citation preview

FINAL REPORT:
Health Risk Perception in Canada
DECISION RESEARCH
1201 OAK STREET
EUGENE, OREGON 97401
This report was prepared for Health and WelfareCanada by Paul Slovic, James Flynn, C. K.Mertz, and Leisha Mullican of DecisionResearch, with the assistance of Daniel Krewski,Cheryl Bartlett, and
at
Health and Welfare Canada.
We are grateful to Douglas Hurley and SudhaMehta of Goldfarb Consultants for their help indesigning, testing, and administering the surveyinstrument.
December 30, 1992

Health Risk Perception in Canada December 30, 1992
Table of Contents
I. Introduction . . . 1
H. Method • • •• 2Survey Content 2Administration of the Survey . . 5
m. Results 6Word Associations • • 6Perception of Risk 10Sources of Information . . 28Responsibility for Health Risk Protection 28Attitudes and Opinions 31Worldviews • 41The Risk-Perception Index 45Personal and Demographic Characteristics . . . 47
IV. Summary and Discussion 58
VI. References 63

Health Risk Perception in Canada December 30, 1992 • 1
I. Introduction
Attitudes and perceptions about health risk have important effects upon individuals
and society. At the individual level they give and deny peace of mind and determine whether
or not appropriate protective actions will be taken. At the societal level, they drive the
agendas of regulatory agencies and lead to policies that affect the safety, cost, and even the
very existence of many products and technologies.
This report describes the results of a national survey in Canada designed to address
the following objectives:
1. Describe precisely and quantitatively people's attitudes, perceptions, values,
knowledge, and beliefs pertaining to environmental health issues.
2. Place perceptions of environmental health risks within a broader context of
perceptions of risks from other domains (e.g., lifestyle risks, risks from sporting activities).
3. Permit comparisons of perceptions, attitudes, etc. to be made across people who
differ with regard to important personal and demographic characteristics.
4. Provide baseline data that will allow perceptions to be monitored over time and
related to unfolding news and events.
5. Provide insights into the kinds of information that the public needs and the best
means of disseminating that information.
6. Enable governmental policy makers and agencies to act in ways that appropriately
address public attitudes and concerns.

Health Risk Perception inCanada December 30, 1992 • 2
n. Method
Survey Content
The present survey was designed to assess many different aspects of health-risk
perception. Accordingly, a variety of question formats was used including word association,
ratings of perceived risk, attitude and opinion questions, and questions about actual risk
taking and risk-avoiding behaviors in which the respondent has engaged. The main
components of the survey are outlined below.
Word associations. The study of associations has a long history in psychology, going
back to Galton (1880), Wundt (1883), and Freud (1924). More recently, word associations
have been found useful in revealing important aspects of the ways people perceive risks (see,
e.g., Slovic et al., 1989; Slovic et al., 1991a, 1991b). The first question of the present
survey simply asked respondents to indicate the first word or image that came to mind when
they heard the word "chemicals." Next, they were asked to do the same thing for the word
"risk." These two association tasks were given at the beginning of the interview so that they
would not be influenced by the content of the other questions.
Risk perception. In the next segment of the interview, respondents were asked to
indicate the degree of health risk they associated with each of 33 hazards. These 33 items
covered a wide range of hazards including risks from technology (e.g., nuclear power, high-
voltage power lines), lifestyle (e.g., AIDS, suntanning, cigarette smoking), pollution (e.g.,
waste incinerators, indoor air quality), common substances (e.g., bacteria in food, tap
water), and crime and violent behavior. The array of items was selected to include many of
the hazards that have recently been of concern to the public, the medical community, or
government agencies.

Health Risk Perception in Canada December 30, 1992 • 3
Each of these items was rated in terms of the health risk posed "to the Canadian
public as a whole." The possible responses were "almost no health risk," "slight health
risk," "moderate health risk," and "high health risk." In addition, for ten of the items
thought to pose risks to respondents and their families that might be quite different from the
risks to the general public (e.g., street drugs), ratings were also obtained for "the health risk
to you and your family."
Five additional items, representing medical devices or treatments, were rated on
perceived health risk under the assumption that "you or some member of your family were
considering using the following medical devices or treatments." These five items included
breast implants, medical X-rays, contraceptives, contact lenses, and heart pacemakers.
Sources of information. Respondents were asked to indicate the amount of
information about health risks that they received from various sources such as the news
media, medical doctors, government agencies, and so on. They also were asked about the
confidence they had in each of these sources.
Responsibility for health-risk protection. A diverse set of private individuals, private
groups, and government agencies were rated according to the degree of responsibility they
were perceived to hold for protecting people against health risks. These same individuals
and groups were also rated according to how good a job each was doing in fulfilling their
responsibilities for protecting people against health risks.
Attitudes and opinions. The middle segment of the survey contained approximately
40 items designed to elicit the respondents' attitudes and opinions to a variety of health-risk
perception issues.These items were presented as statements with which the respondent was
asked to agree or disagree. The content of these items included statements about:

Health Risk Perception in Canada December 30, 1992 • 4
• One's local environment ("There are serious environmental health problems where
I live")
• The global environment ("The greenhouse effect is a serious problem . . . ")
• Perceptions of risks from chemicals and radiation
• Attitudes toward government regulation (e.g., "When there is a serious health
risk, the government will regulate it. Until they alert me . . . , I don't really
have to worry")
• Energy risks (e.g., "In light of health concerns about acid rain, damage to the
ozone layer, and climate change associated with the burning of coal and oil,
Canada should rely more heavily upon nuclear power to meet its future electricity
needs")
• Risk/benefit tradeoffs (e.g., "Canadians should be prepared to accept some risks
to their health in order to strengthen the economy").
The questions pertaining to perceptions of risk from chemicals and radiation were
modeled after the extensive survey of intuitive toxicology conducted by Kraus, Malmfors,
and Slovic (1992). Items were designed to assess sensitivity to dose or amount of exposure
as a determiner of risk, opinions about the value of animal tests as predictors of the effects
of chemicals on humans, attitudes about the nature of chemical and radiation-induced cancer,
and general attitudes about the benefits vs. the risks from chemical technologies.
Worldviews. Over the past decade, evidence has been accumulating regarding the
importance of general dispositions or "worldviews" in determining an individual's
perceptions of risk (Buss, Craik, & Dake, 1986; Dake, 1991; Jasper, 1990). The survey
contained a small number of statements designed to measure the following worldviews:

Health Risk Perception in Canada December 30, 1992 • 5
• Fatalism (e.g., "If something like a chemical is going to harm me it will, and
there isn't much I can do about it—what will be, will be")
• Hierarchy (e.g., "Decisions about health risks should be left to the experts")
• Individualism ("In a fair system, people with more ability should earn more")
• Egalitarianism ("If people in this country were treated more equally, we would
have fewer problems")
• Technological Enthusiasm ("A high technology society is important for improving
our health and social well being").
Personal and demographic characteristics. The final section of the survey elicited
information pertaining to the personal background of the respondent. In addition to standard
demographic information (gender, age, education, region of residence, occupation, and
income), respondents were asked about their health status and health-related lifestyle
(smoking, seat-belt use, exercise, voluntary risk taking, and occupational exposure to risk).
They were also asked questions about their degree of political activism and their
environmental activism (e.g., "Have you purchased a higher priced product because it was
better for your health or environmentally friendly?").
Administration of the Survey
The survey was conducted by Goldfarb Consultants. A representative sample of the
Canadian adult population was interviewed by telephone. The interviewing was conducted in
either English or French during the period between February 14 and February 24, 1992. A
stratified random sampling procedure produced 2765 contacts from which 1506 completed
interviews were obtained, for a response rate of 54.5%. Weighting of the data was

Health Risk Perception in Canada December 30, 1992 • 6
performed to produce a final sample of 1500 individuals, matched to the 1992 Canadian
population in terms of household size, community size, age, and gender.
Prior to the administration of the survey, the questionnaire was pretested with two
focus groups, and with 30 telephone interviews.
During administration of the survey, lists of items within questions (e.g., the various
items in the perceived-risk question) were sequenced randomly, to balance possible order
effects.
III. Results
Word Associations
Chemicals. Previous surveys using small samples (e.g., students at a university) have
found that associations to the word "chemicals" are dominated by the concept of danger, with
rather few associations of a positive nature (Slovic, in press). In the present survey,
associations involving dangerousness and pollution were produced by about one-third of the
respondents (518 persons out of 1506). Generally negative terms (e.g., "bad") accounted for
another 29 responses. In contrast, distinctly positive terms—such as "useful" or
beneficial"—were given only 10 times. However, names of chemical products (e.g.,
"cleansers", "medicines," "pesticides," "gasoline") were produced 580 times, about as often
as were the clearly negative terms. In sum, although the ratio of clearly negative to clearly
positive associations is remarkably high, there is also an awareness of many useful chemical
products. A listing of the major categories of response to the word chemicals is given in
Table 1.
Previous research has found that the affective quality of a person's word associations
to a hazard is related to fundamental attitudes and perceptions regarding that hazard. For

Health Risk Perception in Canada December 30, 1992 • 7
Table 1. Associations to the Word "Chemicals"
Chemical Products (All) 580
Medicines, drugsCleaning agentsFertilizers
Pesticides
Gasoline
133
127
75
63
31
Dangerous 333
DangerousPoisonous
Toxic
79
75
43
Pollution 185
Chemical Compounds 129
Acid/Burn 56
Chemistry and Related Apparatus 55
Chemical Companies and Manufacturing Plants 54
Negative Terms 29
Workplace 11
Useful 10
Drug Abuse/Illegal Drugs 9
Miscellaneous 15
Total 1466

Health Risk Perception in Canada December 30, 1992 • 8
example, Slovic et al. (1991b) found that persons whose first association to the stimulus
phrase "underground nuclear waste repository" was affectively negative (e.g., dangerous)
were much more likely to say they would vote against a repository than were persons whose
associations were positive.
In the present study, the affective quality of a person's association to the stimulus
word "chemicals" was compared to the perceptions, attitudes, and demographic status of that
person. As expected, many statistically significant relationships were observed.
To conduct this analysis, the associations were first partitioned into two categories:
those that were clearly negative (dangerous, pollution, negative terms; N = 561) and those
that were not clearly negative (all the rest of the associations; N = 905). Many of the
associations in the non-negative category may indeed have been negative (e.g., chemicals
such as PCB's or dioxin or associations such as pesticides, acid, burn, Exxon, and drug
abuse). However, because respondents did not provide ratings of their associations, the
affective quality of responses in the non-negative category cannot be verified. Labeling all
responses in this category as non-negative likely works to reduce the observed relationships
between association category and other variables. Nevertheless, the differences in responses
between people whose associations were negative and non-negative were often moderately
large.
For example, persons with negative imagery were more likely to assign high risk-
perception ratings to many hazards. The largest differences were:
• Chemical pollution (62.9% of those whose association to "chemicals" was
negative responded "high risk" vs. 49.9% responding "high risk" among those
whose association was non-negative)

Health Risk Perception in Canada December 30, 1992 • 9
• Tap water (60.6% moderate or high risk vs. 46.7%)
• Food additives (44.4% high risk vs. 33.4%)
• PCB's or dioxin (47.2% high risk vs. 34.9%).
Persons with negative and non-negative associations did not differ much on responses
to questions about information sources or agents responsible for health protection. However,
there were some substantial differences on the various attitude and opinion questions. For
example, persons whose associations were clearly negative were more likely to agree that
most chemicals cause cancer (58.8% agreement vs. 41.8% among those with non-negative
associations). Persons with negative associations were also more likely to agree that:
• "If even a tiny amount of a cancer-causing substance were found in my tap water,
I wouldn't drink it"
• "I try hard to avoid contact with chemicals and chemical products in my daily
life."
Persons with negative associations were more likely to disagree with statements
asserting that:
• "I don't worry much about chemicals because there are just too many other things
in my life that I have to deal with"
• "In a fair system people with more ability should earn more."
Negative associations were given by 40.9% of the women respondents and by 33.5%
of the men. Persons with less education and persons living in the Atlantic regions or in
Quebec were more likely than others to produce associations to the word chemicals that were
clearly negative.

Health Risk Perception in Canada December 30, 1992 • 10
Risk. Table 2 presents the major response categories to the stimulus word "risk."
Associations with accidents and danger dominate the list, followed by associations involving
illness and economic or financial matters. Positive associations involving adventure,
challenge, or. sport were rare (42 mentions) and were, greatly outnumbered by the negative
categories. Of interest were the categories that one might have expected to be frequent but
were not. "War" or "weapons" were mentioned by only 7 respondents. "Crime" was
mentioned only four times, "uncertainty" only twice, and a.natural hazard only once
("storm"). - : .-i '.-• j
Perception of Risk >
Risk to the Canadian public. Figure 1 illustrates the perceived risk to the Canadian
public as a whole based on the responses of the entire sample (N = 1500).' Cigarette
smoking elicited the greatest percentage of responses in the "high risk" category and bottled
water and contact lenses the lowest percentage of high-risk responses. Ozone depletion and
the related risk from suntanning stood out as quite high in perceived risk, testimony to the
degree to which recent media coverage has effectively brought these problems to public
attention. The same is true for silicone breast implants. Stress also stands out as quite high
in the hierarchy, close to street drugs and higher than crime and violence, AIDS, traffic
accidents, and nuclear power risks. In contrast, other hazards that experts might see as
relatively serious, such as bacterial contamination of food and indoor air quality, were rated
rather low in risk to health.
1 Included in the figure are the five items for whom the rated risk pertained to anindividual considering the use of a specific medical device or treatment. These itemswere breast implants, medical X-rays, contraceptives, contact lenses, and heartpacemakers.

Health Risk Perception in Canada December 30, 1992 • 12
Figure 1. Perceived Health
Risk To Canadian Public
Cigarette SmokingOzone Depletion
Breast ImplantsStreet Drugs
Stress
Chemical Pollution
Crime and Violence
Suntanning §AIDS
Motor Vehicle Accidents
Nuclear Waste
Alcohol & PregnancyPCB's or Dioxin
Pesticides in Food
Food Additives
Drinking AlcoholNuclear Power Plants
Climate ChangeNonprescription Med.
Asbestos
Waste Incinerators
Malnutrition
Hi-Volt Power Lines
Food Irradiation
Prescription DrugsGenet Engr BacteriaOutdoor Air Quality
Bacteria in FoodMolds in Food
Mercury in FillingsTap Water
Medical X-raysIndoor Air Quality
VDTs
ContraceptivesHeart Pacemakers
Bottled Water
Contact Lenses
0% 20% 40% 60% 80% 100%
IHigh CUModerate BSIight ^Almost No BDon'tKnow

Health Risk Perception in Canada December 30, 1992 • 13
Chemical risks from ozone, street drugs, chemical pollution, PCBs or Dioxin,
pesticides, food additives, and alcohol were rated high in risk, but chemicals in the form of
prescription drugs were rated relatively low in risk. Radiation hazards associated with
industry (nuclear power and nuclear waste) were seen as more risky than radiation hazards
associated with medicine (x-rays). The relatively low perceived risks associated with medical
uses of chemicals and radiation replicates earlier findings in Canada (Slovic et al., 1989) and
elsewhere (Slovic, 1990) and may reflect the influence on risk perceptions of perceived
benefit, familiarity, and trust in medical treatments and the medical establishment.
Perceived risks due to climate change were seen as moderate in magnitude, smaller
than risks from ozone depletion. Nuclear waste was seen as a more serious risk than nuclear
power (another replication of previous findings). Drinking alcoholic beverages during
pregnancy was seen as more risky for the public as a whole than was drinking alcoholic
beverages overall. If risk is equated with total morbidity and mortality, drinking alcohol
must cause more harm than drinking alcohol during pregnancy (which is subsumed under the
broader category of drinking alcohol). The higher perception of risk associated with alcohol
and pregnancy may reflect the conjunction fallacy (Tversky & Kahneman, 1983), whereby a
combination of events sometimes seems more frequent or probable than the individual events
themselves. This result may also indicate that perceived risk in this context reflects the
probability of harm to the unborn child if its mother engages in the specified behavior (i.e.,
drinking alcohol if pregnant is perceived as more risky than drinking alcohol if not
pregnant).
Risk to respondents and theirfamilies. Figure 2 compares the percentage of "high
risk" responses when respondents were considering the health risk "to you and your family"

Health Risk Perception in Canada December 30, 1992 • 14
Figure 2. Public vs. Individual
Perceived Health Risks
Nuclear Waste
Nuclear Power Plants
Street Drugs
Alcohol & Pregnancy
AIDS
Hi-Volt Power Lines
Waste Incinerators
Malnutrition
Mercury in Fillings
VDTs
0%
Individual M Public
20% 40%
Percent High Risk
60%

Health Risk Perception inCanada December 30, 1992 • 15
with the percentage for the "Canadian public as a whole" for each of 10 items. Note that
nuclear waste and nuclear power received more "high risk" evaluations than any other items
when the reference was to personal or family risk. This was true even in regions distant
from nuclear power plants, such as British Columbia and the Prairie Provinces. In every
instance, there were more high-risk judgments in reference to the Canadian public and for
some items, such as street drugs and AIDS, the difference between personal and societal risk
perception was quite large. Most surveys have looked at either personal or societal risk
perceptions. These results demonstrate that the reference group can be quite important,
particularly when people are not personally exposed (or think they are not personally
exposed) to certain hazards.
Subgroup analyses: Gender. Perceived risk for the Canadian public as a whole was
examined for subgroups of respondents differing according to gender, age, education, and
region of residence. Sizable differences were observed as a function of each of these
demographic variables. Differences between men and women are shown in Figure 3.
Women were more likely to rate a hazard as a "high risk" for every item but one—heart
pacemakers. In many instances, the differences between men and women were quite
large—up to 22.8%, for example, for suntanning. Other items exhibiting more than a 15%
difference in percentage of high-risk responses were crime and violence, AIDS, motor
vehicle accidents, stress, ozone depletion, malnutrition, nuclear power plants, drinking
alcohol, chemical pollution, and waste incinerators (see Figure 4). Items for which women
had relatively less excess concern (when compared to men) included asbestos, nuclear waste,
and genetically engineered bacteria.

Health Risk Perception in Canada December 30, 1992 • 16
Figure 3. Perceived Health Risks toCanadian Public By Gender
Cigarette Smoking i ~^ ^ "Street Drugs IT !*S* iBreast Implants / I \Ozone Depletion \ A L^*Chemical Pollution i f i K i
Stress r I a'Crime and Violence
Nuclear WasteSuntanning J* : ~^"£*
AIDSMotor Vehicle Accidents
Alcohol & Pregnancy w yt*^ •
PCB's or DioxinFood Additives
Pesticides in Food Jw yHt
Drinking AlcoholAsbestos •'"^•••CZ
Nuclear Power Plants j I ^^^iClimate Change
Nonprescription Med. J<^ IFood Irradiation
Waste IncineratorsHi-Volt Power Lines
Genet Engr BacteriaMalnutrition
Outdoor Air Quality Y ^t;Bacteria in Food
Prescription Drugs \ f L^5" ' iMolds in Food j w ^s*f
Mercury in FilingsMedical X-rays \\ A i
Tap Water f\ p \ \ \Indoor Air Quality
VDTs
Heart PacemakersContraceptives
Bottled Water-♦-Males -9-Females
Contact Lenses •-*-$- -0% 10% 20% 30% 40% 50% 60% 70% 80%
Percent High Risk

Health Risk Perception in Canada December 30, 1992 • 17
Figure 4. Perceived Health Risks to CanadianPublic by Gender: Difference Between
Males and Females
SuntanningCrime and Violence
AIDSMotor Vehicle Accidents
StressOzone Depletion
MalnutritionNuclear Power Plants
Drinking AlcoholChemical Pollution
Breast ImplantsWaste IncineratorsPesticides in Food
Nonprescription Med.Climate Change
Nuclear WastePrescription Drugs
Food AdditivesHi-Volt Power Lines
Alcohol & PregnancyStreet Drugs
Food IrradiationPCB's or Dioxin
Cigarette SmokingBacteria in Food
Molds in FoodOutdoor Air Quality
ContraceptivesTap Water
VDTsMedical X-rays
Genet Engr BacteriaIndoor Air Quality
Mercury in FillingsContact Lenses
AsbestosBottled Water
Heart Pacemakers
•10% 0% 10% * 20%
Percent Difference in High Risk
Note: Percent difference is percent female high risk responseminus percent male high risk response.

Health Risk Perception inCanada December 30, 1992 • 18
Subgroup analyses: Age. Figures 5 and 6 portray the difference in high-risk
responses between respondents age 30 or less and age 55 or more. In general, older persons
were more likely to rate a health risk as high. This tendency was particularly evident for
street drugs, crime and violence, breast implants, alcohol and pregnancy, suntanning,
asbestos, video display terminals, drinking alcohol, and cigarette smoking. The younger
respondents displayed slightly higher perceived risk than did the older group for heart
pacemakers, pesticides, and various forms of chemical pollution (including ozone depletion
and outdoor air quality). Younger persons were slightly less likely to rate AIDS as a high
risk.
Subgroup analyses: Gender differences by age. In each of three age categories,
women were more likely than men to rate a risk as high. However, the "gender gap" was
not always uniform across age groups, as Figure 7 indicates. Examination of Figure 7 shows
that younger women are relatively more concerned about AIDS (compared to younger men).
Middle-aged men were relatively less likely to see stress as a high risk and older women
stand out in having relatively more concern about malnutrition than do older men.
The gender gap (greater tendency of women to judge a risk as high) increased with
age for the following 14 hazards:
• PCB's or dioxin
• Cigarette smoking
• Bacteria in food
• Food irradiation
• VDTs
• Genetically engineered bacteria
• Asbestos
• Suntanning
• Motor vehicle accidents
• Ozone depletion
• Malnutrition
• Drinking alcohol
• Pesticides in food
• Food additives
• Food irradiation

Health Risk Perception in Canada December 30, 1992 • 19
Figure 5. Perceived Health Risksto Canadian Public by Age
Ozone DepletionCigarette SmokingChemical Pollution I ^T " r \
Stress . i \y&rAIDS
Street Drugs | j m j J^^^ty
Motor Vehicle Accidents o <^cir^Breast Implants !
Crime and ViolenceNuclear Waste
Suntanning I \^2-———: ^ j
PCB's or Dioxin /^ft\Pesticides in Food
Alcohol & Pregnancy \ /* i J^^ j
Drinking AlcoholFood Additives
Nuclear Power Plants i
Climate ChangeWaste Incinerators
Nonprescription Med. ^f~-— |
Asbestos
Malnutrition
Hi-Volt Power LinesPrescription Drugs
Food IrradiationOutdoor Air Quality "OcC^I I
Molds in FoodBacteria in Food j
Genet Engr BacteriaTap Water
Heart PacemakersMercury in Fillings
Medical X-raysIndoor Air Quality
ContraceptivesVDTs
Bottled Water♦ Under 30 -$-55 and Over
Contact Lenses ' * ®—
0% 10% 20% 30% 40% 50% 60% 70%
—
Percent High Risk

Health Risk Perception in Canada December 30, 1992 • 20
Figure 6. Perceived Health Risks to CanadianPublic by Age: Difference Between
55+ and Under 30 Age GroupsStreet Drugs
Crime and ViolenceBreast Implants
Alcohol & PregnancySuntanning
Asbestos
VDTs
Drinking AlcoholMalnutrition
Cigarette SmokingHi-Volt Power Lines
Molds in FoodFood Additives
Genet Engr BacteriaNuclear Power Plants
ContraceptivesFood Irradiation
Bacteria in FoodIndoor Air Quality
Motor Vehicle AccidentNuclear Waste
Contact LensesMedical X-rays
Prescription DrugsBottled Water
PCB's or DioxinTap Water
Nonprescription Med.Stress
Waste IncineratorsClimate Change
AIDS
Outdoor Air QualityPesticides in Food
Ozone DepletionChemical PollutionHeart Pacemakers
•10% 0% 10% 20%
Percent Difference in High Risk
Note: Percent difference is percent 55+ high risk responseminus Under 30 high risk response.

Health Risk Perception in Canada December 30,1992 • 21
CigaretteSmokingStreet Drugs
Breast ImplantsOzone Oepletion
Chemical PollutionStress
Crime & VWenceNuclear Waste
SuntanningAJDS
Motor Vehide Accident
Alcohol & PregnancyPCS* or Dioxina
Food Additives
Pesticides in FoodDrinking Alcohol
Asbestos
Nudeer Power PlantsOimata Change
Nonprescription Med.Food Irradiation
Waste incinerator*
HWolt Power UneaGenet Engr Bacteria
Malnutrition
Outdoor Air QualityBacteria in Food
Piascription DrugsMotdsmFood
Mercury in FdUngsMedical X-Rays
Tap WaterIndoor Air Quality
VOTi
Heart Pacemakers
ContraceptivesBottled Water
Contact Lamas
Figure 7. Perceived Health Risk to CanadianPublic by Gender and Age Group
Age Group 18-29
30% 40% 50*
Percent High Risk
Cigarette SmokingStre«t Drugs
Breast ImplantsOzone Depletion
Chemical PollutionStress
Crime & ViolenceNuclear Waste
SuntanningAIDS
Motor Vehide AccidentAlcohol & Pregnancy
PCB's or DioxinsFood Additives
Pesticides in FoodDrinking Alcohol
AsbestosNudear Power Plants
Climate ChangeNonprescription Med.
Food IrradiationWaste Indnerators
Hl-Votl Power LinesGenet Engr Bacteria
MalnutritionOutdoor Air Quality
Bacteria in FoodPrescription Drugs
Molds in FoodMercury in Fillings
Medical X-RaysTap Water
Indoor Air QualityVDTs
Heart PacemakersContraceptives
Bottled WaterContact Lenses
Age Group 30-54
0% 10% 20% 30% 40% 50% 60% 70% 80%
Percent High Risk
Cigarette SmokingStreet Drugs
Breesl ImplantsOzone Depletion
Chemical Pollution
StressCrime & Violence
Nuclear Waste
SuntanningAIDS
Motor Vehide Acddent
Alcohol & PregnancyPCB's or Dioxina
Food AdditivesPesticides in Food
Drinking A)cohdAsbestoa
Nuclear Power PlantsClimate Change
Nonprescription Mad.Food Irradiation
Waste Incinerators
Hi-Voft Power Unas
Genet Engr BacteriaMalnutrition
Outdoor AirQualityBacteria in Food
Prescription DrugsMolds m Food
Mercury In FillingsMedical X-Rays
Tap WaterIndoor Air OuaDty
VDTsHeart Pacemakers
ContaceptfvesBotOed Water
Contact Lenses
Age Group 55+
20% 30% 40% 50*
Percenthigh Fcsk

Health Risk Perception in Canada December 30, 1992 • 22
The reverse held for 7 hazards. The gender gap decreased with age for:
• Crime • Breast implants • Nonprescription medicines
• AIDS • Waste incinerators • Street drugs
• Nuclear power
Subgroup analyses: Education. College-educated respondents were consistently less
likely than respondents with high-school or less education to rate a risk as "high" (see
Figures 8 and 9). People with less formal education were relatively more concerned about
street drugs, crime and violence, AIDS, high-voltage power lines, malnutrition, nuclear
power and nuclear waste, and alcohol. In general, these differences were smaller than the
gender differences described earlier. The maximum difference in the "high-risk" response
associated with education was 17.5%, for street drugs.
Subgroup analyses: Region ofresidence. Regional differences are shown in Figure
10 for the 10 items rated with respect to both individual and family risk. In most instances,
regional differences were small, with one exception. Residents of Quebec were more likely
to rate certain risks as high than were residents of other regions. This tendency was
particularly marked for perceived individual and family risks from street drugs, nuclear
waste, AIDS, alcohol and pregnancy, and nuclear power plants.
Figure 11 presents the regional differences in perceived public risk across all 38
hazards. Residents of Quebec produced the highest proportion of "high risk" responses for
29 of the 38 hazard items. Differences among the other regions were relatively small in
comparison with the differences between Quebec and the rest. As Figure 12 indicates,
residents of Quebec were particularly high in perceived risk for non prescription medicines,
nuclear waste, PCBs or dioxin, molds in food, malnutrition, chemical pollution, nuclear

Health Risk Perception in Canada December 30, 1992 • 23
Figure 8. Perceived Health Risks to
Canadian Public by Education
Breast ImplantsOzone Depletion
Cigarette SmokingStress
SuntanningChemical Pollution
Street DrugsCrime and Violence
Motor Vehicle AccidentsNuclear Waste
AIDS
Alcohol & PregnancyPesticides in Food
PCB's or DioxinFood Additives
Drinking AlcoholClimate Change
Nuclear Power PlantsAsbestos
Nonprescription Med.Waste Incinerators
Food IrradiationPrescription Drugs
Malnutrition
Outdoor Air QualityGenet Engr Bacteria
Hi-Volt Power LinesBacteria in Food
Molds in FoodIndoor Air Quality
Medical X-raysMercury in Fillings
Tap WaterVDTs
ContraceptivesHeart Pacemakers
Bottled WaterContact Lenses
0% 10% 20% 30% 40% 50% 60% 70%
Percent High Risk

Health Risk Perception in Canada December 30, 1992 • 24
Figure 9. Perceived Health Risks to CanadianPublic by Education: Difference Between
High School and College EducatedStreet Drugs
Crime and ViolenceAIDS
Hi-Volt Power LinesMalnutrition
Nuclear WasteNuclear Power Plants
Drinking AlcoholBacteria in FoodPCB's or Dioxin
Chemical PollutionMolds in Food
Motor Vehicle AccidentTap Water
Nonprescription Med.Suntanning
Cigarette SmokingFood Irradiation
Waste IncineratorsGenet Engr Bacteria
Food AdditivesAlcohol & Pregnancy
Outdoor Air QualityMercury in Fillings
AsbestosPesticides in Food
VDTsPrescription Drugs
Bottled WaterContraceptives
Climate ChangeContact Lenses
Ozone DepletionMedical X-rays
Stress
Heart PacemakersIndoor Air Quality
Breast Implants
-10% 0% 10% 20%
Percent Difference in High RiskNote: Percent difference is percent High School Educated
high risk response minus percent College Educatedhigh risk response.

Health Risk Perception in Canada December 30, 1992 • 25
Figure 10. Perceived Health Risks By Region:Individual and Family Risks
Street Drugs
Nuclear Waste ««*
AIDS
Alcohol & Pregnancy
Nuclear Power Plants
Malnutrition
Hi-Volt Power Lines
Waste Incinerators
Mercury in Fillings
VDTs
0% 10% 20% 30% 40% 50% 60% 70%
Percent High Risk
•Quebec • Atlantic MOntario
mPrairies aB.C.

Health Risk Perception in Canada December 30, 1992 • 26
Figure 11. Perceived Health Risks by RegionCigarette Smoking
Ozone Depletion
Breast Implants
Street Drugs
Stress
Chemical Pollution
Crime and Violence
Suntanning
AIDS
Motor Vehicle Accidents
Nuclear Waste
Alcohol & Pregnancy
PCB's or Dioxin
Pesticides in Food
Food Additives
Drinking Alcohol
Nuclear Power Plants
Climate Change
Nonprescription Med.
—J——
Asbestos
Waste Incinerators
Malnutrition
Hi-Volt Power Unes
Food Irradiation
Prescription Drugs
Genet Engr Bacteria
Outdoor Air Quality
Bacteria in Food
Molds in Food
Mercury in Fillings
Tap Water
Medical X-Rays
Indoor Air Quality
VDTs
Contraceptives
Heart Pacemakers
Bottled Water
Contact Lenses
•r
•^
lQuebec a Atlantic
IPrairies •B.C.
IOntario

Health Risk Perception in Canada December 30, 1992 • 27
Figure 12. Difference Between Quebecand Other Provinces
Nonprescription Med.Nuclear Waste
PCB's or DioxinMolds in Food
MalnutritionChemical Pollution
Street DrugsNuclear Power Plants
Crime and ViolenceBacteria in Food
StressHi-Volt Power Lines
Food IrradiationFood Additives
Prescription DrugsAlcohol & Pregnancy
Ozone DepletionPesticides in Food
Genet Engr BacteriaMotor Vehicle Accident
AIDSClimate Change
Outdoor AirQualityMedical X-rays
Indoor Air QualitySuntanning
Drinking AlcoholWaste Incinerators
ContraceptivesMercury in Fillings
VDTsTap Water
Heart PacemakersCigarette Smoking
Contact LensesBottled Water
AsbestosBreast Implants
-10% 0% 10% 20%
Percent Difference in High RiskNote: Percent difference is percent Quebec high risk response
minus percent other provinces high risk response.

Health Risk Perception in Canada December 30, 1992 • 28
power plants, crime and violence, and bacteria in food.
Two striking exceptions to the general pattern of regional differences occurs with
perceptions of risk from breast implants and asbestos. Residents of Quebec exhibit
considerably lower perceptions of risk for implants and moderately lower perceptions of risk
from asbestos.
Sources of Information
The left panel of Figure 13 presents the response distributions for the various sources
of information about health issues and risks. The right panel of Figure 13 presents the
responses regarding the confidence that respondents had in those information sources. The
information source relied upon most heavily was the news media. Private industry and
municipal government were relied upon least often. Differences among the remaining
sources were relatively small. Degree of confidence in a source roughly paralleled degree of
reliance on that source. However, medical doctors were trusted substantially more than other
sources. Health and Welfare Canada and Environment Canada received high evaluations.
Private industry received the lowest ratings on confidence. The news media, the most
heavily relied upon source, was outranked on confidence by a number of the other sources.
Responsibility for Health Risk Protection
The perceived degree of responsibility that various individuals, private groups, and
government agencies hold for protecting people against health risks is shown in the left panel
of Figure 14. The right-hand panel of this figure indicates the evaluations of how good a job
each of these agents is doing in meeting their responsibilities for health protection. Medical
doctors and Health and Welfare Canada were seen to be most responsible for health-risk

Health Risk Perception in Canada December 30, 1992 • 29
Figure 13.
Sources of Information about
Health Issues and Risks
News Media
Medical Doctors
Public/Environmental
HWC
Environment Canada
Friends & Relatives
Univ. Scientists
Agriculture Canada
Provincial Govt.
Municipal Govt.
Private Industry
Alot ml Fair
None EI3 DK/NO
Little
50% 75% 100%
Confidence in Organizationas Information Source
News Media
Medical Doctors
Public/Environmental
HWC |
Environment Canada
Friends & Relatives
Univ. Scientists
Agriculture Canada
Provincial Govt.
Municipal Govt.
Private Industry
Alot M Fair Hi Little
None C3 DK/NO
25% 50% 75% 100%

Health Risk Perception in Canada December 30, 1992 • 30
Figure 14
Perceived Degree of Responsibilityfor Protecting the Public
Against Health Risks
Medical Doctors
HWC
Environment Canada
Individual Citizens
Other Health Pros
Agriculture Canada
Local Government
Private Industry
Public/Environmental
0%
MaJ. HH Mod. Hi Some
No Ell DK/NO
25% 50% 75% 100%
Perceived Fulfillment of Responsibilityfor Protecting the Public
Against Health Risks
Medical Doctors
HWC
Environment Canada
Individual Citizens
Other Health Pro3
Agriculture Canada
Local Government
Private Industry
Public/Environmental
0% 25% 50% 75% 100%

Health Risk Perception in Canada December 30, 1992 • 31
protection and also to be doing the best job of fulfilling those responsibilities. Private
industry was judged to be doing the poorest job in meeting this responsibility.
There seemed to be a weak general tendency within individual respondents to either
trust or distrust news sources and to believe that the diverse people and organizations were
doing either a good or bad job in fulfilling their responsibilities for protecting people against
health risks. For example the median intercorrelation between the confidence responses for
pairs of the 11 items in Figure 13 was .26 and the median intercorrelation among "how good
a job" responses for pairs among the 9 items in Figure 14 was .33. As one specific
example, ratings of the job which private industry was doing in fulfilling its responsibilities
correlated .21 with ratings of public interest groups. Ratings for Health and Welfare Canada
and Environment Canada on the same question correlated .72.
Attitudes and Opinions
Tables 3-12 present the response distributions for the 34 attitude and opinion
statements. These statements have been grouped by content category for easier
interpretation.
Category 1 (Table 3) includes general statements about the risks in one's local
environment and in the global environment. At the local level, respondents were about
evenly divided about whether there are serious environmental health problems where they
lived (45% agreement; Question la). Only 39.6% agreed that their community was
becoming a healthier place in which to live (Question lb). There was almost a complete
agreement (93.4%) with the statement that the land, air, and water are more contaminated
now than ever before (Question lc). In summary, almost everyone seems to believe that
contamination has been increasing, and a high percentage of respondents express serious

Health Risk Perception in Canada December 30, 1993 • 32
Table 3. Responses to Attitudes and Opinion Statements: Category 1Local and Global Environmental Health Risks
Disagree Disagree Agree Agree Don't Know/
Strongly Somewhat Somewhat Strongly No Opinion
la. There are serious environmental
health problems where I live(.20)
17.86 36.06 29.88 15.14 1.06
lb. I believe my community isbecoming a healthier place inwhich to live (-.08)
22.05 37.38 31.27 8.30 1.00
lc. The land, air and water around 1.86 4.25 20.78 72.58 0.53us are, in general, morecontaminated now than ever
before (.13)
Id. The greenhouse effect is a 2.32 8.03 35.92 49.93 3.78serious problem which couldlead to harmful changes in theenvironment and in people'shealth (.16)
Note: Cell entries are percentages. Values in parentheses are correlations between responses to thestatement and the risk-perception index. Correlations greater than .07 are significant atp < .01.
concern regarding the healthiness of their home environment. Considerable concern about
the global environment was evident in the finding that 85.9% agreed that the greenhouse
effect is a serious health threat (Question Id).
Questions in Category 2 (Table 4) examined general opinions and attitudes regarding
the risks from exposure to chemicals. Only 43.0% agreed that the use of chemicals has
improved our health more than it has harmed it (Question 2a). Respondents were split
almost evenly on the question of whether most chemicals cause cancer (Question 2b).
Significant concern regarding chemical risks is evident in the finding that 58.9% disagreed

Health Risk Perception in Canada December 30, 1993 • 33
Table 4. Responses to Attitudes and Opinion Statements. Category 2General Opinions About Health Risks from Chemicals
Disagree
Strongly
Disagree
Somewhat
Agree
Somewhat
Agree
Strongly
Don't Know/
No Opinion
2a. Use of chemicals has improved
our health more than it has
harmed it (--28)
23.84 30.15 32.74 10.23 3.05
2b. Most chemicals cause cancer
(.36)
13.35 32.67 29.88 18.53 5.58
2c. I don't worry much aboutchemicals because there are justtoo many other things in my lifethat I have to deal with (-.19)
29.22 29.66 27.42 12.62 1.86
2d. I try hard to avoid contact with 5.71 16.80 39.58 37.05 0.86chemicals and chemical
products in my daily life (.26)
Note: Cell entries are percentages. Values in parentheses are correlations between responses to thestatement and the risk-perception index. Correlations greater than .07 are significant atp < .01.
with the statement that "I don't worry much about chemicals because there are just too many
other things in my life I have to deal with (Question 2c). Even more remarkable is the
concern about chemicals indicated by the finding that 76.6% agreed that "I try hard to avoid
contact with chemicals and chemical products in my daily life" (Question 2d).
Attitudes toward regulation of chemical hazards are indicated by responses to
statements in Category 3 (Table 5). The picture is mixed. Moderate confidence in the
regulatory system is shown by the 54.6% of respondents who agreed that "Chemical risks are
adequately regulated" (Question 3a). However there was 79% disagreement with the
statement in Question 3b that government regulation permits one the luxury of not having to
worry about serious health problems and 85.3% disagreement with the statement that
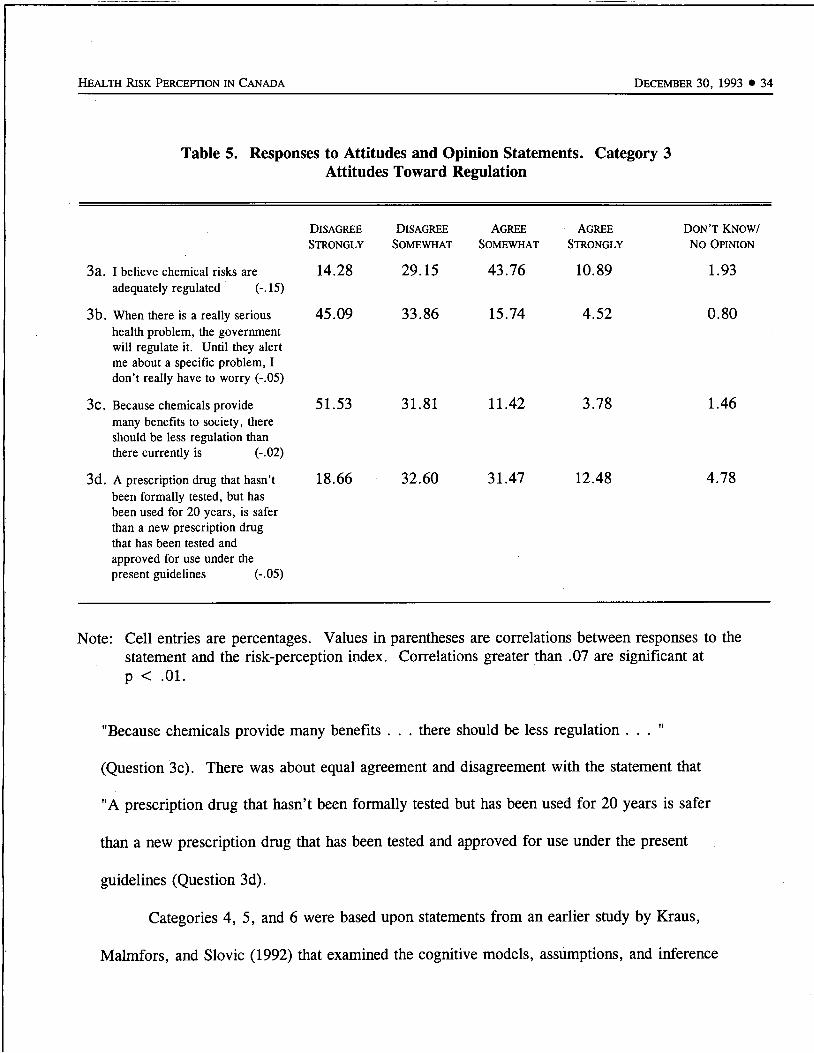
Health Risk Perception in Canada December 30, 1993 • 34
Table 5. Responses to Attitudes and Opinion Statements. Category 3Attitudes Toward Regulation
3a. I believe chemical risks are
adequately regulated (-.15)
3b. When there is a really serioushealth problem, the governmentwill regulate it. Until they alertme about a specific problem, Idon't really have to worry (-.05)
3c. Because chemicals providemany benefits to society, thereshould be less regulation thanthere currently is (-02)
3d. A prescription drug that hasn'tbeen formally tested, but hasbeen used for 20 years, is saferthan a new prescription drugthat has been tested and
approved for use under thepresent guidelines (-05)
Disagree
Strongly
14.28
45.09
51.53
18.66
Disagree Agree Agree
Somewhat Somewhat Strongly
29.15 43.76 10.89
33.86 15.74 4.52
31.81 11.42 3.78
32.60 31.47 12.48
Don't Know/
No Opinion
1.93
0.80
1.46
4.78
Note: Cell entries are percentages. Values in parentheses are correlations between responses to thestatement and the risk-perception index. Correlations greater than .07 are significant atp < .01.
"Because chemicals provide many benefits . . . there should be less regulation ..."
(Question 3c). There was about equal agreement and disagreement with the statement that
"A prescription drug that hasn't been formally tested but has been used for 20 years is safer
than a new prescription drug that has been tested and approved for use under the present
guidelines (Question 3d).
Categories 4, 5, and 6 were based upon statements from an earlier study by Kraus,
Malmfors, and Slovic (1992) that examined the cognitive models, assumptions, and inference

Health Risk Perception in Canada December 30, 1992 • 35
methods that comprise laypeople's intuitive theories about the relationship between chemicals
and health risks. The purpose of the present investigation into what has been termed
"intuitive toxicology" is to provide a deeper understanding of perception of chemical risks
that can serve as a starting point around which to structure discussion, education, and
communication about health-risk assessment.
Questions were developed to address fundamental concepts within the science of
toxicology, specifically
• Conceptions of carcinogenicity
• Conceptions of the relationship between chemical dose or amount of exposure and
degree of risk
• Trust in the use of animal studies to determine the risk a chemical poses to
humans.
Questions in Category 4 (Table 6) assessed the respondents' sensitivity to the
relationship between the dose or amount of exposure to a chemical (or to radiation) and the
degree of health risk. Previous studies have found that the public appears to have an "all-or-
none" view that equates the mere fact of exposure to a carcinogen (regardless of degree of
exposure) with a high probability of being harmed. This same tendency was observed
strongly in the respondents to the present survey. For example, 61.7% agreed that "If a
person is exposed to a chemical that can cause cancer, then that person will probably get
cancer some day" (Question 4a). A similar question involving exposure to radiation elicited
agreement for 64.9% of the respondents (Question 4b). Almost half of the respondents
(49.6%) agreed with the statement that "Chemicals are either safe or dangerous. There is
really no in between." Although the responses to questions 4a, 4b, and 4c suggest a lack of

Health Risk Perception in Canada December 30, 1993 • 36
Table 6. Responses to Attitudes and Opinion Statements. Category 4Perceived Relationship Between Level of Exposure and Health Risk
Disagree Disagree Agree Agree Don't Know/
Strongly Somewhat Somewhat Strongly No Opinion
4a. If a person is exposed to a 6.71 26.95 38.71 22.97 2.66chemical that can cause cancer
then that person will probablyget cancer some day (.26)
4b. If a person is exposed to 7.30 25.17 39.38 25.50 2.66radiation, then that person willprobably get cancer some day
(.26)1
4c. Chemicals are either safe or 20.19 27.62 25.03 24.57 2.59
dangerous. There is really noin between (.21)
4d. The more often a person is 3.65 6.51 34.93 53.39 1.53exposed to a substance that cancause cancer the more likely heor she is to get cancer (.05)
4e. If even a tiny amount of a 4.52 19.65 27.89 46.02 1.93substance that can cause cancer
were found in my tap water, Iwouldn't drink it (.22)
4f. No matter how low the level of 7.30 25.30 41.30 20.72 5.36exposure to radiation, it can stillcause cancer (.19)
Note: Cell entries are percentages. Values in parentheses are correlations between responses to thestatement and the risk-perception index. Correlations greater than .07 are significant atp < .01.
sensitivity to degree of dose or degree of exposure to chemicals and radiation, the responses
to Question 4d illustrate that people also believe that repeated exposures increase risk. There
was agreement by 88.3% that "The more often a person is exposed to a substance that can
cause cancer, the more likely he or she is to get cancer" (Question 4d). In light of these
concerns about any degree of exposure (single or repeated) to carcinogens, it is perhaps not

Health Risk Perception in Canada December 30, 1992 • 37
surprising that 73.9% agreed with the statement that "If even a tiny amount of a substance
that can cause cancer were found in my tap water, I wouldn't drink it" (Question 4e). On
the final question in this series, Question 4f, 62.0% agreed that "No matter how low the
level of exposure to radiation, it can still cause cancer." This "non-threshold" view is
consistent with the assumption that guides risk assessment and regulatory policy regarding
radiation exposure.
Kraus et al. (1992) found a strong relationship between a person's sensitivity to level
of exposure or dose and their general attitudes toward chemicals. Persons who lacked
sensitivity to dose and thus believed any exposure to a toxic substance or carcinogen implied
subsequent harm had less favorable attitudes toward chemicals. The same relationship held
in the present study. For example, among persons who disagreed with Question 4a
(exposure to a carcinogen implies cancer), 69% said they tried to avoid contact with
chemicals (Question 2d). Among those who agreed with Question 4a, 82% said they tried to
avoid chemicals. Similarly, expressed avoidance of chemicals in Question 2d jumped from
53.9% among those who disagreed with Question 4e (If even a tiny amount of a carcinogen
were found in my tap water, I wouldn't drink it) to 81.4% among those who agreed they
would not drink the water.
Category 5 (Table 7) included two questions designed to gauge one's trust in the use
of animal studies to determine a chemical's risk to humans. There was a moderate level of
trust expressed in answers to the general statement in Question 5a: "The way an animal
reacts to a chemical is a reliable predictor of how a human would react to it" (60.3%
agreement). When an animal study was said to provide evidence that a chemical causes
cancer in animals (Question 5b), confidence increased (82.3% agreed). The tendency for
/

Health Risk Perception in Canada December 30, 1993 • 38
Table 7. Responses to Attitudes and Opinion Statements. Category 5Trust in the Use of Animal Studies to Determine Human Health Risk
Disagree Disagree Agree Agree Don't Know/
Strongly Somewhat Somewhat Strongly No Opinion
5a. The way that an animal reacts 14.87 21.71 39.64 20.65 3.12to a chemical is a reliable
predictor of how a humanwould react to it (.00)
5b. If a scientific study produces 4.05 11.82 47.54 34.73 1.86evidence that a chemical causes
cancer in animals, then we can
be reasonably sure the chemicalwill cause cancer in humans
(.17)
Note: Cell entries are percentages. Values in parentheses are correlations between responses to thestatement and the risk-perception index. Correlations greater than .07 are significant atp < .01.
studies that bring bad news about risk to be seen as more valid than other studies has been
observed in a number of other surveys (see, e.g., Kraus et al., 1992).
Other questions pertaining to cancer are grouped in Category 6 (Table 8). Responses
to Question 6a (68.5% disagreement vs. 25.6% agreement) indicates that most respondents
do not share the view presented by Ames (1983) that fruits and vegetables contain natural
substances that are carcinogenic.
Questions 6b and 6c were designed to assess people's conceptions of the mechanism
by which a carcinogen acts. In Question 6b, about 42.6% agreed with the notion that
carcinogens turn normal cells into cancer cells through contact, much like the spread of a
highly contagious disease. About 44.8% disagreed with this statement and 12.7% did not

Health Risk Perception in Canada December 30, 1993 • 39
Table 8. Responses to Attitudes and Opinion Statements. Category 6Other Questions Pertaining to Cancer
Disagree Disagree Agree agree don't Know/
Strongly Somewhat Somewhat Strongly No Opinion
6a. Fruits and vegetables contain 34.86 33.60 19.85 5.78 5.91natural substances that can
cause cancer (.04)
6b. A cancer-causing substance 18.33 26.43 30.35 12.22 12.68turns normal cells into cancer
cells through contact, much likethe spread of a highlycontagious disease (.07)
6c. The body usually repairs the 23.90 33.93 25.23 6.04 10.89damage caused by exposure toradiation so that cancer does not
occur (-14)
Note: Cell entries are percentages. Values in parentheses are correlations between responses to thestatement and the risk-perception index. Correlations greater than .07 are significant atp < .01.
know or did not answer. In Question 6c, only 31.3% agreed that the body usually repairs
damage caused by exposure to radiation (57.8% disagreed).
Willingness to entertain risk/benefit tradeoffs was examined in Category 7 (Table 9).
Only 29.0% agreed that "Canadians should be prepared to accept some risks to their health
in order to strengthen the economy" (Question 7a). However, if the benefit was a personal
one involving drugs or medical devices, willingness to accept some risk rose to 52.9%
(Question 7b).
Two questions about health risks and energy policies are included in Category 8
(Table 10). On Question 8a, 45.0% agreed that Canada should rely more heavily upon
nuclear power to meet future electricity needs, in light of health concerns associated with

Health Risk Perception in Canada December 30, 1993 • 40
Table 9. Responses to Attitudes and Opinion Statements. Category 7Willingness to Entertain Risk/Benefit Tradeoffs
7a. Canadians should be preparedto accept some risks to theirhealth in order to strengthen theeconomy (.02)
7b. I am prepared to accept somerisk in order to achieve the
potential health benefit of drugsor medical devices (-06)
Disagree
Strongly
43.29
20.45
Disagree Agree Agree
Somewhat Somewhat Strongly
26.63 18.99 9.96
24.44 42.43 10.49
Don't Know/
No Opinion
1.13
2.19
Note: Cell entries are percentages. Values in parentheses are correlations between responses to thestatement and the risk-perception index. Correlations greater than .07 are significant atp < .01.
Table 10. Responses to Attitudes and Opinion Statements. Category 8Health Risks and Energy Policy
Disagree
Strongly
Disagree
Somewhat
Agree
Somewhat
AgreeStrongly
Don't Know/
No Opinion
8a. In light of health concerns aboutacid rain, damage to the ozone -layer and climate changeassociated with the burning ofcoal and oil, Canada should relymore heavily upon nuclearpower to meet its futureelectricity needs (-12)
22.05 26.83 32.54 12.42 6.18
8b. In light of these same healthconcerns, Canada should placegreater emphasis on energyconservation (. 10)
0.86 2.99 31.34 63.61 1.20
Note: Cell entries are percentages. Values in parentheses are correlations between responses to thestatement and the risk-perception index. Correlations greater than .07 are significant atp < .01.

Health Risk Perception in Canada December 30, 1992 • 41
burning coal and oil. In light of these same concerns, 95.0% agreed that Canada should
place greater emphasis on energy conservation (Question 8b).
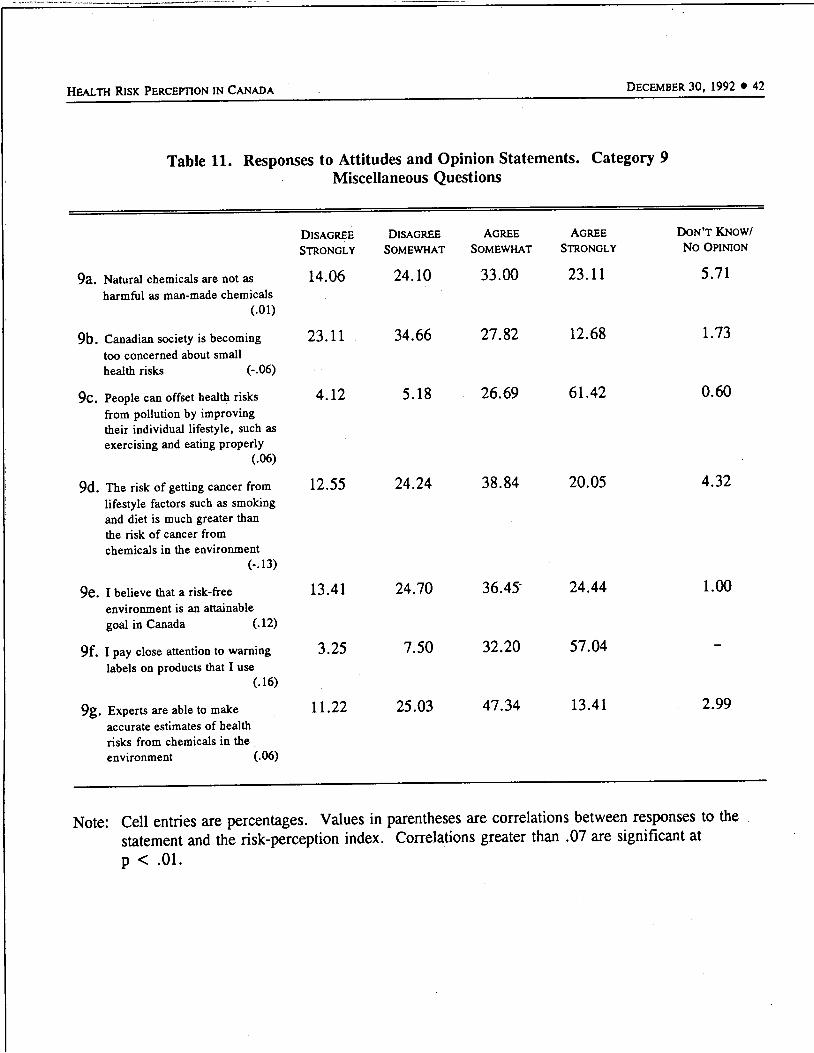
Seven miscellaneous questions are contained in Category 9 (Table 11). Question 9a
indicates that 56.1% agreed with the statement that natural chemicals are not as harmful as
man-made chemicals, a view forcefully proposed by Rachel Carson in Silent Spring (Carson,
1962) but disputed by most toxicologists (Kraus et al., 1992). Most respondents (57.8%)
disagreed with the view that "Canadian society is becoming too concerned about small health
risks" (Question 9b); 40.5% agreed with this statement. A note of optimism was evident in
responses to Question 9c. Exercise and proper eating were believed by 90.1% to be able to
offset health risks from pollution. In Question 9d, 58.9% agreed that lifestyle factors such
as smoking and diet posed greater cancer risk than did chemicals in the environment; 38.8%
disagreed with this view. In Question 9e, a majority of respondents (60.9%) agreed that
"... a risk-free environment is an attainable goal in Canada" (38.1% disagreed). In
Question 9f, 89.2% agreed with the statement "I pay close attention to warning labels on
products that I use." The final miscellaneous question (9g) elicited 60.8% agreement with
the statement: "Experts are able to make accurate estimates of health risks from chemicals in
the environment."
Worldviews
Response distributions for questions pertaining to worldviews (also known as "cultural
biases" or "orienting dispositions") are shown in Category 10 (Table 12).
Health Risk Perception in Canada December 30, 1992 • 42
Table 11. Responses to Attitudes and Opinion Statements. Category 9Miscellaneous Questions
9a. Natural chemicals are not asharmful as man-made chemicals
(.01)
9b. Canadian society is becomingtoo concerned about small
health risks (-.06)
9c. People can offset health risksfrom pollution by improvingtheir individual lifestyle, such asexercising and eating properly
(.06)
9d. The risk of getting cancer fromlifestyle factors such as smokingand diet is much greater thanthe risk of cancer from
chemicals in the environment
(-13)
9e. I believe that a risk-freeenvironment is an attainable
goal in Canada (.12)
9f. I pay close attention to warninglabels on products that I use
(.16)
9g. Experts areable to makeaccurate estimates of health
risks from chemicals in the
environment (.06)
Disagree
Strongly
14.06
23.11
4.12
12.55
13.41
3.25
11.22
Disagree Agree Agree
Somewhat Somewhat Strongly
24.10 33.00 23.11
34.66 27.82 12.68
5.18 26.69 61.42
24.24 38.84 20.05
24.70 36.45' 24.44
7.50 32.20 57.04
25.03 47.34 13.41
Don't Know/
No Opinion
5.71
1.73
0.60
4.32
1.00
2.99
Note: Cell entries are percentages. Values in parentheses are correlations between responses to thestatement and the risk-perception index. Correlations greater than .07 are significant atp < .01.

Health Risk Perception in Canada December 30, 1992 • 43
Table 12. Responses to Attitudes and Opinion Statements. Category 10Worldviews
10a. I feel that I have very littlecontrol over risks to my health(Fatalism) (.23)
10b. If something like a chemical isgoing to harm me it will, andthere isn't much that I can do
about it—what will be, will be
(Fatalism) (-.01)
10c. Decisions about health risksshould be left to the experts
(Hierarchy) (.05)
10d. People in positions ofauthority are not likely to abusetheir power (Hierarchy) (.05)
10e. In a fair system, people withmore ability should earn more(Individualism) (-.11)
lOf. If people in this country weretreated more equally we wouldhave fewer problems(Egalitarianism) (.19)
lOg. A high technology society isimportant for improving ourhealth and social well being(Technological Enthusiasm)
(-.01)
Disagree
Strongly
21.65
39.64
28.75
36.7
7.0
5.5
6.91
Disagree agree Agree
Somewhat Somewhat Strongly
29.02 30.68 18.39
26.29 21.85 10.69
32.40 23.44 14.41
33.2 19.1 10.0
16.5 45.4 30.6
12.6 36.5 44.6
18.06 45.55 26.69
Don't Know/
No Opinion
0.27
1.53
1.00
1.0
0.6
0.9
2.79
Note: Cell entries are percentages. Values in parentheses are correlations between responses to thestatement and the risk-perception index. Correlations greater than .07 are significant atp < .01.
Health Risk Perception in Canada December 30, 1992 • 44
The worldview "fatalism" was assessed in questions 10a and 10b.2 In Question 10a,
there was about an even split between agreement and disagreement with the statement, "I
have very little control over risks to my health" (49.1% agreement; 50.7% disagreement).
On Question 10b, 32.5% agreed with the view that "there isn't much I can do" regarding
harm from chemicals—"what will be, will be"; 65.9% disagreed).
Two questions about experts were designed to assess the worldview "adherence to
hierarchical forms of social organization" (hierarchy). In Question 10c, 38.8% agreed with
the hierarchical position: "Decisions about health risks should be left to the experts." The
second question about hierarchy was lOd, which elicited 22.2% agreement with the
statement, "People in positions of authority are not likely to abuse their power." The fact
that a majority of respondents did not wish to leave decision making to the experts is
interesting in light of the finding that medical doctors and organizations employing experts
were judged to have a high degree ofresponsibility for protecting the public against health
risks (Figure 14, left-hand panel). What appears to be an inconsistency between these two
perspectives may be explained in light of the fact that experts and organizations were not
always given high marks in fulfilling this responsibility (Figure 14, right-hand panel).
The view known as "individualism" was measured by Question lOe; 76.0% agreed
with the individualist view: "In a fair system people with more ability should earn more."
The worldview known as "egalitarianism" was measured in Question lOf: 81.1% agreed
with the egalitarian view that "If people in this country were treated more equally we would
have fewer problems."
2Studies of worldviews typically use four or more questions to measure each view. Thepresent study included only one or two items representing each view, thus providing only apartial assessment.

Health Risk Perception in Canada December 30, 1992 • 45
The final view assessed here, "technological enthusiasm" (Jasper, 1990), is reflected
in responses to Question lOg: "A high-technology society is important for improving our
health and social well-being" (71.2% agreement).
A number of previous studies have found that worldviews correlate significantly with
perceptions of risk (see, e.g., Dake, 1991). Of the seven worldviews assessed in this study,
two appeared related to perceived risk. Item 10a, expressing Fatalism, correlated positively
with perceived risk from many of the hazard items. The highest correlations, ranging
between .18 and .20, involved hazards from foods and/or bacteria (bacteria in foods, food
irradiation, molds in food, genetically engineered bacteria in agriculture).
The second worldview that showed consistent relationships with perceived risk was
item lOf, expressing Egalitarianism. Egalitarianism showed positive correlations, ranging
between .12 and .15, with perceived risk from nuclear power, mercury fillings, malnutrition,
chemical pollution, bacteria in food, tap water, alcohol, genetically engineered bacteria in
agriculture, and food additives.
The Risk-Perception Index
There was a moderately strong tendency for people to be consistent across hazards in
their perceptions of risk. Perceptions for every one of the 703 pairs among the 38 hazards
studied here were positively correlated across respondents (the mean and median of the
distribution of these correlations were both .25). Thus, for example, perceived risk to the
public from nuclear power plants correlated .36 with perceived risk from chemical pollution.
Perception of risk from nuclear power correlated almost as highly (.28) with perception of a
very different type of risk—crime and violence.

Health Risk Perception in Canada December 30, 1992 • 46
A risk-perception index was created for each respondent by averaging his or her
ratings across all of the hazard items. The mean ratings were distributed as shown in Table
13. Almost half (43.2%) of the respondents had a mean value greater than 3.0 (the
"moderate risk" response).
Table 13. Mean Risk Perception Ratings(The Risk-Perception Index)
Index Frequency Percent
1.00 - 1.5 3 0.2
1.51-2.0 39 2.6
2.01 -2.5 257 17.1
2.51 -3.0 557 37.0
3.01 - 3.5 543 36.1
3.51-4.0 107 7.1
1506
Note: Cell entries are percentages. Responsesaveraged to create the index ranged from 1(almost no risk) to 4 (high risk).
The risk-perception index values were correlated with responses to the attitude,
opinion, and worldview questions presented in Tables 3-12. These correlations are shown in
parentheses next to each question in Tables 3-12. We can see that the perception index was
significantly correlated with general opinions about health risks from chemicals (Category 2,
Table 4) and with sensitivity to the relationship between exposure and risk (Category 4,
Table 6). In Category 2, for example, the perception index correlated .36 with the view that
"most chemicals cause cancer" (Question 2b). In Category 4, there was a correlation of .26
between the index and the view that a person exposed to a chemical that can cause cancer

Health Risk Perception in Canada December 30, 1992 ♦ 47
will probably get cancer some day (Question 4a). Worldviews pertaining to fatalism
(Question 10a) and egalitarianism (Question lOf) also correlated moderately with the risk-
perception index.
The risk-perception index also correlated strongly with gender (r = .29; women were
higher on the index), education (r = -.22), and income (r = -.20). It also correlated
significantly with the respondents' self-rated health status (r = .14). Persons with higher
mean ratings for perceived risk rated their personal health as less good, in comparison with
persons whose risk-perception ratings were lower.
Personal and Demographic Characteristics
Most of the questions in the survey asked for perceptions, evaluations, and attitudes
about various health risk issues. The final section, however, asked questions about personal
characteristics of the respondents including social, economic, and other behavioral
information. Data from selected items are examined below and related to of the ratings of
health and safety risk.
Smoking. One of the highest perceived health risks is smoking. Questions were
asked about past smoking behavior ("Has there ever been a period in your life when you
smoked cigarettes regularly?"), and current smoking behavior ("Do you smoke regularly
now?").
Well over half the respondents (57.6%) said they had smoked cigarettes regularly at
some period in their life. Males (62.6%) were more likely than females (52.8%) to answer
"yes" to this question. The proportion of affirmative answers increases by age category. It
was less than half for those under age 30 (49.7%), but more than ten percentage points
higher for those ages 30-54 (59.9%) and over 55 years of age (60.9%). People with
Health Risk Perception inCanada December 30, 1992 • 48
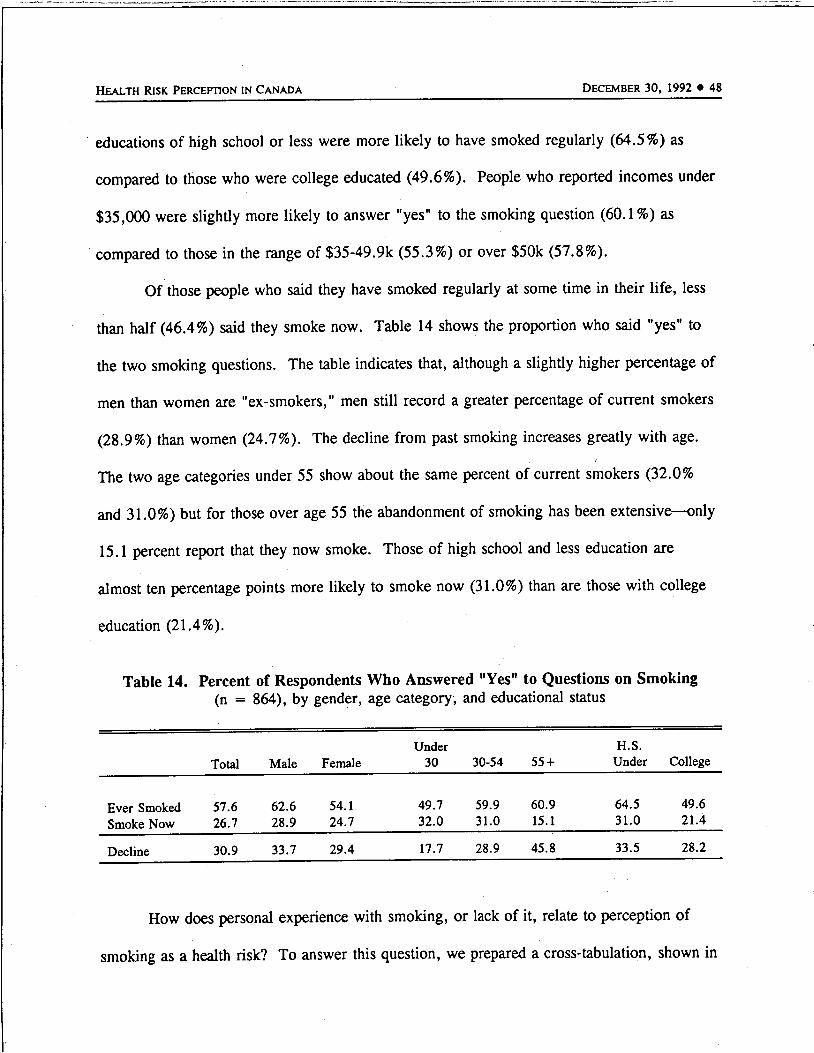
educations of high school or less were more likely to have smoked regularly (64.5%) as
compared to those who were college educated (49.6%). People who reported incomes under
$35,000 were slightly more likely to answer "yes" to the smoking question (60.1%) as
compared to those in the range of $35-49.9k (55.3%) or over $50k (57.8%).
Of those people who said they have smoked regularly at some time in their life, less
than half (46.4%) said they smoke now. Table 14 shows the proportion who said "yes" to
the two smoking questions. The table indicates that, although a slighdy higher percentage of
men than women are "ex-smokers," men still record a greater percentage of current smokers
(28.9%) than women (24.7%). The decline from past smoking increases greatly with age.
The two age categories under 55 show about the same percent of current smokers (32.0%
and 31.0%) but for those over age 55 the abandonment of smoking has been extensive—only
15.1 percent report that they now smoke. Those of high school and less education are
almost ten percentage points more likely to smoke now (31.0%) than are those with college
education (21.4%).
Table 14. Percent of Respondents Who Answered "Yes" to Questions on Smoking(n = 864), by gender, age category, and educational status
Total Male Female
Under
30 30-54 55 +
H.S.
Under College
Ever Smoked
Smoke Now
57.6
26.7
62.6
28.9
54.1
24.7
49.7
32.0
59.9
31.0
60.9
15.1
64.5
31.0
49.6
21.4
Decline 30.9 33.7 29.4 17.7 28.9 45.8 33.5 28.2
How does personal experience with smoking, or lack of it, relate to perception of
smoking as a health risk? To answer this question, we prepared a cross-tabulation, shown in

Health Risk Perception in Canada December 30, 1992 • 49
Table 15, that compares those who smoke now, those who once did smoke but quit, and
those who have never smoked with their ratings of risk from smoking. Nonsmokers rate the
risks of smoking higher than those who quit, and those who quit, in turn, rate the risks
higher than those who currently smoke cigarettes. In all cases, however, a solid majority see
smoking as a high-risk condition, even those who continue to smoke.
Table 15. Perception of Smoking as a Health Risk by Experience with SmokingBehavior (n = 1498)
Smoke Now Did Smoke and Quit Never Smoked
Smoking Risk Rating n % n % n %
Almost No Risk 7 1.7 8 1.9 9 1.5
Slight Risk 43 10.6 22 4.8 36 5.7
Moderate Risk 134 33.5 151 32.6 174 27.4
High Risk 217
401
54.2
100.0
281 60.7 416 65.4
Total 462 100.0 635 100.0
X2 = 24.41, DF = 9, P = .0037
Seat Belts. Another question asked if the respondent wears a seat belt when driving
or riding in a motor vehicle. Over all, 95 percent said "yes" to this question. There were
some differences between men (92.4%) and women (97.5%). Generally the reported use
increased slightly with age: under 30, 93.0 percent; 30-54 years of age, 95.2 percent; and
over age 55, 96.4 percent. Regionally, Quebec reported the highest seat belt use at 97.6
percent while the Prairies were the lowest at 91.8 percent. There were only slight
differences by educational or income categories.

Health Risk Perception inCanada December 30, 1992 • 50
Exercise. A majority of the respondents reported that they exercised regularly
(63.7%). Men were slightly more likely (66.4%) than women (61.2%) to report exercise
behavior. The region reporting the highest proportion of respondents who exercise regularly
was British Columbia (73.0%) while the Atlantic provinces reported the least (58.8%).
More than two-thirds of those under 30 (67.1%) and those over age 55 (66.8%) reported
regular exercise, while only 60.1 percent of those between ages 30-54 gave the same "yes"
answer. College-educated people were more likely to report regular exercise (67.5%) than
were those having a high school or less education (60.5%).
Voluntary risk. Less than a fifth (18.8%) of the respondents said they participate in
an activity that other people consider risky. Regionally, the highest level of such reports is
from British Columbia (27.1%) and the lowest from the Adantic (13.4%) and Quebec
(14.7%). Men (27.5%) are much more likely to report such behaviors than are women
(10.6%). There is also a decline with age in such reports. Under 30 years of age, 31.7%
reported voluntary risk behaviors, while the rate for ages 30-55 was 17.3 percent, and for
those age 55 and older it was 10.1 percent. College-educated people reported such risky
behavior (23.4%) more often than those with high school or less education (14.5%). Most
of these voluntary risk activities were related to sports (skiing, parachuting, contact sports
such as hockey or football, hunting, etc.). A small set had to do with volunteer community
activities such as fire-fighting or militia service.
How do people who engage in voluntary risk behaviors rate other hazards as
compared to those who do not undertake such voluntary risks? Table 16, below, shows a
cross-tabulation for these two groups of people compared to ratings in the risk-perception
index.

Health Risk Perception in Canada December 30, 1992 • 51
Table 16. Voluntary Risk Behavior by Risk-Perception Index Score
Engage in Voluntary Risk Behavior:
Yes No
Risk-Perception Index Score n % %
Low (1.0-2.0)
MEDIUM (2.01-3.0)
High (3.01-4.0)
13 4.7 33 2.7
178 63.3 643 52.8
90 32.0 541 44.5
Total 281 100.0 1217 100.0
These findings show that people who voluntarily engage in behaviors others think are
risky generally rated risks lower than people who do not engage in such behaviors.
Health and safety risk from employment. Well over half (54.1 %) of those respondents
who said they were employed outside the home (n = 857) said their employment exposed
them to health or safety risks. The Atlantic region had the lowest reported employment risk
(43.5%) while British Columbia had the highest at 66.2 percent. Men were more likely
(59.7%) than women (47.0%) to report exposure to occupational health or safety risks. For
the two age categories under age 55, over 55 percent said they face health and safety risks,
while only 42.1 percent of those over age 55 make this claim. Those with a high school or
lower education reported such risks more often (57.7%) than those with college education
(51.2%). The middle income group ($35-50k) reported health and safety risks at a rate 10
percentage points higher (63.2%) than those in a lower category (under $35k = 53.5%) and
those in the higher category (over $50k = 51.7%).

Health Risk Perception in Canada December 30, 1992 • 52
It might be assumed that employment risks are both voluntary and imposed; voluntary
in the sense that a person can quit a dangerous job, and imposed as part of complex social,
psychological, and economic conditions. We wanted to examine whether or not job health
safety risks were related to people's general assessment of risks. Table 17 shows a cross-
tabulation of how people answered the question about job risks with the ratings of risk on the
risk-perception index.
Table 17. Job Health Safety Risk by Risk-Perception Index Score
Job Health Safety Risks
Yes No
Risk-Perception Index Score n % %
Low (1.0-2.0)
MEDIUM (2.01-3.0)
HIGH (3.01-4.0)
11 2.4 22 5.5
281 60.5 235 59.3
172 37.1 140 35.2
Total 464 100.0 397 100.0
Those who reported job health and safety risks and those who did not were quite
similar in their ratings of the risks as indicated by the Risk-Perception Index. These results
can be compared to those who reported voluntary risks, primarily from recreational
activities. Those who engaged in voluntary risks tended to score lower on the risk-
perception index than those who reported health and safety risks from their jobs.
Health-related employment. Over a fifth of the respondents (22.4%) said they worked
in a health-related profession. Regionally, the highest proportion was in the Atlantic

Health Risk Perception in Canada December 30, 1992 • 53
(30.8%) while the Prairies recorded the smallest (17.5%) share. Women (32.1%) were more
than twice as likely as men (14.8%) to work in the health professions. Interestingly, those
over age 55 had the largest proportion of health profession workers, 32.2 percent. Neither
educational nor income categories showed much variation with regard to employment in the
health professions.
Selfrating ofpersonal health. Respondents were asked to rate their personal health
on a four-point scale. For the country as a whole the results were: Excellent, 27.8 percent;
Good, 52.5 percent; Fair, 26.8 percent; and Poor, 2.8 percent. Regionally, the Atlantic
provinces reported the lowest proportion of "excellent" (20.7%) and the highest proportion
(62.6%) of "good" ratings. Quebec (29.2%) and British Columbia (29.4%) reported the
greatest proportion of "excellent" ratings. The Prairies, at 19.0 percent, recorded the highest
"poor" rating score.
As might be expected, those over age 55 reported the lowest number of "excellent"
ratings (20.3%), about ten percentage points below the two younger age groups. The 55 and
older group also reported a much higher "poor" rating (25.5%), about 12 percentage points
above the other two age groups.
College-educated people were more likely to rate their health as "excellent" (35.1%)
than were those with high school or less education (21.6%). The "excellent" rating also
increased with household income. Those under $35k were at 21.8 percent, those in the
range of $35-50k were at 26.7 percent, and those over $50k increased another ten percentage
points to 37.3 percent.
Rating ofmedical care. The same scale used for rating personal health was also used
to rate the medical care available (Excellent, Good, Fair, Poor). A vast majority of

Health Risk Perception in Canada December 30, 1992 • 54
respondents (87.0%) rated the available health care as excellent (40.6%) or good (46.4%).
The "excellent" rating was lowest in Quebec (27.7%) and highest in British Columbia
(46.1%) and Ontario (47.4%). There was a steady increase in the proportion of "excellent"
ratings by age category. For those under 30, the rating of "excellent" was made in 35.2
percent of the cases. Between 30-55 years of age this rating was 40.9 percent; and for over
age 55 the rating was 44.2 percent. There were only slight differences by educational
category. By income category, more than half (50.2%) of those with incomes over $50k
rated medical care as excellent, while those under $50k were 15-18 points lower—about a
third of those under $50k said medical care is "excellent."
In considering these two ratings, we were interested in knowing how personal health
and available medical care ratings related to each other. These data are shown in Table 18,
below.
Table 18. Personal Health Rating by Available Medical Care Rating (n = 1497)
Personal Health
Medical Care Excellent/Good Fair/Poor
Excellent/Good 1079 225
72.1% 15.0%
Fair/Poor 124 69
8.3% 4.6%
The personal health rating was positively correlated with evaluations of the available
medical care. At the same time, medical care ratings were consistently higher than personal

Health Risk Perception in Canada December 30, 1992 • 55
health ratings. For example, while 80.4 percent of the respondents rated their own health as
good or excellent, 87.1 percent rated the available medical care as good or excellent.
Almost a fifth of the sample (19.6%) said their health was only fair or even poor. However,
of these people, who presumably would most need current medical care, three quarters rated
the care available to them as good or excellent.
Living with disabled or serious health problems. Over a tenth (11.4%) of the
respondents reported that they have people living with them who are disabled or have serious
health problems. The lowest proportion of such households is reported for Quebec (6.5%)
and the highest for Ontario (15.1%). Those under age 55 reported this household condition
for about 9.5 percent of the cases while those over age 55 recorded a "yes" answer for 15.3
percent of the households. The largest proportion of such conditions was reported for
households under $35k annual income. The two income categories above that figure report
6.9 percent ($35-50k) and 7.6 percent ($50k and over).
Table 19 below shows how people with and without disabled persons or serious health
problems in their households rated the available medical care.
Although the households with disabled or serious health problems would be expected
to have more contact with the available medical care, at least in the area of the problems
referred to, they did not record a significantly different rating of medical care than those
households without such problems.
Additional demographic analyses. A snapshot of the relationships between various
personal characteristics and risk perception was provided earlier (see, e.g., Figures 3-12). A
broader view of the relationship between personal and demographic variables and health-risk

Health Risk Perception in Canada December 30, 1992 • 56
Table 19. Ratings of Available Medical Care by People Livingin Households with Disabled or Serious Health Problems
Household with
Disabled or Serious
Health Problem
Yes n
row %
col %
No n
row %
col %
Rating of Available Medical Care
Excellent Good Fair Poor
65 81 17 8
38.0 47.4 9.9 4.7
10.7 11.7 11.0 21.1
544 613 137 30
41.1 46.3 10.3 2.3
89.3 88.3 89.0 78.9
609 694 154 38
X2 = 3.89; DF = 3; p = .2746
171
1324
attitudes and perceptions was obtained by correlating responses to the survey questions with
gender (men were coded as 1; women as 2), age, education, and income.
Looking first at correlations with the 38 questions about perceived risk to the
Canadian public, gender differences were more important than the other demographic
variables. Gender had the highest correlation with perceived risk for 24 of the 38 items.
Education was highest for 8 (AIDS, street drugs, malnutrition, bacteria in food, tap water,
genetically engineered bacteria, crime and violence, and food irradiation). Income was
highest for 3 (mercury fillings, alcohol, bottled water) and age was highest for 3
(pacemakers, contact lenses, alcohol when pregnant). The correlations with gender were all

Health Risk Perception inCanada December 30, 1992 • 57
negative (women had higher perceived risk). When the highest correlations were with age,
the correlation was negative for pacemakers and positive for contact lenses and for drinking
alcohol when pregnant.
Based upon these results one might expect that responses to the attitude and
worldview statements in Tables 3-12 would also correlate more highly with gender than with
any of the other demographic variables. This was not the case. Education had the highest
correlation for 24 of the 37 statements. Gender was highest for only 6 statements, age for 5,
and income for 2.
Compared to persons with less education, those who were college educated
• had more favorable attitudes toward chemicals
• were less likely to see chemical risks as all-or-none matters
• were more likely to reject a fatalistic view of risk
• were more likely to disagree that decisions about health risks should be left to
experts or the government
• were less likely to agree that Canadians should be prepared to accept some risks
to their health in order to strengthen the economy.
Correlations with gender indicated that women were more likely than men to:
• pay close attention to warning labels
• try to avoid contact with chemicals and chemical products
• express negative attitudes toward chemicals and their safety.
Health Risk Perception inCanada December 30, 1992 • 58
Correlations with age indicated that older people were more likely than younger
people to:
• disagree that these are serious environmental health problems in their community
• trust government and experts to take care of health risks
• express fatalist attitudes toward health risks
• try to avoid contact with chemicals and chemical products.
In general, persons with higher income
• had more favorable attitudes toward chemicals and less concern about chemical
risks
• were less likely to see risk from chemicals as an all-or-none matter
• were less likely to trust government and experts to take care of health risks
• were less likely to agree that treating people more equally would lead to fewer
problems.
IV. Summary and Discussion
The present study represents one of the most comprehensive national surveys of
health-risk perception conducted to date. The key findings were as follows:
1. The Canadian public reported a high degree of perceived risk for many hazards.
Contrary to the view of many observers that the public is overconcerned about small risks
and underconcemed about serious risks, the present study found that people are quite aware
of individually chosen lifestyle risks that are judged serious by health and risk professionals
(e.g., cigarette smoking, street drugs, alcohol, AIDS, suntanning). However there was a
tendency to see AIDS, drugs, and alcohol as posing much higher risk to society in general
Health Risk Perception inCanada December 30, 1992 • 59
than to oneself and one's family. There was also a great deal of concern expressed regarding
health risks associated with industrial pollution (e.g., ozone depletion, chemical pollution,
nuclear waste) and risks from certain medical devices (e.g., breast implants). Perceptions of
risk from nuclear power and nuclear waste were particularly high with respect to oneselfand
one's family and these concerns were not related to one's distance from nuclear power
plants.
2. Perceptions of risk between pairs of hazards tended to be positively correlated.
That is, persons concerned about one hazard were more likely to be concerned about other
hazards as well. Those unconcerned about one hazard were more likely to be unconcerned
about others.
3. There was a high degree of concern about chemical products (except for
medicines) and chemical pollution. There was almost complete agreement (93.4%) that the
land, air, and water are more contaminated now than ever before. Fewer than half (43.0%)
of the respondents agree that use of chemicals has improved health more than it has harmed
health. Perhaps most dramatic was the finding that about 75 % of the respondents said that
they try hard to avoid contact with chemicals and chemical products. This response was
linked to a widespread belief that even very small exposures to chemicals could be harmful
and that chemicals found to produce cancer in animals were likely to produce cancer in
humans.
4. There was a widespread belief that a risk-free environment is achievable in
Canada and a definite unwillingness to accept some risks to one's health in order to aid the
economy. A majority of respondents would, however, accept some risk in order to achieve
the potential personal health benefits of medicines or medical devices.

Health Risk Perception inCanada December 30, 1992 • 60
5. There were sizable effects of gender, age, education, and region of residence that
need to be better understood. Women generally rated health risks as higher than did men,
and less educated persons had generally higher perceptions of risk than did people with more
education. Residents of Quebec stood out from other respondents in their attitudes and
perceptions.
Many studies have found women to be more concerned than men about risks from
nuclear power and chemicals (see, e.g., Kraus et al., 1992, Slovic et al., 1989, 1991). The
differences between men and women observed in the present study appear to be larger than
differences observed previously. The present results also indicate that gender differences
exist even for perceptions of nonchemical and non-nuclear hazards (e.g., stress, crime, motor
vehicle accidents). These results also demonstrate that the magnitude of gender differences
in risk perception varies considerably across hazards. There have been relatively few studies
attempting to explain the origin of gender differences in risk perception. The sizable
differences observed in the present study call attention to the need for a better understanding
of these differences.
The observed regional differences also need to be much better understood. Why, for
example, do residents of Quebec perceive more risk from nuclear power and nuclear waste
than do residents of Ontario when only one of the country's 22 reactors are located in
Quebec and 20 are located in Ontario? Is this another example of the finding by Lindell and
Earle (1983) that persons closest to hazardous facilities are least concerned about them? Or
do persons living in Quebec feel vulnerable to the reactors in Ontario? Why, also, do
respondents from Quebec appear to perceive less risk from breast implants and asbestos than
do persons living elsewhere?

Health Risk Perception in Canada December 30, 1992 • 61
6. There were numerous other specific findings of interest. For example:
a. More persons were in favor of stepping up energy conservation in response
to concerns about risks from burning fossil fuels than were in favor of
increasing use of nuclear power.
b. A high percentage of Canadians believe that proper exercise and diet can help
offset health risks from pollution.
c. A majority of respondents agreed that lifestyle factors such as smoking and
diet posed greater cancer risk than do chemicals in the environment.
d. Younger people were slightly less likely than older people to rate cigarette
smoking as a high risk, and a higher percentage of younger persons smoked.
Colleged-educated persons perceived higher risk from smoking and were less
likely to smoke than were persons having less education.
e. Health and Welfare Canada was viewed relatively favorably as a useful and
credible source of information about health risks and as an agency that was
doing a good job in fulfilling its responsibility for protecting people against
health risks.
f. Almost 90% of the respondents claimed to pay close attention to warning
labels on products that they use.
g. Generalized attitudes, known as worldviews, were correlated with perceptions
of risk. Specifically, a fatalistic view ("I feel I have little control over risks
to my health") was endorsed by over half of the respondents and was
associated with high perceptions of risk. An egalitarian view ("If people in
this country were treated more equally we would have fewer problems") was
Health Risk Perception in Canada December 30, 1992 • 62
endorsed by about 72% of the sample and was also associated with high
perceptions of risk.
While the broad outline of these results is similar to results from other studies in
Canada and elsewhere, many of the findings are new and point to the need for more
extensive studies of specific issues. Many of the hazards currentiy of concern to Canadians,
such as ozone depletion, breast implants, suntanning, AIDS, and climate change, would not
have been considered serious only a few years ago. Perceptions of risk are constantly in flux
and surveys such as the present study, if repeated periodically, can track the ebb and flow of
public opinion in light of new discoveries in the world of hazards, educational campaigns,
and risk-management policies.

Health Risk Perception in Canada December 30, 1992 • 63
VI. References
Ames, B. (1983). Dietary carcinogens and anticarcinogens. Science, 221, 1256-1264.
Buss, D. M., Craik, K. H., & Dake, K. M. (1986). Contemporary worldviews andperception of the technological system. In V. T. Covello, J. Menkes, & J. Mumpower(Ed.), Risk evaluation and management (pp. 93-130). New York: Plenum.
Carson, R. (1962). Silent spring. New York: Houghton Mifflin.
Dake, K. (1991). Orienting dispositions in the perception of risk: An analysis ofcontemporary worldviews and cultural biases. Journal of Cross-Cultural Psychology, 22,61-82.
Freud, S. (1924). Collected papers. London: Hogarth.
Galton, F. (1880). Psychometric experiments. Brain, 2, 149-162.
Jasper, J. M. (1990). Nuclear politics: Energy and the state in the United States, Sweden,and France. Princeton, NJ: Princeton University Press.
Kraus, N., Malmfors, T., & Slovic, P. (1992). Intuitive toxicology: Expert and layjudgments of chemical risks. Risk Analysis, 12, 215-232.
Lindell, M., & Earle, T. C. (1983). How close is close enough: Public perceptions of therisks of industrial facilities. Risk Analysis, 3, 245-254.
Slovic, P. (In press). Perceptions of risk: Reflections on the psychometric paradigm. InD. Golding & S. Krimsky (Eds.), Theories of risk. Westport, CT: Praeger-Greenwood.
Slovic, P. (1990). Perception of risk from radiation. In W. K. Sinclair (Ed.), Proceedings ofthe Twenty-fifth Annual Meeting of the National Council on Radiation Protection andMeasurements. Vol 11: Radiationprotection today: The NCRP at sixty years (pp. 73-97).Bethesda, MD: NCRP.
Slovic, P., Flynn, J., & Layman, M. (1991). Perceived Risk, Trust, and the Politics ofNuclear Waste. Science, 254, 1603-1607.
Slovic, P., Kraus, N. N., Lappe, H., Letzel, H., & Malmfors, T. (1989). Risk perception ofprescription drugs: Report on a survey in Sweden. Pharmaceutical Medicine, 4, 43-65.
Slovic, P., Kraus, N. N., Lappe, H., & Major, M. (1991a). Risk perception of prescriptiondrugs: Report on a survey in Canada. Canadian Journal of Public Health, 82, S15-S20.

Health Risk Perception in Canada December 30, 1992 • 64
Slovic, P., Layman, M., Kraus, N., Flynn, J., Chalmers, J., & Gesell, G. (1991b).Perceived risk, stigma, and potential economic impacts of a high-level nuclear wasterepository in Nevada. Risk Analysis, 11, 683-696.
Tversky, A., & Kahneman, D. (1983). Extensional vs. intuitive reasoning: The conjunctionfallacy in probability judgment. Psychological Review, 90, 293-315.
Wundt, W. (1883). Uber psychologische methoden. Philosophische Studien, 1, 1-38.