Embed Size (px)
Citation preview
Bundesamt für Eich- und Vermessungswesen (BEV)
Vienna, Austria
Report on Key Comparison EURAMET.L-K1.2011
Measurement of gauge blocks by interferometry
EURAMET project #1218
Final Report
M Matus (BEV),
H Pirée (SMD), V Gavalyugov (BIM), D Tamakyarska (BIM), R Thalmann (METAS), P Balling (CMI), J Garnæs (DFM), J Hald (DFM), N Farid (NIS), E Prieto (CEM),
A Lassila (MIKES), J Salgado (LNE), A Lewis (NPL), Ch Bandis (EIM), V Mudronja (HMI), E Bánréti (MKEH), A Balsamo (INRIM), R Bergmans (VSL), H Karlsson (JV),
Z Ramotowski (GUM), F Saraiva (IPQ), L Eusébio (IPQ), A Duta (INM), S Zelenika (DMDM), S Bergstrand (SP), R Fíra (SMU), T Yandayan (UME), D Şendoğdu (UME), S A Akgöz (UME),
O Ganioğlu (UME), S Haas (BEV), P Franke (PTB)
Vienna, Austria, December 2015
EURAMET.L-K1.2011 Measurements of gauge blocks by interferometry Final report
Pg. 2/63
Contents
1 Document control 4
2 Introduction 4
3 Organization 4
3.1 Participants 4
3.2 Schedule 7
4 Artefacts 9
4.1 Description of the standards 9
5 Measuring instructions 11
5.1 Handling of artefacts 11
5.2 Traceability 11
5.3 The measurand 11
5.4 Measurement uncertainty 12
5.4.1 Reporting of measurement uncertainty 12
6 Stability of Artefacts 12
6.1 Condition of artefacts at start/end of comparison (wear marks) 12
6.2 Dimensional stability of artefacts (Drift) 13
7 Results 14
7.1 Reporting of results 14
7.2 Treatment of potentially discrepant results during circulation 14
7.3 Results and standard uncertainties as reported by participants 15
8 Analysis of the measurement results 15
8.1 Calculation of the KCRV for the principal measurand ec 15
8.1.1 Calculation of the KCRV for artefacts without significant drift 16
8.1.2 Calculation of the KCRV for artefacts with significant drift 17
8.1.3 Correlation coefficients for linking laboratories 18
8.1.4 Degree of Equivalence (DoE) 19
8.1.5 Statistical consistency 20
EURAMET.L-K1.2011 Measurements of gauge blocks by interferometry Final report
Pg. 3/63
8.1.6 Compilation of reference values 21
8.2 Calculation of the reference value for the auxiliary measurand dc 21
9 Results, Reference values and degrees of Equivalence 22
9.1 The principal measurand ec 22
9.2 The auxiliary measurand dc 41
9.3 Discussion of results 52
9.4 Changes to results after Draft A.1 report 52
9.5 Comments received after Draft B.1 report 53
9.5.1 NPL comment from 29.07.2015 53
9.5.2 METAS comment from 30.07.2015 54
9.5.3 GUM comment from 31.08.2015 54
9.5.4 DFM comment from 04.09.2015 54
9.5.5 DFM comment from 14.09.2015 54
9.6 Linking of result to other comparisons 55
10 Conclusion 55
Appendix A Equipment and measuring processes of the participants 56
Appendix B Time dependent KCRVs 56
Appendix C Additional measurements not contributing to the KCRV 57
SP measurement on 3 mm steel block 58
Expansion coefficient – Complementary Measurements by CMI 59
Appendix D Measurement faces – Compilation of images 59
Appendix E CMCs as declared by the laboratories in the CIPM-MRA 62
References 63

EURAMET.L-K1.2011 Measurements of gauge blocks by interferometry Final report
Pg. 4/63
1 Document control
Version Draft A.1 Issued on 16. October 2014. Version Draft B.1 Issued on 29. July 2015. Version Draft B.2 Issued on 21. October 2015, accounting for participant’s recommendations Version Draft B.3 Issued on 27. November 2015, minor editorial change Version Draft B.4 Issued on 17. December 2015, including UME´s requests on instruments Version Draft B.5 Issued on 21. December 2015, including UME´s requests for CMC table Final Version Issued on 27. January 2016, email of CEM corrected
2 Introduction
The metrological equivalence of national measurement standards will be determined by a set of key comparisons chosen and organized by the Consultative Committees of the CIPM working closely with the Regional Metrology Organizations (RMOs). At its meeting in September 2008, the Consultative Committee for Length, CCL, identified several key comparisons in the field of dimensional metrology. In particular, it decided that the formally individual key comparisons on short gauge blocks and on length bars (long gauge blocks) should be combined under the designation CCL-K1.
The key comparison detailed in this document, EURAMET.L-K1.2011, is parallel to the CIPM key comparison CCL-K1.2011 which is piloted by CENAM and NRC. Key Comparison EURAMET.L-K1 was instigated following a decision at the 2010 meeting of the EURAMET Length contact persons held at SP Technical Research Institute of Sweden.
The sets of gauge blocks used in both the CCL and EURAMET key comparisons have almost the same composition, i.e. steel and ceramic gauges ranging from 0,5 mm to 500 mm in length.
BEV (AT) acts as pilot laboratory for EURAMET.L-K1 with substantial help by PTB (DE) for the stability measurements on long gauge blocks. It should be noted that PTB is not a participant of this very comparison (instead it will take part in the corresponding COOMET.L-K1 loop of CCL-K1.2011)
A goal of the CCL key comparisons for topics in dimensional metrology is to demonstrate the equivalence of routine calibration services offered by NMIs to clients, as listed in Appendix C of the Mutual Recognition Arrangement (MRA) [1]. To this end, participants in this comparison agree to use the same apparatus and methods as routinely applied to client artefacts.
3 Organization
The comparison was coordinated by the BEV (AT) as the pilot laboratory with substantial help by PTB (DE) for the long gauge blocks stability measurements. Due to the large number of participants the comparison was performed in two concurrent loops. Laboratories outside the EU (with any kind of customs barriers) were pooled in loop A. (METAS also in loop B for linking reasons)
3.1 Participants
The list of participants was prepared by the pilot laboratory after soliciting participation from any interested EURAMET NMIs. All participants must be able to demonstrate traceability to the realization of the metre. Moreover they must be capable to calibrate the gauge blocks using an interferometric (or

EURAMET.L-K1.2011 Measurements of gauge blocks by interferometry Final report
Pg. 5/63
other primary) technique. Calibration by comparison to standard gauge blocks of similar nominal size is not a topic of this project.
Contact persons changed in the course of the project for IPQ, UME, NIS, DFM, and LNE.
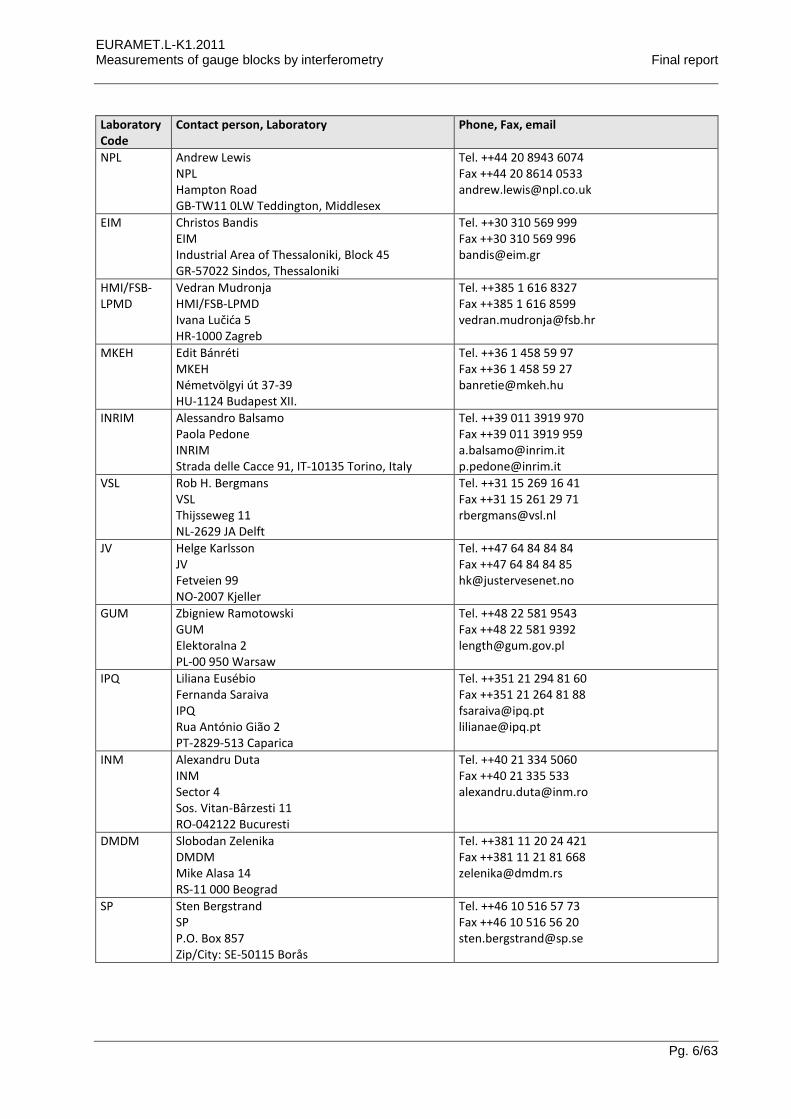
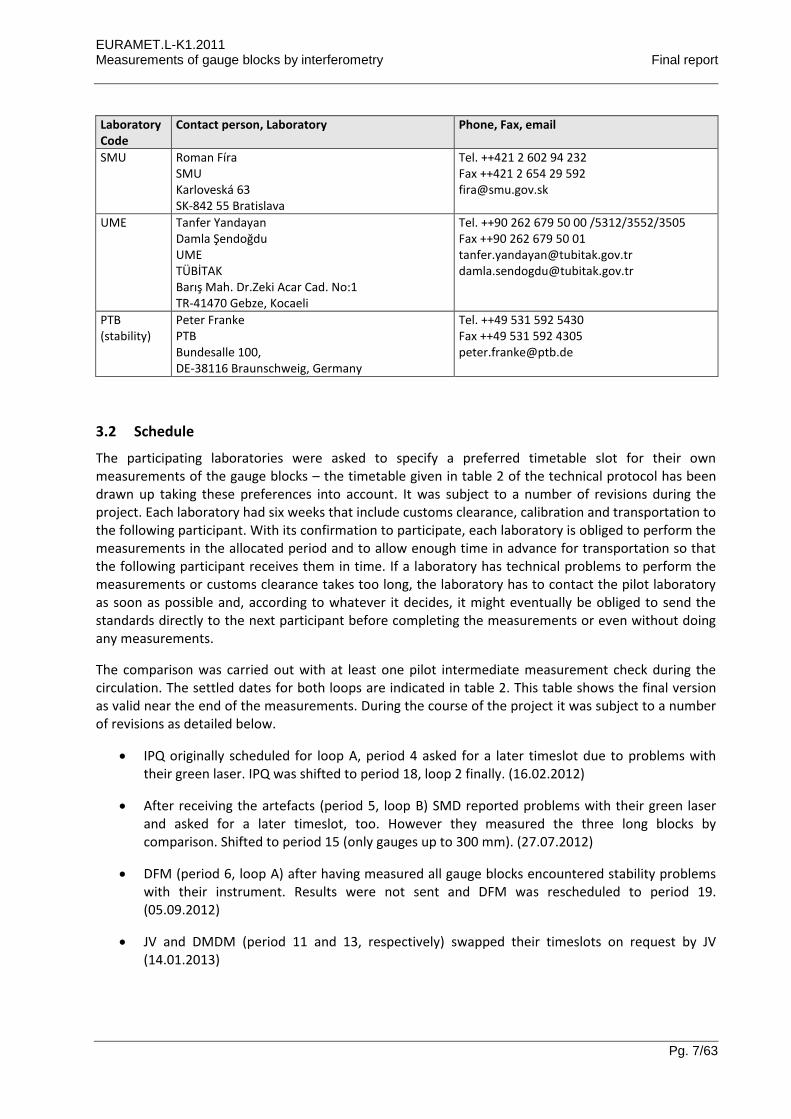
Table 1. List of participant laboratories and their contacts.
Laboratory Code
Contact person, Laboratory Phone, Fax, email
BEV (pilot)
Michael Matus Bundesamt für Eich- und Vermessungswesen BEV Arltgasse 35, 1160 Wien Austria
Tel. ++43 1 21110 6540 Fax ++43 1 21110 996000 e-mail: [email protected]
SMD Hugo Pirée Service Métrologie Scientifique SMD Koning Albert II Laan 16, 1000 Brussel Belgium
Tel. ++32 2277 7610 Fax ++32 2 277 5405 e-mail: [email protected]
BIM Veselin Gavalyugov Denita Tamakyarska BIM 52B, G.M. Dimitrov blvd. BG-1040 Sofia
Tel. ++359 2 873 52 68 Fax ++359 2 873 52 85 [email protected] [email protected]
METAS Rudolf Thalmann METAS Lindenweg 50, CH-3003, Bern-Wabern, Switzerland
Tel. ++41 58 387 03 85 Fax ++41 58 387 02 10 [email protected]
CMI Petr Balling CMI V Botanice 4 CZ-15072 Prague 5
Tel. ++420 257 288 326 Fax ++420 257 328 077 [email protected]
DFM Joergen Garnaes Jan Hald DFM Matematiktorvet 307 DK-2800 Kongens Lyngby
Tel. ++45 45 93 1144 Fax ++45 45 93 1137 [email protected] [email protected]
NIS Niveen Farid NIS Tersa Street El Haram, P.O. Box: 136 EG-12211 Giza
Tel. ++201068072427 Fax ++202 33867451 [email protected]
CEM Emilio Prieto CEM C/del Alfar 2 ES-28760 Tres Cantos (Madrid)
Tel. ++34 91 807 47 16 Fax ++34 91 807 48 07 [email protected]
MIKES Antti Lassila MIKES Tekniikantie 1, FI-02151, Espoo, P.O. Box 9, Finland
Tel. ++358 10 6054 000 Fax ++358 10 6054 499 ([email protected]) [email protected]
LNE José Antonio Salgado LNE rue Gaston Boissier 1 FR-75724 Paris cedex 15
Tel. ++33 1 40 43 37 77 Fax ++33 1 40 43 37 37 [email protected]
EURAMET.L-K1.2011 Measurements of gauge blocks by interferometry Final report
Pg. 6/63
Laboratory Code
Contact person, Laboratory Phone, Fax, email
NPL Andrew Lewis NPL Hampton Road GB-TW11 0LW Teddington, Middlesex
Tel. ++44 20 8943 6074 Fax ++44 20 8614 0533 [email protected]
EIM Christos Bandis EIM Industrial Area of Thessaloniki, Block 45 GR-57022 Sindos, Thessaloniki
Tel. ++30 310 569 999 Fax ++30 310 569 996 [email protected]
HMI/FSB-LPMD
Vedran Mudronja HMI/FSB-LPMD Ivana Lučića 5 HR-1000 Zagreb
Tel. ++385 1 616 8327 Fax ++385 1 616 8599 [email protected]
MKEH Edit Bánréti MKEH Németvölgyi út 37-39 HU-1124 Budapest XII.
Tel. ++36 1 458 59 97 Fax ++36 1 458 59 27 [email protected]
INRIM Alessandro Balsamo Paola Pedone INRIM Strada delle Cacce 91, IT-10135 Torino, Italy
Tel. ++39 011 3919 970 Fax ++39 011 3919 959 [email protected] [email protected]
VSL Rob H. Bergmans VSL Thijsseweg 11 NL-2629 JA Delft
Tel. ++31 15 269 16 41 Fax ++31 15 261 29 71 [email protected]
JV Helge Karlsson JV Fetveien 99 NO-2007 Kjeller
Tel. ++47 64 84 84 84 Fax ++47 64 84 84 85 [email protected]
GUM Zbigniew Ramotowski GUM Elektoralna 2 PL-00 950 Warsaw
Tel. ++48 22 581 9543 Fax ++48 22 581 9392 [email protected]
IPQ Liliana Eusébio Fernanda Saraiva IPQ Rua António Gião 2 PT-2829-513 Caparica
Tel. ++351 21 294 81 60 Fax ++351 21 264 81 88 [email protected] [email protected]
INM Alexandru Duta INM Sector 4 Sos. Vitan-Bârzesti 11 RO-042122 Bucuresti
Tel. ++40 21 334 5060 Fax ++40 21 335 533 [email protected]
DMDM Slobodan Zelenika DMDM Mike Alasa 14 RS-11 000 Beograd
Tel. ++381 11 20 24 421 Fax ++381 11 21 81 668 [email protected]
SP Sten Bergstrand SP P.O. Box 857 Zip/City: SE-50115 Borås
Tel. ++46 10 516 57 73 Fax ++46 10 516 56 20 [email protected]
EURAMET.L-K1.2011 Measurements of gauge blocks by interferometry Final report
Pg. 7/63
Laboratory Code
Contact person, Laboratory Phone, Fax, email
SMU Roman Fíra SMU Karloveská 63 SK-842 55 Bratislava
Tel. ++421 2 602 94 232 Fax ++421 2 654 29 592 [email protected]
UME Tanfer Yandayan Damla Şendoğdu UME TÜBİTAK Barış Mah. Dr.Zeki Acar Cad. No:1 TR-41470 Gebze, Kocaeli
Tel. ++90 262 679 50 00 /5312/3552/3505 Fax ++90 262 679 50 01 [email protected] [email protected]
PTB (stability)
Peter Franke PTB Bundesalle 100, DE-38116 Braunschweig, Germany
Tel. ++49 531 592 5430 Fax ++49 531 592 4305 [email protected]
3.2 Schedule
The participating laboratories were asked to specify a preferred timetable slot for their own measurements of the gauge blocks – the timetable given in table 2 of the technical protocol has been drawn up taking these preferences into account. It was subject to a number of revisions during the project. Each laboratory had six weeks that include customs clearance, calibration and transportation to the following participant. With its confirmation to participate, each laboratory is obliged to perform the measurements in the allocated period and to allow enough time in advance for transportation so that the following participant receives them in time. If a laboratory has technical problems to perform the measurements or customs clearance takes too long, the laboratory has to contact the pilot laboratory as soon as possible and, according to whatever it decides, it might eventually be obliged to send the standards directly to the next participant before completing the measurements or even without doing any measurements.
The comparison was carried out with at least one pilot intermediate measurement check during the circulation. The settled dates for both loops are indicated in table 2. This table shows the final version as valid near the end of the measurements. During the course of the project it was subject to a number of revisions as detailed below.
IPQ originally scheduled for loop A, period 4 asked for a later timeslot due to problems with their green laser. IPQ was shifted to period 18, loop 2 finally. (16.02.2012)
After receiving the artefacts (period 5, loop B) SMD reported problems with their green laser and asked for a later timeslot, too. However they measured the three long blocks by comparison. Shifted to period 15 (only gauges up to 300 mm). (27.07.2012)
DFM (period 6, loop A) after having measured all gauge blocks encountered stability problems with their instrument. Results were not sent and DFM was rescheduled to period 19. (05.09.2012)
JV and DMDM (period 11 and 13, respectively) swapped their timeslots on request by JV (14.01.2013)
EURAMET.L-K1.2011 Measurements of gauge blocks by interferometry Final report
Pg. 8/63
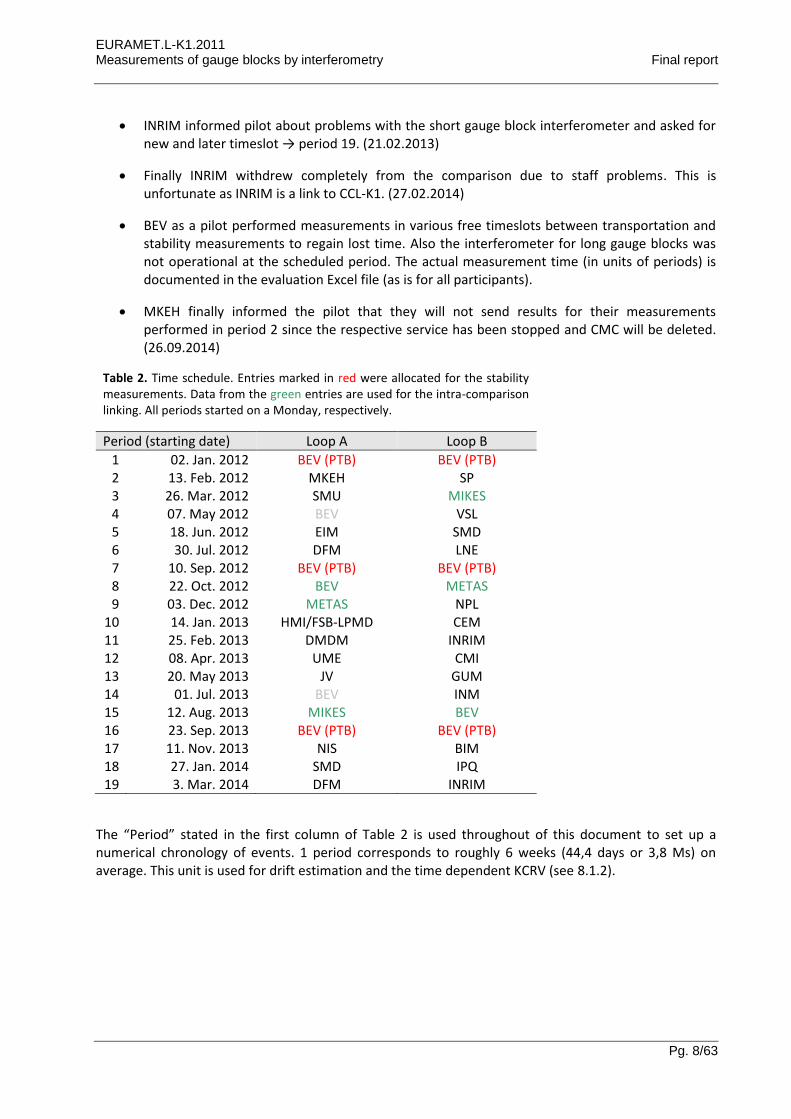
INRIM informed pilot about problems with the short gauge block interferometer and asked for new and later timeslot → period 19. (21.02.2013)
Finally INRIM withdrew completely from the comparison due to staff problems. This is unfortunate as INRIM is a link to CCL-K1. (27.02.2014)
BEV as a pilot performed measurements in various free timeslots between transportation and stability measurements to regain lost time. Also the interferometer for long gauge blocks was not operational at the scheduled period. The actual measurement time (in units of periods) is documented in the evaluation Excel file (as is for all participants).
MKEH finally informed the pilot that they will not send results for their measurements performed in period 2 since the respective service has been stopped and CMC will be deleted. (26.09.2014)
Table 2. Time schedule. Entries marked in red were allocated for the stability measurements. Data from the green entries are used for the intra-comparison linking. All periods started on a Monday, respectively.
Period (starting date) Loop A Loop B
1 02. Jan. 2012 BEV (PTB) BEV (PTB) 2 13. Feb. 2012 MKEH SP 3 26. Mar. 2012 SMU MIKES 4 07. May 2012 BEV VSL 5 18. Jun. 2012 EIM SMD 6 30. Jul. 2012 DFM LNE 7 10. Sep. 2012 BEV (PTB) BEV (PTB) 8 22. Oct. 2012 BEV METAS 9 03. Dec. 2012 METAS NPL
10 14. Jan. 2013 HMI/FSB-LPMD CEM 11 25. Feb. 2013 DMDM INRIM 12 08. Apr. 2013 UME CMI 13 20. May 2013 JV GUM 14 01. Jul. 2013 BEV INM 15 12. Aug. 2013 MIKES BEV 16 23. Sep. 2013 BEV (PTB) BEV (PTB) 17 11. Nov. 2013 NIS BIM 18 27. Jan. 2014 SMD IPQ 19 3. Mar. 2014 DFM INRIM
The “Period” stated in the first column of Table 2 is used throughout of this document to set up a numerical chronology of events. 1 period corresponds to roughly 6 weeks (44,4 days or 3,8 Ms) on average. This unit is used for drift estimation and the time dependent KCRV (see 8.1.2).
EURAMET.L-K1.2011 Measurements of gauge blocks by interferometry Final report
Pg. 9/63
4 Artefacts
4.1 Description of the standards
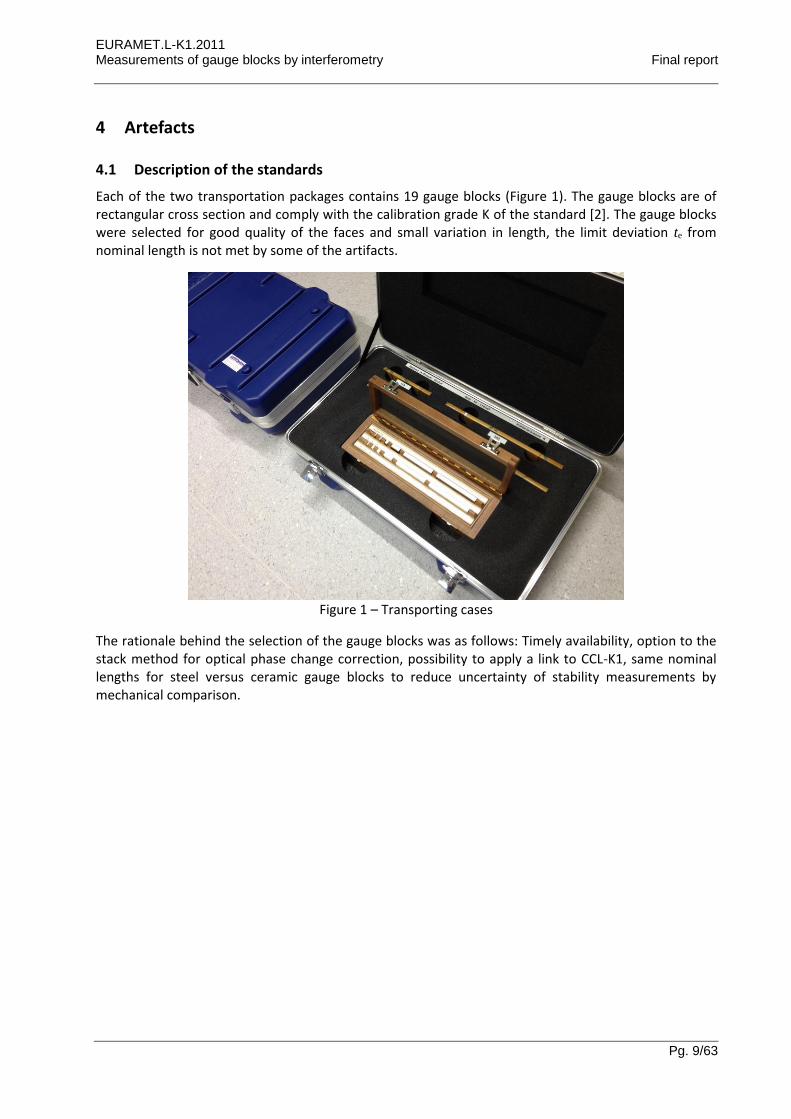
Each of the two transportation packages contains 19 gauge blocks (Figure 1). The gauge blocks are of rectangular cross section and comply with the calibration grade K of the standard [2]. The gauge blocks were selected for good quality of the faces and small variation in length, the limit deviation te from nominal length is not met by some of the artifacts.
Figure 1 – Transporting cases
The rationale behind the selection of the gauge blocks was as follows: Timely availability, option to the stack method for optical phase change correction, possibility to apply a link to CCL-K1, same nominal lengths for steel versus ceramic gauge blocks to reduce uncertainty of stability measurements by mechanical comparison.
EURAMET.L-K1.2011 Measurements of gauge blocks by interferometry Final report
Pg. 10/63
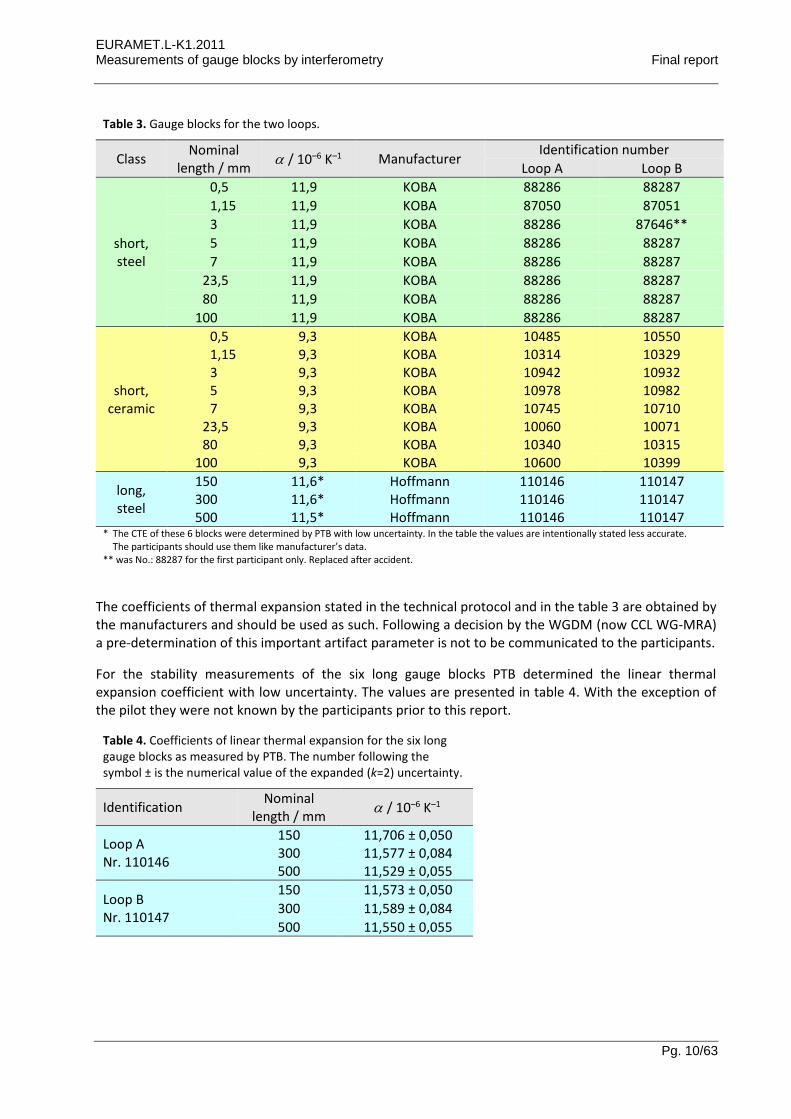
Table 3. Gauge blocks for the two loops.
Class Nominal
length / mm / 10–6 K–1 Manufacturer
Identification number
Loop A Loop B
short, steel
0,5 11,9 KOBA 88286 88287
1,15 11,9 KOBA 87050 87051
3 11,9 KOBA 88286 87646**
5 11,9 KOBA 88286 88287
7 11,9 KOBA 88286 88287
23,5 11,9 KOBA 88286 88287
80 11,9 KOBA 88286 88287
100 11,9 KOBA 88286 88287
short, ceramic
0,5 9,3 KOBA 10485 10550 1,15 9,3 KOBA 10314 10329 3 9,3 KOBA 10942 10932 5 9,3 KOBA 10978 10982 7 9,3 KOBA 10745 10710
23,5 9,3 KOBA 10060 10071 80 9,3 KOBA 10340 10315
100 9,3 KOBA 10600 10399
long, steel
150 11,6* Hoffmann 110146 110147 300 11,6* Hoffmann 110146 110147 500 11,5* Hoffmann 110146 110147
* The CTE of these 6 blocks were determined by PTB with low uncertainty. In the table the values are intentionally stated less accurate. The participants should use them like manufacturer’s data. ** was No.: 88287 for the first participant only. Replaced after accident.
The coefficients of thermal expansion stated in the technical protocol and in the table 3 are obtained by the manufacturers and should be used as such. Following a decision by the WGDM (now CCL WG-MRA) a pre-determination of this important artifact parameter is not to be communicated to the participants.
For the stability measurements of the six long gauge blocks PTB determined the linear thermal expansion coefficient with low uncertainty. The values are presented in table 4. With the exception of the pilot they were not known by the participants prior to this report.
Table 4. Coefficients of linear thermal expansion for the six long gauge blocks as measured by PTB. The number following the symbol ± is the numerical value of the expanded (k=2) uncertainty.
Identification Nominal
length / mm / 10–6 K–1
Loop A Nr. 110146
150 11,706 ± 0,050 300 11,577 ± 0,084 500 11,529 ± 0,055
Loop B Nr. 110147
150 11,573 ± 0,050
300 11,589 ± 0,084
500 11,550 ± 0,055
EURAMET.L-K1.2011 Measurements of gauge blocks by interferometry Final report
Pg. 11/63
CMI as a participant reported the linear thermal expansion coefficient for the three long gauge blocks of loop B. The values were not used for the analysis of this comparison but are reported in Appendix C for information only.
5 Measuring instructions
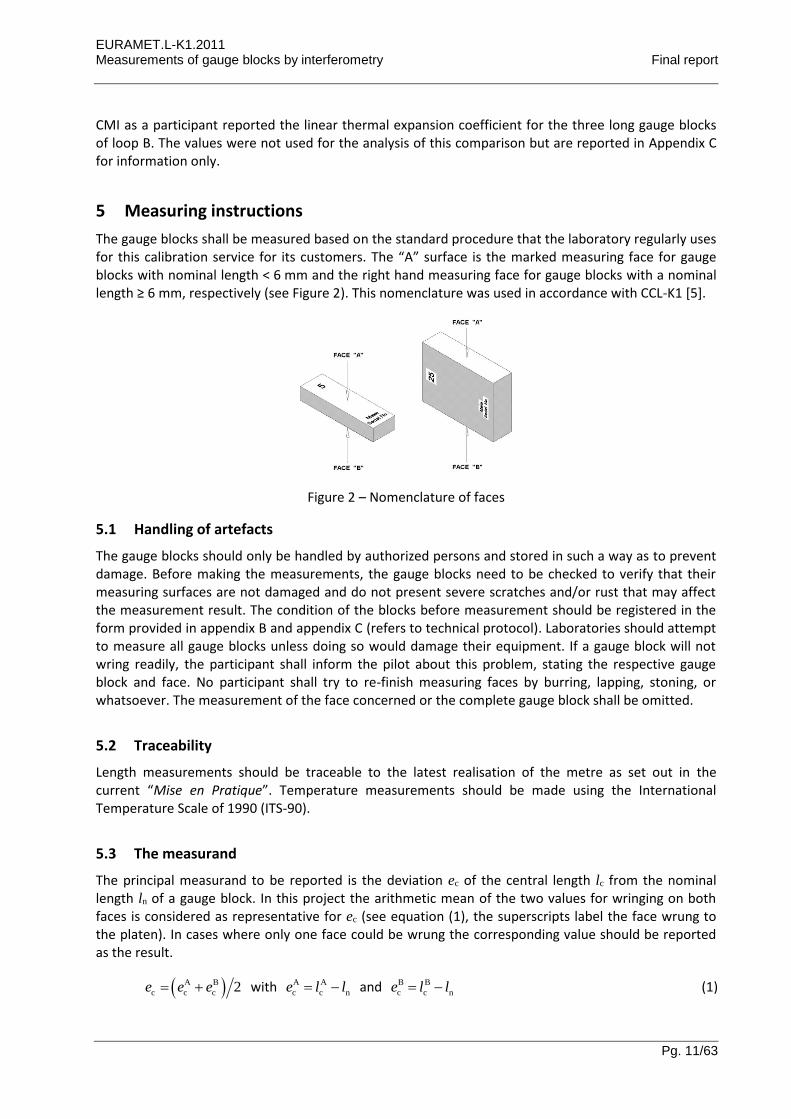
The gauge blocks shall be measured based on the standard procedure that the laboratory regularly uses for this calibration service for its customers. The “A” surface is the marked measuring face for gauge blocks with nominal length < 6 mm and the right hand measuring face for gauge blocks with a nominal length ≥ 6 mm, respectively (see Figure 2). This nomenclature was used in accordance with CCL-K1 [5].
Figure 2 – Nomenclature of faces
5.1 Handling of artefacts
The gauge blocks should only be handled by authorized persons and stored in such a way as to prevent damage. Before making the measurements, the gauge blocks need to be checked to verify that their measuring surfaces are not damaged and do not present severe scratches and/or rust that may affect the measurement result. The condition of the blocks before measurement should be registered in the form provided in appendix B and appendix C (refers to technical protocol). Laboratories should attempt to measure all gauge blocks unless doing so would damage their equipment. If a gauge block will not wring readily, the participant shall inform the pilot about this problem, stating the respective gauge block and face. No participant shall try to re-finish measuring faces by burring, lapping, stoning, or whatsoever. The measurement of the face concerned or the complete gauge block shall be omitted.
5.2 Traceability
Length measurements should be traceable to the latest realisation of the metre as set out in the current “Mise en Pratique”. Temperature measurements should be made using the International Temperature Scale of 1990 (ITS-90).
5.3 The measurand
The principal measurand to be reported is the deviation ec of the central length lc from the nominal length ln of a gauge block. In this project the arithmetic mean of the two values for wringing on both faces is considered as representative for ec (see equation (1), the superscripts label the face wrung to the platen). In cases where only one face could be wrung the corresponding value should be reported as the result.
A B
c c c 2e e e with A A
c c ne l l and B B
c c ne l l (1)
EURAMET.L-K1.2011 Measurements of gauge blocks by interferometry Final report
Pg. 12/63
As an auxiliary measurand the difference of the found deviations dc when the block is wrung to face A and face B, respectively, should be reported according to equation (2). Care has to be taken to use the correct sign.
A B A B
c c c c cd e e l l (2)
5.4 Measurement uncertainty
The uncertainty of measurement shall be estimated according to the ISO Guide to the Expression of Uncertainty in Measurement [3]. Although comparability is sacrificed by not giving an explicit model equation, the participating laboratories are encouraged to use their usual model for the uncertainty calculation. Examples for model equations might be found in [4, 5, 6].
All measurement uncertainties shall be stated as standard uncertainties. If appropriate the corresponding effective degree of freedom might be stated by the participants. If none is given, ∞ is assumed. (Note: for principal reasons the concept of degree of freedom is undefined in presence of covariance and it is in general a questionable concept [12]. Anyway it will not be taken into account for the analysis.) For efficient evaluation and subsequent assessment of CMC claims an uncertainty statement in the functional form (3) is preferred.
22
c n n,u e Q a b l a b l (3)
5.4.1 Reporting of measurement uncertainty
In this document we use the following notation for the reporting of uncertainties. For expanded uncertainties (which are essentially coverage intervals) the ± sign is used, like 234 nm ± 44 nm. Standard uncertainties and standard deviations are reported using the parenthesis notation: 234(22) nm. In any case care is taken to avoid ambiguities.
Throughout this report expanded uncertainties are exclusively stated with an expansion factor of k = 2.
xuxU 2 (4)
6 Stability of Artefacts
6.1 Condition of artefacts at start/end of comparison (wear marks)
All gauge blocks were freshly acquired with unused measurement faces. Former comparisons of this type have shown that the faces experienced progressive wear eventually making them unwringeable. Moreover the drawings requested from the participants were seldom significant. To document the wear in a more objective way, it was decided to take micrographic images whenever possible for this comparison. Unfortunately the microscopes were not ready at the start of the circulation consequently there are no images of the fresh faces.
A standard optical microscope was used to document the faces of gauge blocks up to 23,5 mm (Zeiss Imager.M2m, 5x/0,13 DIC). For longer blocks (up to 150 mm) a Leica M80 binocular microscope was used. Since the field of view for both microscopes is smaller than the measuring faces, stitching software was used to generate overview images. Blocks longer than 150 mm have not been documented by photography. An assortment of pictures is reproduced in Appendix D.
EURAMET.L-K1.2011 Measurements of gauge blocks by interferometry Final report
Pg. 13/63
All micrographic images as taken at the original resolution by the pilot are stored on Google Drive, sorted by loop number, gauge block, face and period:
https://drive.google.com/folderview?id=0B5DBrJH86ttOY1dJOHVsano5R0k&usp=sharing
A few participants provided micrographic images also, those can be found on the link given above. All participants have been asked to document (by drawing) the conditions of the faces in advance of performing the actual calibration. Copies of these reports can be found in Appendix A.
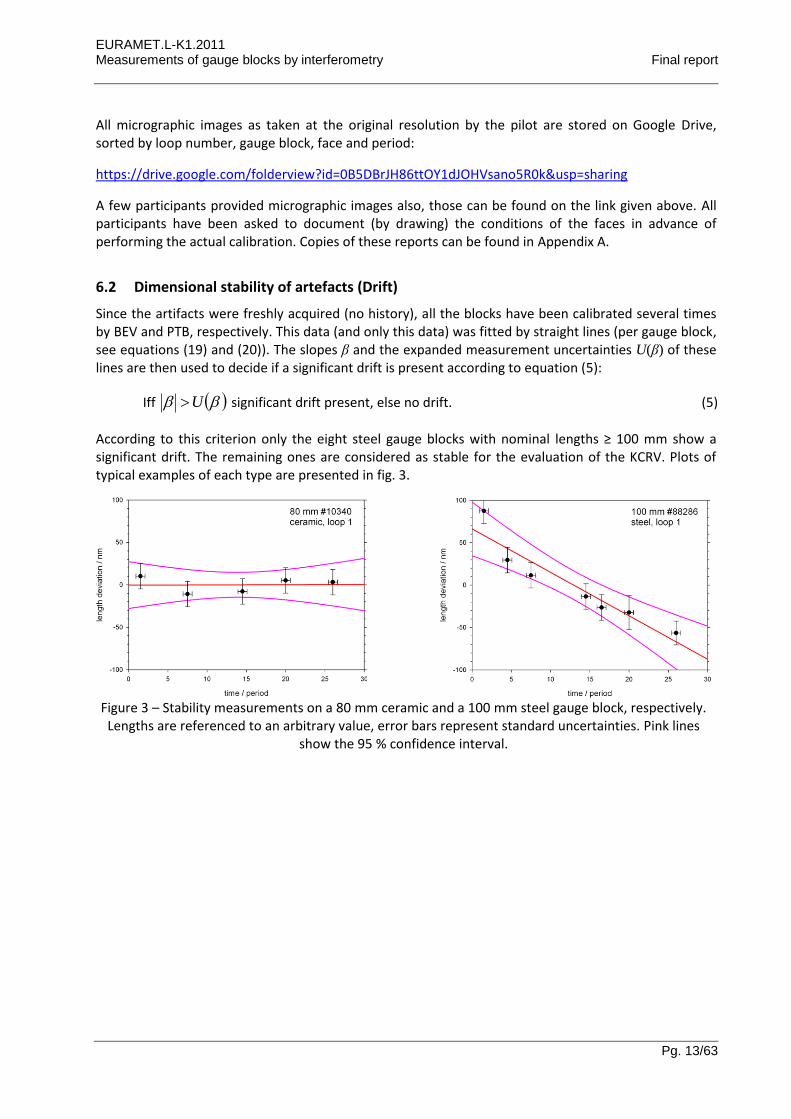
6.2 Dimensional stability of artefacts (Drift)
Since the artifacts were freshly acquired (no history), all the blocks have been calibrated several times by BEV and PTB, respectively. This data (and only this data) was fitted by straight lines (per gauge block, see equations (19) and (20)). The slopes β and the expanded measurement uncertainties U(β) of these lines are then used to decide if a significant drift is present according to equation (5):
Iff U significant drift present, else no drift. (5)
According to this criterion only the eight steel gauge blocks with nominal lengths ≥ 100 mm show a significant drift. The remaining ones are considered as stable for the evaluation of the KCRV. Plots of typical examples of each type are presented in fig. 3.
Figure 3 – Stability measurements on a 80 mm ceramic and a 100 mm steel gauge block, respectively.
Lengths are referenced to an arbitrary value, error bars represent standard uncertainties. Pink lines show the 95 % confidence interval.
EURAMET.L-K1.2011 Measurements of gauge blocks by interferometry Final report
Pg. 14/63
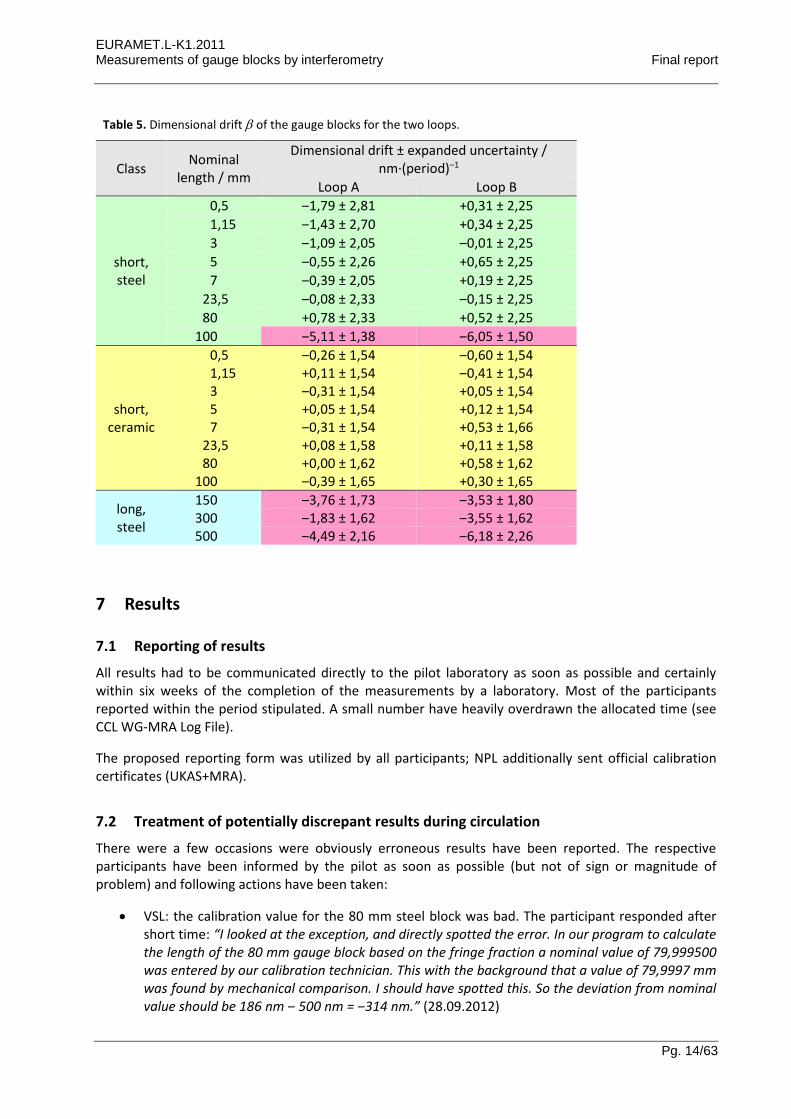
Table 5. Dimensional drift of the gauge blocks for the two loops.
Class Nominal
length / mm
Dimensional drift ± expanded uncertainty / nm·(period)‒1
Loop A Loop B
short, steel
0,5 ‒1,79 ± 2,81 +0,31 ± 2,25
1,15 ‒1,43 ± 2,70 +0,34 ± 2,25
3 ‒1,09 ± 2,05 ‒0,01 ± 2,25
5 ‒0,55 ± 2,26 +0,65 ± 2,25
7 ‒0,39 ± 2,05 +0,19 ± 2,25
23,5 ‒0,08 ± 2,33 ‒0,15 ± 2,25
80 +0,78 ± 2,33 +0,52 ± 2,25
100 ‒5,11 ± 1,38 ‒6,05 ± 1,50
short, ceramic
0,5 ‒0,26 ± 1,54 ‒0,60 ± 1,54 1,15 +0,11 ± 1,54 ‒0,41 ± 1,54 3 ‒0,31 ± 1,54 +0,05 ± 1,54 5 +0,05 ± 1,54 +0,12 ± 1,54 7 ‒0,31 ± 1,54 +0,53 ± 1,66
23,5 +0,08 ± 1,58 +0,11 ± 1,58 80 +0,00 ± 1,62 +0,58 ± 1,62
100 ‒0,39 ± 1,65 +0,30 ± 1,65
long, steel
150 ‒3,76 ± 1,73 ‒3,53 ± 1,80 300 ‒1,83 ± 1,62 ‒3,55 ± 1,62 500 ‒4,49 ± 2,16 ‒6,18 ± 2,26
7 Results
7.1 Reporting of results
All results had to be communicated directly to the pilot laboratory as soon as possible and certainly within six weeks of the completion of the measurements by a laboratory. Most of the participants reported within the period stipulated. A small number have heavily overdrawn the allocated time (see CCL WG-MRA Log File).
The proposed reporting form was utilized by all participants; NPL additionally sent official calibration certificates (UKAS+MRA).
7.2 Treatment of potentially discrepant results during circulation
There were a few occasions were obviously erroneous results have been reported. The respective participants have been informed by the pilot as soon as possible (but not of sign or magnitude of problem) and following actions have been taken:
VSL: the calibration value for the 80 mm steel block was bad. The participant responded after short time: “I looked at the exception, and directly spotted the error. In our program to calculate the length of the 80 mm gauge block based on the fringe fraction a nominal value of 79,999500 was entered by our calibration technician. This with the background that a value of 79,9997 mm was found by mechanical comparison. I should have spotted this. So the deviation from nominal value should be 186 nm ‒ 500 nm = ‒314 nm.” (28.09.2012)
EURAMET.L-K1.2011 Measurements of gauge blocks by interferometry Final report
Pg. 15/63
INM: 4 calibration values discrepant, the participant was informed (05.08.2013). Revised results were sent, 3 values still discrepant. No explanation for revised results was provided. (07.10.2013)
NIS: The lab was informed that 8 calibration values were discrepant (15.01.2014). NIS sent revised results – worse than before (23.01.2014). A second revision did not improve the situation. No explanation for revised results was provided. (24.01.2014)
IPQ: 2 calibration values discrepant. Information by the pilot. (15.10.2014)
All results still discrepant after information by the pilot are included as reported. For the evaluation they are not taken in account right from the beginning.
7.3 Results and standard uncertainties as reported by participants
The results had to be reported by the participants on Word forms in tables. The principal measurands ec (deviation from nominal length) were all copied in an Excel spread sheet EURAMET.L-K1.2011-results.xls. The spread sheet allows for the evaluation of the reference values, for the determination of the largest consistent subset and the degrees of equivalence, according to section 8.1 of this report.
For the auxiliary measurand dc (difference between the two wringings) a separate Excel spread sheet EURAMET.L-K1.2011-diff.xls was used. Only statistical parameters were evaluated in this case as discussed in section 8.2.
The results as they were reported by the participants are shown in section 9.
8 Analysis of the measurement results
8.1 Calculation of the KCRV for the principal measurand ec
The weighted mean is the preferred measure to be used as the KCRV (Key Comparison Reference Value) for each measurand. Before the weights can be assigned and the mean taken, it is necessary to exclude any clear outliers from the analysis. There are different ways to perform this task in an reproducible way. For this comparison the Birge ratio was chosen as the criterion since it led to the smallest number of results to be excluded. The necessary uncertainties for this criterion are calculated on a per loop basis (i.e. without the modification due to linking).
The evaluation of the KCRV has been complicated by two facts: first a numerical link between the loops is necessary and second, some artifacts show a drift of the measurand.
The available data (measurement values) are for each gauge block (indexed by g) and laboratory i:
Measurement result xg,i (provided by participant).
Standard uncertainty of measurement result u(xg,i) (provided by participant).
Time of measurement tg,i (estimated by pilot).
Set of stability measurement results {xSg} (provided by pilot).
Set of standard uncertainties of stability measurement results {u(xSg)} (provided by pilot).
Set of stability measurement times {tSg} (provided by pilot).
These data must be used to evaluate following interim results:
EURAMET.L-K1.2011 Measurements of gauge blocks by interferometry Final report
Pg. 16/63
Dimensional linear drift rate βg (evaluated by pilot).
Standard uncertainty of the drift rate u(βg) (evaluated by pilot).
Covariance of the two results per linking lab u(xAg,i, xBg,i) (estimated by pilot).
Finally the actual KC-relevant parameters are obtained:
The KCRV per loop xref,A and xref,B (might be time dependent).
The standard uncertainty of the KCRV per loop u(xref,A) and u(xref,B) (might be time dependent).
The deviation of the individual results dg,i.
Standard uncertainty of the deviation of the individual results u(dg,i).
The normalized deviation of the individual results En. The mathematics used for this evaluation is detailed in the following sections.
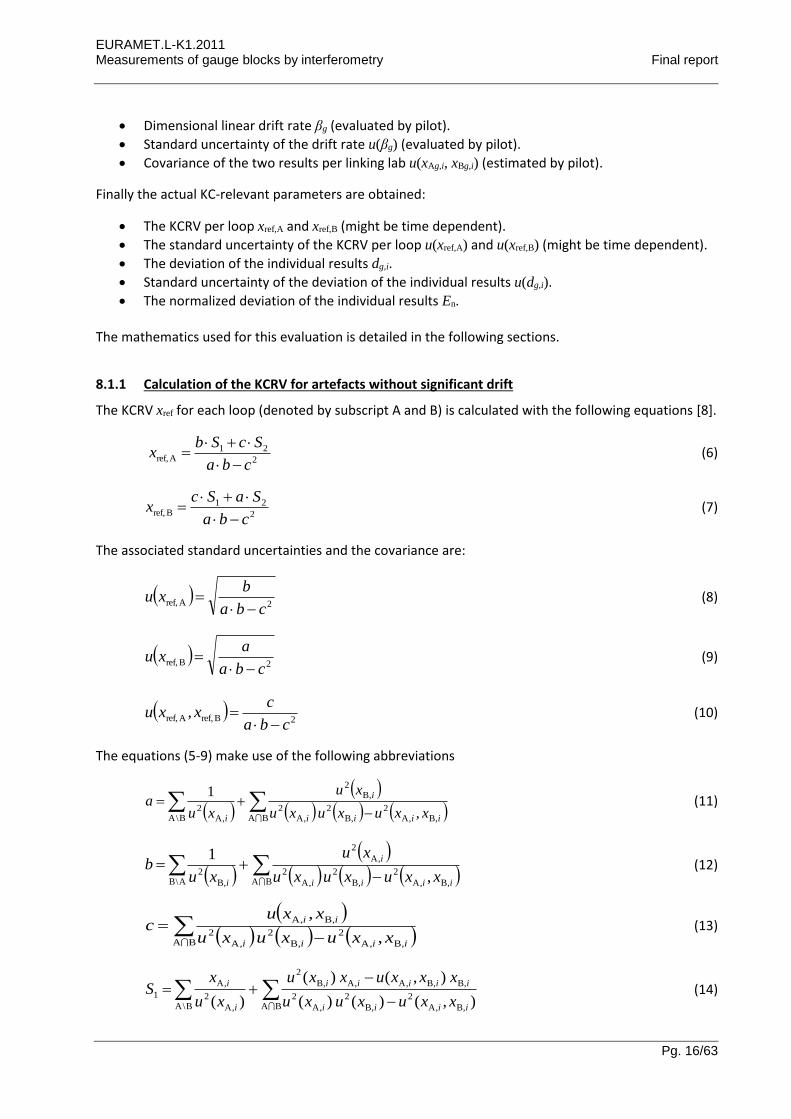
8.1.1 Calculation of the KCRV for artefacts without significant drift
The KCRV xref for each loop (denoted by subscript A and B) is calculated with the following equations [8].
2
21Aref,
cba
ScSbx
(6)
2
21Bref,
cba
SaScx
(7)
The associated standard uncertainties and the covariance are:
2Aref,
cba
bxu
(8)
2Bref,
cba
axu
(9)
2Bref,Aref, ,
cba
cxxu
(10)
The equations (5-9) make use of the following abbreviations
BA ,B,A
2,B
2,A
2
,B2
B\A ,A2 ,
1
iiii
i
i xxuxuxu
xu
xua (11)
BA ,B,A
2
,B
2
,A
2
,A
2
A\B ,B
2 ,
1
iiii
i
i xxuxuxu
xu
xub (12)
BA ,B,A
2
,B
2
,A
2
,B,A
,
,
iiii
ii
xxuxuxu
xxuc (13)
BA ,B,A
2
,B
2
,A
2
,B,B,A,A,B
2
B\A ,A
2
,A
1),()()(
),()(
)( iiii
iiiii
i
i
xxuxuxu
xxxuxxu
xu
xS (14)
EURAMET.L-K1.2011 Measurements of gauge blocks by interferometry Final report
Pg. 17/63
BA ,B,A
2
,B
2
,A
2
,A,B,A,B,A
2
A\B ,B
2
,B
2),()()(
),()(
)( iiii
iiiii
i
i
xxuxuxu
xxxuxxu
xu
xS (15)
The equations can be rewritten by substitution of the covariance by the correlation coefficient r and/or the uncertainty by the weight w:
)()(
),(
,B,A
,B,A
ii
ii
ixuxu
xxur (16)
)(
12
i
ixu
w (17)
It must be noted that for the calculation of the KCRV only the largest statistical consistent subset of the participant’s results must be used. The determination of such subsets is exemplified in section 8.1.5.
8.1.2 Calculation of the KCRV for artefacts with significant drift
A KCRV with drift is modeled by a linear function in time t with two parameters (per loop) α and β. Here the subscript A, B for a quantity denotes either loop A or loop B, so we need to write only a single equation.
tx BA,BA,B)(A, ref (18)
The slope and its standard uncertainty for each loop is calculated from the m stability measurements only (i.e. not including the participants data, j is running over the stability measurement results)
2
11
2
1
1111
BA,
m
j
jj
m
j
jj
m
j
j
m
j
jj
m
i
jj
m
j
jjj
m
j
j
twtww
twxwtxww
(19)
2
11
2
1
1
BA,
m
j
jj
m
j
jj
m
j
j
m
j
j
twtww
w
u (20)
Now by using the transformation of the participant’s uncertainties and referencing the time of measurement to the central time (i is running over the participants results)
2BA,,B)(A,BA,
2
,B)(A,
2
,B)(A,
2 ttuxuxu iii (21)
n
i
itn
t1
,B)(A,BA,
1 (22)
EURAMET.L-K1.2011 Measurements of gauge blocks by interferometry Final report
Pg. 18/63
The purpose of the time transformation is to make independent of . The use of the arithmetic mean (22) is only valid if all uncertainties are equal which is (almost) the case here. The equations (5-9) can formally be reused to obtain the constant parameter of (18)
2
21A
cba
ScSb
(23)
2
21B
cba
SaSc
(24)
2A
cba
bu
(25)
,2B
cba
au
(26)
,ABba
cr
(27)
Where a, b, c are calculated according to equations (11-13) but with S1 and S2 modified as follows (With t referenced to the respective mean time according to equation (22)):
ii
i
i
i
i
ii
i
i
i
i
i i
i i
i
i i
i
xuxu
tr
xu
t
xuxu
xr
xu
x
r
xu
t
xu
xS
,B,A
,BB
,AB
,A2
,AA
,B,A
,B
,AB
,A2
,A
AB2
,AB
A/B ,A2
,AA
A/B ,A2
,A
1
1
1
(28)
ii
i
i
i
i
ii
i
i
i
i
i i
i i
i
i i
i
xuxu
tr
xu
t
xuxu
xr
xu
x
r
xu
t
xu
xS
,B,A
,AA
,AB
,B2
,BB
,B,A
,A
,AB
,B2
,B
AB2
,AB
B/A ,B2
,BB
B/A ,B2
,B
2
1
1
(29)
8.1.3 Correlation coefficients for linking laboratories
As can be seen in the equations above it is essential to estimate the covariance or correlation coefficients of analogous measurement results (for both loops) of each linking laboratory. In past comparisons [9] this was done by combining the sample covariance according to (30) with the uncertainties stated by the laboratories.
BA
,B,B
BA
,A,A,B,A
11,
j
ji
j
jiii xn
xxn
xxxu (30)
Correlation coefficients must comply with 11 r . Moreover in the current context one expects them to be positive since two measurements of the same laboratory always tend to be biased in the same direction. It was found that combining the sample covariance (30) with the stated standard uncertainties (which are not obtained as sample variances) can yield implausible values. Consequently
EURAMET.L-K1.2011 Measurements of gauge blocks by interferometry Final report
Pg. 19/63
the application of equations above would not have been possible. Therefore a scientifically more warrantable technique was used to estimate the correlation coefficients.
The correlation between two measurements on different artefacts of the same laboratory may be modeled by two types of influence quantities. The first type can be considered as constant between the measurements, whilst the other type is not. Examples of the first type are traceability influences for the sensors (as long as they have not been recalibrated between the measurements), approximations for the length evaluation, and – most important – the method of correcting the roughness/phase change effect.
Provided one knows the contribution uC(x) of this influence quantity type to the overall uncertainty u(x) the correlation coefficient can easily be calculated as
xuxu
xur
21
2C
(31)
Often the overall uncertainties of the two measurements (of the same laboratory) are equal thus simplifying the expression even more
xu
xur
2
2C (32)
Since uC(x) < u(x) by definition the correlation coefficient is always less than 1 and because of the squares it is never negative.
The standard uncertainties u(x) are reported but uC(x) are only known by the experts. At least for the pilot and linking lab (BEV) it is possible to estimate this value. For BEV the dominant constant uncertainty contribution is caused by the roughness correction. The contribution uC(x) = 6,5 nm gives r = 0,2 for gauge blocks up to 100 mm (u(x) = 15 nm). The correlation coefficient decreases for longer blocks (0,1 for 150 mm and nearly 0 for 300 mm and 500 mm).
For the two remaining linking laboratories (METAS, MIKES) no explicit information is given but expert knowledge allows one to roughly estimate the correlation coefficient. For this comparison two numerical values for r are used for all three linking labs:
r = 0,2 for gauge blocks up to 100 mm
r = 0,1 for gauge blocks larger than 100 mm
Despite of the theoretical background discussed, the actual values are somewhat artificial. Therefore the influence on the reference values and the En-values was checked by variation of r between 0,0 and 0,9. Although the reference values can change by a few nm, the En-values stay virtually unaffected. Most important the pattern of En > 1 and excluded labs did not change at all. For the evaluation the correlation coefficients as discussed above are used.
8.1.4 Degree of Equivalence (DoE)
The deviation of each laboratory’s s result is simply
refxxd ii (33)
EURAMET.L-K1.2011 Measurements of gauge blocks by interferometry Final report
Pg. 20/63
Its standard uncertainty is given by
ref
22 xuxudu ii for results contributing to the KCRV (34)
The minus sign under the square root originates from the correlation of laboratory’s result xi with the KCRV xref as defined in the preceding sections. In case a laboratory does not contribute to the KCRV (because its result is found to be inconsistent according to section 8.1.5) no correlation is expected and the standard uncertainty evaluates to:
ref
22 xuxudu ii for results not contributing to the KCRV (35)
In any case both, xref and u(xref), might be time dependent as exemplified in 8.1.2.
For each laboratory’s result the En value is calculated, where En is defined here as the absolute ratio of the deviation from the KCRV, divided by the expanded uncertainty of this deviation
i
i
dU
dE n (36)
As discussed in 5.4.1 the expanded uncertainty is obtained from the standard uncertainty by multiplication by k = 2. Prior to presentation and use the En value is rounded to one decimal place. The absolute value is used as a simplification in data presenting since the sign is anyway never used for evaluation.
8.1.5 Statistical consistency
For the determination of the key comparison reference value KCRV, statistical consistency of the results contributing to the KCRV is required. A check for statistical consistency of the results with their associated uncertainties can be made by the so-called Birge ratio RB which compares the observed spread of the results with the spread expected from the individual reported uncertainties. Note: The subscript “B” here is derived from “Birge” and does not denote a loop. All equations in this section must be considered as “twofold” (one for each loop).
The application of least squares algorithms and the χ2-test leads to the Birge ratio
ref
refextB
xu
xuR (37)
Where u(xref) is defined above and uext(xref) is the external standard deviation
N
i
i
N
i
ii
wN
xxw
xu
1
1
2
ref
refext
1
(38)
Here N denotes the number of laboratories. The Birge ratio has an expectation value of RB = 1, when considering standard uncertainties. For a coverage factor of k = 2, the expectation value is increased and the data in a comparison are consistent provided that
EURAMET.L-K1.2011 Measurements of gauge blocks by interferometry Final report
Pg. 21/63
1
81B
NR (39)
If statistical consistency according to equation (39) is not given, the result with the largest En calculated according to section 8.1.3 is identified and excluded from the reference value and RB is calculated again, now with N reduced by 1. This process of excluding the result with the largest En from contributing to the KCRV is iterated until statistical consistency is reached.
Because inconsistent results excluded by this technique are no longer correlated with the KCRV, when calculating their En value, equation (35) has to be used for determining u(di).
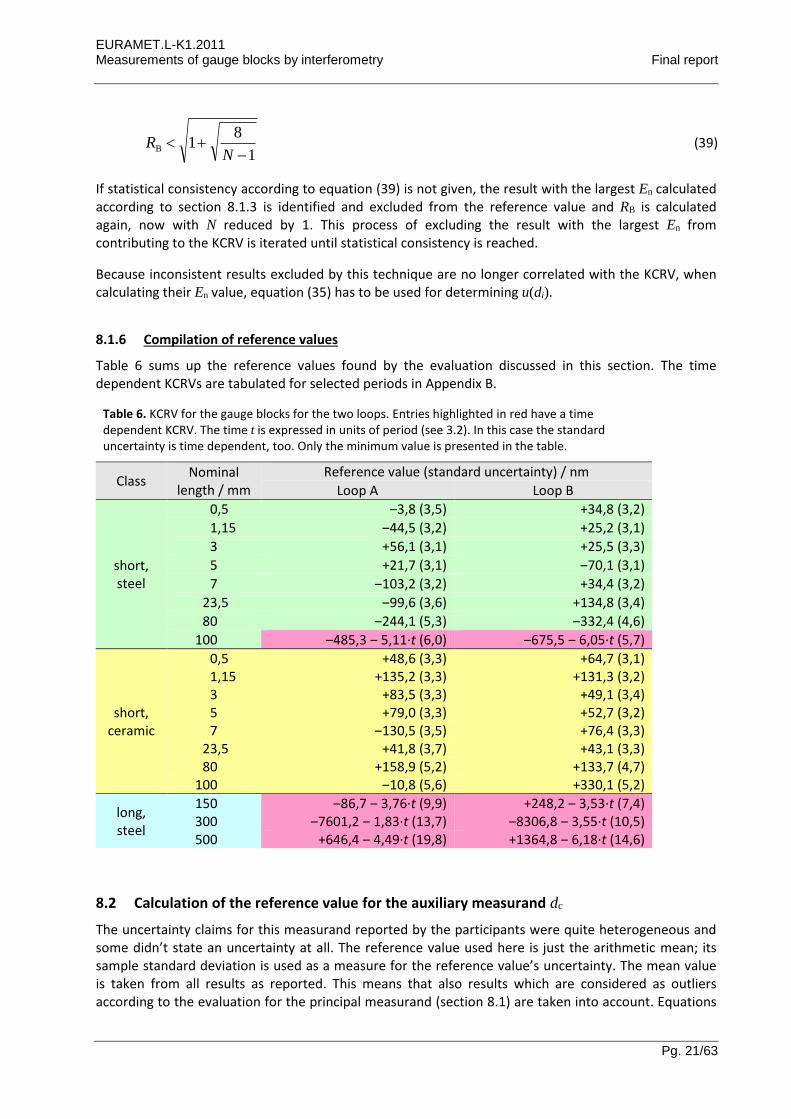
8.1.6 Compilation of reference values
Table 6 sums up the reference values found by the evaluation discussed in this section. The time dependent KCRVs are tabulated for selected periods in Appendix B.
Table 6. KCRV for the gauge blocks for the two loops. Entries highlighted in red have a time dependent KCRV. The time t is expressed in units of period (see 3.2). In this case the standard uncertainty is time dependent, too. Only the minimum value is presented in the table.
Class Nominal
length / mm Reference value (standard uncertainty) / nm
Loop A Loop B
short, steel
0,5 ‒3,8 (3,5) +34,8 (3,2)
1,15 ‒44,5 (3,2) +25,2 (3,1)
3 +56,1 (3,1) +25,5 (3,3)
5 +21,7 (3,1) ‒70,1 (3,1)
7 ‒103,2 (3,2) +34,4 (3,2)
23,5 ‒99,6 (3,6) +134,8 (3,4)
80 ‒244,1 (5,3) ‒332,4 (4,6)
100 ‒485,3 ‒ 5,11·t (6,0) ‒675,5 ‒ 6,05·t (5,7)
short, ceramic
0,5 +48,6 (3,3) +64,7 (3,1) 1,15 +135,2 (3,3) +131,3 (3,2) 3 +83,5 (3,3) +49,1 (3,4) 5 +79,0 (3,3) +52,7 (3,2) 7 ‒130,5 (3,5) +76,4 (3,3)
23,5 +41,8 (3,7) +43,1 (3,3) 80 +158,9 (5,2) +133,7 (4,7)
100 ‒10,8 (5,6) +330,1 (5,2)
long, steel
150 ‒86,7 ‒ 3,76·t (9,9) +248,2 ‒ 3,53·t (7,4) 300 ‒7601,2 ‒ 1,83·t (13,7) ‒8306,8 ‒ 3,55·t (10,5) 500 +646,4 ‒ 4,49·t (19,8) +1364,8 ‒ 6,18·t (14,6)
8.2 Calculation of the reference value for the auxiliary measurand dc
The uncertainty claims for this measurand reported by the participants were quite heterogeneous and some didn’t state an uncertainty at all. The reference value used here is just the arithmetic mean; its sample standard deviation is used as a measure for the reference value’s uncertainty. The mean value is taken from all results as reported. This means that also results which are considered as outliers according to the evaluation for the principal measurand (section 8.1) are taken into account. Equations
EURAMET.L-K1.2011 Measurements of gauge blocks by interferometry Final report
Pg. 22/63
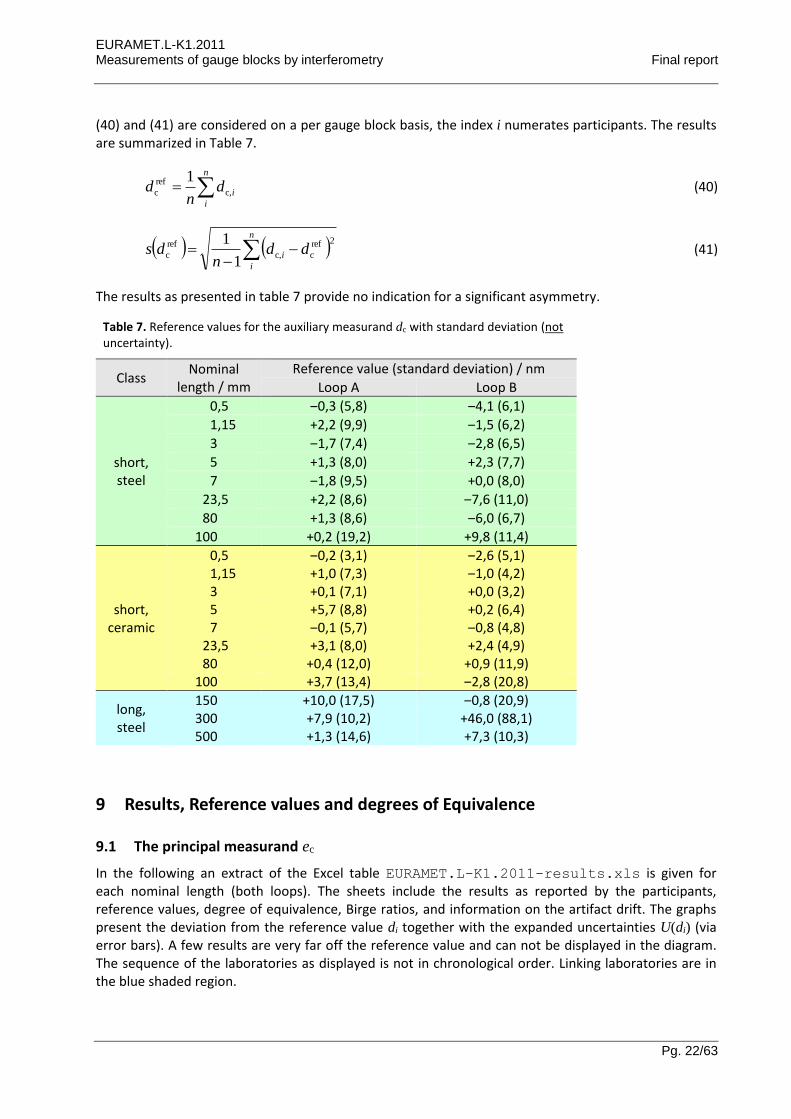
(40) and (41) are considered on a per gauge block basis, the index i numerates participants. The results are summarized in Table 7.
n
i
idn
d c,
ref
c
1 (40)
n
i
i ddn
ds2ref
cc,
ref
c1
1 (41)
The results as presented in table 7 provide no indication for a significant asymmetry.
Table 7. Reference values for the auxiliary measurand dc with standard deviation (not uncertainty).
Class Nominal
length / mm
Reference value (standard deviation) / nm
Loop A Loop B
short, steel
0,5 ‒0,3 (5,8) ‒4,1 (6,1)
1,15 +2,2 (9,9) ‒1,5 (6,2)
3 ‒1,7 (7,4) ‒2,8 (6,5)
5 +1,3 (8,0) +2,3 (7,7)
7 ‒1,8 (9,5) +0,0 (8,0)
23,5 +2,2 (8,6) ‒7,6 (11,0)
80 +1,3 (8,6) ‒6,0 (6,7)
100 +0,2 (19,2) +9,8 (11,4)
short, ceramic
0,5 ‒0,2 (3,1) ‒2,6 (5,1) 1,15 +1,0 (7,3) ‒1,0 (4,2) 3 +0,1 (7,1) +0,0 (3,2) 5 +5,7 (8,8) +0,2 (6,4) 7 ‒0,1 (5,7) ‒0,8 (4,8)
23,5 +3,1 (8,0) +2,4 (4,9) 80 +0,4 (12,0) +0,9 (11,9)
100 +3,7 (13,4) ‒2,8 (20,8)
long, steel
150 +10,0 (17,5) ‒0,8 (20,9) 300 +7,9 (10,2) +46,0 (88,1) 500 +1,3 (14,6) +7,3 (10,3)
9 Results, Reference values and degrees of Equivalence
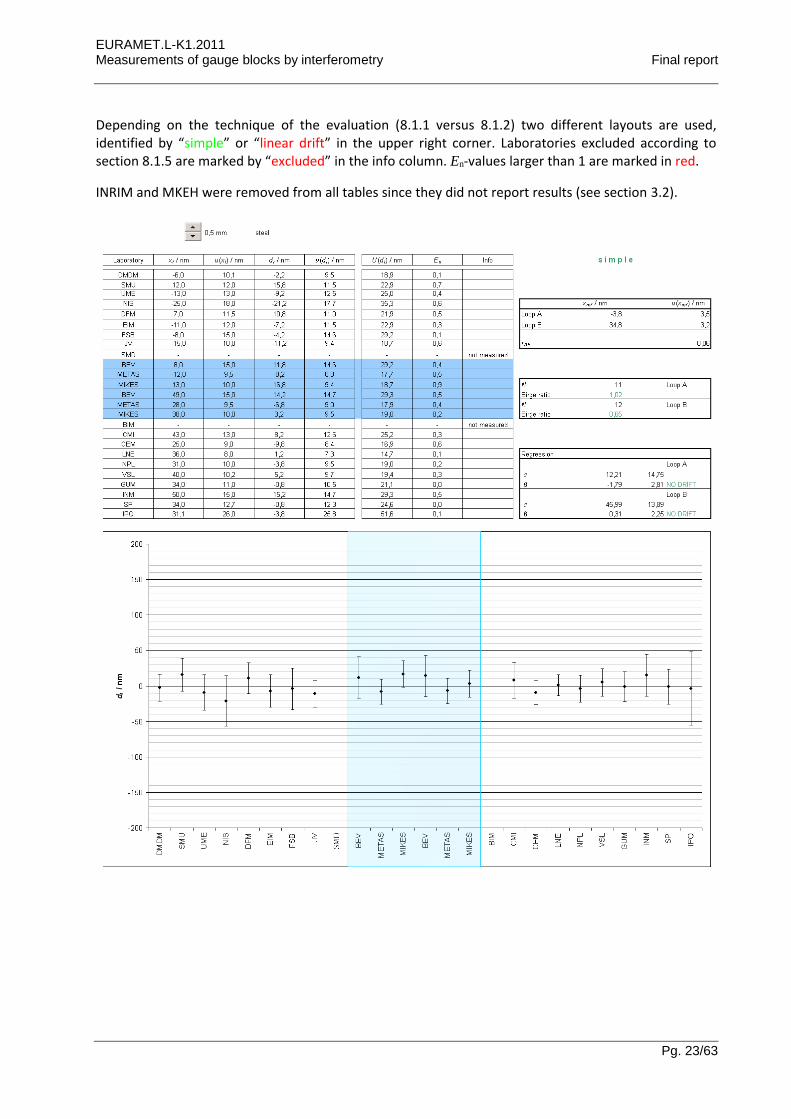
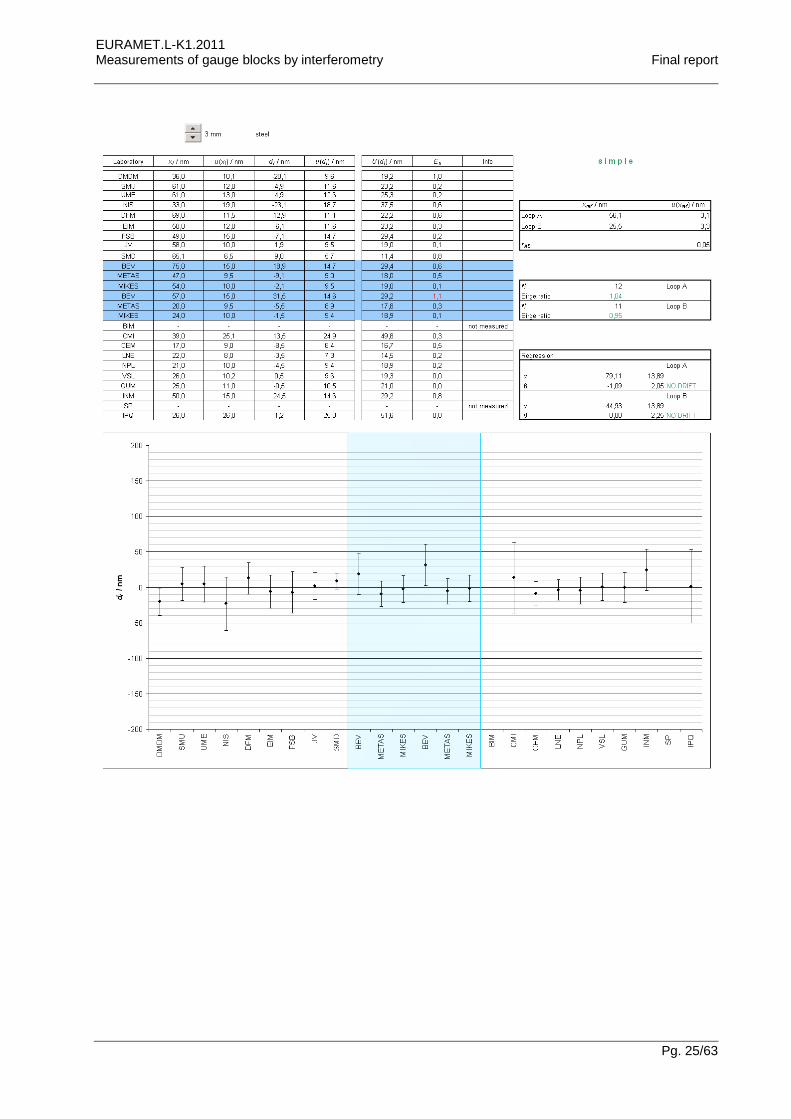
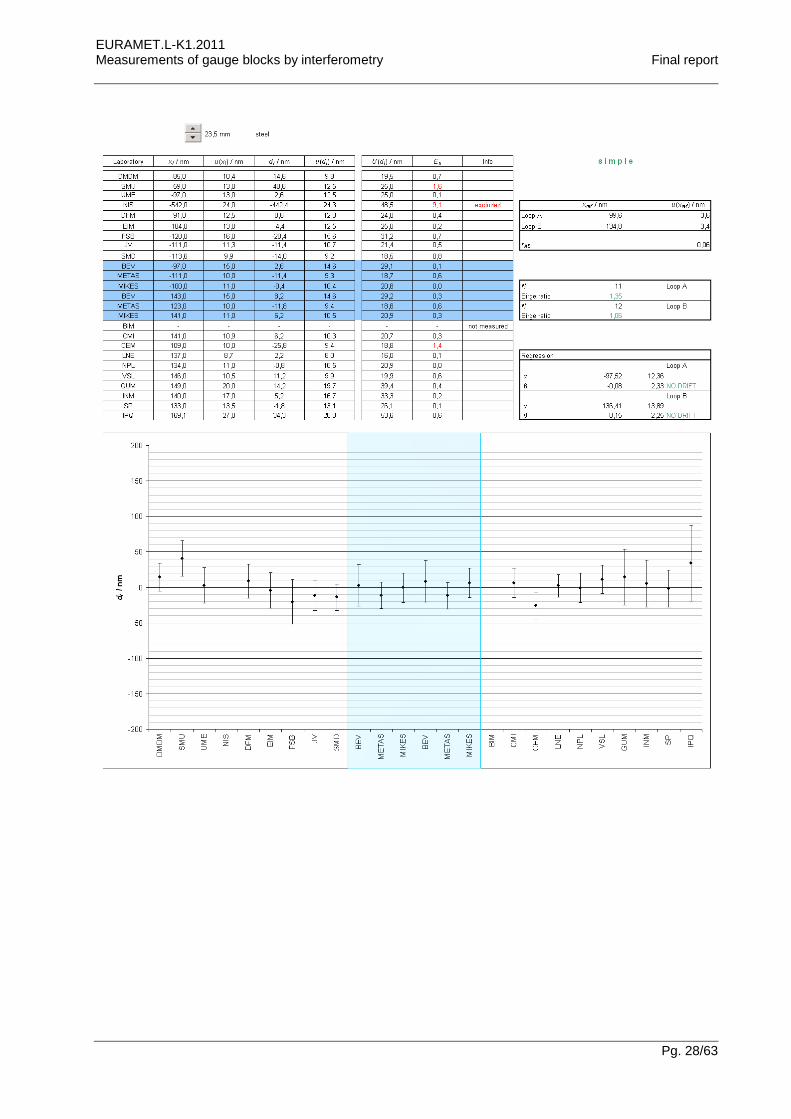
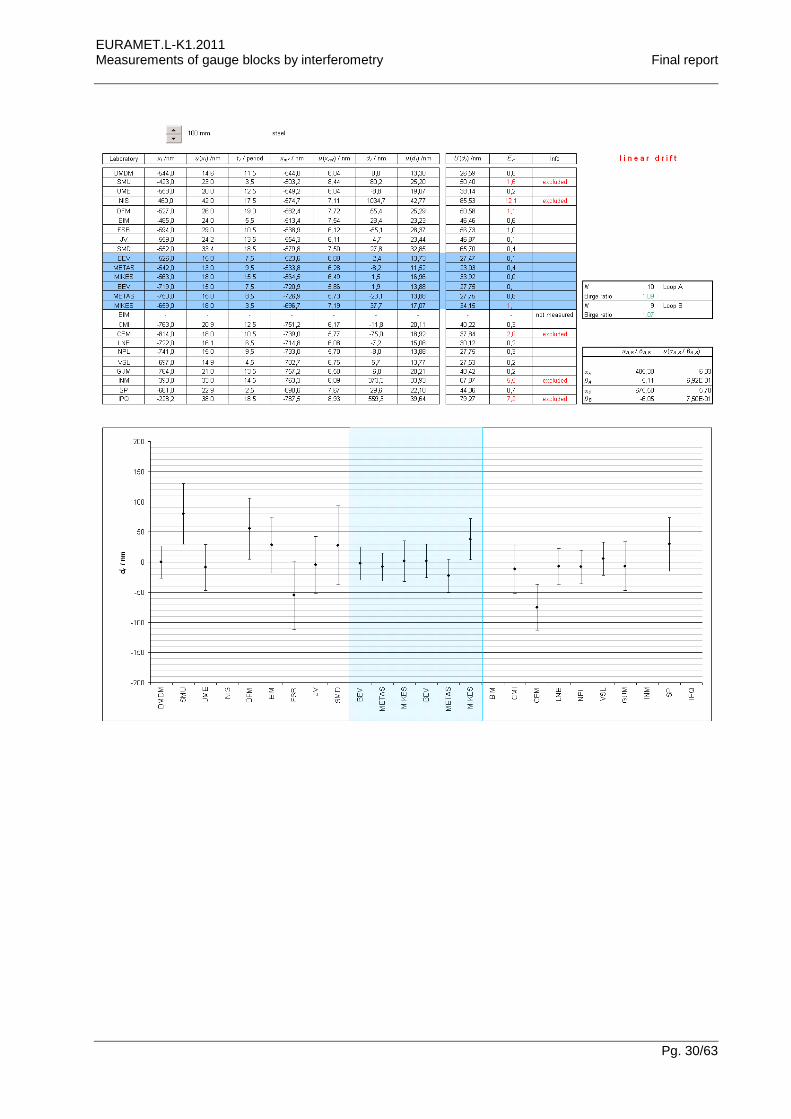
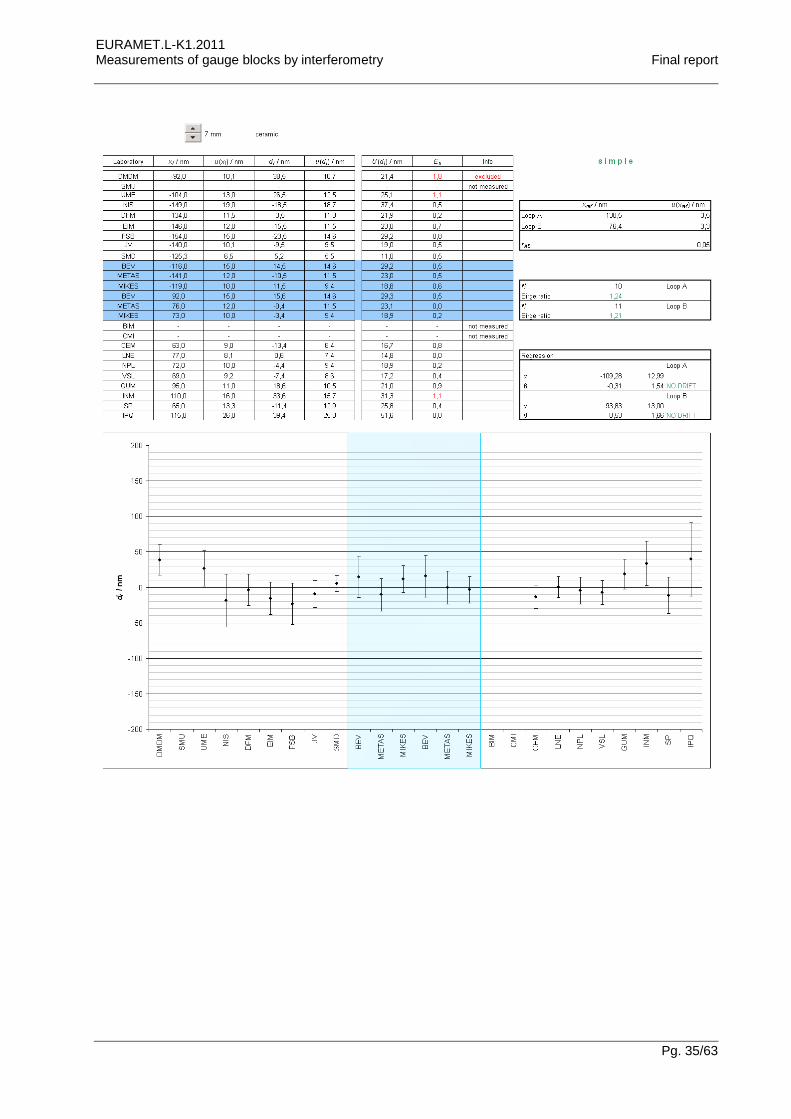
9.1 The principal measurand ec
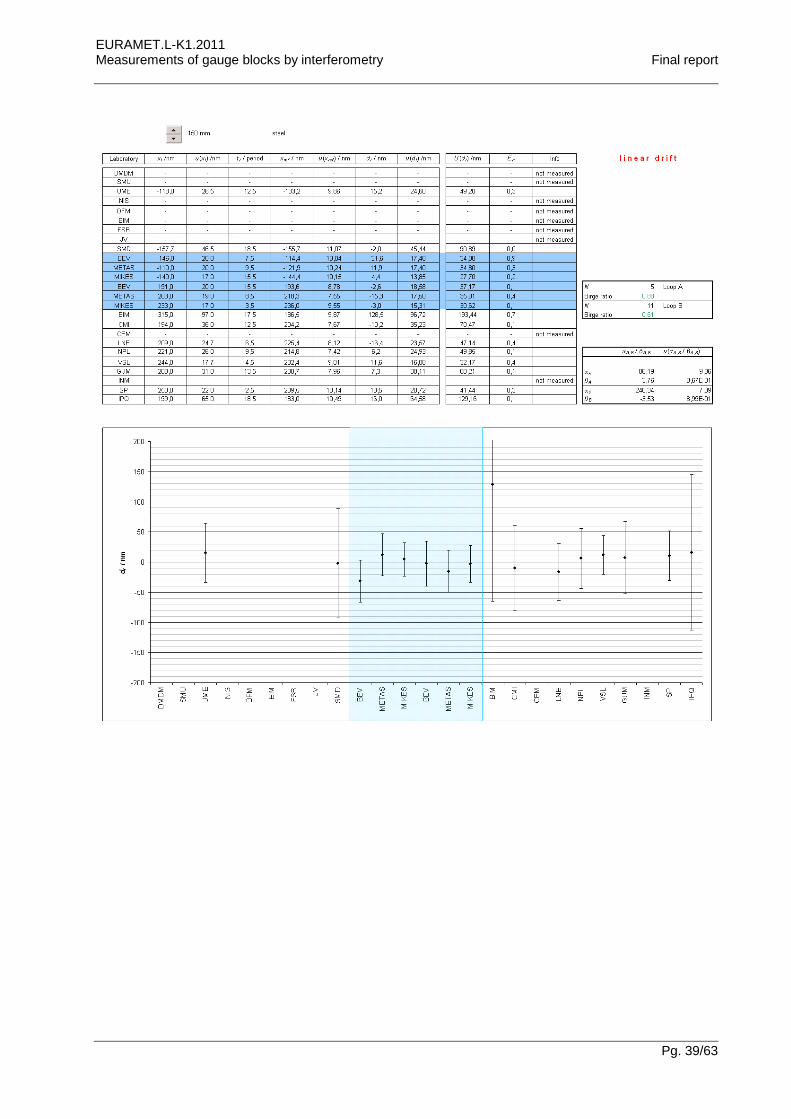
In the following an extract of the Excel table EURAMET.L-K1.2011-results.xls is given for each nominal length (both loops). The sheets include the results as reported by the participants, reference values, degree of equivalence, Birge ratios, and information on the artifact drift. The graphs present the deviation from the reference value di together with the expanded uncertainties U(di) (via error bars). A few results are very far off the reference value and can not be displayed in the diagram. The sequence of the laboratories as displayed is not in chronological order. Linking laboratories are in the blue shaded region.
EURAMET.L-K1.2011 Measurements of gauge blocks by interferometry Final report
Pg. 23/63
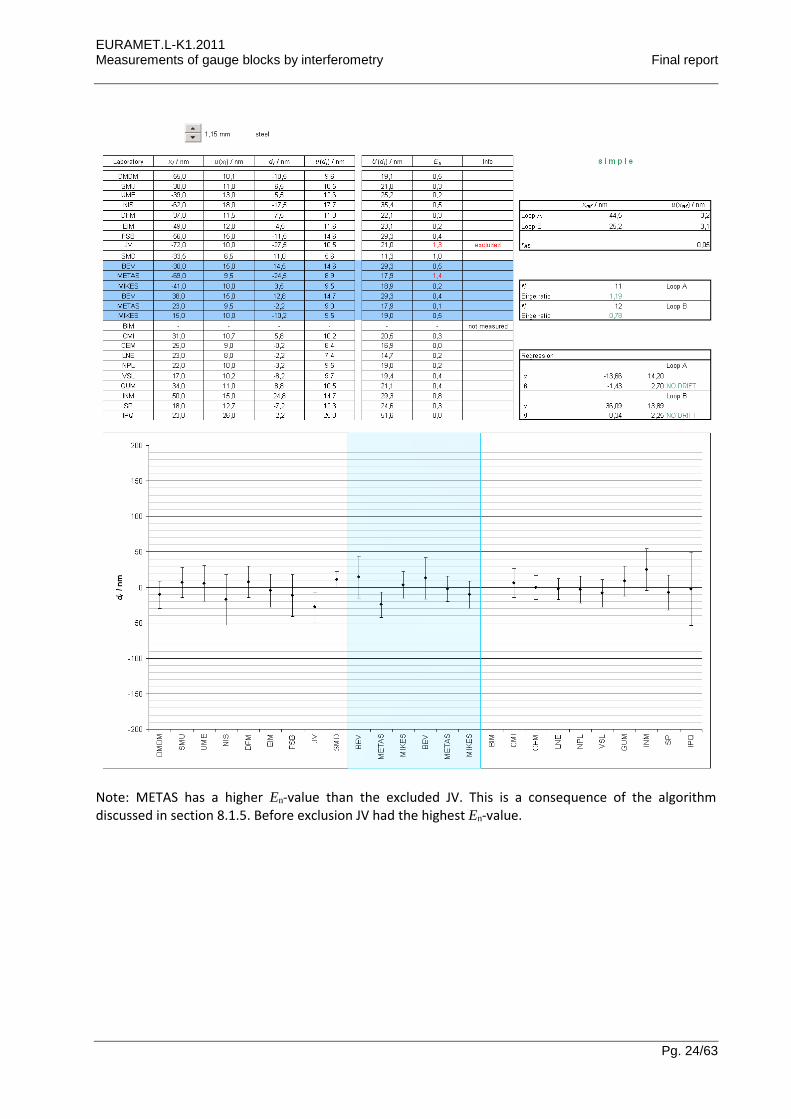
Depending on the technique of the evaluation (8.1.1 versus 8.1.2) two different layouts are used, identified by “simple” or “linear drift” in the upper right corner. Laboratories excluded according to section 8.1.5 are marked by “excluded” in the info column. En-values larger than 1 are marked in red.
INRIM and MKEH were removed from all tables since they did not report results (see section 3.2).
EURAMET.L-K1.2011 Measurements of gauge blocks by interferometry Final report
Pg. 24/63
Note: METAS has a higher En-value than the excluded JV. This is a consequence of the algorithm discussed in section 8.1.5. Before exclusion JV had the highest En-value.
EURAMET.L-K1.2011 Measurements of gauge blocks by interferometry Final report
Pg. 25/63

EURAMET.L-K1.2011 Measurements of gauge blocks by interferometry Final report
Pg. 26/63

EURAMET.L-K1.2011 Measurements of gauge blocks by interferometry Final report
Pg. 27/63
EURAMET.L-K1.2011 Measurements of gauge blocks by interferometry Final report
Pg. 28/63

EURAMET.L-K1.2011 Measurements of gauge blocks by interferometry Final report
Pg. 29/63
EURAMET.L-K1.2011 Measurements of gauge blocks by interferometry Final report
Pg. 30/63

EURAMET.L-K1.2011 Measurements of gauge blocks by interferometry Final report
Pg. 31/63

EURAMET.L-K1.2011 Measurements of gauge blocks by interferometry Final report
Pg. 32/63

EURAMET.L-K1.2011 Measurements of gauge blocks by interferometry Final report
Pg. 33/63

EURAMET.L-K1.2011 Measurements of gauge blocks by interferometry Final report
Pg. 34/63
EURAMET.L-K1.2011 Measurements of gauge blocks by interferometry Final report
Pg. 35/63

EURAMET.L-K1.2011 Measurements of gauge blocks by interferometry Final report
Pg. 36/63

EURAMET.L-K1.2011 Measurements of gauge blocks by interferometry Final report
Pg. 37/63

EURAMET.L-K1.2011 Measurements of gauge blocks by interferometry Final report
Pg. 38/63
EURAMET.L-K1.2011 Measurements of gauge blocks by interferometry Final report
Pg. 39/63

EURAMET.L-K1.2011 Measurements of gauge blocks by interferometry Final report
Pg. 40/63
EURAMET.L-K1.2011 Measurements of gauge blocks by interferometry Final report
Pg. 41/63
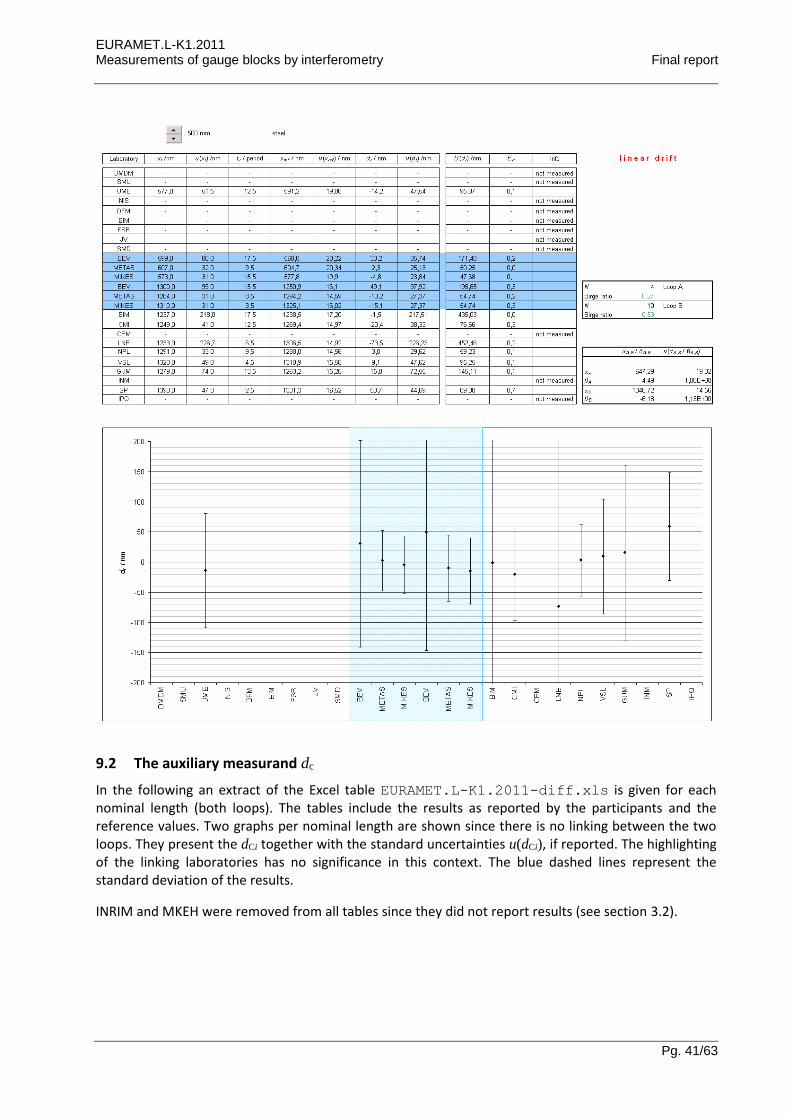
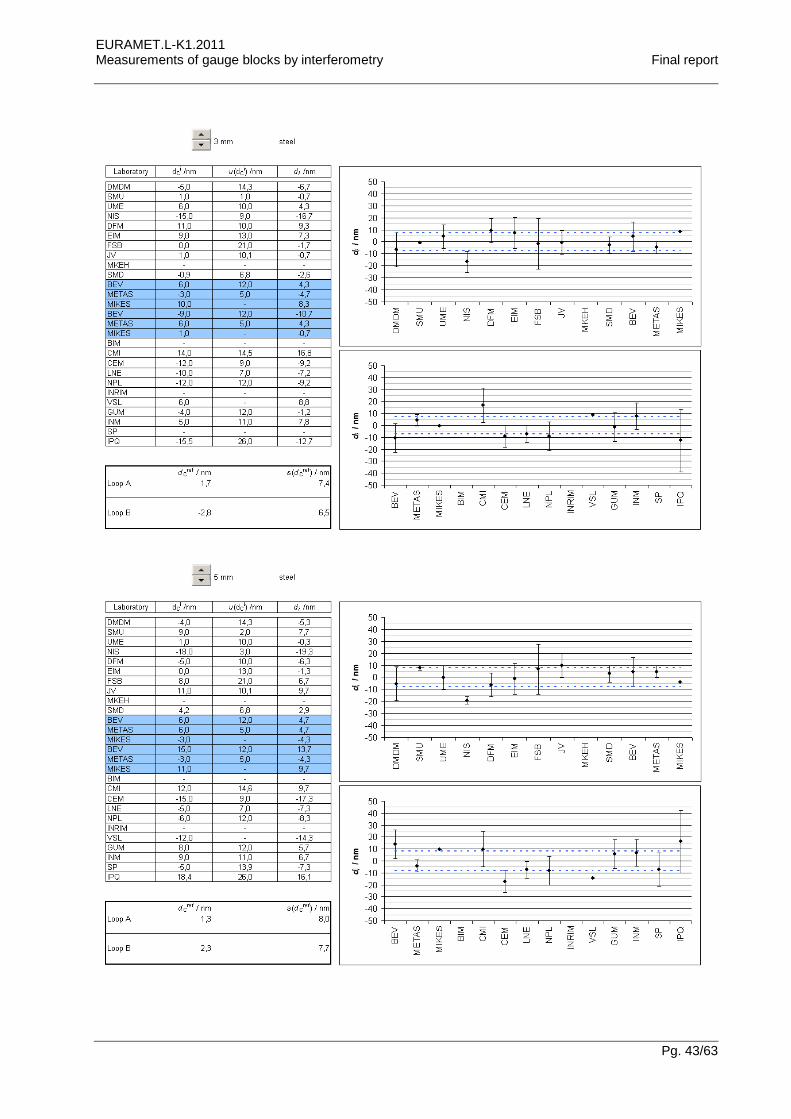
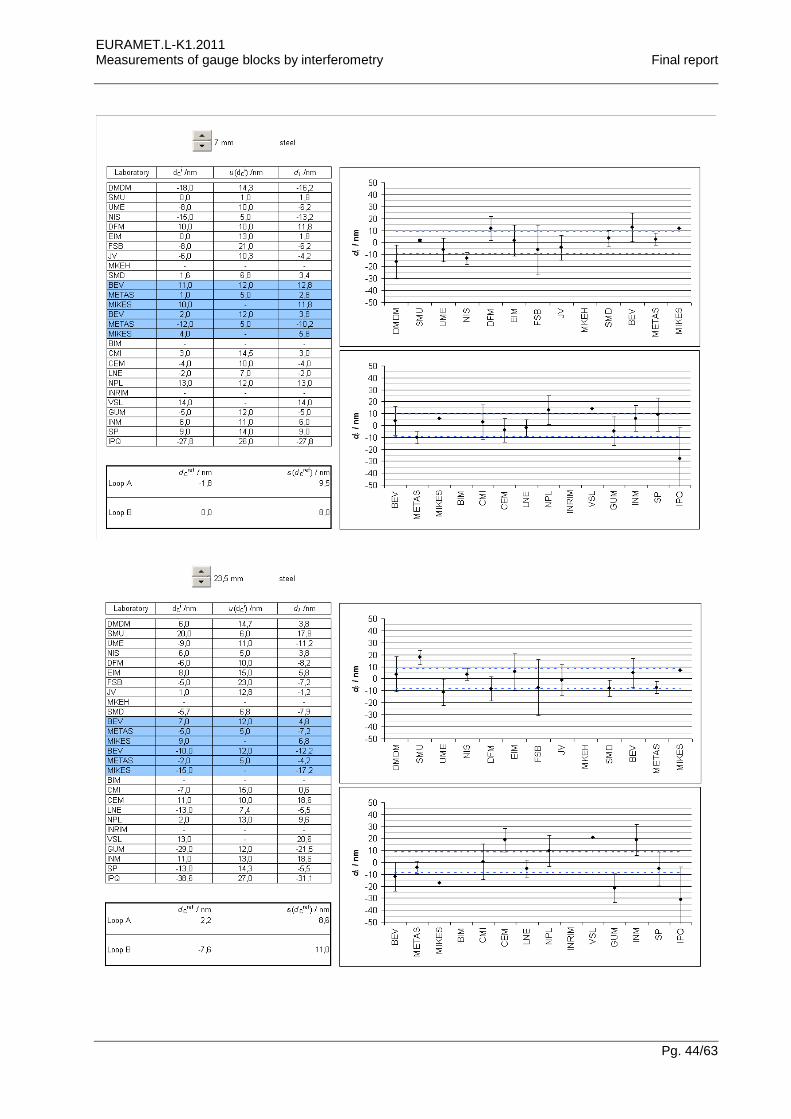
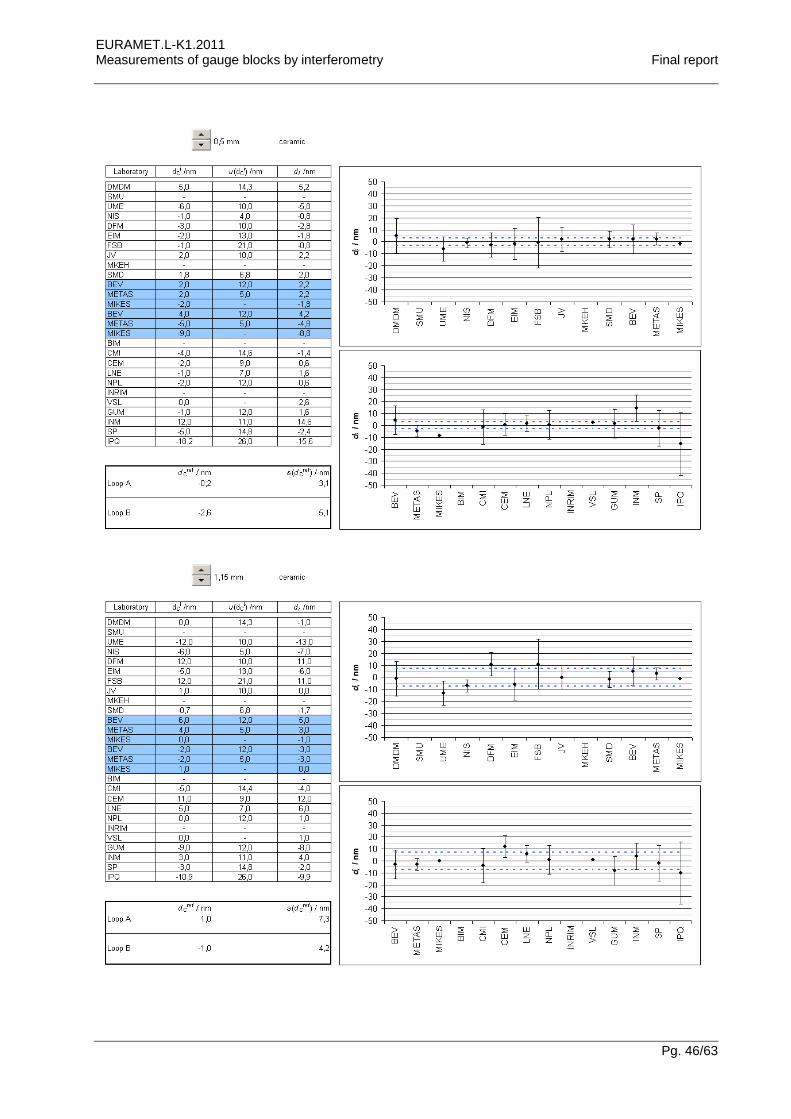
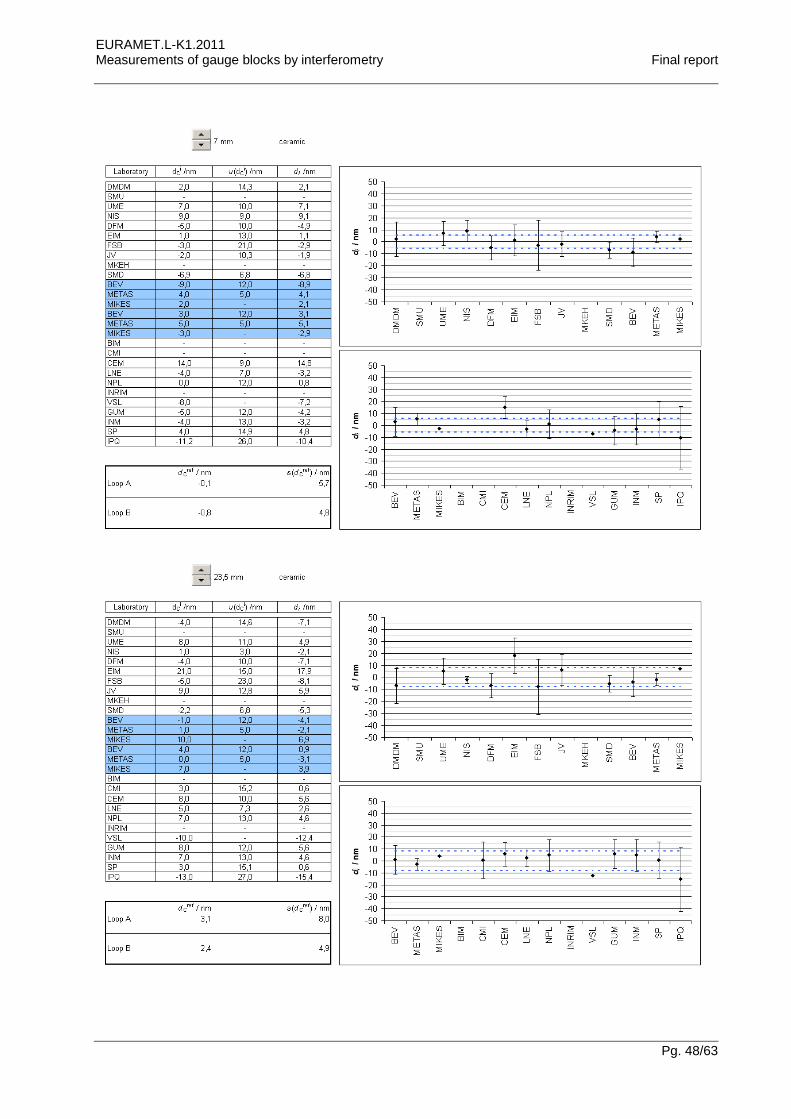
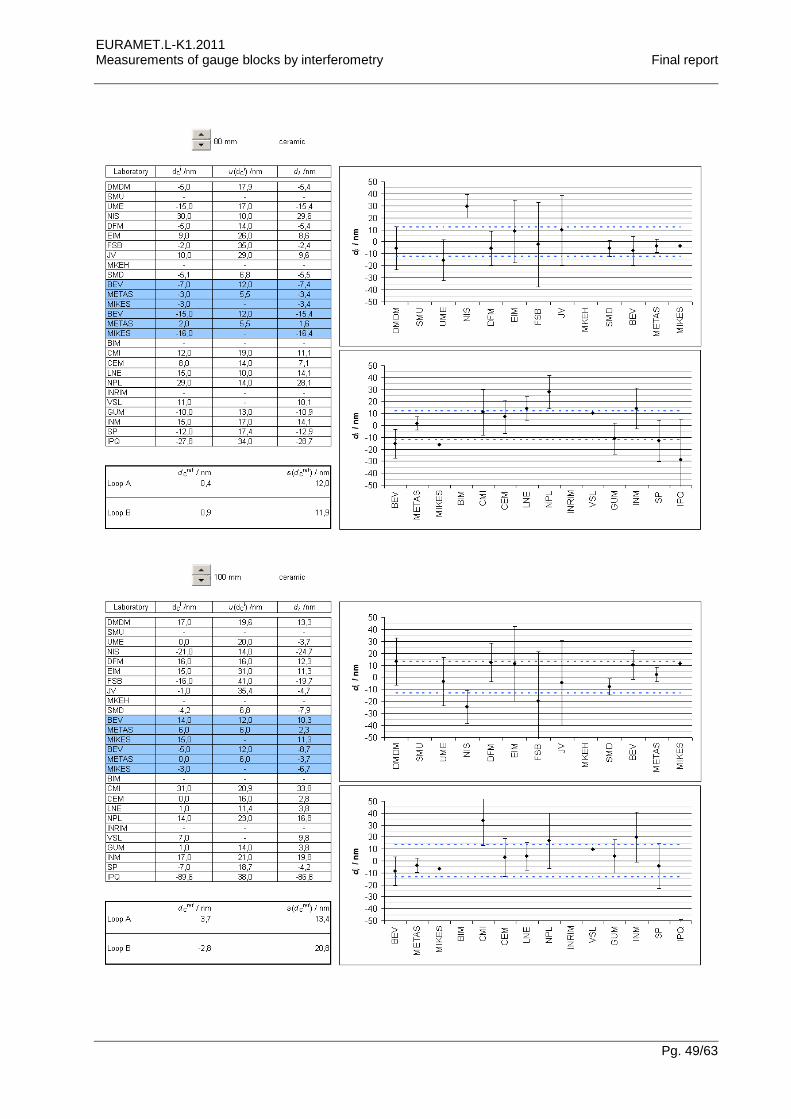
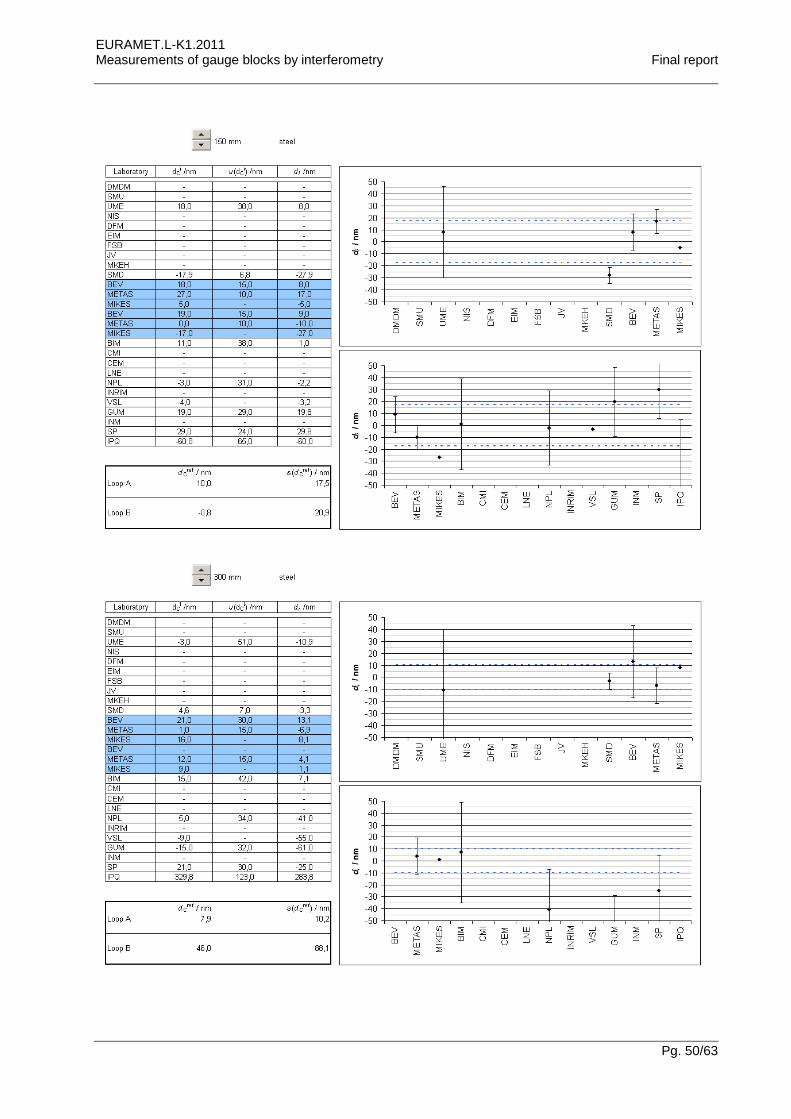
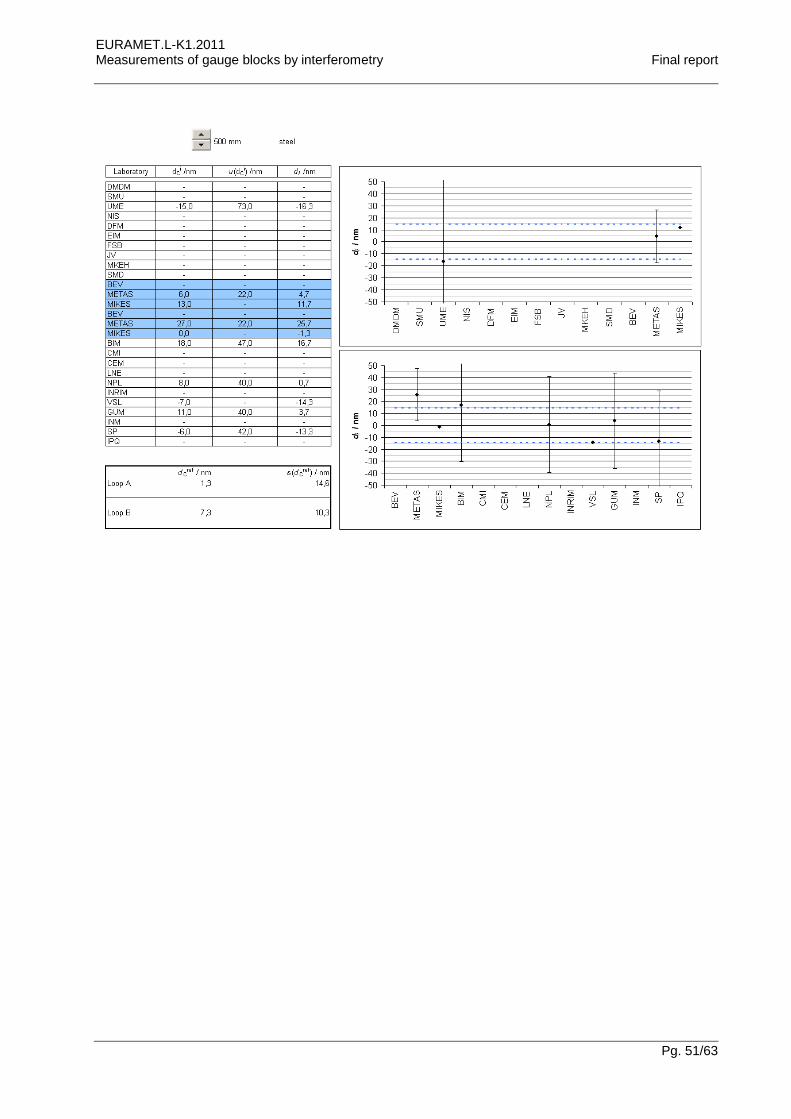
9.2 The auxiliary measurand dc
In the following an extract of the Excel table EURAMET.L-K1.2011-diff.xls is given for each nominal length (both loops). The tables include the results as reported by the participants and the reference values. Two graphs per nominal length are shown since there is no linking between the two loops. They present the dCi together with the standard uncertainties u(dCi), if reported. The highlighting of the linking laboratories has no significance in this context. The blue dashed lines represent the standard deviation of the results.
INRIM and MKEH were removed from all tables since they did not report results (see section 3.2).

EURAMET.L-K1.2011 Measurements of gauge blocks by interferometry Final report
Pg. 42/63
EURAMET.L-K1.2011 Measurements of gauge blocks by interferometry Final report
Pg. 43/63
EURAMET.L-K1.2011 Measurements of gauge blocks by interferometry Final report
Pg. 44/63

EURAMET.L-K1.2011 Measurements of gauge blocks by interferometry Final report
Pg. 45/63
EURAMET.L-K1.2011 Measurements of gauge blocks by interferometry Final report
Pg. 46/63

EURAMET.L-K1.2011 Measurements of gauge blocks by interferometry Final report
Pg. 47/63
EURAMET.L-K1.2011 Measurements of gauge blocks by interferometry Final report
Pg. 48/63
EURAMET.L-K1.2011 Measurements of gauge blocks by interferometry Final report
Pg. 49/63
EURAMET.L-K1.2011 Measurements of gauge blocks by interferometry Final report
Pg. 50/63
EURAMET.L-K1.2011 Measurements of gauge blocks by interferometry Final report
Pg. 51/63
EURAMET.L-K1.2011 Measurements of gauge blocks by interferometry Final report
Pg. 52/63
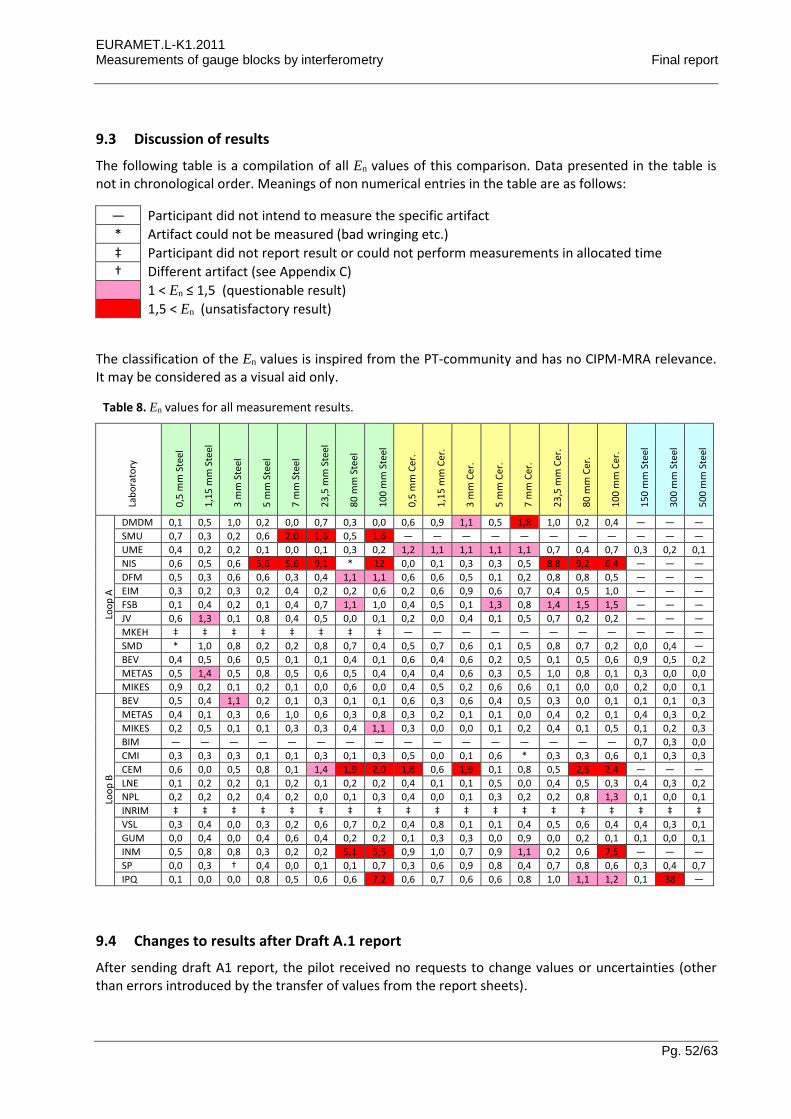
9.3 Discussion of results
The following table is a compilation of all En values of this comparison. Data presented in the table is not in chronological order. Meanings of non numerical entries in the table are as follows:
― Participant did not intend to measure the specific artifact
* Artifact could not be measured (bad wringing etc.)
‡ Participant did not report result or could not perform measurements in allocated time
† Different artifact (see Appendix C)
1 < En ≤ 1,5 (questionable result)
1,5 < En (unsatisfactory result)
The classification of the En values is inspired from the PT-community and has no CIPM-MRA relevance. It may be considered as a visual aid only.
Table 8. En values for all measurement results.
Lab
ora
tory
0,5
mm
Ste
el
1,1
5 m
m S
teel
3 m
m S
teel
5 m
m S
teel
7 m
m S
teel
23
,5 m
m S
teel
80
mm
Ste
el
10
0 m
m S
teel
0,5
mm
Cer
.
1,1
5 m
m C
er.
3 m
m C
er.
5 m
m C
er.
7 m
m C
er.
23
,5 m
m C
er.
80
mm
Cer
.
10
0 m
m C
er.
15
0 m
m S
teel
30
0 m
m S
teel
50
0 m
m S
teel
Loo
p A
DMDM 0,1 0,5 1,0 0,2 0,0 0,7 0,3 0,0 0,6 0,9 1,1 0,5 1,8 1,0 0,2 0,4 ― ― ―
SMU 0,7 0,3 0,2 0,6 2,0 1,6 0,5 1,6 ― ― ― ― ― ― ― ― ― ― ―
UME 0,4 0,2 0,2 0,1 0,0 0,1 0,3 0,2 1,2 1,1 1,1 1,1 1,1 0,7 0,4 0,7 0,3 0,2 0,1
NIS 0,6 0,5 0,6 5,6 5,6 9,1 * 12 0,0 0,1 0,3 0,3 0,5 8,8 9,2 6,4 ― ― ―
DFM 0,5 0,3 0,6 0,6 0,3 0,4 1,1 1,1 0,6 0,6 0,5 0,1 0,2 0,8 0,8 0,5 ― ― ―
EIM 0,3 0,2 0,3 0,2 0,4 0,2 0,2 0,6 0,2 0,6 0,9 0,6 0,7 0,4 0,5 1,0 ― ― ―
FSB 0,1 0,4 0,2 0,1 0,4 0,7 1,1 1,0 0,4 0,5 0,1 1,3 0,8 1,4 1,5 1,5 ― ― ―
JV 0,6 1,3 0,1 0,8 0,4 0,5 0,0 0,1 0,2 0,0 0,4 0,1 0,5 0,7 0,2 0,2 ― ― ―
MKEH ‡ ‡ ‡ ‡ ‡ ‡ ‡ ‡ ― ― ― ― ― ― ― ― ― ― ―
SMD * 1,0 0,8 0,2 0,2 0,8 0,7 0,4 0,5 0,7 0,6 0,1 0,5 0,8 0,7 0,2 0,0 0,4 ―
BEV 0,4 0,5 0,6 0,5 0,1 0,1 0,4 0,1 0,6 0,4 0,6 0,2 0,5 0,1 0,5 0,6 0,9 0,5 0,2
METAS 0,5 1,4 0,5 0,8 0,5 0,6 0,5 0,4 0,4 0,4 0,6 0,3 0,5 1,0 0,8 0,1 0,3 0,0 0,0
MIKES 0,9 0,2 0,1 0,2 0,1 0,0 0,6 0,0 0,4 0,5 0,2 0,6 0,6 0,1 0,0 0,0 0,2 0,0 0,1
Loo
p B
BEV 0,5 0,4 1,1 0,2 0,1 0,3 0,1 0,1 0,6 0,3 0,6 0,4 0,5 0,3 0,0 0,1 0,1 0,1 0,3
METAS 0,4 0,1 0,3 0,6 1,0 0,6 0,3 0,8 0,3 0,2 0,1 0,1 0,0 0,4 0,2 0,1 0,4 0,3 0,2
MIKES 0,2 0,5 0,1 0,1 0,3 0,3 0,4 1,1 0,3 0,0 0,0 0,1 0,2 0,4 0,1 0,5 0,1 0,2 0,3
BIM ― ― ― ― ― ― ― ― ― ― ― ― ― ― ― ― 0,7 0,3 0,0
CMI 0,3 0,3 0,3 0,1 0,1 0,3 0,1 0,3 0,5 0,0 0,1 0,6 * 0,3 0,3 0,6 0,1 0,3 0,3
CEM 0,6 0,0 0,5 0,8 0,1 1,4 1,9 2,0 1,8 0,6 1,9 0,1 0,8 0,5 2,5 2,4 ― ― ―
LNE 0,1 0,2 0,2 0,1 0,2 0,1 0,2 0,2 0,4 0,1 0,1 0,5 0,0 0,4 0,5 0,3 0,4 0,3 0,2
NPL 0,2 0,2 0,2 0,4 0,2 0,0 0,1 0,3 0,4 0,0 0,1 0,3 0,2 0,2 0,8 1,3 0,1 0,0 0,1
INRIM ‡ ‡ ‡ ‡ ‡ ‡ ‡ ‡ ‡ ‡ ‡ ‡ ‡ ‡ ‡ ‡ ‡ ‡ ‡
VSL 0,3 0,4 0,0 0,3 0,2 0,6 0,7 0,2 0,4 0,8 0,1 0,1 0,4 0,5 0,6 0,4 0,4 0,3 0,1
GUM 0,0 0,4 0,0 0,4 0,6 0,4 0,2 0,2 0,1 0,3 0,3 0,0 0,9 0,0 0,2 0,1 0,1 0,0 0,1
INM 0,5 0,8 0,8 0,3 0,2 0,2 5,1 5,5 0,9 1,0 0,7 0,9 1,1 0,2 0,6 7,5 ― ― ―
SP 0,0 0,3 † 0,4 0,0 0,1 0,1 0,7 0,3 0,6 0,9 0,8 0,4 0,7 0,8 0,6 0,3 0,4 0,7
IPQ 0,1 0,0 0,0 0,8 0,5 0,6 0,6 7,2 0,6 0,7 0,6 0,6 0,8 1,0 1,1 1,2 0,1 38 ―
9.4 Changes to results after Draft A.1 report
After sending draft A1 report, the pilot received no requests to change values or uncertainties (other than errors introduced by the transfer of values from the report sheets).
EURAMET.L-K1.2011 Measurements of gauge blocks by interferometry Final report
Pg. 53/63
9.5 Comments received after Draft B.1 report
After sending draft B.1 report, the pilot received the following comments:
9.5.1 NPL comment from 29.07.2015
NPL commented mainly on the single result with En value larger than 1:
Regarding the single 'borderline' result for NPL on the 100 mm ceramic gauge, examining the measurement records reveals the following. We used 9.3 ppm/K for the expansion, as stated in the protocol.
B wring (NPL first wring) Temperature = 20.018 °C, deviation = +334 nm [started at +373 nm whilst cooling from 20.078 °C]
A wring (NPL second wring) Temperature = 20.023 °C, deviation = +348 nm [started at +393 nm before being re-wrung]
Phase correction Determined using stack technique = −48 nm.
Mean phase corrected result, deviation = (+334 +348)/2 − 48 = +293 nm. Result from mechanical comparator, deviation = +286 nm.
Our result is 37 nm below the KCRV but if we had used the longer results obtained during 'cooling' we would be 7 nm above the KCRV with En < 1. I do note that our 80 mm ceramic result is showing the same trend as the 100 mm ceramic, i.e. shorter than the KCRV, but is still within En < 1.
1. The long steel gauges were measured OK so there is no alignment problem and other length dependent issues (refractive index, thermal measurement & compensation) are OK.
2. A bad wring would make the gauge measure longer, but we measured shorter.
3. A wrong CTE value would only affect the result if the temperature is far from 20 °C. On average, we measured the gauge when 20 mK 'hot', leading to a correction of only 19 nm.
4. All other gauges measure very well (very low En values), so there is nothing fundamentally wrong with our process.
5. There is no mention in our records of poor surface geometry and none given in the report, so it is unlikely a flatness or variation issue has caused the problem.
6. The trend observed for the 80 mm ceramic and 100 mm ceramic gauges suggest a possible length dependent issue for ceramic gauges only, which may suggest a thermal effect due to the poor thermal conductivity of ceramic material. This may be also affected because we wrung the ceramic gauges to steel platens.
7. We had some difficulty wringing the phase stack with the ceramic gauges but eventually good phase stacks were obtained in both wrings and the results for the other ceramic gauges are good, suggesting the phase correction is OK.
8. The mechanical comparator results for the gauges agree well with the interferometer results for all gauges in the comparison.
EURAMET.L-K1.2011 Measurements of gauge blocks by interferometry Final report
Pg. 54/63
Pilot: The comment has no influence on the outcome of this key comparison (no change in values or evaluation) and is reproduced here as such.
9.5.2 METAS comment from 30.07.2015
Beside some typos METAS also send suggestions for improvement. Specifically an argument on the validity of the linking process was asked for (especially since some of the linking laboratory results have En-values larger than one)
Pilot: Most recommendations have been included in the draft B.2 report. Also an (hand waving) argument was added in section 10.
9.5.3 GUM comment from 31.08.2015
Beside of some typos, GUM spotted severe errors in the graphs of section 9.2 (mixing up standard and expanded uncertainties, using wrong reference value). Moreover the two measurement loops were not consistently designated in the document.
Pilot: All recommendations have been included in the draft B.2 report.
9.5.4 DFM comment from 04.09.2015
DFM provided valuable suggestions on the boundary conditions for the formulas developed in section 8.1. Also some inaccurateness was pointed out regarding the time transformation for drifting artefacts.
Pilot: All recommendations have been included in the draft B.2 report.
9.5.5 DFM comment from 14.09.2015
This was a post-deadline comment. It gives additional information on artefact stability and the influence on the evaluation schema. Since this topics are of general interest this comment is reproduced here. All files mentioned in the following can be found on Google Drive, see 6.1.
Harald Bosse visited DFM last week as one of the technical assessor for the renewal of DFM’s accreditation.
As part of his assessment, we discussed DFM’s results in the EURAMET.L-K1.2011 comparison. As you know, we have two En values slightly above one for the 80 mm and 100 mm steel gauge blocks. My colleague Lars Nielsen, our local expert in data analysis and key comparisons, has performed an alternative analysis of the EURAMET.L-K1.2011 results using methods developed some time ago (see attached pdf files for details). Harald suggested that I informed you about this analysis, giving you the possibility to comment in the report (in case you find it relevant) that an alternative analysis for the 80 mm and 100 mm steel gauges gives slightly different results.
I have attached Lars’ analyses in the two Excel work books.
Note that the equivalent of the En value is in Lars’ analysis the ‘normalised deviations d’. A value of En = 1 is equivalent to a value of d = 2; thus, d ≤ 2 is in general fine.
EURAMET.L-K1.2011 Measurements of gauge blocks by interferometry Final report
Pg. 55/63
For both gauge blocks, Lars’ analysis reduces the number of ‘questionable results’ by one – in both cases DFM is affected (going from an En value of 1.1 to what compares to a value of 0.9 (i.e. d=1.8) in Lars’ analysis).
One major difference between Lars’ analysis and yours is that Lars include all consistent results in the drift estimation. There are possibly arguments for and against this method.
In any case, this additional analysis is not in any way criticism of your work, merely a supplement. Taking the uncertainties of the En values into account, I think both analyses give consistent results.
Pilot: The proposed analysis technique has advantages regarding the determination of a more robust KCRV with lower uncertainty. However it is not in line with the decided evaluation technique as laid down in the technical protocol.
Essentially the proposal differs in two aspects from the technique actually taken in this report.
1. It takes into account any available information for the determination of the KCRV.
2. All artefacts are modelled as having a linear time drift right from the beginning.
By taking all available data for the fit of a linear drift the respective coefficient (drift rate) can be determined with smaller uncertainty.
For example, for the 80 mm steel block, loop A, one obtains +0,94 ± 0,68 as compared to +0,78 ± 2,33 in this work (all values in nm·period−1). Whilst the actual drift rate does not change significantly, the
respective uncertainty is much smaller. The same holds for the constant parameter (equ. 18), simply because the number of input data is larger. Since the uncertainty of the KCRV is smaller and the drift is now accounted for, the En-values tend to be smaller, too.
Unfortunately this procedure gives the laboratory performing the stability measurements a weight 5 to 7 times larger than the remaining participants. Even worse, this laboratory might not even be a participant (PTB for long blocks).
In summary this technique might be an alternative approach to evaluate future key (provided to make clear how to give equal weights to all participants). Also for an in-depth analysis of specific participants results this might be useful.
9.6 Linking of result to other comparisons
The comparison followed the protocol of the former comparison CCL-K1.2011 as closely as possible. To what extent the two comparisons can be linked to each other, and whether this brings any added value, needs to be investigated by the CCL Task Group on comparison linking (TG-L) once the final reports of the comparisons are available.
10 Conclusion
In total there were 44 En values larger than 1. This represents 10 % of the full set of 420 results which is a considerable high number. At least 12 of them are clearly outlier where the participants have been informed by the pilot as soon as possible. With a single exception (see discussion in section 7.2) the discrepancies have not been solved.
EURAMET.L-K1.2011 Measurements of gauge blocks by interferometry Final report
Pg. 56/63
The comparison was conducted in two loops with two sets of artifacts. Like in similar comparisons a statistical technique for linking the reference values was applied [8, 9]. As a consequence the reference value of one loop is influenced by the measurements of the other loop although they did not even see the artifacts of the others. This influence comes solely from the “linking laboratories” which measure both sets of artifacts. This influence depends among others on the correlation of the two measurements of each linking laboratory. Taking the sample variance as an estimate yields sometimes implausible values (negative correlation) therefore a GUM type B evaluation was used (see section 8.1.3). The numerical value of the respective correlation coefficients includes some arbitrariness. Its impact was checked by variation of this parameter within a practical range. The reference values are influenced in the nm-range but the pattern of En values did not change at all.
For each of the three linking labs there was a single result (out of 38 each) with En-value slightly larger than one. The validity of the linking process is not at risk since this number is smaller the 5 % which could be expected on a statistical basis.
All artifacts were newly acquired and were monitored for stability during the comparison. The length of the 8 longest steel gauge blocks proved to decrease in time with different rates. These drift rates were included in the evaluation of the KCRV in a straightforward way by modeling the length as a linear function in time (see section 8.1.2). Care was taken to determine this drift rate with a self contained technique thus preventing any influence of the stability measurements on the KCRV as far as possible. The stability measurements of the short gauge blocks were performed by BEV (a participant), for the long blocks by PTB (not a participant). In both cases only the slope of the linear function is used for the evaluation leading to a very small additional weight of the BEV stability measurements to the KCRV of the 100 mm steel blocks. For the remaining 30 blocks with no significant drift, the KCRV is not at all influenced by the multiple stability measurements. The consideration of the drift improves the number of consistent results considerable, especially for the 100 mm gauge blocks.
The results for the supplementary measurand dc (equation (2)) were inconclusive. This quantity is of some importance for the uncertainty estimation but is never communicated per se to clients. For this use an uncertainty value and even the sign is unimportant. For future comparison on gauge blocks this measurand should probably be no longer considered to save time in reporting.
Appendix A Equipment and measuring processes of the participants
The participants were asked to supply this information in a format ready for inclusion. Since not all participants provided an electronic version, this information has been collated in a separate PDF file EURAMET.L-K1.2011_AppendixA.pdf. This file includes the participant’s reports “Appendix B – Condition of Measuring Faces (short GB)”, “Appendix C – Condition of Measuring Faces (long GB)”, and “Appendix E – Description of the measurement instrument”. The same order as in section 9.1 was utilized for the laboratories. Not each participant provided all reports.
Appendix B Time dependent KCRVs
The numerical values for the KCRV together with its standard uncertainty are presented in the following table for convenience.
EURAMET.L-K1.2011 Measurements of gauge blocks by interferometry Final report
Pg. 57/63
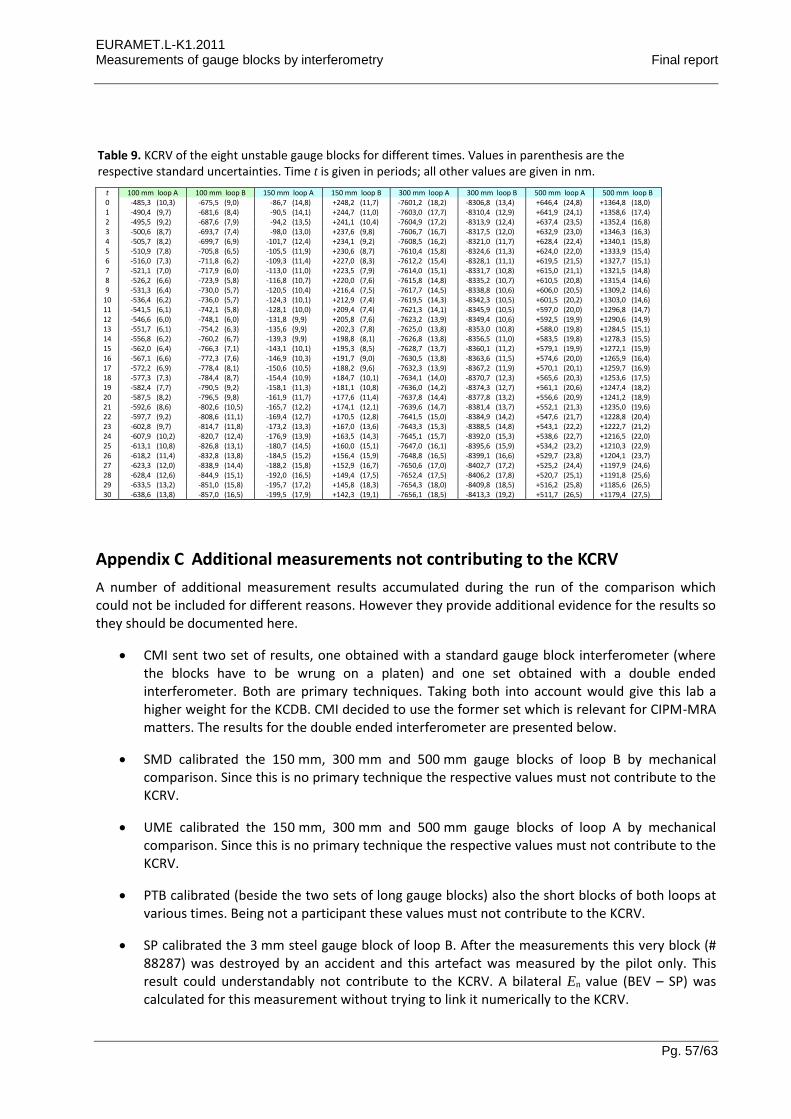
Table 9. KCRV of the eight unstable gauge blocks for different times. Values in parenthesis are the respective standard uncertainties. Time t is given in periods; all other values are given in nm.
t 100 mm loop A 100 mm loop B 150 mm loop A 150 mm loop B 300 mm loop A 300 mm loop B 500 mm loop A 500 mm loop B 0 -485,3 (10,3) -675,5 (9,0) -86,7 (14,8) +248,2 (11,7) -7601,2 (18,2) -8306,8 (13,4) +646,4 (24,8) +1364,8 (18,0) 1 -490,4 (9,7) -681,6 (8,4) -90,5 (14,1) +244,7 (11,0) -7603,0 (17,7) -8310,4 (12,9) +641,9 (24,1) +1358,6 (17,4) 2 -495,5 (9,2) -687,6 (7,9) -94,2 (13,5) +241,1 (10,4) -7604,9 (17,2) -8313,9 (12,4) +637,4 (23,5) +1352,4 (16,8) 3 -500,6 (8,7) -693,7 (7,4) -98,0 (13,0) +237,6 (9,8) -7606,7 (16,7) -8317,5 (12,0) +632,9 (23,0) +1346,3 (16,3) 4 -505,7 (8,2) -699,7 (6,9) -101,7 (12,4) +234,1 (9,2) -7608,5 (16,2) -8321,0 (11,7) +628,4 (22,4) +1340,1 (15,8) 5 -510,9 (7,8) -705,8 (6,5) -105,5 (11,9) +230,6 (8,7) -7610,4 (15,8) -8324,6 (11,3) +624,0 (22,0) +1333,9 (15,4) 6 -516,0 (7,3) -711,8 (6,2) -109,3 (11,4) +227,0 (8,3) -7612,2 (15,4) -8328,1 (11,1) +619,5 (21,5) +1327,7 (15,1) 7 -521,1 (7,0) -717,9 (6,0) -113,0 (11,0) +223,5 (7,9) -7614,0 (15,1) -8331,7 (10,8) +615,0 (21,1) +1321,5 (14,8) 8 -526,2 (6,6) -723,9 (5,8) -116,8 (10,7) +220,0 (7,6) -7615,8 (14,8) -8335,2 (10,7) +610,5 (20,8) +1315,4 (14,6) 9 -531,3 (6,4) -730,0 (5,7) -120,5 (10,4) +216,4 (7,5) -7617,7 (14,5) -8338,8 (10,6) +606,0 (20,5) +1309,2 (14,6)
10 -536,4 (6,2) -736,0 (5,7) -124,3 (10,1) +212,9 (7,4) -7619,5 (14,3) -8342,3 (10,5) +601,5 (20,2) +1303,0 (14,6) 11 -541,5 (6,1) -742,1 (5,8) -128,1 (10,0) +209,4 (7,4) -7621,3 (14,1) -8345,9 (10,5) +597,0 (20,0) +1296,8 (14,7) 12 -546,6 (6,0) -748,1 (6,0) -131,8 (9,9) +205,8 (7,6) -7623,2 (13,9) -8349,4 (10,6) +592,5 (19,9) +1290,6 (14,9) 13 -551,7 (6,1) -754,2 (6,3) -135,6 (9,9) +202,3 (7,8) -7625,0 (13,8) -8353,0 (10,8) +588,0 (19,8) +1284,5 (15,1) 14 -556,8 (6,2) -760,2 (6,7) -139,3 (9,9) +198,8 (8,1) -7626,8 (13,8) -8356,5 (11,0) +583,5 (19,8) +1278,3 (15,5) 15 -562,0 (6,4) -766,3 (7,1) -143,1 (10,1) +195,3 (8,5) -7628,7 (13,7) -8360,1 (11,2) +579,1 (19,9) +1272,1 (15,9) 16 -567,1 (6,6) -772,3 (7,6) -146,9 (10,3) +191,7 (9,0) -7630,5 (13,8) -8363,6 (11,5) +574,6 (20,0) +1265,9 (16,4) 17 -572,2 (6,9) -778,4 (8,1) -150,6 (10,5) +188,2 (9,6) -7632,3 (13,9) -8367,2 (11,9) +570,1 (20,1) +1259,7 (16,9) 18 -577,3 (7,3) -784,4 (8,7) -154,4 (10,9) +184,7 (10,1) -7634,1 (14,0) -8370,7 (12,3) +565,6 (20,3) +1253,6 (17,5) 19 -582,4 (7,7) -790,5 (9,2) -158,1 (11,3) +181,1 (10,8) -7636,0 (14,2) -8374,3 (12,7) +561,1 (20,6) +1247,4 (18,2) 20 -587,5 (8,2) -796,5 (9,8) -161,9 (11,7) +177,6 (11,4) -7637,8 (14,4) -8377,8 (13,2) +556,6 (20,9) +1241,2 (18,9) 21 -592,6 (8,6) -802,6 (10,5) -165,7 (12,2) +174,1 (12,1) -7639,6 (14,7) -8381,4 (13,7) +552,1 (21,3) +1235,0 (19,6) 22 -597,7 (9,2) -808,6 (11,1) -169,4 (12,7) +170,5 (12,8) -7641,5 (15,0) -8384,9 (14,2) +547,6 (21,7) +1228,8 (20,4) 23 -602,8 (9,7) -814,7 (11,8) -173,2 (13,3) +167,0 (13,6) -7643,3 (15,3) -8388,5 (14,8) +543,1 (22,2) +1222,7 (21,2) 24 -607,9 (10,2) -820,7 (12,4) -176,9 (13,9) +163,5 (14,3) -7645,1 (15,7) -8392,0 (15,3) +538,6 (22,7) +1216,5 (22,0) 25 -613,1 (10,8) -826,8 (13,1) -180,7 (14,5) +160,0 (15,1) -7647,0 (16,1) -8395,6 (15,9) +534,2 (23,2) +1210,3 (22,9) 26 -618,2 (11,4) -832,8 (13,8) -184,5 (15,2) +156,4 (15,9) -7648,8 (16,5) -8399,1 (16,6) +529,7 (23,8) +1204,1 (23,7) 27 -623,3 (12,0) -838,9 (14,4) -188,2 (15,8) +152,9 (16,7) -7650,6 (17,0) -8402,7 (17,2) +525,2 (24,4) +1197,9 (24,6) 28 -628,4 (12,6) -844,9 (15,1) -192,0 (16,5) +149,4 (17,5) -7652,4 (17,5) -8406,2 (17,8) +520,7 (25,1) +1191,8 (25,6) 29 -633,5 (13,2) -851,0 (15,8) -195,7 (17,2) +145,8 (18,3) -7654,3 (18,0) -8409,8 (18,5) +516,2 (25,8) +1185,6 (26,5) 30 -638,6 (13,8) -857,0 (16,5) -199,5 (17,9) +142,3 (19,1) -7656,1 (18,5) -8413,3 (19,2) +511,7 (26,5) +1179,4 (27,5)
Appendix C Additional measurements not contributing to the KCRV
A number of additional measurement results accumulated during the run of the comparison which could not be included for different reasons. However they provide additional evidence for the results so they should be documented here.
CMI sent two set of results, one obtained with a standard gauge block interferometer (where the blocks have to be wrung on a platen) and one set obtained with a double ended interferometer. Both are primary techniques. Taking both into account would give this lab a higher weight for the KCDB. CMI decided to use the former set which is relevant for CIPM-MRA matters. The results for the double ended interferometer are presented below.
SMD calibrated the 150 mm, 300 mm and 500 mm gauge blocks of loop B by mechanical comparison. Since this is no primary technique the respective values must not contribute to the KCRV.
UME calibrated the 150 mm, 300 mm and 500 mm gauge blocks of loop A by mechanical comparison. Since this is no primary technique the respective values must not contribute to the KCRV.
PTB calibrated (beside the two sets of long gauge blocks) also the short blocks of both loops at various times. Being not a participant these values must not contribute to the KCRV.
SP calibrated the 3 mm steel gauge block of loop B. After the measurements this very block (# 88287) was destroyed by an accident and this artefact was measured by the pilot only. This result could understandably not contribute to the KCRV. A bilateral En value (BEV – SP) was calculated for this measurement without trying to link it numerically to the KCRV.
EURAMET.L-K1.2011 Measurements of gauge blocks by interferometry Final report
Pg. 58/63
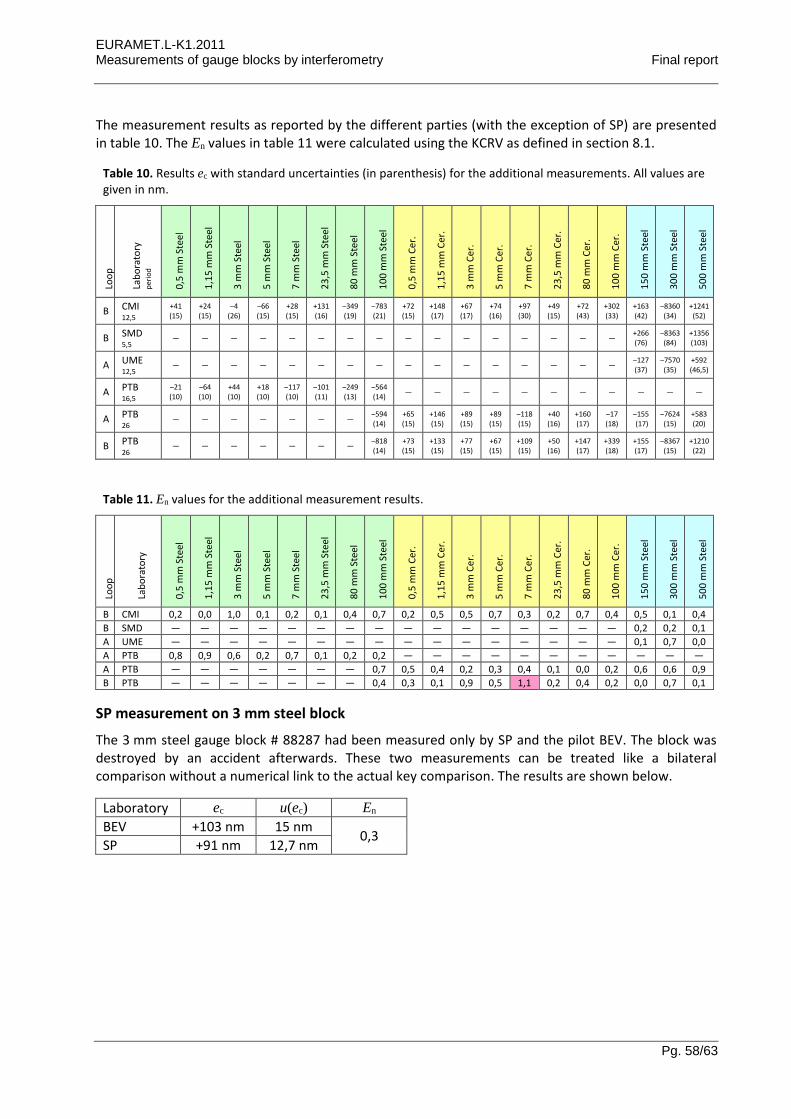
The measurement results as reported by the different parties (with the exception of SP) are presented in table 10. The En values in table 11 were calculated using the KCRV as defined in section 8.1.
Table 10. Results ec with standard uncertainties (in parenthesis) for the additional measurements. All values are given in nm.
Loo
p
Lab
ora
tory
p
erio
d
0,5
mm
Ste
el
1,1
5 m
m S
teel
3 m
m S
teel
5 m
m S
teel
7 m
m S
teel
23
,5 m
m S
teel
80
mm
Ste
el
10
0 m
m S
teel
0,5
mm
Cer
.
1,1
5 m
m C
er.
3 m
m C
er.
5 m
m C
er.
7 m
m C
er.
23
,5 m
m C
er.
80
mm
Cer
.
10
0 m
m C
er.
15
0 m
m S
teel
30
0 m
m S
teel
50
0 m
m S
teel
B CMI 12,5
+41 (15)
+24 (15)
‒4 (26)
‒66 (15)
+28 (15)
+131 (16)
‒349 (19)
‒783 (21)
+72 (15)
+148 (17)
+67 (17)
+74 (16)
+97 (30)
+49 (15)
+72 (43)
+302 (33)
+163 (42)
‒8360 (34)
+1241 (52)
B SMD 5,5
― ― ― ― ― ― ― ― ― ― ― ― ― ― ― ― +266 (76)
‒8363 (84)
+1356 (103)
A UME 12,5
― ― ― ― ― ― ― ― ― ― ― ― ― ― ― ― ‒127 (37)
‒7570 (35)
+592 (46,5)
A PTB 16,5
‒21 (10)
‒64 (10)
+44 (10)
+18 (10)
‒117 (10)
‒101 (11)
‒249 (13)
‒564 (14)
― ― ― ― ― ― ― ― ― ― ―
A PTB 26
― ― ― ― ― ― ― ‒594 (14)
+65 (15)
+146 (15)
+89 (15)
+89 (15)
‒118 (15)
+40 (16)
+160 (17)
‒17 (18)
‒155 (17)
‒7624 (15)
+583 (20)
B PTB 26
― ― ― ― ― ― ― ‒818 (14)
+73 (15)
+133 (15)
+77 (15)
+67 (15)
+109 (15)
+50 (16)
+147 (17)
+339 (18)
+155 (17)
‒8367 (15)
+1210 (22)
Table 11. En values for the additional measurement results.
Loo
p
Lab
ora
tory
0,5
mm
Ste
el
1,1
5 m
m S
teel
3 m
m S
teel
5 m
m S
teel
7 m
m S
teel
23
,5 m
m S
teel
80
mm
Ste
el
10
0 m
m S
teel
0,5
mm
Cer
.
1,1
5 m
m C
er.
3 m
m C
er.
5 m
m C
er.
7 m
m C
er.
23
,5 m
m C
er.
80
mm
Cer
.
10
0 m
m C
er.
15
0 m
m S
teel
30
0 m
m S
teel
50
0 m
m S
teel
B CMI 0,2 0,0 1,0 0,1 0,2 0,1 0,4 0,7 0,2 0,5 0,5 0,7 0,3 0,2 0,7 0,4 0,5 0,1 0,4
B SMD ― ― ― ― ― ― ― ― ― ― ― ― ― ― ― ― 0,2 0,2 0,1
A UME ― ― ― ― ― ― ― ― ― ― ― ― ― ― ― ― 0,1 0,7 0,0
A PTB 0,8 0,9 0,6 0,2 0,7 0,1 0,2 0,2 ― ― ― ― ― ― ― ― ― ― ―
A PTB ― ― ― ― ― ― ― 0,7 0,5 0,4 0,2 0,3 0,4 0,1 0,0 0,2 0,6 0,6 0,9
B PTB ― ― ― ― ― ― ― 0,4 0,3 0,1 0,9 0,5 1,1 0,2 0,4 0,2 0,0 0,7 0,1
SP measurement on 3 mm steel block
The 3 mm steel gauge block # 88287 had been measured only by SP and the pilot BEV. The block was destroyed by an accident afterwards. These two measurements can be treated like a bilateral comparison without a numerical link to the actual key comparison. The results are shown below.
Laboratory ec u(ec) En
BEV +103 nm 15 nm 0,3
SP +91 nm 12,7 nm
EURAMET.L-K1.2011 Measurements of gauge blocks by interferometry Final report
Pg. 59/63
Expansion coefficient – Complementary Measurements by CMI
CMI as a participant reported the linear thermal expansion coefficient for the three long gauge blocks of loop B. The values and expanded uncertainties are presented in table 12. The values are in good agreement with the data provided by PTB (table 4).
Table 12. Coefficients of linear thermal expansion as measured by CMI. The number following the symbol ± is the numerical value of the expanded (k=2) uncertainty.
Identification Nominal
length / mm / 10–6 K–1
Loop B Nr. 110147
150 11,607 ± 0,132
300 11,610 ± 0,066
500 11,596 ± 0,040
Appendix D Measurement faces – Compilation of images
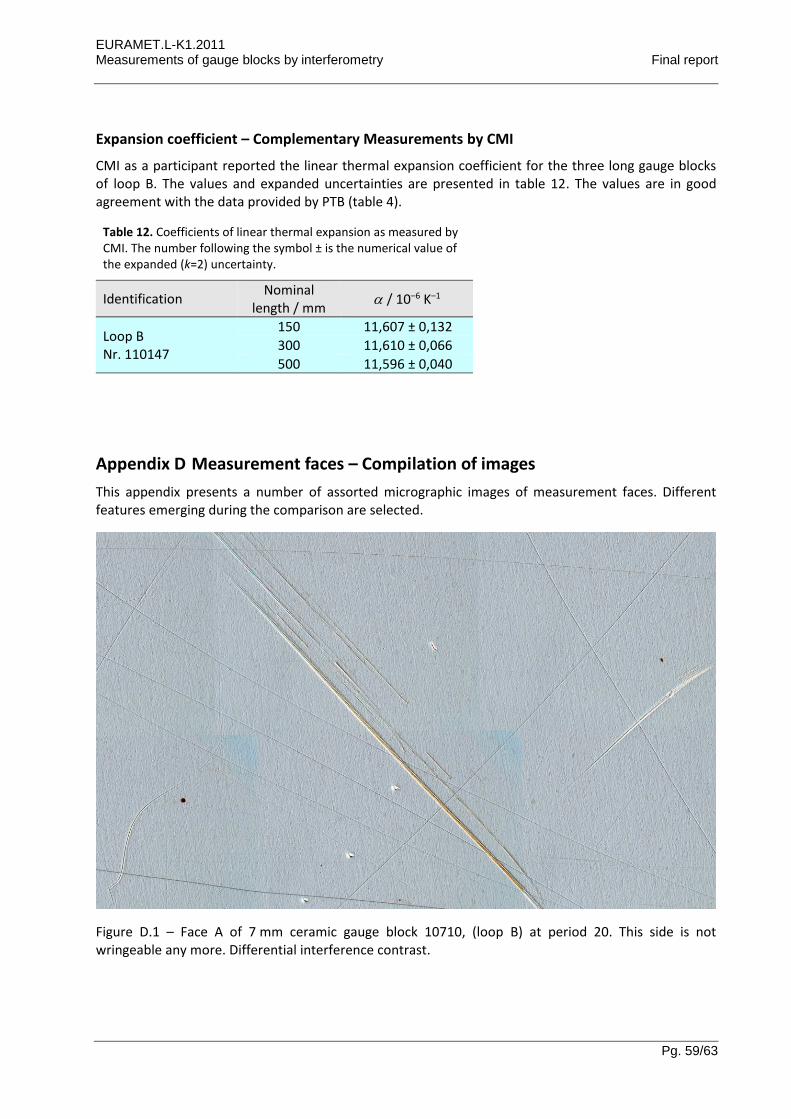
This appendix presents a number of assorted micrographic images of measurement faces. Different features emerging during the comparison are selected.
Figure D.1 – Face A of 7 mm ceramic gauge block 10710, (loop B) at period 20. This side is not wringeable any more. Differential interference contrast.
EURAMET.L-K1.2011 Measurements of gauge blocks by interferometry Final report
Pg. 60/63
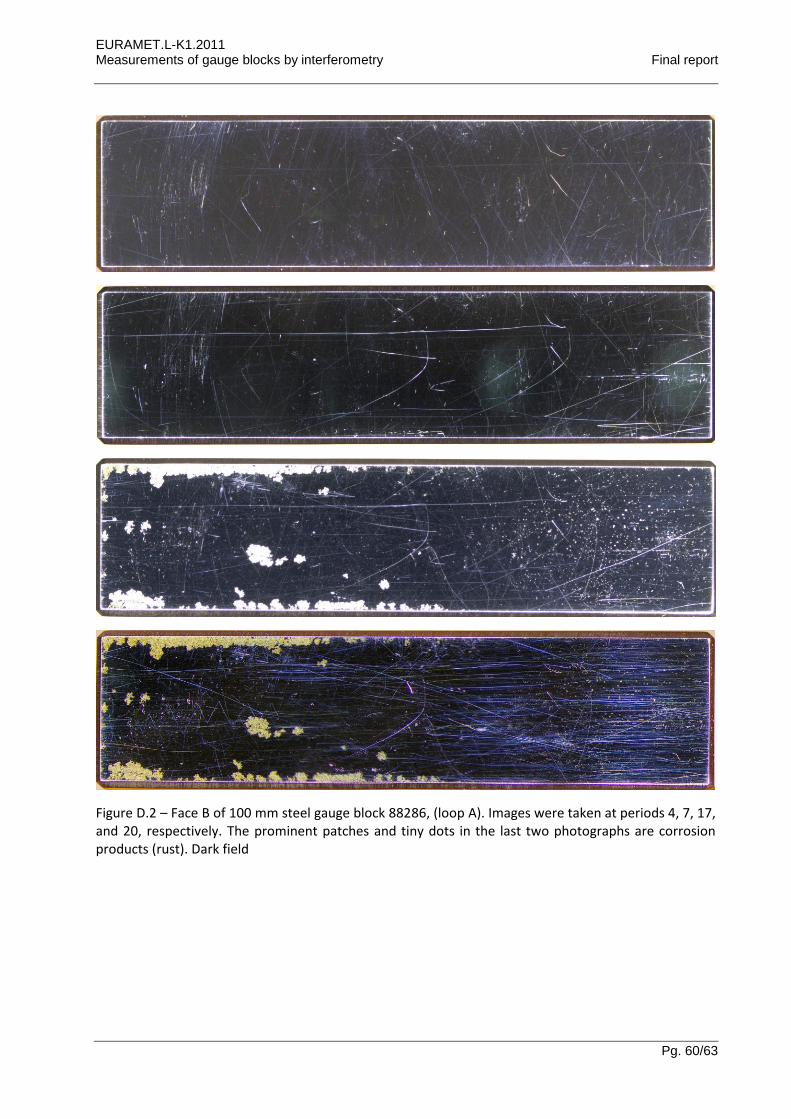
Figure D.2 – Face B of 100 mm steel gauge block 88286, (loop A). Images were taken at periods 4, 7, 17, and 20, respectively. The prominent patches and tiny dots in the last two photographs are corrosion products (rust). Dark field
EURAMET.L-K1.2011 Measurements of gauge blocks by interferometry Final report
Pg. 61/63
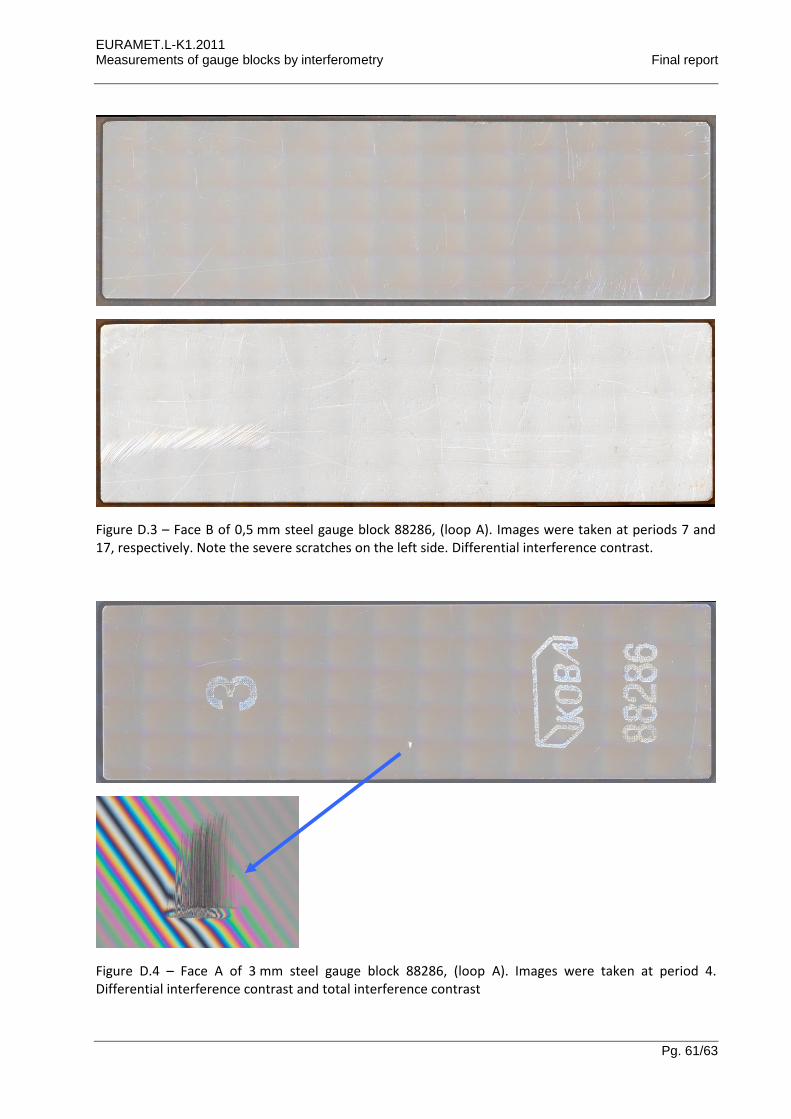
Figure D.3 – Face B of 0,5 mm steel gauge block 88286, (loop A). Images were taken at periods 7 and 17, respectively. Note the severe scratches on the left side. Differential interference contrast.
Figure D.4 – Face A of 3 mm steel gauge block 88286, (loop A). Images were taken at period 4. Differential interference contrast and total interference contrast
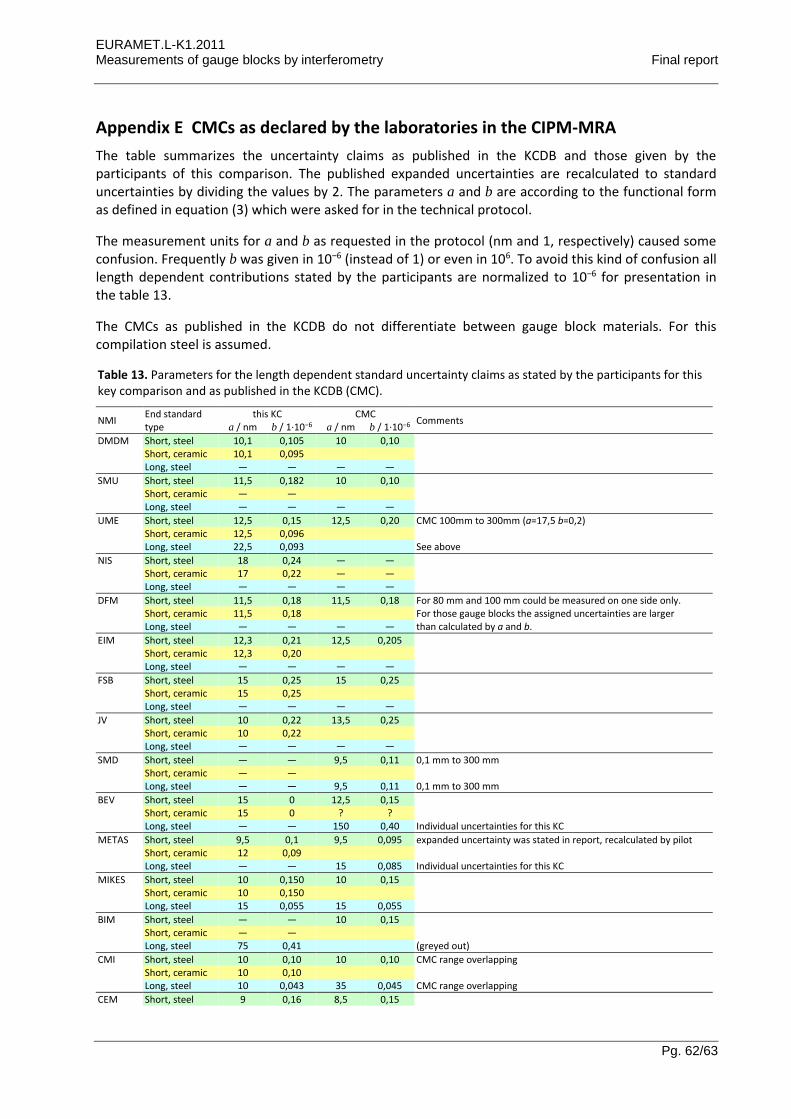
EURAMET.L-K1.2011 Measurements of gauge blocks by interferometry Final report
Pg. 62/63
Appendix E CMCs as declared by the laboratories in the CIPM-MRA
The table summarizes the uncertainty claims as published in the KCDB and those given by the participants of this comparison. The published expanded uncertainties are recalculated to standard uncertainties by dividing the values by 2. The parameters a and b are according to the functional form as defined in equation (3) which were asked for in the technical protocol.
The measurement units for a and b as requested in the protocol (nm and 1, respectively) caused some confusion. Frequently b was given in 10‒6 (instead of 1) or even in 106. To avoid this kind of confusion all length dependent contributions stated by the participants are normalized to 10‒6 for presentation in the table 13.
The CMCs as published in the KCDB do not differentiate between gauge block materials. For this compilation steel is assumed.
Table 13. Parameters for the length dependent standard uncertainty claims as stated by the participants for this key comparison and as published in the KCDB (CMC).
NMI End standard type
this KC CMC Comments
a / nm b / 1·10−6 a / nm b / 1·10−6
DMDM Short, steel 10,1 0,105 10 0,10 Short, ceramic 10,1 0,095 Long, steel ― ― ― ―
SMU Short, steel 11,5 0,182 10 0,10 Short, ceramic ― ― Long, steel ― ― ― ―
UME Short, steel 12,5 0,15 12,5 0,20 CMC 100mm to 300mm (a=17,5 b=0,2) Short, ceramic 12,5 0,096 Long, steel 22,5 0,093 See above
NIS Short, steel 18 0,24 ― ― Short, ceramic 17 0,22 ― ― Long, steel ― ― ― ―
DFM Short, steel 11,5 0,18 11,5 0,18 For 80 mm and 100 mm could be measured on one side only. Short, ceramic 11,5 0,18 For those gauge blocks the assigned uncertainties are larger Long, steel ― ― ― ― than calculated by a and b.
EIM Short, steel 12,3 0,21 12,5 0,205 Short, ceramic 12,3 0,20 Long, steel ― ― ― ―
FSB Short, steel 15 0,25 15 0,25 Short, ceramic 15 0,25 Long, steel ― ― ― ―
JV Short, steel 10 0,22 13,5 0,25 Short, ceramic 10 0,22 Long, steel ― ― ― ―
SMD Short, steel ― ― 9,5 0,11 0,1 mm to 300 mm Short, ceramic ― ― Long, steel ― ― 9,5 0,11 0,1 mm to 300 mm
BEV Short, steel 15 0 12,5 0,15 Short, ceramic 15 0 ? ? Long, steel ― ― 150 0,40 Individual uncertainties for this KC
METAS Short, steel 9,5 0,1 9,5 0,095 expanded uncertainty was stated in report, recalculated by pilot Short, ceramic 12 0,09 Long, steel ― ― 15 0,085 Individual uncertainties for this KC
MIKES Short, steel 10 0,150 10 0,15 Short, ceramic 10 0,150 Long, steel 15 0,055 15 0,055
BIM Short, steel ― ― 10 0,15 Short, ceramic ― ― Long, steel 75 0,41 (greyed out)
CMI Short, steel 10 0,10 10 0,10 CMC range overlapping Short, ceramic 10 0,10 Long, steel 10 0,043 35 0,045 CMC range overlapping
CEM Short, steel 9 0,16 8,5 0,15
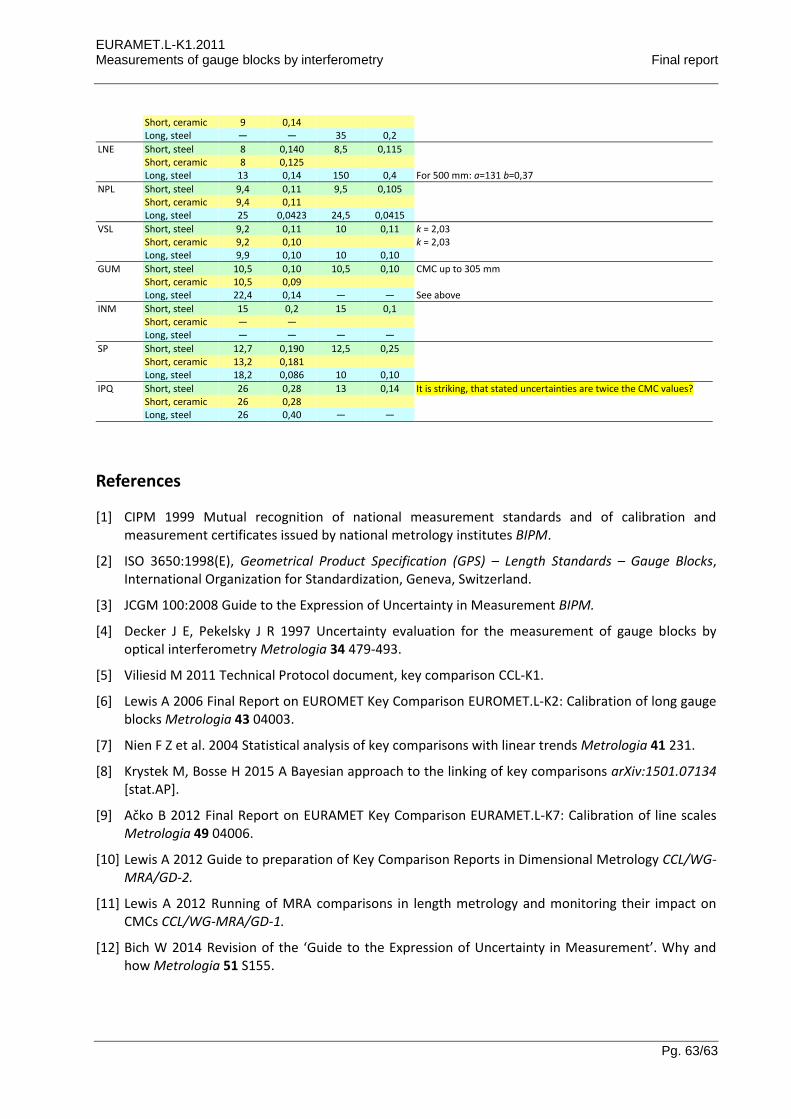
EURAMET.L-K1.2011 Measurements of gauge blocks by interferometry Final report
Pg. 63/63
Short, ceramic 9 0,14 Long, steel ― ― 35 0,2
LNE Short, steel 8 0,140 8,5 0,115 Short, ceramic 8 0,125 Long, steel 13 0,14 150 0,4 For 500 mm: a=131 b=0,37
NPL Short, steel 9,4 0,11 9,5 0,105 Short, ceramic 9,4 0,11 Long, steel 25 0,0423 24,5 0,0415
VSL Short, steel 9,2 0,11 10 0,11 k = 2,03 Short, ceramic 9,2 0,10 k = 2,03 Long, steel 9,9 0,10 10 0,10
GUM Short, steel 10,5 0,10 10,5 0,10 CMC up to 305 mm Short, ceramic 10,5 0,09 Long, steel 22,4 0,14 ― ― See above
INM Short, steel 15 0,2 15 0,1 Short, ceramic ― ― Long, steel ― ― ― ―
SP Short, steel 12,7 0,190 12,5 0,25 Short, ceramic 13,2 0,181 Long, steel 18,2 0,086 10 0,10
IPQ Short, steel 26 0,28 13 0,14 It is striking, that stated uncertainties are twice the CMC values? Short, ceramic 26 0,28 Long, steel 26 0,40 ― ―
References
[1] CIPM 1999 Mutual recognition of national measurement standards and of calibration and measurement certificates issued by national metrology institutes BIPM.
[2] ISO 3650:1998(E), Geometrical Product Specification (GPS) – Length Standards – Gauge Blocks, International Organization for Standardization, Geneva, Switzerland.
[3] JCGM 100:2008 Guide to the Expression of Uncertainty in Measurement BIPM.
[4] Decker J E, Pekelsky J R 1997 Uncertainty evaluation for the measurement of gauge blocks by optical interferometry Metrologia 34 479-493.
[5] Viliesid M 2011 Technical Protocol document, key comparison CCL-K1.
[6] Lewis A 2006 Final Report on EUROMET Key Comparison EUROMET.L-K2: Calibration of long gauge blocks Metrologia 43 04003.
[7] Nien F Z et al. 2004 Statistical analysis of key comparisons with linear trends Metrologia 41 231.
[8] Krystek M, Bosse H 2015 A Bayesian approach to the linking of key comparisons arXiv:1501.07134 [stat.AP].
[9] Ačko B 2012 Final Report on EURAMET Key Comparison EURAMET.L-K7: Calibration of line scales Metrologia 49 04006.
[10] Lewis A 2012 Guide to preparation of Key Comparison Reports in Dimensional Metrology CCL/WG-MRA/GD-2.
[11] Lewis A 2012 Running of MRA comparisons in length metrology and monitoring their impact on CMCs CCL/WG-MRA/GD-1.
[12] Bich W 2014 Revision of the ‘Guide to the Expression of Uncertainty in Measurement’. Why and how Metrologia 51 S155.