Embed Size (px)
Citation preview
1
Final report for PSO project 2008-1-0065, SOFC R&D II Compiled by Mogens Mogensen, scientific/technical responsible project manager, Fuels Cells and Solid State Chemistry Division, Risø DTU Contributing scientists from Fuel Cells and Solid State Chemistry Division, Risø DTU: Nikolaos Bonanos, Sune D. Ebbesen, Henrik Lund Frandsen, Anke Hagen, Karin Vels Hansen, Anne Hauch, Per Hjalmarsson, Johan Hjelm, Mohammed H. A. Jabbar, Andreas Kaiser, Wolff-Ragnar Kiebach, Ruth Knibbe, Yi-Lin Liu, Kai Neufeld, Jimmi Nielsen, Mikko Pihlatie, Tânia Ramos, Alfred Junio Samson, Karl Thydén, Hsiang-Jen (Jason) Wang. Contributing scientists from IRD Fuel Cells A/S: Laila Grahl-Madsen, Bertil Sieborg.
Content: 1. Introduction .............................................................................................................2 2. Milestone reports ...................................................................................................50 3. Conclusions ...........................................................................................................69 4. List of publication from the present project ..........................................................69

2
1. Introduction The project started July 1st, 2008, and ended June 30th, 2010. The headings of the scientific and technical activities of the project were: 1) Improvement of electrochemical characterization. 2) Development of materials and structures. 3) Effect of additives in controlling detrimental segregation and agglomeration. 4) Performance and durability tests of cells. 5) Modelling. 6) Improvement of fabrication of sealing. The milestone list was changed, i.e. the original milestone 7 (Detailed electrochemical characterization (impedance spectroscopy) of an all ceramic cell performed.) was abandoned with approval from Energinet.dk during the project. The revised milestone list is:
Milestones: 1. 4 test set-ups fully automated. Date: 2009-03-31. 2. All 8 test set-ups fully automated. Date: 2010-06-30 3. Three new improved electrodes fabricated. Date: 2009-03-31. 4. Two additives resulting in improved electrode performance identified. Date: 2008-10-31. 5. Evaluation of deposition methods for manufacturing of 2G cells (screen printing, lamination
vs. spraying) finished. Date: 2009-02-28. 6. Detailed electrochemical characterization (impedance spectroscopy) of improved 2G cells
performed. Date: 2009-04-15. 7. Redox stability of cells with normal 2G-type anode compared to an improved 2G type cell.
Date: 2010-06-30 8. Three 1500 hour tests with impurity containing fuels performed. Date: 2010-03-31 9. Four long-term tests on 2.XG cell generations at 650 C performed and microstructure
studied. Date: 2010-06-30 10. Effect of humidity on performance and durability studied on different cathodes, and limits of
safe operation defined. Date: 2010-02-28 11. Detailed electrochemical characterization of metal supported cell. Date: 2010-01-15. 12. One 1500 hours long-term test of metal supported cell done. Date: 2010-06-30 13. Seal glasses for low temperature sealing identified. Date: 2010-02-15 14. A simple seal fabrication route developed. Date: 2010-03-15 15. The target values on leakage rates of 0.1 cm3/min for single cells obtained for the fabricated
seals. Date: 2010-03-31. The milestone reports are presented below in numerical order. Thereafter, the outcome of the project is summarized with conclusions. Finally, a list of publications from the present project is given.
3
2. Milestone reports Report on milestones 1 and 2: First 4 and then all 8 test set-ups fully automated. During 2008 an activity for increasing the automation of Risø National Laboratory’s SOFC test rigs and associated equipment was initiated. As SOFC testing involves relatively long measurement and equilibration periods, and due to the costly nature of high temperature testing, it is essential that the test rigs can be operated 24 h a day, unattended by operators. Further, it is important that highly sensitive measurements can be carried out at the conditions the operator may desire to use during the automated test run. In this effort a number of improvements were first tested out in one rig during 2008
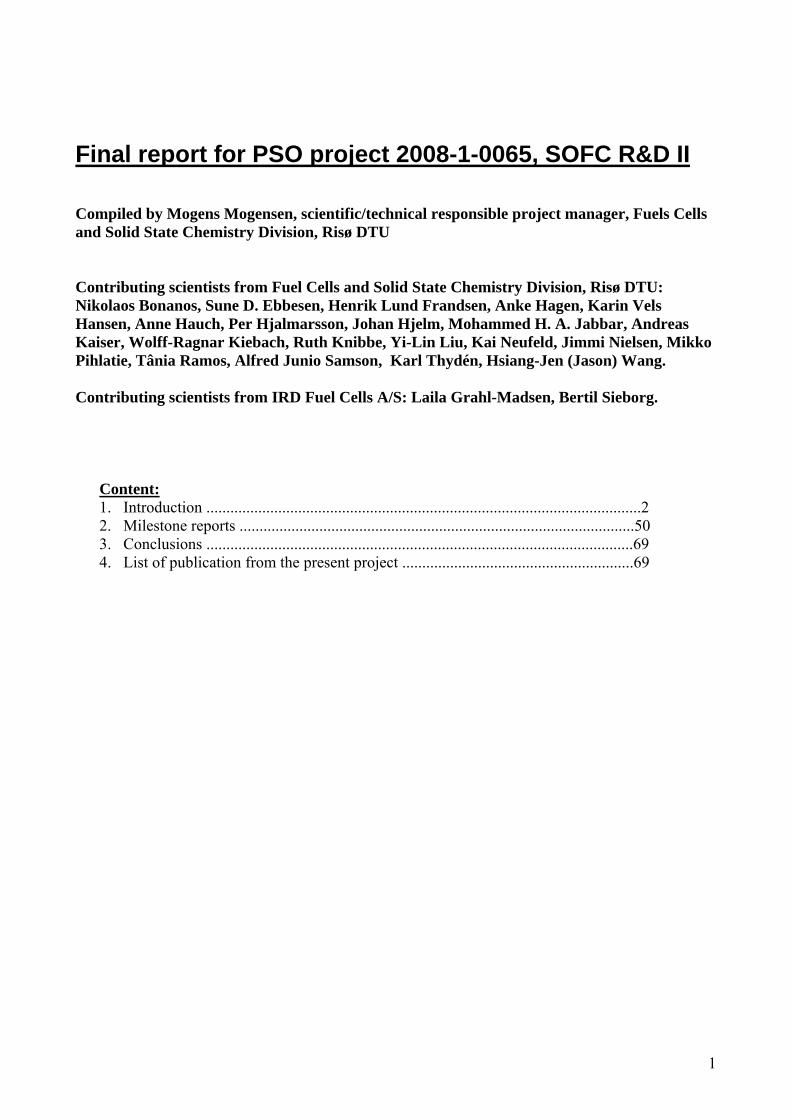
Full automation of cell test rig no. 14, so that gas composition variations can be carried out in an automated fashion on both anode and cathode side. Anode side saturator humidification system can be switched on and off automatically, see the schematic piping and instrumentation diagram (P&ID) in Figure 1.
Computer controlled automatic DC (direct current) voltage compensation electronics have been designed, constructed, and implemented on some of the mobile electrochemical impedance analyzers that are used for characterization of SOFC, allowing automated impedance measurements at any cell voltage (i.e. at any fuel or oxidant gas composition)
The increased automation with changes equivalent to those implemented on rig 14 was carried out for 3 more cell test rigs during the first quarter of 2009, and for some rigs also automated switching on/off of a saturator type humidification system for the fuel and oxidant gas was made.. The changes improved test efficiency and allowed many more test points to be executed during a single cell test. Figure 1. Schematic P&ID diagram over rig 14. Added/automated parts are indicated by blue dotted lines. Some rigs got an additional water vapour saturator flask mounted on the cathode gas line, in order to facilitate investigations of the effect of water in the oxidant gas on the cell performance.
H2OTC
NONO
NCNC
NCNC
NONO
NCNC
NCNC
MFC 1
MFC 2
MFC 3
CH4
CO2
H2
9% H2/N2
O2
Anode Inlet 2”Hydrogen”
Anode Inlet 1”Oxygen”
NONO
NCNCMFC 4O2
airNONO
NCNC
NONO
SB
MFC #
NCNC
NONO
TC
= Non-return valve
= Flow-regulating valve,electrically controlled
= Two-way solenoid valve,Normally Open
= Flow-regulating valve,manually controlled
= Two-way solenoid valve,Normally Closed
= Thermocouple
= Two-way valve (on/off)manually controlled
NCNCMFC 5N2
Anode Inlet 3”Methane”
N2
CathodeInlet 1
4
During the first half year of 2010 the work with automation of the remaining test rigs has been completed, although delayed with respect to the original plan due to the added workload caused by the move of all single-cell and stack test rigs to a new laboratory building. The following 8 test rigs have been rendered fully automated (rigs 1, 2, 6, 11, 12, 13, 14, and 15). The implemented features include:
- automatic switching on/off of saturator humidifier bottles for both fuel and oxidant gases. - automatic switching between air-nitrogen and oxygen-nitrogen mixtures as the oxidant gas,
which allows oxygen partial pressure variations over two orders of magnitude (~ 1% - 100% O2) – a valuable feature for establishing the internal resistance contribution from the oxygen electrode in a Solid Oxide Cell
- automatic dc voltage compensation for the impedance equipment used – allowing automated impedance measurements at any cell voltage (i.e. at various fuel and oxidant gas compositions, and under various dc load levels)
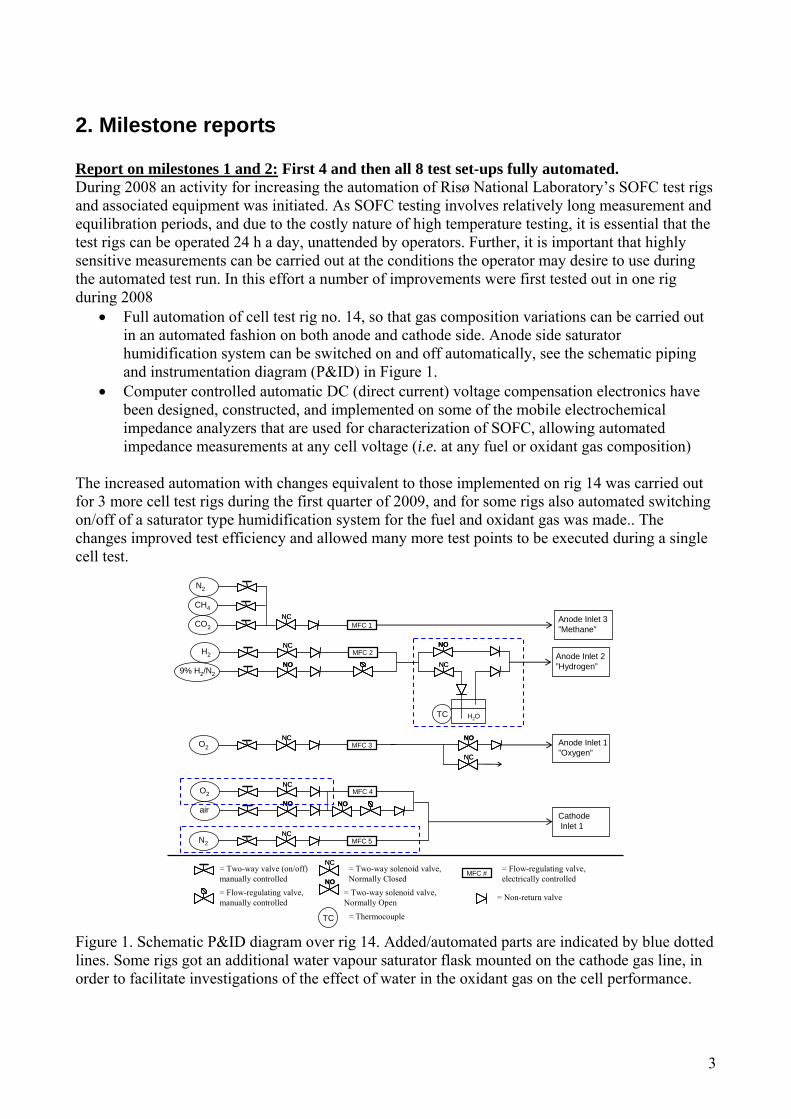
Further, two multiplexers have been installed so that a single impedance measurement unit can serve up to eight test rigs with automated impedance measurements during long-term durability tests, a feature which will greatly assist in future durability studies. An example of the outcome of an automated test sequence is shown below in Figure 2.
Figure 2: Overview of measured key test parameters during a cell test run with an upgraded test rig with fully automated test sequences (controlled by in-house software that allows scripting) and data control and acquisition. The test object was a 3G SOFC cell, with leak testing, performance characterization, and detailed studies at varying fuel and oxidant gas compositions, and under various dc load levels. Report on milestone 3: Three new improved electrodes fabricated. This development is in part based on results from a recent Ph.D.-project at Risø DTU. SrO doped LaCoO3 (LSC) is known to be one of the best cathode materials, and therefore work is carried out on studying and improving LSC and LSC/CGO cathodes. Furthermore, new interesting composite cathodes of the type LaCo0.4Ni0.6O3 / Ce1.9Gd0.1O1.95 (LCN60/CGO) are being fabricated and

5
characterized. This cathode has also been infiltrated with La0.6Sr0.4CoO3 (LSC) and/or CGO to possibly decrease the electrode resistance further. A number of LSC and LSC/CGO cathodes have been developed, and Figure 1 shows the results for two of them. The pure LSC shows better performance at high temperature due to its high catalytic activity and mixed conducting properties. Below 500 C it loses it ionic conductivity, which explains its higher activation energy as compared to the composite LSC/CGO cathode in which CGO maintains the ionic conductivity at low temperatures. Both these cathodes have been integrated in full cells with very promising results.
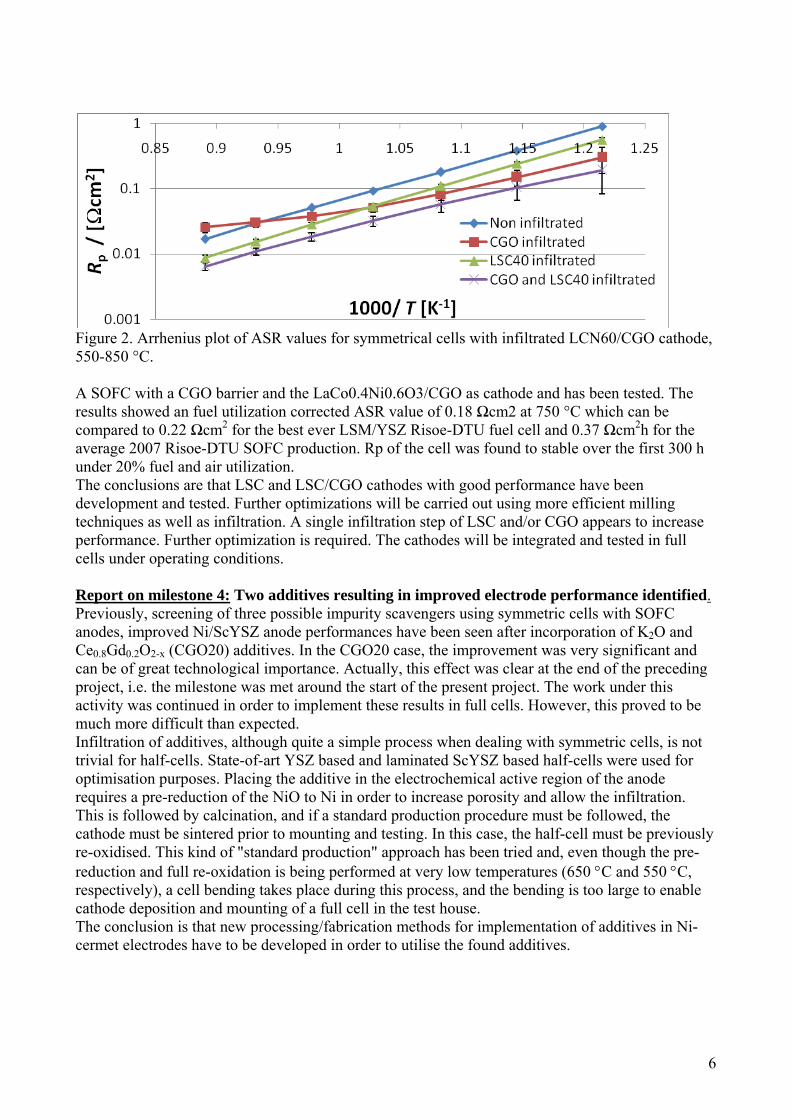
Figure 1. Arrhenius plots of one LSC and one LSC/CGO cathode. Figure 2 shows the polarization resistance of symmetrical cells with differently infiltrated LCN60/CGO cathodes. Already the LCN60/CGO cathode shows good performance with about 92 Ωcm2 at 700 °C and open circuit voltage (OCV). This was reduced to about 51, 55 and 32 Ωcm2 with infiltrated with CGO, LSC and LSC/CGO respectively. The deviation from Arrhenius behaviour at high temperature for the CGO infiltrated electrode is related to diffusion as the electrode microstructure was found to be too dense. The LSC infiltration was found to be insufficient, and thus optimization of the method is still required in order to improve performance further. The temperature dependence was left relatively unchanged by the infiltration, indicating no major change in reaction mechanism.
6
Figure 2. Arrhenius plot of ASR values for symmetrical cells with infiltrated LCN60/CGO cathode, 550-850 °C. A SOFC with a CGO barrier and the LaCo0.4Ni0.6O3/CGO as cathode and has been tested. The results showed an fuel utilization corrected ASR value of 0.18 Ωcm2 at 750 °C which can be compared to 0.22 Ωcm2 for the best ever LSM/YSZ Risoe-DTU fuel cell and 0.37 Ωcm2h for the average 2007 Risoe-DTU SOFC production. Rp of the cell was found to stable over the first 300 h under 20% fuel and air utilization. The conclusions are that LSC and LSC/CGO cathodes with good performance have been development and tested. Further optimizations will be carried out using more efficient milling techniques as well as infiltration. A single infiltration step of LSC and/or CGO appears to increase performance. Further optimization is required. The cathodes will be integrated and tested in full cells under operating conditions. Report on milestone 4: Two additives resulting in improved electrode performance identified. Previously, screening of three possible impurity scavengers using symmetric cells with SOFC anodes, improved Ni/ScYSZ anode performances have been seen after incorporation of K2O and Ce0.8Gd0.2O2-x (CGO20) additives. In the CGO20 case, the improvement was very significant and can be of great technological importance. Actually, this effect was clear at the end of the preceding project, i.e. the milestone was met around the start of the present project. The work under this activity was continued in order to implement these results in full cells. However, this proved to be much more difficult than expected. Infiltration of additives, although quite a simple process when dealing with symmetric cells, is not trivial for half-cells. State-of-art YSZ based and laminated ScYSZ based half-cells were used for optimisation purposes. Placing the additive in the electrochemical active region of the anode requires a pre-reduction of the NiO to Ni in order to increase porosity and allow the infiltration. This is followed by calcination, and if a standard production procedure must be followed, the cathode must be sintered prior to mounting and testing. In this case, the half-cell must be previously re-oxidised. This kind of "standard production" approach has been tried and, even though the pre-reduction and full re-oxidation is being performed at very low temperatures (650 C and 550 C, respectively), a cell bending takes place during this process, and the bending is too large to enable cathode deposition and mounting of a full cell in the test house. The conclusion is that new processing/fabrication methods for implementation of additives in Ni-cermet electrodes have to be developed in order to utilise the found additives.
7
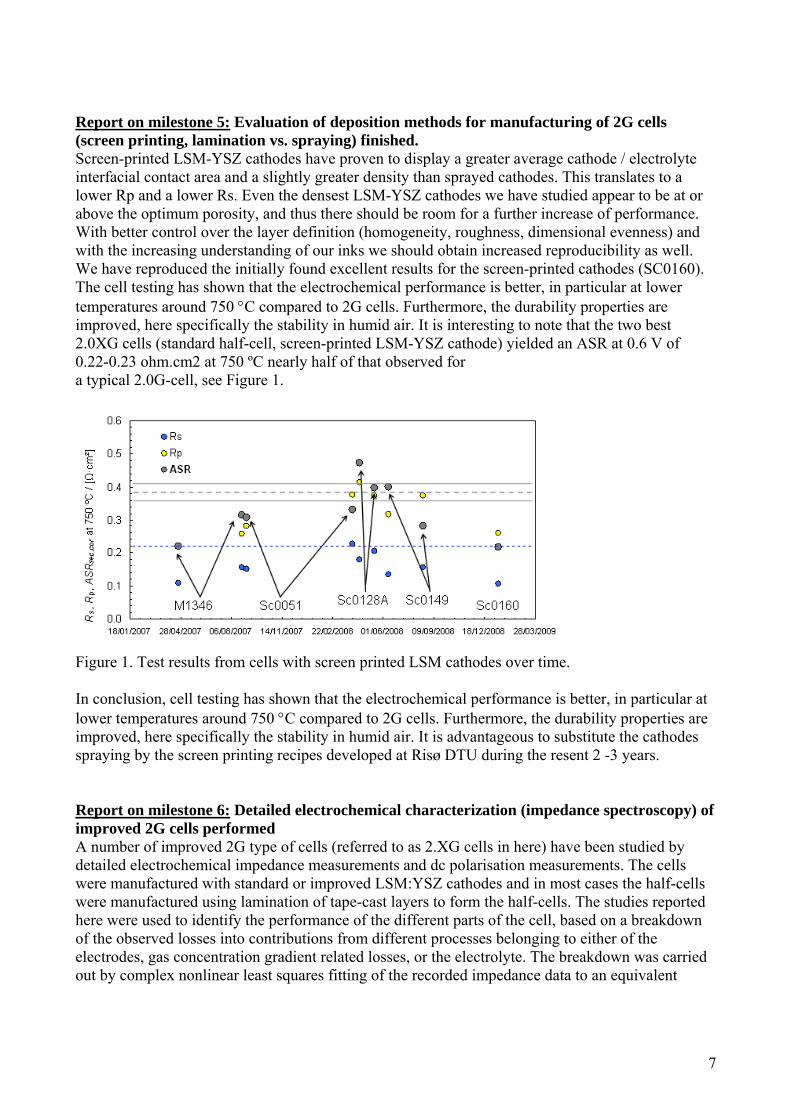
Report on milestone 5: Evaluation of deposition methods for manufacturing of 2G cells (screen printing, lamination vs. spraying) finished. Screen-printed LSM-YSZ cathodes have proven to display a greater average cathode / electrolyte interfacial contact area and a slightly greater density than sprayed cathodes. This translates to a lower Rp and a lower Rs. Even the densest LSM-YSZ cathodes we have studied appear to be at or above the optimum porosity, and thus there should be room for a further increase of performance. With better control over the layer definition (homogeneity, roughness, dimensional evenness) and with the increasing understanding of our inks we should obtain increased reproducibility as well. We have reproduced the initially found excellent results for the screen-printed cathodes (SC0160). The cell testing has shown that the electrochemical performance is better, in particular at lower temperatures around 750 C compared to 2G cells. Furthermore, the durability properties are improved, here specifically the stability in humid air. It is interesting to note that the two best 2.0XG cells (standard half-cell, screen-printed LSM-YSZ cathode) yielded an ASR at 0.6 V of 0.22-0.23 ohm.cm2 at 750 ºC nearly half of that observed for a typical 2.0G-cell, see Figure 1.
Figure 1. Test results from cells with screen printed LSM cathodes over time. In conclusion, cell testing has shown that the electrochemical performance is better, in particular at lower temperatures around 750 C compared to 2G cells. Furthermore, the durability properties are improved, here specifically the stability in humid air. It is advantageous to substitute the cathodes spraying by the screen printing recipes developed at Risø DTU during the resent 2 -3 years. Report on milestone 6: Detailed electrochemical characterization (impedance spectroscopy) of improved 2G cells performed A number of improved 2G type of cells (referred to as 2.XG cells in here) have been studied by detailed electrochemical impedance measurements and dc polarisation measurements. The cells were manufactured with standard or improved LSM:YSZ cathodes and in most cases the half-cells were manufactured using lamination of tape-cast layers to form the half-cells. The studies reported here were used to identify the performance of the different parts of the cell, based on a breakdown of the observed losses into contributions from different processes belonging to either of the electrodes, gas concentration gradient related losses, or the electrolyte. The breakdown was carried out by complex nonlinear least squares fitting of the recorded impedance data to an equivalent

8
circuit model with a slightly relaxed set of constraints. The procedure produced reliable results of diagnostic quality. Examples of key results are shown in figures 1 and 2 below.
8,245 Hz824.5 Hz
82.45 Hz 8.245Hz
0.8245 Hz0.00
0.05
0.10
0.15
0.05 0.10 0.15 0.20 0.25 0.30 0.35 0.40 0.45 0.50 0.55 0.60
Z' [ cm2]
-Z''
[ c
m2 ]
Fit
Cat I
Ano I
Cat II
Dif/Conv
13test54
Rs = 0.10 cm2; RCat = 0.16 cm2; RAno = 0.09 cm2; RCat/RAno = 1.81
Ni/ScYSZ anode; ScYSZ electrolyte; LSM-YSZ cathode; Sintered < 1300 C
Figure 1: Breakdown of losses for a laminated 2.XG cell with an old screen-printed LSM:YSZ cathode based on ink SC0051.
8,254 Hz
825.4 Hz
82.54 Hz
8.254 Hz
0.00
0.05
0.10
0.15
0.05 0.10 0.15 0.20 0.25 0.30 0.35 0.40 0.45 0.50 0.55 0.60
Z' [cm2]
-Z''
[ c
m2 ]
Fit
Cat I
Ano I
Cat II
Dif/Conv
14test84
Rs = 0.08 cm2; RCat = 0.09 cm2; RAno = 0.14 cm2; RCat/RAno = 0.64
Ni/ScYSZ/CGO anode; ScYSZ electrolyte; LSM-YSZ cathode; Sintered < 1300 C
Figure 2. Breakdown of losses for a laminated 2.XG cell with an new screen-printed LSM:YSZ cathode based on an ink corresponding to SC0160 and with CGO particles added to the anode. As is clearly demonstrated in figure 1 and 2 the cell with a new and improved LSM:YSZ cathode yields smaller contributions to the overall impedance (Cat I and Cat II contributions smaller in figure 2 than in figure 1). This observation was further strengthened by dc polarisation measurements outlined below. The increased degree of automation of the SOFC test rigs has led to much improved possibilities for standardisation of testing and inclusion of a greater number of test conditions in each test. An example of the benefits of this is highlighted in Figure 3. The data in the graph is obtained by taking the difference in ASR (at 600 mV) between measurements carried out under identical anode conditions but with an oxygen partial pressure of 0.21 and 1.00 atm. at the cathode. This difference is proportional to the magnitude of the cathode contribution to the total cell resistance, and thus is a measure of cathode performance under strong polarisation.

9
0
0.1
0.2
0.3
0.4
0.5
650 700 750 800 850
ΔASRsec,min/ Ω∙cm²
T / [°C]
12test40 ‐ 2G Production Cell (2008)
14test84 ‐ screen‐printed cathode on laminated 2.XG cell
14test79 ‐ sprayed LSM:YSZ cathode on laminated 2.XG cell
Figure 3. ΔASRsec,min is difference in the secant ASR (fuel utilisation corrected) determined at a cell voltage of 600 mV with oxygen or air over the cathode. The small difference in OCV between these measurements is constant for all the different cells, and thus the difference in ASR is proportional to the magnitude of the cathode contribution to the overall cell resistance for each cell. It is clear from this data that the sprayed cathode on the two different half-cells (a traditional cell and the laminated 2.XG half-cell) is showing a similar resistance under electrical load, while the cell with the improved screen-printed cathode displays a significantly reduced resistance, which agrees well with the impedance data collected at OCV. Report on Milestone 7: Redox stability of cells with normal 2G-type anode compared to an improved 2G type cell. The lab-scale manufacturing of a new generation of anode supported half-cells, with expected improved redox-stability, has been achieved by co-sintering. Improving the redox-stability of the anode supported cells required a change in microstructure of the anode support itself, which resulted in slightly lower total support shrinkage and a change in the shrinkage profile. A better matching of the shrinkage profile between the new anode support and the electrolyte layer was necessary to achieve half-cells with a defect-free and dense electrolyte layer. The first redox test of a modified cell has been performed, with promising results. Figure 1 shows the total cell resistance as a function of exposure time for 3 tests. The cells were subjected to a series of 11 redox cycles at the nominal temperature of 750 ºC, with air exposure times varied gradually between 2 min and 60 min (2x). This was followed by a repetition of the cycles at the nominal temperature of 800 ºC. At the highest temperature, the cell broke after only 4 redox cycles. However, when compared to a common Risø DTU cell, subjected to the same test protocol, the series and polarization resistances of the modified cell suffered significantly less degradation (Figure 1). If the results are compared at the end of the 11 cycles, at 750 ºC, the Rs of the modified cell increased by a factor of 8, whereas a factor of 22 was determined for the common cell. In terms of Rp, the modified cell showed no degradation, whereas the common cell exhibited a Rp which increased by a factor of ~4. The absolute values are still too high for some SOFC applications. However, the modifications performed to the cell impacted beneficially the redox stability. Further modifications are envisaged, namely on the anode layer, and the possibility of developing a more robust cell against redox in the near future should be further pursued.

10
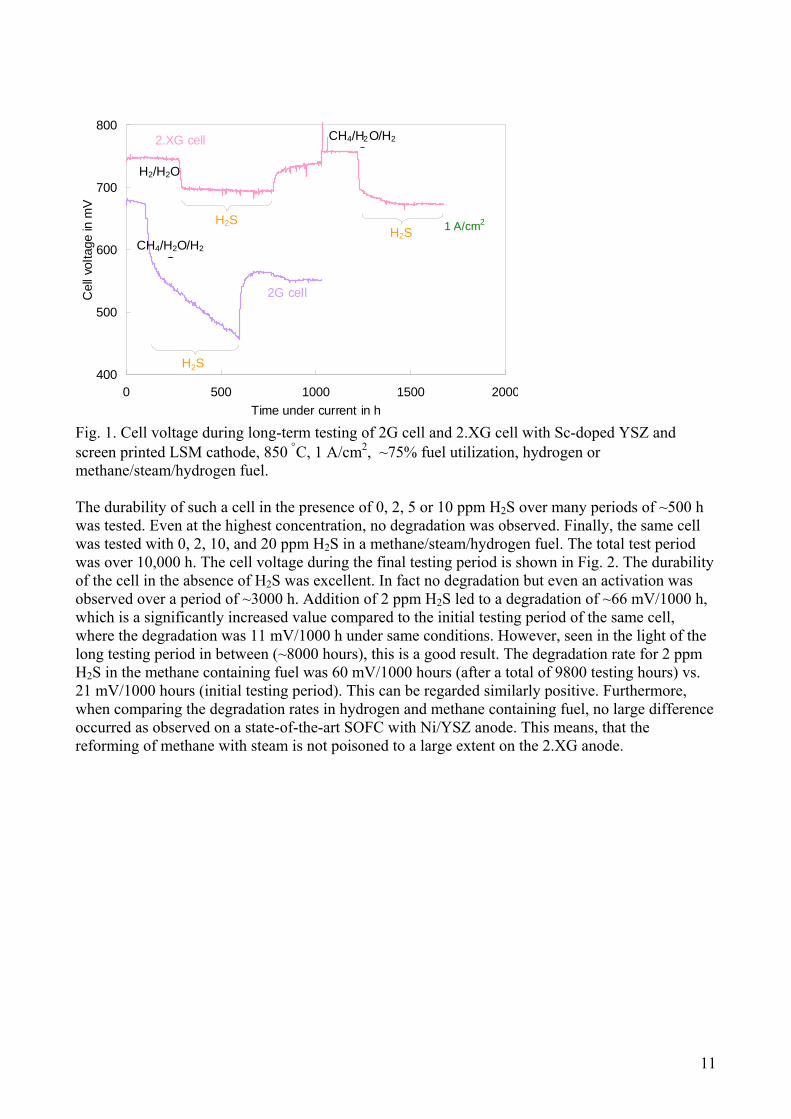
Figure 1. Cell resistance as a function of time of Ni-cermet exposure to air at 750 C for a 2G cell and two improved 2G type cells. Report on Milestone 8: Three 1500 hour tests with impurity containing fuels performed. Durability of improved 2G cells with regard to sulphur tolerance. Sulphur is known to poison Ni/YSZ anodes of state-of-the-art SOFCs. In particular, when methane containing fuel is used, reforming of methane with steam to CO and hydrogen is severely suppressed, even at low H2S concentrations of 2 ppm. It is necessary to improve the sulphur tolerance as sulphur compounds are often contained in attractive fuels for SOFCs such as biogas or fuel from catalytic partial oxidation of diesel. More sulphur tolerant anodes – based on scandia and yttria doped zirconia (ScYSZ) – have been developed in the preceding projects and implemented in full cells called 2.XG cells. The function of the anode and anode support is, in addition to the electrochemical reactions, to catalyze the methane reforming to CO and hydrogen; both processes may be affected by the presence of sulphur. In Fig. 1, the cell voltage is shown over time. There were two long-term test periods on the 2.XG cell, one in hydrogen fuel (only hydrogen oxidation on anode) and one in the methane/steam/hydrogen mixture (reforming of methane plus hydrogen / CO oxidation at the anode), both under presence of H2S for periods of ~500 h. Firstly, the 2.XG cell performed better than the 2G cell. Secondly, while the 2G cell already degraded when the methane/steam/hydrogen fuel mixture was applied and even more after the addition of 2 ppm H2S. The 2.XG cell in contrast did not degrade in the absence of H2S and only very little in the presence of 2 ppm H2S.
11
400
500
600
700
800
0 500 1000 1500 2000
Time under current in h
Cel
l vol
tage
in m
V
1 A/cm2H2SH2S
H2S
2G cell
2.XG cell
CH4/H2O/H2
O
CH4/H2O/H2
O
H2/H2O
Fig. 1. Cell voltage during long-term testing of 2G cell and 2.XG cell with Sc-doped YSZ and screen printed LSM cathode, 850 C, 1 A/cm2, ~75% fuel utilization, hydrogen or methane/steam/hydrogen fuel. The durability of such a cell in the presence of 0, 2, 5 or 10 ppm H2S over many periods of ~500 h was tested. Even at the highest concentration, no degradation was observed. Finally, the same cell was tested with 0, 2, 10, and 20 ppm H2S in a methane/steam/hydrogen fuel. The total test period was over 10,000 h. The cell voltage during the final testing period is shown in Fig. 2. The durability of the cell in the absence of H2S was excellent. In fact no degradation but even an activation was observed over a period of ~3000 h. Addition of 2 ppm H2S led to a degradation of ~66 mV/1000 h, which is a significantly increased value compared to the initial testing period of the same cell, where the degradation was 11 mV/1000 h under same conditions. However, seen in the light of the long testing period in between (~8000 hours), this is a good result. The degradation rate for 2 ppm H2S in the methane containing fuel was 60 mV/1000 hours (after a total of 9800 testing hours) vs. 21 mV/1000 hours (initial testing period). This can be regarded similarly positive. Furthermore, when comparing the degradation rates in hydrogen and methane containing fuel, no large difference occurred as observed on a state-of-the-art SOFC with Ni/YSZ anode. This means, that the reforming of methane with steam is not poisoned to a large extent on the 2.XG anode.
12
0
200
400
600
800
1000
1200
9000 9500 10000 10500
Time under current in h
Cel
l vol
tage
in m
V
0 ppm 2 ppm
2 ppm10 ppm
H2/H2O
20 ppm
H2/CH4/H2O
H2S
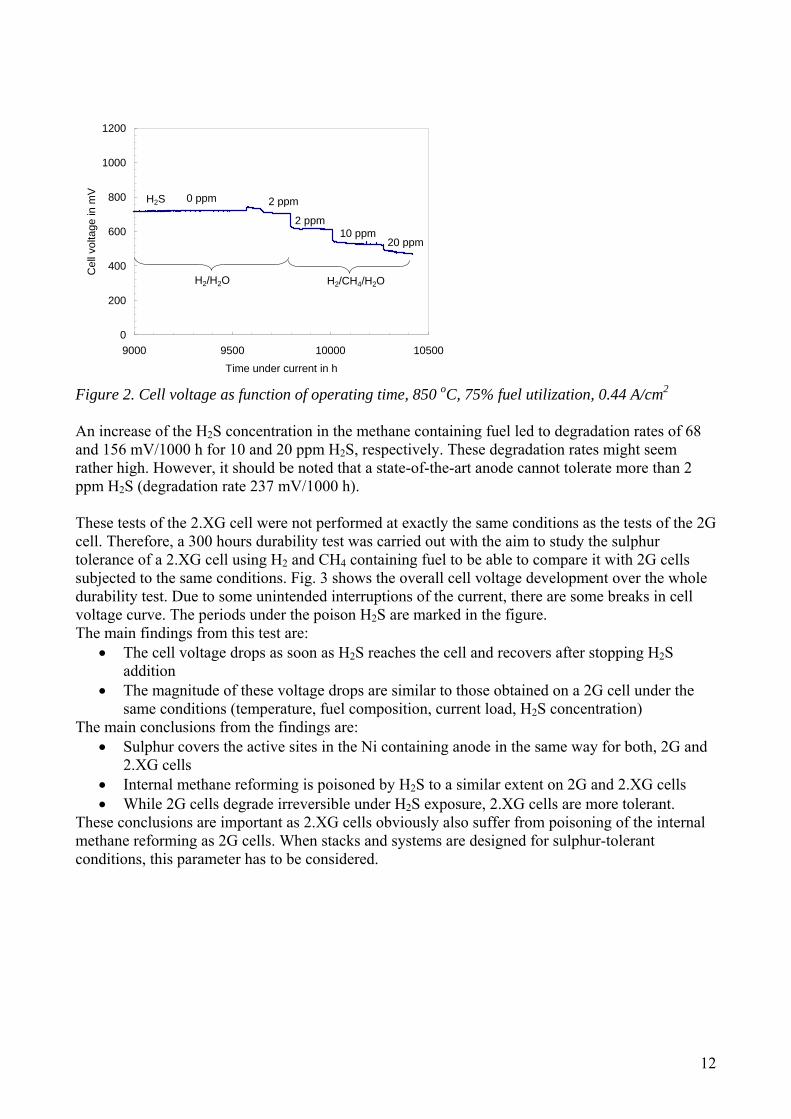
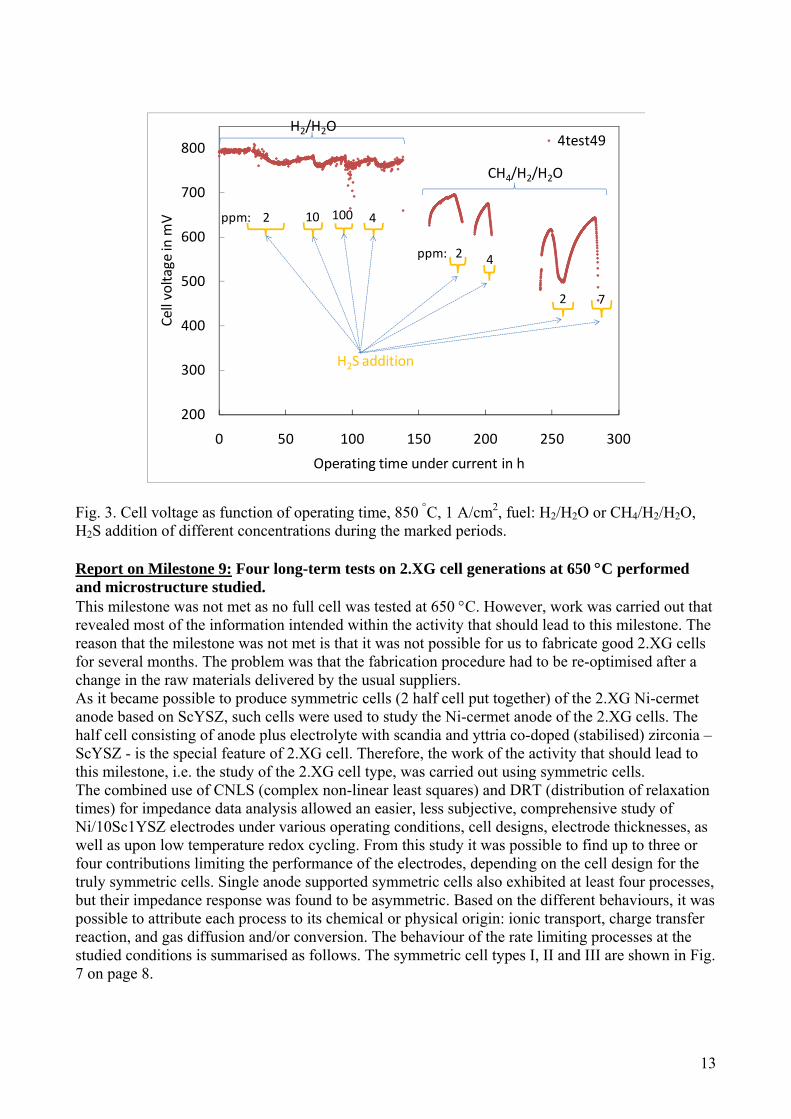
Figure 2. Cell voltage as function of operating time, 850 oC, 75% fuel utilization, 0.44 A/cm2 An increase of the H2S concentration in the methane containing fuel led to degradation rates of 68 and 156 mV/1000 h for 10 and 20 ppm H2S, respectively. These degradation rates might seem rather high. However, it should be noted that a state-of-the-art anode cannot tolerate more than 2 ppm H2S (degradation rate 237 mV/1000 h). These tests of the 2.XG cell were not performed at exactly the same conditions as the tests of the 2G cell. Therefore, a 300 hours durability test was carried out with the aim to study the sulphur tolerance of a 2.XG cell using H2 and CH4 containing fuel to be able to compare it with 2G cells subjected to the same conditions. Fig. 3 shows the overall cell voltage development over the whole durability test. Due to some unintended interruptions of the current, there are some breaks in cell voltage curve. The periods under the poison H2S are marked in the figure. The main findings from this test are:
The cell voltage drops as soon as H2S reaches the cell and recovers after stopping H2S addition
The magnitude of these voltage drops are similar to those obtained on a 2G cell under the same conditions (temperature, fuel composition, current load, H2S concentration)
The main conclusions from the findings are: Sulphur covers the active sites in the Ni containing anode in the same way for both, 2G and
2.XG cells Internal methane reforming is poisoned by H2S to a similar extent on 2G and 2.XG cells While 2G cells degrade irreversible under H2S exposure, 2.XG cells are more tolerant.
These conclusions are important as 2.XG cells obviously also suffer from poisoning of the internal methane reforming as 2G cells. When stacks and systems are designed for sulphur-tolerant conditions, this parameter has to be considered.
13
200
300
400
500
600
700
800
0 50 100 150 200 250 300
Cell voltage in m
V
Operating time under current in h
4test49
H2S addition
H2/H2O
CH4/H2/H2O
ppm: 2 10 100 4
ppm: 2 4
2 7
Fig. 3. Cell voltage as function of operating time, 850 C, 1 A/cm2, fuel: H2/H2O or CH4/H2/H2O, H2S addition of different concentrations during the marked periods. Report on Milestone 9: Four long-term tests on 2.XG cell generations at 650 C performed and microstructure studied. This milestone was not met as no full cell was tested at 650 C. However, work was carried out that revealed most of the information intended within the activity that should lead to this milestone. The reason that the milestone was not met is that it was not possible for us to fabricate good 2.XG cells for several months. The problem was that the fabrication procedure had to be re-optimised after a change in the raw materials delivered by the usual suppliers. As it became possible to produce symmetric cells (2 half cell put together) of the 2.XG Ni-cermet anode based on ScYSZ, such cells were used to study the Ni-cermet anode of the 2.XG cells. The half cell consisting of anode plus electrolyte with scandia and yttria co-doped (stabilised) zirconia – ScYSZ - is the special feature of 2.XG cell. Therefore, the work of the activity that should lead to this milestone, i.e. the study of the 2.XG cell type, was carried out using symmetric cells. The combined use of CNLS (complex non-linear least squares) and DRT (distribution of relaxation times) for impedance data analysis allowed an easier, less subjective, comprehensive study of Ni/10Sc1YSZ electrodes under various operating conditions, cell designs, electrode thicknesses, as well as upon low temperature redox cycling. From this study it was possible to find up to three or four contributions limiting the performance of the electrodes, depending on the cell design for the truly symmetric cells. Single anode supported symmetric cells also exhibited at least four processes, but their impedance response was found to be asymmetric. Based on the different behaviours, it was possible to attribute each process to its chemical or physical origin: ionic transport, charge transfer reaction, and gas diffusion and/or conversion. The behaviour of the rate limiting processes at the studied conditions is summarised as follows. The symmetric cell types I, II and III are shown in Fig. 7 on page 8.

14
Process 1a: appears at the highest frequencies, usually between 10 kHz – 2 kHz for type I, 26 kHz – 7 kHz for type II, and 37 kHz – 15 kHz for type III. The temperature dependence is weaker than that found for process 1b, with the pH2O dependence also very weak. The resistance associated with this process increases with increased electrode thickness, but remains almost unchanged by the redox cycle. These characteristics can be attributed to ionic conduction in the ceramic matrix; Process 1b: appears at high to intermediate frequencies, usually between 1 kHz – 150 Hz for type I, 5 kHz – 600 Hz for type II, and 2 kHz – 500 Hz for type III. Very strong temperature and pH2O dependences. The resistances associated with this process decrease significantly with increased electrode thickness, and after a low temperature redox cycle, which is associated with increased active electrochemical volume, and decreased Ni particle sizes, respectively. This process must be associated with the charge transfer reaction occurring in the triple phase boundary region; Process 1c: appears at low frequencies (< 200 Hz) in Type III cells. Very strong temperature and pH2O dependences. This process seems to arise from one of the two anodes, due to an asymmetric impedance response of these cells; Process 2a: appears at low frequencies in type II cells only, usually between 200 Hz – 100 Hz. Possibly present, but not deconvoluted for type III cells. Not thermally activated or slightly deactivated. Very strong pH2O dependences, with resistance decreasing significantly upon increased H2O content, particularly in the low pH2O range. The resistance is also affected by microstructural changes imposed by low temperature redox cycling. This process seems to be associated to gas diffusion in the porous support structure;
710
730
750
770
790
810
830
0 50 100 150 200 250 300
Cel
l vol
tage
(m
V)
Time (h)
Cell voltage curves - 750C, 0.75 A/cm2, 40% H2O in H2, 26% H2 utili., O2 to cathode.
6t38 (2XG Sc-doped laminated cell, ref. test)
13t63 (OCV treated, 2G)
8t12 (ref. 2G)
Fig. 1. Cell voltage as a function of time at 750 C of a 2.XG cell. For comparison is shown the results of an ordinary test of a normal 2G cell (8t12) and of a special treated 2G cell (13t63). Note the expanded x-axis scale. The 2.XG cell activates during the first 100 h, and it did not degrade at all until 300 h at a current density of 0. 75 A/cm-2. Process 2b: appears at the lowest frequencies, below 50 Hz for type I and II, not deconvoluted for type III cells. Not thermally activated or very slightly activated. The resistance remains unaffected by microstructural changes imposed by low temperature redox cycling and by changes in electrode

15
thickness. Very strong pH2O dependences, with resistance decreasing significantly upon increased H2O content, particularly in the low pH2O range. This process seems to be associated to gas conversion and/or diffusion in the gas channels Finally the fabrication procedure was optimised successfully, and 2.XG cells were produced toards the end of the present project, but regrettably it was too late to do the promised long term tests. However, one cell test was done at 750 C in order to compare the cell to ordinary 2G cell. Figure 1 shows the result. The conditions for the three tests were so that the contribution from the cathodes was minimised and thus the results reflect the differences in anode perfomance. The results (Fig. 1) shows that RNi,TPB was less than half of what is typical for 2G cells at these conditions. Report on Milestone 10: Effect of humidity on performance and durability studied on different cathodes, and limits of safe operation defined. The effect of moisture in the inlet gas air on LSM:YSZ, LSM:CGO:YSZ and LSCF:CGO:YSZ based solid oxide fuel cell (SOFC) cathodes has been studied. LSM is lanthanum strontium manganate, YSZ is yttria stabilised zirconia, CGO is ceria gadolinia oxide (used as a reaction barrier layer between the electrode and the YSZ electrolyte), and LSCF is lanthanum strontium cobalt ferrite. The cathodes are relevant for Risø cells, where Risø 2G and 2.5G single cells consist of a LSM:YSZ and a LSCF:CGO based cathode respectively. It was found that moisture in the air has a significant impact on cells based on LSM:YSZ and LSM:CGO cathodes respectively. In contrast to these findings Risø 2.5G cells showed a very high tolerance towards air moisture where no significant effect could be detected even when the humidification was as high as 12.8%, which corresponds to air saturated with water vapour at 49 ºC. The effect of air moisture on fresh non-degraded Risø 2G cells was screened as both a function of the degree of air humidification and as a function of cathode polarization. This was experimentally done by 100-200 hours segments with different operating conditions. No effect of humidification was found at zero cathode polarization (open circuit voltage), which means that a traditional poisoning effect as in catalysis, where active sites are being blocked, can be ruled out. However, when the cathode was polarized, due to a given current load, an effect dependent on the degree of humidification was observed. From the screening studies it can be concluded that a complicated interplay between humidification and polarization exist. The long term effect of 3.2% humidification at different current loads was studied in 1500 h tests and compared with reference tests in dry air. From the comparison of the 1500 h tests it can first of all be concluded that there is an effect of air moisture and that it is dependent on how hard the cell is operated (the magnitude of cathode polarization). A cell with a LSM:CGO cathode was tested to obtain further knowledge regarding the cause to this difference in air moisture tolerance between Risø 2G and 2.5G cells. The cell showed similar trends as Risø 2G cells (LSM:YSZ) with respect to air moisture tolerance. These observations suggest that the air moisture effect is purely LSM material related. Impedance spectroscopy deconvolution along with electron microscopy studies points towards a decomposition of LSM at the cathode/electrolyte interface. In conclusion, it was not possible to identify a limit of "safe operation" i.e. no degradation due to water vapour in the air for 2G cells, whereas water vapour in the air has no effect on the performance of 2.5 G type cells with in all practical relevant limits.
16
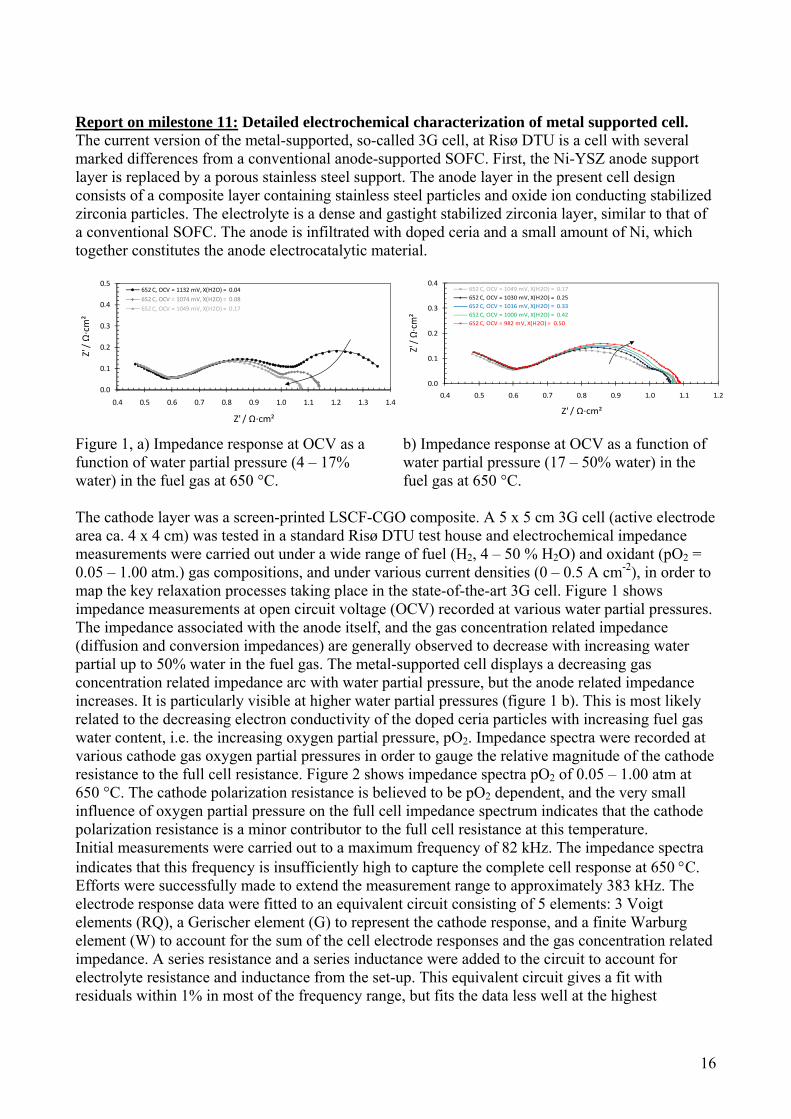
Report on milestone 11: Detailed electrochemical characterization of metal supported cell. The current version of the metal-supported, so-called 3G cell, at Risø DTU is a cell with several marked differences from a conventional anode-supported SOFC. First, the Ni-YSZ anode support layer is replaced by a porous stainless steel support. The anode layer in the present cell design consists of a composite layer containing stainless steel particles and oxide ion conducting stabilized zirconia particles. The electrolyte is a dense and gastight stabilized zirconia layer, similar to that of a conventional SOFC. The anode is infiltrated with doped ceria and a small amount of Ni, which together constitutes the anode electrocatalytic material.
0.0
0.1
0.2
0.3
0.4
0.5
0.4 0.5 0.6 0.7 0.8 0.9 1.0 1.1 1.2 1.3 1.4
Z' / Ω∙cm²
Z' / Ω∙cm²
652 C, OCV = 1132 mV, X(H2O) = 0.04
652 C, OCV = 1074 mV, X(H2O) = 0.08
652 C, OCV = 1049 mV, X(H2O) = 0.17
0.0
0.1
0.2
0.3
0.4
0.4 0.5 0.6 0.7 0.8 0.9 1.0 1.1 1.2
Z' / Ω∙cm²
Z' / Ω∙cm²
652 C, OCV = 1049 mV, X(H2O) = 0.17
652 C, OCV = 1030 mV, X(H2O) = 0.25
652 C, OCV = 1016 mV, X(H2O) = 0.33
652 C, OCV = 1000 mV, X(H2O) = 0.42
652 C, OCV = 982 mV, X(H2O) = 0.50
Figure 1, a) Impedance response at OCV as a function of water partial pressure (4 – 17% water) in the fuel gas at 650 °C.
b) Impedance response at OCV as a function of water partial pressure (17 – 50% water) in the fuel gas at 650 °C.
The cathode layer was a screen-printed LSCF-CGO composite. A 5 x 5 cm 3G cell (active electrode area ca. 4 x 4 cm) was tested in a standard Risø DTU test house and electrochemical impedance measurements were carried out under a wide range of fuel (H2, 4 – 50 % H2O) and oxidant (pO2 = 0.05 – 1.00 atm.) gas compositions, and under various current densities (0 – 0.5 A cm-2), in order to map the key relaxation processes taking place in the state-of-the-art 3G cell. Figure 1 shows impedance measurements at open circuit voltage (OCV) recorded at various water partial pressures. The impedance associated with the anode itself, and the gas concentration related impedance (diffusion and conversion impedances) are generally observed to decrease with increasing water partial up to 50% water in the fuel gas. The metal-supported cell displays a decreasing gas concentration related impedance arc with water partial pressure, but the anode related impedance increases. It is particularly visible at higher water partial pressures (figure 1 b). This is most likely related to the decreasing electron conductivity of the doped ceria particles with increasing fuel gas water content, i.e. the increasing oxygen partial pressure, pO2. Impedance spectra were recorded at various cathode gas oxygen partial pressures in order to gauge the relative magnitude of the cathode resistance to the full cell resistance. Figure 2 shows impedance spectra pO2 of 0.05 – 1.00 atm at 650 °C. The cathode polarization resistance is believed to be pO2 dependent, and the very small influence of oxygen partial pressure on the full cell impedance spectrum indicates that the cathode polarization resistance is a minor contributor to the full cell resistance at this temperature. Initial measurements were carried out to a maximum frequency of 82 kHz. The impedance spectra indicates that this frequency is insufficiently high to capture the complete cell response at 650 C. Efforts were successfully made to extend the measurement range to approximately 383 kHz. The electrode response data were fitted to an equivalent circuit consisting of 5 elements: 3 Voigt elements (RQ), a Gerischer element (G) to represent the cathode response, and a finite Warburg element (W) to account for the sum of the cell electrode responses and the gas concentration related impedance. A series resistance and a series inductance were added to the circuit to account for electrolyte resistance and inductance from the set-up. This equivalent circuit gives a fit with residuals within 1% in most of the frequency range, but fits the data less well at the highest

17
frequencies after appropriate inductance correction has been carried out. Further work is required in order to establish a good model that can account for impedance data over the whole frequency range.
0.0
0.1
0.2
0.3
0.4 0.5 0.6 0.7 0.8 0.9 1.0 1.1
Z' / Ω∙cm²
Z' / Ω∙cm²
653 C, OCV = 1005 mV, X(O2) = 0.05
653 C, OCV = 1025 mV, X(O2) = 0.10
653 C, OCV = 1042 mV, X(O2) = 0.19
653 C, OCV = 1053 mV, X(O2) = 0.50
653 C, OCV = 1077 mV, X(O2) = 1.00
‐0.02
‐0.01
0.00
0.01
0.02
0.03
0 1 10 100 1,000 10,000 100,000
ΔŻ' / Ω∙cm²
f / Hz
[653 C, X(O2) = 0.05] ‐ [653 C, X(O2) = 1.00][653 C, X(O2) = 0.10] ‐ [653 C, X(O2) = 1.00][653 C, X(O2) = 0.19] ‐ [653 C, X(O2) = 1.00][653 C, X(O2) = 0.50] ‐ [653 C, X(O2) = 1.00]
Figure 2 a) Impedance response at OCV as a function of oxygen partial pressure (5 – 100% oxygen) in the cathode gas at 650 °C.
b) ADIS spectra calculated from the spectra in figure 2 a.
The clear technical conclusion based on this detailed electrochemical characterization is that most of the cell resistance originates form the anode and concentration polarisation on the anode side. Consequently, the recommendation is that the focus of the further R&D efforts should continue to be on improving the anode and metal support structure.
Figure 3: Impedance spectrum recorded at 650 C and OCV. The fuel was H2 with 20 % H2O, and the oxidant gas was air. The impedance spectrum was measured up to 383 kHz. The CNLS fit was carried out using the equivalent circuit L-R-(RQ)-G-(RQ)-W-(RQ). The model accounts well for the response below 10 kHz. Note that the units on the axes of the figure are in Ω. The lower frequency limit was 0.177 Hz. Report on Milestone 12: One 1500 hours long-term test of metal supported cell done The 3G cell is currently a cell undergoing rapid development and the development work faces a set of challenges with respect to cathode fabrication that sets it apart from the more conventional anode-supported cell. The metal supported cell is based on a porous stainless steel support, that does not tolerate oxidizing atmosphere at elevated temperatures (above 600 °C), without undergoing significant corrosion. The operating temperature of a metal supported cell is generally below 700 °C, and therefore requires use of cathodes based on more reactive mixed ionic and electronic conductors (MIEC), i.e. perovskites such as LSCF (lanthanum strontium cobalt ferrites) and LSC (lanthanum strontium cobaltites), rather than the well known LSM-YSZ composite cathode used on 2G cells. LSCF and LSC cathodes are normally sintered at temperatures exceeding 900 °C. LSCF and LSC are not stable under strong reducing conditions at elevated temperatures, and this prevents firing of the cathode in reducing atmosphere. In 3G cells the cathode is fired in-
18
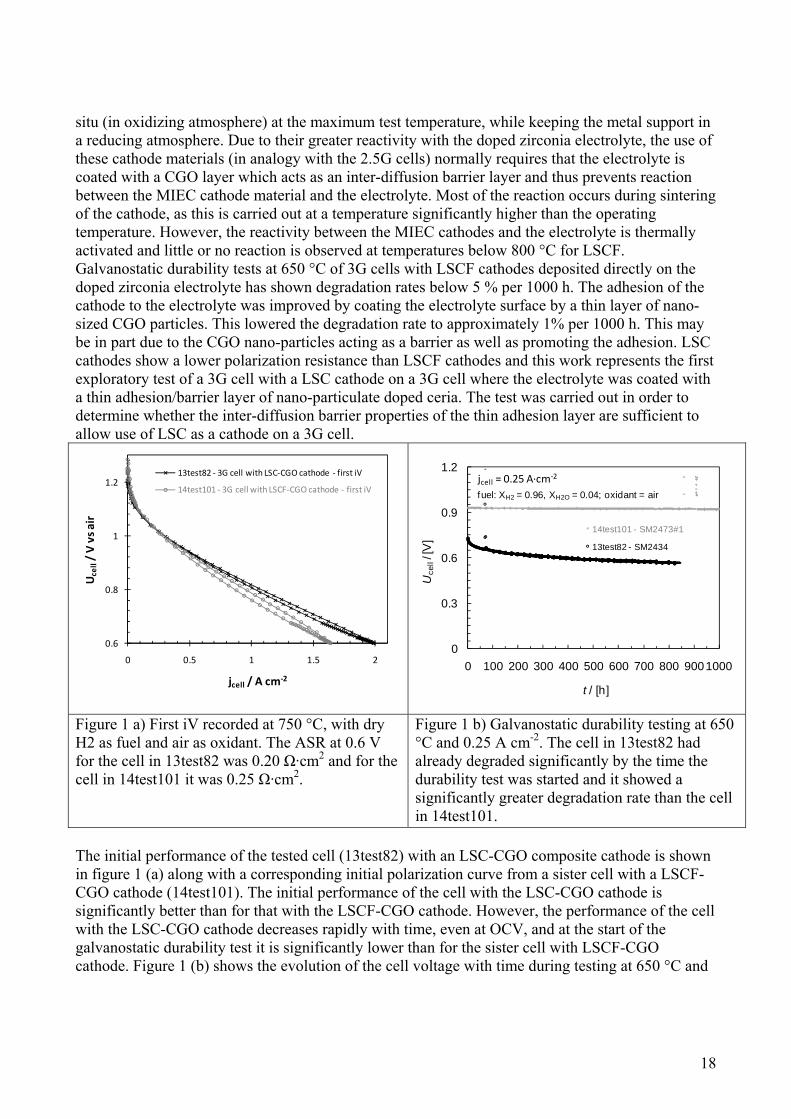
situ (in oxidizing atmosphere) at the maximum test temperature, while keeping the metal support in a reducing atmosphere. Due to their greater reactivity with the doped zirconia electrolyte, the use of these cathode materials (in analogy with the 2.5G cells) normally requires that the electrolyte is coated with a CGO layer which acts as an inter-diffusion barrier layer and thus prevents reaction between the MIEC cathode material and the electrolyte. Most of the reaction occurs during sintering of the cathode, as this is carried out at a temperature significantly higher than the operating temperature. However, the reactivity between the MIEC cathodes and the electrolyte is thermally activated and little or no reaction is observed at temperatures below 800 °C for LSCF. Galvanostatic durability tests at 650 °C of 3G cells with LSCF cathodes deposited directly on the doped zirconia electrolyte has shown degradation rates below 5 % per 1000 h. The adhesion of the cathode to the electrolyte was improved by coating the electrolyte surface by a thin layer of nano-sized CGO particles. This lowered the degradation rate to approximately 1% per 1000 h. This may be in part due to the CGO nano-particles acting as a barrier as well as promoting the adhesion. LSC cathodes show a lower polarization resistance than LSCF cathodes and this work represents the first exploratory test of a 3G cell with a LSC cathode on a 3G cell where the electrolyte was coated with a thin adhesion/barrier layer of nano-particulate doped ceria. The test was carried out in order to determine whether the inter-diffusion barrier properties of the thin adhesion layer are sufficient to allow use of LSC as a cathode on a 3G cell.
0.6
0.8
1
1.2
0 0.5 1 1.5 2
Ucell/ V vs air
jcell / A cm‐2
13test82 ‐ 3G cell with LSC‐CGO cathode ‐ first iV
14test101 ‐ 3G cell with LSCF‐CGO cathode ‐ first iV
0
0.3
0.6
0.9
1.2
0 100 200 300 400 500 600 700 800 9001000
Uce
ll/ [
V]
t / [h]
14test101 - SM2473#1
13test82 - SM2434
fuel: XH2 = 0.96, XH2O = 0.04; oxidant = air
jcell = 0.25 A∙cm‐2
Figure 1 a) First iV recorded at 750 °C, with dry H2 as fuel and air as oxidant. The ASR at 0.6 V for the cell in 13test82 was 0.20 Ω·cm2 and for the cell in 14test101 it was 0.25 Ω·cm2.
Figure 1 b) Galvanostatic durability testing at 650 °C and 0.25 A cm-2. The cell in 13test82 had already degraded significantly by the time the durability test was started and it showed a significantly greater degradation rate than the cell in 14test101.
The initial performance of the tested cell (13test82) with an LSC-CGO composite cathode is shown in figure 1 (a) along with a corresponding initial polarization curve from a sister cell with a LSCF-CGO cathode (14test101). The initial performance of the cell with the LSC-CGO cathode is significantly better than for that with the LSCF-CGO cathode. However, the performance of the cell with the LSC-CGO cathode decreases rapidly with time, even at OCV, and at the start of the galvanostatic durability test it is significantly lower than for the sister cell with LSCF-CGO cathode. Figure 1 (b) shows the evolution of the cell voltage with time during testing at 650 °C and

19
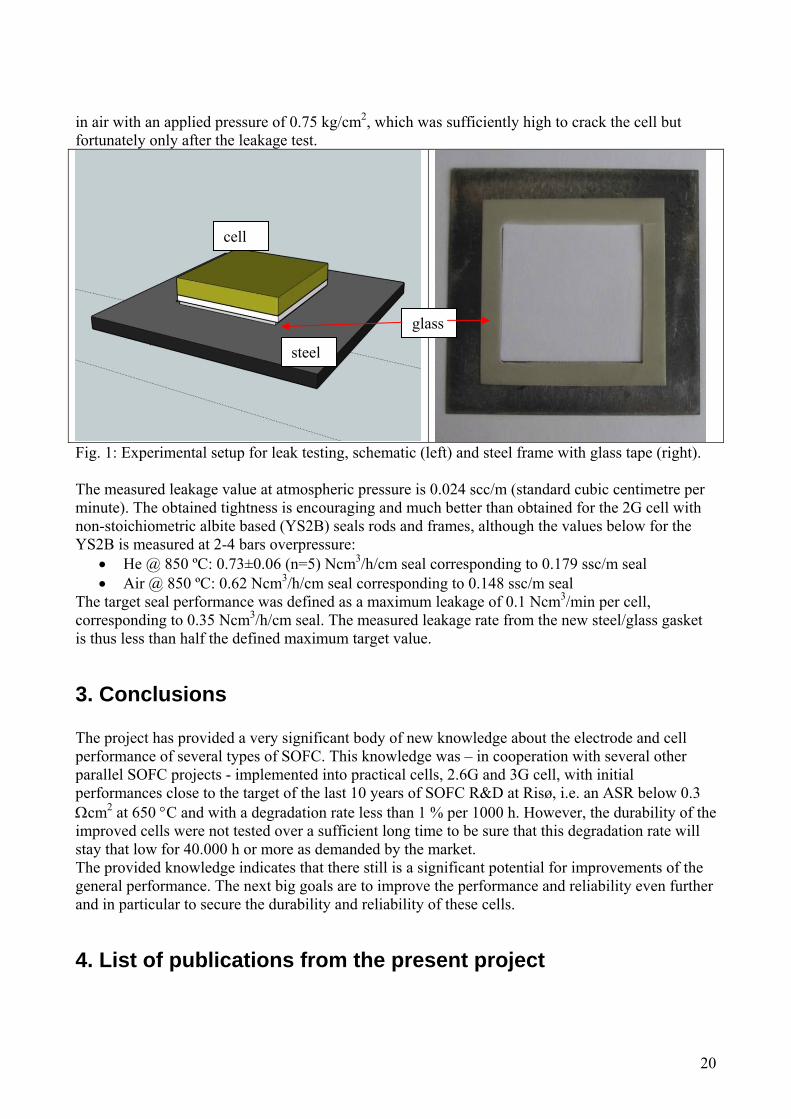
at a current density of 0.25 A cm-2. Due to the high degradation rate the durability test in 13test82 was stopped after approximately 830 h. The conclusion of these measurements is that inter-diffusion barrier properties of the thin and relatively porous CGO layer that acts as an adhesion layer between the cathode and the electrolyte in the tested cells, is insufficient as a barrier layer for cells with LSC-CGO cathodes. LSC is known to have a significantly higher Sr-activity than LSCF. Future work with LSC based cathodes for 3G cells will involve development of a CGO layer with better SrO diffusion barrier properties. Report on Milestone 13: Seal glasses for low temperature sealing identified Different compositions in a new candidate glass system were investigated. The system was chosen for the following reasons: The glasses in this system have high thermal expansion coefficient which matches with other cell test components, the glass transition temperature (Tg) is low and no problematic chemical reactions with other cell test components are expected. The glass was synthesized by melting the different oxides in a Pt crucible at 1300 °C. The pulverized glass was used for further characterization and production of glass tape for sealing tests. An optimal composition was identified. The sealing ability towards YSZ , steel and NiO (Anode support) was tested successfully. The sealing temperature can be varied over large interval from 750 °C to 950 °C. Thus, a low temperature (in SOFC context) seal glass has been identified, and the milestone is therewith considered completely fulfilled. Report on Milestone 14: A simple seal fabrication route developed Leak test of glass screen-printed on steel-frames has proven to perform well cf. report on milestone 15. The initial glass-inks were based on terpineol, a solvent that very soon has to be replaced due to environmental regulations. The scope of the present work has therefore been to develop new environmental friendly ink(s). The work has been concentrated on aqueous based inks. Crushed commercial available boron-silicate glass (Duran) has been used in the preliminary ink-development. Several binders have been investigated e.g. polyacrylic acid and polyvinyl alcohol. The inks prepared with these binders had rheological properties well-suited for serigraphic processing, but the screen-printed film has insufficient adhesion to the steel frame. However, polyvinyl alcohol has some dispersion effect. Inks with photocuring binders e.g. triethyleneglycol divinyl ether together with Irgacure 184 have been tested as well. The rheological properties of inks prepared with these binders were well suited for screen-printing., but the amount (37 vol. %) of binder required was too high to make dense films, and the further work with these binders were abandoned. An optimized ink composition with good screen-printing rheological properties is listed in Table 1. The resulting screen-printed glass films show good adhesion to the steel frame after drying. The milestone on developing a simple and environmental friendly seal fabrication route is therefore fulfilled! Report on milestone 15: The target values on leakage rates of 0.1 cm3/min for single cells obtained for the fabricated seals The new candidate glass (see report on milestone 13) was used for leak testing. The glass tape was placed between a Crofer steel frame and a standard half cell (see Fig. 1) towards the YSZ electrolyte. The setup was chosen, because the steel as well as the YSZ electrolyte are dense and therewith all detected leakage can be assigned to the seal. The described setup was sealed at 850°C
20
in air with an applied pressure of 0.75 kg/cm2, which was sufficiently high to crack the cell but fortunately only after the leakage test.
Fig. 1: Experimental setup for leak testing, schematic (left) and steel frame with glass tape (right). The measured leakage value at atmospheric pressure is 0.024 scc/m (standard cubic centimetre per minute). The obtained tightness is encouraging and much better than obtained for the 2G cell with non-stoichiometric albite based (YS2B) seals rods and frames, although the values below for the YS2B is measured at 2-4 bars overpressure:
He @ 850 ºC: 0.73±0.06 (n=5) Ncm3/h/cm seal corresponding to 0.179 ssc/m seal Air @ 850 ºC: 0.62 Ncm3/h/cm seal corresponding to 0.148 ssc/m seal
The target seal performance was defined as a maximum leakage of 0.1 Ncm3/min per cell, corresponding to 0.35 Ncm3/h/cm seal. The measured leakage rate from the new steel/glass gasket is thus less than half the defined maximum target value.
3. Conclusions The project has provided a very significant body of new knowledge about the electrode and cell performance of several types of SOFC. This knowledge was – in cooperation with several other parallel SOFC projects - implemented into practical cells, 2.6G and 3G cell, with initial performances close to the target of the last 10 years of SOFC R&D at Risø, i.e. an ASR below 0.3 cm2 at 650 C and with a degradation rate less than 1 % per 1000 h. However, the durability of the improved cells were not tested over a sufficient long time to be sure that this degradation rate will stay that low for 40.000 h or more as demanded by the market. The provided knowledge indicates that there still is a significant potential for improvements of the general performance. The next big goals are to improve the performance and reliability even further and in particular to secure the durability and reliability of these cells.
4. List of publications from the present project
glass
steel
cell
21
Publications originating from this project and the preceding PSO projects in this series published during the project period. Journal articles: 1. P. Blennow, A. Hagen, K. K. Hansen, L. R. Wallenberg, and M. Mogensen, Defect and
electrical transport properties of Nb-doped SrTiO3. Solid State Ionics, 179(2008), pp. 2047-2058, (doi:10.1016/j.ssi.2008.06.023)
2. P. Blennow, K. K. Hansen, L. R. Wallenberg, and M. Mogensen, Electrochemical
characterization and redox behavior of Nb-doped SrTiO3. Solid State Ionics (2008), (doi:10.1016/j.ssi.2008.10.011)
3. Y.L. Liu, A. Hagen, R. Barfod, M. Chen, H.J. Wang, F.W. Poulsen and P.V. Hendriksen,
“Microstructural studies on degradation of interface between LSM-YSZ cathode and YSZ electrolyte in SOFCs”, Solid State Ionics, 180 (2009) 1298-1304.
4. Hauch, A.; Hagen, A.; Mogensen, M., “Ni/YSZ Electrode Degradation Studied by Impedance
Spectroscopy – Effect of p(H2O)” Solid State Ionics, DOI: 10.1016/j.ssi.2010.01.004, In press 5. Hauch, A.; Mogensen, M.; “Ni/YSZ Electrode Degradation Studied by Impedance
Spectroscopy – Effect of Gas Cleaning and Current Density”, Solid State Ionics, 181(15-16), p. 745 (2010)
6. Nielsen, J.; Hagen, Anke; Liu, Yi-Lin; "Effect of cathode gas humidification on performance
and durability of Solid Oxide Fuel Cells" Solid State Ionics, 181 (2010) 517-524. 7. 8. Hagen, Anke; Neufeld, Kai; Liu, Yi-Lin; "Effect of Humidity in Air on Performance and Long-
Term Durability of SOFCs", J. Electrochem. Soc., 157 (2010) B1343. 9. M. Pihlatie, A. Kaiser, P.H. Larsen, M. Mogensen, "Dimensional behavior of Ni-YSZ
composites during redox cycling", J. Electrochem. Soc., 156 (2009) B322-B329
10. M. Pihlatie, A. Kaiser, M. Mogensen, "Redox stability of SOFC: Thermal analysis of Ni-YSZ composites", Solid State Ionics, 180 (2009) 1100-1112.
11. M. Pihlatie, A. Kaiser, M. Mogensen, "Mechanical properties of NiO/Ni-YSZ composites
depending on temperature, porosity and redox cycling" J. Eur. Ceram. Soc., 29 (2009), 1657-1664.
12. Pihlatie, Mikko; Frandsen, Henrik Lund; Kaiser, Andreas; Mogensen, Mogens; "Continuum
mechanics simulations of NiO/Ni-YSZ composites during reduction and re-oxidation", J. Power Sources, 195 (2010) 2277.
13. Kammer Hansen, Kent; Wandel, Marie; Liu, Yi-Lin; Mogensen, Mogens; "Effect of
impregnation of La0.85Sr0.15MnO3/Yttria Stabilized Zirconia Solid Oxide Fuel Cell cathodes with La0.85Sr0.15MnO3 or Al2O3 nano-particles", Electrochimica Acta, 55 (2010) 4606.
22
14. R. Knibbe et al., "Cathode-Electrolyte Interfaces with CGO Barrier Layers in SOFC", J. Am. Ceram. Soc., 93 (2010) 2877.
15. Kammer Hansen, Kent; Menon, Mohan; Knudsen, Jesper; Bonanos, Nikolaos; Mogensen,
Mogens; "The Effect of a CGO Barrier Layer on the Performance of LSM/YSZ SOFC Cathodes", J. Electrochem. Soc., 157 (2010) B309.
16. Kammer Hansen, Kent; Hansen, Karin Vels; Mogensen, Mogens; "High Performance Fe-Co
Based SOFC Cathodes", J. Solid State Electrochemistry, 14 (2010) 2107-2112. Conference proceeding articles and presentations: 17. P. Blennow, K. K. Hansen, L. R. Wallenberg, and M. Mogensen, Strontium Titanate-based
Composite Anodes for Solid Oxide Fuel Cells. "ECS Transactions - Phoenix, AZ" Volume 13, "Ionic and Mixed Conducting Ceramics 6", from the Phoenix, AZ meeting.
18. J. Hjelm, M. Søgaard, R. Knibbe, A. Hagen, M. Mogensen, “Electrochemical Characterization
of Planar Anode Supported SOFC with Strontium-Doped Lanthanum Cobalt Oxide Cathodes”, Proc. of the 6th Symposium on Ionic and Mixed Conducting Ceramics, 213th ECS Phoenix, Arizona, USA 2008
19. M. Mogensen, M. Søgaard, P. Blennow, K. K. Hansen, “The Action of Nano-Particles in SOFC
Electrodes”, Proc. of the 8th European Fuel Cell Forum, Lucerne, Switzerland, 2008. 20. M. Søgaard, T. Z. Sholklapper, M. Wandel, L. C. De Jonghe, and M. Mogensen, “Infiltration of
SOFC Cathodes”, Proc. of the 8th European Fuel Cell Forum, Lucerne, Switzerland, 2008. 21. Martin Søgaard et al. “Microstructural Modeling and Experimental Validation Applied to Solid
Oxide Fuel Cell Cathodes” Poster presented at the 6th Symposium on Fuel Cell Modelling and Experimental Validation (MODVAL 6), Bad Herrenalp, Germany, March 2009.
22. Jimmi Nielsen and Anke Hagen; “Effect of cathode gas humidification on performance and
durability of solid oxide fuel cells”, oral presentations given at the 17th International conference on solid state ionics, 28 June – 3 July, 2009, Toronto Canada.
23. Anne Hauch et al., Ni/YSZ degradation studied by impedance spectroscopy, oral presentations
given at the 17th International conference on solid state ionics, 28 June – 3 July, 2009, Toronto Canada.
24. P. Blennow, K. K. Hansen, L. R. Wallenberg, and M. Mogensen, Strontium Titanate-based
Composite Anodes for Solid Oxide Fuel Cells. Oral presentation at ECS213 meeting "Ionic and Mixed Conducting Ceramics 6" in Phoenix, AZ, USA.
25. P. Blennow, T. Klemensø, Å. Persson, M. Mogensen, Novel composite anodes for metal
supported SOFC, Abstract accepted for presentation at ICACC, Daytona Beach, 2009. 26. M. Mogensen, M. Søgaard, P. Blennow, K. K. Hansen, The Action of Nano-Particles in SOFC
Electrodes, Proceeding article, Fuel Cell Forum, Lucerne, 2008.

23
27. J. Hjelm, P. Blennow, K. Brodersen, S. Ramousse, M. Mogensen, Performance and Degradation
of Metal Supported SOFC, Abstract accepted for presentation at ICACC, Daytona Beach, 2009. 28. Jimmi Nielsen, “Some aspects of the O2/O2-/LSM/YSZ electrode kinetics “Oral presentation at
4th SERC Biannual Meeting August 28th 2008 Risø National Laboratory for Sustainable Energy DTU, Roskilde.
29. Jimmi Nielsen “Impact of air humidity on performance and durability of Solid-Oxide-Fuel-
Cells” Oral presentation at Electrochemical Science and Technology conference 2-3 October 2008 Aluminium Danmark, Forskerbyen Fyn/ Syddanske Forskerparker i Odense, Forskerparken 10, 5230 Odense M.
30. M. Søgaard, T. Z. Sholklapper, M. Wandel, L. C. De Jonghe, and M. Mogensen, “Infiltration of
SOFC Cathode”, Presentation at the 8th European Fuel Cell Forum, Lucerne, Switzerland, 2008 31. Wandel, M.; Bowen, J.R.; Mogensen, M., Performance, degradation and microstructure of
LSCF/CGO composite cathodes. 8. European solid oxide fuel cell forum, Lucerne (CH), 30 Jun - 4 Jul 2008.
32. Wandel, M.; Hagen, A.; Mogensen, M., Improving the performance of composite LSM
cathodes for solid oxide fuel cells. Fuel cells science and technology 2008: Scientific advances in fuel cell systems, Copenhagen (DK), 8-9 Oct 2008.
33. Ramos, Tania; Thydén, Karl Tor Sune; Mogensen, Mogens, "Impact of Initial Reduction and
H2/H2O Contents on the Performance and Microstructure of Ni Cermets", Presented at: ECS Meeting. Vancouver, Canada, 2010
34. Søgaard, Martin; Mortensen, Jakob Egeberg; Jacobsen, Torben; "Impedance Modeling of Mixed
Ionic Electronic Conducting Cathodes for Solid Oxide Fuel Cells", Presented at: ECS Meeting. Vancouver, Canada, 2010