Embed Size (px)
Citation preview

Corporate Finance
Final project: The Air transportation industry
Submitted by: Andrea Trozzi Braulio Serna
David Calvo Platero Dimitar Petrov
New York University New York
May2, 2005
1
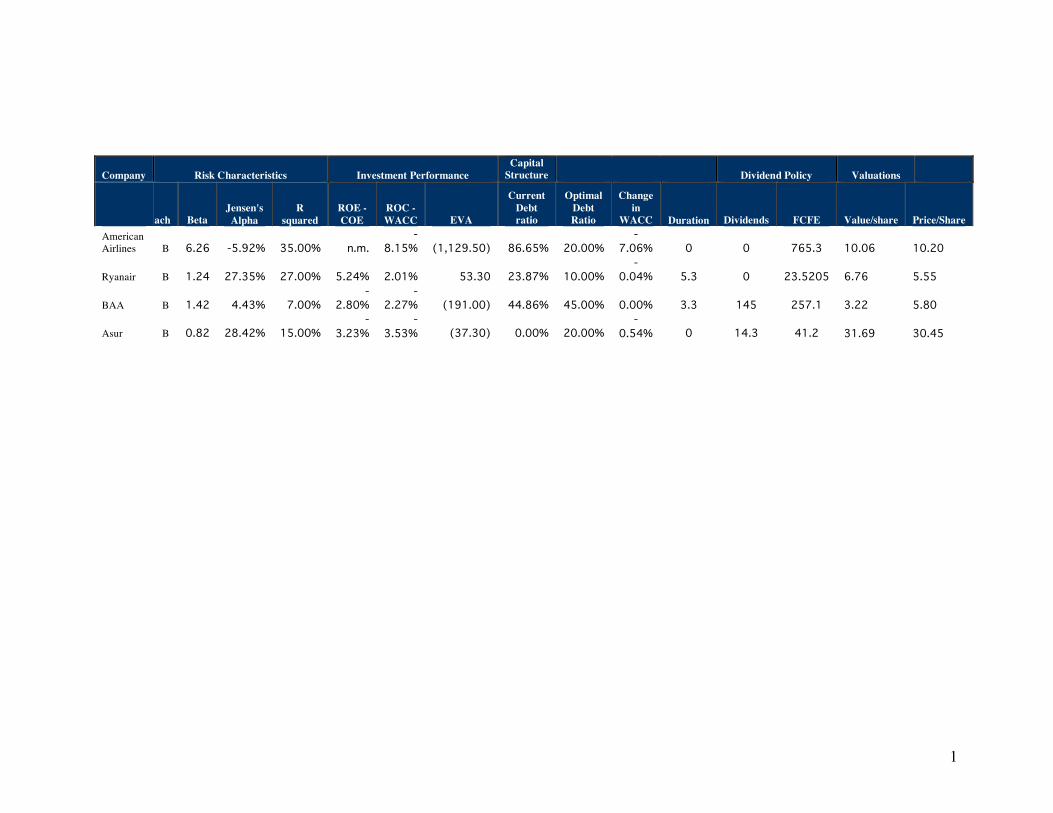
Company Risk Characteristics Investment Performance Capital
Structure Dividend Policy Valuations
Approach Beta Jensen's Alpha
R squared
ROE - COE
ROC - WACC EVA
Current Debt ratio
Optimal Debt Ratio
Change in
WACC
Duration Dividends FCFE Value/share Price/Share American Airlines B 6.26 -5.92% 35.00% n.m.
-8.15% (1,129.50) 86.65% 20.00%
-7.06% 0 0 765.3
10.06
10.20
Ryanair B 1.24 27.35% 27.00% 5.24% 2.01% 53.30 23.87% 10.00% -
0.04% 5.3 0 23.5205 6.76
5.55
BAA B 1.42 4.43% 7.00% -
2.80% -
2.27% (191.00) 44.86% 45.00% 0.00% 3.3 145 257.1 3.22
5.80
Asur B 0.82 28.42% 15.00% -
3.23% -
3.53% (37.30) 0.00% 20.00% -
0.54% 0 14.3 41.2 31.69
30.45
1
EXECUTIVE SUMMARY................................................................................................... 3
INTRODUCTION AND THE COMPANIES........................................................................ 4
1. Introduction ......................................................................................................................................................................... 4
2. Brief description of the companies .................................................................................................................................. 6
CORPORATE GOVERNANCE ANALYSIS ...................................................................... 8
1. Balance of power between management and shareholders .......................................................................................... 8
2. Management compensation.............................................................................................................................................. 9
3. Market coverage................................................................................................................................................................ 11
4. Social responsibility.......................................................................................................................................................... 12
STOCKHOLDER ANALYSIS.......................................................................................... 14
RISK PROFILE ............................................................................................................... 16
1. Market risk and return...................................................................................................................................................... 16
2. Bottom up betas................................................................................................................................................................ 20
3. Cost of equity .................................................................................................................................................................... 22
4. Cost of debt........................................................................................................................................................................ 23
5. Cost of capital.................................................................................................................................................................... 25
INVESTMENT RETURN ANALYSIS............................................................................... 27
1. Typical project ................................................................................................................................................................... 27
2. Measuring Returns ........................................................................................................................................................... 28
3. Future outlook................................................................................................................................................................... 30
CAPITAL STRUCTURE CHOICES................................................................................. 33
1. Current financing mix ...................................................................................................................................................... 33
2. Trade off on Debt and Equity......................................................................................................................................... 35
2
OPTIMAL CAPITAL STRUCTURE................................................................................. 37
1. Current Cost of Capital / Financing Mix ...................................................................................................................... 37
2. Cost of Capital at Different Financing Mixes............................................................................................................... 37
3. Firm Value at Optimal ..................................................................................................................................................... 38
4. Optimal capital structure – APV approcah ................................................................................................................... 40
5. Sector and market debt ratios ......................................................................................................................................... 42
MECHANICS OF MOVING TOWARDS THE OPTIMAL................................................. 43
1. A Path to the Optimal...................................................................................................................................................... 43
2. Quantitative Analysis and Overall Recommendation on Financing Mix................................................................. 43
3. Summary of desirable debt charachteristics ................................................................................................................. 47
DIVIDEND POLICY ......................................................................................................... 48
1. Current Dividend Policy .................................................................................................................................................. 48
DIVIDEND POLICY: A FRAMEWORK ........................................................................... 51
1. Affordable Dividends........................................................................................................................................................ 51
2. Management Trust and Changing Dividend Policy ................................................................................................... 51
VALUATION.................................................................................................................... 54
1. Valuation models .............................................................................................................................................................. 54
2. Valuation assumptions and inputs................................................................................................................................. 54
3. Valuation results .............................................................................................................................................................. 57
3
I. Executive Summary
Corporate Governance and Stockholder analys i s
We believe that the stockholders’ interests are generally well protected in the companies
subject to our review with the exception of American Airlines, which has some controversial
corporate governance practices in place. The marginal investor in all companies is well diversified,
often internationally, investors. In three out the four companies there were significantly large
institutional holdings.
Risk Prof i l e
We used two measures of bete to estimate the exposure of each company to market risk. Not
surprisingly, the results reflect the fundamental characteristics of each company and in particular
variance of earnings and leverage. The riskiest company as measured by historical regression beta is
American Airlines and the least risky – BAA. Because of the historical character of the regressions
beta and high standard errors of the estimates we used bottom-up betas in our further analysis.
In addition, we used two methods to compute returns of each company with relation to its risk
– Jensen’s Alpha and Treynor ratio. Under both methods the top performing companies were Ryanair
and Asur.
Inves tment analys i s
In analyzing the returns of the investment projects at which companies we looked at a typical
project in each line of business and computed accounting measures of returns, such as ROC and
ROE. Ryanair proved to be the company with highest returns and it was the only company that
generated positive EVA. In addition we assessed the future prospects of each company, analyzing the
sustainability of its competitive advantages. This analysis was used as a basis for the valuation of the
firms.
Capi tal s t ruc ture
The four companies adopt very different policies with regards to their capital structure,
ranging from the highly overlevered American Airlines (debt ratio of 87%) to the all equity financed
Asur. Taking into account the potential benefits and disadvantages from the use of debt we computed
optimal capital structures for each firm and assessed the impact on the share price from moving from
the current capital structure to the optimal. The result was an average of 8.12% increase in the firm
4
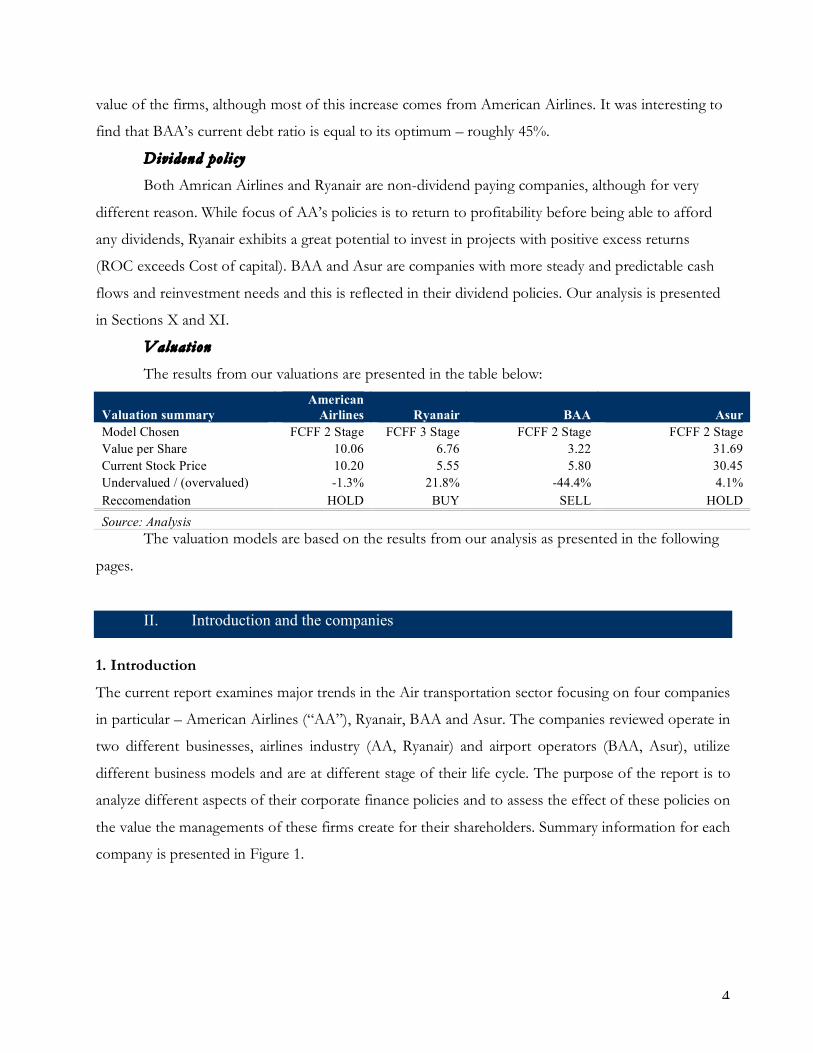
value of the firms, although most of this increase comes from American Airlines. It was interesting to
find that BAA’s current debt ratio is equal to its optimum – roughly 45%.
Dividend pol i cy
Both Amrican Airlines and Ryanair are non-dividend paying companies, although for very
different reason. While focus of AA’s policies is to return to profitability before being able to afford
any dividends, Ryanair exhibits a great potential to invest in projects with positive excess returns
(ROC exceeds Cost of capital). BAA and Asur are companies with more steady and predictable cash
flows and reinvestment needs and this is reflected in their dividend policies. Our analysis is presented
in Sections X and XI.
Valuat ion
The results from our valuations are presented in the table below:
Valuation summary American
Airlines Ryanair BAA Asur Model Chosen FCFF 2 Stage FCFF 3 Stage FCFF 2 Stage FCFF 2 Stage Value per Share 10.06 6.76 3.22 31.69 Current Stock Price 10.20 5.55 5.80 30.45 Undervalued / (overvalued) -1.3% 21.8% -44.4% 4.1% Reccomendation HOLD BUY SELL HOLD Source: Analysis
The valuation models are based on the results from our analysis as presented in the following
pages.
II. Introduction and the companies
1. Introduction
The current report examines major trends in the Air transportation sector focusing on four companies
in particular – American Airlines (“AA”), Ryanair, BAA and Asur. The companies reviewed operate in
two different businesses, airlines industry (AA, Ryanair) and airport operators (BAA, Asur), utilize
different business models and are at different stage of their life cycle. The purpose of the report is to
analyze different aspects of their corporate finance policies and to assess the effect of these policies on
the value the managements of these firms create for their shareholders. Summary information for each
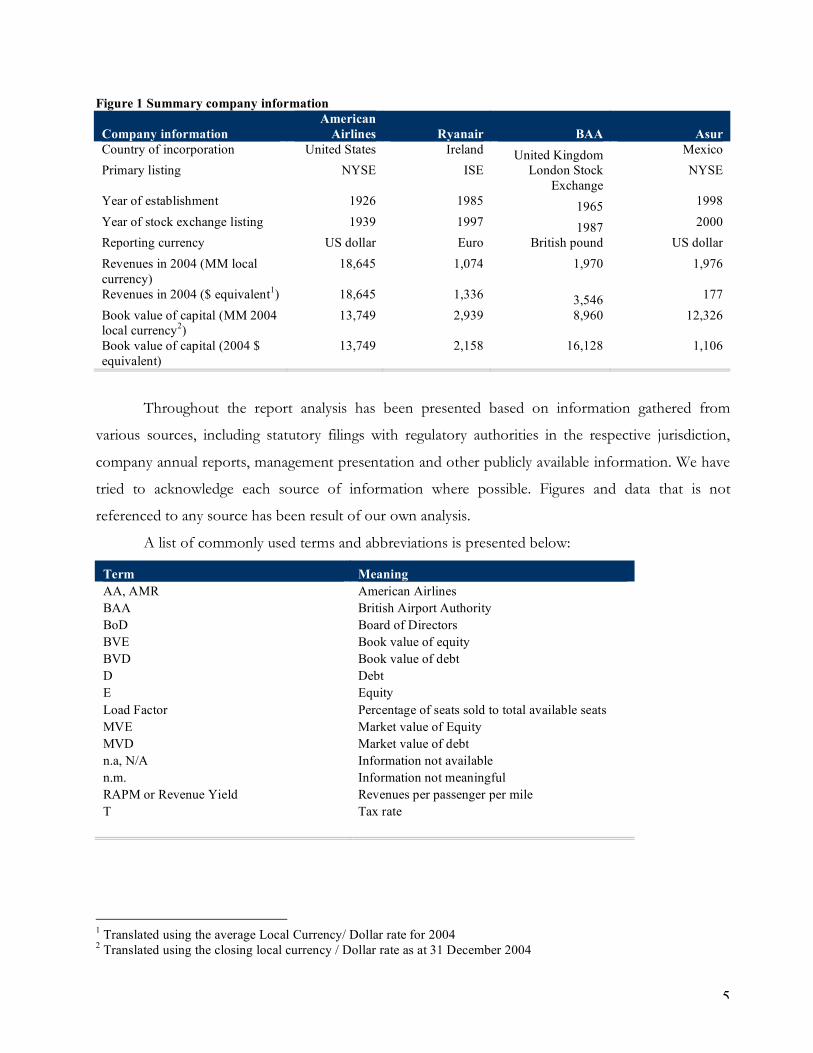
company is presented in Figure 1.
5
Figure 1 Summary company information
Company information American
Airlines Ryanair BAA Asur Country of incorporation United States Ireland United Kingdom Mexico Primary listing NYSE ISE London Stock
Exchange NYSE
Year of establishment 1926 1985 1965 1998 Year of stock exchange listing 1939 1997 1987 2000 Reporting currency US dollar Euro British pound US dollar Revenues in 2004 (MM local currency)
18,645 1,074 1,970 1,976
Revenues in 2004 ($ equivalent1) 18,645 1,336 3,546 177 Book value of capital (MM 2004 local currency2)
13,749 2,939 8,960 12,326
Book value of capital (2004 $ equivalent)
13,749 2,158 16,128 1,106
Throughout the report analysis has been presented based on information gathered from
various sources, including statutory filings with regulatory authorities in the respective jurisdiction,
company annual reports, management presentation and other publicly available information. We have
tried to acknowledge each source of information where possible. Figures and data that is not
referenced to any source has been result of our own analysis.
A list of commonly used terms and abbreviations is presented below:
Term Meaning AA, AMR American Airlines BAA British Airport Authority BoD Board of Directors BVE Book value of equity BVD Book value of debt D Debt E Equity Load Factor Percentage of seats sold to total available seats MVE Market value of Equity MVD Market value of debt n.a, N/A Information not available n.m. Information not meaningful RAPM or Revenue Yield Revenues per passenger per mile T Tax rate
1 Translated using the average Local Currency/ Dollar rate for 2004 2 Translated using the closing local currency / Dollar rate as at 31 December 2004

6
For computational ease the analysis for each company has been undertaken in the reporting
currency under which the company reports annual results – US dollars (for AA and Asur), Euro
(Ryanair), British pounds (BAA). All figures are in million local currency unless otherwise indicated.
2. Brief description of the companies
Ameri can Airl ines
AMR was established in 1926 and had Charles Lindberg as chief pilot of its fleet of 3 DH 4 bi-
planes. The company was listed in 1939 and throughout the years grew on acquisitions and survived
several crisis (included World War II that forced them to turn half of the fleet to the military airline).
The company grew internationally and domestically especially after the deregulation act of 1978. In
2001, before September 11 acquired all the assets of TWA, but then was hit by an economic recession,
increased competition from low cost carriers and the terrorist attack.
Nowadays AMR Corporation is a holding company that provides scheduled passenger and
airfreight services to approximately 150 destinations in North America, the Caribbean, Latin America,
Europe and the Pacific through its American Airlines subsidiary. The Company in 2004 employed
roughly 92,000 people and its headquarter is at Dallas Forth Worth Airport, Texas. For the FY ended
12/31/04, revenues rose 7% to $18.65B. Net loss fell 38% to $761M. Results reflect higher affiliate
passenger revenues a decline in wage costs but also an increase in fuel costs.
Ryanair
Ryanair was founded in 1985 by the Ryan family in Ireland. It started with one scheduled flight
between south-eastern Ireland and London Gatwick. First crew members were required to be less
than 5 foot 2 inches tall in order to fit in the tiny cabin of the only 15-seater aircraft. Soon after its
launch, the company acquires permission to challenge British Airways and Aer Lingus on the Dublin –
London route. The number of passengers grew from 5,000 to 82,000 in the first 2 year of operations.
The next few years are marked by growth in the number of routes and passengers between Ireland and
the United Kingdom. However, by 1990 the company had accumulated over � 20 million in losses.
The Ryan family invested additional 20 million in capital in the business which went through
substantial financial and operational restructuring – copying the South West Airlines model, Ryanair
was re-launched as Europe’s first low cost airline. This was a revolutionary new model for the
European air transportation market and some publications note that “people queued up for three days
7
to get the Easter sale fares”. The new model incorporated move towards same aircraft fleet, direct
sales, scrapping of drinks and food served on board and cutting turnaround time and costs. In 1995
the company launches the first low cost airfares on UK routes and in 1997 – in Europe. In the same
year the company gets listed on the Irish Stock Exchange. Promotional fares of � 1 on domestic and
European routes attracted the attention of passengers. Today, Ryanair is the largest European low cost
airline carrying over 7 million passengers annually on 220 routes across 19 countries. Operations are
concentrated in 12 European bases and the company employees over 2,600 employees.
BAA
BAA is engaged in the management and operation of airport facilities in the UK and overseas.
The company is headquartered in London, UK and has a workforce of about 12,500 employees. The
company owns seven UK airports: Heathrow, Gatwick, Stansted, Glasgow, Edinburgh, Aberdeen and
Southampton. BAA also has interests in 13 airports located in Italy, Australia, US and Oman. BAA’s
airports in the UK and overseas serve 230 million passengers a year. The company’s operations are
divided into the following segments: airports, retail, BAA Property, rail and other. The airport segment
primarily oversees terminal and airfield management. In the terminal management area, the company
looks after buildings, passenger services and cargo. In the airfield management division, the company
maintains and operates runways and taxiways. BAA also develops, manages and markets commercial
activities at its UK airports. BAA’s UK airport retail activity is made up of two complementary
businesses: Retail management at UK airports and World Duty Free. Retail management at UK
airports involves the development, management and marketing of commercial activities at BAA’s
seven UK airports. These include shopping, catering, financial services, travel, services, parking,
telecommunications and media management. The business specializes in luxury brands and operates
64 stores across the UK airports.
Asur
Grupo Aeroportuario del Sureste (“Asur”) holds a concession from the Mexican government
to operate, maintain and develop nine airports in the, primarily touristic, Southeastern region of
Mexico. The company’s main airport is the Cancun International Airport, which generates over 70%
of Asur’s revenues and is the second busiest airport in Mexico. Cancun and the surrounding Mayan
Riviera, are Mexico’s top tourist destination and among the fastest growing tourist developments in
the country. Asur’s nine airports served more than 13.8 million passengers in 2004, of which around

8
60% were international passengers and 40% were domestic passengers. Approximately 70% of the
international passengers traveled on flights originating from the United States. As of 2003, 17
Mexican and 45 international airlines operated directly or through code-sharing agreements from
Asur’s airports.
Asur was established in 1998 as part of the Mexican government’s airport privatization program,
which included three regional airport groups and the Mexico City International Airport. A private
consortium, ITA, led by Copenhagen Airports won the 50-year concession to operate the nine airports
in the Southeastern group. The consortium acquired a 15% stake in Asur, while the remaining shares
were floated in the NYSE and the Mexican Stock Exchange on October 3, 2000. The Mexican
government, through one of its development banks, Nafin, retained an 11.1% stake in Asur to be
floated on a future date. As the long-term operator of the airports, Asur generates revenues from two
main sources: aeronautical services and non-aeronautical services. The former account for 75% of
total revenues and are derived primarily from passenger and landing charges, aircraft parking charges,
and general airport services. Non-aeronautical services are divided into retail operations and access
fees charged to third-party providers of complementary services. While the aeronautical revenues are
heavily regulated by the Mexican government, the retail operations and access fees provide an
important growth opportunity for Asur. These have grown at a compounded annual growth rate of
22.9% since 1999, when they accounted for only 14% of total revenues.
Summary financial data for each company is presented in Appendix I.
III. Corporate Governance Analysis
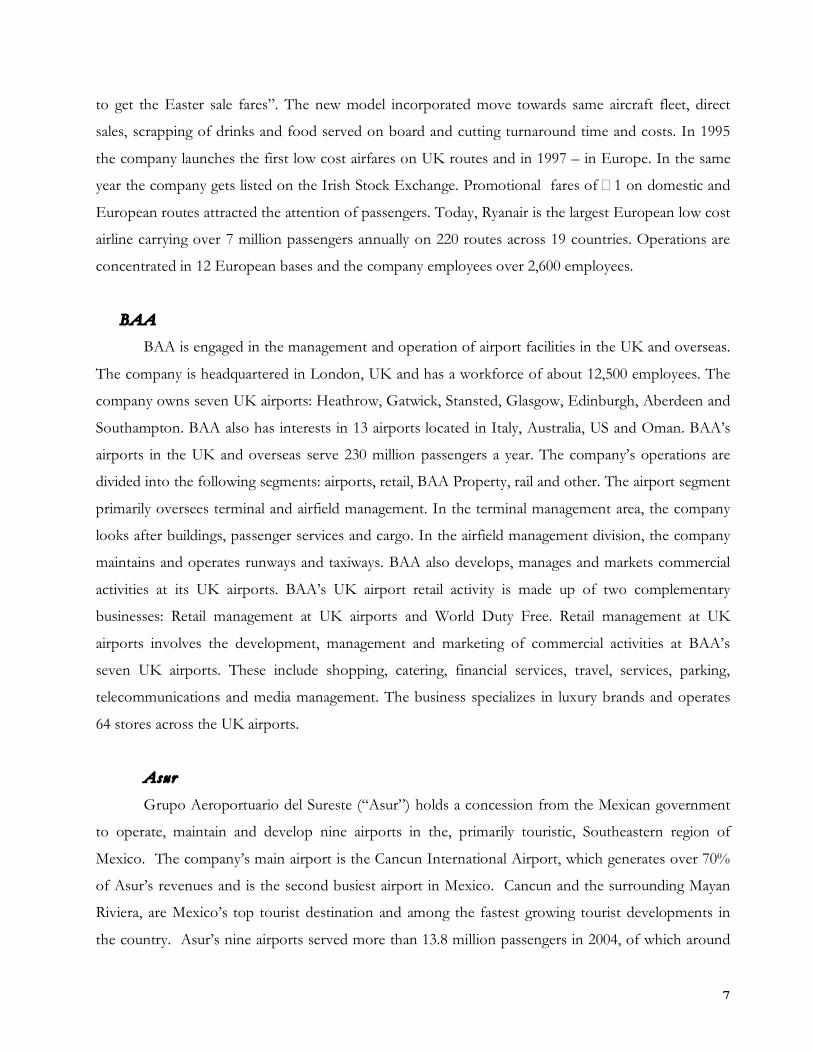
1. Balance of power between management and shareholders
We believe that the interests of shareholders are relatively well protected by the corporate
governance policies of the four companies analyzed, with the possible exception of American Airlines.
As an example at AA, directors are nominated for life and more than half are CEOs of other
companies, two of them in related businesses. A shareholder is challenging the lifetime rule at the
next general shareholders’ meeting in May. Recently, some board members and the CEO have raised
their own salaries.
Insiders are generally not overrepresented in the companies’ boards, while the CEOs tend to
have a long history with their companies, once again with the notable exception of American Airlines.
One interesting common feature is that all of the CEOs are relatively young with an average age of
9
only 48 years. These last two factors could suggest a dynamic leadership with intimate knowledge of
the challenges and opportunities facing their businesses. Although the balance of power seems to tilt
in favor of shareholders, it is interesting to note that 3 out of the 4 companies have board members
who are CEOs of other companies. This could indicate a lesser oversight due to the lack of time and
possible conflicts of interest, although it should be noted that only AA board members are CEOs of
related companies. Nonetheless, the large percentage of institutional shareholders in most firms, as
well as the relative absence of insiders in the boards of directors, leads us to believe that shareholders
hold an adequate level of power and oversight in their companies. An exception in terms of number
of insiders is BAA, where company executives represent a majority of the board. We believe that
management discretion is counterbalanced in this case by the oversight of the regulatory authority, the
Civil Aviation Authority (“CAA”).
Figure 2 Balance of power between stockholders and current managers
2. Management compensation
Management compensation does not appear to be an issue at any of the companies analyzed.
Only the CEO of Ryanair earns more than US$1 million in total compensation (half of which is in
stock options). All firms, with the exception of Asur, use stock options as a mean to align
management’s interest with those of shareholders, but with the exception of Ryanair, none of the
CEOs own a significant stake in their companies. Details about the CEOs, their compensations and
the composition of the Board are presented in Figure 3 and Figure 4.
Incumbent
managers
Balance of power
Stock
holdersR
yan
air
Asu
r
BA
A
AA
Incumbent
managers
Balance of power
Stock
holdersR
yan
air
Asu
r
BA
A
AA
Balance of power
Stock
holdersR
yan
air
Asu
r
BA
A
AA

10
Figure 3 Brief presentation of management
Chief Executive Officers American
Airlines Ryanair BAA Asur Name Gerard Arpey Michael O'Leary Mike Clasper Kjeld Binger Age 46 43 52 50
Years at the Company 23 17 4 6 (Asur), 11
(CPH) Years as CEO 3 9 3 1 Education MBA n.a. MA, Engeneering,
St John's College Cambridge
BSc in Structural and Civil
Engineering (Denmark)
CEO Compensation Salary ('000) 518.8 505.0 553.0 N/A Bonus ('000) - 127.0 167.0 N/A Other (‘000) 0.2 49.0 21.0 N/A Stock Options (‘000.) 172.0 502.0 525.0 0 Total Compensation (‘000).) 691.0 1,183.0 741.0 1,317.0* Stock Ownership (% of Total) 0.1% 5.44% 0.001% 0% Market Value of Stock Held (mm) 1.14 237 0.1 0.0 * Compensation to all 5 executive officers including the CEO Source: Annual reports, Statutory filings
Figure 4 Board of Directors
Board of Directors American
Airlines Ryanair BAA Asur Number of members 13 9 9 7 Insiders 1 1 5 3 CEO of other Companies? 7 no yes 3 Related Companies? 2 no No Yes Source: Annual reports, Bloomberg, various public sources
11
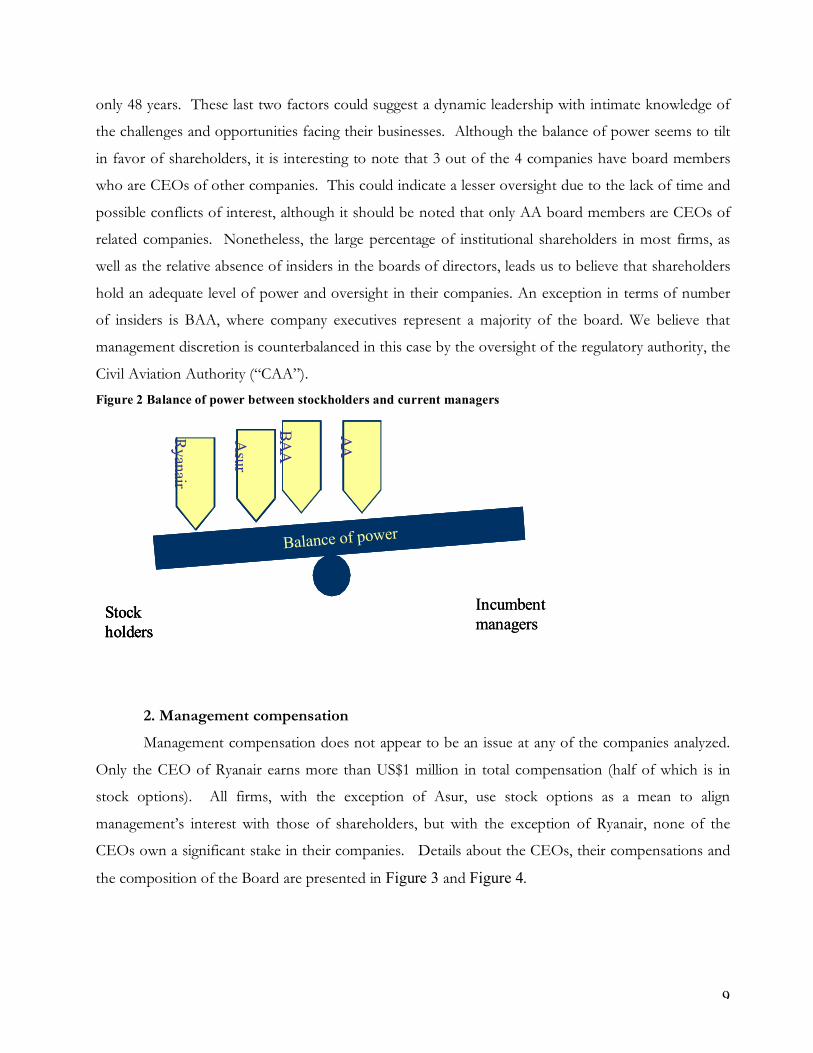
3. Market coverage
Figure 5 Firms and markets – sources of information
All firms, with the exception of American Airlines, have shares listed in more than one stock
exchange and thus garner significant investor’s interest outside of their home markets. In the case of
Asur, its shares are more heavily traded in the NYSE than in its home market of Mexico. The two
airlines in our sample are leaders in their sectors, while BAA is the largest airport group in the world
and Asur is the only public airport company in the Americas. As such and despite the travails of the
air transportation sector, all companies are relatively widely followed by the financial community and
command significant trading volumes. Nevertheless, with the exception of American Airlines, most of
the information on the companies is provided by the firms themselves, since some of the sub-sectors
in which they operate, discount airlines and airport operations, are relatively new and with few
comparable companies. With respect to the view of research analysts, this seems to be about evenly
split between buy and hold recommendations, despite their out-performance of the market, once again
with the notable exception of American Airlines.
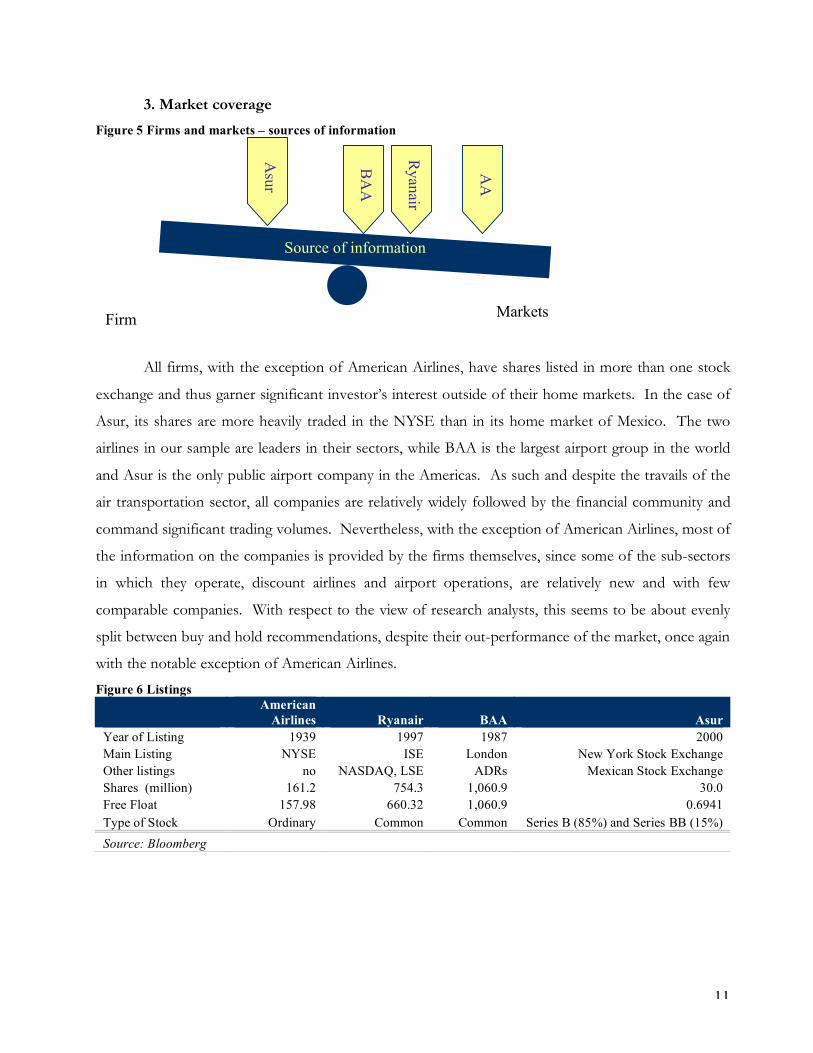
Figure 6 Listings
American
Airlines Ryanair BAA Asur Year of Listing 1939 1997 1987 2000 Main Listing NYSE ISE London New York Stock Exchange Other listings no NASDAQ, LSE ADRs Mexican Stock Exchange Shares (million) 161.2 754.3 1,060.9 30.0 Free Float 157.98 660.32 1,060.9 0.6941 Type of Stock Ordinary Common Common Series B (85%) and Series BB (15%) Source: Bloomberg
Markets
Source of information
Firm
Ryanair
Asur
BA
A
AA
12
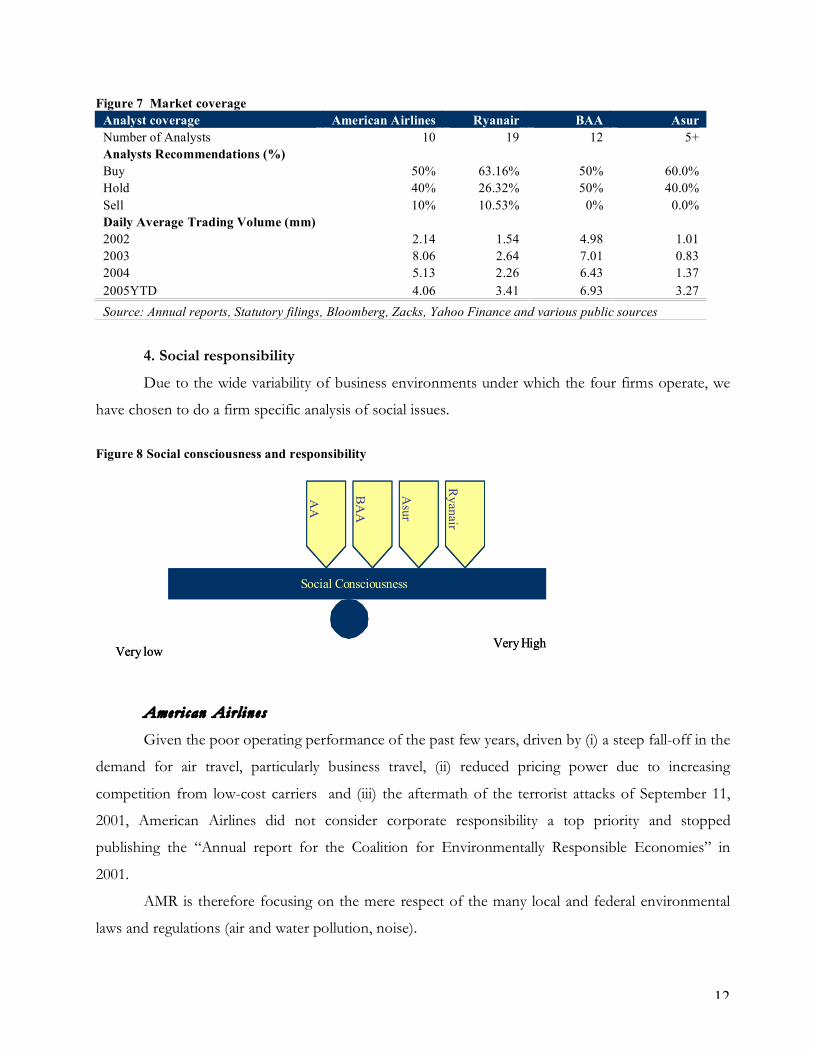
Figure 7 Market coverage Analyst coverage American Airlines Ryanair BAA Asur Number of Analysts 10 19 12 5+ Analysts Recommendations (%) Buy 50% 63.16% 50% 60.0% Hold 40% 26.32% 50% 40.0% Sell 10% 10.53% 0% 0.0% Daily Average Trading Volume (mm) 2002 2.14 1.54 4.98 1.01 2003 8.06 2.64 7.01 0.83 2004 5.13 2.26 6.43 1.37 2005YTD 4.06 3.41 6.93 3.27 Source: Annual reports, Statutory filings, Bloomberg, Zacks, Yahoo Finance and various public sources
4. Social responsibility
Due to the wide variability of business environments under which the four firms operate, we
have chosen to do a firm specific analysis of social issues.
Figure 8 Social consciousness and responsibility
Ameri can Airl ines
Given the poor operating performance of the past few years, driven by (i) a steep fall-off in the
demand for air travel, particularly business travel, (ii) reduced pricing power due to increasing
competition from low-cost carriers and (iii) the aftermath of the terrorist attacks of September 11,
2001, American Airlines did not consider corporate responsibility a top priority and stopped
publishing the “Annual report for the Coalition for Environmentally Responsible Economies” in
2001.
AMR is therefore focusing on the mere respect of the many local and federal environmental
laws and regulations (air and water pollution, noise).
Social Consciousness
Very lowVery High
Ryan
air
Asu
r
BA
A
AA
Social Consciousness
Very lowVery High
Ryan
air
Asu
r
BA
A
AA

13
The company has been named as a potentially responsible party for land or water
contaminations in California, Oklahoma and Florida. AMR has already accrued $ 6 millionn for
settlement expected, but the actual amount that AMR will have to pay is still unknown.
Ryanair
The perceived image of Ryanair as a low cost air carrier and provider of value of its passengers
is extremely important for the company. This image is aligned with the operational model of the
company, using modern fleet of aircrafts with lower fuel consumption reducing the emissions and
environmental damage. In addition, its policy to operate from remote airports resulted in numerous
benefits for the communities in these regions, increasing economic activity. However, major focus of
the company is to be perceived as a value provider for its passengers.
BAA
Given its handling of all the major airports in the UK BAA as well undergoes substantial
public scrutiny. Recently the debate over the environmental impact of the new Terminal at Heathrow
and the new runaway at Stansted has further heightened attention. BAA has always been receptive to
issues coming from airport communities and currently pledges 0.15% of its pre-tax profits (equiv. to
slightly under £1 mm in 2004). to 21st Century Communities Trust, a charity it created.
Asur
As the monopoly provider of the main airport facilities in nine southeastern Mexican cities,
Asur faces significant public oversight and societal constraints. The Mexican Airport Law of 1995
established the general framework regulating the construction, operation, maintenance and
development of Mexican airport facilities in the benefit of the public good. Moreover, Asur is also
subject to Mexican federal and state laws and regulations relating to the protection of the
environment. The level of environmental regulation in Mexico has increased in recent years, and the
enforcement of the law is becoming more stringent.
Asur generally has a positive image with the Mexican public and a strong reputation as a good
corporate citizen, since it has greatly improved the quality and scope of the facilities and services
offered by its nine airports. However, in the near future the company could face criticism by local

14
government officials that want to build new airport facilities in their regions, such as in Veracruz and
Quintana Roo (Cancun and Cozumel airports).
IV. Stockholder Analysis
All firms in our sample, with the exception of BAA which has a more widespread investor
base made up of small private investors, have a strong institutional shareholder base which commands
over 2/3 of the total outstanding shares of their companies. This contrasts sharply with an industry
average of only 33%, and gives credibility to our argument that corporate governance is relatively
strong and minority shareholder rights are well protected. Moreover, the top 5 institutional
shareholders in all companies are among the largest and most diversified asset management companies
in the world. On the other hand and with the exception of Asur, insider holdings are relatively small
and in line with the industry average of 6%. All these facts suggest that the marginal investor for all
firms is a well diversified global institutional investor and we can thus proceed to carry out CAPM
based risk and return analyses for the companies. In the case of BAA, even though the majority of the
shares are held by private individuals, these tend to be buy-and-hold investors with the majority of the
trading is done by institutional funds, which are therefore the marginal investor.
Most firms in our sample have only one type of share, common or ordinary. We take a look at
the exceptions below:
Ameri can Airl ines AMR Corporation has only common stock outstanding, but the board of directors has already
authorized the CEO to issue 20million shares of preferred stock, probably to ease the deep financial
stress of the company. Book value of equity has been negative for the last 3 quarters and debt ratio is
around 90%.
Asur Asur has two types of shares: B shares and BB shares. Series B shares currently represent 85%
of the company’s capital, while series BB shares represent the remaining 15%. Each series B share
and series BB share entitles the holder to one vote at the general shareholders’ meeting. However,
holders of series BB shares are entitled to elect only two members of the board of directors, while
holders of series B shares are entitled to name the remaining directors. Under the company’s bylaws,
each shareholder or group of shareholders owning at least 10% of Asur’s capital stock in the form of

15
series B shares is entitled to elect one member to the board of directors for each 10% interest that it
owns. Directors and senior management do not own any shares of Asur. Pursuant to the company’s
bylaws, the holders of series BB shares are entitled to appoint and remove Asur’s CEO and one half
of the executive officers reporting directly to the CEO. Currently, four executive officers report
directly to the CEO, one of whom was appointed by ITA as holder of the BB shares.
The shareholders distribution as well as details about institutional and insiders holdings in the
companies are presented in Figure 9, Figure 10 and Figure 11.
Figure 9 Distribution of stockholders
Institutional 12%
Institutional 69%
Insider 12%
Other 88%
Institutional 87%
Institutional 98%
Insider 2%
Insider 0.03%
Insider 31%
Other 1%
0%
10%
20%
30%
40%
50%
60%
70%
80%
90%
100%
AA Ryan BAA Asur
Figure 10 Institutional Holdings Institutional holdings American Airlines Ryanair BAA Asur Number of shares held (million)
158.0 n/a 124.2 20.8
% of Shares Outstanding
98.0% 70% + 11.6% 69.41%
Top 5 Holders Fidelity Management Fidelity Investment Legal & General First State Investment Management UK
Primecap Management Capital Group Company Scottish Widows Columbia Wagner Asset
Management
Wellington
Management Guilder Gagnon
Holding Newton Inv.
Mgmt Oakmark International
Small Cap Fund
Allianz Global Wellington
Management Threadneedle Inv. Schroder Investment
Management Group
Hall Phoenix Janus Causeway Capital American Express
Financial Corp Number of shares held by Top 5 (million)
69.5 392.2 93.1 6.5
% of Shares Outstanding 43.1% 52.0% 8.7% 21.57%
Source: Bloomberg, Statutory filings

16
Figure 11 Insiders holdings
Insiders ownership American Airlines Ryanair BAA Asur
Number of shares held (million) 3.22 88.3 0.3 9.2 % of Shares Outstanding 2% 12.47% 0.03% 30.59% Major Holders Daniel Garton
(CEO) Michael O'Leary Sir Mike Hodgkinson
(Exec. Director) ITA (15.01%)
Jeffrey Campbell Anthony Ryan Joel Hoerner
(Non-exec. Dir) Nafin (11.10%)
Charles Marlett (Executive VP)
Ryan Family members
Tony Ward (Exec. Director)
Copenhagen Airports (2.50%)
Gary Kennedy
JanisKong (Exec. Dir.) Fernando Chico Pardo
(1.98%) Source: Bloomberg, Statutory filings, various public sources
V. Risk Profile
1. Market risk and return In analyzing the risk characteristics of the four companies we first looked at their returns over
a five year period compared them to the returns of a broad based market index such as the S&P 500.
Figure 12 below presents the rebased share prices of all four companies and the level of the S&P 500
(Jan 2000 = 100).
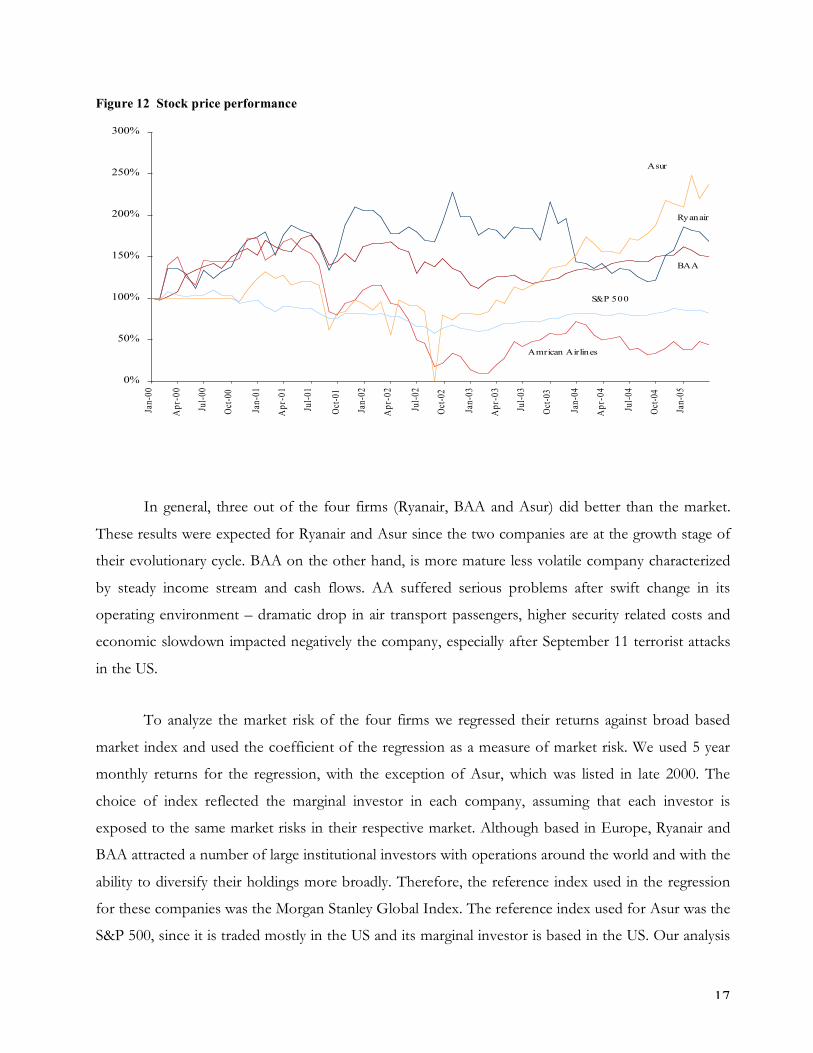
17
Figure 12 Stock price performance
0%
50%
100%
150%
200%
250%
300%
Jan
-00
Ap
r-0
0
Jul-
00
Oct
-00
Jan
-01
Ap
r-0
1
Jul-
01
Oct
-01
Jan
-02
Ap
r-0
2
Jul-
02
Oct
-02
Jan
-03
Ap
r-0
3
Jul-
03
Oct
-03
Jan
-04
Ap
r-0
4
Jul-
04
Oct
-04
Jan
-05
Amrican Airlines
S&P 500
Asur
BAA
Ryanair
In general, three out of the four firms (Ryanair, BAA and Asur) did better than the market.
These results were expected for Ryanair and Asur since the two companies are at the growth stage of
their evolutionary cycle. BAA on the other hand, is more mature less volatile company characterized
by steady income stream and cash flows. AA suffered serious problems after swift change in its
operating environment – dramatic drop in air transport passengers, higher security related costs and
economic slowdown impacted negatively the company, especially after September 11 terrorist attacks
in the US.
To analyze the market risk of the four firms we regressed their returns against broad based
market index and used the coefficient of the regression as a measure of market risk. We used 5 year
monthly returns for the regression, with the exception of Asur, which was listed in late 2000. The
choice of index reflected the marginal investor in each company, assuming that each investor is
exposed to the same market risks in their respective market. Although based in Europe, Ryanair and
BAA attracted a number of large institutional investors with operations around the world and with the
ability to diversify their holdings more broadly. Therefore, the reference index used in the regression
for these companies was the Morgan Stanley Global Index. The reference index used for Asur was the
S&P 500, since it is traded mostly in the US and its marginal investor is based in the US. Our analysis
18
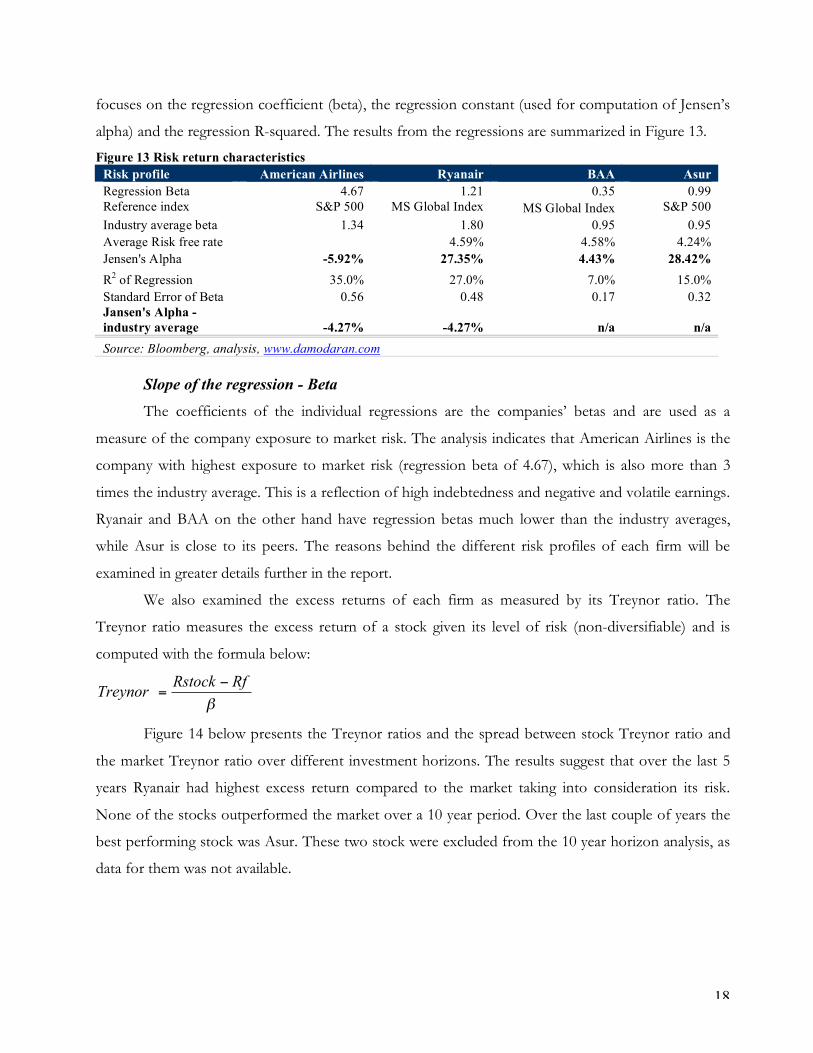
focuses on the regression coefficient (beta), the regression constant (used for computation of Jensen’s
alpha) and the regression R-squared. The results from the regressions are summarized in Figure 13.
Figure 13 Risk return characteristics Risk profile American Airlines Ryanair BAA Asur Regression Beta 4.67 1.21 0.35 0.99 Reference index S&P 500 MS Global Index MS Global Index S&P 500 Industry average beta 1.34 1.80 0.95 0.95 Average Risk free rate 4.59% 4.58% 4.24% Jensen's Alpha -5.92% 27.35% 4.43% 28.42% R2 of Regression 35.0% 27.0% 7.0% 15.0% Standard Error of Beta 0.56 0.48 0.17 0.32 Jansen's Alpha - industry average -4.27% -4.27% n/a n/a Source: Bloomberg, analysis, www.damodaran.com
Slope of the regression - Beta The coefficients of the individual regressions are the companies’ betas and are used as a
measure of the company exposure to market risk. The analysis indicates that American Airlines is the
company with highest exposure to market risk (regression beta of 4.67), which is also more than 3
times the industry average. This is a reflection of high indebtedness and negative and volatile earnings.
Ryanair and BAA on the other hand have regression betas much lower than the industry averages,
while Asur is close to its peers. The reasons behind the different risk profiles of each firm will be
examined in greater details further in the report.
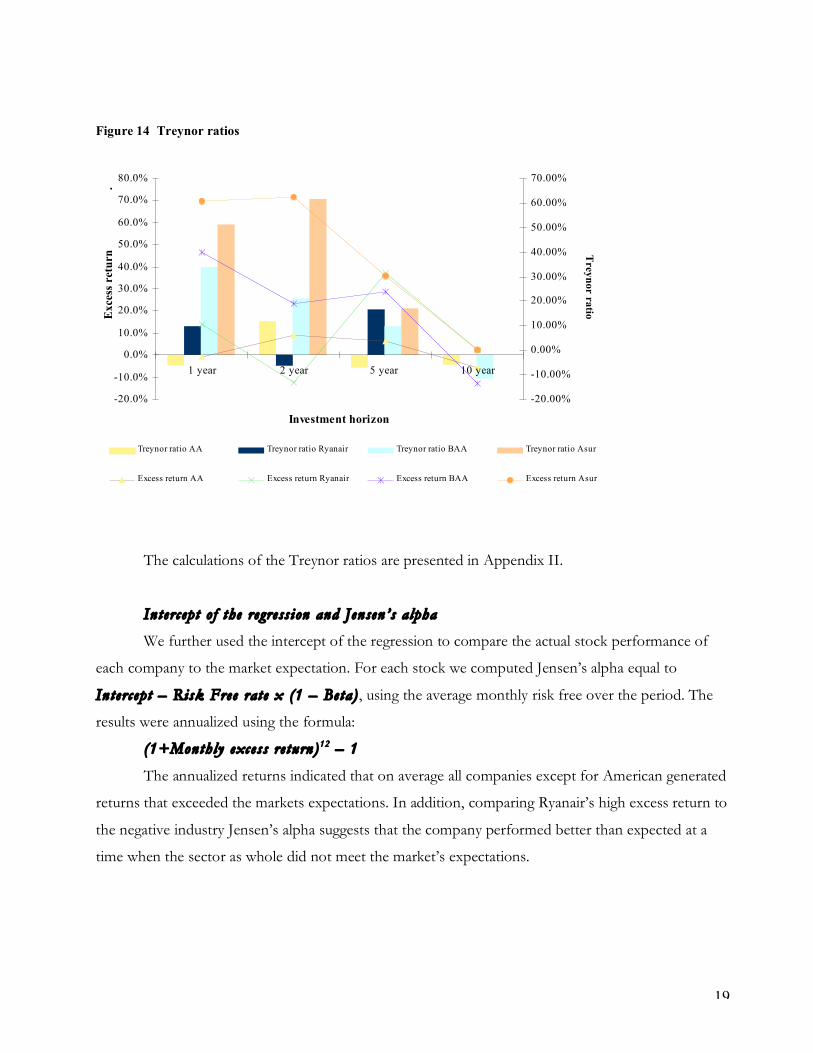
We also examined the excess returns of each firm as measured by its Treynor ratio. The
Treynor ratio measures the excess return of a stock given its level of risk (non-diversifiable) and is
computed with the formula below:
!
RfRstockTreynor
"=
Figure 14 below presents the Treynor ratios and the spread between stock Treynor ratio and
the market Treynor ratio over different investment horizons. The results suggest that over the last 5
years Ryanair had highest excess return compared to the market taking into consideration its risk.
None of the stocks outperformed the market over a 10 year period. Over the last couple of years the
best performing stock was Asur. These two stock were excluded from the 10 year horizon analysis, as
data for them was not available.
19
Figure 14 Treynor ratios
The calculations of the Treynor ratios are presented in Appendix II.
In t erc ept o f the regress ion and Jensen ’s alpha
We further used the intercept of the regression to compare the actual stock performance of
each company to the market expectation. For each stock we computed Jensen’s alpha equal to
Interc ept – Risk Free rat e x (1 – Beta) , using the average monthly risk free over the period. The
results were annualized using the formula:
(1+Monthly excess re turn)12 – 1
The annualized returns indicated that on average all companies except for American generated
returns that exceeded the markets expectations. In addition, comparing Ryanair’s high excess return to
the negative industry Jensen’s alpha suggests that the company performed better than expected at a
time when the sector as whole did not meet the market’s expectations.
-20.0%
-10.0%
0.0%
10.0%
20.0%
30.0%
40.0%
50.0%
60.0%
70.0%
80.0%
1 year 2 year 5 year 10 year
Investment horizon
Exce
ss r
etu
rn
.
-20.00%
-10.00%
0.00%
10.00%
20.00%
30.00%
40.00%
50.00%
60.00%
70.00%
T
reyn
or ra
tio
Treynor ratio AA Treynor ratio Ryanair Treynor ratio BAA Treynor ratio Asur
Excess return AA Excess return Ryanair Excess return BAA Excess return Asur
20
R-squared
R-squared of the regression provides information as to what proportion of the variability in
returns could be explained by the regression, or in other words what part of the variability in the
returns (total risk) can be attributed to beta (market risk). The market non-diversifiable risk represents
35%, 27%, 7% and 15% for AA, Ryanair, BAA and Asur respectively. The remainder is company
specific, non-diversifiable risk. While the relatively low R-squared for Ryanair and Asur could be
explained by the fact that they were small, fast growing companies during the observed period and
were facing numerous company specific challenges in establishing their business models, we were
surprised to estimate that BAA was characterized by a large proportion of (93%) of company specific,
diversifiable risk. One possible explanation could be the fact that airport operators’ revenues are
generally much more stable stream and have a fixed nature – they are based on long term contracts
under which airport slots are sold to airline companies. Even in the event of drop in passenger
numbers the charge payable to airports is generally steady.
Standard errors
The standard errors of the regression betas appear to be significant, suggesting a wide interval
for the possible values of the beta. This is one of the reasons why we considered an alternative
approach to measuring the companies exposure to market risk, which is described bellow.
2. Bottom up betas As an alternative approach to regressions betas we considered using bottom-up betas for our
analysis. This is mainly due to the following factors:
As growing companies Ryanair and Asur are likely to change over time, hence alter
their risk profile. In addition, their capital structure is likely to change;
BAA is mature, steady company which risk profile is likely to remain similar.
However, the standard error of the regression beta indicates that it might nor be a
reliable measure of risk;
American Airline as a company facing financial difficulties is likely to change in the
long term if it is to return to profitability. Making a going concern assumption
about the business requires change in the company and hence, its risk profile.
Therefore we believed that historical indicators might not be a reliable measure for
the future.
21
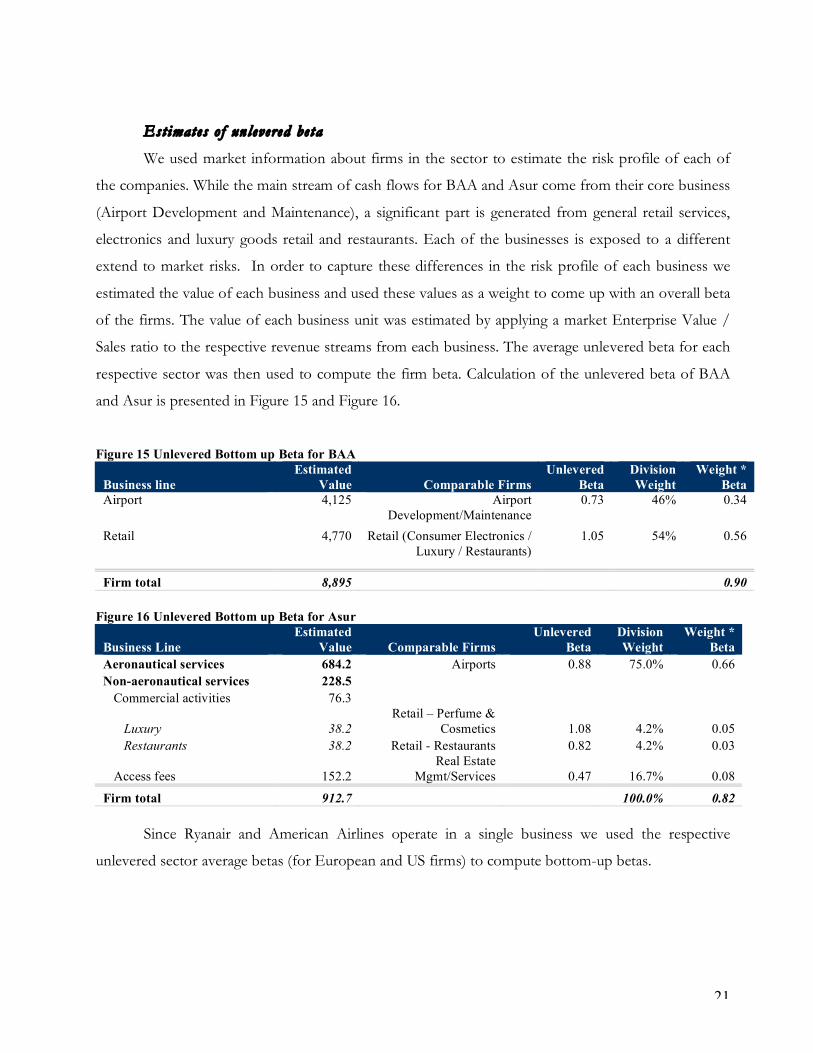
Est imates o f un levered be ta
We used market information about firms in the sector to estimate the risk profile of each of
the companies. While the main stream of cash flows for BAA and Asur come from their core business
(Airport Development and Maintenance), a significant part is generated from general retail services,
electronics and luxury goods retail and restaurants. Each of the businesses is exposed to a different
extend to market risks. In order to capture these differences in the risk profile of each business we
estimated the value of each business and used these values as a weight to come up with an overall beta
of the firms. The value of each business unit was estimated by applying a market Enterprise Value /
Sales ratio to the respective revenue streams from each business. The average unlevered beta for each
respective sector was then used to compute the firm beta. Calculation of the unlevered beta of BAA
and Asur is presented in Figure 15 and Figure 16.
Figure 15 Unlevered Bottom up Beta for BAA
Business line Estimated
Value Comparable Firms Unlevered
Beta Division Weight
Weight * Beta
Airport 4,125 Airport Development/Maintenance
0.73 46% 0.34
Retail 4,770 Retail (Consumer Electronics / Luxury / Restaurants)
1.05 54% 0.56
Firm total 8,895 0.90
Figure 16 Unlevered Bottom up Beta for Asur
Business Line Estimated
Value Comparable Firms Unlevered
Beta Division Weight
Weight * Beta
Aeronautical services 684.2 Airports 0.88 75.0% 0.66 Non-aeronautical services 228.5
Commercial activities 76.3
Luxury 38.2 Retail – Perfume &
Cosmetics 1.08 4.2% 0.05 Restaurants 38.2 Retail - Restaurants 0.82 4.2% 0.03
Access fees 152.2 Real Estate
Mgmt/Services 0.47 16.7% 0.08
Firm total 912.7 100.0% 0.82 Since Ryanair and American Airlines operate in a single business we used the respective
unlevered sector average betas (for European and US firms) to compute bottom-up betas.
22
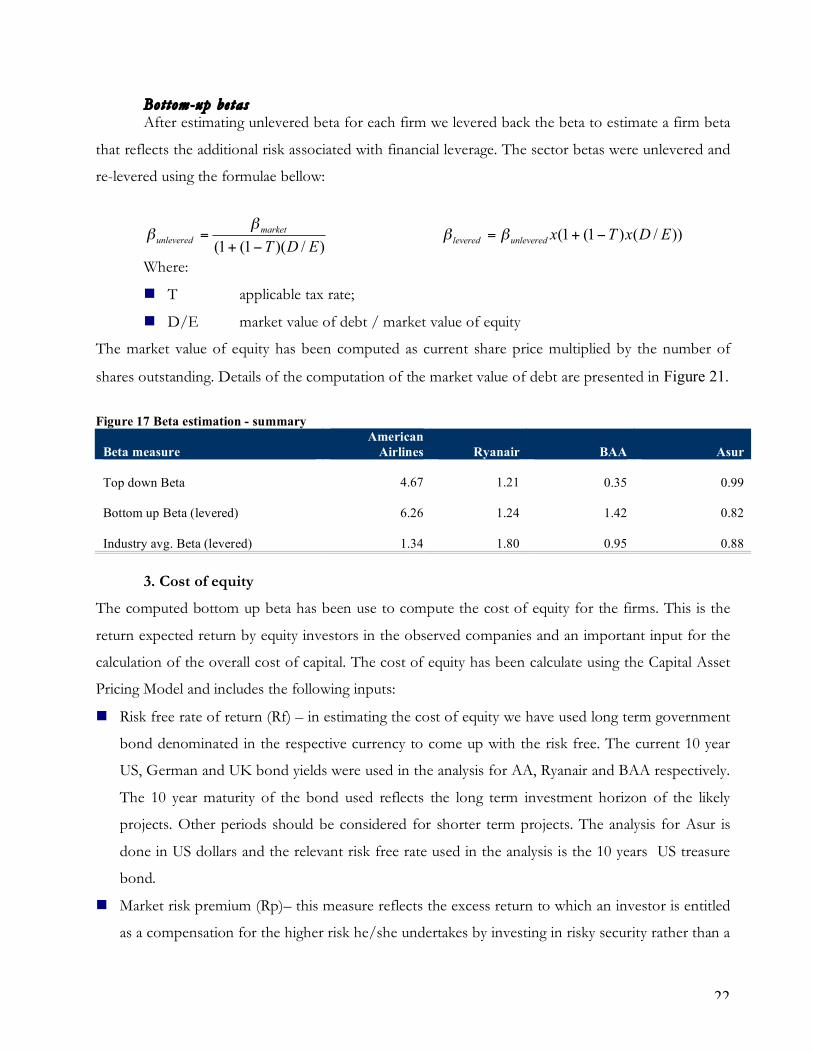
Bottom-up be tas After estimating unlevered beta for each firm we levered back the beta to estimate a firm beta
that reflects the additional risk associated with financial leverage. The sector betas were unlevered and
re-levered using the formulae bellow:
)/)(1(1( EDT
market
unlevered
!+=
"" ))/()1(1( EDxTx
unleveredlevered!+= ""
Where:
T applicable tax rate;
D/E market value of debt / market value of equity
The market value of equity has been computed as current share price multiplied by the number of
shares outstanding. Details of the computation of the market value of debt are presented in Figure 21.
Figure 17 Beta estimation - summary
Beta measure American
Airlines Ryanair BAA Asur
Top down Beta
4.67
1.21 0.35 0.99
Bottom up Beta (levered)
6.26
1.24 1.42 0.82
Industry avg. Beta (levered)
1.34
1.80 0.95 0.88 3. Cost of equity
The computed bottom up beta has been use to compute the cost of equity for the firms. This is the
return expected return by equity investors in the observed companies and an important input for the
calculation of the overall cost of capital. The cost of equity has been calculate using the Capital Asset
Pricing Model and includes the following inputs:
Risk free rate of return (Rf) – in estimating the cost of equity we have used long term government
bond denominated in the respective currency to come up with the risk free. The current 10 year
US, German and UK bond yields were used in the analysis for AA, Ryanair and BAA respectively.
The 10 year maturity of the bond used reflects the long term investment horizon of the likely
projects. Other periods should be considered for shorter term projects. The analysis for Asur is
done in US dollars and the relevant risk free rate used in the analysis is the 10 years US treasure
bond.
Market risk premium (Rp)– this measure reflects the excess return to which an investor is entitled
as a compensation for the higher risk he/she undertakes by investing in risky security rather than a
23
riskless one. We have used the geometric average of excess returns from the US market over long
term Treasury bonds for the period between 1929 and 2004. We assumed that the US market,
being the largest and most mature capital market in the world is a good proxy for the market risk
premium required by the investors. In the case of Asur, we added an additional country risk
premium of 1.8%, to account for the increased risk to equity investors of investing in a Mexican-
based company. The country risk premium is based on the Mexican sovereign debt rating of Baa
(spread of 1.2%) and relative volatility of equity compared to bonds (assumed to be 1.5 times).
The country risk premium applied to Asur was 1.8%
Beta – as computed above.
The cost of equity, for all companies except Asur, is defined as:
Ke = Rf + β x Rp The cost of equity for Asur, is defined as:
Ke = Rf + β x (Rp+Country Risk) We did not add any country risk premium for AMR, Ryanair or BAA, since the US, Republic of
Ireland and the UK are all AAA rated countries.
The cost of equity computation is summarized in Figure 18.
Figure 18 Calculation of cost of equity Cost of Equity American Airlines Ryanair BAA Asur Risk Free Rate 4.27% 3.47% 4.5% 4.24% Beta 6.26 1.24 1.42 0.82 Risk Premium 4.82% 4.82% 4.82% 4.82% Country Risk - - - 1.80% Cost of Equity 34.54% 9.45% 11.30% 9.65%
4. Cost of debt
The other important component of the cost of capital is the cost of debt. It reflects the
perceived risk of the companies by lenders and debt investors, or its credit risk. The two components
of credit risk are default risk (or the probability that a company will cease making payments as agreed
in the credit agreement) and non-recovery risk (or the probability of recovery of the capital provided,
once the company goes in default). More detailed analysis of the borrowing policies of all firms is
presented in Section VII Capital Structure.
24
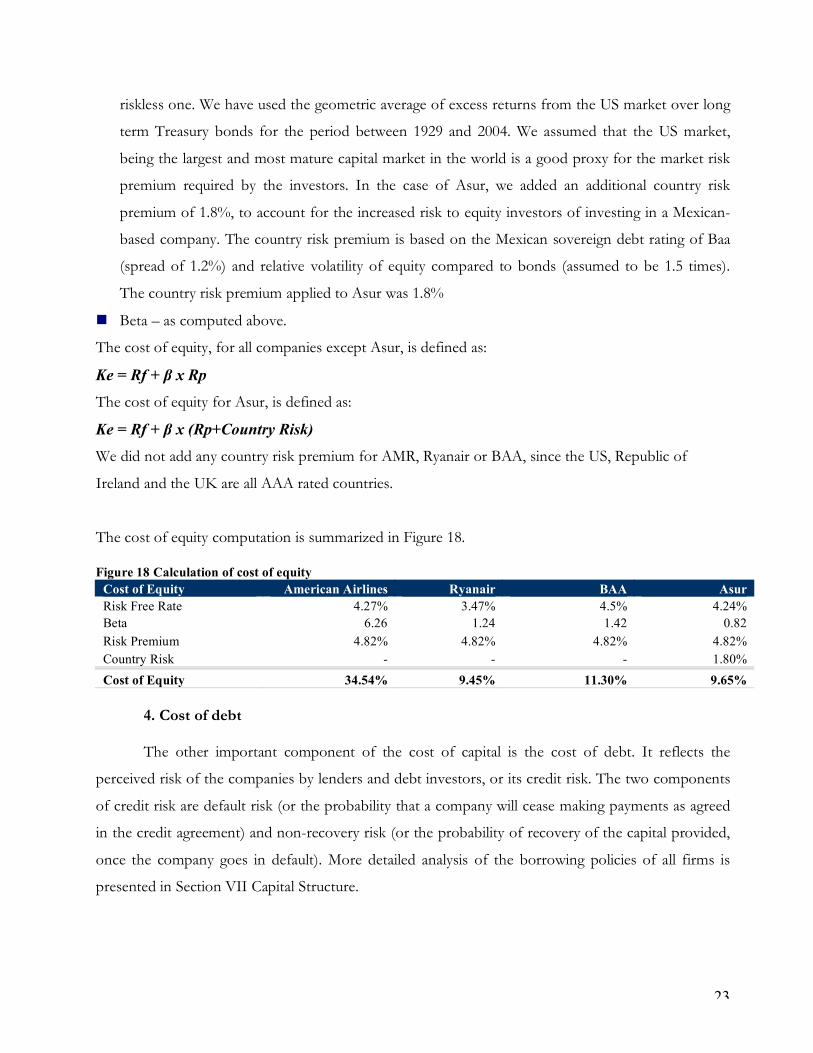
The cost of debt for each company has two components – a risk free rate of return and
compensation for the credit risk associated with the company. In estimating the credit risk for each
company we took 2 approaches:
For American Airlines and BAA we looked at the current credit rating of the company.
The companies had recently issued traded bonds which represent a good indicator of the risk of
their debt and hence we used the implied default read on long term publicly traded debt.
Since Ryanair has not issued any publicly traded debt, we computed synthetic credit
rating for the firm based on its interest rate cover ratio.
Asur currently has no debt.
After obtaining the respective credit ratings we looked at the credit default spreads
corresponding to each rating, which is a measure of the risk premium required. For AA and BAA we
used the credit default spread embedded in current yields of publicly traded debt. We computed the
cost of debt for each by adding the default spread to the risk free rate for the respective company. The
results are presented in Figure 19.
Figure 19 Calculation of cost of debt Cost of debt American Airlines Ryanair BAA Asur Credit Rating CCC A- A+ n.a. Spread vs. Treasury (a) 9.66% 1.00% 0.70% 0.00% Risk Free Rate (b) 4.27% 3.47% 4.47% 0.00% Pre-tax Cost of Debt (c) = (a) + (b) 13.93% 4.47% 5.17% 0.00% Marginal Tax Rate 35.00% 12.50% 30.00% 33.00% After Tax Cost of Debt (c) * (1-tax rate) 13.93% 3.91% 3.62% 0.00%
After computing the cost of debt for each firm we computed the after tax cost of debt. The
after tax cost of debt reflects the fact that interest payable on debt is deductible from the operating
income for tax purposes and results in tax savings for the firms.
In the case of American Airlines, the company cannot benefit from lower tax bill by financing
its operations with debt. The company has net operating loss before interest and hence pays no taxes.
In addition American Airlines has a huge accumulated tax loss, which could be carried forward and
used to offset future taxable income. Therefore the company does not enjoy tax benefits from the use
of debt and we excluded this component from the cost of capital calculation.

25
5. Cost of capital
Market value o f equi ty
The market value of equity for each firm has been estimated by multiplying the number of
shares outstanding for each company by the current share price. The market values of equity are
presented in Figure 20.
Figure 20 Market values of equity Market Value of Equity (million) American Airlines Ryanair BAA Asur
Market Value of Equity (million) 1,862.2 4,352.4 6,153.3 912.7
Source: Bloomberg
Market value o f debt
In estimating the market value of debt we again took two approaches:
Use the current value for debt that is publicly traded and information is obtainable;
Project interest and principal payments and discount them back at the current cost of
debt as estimated above.
In projecting the interest payments we have used the current interest payments to book value
of debt ratio as a proxy for the average interest rate payable on the debt; and the average maturity of
the outstanding debt.
In addition, AA, Ryanair and BAA have significant operating lease commitments, which are
not recorded in their books. Such commitments require that the firms make regular payments to the
lessors in exchange for the use of assets (aircrafts, real estate). Such transactions are treated as rent for
accounting purposes and lease payments are recorded as operating expense. The essence of the
transaction, however, is financing the use of the assets and lease payments could be viewed as interest
and principal repayment of a loan provided for the acquisition of the assets. Moreover, the companies
are committed to making these payments for a long period of time.
We treated lease commitment as another form of debt and discounted the future lease
payments at the current cost of debt to estimate their current market value. The present value of all
future lease payments have been included in the market value of the companies’ debt and the
operating income has been adjusted by adding back the operating lease payment and subtracting the
estimated depreciation charge associated with recording the leased assets in the companies’ books.
Summary of the market value of debt calculation is presented in Figure 21.
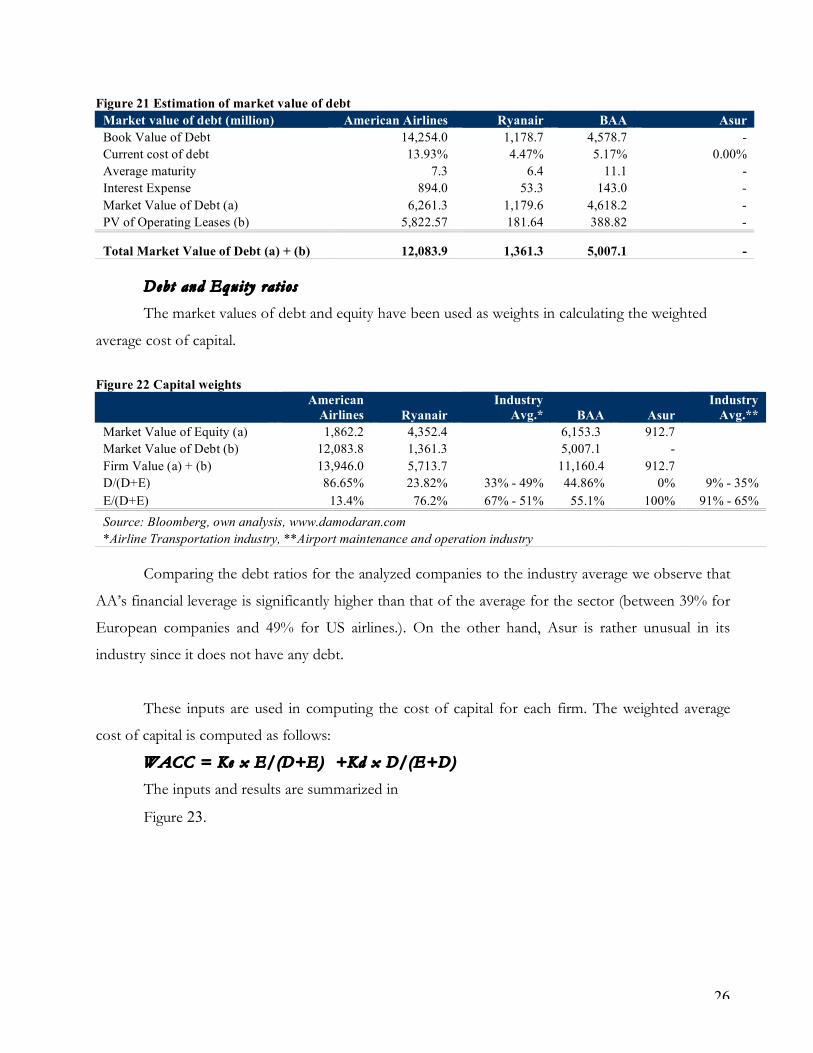
26
Figure 21 Estimation of market value of debt Market value of debt (million) American Airlines Ryanair BAA Asur Book Value of Debt 14,254.0 1,178.7 4,578.7 - Current cost of debt 13.93% 4.47% 5.17% 0.00% Average maturity 7.3 6.4 11.1 - Interest Expense 894.0 53.3 143.0 - Market Value of Debt (a) 6,261.3 1,179.6 4,618.2 - PV of Operating Leases (b) 5,822.57 181.64 388.82 -
Total Market Value of Debt (a) + (b) 12,083.9 1,361.3 5,007.1 -
Debt and Equity rat ios
The market values of debt and equity have been used as weights in calculating the weighted
average cost of capital.
Figure 22 Capital weights
American
Airlines Ryanair Industry
Avg.* BAA Asur Industry
Avg.** Market Value of Equity (a) 1,862.2 4,352.4 6,153.3 912.7 Market Value of Debt (b) 12,083.8 1,361.3 5,007.1 - Firm Value (a) + (b) 13,946.0 5,713.7 11,160.4 912.7 D/(D+E) 86.65% 23.82% 33% - 49% 44.86% 0% 9% - 35% E/(D+E) 13.4% 76.2% 67% - 51% 55.1% 100% 91% - 65% Source: Bloomberg, own analysis, www.damodaran.com *Airline Transportation industry, **Airport maintenance and operation industry
Comparing the debt ratios for the analyzed companies to the industry average we observe that
AA’s financial leverage is significantly higher than that of the average for the sector (between 39% for
European companies and 49% for US airlines.). On the other hand, Asur is rather unusual in its
industry since it does not have any debt.
These inputs are used in computing the cost of capital for each firm. The weighted average
cost of capital is computed as follows:
WACC = Ke x E/(D+E) +Kd x D/(E+D)
The inputs and results are summarized in
Figure 23.

27
Figure 23 Calculation of cost of capital Cost of capital American Airlines Ryanair BAA Asur Beta 6.26 1.24 1.42 0.82 Cost of Equity 34.54% 9.45% 11.30% 9.65% E/(D+E) 13.35% 76.18% 55.14% 100.00% After-tax Cost of Debt 13.93% 3.91% 3.62% 0.00% D/(D+E) 86.65% 23.82% 44.86% 0.00% WACC 16.69% 8.13% 7.85% 9.65%
Not surprisingly the company with highest cost of capital is American Airlines, reflecting its
high risk. The high cost of capital is driven by two factors – high beta (volatile earnings and high debt
to equity ratio) and high cost of debt (low credit rating because of high debt and huge interest
payments). The lowest cost of capital, that of BAA, reflects the fact that the company is relatively
mature and stable, with predictable earnings and cash flows and is less subjective to market
fluctuations.
The estimated cost of capital of and cost equity are the hurdle rates that should be used in
capital allocation decisions in each company. These are the minimum acceptable rates against
performance of each new project considered should be measured – return on equity against the cost
of equity and return on capital against cost of capital. In addition, the cost of equity and cost of capital
rates are the rates at which projects’ cash flows should be discounted to estimate their net present
value.
VI. Investment Return Analysis
The ability of each firm to grow and create value for its stockholders ultimately depends on its
management capability to identify and undertake projects that generate returns exceeding the cost of
capital employed. In this section we will analyze the quality of the projects that the four companies
undertake ad review the past performance of the companies as measured by indicators such as Return
on Capital (ROC) and Return on Equity (ROE).
1. Typical project
The companies, subject to our analysis are involved primarily in 3 types of businesses – air
transportation, aeronautical services and retail services. Aeronautical services include operation and
maintenance of airport and all related facilities that are used by passengers and airlines. Some of the
characteristics of a typical project for each business are presented in Figure 24.
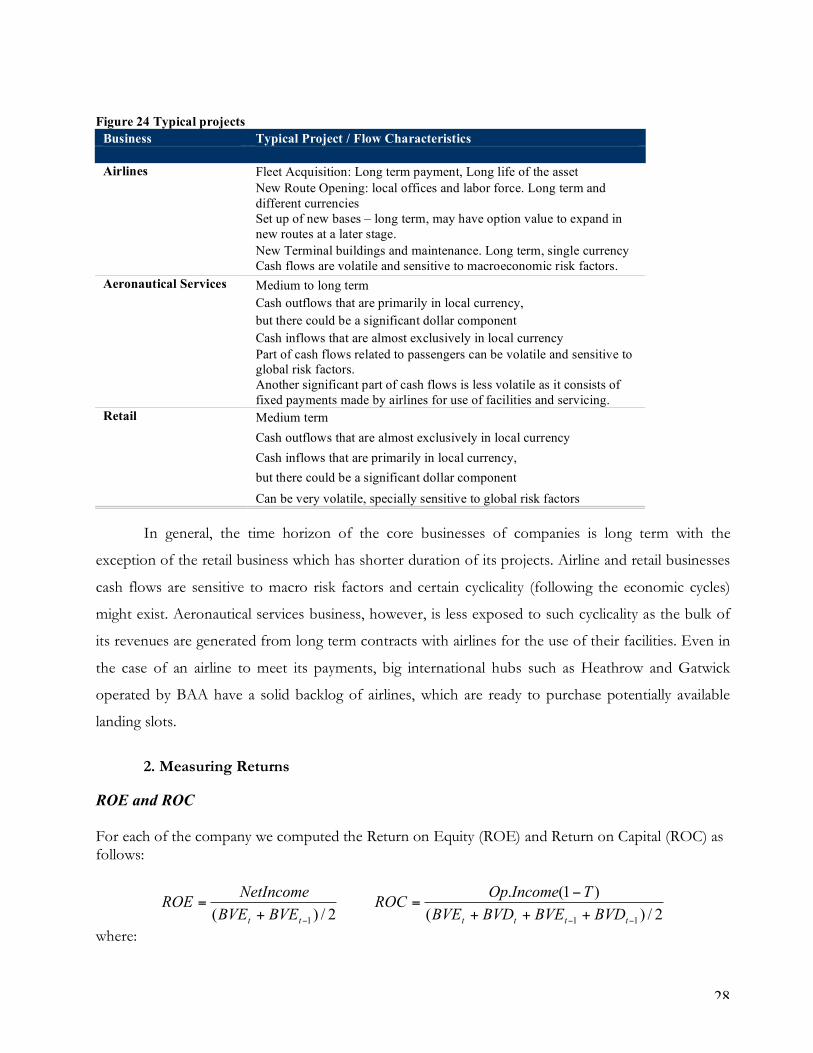
28
Figure 24 Typical projects
Business Typical Project / Flow Characteristics
Fleet Acquisition: Long term payment, Long life of the asset New Route Opening: local offices and labor force. Long term and different currencies Set up of new bases – long term, may have option value to expand in new routes at a later stage.
Airlines
New Terminal buildings and maintenance. Long term, single currency Cash flows are volatile and sensitive to macroeconomic risk factors. Medium to long term Cash outflows that are primarily in local currency, but there could be a significant dollar component Cash inflows that are almost exclusively in local currency
Aeronautical Services
Part of cash flows related to passengers can be volatile and sensitive to global risk factors. Another significant part of cash flows is less volatile as it consists of fixed payments made by airlines for use of facilities and servicing. Medium term Cash outflows that are almost exclusively in local currency Cash inflows that are primarily in local currency, but there could be a significant dollar component
Retail
Can be very volatile, specially sensitive to global risk factors
In general, the time horizon of the core businesses of companies is long term with the
exception of the retail business which has shorter duration of its projects. Airline and retail businesses
cash flows are sensitive to macro risk factors and certain cyclicality (following the economic cycles)
might exist. Aeronautical services business, however, is less exposed to such cyclicality as the bulk of
its revenues are generated from long term contracts with airlines for the use of their facilities. Even in
the case of an airline to meet its payments, big international hubs such as Heathrow and Gatwick
operated by BAA have a solid backlog of airlines, which are ready to purchase potentially available
landing slots.
2. Measuring Returns
ROE and ROC For each of the company we computed the Return on Equity (ROE) and Return on Capital (ROC) as follows:
2/)( 1!+=
ttBVEBVE
NetIncomeROE
2/)(
)1(.
11 !! +++
!=
tttt BVDBVEBVDBVE
TIncomeOpROC
where:
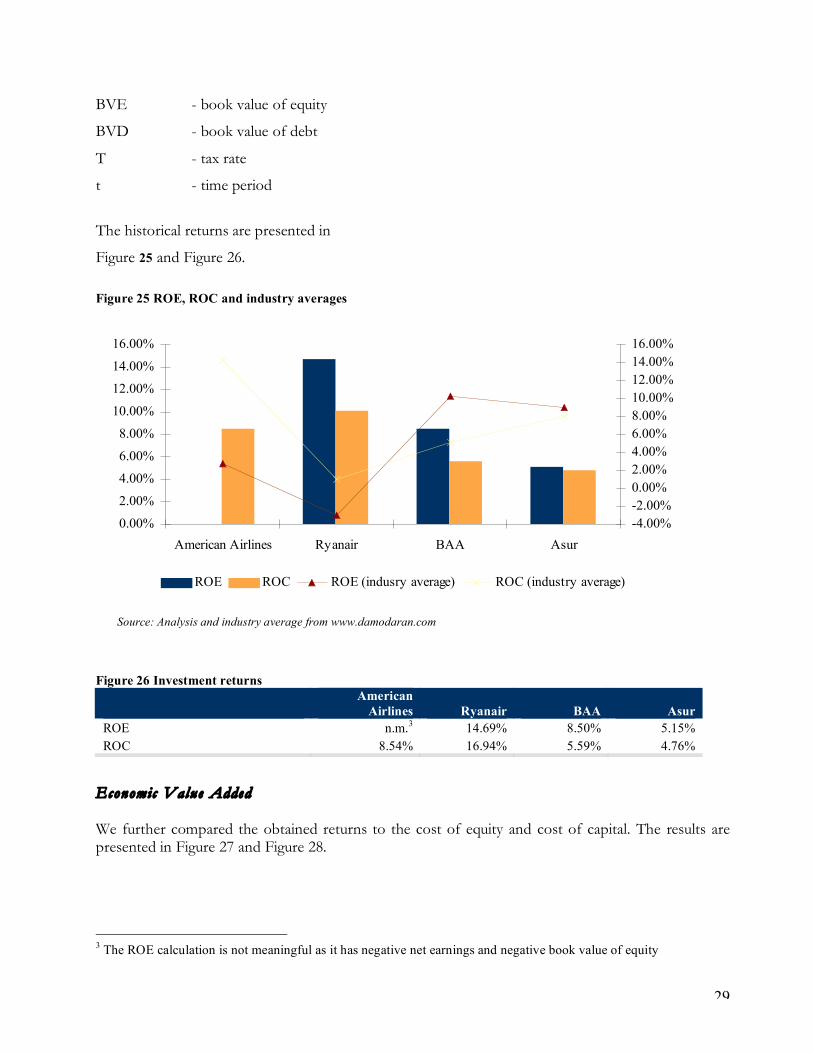
29
BVE - book value of equity
BVD - book value of debt
T - tax rate
t - time period
The historical returns are presented in
Figure 25 and Figure 26.
Figure 25 ROE, ROC and industry averages Figure 26 Investment returns
American
Airlines Ryanair BAA Asur ROE n.m.3 14.69% 8.50% 5.15% ROC 8.54% 16.94% 5.59% 4.76%
Economic Value Added We further compared the obtained returns to the cost of equity and cost of capital. The results are presented in Figure 27 and Figure 28.
3 The ROE calculation is not meaningful as it has negative net earnings and negative book value of equity
0.00%
2.00%
4.00%
6.00%
8.00%
10.00%
12.00%
14.00%
16.00%
American Airlines Ryanair BAA Asur
-4.00%
-2.00%
0.00%
2.00%
4.00%
6.00%
8.00%
10.00%
12.00%
14.00%
16.00%
ROE ROC ROE (indusry average) ROC (industry average)
Source: Analysis and industry average from www.damodaran.com

30
Figure 27 Equity Economic Value Added
American
Airlines Ryanair BAA Asur ROE (a)4 nm 14.69% 8.50% 5.15% Cost of Equity (b) 34.54% 9.45% 11.30% 9.65% Equity Return Spread (a)-(b) nm 5.24% -2.80% -3.23% Average book value of equity (268.0) 1,574.7 4,797.0 1,057.7
Equity EVA n.a
82.5
(134.5)
(47.6)
From the companies included in the analysis only Ryanair created excess returns on equity
(Return in Equity – Cost of Equity). It created a positive equity economic value added (EVA) of €
82.5 million based on the last 12 months results. At the same time the airline industry destroyed on
average value of $ 4,95765.7 in 20045. Both BAA and Asur had return on equity lower than their cost
of equity. Comparing these results with the positive Jensen’s alpha values calculated in Section IV, we
can conclude that although both firms performed better that the market expected, they still have not
generated equity returns in excess of their equity costs.
Multiplying the spread between the return on capital and cost of capital for each company by
the average book value of total capital (equity + debt) we estimated the economic value added for each
firm.
Figure 28 Economic Value Added
American
Airlines Ryanair BAA Asur ROC 8.54% 10.14% 5.59% 4.76% Cost of Capital (b) 16.69% 8.13% 7.85% 9.65% Capital Return Spread (a)-(b) -8.15% 2.01% -2.27% -4.89% Average book value of capital 13,862.5 2,652.8 8,427.0 1,057.7 EVA (million) (1,129.5) 53.3 (191.0) (51.7)
Again the only company that created value during the observed period was Ryanair. The
average EVA for the sector in 2004 was $9,551.76
3. Future outlook
The ability of any of the companies to generate positive excess returns depends on its competitive
advantages and their sustainability in the medium and long term. In this section we look at some key
4 The ROE calculation is not meaningful as it has negative net earnings and negative book value of equity 5 Equity EVA for US market used as a comparison. Source: www.damodaran.com 6 EVA for US air transportation sector used as comparable. Source: www.damodaran.com
31
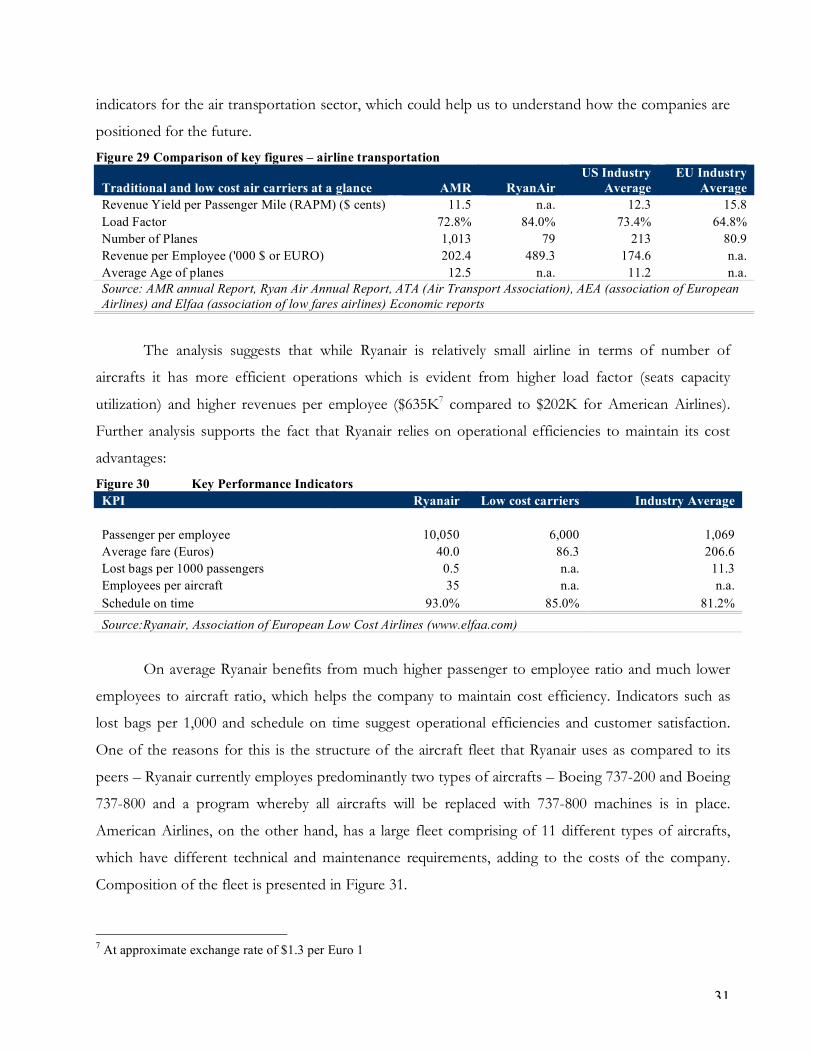
indicators for the air transportation sector, which could help us to understand how the companies are
positioned for the future.
Figure 29 Comparison of key figures – airline transportation
Traditional and low cost air carriers at a glance AMR RyanAir US Industry
Average EU Industry
Average Revenue Yield per Passenger Mile (RAPM) ($ cents) 11.5 n.a. 12.3 15.8 Load Factor 72.8% 84.0% 73.4% 64.8% Number of Planes 1,013 79 213 80.9 Revenue per Employee ('000 $ or EURO) 202.4 489.3 174.6 n.a. Average Age of planes 12.5 n.a. 11.2 n.a. Source: AMR annual Report, Ryan Air Annual Report, ATA (Air Transport Association), AEA (association of European Airlines) and Elfaa (association of low fares airlines) Economic reports
The analysis suggests that while Ryanair is relatively small airline in terms of number of
aircrafts it has more efficient operations which is evident from higher load factor (seats capacity
utilization) and higher revenues per employee ($635K7 compared to $202K for American Airlines).
Further analysis supports the fact that Ryanair relies on operational efficiencies to maintain its cost
advantages:
Figure 30 Key Performance Indicators KPI Ryanair Low cost carriers Industry Average Passenger per employee 10,050 6,000 1,069 Average fare (Euros) 40.0 86.3 206.6 Lost bags per 1000 passengers 0.5 n.a. 11.3 Employees per aircraft 35 n.a. n.a. Schedule on time 93.0% 85.0% 81.2% Source:Ryanair, Association of European Low Cost Airlines (www.elfaa.com)
On average Ryanair benefits from much higher passenger to employee ratio and much lower
employees to aircraft ratio, which helps the company to maintain cost efficiency. Indicators such as
lost bags per 1,000 and schedule on time suggest operational efficiencies and customer satisfaction.
One of the reasons for this is the structure of the aircraft fleet that Ryanair uses as compared to its
peers – Ryanair currently employes predominantly two types of aircrafts – Boeing 737-200 and Boeing
737-800 and a program whereby all aircrafts will be replaced with 737-800 machines is in place.
American Airlines, on the other hand, has a large fleet comprising of 11 different types of aircrafts,
which have different technical and maintenance requirements, adding to the costs of the company.
Composition of the fleet is presented in Figure 31.
7 At approximate exchange rate of $1.3 per Euro 1
32
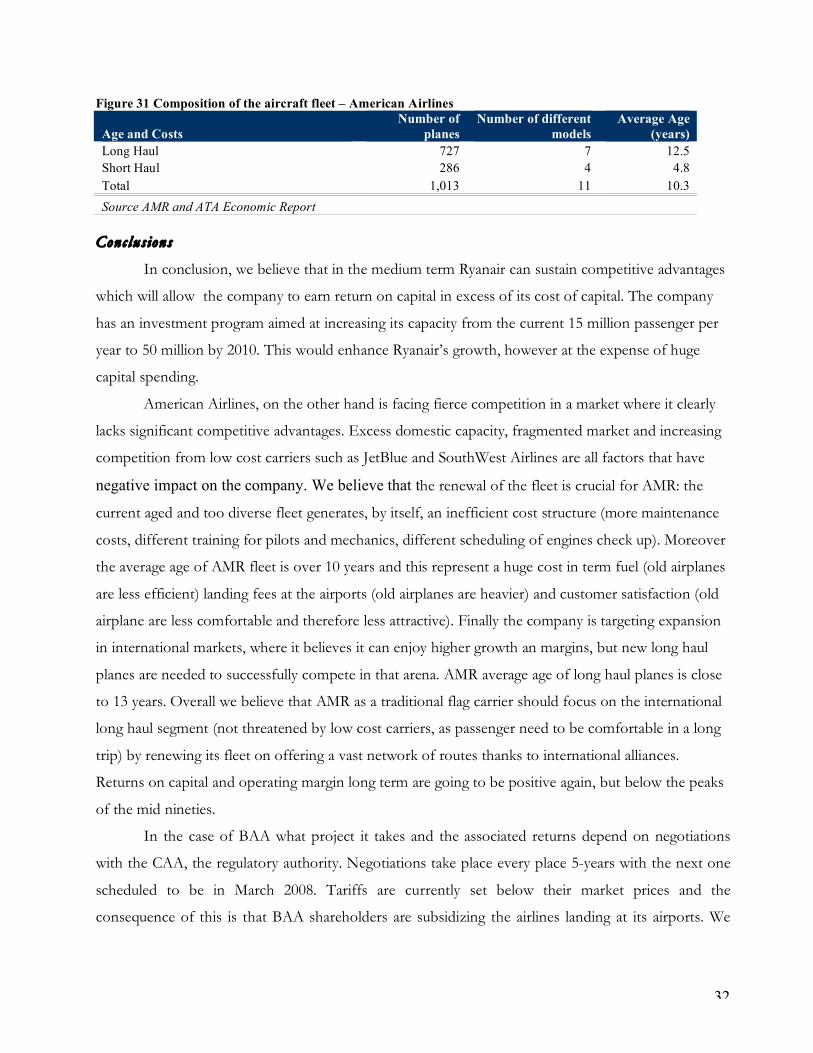
Figure 31 Composition of the aircraft fleet – American Airlines
Age and Costs Number of
planes Number of different
models Average Age
(years) Long Haul 727 7 12.5 Short Haul 286 4 4.8 Total 1,013 11 10.3 Source AMR and ATA Economic Report
Conc lus ions
In conclusion, we believe that in the medium term Ryanair can sustain competitive advantages
which will allow the company to earn return on capital in excess of its cost of capital. The company
has an investment program aimed at increasing its capacity from the current 15 million passenger per
year to 50 million by 2010. This would enhance Ryanair’s growth, however at the expense of huge
capital spending.
American Airlines, on the other hand is facing fierce competition in a market where it clearly
lacks significant competitive advantages. Excess domestic capacity, fragmented market and increasing
competition from low cost carriers such as JetBlue and SouthWest Airlines are all factors that have
negative impact on the company. We believe that the renewal of the fleet is crucial for AMR: the
current aged and too diverse fleet generates, by itself, an inefficient cost structure (more maintenance
costs, different training for pilots and mechanics, different scheduling of engines check up). Moreover
the average age of AMR fleet is over 10 years and this represent a huge cost in term fuel (old airplanes
are less efficient) landing fees at the airports (old airplanes are heavier) and customer satisfaction (old
airplane are less comfortable and therefore less attractive). Finally the company is targeting expansion
in international markets, where it believes it can enjoy higher growth an margins, but new long haul
planes are needed to successfully compete in that arena. AMR average age of long haul planes is close
to 13 years. Overall we believe that AMR as a traditional flag carrier should focus on the international
long haul segment (not threatened by low cost carriers, as passenger need to be comfortable in a long
trip) by renewing its fleet on offering a vast network of routes thanks to international alliances.
Returns on capital and operating margin long term are going to be positive again, but below the peaks
of the mid nineties.
In the case of BAA what project it takes and the associated returns depend on negotiations
with the CAA, the regulatory authority. Negotiations take place every place 5-years with the next one
scheduled to be in March 2008. Tariffs are currently set below their market prices and the
consequence of this is that BAA shareholders are subsidizing the airlines landing at its airports. We
33
think that this situation is very unlikely to change in the short term, at least until the new review in
March 2008.
Similarly for Asur, the company faces mandatory capital investments which are negotiated with
the Mexican Ministry of Communications and Transportation every five years. In the coming years,
Asur’s main investment project will be the construction of a second runway at the Cancun airport, to
handle the higher than expected growth in passenger volumes. This project has already been moved
forward five years from its original start date, signaling the company’s strong confidence in its growth
prospects for the coming years.
VII. Capital Structure Choices
1. Current financing mix
Figure 32 below summarizes the current debt structure of American Airlines, BAA and Ryanir (Asur
has no debt). As can be observed, the three companies employ very different kinds of debt:
Ameri can Airl ines
AA has outstanding a wide variety of notes, from bank debt, plain vanilla bonds to more structured
debt instruments. On one hand this is driven by the necessity to tailor the debt to match the
company’s cash flow profile and risk, which is very specific. On the other hand this is a symptom of
the financial difficulties the company has been going through and the need to raise capital in any form
it was available. With this respect, it is worth noticing that the BoD has even authorized (but not yet
issued) the emission of 20million preferred shares.
Ryanair
Ryanair has only bank debt outstanding and this is a reflection of both the early stage of the life cycle
is in and its ability to generate cash flows, thus funding growth largely with internal funds. We expect
the financing mix to change as the company continues to expand and it will need to access the public
bond markets to fund its future projects.

34
BAA
BAA’s debt is almost all made up by straight bonds (82% of the total), with the rest coming from bank
debt and two outstanding convertible bonds issues. This is due to the high stability and predictability
of its cash flows, which has given BAA easy access to the public the bond markets. The company has
issued substantial debt over the last years (Gross Debt went from approx. £1.0 bn in 1995 to over £4
bn today with D/E climbing from 20% to 81%) as a result of the expected capex expenditures
connected with the fifth terminal at Heathrow and other projects.
Asur
Asur has no debt outstanding as it has been able to fund all its capex requirements through internal
cash-flows.
Figure 32 Current debt characteristics
Company Type of Financing Amount (mm) Interest Rate on
Books Maturity Secured Variable and Fixed rate indebtness 6,340.0 2.03% - 9.16% 2021 Enhanced Equipment trust certificates 3,707.0 2.14% - 9.09% 2011 Special facility revenue bond 946.0 6.00% - 8.50% 2036 Credit Facility Agreement 850.0 9.150% 2010 Senior Convertibles Notes 619.0 4.25% - 4.50% 2023-2024 Debentures 330.0 9.00% - 10.20% 2021 Notes 303.0 7.88% - 10.55% 2039
Americal Airlines
Other 1,159.0 Straight Bond 200.0 7.875% 2007 Straight Bond 400.0 5.750% 2013 Straight Bond 300.0 11.750% 2016 Straight Bond 250.0 8.500% 2021 Straight Bond 200.0 6.375% 2028 Straight Bond 900.0 5.750% 2031 Straight Bond 750.0 4.500% 2014 Convertible Bond 424.0 2.940% 2008
BAA
Convertible Bond 425.0 2.625% 2009 Secured bank debt 80.3 n.a. 2005 Secured bank debt 84.2 n.a. 2006 Secured bank debt 88.1 n.a. 2007 Secured bank debt 92.1 n.a. 2008
Ryanair
Secured bank debt 608.2 n.a. 2009 - 2016
In addition to the balance sheet debt 3 of the 4 companies analyzed have relevant off-balance
sheet items related to operating leases that we summarize below.

35
Figure 33 Debt embedded in operating lease commitments
2. Trade off on Debt and Equity
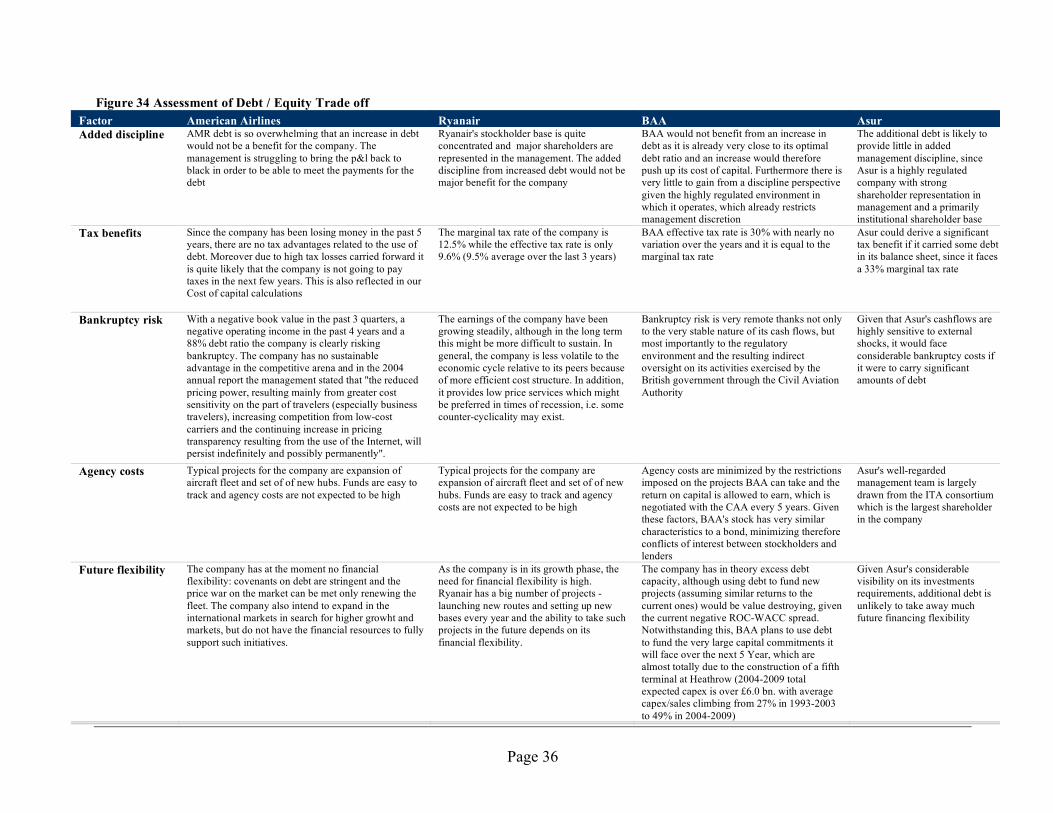
Each company advantages and disadvantages of debt are analyzed in the table on the next page.
Off Balance Sheet Debt American Airlines Ryanair BAA Asur PV of Operating Leases 5,822.57 181.64 388.82 - As a % of total market value of debt 48% 13% 8%
Page 36
Figure 34 Assessment of Debt / Equity Trade off Factor American Airlines Ryanair BAA Asur Added discipline AMR debt is so overwhelming that an increase in debt
would not be a benefit for the company. The management is struggling to bring the p&l back to black in order to be able to meet the payments for the debt
Ryanair's stockholder base is quite concentrated and major shareholders are represented in the management. The added discipline from increased debt would not be major benefit for the company
BAA would not benefit from an increase in debt as it is already very close to its optimal debt ratio and an increase would therefore push up its cost of capital. Furthermore there is very little to gain from a discipline perspective given the highly regulated environment in which it operates, which already restricts management discretion
The additional debt is likely to provide little in added management discipline, since Asur is a highly regulated company with strong shareholder representation in management and a primarily institutional shareholder base
Tax benefits Since the company has been losing money in the past 5 years, there are no tax advantages related to the use of debt. Moreover due to high tax losses carried forward it is quite likely that the company is not going to pay taxes in the next few years. This is also reflected in our Cost of capital calculations
The marginal tax rate of the company is 12.5% while the effective tax rate is only 9.6% (9.5% average over the last 3 years)
BAA effective tax rate is 30% with nearly no variation over the years and it is equal to the marginal tax rate
Asur could derive a significant tax benefit if it carried some debt in its balance sheet, since it faces a 33% marginal tax rate
Bankruptcy risk With a negative book value in the past 3 quarters, a negative operating income in the past 4 years and a 88% debt ratio the company is clearly risking bankruptcy. The company has no sustainable advantage in the competitive arena and in the 2004 annual report the management stated that "the reduced pricing power, resulting mainly from greater cost sensitivity on the part of travelers (especially business travelers), increasing competition from low-cost carriers and the continuing increase in pricing transparency resulting from the use of the Internet, will persist indefinitely and possibly permanently".
The earnings of the company have been growing steadily, although in the long term this might be more difficult to sustain. In general, the company is less volatile to the economic cycle relative to its peers because of more efficient cost structure. In addition, it provides low price services which might be preferred in times of recession, i.e. some counter-cyclicality may exist.
Bankruptcy risk is very remote thanks not only to the very stable nature of its cash flows, but most importantly to the regulatory environment and the resulting indirect oversight on its activities exercised by the British government through the Civil Aviation Authority
Given that Asur's cashflows are highly sensitive to external shocks, it would face considerable bankruptcy costs if it were to carry significant amounts of debt
Agency costs Typical projects for the company are expansion of aircraft fleet and set of of new hubs. Funds are easy to track and agency costs are not expected to be high
Typical projects for the company are expansion of aircraft fleet and set of of new hubs. Funds are easy to track and agency costs are not expected to be high
Agency costs are minimized by the restrictions imposed on the projects BAA can take and the return on capital is allowed to earn, which is negotiated with the CAA every 5 years. Given these factors, BAA's stock has very similar characteristics to a bond, minimizing therefore conflicts of interest between stockholders and lenders
Asur's well-regarded management team is largely drawn from the ITA consortium which is the largest shareholder in the company
Future flexibility The company has at the moment no financial flexibility: covenants on debt are stringent and the price war on the market can be met only renewing the fleet. The company also intend to expand in the international markets in search for higher growht and markets, but do not have the financial resources to fully support such initiatives.
As the company is in its growth phase, the need for financial flexibility is high. Ryanair has a big number of projects - launching new routes and setting up new bases every year and the ability to take such projects in the future depends on its financial flexibility.
The company has in theory excess debt capacity, although using debt to fund new projects (assuming similar returns to the current ones) would be value destroying, given the current negative ROC-WACC spread. Notwithstanding this, BAA plans to use debt to fund the very large capital commitments it will face over the next 5 Year, which are almost totally due to the construction of a fifth terminal at Heathrow (2004-2009 total expected capex is over £6.0 bn. with average capex/sales climbing from 27% in 1993-2003 to 49% in 2004-2009)
Given Asur's considerable visibility on its investments requirements, additional debt is unlikely to take away much future financing flexibility
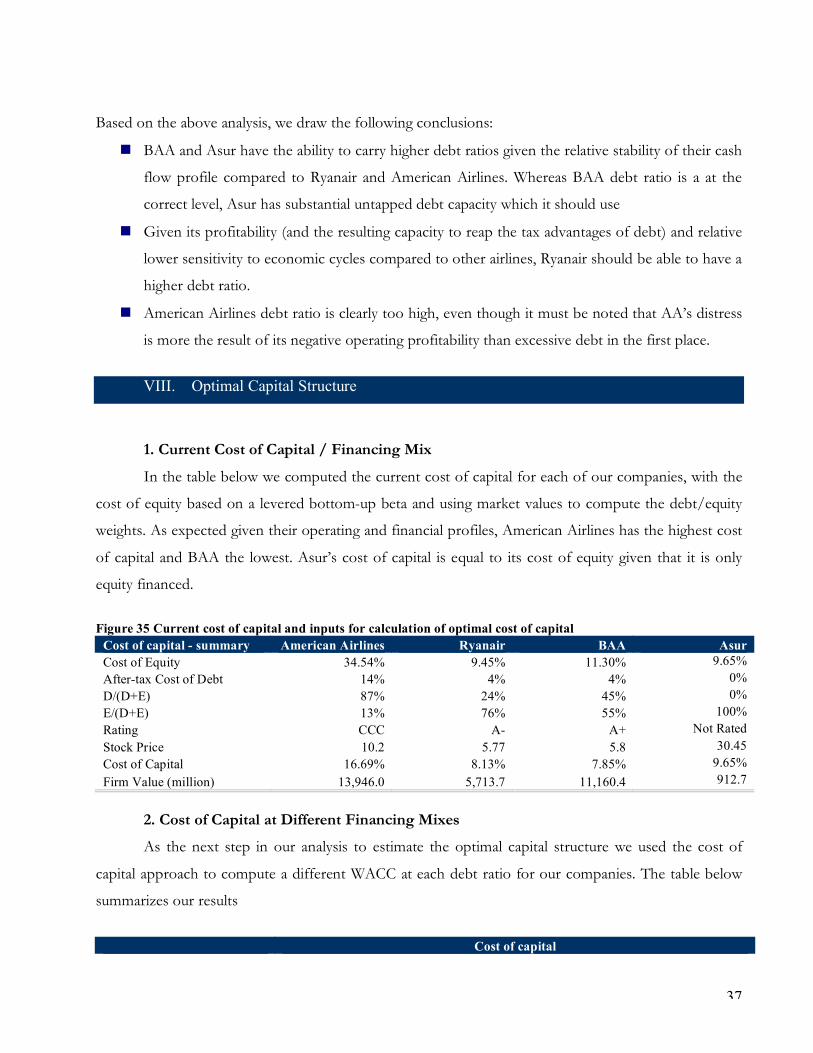
37
Based on the above analysis, we draw the following conclusions:
BAA and Asur have the ability to carry higher debt ratios given the relative stability of their cash
flow profile compared to Ryanair and American Airlines. Whereas BAA debt ratio is a at the
correct level, Asur has substantial untapped debt capacity which it should use
Given its profitability (and the resulting capacity to reap the tax advantages of debt) and relative
lower sensitivity to economic cycles compared to other airlines, Ryanair should be able to have a
higher debt ratio.
American Airlines debt ratio is clearly too high, even though it must be noted that AA’s distress
is more the result of its negative operating profitability than excessive debt in the first place.
VIII. Optimal Capital Structure
1. Current Cost of Capital / Financing Mix
In the table below we computed the current cost of capital for each of our companies, with the
cost of equity based on a levered bottom-up beta and using market values to compute the debt/equity
weights. As expected given their operating and financial profiles, American Airlines has the highest cost
of capital and BAA the lowest. Asur’s cost of capital is equal to its cost of equity given that it is only
equity financed.
Figure 35 Current cost of capital and inputs for calculation of optimal cost of capital
Cost of capital - summary American Airlines Ryanair BAA Asur Cost of Equity 34.54% 9.45% 11.30% 9.65% After-tax Cost of Debt 14% 4% 4% 0% D/(D+E) 87% 24% 45% 0% E/(D+E) 13% 76% 55% 100% Rating CCC A- A+ Not Rated Stock Price 10.2 5.77 5.8 30.45 Cost of Capital 16.69% 8.13% 7.85% 9.65% Firm Value (million) 13,946.0 5,713.7 11,160.4 912.7
2. Cost of Capital at Different Financing Mixes
As the next step in our analysis to estimate the optimal capital structure we used the cost of
capital approach to compute a different WACC at each debt ratio for our companies. The table below
summarizes our results
Cost of capital
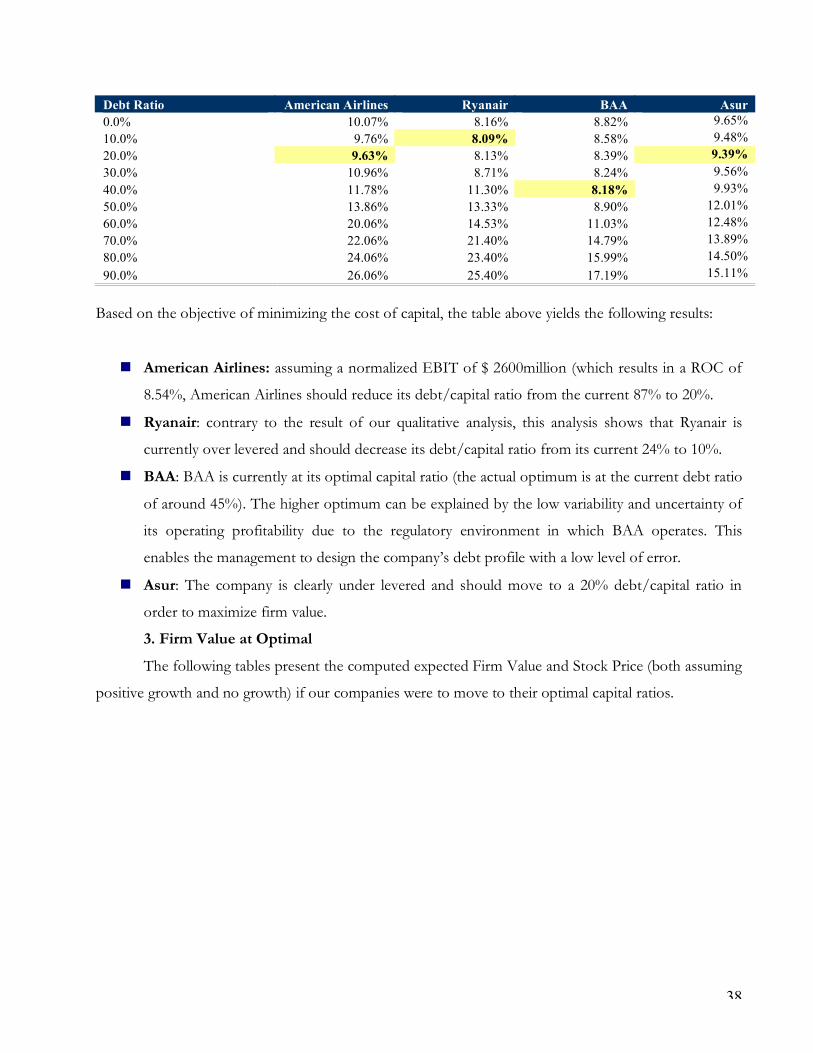
38
Debt Ratio American Airlines Ryanair BAA Asur 0.0% 10.07% 8.16% 8.82% 9.65% 10.0% 9.76% 8.09% 8.58% 9.48% 20.0% 9.63% 8.13% 8.39% 9.39% 30.0% 10.96% 8.71% 8.24% 9.56% 40.0% 11.78% 11.30% 8.18% 9.93% 50.0% 13.86% 13.33% 8.90% 12.01% 60.0% 20.06% 14.53% 11.03% 12.48% 70.0% 22.06% 21.40% 14.79% 13.89% 80.0% 24.06% 23.40% 15.99% 14.50% 90.0% 26.06% 25.40% 17.19% 15.11%
Based on the objective of minimizing the cost of capital, the table above yields the following results:
American Airlines: assuming a normalized EBIT of $ 2600million (which results in a ROC of
8.54%, American Airlines should reduce its debt/capital ratio from the current 87% to 20%.
Ryanair: contrary to the result of our qualitative analysis, this analysis shows that Ryanair is
currently over levered and should decrease its debt/capital ratio from its current 24% to 10%.
BAA: BAA is currently at its optimal capital ratio (the actual optimum is at the current debt ratio
of around 45%). The higher optimum can be explained by the low variability and uncertainty of
its operating profitability due to the regulatory environment in which BAA operates. This
enables the management to design the company’s debt profile with a low level of error.
Asur: The company is clearly under levered and should move to a 20% debt/capital ratio in
order to maximize firm value.
3. Firm Value at Optimal
The following tables present the computed expected Firm Value and Stock Price (both assuming
positive growth and no growth) if our companies were to move to their optimal capital ratios.
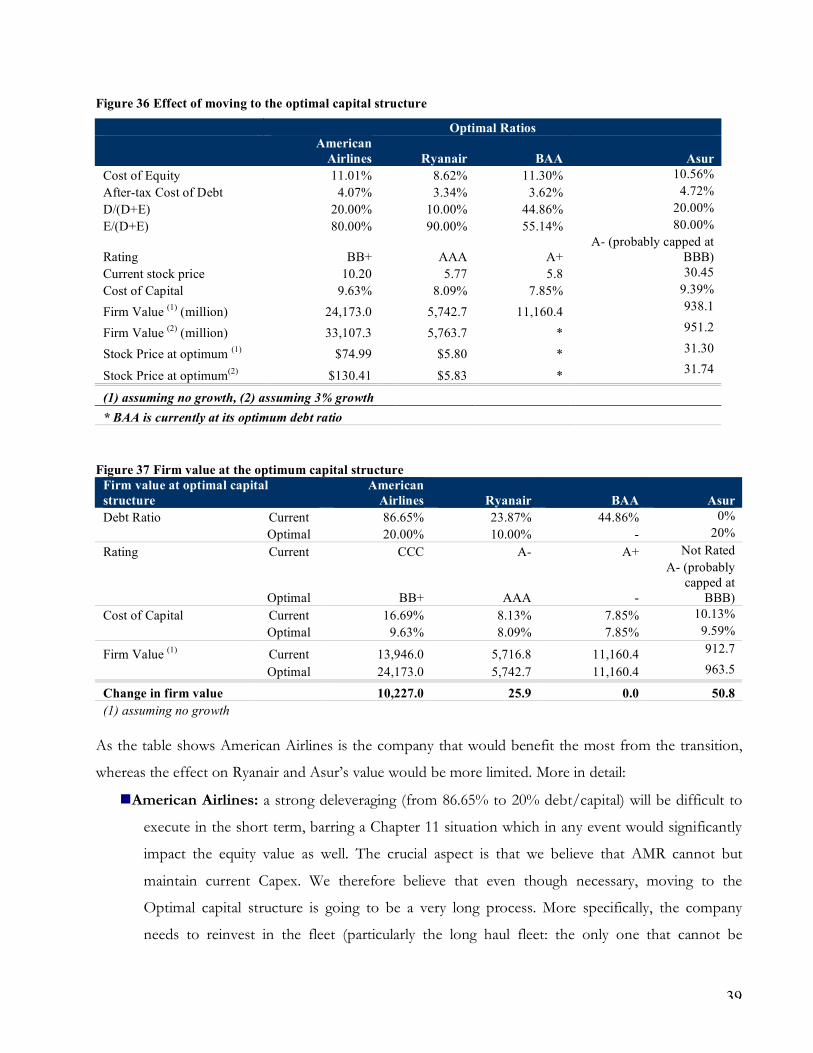
39
Figure 36 Effect of moving to the optimal capital structure
Optimal Ratios
American
Airlines Ryanair BAA Asur Cost of Equity 11.01% 8.62% 11.30% 10.56% After-tax Cost of Debt 4.07% 3.34% 3.62% 4.72% D/(D+E) 20.00% 10.00% 44.86% 20.00% E/(D+E) 80.00% 90.00% 55.14% 80.00%
Rating BB+ AAA A+ A- (probably capped at
BBB) Current stock price 10.20 5.77 5.8 30.45 Cost of Capital 9.63% 8.09% 7.85% 9.39%
Firm Value (1) (million) 24,173.0 5,742.7 11,160.4 938.1
Firm Value (2) (million) 33,107.3 5,763.7 * 951.2
Stock Price at optimum (1) $74.99 $5.80 * 31.30
Stock Price at optimum(2) $130.41 $5.83 * 31.74
(1) assuming no growth, (2) assuming 3% growth * BAA is currently at its optimum debt ratio
Figure 37 Firm value at the optimum capital structure Firm value at optimal capital structure
American Airlines Ryanair BAA Asur
Debt Ratio Current 86.65% 23.87% 44.86% 0% Optimal 20.00% 10.00% - 20% Rating Current CCC A- A+ Not Rated
Optimal BB+ AAA -
A- (probably capped at
BBB) Cost of Capital Current 16.69% 8.13% 7.85% 10.13% Optimal 9.63% 8.09% 7.85% 9.59%
Firm Value (1) Current 13,946.0 5,716.8 11,160.4 912.7
Optimal 24,173.0 5,742.7 11,160.4 963.5
Change in firm value 10,227.0 25.9 0.0 50.8 (1) assuming no growth
As the table shows American Airlines is the company that would benefit the most from the transition,
whereas the effect on Ryanair and Asur’s value would be more limited. More in detail:
American Airlines: a strong deleveraging (from 86.65% to 20% debt/capital) will be difficult to
execute in the short term, barring a Chapter 11 situation which in any event would significantly
impact the equity value as well. The crucial aspect is that we believe that AMR cannot but
maintain current Capex. We therefore believe that even though necessary, moving to the
Optimal capital structure is going to be a very long process. More specifically, the company
needs to reinvest in the fleet (particularly the long haul fleet: the only one that cannot be
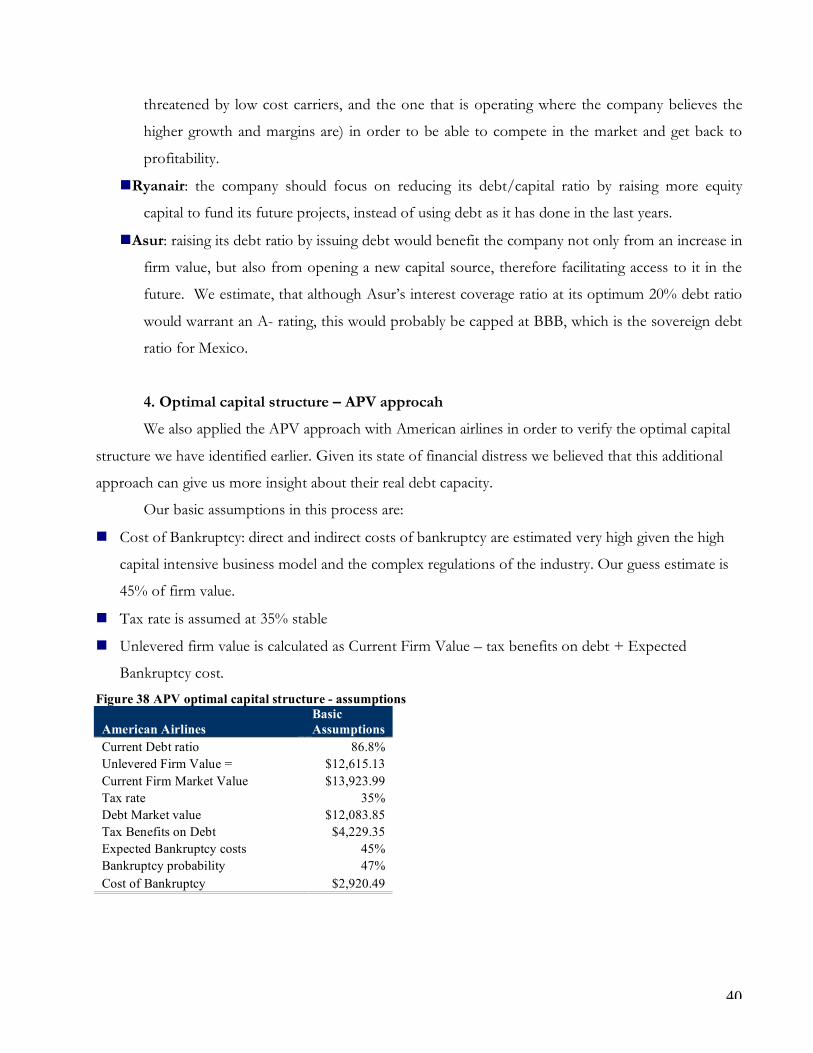
40
threatened by low cost carriers, and the one that is operating where the company believes the
higher growth and margins are) in order to be able to compete in the market and get back to
profitability.
Ryanair: the company should focus on reducing its debt/capital ratio by raising more equity
capital to fund its future projects, instead of using debt as it has done in the last years.
Asur: raising its debt ratio by issuing debt would benefit the company not only from an increase in
firm value, but also from opening a new capital source, therefore facilitating access to it in the
future. We estimate, that although Asur’s interest coverage ratio at its optimum 20% debt ratio
would warrant an A- rating, this would probably be capped at BBB, which is the sovereign debt
ratio for Mexico.
4. Optimal capital structure – APV approcah
We also applied the APV approach with American airlines in order to verify the optimal capital
structure we have identified earlier. Given its state of financial distress we believed that this additional
approach can give us more insight about their real debt capacity.
Our basic assumptions in this process are:
Cost of Bankruptcy: direct and indirect costs of bankruptcy are estimated very high given the high
capital intensive business model and the complex regulations of the industry. Our guess estimate is
45% of firm value.
Tax rate is assumed at 35% stable
Unlevered firm value is calculated as Current Firm Value – tax benefits on debt + Expected
Bankruptcy cost.
Figure 38 APV optimal capital structure - assumptions
American Airlines Basic Assumptions
Current Debt ratio 86.8% Unlevered Firm Value = $12,615.13 Current Firm Market Value $13,923.99 Tax rate 35% Debt Market value $12,083.85 Tax Benefits on Debt $4,229.35 Expected Bankruptcy costs 45% Bankruptcy probability 47% Cost of Bankruptcy $2,920.49
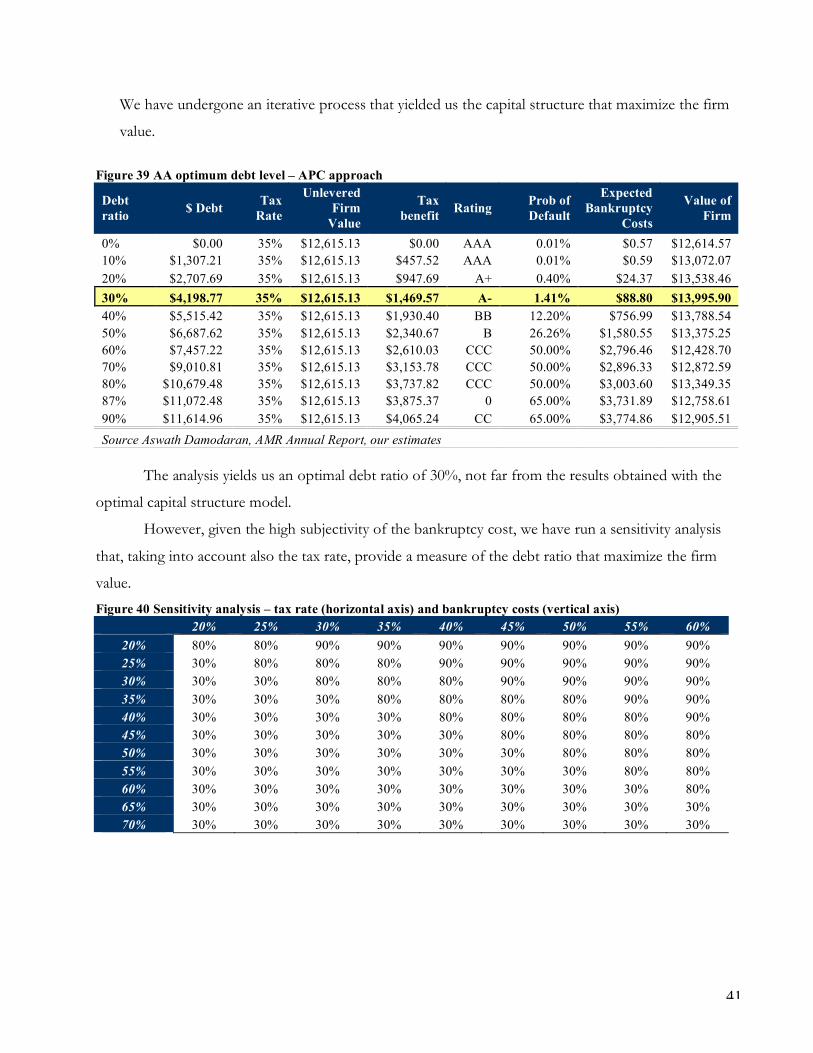
41
We have undergone an iterative process that yielded us the capital structure that maximize the firm
value.
Figure 39 AA optimum debt level – APC approach
Debt ratio $ Debt Tax
Rate
Unlevered Firm
Value
Tax benefit Rating Prob of
Default
Expected Bankruptcy
Costs
Value of Firm
0% $0.00 35% $12,615.13 $0.00 AAA 0.01% $0.57 $12,614.57 10% $1,307.21 35% $12,615.13 $457.52 AAA 0.01% $0.59 $13,072.07 20% $2,707.69 35% $12,615.13 $947.69 A+ 0.40% $24.37 $13,538.46 30% $4,198.77 35% $12,615.13 $1,469.57 A- 1.41% $88.80 $13,995.90 40% $5,515.42 35% $12,615.13 $1,930.40 BB 12.20% $756.99 $13,788.54 50% $6,687.62 35% $12,615.13 $2,340.67 B 26.26% $1,580.55 $13,375.25 60% $7,457.22 35% $12,615.13 $2,610.03 CCC 50.00% $2,796.46 $12,428.70 70% $9,010.81 35% $12,615.13 $3,153.78 CCC 50.00% $2,896.33 $12,872.59 80% $10,679.48 35% $12,615.13 $3,737.82 CCC 50.00% $3,003.60 $13,349.35 87% $11,072.48 35% $12,615.13 $3,875.37 0 65.00% $3,731.89 $12,758.61 90% $11,614.96 35% $12,615.13 $4,065.24 CC 65.00% $3,774.86 $12,905.51 Source Aswath Damodaran, AMR Annual Report, our estimates
The analysis yields us an optimal debt ratio of 30%, not far from the results obtained with the
optimal capital structure model.
However, given the high subjectivity of the bankruptcy cost, we have run a sensitivity analysis
that, taking into account also the tax rate, provide a measure of the debt ratio that maximize the firm
value.
Figure 40 Sensitivity analysis – tax rate (horizontal axis) and bankruptcy costs (vertical axis) $0.30 20% 25% 30% 35% 40% 45% 50% 55% 60% 20% 80% 80% 90% 90% 90% 90% 90% 90% 90% 25% 30% 80% 80% 80% 90% 90% 90% 90% 90% 30% 30% 30% 80% 80% 80% 90% 90% 90% 90% 35% 30% 30% 30% 80% 80% 80% 80% 90% 90% 40% 30% 30% 30% 30% 80% 80% 80% 80% 90% 45% 30% 30% 30% 30% 30% 80% 80% 80% 80% 50% 30% 30% 30% 30% 30% 30% 80% 80% 80% 55% 30% 30% 30% 30% 30% 30% 30% 80% 80% 60% 30% 30% 30% 30% 30% 30% 30% 30% 80% 65% 30% 30% 30% 30% 30% 30% 30% 30% 30% 70% 30% 30% 30% 30% 30% 30% 30% 30% 30%
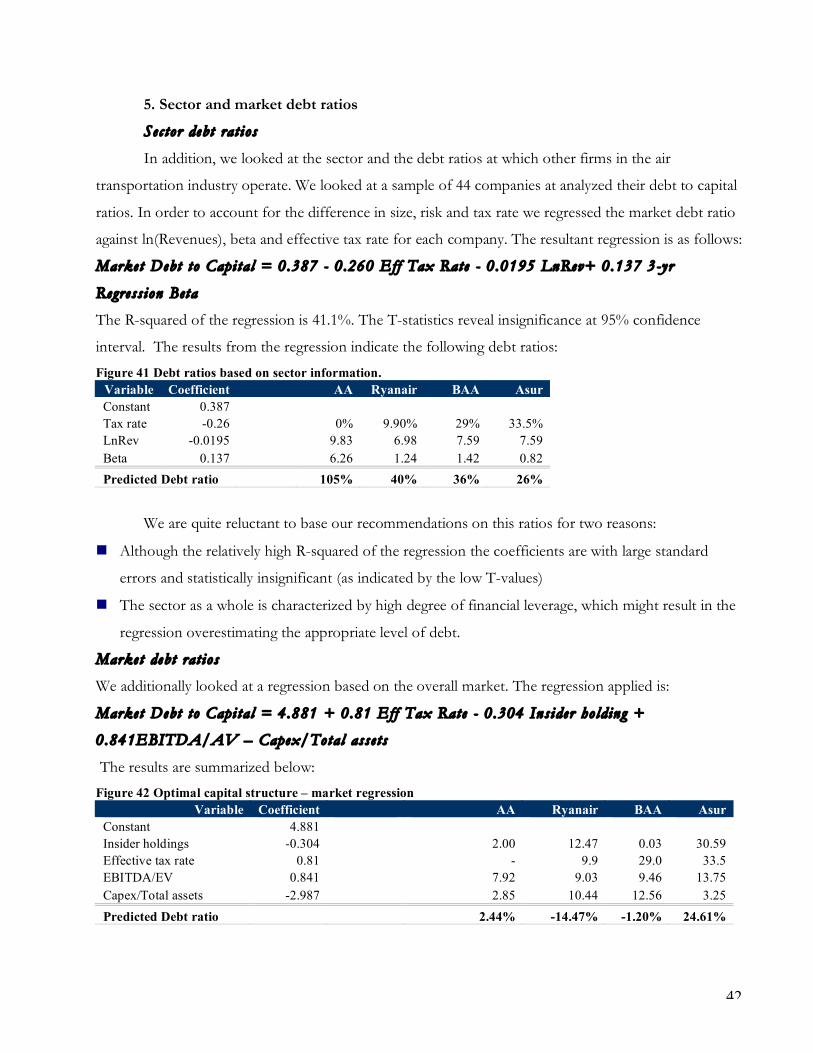
42
5. Sector and market debt ratios
Sec tor debt rat ios
In addition, we looked at the sector and the debt ratios at which other firms in the air
transportation industry operate. We looked at a sample of 44 companies at analyzed their debt to capital
ratios. In order to account for the difference in size, risk and tax rate we regressed the market debt ratio
against ln(Revenues), beta and effective tax rate for each company. The resultant regression is as follows:
Market Debt to Capi tal = 0.387 - 0 .260 Eff Tax Rate - 0 .0195 LnRev+ 0.137 3-yr
Regress ion Beta
The R-squared of the regression is 41.1%. The T-statistics reveal insignificance at 95% confidence
interval. The results from the regression indicate the following debt ratios:
Figure 41 Debt ratios based on sector information. Variable Coefficient AA Ryanair BAA Asur Constant 0.387 Tax rate -0.26 0% 9.90% 29% 33.5% LnRev -0.0195 9.83 6.98 7.59 7.59 Beta 0.137 6.26 1.24 1.42 0.82 Predicted Debt ratio 105% 40% 36% 26%
We are quite reluctant to base our recommendations on this ratios for two reasons:
Although the relatively high R-squared of the regression the coefficients are with large standard
errors and statistically insignificant (as indicated by the low T-values)
The sector as a whole is characterized by high degree of financial leverage, which might result in the
regression overestimating the appropriate level of debt.
Market debt rat ios
We additionally looked at a regression based on the overall market. The regression applied is:
Market Debt to Capi tal = 4.881 + 0.81 Eff Tax Rate - 0 .304 Ins ider ho lding +
0.841EBITDA/AV – Capex/Total asse t s
The results are summarized below:
Figure 42 Optimal capital structure – market regression Variable Coefficient AA Ryanair BAA Asur
Constant 4.881 Insider holdings -0.304 2.00 12.47 0.03 30.59 Effective tax rate 0.81 - 9.9 29.0 33.5 EBITDA/EV 0.841 7.92 9.03 9.46 13.75 Capex/Total assets -2.987 2.85 10.44 12.56 3.25 Predicted Debt ratio 2.44% -14.47% -1.20% 24.61%

43
The market debt ratio regression clearly provided some controversial results for AA, Ryanair and
BAA, suggesting a negative market debt ratio, which is contrary to our previous analysis based on cost
of capital or APV (for American Airlines)
IX. Mechanics of moving towards the optimal
1. A Path to the Optimal
In the table below we have listed the main cash flow characteristics of the three businesses our
companies are in: Airlines (American Airlines and Ryanair), Aeronautical service and Retail (BAA and
Asur). We have then listed what would be the optimal features of the debt for each business.
Figure 43 Typical projects and cash flow characteristics
Business Typical Project Type of Financing Cash Flow Characteristics Debt should be
Fleet Acquisition: Long term payment, Long life of the asset Long term
New Route Opening: local offices and labor force. Long term and different currencies Multiple currencies
Airlines
New Terminal buildings and maintenance
Medium to long term Medium/Long term Cash outflows that are primarily in local currency, (there could be a significant dollar component for Asur)
Single currency (dollar portion for Asur)
Cash inflows that are almost exclusively in local currency
Asur: if possible tied to influx of tourism
Aeronautical Services
BAA: very stable cash flows Asur: volatile due to exposure to tourism travel
Medium term Medium Term Cash outflows that are almost exclusively in local currency Mix of currencies
Cash inflows that are primarily in local currency although influenced by relative strength of pound/peso
Asur: if possible tied to influx of tourism
Retail
Can be very volatile, specially sensitive to global risk factors
2. Quantitative Analysis and Overall Recommendation on Financing Mix
To further evaluate the optimal debt characteristics for each company we regressed the firm
value and the EBITDA of each of our companies against: Change in Long Term Rate, GDP growth,
Change in local currency, Change in inflation and Change in the price of oil (only for American Airlines
44
and Ryanair). The Firm value regression results and the conclusion for each company are shown below.
Regressions on EBITDA against macroeconomic variables are presented in Appendix IV.
Ameri can Airl ines
The current crisis of the company makes firm variations very unpredictable and driven much more by
company specific issues rather than macroeconomic variables. Not surprisingly results are disappointing
in terms of signs of the coefficients and T statistic significance.
Long Term Interest Rates: very weak R square and T statistic. The regression suggests
that the duration of the operating assets of the company is very low. .
GDP Growth: The company’s earnings are cyclical and shows a positive coefficient with
EBITDA. R-squared is fairly significant: AMR is undoubtedly a cyclical company. The
negative coefficient with firm value is likely to be related to the high leverage: high GDP
growth rates are usually related to high interest rates that affects negatively the firm value.
Dollar: A weaker dollar helps EBITDA, but at the same time has a slightly negative effect
on firm value. Revenues in foreign currencies (about 35% of total sales) explain the relations
with EBITDA, although the effect is small (probably offset by foreign currency costs and
expenses). The company should use predominantly dollar denominated debt.
Inflation: Does not impact significantly EBITDA, while is negatively correlated to the firm
value, probably due to the high amount of debt, hence higher discount rate.
Price of Oil: Oil seems to be completely non influent on company firm value or EBITDA.
This can be due to two factors: 1) the company has pursued an efficient hedging strategy 2)
company’s firm value is driven by company specific issues related to bankruptcy risk, rather
than industry themes.
Based on this analysis we would suggest the company to use mainly dollar denominated debt with fixed
rates.
The regression results for FV are presented below
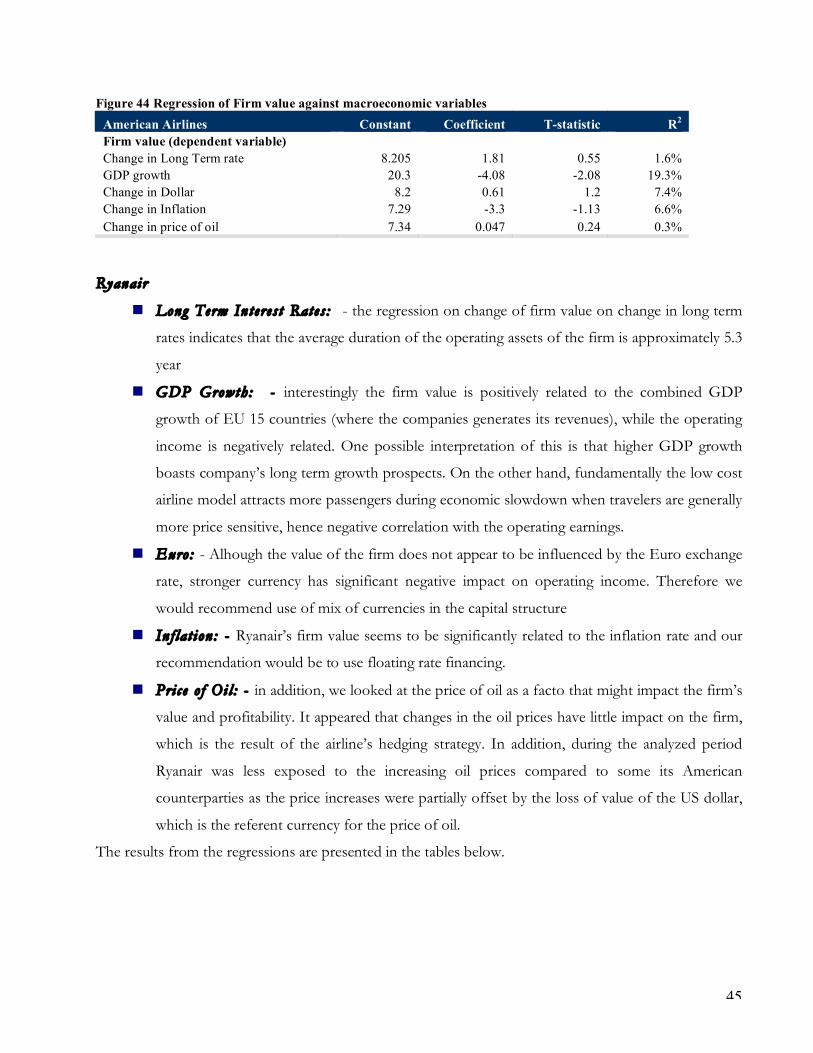
45
Figure 44 Regression of Firm value against macroeconomic variables American Airlines Constant Coefficient T-statistic R2 Firm value (dependent variable) Change in Long Term rate 8.205 1.81 0.55 1.6% GDP growth 20.3 -4.08 -2.08 19.3% Change in Dollar 8.2 0.61 1.2 7.4% Change in Inflation 7.29 -3.3 -1.13 6.6% Change in price of oil 7.34 0.047 0.24 0.3%
Ryanair
Long Term Interes t Rates : - the regression on change of firm value on change in long term
rates indicates that the average duration of the operating assets of the firm is approximately 5.3
year
GDP Growth: - interestingly the firm value is positively related to the combined GDP
growth of EU 15 countries (where the companies generates its revenues), while the operating
income is negatively related. One possible interpretation of this is that higher GDP growth
boasts company’s long term growth prospects. On the other hand, fundamentally the low cost
airline model attracts more passengers during economic slowdown when travelers are generally
more price sensitive, hence negative correlation with the operating earnings.
Euro: - Alhough the value of the firm does not appear to be influenced by the Euro exchange
rate, stronger currency has significant negative impact on operating income. Therefore we
would recommend use of mix of currencies in the capital structure
In f lat ion : - Ryanair’s firm value seems to be significantly related to the inflation rate and our
recommendation would be to use floating rate financing.
Pri c e o f Oi l : - in addition, we looked at the price of oil as a facto that might impact the firm’s
value and profitability. It appeared that changes in the oil prices have little impact on the firm,
which is the result of the airline’s hedging strategy. In addition, during the analyzed period
Ryanair was less exposed to the increasing oil prices compared to some its American
counterparties as the price increases were partially offset by the loss of value of the US dollar,
which is the referent currency for the price of oil.
The results from the regressions are presented in the tables below.

46
Figure 45 Regression of Firm value against macroeconomic variables
Ryanair Constant Coefficient T-statistic of
coefficient R2 Firm value (dependent variable) Change in Long Term rate 30.2 -5.3 -0.2 0.70% GDP growth 6.03 3.24 2.63 36.60% Change in EURO 32.4 0.68 -0.27 1.20% Change in Inflation 18.8 6.56 1.56 16.80% Change in price of oil 38.5 -0.532 -1.08 16.3%
BAA
Long Term Interest Rates: Both regressions have a negative coefficient which points to a
longer duration of debt, approx. 2 years. It should be noted that the T-statistic and the R2 of
both regressions are very weak.
GDP Growth: BAA is positively correlated to GDP growth but shows a low degree of
cyclicality as evidenced by the coefficients.
GBP: BAA is not influenced by changes in the British Pound.
Inflation: the FV regression shows a high positive sensitivity to changes in inflation, which
therefore suggests the use of floating rate debt
Based upon this analysis, we would recommend that BAA issues debt:
With a high duration. Given the weakness of the regression we would not use the coefficient
number as a proxy for the duration
In British pounds
Floating rate
BAA’ current debt satisfies all these characteristics, except for the fact that most of the current debt is
with fixed rate. The regressions results are presented in the tables below.
Figure 46 Regression of Firm value against macroeconomic variables
BAA Constant Coefficient T-statistic R2 Firm value (dependent variable) Change in Long Term rate 8.80 -3.30 0.21 0.6% GDP growth 6.60 1.72 0.20 0.2% Change in GBP 10.30 -0.72 -0.04 0.0% Change in Inflation 11.50 15.9 0.74 7.2%

47
Asur
Long Term Interest Rates: the regressions on interest rates, suggest that Asur market value
and EBITDA increase with higher Mexican interest rates, which is somewhat counterintuitive.
A possible explanation might be that, often a rise in domestic rates is a response to higher
inflation and/or a depreciation in the peso, both of which might entice more US tourists to
visit Asur’s destinations. It is interesting to note the relatively high R2 of 54.4% in the
EBITDA regression.
GDP Growth: Once again we note the relatively high R2s, compared to the other three
companies in our sample. Clearly, Asur’s prospects are highly correlated to economic activity
as would be expected from a tourism-based company. The cyclicality of Asur’s business was
quite evident after the terrorist attacks of 9/11, when its foreign passengers arrivals contracted
dramatically. This leads to a recommendation for careful use of debt.
Exchange Rate: Asur’s firm value and EBITDA seems to be affected little by changes in the
value of the peso with respect to the dollar, which is, once again, a surprising result.
Nevertheless, we would advise that if Asur issues debt in the future, it should do so for the
most part in the domestic market and in peso denominations.
Inflation: the link between firm value and domestic inflation suggests that Asur should issue
any future debt with a variable, rather than a fixed, rate.
Figure 47 Regression of Firm value against macroeconomic variables
ASUR Constant Coefficient T-statistic R2 Firm value (dependent variable) Interest Rate (Cetes) 27.7 2.99 1.12 10.3% Mexican GDP 2.5 10.4 2.52 36.6% Exchange Rate (Peso/Dollar) 28.4 -0.98 -0.63 3.5% Mexican Inflation 163 29.7 -1.68 20.3%
3. Summary of desirable debt charachteristics
The profile of the ideal debt that the companies should use is presented in Figure 48 below:

48
Figure 48 Summary of desired debt features Company Maturity Currency Interest rate Comments Other features American Airlines Medium to long term,
despite the regression US dollars Fixed rate Analysis distorted by
the distressed state of the firm
None, provided that the company is hedged against sharp movement in price of oil
Ryanair medium term (5 years)
Euro Floating rate Analysis is distorted by the growth stage of the firm
None, provided that the company is hedged against sharp movement in price of oil
BAA short term (2 years) British Pounds
Fixed rate n.a. n.a.
Asur short to medium term Peso Floating rate n.a. n.a.
X. Dividend Policy
1. Current Dividend Policy
Of the four companies that we are analyzing, only two of them pay dividends: BAA and Asur.
This is consistent with their different characteristics in terms of cash flow profile, expected growth and
profitability. The main factors behind American Airlines and Ryanair not issuing dividends are the
following:
American Airlines: The constraint is clearly the financial and operational distress the company
is going through
Ryanair: although the company is profitable it chooses not to pay dividend given the stage of
the life cycle and the consequent growth it has to fund. Investors have been rewarded by the
high stock price appreciation over the last years. In addition, the management of Ryanair stated
on a number of occasion that it does not intend to pay out dividends in the foreseeable future as
it intends to fund a large scale capacity expansion program. The management put up the issue
for a large purchase of 50 new Boeing 737-800 aircrafts for vote at the forthcoming general
annual meeting.
BAA
BAA has kept a stable dividend policy over the past 5 years, with an average dividend yield of
3.3%. The company’s policy of keeping a stable dividend yield was evidenced in 2002 when it paid a
dividend although it recorded a much lower net income (this resulted in a dividend payout ratio of
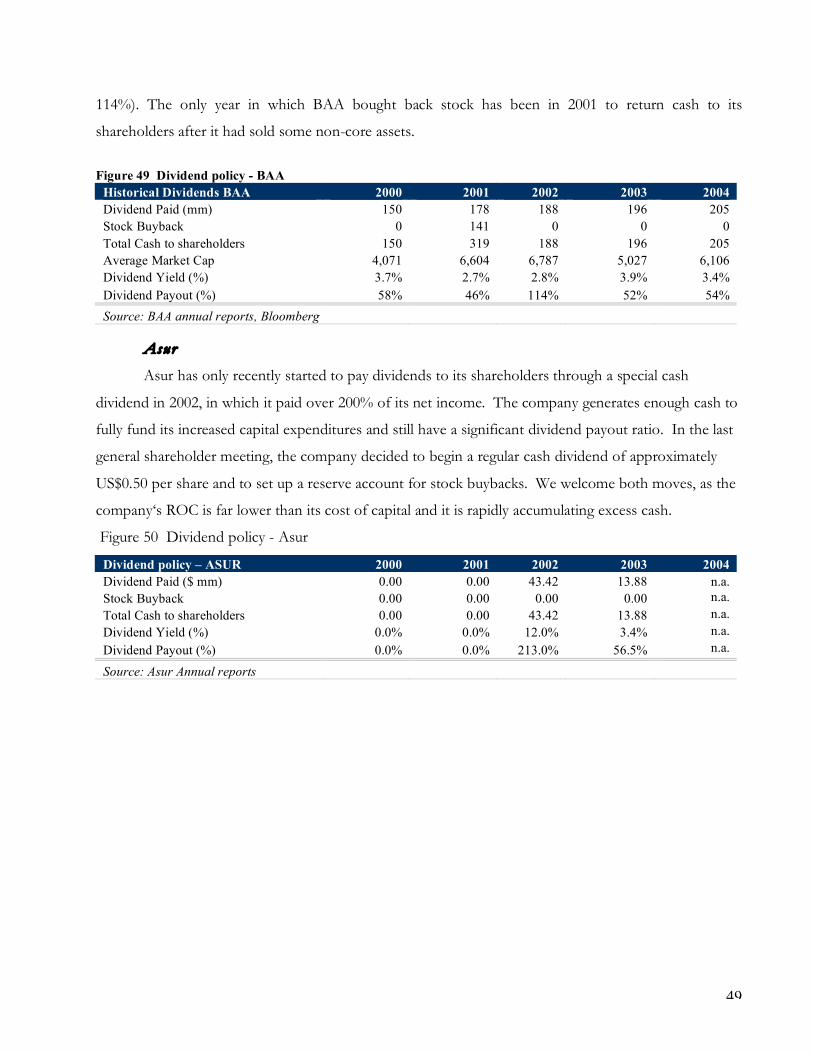
49
114%). The only year in which BAA bought back stock has been in 2001 to return cash to its
shareholders after it had sold some non-core assets.
Figure 49 Dividend policy - BAA
Historical Dividends BAA 2000 2001 2002 2003 2004 Dividend Paid (mm) 150 178 188 196 205 Stock Buyback 0 141 0 0 0 Total Cash to shareholders 150 319 188 196 205 Average Market Cap 4,071 6,604 6,787 5,027 6,106 Dividend Yield (%) 3.7% 2.7% 2.8% 3.9% 3.4% Dividend Payout (%) 58% 46% 114% 52% 54% Source: BAA annual reports, Bloomberg
Asur
Asur has only recently started to pay dividends to its shareholders through a special cash
dividend in 2002, in which it paid over 200% of its net income. The company generates enough cash to
fully fund its increased capital expenditures and still have a significant dividend payout ratio. In the last
general shareholder meeting, the company decided to begin a regular cash dividend of approximately
US$0.50 per share and to set up a reserve account for stock buybacks. We welcome both moves, as the
company‘s ROC is far lower than its cost of capital and it is rapidly accumulating excess cash.
Figure 50 Dividend policy - Asur
Dividend policy – ASUR 2000 2001 2002 2003 2004 Dividend Paid ($ mm) 0.00 0.00 43.42 13.88 n.a. Stock Buyback 0.00 0.00 0.00 0.00 n.a. Total Cash to shareholders 0.00 0.00 43.42 13.88 n.a. Dividend Yield (%) 0.0% 0.0% 12.0% 3.4% n.a. Dividend Payout (%) 0.0% 0.0% 213.0% 56.5% n.a. Source: Asur Annual reports
Page 50
Figure 51 Trade Offs on Dividend Policy Factor American Airlines Ryanair BAA Asur Stockholder Tax Preferences
Most of the stockholder are American Institutional investors and should be therefore indifferent between the choice of dividends or buybacks. Given the financial situation of the company no investor is buying AMR shares expecting other than stock appreciation.
The marginal stockholder in Ryanair is large internationally diversified institutional investor, who probably has the flexibility to move any dividend and capital gains to locations with highest tax advantage. From this standpoint the stockholders might indifferent between capital or income gains.
The Company has a consistent history of paying dividends. This is reflected in its stockholders base, which is made up mostly of small private shareholders
Investor’s in Asur expect recurrent dividend payments
Information Effects and signaling Incentives
In the unlikely case of a change in dividend policy (the company paid no dividend in the past 5 years) the market would read that a strong signal of confidence.
Given the good returns on capital and the largely announced capital investments plans a dividend announcement might signal that the company has run out of good projects and have a negative impact on the growth expectation hence on the stock value
Given the high number of analysts that follow the stock and the amount of disclosure given by the company, any signal imbedded in a change in dividend policy would have most probably already been captured by the market
Minimal, as Asur has no history of sticky dividends and is more inclined to pay special dividends
Effects on flexibility
The good side of the crisis the company is suffering it is it could cancel dividends and now has free hands on this policy.
Dividend policy is constrained by the huge capital expenditure requirements related to the companies expansion program.
BAA’s dividend policy in the short medium term is constrained by the heavy capex spending related to the new terminal at Heathrow.
Asur has no debt
Bond Covenants and Rating Agency Constraints
Debt covenants are pretty high. The company must meet a detailed schedule of financing for the $ 850mn credit facility in terms of current assets (no less than 1.5bn every quarter) and Cash flow to fixed charges around 1x.
Neither of these would be a constraint for Ryan air.
Neither of these factors would be a restraint to BAA raising dividends
Investor’s in Asur expect recurrent dividend payments
51
XI. Dividend Policy: a Framework
1. Affordable Dividends
In order to determine the amount our companies could have paid out in dividends we have
computed the average FCFE over the last 5-year and compared it to the dividends and buyback paid by
the companies. As mentioned before American Airlines and Ryanair do not payout any dividends. Even
though both companies could have potentially returned cash to their shareholders, none of them did,
but for completely different reasons: American Airlines positive FCFE come exclusively from the
borrowings necessary to pay previous debt and try to renew the old fleet; Ryan Air decided to retain its
FCFE to fund future growth. BAA and Asur have as well paid out less than what they could have to
their shareholders.
Figure 52 Dividend policy – sector analysis
Dividend policy analysis American
Airlines Ryanair BAA Asur Average FCFE in million (last 5 years) 765.3 23.5 248 41.2 Average Dividends & Stock Buybacks 0 0 183 14.3 Difference 765.3 23.5 -65 26.9 % Dividends / Stock Buybacks 0.0% 0.0% 74% 34.7%
Figure 53 Dividend policy – sector analysis
Dividend policy - Sector analysis American
Airlines Ryanair BAA Asur Dividend Yield 0.0% 0.0% 3.4% 3.9% Dividend Yield (sector) 0.06% 0.05% Difference -0.06% -0.05% 3.36% 3.90% Payout Ratio 0.0% 0.0% 54.4% 67.4% Payout Ratio (sector) 2.6% 79.4% Difference -2.6% -79.4% 54.4% 67.4%
2. Management Trust and Changing Dividend Policy
As a second step in our analysis we analyzed past ROE and ROC to judge if firms that paid out
less than they could afford created value for their shareholders. In the case of Ryanair the company has
been justified in its policy of not paying out dividends by the largely positive spread, both in terms of
ROE-Cost of Equity and ROC-WACC. On the other hand BAA and Asur both have recorded negative
ROE-Cost of Equity / ROC-WACC spreads. This suggests that they should increase their dividend
payout ratios.
Figure 54 Analysis of past returns and dividend policy

52
Analysis of dividend policy American
Airlines Ryanair Industry Average BAA Asur
Industry average
ROE n.m. 14.69% 2.76% 8.23% 5.15% 10.20% Cost of Equity 34.54% 9.45% 10.69% 11.30% 9.65% n.a. Difference Na 5.24% -7.93% -3.07% -4.50% n.a. ROC 8.54% 16.94% 14.22% 5.59% 4.76% 5.71% WACC 16.69% 8.13% 8.65% 7.85% 9.65% n.a. Difference -8.15% 8.81% 5.57% -2.27% -4.89% n.a.
Figure 55 Analysis of past returns AA
Historical returns AA 2001 2002 2003 2004 ROE -32.79% -366.88% -2669.57% Nm Cost of Equity 15.69% 42.69% 26.01% 29.88% Difference -48.49% -409.56% -2695.58% Nm ROC -12.29% -16.82% -4.23% -0.72% WACC 14.32% 16.04% 15.70% 15.96% Difference -26.62% -32.86% -19.94% -16.68%
Figure 56 Analysis of past returns Ryanair Historical returns – Ryanair 2001 2002 2003 LTM ROE 18.80% 17.99% 21.34% 14.69% Cost of Equity 8.25% 9.46% 9.53% 9.45% Difference 10.56% 8.53% 11.81% 5.24% ROC 12.02% 10.74% 12.59% 16.94% WACC 7.85% 8.95% 8.57% 8.13% Difference 4.17% 1.80% 4.02% 8.81%
Figure 57 Analysis of past returns BAA
Historical returns BAA 2001 2002 2003 2004 ROE 8.59% 3.41% 7.89% 8.23% Cost of Equity 10.35% 9.48% 10.51% 11.30% Difference -1.76% -6.07% -2.63% -3.07% ROC 6.07% 5.72% 5.56% 5.59% WACC 8.92% 7.77% 7.85% 7.85% Difference -2.85% -2.05% -2.30% -2.27%
Figure 58 Analysis of past returns Asur Historical Returns – Asur 2001 2002 2003 2004 ROE 2.31% 1.81% 2.45% 5.15% Cost of Equity 9.89% 9.94% 10.46% 9.65% Difference -7.58% -8.14% -8.01% -4.50% ROC 2.25% 1.89% 2.94% 4.76% WACC 9.89% 9.94% 10.46% 9.65% Difference -7.65% -8.05% -7.52% -4.89%
53
Figure 59 Analysis of historical returns \
Recommendat ions
American Airlines – AA has the priority to return back to profitability before being able to
give any cash back to its stockholders. It seems that to a significant extend the problems of
AA stem from its high leverage and any dividend payment would reduce the value of the
equity, resulting in even worse debt ratio
Ryanair – the company has not paid any dividends, but it appears that it has a good
portfolio of investment projects that can and do generate positive value for its stockholders.
In addition, good corporate governance practices ensure that investors money is in good
hands with Ryanair’s management and we support the current non-divident policy of the
company
BAA – with its low risk profile and in its steady and reliable cash flows, BAA has definitely
attracted “dividend addict” shareholders, evident by the distribution of ownership. It is the
company with a large number of smaller investors who probably rely more on income than
on capital gain from this company. Appropriately it payout out large portion of its available
free cash flow to equity (74%) back to its shareholders. Taken into account the regulated
nature of the business and the fact that BAA cannot upgrade the prices it currently charges
from Airline until 2008, we suggest it accumulate a certain cash cushion to meet unexpected
turns in the economic trends. Current retention ration of about 25% seems appropriate.
-30.00%
-25.00%
-20.00%
-15.00%
-10.00%
-5.00%
0.00%
5.00%
10.00%
15.00%
20.00%
25.00%
30.00%
2001 2002 2003 2004
-50.00%
-40.00%
-30.00%
-20.00%
-10.00%
0.00%
10.00%
20.00%
American airlines ROE Ryanair ROE BAA ROE
Asur ROE AA Spread Ryanair Spread
BAA Spread Asur Spread
- 32.8%
- 366.9%
- 2669.6%
-30.00%
-25.00%
-20.00%
-15.00%
-10.00%
-5.00%
0.00%
5.00%
10.00%
15.00%
20.00%
25.00%
30.00%
2001 2002 2003 2004
-50.00%
-40.00%
-30.00%
-20.00%
-10.00%
0.00%
10.00%
20.00%
American airlines ROE Ryanair ROE BAA ROE
Asur ROE AA Spread Ryanair Spread
BAA Spread Asur Spread
- 32.8%
- 366.9%
- 2669.6%
54
Asur – Asur has been retaining a significant portion of their available free cash flow to
equity and on the other hand has not been able to deliver excess returns over it s cost of
capital. We believe that it should return more cash to its stockholders in the form of
dividends. In addition, it is not constrained by high debt ratio as its debt capacity is still
unused.
XII. Valuation
1. Valuation models
Based on the analysis presented above we proceeded to perform valuation of the market value
of the equity of all four companies. Table Figure 60 below summarizes the choice of our valuation
model and the results.
Figure 60 Summary of valuation results
Valuation summary American
Airlines Ryanair BAA Asur Model Chosen FCFF 2 Stage FCFF 3 Stage FCFF 2 Stage FCFF 2 Stage Value per Share 10.06 6.76 3.22 31.69 Current Stock Price 10.20 5.55 5.80 30.45 Undervalued / (overvalued) -1.3% 21.8% -44.4% 4.1% Reccomendation HOLD BUY SELL HOLD Source: Analysis
The choice of growth period reflects the sustainability of competitive advantages of each firm as
outlined in Part 3 Section IV – Investment Returns and Future prospects.
2. Valuation assumptions and inputs.
The valuation assumptions are presented in Figure 61 to Figure 64 below.

55
Figure 61 American Airlines – DCF valuation assumptions American Airlines High Growth Phase Stable Growth Length of Period 10.0 Forver Revenues 18,883.0 Pre-tax Operating Margin 13.8% Tax Rate 35% (theoretical) 35.0% Return on Capital 8.5% 10.5% Non-Cash Working Capital -8.4% -8.4% Reinvestment Rate (Net Cap Ex + Working Capital Investments/EBIT 16.5% 19.0% Expected growth Rate in EBIT 1.4% 2.0% Debt Capital Ratio 86.6% 25.0% Beta 6.26 1.22 Cost of Equity 34.5% 10.2% Cost of Debt 13.9% 25.0% Source: Company reports, analysis
Figure 62 Ryanair – DCF valuation assumptions Ryanair High Growth Phase Stable Growth Length of Period 4 years and 4 years transitional period Forever Operating income growth 22.53% 3% Tax Rate 12.50% 20.00% Return on Capital 15.48% 7.78% Cost of capital 8.13% 7.78% Non-Cash Working Capital starting at 8.45% and declining to 2% 2.00% Reinvestment Rate (Net Cap Ex + Working Capital Investments/EBIT 146% 39% Debt Capital Ratio 23.87% 10.00% Beta 1.24 1.00 Cost of Equity 9.5% 8.3% Cost of Debt 4.5% 4.0% Source: Company reports, analysis
Figure 63 BAA – DCF valuation assumptions BAA High Growth Phase Stable Growth Length of Period 4 Years Forever
Revenues Starting at £1,970 and growing with 4.8%
CAGR Growing at 2.00% Tax Rate 30% 30% Return on Capital 5.23% 6.93% Reinvestment Rate (Net Cap Ex + Working Capital Investments/EBIT Starting at 161.65% and declining to 28.85% 28.85% Expected growth Rate in EBIT starting at 8.45% and declining to 2% 2.00% Debt Capital Ratio 45% 45% Beta 1.42 0.90 Cost of Equity 11.30% 8.81% Cost of Debt 5.17% 5.17% Source: Company reports, analysis

56
Figure 64 Asur – DCF valuation assumptions Asur High Growth Phase Stable Growth Length of Period 5.0 Forever Revenues 177.2 Pre-tax Operating Margin Tax Rate 33.0% 33.0% Return on Capital 7.5% 11.0% Non-Cash Working Capital 5.93 5.93 Reinvestment Rate (Net Cap Ex + Working Capital Investments/EBIT 85.0% 30.0% Expected growth Rate in EBIT 7.0% 3.0% Debt Capital Ratio 0.0% 20.0% Beta 0.82 0.80 Cost of Equity 10.0% 8.1% Cost of Debt 0.0% 7.0% Source: Company reports, analysis
In building our assumptions into the valuation model we had the following approach:
We have used the bottom-up beta estimates we calculated earlier in the cost of equity computation.
The risk characteristics in perpetuity are likely to change as follows:
o American Airline – changing debt ratio (going concern assumption) should reduce risk
and hence beta. The beta used in perpetuity is the unlevered average industry beta re-
levered to a more sustainable debt ratio
o Ryanair – as the company grows and becomes more mature, the risk is expected to
converge with the market
o BAA and Asur – risk is assumed to converge with market risk, although at the low end
reflecting stability in cash flows
Growth rate are derived from fundamentals and based on ROC and Reinvestment rates. In
perpetuity the growth rate is set at levels below or close to long term sustainable economic growth
as we don’t expect these sectors to be the major drivers of economic growth.
Growth phase Capex and Working capital changes have been projected on the basis of historical
data. I perpetuity the implied reinvestment rates were used (derived as a function of growth and
ROC).
Leverage – we projected that in the long term the companies gradually move to their optimal capital
structure, except for BAA,which is already at its optimum.
In addition, Asur is assumed to generate a ROC slightly higher than its cost of capital in the future. The
rationale behind this is that as the company becomes more mature and moves towards its optimum
capital structure the cost of capital is likely to fall. This fall is likely to be supplemented by reduced risk
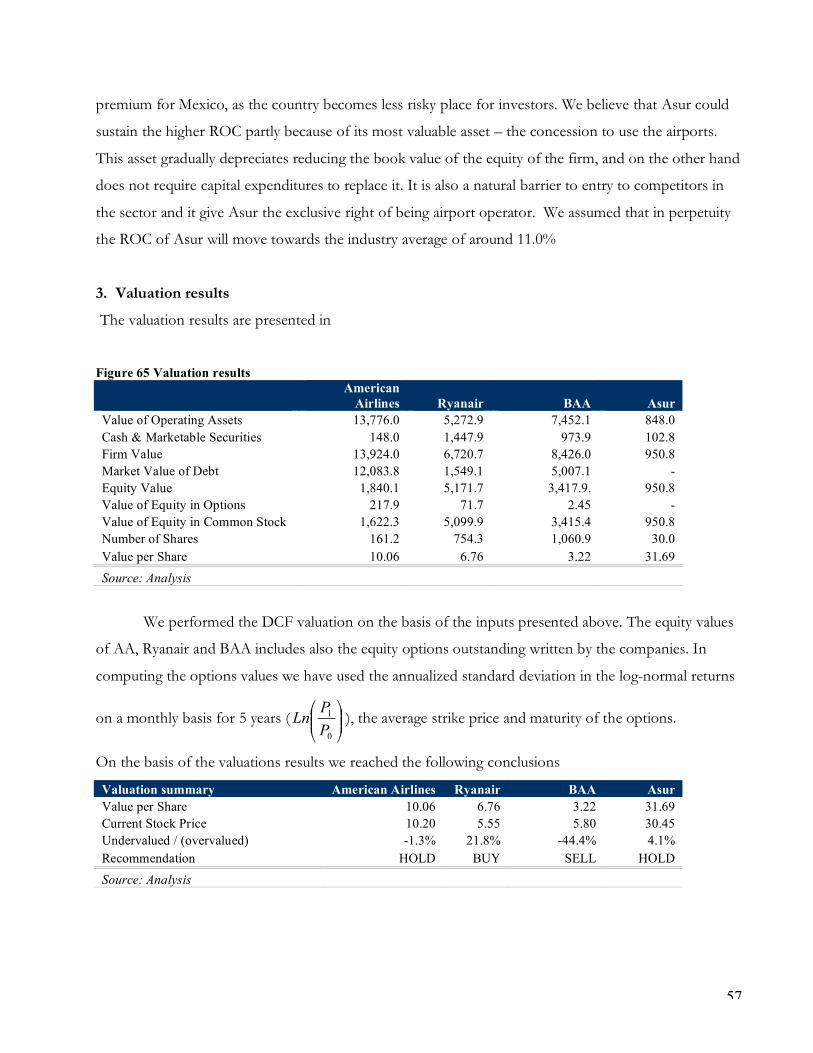
57
premium for Mexico, as the country becomes less risky place for investors. We believe that Asur could
sustain the higher ROC partly because of its most valuable asset – the concession to use the airports.
This asset gradually depreciates reducing the book value of the equity of the firm, and on the other hand
does not require capital expenditures to replace it. It is also a natural barrier to entry to competitors in
the sector and it give Asur the exclusive right of being airport operator. We assumed that in perpetuity
the ROC of Asur will move towards the industry average of around 11.0%
3. Valuation results
The valuation results are presented in
Figure 65 Valuation results
American
Airlines Ryanair BAA Asur Value of Operating Assets 13,776.0 5,272.9 7,452.1 848.0 Cash & Marketable Securities 148.0 1,447.9 973.9 102.8 Firm Value 13,924.0 6,720.7 8,426.0 950.8 Market Value of Debt 12,083.8 1,549.1 5,007.1 - Equity Value 1,840.1 5,171.7 3,417.9. 950.8 Value of Equity in Options 217.9 71.7 2.45 - Value of Equity in Common Stock 1,622.3 5,099.9 3,415.4 950.8 Number of Shares 161.2 754.3 1,060.9 30.0 Value per Share 10.06 6.76 3.22 31.69 Source: Analysis
We performed the DCF valuation on the basis of the inputs presented above. The equity values
of AA, Ryanair and BAA includes also the equity options outstanding written by the companies. In
computing the options values we have used the annualized standard deviation in the log-normal returns
on a monthly basis for 5 years ( !!"
#$$%
&
0
1
P
PLn ), the average strike price and maturity of the options.
On the basis of the valuations results we reached the following conclusions
Valuation summary American Airlines Ryanair BAA Asur Value per Share 10.06 6.76 3.22 31.69 Current Stock Price 10.20 5.55 5.80 30.45 Undervalued / (overvalued) -1.3% 21.8% -44.4% 4.1% Recommendation HOLD BUY SELL HOLD Source: Analysis

58
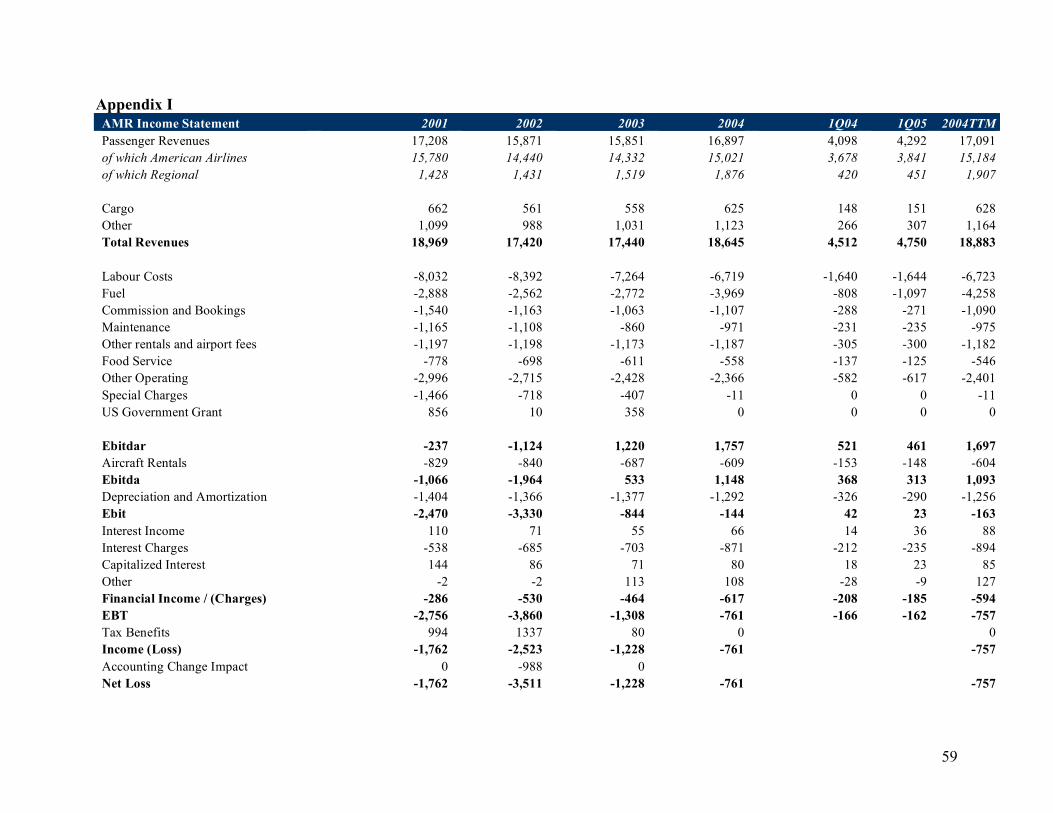
59
Appendix I AMR Income Statement 2001 2002 2003 2004 1Q04 1Q05 2004TTM Passenger Revenues 17,208 15,871 15,851 16,897 4,098 4,292 17,091 of which American Airlines 15,780 14,440 14,332 15,021 3,678 3,841 15,184 of which Regional 1,428 1,431 1,519 1,876 420 451 1,907 Cargo 662 561 558 625 148 151 628 Other 1,099 988 1,031 1,123 266 307 1,164 Total Revenues 18,969 17,420 17,440 18,645 4,512 4,750 18,883 Labour Costs -8,032 -8,392 -7,264 -6,719 -1,640 -1,644 -6,723 Fuel -2,888 -2,562 -2,772 -3,969 -808 -1,097 -4,258 Commission and Bookings -1,540 -1,163 -1,063 -1,107 -288 -271 -1,090 Maintenance -1,165 -1,108 -860 -971 -231 -235 -975 Other rentals and airport fees -1,197 -1,198 -1,173 -1,187 -305 -300 -1,182 Food Service -778 -698 -611 -558 -137 -125 -546 Other Operating -2,996 -2,715 -2,428 -2,366 -582 -617 -2,401 Special Charges -1,466 -718 -407 -11 0 0 -11 US Government Grant 856 10 358 0 0 0 0 Ebitdar -237 -1,124 1,220 1,757 521 461 1,697 Aircraft Rentals -829 -840 -687 -609 -153 -148 -604 Ebitda -1,066 -1,964 533 1,148 368 313 1,093 Depreciation and Amortization -1,404 -1,366 -1,377 -1,292 -326 -290 -1,256 Ebit -2,470 -3,330 -844 -144 42 23 -163 Interest Income 110 71 55 66 14 36 88 Interest Charges -538 -685 -703 -871 -212 -235 -894 Capitalized Interest 144 86 71 80 18 23 85 Other -2 -2 113 108 -28 -9 127 Financial Income / (Charges) -286 -530 -464 -617 -208 -185 -594 EBT -2,756 -3,860 -1,308 -761 -166 -162 -757 Tax Benefits 994 1337 80 0 0 Income (Loss) -1,762 -2,523 -1,228 -761 -757 Accounting Change Impact 0 -988 0 Net Loss -1,762 -3,511 -1,228 -761 -757
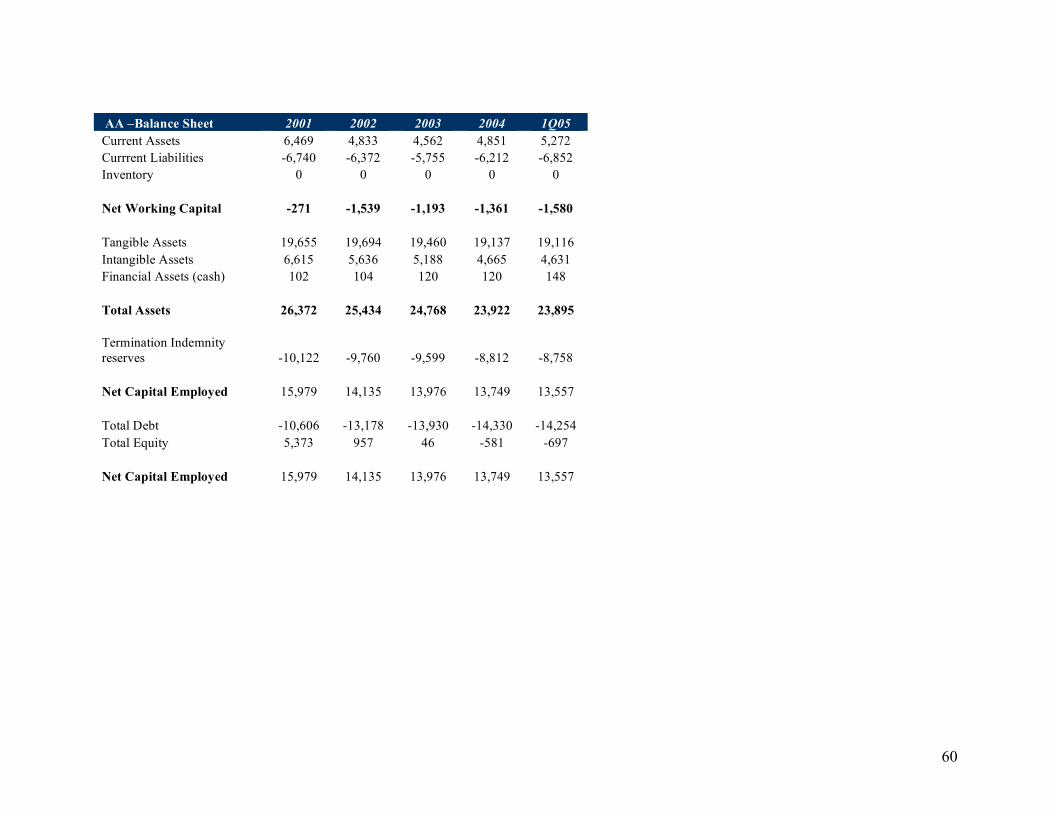
60
AA –Balance Sheet 2001 2002 2003 2004 1Q05 Current Assets 6,469 4,833 4,562 4,851 5,272 Currrent Liabilities -6,740 -6,372 -5,755 -6,212 -6,852 Inventory 0 0 0 0 0 Net Working Capital -271 -1,539 -1,193 -1,361 -1,580 Tangible Assets 19,655 19,694 19,460 19,137 19,116 Intangible Assets 6,615 5,636 5,188 4,665 4,631 Financial Assets (cash) 102 104 120 120 148 Total Assets 26,372 25,434 24,768 23,922 23,895 Termination Indemnity reserves -10,122 -9,760 -9,599 -8,812 -8,758 Net Capital Employed 15,979 14,135 13,976 13,749 13,557 Total Debt -10,606 -13,178 -13,930 -14,330 -14,254 Total Equity 5,373 957 46 -581 -697 Net Capital Employed 15,979 14,135 13,976 13,749 13,557
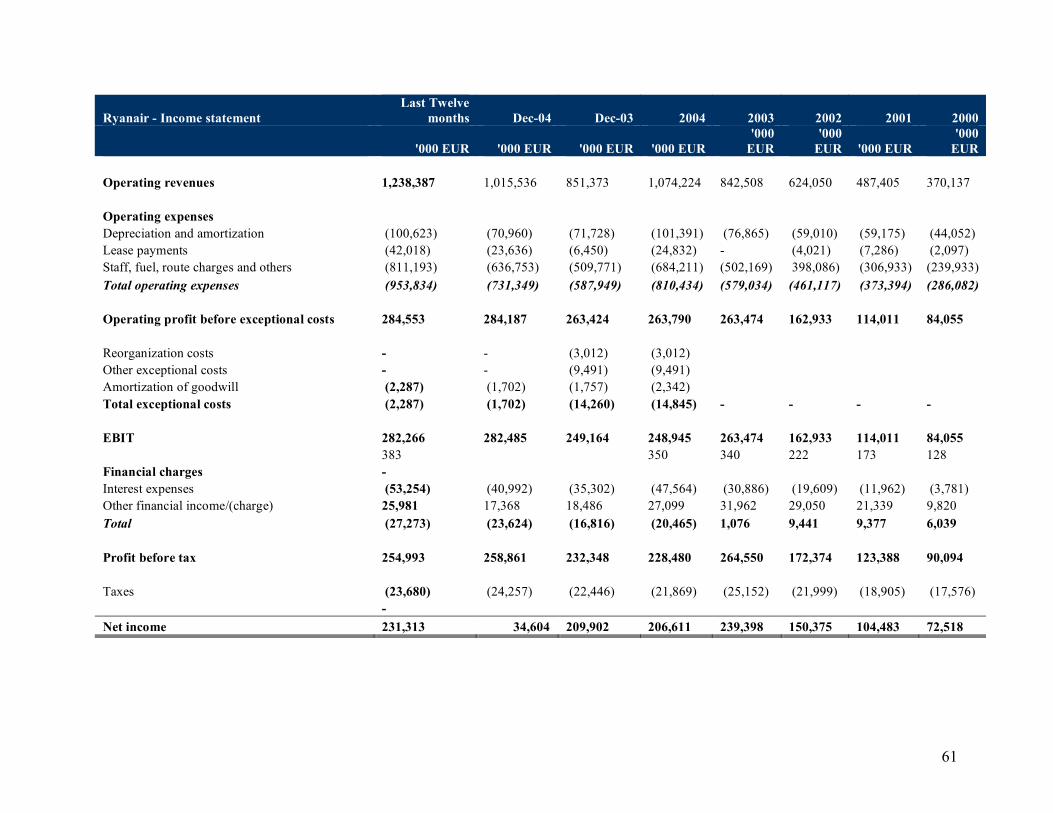
61
Ryanair - Income statement Last Twelve
months Dec-04 Dec-03 2004 2003 2002 2001 2000
'000 EUR '000 EUR '000 EUR '000 EUR '000
EUR '000
EUR '000 EUR '000
EUR
Operating revenues 1,238,387 1,015,536 851,373 1,074,224 842,508 624,050 487,405 370,137 Operating expenses Depreciation and amortization (100,623) (70,960) (71,728) (101,391) (76,865) (59,010) (59,175) (44,052) Lease payments (42,018) (23,636) (6,450) (24,832) - (4,021) (7,286) (2,097) Staff, fuel, route charges and others (811,193) (636,753) (509,771) (684,211) (502,169) 398,086) (306,933) (239,933) Total operating expenses (953,834) (731,349) (587,949) (810,434) (579,034) (461,117) (373,394) (286,082) Operating profit before exceptional costs 284,553 284,187 263,424 263,790 263,474 162,933 114,011 84,055 Reorganization costs - - (3,012) (3,012) Other exceptional costs - - (9,491) (9,491) Amortization of goodwill (2,287) (1,702) (1,757) (2,342) Total exceptional costs (2,287) (1,702) (14,260) (14,845) - - - - EBIT 282,266 282,485 249,164 248,945 263,474 162,933 114,011 84,055 383 350 340 222 173 128 Financial charges - Interest expenses (53,254) (40,992) (35,302) (47,564) (30,886) (19,609) (11,962) (3,781) Other financial income/(charge) 25,981 17,368 18,486 27,099 31,962 29,050 21,339 9,820 Total (27,273) (23,624) (16,816) (20,465) 1,076 9,441 9,377 6,039 Profit before tax 254,993 258,861 232,348 228,480 264,550 172,374 123,388 90,094 Taxes (23,680) (24,257) (22,446) (21,869) (25,152) (21,999) (18,905) (17,576) - Net income 231,313 34,604 209,902 206,611 239,398 150,375 104,483 72,518

62
Balance sheet Last Twelve
months Dec-04 Dec-03 2004 2003 2002 2001 2000
'000 EUR '000 EUR '000 EUR '000 EUR '000 EUR '000 EUR '000 EUR '000
EUR
Fixed assets Intangible 30,872 30,872 45,085 44,499 - 36 36 Tangible 1,845,452 1,845,452 1,611,127 1,576,526 1,352,361 951,806 613,591 315,032 Total fixed assets 1,876,324 1,876,324 1,656,212 1,621,025 1,352,361 951,806 613,627 315,068 Current asets Cash and liquid resources 1,447,850 1,447,850 1,124,671 1,257,350 1,060,218 899,275 626,720 355,248 Receivables 14,467 14,467 11,478 14,932 14,970 10,331 8,695 21,974 Prepayments and other receivables 18,608 18,608 22,977 19,251 16,370 11,035 12,235 6,478 Inventories 27,160 27,160 24,183 26,440 22,788 17,125 15,975 13,933 Total current assets 1,508,085 1,508,085 1,183,309 1,317,973 1,114,346 937,766 663,625 397,633 Total assets 3,384,409 3,384,409 2,839,521 2,938,998 2,466,707 1,889,572 1,277,252 712,701 Current liabilities Payables 89,439 89,439 82,491 67,936 61,604 46,779 29,998 22,861 Accrued expenses and others 317,049 317,049 223,679 338,208 251,328 217,108 139,406 107,445 Current portion of long term debt 106,841 106,841 79,545 80,337 63,291 38,800 27,994 9,567 Short term borrowings 2,325 2,325 4,454 345 1,316 5,505 5,078 3,780 Total current liabilities 515,654 515,654 390,169 486,826 377,539 308,192 202,476 143,653 Long term liabilities Provisions 107,741 107,741 97,915 94,192 67,833 49,317 30,122 Other creditors 22,958 22,958 268 30,047 5,673 18,086 15,279 Long term debt 1,046,546 1,046,546 893,285 872,645 773,934 511,703 374,756 112,412 Total long term liabilities 1,177,245 1,177,245 991,468 996,884 847,440 579,106 404,878 127,691 Shareholders equity Share capital 9,652 9,652 9,637 9,643 9,588 9,587 9,194 8,892 Share premium 562,015 562,015 559,717 560,406 553,512 553,457 371,849 248,093 Profit and loss 1,119,843 1,119,843 888,530 885,239 678,628 439,230 288,855 184,372 Total equity funds 1,691,510 1,691,510 1,457,884 1,455,288 1,241,728 1,002,274 669,898 441,357 Total liabilities and equity 3,384,409 3,384,409 2,839,521 2,938,998 2,466,707 1,889,572 1,277,252 712,701
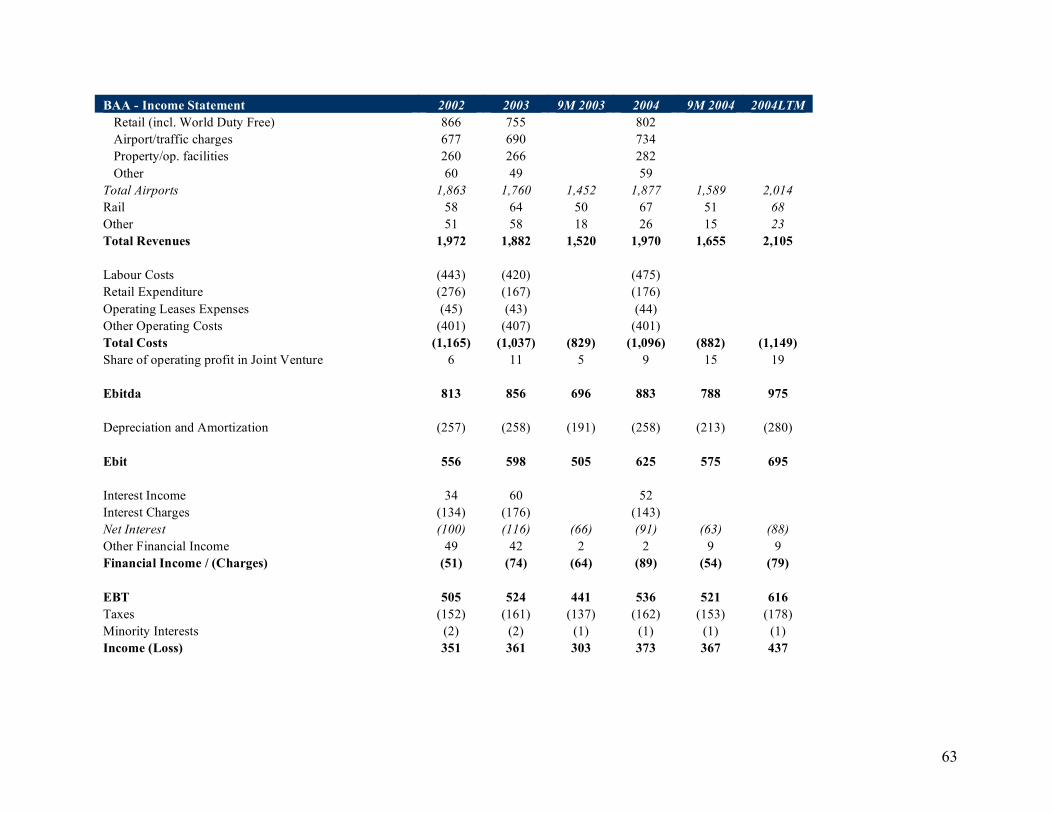
63
BAA - Income Statement 2002 2003 9M 2003 2004 9M 2004 2004LTM Retail (incl. World Duty Free) 866 755 802 Airport/traffic charges 677 690 734 Property/op. facilities 260 266 282 Other 60 49 59
Total Airports 1,863 1,760 1,452 1,877 1,589 2,014 Rail 58 64 50 67 51 68 Other 51 58 18 26 15 23 Total Revenues 1,972 1,882 1,520 1,970 1,655 2,105 Labour Costs (443) (420) (475) Retail Expenditure (276) (167) (176) Operating Leases Expenses (45) (43) (44) Other Operating Costs (401) (407) (401) Total Costs (1,165) (1,037) (829) (1,096) (882) (1,149) Share of operating profit in Joint Venture 6 11 5 9 15 19 Ebitda 813 856 696 883 788 975 Depreciation and Amortization (257) (258) (191) (258) (213) (280) Ebit 556 598 505 625 575 695 Interest Income 34 60 52 Interest Charges (134) (176) (143) Net Interest (100) (116) (66) (91) (63) (88) Other Financial Income 49 42 2 2 9 9 Financial Income / (Charges) (51) (74) (64) (89) (54) (79) EBT 505 524 441 536 521 616 Taxes (152) (161) (137) (162) (153) (178) Minority Interests (2) (2) (1) (1) (1) (1) Income (Loss) 351 361 303 373 367 437

64
BAA - Balance Shteet 2002 2003 2004 Dec-04
Trade Receivables 183 218 270 314 Trade Payables (125) (143) (152) (150) Inventory 34 27 23 53
Net Working Capital 92 102 141 217 Other Current Assets / (Liabilities) (576) (669) (792) (810) Total Net Current Assets (484) (567) (651) (593) Tangible Assets 6,975 7,802 9,074 9,997 Intangible Assets 10 10 10 10
Share of Gross Assets 51 75 60 62 Share of Gross Liabilities (39) (72) (46) (48) Loans 39 30 17 18
Investments in JVs 51 33 31 32 Investments in associates 6 7 49 42 Othe investments 80 142 122 80 Total Fixed Assets 7,122 7,994 9,286 10,161 Other Liabilities (267) (971) (901) (941) Net Capital Employed 6,371 6,456 7,734 8,627
Gross Financial Debt 2,567 3,029 3,598 4,169 of which Convertible Debt 311 730 838 838 of which Bonds 1,842 1,873 2,266 of which Bank Loans 350 378 447 other financial debt 34 48 47
Cash & Marketable Securities (939) (1,156) (890) (849) Net Debt 1,628 1,873 2,708 3,320 Minority Interest 6 8 8 9 Total Equity 4,737 4,575 5,018 5,298 Net Capital Employed 6,371 6,456 7,734 8,627
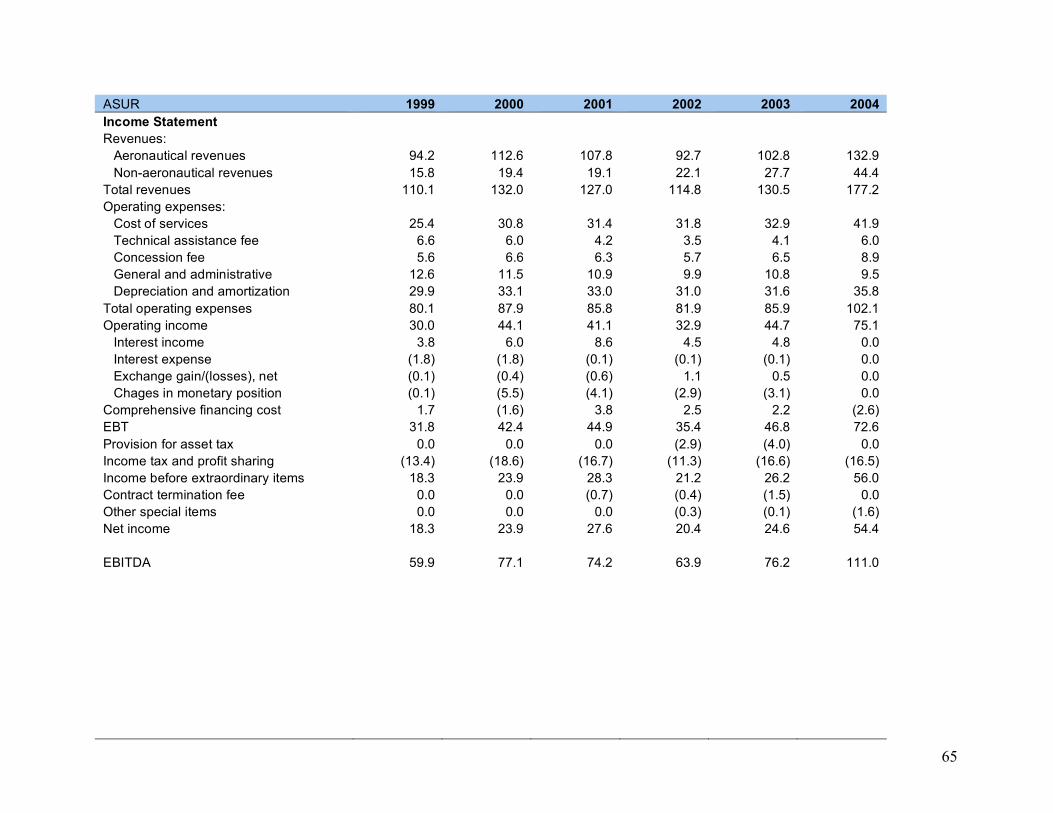
65
ASUR 1999 2000 2001 2002 2003 2004 Income Statement Revenues:
Aeronautical revenues 94.2 112.6 107.8 92.7 102.8 132.9 Non-aeronautical revenues 15.8 19.4 19.1 22.1 27.7 44.4
Total revenues 110.1 132.0 127.0 114.8 130.5 177.2 Operating expenses:
Cost of services 25.4 30.8 31.4 31.8 32.9 41.9 Technical assistance fee 6.6 6.0 4.2 3.5 4.1 6.0 Concession fee 5.6 6.6 6.3 5.7 6.5 8.9 General and administrative 12.6 11.5 10.9 9.9 10.8 9.5 Depreciation and amortization 29.9 33.1 33.0 31.0 31.6 35.8
Total operating expenses 80.1 87.9 85.8 81.9 85.9 102.1 Operating income 30.0 44.1 41.1 32.9 44.7 75.1
Interest income 3.8 6.0 8.6 4.5 4.8 0.0 Interest expense (1.8) (1.8) (0.1) (0.1) (0.1) 0.0 Exchange gain/(losses), net (0.1) (0.4) (0.6) 1.1 0.5 0.0 Chages in monetary position (0.1) (5.5) (4.1) (2.9) (3.1) 0.0
Comprehensive financing cost 1.7 (1.6) 3.8 2.5 2.2 (2.6) EBT 31.8 42.4 44.9 35.4 46.8 72.6 Provision for asset tax 0.0 0.0 0.0 (2.9) (4.0) 0.0 Income tax and profit sharing (13.4) (18.6) (16.7) (11.3) (16.6) (16.5) Income before extraordinary items 18.3 23.9 28.3 21.2 26.2 56.0 Contract termination fee 0.0 0.0 (0.7) (0.4) (1.5) 0.0 Other special items 0.0 0.0 0.0 (0.3) (0.1) (1.6) Net income 18.3 23.9 27.6 20.4 24.6 54.4 EBITDA 59.9 77.1 74.2 63.9 76.2 111.0

66
ASUR 1999 2000 2001 2002 2003 2004 Balance Sheet Cash and marketable securities 63.7 95.8 46.0 63.2 102.8 Trade receivables 10.9 14.1 15.4 15.2 19.0 Recovarable taxes and other current assets 2.1 6.7 5.5 12.5 2.8 Total current assets 76.7 116.6 66.9 90.9 124.6 Property, plant and equipment 30.7 65.4 79.4 103.8 149.4 Airport concessions, net of amortization 827.9 806.1 703.4 683.8 704.2 Right to use airport facilities, net 233.6 225.1 194.4 187.8 192.7 Total assets 1,169.0 1,213.3 1,044.0 1,066.3 1,170.9 Trade accounts payable 1.3 0.1 0.2 0.9 1.0 Accrued expenses and other payables 7.3 8.7 11.1 13.0 14.9 Total current liabilities 8.6 8.8 11.4 13.9 15.9 Long term debt 0.0 0.0 0.0 0.0 0.0 Other 0.0 0.0 0.1 0.1 1.3 Deferred income tax and profit sharing 24.2 40.7 36.0 42.6 48.1 Total liabilities 32.8 49.5 47.4 56.5 65.3 Capital stock 1,082.2 1,082.2 970.6 970.6 1,029.0 Legal reserve 1.4 7.3 3.6 4.6 20.5 Retained earnings 52.5 74.2 22.5 34.6 56.0 Total stockholders' equity 1,136.2 1,163.7 996.7 1,009.8 1,105.5 Total liabilities and stockholders' equity 1,169.0 1,213.3 1,044.0 1,066.3 1,170.9
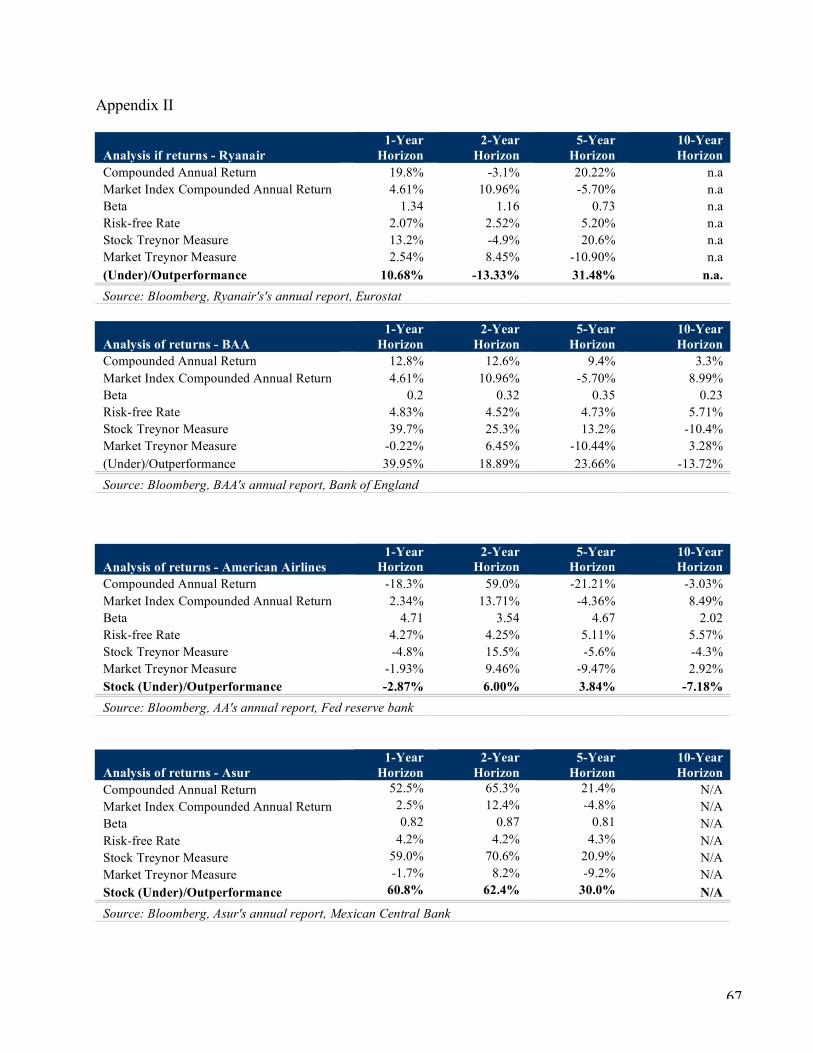
67
Appendix II
Analysis if returns - Ryanair 1-Year
Horizon 2-Year
Horizon 5-Year
Horizon 10-Year Horizon
Compounded Annual Return 19.8% -3.1% 20.22% n.a Market Index Compounded Annual Return 4.61% 10.96% -5.70% n.a Beta 1.34 1.16 0.73 n.a Risk-free Rate 2.07% 2.52% 5.20% n.a Stock Treynor Measure 13.2% -4.9% 20.6% n.a Market Treynor Measure 2.54% 8.45% -10.90% n.a (Under)/Outperformance 10.68% -13.33% 31.48% n.a. Source: Bloomberg, Ryanair's's annual report, Eurostat
Analysis of returns - BAA 1-Year
Horizon 2-Year
Horizon 5-Year
Horizon 10-Year Horizon
Compounded Annual Return 12.8% 12.6% 9.4% 3.3% Market Index Compounded Annual Return 4.61% 10.96% -5.70% 8.99% Beta 0.2 0.32 0.35 0.23 Risk-free Rate 4.83% 4.52% 4.73% 5.71% Stock Treynor Measure 39.7% 25.3% 13.2% -10.4% Market Treynor Measure -0.22% 6.45% -10.44% 3.28% (Under)/Outperformance 39.95% 18.89% 23.66% -13.72% Source: Bloomberg, BAA's annual report, Bank of England
Analysis of returns - American Airlines 1-Year
Horizon 2-Year
Horizon 5-Year
Horizon 10-Year Horizon
Compounded Annual Return -18.3% 59.0% -21.21% -3.03% Market Index Compounded Annual Return 2.34% 13.71% -4.36% 8.49% Beta 4.71 3.54 4.67 2.02 Risk-free Rate 4.27% 4.25% 5.11% 5.57% Stock Treynor Measure -4.8% 15.5% -5.6% -4.3% Market Treynor Measure -1.93% 9.46% -9.47% 2.92% Stock (Under)/Outperformance -2.87% 6.00% 3.84% -7.18% Source: Bloomberg, AA's annual report, Fed reserve bank
Analysis of returns - Asur 1-Year
Horizon 2-Year
Horizon 5-Year
Horizon 10-Year Horizon
Compounded Annual Return 52.5% 65.3% 21.4% N/A Market Index Compounded Annual Return 2.5% 12.4% -4.8% N/A Beta 0.82 0.87 0.81 N/A Risk-free Rate 4.2% 4.2% 4.3% N/A Stock Treynor Measure 59.0% 70.6% 20.9% N/A Market Treynor Measure -1.7% 8.2% -9.2% N/A Stock (Under)/Outperformance 60.8% 62.4% 30.0% N/A Source: Bloomberg, Asur's annual report, Mexican Central Bank

68