Embed Size (px)
Citation preview

Aswath Damodaran 132
Relative Valuation
Aswath Damodaran

Aswath Damodaran 133
The Essence of relative valuation?
In relative valuation, the value of an asset is compared to the values assessedby the market for similar or comparable assets.
To do relative valuation then,• we need to identify comparable assets and obtain market values for these assets• convert these market values into standardized values, since the absolute prices
cannot be compared This process of standardizing creates price multiples.• compare the standardized value or multiple for the asset being analyzed to the
standardized values for comparable asset, controlling for any differences betweenthe firms that might affect the multiple, to judge whether the asset is under or overvalued

Aswath Damodaran 134
Relative valuation is pervasive…
Most asset valuations are relative. Most equity valuations on Wall Street are relative valuations.
• Almost 85% of equity research reports are based upon a multiple and comparables.• More than 50% of all acquisition valuations are based upon multiples• Rules of thumb based on multiples are not only common but are often the basis for
final valuation judgments. While there are more discounted cashflow valuations in consulting and
corporate finance, they are often relative valuations masquerading asdiscounted cash flow valuations.
• The objective in many discounted cashflow valuations is to back into a number thathas been obtained by using a multiple.
• The terminal value in a significant number of discounted cashflow valuations isestimated using a multiple.

Aswath Damodaran 135
The Reasons for the allure…
“If you think I’m crazy, you should see the guy who lives across the hall”Jerry Seinfeld talking about Kramer in a Seinfeld episode
“ A little inaccuracy sometimes saves tons of explanation”H.H. Munro
“ If you are going to screw up, make sure that you have lots of company”Ex-portfolio manager

Aswath Damodaran 136
The Market Imperative….
Relative valuation is much more likely to reflect market perceptions andmoods than discounted cash flow valuation. This can be an advantage when itis important that the price reflect these perceptions as is the case when
• the objective is to sell a security at that price today (as in the case of an IPO)• investing on “momentum” based strategies
With relative valuation, there will always be a significant proportion ofsecurities that are under valued and over valued.
Since portfolio managers are judged based upon how they perform on arelative basis (to the market and other money managers), relative valuation ismore tailored to their needs
Relative valuation generally requires less information than discounted cashflow valuation (especially when multiples are used as screens)

Aswath Damodaran 137
The Four Steps to Deconstructing Multiples
Define the multiple• In use, the same multiple can be defined in different ways by different users. When
comparing and using multiples, estimated by someone else, it is critical that weunderstand how the multiples have been estimated
Describe the multiple• Too many people who use a multiple have no idea what its cross sectional
distribution is. If you do not know what the cross sectional distribution of amultiple is, it is difficult to look at a number and pass judgment on whether it is toohigh or low.
Analyze the multiple• It is critical that we understand the fundamentals that drive each multiple, and the
nature of the relationship between the multiple and each variable. Apply the multiple
• Defining the comparable universe and controlling for differences is far moredifficult in practice than it is in theory.

Aswath Damodaran 138
Definitional Tests
Is the multiple consistently defined?• Proposition 1: Both the value (the numerator) and the standardizing variable (
the denominator) should be to the same claimholders in the firm. In otherwords, the value of equity should be divided by equity earnings or equity bookvalue, and firm value should be divided by firm earnings or book value.
Is the multiple uniformly estimated?• The variables used in defining the multiple should be estimated uniformly across
assets in the “comparable firm” list.• If earnings-based multiples are used, the accounting rules to measure earnings
should be applied consistently across assets. The same rule applies with book-valuebased multiples.

Aswath Damodaran 139
Example 1: Price Earnings Ratio: Definition
PE = Market Price per Share / Earnings per Share There are a number of variants on the basic PE ratio in use. They are based
upon how the price and the earnings are defined. Price: is usually the current price
is sometimes the average price for the year EPS: earnings per share in most recent financial year
earnings per share in trailing 12 months (Trailing PE)forecasted earnings per share next year (Forward PE)forecasted earnings per share in future year

Aswath Damodaran 140
Example 2: Enterprise Value /EBITDA Multiple
The enterprise value to EBITDA multiple is obtained by netting cash outagainst debt to arrive at enterprise value and dividing by EBITDA.
Why do we net out cash from firm value? What happens if a firm has cross holdings which are categorized as:
• Minority interests?• Majority active interests?
!
Enterprise Value
EBITDA=
Market Value of Equity + Market Value of Debt - Cash
Earnings before Interest, Taxes and Depreciation
Aswath Damodaran 141
Descriptive Tests
What is the average and standard deviation for this multiple, across theuniverse (market)?
What is the median for this multiple?• The median for this multiple is often a more reliable comparison point.
How large are the outliers to the distribution, and how do we deal with theoutliers?
• Throwing out the outliers may seem like an obvious solution, but if the outliers alllie on one side of the distribution (they usually are large positive numbers), this canlead to a biased estimate.
Are there cases where the multiple cannot be estimated? Will ignoring thesecases lead to a biased estimate of the multiple?
How has this multiple changed over time?

Aswath Damodaran 142
Looking at the distribution…

Aswath Damodaran 143
PE: Deciphering the Distribution
Current PE Trailing PE Forward PE
Mean 40.77 39.67 34.46
Standard Error 1.80 5.08 2.12
Median 21.21 19.20 19.62
Standard Deviation 119.08 330.10 114.32
Kurtosis 355.27 2921.11 1111.11
Skewness 16.53 50.83 30.77
Range 12170.00 19561.00 4562.00
Minimum 2.45 4.16 4.38
Maximum 19561.00 13355.00 4562.00
Count 4363 4229 2894
90th percentile 66.64 54.28 44.98
10th percentile 9.89 8.35 13.05

Aswath Damodaran 144
Comparing PE Ratios: US, Europe, Japan and EmergingMarkets

Aswath Damodaran 145
And 8 times EBITDA is not cheap

Aswath Damodaran 146
Analytical Tests
What are the fundamentals that determine and drive these multiples?• Proposition 2: Embedded in every multiple are all of the variables that drive every
discounted cash flow valuation - growth, risk and cash flow patterns.• In fact, using a simple discounted cash flow model and basic algebra should yield
the fundamentals that drive a multiple How do changes in these fundamentals change the multiple?
• The relationship between a fundamental (like growth) and a multiple (such as PE)is seldom linear. For example, if firm A has twice the growth rate of firm B, it willgenerally not trade at twice its PE ratio
• Proposition 3: It is impossible to properly compare firms on a multiple, if wedo not know the nature of the relationship between fundamentals and themultiple.

Aswath Damodaran 147
PE Ratio: Understanding the Fundamentals
To understand the fundamentals, start with a basic equity discounted cash flowmodel.
With the dividend discount model,
Dividing both sides by the current earnings per share,
If this had been a FCFE Model,
P0 =DPS1
r ! gn
P0
EPS0
= PE = Payout Ratio * (1 + gn )
r-gn
P0 =FCFE1
r ! gn
!
P0
EPS0
= PE = (FCFE/Earnings)* (1+ gn )
r-gn

Aswath Damodaran 148
Using the Fundamental Model to Estimate PE For a HighGrowth Firm
The price-earnings ratio for a high growth firm can also be related tofundamentals. In the special case of the two-stage dividend discount model,this relationship can be made explicit fairly simply:
• For a firm that does not pay what it can afford to in dividends, substituteFCFE/Earnings for the payout ratio.
Dividing both sides by the earnings per share:
P0 =
EPS0 * Payout Ratio *(1+ g)* 1 !(1+ g)
n
(1+ r)n
"
# $ %
&
r - g+
EPS0 * Payout Ration *(1+ g)n *(1+ gn )
(r -gn )(1+ r)n
P0
EPS0
=
Payout Ratio * (1 + g) * 1 !(1 + g)n
(1+ r)n
"
# $ %
& '
r - g+
Payout Ratio n *(1+ g)n * (1 + gn )
(r - gn )(1+ r)n

Aswath Damodaran 149
A Simple Example
Assume that you have been asked to estimate the PE ratio for a firm which hasthe following characteristics:Variable High Growth Phase Stable Growth Phase
Expected Growth Rate 25% 8%Payout Ratio 20% 50%Beta 1.00 1.00Number of years 5 years Forever after year 5 Riskfree rate = T.Bond Rate = 6% Required rate of return = 6% + 1(5.5%)= 11.5%
!
PE =
0.2 * (1.25) * 1"(1.25)
5
(1.115)5
#
$ %
&
' (
(.115 - .25)+
0.5 * (1.25)5* (1.08)
(.115 - .08) (1.115)5
= 28.75

Aswath Damodaran 150
a. PE and Growth: Firm grows at x% for 5 years, 8%thereafter
PE Ratios and Expected Growth: Interest Rate Scenarios
0
20
40
60
80
100
120
140
160
180
5% 10% 15% 20% 25% 30% 35% 40% 45% 50%
Expected Growth Rate
PE
Rati
o r=4%
r=6%
r=8%
r=10%

Aswath Damodaran 151
b. PE and Risk: A Follow up Example
PE Ratios and Beta: Growth Scenarios
0
5
10
15
20
25
30
35
40
45
50
0.75 1.00 1.25 1.50 1.75 2.00
Beta
PE
Rati
o g=25%
g=20%
g=15%
g=8%

Aswath Damodaran 152
Comparisons of PE across time: PE Ratio for the S&P 500

Aswath Damodaran 153
Is low (high) PE cheap (expensive)?
A market strategist argues that stocks are over priced because the PE ratiotoday is too high relative to the average PE ratio across time. Do you agree? Yes No
If you do not agree, what factors might explain the higher PE ratio today?

Aswath Damodaran 154
E/P Ratios , T.Bond Rates and Term Structure

Aswath Damodaran 155
Regression Results
There is a strong positive relationship between E/P ratios and T.Bond rates, asevidenced by the correlation of 0.71 between the two variables.,
In addition, there is evidence that the term structure also affects the PE ratio. In the following regression, using 1960-2006 data, we regress E/P ratios
against the level of T.Bond rates and a term structure variable (T.Bond - T.Billrate)
E/P = 2.09% + 0.743 T.Bond Rate - 0.328 (T.Bond Rate-T.Bill Rate) (2.51) (6.75) (-1.37)
R squared = 51.50%

Aswath Damodaran 156
The Determinants of Multiples…
Value of Stock = DPS 1/(ke - g)
PE=Payout Ratio (1+g)/(r-g)
PEG=Payout ratio (1+g)/g(r-g)
PBV=ROE (Payout ratio) (1+g)/(r-g)
PS= Net Margin (Payout ratio)(1+g)/(r-g)
Value of Firm = FCFF 1/(WACC -g)
Value/FCFF=(1+g)/(WACC-g)
Value/EBIT(1-t) = (1+g) (1- RIR)/(WACC-g)
Value/EBIT=(1+g)(1-RiR)/(1-t)(WACC-g)
VS= Oper Margin (1-RIR) (1+g)/(WACC-g)
Equity Multiples
Firm Multiples
PE=f(g, payout, risk) PEG=f(g, payout, risk) PBV=f(ROE,payout, g, risk) PS=f(Net Mgn, payout, g, risk)
V/FCFF=f(g, WACC) V/EBIT(1-t)=f(g, RIR, WACC) V/EBIT=f(g, RIR, WACC, t) VS=f(Oper Mgn, RIR, g, WACC)

Aswath Damodaran 157
Application Tests
Given the firm that we are valuing, what is a “comparable” firm?• While traditional analysis is built on the premise that firms in the same sector are
comparable firms, valuation theory would suggest that a comparable firm is onewhich is similar to the one being analyzed in terms of fundamentals.
• Proposition 4: There is no reason why a firm cannot be compared withanother firm in a very different business, if the two firms have the same risk,growth and cash flow characteristics.
Given the comparable firms, how do we adjust for differences across firms onthe fundamentals?
• Proposition 5: It is impossible to find an exactly identical firm to the one youare valuing.

Aswath Damodaran 158
I. Comparing PE Ratios across a Sector: PE
Company Name PE Growth
PT Indosat ADR 7.8 0.06
Telebras ADR 8.9 0.075
Telecom Corporation of New Zealand ADR 11.2 0.11
Telecom Argentina Stet - France Telecom SA ADR B 12.5 0.08
Hellenic Telecommunication Organization SA ADR 12.8 0.12
Telecomunicaciones de Chile ADR 16.6 0.08
Swisscom AG ADR 18.3 0.11
Asia Satellite Telecom Holdings ADR 19.6 0.16
Portugal Telecom SA ADR 20.8 0.13
Telefonos de Mexico ADR L 21.1 0.14
Matav RT ADR 21.5 0.22
Telstra ADR 21.7 0.12
Gilat Communications 22.7 0.31
Deutsche Telekom AG ADR 24.6 0.11
British Telecommunications PLC ADR 25.7 0.07
Tele Danmark AS ADR 27 0.09
Telekomunikasi Indonesia ADR 28.4 0.32
Cable & Wireless PLC ADR 29.8 0.14
APT Satellite Holdings ADR 31 0.33
Telefonica SA ADR 32.5 0.18
Royal KPN NV ADR 35.7 0.13
Telecom Italia SPA ADR 42.2 0.14
Nippon Telegraph & Telephone ADR 44.3 0.2
France Telecom SA ADR 45.2 0.19
Korea Telecom ADR 71.3 0.44
Aswath Damodaran 159
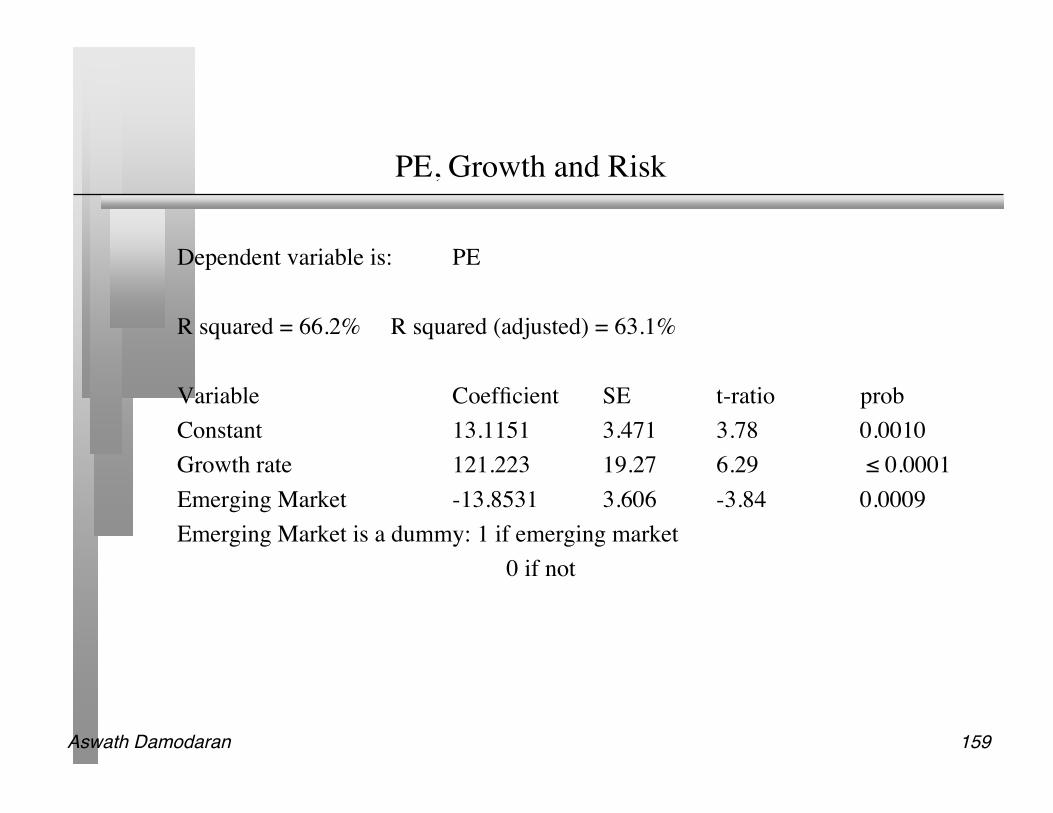
PE, Growth and Risk
Dependent variable is: PE
R squared = 66.2% R squared (adjusted) = 63.1%
Variable Coefficient SE t-ratio probConstant 13.1151 3.471 3.78 0.0010Growth rate 121.223 19.27 6.29 ≤ 0.0001Emerging Market -13.8531 3.606 -3.84 0.0009Emerging Market is a dummy: 1 if emerging market
0 if not

Aswath Damodaran 160
Is Telebras under valued?
Predicted PE = 13.12 + 121.22 (.075) - 13.85 (1) = 8.35 At an actual price to earnings ratio of 8.9, Telebras is slightly overvalued.

Aswath Damodaran 161
II. Price to Book vs ROE: US Stocks in January 2005
Return on Equity
806040200
PB
V R
atio
18
16
14
12
10
8
6
4
2
0
BUD
PBR
BADOW
NS ANY
FRE
ER ICY
YHOO
UNH
WYE
D
MDT
VIA/B
UL
FNM
MRK
EB AY
AMGN
TWX
EDP
KO
DELL
RD
GS K
PG
IBM

Aswath Damodaran 162
A Risk Adjusted Version?
470
PBV Ratio
2
4
TSM
60
6
FNM
ORCL
UL
8
3
BUD
10
AMAT
AOL
50
MRK
12PFE
14
G
PG
16
VIA/B
40
FRE
MMM
SC
2
EBAY
KMB
ROERegression Beta
QCOMWMT
MDT
30
D
120 10 00

Aswath Damodaran 163
III. Value/EBITDA Multiple: Trucking Companies
Company Name Value EBITDA Value/EBITDAKLLM Trans. Svcs. 114.32$ 48.81$ 2.34Ryder System 5,158.04$ 1,838.26$ 2.81Rollins Truck Leasing 1,368.35$ 447.67$ 3.06Cannon Express Inc. 83.57$ 27.05$ 3.09Hunt (J.B.) 982.67$ 310.22$ 3.17Yellow Corp. 931.47$ 292.82$ 3.18Roadway Express 554.96$ 169.38$ 3.28Marten Transport Ltd. 116.93$ 35.62$ 3.28Kenan Transport Co. 67.66$ 19.44$ 3.48M.S. Carriers 344.93$ 97.85$ 3.53Old Dominion Freight 170.42$ 45.13$ 3.78Trimac Ltd 661.18$ 174.28$ 3.79Matlack Systems 112.42$ 28.94$ 3.88XTRA Corp. 1,708.57$ 427.30$ 4.00Covenant Transport Inc 259.16$ 64.35$ 4.03Builders Transport 221.09$ 51.44$ 4.30Werner Enterprises 844.39$ 196.15$ 4.30Landstar Sys. 422.79$ 95.20$ 4.44AMERCO 1,632.30$ 345.78$ 4.72USA Truck 141.77$ 29.93$ 4.74Frozen Food Express 164.17$ 34.10$ 4.81Arnold Inds. 472.27$ 96.88$ 4.87Greyhound Lines Inc. 437.71$ 89.61$ 4.88USFreightways 983.86$ 198.91$ 4.95Golden Eagle Group Inc. 12.50$ 2.33$ 5.37Arkansas Best 578.78$ 107.15$ 5.40Airlease Ltd. 73.64$ 13.48$ 5.46Celadon Group 182.30$ 32.72$ 5.57Amer. Freightways 716.15$ 120.94$ 5.92Transfinancial Holdings 56.92$ 8.79$ 6.47Vitran Corp. 'A' 140.68$ 21.51$ 6.54Interpool Inc. 1,002.20$ 151.18$ 6.63Intrenet Inc. 70.23$ 10.38$ 6.77Swift Transportation 835.58$ 121.34$ 6.89Landair Services 212.95$ 30.38$ 7.01CNF Transportation 2,700.69$ 366.99$ 7.36Budget Group Inc 1,247.30$ 166.71$ 7.48Caliber System 2,514.99$ 333.13$ 7.55Knight Transportation Inc 269.01$ 28.20$ 9.54Heartland Express 727.50$ 64.62$ 11.26Greyhound CDA Transn Corp 83.25$ 6.99$ 11.91Mark VII 160.45$ 12.96$ 12.38Coach USA Inc 678.38$ 51.76$ 13.11US 1 Inds Inc. 5.60$ (0.17)$ NA
Average 5 .61

Aswath Damodaran 164
A Test on EBITDA
Ryder System looks very cheap on a Value/EBITDA multiple basis, relative tothe rest of the sector. What explanation (other than misvaluation) might therebe for this difference?

Aswath Damodaran 165
IV. A Case Study: Internet Stocks in early 2000
ROWEGSVIPPODTURF BUYX ELTXGEEKRMIIFATB TMNTONEM ABTL INFO ANETITRAIIXLBIZZ EGRPACOMALOYBIDSSPLN EDGRPSIX ATHY AMZN
CLKS PCLNAPNT SONENETO
CBIS NTPACSGPINTW RAMP
DCLKCNETATHMMQST FFIV
SCNT MMXIINTM
SPYGLCOS
PKSI
-0
10
20
30
-0.8 -0.6 -0.4 -0.2
AdjMargin
AdjPS

Aswath Damodaran 166
PS Ratios and Margins are not highly correlated
Regressing PS ratios against current margins yields the followingPS = 81.36 - 7.54(Net Margin) R2 = 0.04
(0.49) This is not surprising. These firms are priced based upon expected margins,
rather than current margins.

Aswath Damodaran 167
Solution 1: Use proxies for survival and growth: Amazon inearly 2000
Hypothesizing that firms with higher revenue growth and higher cash balancesshould have a greater chance of surviving and becoming profitable, we ran thefollowing regression: (The level of revenues was used to control for size)
PS = 30.61 - 2.77 ln(Rev) + 6.42 (Rev Growth) + 5.11 (Cash/Rev)(0.66) (2.63) (3.49)
R squared = 31.8%Predicted PS = 30.61 - 2.77(7.1039) + 6.42(1.9946) + 5.11 (.3069) = 30.42Actual PS = 25.63Stock is undervalued, relative to other internet stocks.

Aswath Damodaran 168
Solution 2: Use forward multiples
Global Crossing lost $1.9 billion in 2001 and is expected to continue to lose money for the next 3years. In a discounted cashflow valuation (see notes on DCF valuation) of Global Crossing, weestimated an expected EBITDA for Global Crossing in five years of $ 1,371 million.
The average enterprise value/ EBITDA multiple for healthy telecomm firms is 7.2 currently. Applying this multiple to Global Crossing’s EBITDA in year 5, yields a value in year 5 of
• Enterprise Value in year 5 = 1371 * 7.2 = $9,871 million• Enterprise Value today = $ 9,871 million/ 1.1385 = $5,172 million(The cost of capital for Global Crossing is 13.80%)• The probability that Global Crossing will not make it as a going concern is 77%.• Expected Enterprise value today = 0.23 (5172) = $1,190 million

Aswath Damodaran 169
Comparisons to the entire market: Why not?
In contrast to the 'comparable firm' approach, the information in the entirecross-section of firms can be used to predict PE ratios.
The simplest way of summarizing this information is with a multipleregression, with the PE ratio as the dependent variable, and proxies for risk,growth and payout forming the independent variables.
Aswath Damodaran 170
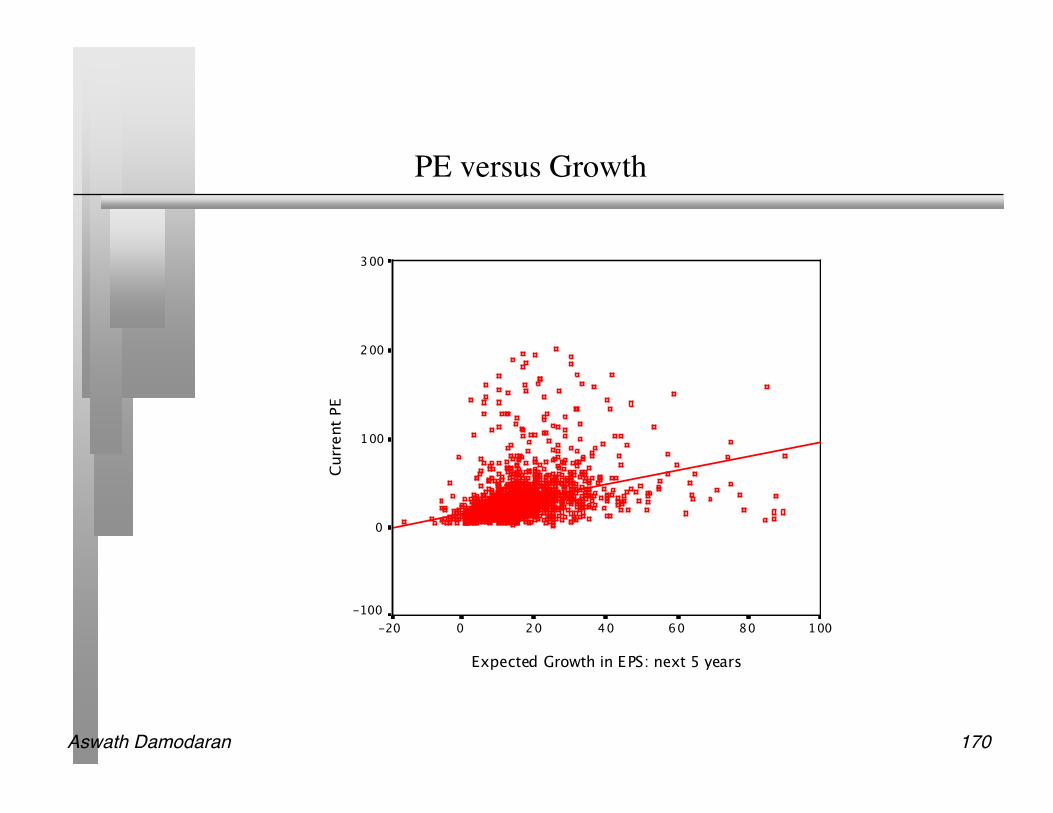
PE versus Growth
Expected Growth in EPS: next 5 years
100806040200-20
Curr
ent
PE
300
200
100
0
-100

Aswath Damodaran 171
PE Ratio: Standard Regression for US stocks - January 2007
Model Summary
.644a .414 .413 1125.459118189800000
Model
1
R R Sq uareAdjusted R
Square Std. Er ror of the Estimate
Predictors: (Constant), Payout Ratio, Value Line Beta, Expected Growth in EPS:next 5 years
a.
Coefficientsa,b
10.645 1.204 8.844 .000
1.178 .033 .659 36.211 .000
-2.621 1.074 -.043 -2.441 .015
7.419E-03 .011 .012 .686 .493
(Constant)
Expected G rowth inEPS: next 5 years
Value Line Be ta
Payout Ratio
Model
1
B Std. Error
UnstandardizedCoefficients
Be ta
StandardizedCoefficients
t Sig.
Dependent Variable: Current PEa.
Weighted Least Squares Regression - Weighted by Market Capb.

Aswath Damodaran 172
Fundamentals hold in every market: PE ratio regression forJapan
Model Summary
.616a .379 .373 1146.48956973352800
Model
1
R R SquareAdjusted R
SquareStd. Er ror of the
Estimate
Predictors: (Constant), BETA, Epected Earnings Growth (if available),Payout Ratio
a.
Coefficientsa ,b
-4.550 3.012 -1.510 .132
25.414 4.678 .250 5.433 .000
.782 .072 .535 10.820 .000
8.293 1.557 .263 5.325 .000
(Constant)
Epected EarningsGrowth (if available)
Payout Ratio
BETA
Model
1
B Std. Er ror
UnstandardizedCoefficients
Beta
StandardizedCoefficients
t Sig.
Dependent Variable: PEa.
Weighted Least Squares Regression - Weighted by Market Cap (US $ )b.

Aswath Damodaran 173
Relative Valuation: Some closing propositions
Proposition 1: In a relative valuation, all that you are concluding is that a stockis under or over valued, relative to your comparable group.
• Your relative valuation judgment can be right and your stock can be hopelesslyover valued at the same time.
Proposition 2: In asset valuation, there are no similar assets. Every asset isunique.
• If you don’t control for fundamental differences in risk, cashflows and growthacross firms when comparing how they are priced, your valuation conclusions willreflect your flawed judgments rather than market misvaluations.

Aswath Damodaran 174
Choosing Between the Multiples
As presented in this section, there are dozens of multiples that can bepotentially used to value an individual firm.
In addition, relative valuation can be relative to a sector (or comparable firms)or to the entire market (using the regressions, for instance)
Since there can be only one final estimate of value, there are three choices atthis stage:
• Use a simple average of the valuations obtained using a number of differentmultiples
• Use a weighted average of the valuations obtained using a nmber of differentmultiples
• Choose one of the multiples and base your valuation on that multiple

Aswath Damodaran 175
Picking one Multiple
This is usually the best way to approach this issue. While a range of values canbe obtained from a number of multiples, the “best estimate” value is obtainedusing one multiple.
The multiple that is used can be chosen in one of two ways:• Use the multiple that best fits your objective. Thus, if you want the company to be
undervalued, you pick the multiple that yields the highest value.• Use the multiple that has the highest R-squared in the sector when regressed against
fundamentals. Thus, if you have tried PE, PBV, PS, etc. and run regressions ofthese multiples against fundamentals, use the multiple that works best at explainingdifferences across firms in that sector.
• Use the multiple that seems to make the most sense for that sector, given how valueis measured and created.

Aswath Damodaran 176
A More Intuitive Approach
Managers in every sector tend to focus on specific variables when analyzingstrategy and performance. The multiple used will generally reflect this focus.Consider three examples.
• In retailing: The focus is usually on same store sales (turnover) and profit margins.Not surprisingly, the revenue multiple is most common in this sector.
• In financial services: The emphasis is usually on return on equity. Book Equity isoften viewed as a scarce resource, since capital ratios are based upon it. Price tobook ratios dominate.
• In technology: Growth is usually the dominant theme. PEG ratios were invented inthis sector.

Aswath Damodaran 177
In Practice…
As a general rule of thumb, the following table provides a way of picking a multiple fora sector
Sector Multiple Used RationaleCyclical Manufacturing PE, Relative PE Often with normalized earningsHigh Tech, High Growth PEG Big differences in growth across
firmsHigh Growth/No Earnings PS, VS Assume future margins will be goodHeavy Infrastructure VEBITDA Firms in sector have losses in early
years and reported earnings can varydepending on depreciation method
REITa P/CF Generally no cap ex investments from equity earnings
Financial Services PBV Book value often marked to marketRetailing PS If leverage is similar across firms
VS If leverage is different

Aswath Damodaran 178
Reviewing: The Four Steps to Understanding Multiples
Define the multiple• Check for consistency• Make sure that they are estimated uniformly
Describe the multiple• Multiples have skewed distributions: The averages are seldom good indicators of
typical multiples• Check for bias, if the multiple cannot be estimated
Analyze the multiple• Identify the companion variable that drives the multiple• Examine the nature of the relationship
Apply the multiple