Embed Size (px)
Citation preview
December 10 2013
1
AbstractmdashThis report analyzes the energy absorption of a
simply supported beam struck by a hammer attached to the end
of a large pendulum The acceleration of the hammer was
measured with a MEMs (Micro Electrical Mechanical system)
accelerometer and the position was measured with a Hall Effect
rotary position sensor Voltages from these devices were sent to an
OOTB DAQ device (Out of the Box Data Acquisition) The energy
is calculated using the concepts of potential energy A high speed
camera was used to capture images of the test Those images were
brought into a software program called ImageJ and analyzed
Index TermsmdashOOTB DAQ MEMS accelerometer Hall Effect
rotary position sensor ImageJ
I INTRODUCTION
HIS experiment quantifies the energy absorption of a
simply supported beam relative to its mass The goal of the
experiment was to design and manufacture a beam that would
be able to absorb at least 04 J of energy per gram of mass of
the beam The energy per mass absorbed was calculated using
the angular position of the pendulum arm mass of the
pendulum (including the hammer) and the radius to the center
of mass Angular position and the radius to the center of mass
were used to calculate the difference in height between the
initial position of the pendulum arm and its final positionmdashthe
maximum angle after swinging past vertical Then the
potential energy was found by multiplying the difference in
height by gravity and the mass of the pendulum arm and
hammer combined
II PROCEDURE
Fabrication Procedure
A Cut the balsa wood and foam to size
Cut the three-eighths inch thick balsa wood and the half-inch
thick insulation foam into three-inch by one-inch sectionsmdash
two sections of balsa wood and 5 sections of foam
B Glue the balsa wood insulation foam and aluminum
extrusion together
Adhere the two sections of balsa wood together and then
adhere the balsa wood to the aluminum extrusion using Gorilla
Glue Apply a load on top of the wood or clamp the pieces
together for best results Then adhere three sections of foam to
the front of the balsa wood and one section of foam to each end
of the aluminum extrusion on the face opposite the balsa wood
(This foam will make contact with the supports of the
pendulum) Use Loctite aerosol spray glue to adhere foam
Allow 24 hours for the glue to cure
C Adhere an eight-inch section of half-inch PVC to the
center of the aluminum extrusion
Apply Gorilla glue to the outside of an eight-inch section of
PVC that is thick enough to make contact with all inner faces
of the aluminum extrusion Allow 24 hours for the glue to cure
Test Procedure
A Create a VI
Create a VI that obtains the input voltage through channel 0
and channel 1 of the OOTB DAQ and writes the data to a
spreadsheet Channel 0 is wired to the Hall Effect rotary
position sensor and Channel 1 is wired to the MEMs
accelerometer This data will later be used to analyze the
position and acceleration of the pendulum Use an acquisition
time of ten seconds and a sample rate of 5000Hz A block
diagram of the VI is shown in the Appendix
B Part set up
Load the specimen onto the pendulum supports (The
specimen is simply supported) Lift the pendulum arm to the
release magnet Release the pendulum arm when readymdashabout
five seconds after running the VI
III RESULTS
The mass of our specimen weighed 238 grams prior to
testing The mass of the hammer was 3824 kg and this value
was measured using the mass properties feature in Solidworks
The acceleration and position of the hammer over time are
graphed in Fig 1 The range of this figure is from two to five
seconds with impact occurring between 32358 seconds and
32678 seconds TABLE I
MATERIAL DIMENSIONS
Material Dimensions [inches]
aluminum hollow extrusion 1rdquox1rdquox36rdquo
balsa wood 1rdquox38rdquox3rdquo
PVC pipe inner dia=14rdquo outer
dia=12rdquo length=6rdquo
polystyrene insulation foam 1rdquox12rdquox3rdquo
Gorilla Glue NA
Loctite medium strength spray
adhesive NA
FINAL PROJECT
Diana L Nelson (dnelsonufledu) Luis A Muniz (luismunizufledu)
T
December 10 2013
2
Fig 1 Acceleration and position graphed during the time range of impact
Fig 2 Potential energy over time during impact
Fig 2 is a graph of the potential energy versus time The
initial peak is when the hammer is suspended at maximum
height and the second peak is the final potential energy in the
hammer after impact with the specimen Fig 3 is an image of
the specimen after the impact test
Fig 3 Specimen after impact
IV DISCUSSION
The specimen needed to absorb the most amount of energy
while maintaining a light profile Insulation foam can compress
almost its initial width and has a low density compared to other
stiffer materials Using this foam at the point of impact seemed
most logical since the pressure would be the greatest at that
point Also the bending moment is created by the reaction
forces at the supports against the force of the hammer swinging
into the center of the part creating a large moment We
predicted that adhering foam to the ends of the specimen
adjacent to the supports would absorb more energy as the
entire specimen translated with the hammer for a short
distance We also predicted that the balsa wood could absorb
energy over a shorter distance than the foam because it has
greater strength than the foam but has a low density compared
to most other woods The aluminum extrusion was predicted to
absorb much of the bending moment transferring much of the
stress to the back face which should experience the greatest
tensile stress Aluminumrsquos tensile stress yield point led us to
believe that the extrusion would absorb a great amount of
energy The aluminum extrusion is also light because it is
hollow with thin walls Lastly the PVC was predicted to
support the walls of the extrusion from collapsing at the
midpoint of the specimen therefore it seemed unnecessary to
add weight by supporting the entire specimen with PVC
The specimen absorbed approximately four times the
required energy per mass By utilizing different geometries
such as the one-inch square aluminum extrusion the beam was
able to transfer much of the impact force into tensile stress on
the back face of the specimen increasing its strength Also by
adding foam at the point of impact and the two points of
contact between the pendulum supports and the specimen the
specimen absorbed much of the impact by translating in the
direction of the hammer before bending Once the specimen
began to bend the short piece of PVC inside the aluminum
extrusion added pressure on the inside of the collapsing walls
of the aluminum Since the bending occurs in the center of the
specimen the specimen did not require PVC through its entire
length
An analysis of the results is presented in the remainder of
this section Input variables and calculated variables are
defined in table II
TABLE II
DEFINITION OF VARIABLES AND THEIR UNITS
Symbol Quantity Value (if
constant) Units
V0 channel 0 voltage - V
V1 channel 1 voltage - V
V0t channel 0 tare
voltage 242 V
V1t channel 1 tare voltage
2477 V
Vθ tared channel 0
voltage - V
Va tared channel 1
voltage - V
k
calibration
constant of Hall Effect sensor
568 degV
c
calibration
constant of
accelerometer
008 V(9806 ms2)
g gravitational acceleration 9806 ms2
h height of hammera
- m
L length of
hammerb - m
U potential energy - J
mh mass of hammer 3824 kg
mpart mass of part 238 kg
a acceleration of
hammer - ms2
aWhere the height at 0deg is equal to 0 m bMeasured from axis of rotation to center of mass of hammer
The derivation of the energy absorbed by our part is shown
-100
-50
0
50
100
150
200
2 3 4 5
Acc
ele
rati
on
[m
s^2
) p
osi
tio
n (θ
)
Time (s)
acceleration
position
0
100
200
300
400
500
600
25 3 35 4 45
Po
ten
tial
En
erg
y U
[J]
Time t [s]
December 10 2013
3
in (1) through (5)
Vθ =V0- V0t (1)
(2)
( ( )) (3)
(4)
(5)
Using triangular and parallel geometry we formed an
equation for the height of the hammer (3) using (6) and (7)
below
( )
(6)
(7)
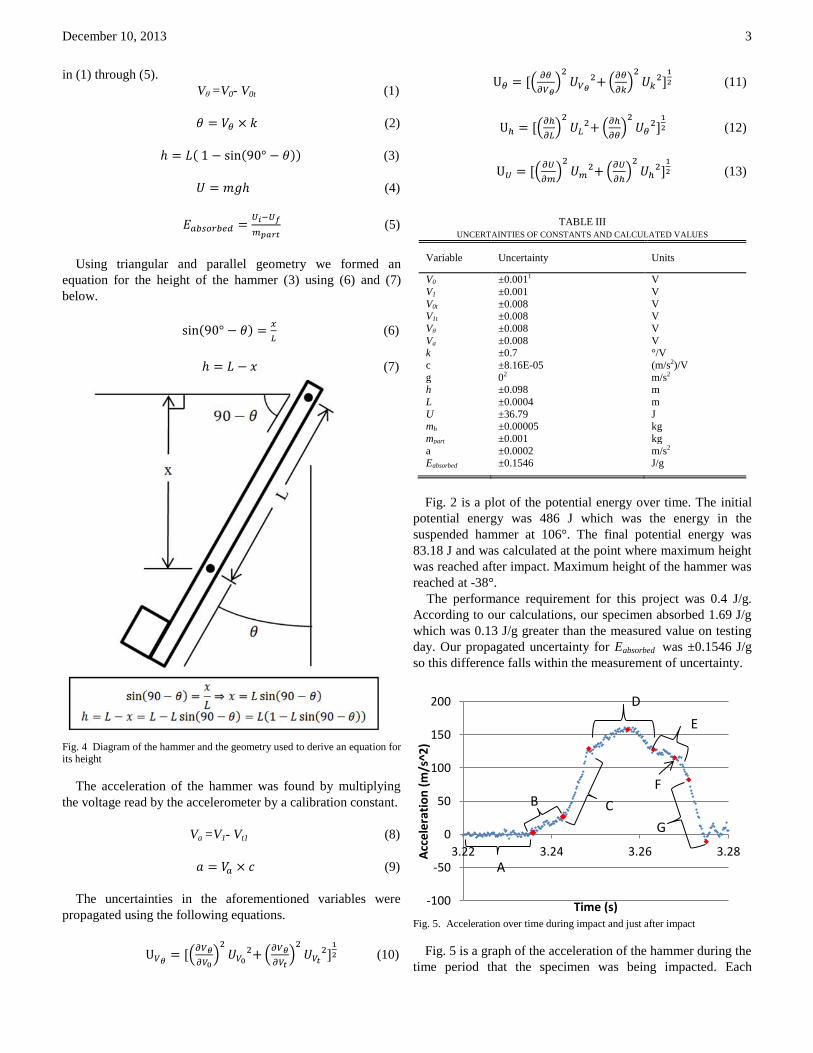
Fig 4 Diagram of the hammer and the geometry used to derive an equation for its height
The acceleration of the hammer was found by multiplying
the voltage read by the accelerometer by a calibration constant
Va =V1- Vt1 (8)
(9)
The uncertainties in the aforementioned variables were
propagated using the following equations
(
)
(
)
(10)
(
)
(
)
(11)
(
)
(
)
(12)
(
)
(
)
(13)
TABLE III
UNCERTAINTIES OF CONSTANTS AND CALCULATED VALUES
Variable Uncertainty Units
V0 plusmn00011 V
V1 plusmn0001 V
V0t plusmn0008 V V1t plusmn0008 V
Vθ plusmn0008 V
Va plusmn0008 V
k plusmn07 degV
c plusmn816E-05 (ms2)V
g 02 ms2
h plusmn0098 m
L plusmn00004 m
U plusmn3679 J mh plusmn000005 kg
mpart plusmn0001 kg
a plusmn00002 ms2 Eabsorbed plusmn01546 Jg
Fig 2 is a plot of the potential energy over time The initial
potential energy was 486 J which was the energy in the
suspended hammer at 106deg The final potential energy was
8318 J and was calculated at the point where maximum height
was reached after impact Maximum height of the hammer was
reached at -38deg
The performance requirement for this project was 04 Jg
According to our calculations our specimen absorbed 169 Jg
which was 013 Jg greater than the measured value on testing
day Our propagated uncertainty for Eabsorbed was plusmn01546 Jg
so this difference falls within the measurement of uncertainty
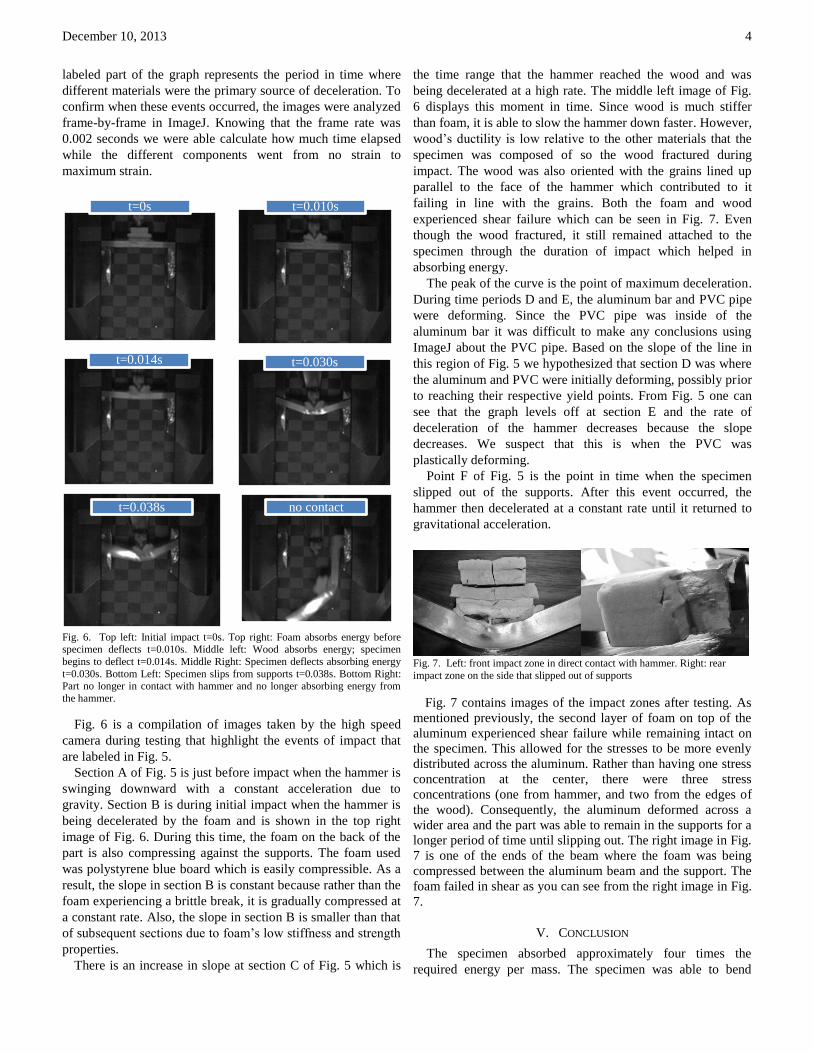
Fig 5 Acceleration over time during impact and just after impact
Fig 5 is a graph of the acceleration of the hammer during the
time period that the specimen was being impacted Each
-100
-50
0
50
100
150
200
322 324 326 328Acc
ele
rati
on
(m
s^2
)
Time (s)
A
B C
D
E
F
G
December 10 2013
4
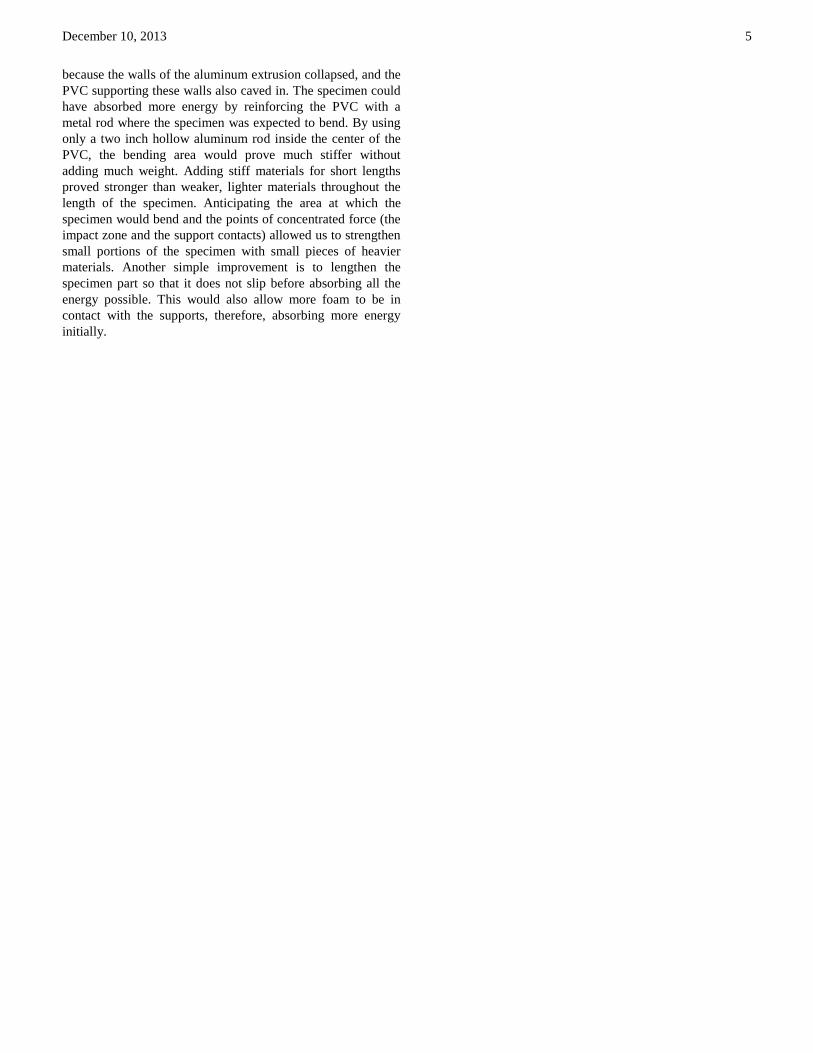
labeled part of the graph represents the period in time where
different materials were the primary source of deceleration To
confirm when these events occurred the images were analyzed
frame-by-frame in ImageJ Knowing that the frame rate was
0002 seconds we were able calculate how much time elapsed
while the different components went from no strain to
maximum strain
Fig 6 Top left Initial impact t=0s Top right Foam absorbs energy before specimen deflects t=0010s Middle left Wood absorbs energy specimen
begins to deflect t=0014s Middle Right Specimen deflects absorbing energy
t=0030s Bottom Left Specimen slips from supports t=0038s Bottom Right Part no longer in contact with hammer and no longer absorbing energy from
the hammer
Fig 6 is a compilation of images taken by the high speed
camera during testing that highlight the events of impact that
are labeled in Fig 5
Section A of Fig 5 is just before impact when the hammer is
swinging downward with a constant acceleration due to
gravity Section B is during initial impact when the hammer is
being decelerated by the foam and is shown in the top right
image of Fig 6 During this time the foam on the back of the
part is also compressing against the supports The foam used
was polystyrene blue board which is easily compressible As a
result the slope in section B is constant because rather than the
foam experiencing a brittle break it is gradually compressed at
a constant rate Also the slope in section B is smaller than that
of subsequent sections due to foamrsquos low stiffness and strength
properties
There is an increase in slope at section C of Fig 5 which is
the time range that the hammer reached the wood and was
being decelerated at a high rate The middle left image of Fig
6 displays this moment in time Since wood is much stiffer
than foam it is able to slow the hammer down faster However
woodrsquos ductility is low relative to the other materials that the
specimen was composed of so the wood fractured during
impact The wood was also oriented with the grains lined up
parallel to the face of the hammer which contributed to it
failing in line with the grains Both the foam and wood
experienced shear failure which can be seen in Fig 7 Even
though the wood fractured it still remained attached to the
specimen through the duration of impact which helped in
absorbing energy
The peak of the curve is the point of maximum deceleration
During time periods D and E the aluminum bar and PVC pipe
were deforming Since the PVC pipe was inside of the
aluminum bar it was difficult to make any conclusions using
ImageJ about the PVC pipe Based on the slope of the line in
this region of Fig 5 we hypothesized that section D was where
the aluminum and PVC were initially deforming possibly prior
to reaching their respective yield points From Fig 5 one can
see that the graph levels off at section E and the rate of
deceleration of the hammer decreases because the slope
decreases We suspect that this is when the PVC was
plastically deforming
Point F of Fig 5 is the point in time when the specimen
slipped out of the supports After this event occurred the
hammer then decelerated at a constant rate until it returned to
gravitational acceleration
Fig 7 Left front impact zone in direct contact with hammer Right rear
impact zone on the side that slipped out of supports
Fig 7 contains images of the impact zones after testing As
mentioned previously the second layer of foam on top of the
aluminum experienced shear failure while remaining intact on
the specimen This allowed for the stresses to be more evenly
distributed across the aluminum Rather than having one stress
concentration at the center there were three stress
concentrations (one from hammer and two from the edges of
the wood) Consequently the aluminum deformed across a
wider area and the part was able to remain in the supports for a
longer period of time until slipping out The right image in Fig
7 is one of the ends of the beam where the foam was being
compressed between the aluminum beam and the support The
foam failed in shear as you can see from the right image in Fig
7
V CONCLUSION
The specimen absorbed approximately four times the
required energy per mass The specimen was able to bend
t=0s t=0010s
t=0014s t=0030s
t=0038s no contact
December 10 2013
5
because the walls of the aluminum extrusion collapsed and the
PVC supporting these walls also caved in The specimen could
have absorbed more energy by reinforcing the PVC with a
metal rod where the specimen was expected to bend By using
only a two inch hollow aluminum rod inside the center of the
PVC the bending area would prove much stiffer without
adding much weight Adding stiff materials for short lengths
proved stronger than weaker lighter materials throughout the
length of the specimen Anticipating the area at which the
specimen would bend and the points of concentrated force (the
impact zone and the support contacts) allowed us to strengthen
small portions of the specimen with small pieces of heavier
materials Another simple improvement is to lengthen the
specimen part so that it does not slip before absorbing all the
energy possible This would also allow more foam to be in
contact with the supports therefore absorbing more energy
initially
December 10 2013
6
APPENDIX
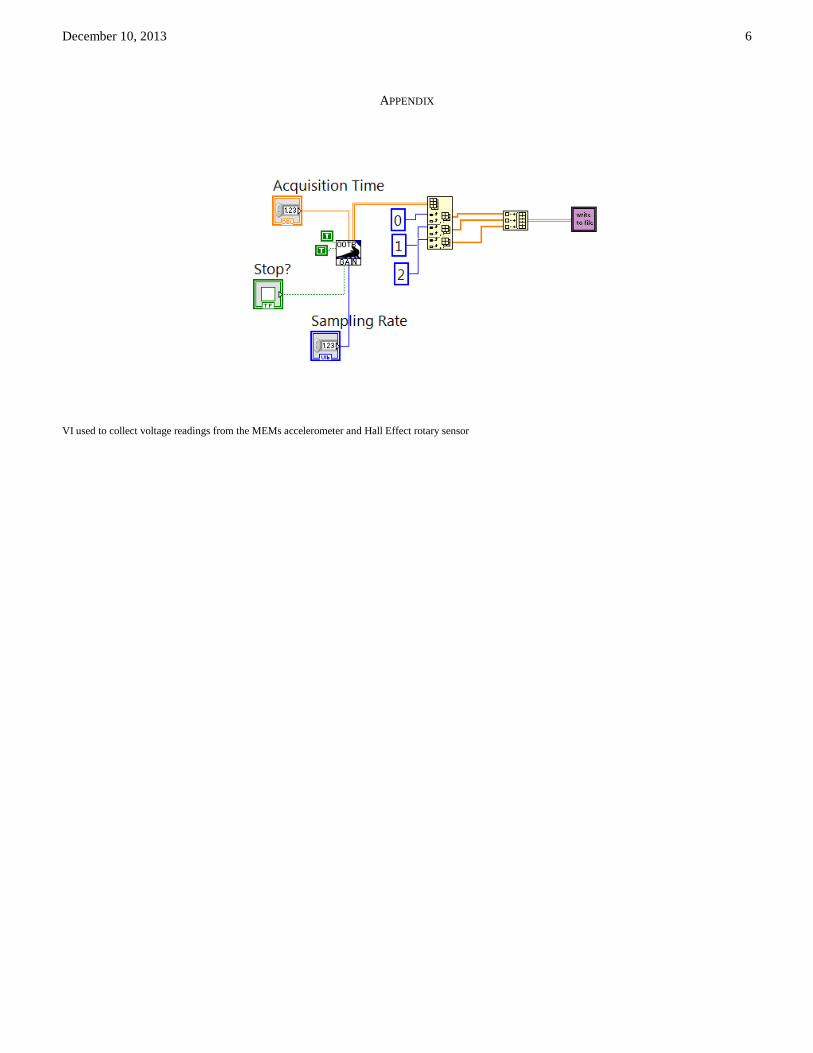
VI used to collect voltage readings from the MEMs accelerometer and Hall Effect rotary sensor
December 10 2013
7
REFERENCES
[1] DL Nelson ldquoLab 1B ndash Dynamic Data Acquisition Uncertainty amp
Strain Gaugesrdquo unpublished
[2] The NIST Reference on Constants Units and Uncertainty
ldquohttpphysicsnistgovcgi-bincuuValuegn|search_for=gravityrdquo [3] JK Author ldquoEML3301C ndashMechanics of Material Laboratory-Final
Projectrdquo unpublished

December 10 2013
2
Fig 1 Acceleration and position graphed during the time range of impact
Fig 2 Potential energy over time during impact
Fig 2 is a graph of the potential energy versus time The
initial peak is when the hammer is suspended at maximum
height and the second peak is the final potential energy in the
hammer after impact with the specimen Fig 3 is an image of
the specimen after the impact test
Fig 3 Specimen after impact
IV DISCUSSION
The specimen needed to absorb the most amount of energy
while maintaining a light profile Insulation foam can compress
almost its initial width and has a low density compared to other
stiffer materials Using this foam at the point of impact seemed
most logical since the pressure would be the greatest at that
point Also the bending moment is created by the reaction
forces at the supports against the force of the hammer swinging
into the center of the part creating a large moment We
predicted that adhering foam to the ends of the specimen
adjacent to the supports would absorb more energy as the
entire specimen translated with the hammer for a short
distance We also predicted that the balsa wood could absorb
energy over a shorter distance than the foam because it has
greater strength than the foam but has a low density compared
to most other woods The aluminum extrusion was predicted to
absorb much of the bending moment transferring much of the
stress to the back face which should experience the greatest
tensile stress Aluminumrsquos tensile stress yield point led us to
believe that the extrusion would absorb a great amount of
energy The aluminum extrusion is also light because it is
hollow with thin walls Lastly the PVC was predicted to
support the walls of the extrusion from collapsing at the
midpoint of the specimen therefore it seemed unnecessary to
add weight by supporting the entire specimen with PVC
The specimen absorbed approximately four times the
required energy per mass By utilizing different geometries
such as the one-inch square aluminum extrusion the beam was
able to transfer much of the impact force into tensile stress on
the back face of the specimen increasing its strength Also by
adding foam at the point of impact and the two points of
contact between the pendulum supports and the specimen the
specimen absorbed much of the impact by translating in the
direction of the hammer before bending Once the specimen
began to bend the short piece of PVC inside the aluminum
extrusion added pressure on the inside of the collapsing walls
of the aluminum Since the bending occurs in the center of the
specimen the specimen did not require PVC through its entire
length
An analysis of the results is presented in the remainder of
this section Input variables and calculated variables are
defined in table II
TABLE II
DEFINITION OF VARIABLES AND THEIR UNITS
Symbol Quantity Value (if
constant) Units
V0 channel 0 voltage - V
V1 channel 1 voltage - V
V0t channel 0 tare
voltage 242 V
V1t channel 1 tare voltage
2477 V
Vθ tared channel 0
voltage - V
Va tared channel 1
voltage - V
k
calibration
constant of Hall Effect sensor
568 degV
c
calibration
constant of
accelerometer
008 V(9806 ms2)
g gravitational acceleration 9806 ms2
h height of hammera
- m
L length of
hammerb - m
U potential energy - J
mh mass of hammer 3824 kg
mpart mass of part 238 kg
a acceleration of
hammer - ms2
aWhere the height at 0deg is equal to 0 m bMeasured from axis of rotation to center of mass of hammer
The derivation of the energy absorbed by our part is shown
-100
-50
0
50
100
150
200
2 3 4 5
Acc
ele
rati
on
[m
s^2
) p
osi
tio
n (θ
)
Time (s)
acceleration
position
0
100
200
300
400
500
600
25 3 35 4 45
Po
ten
tial
En
erg
y U
[J]
Time t [s]
December 10 2013
3
in (1) through (5)
Vθ =V0- V0t (1)
(2)
( ( )) (3)
(4)
(5)
Using triangular and parallel geometry we formed an
equation for the height of the hammer (3) using (6) and (7)
below
( )
(6)
(7)
Fig 4 Diagram of the hammer and the geometry used to derive an equation for its height
The acceleration of the hammer was found by multiplying
the voltage read by the accelerometer by a calibration constant
Va =V1- Vt1 (8)
(9)
The uncertainties in the aforementioned variables were
propagated using the following equations
(
)
(
)
(10)
(
)
(
)
(11)
(
)
(
)
(12)
(
)
(
)
(13)
TABLE III
UNCERTAINTIES OF CONSTANTS AND CALCULATED VALUES
Variable Uncertainty Units
V0 plusmn00011 V
V1 plusmn0001 V
V0t plusmn0008 V V1t plusmn0008 V
Vθ plusmn0008 V
Va plusmn0008 V
k plusmn07 degV
c plusmn816E-05 (ms2)V
g 02 ms2
h plusmn0098 m
L plusmn00004 m
U plusmn3679 J mh plusmn000005 kg
mpart plusmn0001 kg
a plusmn00002 ms2 Eabsorbed plusmn01546 Jg
Fig 2 is a plot of the potential energy over time The initial
potential energy was 486 J which was the energy in the
suspended hammer at 106deg The final potential energy was
8318 J and was calculated at the point where maximum height
was reached after impact Maximum height of the hammer was
reached at -38deg
The performance requirement for this project was 04 Jg
According to our calculations our specimen absorbed 169 Jg
which was 013 Jg greater than the measured value on testing
day Our propagated uncertainty for Eabsorbed was plusmn01546 Jg
so this difference falls within the measurement of uncertainty
Fig 5 Acceleration over time during impact and just after impact
Fig 5 is a graph of the acceleration of the hammer during the
time period that the specimen was being impacted Each
-100
-50
0
50
100
150
200
322 324 326 328Acc
ele
rati
on
(m
s^2
)
Time (s)
A
B C
D
E
F
G
December 10 2013
4
labeled part of the graph represents the period in time where
different materials were the primary source of deceleration To
confirm when these events occurred the images were analyzed
frame-by-frame in ImageJ Knowing that the frame rate was
0002 seconds we were able calculate how much time elapsed
while the different components went from no strain to
maximum strain
Fig 6 Top left Initial impact t=0s Top right Foam absorbs energy before specimen deflects t=0010s Middle left Wood absorbs energy specimen
begins to deflect t=0014s Middle Right Specimen deflects absorbing energy
t=0030s Bottom Left Specimen slips from supports t=0038s Bottom Right Part no longer in contact with hammer and no longer absorbing energy from
the hammer
Fig 6 is a compilation of images taken by the high speed
camera during testing that highlight the events of impact that
are labeled in Fig 5
Section A of Fig 5 is just before impact when the hammer is
swinging downward with a constant acceleration due to
gravity Section B is during initial impact when the hammer is
being decelerated by the foam and is shown in the top right
image of Fig 6 During this time the foam on the back of the
part is also compressing against the supports The foam used
was polystyrene blue board which is easily compressible As a
result the slope in section B is constant because rather than the
foam experiencing a brittle break it is gradually compressed at
a constant rate Also the slope in section B is smaller than that
of subsequent sections due to foamrsquos low stiffness and strength
properties
There is an increase in slope at section C of Fig 5 which is
the time range that the hammer reached the wood and was
being decelerated at a high rate The middle left image of Fig
6 displays this moment in time Since wood is much stiffer
than foam it is able to slow the hammer down faster However
woodrsquos ductility is low relative to the other materials that the
specimen was composed of so the wood fractured during
impact The wood was also oriented with the grains lined up
parallel to the face of the hammer which contributed to it
failing in line with the grains Both the foam and wood
experienced shear failure which can be seen in Fig 7 Even
though the wood fractured it still remained attached to the
specimen through the duration of impact which helped in
absorbing energy
The peak of the curve is the point of maximum deceleration
During time periods D and E the aluminum bar and PVC pipe
were deforming Since the PVC pipe was inside of the
aluminum bar it was difficult to make any conclusions using
ImageJ about the PVC pipe Based on the slope of the line in
this region of Fig 5 we hypothesized that section D was where
the aluminum and PVC were initially deforming possibly prior
to reaching their respective yield points From Fig 5 one can
see that the graph levels off at section E and the rate of
deceleration of the hammer decreases because the slope
decreases We suspect that this is when the PVC was
plastically deforming
Point F of Fig 5 is the point in time when the specimen
slipped out of the supports After this event occurred the
hammer then decelerated at a constant rate until it returned to
gravitational acceleration
Fig 7 Left front impact zone in direct contact with hammer Right rear
impact zone on the side that slipped out of supports
Fig 7 contains images of the impact zones after testing As
mentioned previously the second layer of foam on top of the
aluminum experienced shear failure while remaining intact on
the specimen This allowed for the stresses to be more evenly
distributed across the aluminum Rather than having one stress
concentration at the center there were three stress
concentrations (one from hammer and two from the edges of
the wood) Consequently the aluminum deformed across a
wider area and the part was able to remain in the supports for a
longer period of time until slipping out The right image in Fig
7 is one of the ends of the beam where the foam was being
compressed between the aluminum beam and the support The
foam failed in shear as you can see from the right image in Fig
7
V CONCLUSION
The specimen absorbed approximately four times the
required energy per mass The specimen was able to bend
t=0s t=0010s
t=0014s t=0030s
t=0038s no contact
December 10 2013
5
because the walls of the aluminum extrusion collapsed and the
PVC supporting these walls also caved in The specimen could
have absorbed more energy by reinforcing the PVC with a
metal rod where the specimen was expected to bend By using
only a two inch hollow aluminum rod inside the center of the
PVC the bending area would prove much stiffer without
adding much weight Adding stiff materials for short lengths
proved stronger than weaker lighter materials throughout the
length of the specimen Anticipating the area at which the
specimen would bend and the points of concentrated force (the
impact zone and the support contacts) allowed us to strengthen
small portions of the specimen with small pieces of heavier
materials Another simple improvement is to lengthen the
specimen part so that it does not slip before absorbing all the
energy possible This would also allow more foam to be in
contact with the supports therefore absorbing more energy
initially
December 10 2013
6
APPENDIX
VI used to collect voltage readings from the MEMs accelerometer and Hall Effect rotary sensor
December 10 2013
7
REFERENCES
[1] DL Nelson ldquoLab 1B ndash Dynamic Data Acquisition Uncertainty amp
Strain Gaugesrdquo unpublished
[2] The NIST Reference on Constants Units and Uncertainty
ldquohttpphysicsnistgovcgi-bincuuValuegn|search_for=gravityrdquo [3] JK Author ldquoEML3301C ndashMechanics of Material Laboratory-Final
Projectrdquo unpublished
December 10 2013
6
APPENDIX
VI used to collect voltage readings from the MEMs accelerometer and Hall Effect rotary sensor
December 10 2013
7
REFERENCES
[1] DL Nelson ldquoLab 1B ndash Dynamic Data Acquisition Uncertainty amp
Strain Gaugesrdquo unpublished
[2] The NIST Reference on Constants Units and Uncertainty
ldquohttpphysicsnistgovcgi-bincuuValuegn|search_for=gravityrdquo [3] JK Author ldquoEML3301C ndashMechanics of Material Laboratory-Final
Projectrdquo unpublished