Embed Size (px)
Citation preview

POWER OF SOLAR PHOTOVOLTAICSBY HANSA KESWANI
BACKGROUND
• One of the most viable sources of renewable energy
• Photovoltaic (PV) devices are utilized to capture solar energy and convert it to electricity.
• As of right now, solar produces 1% of total energy in U.S.
• Technology is showing improvement and costs are reducing.

DATA AND FOCUS
Source of data – The Open PV project by National Renewable Energy Laboratory.
Data is an ongoing collaborative effort between government, industry and the public.
Analysis will be performed using Excel and SQL and visualization will be done mainly on Tableau.
Focus has been on 4 key factors – Number and time of installations, Size, Cost per watt and Location.
After looking at the results of installations all around the US, the PV market in California was chose to study further.

CLEANING METHODOLOGY
• Around 50 blank columns were deleted.
• The analysis was done on data from the year 2000 to 2015. Data from 2016 was not reliable (see next slide). The data from all other years was deleted.
• The column ‘Installation Type’ was manually edited. For example, types such as Commercial – building and Commercial – others were changed to ‘Commercial’.
• For the key attributes, less than 10% of values were NULL and hence were considered insignificant. Fields such as ‘Annual PV production’ had around 50% NULL values and were not taken into consideration for the purpose of analysis.
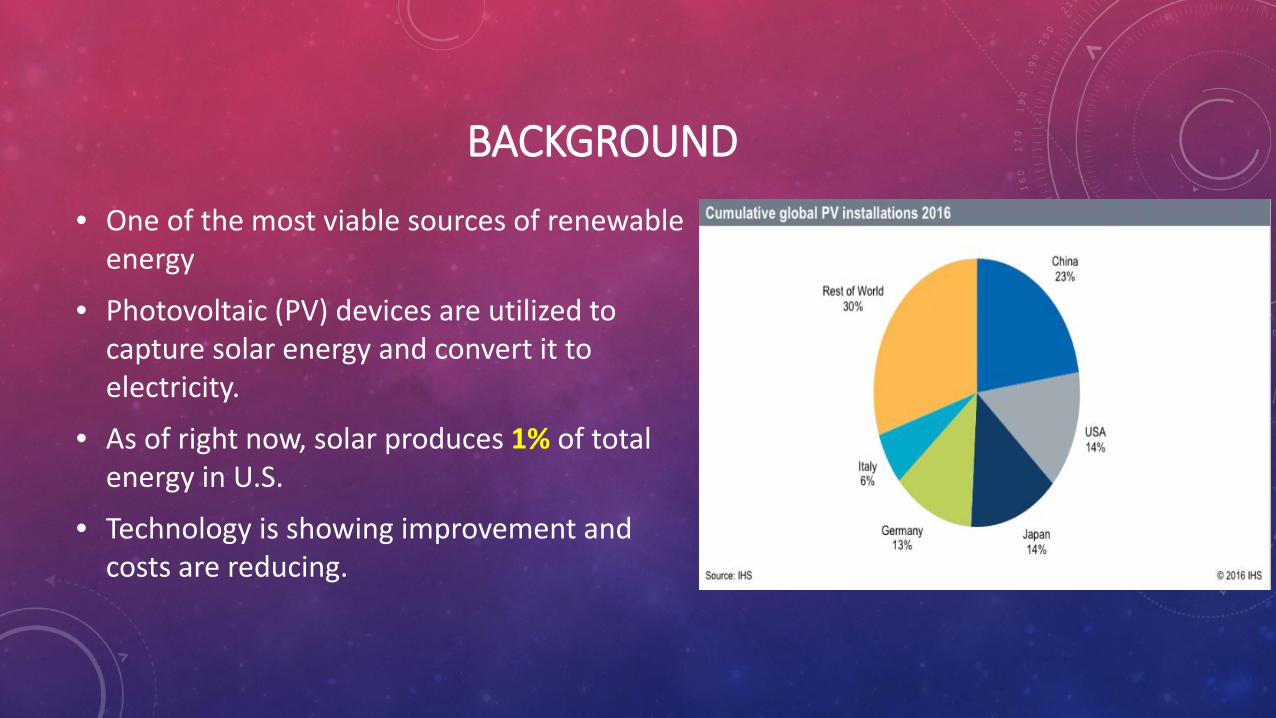
INITIAL FINDINGS
Outlier
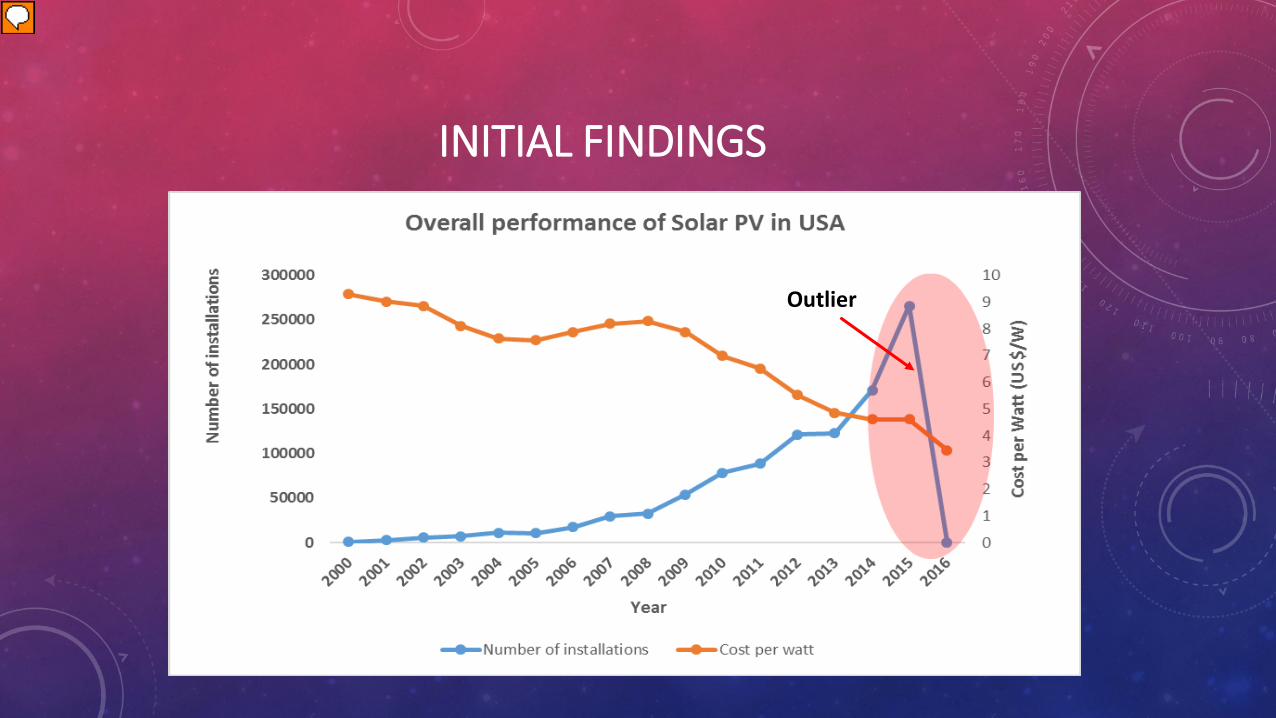
DISTRIBUTION OF SOLAR INSTALLATIONS IN USA (2000 – 2015)
Over the last 15 years, CA has had around 60% of the total installations in USA

For further in-depth analysis, California was chosen as it has the largest number of data points.
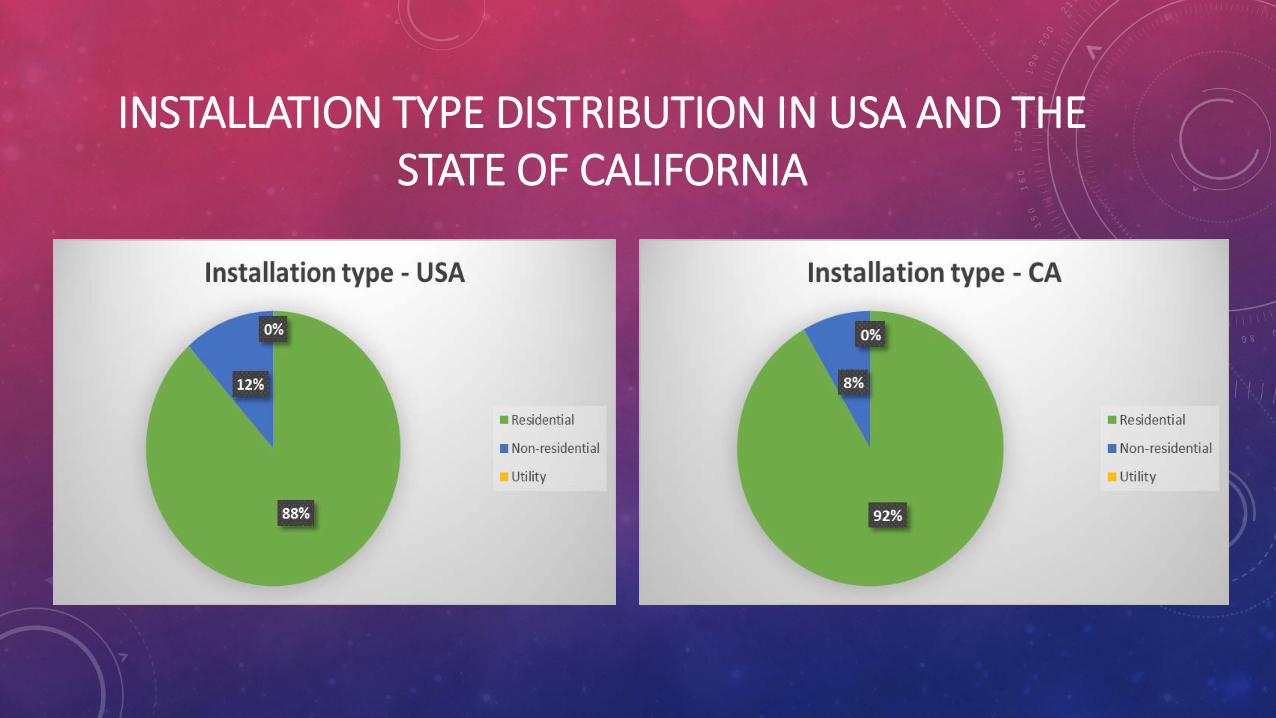
INSTALLATION TYPE DISTRIBUTION IN USA AND THE STATE OF CALIFORNIA

TABLEAU PUBLIC PROJECT LINK
• https://public.tableau.com/profile/hansa.keswani#!/vizhome/finalproject_21/Story1
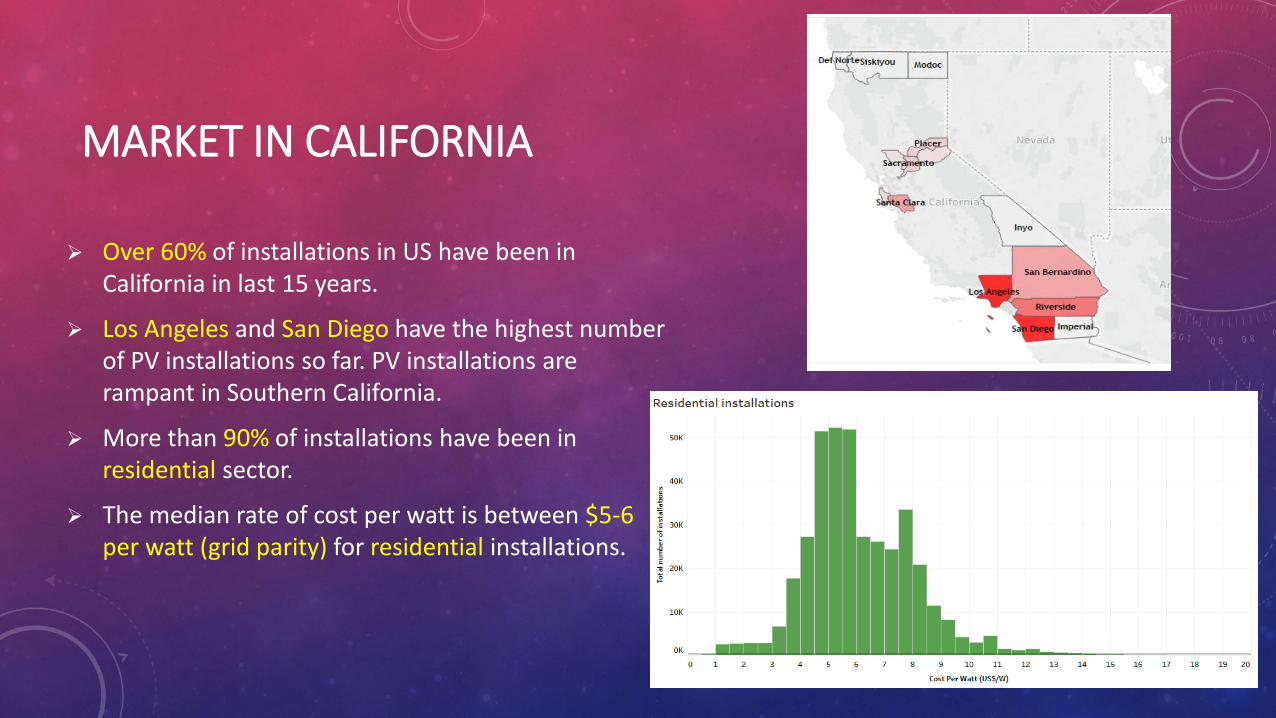
MARKET IN CALIFORNIA
Over 60% of installations in US have been in California in last 15 years.
Los Angeles and San Diego have the highest number of PV installations so far. PV installations are rampant in Southern California.
More than 90% of installations have been in residential sector.
The median rate of cost per watt is between $5-6 per watt (grid parity) for residential installations.
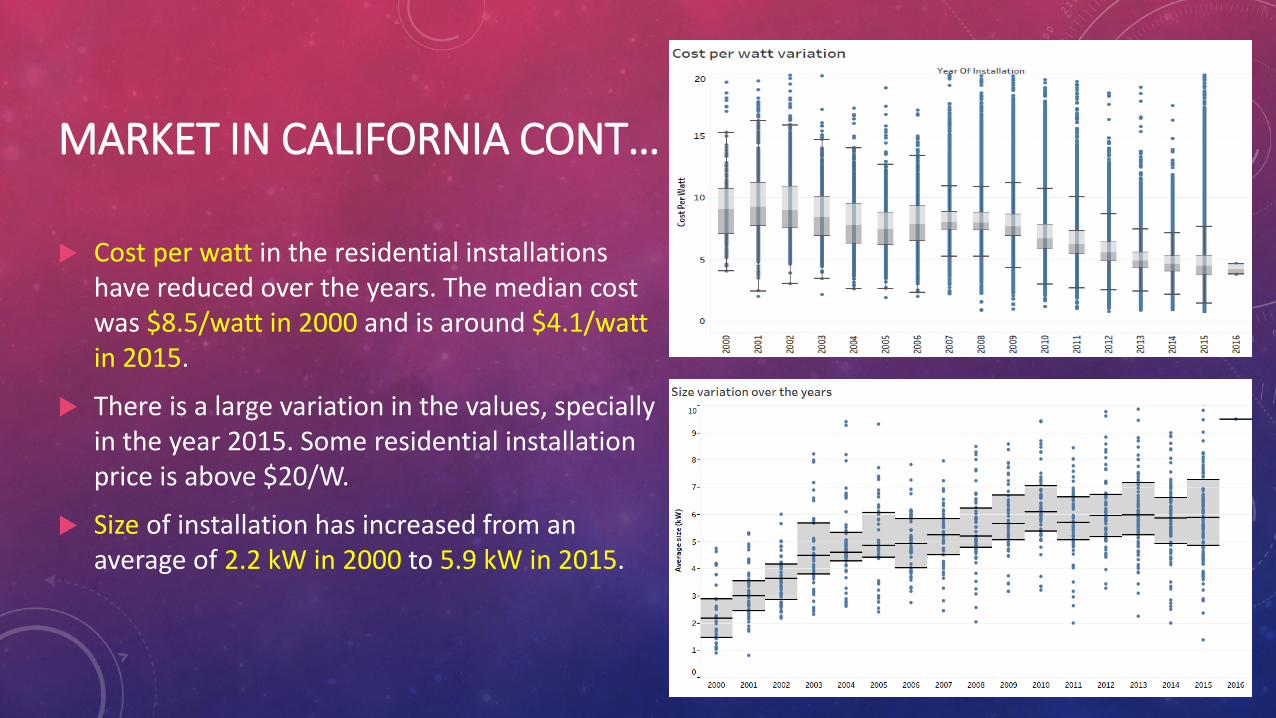
MARKET IN CALIFORNIA CONT…
Cost per watt in the residential installations have reduced over the years. The median cost was $8.5/watt in 2000 and is around $4.1/watt in 2015.
There is a large variation in the values, specially in the year 2015. Some residential installation price is above $20/W.
Size of installation has increased from an average of 2.2 kW in 2000 to 5.9 kW in 2015.
CONCLUSION AND FURTHER ANALYSIS
• Overall cost per watt is reducing and number of installations are increasing due to the advancement in technology and reduction in soft costs.
• Since California is way ahead of the other states in USA, it might suggest that the governments’ rebate program, cost of solar panels etc is aiding the solar industry.
• The data suggests that with continued effort of the industry, the government and the public, the solar prices will further reduce and other states can catch up to California.
• The non – residential sector such as commercial, agricultural, educational etc. needs to be targeted.