Embed Size (px)
Citation preview

Final Presentation 2004
Momentum Measurement Card (MMC)
Project supervised by:
Mony Orbach
Project performed by:
Hadas PremingerUri Niv

Final Presentation 2004
Introduction The MMC project is a result of
collaboration between the Physics Lab and the HS DSL.
The outcome is an electronic card capable of measuring momentum.
The implementation was done using: FPGA USB to FIFO module. C++ application.

Final Presentation 2004
Block Diagram
CycloneFPGA USB
CommunicationUnit
Data
PCB
2 Optical Sensors
Control

Final Presentation 2004
The Experiment’s System The experiment
consists of : Two carts on an air
track moving towards each other.
On each cart there is a "Miller Strip“.
Two position sensors.

Final Presentation 2004
Input Signals Two 2-bit signals:
Each signal consists of two square waves, with 90° phase difference.
These signals are generated by the two optical encoders (EM-1).
Usb connection to PC.

Final Presentation 2004
Output Signals
A file, consists of three dimension array [tick, position1_, position2_].
The length of the array: 600 measurements per experiment (for each cart).
The +/- mark represents the position in reference to the zero point. It is set by the location of the cart in the beginning.

Final Presentation 2004
System Rates
Hardware Rates: Main clock rate 12MHz Data transfer rate 32 bits/sample Send/Receive data over USB up to
1Mbits/sec Sampling & Processing rates:
Number of samples per experiment 600 samples Sample resolution 480 counts/inch Sampling Interval (Tick length) 10ms or 5ms
or 3ms Cart minimum/maximum speed 0-5 meter/sec

Final Presentation 2004
Currents and Voltages The system uses 3 voltage levels:
5V power supply from the computer via USB cable.
3.3V and 1.5V from an external DC power supply unit of 7.5V. Two internal regulators convert it to the specified voltage levels.
Ground is received from PC.

Final Presentation 2004
Current Supply limitations 2 A (for both 3.3V and 1.5V regulators). 500 mA (for the 5V power supply from
the PC). Fuses
Main Fuse – 2A. Pico Fuse – 1A, for the 5V received from
the PC via DLP.
Currents and Voltages – cont.

Final Presentation 2004
Electrical Structure
Cyclone
FPGA
Transceivers
DLP
CLK
PCB
EPCSReset
PC
D-9D-15Jack Sockets D-9
sensors

Final Presentation 2004
The Connectors D-9 – connection to the EM1 sensors. D-15 – for future use. Jack Sockets – for future connection
of photo-gates. Debag port. JTAG connection for FPGA
programming.

Final Presentation 2004
PCB Structure The PCB is made of 6 layers, as
following (from top to bottom): Layer 1 (top) – Signals. Layer 2 – Ground. Layer 3 – Vcc 3.3V. Layer 4 – Vcc 1.5V. Layer 5 – Vcc 5V. Layer 6 (Bottom) – Signals.

Final Presentation 2004
PCB Structure – cont. The PCB measurements:
Thickness - 1.6 mm. Length (connectors' side) – 146.1 mm. Width (tracks' side) – 148.7 mm.
PCB's material – FR4.

Final Presentation 2004
The FPGA tasks General:
The FPGA has two main tasks: Sample and calculate the position of the cart. Control the data transmission process to the PC.
The two tasks are done by two separate blocks in the implementation and are synchronized by special signals.
2 additional blocks convert the asynchronous input signals to synchronous signals.

Final Presentation 2004
Control signal
Inputs’Async
To Sync
Sensor1
Sensor2Calc_Coord
Operating
Machine
ControlSignals
Carts’ coordination
Control’sAsync
To Sync
Control Signals from DLP
DLP Control Signals
DLP8bit DataBus
Data signal
FPGA Top Level

Final Presentation 2004
Calc_Coord Block Samples the input
signal and calculates the position of the carts.
Creates the signal ‘Count’.
Determines the direction of the cart.
Counts the number of ‘counts’ from the beginning.
AB
00
01
11
10
L
R

Final Presentation 2004
Wave sample0.211 mm
Count
Signal A
Signal B
A xor B

Final Presentation 2004
Operating_Machine Block The core of the whole system. It is synchronized with the PC application. Controls of the USB comm. module. Implemented by a Finite State Machine. The blocks main tasks are:
Receiving the sampling interval from the PC. Sampling the counter of the Calc_Coord block
every ‘Tick’. Sending the data to the PC via the USB
module.

Final Presentation 2004
Read Byte Cycle
Ready Init_read Read_bus Wait_ RXF1
Wait_ RXF2
Copy Pre_read Wait_ Read
Wait_ Read
RXF_sample2
RXF_smaple1
RD
Data_Buf [7..0]
Data_read [7..0]
Valid
Pre_read Read_bus
Valid
First Byte Second Byte

Final Presentation 2004
Write Byte Cycle
Init_write Write_ First
Write_bus Wait1 Wait2 Write_ Second
TXE_sample2
TXE_smaple1
WR
Data_Buf [7..0]
Data_wr [7..0]
Valid
Pre_Write
First Byte Second Byte
Pre_Write Write_bus Pre_Write
Valid

Final Presentation 2004
Prior to Power Up When the main power switch is off, and
the USB cable is not connected, the system is in a shut down mode and isolated.
The control lines between the FPGA and the DLP are connected to Pull-Up and Pull-Down resistors to prevent High-Z.
The transceivers are in isolation state until the FPGA competes its Boot-Up sequence.

Final Presentation 2004
Power Up Sequence
FPGA Starts its Boot Up Sequence
USB cable connected and main power switch turned on
System Off

Final Presentation 2004
Power Up Sequence – Cont.
Transceivers open and set to the right data flow direction.
FPGA sets control lines to appropriate Values .
DLP’s RESET held on ‘0’ level(Disconnected from PC)

Final Presentation 2004
Power Up Sequence
A positive edge on the DLP’s signal RESETO indicates that a connection to PC
was successfully established
System Ready
DLP’s RESET set to ‘1’(Enables connection to PC )

Final Presentation 2004
Application & Drivers A Visual C++ application was written to:
Establish a real time connection between the peripheral hardware and the PC.
Supply a basic user’s interface. We referred to the USB protocol as a
"Black Box“. The communication between the
hardware and the software is done automatically by the operating system of the PC.

Final Presentation 2004
Application & Drivers DLP Design supplies two kinds of
interfaces for the application software developer.
The solution of an Interface that uses a DLL was chosen.

Final Presentation 2004
Application & Drivers The
drivers' architecture for the DLL interface are:
Application SoftwareVisual C++
Ftd2xx.dll
Ftd2xx.sys
Operating System – WindowsUSB Driver
Stack
USB245M
The application software is compiled with a .lib file, which connects the application during run-time, to
the .dll file.
Windows USB Interface – via USB stack.
Application Software Interface

Final Presentation 2004
Application & Drivers
File NameFile descriptionComments
1.
Ftd2xx.hThis heeder file must be included to the project in order to use the DLP system calls.
The file is one of the files included in the DLL package of drivers.
2.
Function.hIn this header file, the declarations of the utility functions, which are used by main.cpp, are made.
3.
Momentum.hIn this header file, the declarations of the main classes of the program are made.
4.
Function.cppImplementation.
5.
Momentum.cppImplementation.
6.
Main.cppImplementation of the "main" program.

Final Presentation 2004
Application’s Flow ChartInitialize USB connection
Is a device connected?
No
Ask user for time between samples
Yes

Final Presentation 2004
Application’s Flow Chart
Send time between samples to hardware
Take a sample
600 samples?
No
Yes
End

Final Presentation 2004
Application’s Classes Based on two important classes:
Position and DLP. The DLP class manages the
communication between the application and the USB.
The Position class manages and stores the information that is recieved from the hardware.

Final Presentation 2004
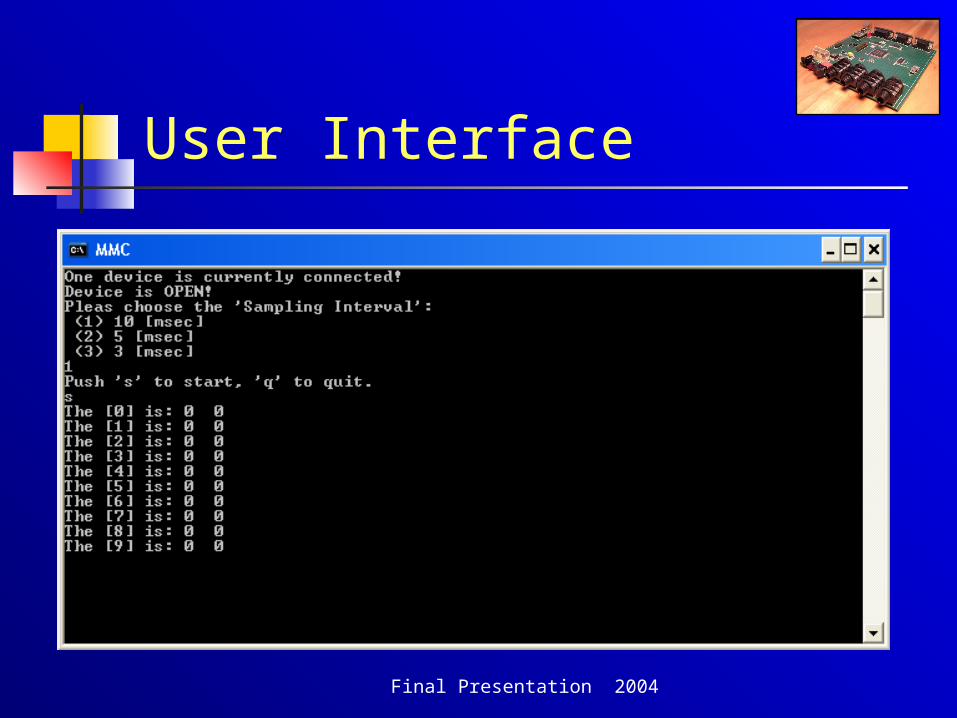
User Interface

Final Presentation 2004
User Interface
Final Presentation 2004
User Interface

Final Presentation 2004
User Interface

Final Presentation 2004
The MMC

Final Presentation 2004
Package

Final Presentation 2004
Future Improvements Expanding the software to support 2
sets of carts and the photo gates. Allowing the user to determine the
number of measurements per experiment.
Changing the main power switch so it would control also the 5V supply coming from the PC.

Final Presentation 2004
Summary Designing a stable reliable system. Designing a PCB.