Embed Size (px)
Citation preview

Savannah Environmental: EMVELO Pre-construction Report CSP2
P 1
FINAL PRE-CONSTRUCTION AVIAN IMPACT
ASSESSMENT OF THE ILANGA CSP 2,
NEAR UPINGTON, NORTHERN CAPE
Prepared for:
On behalf of: EMVELO HOLDINGS (PTY) Ltd
Prepared by:

Savannah Environmental: EMVELO Pre-construction Report CSP2
P 2
Contents
1 SUMMARY ....................................................................................................................................... 3
1.1 CONSULTANT’S DECLARATION OF INDEPENDENCE ................................................................ 5
1.2 QUALIFICATIONS OF SPECIALIST CONSULTANT ...................................................................... 5
2 TERMS OF REFERENCE .................................................................................................................... 5
3 BACKGROUND ................................................................................................................................. 6
3.1 CSP solar power ....................................................................................................................... 6
3.2 Potential avian impacts with CSP facilities .............................................................................. 7
3.2.1 Habitat loss – Destruction, Disturbance and Displacement ........................................... 9
3.2.2 Collision – with reticulation lines and CSP troughs ...................................................... 10
4 STUDY METHODS .......................................................................................................................... 10
4.1 Aims and methods ................................................................................................................. 10
4.2 Study area .............................................................................................................................. 11
4.2.1 Vegetation of the study area ........................................................................................ 11
4.2.2 Avian microhabitats ...................................................................................................... 12
5 ON SITE METHODS ........................................................................................................................ 14
6 RESULTS ......................................................................................................................................... 15
6.1 Presence and movements of sensitive species ..................................................................... 15
6.2 Avian Species richness and red data species ......................................................................... 15
6.2.1 Density of birds recorded within the proposed CSP sites ............................................ 17
6.2.2 Passage rates of collision-prone species within CSP 2 ................................................. 17
6.2.3 Flights paths of collision-prone species within CSP 2 ................................................... 19
6.3 Sensitivity map of collision-prone red data species .............................................................. 19
7 QUANTIFYING THE IMPACTS ......................................................................................................... 24
7.1 Cumulative impacts ............................................................................................................... 27
8 ENVIRONMENTAL management plan ........................................................................................... 30
9 CONCLUSIONS and recommendations .......................................................................................... 32
10 REFERENCES .................................................................................................................................. 33
11 APPENDICES .................................................................................................................................. 35
Appendix 1. All bird species recorded around the Karoshoek Solar development ...................... 35
Appendix 2: Bird densities by habitat ....................................................................................... 39
Appendix 3: Passage rates of Collision-prone species .............................................................. 42
Savannah Environmental: EMVELO Pre-construction Report CSP2
P 3
1 SUMMARY
This study reports on avian monitoring for the proposed Ilanga CSP solar project,
proposed by Emvelo Holdings (Pty) Ltd on various farms near “Karoshoek” east of
Upington, Northern Cape. Our specific objective is to determine the numbers of collision-
prone birds attracted to the proposed solar development before and after rains in
November 2015 and March 2016 to understand and mitigate any possible impacts to
sensitive and threatened species.
A brief review of recent literature on Concentrating Solar Plants (CSP) and their effects
on avifauna reveals that CSP trough technology, which utilizes parabolic mirrors may
attract birds to its reflective surfaces, and median levels of mortality and displacement
may occur relative to other PV and CSP technology. Here we identify potential impacts
associated with these facilities in the proposed Ilanga Solar Park development.
The possible impacts are:
(i) Displacement of nationally important species from their habitats by the
presence of the parabolic mirrors;
(ii) Loss of habitats for such species due to direct habitat destruction under the
CSP trough sites;
(iii) Disturbance during construction of the array, and
(iv) Collision with the parabolic troughs by birds that mistake them for water
bodies (the so-called “lake effect”).
Indirect and cumulative impacts include water abstraction from the Orange River which
may reduce flow rate in low-flow seasons and force avifauna to seek alternative habitats.
The impact zone of the CSP trough CSP 2 lies on the interface of Nama Karoo and
Kalahari Shrubland. Up-to-date (SABAP2) bird atlas data combined with our data
indicates that habitat in the Karoshoek Solar Valley development footprint supports up to
114 bird species, including 14 species ranked in the top 100 collision-prone species. Six
of these species are also red-listed: Black Harrier Circus maurus, Lanner Falcon Falco
biarmicus, Kori Bustard Ardeotis kori, Ludwig’s Bustard Neotis ludwigi, Verreaux’s Eagle
Aquila verreauxi and Secretarybird Saggitarius serpentarius. Given that harriers, eagle
and bustards are highly collision-prone species, they may interact negatively with the
CSP 2 CSP infrastructure. Similarly, the proximity to the Orange River may attract
wetland species seeking other wetland areas, and cause mortality as birds attempt to
Savannah Environmental: EMVELO Pre-construction Report CSP2
P 4
land on the CSP mirrors. In addition, larks and sandgrouse will lose habitat totaling ~410
ha.
Since the degree and significance of bird impacts will depend largely on the abundance
and movements of key species, we calculated bird densities in the site footprint and the
passage rate of the collision-prone through and over the site. Our 1 km surveys revealed
a higher species richness of smaller birds in the wet season (13.3 v 9.0 species km-1).
The Passage rate of larger collision-prone birds was low at 0.29 birds per hour of
observation and it differed little between the seasons. Five species of wetland birds that
may be attracted to the mirrored surfaces, were recorded in the wet season as expected,
and large numbers of sandgrouse (944 birds h-1) were recorded commuting to a flooded
pan on the eastern edge in the wet season. Sociable Weavers were present in low
numbers on the site.
The volume of water required for the generation of steam to drive the turbines at one
CSP is about 80 000 m3 per year. Thus, steam generation required for the 8 CSPs
planned for the solar park development may require substantial amounts over 600 000
m3 of water from the Orange River. The cumulative impacts of many other solar farms
proposed along the Orange River’s borders may reduce flow at low flow, forcing wetland
species to seek other water sources.
We quantified the impacts and found high levels of significance for the collision-prone
red data bustard species on CSP 2 that require mitigation. Overhead power lines pose a
significant threat, particularly to the bustards, and this is assessed in a separate Basic
Assessment process.
To mitigate the possible problems of impacts with the CSP troughs, we recommend that:
(i) Bird scaring techniques including rotating prisms and experimental use of
Torri lines (ribbons used on trawlers to deter albatrosses from taking baited
hooks and drowning) are used if birds are found to impact the CSP mirrors;
(ii) The CSP troughs are constructed as far as possible from the high sensitivity
areas identified;
(iii) All power lines – present and future – must be marked with bird diverters to
reduce the possible impact of the raptorial species.
Systematic monitoring during construction and post-construction of the CSP facility is
required by trained ornithologists to determine the full impact of the facility on South
Africa’s red data birds.

Savannah Environmental: EMVELO Pre-construction Report CSP2
P 5
1.1 CONSULTANT’S DECLARATION OF INDEPENDENCE
Birds & Bats Unlimited are independent consultants to Savannah Environmental. They
have no business, financial, personal or other interest in the activity, application or
appeal in respect of which they were appointed other than fair remuneration for work
performed in connection with the activity, application or appeal. There are no
circumstances that compromise the objectivity of this specialist performing such work.
1.2 QUALIFICATIONS OF SPECIALIST CONSULTANT
Birds & Bats Unlimited Environmental Consultants (http://www.birds-and-bats-
unlimited.com/), were approached to undertake the specialist avifaunal assessment for
the pre-construction phase of the CSP solar parks proposed by Emvelo Holdings (Pty)
Ltd, east of Upington, Northern Cape. Dr Rob Simmons is an experienced ornithologist,
with 30 years’ experience in avian research and impact assessment work. He has
published over 100 peer-reviewed papers and 2 books, (see
www.fitzpatrick.uct.ac.za/docs/robert.html for details). More than forty avian impact
assessments have been undertaken throughout Namibia and South Africa. He also
undertakes long-term research on threatened species (raptors, flamingos and terns) and
their predators (cats) at the FitzPatrick Institute, UCT.
Marlei Martins, co-director of Birds & Bats Unlimited, has over 5 years’ consultancy
experience in avian wind farm impacts as well as environmental issues, and has been
employed by several other consultancy companies all over South Africa because of her
expertise in this field. She has published papers on her observations including a new
species of raptor to South Africa (http://www.birds-and-bats-unlimited.com/).
2 TERMS OF REFERENCE
To provide a desktop and field assessment of all potential impacts to avifauna by
the CSP Parabolic trough technology at CSP 2 within Karoshoek Solar Park
development, near Upington;
The final avian impact assessment should include assessments of all revised areas
proposed after the initial site visit in November 2015;
To provide a summary of expected impacts for all threatened or collision-prone
species found in the area;
Savannah Environmental: EMVELO Pre-construction Report CSP2
P 6
To quantify the expected impacts with and without mitigation measures;
To determine the cumulative impacts to the avifauna in the area;
To provide possible mitigation measures to reduce impacts wherever they occur;
Provide recommendations for an environmental management plan to
systematically monitor the site, during and post-construction to determine
impacts to the avifauna, and provide mitigation solutions were necessary.
We start with a review of the solar technology to be employed to contextualize it,
relative to possible and known avian impacts elsewhere in the world.
3 BACKGROUND
3.1 CSP SOLAR POWER
Renewable energy is generally provided either by water, wind or solar power and has the
potential to supply the human population with unlimited non-polluting power. As a
major greenhouse gas emitter South Africa is a signatory to the Kyoto Protocol and is
committed to turning to green energy sources that emit no greenhouse gases or other
pollution. Southern Africa’s Kalahari region is one of the Earth’s hot spots for solar
radiation because deserts provide some of the longest periods of continuous sunlight in
the world http://www.iir-sa.gr/files/news/CSP.pdf. This makes it the ideal hub for solar
projects that capture the sun’s energy to provide an energy-hungry South Africa with the
power it requires.
Three options are generally employed to capture solar energy:
(i) Concentrated Solar Plants (CSPs) using heliostats that focus the sun’s energy
onto a central tower that heats a salt or oil liquid that drives a turbine (CSP
tower);
(ii) a CSP using trough technology with smaller parabolic mirrors that capture and
focus the sun’s energy onto a central pipe that also employs a heat-transfer
liquid to heat steam to drive a turbine. This is the preferred option by the
developer Emvelo Holdings (Pty) Ltd, in the Ilanga Solar development CSP 2;
or
(iii) Photo-voltaic panels that capture and convert sunlight directly into electrical
power using conventional PV technology.
There are fewer direct risks associated with the PV and CSP trough technology than CSP
towers from an avian perspective (see below). However, all forms of solar technology

Savannah Environmental: EMVELO Pre-construction Report CSP2
P 7
appear to draw in birds because research suggests birds perceive the shiny mirrored-
surfaces as open water (the so-called “Lake Effect” – Kagan et al. 2014). This CSP
trough technology is the only one assessed in this report for the Emvelo solar
development at CSP 2.
3.2 POTENTIAL AVIAN IMPAC TS WITH CSP FACILITIES
The main avian impacts according to a position paper on the subject by Birdlife SA
(http://www.birdlife.org.za/images/stories/conservation/birds_and_wind_energy/solar_power.pdf)
are:
(i) displacement of nationally important species from their habitats;
(ii) loss of habitats for such species;
(iii) disturbance during construction, and operation of the facility;
(iv) collision with the CSP mirrors (mistaking them for water bodies); or
(v) collision with associated infra-structure.
The nature and magnitude of impacts to birds from solar facilities is related to three
factors: (a) location, (b) size of the facility, and (c) the technology involved (i.e. Photo-
voltaic vs CSP trough vs CSP tower). Thus, the location in relation to avian flyways,
wetlands, nest sites, roost sites and the habitat removed in the footprint may have an
important effect on the impact to birds at the solar site. The size of the footprint will be
directly related to the negative impact on smaller birds, thus, habitat of range-restricted
or collision-prone species around the site must be determined with accuracy.
An area up to 410 ha is required in the operation of the CSP 2 facility, and this will
reduce habitat availability for birds where construction takes place. It is a simple
exercise to calculate the numbers potentially lost from our estimates of birds per unit
area. These are likely to be minimal considerations given that smaller birds generally
occur at higher densities than larger birds, breed faster, and are less likely to suffer high
population reduction. However, avoidance of some habitats will reduce the impact.
Avian fatalities at CSP sites have been summarised from those investigated in the USA
by two recent reports (Kagan et al. 2014, Walston et al. 2015). Of the three types of
solar energy capture (PV, CSP trough and CSP tower) the CSP trough sites recorded
median levels of avian fatalities relative to the PV and CSP tower sites in one review
(Kagan et al. 2014).
Given that impact trauma was the most common cause of mortality at two of the three

Savannah Environmental: EMVELO Pre-construction Report CSP2
P 8
solar sites investigated, minimising the reasons for the cause of that trauma are
paramount. Biologists believe that birds mistake the troughs in the solar arrays for a
body of water (the Lake effect – Kagan et al. 2014) and suffer physical trauma when
they attempt to land on it. Birds, particularly wetland species, are the main victims of
this sort of impact.
In a review of all bird fatalities at large scale operational solar plants across the world
(mainly the USA but one in Israel) Walston et al. (2015) found that few solar plants had
undertaken systematic monitoring of bird fatalities (Table 1).
Table 1. Summary of all avian fatality data from large-scale solar facilities from the USA (after
Walston et al. 2015). The results for CSP trough technology are given in bold.
Project Name
Avian Fatality
Data –
systematic or
incidental?
Survey Period Incidental Fatalities
Systematic Fatalities
(Unadjusted)**
Mohave Solar (CSP trough) Yes – Incidental Aug. 2013–March 2014 14 None collected
Genesis (CSP trough) Yes – Incidental Jan. 2012–May 2014 183 None collected
California Valley Solar Ranch (PV)
Yes – Systematic Aug. 2012–Aug. 2013 Not Available
368
Desert Sunlight (PV) Yes – Incidental Sept. 2011–March 2014 154 None collected
Topaz Solar Farm (PV) Yes – Incidental
and Systematic Jan. 2013 –Jan. 2014 19 41
California Solar One (CSP tower) Yes – Systematic May 1982–May 1983
(40visits)
Not
Available 70 (114 birds)
Crescent Dunes (CSP tower) Yes - systematic Under construction Not available Not available
Ivanpah (CSP Tower) Yes – Systematic Oct. 2013–March 2014 159 376 (includes 7
injured birds)
*Causes of death include: solar flux, impact trauma, predation, electrocution and emaciation
** Unadjusted refers to the fact that numbers are not adjusted for biases resulting from predator removal or human
observer bias
In summarising the avian species found, Walston et al. (2015) noted that:
most birds were small passerines (40%-63% at 7 solar farms);
Kagan et al. (2014) also found 20 of the 30 birds identified at the Genesis CSP
trough site in California were smaller passerine birds or swallows;
they also recovered waterbirds such as grebes, herons and gulls suggesting these
species may be attracted by the perceived availability of water or the lake effect
(Kagan et al. 2014);
overall, waterbirds were found to average 11% of the fatalities at solar farms, but
reached 46% of all fatalities at one solar PV facility (Desert Sunlight) in
California;
there were too few fatalities at different types of facilities to test the lake effect of
Kagan et al. (2014);
Savannah Environmental: EMVELO Pre-construction Report CSP2
P 9
there was a clear trend at all solar facilities for resident species to dominate the
fatalities. At the Genesis CSP trough facility 64% of the fatalities were resident
species, meaning that 36% were migrants (Walston et al. 2015), the highest
among those reviewed.
Tabulating fatalities of birds at solar sites is insufficient to determine the impact to birds
of conservation significance. They must be collected systematically and account for
human error in (not) finding carcasses, and the rate of carcass removal by scavengers.
In an arid environment where sensitive species may not occur at all if rains do not fall
(Dean 2004, Dean et al. 2009) even a full year’s monitoring is unlikely to be sufficient.
Thus, visits must be timed to coincide with the most productive time of year – the rain
season. Therefore, the present CSP trough CSP 2 was closely and systematically
monitored by Birds & Bats Unlimited, over a dry and wet season, to determine
movements and rates of passage of all collision-prone species (as defined by BARESG
2014). We followed the draft Birdlife/EWT guidelines (Jenkins et al. 2015) for such
monitoring to minimise the possibility of inappropriate or under-sampling obvious in
some other EIA reports.
As a relatively new field, and with the burgeoning solar farm industry in South Africa
focussed on the Kalahari Desert, we need to be pro-active in our research and innovative
designs to reduce mortality.
3.2.1 HABI TAT LOSS – DES TRUCTI ON , DIS TURBAN CE AND DIS PL ACEMEN T
The construction and maintenance of CSP technology causes mainly permanent habitat
destruction under the parabolic mirrors. Maintenance activities are likely to cause some
disturbance to birds in the general surrounds, and especially the shy or ground-nesting
species resident in the area. Mitigation of such effects requires that best-practice
principles be rigorously applied – i.e. sites are selected to avoid the destruction of key
habitats for red data species, and the disturbance and construction and the final
footprint size, for key species, should all be kept to a minimum. Construction time for
each facility is expected to take 2-3 years.
From the habitat removal point of view, it is a simple exercise to calculate the numbers
of birds potentially lost from our density estimates of important species/birds per unit
area of habitat. These are likely to be minimal considerations, given that smaller birds
are generally more common than larger birds, breed faster, and are less likely to suffer

Savannah Environmental: EMVELO Pre-construction Report CSP2
P 10
high population reduction.
However, where range-restricted species occur on sites ear-marked for development,
this can have a larger impact.
Because CSP facilities are not yet operational in South Africa, and there are relatively
few published studies of avian mortalities at such sites in other parts of the world (Table
1), this section is necessarily brief and is in need of further study, transparency and data
sharing in southern Africa.
3.2.2 COLLISION – WI TH RE TI CULATI ON LI NES AN D CSP TRO UG HS
Several South African bird species are well known to collide with overhead power lines,
fences, towers and other aerial objects (Jenkins et al. 2010). These have been tabulated
and the reasons for their propensity for collision investigated (Martin and Shaw 2010).
The extenuating factors were then extrapolated to all South African species based on
wing loading, aerial flights, nocturnal activity, red-data status (Taylor et al. 2015) and
several other contributing factors (BARESG 2014).
We have used Birdlife South Africa’s list and taken the top 100 species as the most likely
to collide with power lines. The most collision-prone species are generally the larger
species such as bustards and cranes, but also raptors. It is somewhat surprising that
birds also collide with ground-based structures and, as shown above (Table 1), these
include passerines, and wetland birds in collision with CSP troughs in the USA. While we
do not know which species will be similarly prone in South Africa, they are likely to be a
similar suite of wetland and aerial species, as well as those known to collide with aerial
structures (bustards and raptors). It is these we focused on during our surveys.
4 STUDY METHODS
4.1 AIMS AND METHODS The primary aims of the avian pre-construction monitoring at the CSP 2 proposed by
Emvelo Holdings (Pty) Ltd at the Karoshoek Solar Valley development are to:
Determine the densities of birds regularly present, or resident, within the impact
area of the CSPs before the construction phase;
Document the patterns and movements of birds in the vicinity of the proposed
CSPs before their construction;

Savannah Environmental: EMVELO Pre-construction Report CSP2
P 11
Monitor the patterns and rates of movements of birds in the CSP areas in relation
to time of day, and over one dry and one wet season when bird numbers and
species richness may change;
Establish a pre-construction baseline for all Red data and collision-prone bird
species including all breeding birds within the study area;
Quantify the impacts before and after mitigation;
Quantify, if possible, the cumulative impacts around the solar park
Inform final design, construction and management strategy of development with
a view to mitigating potential impacts.
We consulted several published sources of bird data including:
Information on the ecology (Hockey et al 2005), distribution (Harrison et al.
1997) and conservation status (Taylor et al. 2015) of all South African birds;
The Important Bird Areas Programme (IBA) of Birdlife South Africa (Barnes 1998)
Contemporary South-Africa-wide atlas data were extracted from the Southern
African Bird Atlas Project (SABAP), which were obtained from the Animal
Demography Unit website (http://sabap2.adu.org.za/index.php) for the relevant
“pentads” of 5’ x 5’ (of 9 km x 8km) surrounding the planned development areas.
From these data we compiled a list of the avifauna likely to occur within the
impact zone of the proposed power lines. Because of the remoteness of the area
there were limited SABAP2 data available at http://sabap2.adu.org.za/index.php for
this region.
These data were combined with data from two visits to the area in November
2015 and March 2016 to record bird densities and passage rates.
This report combines the data gleaned from all sources to give an assessment of the
birds present in the site and, the potential impacts they face arising from the solar
developments.
4.2 STUDY AREA The Karoshoek Solar Valley Development is located approximately 30 km east of
Upington within the Khara Hais Local Municipality, which falls under the Siyanda District
Municipality in the Northern Cape. The facility is proposed on Lot 944, Karos Settlement.
The CSP 2 is geographically centred on S28°30'32.30" E 21°31'38.90".
4.2.1 Vegetation of the study area

Savannah Environmental: EMVELO Pre-construction Report CSP2
P 12
The study area occurs on the interface between the Nama Karoo biome to the south and
Kalahari Savannah biome to the north (Mucina and Rutherford 2006, p44). A large
swathe of Bushmanland Arid Grassland runs north-south through the park (Mucina and
Rutherford p335), and elements of five other vegetation types are found and described
by Todd (2012). The area experiences summer rainfall up to 510 mm near Upington.
High day-time temperatures occur in summer (mean 37oC) and relatively cool
temperatures occur in winter (4-23oC). The site was dry and all but the larger trees were
dormant in November 2015, our first site visit. Substantial rains (~250 mm in February
and March 2016), had fallen by our second site visit in March 2016 and new grass cover
was evident and the Rhigozum bushes and Acacia and Boscia trees were in full leaf.
4.2.2 Avian microhabitats
Bird habitat in the region consists of two basic vegetation types: Nama Karoo scrub and
Kalahari Savannah with a very sparse cover of Boscia and Acacia trees along the dry
water courses. The main avian micro-habitats were provided by the grasses, (exploited
by bustards, korhaans, larks and finches) and the trees (exploited by flycatchers,
sociable weavers and perching raptors). Artificial habitats are provided by the farmers -
windmills, water points and power poles. Some pans occur just outside the immediate
study area and were expected to attract sandgrouse, and raptors.
Photo 1: Several breeding species were encountered in the wet-season (March) including a Sabota Lark (left)
and Sociable Weavers (right). A Black-chested Snake-Eagle was seen only once perched above the weaver nest
in a mature Boscia tree in the south-west corner of CSP 2.

Savannah Environmental: EMVELO Pre-construction Report CSP2
P 13
Photo 2: Typical dry-season habitat (top) on CSP 2 in the eastern half of the Ilanga solar development
showing sparse dry grass cover, Rhigozum shrubs (middle distance), and a mature Boscia albitrunca. By
contrast the wet-season transformation (above) sees the Rhigozum bushes (foreground), grasses and trees in
full leaf. The pan, visible in both images, is 75% filled in the wet season.

Savannah Environmental: EMVELO Pre-construction Report CSP2
P 14
5 ON SITE METHODS
Two site visits were undertaken to the CSP 2 to coincide with different environmental
conditions:
a dry season visit from 31 October - 7 November 2015;
a wet-season visit following substantial and on-going rains from 29 February – 9
March 2016;
In each visit we surveyed birds in 1-km transects in areas proposed for the CSP
solar arrays. These transects covered all main habitat types present;
We also undertook Vantage Point observations covering 12 h in each season as
prescribed by BARESG guidelines (Jenkins et al. 2015).
All 1-km bird transects took place in the morning (bird-active) hours.
Each transect was walked slowly over 35 to 60 minute duration, depending on
terrain and number of birds present;
All species were identified where possible using Swarovski 8.5 x 42 binoculars,
and the number of individual birds and the perpendicular distance to them,
recorded;
In denser habitat, or with some cryptic birds (e.g. larks), species were identified
by call and the distance to them estimated. This allows an estimate of the density
(birds per unit area and per km, expressed as bird km-1) and the species richness
in each area;
We simultaneously recorded all large birds (mainly bustards and raptors) and
noted and recorded the position of any nests found;
Over 900 (dry season) and 1300 (wet season) individual birds were recorded in
the CSP areas in these transects alone.
The most important aspect of this monitoring is Vantage Point (VP) surveys:
This determines the number of flights of collision-prone species per hour
through the possible area of impact, which in turn gives an indication of the
collision-risk to larger species that may impact the infrastructure in the solar
park;
12 hours per VP is the minimum recommended observation time for each VP
(BARESG guidelines: Jenkins et al. 2015);
Each VP should have a view-shed (area of observation) not exceeding 2 km;
Because of the large size and flat nature of the terrain we walked some areas not

Savannah Environmental: EMVELO Pre-construction Report CSP2
P 15
well covered by the VP points at each site.
6 RESULTS
6.1 PRESENCE AND MOVEMENT S OF SENSITIVE SPECIES
Large sensitive species, observed from our walking transects or VPs, are defined as
those species that are known, or expected, to be at risk from the CSP infrastructure, or
attracted by the reflective surfaces of the CSP troughs. These species are typically large
and threatened red data species that occur in the study areas (e.g. bustards and
raptors), but could include wetland species attracted by the mirrored surfaces.
No recent (SABAP2) data were available from the Southern African Bird Atlas Projects
website (http://sabap2.adu.org.za/index.php) for the Karoshoek solar footprint itself.
Therefore, we took information from a slightly wider net that included the Ilanga power
line (Birds Unlimited 2014). To these we added our own dry (November 2015) and wet-
season (March 2016) data for those species found directly on site.
6.2 AVIAN SPECIES RICHNESS AND RED DATA SPECIES
The CSP 2 is shown in Figure 1. A total of 114 bird species were recorded on the 17 bird
atlas cards from the Ilanga solar development and similar areas to the west (following
the proposed Ilanga power line) submitted to the Animal Demography Unit from 2007 to
2014 (Appendix 1). Of these, 8 were collision-prone as ranked by the BARESG (2014),
and only 2 were red-listed (Kori Bustard Ardeotis kori and Lanner Falcon Falco
biarmicus).
However, we noted four additional red data species in our two site visits: a Black Harrier
Circus maurus, breeding Verreaux’s Eagle Aquila verreauxii, a Secretarybird Sagittarius
serpentarius, and numerous Ludwig’s Bustards Neotis ludwigi. Thus, 6 red-data species
occur on site (Table 2). A further 8 collision-prone species (Table 2) were recorded on
the Karoshoek Solar Valley development area, giving 14 collision prone/red data species
in total.
Because the SABAP data were completely missing for pentads away from the Orange
River we tallied every species recorded in our transects, VPs and incidental observations
to determine overall species richness in the dry and wet seasons over the development
area alone. A total of 72 species were recorded which will be added to the SABAP2 data

Savannah Environmental: EMVELO Pre-construction Report CSP2
P 16
base.
In summary, a total of 14 collision-prone species occur on the Ilanga solar
development site, of which six are red-listed.
Table 2. Threatened (in red) and collision-prone bird species (in bold) likely to occur over the proposed CSP
2 trough development drawn from SABAP2 atlas cards for 4 pentads. These are based on 17 cards, submitted
to the SABAP2 project from 2007 to 2015. Those shaded were seen in our site visits in November 2015 and
March 2016, but not previously recorded.
*Reporting rate is a measure of the likelihood of occurrence, as recorded in the atlas period.
** Collision rank derived from the BAWESG 2014 guidelines. Smaller numbers denote more collision-prone.
Seasonal differences in the composition of the bird community are expected to be
large in an arid environment (Dean 2004). This arises for several reasons for different
groups of birds:
wetland species (e.g. geese, stilts and crakes) are attracted by the sudden
appearance of wetlands that were not available prior to pans flooding. They follow
rain fronts to find such ephemeral wetlands (Simmons et al. 1999, Henry et al.
2016);
other birds, including sandgrouse, will use pans that fill with water;
nomadic species (e.g. bustards, larks) are attracted to high rainfall areas because
of the flush of insects that follow rains (Allan and Osborne 2005).
Thus, an arid area such as the Kalahari Desert is very much a “boom or bust” landscape
and one dry season visit can give a biased impression relative to the explosion in
Susceptible to:
Common name Scientific name Threat status
Reportin
g Rate*
Collision
Rank** Disturbance
Verreaux’s Eagle Aquila verreauxii Vulnerable 2 Moderate
Black Harrier Circus maurus Endangered 6 High
Ludwig’s Bustard Neotis ludwigii Endangered 10 Moderate
Secretarybird Saggitarius
serpentarius Vulnerable 12 Moderate
Lanner Falcon Falco biarmicus Near-threatened 6% 22
African Fish Eagle Haliaetus vocifer - 35% 27
Kori Bustard Ardeotis kori Vulnerable 6% 37 Moderate
Karoo Korhaan Eupodotis vigorii 6% 49
Booted Eagle Aquila pennatus - 55
Black-chested Snake Eagle Circaetus pectoralis 56
Pale Chanting Goshawk Melierax canorus - 6% 73 Moderate
N Black Korhaan Afrotis afroides 12% 91
Black-shouldered Kite Elanus caeruleus - 24% 96
Spotted Eagle Owl Bubo africanus - 6% 100

Savannah Environmental: EMVELO Pre-construction Report CSP2
P 17
biodiversity that can follow high rainfall events (Lloyd 1999).
These differences were apparent after good rains that fell in February 2016 and
continued into March at the time of our second visit. Thus, the avian species richness
values will be close to their maximum.
6.2.1 Density of birds recorded within the proposed CSP sites
In our 1-km surveys we recorded an average of 9.0 species km-1 in the dry season and
15.5 species km-1 in the wet season (Table 3). The higher species richness in the wet
season was also reflected in the density of birds per kilometre (Table 3). These species
comprised typical Kalahari birds such as korhaans, scrub-robins, larks, chats, prinias,
finches, sandgrouse and weavers (Appendix 1).
Table 3: Comparison of Dry vs Wet season bird species richness recorded over 1 km at Ilanga CSP 2 in
November 2015 and March 2016.
Summary Species km-1 Birds km-1 Collision-prone species
CSP 2 dry season 9.0 44.5 N Black Korhaan, Rock Kestrel
CSP 2 wet season 17.0 116.0 N Black Korhaan, Karoo Korhaan,
Black-chested Snake Eagle
Means 13.0 sp km-1 87.4 birds h-1 4 species
6.2.2 Passage rates of collision-prone species within CSP 2
Four collision prone species in the top 100 (BARESG 2014) were present in the CSP 2
(Table 4) two of which were red data species. The rate at which they flew through the
site differed little between the seasons (Table 4) and averaged 0.29 birds h-1.
Other aerial species that may be influenced by the mirrored surfaces included Namaqua
Sandgrouse that were infrequent in the dry season but averaged 4.0 birds h-1 in the wet
season (Appendix 1).
Table 4: Comparison of Passage Rates of Collision-prone species from VP observation at Ilanga CSP site,
November 2015 and March 2016
Summary Birds Hours Passage Rate Collision-prone species
Passage Rate (dry season) 4 12 0.33 birds h-1 Ludwig’s Bustard, Kori Bustard,
N Black Korhaan
Passage Rate (wet season) 3 12 0.25 birds h-1 N Black Korhaan, Karoo Korhaan
Means 0.29 birds h-1 4 species

Savannah Environmental: EMVELO Pre-construction Report CSP2
P 18
While no wetland birds were ever recorded on CSP 2, five species (photo 3) were
recorded at the flooded pan 370 m east of CSP 2 in March 2015 suggesting that future
collisions by these species with the CSP mirrors surfaces are quite possible. One Sociable
Weaver nest was recorded on this site (photo 1), and 30 birds were recorded.
Photo 3: Five wetland bird species were drawn into the small flooded pan 370 m east of the eastern border of
site 1.4. These included a collision-prone Goliath Heron (top), Red-billed Teal (centre-right), and Black-winged
stilt (centre-left). This pan (S28°30'26.25" E 21°32'15.80") was also used extensively by Namaqua
Sandgrouse and 944 birds per hour were recorded on 29 February 2016 (bottom).

Savannah Environmental: EMVELO Pre-construction Report CSP2
P 19
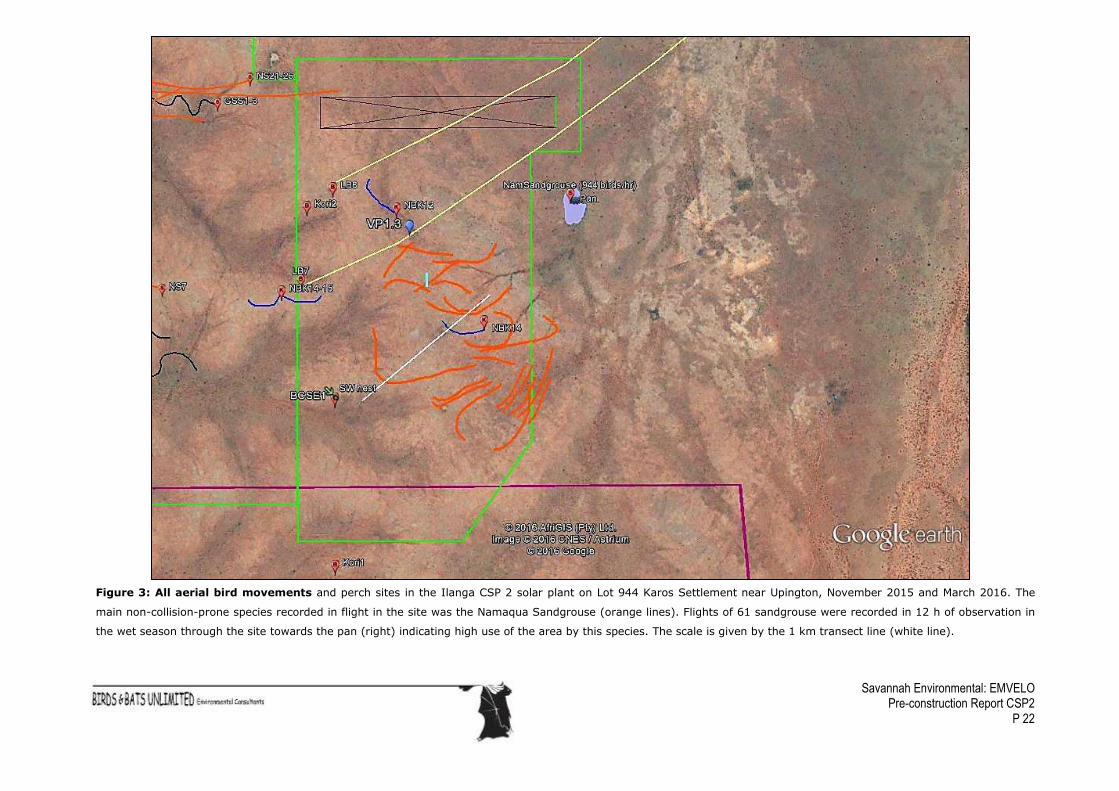
6.2.3 Flights paths of collision-prone species within CSP 2
The flight paths of the collision-prone species through the proposed CSP 2 are shown in
Figure 2. The most frequently recorded species was the Northern Black Korhaan Afrotis
afroides and the Endangered Ludwig’s Bustard. The latter was flushed on two occasions
in November – the end of their breeding season in this region (Allan 2005) – with both
birds flying long distances out of the site in a north-easterly direction. The korhaans
performed territorial display flights within the site and did so in both the wet and dry
seasons. The only other red-listed species recorded was the Vulnerable Kori Bustard that
was seen walking in the western part of the CSP 2 (Figure 2). A collision-prone Black-
chested Snake-Eagle was similarly recorded in the site, perched on the only Sociable
Weaver nest in CSP 2 (photo 1).
Other non-collision-prone species attracted to water were recorded on site in large
numbers, and these included Namaqua Sandgrouse (944 birds per hour visiting the pan:
photo 3). Their interaction with mirrored surfaces is unknown in southern Africa.
In summary:
72 species, 14 collision-prone species and 6 threatened red-data species have
been recorded over the greater Karoshoek Solar Valley Development;
Species richness was lower on the CSP 2 with the density of smaller species
being higher in the wet season (17.0 km-1) than in the dry season (9.0 km-1);
Namaqua Sandgrouse were particularly numerous in the wet season with
thousands flying to the flooded pan on the eastern boundary;
Four collision-prone species were recorded in CSP 2 of which two are red-data
species (Ludwig’s and Kori Bustard). The Passage Rate of these birds was
relatively low at 0.29 birds h-1.
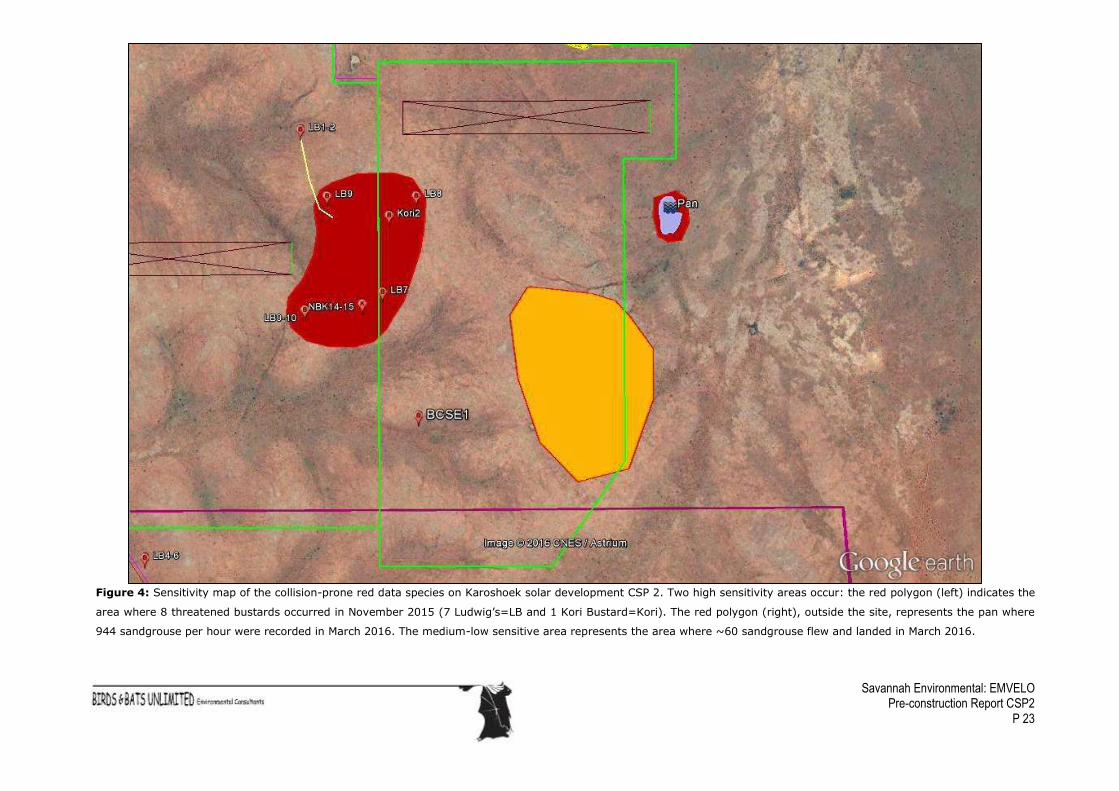
6.3 SENSITIVITY MAP OF CO LLISION-PRONE RED DATA SPECI ES
By combining all records of the collision-prone red data species we can map the most
sensitive areas for birds within CSP 2. The highest sensitive areas are shown in Figure 4
and represent sites where up to 8 red data bustards were recorded or hundreds of birds
came to drink at the pan. The bustards lay eggs in July-September here (Allan 2005),
suggesting the birds seen in November were breeders. One medium-low sensitive area
was also revealed where 60 sandgrouse traversed or landed in March (Figure 4).

Savannah Environmental: EMVELO Pre-construction Report CSP2
P 20
Figure 1: Layout of the Ilanga Karoshoek solar park showing Ilanga CSP 2. The proposed new roads are shown in red and the water pipeline in blue, in relation to
the Orange River. The increased areas are shown adjacent to the coloured rhomboids.
CSP 2

Savannah Environmental: EMVELO Pre-construction Report CSP2
P 21
Figure 2: Collision-prone bird movements and perch sites in the Ilanga CSP 2 solar plant on the farm Lot 944 Karos Settlement near Upington, from November 2015 and
March 2016. Two species of collision-prone birds were recorded in flights in the site, LB = Ludwig’s Bustard (pale yellow) and NBK = Northern Black Korhaan (blue). Two
other stationary collision-prone species occurred Kori Bustard = Kori and Black-chested Snake Eagle = BCSE1. The scale is given by the 1 km transect lines (white line).
Savannah Environmental: EMVELO Pre-construction Report CSP2
P 22
Figure 3: All aerial bird movements and perch sites in the Ilanga CSP 2 solar plant on Lot 944 Karos Settlement near Upington, November 2015 and March 2016. The
main non-collision-prone species recorded in flight in the site was the Namaqua Sandgrouse (orange lines). Flights of 61 sandgrouse were recorded in 12 h of observation in
the wet season through the site towards the pan (right) indicating high use of the area by this species. The scale is given by the 1 km transect line (white line).
Savannah Environmental: EMVELO Pre-construction Report CSP2
P 23
Figure 4: Sensitivity map of the collision-prone red data species on Karoshoek solar development CSP 2. Two high sensitivity areas occur: the red polygon (left) indicates the
area where 8 threatened bustards occurred in November 2015 (7 Ludwig’s=LB and 1 Kori Bustard=Kori). The red polygon (right), outside the site, represents the pan where
944 sandgrouse per hour were recorded in March 2016. The medium-low sensitive area represents the area where ~60 sandgrouse flew and landed in March 2016.

Savannah Environmental: EMVELO Pre-construction Report CSP2
P 24
7 QUANTIFYING THE IMPACTS
The Significance (S) of the impacts can be semi-quantified by independently assessing
the extent (E) of the impact in length or area, the duration (D) in months or years, the
expected Magnitude (M) in terms of its impact (minor to major) on the species likely to
be affected, and the probability (P) that the impact will occur. The significance can then
be calculated as S = (E+D+M)P ], as follows (Table 4).
Nature: The impact of the proposed CSP trough areas will generally be negative given
the certainty that: (i) ~410 ha will be transformed and the associated bird habitat
destroyed; (ii) birds may collide with the CSP mirrors if they mistakenly perceive them
as open water; and (iii) collision-prone species living around the periphery may collide
with any overhead power lines linking the solar development to the substation.
The Extent (E, from 1-5) of the impact will occur within the chosen CSP area (of 410
ha) = (1)
The Duration (D, from 1-5) will be long-term (4) for the lifetime of the CSP area.
The Magnitude (M, from 0-10) of the impact of the CSP areas is expected to have a
medium-high impact (7) for the two bustard species (that were probably breeding), and
lower for the raptors and wetland birds (4) korhaans (2).
Up to seven Ludwig’s Bustards and 1 Kori Bustard, and many smaller birds will be
displaced by habitat destruction of 410 ha on site. For any wetland birds, some (4) may
be killed by collision with the parabolic mirrors (Kagen et al. 2014). A Sociable Weaver
nest (photo 1) may also be lost during construction in the CSP area.
The Probability of occurrence (P, from 1-5) of the bustards having a negative
interaction with the CSP troughs is ranked high (5) because they will all be displaced by
habitat destruction during construction. For the non-threatened korhaans and raptors
the probability of occurrence is medium (3).
The Significance S, [calculated as S = (E+D+M)P ], is as follows (Table 4) for the
species identified as at risk in the (i) CSP site due to displacement or avoidance and (ii)
collision after construction.

Savannah Environmental: EMVELO Pre-construction Report CSP2
P 25
The scale varies from 0 (no significance) to 100 (highly significant and unacceptable). A
score above 50 is considered high and mitigation is required.
Table 4. A summary of the quantified impacts to the collision-prone bustards, raptors and wetland
bird species likely to be impacted by (i) displacement and avoidance and (ii) collision with the CSP
mirrors or associated infra-structure.
(i) Within the CSP site itself (DISPLACEMENT AND AVOIDANCE)
Nature: Mostly negative due to direct impact mortality (or displacement /avoidance of area) around
the CSP 2 for the Red-listed bird groups identified as at risk above.
(Bust = Bustards, Rapt = Raptors, Korh = Korhaans, WetB = Wetland birds):
Without mitigation With mitigation
Extent 1 1
Duration 4 4
Magnitude 7 (Bust) high
4 (Rapt) medium-low
4 (WetB) medium-low
2 (Korh) low
6 (Bust) medium-high
3 (Rapt) low
3 (WetB) low
1 (Korh) low
Probability 5 (Bust) high
3 (Rapt) medium
3 (WetB) medium
2 (Korh) low
4 (Bust) medium-high
2 (Rapt) low
2 (WetB) low
1 (Korh) low
Significance (E+D+M)P 60 (Bust) high
27 (Rapt) medium-low
27 (WetB), medium-low
14 (Korh) medium-low
44 (Bust) medium
16 (Rapt) low
16 (WetB) low
6 (Korh) low
Status (+ve or –ve) Negative Negative-Neutral
Reversibility Medium medium
Irreplaceable loss of species?
Yes, two red data species of bustard will lose foraging and
possible breeding areas and will disappear from the site.
Can impacts be mitigated?
Probably yes: by avoiding areas close to the highly sensitive sites
identified (Figure 4) bustards may return post-construction.
Savannah Environmental: EMVELO Pre-construction Report CSP2
P 26
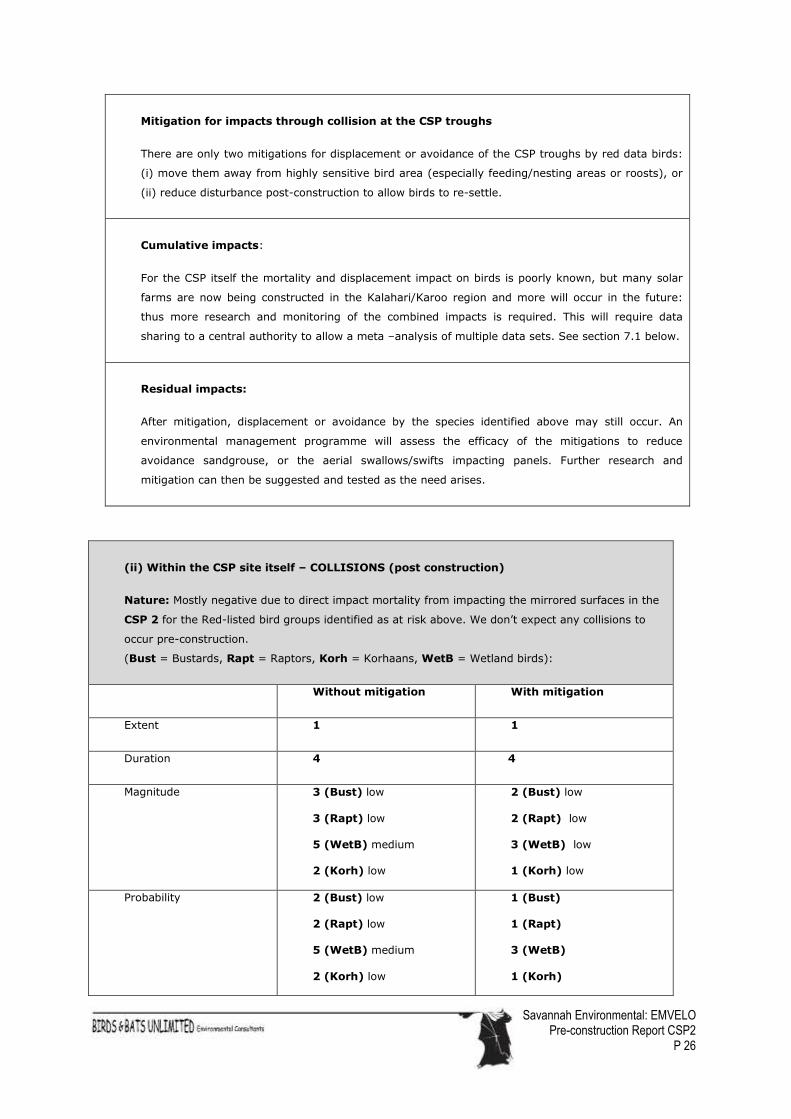
Mitigation for impacts through collision at the CSP troughs
There are only two mitigations for displacement or avoidance of the CSP troughs by red data birds:
(i) move them away from highly sensitive bird area (especially feeding/nesting areas or roosts), or
(ii) reduce disturbance post-construction to allow birds to re-settle.
Cumulative impacts:
For the CSP itself the mortality and displacement impact on birds is poorly known, but many solar
farms are now being constructed in the Kalahari/Karoo region and more will occur in the future:
thus more research and monitoring of the combined impacts is required. This will require data
sharing to a central authority to allow a meta –analysis of multiple data sets. See section 7.1 below.
Residual impacts:
After mitigation, displacement or avoidance by the species identified above may still occur. An
environmental management programme will assess the efficacy of the mitigations to reduce
avoidance sandgrouse, or the aerial swallows/swifts impacting panels. Further research and
mitigation can then be suggested and tested as the need arises.
(ii) Within the CSP site itself – COLLISIONS (post construction)
Nature: Mostly negative due to direct impact mortality from impacting the mirrored surfaces in the
CSP 2 for the Red-listed bird groups identified as at risk above. We don’t expect any collisions to
occur pre-construction.
(Bust = Bustards, Rapt = Raptors, Korh = Korhaans, WetB = Wetland birds):
Without mitigation With mitigation
Extent 1 1
Duration 4 4
Magnitude 3 (Bust) low
3 (Rapt) low
5 (WetB) medium
2 (Korh) low
2 (Bust) low
2 (Rapt) low
3 (WetB) low
1 (Korh) low
Probability 2 (Bust) low
2 (Rapt) low
5 (WetB) medium
2 (Korh) low
1 (Bust)
1 (Rapt)
3 (WetB)
1 (Korh)

Savannah Environmental: EMVELO Pre-construction Report CSP2
P 27
7.1 CUMULATIVE IMPACTS
Cumulative impacts are defined as “Impacts that result from incremental changes caused by either
past, present or reasonably foreseeable actions together with the project” (Hyder, 1999, in Masden
Significance (E+D+M)P 16 (Bust) low
16 (Rapt) low
50 (WetB), medium
14 (Korh) low
7 (Bust) low
7 (Rapt) low
24 (WetB) low
6 (Korh) low
Status (+ve or –ve) Negative Neutral
Reversibility Medium (mitigations untested)
Irreplaceable loss of species?
No, few red data species expected to collide with mirrors. It
depends entirely whether wetland species (or other African
species) are attracted to and collide with the mirrors.
Can impacts be mitigated?
Probably yes: the use of bird scaring strategies on the site will
probably deter species from interacting negatively.
Mitigation for impacts for the CSP troughs
There are two classes of mitigation for the CSP troughs: (i) move them away from highly sensitive
bird area (especially pans or other nests or roosts), or (ii) employ bird-diverters to deter birds
mistaking the troughs for open water.
We recommend that Emvelo install video cameras above some troughs for post-construction
monitoring of any mortality of birds in the vicinity, through direct observation and carcass searches
in a systematic and regular fashion.
Cumulative impacts:
For the CSP itself the collision-mortality of birds is poorly known, but many solar farms are now
being constructed in the Kalahari/Karoo region and more will occur in the future: thus more
research and monitoring of the combined impacts is required. See 7.1 below.
Residual impacts:
After mitigation, direct mortality through collision by the species identified above may still occur. An
environmental management programme will assess the efficacy of the mitigations to reduce direct
impacts or any problems with sandgrouse, or the aerial swallows/swifts impacting panels. Further
research and mitigation can then be suggested and tested as the need arises.

Savannah Environmental: EMVELO Pre-construction Report CSP2
P 28
et al. 2010).
Thus, in this context, cumulative impacts are those that will impact the general avian communities in
and around the Karoshoek solar development, mainly by other solar farms and associated
infrastructure. This will happen via the same factors identified here viz: collision, avoidance and
displacement. Therefore, we need to know as a starting point the number of solar farms around the
region within 50 km, and secondly, to know their impact on avifauna.
Figure 5: The location and extent of all other solar farm developments in the Karos/Upington area (as
supplied by Savannah Environmental) in 2016.
There are four proposed or approved solar farms of various sizes within 50 km of
Karoshoek (Figure 5).
Given the general assumption that footprint size and bird impacts are linearly related for
CSP solar farms, a starting point in determining cumulative impacts is to determine:
the number of bird displaced per unit area, by habitat destruction, or disturbed or
displaced by human activity;

Savannah Environmental: EMVELO Pre-construction Report CSP2
P 29
the number of birds killed by collision with the structures on site;
the number of birds killed by collision with infrastructure leading away from the
site;
the number of birds killed by flying through the solar flux of CSP tower sites.
Because there are no post-construction mortality data or displacement data for any of
these aspects in South Africa, it is a futile exercise to attempt to put any figures to the
Cumulative Impacts for birds in and around the Orange River’s solar farms. Once the
data is collected and published (or released to other specialists) we can quantify this
aspect.
Orange River water off–take rates are considerations already under investigation by
hydrologists. However, the influence on the Orange River’s wetland birds, which use the
river as a linear oasis (Simmons & Allan 2002), needs to be assessed. This arises
because the Orange River flow is reduced at certain times of year to very low rates. But
at all times no less than 20% of the flow is required as an ecological reserve to maintain
ecological functioning of the river (http://orangesenqurak.com/challenge/water+demand
/environmental+flows.aspx). Further off-take amounting to a possible 640 000 m3, (8 CSP
sites x 80 000 m2) particularly at low flow (November-December) may force some
wetland species to seek other water sources. This may become an issue for the CSPs and
the bank of mirrored surfaces that will be in the environment surrounding the river
environs. If the Lake Effect of Kagen et al. (2014) attracts such water-seeking wetland
birds then the large off-take of water from the Orange River may exacerbate this effect.
We would predict:
a seasonal influx of wetland birds attracted to the CSPs in the dry season and an
increase in mortality;
greater mortality with time, as more and more solar developments take more and
more water away at low-flow periods.
A simple calculation of the Cumulative Impact of this would be related to:
the rate of avian mortality per surface area of the mirrored surfaces of the CSPs
per year;
the total surface area of the mirrored surfaces of each CSP in the area;
the reduction in flow of the Orange River causing more birds to seek other water
sources; and
the number of solar farms within 30 km of the Karoshoek site.

Savannah Environmental: EMVELO Pre-construction Report CSP2
P 30
In 2016 we cannot yet quantify all of these variables, so a prediction of Cumulative
Impact is not possible. Data gathering and sharing over even just one 12-month period,
of one or more solar farms, will allow us to determine impacts on Orange River avifauna.
8 ENVIRONMENTAL MANAGEMENT PLAN
Given the size and number of the CSP plants proposed for the total Karoshoek Solar
Valley Development, the overall impact on the avifauna species requires systematic
monitoring at both the construction and post-construction phases. This is a
recommendation of the draft BARESG guidelines (Jenkins et al. 2015).
The guidelines suggest an adaptive and systematic monitoring of bird displacement
(comparing avian densities before and after construction, particularly for collision-prone
and red data species) and all fatalities. The latter must take account of biases introduced
by scavengers removing carcasses and human observers not detecting bird remains.
The monitoring should include the following (after Jenkins et al. 2015):
Post-construction monitoring should be started as the facility becomes
operational, bearing in mind that the effects of the CSP facility may change over
time;
Post-construction monitoring can be divided into two categories: a) quantifying
bird numbers and movements (replicating baseline data collection), and b)
estimating bird mortalities;
Estimating bird fatality rates includes: a) estimation of searcher efficiency and
scavenger removal rates, b) carcass searches, and c) data analysis incorporating
systematically collected data from a and b;
A minimum of 20-30% of the CSP solar footprint should be methodically searched
for fatalities, with a search interval informed by scavenger removal trials and
objective monitoring. Any evidence of mortalities or injuries within the remaining
area should be recorded and included in reports as incidental finds;
The search area should be defined and consistently applied throughout
monitoring;
Observed mortality rates must be adjusted to account for searcher efficiency
(which is likely to change seasonally depending on vegetative condition of the

Savannah Environmental: EMVELO Pre-construction Report CSP2
P 31
site), scavenger removal and the proportion of the facility covered by the
monitoring effort. Some of these factors may change seasonally due to the
breeding season of scavengers and whether visibility of the survey area changes
through the year;
The duration and scope of post-construction monitoring should be informed by
the outcomes of the previous year’s monitoring, and reviewed annually;
Post-construction monitoring of bird abundance and movements and fatality
surveys should span 2-3 years to take inter-annual variation into account;
If significant problems are found or suspected, the post-construction monitoring
should continue as needed in conjunction with adaptive management and
mitigations, taking into account the risks related to the particular site and species
involved.
A comprehensive assessment guided by the principles above is required not only to
enact and experiment with different mitigation measures where significant mortality is
found, but to allow data to be collected that will benefit the welfare of avifauna at other
solar farms. This will also be important for a study of cumulative avian impacts for the
large number of solar farms planned for the Northern Cape of South Africa.
Management interventions: Where avian fatalities are found to occur (i) to red-data
species, or (ii) at unacceptably high levels, to these or other species, then mitigation
measures should be brought into play. Thus, experiments with bird deterrent techniques
such as Torri Lines, successfully used to prevent albatrosses and petrels descending onto
baited hooks behind trawlers at sea, can be tried and tested
(http://www.birdlife.org.za/conservation/seabird-conservation/albatross-task-force).
Bird-scaring prisms are also an option that can be tested. Where natural or artificial pans
occur and attract wetland species that are then killed by the CSP mirrors, action to close
down the pan or dam will then be required. (Avoiding construction around natural pans
beforehand is recommended to avoid such action).
Savannah Environmental: EMVELO Pre-construction Report CSP2
P 32
9 CONCLUSIONS AND RECOMMENDATIONS
The proposed CSP 2 plant in the Karoshoek Solar Valley Development, near Upington, is
one of many such renewable energy initiatives being proposed for this high-flux solar
radiation region of South Africa.
The avifauna of the area may be affected by the infrastructure of the Solar Power (CSP)
plant and our analysis of the number of collision-prone birds on CSP 2 suggests that:
both threatened bustards and some wetland birds may be impacted. The
significance for displacement and avoidance will be high for the two species of
bustards which may be breeding on site;
mitigation measures include avoiding the high sensitivity areas identified;
for the wetland birds, korhaans and raptors the significance is lower because
they are less collision-prone and less threatened;
the presence of Sociable Weavers and one nest in CSP 2 suggests that these
species may transfer their massive nest from natural sites to the CSP
infrastructure and is of medium significance;
sandgrouse, which were very numerous on site, are unlikely to react to mirrored
surfaces as they do not land on water;
a structured and systematic construction and post-construction assessment, as
laid out in the Environmental Management Programme (above) by trained
ornithologists will determine the impacts and provide appropriate mitigations.
Precious little research in South Africa is presently available to determine the impact of
CSP trough and tower technology on the South African avian community, so a minimum
of 12 months’ post-construction monitoring at this site by trained ornithologists is
strongly recommended.
We also recommend that all available precautions are taken to avoid threatened species
and wetland birds being attracted to the troughs. If species are attracted and collide with
the CSP troughs by mistaking them for open water then we recommend that innovative
bird deterrent techniques are used, such as the Torri lines mentioned above and in the
avian Scoping Report (Simmons and Martins 2015).
If these recommendations can be followed and prove effective, we believe that the
Ilanga CSP 2 development can be allowed to proceed with the least impact to the
avifauna of the area.
Savannah Environmental: EMVELO Pre-construction Report CSP2
P 33
10 REFERENCES
Allan DG Osborne TE. 2005. Kori Bustard Ardeotis kori In: Hockey, P.A.R., Dean, W.R.J., Ryan, P.G. (Eds) 2005.
Roberts – Birds of Southern Africa, VIIth ed. The Trustees of the John Voelcker Bird Book Fund, Cape Town.
BARESG 2014. Ranking of top collision-prone species in South Africa. Birdlife South Africa, unpubl report.
Barnes, K.N. (ed.) 1998. The Important Bird Areas of southern Africa. BirdLife South Africa, Johannesburg.
Birds Unlimited 2014. Avian assessment of proposed 30 km power line from Upington to the Ilanga CSP
facility, Northern Cape. Unpubl report to Savannah Environmental, Johannesburg.
Dean W.R.J. 2004. Nomadic Desert Birds. Adaptations of Desert Organisms series. Springer Verlag, Berlin,
Heidelberg,
Dean WRJ, Barnard PE Anderson MD 2009. When to stay, when to go: trade-offs for southern African arid-
zone birds in times of drought. S Af J Science 105:24-28.
Harrison, J.A., Allan, D.G., Underhill, L.G., Herremans, M., Tree, A.J., Parker, V & Brown, C.J. (eds). 1997. The
atlas of southern African birds. Vol. 1&2. BirdLife South Africa, Johannesburg.
Henry DAW, Ament JM Cumming GS. 2016. Exploring the environmental drivers of waterfowl movement in
arid landscapes using first-passage time analysis. Movement Ecology 4:8 DOI 10.1186/s40462-016-0073-x
Hockey, P.A.R., Dean, W.R.J., Ryan, P.G. (Eds) 2005. Roberts – Birds of Southern Africa, VIIth ed. The trustees
of the John Voelcker Bird Book Fund, Cape Town.
Jenkins AR, Smallie JJ, Diamond M. 2010. Avian collisions with power lines: a global review of causes and
mitigation with a South African perspective. Bird Conservation International 20: 263 – 278.
Jenkins AR, Ralston
S, Smit-Robinson HA. 2015. Birds and Solar Energy: Best Practice Guidelines for assessing
and monitoring the impact of solar energy facilities on birds in southern Africa. Birdlife South Africa,
Johannesburg
Kagan RA, Verner TC, Trail PW, Espinoza EO. 2014. Avian mortality at solar energy facilities in southern
California: a preliminary analysis. Unpublished report National Fish & Wildlife Forensics Laboratory, USA .
Lloyd P. 1999. Rainfall as a breeding stimulus and clutch size determinant in South African arid-zone birds. Ibis
141, 637–643.
Martin GR, Shaw JM 2010. Bird collisions with power lines: Failing to see the way ahead? Biological
Conservation 143: 2695–2702.
Mucina. L. & Rutherford, M.C. (Eds) 2006. The vegetation of South Africa, Lesotho and Swaziland. Strelitzia 19.
South African National Biodiversity Institute, Pretoria, RSA.
Retief E. et al. 2012. Birds and wind farm map. http://www.birdlife.org.za/conservation/terrestrial-bird-
conservation/birds-and-renewable-energy/wind-farm-map
Shaw, J., Jenkins, A.R. Allan D & Ryan, P.G. 2015. Population size and trends of Ludwig’s BustardNeotis
ludwigii and other large terrestrial birds. in the Karoo, South Africa. Bird Conservation International, page 1
of 18.
Simmons RE, Martins M. 2015. Avian Impact Assessment for the proposed Savannah Environmental Emvelo
Solar Power CSP Plant at Karoshoek, near Upington, Northern Cape- Scoping Report. Unpubl report to

Savannah Environmental: EMVELO Pre-construction Report CSP2
P 34
Savannah Environmental, Birds & Bats Unlimited, Cape Town.
Simmons R.E., Barnard P. and Jamieson I.G. 1999. What precipitates influxes of wetland birds to ephemeral
pans in arid landscapes? Observations from Namibia. Ostrich 70, 145–148. African National Biodiversity
Institute, Pretoria, RSA.
Spottiswoode C. 2005. Sociable Weaver In: Hockey, P.A.R., Dean, W.R.J., Ryan, P.G. (Eds) 2005. Roberts – Birds
of Southern Africa, VIIth ed. The Trustees of the John Voelcker Bird Book Fund, Cape Town
Taylor M, Peacock F, Wanless R. (eds.) 2015. The Eskom red data book of birds of South Africa, Lesotho and
Swaziland. Birdlife South Africa.
Todd, S. 2012 Proposed Karoshoek Solar Valley Development: Fauna and Flora Specialist Impact Assessment
Report. Unpubl report to Savannah Environmental, Johannesburg
Walston, LJ., Rollins KE, Smith KP, LaGory KE, Sinclair K, Turchi C, Wendelin T Souder H. 2014. A Review of
Avian Monitoring and Mitigation Information at Existing Utility-Scale Solar Facilities Unpublished report by
Argonne National Laboratory, USA for U.S. Department of Energy, SunShot Initiative and Office of Energy
Efficiency & Renewable Energy.
Dr R.E. Simmons and M Martins
Birds & Bats Unlimited
www.birds-and-bats-unlimited.com
11 April 2016
Revised: 17 April 2016

Savannah Environmental: EMVELO Pre-construction Report CSP2
P 35
11 APPENDICES
APPENDIX 1. ALL BIRD SPECIES RECO RDED AROUND THE KAROSHOEK
SOLAR DEVELOPMENT
All bird species and their likelihood of occurrence in the greater Karoshoek solar development area, from the
bird atlas pentads that run along the Ilanga power line to the CSP site. These pentads are: 2825_2115,
2825_2120, 2825_2125, 2825_2130 from the period 2007 to 2013. Extracted from the Animal Demography
Unit, University of Cape Town website http://sabap2.adu.org.za and based on 17 cards. Red data species are
given in red, collision-prone species in bold. Blue shading indicates wetland species that may be attracted to
the parabolic mirrors.
Note: this list includes pentads that overlap the Orange River inflating the number of species that will occur in
the drier footprint of the Karoshoek solar development. We have added our species records in the last column,
which includes no Orange River areas.
Species Pentads/4 Records Total cards Reporting Rate %
Recorded in our site visits in Karos solar park
Ostrich, Common 1 1 17 5.9 √
Grebe, Little 1 2 17 11.8
Cormorant, White-breasted 2 6 17 35.3
Cormorant, Reed 3 6 17 35.3
Darter, African 2 7 17 41.2
Heron, Grey 1 4 17 23.5
Heron, Black-headed 1 1 17 5.9
Heron, Goliath 1 1 17 5.9 √
Egret, Little 1 4 17 23.5
Egret, Cattle 3 10 17 58.8
Bittern, Little 1 1 17 5.9
Hamerkop 2 8 17 47.1
Stork, Abdim's 1 1 17 5.9
Ibis, African Sacred 3 5 17 29.4 √
Ibis, Hadeda 3 16 17 94.1
Goose, Egyptian 2 11 17 64.7 √
Shelduck, South African 2 2 17 11.8
Duck, African Black 1 1 17 5.9
Duck, Yellow-billed 1 1 17 5.9
Teal, Cape 1 1 17 5.9
Red-billed Teal √
Harrier, Black √
Eagle, Verreaux’s √
Eagle, Booted √
Falcon, Lanner 1 1 17 5.9 √
Kestrel, Rock √
Falcon, Pygmy 1 1 17 5.9 √
Kite, Black-shouldered 2 4 17 23.5

Savannah Environmental: EMVELO Pre-construction Report CSP2
P 36
Fish-Eagle, African 2 6 17 35.3
Pale-chanting Goshawk 1 1 17 5.9 √
Guineafowl, Helmeted 2 8 17 47.1
Common Quail √
Crake, Black 1 1 17 5.9
Moorhen, Common 1 1 17 5.9
Bustard, Kori 1 1 17 5.9 √
Bustard, Ludwig’s √
Korhaan, Karoo 1 1 17 5.9 √
Northern Black Korhaan 1 2 17 11.8 √
Plover, Three-banded 2 4 17 23.5
Lapwing, Crowned 1 5 17 29.4
Lapwing, Blacksmith 3 9 17 52.9 √
Sandgrouse, Namaqua 2 2 17 11.8 √
Double-banded Courser √
Pigeon, Speckled 3 16 17 94.1
Dove, Red-eyed 3 13 17 76.5
Turtle-Dove, Cape 3 14 17 82.4 √
Dove, Laughing 3 15 17 88.2 √
Dove, Namaqua 1 3 17 17.6 √
Cuckoo, Diderick 1 3 17 17.6
Owl, Barn 1 3 17 17.6
Owlet, Pearl-spotted 1 1 17 5.9
Eagle-Owl, Spotted 1 1 17 5.9 √
Common Swift √
Swift, White-rumped 2 3 17 17.6
Swift, Little 3 12 17 70.6 √
Palm-Swift, African 2 12 17 70.6
Mousebird, White-backed 3 14 17 82.4 √
Mousebird, Red-faced 1 8 17 47.1 √
Kingfisher, Pied 2 5 17 29.4
Kingfisher, Giant 2 4 17 23.5
Kingfisher, Malachite 2 3 17 17.6
Kingfisher, Striped 1 1 17 5.9
Bee-eater, European 1 2 17 11.8
Bee-eater, Swallow-tailed 3 4 17 23.5
Hoopoe, African 2 10 17 58.8
Barbet, Black-collared 1 1 17 5.9
Barbet, Acacia Pied 3 4 17 23.5 √
Barbet, Crested 3 9 17 52.9
Honeyguide, Lesser 1 2 17 11.8
Shrike, Lesser Grey √
Woodpecker, Golden-tailed 1 3 17 17.6
Lark, Fawn-coloured 1 2 17 11.8 √

Savannah Environmental: EMVELO Pre-construction Report CSP2
P 37
Lark, Sabota 3 4 17 23.5 √
Lark, Spike-heeled 2 2 17 11.8 √
Stark’s Lark √
Swallow, Barn 2 4 17 23.5 √
Swallow, White-throated 1 6 17 35.3
Swallow, Greater Striped 2 10 17 58.8 √
Martin, Rock 3 6 17 35.3 √
Martin, Brown-throated 3 8 17 47.1
Tit, Ashy 1 1 17 5.9
Crow, Pied 1 4 17 23.5 √
Bulbul, African Red-eyed 3 16 17 94.1
Rock-Thrush, Short-toed 1 1 17 5.9
Wheatear, Capped 1 1 17 5.9 √
Chat, Ant-eating √
Chat, Karoo √
Chat, Familiar 3 3 17 17.6
Robin-Chat, Cape 3 12 17 70.6
Scrub-Robin, Karoo 3 5 17 29.4 √
Kalahari Scrub Robin √
Swamp-Warbler, Lesser 2 5 17 29.4
Reed-Warbler, African 2 3 17 17.6
Eremomela, Yellow-bellied √
Warbler, Rufous-eared 1 4 17 23.5 √
Cisticola, Zitting 3 6 17 35.3
Cisticola, Levaillant's 3 4 17 23.5
Cisticola, Desert √
Prinia, Black-chested 3 8 17 47.1 √
Warbler, Namaqua 1 1 17 5.9 √
Tit-Babbler, Chestnut-vented 2 2 17 11.8 √
Tit-babbler, Layard’s √
Flycatcher, Chat √
Flycatcher, Fiscal 3 3 17 17.6
Batis, Pririt 3 4 17 23.5
Wagtail, African Pied 1 1 17 5.9
Wagtail, Cape 2 13 17 76.5 √
Pipit, African 2 3 17 17.6
Fiscal, Common 2 11 17 64.7 √
Bokmakierie, 2 4 17 23.5 √
Brubru 1 3 17 17.6
Starling, Wattled 2 9 17 52.9
Starling, Cape Glossy 3 4 17 23.5
Sunbird, Dusky 3 5 17 29.4 √
Sparrow-Lark, Grey-backed √
Sparrow-Lark, Black-eared √

Savannah Environmental: EMVELO Pre-construction Report CSP2
P 38
Sparrow-Weaver, White-browed 2 9 17 52.9 √
Weaver, Sociable 3 5 17 29.4 √
Sparrow, House 3 13 17 76.5
Sparrow, Cape 3 13 17 76.5 √
Masked-Weaver, Southern 3 15 17 88.2 √
Quelea, Red-billed 3 6 17 35.3 √
Bishop, Southern Red 2 9 17 52.9
Firefinch, Red-billed 2 4 17 23.5
Finch, Scaly-feathered √
Waxbill, Common 2 2 17 11.8
Whydah, Pin-tailed 1 4 17 23.5
Canary, Black-headed √
Canary, Black-throated 2 6 17 35.3
Canary, Yellow 2 3 17 17.6 √
White-throated Canary √
Dove, Rock 3 8 17 47.1
Thrush, Karoo 1 13 17 76.5
White-eye, Orange River 3 15 17 88.2
Lark, Eastern Clapper 1 1 17 5.9 √
Coucal, Burchell's 1 3 17 17.6
Sparrow, Southern Grey-headed 2 3 17 17.6
Bunting, Lark-like √

Savannah Environmental: EMVELO Pre-construction Report CSP2
P 39
APPENDIX 2: BIRD DENSITIES BY HABITAT
Species recorded on site in 1-km transects on the Karoshoek Solar Valley Development CSP 2 in
November 2015 and March 2016.
Dry Season (Nov2015)
Species Number PerpDist Date Transect Habitat
Northern black korhaan 1 220 31/10/2015 KT1.3-1 Open grassy plain
Stark's lark 25 10 31/10/2015 KT1.3-1 Open grassy plain
Sabota lark 1 30 31/10/2015 KT1.3-1 Open grassy plain
Stark's lark 2 35 31/10/2015 KT1.3-1 Open grassy plain
Larklike bunting 2 20 31/10/2015 KT1.3-1 Open grassy plain
Spike-heeled lark 5 20 31/10/2015 KT1.3-1 Open grassy plain
Namaqua sandgrouse 3 300 31/10/2015 KT1.3-1 Open grassy plain
Chat flycatcher 1 40 31/10/2015 KT1.3-1 Open grassy plain
7 species 40 birds In this trans: Red Data species = 0, Collision-prone species = 1
Stark's lark 1 15 01/11/2015 KT1.3-2 Dry river, Rhigozum
Sabota lark 1 25 01/11/2015 KT1.3-2 Dry river, Rhigozum
Rufous-eared warbler 1 25 01/11/2015 KT1.3-2 Dry river, Rhigozum
Yellow canary 1 45 01/11/2015 KT1.3-2 Dry river, Rhigozum
Little swift 2 90 01/11/2015 KT1.3-2 Dry river, Rhigozum
Spike-heeled lark 3 60 01/11/2015 KT1.3-2 Dry river, Rhigozum
Yellow-bellied eremomela 2 65 01/11/2015 KT1.3-2 Dry river, Rhigozum
Chat flycatcher 1 50 01/11/2015 KT1.3-2 Dry river, Rhigozum
Sociable weaver 30 80 01/11/2015 KT1.3-2 Dry river, Rhigozum
Yellow canary 1 30 01/11/2015 KT1.3-2 Dry river, Rhigozum
Yellow canary 2 80 01/11/2015 KT1.3-2 Dry river, Rhigozum
Ant-eating chat 1 170 01/11/2015 KT1.3-2 Dry river, Rhigozum
Ant-eating chat 1 20 01/11/2015 KT1.3-2 Dry river, Rhigozum
Rock kestrel 1 200 01/11/2015 KT1.3-2 Dry river, Rhigozum
Fawn-coloured lark 1 35 01/11/2015 KT1.3-2 Dry river, Rhigozum
11 species 49 birds In this trans: Red Data species = 0, Collision-prone species = 1
Total Birds 89
Total Species 14
Total Collision-prone sp 2 Northern Black Korhaan; Rock Kestrel
Total Red-data Species 0
Summary (DRY) Species Birds Habitat
KT5-1 7 40 Open grassy plain
KT5-2 11 49 Dry river, Rhigozum
Means 9.00 44.50
Wet Season (Mar2016) Number PerpDist Date Transect Habitat
Northern black korhaan 1 300 29/02/2016 KT1.3-1 Open grassy plain
Cape turtle dove 1 150 29/02/2016 KT1.3-1 Open grassy plain
Sabota lark 1 70 29/02/2016 KT1.3-1 Open grassy plain
Acacia pied barbet 1 60 29/02/2016 KT1.3-1 Open grassy plain
African black swift 3 50 29/02/2016 KT1.3-1 Open grassy plain
Karoo korhaan 2 90 29/02/2016 KT1.3-1 Open grassy plain

Savannah Environmental: EMVELO Pre-construction Report CSP2
P 40
Grey-backed sparrowlark 2 40 29/02/2016 KT1.3-1 Open grassy plain
Northern black korhaan 1 400 29/02/2016 KT1.3-1 Open grassy plain
Sabota lark 1 60 29/02/2016 KT1.3-1 Open grassy plain
Barn Swallow 3 50 29/02/2016 KT1.3-1 Open grassy plain
Eremomela spp 2 30 29/02/2016 KT1.3-1 Open grassy plain
Grey-backed sparrowlark 2 50 29/02/2016 KT1.3-1 Open grassy plain
Spike-heeled lark 2 40 29/02/2016 KT1.3-1 Open grassy plain
Rufous-eared warbler 2 50 29/02/2016 KT1.3-1 Open grassy plain
Namaqua dove 2 45 29/02/2016 KT1.3-1 Open grassy plain
Grey-backed sparrowlark 1 10 29/02/2016 KT1.3-1 Open grassy plain
Namaqua sandgrouse 2 80(30) 29/02/2016 KT1.3-1 Open grassy plain
Bokmakierie 2 200 29/02/2016 KT1.3-1 Open grassy plain
Barn Swallow 1 50 29/02/2016 KT1.3-1 Open grassy plain
Sabota lark 1 30 29/02/2016 KT1.3-1 Open grassy plain
Namaqua dove 3 80 29/02/2016 KT1.3-1 Open grassy plain
Namaqua sandgrouse 1 180 29/02/2016 KT1.3-1 Open grassy plain
Sabota lark 1 70 29/02/2016 KT1.3-1 Open grassy plain
Grey-backed sparrowlark 1 10 29/02/2016 KT1.3-1 Open grassy plain
Sabota lark 1 40 29/02/2016 KT1.3-1 Open grassy plain
14 species 40 birds In this trans: Red Data species = 0, Collision-prone species = 2
Common quail 1 20 29/02/2016 K1.3 pan At pan near VP1.3
Goliath heron 1 20 29/02/2016 K1.3 pan At pan near VP1.3
Namaqua sandgrouse 236 20 29/02/2016 K1.3 pan At pan near VP1.3
Blacksmith lapwing 2 20 29/02/2016 K1.3 pan At pan near VP1.3
Red-billed teal 6 20 29/02/2016 K1.3 pan At pan near VP1.3
Sacred ibis 2 20 29/02/2016 K1.3 pan At pan near VP1.3
Egyptian goose 2 20 29/02/2016 K1.3 pan At pan near VP1.3
6 species 250 birds In this trans: Red Data species = 0, Collision-prone species = 1
Northern black korhaan 1 200 02/03/2016 KT1.3-2 Dry river, Rhigozum
Northern black korhaan 1 170 02/03/2016 KT1.3-2 Dry river, Rhigozum
Grey-backed sparrow-weaver 1 12 02/03/2016 KT1.3-2 Dry river, Rhigozum
Karoo korhaan 2 200 02/03/2016 KT1.3-2 Dry river, Rhigozum
Grey-backed sparrow-weaver 1 40 02/03/2016 KT1.3-2 Dry river, Rhigozum
Rufous-eared warbler 1 60 02/03/2016 KT1.3-2 Dry river, Rhigozum
Cape clapper lark 1 50 02/03/2016 KT1.3-2 Dry river, Rhigozum
Cape turtle dove 1 110 02/03/2016 KT1.3-2 Dry river, Rhigozum
Grey-backed sparrow-weaver 2 40 02/03/2016 KT1.3-2 Dry river, Rhigozum
Cape clapper lark 1 55 02/03/2016 KT1.3-2 Dry river, Rhigozum
Barn swallow 1 10 02/03/2016 KT1.3-2 Dry river, Rhigozum
Spike-heeled lark 2 5 02/03/2016 KT1.3-2 Dry river, Rhigozum
Chat flycatcher 1 50 02/03/2016 KT1.3-2 Dry river, Rhigozum
Fawn-coloured lark 1 60 02/03/2016 KT1.3-2 Dry river, Rhigozum
Yellow canary 1 35 02/03/2016 KT1.3-2 Dry river, Rhigozum
Barn Swallow 1 30 02/03/2016 KT1.3-2 Dry river, Rhigozum
Ant-eating chat 1 70 02/03/2016 KT1.3-2 Dry river, Rhigozum
Barn swallow 2 15 02/03/2016 KT1.3-2 Dry river, Rhigozum
Spike-heeled lark 2 15 02/03/2016 KT1.3-2 Dry river, Rhigozum

Savannah Environmental: EMVELO Pre-construction Report CSP2
P 41
Karoo korhaan 2 250 02/03/2016 KT1.3-2 Dry river, Rhigozum
Namaqua sandgrouse 1 90 02/03/2016 KT1.3-2 Dry river, Rhigozum
Rufous-eared warbler 1 0 02/03/2016 KT1.3-2 Dry river, Rhigozum
Little swift 1 45 02/03/2016 KT1.3-2 Dry river, Rhigozum
Spike-heeled lark 1 30 02/03/2016 KT1.3-2 Dry river, Rhigozum
Capped wheatear 1 95 02/03/2016 KT1.3-2 Dry river, Rhigozum
Northern black korhaan 1 220 02/03/2016 KT1.3-2 Dry river, Rhigozum
Barn swallow 1 20 02/03/2016 KT1.3-2 Dry river, Rhigozum
Larklike bunting 1 40 02/03/2016 KT1.3-2 Dry river, Rhigozum
Fawn-coloured lark 1 45 02/03/2016 KT1.3-2 Dry river, Rhigozum
Scaly-feathered finch 1 45 02/03/2016 KT1.3-2 Dry river, Rhigozum
Cape clapper lark 1 50 02/03/2016 KT1.3-2 Dry river, Rhigozum
Grey-backed sparrow-weaver 2 30 02/03/2016 KT1.3-2 Dry river, Rhigozum
Barn swallow 1 10 02/03/2016 KT1.3-2 Dry river, Rhigozum
Rufous-eared warbler 1 50 02/03/2016 KT1.3-2 Dry river, Rhigozum
Fawn-coloured lark 1 15 02/03/2016 KT1.3-2 Dry river, Rhigozum
Spike-heeled lark 2 12 02/03/2016 KT1.3-2 Dry river, Rhigozum
Barn swallow 1 5 02/03/2016 KT1.3-2 Dry river, Rhigozum
Fawn-coloured lark 1 18 02/03/2016 KT1.3-2 Dry river, Rhigozum
Barn swallow 1 10 02/03/2016 KT1.3-2 Dry river, Rhigozum
Rufous-eared warbler 1 70 02/03/2016 KT1.3-2 Dry river, Rhigozum
Common fiscal 1 160 02/03/2016 KT1.3-2 Dry river, Rhigozum
Barn swallow 1 110 02/03/2016 KT1.3-2 Dry river, Rhigozum
Grey-backed sparrow-weaver 1 10 02/03/2016 KT1.3-2 Dry river, Rhigozum
Namaqua dove 1 90 02/03/2016 KT1.3-2 Dry river, Rhigozum
Bokmakierie 1 120 02/03/2016 KT1.3-2 Dry river, Rhigozum
Namaqua sandgrouse 1 130 02/03/2016 KT1.3-2 Dry river, Rhigozum
Grey-backed sparrow-weaver 3 50 02/03/2016 KT1.3-2 Dry river, Rhigozum
Little swift 1 40 02/03/2016 KT1.3-2 Dry river, Rhigozum
20 species 58 birds In this trans: Red Data species = 0, Collision-prone species = 2
Total Birds 348
Total Species 30
Total Collision-prone sp 2 Northern Black Korhaan; Karoo Korhaan
Total Red-data Species 0
Summary (WET) Species Birds Habitat
KT1.3-1 14 40 Open grassy plain
KT1.3 pan 6 250 At pan near VP1.3
KT1.3-2 20 58 Dry river, Rhigozum
Means 17.00 116.00
Overall Mean 13 87.4

Savannah Environmental: EMVELO Pre-construction Report CSP2
P 42
APPENDIX 3: PASSAGE RATES OF COLLISION-PRONE SPECIES
Date Time Obsv period Hrs
Vantage Point No. Species
GPS pos on map Height
Flight duration
(seconds)
31/10/2015 07h10 07h30-11h30 4 VP1.3-1 1 Ludwig's bustard LB7 1m 105s
07h15 2 Northern black korhaan NBK14-15 10m 30s
01/11/2015 07h09 07h00-13h00 6 VP1.3-2 1 Ludwig's bustard LB8 10m 60s
07h37 2 Namaqua sandgrouse NS82-83 15m 20s
09h38 6 Namaqua sandgrouse NS84-89 5m 30s
06/11/2015 14h15-16h15 2 VP1.3-3 No Birds
12 TOTALS 4 Birds 3 Species
Passage rate: 4 birds
in 12 hr 0.33 birds/hr
Date Time Obsv period Hrs
Vantage Point No. Species
GPS pos on map Height
Flight duration
(seconds)
29/02/2016 08h45 06h45-12h45 6 VP1.3-1 1 Namaqua sandgrouse NS205 25-25-25m 30
09h14 2 Namaqua sandgrouse NS206-207 30-30-20m 30
09h35 1 Namaqua sandgrouse NS208 35-35-35m 35
10h01 1 Northern black korhaan NBK12 15-20-20m 40
02/03/2016 06h45 06h50-12h50 6 VP1.3-2 1 Northern black korhaan NBK13 12-15-15m 30
07h58 1 Namaqua sandgrouse NS209 70-80-80m 30
07h59 8 Namaqua sandgrouse NS210-217 30-30-30-25-25-15m 75
08h01 2 Namaqua sandgrouse NS218-219 0-5-5m 30
08h02 3 Namaqua sandgrouse NS220-222 25-25-25m 30
08h05 4 Namaqua sandgrouse NS223-226 30-30-30m 30
08h06 2 Namaqua sandgrouse NS227-228 40-45m 5
08h08 1 Namaqua sandgrouse NS229 50-50-50-50m 45
08h12 4 Namaqua sandgrouse NS230-233 25-25-20-5m 45
08h16 2 Namaqua sandgrouse NS234-235 20-20-20-5m 45
08h17 3 Namaqua sandgrouse NS236-238 20-20-15-2m 30
08h20 9 Namaqua sandgrouse NS239-247 50-60-60-60m 55
08h24 4 Namaqua sandgrouse NS248-251 40-40-40-40-40-35-35-
30m 110
08h30 3 Namaqua sandgrouse NS252-254 15-20-20-20-15m 65
08h34 1 Namaqua sandgrouse NS255 15-15m 20
08h51 1 Northern black korhaan NBK14 20-20m 20

Savannah Environmental: EMVELO Pre-construction Report CSP2
P 43
09h01 3 Namaqua sandgrouse NS256-258 20-20-5m 30
09h06 3 Namaqua sandgrouse NS259-261 15-15-15m 40
09h10 1 Namaqua sandgrouse NS262 50-50m 20
10h15 3 Namaqua sandgrouse NS263-265 50-50-50-50m 60
12 TOTALS 3 Birds 2 Species
64 birds in total
Passage rate: 3 birds
in 12 hr 0.25 birds/hr
Average of the two (dry + wet ) 0.29167