Embed Size (px)
Citation preview

September 2012
Final Phase 1 Technical Report DOE Award No. DE-OE0000196 and NYSERDA 11052
Seneca Compressed Air Energy Storage (CAES) Project

Acknowledgement
This work was funded in part by the U.S. Department of Energy’s National Energy Technology Laboratory (U.S. DOE-NETL) under the American Recovery and Reinvestment Act (ARRA), the New York State Electric & Gas Corporation, and New York State Energy Research and Development Authority (NYSERDA). The DOE sponsor for this project is Dr. Imre Gyuk, Program Manager for Energy Storage Research. The NETL management team provided guidance and technical oversight for this study. The authors acknowledge the significant role played by U.S. DOE/NETL in providing the programmatic guidance and review of this report.
Disclaimer
This report was prepared as an account of work sponsored by an agency of the United States Government and the New York State Energy Research and Development Authority (hereafter the “Sponsors”). Neither the Sponsors nor any agency thereof, nor any of their employees, makes any warranty, express or implied, or assumes any legal liability or responsibility for the accuracy, completeness, or usefulness of any information, apparatus, product, or process disclosed, or represents that its use would not infringe privately owned rights. Reference herein to any specific commercial product, process, or service by trade name, trademark, manufacturer, or otherwise does not necessarily constitute or imply its endorsement, recommendation, or favoring by the Sponsors or any agency thereof. The views and opinions of authors expressed herein do not necessarily state or reflect those of the Sponsors or any agency thereof.

Seneca Compressed Air Energy Storage (CAES) Project
Final Phase 1 Technical Report iii
NYSEG SENECA COMPRESSED AIR ENERGY STORAGE (CAES) DEMONSTRATION PROJECT
Prepared for
DOE/NETL DE-OE0000196
and
NYSERDA Agrm No. 11052
Final Phase 1 Technical Report
September 2012
NETL Contact:
Mr. Ronald K. Staubly Program Manager
NYSERDA Contact:
Mr. Greg A. Pedrick Project Manager

Seneca Compressed Air Energy Storage (CAES) Project
Final Phase 1 Technical Report iv
This page intentionally left blank.

Seneca Compressed Air Energy Storage (CAES) Project
Final Phase 1 Technical Report v
Abstract and Key Words
Compressed Air Energy Storage (CAES) is a hybrid energy storage and generation concept that has many potential benefits especially in a location with increasing percentages of intermittent wind energy generation. The objectives of the NYSEG Seneca CAES Project included: for Phase 1, development of a Front End Engineering Design for a 130MW to 210 MW utility-owned facility including capital costs; project financials based on the engineering design and forecasts of energy market revenues; design of the salt cavern to be used for air storage; draft environmental permit filings; and draft NYISO interconnection filing; for Phase 2, objectives included plant construction with a target in-service date of mid-2016; and for Phase 3, objectives included commercial demonstration, testing, and two-years of performance reporting. This Final Report is presented now at the end of Phase 1 because NYSEG has concluded that the economics of the project are not favorable for development in the current economic environment in New York State. The proposed site is located in NYSEG’s service territory in the Town of Reading, New York, at the southern end of Seneca Lake, in New York State’s Finger Lakes region. The landowner of the proposed site is Inergy, a company that owns the salt solution mining facility at this property. Inergy would have developed a new air storage cavern facility to be designed for NYSEG specifically for the Seneca CAES project. A large volume, natural gas storage facility owned and operated by Inergy is also located near this site and would have provided a source of high pressure pipeline quality natural gas for use in the CAES plant. The site has an electrical take-away capability of 210 MW via two NYSEG 115 kV circuits located approximately one half mile from the plant site. Cooling tower make-up water would have been supplied from Seneca Lake.
NYSEG’s engineering consultant WorleyParsons Group thoroughly evaluated three CAES designs and concluded that any of the designs would perform acceptably. Their general scope of work included development of detailed project construction schedules, capital cost and cash flow estimates for both CAES cycles, and development of detailed operational data, including fuel and compression energy requirements, to support dispatch modeling for the CAES cycles.
The Dispatch Modeling Consultant selected for this project was Customized Energy Solutions (CES). Their general scope of work included development of wholesale electric and gas market price forecasts and development of a dispatch model specific to CAES technologies.
Parsons Brinkerhoff Energy Storage Services (PBESS) was retained to develop an air storage cavern and well system design for the CAES project. Their general scope of work included development of a cavern design, solution mining plan, and air production well design, cost, and schedule estimates for the project.

Seneca Compressed Air Energy Storage (CAES) Project
Final Phase 1 Technical Report vi
Detailed Front End Engineering Design (FEED) during Phase 1 of the project determined that CAES plant capital equipment costs were much greater than the $125.6-million originally estimated by EPRI for the project.
The initial air storage cavern Design Basis was increased from a single five million cubic foot capacity cavern to three, five million cubic foot caverns with associated air production wells and piping. The result of this change in storage cavern Design Basis increased project capital costs significantly. In addition, the development time required to complete the three cavern system was estimated at approximately six years. This meant that the CAES plant would initially go into service with only one third of the required storage capacity and would not achieve full capability until after approximately five years of commercial operation.
The market price forecasting and dispatch modeling completed by CES indicated that the CAES technologies would operate at only 10 to 20% capacity factors and the resulting overall project economics were not favorable for further development.
As a result of all of these factors, the Phase 1 FEED developed an installed CAES plant cost estimate of approximately $2,300/KW for the 210MW CAES 1A and 2 cycles. The capital cost for the 136 MW CAES 1 cycle was even higher due to the lower generating capacity of the cycle. Notably, the large equipment could have generated additional capacity (up to 270MW) which would have improved the cost per KW; however, the output was limited by the night time transmission system capability. The research herein, therefore, is particular to the site-specific factors that influenced the design and the current and forecasted generation mix and energy prices in Upstate New York and may not necessarily indicate that CAES plants cannot be economically constructed in other places in New York State or the world.
Keywords: energy storage; compressed air energy storage; CAES; bedded salt caverns; turbomachinery; CAES generation siting; New York State; ARRA funded Smart Grid Development Program; CAES project.

Seneca Compressed Air Energy Storage (CAES) Project
Final Phase 1 Technical Report vii
List of Acronyms and Abbreviations
A/E Architect/engineer AFBC Atmospheric fluidized bed
combustor ANSI American National Standards
Institute ASME American Society of
Mechanical Engineers ASTM ASTM International (originally
known as the American Society for Testing and Materials)
BACT Best available control
technology Bbl Barrel BEC Bare erected cost BOP Balance of plant Btu British thermal unit ºC Degrees Celsius CAA Clean Air Act CAES Compressed Air Storage CFR Code of Federal Regulations CO Carbon monoxide CO2 Carbon dioxide CTG Combustion Turbine Generator DCS Distributed control system DI De-ionized DOE United States Department of
Energy EDI Electro-deionization EPA United States Environmental
Protection Agency EPC Engineer, procurement, and
construction EPCM Engineering, procurement, and
construction management EPRI Electric Power Research
Institute ER Energy Ratio
ºF Degrees Fahrenheit HAP Hazardous air pollutants HEI Heat Exchange Institute
Standards Hg Mercury HHV Higher heating value hp Horsepower HRSG Heat Recovery Steam
Generator H2S Hydrogen sulfide kW Kilowatt kWh Kilowatt hour LAER Lowest achievable emissions
rate lb Pound lb/hr Pounds per hour LHV Lower heating value MCR Maximum continuous rating MMBtu 106 Btu, (U.S. million Btu) MW Megawatt MWh Megawatt hour NA, N/A Not applicable NAAQS National Ambient Air Quality
Standards NESHAP National Emission Standards
for Hazardous Air Pollutants NETL DOE’s National Energy
Technology Laboratory NFPA National Fire Protection
Association NH3 Ammonia NSPS New Source Performance
Standards NO2 Nitrogen dioxide NOX Oxides of nitrogen NSR New source review NYISO New York Independent
System Operator

Seneca Compressed Air Energy Storage (CAES) Project
Final Phase 1 Technical Report viii
NYSEG New York State Electric & Gas Corporation
O&M Operating and maintenance O2 Oxygen OEM Original equipment
manufacturer OSHA Occupational Safety and
Health Administration P&ID Piping and instrumentation
diagram PCD Particulate control device
(filter) PM Particulate matter POTW Publicly owned treatment
works ppmv Parts per million by volume ppmvd ppmv (dry basis) PSD Prevention of significant
deterioration psia pounds per square inch,
absolute (14.696 psia = 1 atm) psig pounds per square inch, gauge Q Heat RO Reverse osmosis S Sulfur or sulfur content of fuel scf Standard cubic foot SO2 Sulfur dioxide SOX Oxides of sulfur ST Steam turbine t Short ton (2,000 lbs) t/h, tph Short tons per hour (2000
lb/h) t/y, tpy Short tons per year (2000
lb/y) TBD To be determined TEMA Tubular Exchanger
Manufacturers Association TEQ Toxicity equivalent Ton Short ton (2,000 lb)
Tonne Metric ton (1,000 kg or 2,205 lb)
TPC Total plant cost UL Underwriters Laboratory US, U.S. United States USD, US$ United States Dollar y, yr Year

PREPARED BY
New York State Electric & Gas Corporation
with WorleyParsons Group, Inc.
James W. Rettberg, P.E. NYSEG
Binghamton, New York
Michael Holdridge, P.E. WorleyParsons Group, Inc.
Reading, Pennsylvania
DOE Contract # DE - OE0000196
NYSERDA Agreement No: 11052

Seneca Compressed Air Energy Storage (CAES) Project
Final Phase 1 Technical Report 1
TABLE OF CONTENTS
1. EXECUTIVE SUMMARY............................................................................................................ 2 1.1 Overview of Phase 1 Study Results ....................................................................................... 2 1.2 Conclusions & Recommendation.............................................................................7
2 GENERAL OVERVIEW OF PROJECT AND PHASE 1 STUDY APPROACH ......................10 2.1 Project Background .............................................................................................................10 2.2 CAES Technology Overview and Design Basis ..................................................................10 2.3 Project Site ........................................................................................................................... 11 2.4 Seneca CAES Project Phases ...............................................................................................12 2.5 Phase 1 Study Approach.......................................................................................................13 2.6 CAES Technologies Evaluated............................................................................................15
3 PLANT SITING AND LICENSING..........................................................................................19 3.1 Wetlands Assessment.......................................................................................................... 20 3.2 Environmental Justice Assessment..................................................................................... 22 3.3 Cultural Resources .............................................................................................................. 22 3.4 Land Use Assessment ......................................................................................................... 22 3.5 Vegetation & Wildlife.......................................................................................................... 23 3.6 Water Resources.................................................................................................................. 23 3.7 Visual Impacts .................................................................................................................... 24 3.8 Air Resources ...................................................................................................................... 25
4 AIR STORAGE CAVERN AND AIR PRODUCTION WELL DESIGN................................. 25 4.1 Background......................................................................................................................... 25 4.2 Cavern Design..................................................................................................................... 28 4.3 Cavern and Well System Cost and Schedule Estimate ....................................................... 30
5 CAES FRONT END ENGINEERING DESIGN..................................................................... 30 5.1 Equipment Description CAES 1 and 1A ............................................................................. 30 5.2 Equipment Description CAES 2 ......................................................................................... 32 5.3 Operational Capabilities ..................................................................................................... 34 5.4 Operational Performance.................................................................................................... 35
6 CAES PROJECT DEVELOPMENT SCHEDULE................................................................... 35 7 PROJECT COST ESTIMATES.................................................................................................. 36 8 WHOLESALE ELECTRICITY PRICE FORECASTING AND CAES PLANT DISPATCH MODELING ....................................................................................................................................... 38
8.1 NYISO Market Overview.................................................................................................... 38 8.2 Market Price Forecasting.................................................................................................... 40 8.3 Dispatch Modeling Approach............................................................................................. 48 8.4 Dispatch Modeling Results................................................................................................. 49
9 FINANCIAL MODELING ........................................................................................................ 54 9.1 Base Case Modeling Results............................................................................................... 55 9.2 Sensitivity Analyses ............................................................................................................. 58
10 STATEWIDE EMISSIONS IMPACT........................................................................................ 59 11 TRANSMISSION SYSTEM BENEFITS................................................................................... 60 12 RECOMMENDED CAES TECHNOLOGY............................................................................. 60 13 APPENDICES .............................................................................................................................61

Seneca Compressed Air Energy Storage (CAES) Project
Final Phase 1 Technical Report 2
1. Executive Summary
1.1 Overview of Phase 1 Study Results
Compressed Air Energy Storage (CAES) is a hybrid energy storage and generation concept that has many potential benefits especially in a location with increasing percentages of intermittent wind energy generation. The objectives of the NYSEG Seneca CAES Project included: in Phase 1, development of a Front End Engineering Design for a 136MW to 210 MW utility-owned facility including capital costs; project financials based on the engineering design and forecasts of energy market revenues; design of the salt cavern to be used for air storage; development of technical data required for environmental permit filings; and development of technical data required for a NYISO interconnection filing; in Phase 2, objectives included plant construction with a target in-service date of mid-2016; and Phase 3 objectives included commercial demonstration, testing, and two-years of performance reporting. NYSEG has concluded that the economics of the project are not favorable for development in the current and forecast wholesale electric market in New York State, and further project development work is not warranted.
NYSEG evaluated two expansion cycle designs for the plant during Phase 1 of the project to determine whether the CAES technology provides sufficient customer benefit to proceed with Phase 2 project construction. The first CAES cycle evaluated (Cycle #1/1A) is provided by Dresser-Rand and employs air expansion turbine generators with natural gas combustors to pre-heat the storage air prior to admitting it into the expanders. The CAES 1 cycle is rated at 136 MW and the CAES 1A cycle is rated at 210 MW.
The second CAES cycle (Cycle #2) evaluated, also nominally rated at 210 MW, is provided by a joint venture between Energy Storage & Power and MAN Diesel Turbo. Cycle #2 consists of a simple cycle combustion turbine with an air to air heat exchanger downstream of the combustion turbine exhaust that is used to pre-heat the storage air prior to admitting it into the air expanders. NYSEG’s engineering consultant, WorleyParsons, thoroughly evaluated the CAES designs and concluded that any of the designs would perform acceptably and that the dispatch cost of Cycles 1 and 1A is remarkably stable between 100% and 30% load. CAES Cycle 2 dispatch is remarkably stable between 100% and 50% load. The performance of the units is not significantly affected by ambient temperature and relative humidity. While the plant may experience some minor performance degradation over time, proper maintenance should provide long term, stable operation.
Detailed Front End Engineering Design (FEED) during Phase 1 of the project determined that CAES plant capital equipment costs were much greater than the $125.6-million originally estimated for the project. WorleyParsons issued RFPs for major and minor plant equipment as part of the FEED process, and the capital cost estimates for the technology were based on the results of these RFP’s. There were a limited number of qualified bidders for the major equipment items and bidders generally responded with “Budget” quality

Seneca Compressed Air Energy Storage (CAES) Project
Final Phase 1 Technical Report 3
proposals with many exceptions to the RFP terms and conditions. The “Budget” equipment costs were significantly higher than the original estimates, and bidders appeared to add contingencies to address perceived costs associated with government contracting terms and conditions. In addition, the original proposal included the selected use of used equipment which was no longer available at the time the FEED process was underway. The capital cost estimates are shown below and are compared with the original estimate.
Original Cost Estimate CAES 1 CAES 1A CAES 2
($1,0
00)
CAES Capital Costs
Procurement Packages Contract Packages Professional Services Owners Costs
Permit Support Licensing Fees Cavern Development AFUDC
$445,273
$497,178 $494,148
$125,006
Original Estimate CAES 1 CAES 1A CAES 2
Procurement Packages
$56,078,400 $162,300,876 $193,630,735 $161,099,191
Contract Packages
$37,715,710 $149,078,498 $162,956,933 $183,969,191
Professional Services
$13,194,000 $26,419,800 $26,419,800 $27,585,800
Owner’s Costs
$13,682,133 $13,682,133 $13,682,133
Permit Support
$710,000 $710,000 $710,000
Technology Licensing Fees
$734,700 $7,350,000

Seneca Compressed Air Energy Storage (CAES) Project
Final Phase 1 Technical Report 4
Original Estimate CAES 1 CAES 1A CAES 2
Cavern Development
$7,400,000 $38,920,122 $38,920,122 $38,920,122
AFUDC $9,883,293 $54,161,656 $60,857,797 $60,831,375
Total $125,006,103 $445,273,086 $497,177,520 $494,147,812
Project capital costs were increased as well due to a change in the Design Basis of the project. The original proposal called for a CAES 2 design with a generation rating of approximately 150 MW, and a compression train rating of approximately 65 MW. This Design basis assumed a storage cavern of approximately five million cubic feet of free space. Early in the FEED process, the team was advised by Inergy/US Salt (the cavern field owner and operator) that they would provide the project with a new cavern rather than an existing cavern. Preliminary reviews by the project team also indicated that most if not all of the existing salt caverns at the site had been mined in a fashion in which the salt on the roofs of the caverns had largely been mined out leaving a bare rock face on the ceiling. The absence of a substantial layer of salt on the roofs of these caverns, combined with the potential for cavern to cavern leakage made the potential re-use of existing caverns for the storage of high pressure air problematic. The development of a new cavern, specifically designed for CAES cycle duty became the Design Basis for the project. Based on solution mining rates at the Inergy/US Salt operation, a five million cubic foot cavern could be developed within the project development time line, and this formed the Design Basis for the project.
Preliminary cycle operational requirements as recommended by Customized Energy Solutions (project energy markets and modeling consultant) indicated that to maximize economic value, the CAES plant would need to be able to be fully re-charged during off-peak hours on a daily basis. This would allow the plant to provide its full generating capability during on-peak periods. Given the limited size of the air storage cavern, preliminary engineering review indicated that the Design Basis for the compression train would need to be between 150 and 200 MW in size. This large increase in compressor size from the original plant proposal (65 MW) contributed to a significant increase in plant cost.
In addition, initial discussions indicated that compression trains independent from the generation train would provide maximum flexibility in responding to ancillary services market revenue opportunities. Initial evaluations also indicated that the Design Basis should incorporate the capability to de-couple the compressor motors from the compressors so that the motors could be operated as synchronous condensers for VAR support. The separate compression and generation trains as well as the synchronous condenser capability also added to the capital cost for the project.
Parsons Brinkerhoff Energy Storage Services (PBESS) was engaged to confirm the initial Design Basis assumptions about cavern design, capacity, time to create, and ability to

Seneca Compressed Air Energy Storage (CAES) Project
Final Phase 1 Technical Report 5
support CAES plant operation duty cycle requirements over the 30 years design life of the facility. As will be detailed later in this report, the initial air storage cavern Design Basis was increased from a single five million cubic foot capacity cavern to three five million cubic foot caverns with associated air production wells and piping. The result of this change in storage cavern Design Basis increased project capital costs significantly. In addition, the development time required to complete the three cavern system was estimated at approximately six years. This meant that the CAES plant would initially go into service with only one third of the required storage capacity and would not achieve full capability until after approximately five years of commercial operation. This protracted commercial phase-in resulted in significantly reduced wholesale market revenues during the five year period and contributed to the overall unfavorable economics for the CAES project.
The Seneca CAES plant would have been interconnected to two NYSEG 115 kV circuits located approximately one half mile west of the proposed plant site. While no transmission system upgrades would have been required to interconnect the plant, the interconnection would have required the construction of a substation at the plant site as well as a 115 kV switchyard at the interconnection point as well. The costs of this interconnection were not fully assessed as part of the original cost estimate.
The Seneca CAES plant, located in the heart of the New York Finger Lakes wine and tourism area, would have undergone an extensive licensing period under the newly enacted New York State Article X licensing process. The direct costs of this licensing process were included in the cost estimates. In addition, the anticipated design and operational requirements necessary to receive licensing approvals (including noise abatement, visual impacts, stack and cooling tower plume abatement, stormwater management and waste water discharge requirements) were incorporated into the Design Basis and contributed to the capital cost of the project. These costs were not fully assessed as part of the original project cost estimate.
The Seneca CAES Project was proposed as a rate based investment under rate regulation by the New York Public Service Commission. The plant capital cost estimate includes an Allowance for Funds Used During Construction (AFUDC) which NYSEG would accumulate during plant construction and which would then be incorporated into the overall capital cost of the plant as it entered commercial service. Over the nearly four year plant construction schedule, these costs were estimated at $60-million and were not fully assessed as part of the original project cost estimate.
As a result of all of these factors, the Phase 1 FEED developed an installed CAES plant cost estimate of approximately $2,300/KW for the 210MW CAES 1A and 2 cycles. The capital cost for the 136 MW CAES 1 cycle was even higher due to the lower capacity of the cycle.
Wholesale electric market revenue estimates were developed by Customized Energy Solutions (CES) based on sophisticated modeling which took into account hourly price forecasts for the life of project; costs of inventory of air stored in cavern; scenario modeling

Seneca Compressed Air Energy Storage (CAES) Project
Final Phase 1 Technical Report 6
based on anticipated events in New York and the region; and energy policy and market trends. The modeling developed for this project revealed several major findings:
• The retirement of existing coal and other aging base load generation will require the addition of new generation which will largely take the form of natural gas peaking and combined cycle units. While some penetration of renewable energy will be likely to continue, the modeling indicates that the majority of the new capacity additions will be gas fired.
• As a result, the modeling indicates that energy prices in the New York market will be set by the marginal cost of natural gas generating units. The result of this is that the differential between on-peak and off-peak wholesale energy market prices will be very small for many hours of the year (essentially driven by the heat rates of the least efficient NGCC units and the most efficient NGCC units). Energy arbitrage revenues for the CAES plant are significantly diminished in this market environment.
• Capacity revenues forecast in the NYISO market do increase during the study period as the current excess capacity in the NYISO is reduced over time. However, increased capacity revenues are not forecast to occur until well after the Seneca CAES plant enters commercial operation. In addition, the capacity revenue increases associated with the need for new capacity will be driven by the cost of new NGCC or NGCT units which are significantly less costly than the CAES technology. Even when the capacity prices do increase, they would not be sufficient on their own to support the construction of a CAES plant.
• The current NYISO market structure does not provide Ancillary Services market revenues to support new investment in capturing this market segment. Some of the capabilities in which CAES technology excels (fast start, VAR support, frequency regulation) are little valued in the current market and are not forecast to grow significantly in the forecasts used for this project. While NYSEG and CES believe that situation may change with the further retirement of base load fossil units, there was no way to develop defensible estimates of these future market revenue streams.
• The location of the Seneca CAES plant would not impact or reduce transmission congestion costs and there was no credit given to the project for congestion relief. A larger plant or a plant located in a different NYISO Zone may have impacted congestion, but this plant does not.
• The dispatch modeling performed by CES indicated that the CAES plant would reduce statewide emissions of CO2 by over two million tons during a 30 year study period. The societal value of this emission reduction was not monetized and was not included in the calculation of project economics.

Seneca Compressed Air Energy Storage (CAES) Project
Final Phase 1 Technical Report 7
1.2 General Approach to CAES Development – Lessons Learned
At the conclusion of Phase 1, the project team documented the lessons learned from Phase 1 which may assist future CAES project developers. The following are the key aspects of the assessment approach. First, develop an initial approach, with the expectation that some project parameters and assumptions may need to flux as project limitations are discovered. The project management team should identify the initial scope to include:
o generation size range; o compression size range; o minimum air store recharge time; o the maximum hours of generation at full load on a full air charge; and o the expected number of cycles per year.
Next, conduct a preliminary assessment of the electric transmission system capability. Be sure to determine if the transmission system has the generation take-away capability assumed in the initial general scope and if it can supply charging energy, which is typically assumed to be at night time or other off-peak time period. Identify the potential interconnection costs and the costs for any upgrades, if necessary. Evaluate the cost/benefit of resolving capacity and technical issues.
The next step is to develop the preliminary air storage medium assessment and design basis:
o Characterize the initial storage medium design basis (volume, geology, depth, etc). o Using the initial general scope for the above-ground plant, evaluate the ability of the storage
medium to support desired operating envelope. o Modify the operating envelope; determine recommended operating pressure range for the
CAES plant based on a preliminary geotechnical assessment. o Modify the initial storage medium design basis (within technically allowable limits) to best
meet initial general scope of project established above. o Identify key CAES cycle performance and operational data needed to verify preliminary
design basis.
From the above analysis, prepare the preliminary project design basis and key assumptions supporting the design basis. Next, develop preliminary wholesale market forward base case price curves including:
o Hourly on-peak versus off-peak energy forecasts to assess arbitrage value o Installed capacity forecasts o Ancillary services market revenue forecasts o Natural gas and air emission allowance price forecasts
Then, perform preliminary dispatch modeling for the CAES cycle(s) to evaluate potential market revenue streams and verify assumptions on operating duty cycle. Note: NYSEG chose to evaluate the costs and revenue potential of two CAES technologies throughout Phase 1.
Seneca Compressed Air Energy Storage (CAES) Project
Final Phase 1 Technical Report 8
o Market revenue forecasts o Variable cost forecasts (fuel, charging energy, air emission allowances)
Next, perform preliminary financial modeling and refine the preliminary design basis as appropriate. The primary objective is to support decision-making on further detailed project definition and development.
o Identify critical cycle characteristics and potential sensitivities, such as size, charging time, generating time, and capital costs.
o Conduct a preliminary assessment of sensitivity to wholesale gas and/or electric prices.
Refine the design basis as necessary for Front End Engineering Design (FEED) effort including at least the following:
o Size of compression and generation trains o Operating duty cycle desired o Air pressure range across the duty cycle o Special electrical transmission system interconnection requirements o Desired operating duty cycle characteristics to maximize potential revenues including:
o Start/stop times and frequency o Automatic generation control response rates o Ramping capabilities o VAR support requirements o Black start
Next, develop the detailed Front End Engineering Design including cost and schedule estimates. NYSEG’s engineering consultant, Worley Parsons generated its detailed cost estimates using an RFQ process for the major equipment. Using an RFP process has the benefit of being very reliable and defensible, however it is time consuming so adequate time in the schedule should be allocated if possible. During the RFP process, it may be worth considering requesting costs in various size ranges to allow for various scenario assessments during market and dispatch modeling, which is the next step.
Perform detailed market and dispatch modeling using the technical details from the FEED effort. Many scenarios may be modeled to determine whether there is an ideal ratio of above-ground capacities (both generation and compression), below ground capacities (well drilling and cavern development greatly influence schedule and cost), revenues, and costs.
Next, conduct detailed financial modeling to make a Go/No Go decision on the project. Finally, implement a project development plan if the financial results are attractive.

Seneca Compressed Air Energy Storage (CAES) Project
Final Phase 1 Technical Report 9
1.3 Conclusions & Recommendation
The CAES plant designs tended to operate at very low annual capacity factors (under 20%) throughout the study period as illustrated in the chart below.
0%
5%
10%
15%
20%
25%
2016 2017 2018 2019 2020 2021 2022 2023 2024 2025 2026 2027 2028 2029 2030 2031 2032 2033 2034 2035 2036 2037 2038 2039 2040 2041 2042 2043 2044 2045
Annual Capacity Factor
CAES 1 CAES 1A CAES 2
The plant operating profiles tended to be patterned after the operational duty cycle of a natural gas fired peaking unit. Given that the capital cost of this plant was estimated at two to three times the cost of a simple cycle natural gas combustion turbine, it is not surprising that in all but six years of the 30 years of the study period, the total market revenues received from plant operation would be less than the total revenue requirement of the plant. The CAES technology modeled in this study resulted in a negative net present value of over $240-million as shown below. As a result, it was recommended that NYSEG not proceed with further development of the Seneca CAES project.
($259,835)
($256,269)
($246,938)
1
($1,0
00)
2016 - 2045 Customer NPV
CAES 1 CAES 1A CAES 2

Seneca Compressed Air Energy Storage (CAES) Project
Final Phase 1 Technical Report 10
2 General Overview of Project and Phase 1 Study Approach
2.1 Project Background
On November 30, 2010, NYSEG formally accepted a $29.6-million grant from the U.S. Department of Energy to evaluate and develop, if economically feasible, a Compressed Air Energy Storage (CAES) Plant. The scope of the project included the phased planning, design, engineering, construction, operation, performance monitoring, and cost/benefit assessment of an advanced compressed air energy storage (CAES) plant using an underground salt cavern. The proposed site was located in NYSEG’s service territory in the Town of Reading, New York, at the southern end of Seneca Lake, in New York State’s Finger Lakes region. A large volume, natural gas storage facility owned and operated by Inergy Midstream, LLC, is also located near this site and would have provided a source of high pressure pipeline quality natural gas for use in the CAES plant. The site has an electrical take-away capability of 210 MW via two NYSEG 115 kV circuits located approximately one half mile from the plant site.
The Seneca CAES plant would have had a rated capacity of between 136 MW and 210 MW, and would have provided sufficient storage to allow full operation during peak time periods, operating in support of the transmission system and market needs, i.e., approximately 10 to 12 hours per day. The plant would have been capable of recharging the air storage cavern in approximately 8 hours. These capabilities would have been sufficient to provide a wide range of operational benefits on the NYSEG transmission system and provide DOE and the US with a credible demonstration of an advanced CAES plant integrated into a modern, de-regulated wholesale electric market.
2.2 CAES Technology Overview and Design Basis
The Seneca CAES Project would have consisted of a separate, electrically driven compression cycle and a natural gas-fired expansion cycle. NYSEG evaluated two expansion cycle designs for the plant during Phase 1 of the project to determine whether the CAES technology provided sufficient customer benefit to proceed with Phase 2 project construction. The first CAES cycle evaluated (Cycle #1/1A) would have employed air expansion turbine generators with natural gas combustors to pre-heat the storage air prior to admitting it into the expanders. The CAES 1 cycle was nominally rated at 136 MW and the CAES 1A cycle was rated at 210 MW. The second CAES cycle (Cycle #2) evaluated was also nominally rated at 210 MW and consisted of a simple cycle combustion turbine with an air to air heat exchanger downstream of the combustion turbine exhaust that would have been used to pre-heat the storage air prior to admitting it into the air expanders.
The design basis for the project was developed through discussions with the dispatch modeling and engineering consultants retained for the project. The basis is shown below:
• Single fuel (natural gas only) operation. No back-up fuel provided.
Seneca Compressed Air Energy Storage (CAES) Project
Final Phase 1 Technical Report 11
• The generation train of the CAES plant must be able to operate up to 10 hours at full load; the air storage cavern system must be able to be re-charged to maximum pressure within eight hours by the compressor trains.
• The design must support daily cycling operation (full cavern working inventory discharge and re-charge) with up to 260 cycles per year.
• The large electric motors driving the air compressors must be able to quickly be de-coupled from the compressors so that the motors can be operated as synchronous condensers for VAR support.
• The CAES plant must be designed to provide “Black Start” capability.
• The operation of the facility must be capable of changing from generation to compression (or vice versa) within 10 minutes.
• The facility must be capable of providing regulation support service in response to automated signals from the NYISO dispatch center at a machine ramp rate of at least 8 MW/minute.
• Must meet stack emissions of 2.0 ppmvd NOx and CO @ 15% O2 with post combustion emission controls.
• The facility must be designed to operate stably while being in emission compliance limits between 25 % minimum to 100% load.
2.3 Project Site
The proposed site is located in the Town of Reading, New York, at the southern end of Seneca Lake, near Watkins Glen, in New York’s Finger Lakes region. The surrounding land use includes a proposed propane storage and trucking center located adjacent to the CAES plant site, a natural gas storage facility, and a solution salt mining facility. The plant would be situated on a terrace surrounded by a natural screen of forested land so as to minimize its visibility from the road and lake. The landowner of the proposed site is Inergy, the company that owns the salt solution mining facility at this property. Inergy would have developed a new air storage cavern facility to be designed by NYSEG specifically for the Seneca CAES project. Under an agreement with Inergy, upon identification of a suitable cavern, NYSEG has the right to lease the cavern system and an above-ground plant site on Inergy’s property for the CAES Project for a term of years sufficient to build, demonstrate, and operate the project.
The original location for the CAES plant site assumed that Inergy would offer NYSEG the use of an existing salt cavern, but as noted above, Inergy proposed to develop a new cavern for the CAES project and this site is located approximately one mile west of the originally proposed site as illustrated below:

Seneca Compressed Air Energy Storage (CAES) Project
Final Phase 1 Technical Report 12
2.4 Seneca CAES Project Phases
There are three phases of the proposed project:
– Phase 1: Develop a Front End Engineering Design including project capital costs; project financials based on the engineering design and updated forecasts of energy market revenues; design of the salt cavern to be used for air storage; development of draft environmental permit exhibits; development of draft NYISO interconnection filing information and exhibits.
– Phase 2: Plant construction with a target in-service date of mid-2016.
– Phase 3: Commercial demonstration, testing, and two years of performance reporting
Seneca Compressed Air Energy Storage (CAES) Project
Final Phase 1 Technical Report 13
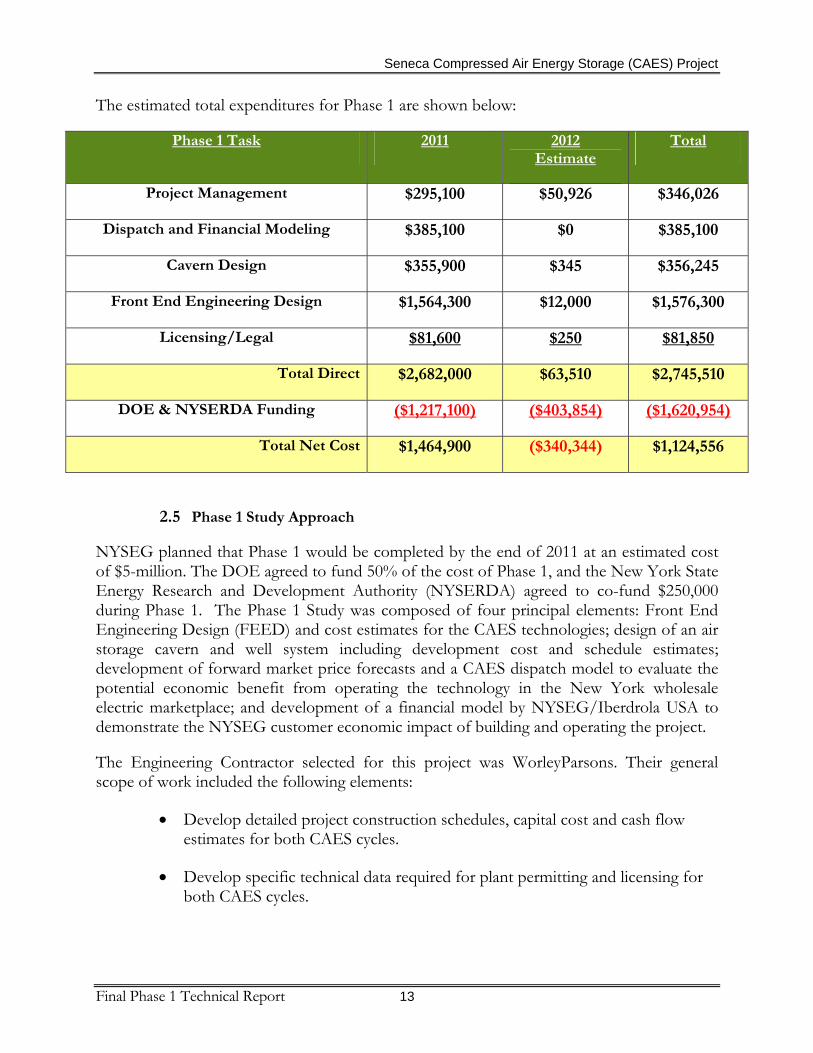
The estimated total expenditures for Phase 1 are shown below:
Phase 1 Task 2011 2012 Estimate
Total
Project Management $295,100 $50,926 $346,026
Dispatch and Financial Modeling $385,100 $0 $385,100
Cavern Design $355,900 $345 $356,245
Front End Engineering Design $1,564,300 $12,000 $1,576,300
Licensing/Legal $81,600 $250 $81,850
Total Direct $2,682,000 $63,510 $2,745,510
DOE & NYSERDA Funding ($1,217,100) ($403,854) ($1,620,954)
Total Net Cost $1,464,900 ($340,344) $1,124,556
2.5 Phase 1 Study Approach
NYSEG planned that Phase 1 would be completed by the end of 2011 at an estimated cost of $5-million. The DOE agreed to fund 50% of the cost of Phase 1, and the New York State Energy Research and Development Authority (NYSERDA) agreed to co-fund $250,000 during Phase 1. The Phase 1 Study was composed of four principal elements: Front End Engineering Design (FEED) and cost estimates for the CAES technologies; design of an air storage cavern and well system including development cost and schedule estimates; development of forward market price forecasts and a CAES dispatch model to evaluate the potential economic benefit from operating the technology in the New York wholesale electric marketplace; and development of a financial model by NYSEG/Iberdrola USA to demonstrate the NYSEG customer economic impact of building and operating the project.
The Engineering Contractor selected for this project was WorleyParsons. Their general scope of work included the following elements:
• Develop detailed project construction schedules, capital cost and cash flow estimates for both CAES cycles.
• Develop specific technical data required for plant permitting and licensing for both CAES cycles.

Seneca Compressed Air Energy Storage (CAES) Project
Final Phase 1 Technical Report 14
• Develop specific technical data and exhibits required for the New York Independent System Operator Interconnection Request process.
• Develop detailed operational data, including fuel and compression energy requirements, to support dispatch modeling for both CAES cycles.
• Develop electric and natural gas interconnection facility plans, drawings, equipment lists, construction schedules, and cost estimates.
• Develop plant staffing plans for both CAES cycles consistent with Good Utility Practice.
• Develop a Transmission Impact Study to demonstrate the impact and system benefits of the CAES technology on the electric transmission system.
• Identify design/operating risks of the CAES cycle technologies, assess the risk profile and potential mitigation measures and costs to support NYSEG’s Risk Mitigation Plan filed with the DOE.
The Dispatch Modeling Consultant selected for this project was Customized Energy Solutions (CES). Their general scope of work included the following elements:
• Support NYSEG and WorleyParsons in optimizing CAES cycle designs to maximize wholesale electric market revenue opportunities while minimizing plant capital costs. The optimization required the development of an hourly dispatch model to be able to evaluate the market revenue opportunities for an air storage cycle.
• Evaluate alternative electricity and ancillary services revenue streams that could be available for the CAES plant operating within the NYISO market.
• Develop long term forecasts of wholesale electric market prices, natural gas prices, ancillary services revenues, and emission allowance prices for use in evaluating the economics of CAES technology operating in the NYISO market.
• Develop long range forecasts of wholesale market revenues and variable operating costs using the market price forecasts and dispatch model.
Parsons Brinkerhoff Energy Storage Services (PBESS) was retained to develop an air storage cavern and well system design for the CAES project. The scope of this engagement included the following elements:
• Review of site geology and verification that suitable salt formations exist at the plant site recommended by Inergy.

Seneca Compressed Air Energy Storage (CAES) Project
Final Phase 1 Technical Report 15
• Development of a cavern design, solution mining plan, and air production well design, cost, and schedule estimates for the project based on the design basis for the CAES plant.
The financial modeling performed for the project was based on an assumption that the New York Public Service Commission would authorize the recovery by NYSEG of all costs of constructing and operating the Project through the NBWC (or an equivalent non-bypassable delivery charge) with the customer receiving a credit for all wholesale electric revenues generated by the Project. When the Project is operating, NYSEG would bid the Project’s energy, capacity and ancillary services products into the NYISO markets at NYSEG’s actual incremental cost of the product and then credit back to the customer all revenues received from the NY ISO in connection with the sale. Since NYSEG is committing to flow back to its customers all of the revenues associated with the sale to the NY ISO of all products provided by the Project, the Commission should be satisfied that there will be no competitive or market power issues resulting from NYSEG’s ownership or operation of the Project. NYSEG would have no financial stake in the outcome of the sale of Project products.
The financial model takes into consideration a number of cost estimates, including (a) the estimated cost of constructing the project itself; (b) the estimated costs of operating the project, including fixed and variable operating and maintenance expenses; (c) a number of long-range forecasts of wholesale electricity prices in the region (detailed in Section 8 below); and (d) projections of how the project is likely to be dispatched in light of the projected wholesale electricity prices.
Key assumptions used in the financial model included:
• DOE ARRA funding of $29.6-million; NYSERDA funding of $1-million.
• The DOE and NYSERDA Grants are taxable upon receipt, but the project qualifies as an R&D expense under IRS Code Section #174 and would be expensed for tax purposes in the year expended.
• Capital Structure: 48% Equity, 52% Debt
• Equity Return = 10%, Debt Rate = 5.5%
2.6 CAES Technologies Evaluated
During Phase 1, NYSEG evaluated two competing technologies. The CAES 1/1A technology was supplied by Dresser-Rand Corporation and is a significantly upgraded design based on the McIntosh Storage Plant built in Alabama in 1991. NYSEG evaluated two variations of this design, which have been designated as CAES Cycle 1 and CAES Cycle 1A.
Seneca Compressed Air Energy Storage (CAES) Project
Final Phase 1 Technical Report 16
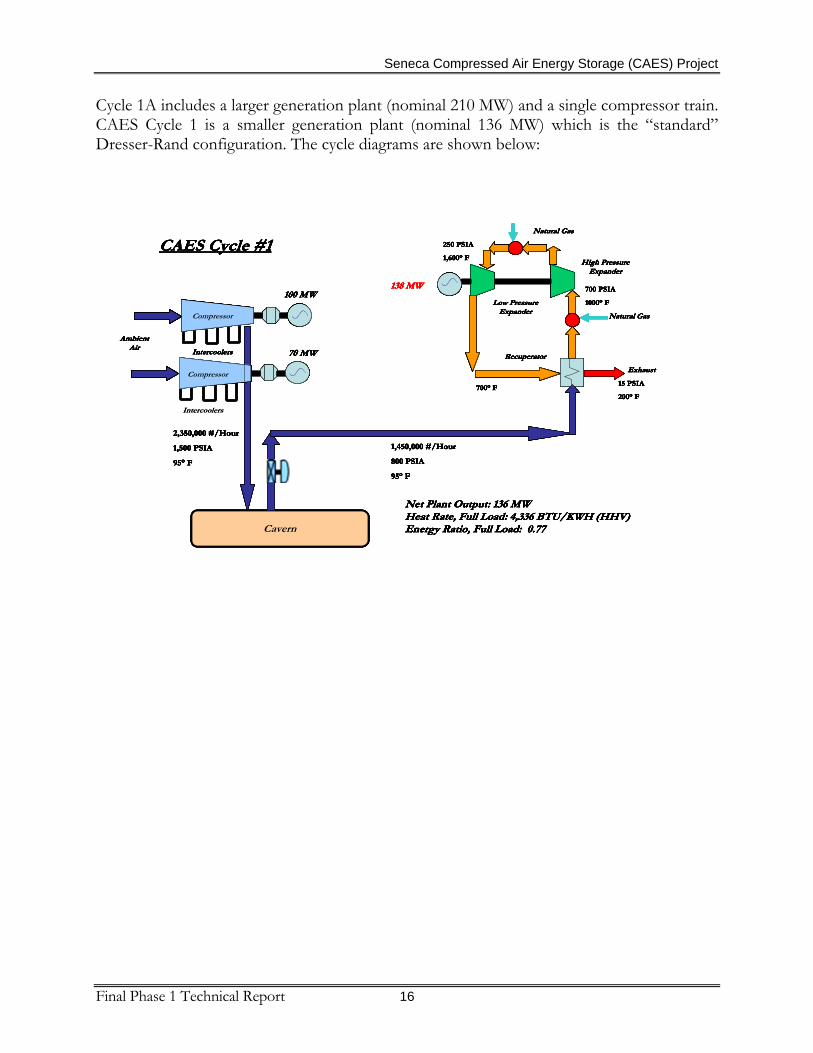
Cycle 1A includes a larger generation plant (nominal 210 MW) and a single compressor train. CAES Cycle 1 is a smaller generation plant (nominal 136 MW) which is the “standard” Dresser-Rand configuration. The cycle diagrams are shown below:
Intercoolers
CAES Cycle #1
Compressor
Natural Gas
Recuperator
Exhaust
High Pressure Expander
Low Pressure Expander
Ambient Air
Intercoolers
138 MW
70 MW
100 MW
2,350,000 #/Hour
1,500 PSIA
95° F
1,450,000 #/Hour
800 PSIA
95° F
Natural Gas
700 PSIA
1000° F
250 PSIA
1,600° F
700° F15 PSIA
200° F
Net Plant Output: 136 MWHeat Rate, Full Load: 4,336 BTU/KWH (HHV)Energy Ratio, Full Load: 0.77Cavern
Compressor
Intercoolers
CAES Cycle #1
Compressor
Natural Gas
Recuperator
Exhaust
High Pressure Expander
Low Pressure Expander
Ambient Air
Intercoolers
138 MW
70 MW
100 MW
2,350,000 #/Hour
1,500 PSIA
95° F
1,450,000 #/Hour
800 PSIA
95° F
Natural Gas
700 PSIA
1000° F
250 PSIA
1,600° F
700° F15 PSIA
200° F
Net Plant Output: 136 MWHeat Rate, Full Load: 4,336 BTU/KWH (HHV)Energy Ratio, Full Load: 0.77Cavern
Compressor
CAES Cycle #1
Compressor
Natural Gas
Recuperator
Exhaust
High Pressure Expander
Low Pressure Expander
Ambient Air
Intercoolers
138 MW
70 MW
100 MW
2,350,000 #/Hour
1,500 PSIA
95° F
1,450,000 #/Hour
800 PSIA
95° F
Natural Gas
700 PSIA
1000° F
250 PSIA
1,600° F
700° F15 PSIA
200° F
Net Plant Output: 136 MWHeat Rate, Full Load: 4,336 BTU/KWH (HHV)Energy Ratio, Full Load: 0.77Cavern
CAES Cycle #1
Compressor
Natural Gas
Recuperator
Exhaust
High Pressure Expander
Low Pressure Expander
Ambient Air
Intercoolers
138 MW
70 MW
100 MW
2,350,000 #/Hour
1,500 PSIA
95° F
1,450,000 #/Hour
800 PSIA
95° F
Natural Gas
700 PSIA
1000° F
250 PSIA
1,600° F
700° F15 PSIA
200° F
Net Plant Output: 136 MWHeat Rate, Full Load: 4,336 BTU/KWH (HHV)Energy Ratio, Full Load: 0.77
CAES Cycle #1
Compressor
Natural Gas
Recuperator
Exhaust
High Pressure Expander
Low Pressure Expander
Ambient Air
Intercoolers
138 MW
70 MW
100 MW
2,350,000 #/Hour
1,500 PSIA
95° F
1,450,000 #/Hour
800 PSIA
95° F
Natural Gas
700 PSIA
1000° F
250 PSIA
1,600° F
700° F15 PSIA
200° F
Net Plant Output: 136 MWHeat Rate, Full Load: 4,336 BTU/KWH (HHV)Energy Ratio, Full Load: 0.77Cavern
Compressor

Seneca Compressed Air Energy Storage (CAES) Project
Final Phase 1 Technical Report 17
Key characteristics of this overall cycle design include:
• Split generation and compression trains with the ability to switch modes of operation (i.e., compression to generation or vice versa) within approximately 10 minutes.
• Full load capability on the generation train within 10 minutes; similar capability on the compressor trains as well.
• Most of the components in the cycle would be sourced from the U.S., with the compression train primarily sourced in New York (NYSEG service territory).
• Dresser-Rand would provide both the compression and generation trains, control systems, recuperator, stack, and air pollution control equipment. Performance guarantees on the equipment and the overall cycle would be part of the Dresser-Rand offering.
• The high pressure air expander is a mechanical drive steam turbine that has been adapted to run on air; the low pressure expander was designed specifically for CAES cycle operation.
• The air expander generator as well as the compressor motors can be equipped with fast acting hydraulic clutches so they can be de-coupled from the turbo machinery and operated as synchronous condensers to provide VAR support (leading and lagging) to the transmission system.
CAES Cycle #1A
Exhaus
15 PSIA
Natural Gas
LP
210 MW
Natural Gas250 PSIA
Expanders
HP
Natural Gas
Recuperator
Exhaust
700 PSIA
700° 15 PSIA
Cavern
Intercoolers
Compressor
Ambient Air
170 MW
2,430,000 #/Hour
1,500 PSIA
2,175,000 #/Hour
800 PSIA
Net Plant Output: 208 MW
Heat Rate, Full Load: 4,382 BTU/KWH (HHV)
LP HP
Natural Gas
Expanders
700 PSIA
700°

Seneca Compressed Air Energy Storage (CAES) Project
Final Phase 1 Technical Report 18
• Compressor start-up will be performed using a variable frequency drive to minimize starting load impacts on the electric transmission system.
• Air pollution control will be achieved through a CO catalyst and through a combination of water injection and SCR for NOx control.
• The expander generator can provide rapid response to automatic generation control signals from the NYISO, with normal response rates of 8 MW/minute and emergency response rates of up to 25 MW/minute.
• The cycle can be configured to provide black start capability with the addition of an on-site natural gas fired generator to provide the required station service capability for start-up. The costs to provide this capability are included in the project cost estimates.
The CAES 2 (nominal 210 MW) technology is based on a design and patent developed by Energy Storage & Power (ES&P) with major equipment supplied by MAN Diesel Turbo (MDT) Corporation. The generation cycle is similar to a natural gas combined cycle in that it is based on using a simple cycle combustion turbine which then supports a bottoming cycle. The design is illustrated below:
Key characteristics of this design include:
• This cycle is a new design in the CAES arena and would be the first of its kind.

Seneca Compressed Air Energy Storage (CAES) Project
Final Phase 1 Technical Report 19
• Split generation and compression trains with the ability to switch modes of operation (i.e., compression to generation or vice versa) within 10 minutes.
• Full load capability on the generation train within 30 minutes due to the start-up time associated with the combustion turbine; the compressor trains can be at full output within 10 minutes if required.
• The CAES 2 cycle we have modeled is based on a GE Frame 7 EA combustion turbine which is made in the U.S. Most of the other components in the cycle would be sourced from Europe.
• ES&P/MDT formed a Joint Venture under U.S. law. MDT would provide both compression and expander trains. They would not provide the control systems, recuperator, stack, and air pollution control equipment, so the project A/E firm would need to develop the designs and procurement packages for those components. Performance guarantees on the equipment and cycle would be part of the MDT offering.
• The air expanders are mechanical drive steam turbines that have been adapted to run on air.
• The air expander generators as well as the compressor motors can be equipped with fast acting hydraulic clutches so they can be de-coupled from the turbo machinery and operated as synchronous condensers to provide VAR support (leading and lagging) to the transmission system.
• Compressor start-up will be performed using a variable frequency drive to minimize starting load impacts on the electric transmission system.
• Air pollution control will be achieved through a CO catalyst and an SCR for NOx control.
• The expander generators can provide rapid response to automatic generation control signals from the NYISO, with normal response rates of 8 MW/minute and emergency response rates of up to 25 MW/minute.
• The cycle can be configured to provide black start capability with the addition of an on-site natural gas fired generator to provide the required station service capability for start-up. The costs to provide this capability are included in the project cost estimates.
3 Plant Siting and Licensing
The CAES project would be licensed under the new Article X siting law which was enacted at the end of the June, 2011 legislative session. Cavern solution mining, cavern use for air

Seneca Compressed Air Energy Storage (CAES) Project
Final Phase 1 Technical Report 20
storage, electric interconnection, and above ground plant licensing would be part of the Article X application. The natural gas transmission line needed to serve the CAES plant would be licensed under existing New York Article VII regulations.
Regulations to implement the new Article X law are being developed by the New York State PSC and DEC. This development effort is expected to be completed by July, 2012 at which time the application for the Seneca CAES plant would have been filed. Under this schedule, the New York State Siting Board approval would have been received in December, 2013 and plant construction would have begun shortly thereafter. Development of the air storage cavern system would also be allowed to begin following the Siting Board Approval. The CAES project cost estimate includes approximately $2-million to cover the costs of the Article X licensing process.
While the Article X process is likely to be lengthy and costly, we anticipated that the project would have been successfully licensed within the schedule and cost estimates noted above. The results of the Phase 1 studies are detailed in the following sections.
3.1 Wetlands Assessment
As part of the Phase 1 wetlands assessment for the CAES Project, both a desktop review and a preliminary field reconnaissance was conducted of the areas proposed to be disturbed by the construction and operation of the CAES Facility, including both the plant site and the linear utility lines. The outcome of the desktop review resulted in the identification of one small open-water feature at the CAES plant site and three potential wetland areas (non-New York State Department of Environmental Conservation (NYSDEC) designated) at the CAES plant site. The field reconnaissance confirmed that the areas identified in the desktop assessment are potential jurisdictional wetlands based on observations of wetland vegetation, soil characteristics, hydrology, and potential connectivity to the tributaries to Seneca Lake (see Figure 1). The preliminarily CAES plant footprint was anticipated to impact the potentially jurisdictional federal wetland areas. In addition to these three wetlands, a roadside drainage swale was noted along Jennings Road and State Route 28 near the proposed substation location. Based on this preliminary field reconnaissance, no wetlands were observed along the proposed underground pipeline route corridor leading approximately south and east of the Project site.

Seneca Compressed Air Energy Storage (CAES) Project
Final Phase 1 Technical Report 21
Figure 1 – Potential Wetland Areas on Proposed CAES Facility Site
As a result of the preliminary field reconnaissance, under Phase 2 of the Project a request for formal jurisdictional wetland delineations would have to be submitted to the US Army Corps of Engineers (USACE), Buffalo Division. If the potential wetlands were determined jurisdictional, wetlands impact mitigation may have included both avoidance and minimization of impacts to jurisdictional wetland areas. Where impacts to wetlands cannot be avoided, compensatory mitigation options have been identified by USACE and in the US Environmental Protection Agency’s (USEPA) Wetlands Compensatory Mitigation Rule. For the CAES Project, the primary focus of any compensatory mitigation requirements would likely have been to restore the wetland functions and services lost due to the Project by re-establishing a wetland in a suitable location within the Oswego River/Finger Lakes Watershed/Seneca Lake sub-watershed. Creation of a new wetland for compensatory mitigation would require a site that meets criteria for successfully developing wetlands. Compensatory mitigation measures typically require the restoration or creation of a larger wetland area than the area of wetland lost. Specific wetlands permitting requirements for the Project would have been determined as part of Phase 2.
If the wetland loss associated with the CAES Project had not qualified for a USACE Nationwide Permit (i.e., a streamlined permitting process), then an Individual USACE Permit would have been required. Wetland mitigation is a typical component of the USACE permitting process. The estimated time to receive a permit from USACE is approximately 9 to12 months following submittal of a completed permit application package. If all three wetlands were permanently impacted by the CAES Project, using the preliminary estimate of 1.3 acres of total wetland in the CAES Project footprint, a 3.9-acre (3X ratio factor) created

Seneca Compressed Air Energy Storage (CAES) Project
Final Phase 1 Technical Report 22
wetland area may have been required to compensate for the wetlands lost. This equates to an approximate wetlands construction cost of $390,000. Purchase of 4 acres of land for the wetland mitigation area construction could cost $100,000, depending on the location selected. Following construction of a wetland mitigation area, long-term maintenance and monitoring would likely be required for a period of at least 5 years at a cost of approximately $25,000 per year. These costs have been included in the project cost estimate and financial analysis.
3.2 Environmental Justice Assessment
A review and an analysis was conducted of potential environmental justice areas that could be affected by the CAES Project, identified existing environmental burden conditions on the area, and evaluated additional burden of any significant adverse environmental impact. Based on this review of the socioeconomic and demographic data, development of the CAES Project in Schuyler County, New York would not result in disproportionately high or adverse impacts to low income populations, or to minority or other identifiable groups. No impacts to environmental justice populations as defined by the applicable policies and regulations are anticipated by the CAES Project.
3.3 Cultural Resources
A Cultural Resources Survey was performed to establish whether any previously-identified historic properties exist within the Project’s Areas of Potential Effects (APE’s) and to investigate the potential existence of previously unidentified historic properties. No archaeological sites are known to exist within the direct APE, nor within two miles of the project area. However, a limited subsurface archaeological testing was recommended for Phase 2 of the Project to evaluate the level of prior disturbance throughout the Project area and to confirm the low sensitivity finding. A review of previously recorded historic architectural resources indicated that there are no such resources within the direct APE. However, once the indirect APE was determined, a survey would have been needed to determine whether any significant historic structures exist within the indirect APE. The likely scenario for Phase 2 of the CAES Project is that, after consulting with the New York State Historic Preservation Office (NYSHPO), they would have asked for a limited archaeological survey of some portion of the direct CAES Project footprint. The cost for this level of archaeological survey would range from $50,000 to $65,000. For a modest architecture survey of a reasonable visual APE, the range of costs would be $20,000 to $30,000. For this mid-range effort, it would take approximately two to three weeks to complete the field work and another three to four weeks to prepare the findings report after the fieldwork is completed. These costs have been included in the project cost estimate and financial analysis.
3.4 Land Use Assessment
In general, the local and regional land use laws and plans share a similar goal of protecting viable farmland as a cornerstone of the local economy and to maintain the rural character of

Seneca Compressed Air Energy Storage (CAES) Project
Final Phase 1 Technical Report 23
the region. The Project’s proximity to a proposed industrial land use (Finger Lake LPG storage), an existing industrial land use (salt mining), and a commercial land use (truck repair facility) would likely be considered more compatible than locating the Project in a more residential or strictly agricultural area within the Town of Reading. A portion of the Project (water intake structure and associated pipeline, pump house, and underground pipelines) is within the Seneca Lake Protection Area. The Town of Reading’s Land Use Law permits no structures within 25 feet of the mean high water line of Seneca Lake. Construction of the water supply intake structure and its associated water intake pipeline for the Project would have been located in Seneca Lake and appear to conflict with the structures within 25 feet of the mean high water line requirement in the Land Use Law. Additional investigation regarding the potential for a variance from this requirement would have been required.
3.5 Vegetation & Wildlife
The terrestrial ecological resources within the Project area have been identified as to the type of vegetation, wildlife, wildlife habitat, and wildlife travel corridors. Wildlife may have been subject to some disturbance and displacement during the construction phase of the CAES Project. These impacts are anticipated to be minor and temporary, ceasing upon completion of the Project. Given the abundance and broad range of forested and open field habitats that exist nearby the CAES Project site that will not be disturbed, impacts to wildlife and wildlife corridors were anticipated to be minor. A review of the USFWS database of federally listed endangered and threatened species and candidate species revealed no federally protected animal species known to occur within Schuyler County. The New York State Natural Heritage Program indicated that no rare or state-listed animals and plants, significant natural communities, or other significant habitats occur on or in the vicinity of the CAES Project. A separate listing of the Endangered, Threatened and Special Concern Fish and Wildlife Species of New York State and their habitat ranges, identified Schuyler County within the range of four avian and bat species. Based on information provided by the Natural Heritage Program, the four protected species listed are not anticipated to be within the vicinity of the CAES Project.
3.6 Water Resources
Potential impacts on water resources from the construction and operation of the Project were assessed. Construction of the plant, the underground pipelines, and the aboveground power lines may have temporarily impacted Seneca Lake and two of its tributaries. The CAES facility was expected to withdraw approximately 0.47 million gallons per day (mgd) from Seneca Lake. According to the NYSDEC inflow to Seneca Lake is approximately 470 mgd from tributaries and groundwater inflow. As such, the CAES water intake rate represents approximately 0.1 percent of the average inflow to Seneca Lake. To supplement the make up water demand and to minimize the amount of water withdrawn from Seneca Lake, storm water runoff was to be collected and stored in an on-site retention pond. Cooling tower blowdown from the facility would have been the principal wastewater discharged to Seneca Lake where it would be diluted and mixed with water in Seneca Lake. For this assessment, a mixing zone is assumed to exist. However, consultation with

Seneca Compressed Air Energy Storage (CAES) Project
Final Phase 1 Technical Report 24
NYSDEC would have been required to determine acceptable analysis methodologies to evaluate the impacts of discharging cooling tower blowdown into Seneca Lake.
3.7 Visual Impacts
Visibility impacts associated with proposed structures on the CAES plant site were assessed based on the surrounding ground surface elevation and potential screening forest cover.
Proposed Site Layout (Cycle 1) Looking Southeast
Proposed Site Layout (Cycle 2) Looking Southeast

Seneca Compressed Air Energy Storage (CAES) Project
Final Phase 1 Technical Report 25
The area with the highest potential visibility of structures on the main plant site is the eastern side of Seneca Lake. The eastern shoreline of the lake has a high predicted visibility due to the lower elevation and direct line of site created by the open water. The forest cover on the eastern side of the lake, however, extends to the shoreline and so when vegetation screening is taken into account, the potential visibility decreases dramatically away from the shoreline. The potential visibility of the site decreases further east, due to elevation changes with the ridge dropping away to the east. North, south, and west of the site generally have lower predicted visibility because of topographic variations and existing forest cover screening the site from view.
3.8 Air Resources
Potential impacts on air resources from the construction and operation of the Project were assessed. Impacts during construction of the plant would have been temporary and minimized by implementing a fugitive dust control plan. Air emissions from the CAES Plant would be controlled to meet applicable new source performance standards and new source review/prevention of significant deterioration of air quality requirements. During Phase 2 air quality dispersion modeling would have been performed to demonstrate that the emissions from the CAES Plant would not cause a violation of national ambient air quality standards.
4 Air Storage Cavern and Air Production Well Design
4.1 Background
NYSEG had an agreement with Inergy under which Inergy had agreed to provide NYSEG with a suitable air storage cavern (either new or existing) and surface area sufficient to accommodate the above-ground plant for the anticipated term of the project. This agreement also contains terms specifying the proposed lease term, annual rent, and rental escalation provisions for both the cavern and ground portions of the lease, which have been factored into the economic calculations in this report.
In March, 2011, Inergy proposed to provide NYSEG with a new storage cavern and adjacent ground lease on a site approximately one mile west of the existing salt cavern field. The proposed site is located on a property owned by Inergy that is located on the west side of NYS Route 14.
The proposed site is adjacent to a proposed propane and butane unloading facility that Inergy is currently in the process of licensing. There is sufficient room on the site to locate the CAES plant and still maintain safe distances (per NFPA guidelines) from the propane and butane unloading facilities. The site does have a number of positive attributes, including:
• The area is on a flat, level parcel with minimum of cut and fill required.

Seneca Compressed Air Energy Storage (CAES) Project
Final Phase 1 Technical Report 26
• The site is within one half mile of the electric transmission interconnection and there is a very direct transmission corridor from the plant site to the 967 and 970 lines.
• The site is well screened to the east and south by mature trees; there will be very limited visual impact as seen from the lake and the eastern shore.
• This area of Central New York overlays an extensive formation of bedded salt beginning at the 2,300 foot level below the surface and the development of new, solution-mined salt caverns should not be an issue.
• There are some adjoining properties to the plant site that could be acquired to provide a buffer zone around the plant; the only residential structure in the immediate vicinity of the site is on one of these properties.
The original Seneca CAES DOE proposal was based on a January, 2008 study conducted by Parsons Brinkerhoff Energy Storage Services (PBESS) and EPRI. That study determined that an existing cavern (Gallery #2 on the US Salt property adjacent to the former NYSEG Seneca Natural Gas Storage facility) of approximately 5 million cubic feet in size could operate safely and reliably in support of a 180 MW CAES plant. The plant operating range studied was between 1,670 psig and 400 psig. The results of this study formed the basis of the cavern agreement between Inergy and NYSEG.
During Phase 1 of the Seneca CAES project, NYSEG again retained PBESS to review the CAES plant design basis and to develop a new cavern design, solution mining plan, cost estimate, and schedule, along with an air production well design. NYSEG, working with WorleyParsons the Phase 1 General Technical Contractor and with Customized Energy Solutions the Phase 1 Dispatch Modeling Contractor, developed a preliminary design basis for the CAES cycles and the air storage cavern. The preliminary design basis for the air storage cavern is shown below:
Maximum wellhead operating pressure 1,500 psig
Minimum wellhead operating pressure 750 psig
Maximum wellhead flow rate (at 480 psig) 660 #/second
New Cavern compressed air recharge cycle length 8 hours
New Cavern compressed air discharge cycle length 10 to 12 hours
Expected Number of Charge/Discharge Cycles 260 cycles/year
Temperature of compressed air at wellhead 95o F
Cavern Free Void Space 5 million ft3
Seneca Compressed Air Energy Storage (CAES) Project
Final Phase 1 Technical Report 27
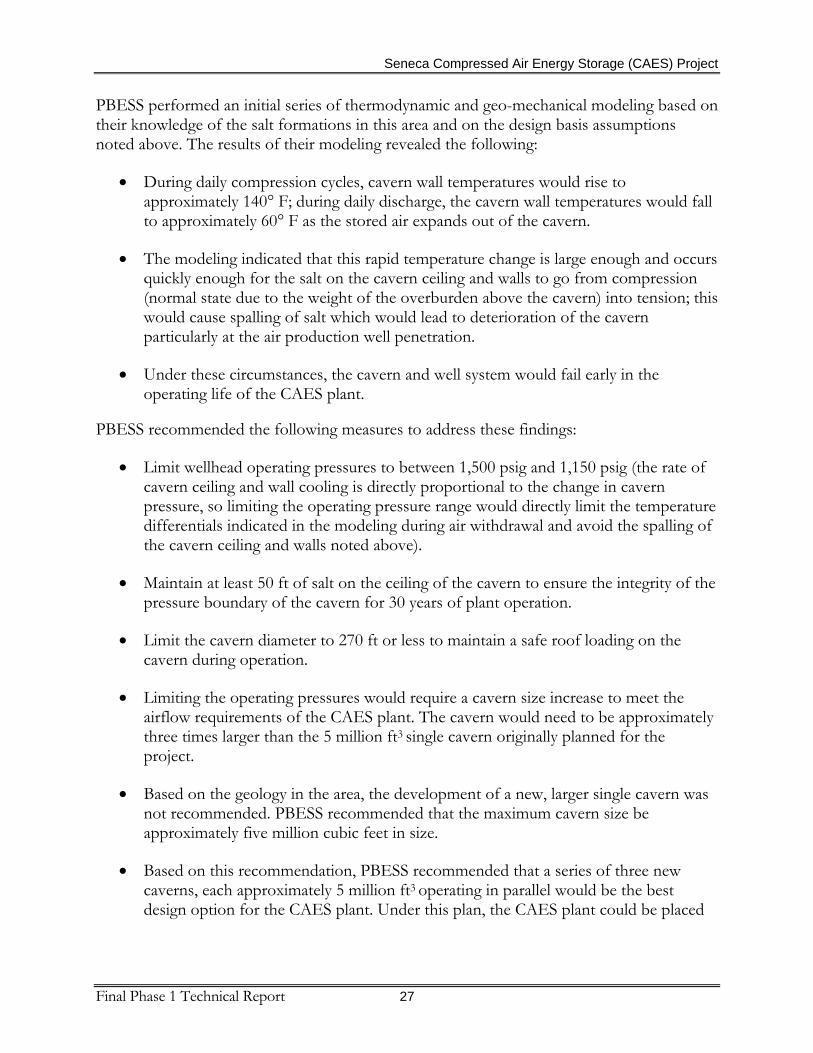
PBESS performed an initial series of thermodynamic and geo-mechanical modeling based on their knowledge of the salt formations in this area and on the design basis assumptions noted above. The results of their modeling revealed the following:
• During daily compression cycles, cavern wall temperatures would rise to approximately 140° F; during daily discharge, the cavern wall temperatures would fall to approximately 60° F as the stored air expands out of the cavern.
• The modeling indicated that this rapid temperature change is large enough and occurs quickly enough for the salt on the cavern ceiling and walls to go from compression (normal state due to the weight of the overburden above the cavern) into tension; this would cause spalling of salt which would lead to deterioration of the cavern particularly at the air production well penetration.
• Under these circumstances, the cavern and well system would fail early in the operating life of the CAES plant.
PBESS recommended the following measures to address these findings:
• Limit wellhead operating pressures to between 1,500 psig and 1,150 psig (the rate of cavern ceiling and wall cooling is directly proportional to the change in cavern pressure, so limiting the operating pressure range would directly limit the temperature differentials indicated in the modeling during air withdrawal and avoid the spalling of the cavern ceiling and walls noted above).
• Maintain at least 50 ft of salt on the ceiling of the cavern to ensure the integrity of the pressure boundary of the cavern for 30 years of plant operation.
• Limit the cavern diameter to 270 ft or less to maintain a safe roof loading on the cavern during operation.
• Limiting the operating pressures would require a cavern size increase to meet the airflow requirements of the CAES plant. The cavern would need to be approximately three times larger than the 5 million ft3 single cavern originally planned for the project.
• Based on the geology in the area, the development of a new, larger single cavern was not recommended. PBESS recommended that the maximum cavern size be approximately five million cubic feet in size.
• Based on this recommendation, PBESS recommended that a series of three new caverns, each approximately 5 million ft3 operating in parallel would be the best design option for the CAES plant. Under this plan, the CAES plant could be placed

Seneca Compressed Air Energy Storage (CAES) Project
Final Phase 1 Technical Report 28
into commercial operation at a much earlier time (with limited operating time at full load) with at least one cavern ready for service.
The final design basis for the air storage cavern system is shown below:
Number of Caverns Required 3
Maximum wellhead operating pressure 1,500 psig
Minimum wellhead operating pressure 1,150 psig
Maximum wellhead flow rate (at 480 psig) 660 #/second
New Cavern compressed air recharge cycle length 8 hours
New Cavern compressed air discharge cycle length 10 to 12 hours
Expected Number of Charge/Discharge Cycles 260 cycles/year
Temperature of compressed air at wellhead 95o F
Total Cavern Free Void Space 15 million ft3
Total Usable Air Storage Inventory 17.8 million #
PBESS proceeded to develop the detailed cavern designs, well designs, and solution mining plan based on this design basis.
4.2 Cavern Design
PBESS was tasked with developing a three cavern design. This work scope included the cavern design, solution mining plan, well design, and overall cost and schedule estimates. The cavern system would have been developed in cooperation with Inergy/US Salt. The solution mining program is based on a brine acceptance rate of 350 GPM at the US Salt plant. Based on this take-away rate, PBESS estimated that it would take approximately two years to solution mine each cavern. As a result, the CAES plant would enter commercial operation with only one cavern in service which would have limited the operating hours but would not have limited the maximum generation output of the plant. The second and third caverns would come on line at approximately two year intervals following cavern number one. Current schedule estimates indicate that full three cavern operation would not be achieved until 2021. The capability of the cavern system is summarized below:
• The CAES cycles require a working gas capacity of 17.8 million lbs of air. Using the proposed cavern system design:
– Three caverns operating in parallel would provide about 18 million lbs or 102 percent of this capacity (34 percent per cavern)

Seneca Compressed Air Energy Storage (CAES) Project
Final Phase 1 Technical Report 29
– Two caverns operating in parallel would provide about 11 million lbs or 62 percent of this capacity (31 percent per cavern)
– A single cavern operating alone would provide about 5.1 million lbs or 29 percent of this capacity
The dispatch modeling/financial modeling for the project incorporates this phased-in cavern development approach. If the Seneca CAES project were proceeding into Phase 2 development, NYSEG would have discussed with Inergy/US Salt whether there may have been opportunities to modify and enhance the brine take-away rates in order to accelerate the development of the cavern system. The caverns would have been developed using conventional solution mining techniques well known in the industry. The proposed cavern design would include a single air production well for each cavern, with Cavern #1 using a 20 inch diameter well (to permit full load operation during development of Caverns #2 and #3). Caverns #2 and #3 would utilize 16 inch air production wells. The well liners would be 316 Stainless Steel for corrosion resistance.
The cavern design is shown in the schematic below. The cavern roof spans and profiles have been developed by PBESS to ensure reliable operation for the thirty year design life of the CAES plant.

Seneca Compressed Air Energy Storage (CAES) Project
Final Phase 1 Technical Report 30
4.3 Cavern and Well System Cost and Schedule Estimate
The cavern and well system development schedule has been incorporated into the overall project schedule and has been used in the dispatch model. Milestones for the cavern system included:
• Begin Cavern #1 Development in December, 2013 upon receipt of Article X approval; cavern and well system ready for service in July, 2016. (This date includes the time after completing cavern #1 for the above grade commissioning and start-up activities that need the cavern in operational status.)
• Begin Cavern #2 Development in April, 2016; cavern and well ready for service in November, 2018.
• Begin Cavern #3 Development in September, 2018; cavern and well ready for service in March, 2021.
The estimated cost to develop the cavern and well system is $39-million, and has been included in the project cost estimates. 5 CAES Front End Engineering Design
5.1 Equipment Description CAES 1 and 1A
The CAES 1 and CAES 1A cycles consist of separate compression and generation trains each capable of being independently operated. All of the major turbo machinery would be provided by Dresser-Rand, and Dresser-Rand would offer performance guarantees for the equipment and for the cycle.
The CAES 1 compression trains consist of two independently driven compressors which would take air at atmospheric pressure and compress the air to 1,500 psig. One train would be equipped with a 100 MW synchronous A/C motor, and the other with a 70 MW synchronous A/C motor. Both compressor trains include a low pressure compressor (axial flow), followed by intermediate and high pressure compressors (centrifugal) in series. Both compressors are equipped with interstage cooling to achieve high efficiency and both are equipped with an after-cooler on the discharge of the high pressure compressor to maintain air temperatures entering the well and cavern system to 95°F. The interstage and after stage cooling would reject low grade waste heat to a mechanical draft cooling tower with tower make-up water to be supplied from Seneca Lake. The compressors and electric motor drives would be coupled using a hydraulic clutch assembly that would allow the motors to be quickly and easily de-coupled from the compressors so that the motors can operate a synchronous condensers to provide VAR support to the transmission system. The compressor motors would also be capable of being operated with a leading power factor of approximately 96% to provide the VAR support while they are running that would otherwise require installation of 115 kV switched capacitors. The compressor motors would be started

Seneca Compressed Air Energy Storage (CAES) Project
Final Phase 1 Technical Report 31
using a Variable Frequency Drive so that starting transients are not imposed onto the 115 kV transmission system.
The CAES 1A design is similar to the above description except that it is a single train using a single large motor drive (170 MW) to power the compressors.
The CAES 1 generation train consists of two air expanders coupled to a common electric generator. The net output of the generation train is expected to be 136 MW. Both air expanders would be preceded by an external combustor firing natural gas. The high pressure air expander would be a steam turbine that has been converted to operate on air. The low pressure expander has been specifically designed for CAES cycle operation. The electric generator can provide limited VAR support at the same time as it is generating, and the generator would also be equipped with a fast acting hydraulic clutch so that it can be decoupled from the air expanders. The generator can then be operated as a synchronous condenser similar to the compressor motors to provide significant VAR support to the 115 kV transmission system. The CAES 1A generation train consists of a single generator driven at either end by an HP/LP expander combination. Clutches on either end of the generator allow it to be driven by either one or both of the expander trains. Both expander trains would have their own recuperator and stack.
The recuperator would include both a CO catalyst and SCR to maintain emissions compliance. The high and low pressure combustors would also utilize demineralized water injection to help maintain NOx compliance. Make-up demineralized water equipment and storage tanks would also be part of the cycle design.
A substation located at the CAES plant site would connect the plant to NYSEG’s transmission system. A 115 kV switchyard would be built adjacent to NYSEG’s Lines 967 and 970 where the physical interconnection would occur. This new switchyard would include all circuit breakers and metering equipment specified in NYSEG’s Interconnection Standards. A 115 kV single circuit wood pole line approximately one half mile long would connect the plant substation with the Interconnection Point switchyard.
A natural gas interconnection would be made to Inergy’s Seneca West Transmission Pipeline near the Seneca Natural Gas Storage compressor building. A new, one mile natural gas transmission line would be built by NYSEG’s Gas Department to serve the CAES plant. The pressure in the Seneca West Pipeline varies during the course of seasonal operation so a small natural gas compressor station would need to be installed at the CAES plant site to ensure that 950 psig natural gas is available to supply the high pressure combustor. The low pressure combustor operates at 400 psig which is well below the minimum Seneca West pressure so no upstream natural gas compression would be required. At full load, the CAES 1 plant would consume approximately 15 dekatherms per hour. At full load, the CAES 1A plant would consume approximately 23 dekatherms per hour.
The CAES 1 and 1A plants would be housed in a building to provide noise shielding and to allow the plant to be operated and maintained in the central New York climate. The building

Seneca Compressed Air Energy Storage (CAES) Project
Final Phase 1 Technical Report 32
would also incorporate a control room, small office, maintenance shops, and locker rooms. A meeting room and small visitor’s center would also be part of the site plan. The height of the compressor/generator building would be approximately 50 feet, and the exhaust stack(s) would be 180 feet tall with a diameter of approximately 16 feet.
The air storage caverns were planned for an area to the east of the plant as shown on the General Arrangement drawing. Production air pipelines from the wells to the plant would be built underground for personnel safety.
The plant would be equipped with a 400,000 gallon water tank to provide make-up water for cooling tower evaporative losses as well as for plant fire protection. A diesel-fired fire pump and associated fire detection and deluge systems would be installed to comply with NFPA guidelines. Propane and butane detection equipment would also be installed within the plant and at the plant boundaries, and appropriate berms would be included as part of the site plan to guard against any spills that could occur at the Inergy propane and butane unloading facility.
A natural gas fired back-up generator would be installed to provide required station service electrical support needed for plant “Black Start” operation if it is economic to provide that capability. This generator would allow the air expanders and critical plant equipment to start without the need for offsite power.
The plant control system would be a Digital Control System (DCS) designed to interface through NYSEG’s SCADA system to the New York ISO dispatch center. The CAES plant would be able to respond to automatic generation control signals directly from the NYISO. The DCS would also need to comply with FERC/NERC Cyber Security standards and the CAES plant would need to provide the DOE with an Interoperability and Cyber Security Plan that details how this compliance would be achieved and maintained.
5.2 Equipment Description CAES 2
The CAES 2 cycle consists of separate compression and generation trains each capable of being independently operated. All of the major turbo machinery with the exception of the combustion turbine would be provided by MAN Diesel Turbo (MDT), and MDT would offer performance guarantees for the equipment and for the cycle. A General Electric Frame 7EA combustion turbine has been modeled in the analysis of the CAES 2 cycle.
The compression trains consist of two independently driven compressors which would take air at atmospheric pressure and compress the air to 1,500 psig. Each train would be equipped with an 85 MW synchronous A/C motor. Both compressor trains include a low pressure compressor (axial flow), followed by a high pressure compressor (centrifugal) in series. Both compressors would be equipped with interstage cooling to achieve high efficiency and both would be equipped with an after-cooler on the discharge of the high pressure compressor to maintain air temperatures entering the well and cavern system to 95°F. The interstage and after stage cooling would reject low grade waste heat to a

Seneca Compressed Air Energy Storage (CAES) Project
Final Phase 1 Technical Report 33
mechanical draft cooling tower with tower make-up water to be supplied from Seneca Lake. The compressors and electric motor drives can be coupled using a hydraulic clutch assembly that would allow the motors to be quickly and easily de-coupled from the compressors so that the motors can operate as synchronous condensers to provide VAR support to the transmission system. The compressor motors would also be capable of being operated with a leading power factor of approximately 96% to provide the VAR support while running that would otherwise require installation of 115 kV switched capacitors. The compressor motors would be started using a Variable Frequency Drive so that starting transients are not imposed onto the 115 kV transmission system.
The generation train consists of two parallel air expanders with separate electric generators. The generation train also includes a GE Frame 7 EA combustion turbine. The net output of the composite generation train is expected to be 226 MW, but site electrical take-away capability would limit the unit to approximately 210 MW net output. Both expanders would be steam turbines that have been converted to operate on air. The electric generators could provide limited VAR support at the same time as they are generating, and the generators could also be equipped with a fast acting hydraulic clutch so that they could be decoupled from the air expanders. The generators could be operated as synchronous condensers similar to the compressor motors to provide significant VAR support to the 115 kV transmission system. The combustion turbine generator would not be equipped with clutches and would not be operated as a synchronous condenser.
The recuperator would include both a CO catalyst and SCR to maintain emission compliance.
A substation located at the CAES plant site would connect the plant to NYSEG’s transmission system. A 115 kV switchyard would be built adjacent to NYSEG’s Lines 967 and 970 where the physical interconnection would occur. This new switchyard would include all circuit breakers and metering equipment specified in NYSEG’s Interconnection Standards. A 115 kV single circuit wood pole line approximately one half mile long would connect the plant substation with the Interconnection Point switchyard.
A natural gas interconnection would be made to Inergy’s Seneca West Transmission Pipeline near the Seneca Natural Gas Storage compressor building. A new, one mile natural gas transmission line would be built by NYSEG’s Gas Department to serve the CAES plant. The combustion turbine would operate at 350 psig which is well below the minimum Seneca West pressure so no upstream natural gas compression would be required. At full load, the CAES 2 plant would consume approximately 23 dekatherms per hour.
The CAES 2 plant would be housed in a building to provide noise shielding and to allow the plant to be operated and maintained in the central New York climate. The building would also incorporate a control room, small office, maintenance shops, and locker rooms. A meeting room and small visitor’s center would also be part of the site plan. The height of the compressor/generator building would be approximately 50 feet, and the exhaust stack would be 180 feet tall with a diameter of approximately 16 feet.

Seneca Compressed Air Energy Storage (CAES) Project
Final Phase 1 Technical Report 34
The air storage caverns were planned for an area to the east of the plant as shown on the General Arrangement drawing. Production air pipelines from the wells to the plant would be built underground for personnel safety.
The plant would be equipped with a 400,000 gallon water tank to provide make-up water for cooling tower evaporative losses as well as for plant fire protection. A diesel-fired fire pump and associated fire detection and deluge systems would be installed to comply with NFPA guidelines. Propane and butane detection equipment would also be installed within the plant and at the plant boundaries, and appropriate berms would be included as part of the site plan to guard against any spills that could occur at the Inergy propane and butane unloading facility.
A natural gas fired back-up generator would be installed to provide required station service electrical support needed for plant “Black Start” operation if it is economic to provide that capability. This generator would allow the air expanders and critical plant equipment to start without the need for offsite power.
The plant control system would be a Digital Control System (DCS) designed to interface through NYSEG’s SCADA system to the New York ISO dispatch center. The CAES plant would be able to respond to automatic generation control signals directly from the NYISO. The DCS would also need to comply with FERC/NERC Cyber Security standards and the CAES plant would need to provide the DOE with an Interoperability and Cyber Security Plan that details how this compliance would be achieved and maintained.
5.3 Operational Capabilities
The CAES 1/1A and 2 designs offer a number of operational capabilities that would provide significant flexibility in meeting both current and future wholesale electric market needs. Among these capabilities are the following:
• The compression trains could be started very rapidly (approximately 10 minutes to full operation) to capture short term opportunities in which wholesale electric market prices might fall to very low levels due to system upsets or short term (one to two hour) transients. While NYSEG would likely limit the number of starts per year to maintain long term equipment material condition, the compression train would have a high degree of flexibility to take advantage of short term low or negative prices in the wholesale markets.
• The compression trains would be large enough to charge the cavern system in under 8 hours to allow the CAES plant to operate in daily cycling mode to maximize wholesale electric market revenue opportunities.
• The compressors could be quickly and easily decoupled from the electric drive motors so that the motors could operate as synchronous condensers to provide VAR support to the transmission system during any hour in which compression operations

Seneca Compressed Air Energy Storage (CAES) Project
Final Phase 1 Technical Report 35
are not required. These are very large electric motors and would be capable of providing significant levels of leading and lagging power factor support. The use of a Variable Frequency Drive (VFD) would allow the motors to be started very quickly in response to a decision to operate in synchronous condenser mode.
• The CAES 1 and 1A air expander-generators could be started very quickly and could achieve full load within approximately 10 minutes from a signal to start.
• The CAES 2 combustion turbine and air expander-generators could be started quickly and could achieve full load within approximately 30 minutes from a signal to start.
• The cycles would be capable of responding to load changes very rapidly (up to 25 MW /minutes if required) and would be capable of providing 8 MW/minute of regulation service in direct response to automatic generation control signals from the NYISO.
• The air expander-generators could provide limited VAR support during operation and could provide significant VAR support when not in generation service using a clutch and VFD similar to the compressor motors.
• The CAES 1/1A design could operate between full load and 10% load while remaining in environmental compliance.
• The CAES 2 design could operate between full load and 25% load while remaining in environmental compliance.
• The combustion turbine, air expanders, and compressors are based on established designs and product experience in the refining, petrochemical, and oil/gas production markets, and the vendors have extensive engineering and maintenance support capabilities.
5.4 Operational Performance
CAES Cycle 1/1A performance across a major portion of the load range would be remarkably stable between 100% and 30% load. CAES Cycle 2 performance across a major portion of the load range would be remarkably stable between 100% and 50% load. The performance of the units would not be significantly affected by ambient temperature and relative humidity. While the plant may experience some minor performance degradation over time, proper maintenance should provide long term, stable operation.
6 CAES Project Development Schedule
The licensing and construction of the above ground portion of the plant would take approximately four and one-half years from the Notice to Proceed. The schedule would be

Seneca Compressed Air Energy Storage (CAES) Project
Final Phase 1 Technical Report 36
essentially the same for both CAES cycles. The solution mining of the first storage cavern would also occur during this period. A high level illustration of this schedule is shown below:
7 Project Cost Estimates
The capital cost estimates for the CAES 2 cycles were developed by WorleyParsons using a “bottom up” approach based on detailed Front End Engineering Design and supported by vendor quotes for major equipment and systems. Bulk materials, construction costs, transportation costs, and contingencies were developed using WorleyParsons standard project estimating practices. NYSEG provided estimates for Owner’s Costs and AFUDC. The project cost estimates developed by WorleyParsons were escalated to the periods in which the expenditures would actually be made according to the overall project schedule. WorleyParsons engaged Cambridge Energy Research Associates (CERA) to obtain escalation indices for each year during Phase 2 for the project. Indices were obtained for 12 key equipment and bulks categories. CERA offered the indices based upon two different scenarios, “Global Redesign” and “Vortex”. The “Global Redesign” is the base (most likely) case, is the only one used by CERA for short term forecasting, and therefore was used by WorleyParsons for this project. While individual indices rose/fell by up to approximately 20% in a single year, the overall escalation for the above grade plant averaged just over 2% per year.
06/ 12
01/ 13
06/ 13
01/ 14
06/ 14
01/ 15
06/ 15
01/ 16
01/ 17
06/ 16
01/ 12
Notice to Proceed
Article X
Final Design
Interconnection Application
Procurement/Contracting
Cavern #1 Development
Interconnection Construction
Major Equipment Delivery
Plant Construction
Commissioning
Commercial Operation8/16
06/ 12
01/ 13
06/ 13
01/ 14
06/ 14
01/ 15
06/ 15
01/ 16
01/ 17
06/ 16
01/ 12
06/ 12
01/ 13
06/ 13
01/ 14
06/ 14
01/ 15
06/ 15
01/ 16
01/ 17
06/ 16
01/ 12
06/ 12
01/ 13
06/ 13
01/ 14
06/ 14
01/ 15
06/ 15
01/ 16
01/ 17
06/ 16
01/ 12
06/ 12
01/ 13
06/ 13
01/ 14
06/ 14
01/ 15
06/ 15
01/ 16
01/ 17
06/ 16
01/ 12
Notice to ProceedNotice to Proceed
Article XArticle X
Final DesignFinal Design
Interconnection ApplicationInterconnection Application
Procurement/ContractingProcurement/Contracting
Cavern #1 DevelopmentCavern #1 Development
Interconnection ConstructionInterconnection Construction
Major Equipment DeliveryMajor Equipment Delivery
Plant ConstructionPlant Construction
CommissioningCommissioning
Commercial Operation8/16
Commercial OperationCommercial Operation8/16
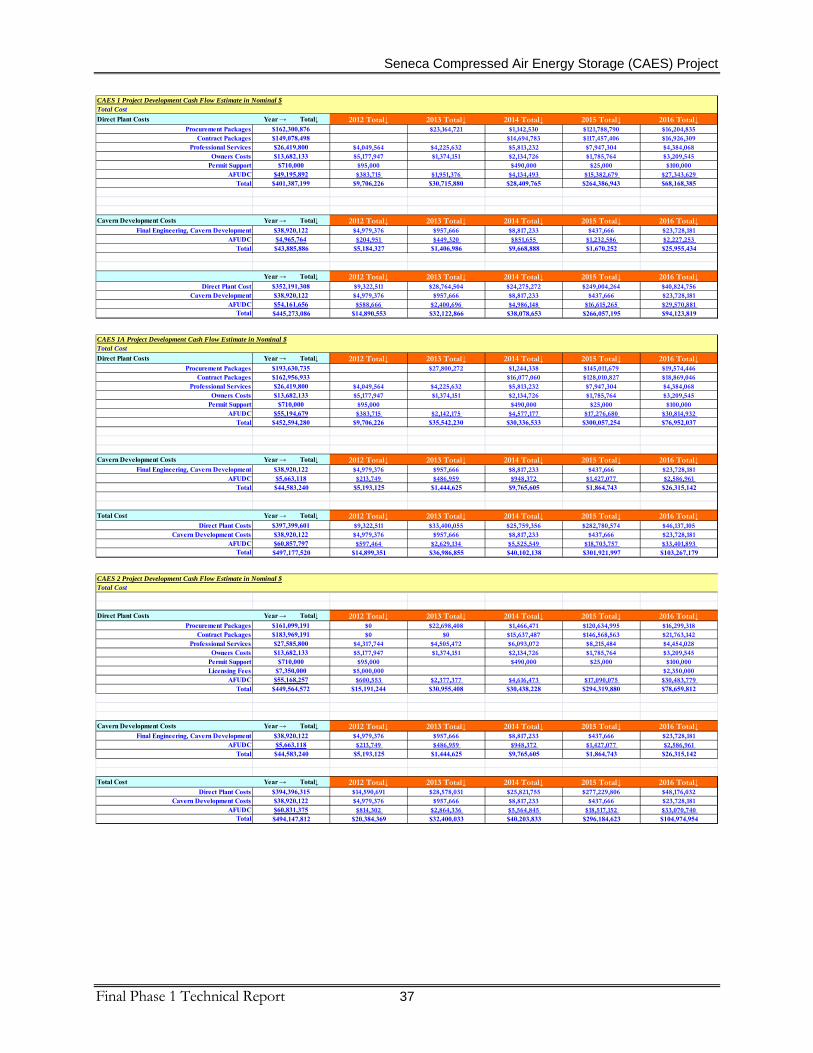
Seneca Compressed Air Energy Storage (CAES) Project
Final Phase 1 Technical Report 37
CAES 1 Project Development Cash Flow Estimate in Nominal $Total CostDirect Plant Costs Year → Total↓ 2012 Total↓ 2013 Total↓ 2014 Total↓ 2015 Total↓ 2016 Total↓
Procurement Packages $162,300,876 $23,164,721 $1,142,530 $121,788,790 $16,204,835 Contract Packages $149,078,498 $14,694,783 $117,457,406 $16,926,309
Professional Services $26,419,800 $4,049,564 $4,225,632 $5,813,232 $7,947,304 $4,384,068 Owners Costs $13,682,133 $5,177,947 $1,374,151 $2,134,726 $1,785,764 $3,209,545
Permit Support $710,000 $95,000 $490,000 $25,000 $100,000 AFUDC $49,195,892 $383,715 $1,951,376 $4,134,493 $15,382,679 $27,343,629
Total $401,387,199 $9,706,226 $30,715,880 $28,409,765 $264,386,943 $68,168,385
Cavern Development Costs Year → Total↓ 2012 Total↓ 2013 Total↓ 2014 Total↓ 2015 Total↓ 2016 Total↓Final Engineering, Cavern Development $38,920,122 $4,979,376 $957,666 $8,817,233 $437,666 $23,728,181
AFUDC $4,965,764 $204,951 $449,320 $851,655 $1,232,586 $2,227,253 Total $43,885,886 $5,184,327 $1,406,986 $9,668,888 $1,670,252 $25,955,434
Year → Total↓ 2012 Total↓ 2013 Total↓ 2014 Total↓ 2015 Total↓ 2016 Total↓Direct Plant Cost $352,191,308 $9,322,511 $28,764,504 $24,275,272 $249,004,264 $40,824,756
Cavern Development $38,920,122 $4,979,376 $957,666 $8,817,233 $437,666 $23,728,181 AFUDC $54,161,656 $588,666 $2,400,696 $4,986,148 $16,615,265 $29,570,881
Total $445,273,086 $14,890,553 $32,122,866 $38,078,653 $266,057,195 $94,123,819 CAES 1A Project Development Cash Flow Estimate in Nominal $Total CostDirect Plant Costs Year → Total↓ 2012 Total↓ 2013 Total↓ 2014 Total↓ 2015 Total↓ 2016 Total↓
Procurement Packages $193,630,735 $27,800,272 $1,244,338 $145,011,679 $19,574,446 Contract Packages $162,956,933 $16,077,060 $128,010,827 $18,869,046
Professional Services $26,419,800 $4,049,564 $4,225,632 $5,813,232 $7,947,304 $4,384,068 Owners Costs $13,682,133 $5,177,947 $1,374,151 $2,134,726 $1,785,764 $3,209,545
Permit Support $710,000 $95,000 $490,000 $25,000 $100,000 AFUDC $55,194,679 $383,715 $2,142,175 $4,577,177 $17,276,680 $30,814,932
Total $452,594,280 $9,706,226 $35,542,230 $30,336,533 $300,057,254 $76,952,037
Cavern Development Costs Year → Total↓ 2012 Total↓ 2013 Total↓ 2014 Total↓ 2015 Total↓ 2016 Total↓Final Engineering, Cavern Development $38,920,122 $4,979,376 $957,666 $8,817,233 $437,666 $23,728,181
AFUDC $5,663,118 $213,749 $486,959 $948,372 $1,427,077 $2,586,961 Total $44,583,240 $5,193,125 $1,444,625 $9,765,605 $1,864,743 $26,315,142
Total Cost Year → Total↓ 2012 Total↓ 2013 Total↓ 2014 Total↓ 2015 Total↓ 2016 Total↓Direct Plant Costs $397,399,601 $9,322,511 $33,400,055 $25,759,356 $282,780,574 $46,137,105
Cavern Development Costs $38,920,122 $4,979,376 $957,666 $8,817,233 $437,666 $23,728,181 AFUDC $60,857,797 $597,464 $2,629,134 $5,525,549 $18,703,757 $33,401,893
Total $497,177,520 $14,899,351 $36,986,855 $40,102,138 $301,921,997 $103,267,179 CAES 2 Project Development Cash Flow Estimate in Nominal $Total Cost
Direct Plant Costs Year → Total↓ 2012 Total↓ 2013 Total↓ 2014 Total↓ 2015 Total↓ 2016 Total↓Procurement Packages $161,099,191 $0 $22,698,408 $1,466,471 $120,634,995 $16,299,318
Contract Packages $183,969,191 $0 $0 $15,637,487 $146,568,563 $21,763,142 Professional Services $27,585,800 $4,317,744 $4,505,472 $6,093,072 $8,215,484 $4,454,028
Owners Costs $13,682,133 $5,177,947 $1,374,151 $2,134,726 $1,785,764 $3,209,545 Permit Support $710,000 $95,000 $490,000 $25,000 $100,000 Licensing Fees $7,350,000 $5,000,000 $2,350,000
AFUDC $55,168,257 $600,553 $2,377,377 $4,616,473 $17,090,075 $30,483,779 Total $449,564,572 $15,191,244 $30,955,408 $30,438,228 $294,319,880 $78,659,812
Cavern Development Costs Year → Total↓ 2012 Total↓ 2013 Total↓ 2014 Total↓ 2015 Total↓ 2016 Total↓Final Engineering, Cavern Development $38,920,122 $4,979,376 $957,666 $8,817,233 $437,666 $23,728,181
AFUDC $5,663,118 $213,749 $486,959 $948,372 $1,427,077 $2,586,961 Total $44,583,240 $5,193,125 $1,444,625 $9,765,605 $1,864,743 $26,315,142
Total Cost Year → Total↓ 2012 Total↓ 2013 Total↓ 2014 Total↓ 2015 Total↓ 2016 Total↓Direct Plant Costs $394,396,315 $14,590,691 $28,578,031 $25,821,755 $277,229,806 $48,176,032
Cavern Development Costs $38,920,122 $4,979,376 $957,666 $8,817,233 $437,666 $23,728,181 AFUDC $60,831,375 $814,302 $2,864,336 $5,564,845 $18,517,152 $33,070,740
Total $494,147,812 $20,384,369 $32,400,033 $40,203,833 $296,184,623 $104,974,954

Seneca Compressed Air Energy Storage (CAES) Project
Final Phase 1 Technical Report 38
The total cost profiles are illustrated in the chart below:
Original Cost Estimate CAES 1 CAES 1A CAES 2
($1,0
00)
CAES Capital Costs
Procurement Packages Contract Packages Professional Services Owners Costs
Permit Support Licensing Fees Cavern Development AFUDC
$445,273
$497,178 $494,148
$125,006
8 Wholesale Electricity Price Forecasting and CAES Plant Dispatch Modeling
8.1 NYISO Market Overview
The NYISO facilitates and administers the markets for installed capacity, energy, ancillary services, and transmission congestion contracts.
Installed Capacity Market
The Installed Capacity (ICAP) Market was established to ensure that there is sufficient generation capacity to cover the capacity requirements determined by the NYISO. An ICAP resource is a generator or load facility that is accessible to the NYS transmission system, which is capable of supplying and/or reducing the demand in the NYCA and complies with the requirements of the reliability rules.
Energy Market
The energy market provides a mechanism for Market Participants to buy and sell energy at the Location Based Marginal Price (LBMP). The generators designated by Security Constrained Unit Commitment (SCUC) program to be available for the next day are dispatched against the Load Serving Entity (LSE) bid-in load and losses. From the dispatch, LBMP's are computed, and day-ahead forward contracts are established for generation and load accordingly. Subsequently, during real-time operation, changes in operating conditions, the influence of additional real-time supply bids and variations in actual load will cause the real-time schedules and prices to be different from the day-ahead schedules and prices.

Seneca Compressed Air Energy Storage (CAES) Project
Final Phase 1 Technical Report 39
Differences between the day-ahead and real-time generation levels and load consumption values are settled at the second settlement, or real-time price.
Ancillary Services Market
Ancillary services support the transmission of energy and reactive power from supply resources to loads and are used to maintain the operational reliability of the NYS power system. The ancillary services include:
• Regulation and Frequency Response Service: This service is accomplished by committing Generators, including Limited Energy Storage Resources (LESR's) and Demand Side Resources (Regulation Service Suppliers), whose output or demand is raised or lowered (predominately using Automatic Generation Control (AGC)) as necessary to follow moment-by-moment changes in load.
• Operating Reserves Service: The NYISO values Spinning Reserve to be the “highest quality” Operating Reserve, followed by 10-Minute Non-Synchronized Reserve and by 30-Minute Reserve (spinning and then non-synchronized). The price of higher quality Operating Reserves will not be set at a price below the price of lower quality Operating Reserves in the same location.
• Voltage Support Service (VSS): In order to maintain transmission voltages on the NYS Transmission System within acceptable limits, facilities under the control of the NYISO are operated to produce (or absorb) Reactive Power. The NYISO directs the Supplier’s Resources to operate within their tested reactive capability limits. Payments to synchronous generators and synchronous condensers eligible for VSS are based upon a fixed dollar amount per MVAR-year. This service is cost based and is currently set at $3419/MVAR-year.
• Black Start Capability Service: Black Start capability represents the key Generators that, following a system-wide blackout, can start without the availability of an outside electric supply and are available to participate in system restoration activities. The NYISO identifies the generating units that are in critical areas for NYS Power System restoration. Transmission Owners, such as NYSEG, can also identify key generating facilities to provide local Black Start capability which are compensated by the Customers within the Transmission Owners Service Territory. The Black Start Service is cost based and requires annual testing and updated embedded cost information associated with maintaining the Service capability.

Seneca Compressed Air Energy Storage (CAES) Project
Final Phase 1 Technical Report 40
8.2 Market Price Forecasting
Customized Energy Solutions developed an economic dispatch model to forecast future market prices to calculate the LBMP, regulation, reserve and capacity prices. The model keeps track of marginal units required to meet load for each hour and then provides additional adjustment to account for the congestion and marginal loss to predict prices for the Zone C, where the Seneca facility would be located.
The model uses existing data on power plants to create a historical supply stack, which is then combined with assumptions on seasonal (summer and winter) capabilities and plant availability to generate available capacity (MW) estimates for each power plant in the supply stack. Historical fuel price and heat rate data is used to estimate the Marginal Energy Cost, which serves as an input in the dispatch model. The dispatch algorithm then allocates capacity from the power generating units to satisfy NYISO hourly demand on a merit order basis by dispatching plants with lowest marginal energy cost first. A regression analysis was also done to estimate loss and congestion costs when computing marginal prices (LBMP's). The resulting LBMP’s are then sorted and arranged as price duration curves before being calibrated against actual historical day-ahead and real-time LBMP’s from the NYISO.
In order to forecast the capacity prices, CES used both historical capacity prices for rest of the state region that applies to Zone C and studies about the cost of new entry that suggests that ~$90,000/MW-year revenue will be required for new peaking units that are required to support reliability needs. Since the capacity addition module of the forecasting model only adds new capacity when the reserve margins fall under 15%, it was decided to assume that for such years the capacity prices have to be at level of $90,000/MW-Year in 2009 real dollars. For future years, when there was no capacity addition required, it was assumed the capacity prices would remain on an average to the levels observed in rest of the state during previous six years (2005-10) of $25,000 / MW-Year (in 2009 real dollars). The model uses a GDP index to escalate to nominal dollars.
The model was also used to develop ancillary service price forecasts for Synch and Non Synch reserves. The historical analysis showed that these ancillary service prices were not significantly impacted by the varying inputs conditions that were observed within 2005–2010 historical period. As a result, a simple methodology of using the average of the previous six years prices was used to set the baseline prices, which were then adjusted for nominal values using the same GDP index used to adjust the capacity prices.
For frequency regulation prices, there are a number of factors that influence the market clearing prices for regulation. These include, energy price, regulation requirement (which changes from hour to hour and seasonally), as well as availability of regulation supply. Given the small size of the regulation market, the market has seen wide fluctuations in these prices over past six years since introduction of Standard Market Design (SMD) 2. As a result, CES decided to use a neural network model based on historical regulation prices to attempt to predict forward regulation prices using the forecasted energy prices and anticipated regulation requirements based on wind penetration.

Seneca Compressed Air Energy Storage (CAES) Project
Final Phase 1 Technical Report 41
8.2.1 Load Forecast Assumption
The load forecast used in the CAES base case was taken directly from the 2011 NYISO Load & Capacity Data Report, referred to as the Gold Book. The 2011 Gold Book forecast for peak load reflects an annual average growth rate of 0.73% for years 2011 through 2021. The 2011 growth rate is lower than the 2010 growth rate due to a lower econometric forecast and an increase in the projected amounts of energy reductions due to the New York State Electric Energy Efficiency programs. The base case includes a 0.8% peak load growth rate from 2021 through the study horizon.
The chart below shows the anticipated load growth over the decision horizon used in the base case. Please note that the Y axis of the chart shows values from 32 GW to 46 GW.
8.2.2 Natural Gas Price Assumptions
The starting point for the fuel forecast used in the CAES base case came from the 2010 U.S. Energy Information Administration (EIA) long term forecast of delivered fuel prices. The natural gas price forecast included in the CAES base case reflects 105% of the forecast Henry Hub prices to account for delivery to New York with an additional 5.5% added to account for delivery to NYISO Zone C. CES applied historical seasonal variations to the annual average fuel price to get the month by month variations using the data used by NYISO for CARIS studies. High and low gas price scenarios were developed using one standard deviation above and below historic gas prices for the past six years. The resulting data set on an annual basis is shown below:
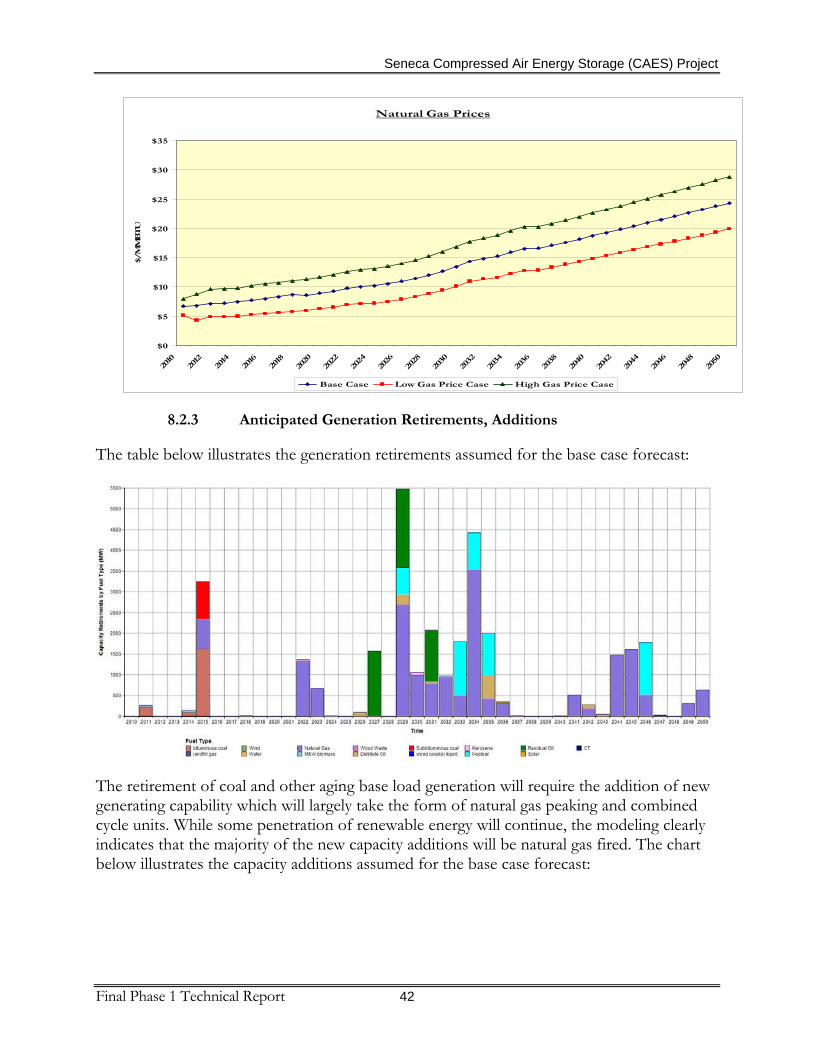
Seneca Compressed Air Energy Storage (CAES) Project
Final Phase 1 Technical Report 42
Natural Gas Prices
$0
$5
$10
$15
$20
$25
$30
$35
2010
2012
2014
2016
2018
2020
2022
2024
2026
2028
2030
2032
2034
2036
2038
2040
2042
2044
2046
2048
2050
$/M
MBTU
Base Case Low Gas Price Case High Gas Price Case
8.2.3 Anticipated Generation Retirements, Additions
The table below illustrates the generation retirements assumed for the base case forecast:
The retirement of coal and other aging base load generation will require the addition of new generating capability which will largely take the form of natural gas peaking and combined cycle units. While some penetration of renewable energy will continue, the modeling clearly indicates that the majority of the new capacity additions will be natural gas fired. The chart below illustrates the capacity additions assumed for the base case forecast:

Seneca Compressed Air Energy Storage (CAES) Project
Final Phase 1 Technical Report 43
The chart below illustrates the resulting generation fuel mix used in the base case forecast. The chart also includes the load forecast superimposed on the capacity forecast. Note that the wind capability shown in the chart has been reduced to 25% of the installed capacity to better reflect the limited availability of this resource.
0
5,000
10,000
15,000
20,000
25,000
30,000
35,000
40,000
45,000
2016 2017 2018 2019 2020 2021 2022 2023 2024 2025 2026 2027 2028 2029 2030 2031 2032 2033 2034 2035 2036 2037 2038 2039 2040 2041 2042 2043 2044 2045 2046 2047 2048 2049 2050
NYISO Load & Capacity Profile
Nuclear Hydro
Wind Adjusted for Availability Other Renewables
Natural Gas Residual Oil
Old CT Mean Load
Mean Load Plus One Standard Deviation Mean Load Minus One Standard Deviation

Seneca Compressed Air Energy Storage (CAES) Project
Final Phase 1 Technical Report 44
8.2.4 Base Case Market Price Forecasts
The market forecast modeling developed the following capacity price forecast for the base case:
$0 $2 $4 $6 $8
$10 $12 $14 $16 $18 $20
$/kw
-mon
th
Average Capacity Value
The capacity revenues forecast in the NYISO market do increase during the study period as the current excess capacity in the market is reduced over time. However, the increased capacity revenues are not forecast to occur until well after the Seneca CAES plant would enter commercial service. In addition, the capacity revenue increases associated with the need for new capacity will be driven by the cost of new NGCC or NGCT units which are significantly less costly than CAES technology. Even when capacity prices do increase, they would not be sufficient on their own to support the construction of a CAES plant.
The modeling indicates that the energy prices in the New York market will be set by the marginal cost of natural gas generating units throughout the study period. The differential between on-peak and off-peak energy prices will be very small for many hours of the year (essentially driven by the heat rates of the least efficient NGCC units and the most efficient NGCC units). As a result, energy arbitrage opportunities for the CAES plant would be significantly diminished.
The chart below indicates the annual average wholesale energy price forecast in Zone C. The price trajectory is very strongly correlated to the forecast price of natural gas shown in Section 8.2.2 above. Successful financial performance of the CAES plant depends much less on the average price in the market on any given day, and much more on the differential between on-peak and off-peak periods. The three charts that follow the average annual price forecast give a view of the potential arbitrage opportunities in three selected years during the study period.

Seneca Compressed Air Energy Storage (CAES) Project
Final Phase 1 Technical Report 45
Average Annual Zone C LBMPBase Case
$0
$20
$40
$60
$80
$100
$120
$140
$160
$180
$200
2012
2014
2016
2018
2020
2022
2024
2026
2028
2030
2032
2034
2036
2038
2040
2042
2044
2046
2048
2050
$/M
WH
$-
$100
$200
$300
$400
$500
$600
$700
2016 Zone C Daily Average On-Peak and Off-Peak LBMP
Daily On-Peak Daily Off-Peak

Seneca Compressed Air Energy Storage (CAES) Project
Final Phase 1 Technical Report 46
$-
$100
$200
$300
$400
$500
$600
$700
2030 Zone C Daily Average On-Peak and Off-Peak LBMP
Daily On-Peak Daily Off-Peak
$-
$100
$200
$300
$400
$500
$600
$700
2045 Zone C Daily Average On-Peak and Off-Peak LBMP
Daily On-Peak Daily Off-Peak
These slides clearly illustrate that there is very limited arbitrage opportunity for the CAES plant outside of a relatively narrow window during the summer months. The modeling results discussed in Section 8.4 confirm this observation.

Seneca Compressed Air Energy Storage (CAES) Project
Final Phase 1 Technical Report 47
8.2.5 Additional Market Price Scenarios
CES also developed additional market price scenarios as sensitivity cases. These scenarios included:
• Low gas price scenario (one historical standard deviation below the base case)
• High gas price scenario (one historical standard deviation above the base case)
• Indian Point Units 2 and 3 Retirement in 2016
• State Energy Policy Goals of 30% Renewables and 15% Energy Conservation by 2015
• High Wind scenario in which a total of 12,000 MW of wind is on line, phased in during the CAES study period
The resulting energy price curves are compared to the Base Case. The on-peak versus off-peak price differentials and patterns noted above for the Base Case are also observed in these additional market price scenarios.
Average Annual Zone C LBMP
$0
$50
$100
$150
$200
$250
2012
2014
2016
2018
2020
2022
2024
2026
2028
2030
2032
2034
2036
2038
2040
2042
2044
2046
2048
2050
$/M
WH
Base Case Low Gas Price Case High Gas Price Case Indian Point Retirement
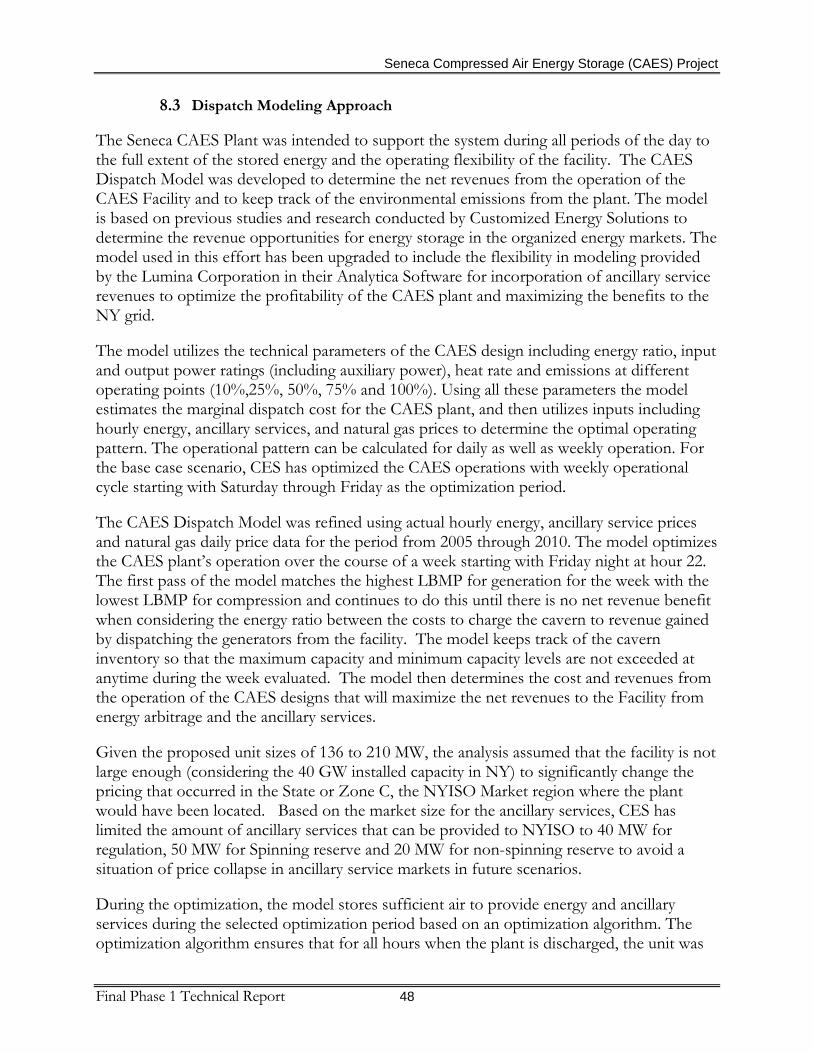
Seneca Compressed Air Energy Storage (CAES) Project
Final Phase 1 Technical Report 48
8.3 Dispatch Modeling Approach
The Seneca CAES Plant was intended to support the system during all periods of the day to the full extent of the stored energy and the operating flexibility of the facility. The CAES Dispatch Model was developed to determine the net revenues from the operation of the CAES Facility and to keep track of the environmental emissions from the plant. The model is based on previous studies and research conducted by Customized Energy Solutions to determine the revenue opportunities for energy storage in the organized energy markets. The model used in this effort has been upgraded to include the flexibility in modeling provided by the Lumina Corporation in their Analytica Software for incorporation of ancillary service revenues to optimize the profitability of the CAES plant and maximizing the benefits to the NY grid.
The model utilizes the technical parameters of the CAES design including energy ratio, input and output power ratings (including auxiliary power), heat rate and emissions at different operating points (10%,25%, 50%, 75% and 100%). Using all these parameters the model estimates the marginal dispatch cost for the CAES plant, and then utilizes inputs including hourly energy, ancillary services, and natural gas prices to determine the optimal operating pattern. The operational pattern can be calculated for daily as well as weekly operation. For the base case scenario, CES has optimized the CAES operations with weekly operational cycle starting with Saturday through Friday as the optimization period.
The CAES Dispatch Model was refined using actual hourly energy, ancillary service prices and natural gas daily price data for the period from 2005 through 2010. The model optimizes the CAES plant’s operation over the course of a week starting with Friday night at hour 22. The first pass of the model matches the highest LBMP for generation for the week with the lowest LBMP for compression and continues to do this until there is no net revenue benefit when considering the energy ratio between the costs to charge the cavern to revenue gained by dispatching the generators from the facility. The model keeps track of the cavern inventory so that the maximum capacity and minimum capacity levels are not exceeded at anytime during the week evaluated. The model then determines the cost and revenues from the operation of the CAES designs that will maximize the net revenues to the Facility from energy arbitrage and the ancillary services.
Given the proposed unit sizes of 136 to 210 MW, the analysis assumed that the facility is not large enough (considering the 40 GW installed capacity in NY) to significantly change the pricing that occurred in the State or Zone C, the NYISO Market region where the plant would have been located. Based on the market size for the ancillary services, CES has limited the amount of ancillary services that can be provided to NYISO to 40 MW for regulation, 50 MW for Spinning reserve and 20 MW for non-spinning reserve to avoid a situation of price collapse in ancillary service markets in future scenarios.
During the optimization, the model stores sufficient air to provide energy and ancillary services during the selected optimization period based on an optimization algorithm. The optimization algorithm ensures that for all hours when the plant is discharged, the unit was

Seneca Compressed Air Energy Storage (CAES) Project
Final Phase 1 Technical Report 49
profitable to operate. Also, during each hour of operation the model compares the profitability of energy arbitrage versus the profitability of providing frequency regulation or synchronous reserves. For any hour when ancillary services are more profitable, the plant is dispatched for both energy and ancillary services as shown in an example of the weekly duty cycle chart below.
The dispatch model was run for each CAES technology under each of market price forecast scenarios noted above. The results of these model runs were directly input to the financial model scenarios discussed in the next section.
8.4 Dispatch Modeling Results
As noted above, the retirement of existing coal and other aging base load generation will require the addition of new generation which will largely be natural gas simple cycle and combined cycle units. This would severely limit the arbitrage opportunities for the CAES plant and would generally see the plant operated in a manner similar to a seasonally operated gas turbine peaking unit as illustrated in the charts below.
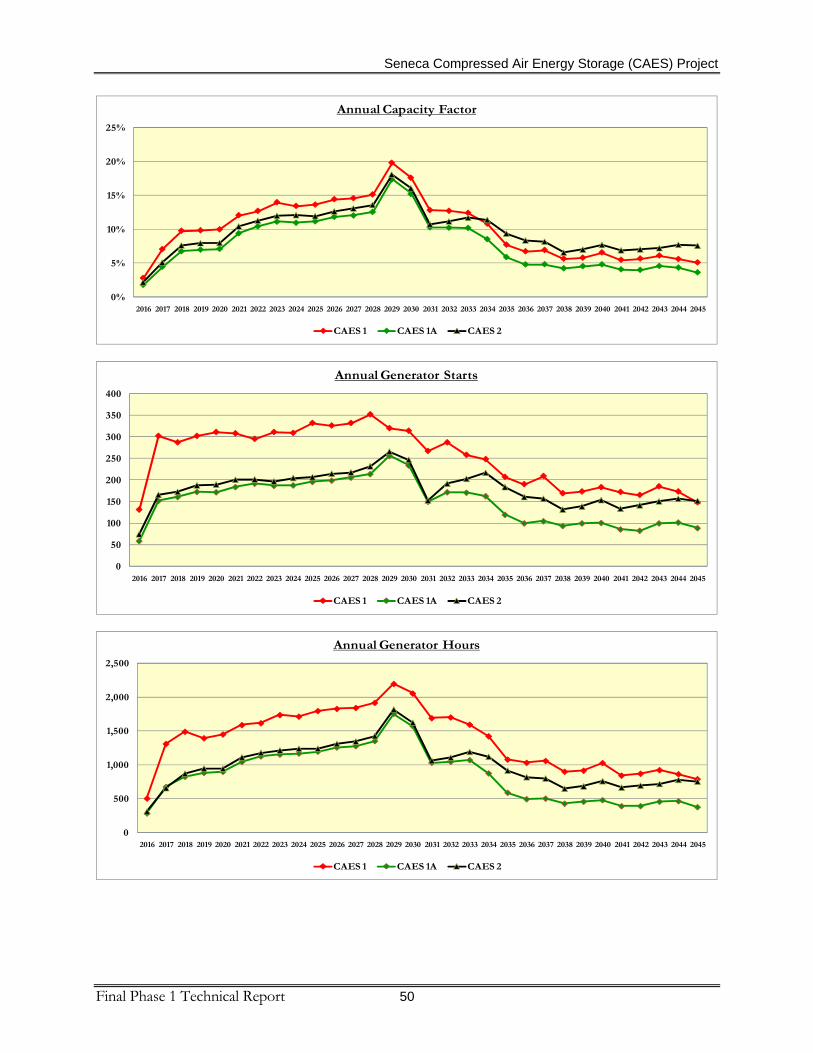
Seneca Compressed Air Energy Storage (CAES) Project
Final Phase 1 Technical Report 50
0%
5%
10%
15%
20%
25%
2016 2017 2018 2019 2020 2021 2022 2023 2024 2025 2026 2027 2028 2029 2030 2031 2032 2033 2034 2035 2036 2037 2038 2039 2040 2041 2042 2043 2044 2045
Annual Capacity Factor
CAES 1 CAES 1A CAES 2
0
50
100
150
200
250
300
350
400
2016 2017 2018 2019 2020 2021 2022 2023 2024 2025 2026 2027 2028 2029 2030 2031 2032 2033 2034 2035 2036 2037 2038 2039 2040 2041 2042 2043 2044 2045
Annual Generator Starts
CAES 1 CAES 1A CAES 2
0
500
1,000
1,500
2,000
2,500
2016 2017 2018 2019 2020 2021 2022 2023 2024 2025 2026 2027 2028 2029 2030 2031 2032 2033 2034 2035 2036 2037 2038 2039 2040 2041 2042 2043 2044 2045
Annual Generator Hours
CAES 1 CAES 1A CAES 2

Seneca Compressed Air Energy Storage (CAES) Project
Final Phase 1 Technical Report 51
The seasonal operation of the CAES plant is best illustrated by the data from a representative year (CAES 1A 2023 results shown here). The seasonal operation and revenue opportunities are clearly very similar to what one would expect from a simple cycle gas turbine peaking unit.
0
50
100
150
200
250
300
350
1 2 3 4 5 6 7 8 9 10 11 12
2023
Generating (Hours) Charging (Hours)
Jan ‐May15%
June ‐ Sept78%
Oct ‐ Dec7%
Annual Revenues

Seneca Compressed Air Energy Storage (CAES) Project
Final Phase 1 Technical Report 52
Capacity Revenues13.4%
Regulation Revenues1.9%
Spinning Reserve Revenues0.2%
Non‐Synch Reserve Revenues0.4%
Energy Revenues84.0%
Sources of Revenues
The modeling results also clearly indicate that the current NYISO market does not produce Ancillary Services revenues that would support new capital investments aimed at capturing this market segment. Some of the capabilities in which the CAES technology excels (fast start, VAR support, frequency regulation) are little valued in the current market design and are not forecast to grow significantly in the forecasts used for this project analysis. While NYSEG and CES believe that this situation may change with the continued retirement of base load generating units, there was no way to develop estimates of these potential future market revenues.

Seneca Compressed Air Energy Storage (CAES) Project
Final Phase 1 Technical Report 53
The model predicted the following gross revenue forecasts for each of the CAES technologies:
$0
$20,000
$40,000
$60,000
$80,000
$100,000
$120,000
$140,000
$160,000
2016 2017 2018 2019 2020 2021 2022 2023 2024 2025 2026 2027 2028 2029 2030 2031 2032 2033 2034 2035 2036 2037 2038 2039 2040 2041 2042 2043 2044 2045
($1,
000)
CAES 1 Revenues
Energy Revenues Capacity Revenues Regulation Revenues Spinning Reserve Revenues Non Spinning Reserve Revenue
$0
$20,000
$40,000
$60,000
$80,000
$100,000
$120,000
$140,000
$160,000
2016 2017 2018 2019 2020 2021 2022 2023 2024 2025 2026 2027 2028 2029 2030 2031 2032 2033 2034 2035 2036 2037 2038 2039 2040 2041 2042 2043 2044 2045
($1,0
00)
CAES 1A Revenues
Energy Revenues Capacity Revenues Regulation Revenues Spinning Reserve Revenues Non Spinning Reserve Revenue
$0
$20,000
$40,000
$60,000
$80,000
$100,000
$120,000
$140,000
$160,000
2016 2017 2018 2019 2020 2021 2022 2023 2024 2025 2026 2027 2028 2029 2030 2031 2032 2033 2034 2035 2036 2037 2038 2039 2040 2041 2042 2043 2044 2045
($1,0
00)
CAES 2 Revenues
Energy Revenue Capacity Revenue Regulation Revenue Spinning Reserve Revenue Non Spinning Reserve Revenue

Seneca Compressed Air Energy Storage (CAES) Project
Final Phase 1 Technical Report 54
9 Financial Modeling
The capital cost forecasts, operating expense forecasts, and dispatch modeling results were input to the NYSEG financial model to evaluate the financial impact of the CAES plant on NYSEG’s customers. Copies of the financial model results for the three Base Case CAES cycles are attached to this report. Key elements of the modeling include:
• The financial modeling performed for the project was based on an assumption that the New York Public Service Commission would authorize the recovery by NYSEG of all costs of constructing and operating the Project through the NBWC (Non-Bypassable Wires Charge) with the customer receiving a credit for all wholesale electric revenues generated by the Project.
• The financial model takes into consideration a number of cost estimates, including (a) the estimated cost of constructing the Project itself; (b) the estimated costs of operating the Project, including fixed and variable operating and maintenance expenses; (c) a number of long-range forecasts of wholesale electricity prices in the region; and (d) projections of how the Project is likely to be dispatched in light of the projected wholesale electricity prices.
• Key assumptions used in the financial model included:
• The DOE and NYSERDA Grants are taxable upon receipt, but the project qualifies as an R&D expense under IRS Code Section #174 and is expensed for tax purposes in the year expended.
• Capital Structure: 48% Equity, 52% Debt
• Equity Return = 10%, Debt Rate = 5.5%
The financial modeling results indicate that the CAES technologies do not result in a net positive benefit for customers over the lifetime of the plant under any of the market scenarios that were modeled. The charts below illustrate the customer impact from CAES 1, CAES 1A, and CAES 2 under Base Case Market Prices.

Seneca Compressed Air Energy Storage (CAES) Project
Final Phase 1 Technical Report 55
9.1 Base Case Modeling Results
$0
$20,000
$40,000
$60,000
$80,000
$100,000
$120,000
$140,000
2016 2017 2018 2019 2020 2021 2022 2023 2024 2025 2026 2027 2028 2029 2030 2031 2032 2033 2034 2035 2036 2037 2038 2039 2040 2041 2042 2043 2044 2045
($1,
000)
CAES 1 Revenue Requirement
Return on Rate Base Depreciation Expense Property Taxes Fixed O&M Compression Costs Fuel Costs Variable O&M Costs
$0
$20,000
$40,000
$60,000
$80,000
$100,000
$120,000
$140,000
$160,000
($1,
000)
Customer Impact from CAES 1 CycleBase Case Market Prices
Total Revenue Requirement Total Market Value

Seneca Compressed Air Energy Storage (CAES) Project
Final Phase 1 Technical Report 56
$0
$20,000
$40,000
$60,000
$80,000
$100,000
$120,000
$140,000
2016 2017 2018 2019 2020 2021 2022 2023 2024 2025 2026 2027 2028 2029 2030 2031 2032 2033 2034 2035 2036 2037 2038 2039 2040 2041 2042 2043 2044 2045
($1,
000)
CAES 1A Revenue Requirement
Return on Rate Base Depreciation Expense Property taxes Fixed O&M Compression Costs Fuel Costs Variable O&M Costs
$0
$20,000
$40,000
$60,000
$80,000
$100,000
$120,000
$140,000
$160,000
($1,
000)
Customer Impact from CAES 1A CycleBase Case Market Prices
Total Revenue Requirement Total Market Value
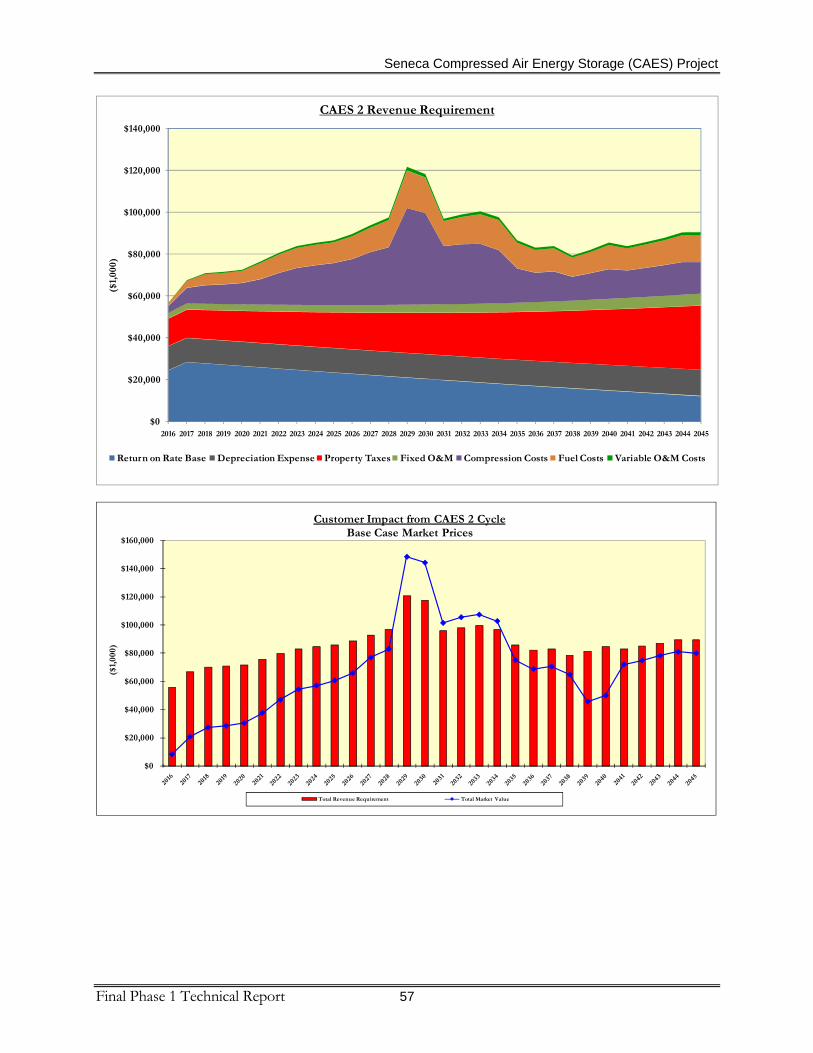
Seneca Compressed Air Energy Storage (CAES) Project
Final Phase 1 Technical Report 57
$0
$20,000
$40,000
$60,000
$80,000
$100,000
$120,000
$140,000
2016 2017 2018 2019 2020 2021 2022 2023 2024 2025 2026 2027 2028 2029 2030 2031 2032 2033 2034 2035 2036 2037 2038 2039 2040 2041 2042 2043 2044 2045
($1,
000)
CAES 2 Revenue Requirement
Return on Rate Base Depreciation Expense Property Taxes Fixed O&M Compression Costs Fuel Costs Variable O&M Costs
$0
$20,000
$40,000
$60,000
$80,000
$100,000
$120,000
$140,000
$160,000
($1,
000)
Customer Impact from CAES 2 CycleBase Case Market Prices
Total Revenue Requirement Total Market Value

Seneca Compressed Air Energy Storage (CAES) Project
Final Phase 1 Technical Report 58
A Net Present Value of Customer Impact was calculated for the 30 year study life of the CAES project. The results of those calculations are shown in the chart below:
($259,835)
($256,269)
($246,938)
1
($1,0
00)
2016 - 2045 Customer NPV
CAES 1 CAES 1A CAES 2
9.2 Sensitivity Analyses
The financial analysis team also evaluated the other market price scenarios discussed above. The net customer impact profiles were not significantly different from the Base Case scenarios.
($259,835)($256,269)($246,938)
($255,416)($248,544)
($209,187)
($243,187)($247,203)($246,718)($239,097)
($196,489)
($235,257)($237,443)
($1,
000)
2016 - 2045 Customer NPV
CAES 1 Base Case CAES 1A Base Case CAES 2 Base CaseCAES 1A High Gas Prices CAES 1A High Wind CAES 1A Indian Point RetirementCAES 1A Low Gas Prices CAES 1A State Policy CAES 2 High Gas PricesCAES 2 High Wind CAES 2 Indian Point Retirement CAES 2 Low Gas PricesCAES 2 State Policy

Seneca Compressed Air Energy Storage (CAES) Project
Final Phase 1 Technical Report 59
A set of model runs was developed to illustrate the maximum allowable plant capital cost (including AFUDC and other Owners Costs) that would result in a zero customer impact NPV. The results of this analysis are shown in the table below.
Cycle Estimated Total Capital Cost Before Funding
Total Maximum Capital Cost Required for Customer NPV = $0
CAES 1 $444,273,000 $170,062,052
CAES 1A $497,178,000 $225,737,812
CAES 2 $494,148,000 $233,194,020
10 Statewide Emissions Impact
The Seneca CAES facility was anticipated to be a renewable enabler. The method to illustrate the statewide reduction in CO2 emissions resulting from the CAES facility operations was to identify the marginal plant from the economic dispatch and then account for the emission difference between the CAES plant and that marginal plant for the number of hours that the CAES plant was expected to run. It was assumed that the CAES plant would utilize off peak renewable energy sources for charging energy, and thus no emissions were accounted for in the compression cycle.
The following chart shows the anticipated emission impact of CAES 1A and 2 (210 MW) configurations. These results are very heavily influenced by the assumptions about generation retirements as well as emissions from the new units added in the generation mix. Since by 2029 a large number of older fossil units are retired, the anticipated emission impact is significantly lower in scenarios after that point in time as more efficient natural gas units are built to replace the older fossil units.
During the life of the project, the CAES 1A and 2 CO2 emissions reduction was estimated at over 2.2-million tons. In a similar fashion, the CAES 1 CO2 emissions reduction was estimated at more than 1.3-million tons.

Seneca Compressed Air Energy Storage (CAES) Project
Final Phase 1 Technical Report 60
CO2 Emissions Reductions
-
20,000
40,000
60,000
80,000
100,000
120,000
140,000
160,000
2016
2017
2018
2019
2020
2021
2022
2023
2024
2025
2026
2027
2028
2029
2030
2031
2032
2033
2034
2035
2036
2037
2038
2039
2040
2041
2042
2043
2044
2045
Ton
s/Y
ear
CAES 1 CO2 Emissions Reduction CAES 1A, 2 Emissions Reduction
11 Transmission System Benefits
WorleyParsons developed a transmission network model based on publicly available network information provided by the NYISO. The modeling was used to assess the electrical capabilities of the NYSEG transmission system with regard to take-away capability and maximum compressor load capability. The modeling also was aimed at assessing the impact on the electric transmission system from Seneca CAES operation. Specific areas of interest included: system overloads, fault current levels, buss voltage levels, stability, and congestion. The results of the transmission study did not indicate any significant transmission system operational improvements resulting from the construction of the CAES plant at this location.
12 Recommended CAES Technology
As noted above, none of the CAES technologies evaluated results in a positive economic benefit for customers. If the project were to proceed into development, final design and bidding for only CAES 1A and 2 cycle technologies would be recommended. Final engineering design and more in-depth risk assessments, followed by formal bidding for equipment and construction services, would be used to determine the recommended technology. As the cost estimates and modeling illustrate, there does not appear to be a clear financial advantage for either the CAES 1A or 2 cycles at this time, and it would make commercial sense to maintain an active competition between the two cycle providers through final design and bidding.

Seneca Compressed Air Energy Storage (CAES) Project
Final Phase 1 Technical Report 61
13 Appendices
13.1 Design Basis
13.1.1 Seneca Design Basis Overview
13.1.2 Seneca CAES Design Basis General
13.1.3 Seneca CAES Design Basis Value Drivers
13.1.4 Seneca CAES Design Basis-Mechanical
13.1.5 Seneca CAES Design Basis-Civil
13.1.6 Seneca CAES Design Basis-Electrical
13.1.7 Seneca CAES Design Basis-I&C
13.1.8 Seneca CAES Design Basis-Structural
13.1.9 Seneca CAES Design Fuel Gas Composition
13.1.10 Seneca CAES Design Basis-Plant Switchyard
13.1.11 Seneca CAES Design Basis-Point of Interconnection
13.2 Cycle Drawings
13.2.1 Cycle 1
13.2.2 Cycle 1A
13.2.3 Cycle 2
13.2.4 Block Diagram 13.3 Equipment Lists
13.3.1 CAES 1 Equipment List
13.3.2 CAES 1A Equipment List
13.3.3 CAES 2 Equipment List
13.4 General Arrangement Drawings
13.4.1 General Arrangement--CAES 1 Area Plan 13.4.2 General Arrangement--CAES 2 Area Plan 13.4.3 General Arrangement--CAES 1 Site Plan 13.4.4 General Arrangement--CAES 1A Site Plan 13.4.5 General Arrangement--CAES 2 Site Plan 13.4.6 General Arrangement--Site Grading Plan 13.4.7 General Arrangement--115 kV Interconnect A 13.4.8 General Arrangement--115 kV Interconnect B 13.4.9 General Arrangement--115 kV Interconnect

Seneca Compressed Air Energy Storage (CAES) Project
Final Phase 1 Technical Report 62
13.4.10 General Arrangement--115 kV Interconnect Switchyard 13.4.11 General Arrangement--115 kV Plant Switchyard 13.4.12 General Arrangement--115 kV Interconnect Switchyard Elevation 13.4.13 General Arrangement--115 kV Plant Switchyard Elevation 13.4.14 General Arrangement--Raw Water Pumphouse Plan 13.4.15 General Arrangement--Lake Intake Site Plan 13.4.16 General Arrangement--Lake Intake Structure Electrical Service Plan 13.4.17 Plan & Profile – CAES Transmission 115kV Circuit, Sheets 1 and 2 13.5 Electrical One Line Diagrams
13.5.1 CAES 1 Electrical One Line 13.5.2 CAES 1A Electrical One Line 13.5.3 CAES 2 Electrical One Line 13.5.4 CAES Interconnection Switchyard Electrical One Line 13.5.5 CAES Plant Switchyard Electrical One Line 13.5.6 CAES 1 & 2 Pumphouse Electrical One Line 13.6 P&ID
13.6.1 Legends & Symbols 13.6.2 Legends & Symbols A 13.6.3 Legends & Symbols B 13.6.4 Compressed Air System 13.6.5 Compressed Air System A 13.6.6 Expander Turbine 13.6.7 Expander Turbine A 13.6.8 Fuel Gas System 13.6.9 Water Treatment System 13.6.10 Waste Water System 13.6.11 Makeup Water System 13.6.12 Fire Protection 13.6.13 Nitrogen System 13.6.14 Ammonia Storage 13.6.15 Circulating Water

Seneca Compressed Air Energy Storage (CAES) Project
Final Phase 1 Technical Report 63
13.6.16 Circulating Water A 13.7 Water Balances
13.7.1 Cycle 1 45°F
13.7.2 Cycle 1 -2°F
13.7.3 Cycle 1 87°F 13.7.4 Cycle 1 Maximum Usage
13.7.5 Cycle 2 45°F
13.7.6 Cycle 2 -2°F
13.7.7 Cycle 2 87°F 13.7.8 Cycle 2 Maximum Usage 13.8 Performance
13.8.1 CAES 1 Compression & Generation Summary 13.8.2 CAES 1A Compression & Generation Summary 13.8.3 CAES 2 Compression & Generation Summary 13.8.4 CAES 1 Heat Balance, Average Ambient 13.8.5 CAES 2 Heat Balance, Average Ambient 13.8.6 CAES 2 Heat Balance, Low Ambient 13.8.7 CAES 2 Heat Balance, High Ambient 13.9 Environmental
13.9.1 NYSEG CAES Project Permits and Approvals Matrix 13.9.2 NYSEG CAES Phase 1 Preliminary Assessment - Air Quality 13.9.3 NYSEG CAES Phase 1 Preliminary Assessment - Cultural Resources 13.9.4 NYSEG CAES Phase 1 Preliminary Assessment - Environmental Justice 13.9.5 NYSEG CAES Phase 1 Preliminary Assessment - Land Use 13.9.6 NYSEG CAES Phase 1 Preliminary Assessment - Vegetation Wildlife 13.9.7 NYSEG CAES Phase 1 Preliminary Assessment - Visual Resources 13.9.8 NYSEG CAES Phase 1 Preliminary Assessment - Water Resources 13.9.9 NYSEG CAES Phase 1 Preliminary Assessment – Wetlands 13.10 PBESS Cavern & Well System Report
13.10.1 PBESS Final Report part 1 of 2 Cavern and Well System Engineering Report plus submittals A thru S

Seneca Compressed Air Energy Storage (CAES) Project
Final Phase 1 Technical Report 64
13.10.2 PBESS Final Report part 2 of 2 includes submittals T thru AD 13.11 Schedule
13.11.1 Phase 2 and 3 Schedule 13.12 WorleyParsons RFQ’s
13.12.1 CAES 1 Power Generation RFQ 13.12.2 CAES 2 Power Generation RFQ 13.12.3 Process Air Compressor RFQ 13.12.4 Air Turbine Generator RFQ 13.12.5 Recuperator RFQ 13.12.6 Combustion Turbine RFQ 13.12.7 Aux Transformer RFQ 13.12.8 Continuous Emission System CAES 1 RFQ 13.12.9 Continuous Emission System CAES 2 RFQ 13.12.10 Cooling Tower RFQ 13.12.11 Crane RFQ 13.12.12 Distributed Control System RFQ 13.12.13 Step-Up (GSU) Transformer RFQ 13.13 Customized Energy Solutions Report
13.13.1 CES Seneca CAES Draft Final Report Dec 20 2011 13.13.2 Summary Market Price Forecasts 13.13.3 Load & Capacity Illustration - Base Case 13.13.4 Base Case Capacity Forecast 13.13.5 Base Case Natural Gas Forecast 13.13.6 Base Case NYISO Load 13.13.7 Base Case Market Forecasts, 2016, 2029 13.14 Transmission System Impact
13.14.1 Transmission Impact Study Report 13.14.2 Attachment 1_Pre CAES Case 3 Light Load Summer of 2016 Overloads and
Voltage Violations 13.14.3 Attachment 2_Pre CAES Case 4 Load 50 50 Summer 2016 Overloads and
Voltage Violations

Seneca Compressed Air Energy Storage (CAES) Project
Final Phase 1 Technical Report 65
13.14.4 Attachment 3_CAES 175 MW Comp No Add Wind Light Load Summer 2016 Overloads and Voltage Violations
13.14.5 Attachment 4_CAES 175 MW Comp Add Local Wind Light Load Sum of 2016 Overloads and Voltage Violations
13.14.6 Attachment 4_CAES 175 MW Comp Add Local Wind Light Load Sum of 2016 Overloads and Voltage Violations
13.14.7 Attachment 5_CAES Gen 210 MW No Add Wind Summer 2016 Overloads and Voltage Violations
13.14.8 Attachment 6_CAES Gen 210 MW Add Local Wind Summer 2016 Overloads and Voltage Violations
13.14.9 Attachment 7_CAES Generation Off Heavy Wind Farm Penetration 13.14.10 Attachment 8_CAES Generation at 210 MW Heavy Wind Penetration 13.14.11 Attachment 9_No CAES Compression Light Load Heavy Wind Farm
Penetration 13.14.12 Attachment 10_CAES Compression 175MW Light Load Heavy Wind Farm
Penetration 13.14.13 Attachment 11_Short Circuit Prior to CAES in service 13.14.14 Attachment 12_Short Circuit With CAES Compressor in sevice 13.14.15 Attachment 13_Short Circuit With CAES in service 13.14.16 Attachment 14_Light Load Voltage Problem in Elmira and Binghamton 13.14.17 Attachment 15_MUST Study Results 13.14.18 Attachment 16_TABLE 1 - CASE 3 13.14.19 Attachment 17_TABLE 2 - CASE 3A 13.14.20 Attachment 18_TABLE 3 - CASE 4 13.15 Risk Assessment
13.15.1 Risk Assessment Overview 13.15.2 Risk Assessment Participants 13.15.3 Likelihood and Consequence 13.15.4 Risk Register 13.15.5 Risk Maps 13.15.6 Risk Summary 13.16 Cost Estimates
13.16.1 Summary Original CAES Project Cost

Seneca Compressed Air Energy Storage (CAES) Project
Final Phase 1 Technical Report 66
13.16.2 NYSEG CAES Estimate Basis 05 2011Dec20 13.16.3 Capital Cost Estimating Methodology 13.16.4 CAES Cycle 1 Quantities 13.16.5 CAES Cycle 2 Quantities 13.16.6 Quantity-Civil CAES 1 13.16.7 Quantity-Civil CAES 2 13.16.8 CAES Cycle 1 Electrical Qty 13.16.9 CAES Cycle 2 Electrical Qty 13.16.10 CAES Intake Structure Quantities 13.16.11 Owners Cost Estimate Summary 13.16.12 CAES 1 Capital Cost Summary 13.16.13 CAES 1A Capital Cost Summary 13.16.14 CAES 2 Capital Cost Summary 13.17 Financial Models
13.17.1 CAES 1 Base Market Price Financial Model 13.17.2 CAES 1A Base Market Price Financial Model 13.17.3 CAES 2 Base Market Price Financial Model 13.17.4 CAES 1A High Gas Market Price Financial Model 13.17.5 CAES 2 High Gas Market Price Financial Model 13.17.6 CAES 1A High Wind Market Price Financial Model 13.17.7 CAES 2 High Wind Market Price Financial Model 13.17.8 CAES 1A Indian Point Market Price Financial Model 13.17.9 CAES 2 Indian Point Market Price Financial Model 13.17.10 CAES 1A Low Gas Market Price Financial Model 13.17.11 CAES 2 Low Gas Market Price Financial Model 13.17.12 CAES 1A State Policy Market Price Financial Model 13.17.13 CAES 2 State Policy Market Price Financial Model 13.18 Post Project Survey


![[REDACTED] FINAL TECHNICAL REPORT, PHASE I (INTENSIVE ... · impacting the site. If avoidance is not feasible, PALrecommendsa Phase III archaeological data recovery program to mitigate](https://img.pdfslide.us/doc/110x75/603cb17f0f2559406913330e/redacted-final-technical-report-phase-i-intensive-impacting-the-site-if.jpg)