Embed Size (px)
Citation preview

FINAL ANNUAL MONITORING REPORT
YEAR 5 (2013) CHAPEL CREEK STREAM RESTORTION SITE
ORANGE COUNTY, NORTH CAROLINA (EEP Project No. 77, Contract No. 004806)
Construction Completed July 2008
Submitted t o: North Carolina Department of Environment and Natural Resources
Ecosystem Enhancement Program Raleigh, North Carolina
January 2014
FINAL ANNUAL MONITORING REPORT
YEAR 5 (2013) CHAPEL CREEK STREAM RESTORTION SITE
ORANGE COUNTY, NORTH CAROLINA (EEP Project No. 77, Contract No. 004806)
Construction Completed July 2008
Submitted t o: North Carolina Department of Environment and Natural Resources
Ecosystem Enhancement Program Raleigh, North Carolina
Prepared by:
Axiom Environmental, Inc. 218 Snow Avenue
Raleigh, North Carolina 27603
January 2014

Table of Contents
1.0 EXECUTIVE SUMMARY ...........................................................................................................1 2.0 METHODOLOGY.......................................................................................................................2
2.1 Vegetation Assessment .............................................................................................................2 2.2 Stream Assessment ...................................................................................................................2
3.0 REFERENCES ............................................................................................................................3
Appendices
APPENDIX A. PROJECT VICINITY MAP AND BACKGROUND TABLES Figure 1. Vicinity M ap Table 1. Project Components and Mitigation Credits Table 2. Project Activity and Reporting History Table 3. Project Contacts Table Table 4. Project Baseline Information and Attributes
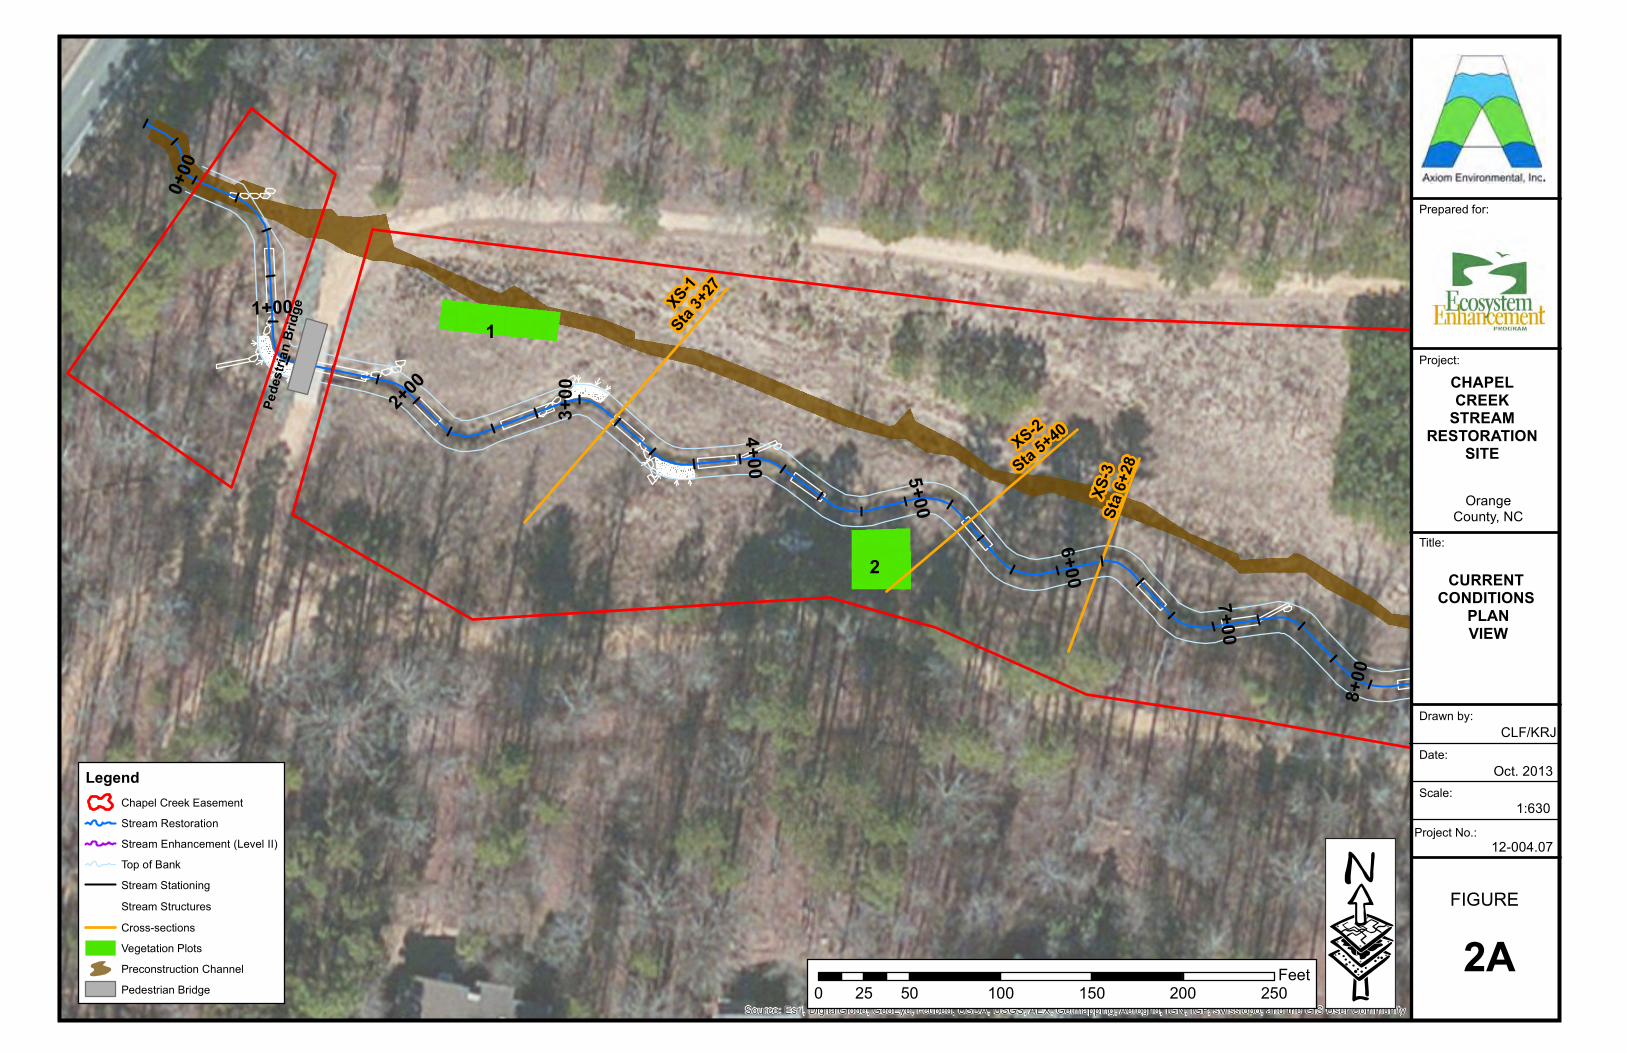
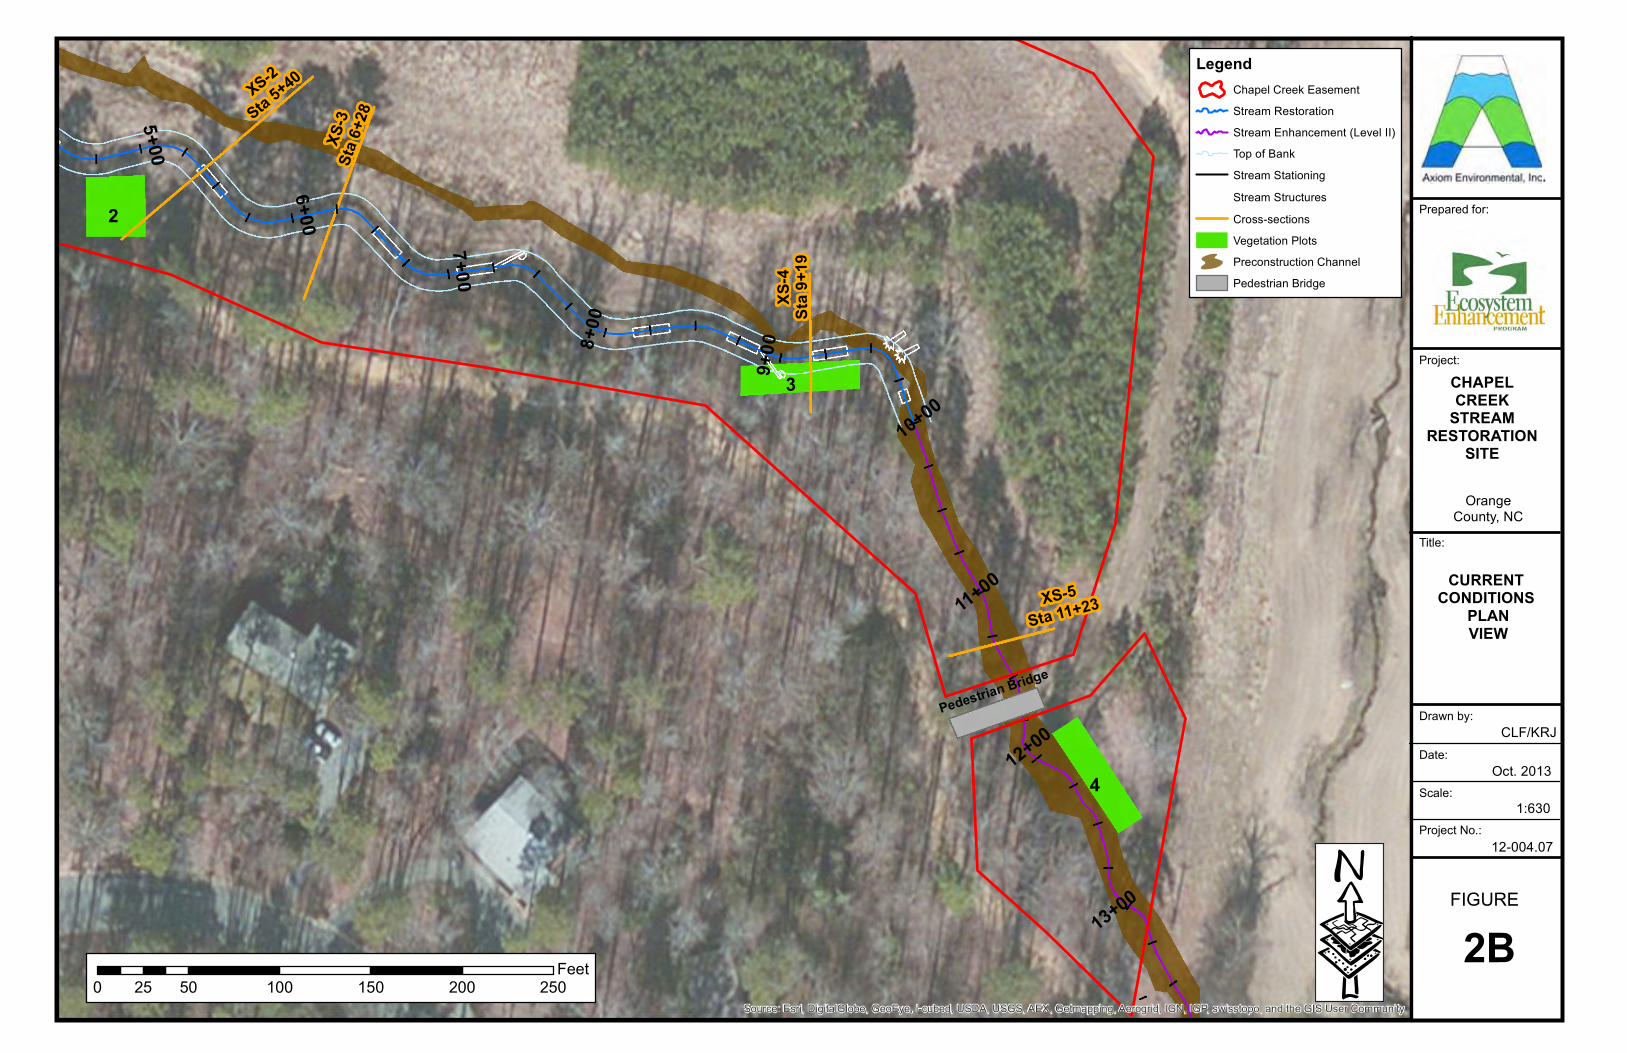
APPENDIX B. VISUAL ASSESSMENT DATA Figures 2 and 2A-2B. Current Conditions Plan View Table 5. Visual Stream Morphology S tability A ssessment Table Table 6. Vegetation Condition Assessment Table Stream Fixed-Station P hotos Vegetation Monitoring Plot Photos
APPENDIX C. VEGETATION PLOT DATA Table 7. Vegetation Plot Criteria Attainment Table 8. CVS Vegetation Plot Metadata Table 9. Total and Planted Stems by Plot and Species
APPENDIX D. STREAM SURVEY DATA Cross-section Plots Longitudinal Profile P lots Substrate Plots Table 10a. Baseline Stream Data Summary Table 10b. Baseline Stream Data Summary (Substrate, Bed, Bank, and Hydrologic Containment
Parameter Distributions) Table 11a. Monitoring Data – Dimensional M orphology Summary (Dimensional Parameters –
Cross Sections) Table 11b. Monitoring Data – Stream Reach Data Summary
APPENDIX E. HYDROLOGY DATA Table 12. Verification of Bankfull Events 2013 (Year 5) Groundwater Gauge Graphs Figure 3. Annual Climatic Data vs. 30-year Historic Data Table 13. Wetland Hydrology Criteria Attainment Summary
APPENDIX F. ADDITIONAL SITE MAPPING Restoration Plan Figure 3. NRCS Soil Survey
APPENDIX G. ADDITIONAL SITE PHOTOGRAPHS Preconstruction Site Photographs Asbuilt Site Photographs
Chapel Creek (final) Axiom Environmental, Inc. Monitoring Year 5 of 5 (2013) EEP Project Number 77 January 2014 Orange County, North Carolina Table of Contents
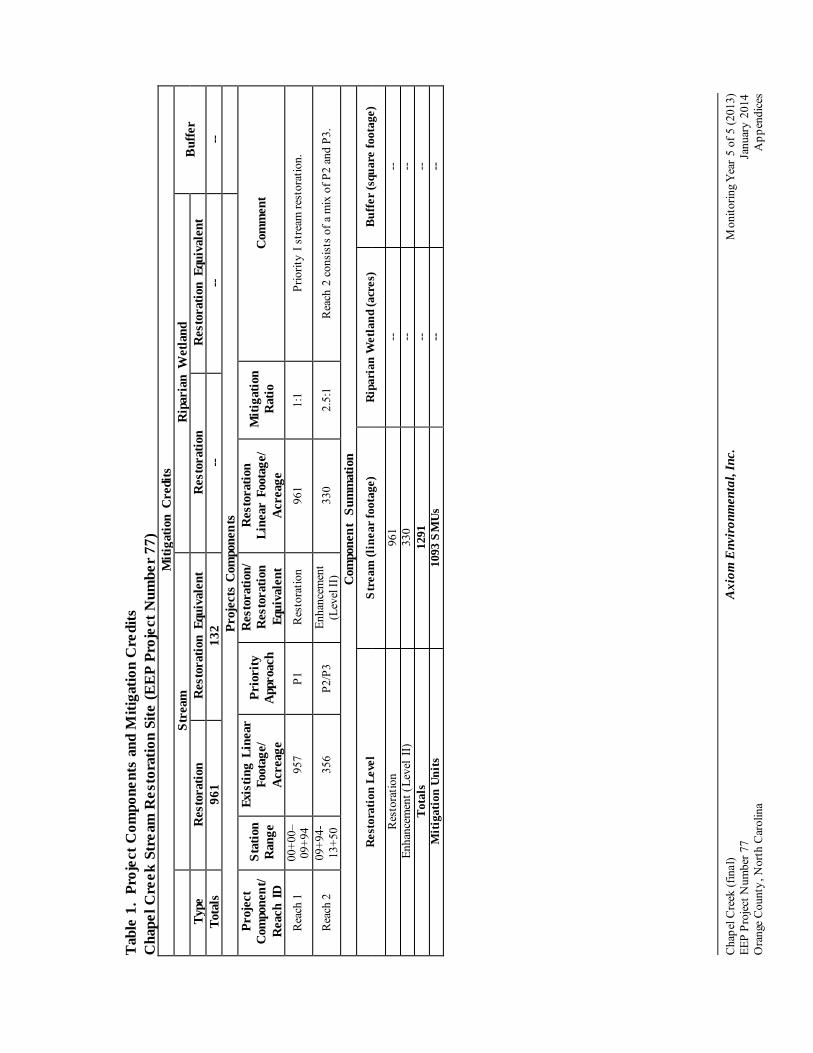
1.0 EXECUTIVE SUMMARY The North Carolina Ecosystem Enhancement Program (NCEEP) has completed restoration of 1350 linear feet of stream at the Chapel Creek Stream Restoration Site (hereafter referred to as the “Site”) to assist in fulfilling stream mitigation goals in the area. Construction of the Chapel Creek Site, originated by the North C arolina Ecosystem E nhancement P rogram (EEP), was completed in J uly 2008. This report (compiled based on EEP’s Procedural Guidance and Content Requirements for EEP Monitoring Reports Version 1.4 dated 11/7/11) summarizes data for year 5 (2013) monitoring. The S ite is located on the University of N orth Carolina Chapel H ill property in Orange County, North Carolina within U nited States Geological S urvey (USGS) Hydrologic U nit and Targeted Local Watershed 03030002060080 (North Carolina Division of Water Quality [NCDWQ] Subbasin 03-06-06) of the Cape Fear River Basin. The Site occurs within the lower Morgan Creek watershed planning area; the Morgan Creek Local Watershed Plan noted water quality de gradation a nd impaired biological communities in the watershed and identified major watershed stressors as streambank erosion, excess stormwater runoff, and disturbed riparian buffers (NCEEP 2004). The drainage area for Chapel Creek is approximately 0.42 square miles at the Site o utfall where a channel that drains through the A.E. Finley Golf Course converges with Chapel Creek. The watershed land us e consists of the University of North Carolina f acilities, single f amily residential land, elementary s chools, roadways, and forested land. The goa ls of the restoration project focus on improving water quality in the Chapel Creek and the Cape Fear River watersheds by the following
• Restoring pattern, profile, and dimension to approximately 9 61 linear feet of Chapel Creek. • Enhancing/stabilizing approximately 3 30 linear feet using a c ombination of Priority 2 and
Priority 3 restoration approaches, excavating a bankfull be nch, and repairing stream banks. • Restoring stable stream channels capable of transporting flows and sediment loads efficiently. • Improving aquatic ha bitat by revegetating stream ba nks to increase s hade, and restoring
sinuosity and riffle-pool complexes. • Reducing sediment inputs by restoring stable stream channels and revegetating banks.
Prior to construction, the Site contained a degraded stream channel located within an abandoned portion of the A.E. Finley Golf Course that was regularly mowed and maintained. Site streams were characterized by entrenched, na rrow, deep, s tep-pool channels w ith low to moderate sinuousity. Project construction was completed in J uly 2008 . The pr oject r estored 961 linear feet of stream us ing Priority I r estoration by constructing a new meandering channel within the floodplain and enhanced (level II) 330 linear feet using a combination of P riority 2 and P riority 3 restoration a pproaches by excavating a bankfull bench a nd repairing stream banks. Site activities provide 1093 Stream Mitigation Units. The Site will be protected by a permanent conservation easement held by the State of North Carolina. Four ve getation m onitoring plots were monitored on September 16, 2013 for year 5 (2013) m onitoring. Vegetation s uccess criteria dictate that a n average density of 320 s tems per acre must be s urviving in the first three monitoring years. Subsequently, 290 stems per acre must be surviving in year 4 and 260 stems per acre in year 5. Stem counts will be based on an average of the evaluated vegetation plots. Based on the number of stems counted, average densities were measured at 607 planted stems per acre (excluding livestakes) surviving in ye ar 5 (2013). The dominant species identified at the Site were planted stems of river bi rch ( Betula nigra), gr een ash ( Fraxinus pennsylvanica), and s outhern arrowwood ( Viburnum dentatum). All individual plots met success criteria based on planted stems alone.
Chapel Creek (final) Axiom Environmental, Inc. Monitoring Year 5 of 5 (2013) EEP Project Number 77 January 2014 Orange County, North Carolina page 1
Several vegetation areas of concern were identified within the S ite during previous monitoring ye ars; however, vegetation throughout the Site is currently doing very well. Natural recruitment of loblolly pine (Pinus taeda) and sweetgum (Liquidambar styraciflua) is high throughout the Site, especially in ar eas of higher planted s tem mortality. Success criteria for stream restoration will be based on stream stability and assessed using measurements of s tream dimension, pattern, a nd profile; site photographs; visual assessments; and vegetation s ampling. Overall, the s tream is functioning properly and emulates design/as-built c onditions. In a ddition, stream success criteria will i nclude doc umentation of two bankfull c hannel events during the monitoring period. In separate monitoring years. A crest ga uge is located w ithin t he S ite t o a ssist w ith doc umentation of bankfull events. Three bankfull e vents were documented during the year 5 (2013) monitoring season for a total of eleven bankfull events with at least one event occurring in each monitoring year. The most recent bankfull e vent occurred after 8.1 inches of rain that fell between June 28 and July 1, 2013, which resulted in floods greater than two times the maximum bankfull channel depth. Several areas of minor bank e rosion/scour w ere identified in p revious monitoring ye ars; however, these areas have stabilized despite several large storm events that occurred during the 2013 monitoring year and are no longer cause for concern. These areas were planted with 125 silky dogwood live stakes in January 2012; the livestakes are doing very well. Summary information/data related to the occurrence of items such as beaver or encroachment and statistics related to performance of various project and monitoring elements can be found in tables and figures within this report’s appendices. Narrative background and supporting information formerly found in these reports can be found in the Baseline M onitoring Report ( formerly M itigation Plan) and in the M itigation Plan (formerly the Restoration P lan) documents available on EEPs website. All raw data supporting the tables and figures in the appendices is available from EEP upon request. 2.0 METHODOLOGY
2.1 Vegetation Assessment Four vegetation plots w ere established a nd marked after construction with m etal conduit demarking t he four plot corners. The plots are 10 meters square or 5-meters by 20-meters and are located randomly within the Site. These plots were surveyed on September 16, 2013 for the year 5 (2013) monitoring season using the CVS-EEP Protocol for Recording Vegetation, Version 4.2 (Lee et al . 2008) (http://cvs.bio.unc.edu/methods.htm); results are included in Appendix C. The taxonomic standard for vegetation us ed for this doc ument w as Flora of the Carolinas, Virginia, Georgia, and Surrounding Areas (Weakley 2007).
2.2 Stream Assessment Annual stream monitoring was conducted the week of May 9, 2013. Five permanent cross-sections, four riffle a nd one pool, were used to e valuate stream dimension; locations are depicted on F igures 2 and 2A-2B (Appendix B). Cross-sections are permanently m onumented w ith m etal conduit at e ach e nd point. Cross-sections were surveyed annually to provide a detailed measurement of the stream and banks including points on the adjacent floodplain, top of bank, bankfull, breaks in slope, edge of water, and thalweg. Data was used to calculate width-depth ratios, e ntrenchment ratios, and bank height ratios for each cross-section. In a ddition, photographs were taken and pe bble c ounts were conducted at each permanent cross-section location a nnually.
Chapel Creek (final) Axiom Environmental, Inc. Monitoring Year 5 of 5 (2013) EEP Project Number 77 January 2014 Orange County, North Carolina page 2
One approximately 1 300-linear foot monitoring reach was used to evaluated stream pattern and longitudinal profile; locations are depicted on F igures 2 and 2A-2B (Appendix B). Measurements of channel pattern included be lt-width and meander length. S ubsequently, data was used to calculate meander-width ratios. Longitudinal profile m easurements included average water surface slopes, facet slopes, and pool-to-pool spacing. In addition, visual stream morphology stability assessments were completed in each of the three monitoring reaches annually to assess the channel bed, banks, and in-stream structures (Tables 5A -5C, Appendix B ). 3.0 REFERENCES Lee, Michael T., R.K. Peet, S.D. Roberts, and T.R. Wentworth. 2008. CVS-EEP Protocol for Recording
Vegetation, Version 4.2. (online). Available: http://cvs.bio.unc.edu/methods.htm. North Carolina Ecosystem Enhancement Program (NCEEP). 2004. Morgan Creek Local Watershed Plan
Detailed Assessment Report. Available: http://www.nceep.net/services/lwps/Morgan_Creek/MLCdata/DetailedAssessmentReport/MLCDetAssRep.pdf [July 2012]. N orth Carolina Department of Environment and N atural Resources, Ecosystem Enhancement Program. Raleigh, North Carolina.
Weakley, Alan S. 2007. F lora of t he C arolinas, Virginia, Georgia, and S urrounding Areas (online).
Available: http://www.herbarium.unc.edu/WeakleysFlora.pdf [February 1, 2008]. University of North Carolina Herbarium, North Carolina Botanical Garden, University of North Carolina, Chapel Hill, North Carolina.
Weather Underground. 2013. Station at Chapel H ill (KGIX) in Chapel H ill, North Carolina. (online).
Available: http://www.wunderground.com/history/airport/KIGX/2013/10/02/CustomHistory.html [October 2, 2013].
Chapel Creek (final) Axiom Environmental, Inc. Monitoring Year 5 of 5 (2013) EEP Project Number 77 January 2014 Orange County, North Carolina page 3

APPENDIX A
PROJECT VICINITY MAP AND BACKGROUND TABLES
Figure 1. Vicinity M ap Table 1. Project Restoration Components
Table 2. Project Activity and Reporting History
Table 3. Project Contacts Table
Table 4. Project Attributes Table
Chapel Creek (final) Axiom Environmental, Inc. Monitoring Year 5 of 5 (2013) EEP Project Number 77 January 2014 Orange County, North Carolina Appendices
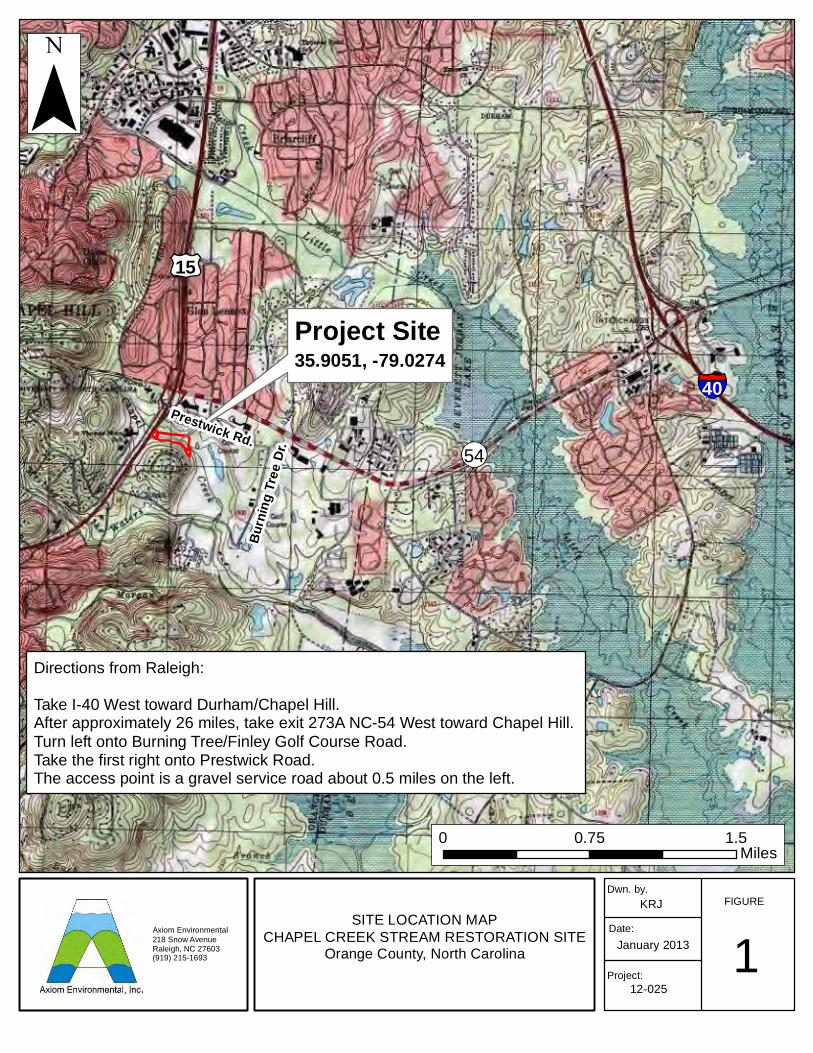
SITE LOCATION MAPCHAPEL CREEK STREAM RESTORATION SITE
Orange County, North Carolina
Dwn. by.
Date:
Project:
FIGURE
1KRJ
January 2013
12-025
Axiom Environmental218 Snow AvenueRaleigh, NC 27603(919) 215-1693
¯
0 1.50.75Miles
Project Site35.9051, -79.0274
Directions from Raleigh:
Take I-40 West toward Durham/Chapel Hill.After approximately 26 miles, take exit 273A NC-54 West toward Chapel Hill.Turn left onto Burning Tree/Finley Golf Course Road.Take the first right onto Prestwick Road.The access point is a gravel service road about 0.5 miles on the left.
��54
tu15B
urni
ng
Tree
Dr.
���40Prestwick Rd.
Tab
le 1
. Pr
ojec
t Com
pone
nts
and
Miti
gatio
n C
redi
ts
Cha
pel C
reek
Str
eam
Res
tora
tion
Site
(EE
P Pr
ojec
t Num
ber
77)
Miti
gatio
n C
redi
ts
St
ream
R
ipar
ian
Wet
land
B
uffe
r Ty
pe
Res
tora
tion
Res
tora
tion
Equi
vale
nt
Res
tora
tion
Res
tora
tion
Equi
vale
nt
Tota
ls
961
132
-- --
-- Pr
ojec
ts C
ompo
nent
s
Proj
ect
Com
pone
nt/
Rea
ch I
D
Stat
ion
Ran
ge
Exis
ting
Line
ar
Foot
age/
A
crea
ge
Prio
rity
A
ppro
ach
Res
tora
tion/
R
esto
ratio
n Eq
uiva
lent
Res
tora
tion
Line
ar F
oota
ge/
Acr
eage
Miti
gatio
n R
atio
C
omm
ent
Rea
ch 1
00
+00–
09
+94
957
P1
Res
tora
tion
961
1:1
Prio
rity
I str
eam
rest
orat
ion.
Rea
ch 2
09
+94-
13
+50
356
P2/P
3 En
hanc
emen
t (L
evel
II)
330
2.5:
1 R
each
2 c
onsi
sts
of a
mix
of P
2 an
d P3
.
Com
pone
nt S
umm
atio
n R
esto
rati
on L
evel
S
trea
m (l
inea
r fo
otag
e)
Rip
aria
n W
etla
nd (a
cres
) B
uffe
r (s
quar
e fo
otag
e)
Res
tora
tion
961
--
--
Enha
ncem
ent (
Leve
l II
) 33
0 --
--
T
otal
s
1291
--
--
M
itig
atio
n U
nits
10
93 S
MU
s --
--
C
hape
l Cre
ek (f
inal
) A
xiom
Env
iron
men
tal,
Inc.
M
onito
ring
Yea
r 5
of 5
(201
3)
EEP
Proj
ect N
umbe
r 77
J
anua
ry 2
014
Ora
nge
Cou
nty,
Nor
th C
arol
ina
A
ppen
dice
s
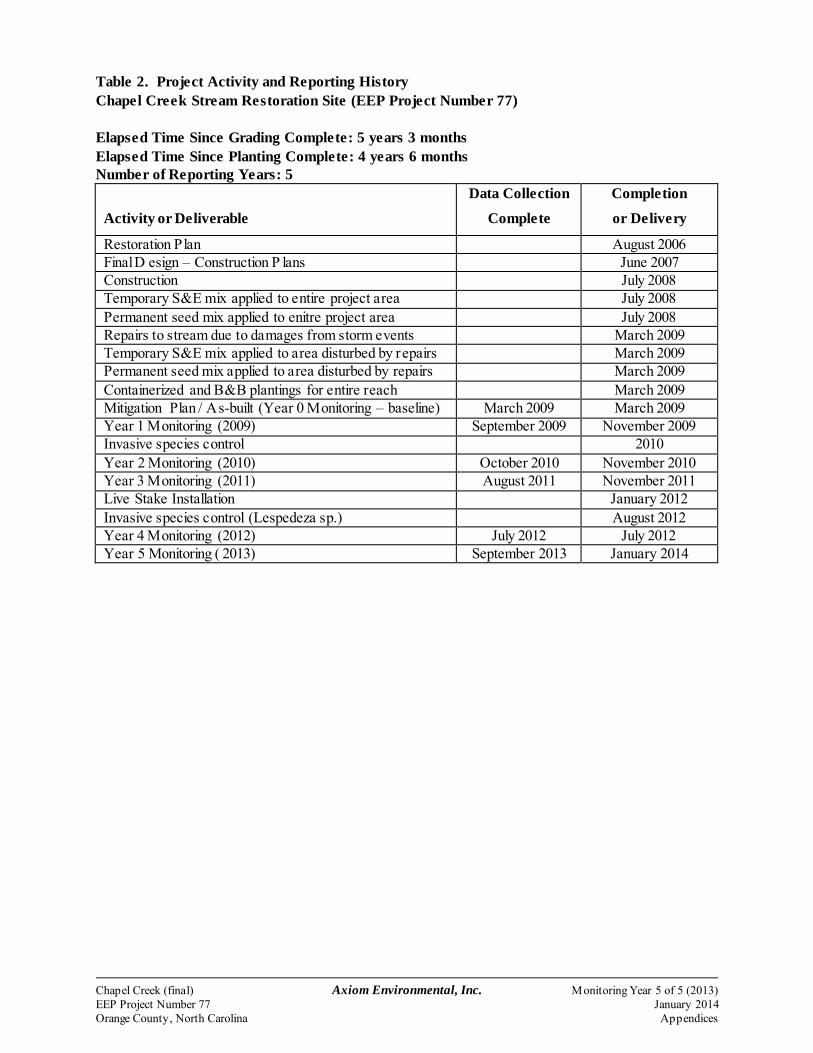
Table 2. Project Activity and Reporting History Chapel Creek Stream Restoration Site (EEP Project Number 77) Elapsed Time Since Grading Complete: 5 years 3 months Elapsed Time Since Planting Complete: 4 years 6 months Number of Reporting Years: 5
Activity or Deliverable
Data Collection
Complete
Completion
or Delivery
Restoration Plan August 2006 Final D esign – Construction P lans June 2007 Construction July 2008 Temporary S&E mix applied to entire project area July 2008 Permanent seed mix applied to enitre project area July 2008 Repairs to stream due to damages from storm events March 2009 Temporary S&E mix applied to area disturbed by repairs March 2009 Permanent seed mix applied to area disturbed by repairs March 2009 Containerized and B&B plantings for entire reach March 2009 Mitigation Plan / As-built (Year 0 Monitoring – baseline) March 2009 March 2009 Year 1 Monitoring (2009) September 2009 November 2009 Invasive species control 2010 Year 2 Monitoring (2010) October 2010 November 2010 Year 3 Monitoring (2011) August 2011 November 2011 Live Stake Installation January 2012 Invasive species control (Lespedeza sp.) August 2012 Year 4 Monitoring (2012) July 2012 July 2012 Year 5 Monitoring ( 2013) September 2013 January 2014
Chapel Creek (final) Axiom Environmental, Inc. Monitoring Year 5 of 5 (2013) EEP Project Number 77 January 2014 Orange County, North Carolina Appendices
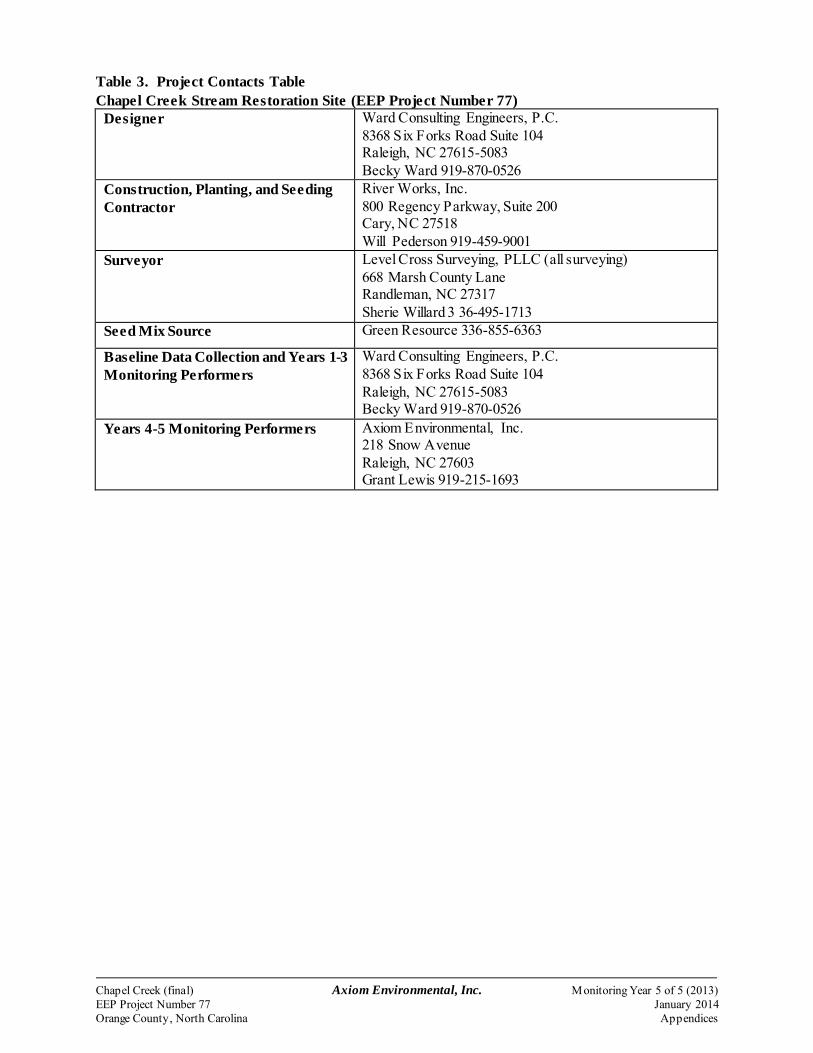
Table 3. Project Contacts Table Chapel Creek Stream Restoration Site (EEP Project Number 77)
Designer
Ward Consulting Engineers, P.C. 8368 Six Forks Road Suite 104 Raleigh, NC 27615-5083 Becky Ward 919-870-0526
Construction, Planting, and Seeding Contractor
River Works, Inc. 800 Regency Parkway, Suite 200 Cary, NC 27518 Will Pederson 919-459-9001
Surveyor Level Cross Surveying, PLLC (all surveying) 668 Marsh County Lane Randleman, NC 27317 Sherie Willard 3 36-495-1713
Seed Mix Source Green Resource 336-855-6363
Baseline Data Collection and Years 1-3 Monitoring Performers
Ward Consulting Engineers, P.C. 8368 Six Forks Road Suite 104 Raleigh, NC 27615-5083 Becky Ward 919-870-0526
Years 4-5 Monitoring Performers Axiom Environmental, Inc. 218 Snow Avenue Raleigh, NC 27603 Grant Lewis 919-215-1693
Chapel Creek (final) Axiom Environmental, Inc. Monitoring Year 5 of 5 (2013) EEP Project Number 77 January 2014 Orange County, North Carolina Appendices

Table 4. Project Baseline Information and Attributes Chapel Creek Stream Restoration Site (EEP Project Number 77)
Project Information Project Name Chapel Creek Stream Restoration Site Project County Orange County, North Carolina Project Area 5.15 acres Project Coordinates 35.9055◦N, 79.0289◦W
(near station 0+00 at Fordham Drive) Project Watershed Summary Information
Physiographic R egion Piedmont Ecoregion Triassic Basin Project River Basin Cape Fear USGS 8-digit H UC 03030002 USGS 14-digit H UC 03030002060080 NCDWQ Subbasin 03-06-06 Project Drainage Area 0.42 square miles Project Drainage Area Impervious Surface 9% Watershed Type Urban
Reach Summary Information Parameters Reach 1 Reach 2 Restored/Enhanced Length 961 linear f eet 356 linear feet Drainage Area 0.42 square miles NCDWQ Index Number 16-41-2-8 NCDWQ Classification WS-IV, NSW Valley Type/Morphological Description VIII/C4 Dominant S oil Series Chewacla Drainage Class Somewhat poorly drained Soil Hydric Status Nonhydric, may contain hydric Wehadkee inclusions Slope 0.0136 0.017 FEMA Classification 100-year floodplain Native Vegetation Community Piedmont/Low Mountain A lluvial Forest Percent Composition of Exotic Invasives 5.4
Regulatory Considerations Regulation Applicable Waters of the U.S. –Sections 404 and 401 Yes-Received Appropriate Permits Endangered Species Act No Historic Preservation Act No CZMA/CAMA No FEMA Floodplain Compliance Yes-LOMR completed a nd c onfirmed by S ue B urke,
Floodplain Manager, Town of Chapel Hill Essential Fisheries Habitat No
Chapel Creek (final) Axiom Environmental, Inc. Monitoring Year 5 of 5 (2013) EEP Project Number 77 January 2014 Orange County, North Carolina Appendices

APPENDIX B VISUAL ASSESSMENT DATA
Figures 2 and 2A-2B. Current Conditions Plan View
Table 5. Visual Stream Morphology S tability A ssessment Table
Table 6. Vegetation Condition Assessment Table
Vegetation Monitoring Plot Photos
Chapel Creek (final) Axiom Environmental, Inc. Monitoring Year 5 of 5 (2013) EEP Project Number 77 January 2014 Orange County, North Carolina Appendices
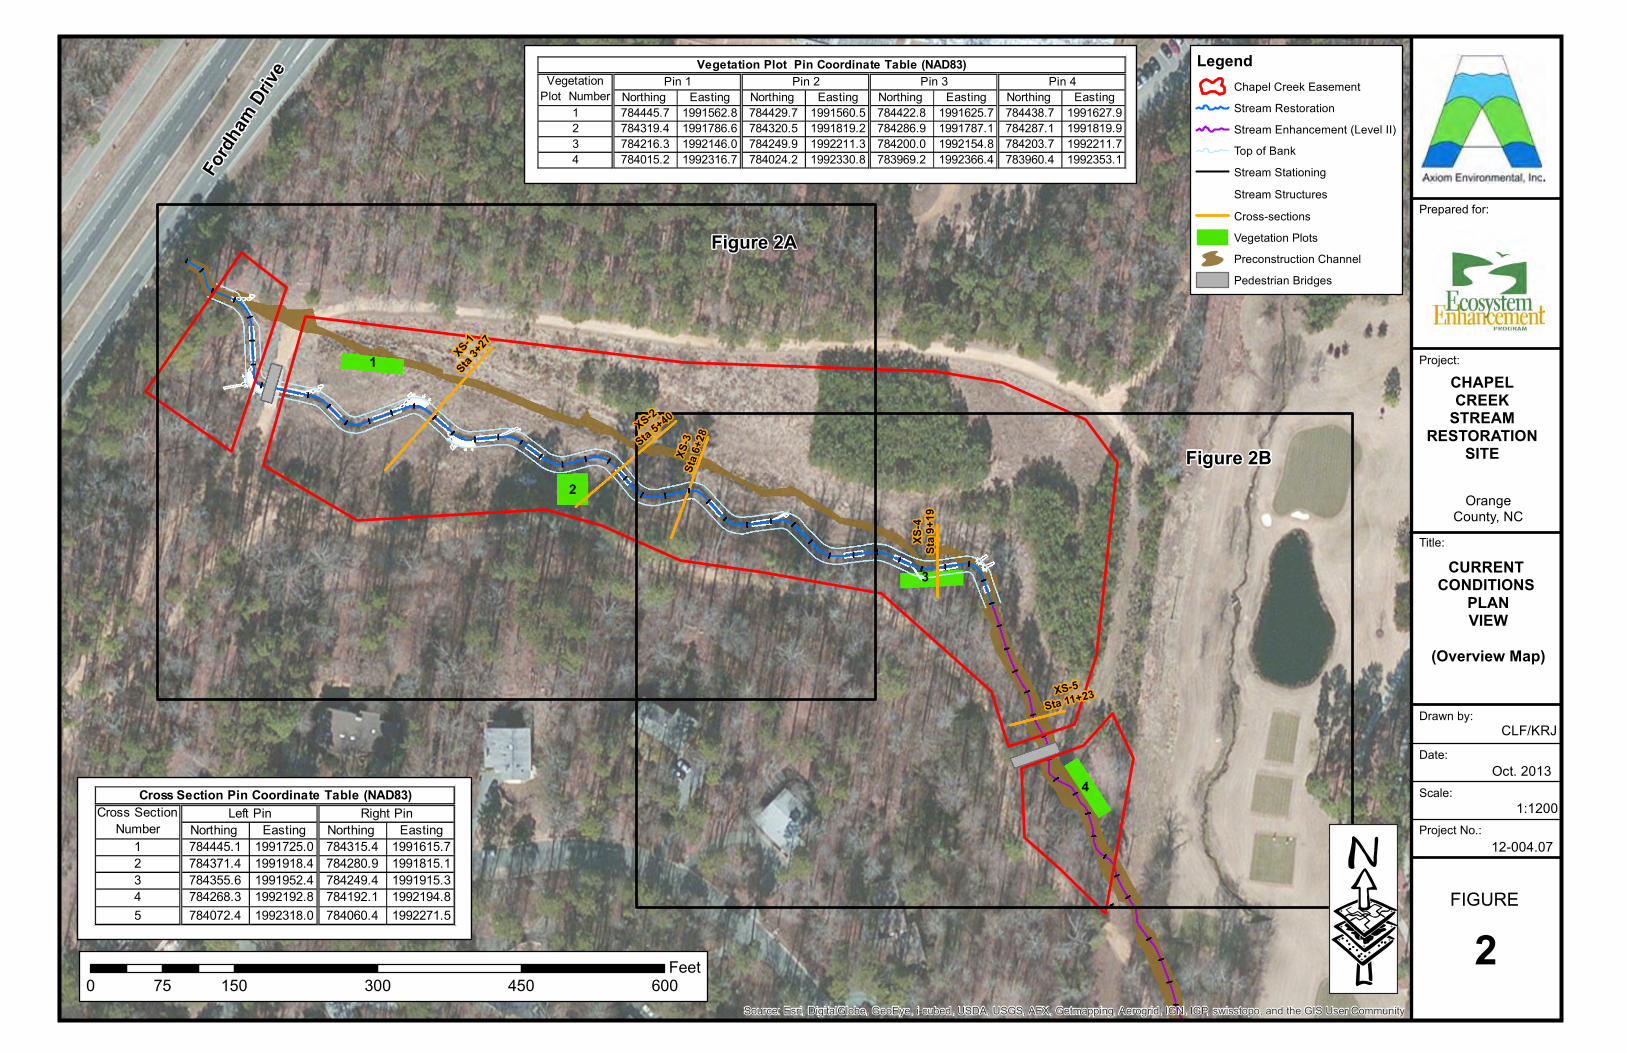
Figure 2A
Figure 2B
1
2
3
4
XS-1
Sta
3+2
7
XS-2
Sta 5
+40
XS
-3S
ta 6
+28
XS
-4
Sta
9+
19
XS-5
Sta 11+23
Source: Esri, DigitalGlobe, GeoEye, i-cubed, USDA, USGS, AEX, Getmapping, Aerogrid, IGN, IGP, swisstopo, and the GIS User Community
FIGURE
Drawn by:
Date:
Scale:
Project No.:
CLF/KRJ
Oct. 2013
1:1200
12-004.07
Title:
Project:
Prepared for:
Orange
County, NC
CHAPELCREEK
STREAMRESTORATION
SITE
CURRENT CONDITIONS
PLANVIEW
(Overview Map)
20 150 300 450 60075
Feet
Legend
Chapel Creek Easement
Stream Restoration
Stream Enhancement (Level II)
Top of Bank
Stream Stationing
Stream Structures
Cross-sections
Vegetation Plots
Preconstruction Channel
Pedestrian Bridges
Ford
ham
Dri
ve
·Northing Easting Northing Easting
1 784445.1 1991725.0 784315.4 1991615.7
2 784371.4 1991918.4 784280.9 1991815.1
3 784355.6 1991952.4 784249.4 1991915.3
4 784268.3 1992192.8 784192.1 1992194.8
5 784072.4 1992318.0 784060.4 1992271.5
Right PinLeft Pin
Cross Section Pin Coordinate Table (NAD83)
Cross Section
Number
Northing Easting Northing Easting Northing Easting Northing Easting
1 784445.7 1991562.8 784429.7 1991560.5 784422.8 1991625.7 784438.7 1991627.9
2 784319.4 1991786.6 784320.5 1991819.2 784286.9 1991787.1 784287.1 1991819.9
3 784216.3 1992146.0 784249.9 1992211.3 784200.0 1992154.8 784203.7 1992211.7
4 784015.2 1992316.7 784024.2 1992330.8 783969.2 1992366.4 783960.4 1992353.1
Vegetation
Plot Number
Vegetation Plot Pin Coordinate Table (NAD83)
Pin 4Pin 3Pin 2Pin 1
1
2
XS-1
Sta
3+2
7
XS-2
Sta 5
+40
XS
-3S
ta 6
+28
0+00
6+
00
1+00
8+
00
7+
002+
00
5+
00
4+
00
3+
00
Source: Esri, DigitalGlobe, GeoEye, i-cubed, USDA, USGS, AEX, Getmapping, Aerogrid, IGN, IGP, swisstopo, and the GIS User Community
FIGURE
Drawn by:
Date:
CLF/KRJ
Oct. 2013
1:630
12-004.07
Title:
Project:
Prepared for:
Orange
County, NC
CHAPELCREEK
STREAMRESTORATION
SITE
CURRENT CONDITIONS
PLANVIEW
2A0 50 100 150 200 25025
Feet
Ped
estr
ian
Bri
dg
e
Scale:
Project No.:
·
Legend
Chapel Creek Easement
Stream Restoration
Stream Enhancement (Level II)
Top of Bank
Stream Stationing
Stream Structures
Cross-sections
Vegetation Plots
Preconstruction Channel
Pedestrian Bridge
2
3
4
11+00
10+00
13+00
XS-2
Sta 5
+40
XS
-3S
ta 6
+28
XS
-4S
ta 9
+19
XS-5
Sta 11+23
12+00
6+
00
9+
008+
00
7+
00
5+
00
Source: Esri, DigitalGlobe, GeoEye, i-cubed, USDA, USGS, AEX, Getmapping, Aerogrid, IGN, IGP, swisstopo, and the GIS User Community
FIGURE
Drawn by:
Date:
Scale:
Project No.:
CLF/KRJ
Oct. 2013
1:630
12-004.07
Title:
Project:
Prepared for:
Orange
County, NC
CHAPELCREEK
STREAMRESTORATION
SITE
CURRENT CONDITIONS
PLANVIEW
2B0 50 100 150 200 25025
Feet
Legend
Chapel Creek Easement
Stream Restoration
Stream Enhancement (Level II)
Top of Bank
Stream Stationing
Stream Structures
Cross-sections
Vegetation Plots
Preconstruction Channel
Pedestrian Bridge
Pedestrian Bridge
·

1. Vertical Stability (Riffle and Run units)
1. Aggradation - Bar formation/growth sufficient to significantly deflect flow laterally (not to include point bars) 100%
2. Degradation - Evidence of downcutting 100%
2. Riffle Condition 1. Texture/Substrate - Riffle maintains coarser substrate 17 17 100%
3. Meander Pool Condition 1. Depth Sufficient (Max Pool Depth : Mean Bankfull Depth > 1.6) 17 17 100%
2. Length appropriate (>30% of centerline distance between tail of upstream riffle and head of downstrem riffle) 17 17 100%
4.Thalweg Position 1. Thalweg centering at upstream of meander bend (Run) 17 17 100%
2. Thalweg centering at downstream of meander (Glide) 17 17 100%
1. Scoured/Eroding Bank lacking vegetative cover resulting simply from poor growth and/or scour and erosion 100% 100%
2. UndercutBanks undercut/overhanging to the extent that mass wasting appears likely. Does NOT include undercuts that are modest, appear sustainable and are providing habitat.
100% 100%
3. Mass Wasting Bank slumping, calving, or collapse 100% 100%
0 0 100% 0 0 100%
1. Overall Integrity Structures physically intact with no dislodged boulders or logs. 8 8 100%
2. Grade Control Grade control structures exhibiting maintenance of grade across the sill. 8 8 100%
2a. Piping Structures lacking any substantial flow underneath sills or arms. 8 8 100%
3. Bank Protection Bank erosion within the structures extent of influence does not exceed 15%. (See guidance for this table in EEP monitoring guidance document) 8 8 100%
4. Habitat Pool forming structures maintaining ~ Max Pool Depth : Mean Bankfull Depth ratio > 1.6 Rootwads/logs providing some cover at base-flow. 8 8 100%
2. Bank
Totals
3. Engineered Structures
1. Bed
Major Channel Category
Table 5 Visual Stream Morphology Stability Assessment
Reach ID Reach 1 (Restoration)Assessed Length
Amount of Unstable Footage
% Stable, Performing as
Intended
Number with Stabilizing
Woody Vegetation
Footage with Stabilizing
Woody Vegetation
Adjusted % for Stabilizing
Woody Vegetation
961
Channel Sub-Category Metric
Number Stable, Performing as
IntendedTotal Number in
As-built
Number of Unstable Segments
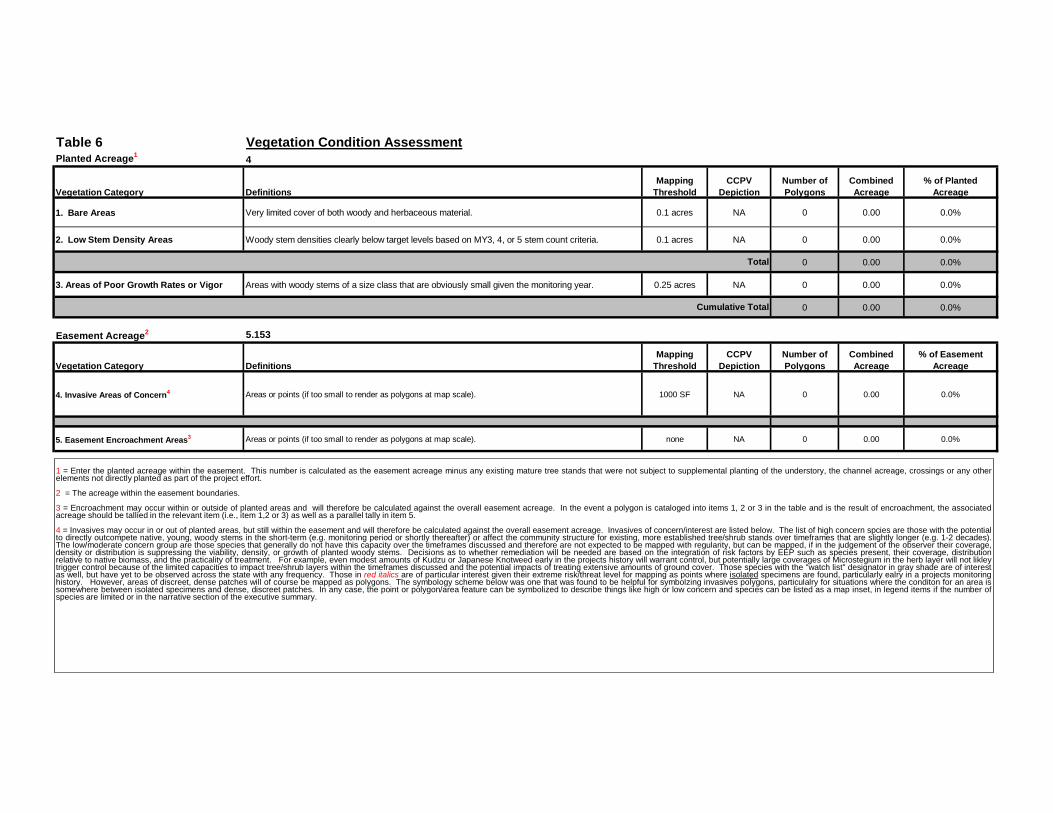
Table 6 Vegetation Condition AssessmentPlanted Acreage1 4
1. Bare Areas Very limited cover of both woody and herbaceous material. 0.1 acres NA 0 0.00 0.0%
2. Low Stem Density Areas Woody stem densities clearly below target levels based on MY3, 4, or 5 stem count criteria. 0.1 acres NA 0 0.00 0.0%
0 0.00 0.0%
3. Areas of Poor Growth Rates or Vigor Areas with woody stems of a size class that are obviously small given the monitoring year. 0.25 acres NA 0 0.00 0.0%
0 0.00 0.0%
Easement Acreage2 5.153
4. Invasive Areas of Concern4 Areas or points (if too small to render as polygons at map scale). 1000 SF NA 0 0.00 0.0%
5. Easement Encroachment Areas3 Areas or points (if too small to render as polygons at map scale). none NA 0 0.00 0.0%
% of Planted Acreage
Total
Cumulative Total
Vegetation Category DefinitionsMapping
ThresholdCCPV
DepictionNumber of Polygons
Combined Acreage
% of Easement Acreage
Vegetation Category DefinitionsMapping
ThresholdCCPV
DepictionNumber of Polygons
Combined Acreage
1 = Enter the planted acreage within the easement. This number is calculated as the easement acreage minus any existing mature tree stands that were not subject to supplemental planting of the understory, the channel acreage, crossings or any otherelements not directly planted as part of the project effort.
2 = The acreage within the easement boundaries.
3 = Encroachment may occur within or outside of planted areas and will therefore be calculated against the overall easement acreage. In the event a polygon is cataloged into items 1, 2 or 3 in the table and is the result of encroachment, the associatedacreage should be tallied in the relevant item (i.e., item 1,2 or 3) as well as a parallel tally in item 5.
4 = Invasives may occur in or out of planted areas, but still within the easement and will therefore be calculated against the overall easement acreage. Invasives of concern/interest are listed below. The list of high concern spcies are those with the potentialto directly outcompete native, young, woody stems in the short-term (e.g. monitoring period or shortly thereafter) or affect the community structure for existing, more established tree/shrub stands over timeframes that are slightly longer (e.g. 1-2 decades).The low/moderate concern group are those species that generally do not have this capacity over the timeframes discussed and therefore are not expected to be mapped with regularity, but can be mapped, if in the judgement of the observer their coverage,density or distribution is suppressing the viability, density, or growth of planted woody stems. Decisions as to whether remediation will be needed are based on the integration of risk factors by EEP such as species present, their coverage, distributionrelative to native biomass, and the practicality of treatment. For example, even modest amounts of Kudzu or Japanese Knotweed early in the projects history will warrant control, but potentially large coverages of Microstegium in the herb layer will not likleytrigger control because of the limited capacities to impact tree/shrub layers within the timeframes discussed and the potential impacts of treating extensive amounts of ground cover. Those species with the "watch list" designator in gray shade are of interestas well, but have yet to be observed across the state with any frequency. Those in red italics are of particular interest given their extreme risk/threat level for mapping as points where isolated specimens are found, particularly ealry in a projects monitoringhistory. However, areas of discreet, dense patches will of course be mapped as polygons. The symbology scheme below was one that was found to be helpful for symbolzing invasives polygons, particulalry for situations where the conditon for an area issomewhere between isolated specimens and dense, discreet patches. In any case, the point or polygon/area feature can be symbolized to describe things like high or low concern and species can be listed as a map inset, in legend items if the number ofspecies are limited or in the narrative section of the executive summary.
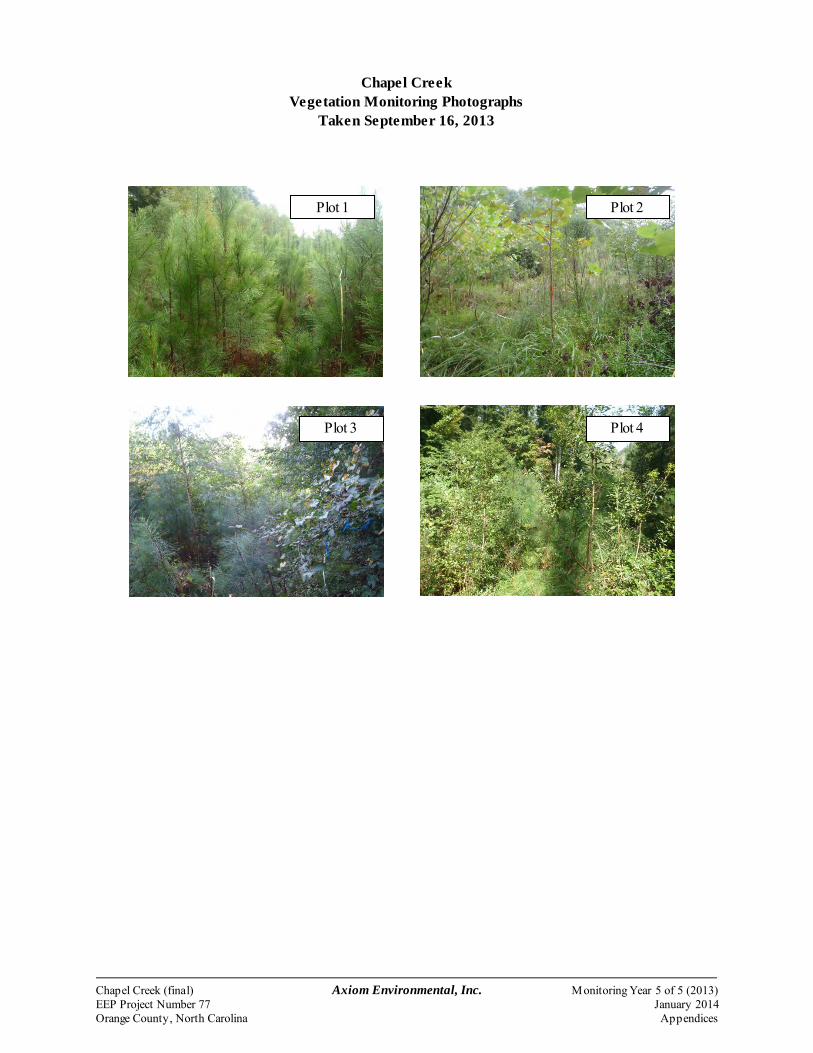
Chapel Creek Vegetation Monitoring Photographs
Taken September 16, 2013
Plot 1
Plot 4 Plot 3
Plot 2
Chapel Creek (final) Axiom Environmental, Inc. Monitoring Year 5 of 5 (2013) EEP Project Number 77 January 2014 Orange County, North Carolina Appendices

APPENDIX C
VEGETATION PLOT DATA Table 7. Vegetation Plot Criteria Attainment
Table 8. CVS Vegetation Plot Metadata
Table 9. Total and Planted Stems by Plot and Species
Chapel Creek (final) Axiom Environmental, Inc. Monitoring Year 5 of 5 (2013) EEP Project Number 77 January 2014 Orange County, North Carolina Appendices

Table 7. Vegetation Plot Criteria Attainment Chapel Creek Restoration Site (EEP Project Number 77)
Vegetation Plot ID Vegetation Survival Threshold Met? Tract Mean 1 Yes
100% 2 Yes 3 Yes 4 Yes
Chapel Creek (final) Axiom Environmental, Inc. Monitoring Year 5 of 5 (2013) EEP Project Number 77 January 2014 Orange County, North Carolina Appendices
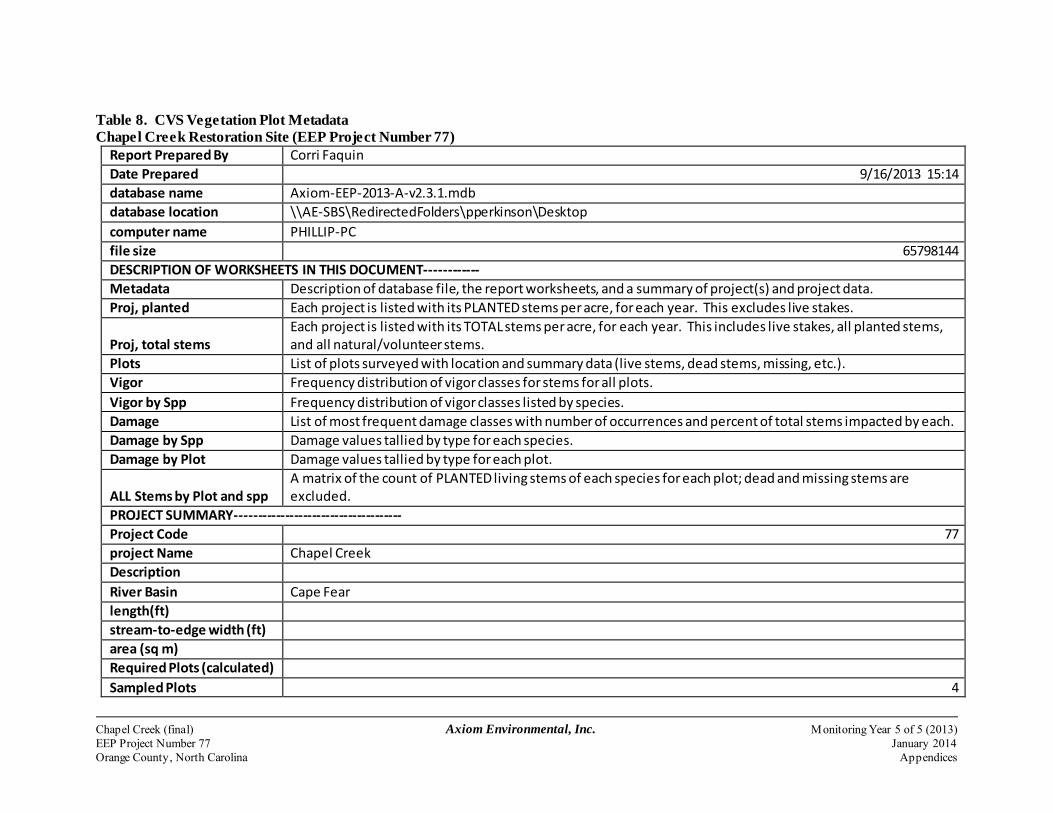
Table 8. CVS Vegetation Plot Metadata Chapel Creek Restoration Site (EEP Project Number 77)
Report Prepared By Corri Faquin Date Prepared 9/16/2013 15:14 database name Axiom-EEP-2013-A-v2.3.1.mdb database location \\AE-SBS\RedirectedFolders\pperkinson\Desktop computer name PHILLIP-PC file size 65798144 DESCRIPTION OF WORKSHEETS IN THIS DOCUMENT------------ Metadata Description of database file, the report worksheets, and a summary of project(s) and project data. Proj, planted Each project is listed with its PLANTED stems per acre, for each year. This excludes live stakes.
Proj, total stems Each project is listed with its TOTAL stems per acre, for each year. This includes live stakes, all planted stems, and all natural/volunteer stems.
Plots List of plots surveyed with location and summary data (live stems, dead stems, missing, etc.). Vigor Frequency distribution of vigor classes for stems for all plots. Vigor by Spp Frequency distribution of vigor classes listed by species. Damage List of most frequent damage classes with number of occurrences and percent of total stems impacted by each. Damage by Spp Damage values tallied by type for each species. Damage by Plot Damage values tallied by type for each plot.
ALL Stems by Plot and spp A matrix of the count of PLANTED living stems of each species for each plot; dead and missing stems are excluded.
PROJECT SUMMARY------------------------------------- Project Code 77 project Name Chapel Creek Description River Basin Cape Fear length(ft) stream-to-edge width (ft) area (sq m) Required Plots (calculated) Sampled Plots 4
Chapel Creek (final) Axiom Environmental, Inc. Monitoring Year 5 of 5 (2013) EEP Project Number 77 January 2014 Orange County, North Carolina Appendices
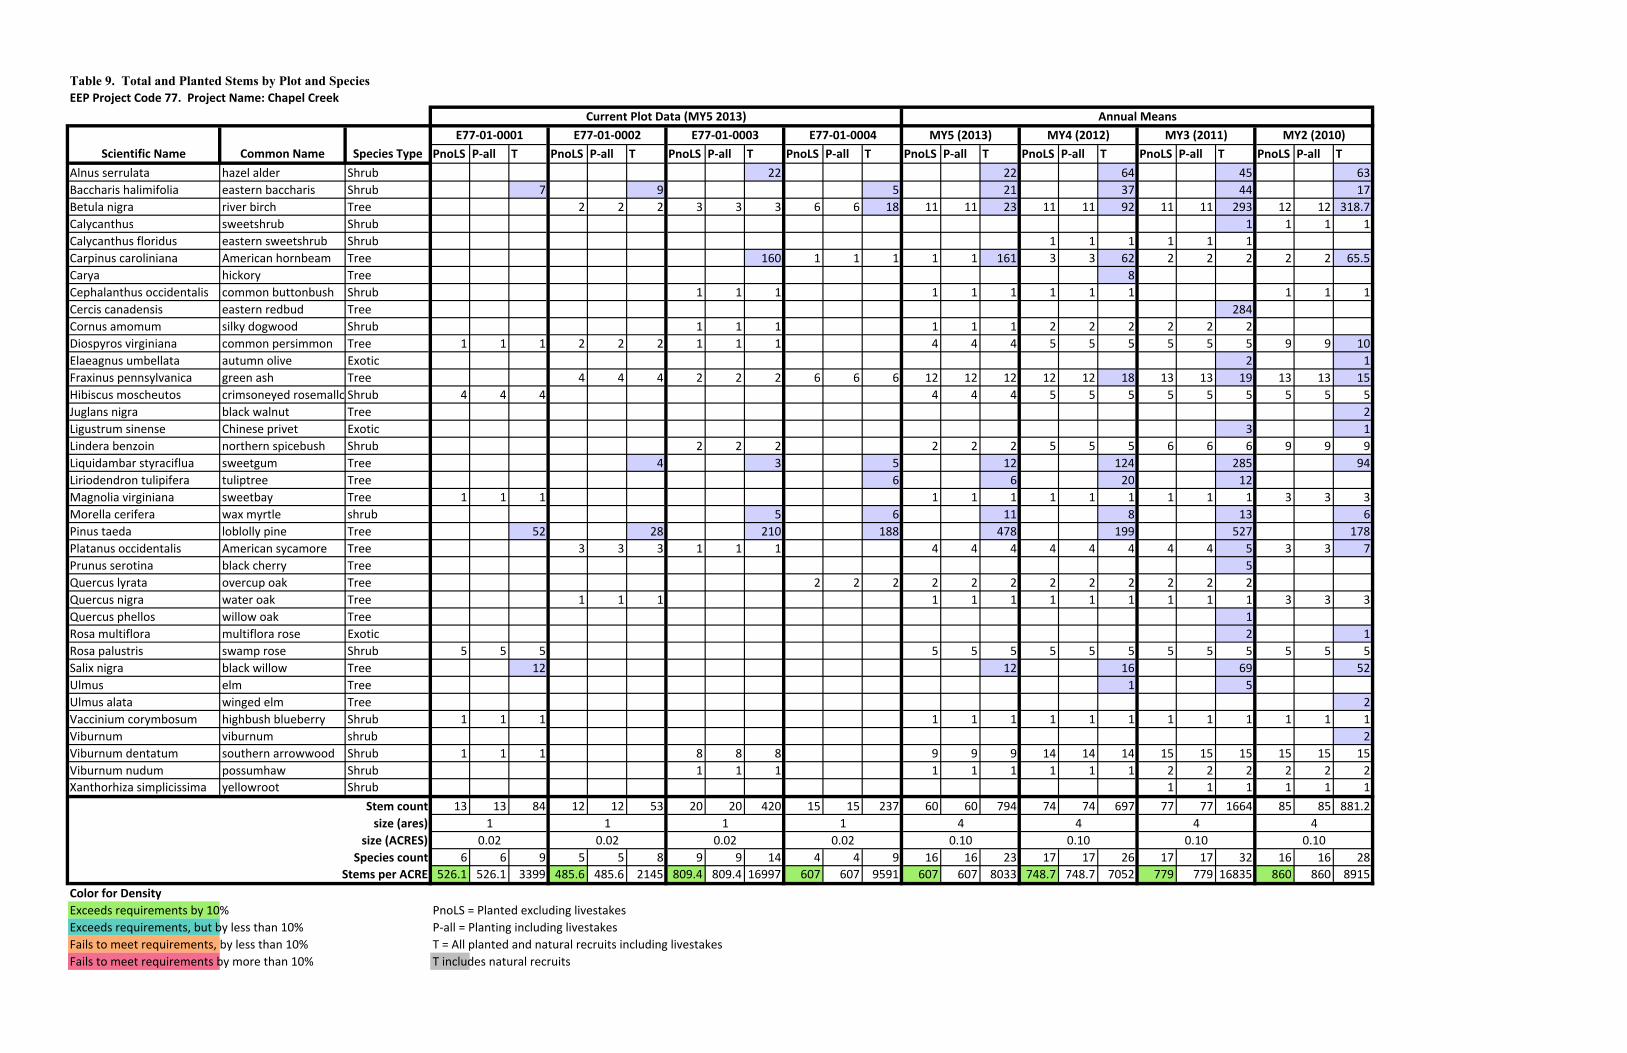
Table 9. Total and Planted Stems by Plot and Species
EEP Project Code 77. Project Name: Chapel Creek
PnoLS P-all T PnoLS P-all T PnoLS P-all T PnoLS P-all T PnoLS P-all T PnoLS P-all T PnoLS P-all T PnoLS P-all T
Alnus serrulata hazel alder Shrub 22 22 64 45 63
Baccharis halimifolia eastern baccharis Shrub 7 9 5 21 37 44 17
Betula nigra river birch Tree 2 2 2 3 3 3 6 6 18 11 11 23 11 11 92 11 11 293 12 12 318.7
Calycanthus sweetshrub Shrub 1 1 1 1
Calycanthus floridus eastern sweetshrub Shrub 1 1 1 1 1 1
Carpinus caroliniana American hornbeam Tree 160 1 1 1 1 1 161 3 3 62 2 2 2 2 2 65.5
Carya hickory Tree 8
Cephalanthus occidentalis common buttonbush Shrub 1 1 1 1 1 1 1 1 1 1 1 1
Cercis canadensis eastern redbud Tree 284
Cornus amomum silky dogwood Shrub 1 1 1 1 1 1 2 2 2 2 2 2
Diospyros virginiana common persimmon Tree 1 1 1 2 2 2 1 1 1 4 4 4 5 5 5 5 5 5 9 9 10
Elaeagnus umbellata autumn olive Exotic 2 1
Fraxinus pennsylvanica green ash Tree 4 4 4 2 2 2 6 6 6 12 12 12 12 12 18 13 13 19 13 13 15
Hibiscus moscheutos crimsoneyed rosemallowShrub 4 4 4 4 4 4 5 5 5 5 5 5 5 5 5
Juglans nigra black walnut Tree 2
Ligustrum sinense Chinese privet Exotic 3 1
Lindera benzoin northern spicebush Shrub 2 2 2 2 2 2 5 5 5 6 6 6 9 9 9
Liquidambar styraciflua sweetgum Tree 4 3 5 12 124 285 94
Liriodendron tulipifera tuliptree Tree 6 6 20 12
Magnolia virginiana sweetbay Tree 1 1 1 1 1 1 1 1 1 1 1 1 3 3 3
Morella cerifera wax myrtle shrub 5 6 11 8 13 6
Pinus taeda loblolly pine Tree 52 28 210 188 478 199 527 178
Platanus occidentalis American sycamore Tree 3 3 3 1 1 1 4 4 4 4 4 4 4 4 5 3 3 7
Prunus serotina black cherry Tree 5
Quercus lyrata overcup oak Tree 2 2 2 2 2 2 2 2 2 2 2 2
Quercus nigra water oak Tree 1 1 1 1 1 1 1 1 1 1 1 1 3 3 3
Quercus phellos willow oak Tree 1
Rosa multiflora multiflora rose Exotic 2 1
Rosa palustris swamp rose Shrub 5 5 5 5 5 5 5 5 5 5 5 5 5 5 5
Salix nigra black willow Tree 12 12 16 69 52
Ulmus elm Tree 1 5
Ulmus alata winged elm Tree 2
Vaccinium corymbosum highbush blueberry Shrub 1 1 1 1 1 1 1 1 1 1 1 1 1 1 1
Viburnum viburnum shrub 2
Viburnum dentatum southern arrowwood Shrub 1 1 1 8 8 8 9 9 9 14 14 14 15 15 15 15 15 15
Viburnum nudum possumhaw Shrub 1 1 1 1 1 1 1 1 1 2 2 2 2 2 2
Xanthorhiza simplicissima yellowroot Shrub 1 1 1 1 1 1
13 13 84 12 12 53 20 20 420 15 15 237 60 60 794 74 74 697 77 77 1664 85 85 881.2
6 6 9 5 5 8 9 9 14 4 4 9 16 16 23 17 17 26 17 17 32 16 16 28
526.1 526.1 3399 485.6 485.6 2145 809.4 809.4 16997 607 607 9591 607 607 8033 748.7 748.7 7052 779 779 16835 860 860 8915
Color for Density
Exceeds requirements by 10% PnoLS = Planted excluding livestakes
Exceeds requirements, but by less than 10% P-all = Planting including livestakes
Fails to meet requirements, by less than 10% T = All planted and natural recruits including livestakes
Fails to meet requirements by more than 10% T includes natural recruits
Stem count
Current Plot Data (MY5 2013)
Scientific Name Common Name Species Type
E77-01-0001 E77-01-0002 E77-01-0003 E77-01-0004
Annual Means
MY5 (2013) MY4 (2012) MY3 (2011) MY2 (2010)
size (ares)
size (ACRES)
Species count
Stems per ACRE
1
0.02
1
0.02
1
0.02
1
0.02
4
0.10
4
0.10
4
0.10
4
0.10

APPENDIX D
STREAM SURVEY DATA Cross-section Plots
Longitudinal Profile P lots
Substrate Plots
Tables 10a-b. Baseline Stream Data Summary
Tables 11a-b. Monitoring Data
Chapel Creek (final) Axiom Environmental, Inc. Monitoring Year 5 of 5 (2013) EEP Project Number 77 January 2014 Orange County, North Carolina Appendices
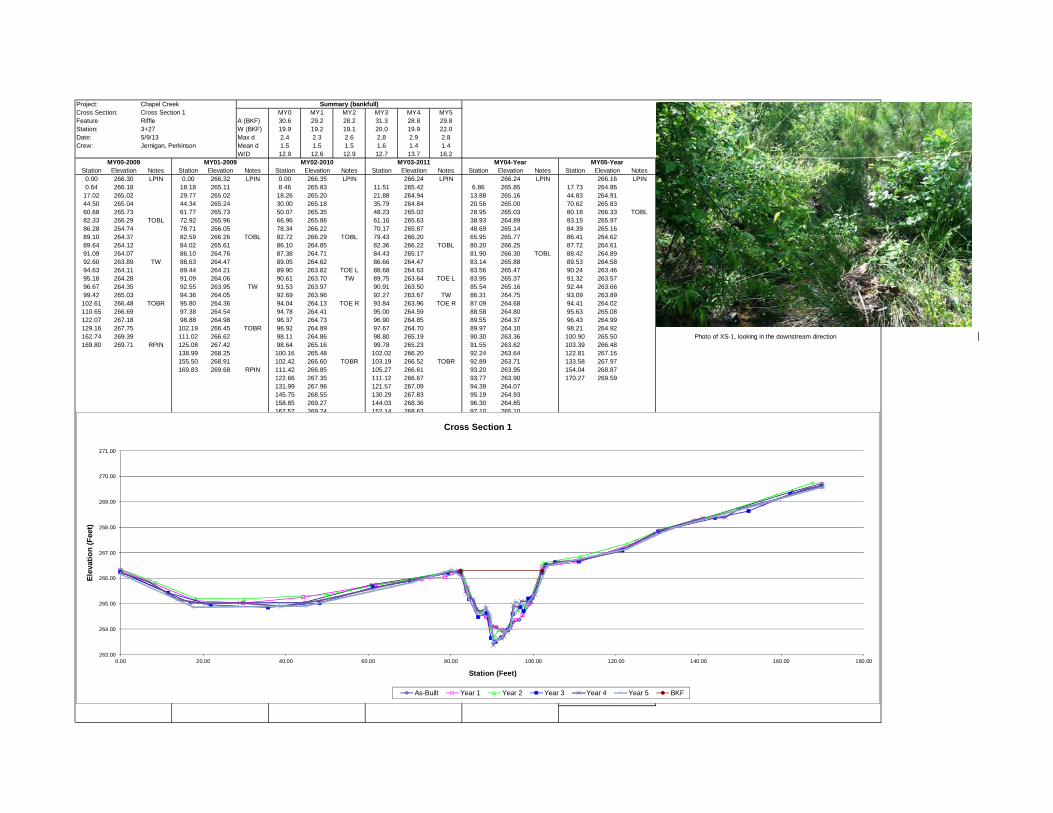
Project: Chapel CreekCross Section: Cross Section 1 MY0 MY1 MY2 MY3 MY4 MY5Feature Riffle A (BKF) 30.6 29.2 28.2 31.3 28.8 29.8Station: 3+27 W (BKF) 19.9 19.2 19.1 20.0 19.9 22.0Date: 5/9/13 Max d 2.4 2.3 2.6 2.8 2.9 2.8Crew: Jernigan, Perkinson Mean d 1.5 1.5 1.5 1.6 1.4 1.4
W/D 12.9 12.6 12.9 12.7 13.7 16.2
Station Elevation Notes Station Elevation Notes Station Elevation Notes Station Elevation Notes Station Elevation Notes Station Elevation Notes0.00 266.30 LPIN 0.00 266.32 LPIN 0.00 266.35 LPIN 266.24 LPIN 266.24 LPIN 266.16 LPIN0.64 266.18 18.18 265.11 8.46 265.83 11.51 265.42 6.86 265.85 17.73 264.86
17.02 265.02 29.77 265.02 18.26 265.20 21.88 264.94 13.88 265.16 44.83 264.9144.50 265.04 44.34 265.24 30.00 265.18 35.79 264.84 20.56 265.00 70.62 265.8360.68 265.73 61.77 265.73 50.07 265.35 48.23 265.02 28.95 265.03 80.18 266.33 TOBL82.33 266.29 TOBL 72.92 265.96 66.96 265.86 61.16 265.63 38.93 264.89 83.15 265.9786.28 264.74 78.71 266.05 78.34 266.22 70.17 265.87 48.69 265.14 84.39 265.1689.10 264.37 82.59 266.26 TOBL 82.72 266.29 TOBL 79.43 266.20 65.95 265.77 86.41 264.6289.64 264.12 84.02 265.61 86.10 264.85 82.36 266.22 TOBL 80.20 266.25 87.72 264.6191.09 264.07 86.10 264.76 87.38 264.71 84.43 265.17 81.90 266.30 TOBL 88.42 264.89 Bankfull Same92.60 263.89 TW 88.63 264.47 89.05 264.62 86.66 264.47 83.14 265.88 89.53 264.58 Station Elevation94.63 264.11 89.44 264.21 89.90 263.82 TOE L 88.68 264.63 83.56 265.47 90.24 263.46 82.33 266.2995.18 264.28 91.09 264.06 90.61 263.70 TW 89.75 263.64 TOE L 83.95 265.37 91.32 263.57 102.192 266.2996.67 264.35 92.55 263.95 TW 91.53 263.97 90.91 263.50 85.54 265.16 92.44 263.6699.42 265.03 94.36 264.05 92.69 263.96 92.27 263.67 TW 86.31 264.75 93.09 263.89102.61 266.48 TOBR 95.80 264.36 94.04 264.13 TOE R 93.84 263.96 TOE R 87.09 264.68 94.41 264.02110.65 266.69 97.38 264.54 94.78 264.41 95.00 264.59 88.58 264.80 95.63 265.08122.07 267.18 98.88 264.98 96.37 264.73 96.90 264.85 89.55 264.37 96.43 264.99129.16 267.75 102.19 266.45 TOBR 96.92 264.89 97.67 264.70 89.97 264.10 98.21 264.92162.74 269.39 111.02 266.62 98.11 264.86 98.80 265.19 90.30 263.36 100.90 265.50 Photo of XS-1, looking in the downstream direction 169.80 269.71 RPIN 125.08 267.42 98.64 265.16 99.78 265.23 91.55 263.62 103.39 266.48
138.99 268.25 100.16 265.48 102.02 266.20 92.24 263.64 122.81 267.16155.50 268.91 102.42 266.60 TOBR 103.19 266.52 TOBR 92.89 263.71 133.58 267.97169.83 269.68 RPIN 111.42 266.85 105.27 266.61 93.20 263.95 154.04 268.87
122.66 267.35 111.12 266.67 93.77 263.90 170.27 269.59131.99 267.96 121.57 267.09 94.39 264.07145.75 268.55 130.29 267.83 95.19 264.93158.85 269.27 144.03 268.36 96.30 264.85167.57 269.74 152.14 268.63 97.10 265.10169.70 269.72 RPIN 162.23 269.30 99.50 265.09
169.82 269.60 RPIN 100.41 265.35101.29 265.86102.01 266.30103.03 266.47 TOBR105.89 266.63111.46 266.72121.16 267.06130.74 267.88140.99 268.37146.50 268.37149.70 268.72159.39 269.12166.26 269.52170.00 269.61 RPIN
MY05-Year
Summary (bankfull)
MY03-2011MY00-2009 MY01-2009 MY02-2010 MY04-Year
263.00
264.00
265.00
266.00
267.00
268.00
269.00
270.00
271.00
0.00 20.00 40.00 60.00 80.00 100.00 120.00 140.00 160.00 180.00
Elev
atio
n (F
eet)
Station (Feet)
Cross Section 1
As-Built Year 1 Year 2 Year 3 Year 4 Year 5 BKF
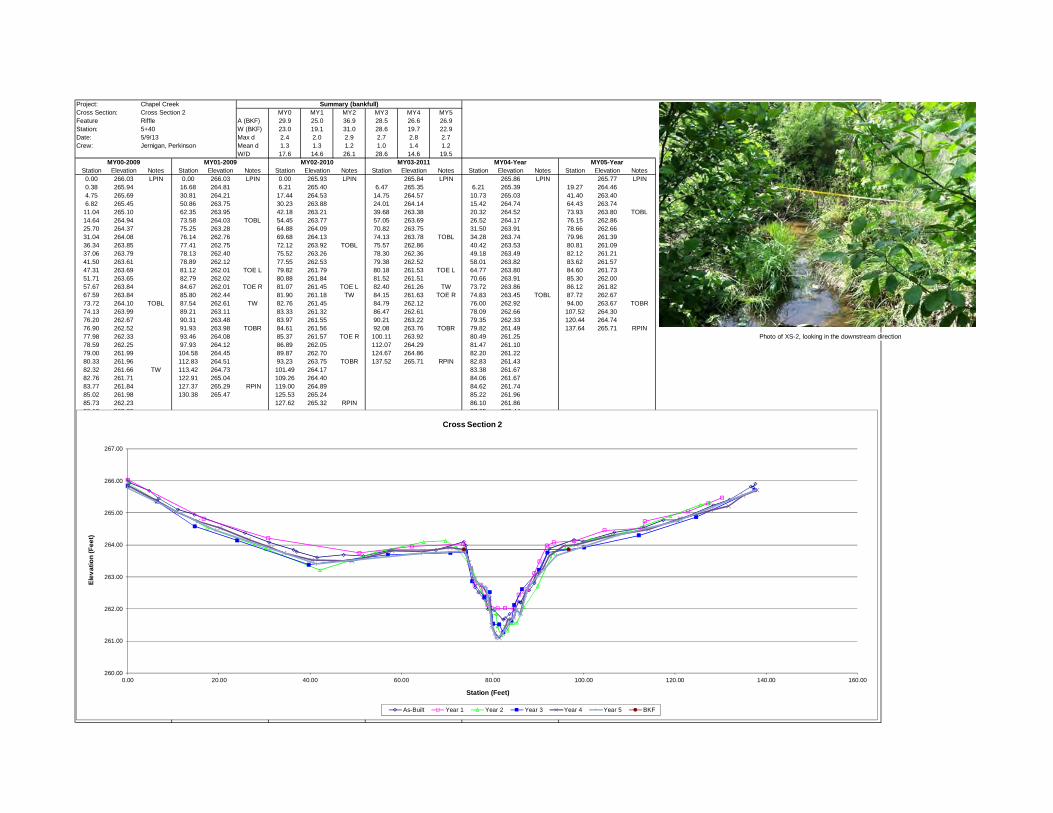
Project: Chapel CreekCross Section: Cross Section 2 MY0 MY1 MY2 MY3 MY4 MY5Feature Riffle A (BKF) 29.9 25.0 36.9 28.5 26.6 26.9Station: 5+40 W (BKF) 23.0 19.1 31.0 28.6 19.7 22.9Date: 5/9/13 Max d 2.4 2.0 2.9 2.7 2.8 2.7Crew: Jernigan, Perkinson Mean d 1.3 1.3 1.2 1.0 1.4 1.2
W/D 17.6 14.6 26.1 28.6 14.6 19.5
Station Elevation Notes Station Elevation Notes Station Elevation Notes Station Elevation Notes Station Elevation Notes Station Elevation Notes0.00 266.03 LPIN 0.00 266.03 LPIN 0.00 265.93 LPIN 265.84 LPIN 265.86 LPIN 265.77 LPIN0.38 265.94 16.68 264.81 6.21 265.40 6.47 265.35 6.21 265.39 19.27 264.464.75 265.69 30.81 264.21 17.44 264.53 14.75 264.57 10.73 265.03 41.40 263.406.82 265.45 50.86 263.75 30.23 263.88 24.01 264.14 15.42 264.74 64.43 263.74
11.04 265.10 62.35 263.95 42.18 263.21 39.68 263.38 20.32 264.52 73.93 263.80 TOBL14.64 264.94 73.58 264.03 TOBL 54.45 263.77 57.05 263.69 26.52 264.17 76.15 262.8625.70 264.37 75.25 263.28 64.88 264.09 70.82 263.75 31.50 263.91 78.66 262.6631.04 264.08 76.14 262.76 69.68 264.13 74.13 263.78 TOBL 34.28 263.74 79.96 261.3936.34 263.85 77.41 262.75 72.12 263.92 TOBL 75.57 262.86 40.42 263.53 80.81 261.0937.06 263.79 78.13 262.40 75.52 263.26 78.30 262.36 49.18 263.49 82.12 261.21 Bankfull Same41.50 263.61 78.89 262.12 77.55 262.53 79.38 262.52 58.01 263.82 83.62 261.57 Station Elevation47.31 263.69 81.12 262.01 TOE L 79.82 261.79 80.18 261.53 TOE L 64.77 263.80 84.60 261.73 73.72 263.8651.71 263.65 82.79 262.02 80.88 261.84 81.52 261.51 70.66 263.91 85.30 262.00 96.68111 263.8657.67 263.84 84.67 262.01 TOE R 81.07 261.45 TOE L 82.40 261.26 TW 73.72 263.86 86.12 261.8267.59 263.84 85.80 262.44 81.90 261.18 TW 84.15 261.63 TOE R 74.83 263.45 TOBL 87.72 262.6773.72 264.10 TOBL 87.54 262.61 TW 82.76 261.45 84.79 262.12 76.00 262.92 94.00 263.67 TOBR74.13 263.99 89.21 263.11 83.33 261.32 86.47 262.61 78.09 262.66 107.52 264.3076.20 262.67 90.31 263.48 83.97 261.55 90.21 263.22 79.35 262.33 120.44 264.7476.90 262.52 91.93 263.98 TOBR 84.61 261.56 92.08 263.76 TOBR 79.82 261.49 137.64 265.71 RPIN77.98 262.33 93.46 264.08 85.37 261.57 TOE R 100.11 263.92 80.49 261.2578.59 262.25 97.93 264.12 86.89 262.05 112.07 264.29 81.47 261.1079.00 261.99 104.58 264.45 89.87 262.70 124.67 264.86 82.20 261.2280.33 261.96 112.83 264.51 93.23 263.75 TOBR 137.52 265.71 RPIN 82.83 261.4382.32 261.66 TW 113.42 264.73 101.49 264.17 83.38 261.6782.76 261.71 122.91 265.04 109.26 264.40 84.06 261.6783.77 261.84 127.37 265.29 RPIN 119.00 264.89 84.62 261.7485.02 261.98 130.38 265.47 125.53 265.24 85.22 261.9685.73 262.23 127.62 265.32 RPIN 86.10 261.8686.10 262.20 87.05 262.4486.17 262.20 88.08 262.7387.25 262.49 88.84 262.8388.04 262.58 89.54 263.0889.18 262.81 91.13 263.2890.27 263.14 92.50 263.66 TOBR92.52 263.89 95.61 263.9697.87 264.16 TOBR 98.33 264.0199.91 264.11 105.74 264.28106.72 264.39 114.15 264.48113.11 264.53 121.21 264.83117.44 264.77 127.94 265.08120.77 264.77 131.77 265.21128.39 265.23 134.96 265.54131.96 265.41 137.98 265.71 RPIN136.68 265.82137.13 265.80137.60 265.91 RRPIN
MY05-Year
Summary (bankfull)
MY03-2011MY00-2009 MY01-2009 MY02-2010 MY04-Year
Photo of XS-2, looking in the downstream direction
260.00
261.00
262.00
263.00
264.00
265.00
266.00
267.00
0.00 20.00 40.00 60.00 80.00 100.00 120.00 140.00 160.00
Elev
atio
n (F
eet)
Station (Feet)
Cross Section 2
As-Built Year 1 Year 2 Year 3 Year 4 Year 5 BKF
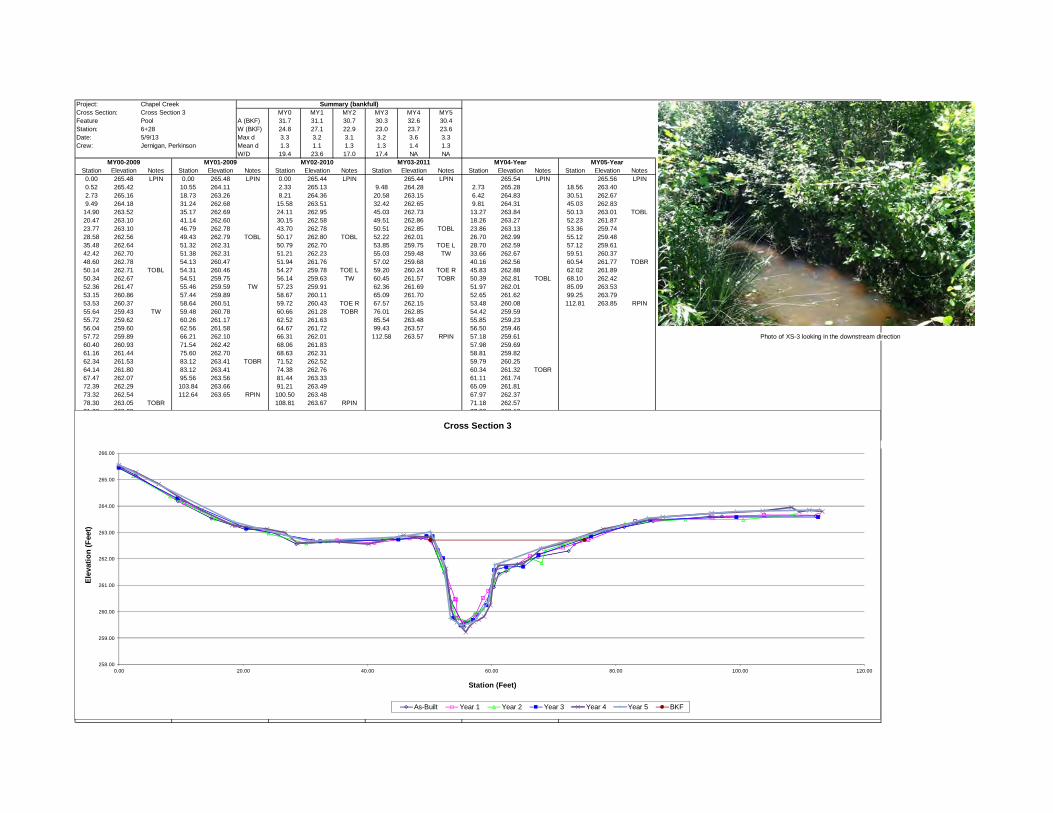
Project: Chapel CreekCross Section: Cross Section 3 MY0 MY1 MY2 MY3 MY4 MY5Feature Pool A (BKF) 31.7 31.1 30.7 30.3 32.6 30.4Station: 6+28 W (BKF) 24.8 27.1 22.9 23.0 23.7 23.6Date: 5/9/13 Max d 3.3 3.2 3.1 3.2 3.6 3.3Crew: Jernigan, Perkinson Mean d 1.3 1.1 1.3 1.3 1.4 1.3
W/D 19.4 23.6 17.0 17.4 NA NA
Station Elevation Notes Station Elevation Notes Station Elevation Notes Station Elevation Notes Station Elevation Notes Station Elevation Notes0.00 265.48 LPIN 0.00 265.48 LPIN 0.00 265.44 LPIN 265.44 LPIN 265.54 LPIN 265.56 LPIN0.52 265.42 10.55 264.11 2.33 265.13 9.48 264.28 2.73 265.28 18.56 263.402.73 265.16 18.73 263.26 8.21 264.36 20.58 263.15 6.42 264.83 30.51 262.679.49 264.18 31.24 262.68 15.58 263.51 32.42 262.65 9.81 264.31 45.03 262.83
14.90 263.52 35.17 262.69 24.11 262.95 45.03 262.73 13.27 263.84 50.13 263.01 TOBL20.47 263.10 41.14 262.60 30.15 262.58 49.51 262.86 18.26 263.27 52.23 261.8723.77 263.10 46.79 262.78 43.70 262.78 50.51 262.85 TOBL 23.86 263.13 53.36 259.7428.58 262.56 49.43 262.79 TOBL 50.17 262.80 TOBL 52.22 262.01 26.70 262.99 55.12 259.4835.48 262.64 51.32 262.31 50.79 262.70 53.85 259.75 TOE L 28.70 262.59 57.12 259.6142.42 262.70 51.38 262.31 51.21 262.23 55.03 259.48 TW 33.66 262.67 59.51 260.37 Bankfull Same48.60 262.78 54.13 260.47 51.94 261.76 57.02 259.68 40.16 262.56 60.54 261.77 TOBR Station Elevation50.14 262.71 TOBL 54.31 260.46 54.27 259.78 TOE L 59.20 260.24 TOE R 45.83 262.88 62.02 261.89 50.14 262.7150.34 262.67 54.51 259.75 56.14 259.63 TW 60.45 261.57 TOBR 50.39 262.81 TOBL 68.10 262.42 74.98 262.7152.36 261.47 55.46 259.59 TW 57.23 259.91 62.36 261.69 51.97 262.01 85.09 263.5353.15 260.86 57.44 259.89 58.67 260.11 65.09 261.70 52.65 261.62 99.25 263.7953.53 260.37 58.64 260.51 59.72 260.43 TOE R 67.57 262.15 53.48 260.08 112.81 263.85 RPIN55.64 259.43 TW 59.48 260.78 60.66 261.28 TOBR 76.01 262.85 54.42 259.5955.72 259.62 60.26 261.17 62.52 261.63 85.54 263.48 55.85 259.2356.04 259.60 62.56 261.58 64.67 261.72 99.43 263.57 56.50 259.4657.72 259.89 66.21 262.10 66.31 262.01 112.58 263.57 RPIN 57.18 259.6160.40 260.93 71.54 262.42 68.06 261.83 57.98 259.6961.16 261.44 75.60 262.70 68.63 262.31 58.81 259.8262.34 261.53 83.12 263.41 TOBR 71.52 262.52 59.79 260.2564.14 261.80 83.12 263.41 74.38 262.76 60.34 261.32 TOBR67.47 262.07 95.56 263.56 81.44 263.33 61.11 261.7472.39 262.29 103.84 263.66 91.21 263.49 65.09 261.8173.32 262.54 112.64 263.65 RPIN 100.50 263.48 67.97 262.3778.30 263.05 TOBR 108.81 263.67 RPIN 71.18 262.5781.32 263.20 77.93 263.1286.02 263.42 87.53 263.5895.12 263.60 95.43 263.7297.05 263.61 103.63 263.82112.14 263.62 RPIN 108.24 263.94
109.50 263.78111.15 263.84113.24 263.79 RPIN
MY05-Year
Photo of XS-3 looking in the downstream direction
Summary (bankfull)
MY03-2011MY00-2009 MY01-2009 MY02-2010 MY04-Year
258.00
259.00
260.00
261.00
262.00
263.00
264.00
265.00
266.00
0.00 20.00 40.00 60.00 80.00 100.00 120.00
Elev
atio
n (F
eet)
Station (Feet)
Cross Section 3
As-Built Year 1 Year 2 Year 3 Year 4 Year 5 BKF
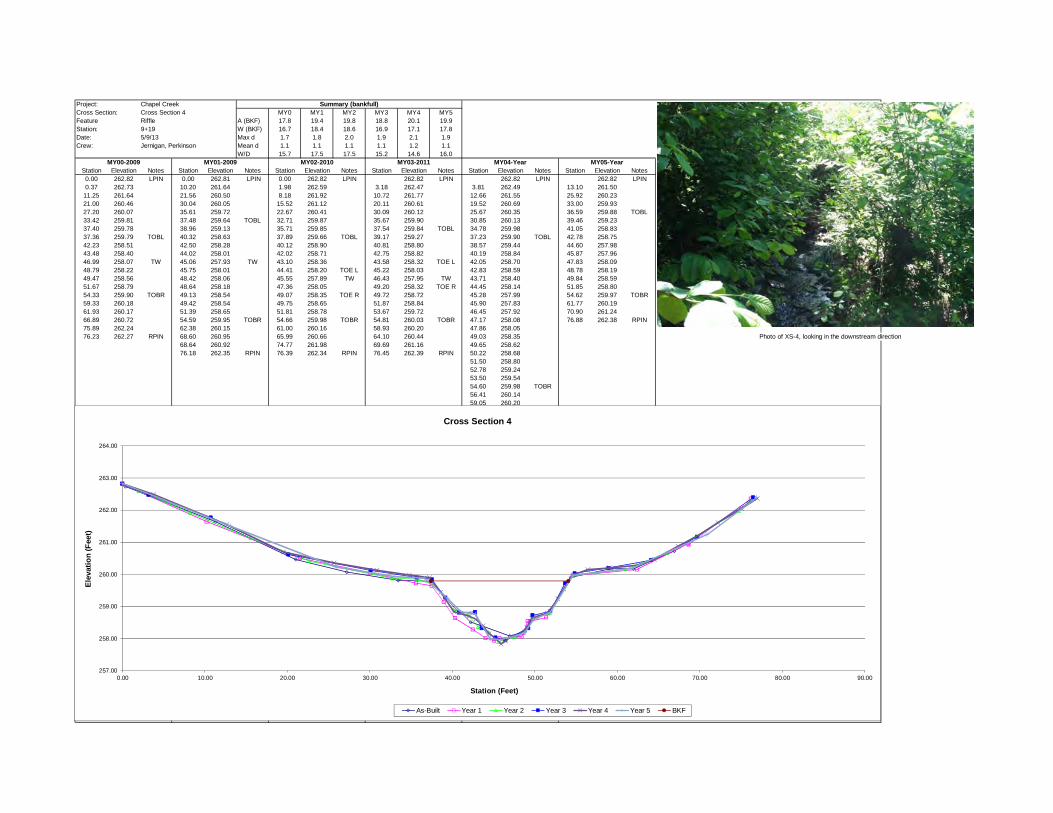
Project: Chapel CreekCross Section: Cross Section 4 MY0 MY1 MY2 MY3 MY4 MY5Feature Riffle A (BKF) 17.8 19.4 19.8 18.8 20.1 19.9Station: 9+19 W (BKF) 16.7 18.4 18.6 16.9 17.1 17.8Date: 5/9/13 Max d 1.7 1.8 2.0 1.9 2.1 1.9Crew: Jernigan, Perkinson Mean d 1.1 1.1 1.1 1.1 1.2 1.1
W/D 15.7 17.5 17.5 15.2 14.6 16.0
Station Elevation Notes Station Elevation Notes Station Elevation Notes Station Elevation Notes Station Elevation Notes Station Elevation Notes0.00 262.82 LPIN 0.00 262.81 LPIN 0.00 262.82 LPIN 262.82 LPIN 262.82 LPIN 262.82 LPIN0.37 262.73 10.20 261.64 1.98 262.59 3.18 262.47 3.81 262.49 13.10 261.50
11.25 261.64 21.56 260.50 8.18 261.92 10.72 261.77 12.66 261.55 25.92 260.2321.00 260.46 30.04 260.05 15.52 261.12 20.11 260.61 19.52 260.69 33.00 259.9327.20 260.07 35.61 259.72 22.67 260.41 30.09 260.12 25.67 260.35 36.59 259.88 TOBL33.42 259.81 37.48 259.64 TOBL 32.71 259.87 35.67 259.90 30.85 260.13 39.46 259.2337.40 259.78 38.96 259.13 35.71 259.85 37.54 259.84 TOBL 34.78 259.98 41.05 258.8337.36 259.79 TOBL 40.32 258.63 37.89 259.66 TOBL 39.17 259.27 37.23 259.90 TOBL 42.78 258.7542.23 258.51 42.50 258.28 40.12 258.90 40.81 258.80 38.57 259.44 44.60 257.9843.48 258.40 44.02 258.01 42.02 258.71 42.75 258.82 40.19 258.84 45.87 257.96 Bankfull Same46.99 258.07 TW 45.06 257.93 TW 43.10 258.36 43.58 258.32 TOE L 42.05 258.70 47.83 258.09 Station Elevation48.79 258.22 45.75 258.01 44.41 258.20 TOE L 45.22 258.03 42.83 258.59 48.78 258.19 37.36 259.7949.47 258.56 48.42 258.06 45.55 257.89 TW 46.43 257.95 TW 43.71 258.40 49.84 258.59 54.0664 259.7951.67 258.79 48.64 258.18 47.36 258.05 49.20 258.32 TOE R 44.45 258.14 51.85 258.8054.33 259.90 TOBR 49.13 258.54 49.07 258.35 TOE R 49.72 258.72 45.28 257.99 54.62 259.97 TOBR59.33 260.18 49.42 258.54 49.75 258.65 51.87 258.84 45.90 257.83 61.77 260.1961.93 260.17 51.39 258.65 51.81 258.78 53.67 259.72 46.45 257.92 70.90 261.2466.89 260.72 54.59 259.95 TOBR 54.66 259.98 TOBR 54.81 260.03 TOBR 47.17 258.08 76.88 262.38 RPIN75.89 262.24 62.38 260.15 61.00 260.16 58.93 260.20 47.86 258.0576.23 262.27 RPIN 68.60 260.95 65.99 260.66 64.10 260.44 49.03 258.35
68.64 260.92 74.77 261.98 69.69 261.16 49.65 258.6276.18 262.35 RPIN 76.39 262.34 RPIN 76.45 262.39 RPIN 50.22 258.68
51.50 258.8052.78 259.2453.50 259.5454.60 259.98 TOBR56.41 260.1459.05 260.2062.51 260.2964.51 260.4667.35 260.8769.71 261.1972.21 261.6175.05 262.0476.95 262.37 RPIN
MY05-Year
Photo of XS-4, looking in the downstream direction
Summary (bankfull)
MY03-2011MY00-2009 MY01-2009 MY02-2010 MY04-Year
257.00
258.00
259.00
260.00
261.00
262.00
263.00
264.00
0.00 10.00 20.00 30.00 40.00 50.00 60.00 70.00 80.00 90.00
Elev
atio
n (F
eet)
Station (Feet)
Cross Section 4
As-Built Year 1 Year 2 Year 3 Year 4 Year 5 BKF

Project: Chapel CreekCross Section: Cross Section 5 MY0 MY1 MY2 MY3 MY4 MY5Feature Riffle A (BKF) 28.9 29.8 32.5 26.7 30.1 28.7Station: 11+23 W (BKF) 15.4 16.3 17.5 15.9 15.5 15.4Date: 5/9/13 Max d 2.9 2.7 2.8 2.4 2.9 2.9Crew: Jernigan, Perkinson Mean d 1.9 1.8 1.9 1.7 1.9 1.9
W/D 8.2 8.9 9.4 9.5 8.0 8.3
Station Elevation Notes Station Elevation Notes Station Elevation Notes Station Elevation Notes Station Elevation Notes Station Elevation Notes0.00 263.84 11.46 263.25 LPIN 11.46 263.25 LPIN 11.46 263.25 LPIN 11.46 263.25 LPIN 11.46 263.40 LPIN
11.46 263.25 LPIN 18.59 261.67 12.53 263.10 13.11 262.95 16.28 262.40 17.67 262.1811.90 263.17 25.70 260.34 14.95 262.59 19.34 261.62 19.17 261.68 24.27 260.7314.29 262.76 32.76 259.76 18.94 261.67 24.03 260.51 21.94 261.05 32.23 260.0917.16 262.06 34.95 259.71 23.47 260.70 31.75 259.92 27.14 260.33 38.35 259.52 TOBL21.29 261.07 37.85 259.29 TOBL 27.38 260.23 35.60 259.59 33.77 259.91 40.05 258.4024.94 260.40 40.42 258.00 34.37 259.81 38.25 259.28 TOBL 38.27 259.38 TOBL 40.82 258.3429.43 260.09 41.37 257.54 TOE L 35.96 259.62 38.92 258.82 39.29 258.82 42.50 257.6138.04 259.37 TOBL 43.11 257.21 37.58 259.36 TOBL 41.10 257.48 40.44 258.10 44.26 257.3140.27 258.13 45.35 256.92 39.74 258.56 42.69 257.25 41.83 257.57 46.60 256.91 Bankfull Same41.78 257.51 47.47 256.79 41.08 257.57 TOE L 43.82 257.13 TOE L 42.75 257.39 49.25 256.90 Station Elevation43.14 257.19 49.40 256.63 TW 42.09 257.44 46.77 256.94 TW 43.60 257.20 51.86 256.44 38.04 259.3743.92 257.16 50.91 256.66 TOE R 43.92 257.00 46.78 256.99 TOE R 44.36 257.08 52.70 258.17 53.39077 259.3746.07 256.88 56.60 261.24 TOBR 44.99 256.86 TW 51.17 257.48 46.31 256.79 54.84 260.1547.81 256.84 59.41 261.60 RPIN 46.54 257.13 51.72 258.30 47.54 256.93 56.54 261.33 TOBR49.84 256.71 49.00 256.87 55.08 260.43 49.03 256.79 60.30 261.61 RPIN50.92 256.50 TW 51.45 256.91 TOE R 56.21 261.11 TOBR 50.93 256.5651.32 256.53 52.45 258.77 59.19 261.36 51.42 256.4551.55 256.86 55.08 260.93 TOBR 59.43 261.69 RPIN 52.64 258.0751.59 257.39 57.25 261.28 53.34 259.0251.85 257.89 59.53 261.62 RPIN 54.51 260.0252.29 258.83 55.65 260.87 TOBR53.88 259.61 57.42 261.4055.53 260.82 58.77 261.6357.29 261.32 TOBR 59.92 261.44 RPIN59.48 261.63 RPIN70.78 263.00
MY05-Year
Photo of XS-5, looking in the downstream direction
Summary (bankfull)
MY03-2011MY00-2009 MY01-2009 MY02-2010 MY04-Year
256.00
257.00
258.00
259.00
260.00
261.00
262.00
263.00
264.00
265.00
0.00 10.00 20.00 30.00 40.00 50.00 60.00 70.00 80.00
Elev
atio
n (F
eet)
Station (Feet)
Cross Section 5
As-Built Year 1 Year 2 Year 3 Year 4 Year 5 BKF
251
252
253
254
255
256
257
258
259
260
261
262
263
264
265
266
267
268
269
270
271
272
273
+ 1+00 2+00 3+00 4+00 5+00 6+00 7+00 8+00 9+00 10+00 11+00 12+00 13+00 14+00
Elev
atio
n (fe
et)
Station (feet)
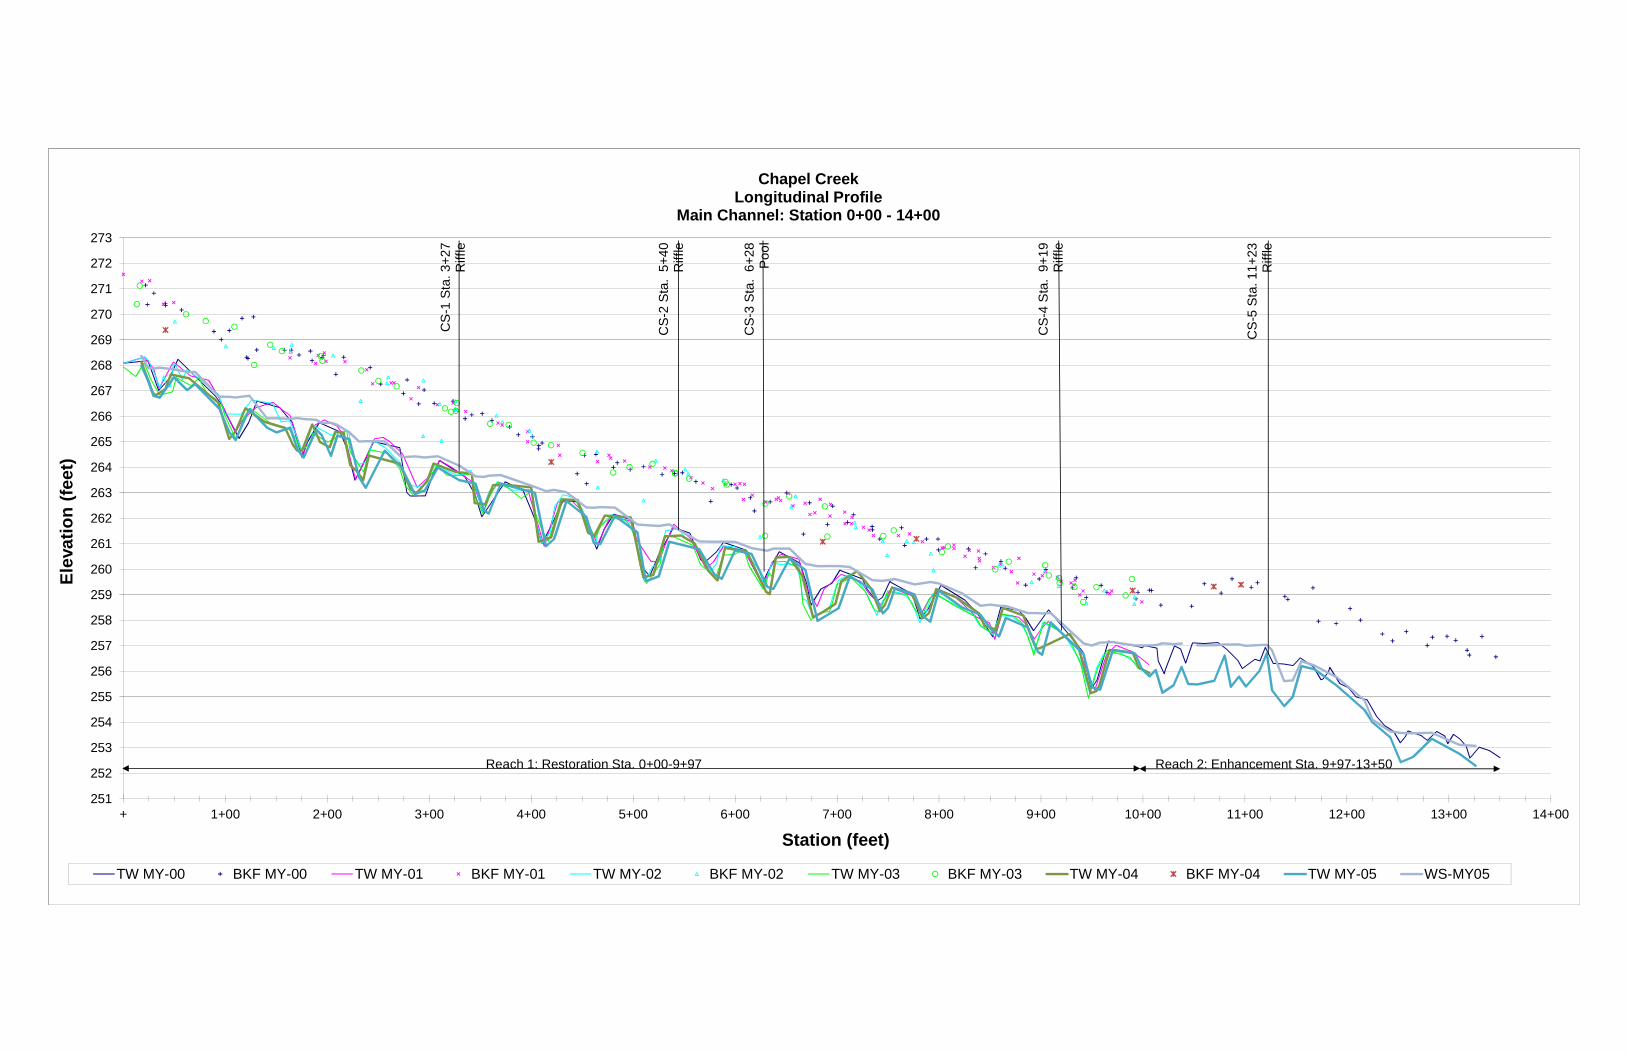
Chapel CreekLongitudinal Profile
Main Channel: Station 0+00 - 14+00
TW MY-00 BKF MY-00 TW MY-01 BKF MY-01 TW MY-02 BKF MY-02 TW MY-03 BKF MY-03 TW MY-04 BKF MY-04 TW MY-05 WS-MY05
CS-
1 St
a. 3
+27
Riff
le
CS-
2 St
a. 5
+40
Riff
le
CS-
3 St
a. 6
+28
Pool
CS-
4 St
a. 9
+19
Riff
le
CS-
5 St
a. 1
1+23
Riff
le
Reach 1: Restoration Sta. 0+00-9+97 Reach 2: Enhancement Sta. 9+97-13+50
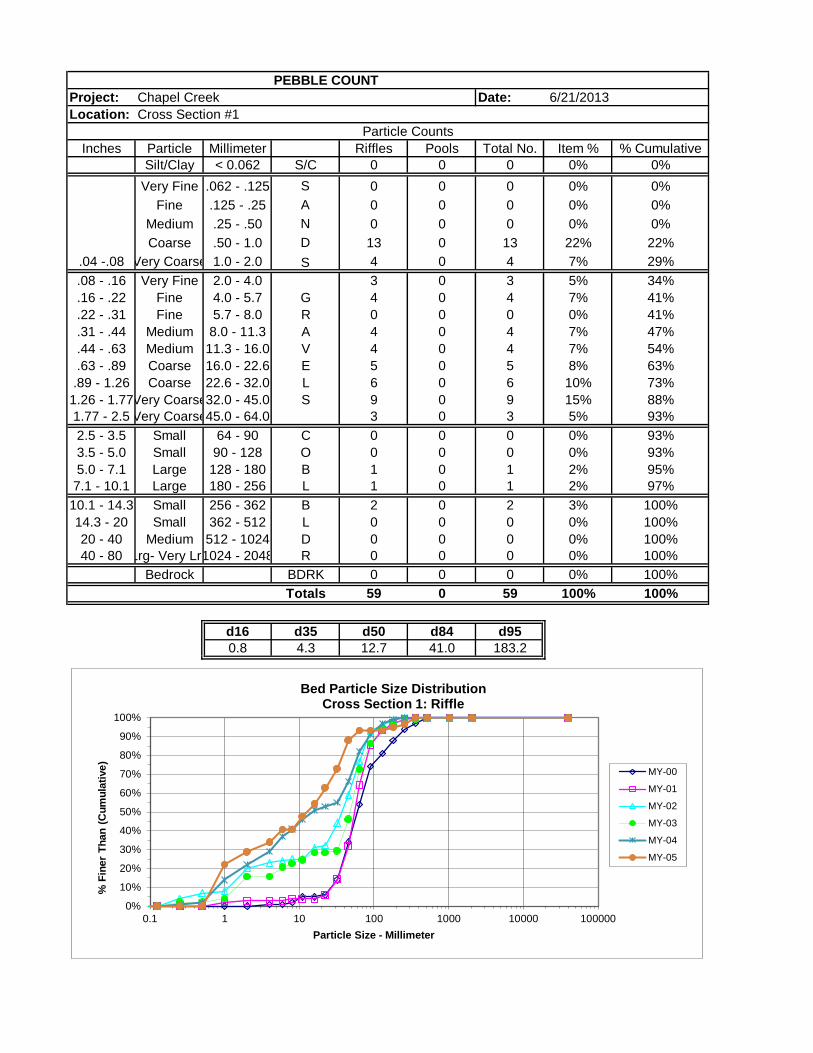
PEBBLE COUNTProject: Chapel Creek Date: 6/21/2013Location: Cross Section #1
Particle CountsInches Particle Millimeter Riffles Pools Total No. Item % % Cumulative
Silt/Clay < 0.062 S/C 0 0 0 0% 0%Very Fine .062 - .125 S 0 0 0 0% 0%
Fine .125 - .25 A 0 0 0 0% 0%Medium .25 - .50 N 0 0 0 0% 0%Coarse .50 - 1.0 D 13 0 13 22% 22%
.04 -.08 Very Coarse 1.0 - 2.0 S 4 0 4 7% 29%.08 - .16 Very Fine 2.0 - 4.0 3 0 3 5% 34%.16 - .22 Fine 4.0 - 5.7 G 4 0 4 7% 41%.22 - .31 Fine 5.7 - 8.0 R 0 0 0 0% 41%.31 - .44 Medium 8.0 - 11.3 A 4 0 4 7% 47%.44 - .63 Medium 11.3 - 16.0 V 4 0 4 7% 54%.63 - .89 Coarse 16.0 - 22.6 E 5 0 5 8% 63%
.89 - 1.26 Coarse 22.6 - 32.0 L 6 0 6 10% 73%1.26 - 1.77Very Coarse32.0 - 45.0 S 9 0 9 15% 88%1.77 - 2.5 Very Coarse45.0 - 64.0 3 0 3 5% 93%2.5 - 3.5 Small 64 - 90 C 0 0 0 0% 93%3.5 - 5.0 Small 90 - 128 O 0 0 0 0% 93%5.0 - 7.1 Large 128 - 180 B 1 0 1 2% 95%
7.1 - 10.1 Large 180 - 256 L 1 0 1 2% 97%10.1 - 14.3 Small 256 - 362 B 2 0 2 3% 100%14.3 - 20 Small 362 - 512 L 0 0 0 0% 100%20 - 40 Medium 512 - 1024 D 0 0 0 0% 100%40 - 80 Lrg- Very Lrg1024 - 2048 R 0 0 0 0% 100%
Bedrock BDRK 0 0 0 0% 100%Totals 59 0 59 100% 100%
d16 d35 d50 d84 d950.8 4.3 12.7 41.0 183.2
0%
10%
20%
30%
40%
50%
60%
70%
80%
90%
100%
0.1 1 10 100 1000 10000 100000
% F
iner
Tha
n (C
umul
ativ
e)
Particle Size - Millimeter
Bed Particle Size DistributionCross Section 1: Riffle
MY-00
MY-01
MY-02
MY-03
MY-04
MY-05

PEBBLE COUNTProject: Chapel Creek Date: 6/21/2013Location: Cross Section #2
Particle CountsInches Particle Millimeter Riffles Pools Total No. Item % % Cumulative
Silt/Clay < 0.062 S/C 4 0 4 8% 8%Very Fine .062 - .125 S 0 0 0 0% 8%
Fine .125 - .25 A 0 0 0 0% 8%Medium .25 - .50 N 2 0 2 4% 12%Coarse .50 - 1.0 D 2 0 2 4% 15%
.04 -.08 Very Coarse 1.0 - 2.0 S 4 0 4 8% 23%.08 - .16 Very Fine 2.0 - 4.0 0 0 0 0% 23%.16 - .22 Fine 4.0 - 5.7 G 1 0 1 2% 25%.22 - .31 Fine 5.7 - 8.0 R 0 0 0 0% 25%.31 - .44 Medium 8.0 - 11.3 A 0 0 0 0% 25%.44 - .63 Medium 11.3 - 16.0 V 8 0 8 15% 40%.63 - .89 Coarse 16.0 - 22.6 E 4 0 4 8% 48%
.89 - 1.26 Coarse 22.6 - 32.0 L 6 0 6 12% 60%1.26 - 1.77Very Coarse32.0 - 45.0 S 4 0 4 8% 67%1.77 - 2.5 Very Coarse45.0 - 64.0 3 0 3 6% 73%2.5 - 3.5 Small 64 - 90 C 4 0 4 8% 81%3.5 - 5.0 Small 90 - 128 O 7 0 7 13% 94%5.0 - 7.1 Large 128 - 180 B 0 0 0 0% 94%
7.1 - 10.1 Large 180 - 256 L 0 0 0 0% 94%10.1 - 14.3 Small 256 - 362 B 3 0 3 6% 100%14.3 - 20 Small 362 - 512 L 0 0 0 0% 100%20 - 40 Medium 512 - 1024 D 0 0 0 0% 100%40 - 80 Lrg- Very Lrg1024 - 2048 R 0 0 0 0% 100%
Bedrock BDRK 0 0 0 0% 100%Totals 52 0 52 100% 100%
d16 d35 d50 d84 d951.1 14.0 23.4 97.9 268.1
0%
10%
20%
30%
40%
50%
60%
70%
80%
90%
100%
0.1 1 10 100 1000 10000 100000
% F
iner
Tha
n (C
umul
ativ
e)
Particle Size - Millimeter
Bed Particle Size DistributionCross Section 2: Riffle
MY-00
MY-01
MY-02
MY-03
MY-04
MY-05

PEBBLE COUNTProject: Chapel Creek Date: 6/21/2013Location: Cross Section #4
Particle CountsInches Particle Millimeter Riffles Pools Total No. Item % % Cumulative
Silt/Clay < 0.062 S/C 0 0 0 0% 0%Very Fine .062 - .125 S 0 0 0 0% 0%
Fine .125 - .25 A 3 0 3 5% 5%Medium .25 - .50 N 0 0 0 0% 5%Coarse .50 - 1.0 D 1 0 1 2% 7%
.04 -.08 Very Coarse 1.0 - 2.0 S 0 0 0 0% 7%.08 - .16 Very Fine 2.0 - 4.0 10 0 10 18% 25%.16 - .22 Fine 4.0 - 5.7 G 2 0 2 4% 28%.22 - .31 Fine 5.7 - 8.0 R 0 0 0 0% 28%.31 - .44 Medium 8.0 - 11.3 A 1 0 1 2% 30%.44 - .63 Medium 11.3 - 16.0 V 1 0 1 2% 32%.63 - .89 Coarse 16.0 - 22.6 E 0 0 0 0% 32%
.89 - 1.26 Coarse 22.6 - 32.0 L 1 0 1 2% 33%1.26 - 1.77Very Coarse32.0 - 45.0 S 8 0 8 14% 47%1.77 - 2.5 Very Coarse45.0 - 64.0 22 0 22 39% 86%2.5 - 3.5 Small 64 - 90 C 4 0 4 7% 93%3.5 - 5.0 Small 90 - 128 O 0 0 0 0% 93%5.0 - 7.1 Large 128 - 180 B 0 0 0 0% 93%
7.1 - 10.1 Large 180 - 256 L 0 0 0 0% 93%10.1 - 14.3 Small 256 - 362 B 2 0 2 4% 96%14.3 - 20 Small 362 - 512 L 2 0 2 4% 100%20 - 40 Medium 512 - 1024 D 0 0 0 0% 100%40 - 80 Lrg- Very Lrg1024 - 2048 R 0 0 0 0% 100%
Bedrock BDRK 0 0 0 0% 100%Totals 57 0 57 100% 100%
d16 d35 d50 d84 d952.9 32.4 45.7 62.7 309.7
0%
10%
20%
30%
40%
50%
60%
70%
80%
90%
100%
0.1 1 10 100 1000 10000 100000
% F
iner
Tha
n (C
umul
ativ
e)
Particle Size - Millimeter
Bed Particle Size DistributionCross Section 4: Riffle
MY-00
MY-01
MY-02
MY-03
MY-04
MY-05
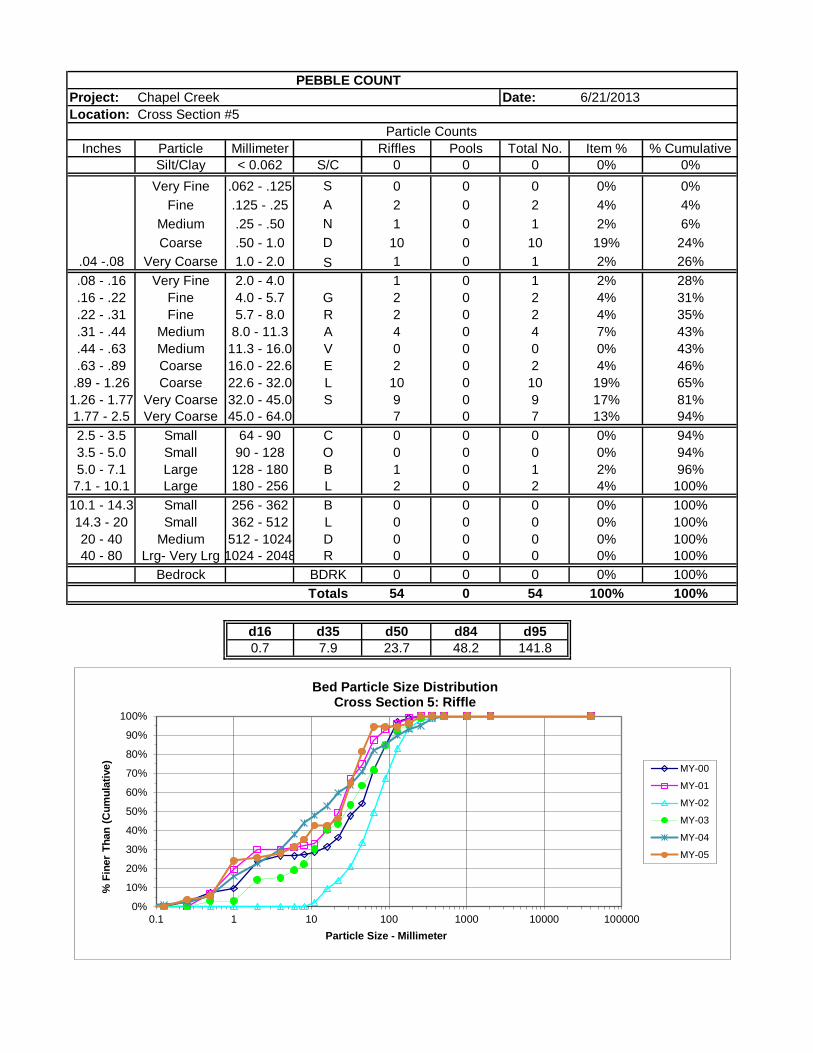
PEBBLE COUNTProject: Chapel Creek Date: 6/21/2013Location: Cross Section #5
Particle CountsInches Particle Millimeter Riffles Pools Total No. Item % % Cumulative
Silt/Clay < 0.062 S/C 0 0 0 0% 0%Very Fine .062 - .125 S 0 0 0 0% 0%
Fine .125 - .25 A 2 0 2 4% 4%Medium .25 - .50 N 1 0 1 2% 6%Coarse .50 - 1.0 D 10 0 10 19% 24%
.04 -.08 Very Coarse 1.0 - 2.0 S 1 0 1 2% 26%.08 - .16 Very Fine 2.0 - 4.0 1 0 1 2% 28%.16 - .22 Fine 4.0 - 5.7 G 2 0 2 4% 31%.22 - .31 Fine 5.7 - 8.0 R 2 0 2 4% 35%.31 - .44 Medium 8.0 - 11.3 A 4 0 4 7% 43%.44 - .63 Medium 11.3 - 16.0 V 0 0 0 0% 43%.63 - .89 Coarse 16.0 - 22.6 E 2 0 2 4% 46%
.89 - 1.26 Coarse 22.6 - 32.0 L 10 0 10 19% 65%1.26 - 1.77 Very Coarse 32.0 - 45.0 S 9 0 9 17% 81%1.77 - 2.5 Very Coarse 45.0 - 64.0 7 0 7 13% 94%2.5 - 3.5 Small 64 - 90 C 0 0 0 0% 94%3.5 - 5.0 Small 90 - 128 O 0 0 0 0% 94%5.0 - 7.1 Large 128 - 180 B 1 0 1 2% 96%
7.1 - 10.1 Large 180 - 256 L 2 0 2 4% 100%10.1 - 14.3 Small 256 - 362 B 0 0 0 0% 100%14.3 - 20 Small 362 - 512 L 0 0 0 0% 100%20 - 40 Medium 512 - 1024 D 0 0 0 0% 100%40 - 80 Lrg- Very Lrg 1024 - 2048 R 0 0 0 0% 100%
Bedrock BDRK 0 0 0 0% 100%Totals 54 0 54 100% 100%
d16 d35 d50 d84 d950.7 7.9 23.7 48.2 141.8
0%
10%
20%
30%
40%
50%
60%
70%
80%
90%
100%
0.1 1 10 100 1000 10000 100000
% F
iner
Tha
n (C
umul
ativ
e)
Particle Size - Millimeter
Bed Particle Size DistributionCross Section 5: Riffle
MY-00
MY-01
MY-02
MY-03
MY-04
MY-05
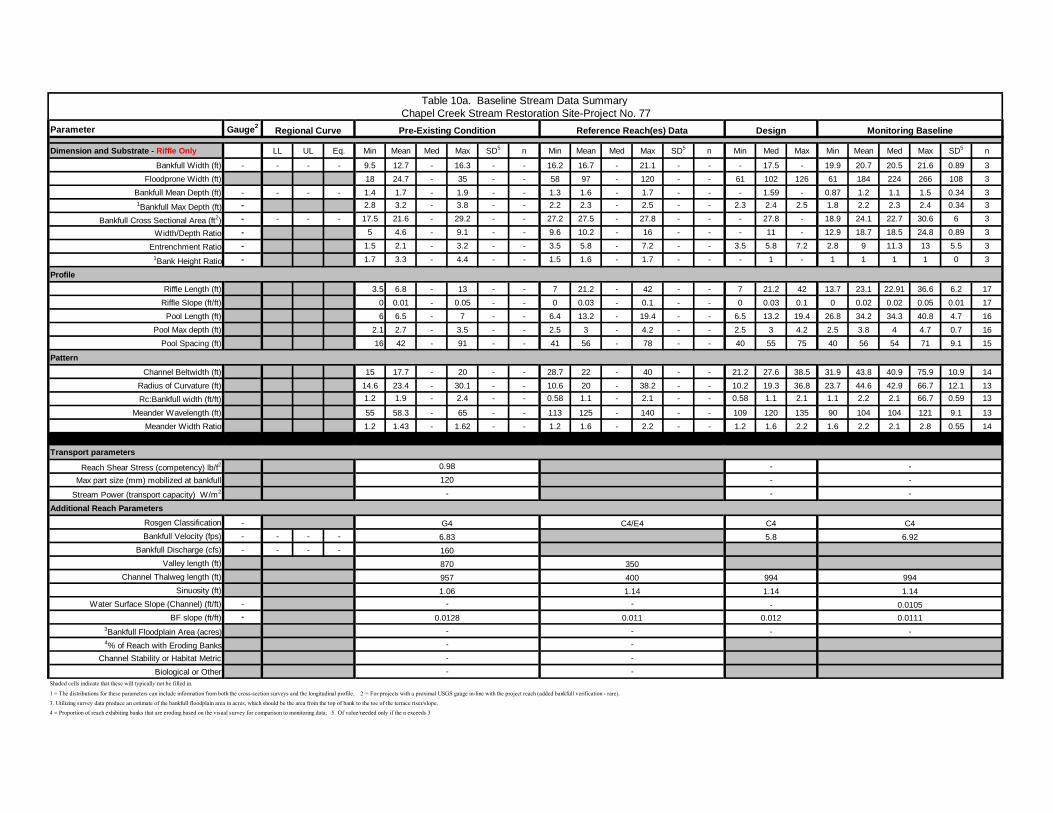
Parameter Gauge2
Dimension and Substrate - Riffle Only LL UL Eq. Min Mean Med Max SD5 n Min Mean Med Max SD5 n Min Med Max Min Mean Med Max SD5 n
Bankfull Width (ft) - - - - 9.5 12.7 - 16.3 - - 16.2 16.7 - 21.1 - - - 17.5 - 19.9 20.7 20.5 21.6 0.89 3Floodprone Width (ft) 18 24.7 - 35 - - 58 97 - 120 - - 61 102 126 61 184 224 266 108 3
Bankfull Mean Depth (ft) - - - - 1.4 1.7 - 1.9 - - 1.3 1.6 - 1.7 - - - 1.59 - 0.87 1.2 1.1 1.5 0.34 31Bankfull Max Depth (ft) - 2.8 3.2 - 3.8 - - 2.2 2.3 - 2.5 - - 2.3 2.4 2.5 1.8 2.2 2.3 2.4 0.34 3
Bankfull Cross Sectional Area (ft2) - - - - 17.5 21.6 - 29.2 - - 27.2 27.5 - 27.8 - - - 27.8 - 18.9 24.1 22.7 30.6 6 3
Width/Depth Ratio - 5 4.6 - 9.1 - - 9.6 10.2 - 16 - - - 11 - 12.9 18.7 18.5 24.8 0.89 3
Entrenchment Ratio - 1.5 2.1 - 3.2 - - 3.5 5.8 - 7.2 - - 3.5 5.8 7.2 2.8 9 11.3 13 5.5 31Bank Height Ratio - 1.7 3.3 - 4.4 - - 1.5 1.6 - 1.7 - - - 1 - 1 1 1 1 0 3
ProfileRiffle Length (ft) 3.5 6.8 - 13 - - 7 21.2 - 42 - - 7 21.2 42 13.7 23.1 22.91 36.6 6.2 17
Riffle Slope (ft/ft) 0 0.01 - 0.05 - - 0 0.03 - 0.1 - - 0 0.03 0.1 0 0.02 0.02 0.05 0.01 17Pool Length (ft) 6 6.5 - 7 - - 6.4 13.2 - 19.4 - - 6.5 13.2 19.4 26.8 34.2 34.3 40.8 4.7 16
Pool Max depth (ft) 2.1 2.7 - 3.5 - - 2.5 3 - 4.2 - - 2.5 3 4.2 2.5 3.8 4 4.7 0.7 16Pool Spacing (ft) 16 42 - 91 - - 41 56 - 78 - - 40 55 75 40 56 54 71 9.1 15
PatternChannel Beltwidth (ft) 15 17.7 - 20 - - 28.7 22 - 40 - - 21.2 27.6 38.5 31.9 43.8 40.9 75.9 10.9 14
Radius of Curvature (ft) 14.6 23.4 - 30.1 - - 10.6 20 - 38.2 - - 10.2 19.3 36.8 23.7 44.6 42.9 66.7 12.1 13Rc:Bankfull width (ft/ft) 1.2 1.9 - 2.4 - - 0.58 1.1 - 2.1 - - 0.58 1.1 2.1 1.1 2.2 2.1 66.7 0.59 13
Meander Wavelength (ft) 55 58.3 - 65 - - 113 125 - 140 - - 109 120 135 90 104 104 121 9.1 13Meander Width Ratio 1.2 1.43 - 1.62 - - 1.2 1.6 - 2.2 - - 1.2 1.6 2.2 1.6 2.2 2.1 2.8 0.55 14
Transport parameters
Reach Shear Stress (competency) lb/f2
Max part size (mm) mobilized at bankfull
Stream Power (transport capacity) W/m2
Additional Reach ParametersRosgen Classification -Bankfull Velocity (fps) - - - -
Bankfull Discharge (cfs) - - - -Valley length (ft)
Channel Thalweg length (ft)Sinuosity (ft)
Water Surface Slope (Channel) (ft/ft) -BF slope (ft/ft) -
3Bankfull Floodplain Area (acres)4% of Reach with Eroding Banks
Channel Stability or Habitat MetricBiological or Other
Shaded cells indicate that these will typically not be filled in.
1 = The distributions for these parameters can include information from both the cross-section surveys and the longitudinal profile. 2 = For projects with a proximal USGS gauge in-line with the project reach (added bankfull verification - rare). 3. Utilizing survey data produce an estimate of the bankfull floodplain area in acres, which should be the area from the top of bank to the toe of the terrace riser/slope. 4 = Proportion of reach exhibiting banks that are eroding based on the visual survey for comparison to monitoring data; 5. Of value/needed only if the n exceeds 3
- -
- -- -
0.0128 0.011 0.012 0.0111- - - -
1.06 1.14 1.14 1.14- - - 0.0105
870 350957 400 994 994
6.83 5.8 6.92160
G4 C4/E4 C4 C4
120 - -- - -
0.98 - -
Table 10a. Baseline Stream Data Summary Chapel Creek Stream Restoration Site-Project No. 77
Regional Curve Pre-Existing Condition Reference Reach(es) Data Design Monitoring Baseline
Parameter
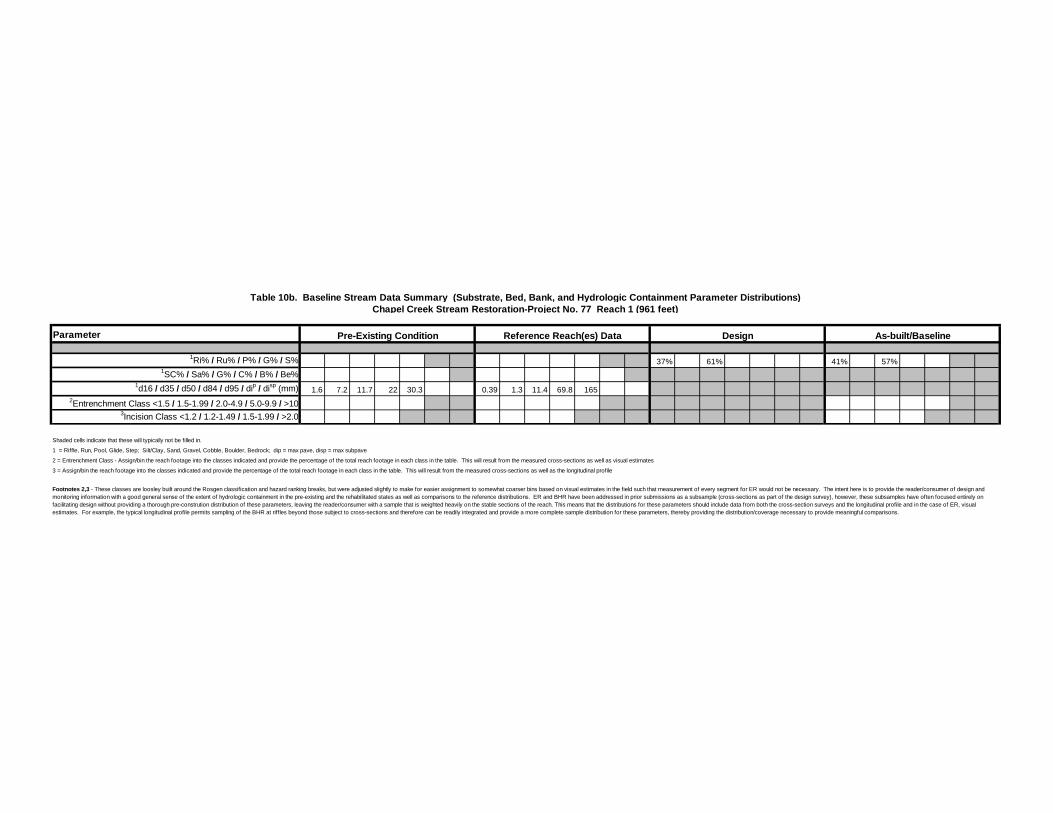
1Ri% / Ru% / P% / G% / S% 37% 61% 41% 57%1SC% / Sa% / G% / C% / B% / Be%
1d16 / d35 / d50 / d84 / d95 / dip / disp (mm) 1.6 7.2 11.7 22 30.3 0.39 1.3 11.4 69.8 1652Entrenchment Class <1.5 / 1.5-1.99 / 2.0-4.9 / 5.0-9.9 / >10
3Incision Class <1.2 / 1.2-1.49 / 1.5-1.99 / >2.0
Shaded cells indicate that these will typically not be filled in.
1 = Riffle, Run, Pool, Glide, Step; Silt/Clay, Sand, Gravel, Cobble, Boulder, Bedrock; dip = max pave, disp = max subpave
2 = Entrenchment Class - Assign/bin the reach footage into the classes indicated and provide the percentage of the total reach footage in each class in the table. This will result from the measured cross-sections as well as visual estimates
3 = Assign/bin the reach footage into the classes indicated and provide the percentage of the total reach footage in each class in the table. This will result from the measured cross-sections as well as the longitudinal profile
Footnotes 2,3 - These classes are loosley built around the Rosgen classification and hazard ranking breaks, but were adjusted slightly to make for easier assignment to somewhat coarser bins based on visual estimates in the field such that measurement of every segment for ER would not be necessary. The intent here is to provide the reader/consumer of design and monitoring information with a good general sense of the extent of hydrologic containment in the pre-existing and the rehabilitated states as well as comparisons to the reference distributions. ER and BHR have been addressed in prior submissions as a subsample (cross-sections as part of the design survey), however, these subsamples have often focused entirely on facilitating design without providing a thorough pre-constrution distribution of these parameters, leaving the reader/consumer with a sample that is weighted heavily on the stable sections of the reach. This means that the distributions for these parameters should include data from both the cross-section surveys and the longitudinal profile and in the case of ER, visual estimates. For example, the typical longitudinal profile permits sampling of the BHR at riffles beyond those subject to cross-sections and therefore can be readily integrated and provide a more complete sample distribution for these parameters, thereby providing the distribution/coverage necessary to provide meaningful comparisons.
Table 10b. Baseline Stream Data Summary (Substrate, Bed, Bank, and Hydrologic Containment Parameter Distributions) Chapel Creek Stream Restoration-Project No. 77 Reach 1 (961 feet)
Pre-Existing Condition Reference Reach(es) Data Design As-built/Baseline
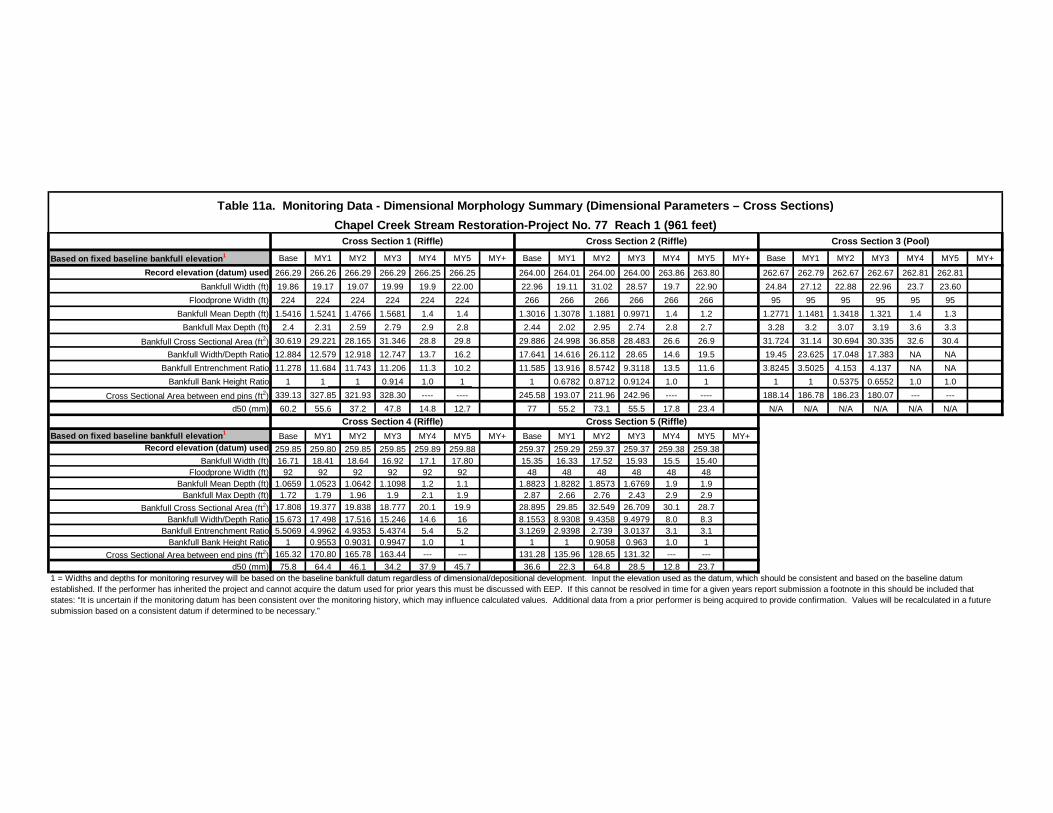
Based on fixed baseline bankfull elevation1 Base MY1 MY2 MY3 MY4 MY5 MY+ Base MY1 MY2 MY3 MY4 MY5 MY+ Base MY1 MY2 MY3 MY4 MY5 MY+Record elevation (datum) used 266.29 266.26 266.29 266.29 266.25 266.25 264.00 264.01 264.00 264.00 263.86 263.80 262.67 262.79 262.67 262.67 262.81 262.81
Bankfull Width (ft) 19.86 19.17 19.07 19.99 19.9 22.00 22.96 19.11 31.02 28.57 19.7 22.90 24.84 27.12 22.88 22.96 23.7 23.60Floodprone Width (ft) 224 224 224 224 224 224 266 266 266 266 266 266 95 95 95 95 95 95
Bankfull Mean Depth (ft) 1.5416 1.5241 1.4766 1.5681 1.4 1.4 1.3016 1.3078 1.1881 0.9971 1.4 1.2 1.2771 1.1481 1.3418 1.321 1.4 1.3Bankfull Max Depth (ft) 2.4 2.31 2.59 2.79 2.9 2.8 2.44 2.02 2.95 2.74 2.8 2.7 3.28 3.2 3.07 3.19 3.6 3.3
Bankfull Cross Sectional Area (ft2) 30.619 29.221 28.165 31.346 28.8 29.8 29.886 24.998 36.858 28.483 26.6 26.9 31.724 31.14 30.694 30.335 32.6 30.4Bankfull Width/Depth Ratio 12.884 12.579 12.918 12.747 13.7 16.2 17.641 14.616 26.112 28.65 14.6 19.5 19.45 23.625 17.048 17.383 NA NA
Bankfull Entrenchment Ratio 11.278 11.684 11.743 11.206 11.3 10.2 11.585 13.916 8.5742 9.3118 13.5 11.6 3.8245 3.5025 4.153 4.137 NA NABankfull Bank Height Ratio 1 1 1 0.914 1.0 1 1 0.6782 0.8712 0.9124 1.0 1 1 1 0.5375 0.6552 1.0 1.0
Cross Sectional Area between end pins (ft2) 339.13 327.85 321.93 328.30 ---- ---- 245.58 193.07 211.96 242.96 ---- ---- 188.14 186.78 186.23 180.07 --- ---d50 (mm) 60.2 55.6 37.2 47.8 14.8 12.7 77 55.2 73.1 55.5 17.8 23.4 N/A N/A N/A N/A N/A N/A
Based on fixed baseline bankfull elevation1 Base MY1 MY2 MY3 MY4 MY5 MY+ Base MY1 MY2 MY3 MY4 MY5 MY+Record elevation (datum) used 259.85 259.80 259.85 259.85 259.89 259.88 259.37 259.29 259.37 259.37 259.38 259.38
Bankfull Width (ft) 16.71 18.41 18.64 16.92 17.1 17.80 15.35 16.33 17.52 15.93 15.5 15.40Floodprone Width (ft) 92 92 92 92 92 92 48 48 48 48 48 48
Bankfull Mean Depth (ft) 1.0659 1.0523 1.0642 1.1098 1.2 1.1 1.8823 1.8282 1.8573 1.6769 1.9 1.9Bankfull Max Depth (ft) 1.72 1.79 1.96 1.9 2.1 1.9 2.87 2.66 2.76 2.43 2.9 2.9
Bankfull Cross Sectional Area (ft2) 17.808 19.377 19.838 18.777 20.1 19.9 28.895 29.85 32.549 26.709 30.1 28.7Bankfull Width/Depth Ratio 15.673 17.498 17.516 15.246 14.6 16 8.1553 8.9308 9.4358 9.4979 8.0 8.3
Bankfull Entrenchment Ratio 5.5069 4.9962 4.9353 5.4374 5.4 5.2 3.1269 2.9398 2.739 3.0137 3.1 3.1Bankfull Bank Height Ratio 1 0.9553 0.9031 0.9947 1.0 1 1 1 0.9058 0.963 1.0 1
Cross Sectional Area between end pins (ft2) 165.32 170.80 165.78 163.44 --- --- 131.28 135.96 128.65 131.32 --- ---d50 (mm) 75.8 64.4 46.1 34.2 37.9 45.7 36.6 22.3 64.8 28.5 12.8 23.7
1 = Widths and depths for monitoring resurvey will be based on the baseline bankfull datum regardless of dimensional/depositional development. Input the elevation used as the datum, which should be consistent and based on the baseline datum established. If the performer has inherited the project and cannot acquire the datum used for prior years this must be discussed with EEP. If this cannot be resolved in time for a given years report submission a footnote in this should be included that states: “It is uncertain if the monitoring datum has been consistent over the monitoring history, which may influence calculated values. Additional data from a prior performer is being acquired to provide confirmation. Values will be recalculated in a future submission based on a consistent datum if determined to be necessary.”
Cross Section 4 (Riffle) Cross Section 5 (Riffle)
Table 11a. Monitoring Data - Dimensional Morphology Summary (Dimensional Parameters – Cross Sections)Chapel Creek Stream Restoration-Project No. 77 Reach 1 (961 feet)
Cross Section 1 (Riffle) Cross Section 2 (Riffle) Cross Section 3 (Pool)
Parameter
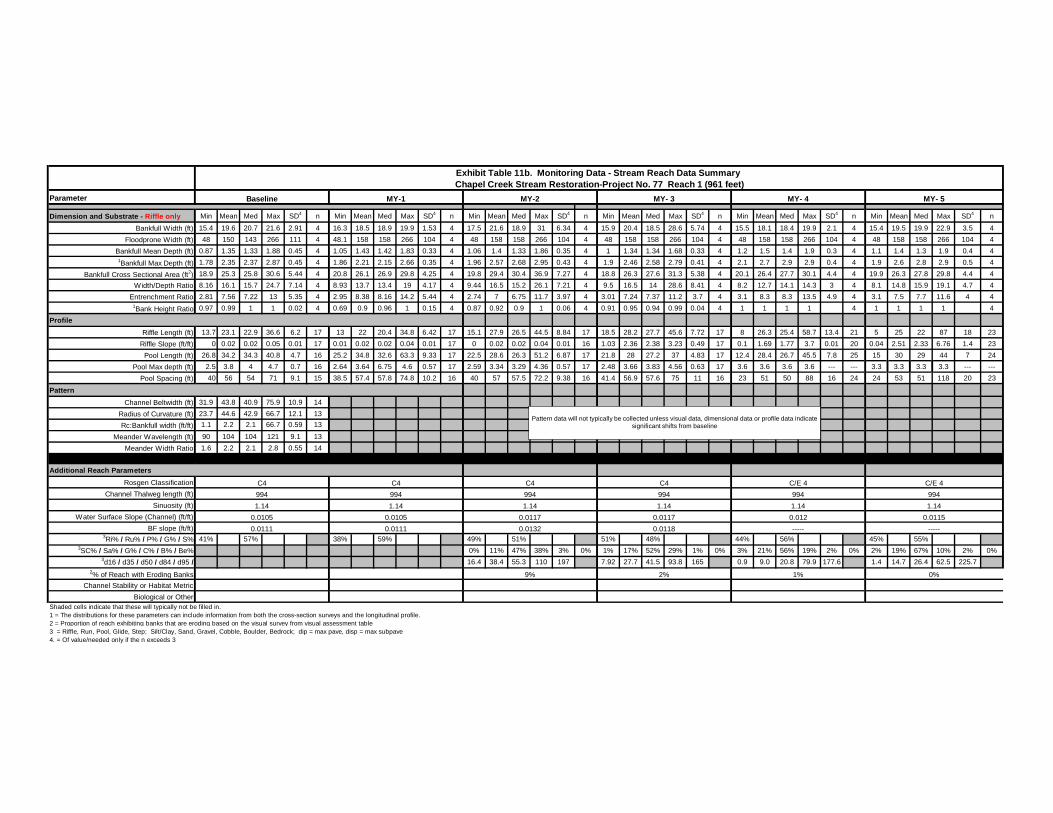
Dimension and Substrate - Riffle only Min Mean Med Max SD4 n Min Mean Med Max SD4 n Min Mean Med Max SD4 n Min Mean Med Max SD4 n Min Mean Med Max SD4 n Min Mean Med Max SD4 nBankfull Width (ft) 15.4 19.6 20.7 21.6 2.91 4 16.3 18.5 18.9 19.9 1.53 4 17.5 21.6 18.9 31 6.34 4 15.9 20.4 18.5 28.6 5.74 4 15.5 18.1 18.4 19.9 2.1 4 15.4 19.5 19.9 22.9 3.5 4
Floodprone Width (ft) 48 150 143 266 111 4 48.1 158 158 266 104 4 48 158 158 266 104 4 48 158 158 266 104 4 48 158 158 266 104 4 48 158 158 266 104 4Bankfull Mean Depth (ft) 0.87 1.35 1.33 1.88 0.45 4 1.05 1.43 1.42 1.83 0.33 4 1.06 1.4 1.33 1.86 0.35 4 1 1.34 1.34 1.68 0.33 4 1.2 1.5 1.4 1.9 0.3 4 1.1 1.4 1.3 1.9 0.4 41Bankfull Max Depth (ft) 1.78 2.35 2.37 2.87 0.45 4 1.86 2.21 2.15 2.66 0.35 4 1.96 2.57 2.68 2.95 0.43 4 1.9 2.46 2.58 2.79 0.41 4 2.1 2.7 2.9 2.9 0.4 4 1.9 2.6 2.8 2.9 0.5 4
Bankfull Cross Sectional Area (ft2) 18.9 25.3 25.8 30.6 5.44 4 20.8 26.1 26.9 29.8 4.25 4 19.8 29.4 30.4 36.9 7.27 4 18.8 26.3 27.6 31.3 5.38 4 20.1 26.4 27.7 30.1 4.4 4 19.9 26.3 27.8 29.8 4.4 4Width/Depth Ratio 8.16 16.1 15.7 24.7 7.14 4 8.93 13.7 13.4 19 4.17 4 9.44 16.5 15.2 26.1 7.21 4 9.5 16.5 14 28.6 8.41 4 8.2 12.7 14.1 14.3 3 4 8.1 14.8 15.9 19.1 4.7 4
Entrenchment Ratio 2.81 7.56 7.22 13 5.35 4 2.95 8.38 8.16 14.2 5.44 4 2.74 7 6.75 11.7 3.97 4 3.01 7.24 7.37 11.2 3.7 4 3.1 8.3 8.3 13.5 4.9 4 3.1 7.5 7.7 11.6 4 41Bank Height Ratio 0.97 0.99 1 1 0.02 4 0.69 0.9 0.96 1 0.15 4 0.87 0.92 0.9 1 0.06 4 0.91 0.95 0.94 0.99 0.04 4 1 1 1 1 4 1 1 1 1 4
ProfileRiffle Length (ft) 13.7 23.1 22.9 36.6 6.2 17 13 22 20.4 34.8 6.42 17 15.1 27.9 26.5 44.5 8.84 17 18.5 28.2 27.7 45.6 7.72 17 8 26.3 25.4 58.7 13.4 21 5 25 22 87 18 23
Riffle Slope (ft/ft) 0 0.02 0.02 0.05 0.01 17 0.01 0.02 0.02 0.04 0.01 17 0 0.02 0.02 0.04 0.01 16 1.03 2.36 2.38 3.23 0.49 17 0.1 1.69 1.77 3.7 0.01 20 0.04 2.51 2.33 6.76 1.4 23Pool Length (ft) 26.8 34.2 34.3 40.8 4.7 16 25.2 34.8 32.6 63.3 9.33 17 22.5 28.6 26.3 51.2 6.87 17 21.8 28 27.2 37 4.83 17 12.4 28.4 26.7 45.5 7.8 25 15 30 29 44 7 24
Pool Max depth (ft) 2.5 3.8 4 4.7 0.7 16 2.64 3.64 6.75 4.6 0.57 17 2.59 3.34 3.29 4.36 0.57 17 2.48 3.66 3.83 4.56 0.63 17 3.6 3.6 3.6 3.6 --- --- 3.3 3.3 3.3 3.3 --- ---Pool Spacing (ft) 40 56 54 71 9.1 15 38.5 57.4 57.8 74.8 10.2 16 40 57 57.5 72.2 9.38 16 41.4 56.9 57.6 75 11 16 23 51 50 88 16 24 24 53 51 118 20 23
PatternChannel Beltwidth (ft) 31.9 43.8 40.9 75.9 10.9 14
Radius of Curvature (ft) 23.7 44.6 42.9 66.7 12.1 13Rc:Bankfull width (ft/ft) 1.1 2.2 2.1 66.7 0.59 13
Meander Wavelength (ft) 90 104 104 121 9.1 13Meander Width Ratio 1.6 2.2 2.1 2.8 0.55 14
Additional Reach ParametersRosgen Classification
Channel Thalweg length (ft)Sinuosity (ft)
Water Surface Slope (Channel) (ft/ft)BF slope (ft/ft)
3Ri% / Ru% / P% / G% / S% 41% 57% 38% 59% 49% 51% 51% 48% 44% 56% 45% 55%3SC% / Sa% / G% / C% / B% / Be% 0% 11% 47% 38% 3% 0% 1% 17% 52% 29% 1% 0% 3% 21% 56% 19% 2% 0% 2% 19% 67% 10% 2% 0%
3d16 / d35 / d50 / d84 / d95 / 16.4 38.4 55.3 110 197 7.92 27.7 41.5 93.8 165 0.9 9.0 20.8 79.9 177.6 1.4 14.7 26.4 62.5 225.72% of Reach with Eroding Banks
Channel Stability or Habitat MetricBiological or Other
Shaded cells indicate that these will typically not be filled in.1 = The distributions for these parameters can include information from both the cross-section surveys and the longitudinal profile. 2 = Proportion of reach exhibiting banks that are eroding based on the visual survey from visual assessment table3 = Riffle, Run, Pool, Glide, Step; Silt/Clay, Sand, Gravel, Cobble, Boulder, Bedrock; dip = max pave, disp = max subpave4. = Of value/needed only if the n exceeds 3
Baseline MY-1
Exhibit Table 11b. Monitoring Data - Stream Reach Data Summary Chapel Creek Stream Restoration-Project No. 77 Reach 1 (961 feet)
MY-2 MY- 3 MY- 4 MY- 5
C4 C4994 994
0.0105 0.01051.14 1.14
----- -----0.0111 0.0111
994 994 994 994C4 C4 C/E 4 C/E 4
0.012 0.01151.14 1.14 1.14 1.14
0.0117 0.0117
2%
0.0132 0.0118
9% 1% 0%
Pattern data will not typically be collected unless visual data, dimensional data or profile data indicate significant shifts from baseline

APPENDIX E
HYDROLOGY DATA Table 12. Verification of Bankfull Events
Chapel Creek (final) Axiom Environmental, Inc. Monitoring Year 5 of 5 (2013) EEP Project Number 77 January 2014 Orange County, North Carolina Appendices
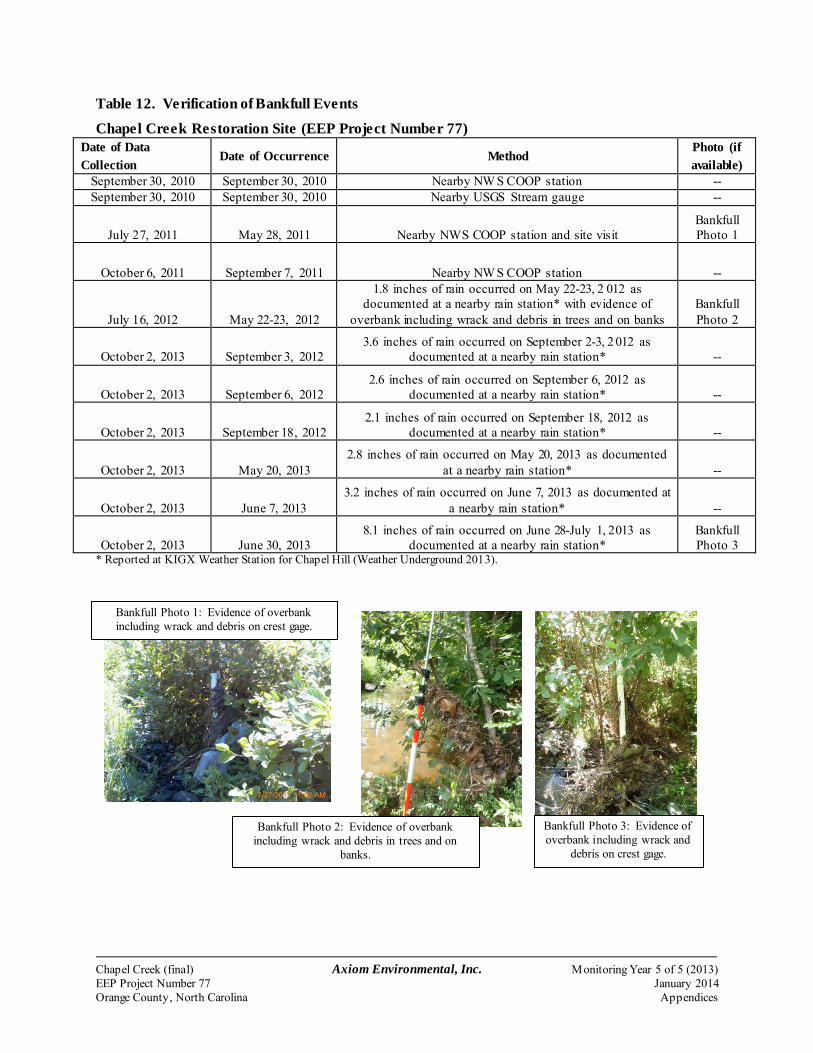
Table 12. Verification of Bankfull Events
Chapel Creek Restoration Site (EEP Project Number 77) Date of Data Collection
Date of Occurrence Method Photo (if available)
September 30, 2010 September 30, 2010 Nearby NW S COOP station -- September 30, 2010 September 30, 2010 Nearby USGS Stream gauge --
July 27, 2011 May 28, 2011 Nearby NWS COOP station and site visit Bankfull Photo 1
October 6, 2011 September 7, 2011 Nearby NW S COOP station --
July 16, 2012 May 22-23, 2012
1.8 inches of rain occurred on May 22-23, 2 012 as documented at a nearby rain station* with evidence of
overbank including wrack and debris in trees and on banks Bankfull Photo 2
October 2, 2013 September 3, 2012 3.6 inches of rain occurred on September 2-3, 2 012 as
documented at a nearby rain station* --
October 2, 2013 September 6, 2012 2.6 inches of rain occurred on September 6, 2012 as
documented at a nearby rain station* --
October 2, 2013 September 18, 2012 2.1 inches of rain occurred on September 18, 2012 as
documented at a nearby rain station* --
October 2, 2013 May 20, 2013 2.8 inches of rain occurred on May 20, 2013 as documented
at a nearby rain station* --
October 2, 2013 June 7, 2013 3.2 inches of rain occurred on June 7, 2013 as documented at
a nearby rain station* --
October 2, 2013 June 30, 2013 8.1 inches of rain occurred on June 28-July 1, 2013 as
documented at a nearby rain station* Bankfull Photo 3
* Reported at KIGX Weather Station for Chapel Hill (Weather Underground 2013).
Bankfull Photo 2: Evidence of overbank including wrack and debris in trees and on
banks.
Bankfull Photo 3: Evidence of overbank including wrack and
debris on crest gage.
Bankfull Photo 1: Evidence of overbank including wrack and debris on crest gage.
Chapel Creek (final) Axiom Environmental, Inc. Monitoring Year 5 of 5 (2013) EEP Project Number 77 January 2014 Orange County, North Carolina Appendices

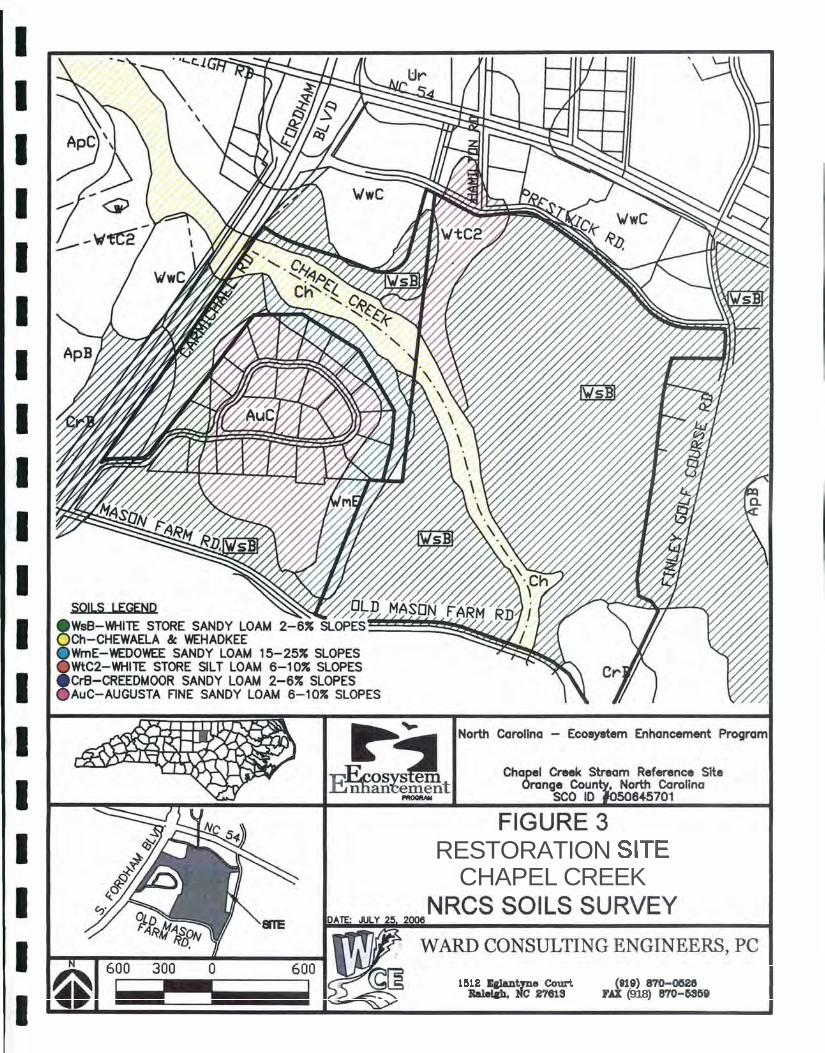
APPENDIX F
ADDITIONAL SITE MAPPING
Restoration Plan Figure 3. NRCS Soil Survey
Chapel Creek (final) Axiom Environmental, Inc. Monitoring Year 5 of 5 (2013) EEP Project Number 77 January 2014 Orange County, North Carolina Appendices
RESTORATIONCHAPEL CREEK
(918)

APPENDIX G
ADDITIONAL SITE PHOTOGRAPHS
Preconstruction Site Photographs Asbuilt Site Photographs
Chapel Creek (final) Axiom Environmental, Inc. Monitoring Year 5 of 5 (2013) EEP Project Number 77 January 2014 Orange County, North Carolina Appendices
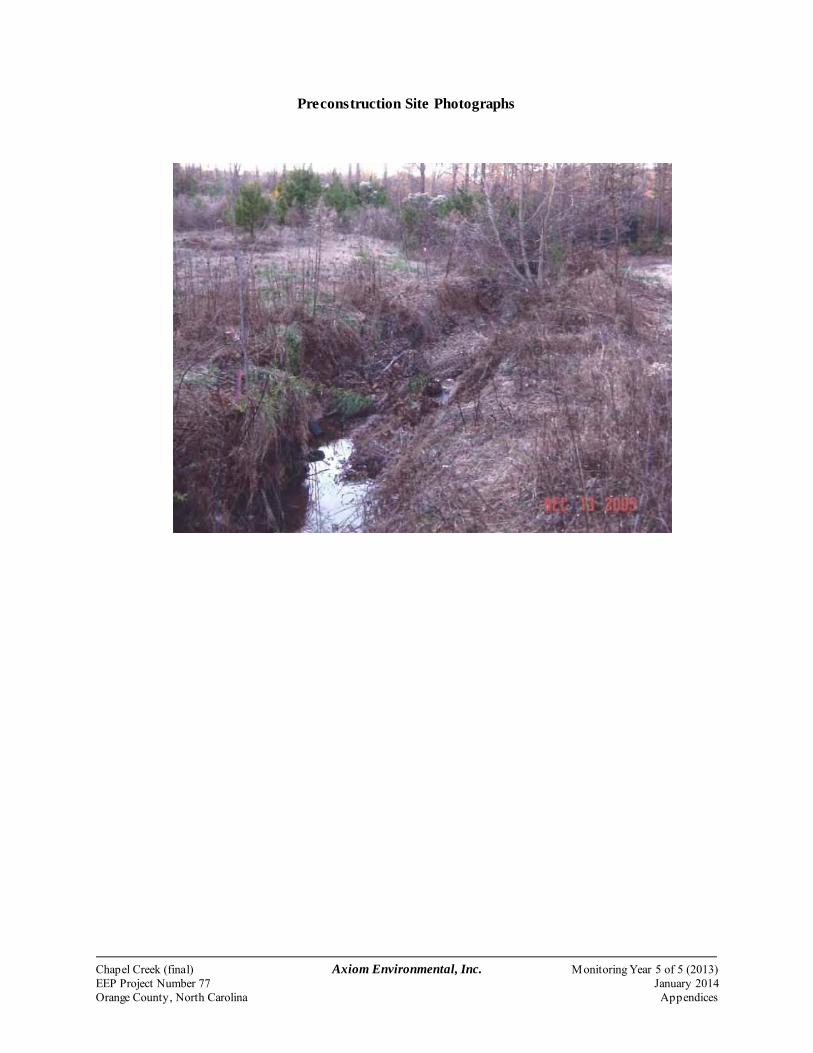
Preconstruction Site Photographs
Chapel Creek (final) Axiom Environmental, Inc. Monitoring Year 5 of 5 (2013) EEP Project Number 77 January 2014 Orange County, North Carolina Appendices
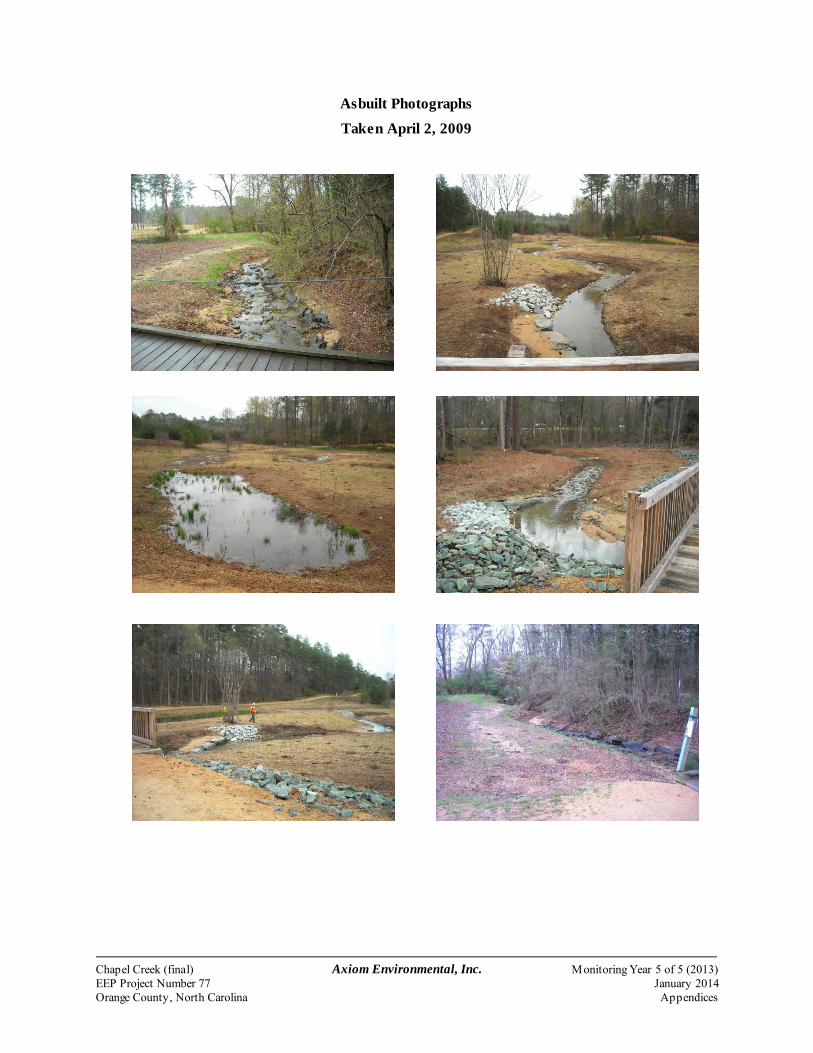
Asbuilt Photographs
Taken April 2, 2009
Chapel Creek (final) Axiom Environmental, Inc. Monitoring Year 5 of 5 (2013) EEP Project Number 77 January 2014 Orange County, North Carolina Appendices