Embed Size (px)
Citation preview
Final concepts of SLR
Author: Nicholas G Reich, Jeff Goldsmith
This material is part of the statsTeachR project
Made available under the Creative Commons Attribution-ShareAlike 3.0 UnportedLicense: http://creativecommons.org/licenses/by-sa/3.0/deed.en US

Today’s lecture
� Simple Linear Regression Continued
� Multiple Regression Intro

Simple linear regression model
� Observe data (yi , xi ) for subjects 1, . . . , I . Want to estimateβ0, β1 in the model
yi = β0 + β1xi + εi ; εiiid∼ (0, σ2)
� Note the assumptions on the variance:
� E (ε | x) = E (ε) = 0� Constant variance� Independence� [Normally distributed is not needed for least squares, but is
needed for inference]

Some definitions / SLR products
� Fitted values: yi := β0 + β1xi
� Residuals / estimated errors: εi := yi − yi
� Residual sum of squares: RSS :=∑n
i=1 εi2
� Residual variance: σ2 := RSSn−2
� Degrees of freedom: n − 2
Notes: residual sample mean is zero; residuals are uncorrelatedwith fitted values.

R2
Looking for a measure of goodness of fit.
� RSS by itself doesn’t work so well:
n∑i=1
(yi − yi )2
� Coefficient of determination (R2) works better:
R2 = 1−∑
(yi − yi )2∑
(yi − y)2

R2
Some notes about R2
� Interpreted as proportion of outcome variance explained bythe model.
� Alternative form
R2 =
∑(yi − y)2∑(yi − y)2
� R2 is bounded: 0 ≤ R2 ≤ 1
� For simple linear regression only, R2 = ρ2
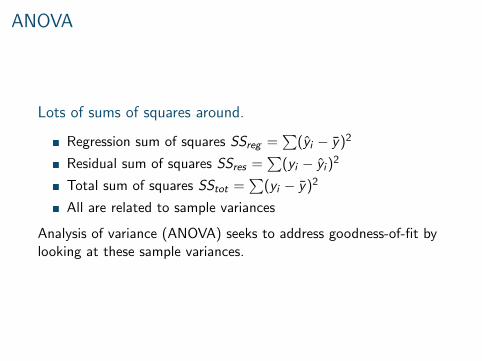
ANOVA
Lots of sums of squares around.
� Regression sum of squares SSreg =∑
(yi − y)2
� Residual sum of squares SSres =∑
(yi − yi )2
� Total sum of squares SStot =∑
(yi − y)2
� All are related to sample variances
Analysis of variance (ANOVA) seeks to address goodness-of-fit bylooking at these sample variances.

ANOVA
ANOVA is based on the fact that SStot = SSreg + SSres

ANOVA
ANOVA is based on the fact that SStot = SSreg + SSres

ANOVA and R2
� Both take advantage of sums of squares
� Both are defined for more complex models
� ANOVA can be used to derive a “global hypothesis test”based on an F test (more on this later)

R example
require(alr3)
data(heights)
linmod <- lm(Dheight ~ Mheight, data = heights)
linmod
##
## Call:
## lm(formula = Dheight ~ Mheight, data = heights)
##
## Coefficients:
## (Intercept) Mheight
## 29.917 0.542

R example
summary(linmod)
##
## Call:
## lm(formula = Dheight ~ Mheight, data = heights)
##
## Residuals:
## Min 1Q Median 3Q Max
## -7.397 -1.529 0.036 1.492 9.053
##
## Coefficients:
## Estimate Std. Error t value Pr(>|t|)
## (Intercept) 29.917 1.623 18.4 <2e-16 ***
## Mheight 0.542 0.026 20.9 <2e-16 ***
## ---
## Signif. codes: 0 '***' 0.001 '**' 0.01 '*' 0.05 '.' 0.1 ' ' 1
##
## Residual standard error: 2.27 on 1373 degrees of freedom
## Multiple R-squared: 0.241, Adjusted R-squared: 0.24
## F-statistic: 435 on 1 and 1373 DF, p-value: <2e-16

R example
names(linmod)
## [1] "coefficients" "residuals" "effects" "rank"
## [5] "fitted.values" "assign" "qr" "df.residual"
## [9] "xlevels" "call" "terms" "model"

R example
head(linmod$residuals)
## 1 2 3 4 5 6
## -7.160 -4.947 -6.747 -6.001 -7.397 -2.084
head(resid(linmod))
## 1 2 3 4 5 6
## -7.160 -4.947 -6.747 -6.001 -7.397 -2.084
head(linmod$fitted.values)
## 1 2 3 4 5 6
## 62.26 61.45 62.75 62.80 63.40 59.98
head(fitted(linmod))
## 1 2 3 4 5 6
## 62.26 61.45 62.75 62.80 63.40 59.98

R example
names(summary(linmod))
## [1] "call" "terms" "residuals" "coefficients"
## [5] "aliased" "sigma" "df" "r.squared"
## [9] "adj.r.squared" "fstatistic" "cov.unscaled"
summary(linmod)$coef
## Estimate Std. Error t value Pr(>|t|)
## (Intercept) 29.9174 1.62247 18.44 5.212e-68
## Mheight 0.5417 0.02596 20.87 3.217e-84
summary(linmod)$r.squared
## [1] 0.2408

R example
anova(linmod)
## Analysis of Variance Table
##
## Response: Dheight
## Df Sum Sq Mean Sq F value Pr(>F)
## Mheight 1 2237 2237 435 <2e-16 ***
## Residuals 1373 7052 5
## ---
## Signif. codes: 0 '***' 0.001 '**' 0.01 '*' 0.05 '.' 0.1 ' ' 1

R example
anova(linmod)
## Analysis of Variance Table
##
## Response: Dheight
## Df Sum Sq Mean Sq F value Pr(>F)
## Mheight 1 2237 2237 435 <2e-16 ***
## Residuals 1373 7052 5
## ---
## Signif. codes: 0 '***' 0.001 '**' 0.01 '*' 0.05 '.' 0.1 ' ' 1
(r2 <- 1 - 7052/(7052 + 2237))
## [1] 0.2408

Note on interpretation of β0
Recall β0 = E (y |x = 0)
� This often makes no sense in context
� “Centering” x can be useful: x∗ = x − x
� Center by mean, median, minimum, etc
� Effect of centering on slope:

Note on interpretation of β0, β1
� The interpretations are sensitive to the scale of the outcomeand predictors (in reasonable ways)
� You can’t get a better model fit by rescaling variables

R example
heights$centeredMheight <- heights$Mheight - mean(heights$Mheight)
centeredLinmod <- lm(Dheight ~ centeredMheight, data = heights)
summary(centeredLinmod)
##
## Call:
## lm(formula = Dheight ~ centeredMheight, data = heights)
##
## Residuals:
## Min 1Q Median 3Q Max
## -7.397 -1.529 0.036 1.492 9.053
##
## Coefficients:
## Estimate Std. Error t value Pr(>|t|)
## (Intercept) 63.7511 0.0611 1043.1 <2e-16 ***
## centeredMheight 0.5417 0.0260 20.9 <2e-16 ***
## ---
## Signif. codes: 0 '***' 0.001 '**' 0.01 '*' 0.05 '.' 0.1 ' ' 1
##
## Residual standard error: 2.27 on 1373 degrees of freedom
## Multiple R-squared: 0.241, Adjusted R-squared: 0.24
## F-statistic: 435 on 1 and 1373 DF, p-value: <2e-16

Properties of β0, β1
Population Sample
Sample StatisticPopulation Parameter

Properties of β0, β1
Estimates are unbiased:E (β0) = β0
E (β1) = β1

Properties of β0, β1
Variances of estimatesVar(β0) = xσ2∑
x2
Var(β1) = σ2
Sxx
where Sxx =∑
(x − x)2

Properties of β0, β1
Note about the variance of β1:
� Denominator contains SSx =∑
(xi − x)2
� To decrease variance of β1, increase variance of x

One slide on multiple linear regression
� Observe data (yi , xi1, . . . , xip) for subjects 1, . . . , n. Want toestimate β0, β1, . . . , βp in the model
yi = β0 + β1xi1 + . . .+ β1xip + εi ; εiiid∼ (0, σ2)
� Assumptions (residuals have mean zero, constant variance, areindependent) are as in SLR
� Notation is cumbersome. To fix this, let
� xi = [1, xi1, . . . , xip]
� βT = [β0, β1, . . . ,βp]� Then yi = xiβ + εi
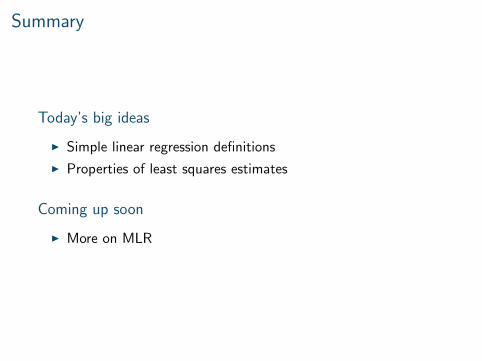
Summary
Today’s big ideas
I Simple linear regression definitions
I Properties of least squares estimates
Coming up soon
I More on MLR