Embed Size (px)
Citation preview


Unilever Pakistan Limited Annual Report 2014 01
ContentsCompany Information
Directors’ Report
Performance Indicators for 6 years (Key Operating & Financial Data)
Pattern of Shareholding
Financial Statements
Notice of AGM
Dividend Mandate Form
Form for Deduction of Tax on Dividend Income
Form of Proxy
01
02
07
09
10
55
59
61
63
Company Information
Board of DirectorsMr. Ehsan A. MalikChairman & Chief Executive
Mr. Ali TariqDirector & CFO
Mr. Amir R. ParachaDirector
Mr. Amar NaseerDirector
Company SecretaryMr. Amar Naseer
Registered OfficeAvari Plaza,Fatima Jinnah Road,Karachi – 75530.
AuditorsMessrs KPMG Taseer Hadi & Co.Chartered AccountantsSheikh Sultan Trust Building No. 2, Beaumont Road, Karachi - 75530Pakistan.
Share Registration OfficeM/s THK Associates (Pvt) Limited,2nd Floor, State Life Building - 3,Dr. Ziauddin Ahmed Road,Karachi-75530.
Website Addresswww.unileverpakistan.com.pk

02 Unilever Pakistan Limited Annual Report 2014 Unilever Pakistan Limited Annual Report 2014 03
Directors’ Report
Summary of Business PerformanceThe directors present the 2014 Annual Report together with audited financial statements of the Company for the year ended December 31, 2014.
Sales grew by 8.5% in a challenging economic and operational environment, with significant commodity deflation headwind. Growth was broad-based and volume led. In the case of Tea, commodity deflation and the resulting price reductions offset the strong volume growth. The improvement in gross margin through higher volume, cost efficiencies and better mix, was offset by restructuring charges. The business continued to invest strategically behind key brands and increased spend by 177 bps to 12.1% of Sales. Profit after tax grew by 3%.
Key Financial Highlights 2014 2013 Rupees in million
Sales 65,705 60,535Gross Profit 26,424 24,422Profit from Operations 9,400 9,223Profit before tax 9,019 8,905Profit after tax 6,302 6,117
EPS ( Rs.) 474 460
Dividend
The Board of Directors has recommended a final cash dividend of Rs. 127.28 per share. With the interim dividend of Rs. 346.0 per share already paid during the year, the total dividend for the year 2014 amounts to Rs. 473.28 (2013: Rs. 456.48) per ordinary share of Rs. 50 each. Total profit distributed by way of dividend amounts to 99.8% (2013: 99%).
Our People
In 2014, AC Nielsen rated the Company as the No.1 Employer of Choice, a position it has now held for the 7th consecutive year. The Company leverages the global Unilever network to develop talent in Marketing, Sales, Supply Chain, Finance and Human Resource Management through E-learning and other programmes. Personal development is facilitated by empowering the people with
bigger roles and challenging assignments, as also through coaching, mentoring and a robust appraisal system.
Diversity is at the heart of the agenda with 200 women employed in various roles across the business. We encourage our employees to work from agile locations and avail flexi-work hours. The Unilever Day Care Centre started in 2003 and has been expanded. In 2014, we have also revised the maternity leave policy by extending it to 6 months, fully paid. Simultaneously, we have also introduced a maternity and paternity support portal which employees are encouraged to utilize in order to manage their work-life balance when going through this crucial family planning stage. Our focus on encouraging personal vitality includes initiatives such as vitality health passport requiring annual check-up, gym facility and healthy eating options at the workplace. Community Involvement
As a multi-local multinational, Unilever Pakistan Limited believes that the highest standards of corporate behaviour are essential to long term success. Unilever Sustainable Living Plan and the Unilever Foundation enable us to achieve ambitious sustainability targets.
The Unilever Sustainable Living Plan (USLP) sets out to decouple growth from the environmental impact, while at the same time increasing our positive social impact. In order to realize sustainable growth, sustainability is integrated into our business strategy, brands and how we go to the market. We also work with our consumers, customers and suppliers, engage employees and foster new partnerships and collaborations to ensure a bright future for our business and future generations.
The Unilever Foundation is a key action taken by the Company globally, to help meet our ambitious goal of helping more than one billion people improve their health and well-being and, in turn, create a sustainable and bright future with our five global partners; UNICEF, United Nations World Food Programme, Save the Children, Population Services International and Oxfam. Unilever Pakistan partners with both local and global partners in order to execute its sustainability agenda.

04 Unilever Pakistan Limited Annual Report 2014 Unilever Pakistan Limited Annual Report 2014 05
During 2014, our main initiatives included:
i. Corporate Philanthropy: Rs. 8.7 million
a) Making quality primary education accessible to the lesser privileged by supporting:
1) The Citizens Foundation (TCF) schools 2) Government schools through Public Private
Partnerships b) Unilever Pakistan also supported WWF for the
Earth Hour campaign along with employee participation across its operations in the country.
ii. Community Investment and Welfare Schemes: Rs. 191.88 million
a) Lifebuoy continued to teach children the importance of washing their hands with soap on the five key occasions through its school programme conducted in collaboration with local and global partners. Lifebuoy also worked with local partners to develop the neo-natal handwashing programme. The brand signed a joint declaration with the Ministry of Education, Punjab and other partners to include hand hygiene into school curriculums.
b) Pond’s again partnered with Shaukat Khanum Hospital to raise awareness about breast cancer and celebrated Pakistani women in their efforts to recognize, encourage and empower women through the Pond’s Miracle Journey.
c) Pureit continued its efforts to provide access to safe drinking water through its water purification device.
d) Supreme continued to support the medical dispensary set up by the brand in 2012 in Khanewal for community health care.
e) Blue Band scaled up its school programme to educate students on healthy eating habits across Pakistan. Blue Band also held multiple activities with mothers to educate them about good fats and its importance in a child’s healthy growth.
f) Wall’s enhanced livelihoods of 3,400 men across the country through the Wall’s trikes.
g) Fair & Lovely, Sunsilk and Lux continued to provide rural women vocational training and basic management skills through the Guddi Baji Programme, which engaged 1,500 women in 2014 as Unilever Brand Ambassadors in their towns and villages. Additionally Lux, through the iconic Lux Style Awards continued to recognise and promote talent in music, TV, film and fashion.
h) Rahbar, our small scale distributor programme launched in 2011, provides rural employment opportunities.
iii. Other Initiatives: Rs. 5.6 million a) Unilever Talent Hunt encouraged thousands of
under-graduate students nationwide to explore their potential and present their skills.
b) We continued our partnership with Naya Jeevan, a social enterprise to encourage third party service providers as well as distributors to provide health insurance to their personnel and sales representatives who are a part of Unilever’s extended value chain.
c) We also supported The Citizens Foundation, Aga Khan University Hospital, Layton Rahmatullah Benevolent Trust, The Kidney Centre and SIUT by managing billboards for their Zakat Campaigns during Ramzan in Karachi, Lahore and Islamabad.
Employee Involvement:
Our people share the Company’s commitment towards sustainable development, which is evident through the support received from them during multiple volunteer programmes. Employees contributed to various organizations in the form of monetary support, skill development and by volunteering time. Through the employee payroll deduction programme, employees voluntarily contributed Rs. 1.7 million to support quality education of 26 girls through The Citizens Foundation, 3 child cardiac surgeries through Aga Khan University Hospital and provided meals to 500 children through the UN World Food Programme.
Employees also participated in internal fund raisers to support child health care programmes run by Save the Children at the IDP camps, families affected by the Thar drought and floods, by contributing over Rs. 1.1 million. Additionally, employees spent time with TCF students to educate them about the importance of handwashing with soap on the occasion of Global Handwashing Day. They also participated in career counselling through the TCF Rahbar programme. Under the Dove self-esteem platform, employees visited schools to engage girls in discussions about self-esteem.
Investments in Retirement Benefits
The investments made by the staff retirement funds operated by the Company as per their financial statements at December 31, 2014 are as follows: Rs. in millionThe Union Pakistan Provident Fund 1,147DC Pension Fund 961Unilever Pension Plan 128Unilever Gratuity Plan - Unilever Non Management Staff Gratuity Fund 65
Total 2,301
Total – 2013 2,069
Directors
The present directors were elected at the AGM in 2014, and the three years term of office of the present Directors expires on April 18, 2017.
Subsidiary Companies and Consolidated Financial Statements
The consolidated financial statements of the Unilever group comprising the Company and its subsidiaries M/s Lever Chemicals (Pvt.) Limited, M/s Lever Associated Pakistan Trust (Pvt.) Limited and M/s Sadiq (Pvt.) Limited, have not been included in view of exemption granted by the Securities & Exchange Commission of Pakistan (the SECP) vide its letter No. CLD/RD/Co.237 11/2007 dated December 22, 2014 from the requirement of Section 237 of the Companies Ordinance, 1984 (the Ordinance). None had any significant or material business transactions during the year.
Holding Company
Through its wholly owned subsidiary, Unilever Overseas Holdings Limited (UOHL), UK, Unilever PLC, a company incorporated in the United Kingdom, is the holding company, owning 98.92% of the shares in Unilever Pakistan Limited.
Auditors
For the year 2014 onwards, Unilever has globally appointed KPMG, Chartered Accountants, as their Auditors after a tendering process.
The Board has recommended the appointment of KPMG Taseer Hadi & Co., as the Auditors of the Company for the year 2015, for the Shareholders’ approval at the AGM scheduled to be held on April 14, 2015.

AcknowledgementOur people are the key driver of sustained growth. The directors acknowledge their valuable contribution. We would also like to express thanks to our consumers and customers for the trust shown in our brands. We are also grateful to our shareholders for their support and confidence in our management. Business Risk and Future OutlookOperating environment remains challenging. Economic conditions, counterfeits and evasion of taxes, especially in the tea category, continue to pose a threat.
Amidst these challenges, our strength lies in strong brand equities, innovative products, research and development capability and global expertise. Our aim is to continue to provide better value to consumers. To achieve this, we will continue to attract, develop and retain the best talent in the country.
On behalf of the Board
Karachi Ehsan A. MalikMarch 6, 2015 Chairman and Chief Executive
Reserve appropriations
CapitalArising under
schemes ofarrangements
foramalgamations
Contingency Unappropriatedprofit
RevenueReserves Total
ShareCapital
Sub Total
(Rupees in thousand)
Performance Indicators for 6 years2014 2013 2012
(Rupees in million)
2011 2010 2009
9,180 1,645
17,021 27,846
664 5
2,537 3,206
-
776 23,874 24,650
27,856
(6,853)
65,705 (39,281)
26,424 9,400 9,019 6,302 6,292 2,464
10,055 (2,054) (4,254)
7,838
7,865 2,052 12,087 22,004
664 5 2,389 3,058
-
912 18,034 18,946
22,004
(5,947)
60,535 (36,114) 24,422 9,223 8,905 6,117 6,068 1,548
11,053 (1,466) (6,080) 4,091
7,226 1,356 9,855 18,437
664 5 4,608 5,277
-
1,093 12,067 13,160
18,437
(2,212)
59,741 (38,068) 21,673 8,495 8,065 5,502 5,490 2,190
6,338 (2,028) (4,390) 586
4,897 1,177 7,427 13,501
664 5 2,891 3,560
12
955 8,974 9,929
13,501
(1,547)
44,672 (30,094) 14,577 5,060 4,780 3,273 3,270 921
6,182 (885) (3,038) 1,461
5,717 1,530 8,619 15,866
664 5 3,404 4,073
12
835 10,946 11,781
15,866
(2,327)
51,876 (33,792) 18,084 6,456 5,925 4,094 4,081 2,023
4,659 (1,948) (3,507) 665
4,737 1,132 5,557 11,426
664 5 2,622 3,291
13
1,020 7,102 8,122
11,426
(1,546)
38,188 (24,853) 13,335 4,943 4,516 3,056 3,044 872
5,216 (878) (2,011) (798)
FINANCIAL POSITION
Balance Sheet
Property, plant and equipmentOther non-current assetsCurrent assets Total assets
Share capital - ordinaryShare capital - Preference Reserves Total equity
Surplus on revaluation of fixed assets
Non-current liabilitiesCurrent liabilities Total liabilities
Total equity and liabilities
Net current liabilities
OPERATING AND FINANCIAL TRENDS
Profit and Loss
Net salesCost of salesGross profitOperating profitProfit before taxProfit after taxCash ordinary dividendsCapital expenditure
Cash Flows
Operating activitiesInvesting activitiesFinancing activitiesCash and cash equivalents at the end of the year
06 Unilever Pakistan Limited Annual Report 2014 Unilever Pakistan Limited Annual Report 2014 07
Issued,subscribedand paid up
capital
Balance as at January 1, 2013Total comprehensive income for the year ended December 31, 2013 - Profit for the year ended December 31, 2013 - Other comprehensive income for the year ended December 31, 2013
Transactions with owners of the CompanyDividend for the year ended December 31, 2012 - On cumulative preference shares @ 5% per share - Final dividend on ordinary shares @ Rs. 283 per shareDividend for the year ended December 31, 2013 - First interim dividend on ordinary shares @ Rs. 51.24 per share - Second interim dividend on ordinary shares @ Rs. 123.25 per share - Third interim dividend on ordinary shares @ Rs. 165.90 per share Balance as at December 31, 2013Total comprehensive income for the year ended December 31, 2014 - Profit for the year ended December 31, 2014 - Other comprehensive income for the year ended December 31, 2014Transactions with owners of the CompanyDividend for the year ended December 31, 2013 - On cumulative preference shares @ 5% per share - Final dividend on ordinary shares @ Rs. 116.09 per share Dividend for the year ended December 31, 2014 - First interim dividend on ordinary shares @ Rs. 346 per share Balance as at December 31, 2014
5,276,997
6,116,734
(48,257)6,068,477
(239)
(3,762,165)
(681,178)
(1,638,469)
(2,205,453)(3,057,970)
6,302,101(10,330)
6,291,771
(239)
(1,543,285)
(4,599,679)(3,206,538)
4,607,520
6,116,734
(48,257)6,068,477
(239)
(3,762,165)
(681,178)
(1,638,469)
(2,205,453)(2,388,493)
6,302,101 (10,330)
6,291,771
(239)
(1,543,285)
(4,599,679)(2,537,061)
4,215,120
6,116,734
(48,257)6,068,477
(239)
(3,762,165)
(681,178)
(1,638,469)
(2,205,453)(1,996,093)
6,302,101 (10,330)
6,291,771
(239)
(1,543,285)
(4,599,679)(2,144,661)
321,471
-
- -
-
-
-
-
- 321.471
- -
-
-
-
- 321,471
70,929
-
- -
-
-
-
-
- 70,929
- -
-
-
-
- 70,929
669,477
-
- -
-
-
-
-
- 669,477
- -
-
-
-
- 669,477

Performance Indicators for 6 yearsUnit 2014 2013 2012 2011 2010 2009
FINANCIAL RATIOS
Profitability Ratios
Gross profit marginNet profit to salesEBITDA Margin to salesOperating leverage ratioPre tax return on equityPost tax return on equityReturn on capital employed
Liquidity Ratios
Current ratioQuick / Acid test ratioCash to current liabilitiesCash flow from operations to sales
Capital Efficiency Ratios
Inventory turnoverDebtors turnoverCreditors turnover Total assets turnoverProperty, plant and equipment turnoverOperating cycle
Investment / Market Ratios
Earnings per share (EPS)Dividend payout ratio - earningsDividend payout ratio - par value Dividend cover ratioCash dividend
Capital Structure Ratios
Financial leverage ratioInterest cover ratio
%%%
Times%%%
Times Times Times Times
daysdaysdays
%timesdays
Rs.TimesTimesTimes
Rs.
TimesTimes
40 10 15
0.17 281197
201
0.71 0.50 0.33 0.15
46 5
(213) 236
7 (162)
474 1.00 9.47 1.00 473
- 62
40 10 16 8.55 291 200 147
0.67 0.30 0.25 0.18
43 5 (170) 278 8 (122)
460 0.99 9.14 1.01 457
0.11 70
36 9 15 2.36 153 104 117
0.82 0.30 0.05 0.11
59 6 (108) 324 8 (43)
413 1.00 8.26 1.00 413
- 130
35 8 13 1.32 145 101 103
0.79 0.30 0.09 0.09
49 5 (98) 327 9 (44)
308 1.00 6.14 1.00 307
0.07 124
33 7 12 0.21 134 92 80
0.83 0.40 0.20 0.14
46 4 (84) 331 9 (34)
246 1.00 4.92 1.00 246
0.09 34
35 8 14 2.30 137 93 62
0.78 0.27 0.03 0.13
58 4 (75) 334 8 (13)
230 1.00 4.58 1.00 229
0.32 20
08 Unilever Pakistan Limited Annual Report 2014 Unilever Pakistan Limited Annual Report 2014 09
Pattern of Shareholding As at December 31, 2014
1,508204
3021
111
1,766
Number of Shareholders
1101501
1,0015,001
10,00113,185,000
100500
1,0005,000
10,00015,000
13,190,000
39,11940,23121,90237,986
7,00010,142
13,185,324
13,341,704
ShareholdingFrom To
Total Shares Held*
Shareholders’ Category
1
1
3
3
1,7199
24
6
1,766
Number ofShareholders
13,185,324
123
62
348
127,3099,229
14,913
4,396
13,341,704
Number of Shares Held
98.83
0.00
0.00
0.00
0.95 0.07
0.12
0.03
100.00
Percentage
Associated Companies, and related parties* Directors, Executives and their spouses* ICP/NBP Trustees Banks and Financial Institutions* General Public a. Local* b. Foreign* Others Foreign Companies *
Totals
Shareholders holding 5% or more voting rights:
Unilever Overseas Holdings Ltd. * Includes Voting Preference Shares
Shares Held
13,185,324
Percentage
98.83

Financial Statements2014
We have audited the annexed balance sheet of Unilever Pakistan Limited (“the Company”) as at December 31, 2014 and the related profit and loss account, cash flow statement and statement of changes in equity together with the notes forming part thereof, for the year then ended and we state that we have obtained all the information and explanations which, to the best of our knowledge and belief, were necessary for the purposes of our audit.
It is the responsibility of the Company’s management to establish and maintain a system of internal control, and prepare and present the above said statements in conformity with the approved accounting standards and the requirements of the Companies Ordinance, 1984. Our responsibility is to express an opinion on these statements based on our audit.
We conducted our audit in accordance with the auditing standards as applicable in Pakistan. These standards require that we plan and perform the audit to obtain reasonable assurance about whether the above said statements are free of any material misstatement. An audit includes examining on a test basis, evidence supporting the amounts and disclosures in the above said statements. An audit also includes assessing the accounting policies and significant estimates made by management, as well as, evaluating the overall presentation of the above said statements. We believe that our audit provides a reasonable basis for our opinion and, after due verification, we report that:
a) in our opinion, proper books of accounts have been kept by the Company as required by the Companies Ordinance, 1984;
b) in our opinion:i) the balance sheet and profit and loss account together with the notes thereon have
been drawn up in conformity with the Companies Ordinance, 1984, and are in agreement with the books of accounts and are further in accordance with accounting policies consistently applied;
ii) the expenditure incurred during the year was for the purpose of the Company’s business; and
iii) the business conducted, investments made and the expenditure incurred during the year were in accordance with the objects of the Company;
c) in our opinion and to the best of our information and according to the explanations given to us, the balance sheet, profit and loss account, cash flow statement and statement of changes in equity together with the notes forming part thereof conform with approved accounting standards as applicable in Pakistan, and, give the information required by the Companies Ordinance, 1984, in the manner so required and respectively give a true and fair view of the state of the Company’s affairs as at December 31, 2014 and of the profit, its cash flows and changes in equity for the year then ended; and
d) in our opinion, Zakat deductible at source under the Zakat and Ushr Ordinance, 1980 (XVIII of 1980), was deducted by the Company and deposited in the Central Zakat Fund established under section 7 of that Ordinance.
The financial statements of the Company for the year ended December 31, 2013 were audited by another firm of Chartered Accountants who expressed an unmodified opinion on those financial statements on March 17, 2014.
KPMG Taseer Hadi & Co.Chartered AccountantsMohammad Mahmood Hussain
Karachi Dated: March 6, 2015
Auditors' Report to the Members
Unilever Pakistan Limited Annual Report 2014 11

12 Unilever Pakistan Limited Annual Report 2014 Unilever Pakistan Limited Annual Report 2014 13
Balance Sheetas at December 31, 2014
Balance Sheetas at December 31, 2014
Ehsan A. Malik Ali Tariq Chairman and Chief Executive Director and Chief Financial Officer
ASSETS
Non-current assets
Property, plant and equipment Intangibles - computer software Long term investments Long term loans Long term deposits and prepayments Staff retirement benefits
Current assets
Stores and spares Stock in trade Trade debts Sales tax receivable Loans and advances Short term prepayments Accrued mark up Other receivables Taxation-net Non-current assets held for sale Cash and bank balances
Total assets
EQUITY AND LIABILITIES
Share capital and reserves
Share capital Reserves
LIABILITIES
Non-current liabilities
Deferred taxation Staff retirement benefits
Current liabilities
Trade and other payables Accrued mark-up Short term borrowings Provisions
Total liabilities
Total equity and liabilities
Contingencies and commitments
The annexed notes 1 to 46 form an integral part of these financial statements.
56789
10
111213
1415
16171819
Note
7,864,440 754,055
95,202 155,266 995,784
52,069 9,916,816
528,211
4,335,309 855,771
- 150,045 987,273
6,781 167,133 590,238
- 4,466,231
12,086,992 22,003,808
9,179,583 656,277
95,202 141,022 762,946
- 10,835,030
567,321 5,012,258
972,405 147,681 260,363 924,594
88,736 87,240
1,104,625 18,096
7,837,837 17,021,156 27,856,186
2021
2210
23
2425
26
Note
669,477 2,388,493 3,057,970
520,948 391,281 912,229
17,079,170 951
375,401 578,087
18,033,609
18,945,838
22,003,808
669,477 2,537,061 3,206,538
475,251 300,351 775,602
23,286,354 - -
587,692 23,874,046
24,649,648
27,856,186
2014 2013(Rupees in thousand)
2014 2013(Rupees in thousand)

Profit and Loss Account for the year ended December 31, 2014
Sales
Cost of sales
Gross profit
Distribution costs
Administrative expenses
Other operating expenses
Other income
Profit from operations
Finance cost
Profit before taxation
Taxation
Profit after taxation
Other comprehensive income:
Items that will not be reclassified to Profit or Loss
(Loss) on remeasurements of post employment benefit obligations
Impact of deferred tax
Items that may be subsequently reclassified to Profit or Loss
Total comprehensive income
The annexed notes 1 to 46 form an integral part of these financial statements.
27
28
29
30
31
32
33
34
10
Note
Cash Flow Statementfor the year ended December 31, 2014
8,904,635
737,038 182,742 (4,561)
(12) 131,675 133,728
47,986 (45,181)
1,183,415 10,088,050
(106,555) 1,908,894
162,790 -
30,958 (439,602)
(58,453) 1,498,032
3,188,590 (36,919)
3,151,671 4,649,703
14,737,753
9,018,949
862,770 107,723
20,300 (12)
151,753 215,795 (31,414)
(469,802) 857,113
9,876,062
(39,110) (676,949) (116,634) (147,681) (110,318)
62,679 79,893
(948,120)
4,317,499 9,605
4,327,104 3,378,984
13,255,046
65,704,906
(39,280,878)
26,424,028
(14,600,308)
(2,053,572)
(1,300,028)
930,116
9,400,236
(381,287)
9,018,949
(2,716,848)
6,302,101
(15,893)
5,563 (10,330)
-
6,291,771
60,535,320
(36,113,538)
24,421,782
(12,672,494)
(2,258,122)
(679,545)
410,936
9,222,557
(317,922)
8,904,635
(2,787,901)
6,116,734
(73,117)
24,860 (48,257)
-
6,068,477
Cash flows from operating activities
Profit before taxation Adjustments for non-cash charges and other items Depreciation Amortisation of intangible - computer software Loss / (gain) on disposal of property, plant and equipment Dividend income Mark-up on short term borrowings Provision for fixed assets to be written off Provision for staff retirement benefits Return on savings accounts and deposit accounts
Effect on cash flows due to working capital changes (Increase) / decrease in current assets Stores and spares Stock in trade Trade debts Sales tax receivable Loans and advances Short term prepayments Other receivables Increase / (decrease) in current liabilities Trade and other payables Provisions
Cash generated from operations (carried forward)
14 Unilever Pakistan Limited Annual Report 2014 Unilever Pakistan Limited Annual Report 2014 15
2014 2013(Rupees in thousand)
2014 2013(Rupees in thousand)
Ehsan A. Malik Ali Tariq Chairman and Chief Executive Director and Chief Financial Officer

35
Cash Flow Statementfor the year ended December 31, 2014
Note
Statement of Changes in Equityfor the year ended December 31, 2014
The annexed notes 1 to 46 form an integral part of these financial statements.
The annexed notes 1 to 46 form an integral part of these financial statements.
669,477 70,929 321,471 4,215,120 4,607,520 5,276,997
- - - 6,116,734 6,116,734 6,116,734
- - - (48,257) (48,257) (48,257)
- - - 6,068,477 6,068,477 6,068,477
- - - (239) (239) (239)
- - - (3,762,165) (3,762,165) (3,762,165)
- - - (681,178) (681,178) (681,178)
- - - (1,638,469) (1,638,469) (1,638,469)
- - - (2,205,453) (2,205,453) (2,205,453)
669,477 70,929 321,471 1,996,093 2,388,493 3,057,970
- - - 6,302,101 6,302,101 6,302,101
- - - (10,330) (10,330) (10,330)
- - - 6,291,771 6,291,771 6,291,771
- - - (239) (239) (239)
- - - (1,543,285) (1,543,285) (1,543,285)
- - - (4,599,679) (4,599,679) (4,599,679)
669,477 70,929 321,471 2,144,661 2,537,061 3,206,538
R E S E R V E S SHARE CAPITAL
TOTAL
CAPITAL REVENUE SUB TOTAL Arising under
schemes of arrangements
for amalgamations
Issued,subscribedand paid up
capital
Contingency Unappropriated profit
13,255,046
(152,704) (3,271,369)
(23,340) 14,244
232,838
10,054,715
(2,464,115) 32,012 (9,944)
387,847 12
(2,054,188)
(4,253,520)
3,747,007 4,090,830 7,837,837
14,737,753
(137,727) (2,536,898)
(15,048) (19,680)
(975,714)
11,052,686
(1,547,803) 42,937
- 38,400
12 (1,466,454)
(6,079,948)
3,506,284 584,546
4,090,830
Cash generated from operations (brought forward) Mark-up on short term borrowings Income tax paid Staff retirement benefits contribution paid Decrease / (increase) in long term loans Decrease / (increase) in long term deposits and prepayments Net cash from operating activities Cash used in investing activities Purchase of property, plant and equipment Proceeds on disposal of property, plant and equipment Purchase of intangible Return on savings accounts and deposit accounts Dividend receivedNet cash used in investing activities Cash used in financing activities Dividends paid
Net increase in cash and cash equivalents Cash and cash equivalents at beginning of the year Cash and cash equivalents at end of the year
Balance as at January 1, 2013
Total comprehensive income for the year ended December 31, 2013
- Profit for the year ended December 31, 2013
- Other comprehensive income for the year ended December 31, 2013
Transactions with owners of the Company
Dividend for the year ended December 31, 2012
- On cumulative preference shares @ 5% per share
- Final dividend on ordinary shares @ Rs. 283 per share
Dividend for the year ended December 31, 2013
- First interim dividend on ordinary shares @ Rs. 51.24 per share
- Second interim dividend on ordinary shares @ Rs. 123.25 per share
- Third interim dividend on ordinary shares @ Rs. 165.90 per share
Balance as at December 31, 2013
Total comprehensive income for the year ended December 31, 2014
- Profit for the year ended December 31, 2014
- Other comprehensive income for the year ended December 31, 2014
Transactions with owners of the Company
Dividend for the year ended December 31, 2013
- On cumulative preference shares @ 5% per share
- Final dividend on ordinary shares @ Rs. 116.09 per share
Dividend for the year ended December 31, 2014
- First interim dividend on ordinary shares @ Rs. 346 per share
Balance as at December 31, 2014
(Rupees in thousand)
16 Unilever Pakistan Limited Annual Report 2014 Unilever Pakistan Limited Annual Report 2014 17
2014 2013(Rupees in thousand)
Ehsan A. Malik Ali Tariq Chairman and Chief Executive Director and Chief Financial Officer
Ehsan A. Malik Ali Tariq Chairman and Chief Executive Director and Chief Financial Officer
Notes to and Forming Part of the Financial Statementsfor the year ended December 31, 2014
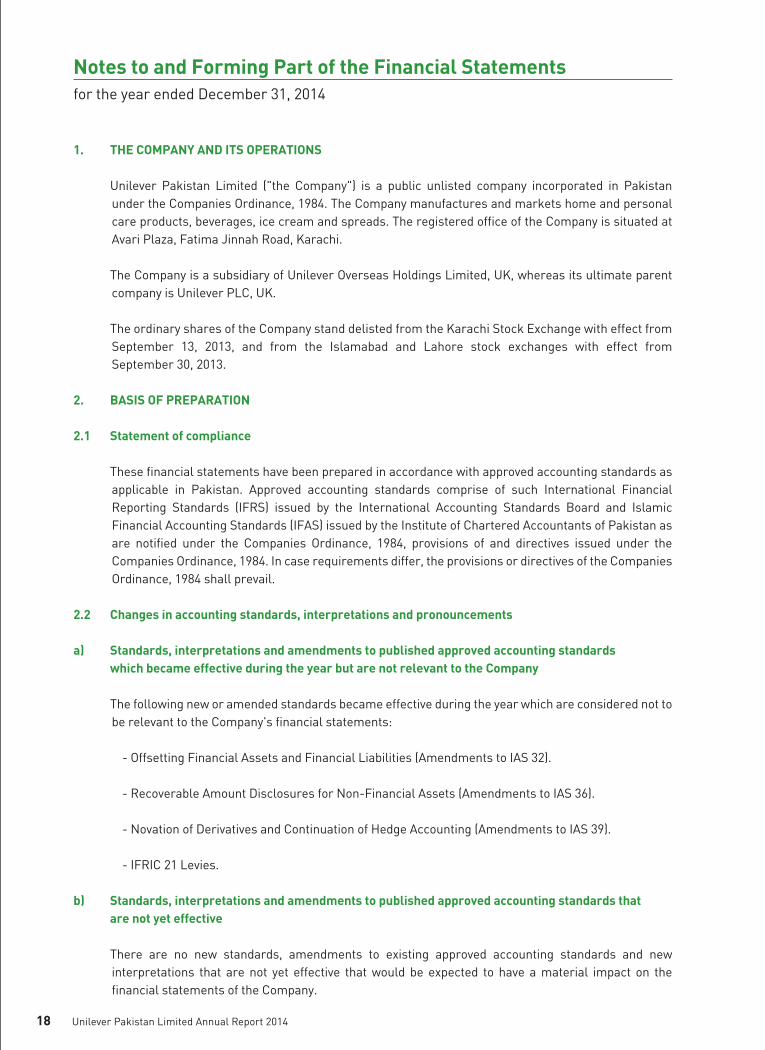
1. THE COMPANY AND ITS OPERATIONS Unilever Pakistan Limited ("the Company") is a public unlisted company incorporated in Pakistan
under the Companies Ordinance, 1984. The Company manufactures and markets home and personal care products, beverages, ice cream and spreads. The registered office of the Company is situated at Avari Plaza, Fatima Jinnah Road, Karachi.
The Company is a subsidiary of Unilever Overseas Holdings Limited, UK, whereas its ultimate parent
company is Unilever PLC, UK.
The ordinary shares of the Company stand delisted from the Karachi Stock Exchange with effect from September 13, 2013, and from the Islamabad and Lahore stock exchanges with effect from September 30, 2013.
2. BASIS OF PREPARATION 2.1 Statement of compliance These financial statements have been prepared in accordance with approved accounting standards as
applicable in Pakistan. Approved accounting standards comprise of such International Financial Reporting Standards (IFRS) issued by the International Accounting Standards Board and Islamic Financial Accounting Standards (IFAS) issued by the Institute of Chartered Accountants of Pakistan as are notified under the Companies Ordinance, 1984, provisions of and directives issued under the Companies Ordinance, 1984. In case requirements differ, the provisions or directives of the Companies Ordinance, 1984 shall prevail.
2.2 Changes in accounting standards, interpretations and pronouncements a) Standards, interpretations and amendments to published approved accounting standards which became effective during the year but are not relevant to the Company The following new or amended standards became effective during the year which are considered not to
be relevant to the Company's financial statements:
- Offsetting Financial Assets and Financial Liabilities (Amendments to IAS 32). - Recoverable Amount Disclosures for Non-Financial Assets (Amendments to IAS 36). - Novation of Derivatives and Continuation of Hedge Accounting (Amendments to IAS 39). - IFRIC 21 Levies. b) Standards, interpretations and amendments to published approved accounting standards that are not yet effective There are no new standards, amendments to existing approved accounting standards and new
interpretations that are not yet effective that would be expected to have a material impact on the financial statements of the Company.
2.3 Measurement basis These financial statements have been prepared under the historical cost convention except as
disclosed in the accounting policy notes. 3. SUMMARY OF SIGNIFICANT ACCOUNTING POLICIES The consolidated financial statements of the Unilever group comprising the Company and its subsidiaries
M/s Lever Chemicals (Pvt.) Limited, M/s Lever Associated Pakistan Trust (Pvt.) Limited and M/s Sadiq (Pvt.) Limited, have not been prepared in view of exemption granted by the Securities & Exchange Commission of Pakistan (the SECP) vide its letter No. CLD/RD/Co.237 11/2007 dated December 22, 2014 from the requirement of Section 237 of the Companies Ordinance, 1984 (the Ordinance).
The principal accounting policies applied in the preparation of these financial statements are set out below. These policies have been consistently applied to all the years presented.
3.1 Property, plant and equipment Property, plant and equipment is stated at cost less accumulated depreciation and accumulated
impairment losses except capital work in progress which is stated at cost. Depreciation is calculated using the straight-line method to charge off their cost excluding residual value, if not insignificant, over their estimated useful lives. Depreciation on additions is charged from the month in which asset is available for use and on disposals up to the month of deletion.
The Company accounts for impairment, where indication exists, by reducing assets' carrying value to the assessed recoverable amount.
The assets' residual values and useful lives are reviewed, and adjusted if appropriate, at each balance
sheet date. Maintenance and normal repairs are charged to income as and when incurred; also individual assets
costing up to Rs. 10,000 are charged to income. Major renewals and improvements are capitalised only when it is probable that future economic benefits associated with the item will flow to the Company and the cost of the item can be measured reliably.
Gains and losses on disposal of property, plant and equipment are recognised in the profit and loss account.
3.2 Intangible assets Intangible assets having definite useful life are stated at cost less accumulated amortisation and
impairment, if any. Intangible assets are reviewed for impairment whenever events or changes in circumstances indicate that the carrying amount may not be recoverable. An impairment loss is recognised for the amount by which the asset’s carrying amount exceeds its recoverable amount. The recoverable amount is the higher of an asset’s fair value less costs to sell and value in use.
18 Unilever Pakistan Limited Annual Report 2014 Unilever Pakistan Limited Annual Report 2014 19

Notes to and Forming Part of the Financial Statementsfor the year ended December 31, 2014
1. THE COMPANY AND ITS OPERATIONS Unilever Pakistan Limited ("the Company") is a public unlisted company incorporated in Pakistan
under the Companies Ordinance, 1984. The Company manufactures and markets home and personal care products, beverages, ice cream and spreads. The registered office of the Company is situated at Avari Plaza, Fatima Jinnah Road, Karachi.
The Company is a subsidiary of Unilever Overseas Holdings Limited, UK, whereas its ultimate parent
company is Unilever PLC, UK.
The ordinary shares of the Company stand delisted from the Karachi Stock Exchange with effect from September 13, 2013, and from the Islamabad and Lahore stock exchanges with effect from September 30, 2013.
2. BASIS OF PREPARATION 2.1 Statement of compliance These financial statements have been prepared in accordance with approved accounting standards as
applicable in Pakistan. Approved accounting standards comprise of such International Financial Reporting Standards (IFRS) issued by the International Accounting Standards Board and Islamic Financial Accounting Standards (IFAS) issued by the Institute of Chartered Accountants of Pakistan as are notified under the Companies Ordinance, 1984, provisions of and directives issued under the Companies Ordinance, 1984. In case requirements differ, the provisions or directives of the Companies Ordinance, 1984 shall prevail.
2.2 Changes in accounting standards, interpretations and pronouncements a) Standards, interpretations and amendments to published approved accounting standards which became effective during the year but are not relevant to the Company The following new or amended standards became effective during the year which are considered not to
be relevant to the Company's financial statements:
- Offsetting Financial Assets and Financial Liabilities (Amendments to IAS 32). - Recoverable Amount Disclosures for Non-Financial Assets (Amendments to IAS 36). - Novation of Derivatives and Continuation of Hedge Accounting (Amendments to IAS 39). - IFRIC 21 Levies. b) Standards, interpretations and amendments to published approved accounting standards that are not yet effective There are no new standards, amendments to existing approved accounting standards and new
interpretations that are not yet effective that would be expected to have a material impact on the financial statements of the Company.
2.3 Measurement basis These financial statements have been prepared under the historical cost convention except as
disclosed in the accounting policy notes. 3. SUMMARY OF SIGNIFICANT ACCOUNTING POLICIES The consolidated financial statements of the Unilever group comprising the Company and its subsidiaries
M/s Lever Chemicals (Pvt.) Limited, M/s Lever Associated Pakistan Trust (Pvt.) Limited and M/s Sadiq (Pvt.) Limited, have not been prepared in view of exemption granted by the Securities & Exchange Commission of Pakistan (the SECP) vide its letter No. CLD/RD/Co.237 11/2007 dated December 22, 2014 from the requirement of Section 237 of the Companies Ordinance, 1984 (the Ordinance).
The principal accounting policies applied in the preparation of these financial statements are set out below. These policies have been consistently applied to all the years presented.
3.1 Property, plant and equipment Property, plant and equipment is stated at cost less accumulated depreciation and accumulated
impairment losses except capital work in progress which is stated at cost. Depreciation is calculated using the straight-line method to charge off their cost excluding residual value, if not insignificant, over their estimated useful lives. Depreciation on additions is charged from the month in which asset is available for use and on disposals up to the month of deletion.
The Company accounts for impairment, where indication exists, by reducing assets' carrying value to the assessed recoverable amount.
The assets' residual values and useful lives are reviewed, and adjusted if appropriate, at each balance
sheet date. Maintenance and normal repairs are charged to income as and when incurred; also individual assets
costing up to Rs. 10,000 are charged to income. Major renewals and improvements are capitalised only when it is probable that future economic benefits associated with the item will flow to the Company and the cost of the item can be measured reliably.
Gains and losses on disposal of property, plant and equipment are recognised in the profit and loss account.
3.2 Intangible assets Intangible assets having definite useful life are stated at cost less accumulated amortisation and
impairment, if any. Intangible assets are reviewed for impairment whenever events or changes in circumstances indicate that the carrying amount may not be recoverable. An impairment loss is recognised for the amount by which the asset’s carrying amount exceeds its recoverable amount. The recoverable amount is the higher of an asset’s fair value less costs to sell and value in use.
18 Unilever Pakistan Limited Annual Report 2014 Unilever Pakistan Limited Annual Report 2014 19

3.3 Investments All investments are initially measured at cost, which is the fair value of the consideration given. These
investments are subsequently measured at fair value, amortised cost or cost, as the case may be.
i) In subsidiaries These are stated at cost. ii) In unlisted entity not being subsidiary These are valued at cost and are classified under investment available-for-sale. iii) Derivatives Derivatives are initially recognised at fair value. Any directly attributable transaction costs are
recognised in the profit and loss account as incurred. Subsequent to initial recognition, derivatives are measured at fair value, and changes therein are generally recognised in profit and loss account.
3.4 Taxation Income tax expense comprises current and deferred tax. Income tax expense is recognised in the profit
and loss account, except to the extent that it relates to items recognised in other comprehensive income or directly in equity. In this case, the tax is also recognised in other comprehensive income or directly in equity.
3.4.1 Current Provision for the current taxation is based on taxability of certain income streams of the Company
under presumptive tax regime at the applicable tax rates and remaining income streams chargeable at current rate of taxation under the normal tax regime, after taking into account tax credits and tax rebates available, if any.
3.4.2 Deferred Deferred tax is recognised using the balance sheet method, providing for temporary differences
between the carrying amounts of assets and liabilities for financial reporting purposes and the amounts used for taxation purposes. Deferred tax is not recognised on the initial recognition of assets or liabilities in a transaction that is not a business combination and that affects neither accounting nor taxable profit at the time of the transaction. Deferred tax is measured at the tax rates that are expected to be applied to the temporary differences when they reverse, based on the laws that have been enacted or substantively enacted by the reporting date.
A deferred tax asset is recognised to the extent that it is probable that future taxable profits will be available against which temporary differences can be utilised. Deferred tax assets are reviewed at each reporting date and are reduced to the extent that it is no longer probable that the related tax benefit will be realised.
3.5 Staff retirement benefits The Company operates various post-employment schemes, including both defined benefit and defined
contribution plans. 3.5.1 Defined contribution plans A defined contribution plan is a plan under which the Company pays fixed contributions into a separate
entity. The Company has no legal or constructive obligations to pay further contributions if the fund does not hold sufficient assets to pay all employees the benefits relating to employee service in the current and prior periods. The contributions are recognised as employee benefit expense when they are due. Prepaid contributions are recognised as an asset to the extent that a cash refund or a reduction in the future payments is available.
i) Provident Fund
The Company operates an approved contributory provident fund for all employees. Equal monthly contributions are made, both by the Company and the employees, to the fund at the rate of 6% per annum of the gross salary and 10% of basic salary plus cost of living allowance in respect of management employees and unionised staff respectively.
ii) DC Pension Fund
The Company has established a defined contribution plan - DC Pension Fund for the following management employees:
a) permanent employees who joined on or after January 1, 2009; and b) permanent employees who joined on or before December 31, 2008 and opted for DC Pension
plan in lieu of future benefits under the existing pension, management gratuity and pensioners' medical plans.
Contributions are made by the Company to the plan at the rate of 9% per annum of the base salary.
3.5.2 Defined benefit plans Defined benefit plans define an amount of pension or gratuity that an employee will receive on or after
retirement, usually dependent on one or more factors such as age, years of service and compensation. A defined benefit plan is a plan that is not a defined contribution plan. The liability recognised in the balance sheet in respect of defined benefit pension plans is the present value of the defined benefit obligation at the end of the reporting period less the fair value of plan assets. The defined benefit obligation is calculated annually by independent actuary using the projected unit credit method. When the calculation results in a potential asset for the Group, the recognised asset is limited to the present value of economic benefits available in the form of any future refunds from the plan or reductions in future contributions to the plan.
20 Unilever Pakistan Limited Annual Report 2014 Unilever Pakistan Limited Annual Report 2014 21

The present value of the defined benefit obligation is determined by discounting the estimated future cash outflows using interest rates of high-quality corporate bonds or the market rates on government bonds. These are denominated in the currency in which the benefits will be paid, and that have terms to maturity approximating to the terms of the related pension obligation.
The Company operates the following schemes:
i) Funded pension scheme for management employees of the Company. Contributions are made on the basis of the actuarial valuation. The latest actuarial valuation was carried out as at December 31, 2014, using the ‘Projected Unit Credit Method’.
ii) Funded gratuity scheme for management employees of the Company. Contributions are made on the basis of the actuarial valuation. The latest actuarial valuation was carried out as at December 31, 2014, using the ‘Projected Unit Credit Method’.
iii) Funded gratuity scheme for non-management employees of the Company. Contributions are made on the basis of the actuarial valuation. The latest actuarial valuation was carried out as at December 31, 2014, using the ‘Projected Unit Credit Method’.
iv) Pensioners’ medical plan, which is a book reserve plan. The plan reimburses actual medical expenses as defined in the plan.
The defined benefit plans (i), (ii) and (iv) above are available only to those management employees who joined on or before December 31, 2008 and not opted for DC Pension scheme.
The amount arising as a result of remeasurements are recognised in the Balance Sheet immediately, with a charge or credit to Other Comprehensive Income in the periods in which they occur.
Past-service costs are recognised immediately in income. The Company also provides long term service awards for staff completing specified years of service. 3.6 Stores and spares These are valued at average cost less impairment loss except for items in transit which are stated at
invoice value plus other charges incurred thereon till the balance sheet date. Cost comprises invoice value and other direct costs but excludes borrowing costs. Provision is made for obsolete / slow moving items where necessary and is recognised in the profit and loss account.
3.7 Stock in trade Stock in trade is valued at the lower of cost and net realisable value. Cost is determined using the
weighted average method except for those in transit where it represents invoice value and other charges paid thereon. Cost of work in process and finished goods include cost of raw and packing materials, direct labour and related production overheads. Net realisable value is the estimated selling price in the ordinary course of business less cost necessary to be incurred in order to make the sale. Provision is made for obsolete / slow moving stocks where necessary and recognised in the profit and loss account.
3.8 Trade and other receivables Trade and other receivables are initially recognised at fair value of consideration receivable. Debts
considered irrecoverable are written off and provision is made against those considered doubtful of recovery.
3.9 Cash and cash equivalents For the purposes of the cash flow statement, cash and cash equivalents comprise cash in hand, with
banks on current and savings accounts, deposit accounts with maturities of three months or less and short term finance.
3.10 Impairment 3.10.1 Financial assets A financial asset is assessed at each reporting date to determine whether there is any objective
evidence that it is impaired. A financial asset is considered to be impaired if objective evidence indicates that one or more events have had a negative effect on the estimated future cash flows of that asset.
The Company considers evidence of impairment for receivable and other financial assets at specific asset levels. Losses are recognised as an expense in the profit and loss account. When a subsequent event causes the amount of impairment loss to decrease, this reduction is reversed through the profit and loss account.
3.10.2 Non-financial assets The carrying amounts of non-financial assets are assessed at each reporting date to ascertain whether
there is any indication of impairment. If any such indication exists, then the asset's recoverable amount is estimated. An impairment loss is recognised as an expense in the profit and loss account for the amount by which the asset's carrying amount exceeds its recoverable amount. The recoverable amount is the higher of an asset's fair value less cost to sell and value in use. Value in use is ascertained through discounting of the estimated future cash flows using a discount rate that reflects current market assessment of the time value of money and the risk specific to the assets. For the purpose of assessing impairment, assets are grouped at the lowest levels for which there are separately identifiable cash flows (cash-generating units).
An impairment loss is reversed if there has been a change in the estimates used to determine the recoverable amount. An impairment loss is reversed only to the extent that the asset's carrying amount does not exceed the carrying amount that would have been determined, net of depreciation or amortisation, if no impairment loss had been recognised. Prior impairments of non-financial assets (other than goodwill) are reviewed for possible reversal at each reporting date.
3.11 Ijarah Ujrah payments made under Ijarah contracts are charged to the profit and loss account on a
straight-line basis over the Ijarah term.
22 Unilever Pakistan Limited Annual Report 2014 Unilever Pakistan Limited Annual Report 2014 23

3.12 Trade and other payables Liabilities for trade and other amounts payable are carried at cost which is the fair value of the
consideration to be paid in future for goods and services.
3.13 Borrowings and their cost Borrowings are recorded initially at fair value, net of transaction cost incurred. Borrowing costs are recognised as an expense in the period in which these are incurred except to the
extent of borrowing costs that are directly attributable to the acquisition, construction or production of a qualifying asset. Such borrowing costs, if any, are capitalised as part of the cost of that qualifying asset.
3.14 Provisions Provisions, if any, are recognised when the Company has a present legal or constructive obligation as
a result of past events, it is probable that an outflow of resources will be required to settle the obligation, and a reliable estimate of the amount can be made.
Restructuring cost provisions comprise staff redundancy payments, relocation and dismantling of factory, and are recognised in the period in which the Company becomes legally or constructively committed to incur.
3.15 Financial assets and liabilities All financial assets and liabilities are initially measured at cost, which is the fair value of the
consideration given and received respectively. These financial assets and liabilities are subsequently measured at fair value, amortised cost or cost, as the case may be.
3.16 Foreign currency transactions and translation Transactions denominated in foreign currencies are translated to Pakistan Rupees at the exchange
rate ruling at the date of transaction. Monetary assets and liabilities in foreign currencies at Balance Sheet date are translated into Pakistan
Rupees at exchange rates ruling on that date. Foreign exchange gains and losses resulting from the settlement of such transactions and from the translation at year-end exchange rates of monetary assets and liabilities denominated in foreign currencies are recognised in the profit and loss account.
3.17 Functional and presentation currency These financial statements are presented in Pakistan Rupees which is the functional currency of the
Company and figures are rounded off to the nearest thousands of Rupees.
3.18 Revenue recognition Revenue is recognised to the extent it is probable that the economic benefits will flow to the Company
and the revenue can be measured reliably. Revenue is measured at the fair value of the consideration received or receivable, and is recognised on the following basis:
- sale of goods is recognised when significant risks and rewards are transferred. - dividend income is recognised when the Company’s right to receive the payment is established; and - return on savings accounts and deposit accounts is recognised on time proportion basis, taking
effect of the effective interest rate.
3.19 Dividend Dividend distribution to the Company's shareholders is recognised as a liability in the period in which
the dividend is approved.
3.20 Share based payment The cost of awarding shares of group companies to employees is reflected by recording a charge in the
profit and loss account equivalent to the fair value of shares over the vesting period. The corresponding liability created is reflected in the trade and other payables.
3.21 Offsetting Monetary assets and liabilities are offset and the net amount is reported in the financial statements
only when there is a legally enforceable right to set-off the recognised amounts and the Company intends either to settle on a net basis, or to realise the assets and to settle the liabilities simultaneously.
3.22 Non-current assets held for sale Non-current assets, or disposal groups comprising assets and liabilities, are classified as
held-for-sale if it is highly probable that they will be recovered primarily through sale rather than through continuing use.
Such assets, or disposal groups, are measured at the lower of their carrying amount and fair value less cost to sell. Any impairment loss on a disposal group is allocated first to goodwill, and then to the remaining assets and liabilities on a pro-rata basis, except that no loss is allocated to inventories, financial assets, deferred tax assets, employee benefit assets or investment property, which continue to be measured in accordance with the Company’s other accounting policies. Impairment losses on initial classification as held-for-sale and subsequent gains and losses on re-measurement are recognized in profit or loss.
Once classified as held-for-sale, intangible assets and property, plant and equipment, are no longer amortised or depreciated.
24 Unilever Pakistan Limited Annual Report 2014 Unilever Pakistan Limited Annual Report 2014 25

4. CRITICAL ACCOUNTING ESTIMATES AND JUDGEMENTS
The preparation of financial statements in conformity with the approved accounting standards requires the use of certain critical accounting estimates. It also requires management to exercise its judgement in the process of applying the Company’s accounting policies. The areas involving a higher degree of judgement or complexity, or areas where assumptions and estimates are significant to the financial statements are disclosed below. The Company makes estimates and assumptions concerning the future. The resulting accounting estimates will, by definition, seldom equal the related actual results.
Estimates and judgements are continually evaluated and are based on historical experience and other factors, including expectations of future events that are believed to be reasonable under the circumstances.
i) Income taxes
In making the estimates for income taxes, the Company takes into account the current income tax law and decisions taken by appellate authorities on certain issues in the past. There may be various matters where the Company's view differs with the view taken by the income tax department at the assessment stage and where the Company considers that its view on items of a material nature is in accordance with the law. The difference between the potential and actual tax charge, if any, is disclosed as a contingent liability.
ii) Defined benefit plans
The Company has adopted certain actuarial assumptions as disclosed in note 10 to the financial statements for valuation of present value of defined benefit obligations and fair value of plan assets, based on actuarial advice.
iii) Provisions
Provisions are considered, among others, for legal matters, disputed indirect taxes, employee termination cost and restructuring where a legal or constructive obligation exists at the balance sheet date and reliable estimate can be made of the likely outcome. The nature of these costs is such that judgement is involved in estimating the timing and amount of cash flows.
Estimates and judgements are continually evaluated and are based on historical experience and other factors, including expectations of future events that are believed to be reasonable under the circumstances.
No critical judgement has been used in applying accounting policies.
5. PROPERTY, PLANT AND EQUIPMENT Operating assets - at net book value -note 5.1 Capital work in progress - at cost - note 5.2
Onfreehold
land
Buildings Plant andmachinery
Electrical,mechanicaland officeequipment
Furnitureand
fittings
Motor vehicles
LandFreehold Leasehold On
leaseholdland
TOTAL
(Rupees in thousand)
6,577,072 2,440,243
(39,831) (12,480)
(135,706) (98,185)
(862,770) 7,868,343
13,279,324
(269,434) (5,141,547) 7,868,343
6,029,015 1,457,199
(38,376)
(133,728) (737,038)
6,577,072
11,150,139
(133,728) (4,439,339) 6,577,072
68,195 -
(24,897) -
20 -
(12,051) 31,267
82,092
20 (50,845) 31,267
81,827 14
(19)
- (13,627) 68,195
125,738
- (57,543) 68,195
20 to 25
41,770 9,293
(18) (1,682)
(214) (85)
(4,928) 44,136
79,223
(2,504) (32,583) 44,136
24,237 22,780
(3)
(2,290) (2,954)
41,770
74,186
(2,290) (30,126) 41,770
7
422,276 - -
(4,586)
- -
(28,356) 389,334
524,440
(10,536) (124,570) 389,334
449,234 10,293
-
(10,536) (26,715)
422,276
828,754
(10,536) (395,942) 422,276
7 to 25
5,267,343 2,070,370
(14,896) (6,126)
(94,002) (94,308)
(787,916) 6,340,465
11,173,405
(212,267) (4,620,673) 6,340,465
4,842,935 1,252,552
(36,761)
(118,265) (673,118)
5,267,343
9,056,533
(118,265) (3,670,925) 5,267,343
7 to 33
24,546 144,324
(20) -
(41,510) (3,792) (3,903)
119,645
202,881
(41,861) (41,375) 119,645
25,177 2,105
(1,593)
(351) (792)
24,546
87,096
(351) (62,199) 24,546
2.5
727,150 216,256
- (86)
- -
(25,612) 917,708
1,191,179
(2,286) (271,185) 917,708
579,809 169,455
-
(2,286) (19,828)
727,150
951,728
(2,286) (222,292) 727,150
2.5
217 - - -
- - (4)
213
529
- (316) 213
221 - -
- (4)
217
529
- (312) 217
1.05
25,575 - - -
- - -
25,575
25,575
- -
25,575
25,575 - -
- -
25,575
25,575
- -
25,575
-
Net carrying value basis Year ended December 31, 2014 Opening net book value (NBV) Additions (at cost) Disposals (at NBV) Assets written off (at NBV)Provision for fixed assets to be written offTransfer to Held for Sale (NBV) Depreciation charge Closing net book value (NBV) Gross carrying value basisAt December 31, 2014 Cost Provision for fixed assets to be written off Accumulated depreciationNet book value (NBV) Net carrying value basisYear ended December 31, 2013Opening net book value (NBV)Additions (at cost) Disposals (at NBV) Provision for fixed assets to be written off Depreciation charge Closing net book value (NBV) Gross carrying value basisAt December 31, 2013 Cost Provision for fixed assets to be written off Accumulated depreciationNet book value (NBV) Depreciation rate % per annum
5.1 Operating assets
6,577,072 1,287,368 7,864,440
7,868,343 1,311,240 9,179,583
26 Unilever Pakistan Limited Annual Report 2014 Unilever Pakistan Limited Annual Report 2014 27
2014 2013(Rupees in thousand)

207,648 8,752
216,400 (61,134) 155,266
13,649 985,060 998,709
(2,925) 995,784
201,419 -
201,419 (60,397) 141,022
23,394 742,477 765,871
(2,925) 762,946
26,608 1,260,760 1,287,368
936,797 -
(182,742) 754,055
1,266,276 -
(512,221) 754,055
7.00
95,000
1
1
200 95,202
2,108 1,309,132 1,311,240
754,055 9,944
(107,722) 656,277
1,266,276 9,944
(619,943) 656,277
6.00
95,000
1
1
200 95,202
5.2 Capital Work in Progress – at cost Civil works Plant and machinery 6. INTANGIBLES - Computer Software Net carrying value basis Opening net book value (NBV) Additions during the year (at cost) Amortisation charge Closing net book value (NBV) Gross carrying value basis Cost Additions Accumulated amortisation Net book value (NBV) Remaining useful life in years 7. LONG TERM INVESTMENTS Investments in related parties In unquoted wholly owned subsidiary companies - at cost Lever Chemicals (Private) Limited 9,500,000 fully paid ordinary shares of Rs. 10 each Levers Associated Pakistan Trust (Private) Limited 100 fully paid ordinary shares of Rs. 10 each Sadiq (Private) Limited 100 fully paid ordinary shares of Rs. 10 each Investment available for sale - at cost Futehally Chemicals (Private) Limited 2,000 6% redeemable cumulative preference shares of Rs. 100 each
8. LONG TERM LOANS - considered good
Executives Other employees
Recoverable within one year- note 14 Long term portion
8.1 The above loans under the terms of employment have been given interest free to facilitate purchase of houses, vehicles and computers repayable in monthly installments over a period of three to five years. These loans are secured against retirement benefits of the employees.
9. LONG TERM DEPOSITS AND PREPAYMENTS Security deposits Prepaid rent - Note 9.1
Less: Provision for doubtful deposits
9.1 This includes advance rent paid for a period of five years for Head Office premises. 10. STAFF RETIREMENT BENEFITS 10.1 As stated in note 3.5.2, the Company operates four defined benefit plans (The Plans) namely approved
funded defined benefit pension scheme for management employees, approved funded defined benefit gratuity scheme for management employees, approved funded defined benefit pension scheme for non-management employees and unfunded medical scheme for members of its pension fund subject to minimum service of prescribed period in the respective trust deed. Actuarial valuation of these plans is carried out every year and the latest actuarial valuation was carried out as at December 31, 2014.
10.2 Plan assets held in trust are governed by local regulations which mainly includes Trust Act, 1882, Companies Ordinance, 1984, Income Tax Rules, 2002 and Rules under the trust deed of The Plans. Responsibility for governance of The Plans, including investment decisions and contribution schedules lies with the Board of Trustees. The Company appoints the trustees and all trustees are employees of the Company.
Note 8.1
28 Unilever Pakistan Limited Annual Report 2014 Unilever Pakistan Limited Annual Report 2014 29
2014 2013(Rupees in thousand)
2014 2013(Rupees in thousand)
2014 2013(Rupees in thousand)

10.11 Mortality was assumed to be 70% of the EFU (61-66) Table.
10.12 Principal actuarial assumptions used are as follows: Discount rate & expected return on plan assets Future salary increases Future pension increases Medical cost trend rates
12.75%10.25%
0.00%7.50%
11.00%8.50%0.90%5.75%
2014 2013 2014 2013 2014 2013 2014 2013
PensionFund
GratuityFunds
Pensioners’Medical Plan
(Rupees in thousand)
Management StaffGratuity Fund
Non - ManagementStaff Gratuity Fund
10.9 Net recognised liability / (asset) Net (asset) / liability at beginning of the year (Income) / Charge for the year Inter fund transfer Employer contributions Remeasurements recognised in Other Comprehensive Income Recognised liability / (asset) as at December 31
10.10 Plan assets comprise of following: Government bonds National Saving Certificates Shares Cash at bank Benefits due Due to DC Pension Fund Due (to) / from Company Total as at December 31
10.13 In case of the funded plans, the Company ensures that the investment positions are managed within an asset-liability matching (ALM) framework that has been developed to achieve long-term investments that are in line with the obligations under the Retirement benefit plan. Within this framework, the Company’s ALM objective is to match assets to the retirement benefit obligations by investing in long-term fixed interest securities with maturities that match the benefit payments as they fall due and in the appropriate currency. The Company actively monitors how the duration and the expected yield of the investments are matching the expected cash outflows arising from the retirement benefit plan obligations. The Company has not changed the processes used to manage its risks from previous periods. The Company does not use derivatives to manage its risk. Investments are
10.3 The latest actuarial valuation of the Fund as at December 31, 2014 was carried out using the Projected Unit Credit Method. Details of the Fund as per the actuarial valuation are as follows:
Fair value of plan assets Present value of defined benefit obligations Recognised liability / (asset)
10.5 Movement in the fair value of plan assets
Fair value as at January 1 Interest Income Remeasurement Employer contributions Transferred to DC Pension Fund Inter fund transfer Benefits paid Fair value as at December 31
10.6 Movement in the present value of defined benefit obligations
Obligation as at January 1 Current service cost Interest cost Past service cost and curtailment Transferred to DC Pension Fund Inter fund transfer Remeasurement Benefits paid Obligation as at December 31
10.7 (Income) / expense recognised in profit and loss account
Current service cost Interest (income) / cost Settlement and curtailment (Income) / expense for the year 10.8 Remeasurements recognised in Other Comprehensive Income
Experience losses / (gain) Remeasurement of fair value of plan assets Remeasurements
2014 20132014 2013 2014 2013
PensionFund
GratuityFunds
2014 2013
Pensioners’Medical Plan
(Rupees in thousand)
Management StaffGratuity Fund
Non - ManagementStaff Gratuity Fund
10.4 Balance sheet reconciliation
-
248,482 248,482
233,236 732
25,957 - - -
3,605 (15,048) 248,482
732 25,957
- 26,689
3,605
- 3,605
-
264,014 264,014
248,482 544
30,766 - - -
(1,415) (14,363) 264,014
544 30,766
- 31,310
(1,415)
- (1,415)
(57,342)
75,386 18,044
57,005 6,328 (630)
- - -
(5,361) 57,342
63,314 5,870 7,052
- - -
4,511 (5,361) 75,386
5,870 724
- 6,594
4,511
630 5,141
(58,186)
71,543 13,357
57,342 6,195 3,180 8,977
- -
(17,508) 58,186
75,386 7,192 8,496
- - -
(2,023) (17,508) 71,543
7,192 2,301
- 9,493
(2,023)
(3,180)(5,203)
96,929
27,826 124,755
17,151 (4,671) 2,666
- (110,913)
58,914 (60,076) (96,929)
179,575 6,727
14,007 -
(110,913) -
(1,494) (60,076) 27,826
6,727 18,678
- 25,405
(1,494)
(2,666) (4,160)
4,139
8,649 12,788
(96,929) (162) 203
- (18,062) 122,357 (11,546)
(4,139)
27,826 435
3,680 252
(18,062) 6,276 (212)
(11,546) 8,649
435 3,842
252 4,529
(212)
(203)(415)
(376,995)
324,926 (52,069)
1,875,133 199,788
(108,342) -
(172,882) (58,914)
(1,357,788) 376,995
1,706,321 8,711
180,375 -
(172,882) -
(39,811) (1,357,788)
324,926
8,711 (19,413)
- (10,702)
(39,811)
108,342 68,531
(133,873)
144,065 10,192
376,995 50,659
(20,842) -
(23,695) (122,357) (126,887) 133,873
324,926 400
17,507 (43,994) (23,695)
(6,276) 2,084
(126,887) 144,065
400 (33,152) (43,994) (76,746)
2,084
20,842 22,926
233,236 26,689
-(15,048)
3,605
248,482
248,482 31,310
- (14,363)
(1,415)
264,014
6,309 6,594
- -
5,141
18,044
18,044 9,493
-(8,977)
(5,203)
13,357
162,424 25,405
(58,914) -
(4,160)
124,755
35,755 23,119
6,411 11,287
- -
(18,386) 58,186
124,755 4,529
(116,081) -
(415)
12,788
- -
- 730
- -
(4,869) (4,139)
(168,812)(10,702)
58,914 -
68,531
(52,069)
(52,069) (76,746) 116,081
-
22,926
10,192
33,792 21,534
6,818 528
(1,375) -
(3,955) 57,342
- -
- 688
(1,368) (104,295)
8,046 (96,929)
- 417,742
- 738,586
(593,793) (171,132)
(14,408) 376,995
127,736 -
- 9,887
(1,537) -
(2,213) 133,873
2014 2013
30 Unilever Pakistan Limited Annual Report 2014 Unilever Pakistan Limited Annual Report 2014 31

well diversified, such that the failure of any single investment would not have a material impact on the overall level of assets. A large portion of assets in 2014 consists of government bonds and term deposits. The Company believes that government bonds offer the best return over the long term with an acceptable level of risk.
10.14 The expected return on plan assets was determined by considering the expected returns available on the assets underlying the current investment policy. Expected yields on fixed interest investments are based on gross redemption yields as at the balance sheet date. The Company's contribution to the pension and gratuity funds in 2015 is expected to amount to Rs. 18.7 million.
The actuary conducts separate valuations for calculating contribution rates and the Company contributes to the pension and gratuity funds according to the actuary's advice. Expense of the defined benefit plan is calculated by the actuary.
Figures in this note are based on the latest actuarial valuation carried out as at December 31, 2014.
10.15 Sensitivity analysis for actuarial assumptions The sensitivity of the defined benefit obligation to changes in the weighted principal assumptions is: Discount rate at December 31 Future salary increases Future pension increases If longevity increases by 1 year, obligation increases by Rs. 19.2 million. The sensitivity analysis are based on a change in an assumption while holding all other assumptions
constant. In practice, this is unlikely to occur, and changes in some of the assumptions may be correlated. When calculating the sensitivity of the defined benefit obligation to significant actuarial assumptions the same method (present value of the defined benefit obligation calculated with the Projected Unit Credit Method at the end of the reporting period) has been applied as when calculating the pension liability recognised within the balance sheet.
The effects of a 1% movement in the assumed medical cost trend rate are as follows:
Effect on the defined benefit obligations
The methods and types of assumptions used in preparing the sensitivity analysis did not change compared to the previous period.
Impact on defined benefit obligation Change in Increase in Decrease in assumption assumption assumption (Percentage) (Rupees in thousand)
1.00 (34,761) 40,403 1.00 10,238 (8,729) 1.00 6,183 (5,804)
Increase Decrease
25,280 (22,010)
10.17 The expected return on plan assets is based on the market expectations and depends upon the asset portfolio of the Fund, at the beginning of the period, for returns over the entire life of related obligation.
10.18 During the year, the Company contributed Rs. 59.83 million (2013: Rs. 64.71 million) to the provident fund and Rs. 95.36 million (2013: 82.79 million) to the DC pension fund.
10.19 The weighted average duration of the defined benefit obligation is 9.2 years. Expected maturity analysis of undiscounted retirement benefit plans:
Less than Between Between Over 5 Total a year 1-2 years 2-5 years years (Rupees in thousand)
Retirement benefit plans 74,960 44,536 143,562 254,893 517,951
11.1 The Company has charged provision of Rs. 25.3 million (2013: charge of Rs. 39.09 million) for obsolescence.
11. STORES AND SPARES Stores (including in transit Rs. 17.3 million; 2013: Rs. 21.6 million) Spares (including in transit Rs. 1.7 million; 2013: Rs. 20 million) Provision for slow moving and obsolete stores and spares
142,257
464,653 606,910
(78,699) 528,211
145,818
525,536 671,354
(104,033) 567,321
2014 2013 2012 2011 2010 (Rupees in thousand) As at December 31 Fair value of plan assets 187,920 337,408 1,949,290 1,748,191 1,691,542 Present value of defined benefit obligations (488,271) (676,620) (2,182,447) (2,247,003) (2,099,508) Deficit (300,351) (339,212) (233,157) (498,812) (407,966)
Experience adjustments (Loss) / gain on plan assets (as percentage of plan assets) (9.3) (32.0) 8.0 1.3 6.6 (Gain) / loss on obligations (as percentage of plan obligations) (0.3) (4.9) (0.9) (0.1) 0.03
10.16 Comparison for five years:
(Rupees in thousand)
32 Unilever Pakistan Limited Annual Report 2014 Unilever Pakistan Limited Annual Report 2014 33
2014 2013(Rupees in thousand)

855,771
46,486 902,257 (46,486)
855,771
Up to 3 months 3 to 6 months More than 6 months
22,427 2,132 9,737
34,296
119,816 569
- 120,385
12. STOCK IN TRADE Raw and packing materials at cost (including in transit Rs. 530 million; 2013: Rs. 421 million) Provision for obsolescence
Work in process
Finished goods (including in transit Rs. 38 million; 2013: Rs. 38 million) Provision for obsolescence
2,263,347 (109,859)
2,153,488
243,838
2,107,140 (169,157)
1,937,983 4,335,309
2,925,622 (178,911)
2,746,711
298,984
2,072,607 (106,044)
1,966,563 5,012,258
972,405
47,802 1,020,207
(47,802) 972,405
12.1 Stock in trade includes Rs. 3.23 billion (2013: Rs. 1.01 billion) held with third parties. 12.2 The above balances include items costing Rs. 73.81 million (2013: Rs. 1.32 billion) valued at net
realisable value of Rs. 13.22 million (2013: Rs. 1.04 billion). 12.3 The Company made a provision of Rs. 203.57 million for obsolescence (2013: Rs. 157.28 million) and
has written off inventory amounting to Rs. 197.63 million (2013: Rs. 81.64 million) by utilising the provision during the year.
13.1 The Company made a provision of Rs. 3.42 million (2013: Rs. 13.02 million) and has written off debts by utilising the provision amounting to Rs. 2.10 million (2013: Nil) during the year.
13. TRADE DEBTS
Considered good Considered doubtful Provision for doubtful debts - note 13.1
14. LOANS AND ADVANCES Considered good Current portion of loans to employees - note 8 Advances to: Executives - note 14.1 Suppliers and others Considered doubtful Advances to suppliers and others Provision for doubtful advances to suppliers and others
61,134
65,226 23,685
150,045
2,610 152,655
(2,610) 150,045
60,397
103,972 95,993
260,362
5,145 265,507
(5,144) 260,363
15. SHORT TERM PREPAYMENTS Trade and margin deposits Prepayments - Rent - note 9.1 - Advertisement - note 15.1 - Others
44,405
315,463 421,195 143,531 924,594
26,380
232,581 517,738 210,574 987,273
14.1 The advances to executives are given to meet business expenses and are settled as and when the expenses are incurred.
15.1 This includes media bulk discount on airing TV Commercials amounting to Rs. 387 million
(2013: Rs. 397 million).
13.2 As of December 31, 2014, trade debts of Rs. 120.39 million (2013: Rs. 34.30 million) were past due but not impaired. These relate to a number of independent customers for whom there is no recent history of default. The age analysis of these trade debts is as follows:
34 Unilever Pakistan Limited Annual Report 2014 Unilever Pakistan Limited Annual Report 2014 35
2014 2013(Rupees in thousand)
2014 2013(Rupees in thousand)
2014 2013(Rupees in thousand)
2014 2013(Rupees in thousand)

855,771
46,486 902,257 (46,486)
855,771
Up to 3 months 3 to 6 months More than 6 months
22,427 2,132 9,737
34,296
119,816 569
- 120,385
12. STOCK IN TRADE Raw and packing materials at cost (including in transit Rs. 530 million; 2013: Rs. 421 million) Provision for obsolescence
Work in process
Finished goods (including in transit Rs. 38 million; 2013: Rs. 38 million) Provision for obsolescence
2,263,347 (109,859)
2,153,488
243,838
2,107,140 (169,157)
1,937,983 4,335,309
2,925,622 (178,911)
2,746,711
298,984
2,072,607 (106,044)
1,966,563 5,012,258
972,405
47,802 1,020,207
(47,802) 972,405
12.1 Stock in trade includes Rs. 3.23 billion (2013: Rs. 1.01 billion) held with third parties. 12.2 The above balances include items costing Rs. 73.81 million (2013: Rs. 1.32 billion) valued at net
realisable value of Rs. 13.22 million (2013: Rs. 1.04 billion). 12.3 The Company made a provision of Rs. 203.57 million for obsolescence (2013: Rs. 157.28 million) and
has written off inventory amounting to Rs. 197.63 million (2013: Rs. 81.64 million) by utilising the provision during the year.
13.1 The Company made a provision of Rs. 3.42 million (2013: Rs. 13.02 million) and has written off debts by utilising the provision amounting to Rs. 2.10 million (2013: Nil) during the year.
13. TRADE DEBTS
Considered good Considered doubtful Provision for doubtful debts - note 13.1
14. LOANS AND ADVANCES Considered good Current portion of loans to employees - note 8 Advances to: Executives - note 14.1 Suppliers and others Considered doubtful Advances to suppliers and others Provision for doubtful advances to suppliers and others
61,134
65,226 23,685
150,045
2,610 152,655
(2,610) 150,045
60,397
103,972 95,993
260,362
5,145 265,507
(5,144) 260,363
15. SHORT TERM PREPAYMENTS Trade and margin deposits Prepayments - Rent - note 9.1 - Advertisement - note 15.1 - Others
44,405
315,463 421,195 143,531 924,594
26,380
232,581 517,738 210,574 987,273
14.1 The advances to executives are given to meet business expenses and are settled as and when the expenses are incurred.
15.1 This includes media bulk discount on airing TV Commercials amounting to Rs. 387 million
(2013: Rs. 397 million).
13.2 As of December 31, 2014, trade debts of Rs. 120.39 million (2013: Rs. 34.30 million) were past due but not impaired. These relate to a number of independent customers for whom there is no recent history of default. The age analysis of these trade debts is as follows:
34 Unilever Pakistan Limited Annual Report 2014 Unilever Pakistan Limited Annual Report 2014 35
2014 2013(Rupees in thousand)
2014 2013(Rupees in thousand)
2014 2013(Rupees in thousand)
2014 2013(Rupees in thousand)

16. OTHER RECEIVABLES
Receivable from related parties Defined contribution plans Defined benefit plans Associated undertakings Others Provision for doubtful receivables
- -
95,066
6,108 101,174 (13,934) 87,240
17,652 45,193 56,236
61,986 181,067 (13,934)
167,133
20. SHARE CAPITAL Authorised share capital 47,835 5% cumulative preference shares of Rs. 100 each 15,904,330 Ordinary shares of Rs. 50 each
Issued, subscribed and paid up capital
5% cumulative preference shares of Rs. 100 each Shares allotted: 43,835 for consideration paid in cash 4,000 for acquisition of an undertaking 47,835
4,783 795,217 800,000
4,383 400
4,783
4,783
795,217 800,000
4,383 400
4,783
19. CASH AND BANK BALANCES With banks on: current accounts savings accounts - note 19.1 deposit accounts - note 19.2 In hand: cash
345,980 7,491,085
-
772 7,837,837
1,161 2,564,124 1,900,000
946 4,466,231
17. TAXATION-NET Taxation - amount paid under protest Taxation - payments less provision
23,683 1,080,942 1,104,625
66,529 523,709 590,238
18. NON-CURRENT ASSETS HELD FOR SALE During the year, certain assets (plant etc.) held with third party were classified as held for sale due to
discontinuation of production. Efforts to sell the assets have started and the sale is expected to be completed within 2015. Assets were recorded at fair value less cost to sell by bringing the carrying value down by Rs. 80 million.
19.1 Mark-up on savings accounts was at the rates ranging from 6.5% to 9.2% per annum (2013: 5% to 9% per annum).
19.2 Term deposits carry mark-up ranging from 8.8% to 9.2% per annum (2013: 8.2% to 9.2% per annum).
Ordinary shares of Rs. 50 each Shares allotted: 467,704 for consideration paid in cash 4,979,208 for consideration other than cash under schemes of arrangements for amalgamations 7,846,957 as bonus shares 13,293,869
23,385
248,961 392,348 664,694 669,477
23,385
248,961 392,348 664,694 669,477
70,929 321,471 392,400
1,996,093 2,388,493
70,929 321,471 392,400
2,144,661 2,537,061
21. RESERVES Capital reserves
Arising under schemes of arrangements for amalgamations - note 21.1 Contingency - note 26.1.1 Revenue reserve Unappropriated profit
At December 31, 2014, Unilever Overseas Holdings Limited, UK, a wholly owned subsidiary of Unilever PLC, UK held 13,151,589 ordinary shares (2013: 12,990,427 ordinary shares) and 33,735 preference shares (2013: 33,735 preference shares) of Unilever Pakistan Limited.
36 Unilever Pakistan Limited Annual Report 2014 Unilever Pakistan Limited Annual Report 2014 37
2014 2013(Rupees in thousand)
2014 2013(Rupees in thousand)
2014 2013(Rupees in thousand)
2014 2013(Rupees in thousand)

(15,764) (2,350)
(60,913) (235,478)
(26,067) (655,458)
520,948
- provision for doubtful debts, advances and other receivables - provision for property, plant and equipment - provision for restructuring - provision for cess and marking fee - others
23. TRADE AND OTHER PAYABLES Creditors Bills payable - note 23.1 Accrued liabilities Dividend payable - note 23.2 Unclaimed dividend Royalty and technical services fee Advance payment from customers Sales tax payable Sindh Sales tax on services Punjab Sales tax on services Workers' Welfare Fund Workers' Profits Participation Fund - note 23.3 Security deposits from dealers - note 23.4 Liability for share-based compensation plans - note 23.5 Withholding tax payable Others
878,952 2,932,809 7,584,246 2,205,453
185,208 1,471,231
150,940 391,997 147,123
- 191,844 478,762
24,217 188,628 238,510
9,250 17,079,170
Outstanding at January 1 Awarded Vested Forfeited Outstanding at December 31
2014 2013(Number of shares)
60,474 20,781
(10,665) (2,304) 68,286
68,286 20,155
(16,723) (1,337) 70,381
The Company has treated these share-based plans as cash settled in view of obligation of the Company.
€ 28.83£ 24.36
€ 32.22£ 26.06
Share price at grant date Unilever NV Unilever PLC
22. DEFERRED TAXATION Credit balance arising in respect of: - accelerated tax depreciation allowances Debit balance arising in respect of: - provision for retirement benefits - share-based compensation - provision for stock in trade and stores and spares
1,228,602 1,228,602
(105,123) (71,467)
(16,731) (94,302) (15,254)
(272,688) (41,640)
(753,351)475,251
1,176,406 1,176,406
(112,440)(63,731)
(138,715)
21.1 This represents amounts of Rs. 18.36 million and Rs. 52.57 million that arose under schemes of arrangement for amalgamations of former Mehran International (Private) Limited, former Ambrosia International Limited and former Pakistan Industrial Promoters (Private) Limited with the Company.
23.3 Workers' Profits Participation Fund Balance as at January 1 Allocation for the year Amount (paid to) / received from the trustees Balance as at December 31
(7,280) 478,762 471,482
7,280 478,762
478,762 484,892 963,654
(479,004) 484,650
23.2 The amount represents dividend declared for the third quarter ended September 30, 2014.
23.1 Bills payable includes Rs. 2.12 billion (2013: Rs. 1.29 billion) in relation to inland letters of credit under vendor financing arrangements which includes interest cost as per Company's negotiated rates.
23.4 This represents security deposits obtained by former Pakistan Industrial Promoters (Private) Limited against freezer cabinets placed with dealers.
23.5 Share-based compensation plans As at December 31, 2014, Company had share-based compensation plans in the form of performance shares.
Performance share awards are made under the Management Co-Investment Plan (MCIP) and the Global Share Incentive Plan (GSIP). The MCIP allows Company’s eligible managers to invest up to 60% of their annual bonus in shares in Unilever NV and Unilever PLC and to receive a corresponding award of performance-related shares. Under GSIP, the Company's eligible managers receive annual awards of Unilever NV and Unilever PLC shares. The awards of both plans will vest after three years depending on the satisfaction of performance conditions.
The performance conditions of both MCIP and GSIP are underlying sales growth, operating cash flow
and underlying operating margin improvement. A summary of the status of the Performance Share Plans as at December 31, 2014 and 2013 and
changes during the years ended on these dates is presented below:
(136,146)
1,402,976 4,678,269 8,348,125 4,095,136
344,564 2,743,455
141,539 -
24,587 78,685
207,708 484,650
24,217 204,192 500,149
8,102 23,286,354
38 Unilever Pakistan Limited Annual Report 2014 Unilever Pakistan Limited Annual Report 2014 39
2014 2013(Rupees in thousand)
2014 2013(Rupees in thousand)

2014 2013(Number of shares)
831,659 1,201,388
2
6,511,496 372,543
2
23.6 Amounts due to related parties included in trade and other payables are as follows:
Ultimate parent company Associated companies Subsidiaries
24. SHORT TERM BORROWINGS Running finance under mark-up arrangements - secured The facilities for running finance available from various banks amount to Rs. 7.875 billion (2013:
Rs. 9.625 billion). The rates of mark-up range between KIBOR to KIBOR + 1% per annum (2013: KIBOR to KIBOR + 1% per annum).
The arrangements are secured by way of pari-passu charge against hypothecation of Company's
stock in trade. The facilities for opening letters of credit and guarantees as at December 31, 2014 amounted to
Rs. 17.25 billion (2013: Rs. 18.775 billion), of which the amount remaining unutilised at the year end was Rs. 9.557 billion (2013: Rs. 13.426 billion).
25. PROVISIONS Sindh Infrastructure Cess - note 25.1 & note 26.1.1 PSI marking fee - note 25.2 Restructuring - note 25.3 25.1 Sindh Infrastructure Cess Balance as at January 1 Charge for the year Reversal Payments made Balance as at December 31 25.2 PSI marking fee Balance as at January 1 Provision during the year Utilised during the year Balance as at December 31
424,695 37,250
116,142 578,087
487,564 91,643
(108,690) (45,822) 424,695
36,547 7,871
(7,168) 37,250
507,213 36,896 43,583
587,692
424,695 170,079
- (87,561) 507,213
37,250 8,801
(9,155) 36,896
25.3 Restructuring Balance as at January 1 Provision during the year Utilised during the year Balance as at December 31
90,895 204,617
(179,370) 116,142
116,142 645,071
(717,630) 43,583
26. CONTINGENCIES AND COMMITMENTS 26.1 Contingencies 26.1.1 Government of Sindh through the Finance Act, 1994 levied fee for services rendered in respect of
development and maintenance of infrastructure on the import and export of goods. However, the Company filed a constitutional petition against the levy of such fee in the High Court of Sindh and the Court granted stay for the payment of the fee. During the year 2001, the Government of Sindh introduced Cess in place of infrastructure fee with retrospective effect. As a result, Unilever's petition became infructuous and a fresh suit was filed by Unilever to challenge the levy. A stay against recovery of the aforesaid levy of Cess was also obtained from the Court. In 2003, the High Court of Sindh decided the issue against the Company. Against this order an intra court appeal was filed with the High Court of Sindh. The appeal was disposed off in August 2008, whereby the levy imposed and collected with effect from December 28, 2006 was declared valid and all imposition and collection before such date as invalid. The Court further ordered that all bank guarantees / securities furnished for transactions before December 28, 2006 stand discharged and are liable to be returned back and those furnished in respect of transactions after December 28, 2006 are liable to be encashed. The Company as well as the Government of Sindh filed appeals in the Supreme Court of Pakistan against the said order. The appeals were heard by the Supreme Court in May 2011, and it was noted that the Government of Sindh had again enacted Infrastructure Fee through Act of 2009 with retrospective effect which had not been challenged in the last appeals. Accordingly, the Supreme Court allowed the petitioners to file fresh petitions at the High Court of Sindh. Accordingly, fresh petition was filed by the Company in the High Court of Sindh in May 2011. A provision amounting to Rs. 995.26 million concerning the levy with respect from December 28, 2006 has been recognised in the financial statements. Moreover, the Company has paid an amount of Rs. 488.061 million under protest against the said order.
As a matter of prudence, a total of Rs. 321.47 million as at December 31, 2014 (2013: Rs. 321.47 million) out
of the revenue reserves has been earmarked as contingency reserve for the levy uptill December 2006.
26.1.2 The Deputy Commissioner Inland Revenue while passing amended assessment orders for tax years 2006 through 2012 and has disallowed certain claimed expenditures resulting in exposure of Rs. 546 million.
The management has contested these matters at various appellate forums and believes that the ultimate
decision will be in favour of the Company.
40 Unilever Pakistan Limited Annual Report 2014 Unilever Pakistan Limited Annual Report 2014 41
2014 2013(Rupees in thousand)
2014 2013(Rupees in thousand)

26.2 Commitments 26.2.1 Aggregate commitments outstanding for capital expenditures as at December 31, 2014 amounted to
Rs. 996.36 million (2013: Rs. 567.76 million). 26.2.2 Commitments for rentals under operating lease agreements / Ijarah contracts as at December 31, 2014
are as follows:
28. COST OF SALES
Raw and packing materials consumed Manufacturing charges paid to third parties Stores and spares consumed Staff costs - note 28.1 Provision for restructuring Provision of fixed assets to be written off Utilities Depreciation Repairs and maintenance Rent, rates and taxes Ujrah payments Amortisation of computer software Travelling and entertainment Stationery and office expenses Expenses on information technology Other expenses Charges by related party Opening work in process
Closing work in process Cost of goods manufactured Opening stock of finished goods Closing stock of finished goods
29,799,596 1,067,775
171,715 2,007,195
106,586 120,444 767,652 683,671 303,146
27,334 17,180 98,316 51,866 45,400
3,148 71,259
6,587 35,348,870
321,999 35,670,869
(243,838) 35,427,031
2,624,490 (1,937,983) 36,113,538
32,749,454 1,240,919
231,592 2,216,384
619,488 237,039 754,362 819,496 213,272
24,994 16,500 57,955 53,179 47,568
3,000 66,717 12,685
39,364,604 243,838
39,608,442 (298,984)
39,309,458 1,937,983
(1,966,563) 39,280,878
28.1 Staff costs Salaries and wages Medical Pension costs - defined benefit plan Gratuity costs - defined benefit plan Pensioners' medical plan Provident fund cost - defined contribution plan Pension fund cost - defined contribution plan
1,938,386 33,581 (2,109) 10,099
5,268 5,908
16,062 2,007,195
2,154,411 39,883
(15,124) 4,425 6,180 9,540
17,069 2,216,384
42 Unilever Pakistan Limited Annual Report 2014 Unilever Pakistan Limited Annual Report 2014 43
Not later than one year Over one year to five years
174,746 334,347 509,093
150,454 270,231 420,685
27. SALES Gross sales Sales tax Rebates and allowances
87,181,381 (13,289,085) 73,892,296 (8,187,390) 65,704,906
79,582,887 (11,837,364) 67,745,523 (7,210,203) 60,535,320
Sales to domestic customers in Pakistan are 99.60% (2013: 99.63%) and to customers outside Pakistan are 0.40% (2013: 0.37%) of the revenue during the year.
The Company's customer base is diverse with no single customer accounting for more than 10% of net
revenue.
2014 2013(Rupees in thousand)
2014 2013(Rupees in thousand)

29. DISTRIBUTION COSTS Staff costs - note 29.1 Provision for restructuring Advertisement and sales promotion Outward freight and handling Royalty and technical fee Utilities Depreciation Repairs and maintenance Rent, rates and taxes Ujrah payments Amortisation of computer software Travelling and entertainment Stationery and office expenses Expenses on information technology Provision for doubtful debts - trade Other expenses Charges by related party
29.1 Staff costs Salaries and wages Medical Share based compensation Pension costs - defined benefit plan Gratuity costs - defined benefit plan Pensioners' medical plan Provident fund cost - defined contribution plan Pension fund cost - defined contribution plan
1,091,619 61,924
6,275,106 1,860,566 2,743,899
57,170 26,347 33,123 98,068 80,515 39,655
109,319 46,586
106 13,022
122,966 12,503
12,672,494
906,793 114
77,359 (5,754) 14,668 14,348 39,391 44,700
1,091,619
1,153,319 25,583
7,974,431 1,864,895 2,985,362
57,110 18,765 40,062 94,782 68,353 23,376
119,453 45,959
24 3,415
113,061 12,358
14,600,308
986,439 16,658 77,519
(41,264) 6,427
16,832 34,379 56,329
1,153,319
30. ADMINISTRATIVE EXPENSES Staff costs - note 30.1 Provision for restructuring Provision of fixed assets to be written off Utilities Depreciation Repairs and maintenance Rent, rates and taxes Ujrah payments Amortisation of computer software Travelling and entertainment Stationery and office expenses Expenses on information technology Legal, professional and other consultancy charges Auditors' remuneration - note 30.2 Other expenses Charges by related party
30.1 Staff costs Salaries and wages Medical Share based compensation Pension costs - defined benefit plan Gratuity costs - defined benefit plan Pensioners' medical plan Provident fund cost - defined contribution plan Pension fund cost - defined contribution plan
691,975 36,107 13,284 55,102 27,020 27,766
225,710 70,244 44,771 61,782 79,770
670,524 137,335
13,151 100,970
2,611 2,258,122
558,424 42,504 38,136 (2,839) 7,232 7,073
19,414 22,031
691,975
702,641 - -
56,467 24,509 25,316
226,967 63,611 26,392 49,160 58,115
661,967 60,315
4,832 90,637
2,643 2,053,572
603,689 31,754 38,215
(20,358) 3,169 8,298
15,910 21,964
702,641
30.2 Auditors' remuneration Audit fee Taxation services Limited review, consolidation, pension, provident and gratuity funds and other certifications Out of pocket expenses
4,350 3,650
3,575 1,576
13,151
4,367 -
155 310
4,832
44 Unilever Pakistan Limited Annual Report 2014 Unilever Pakistan Limited Annual Report 2014 45
2014 2013(Rupees in thousand)
2014 2013(Rupees in thousand)
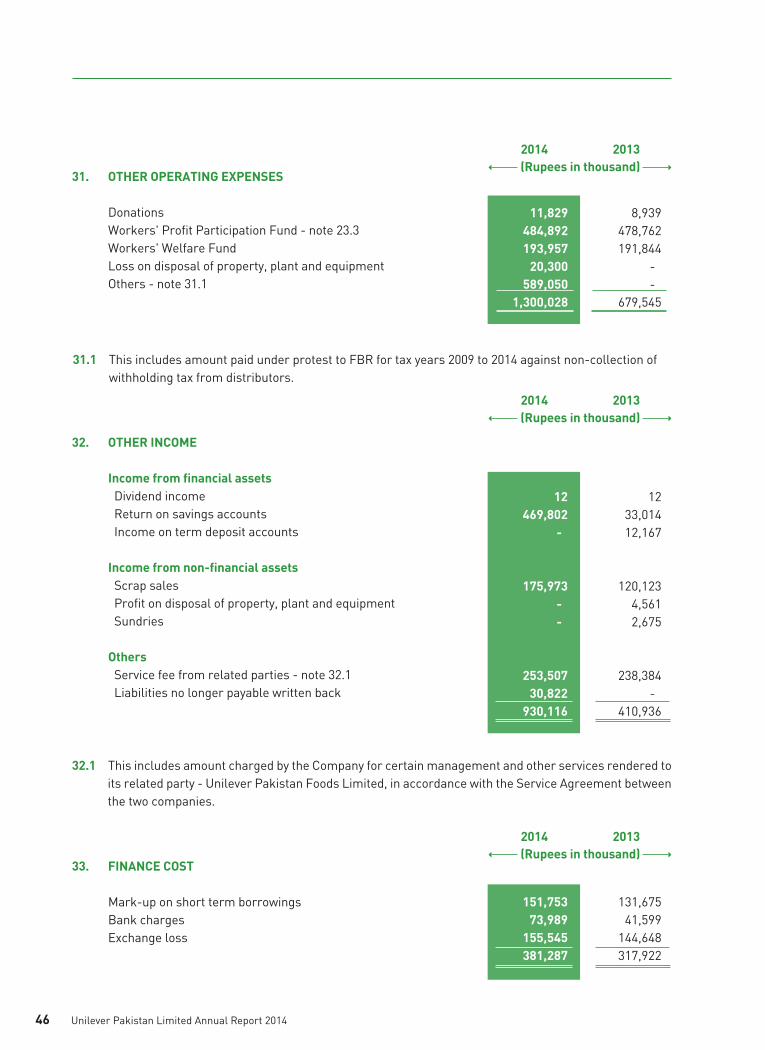
31. OTHER OPERATING EXPENSES Donations Workers' Profit Participation Fund - note 23.3 Workers' Welfare Fund Loss on disposal of property, plant and equipment Others - note 31.1
11,829 484,892 193,957
20,300 589,050
1,300,028
8,939 478,762 191,844
- -
679,545
34. TAXATION Current - for the year Pakistan Azad Kashmir Deferred tax - credit
2,715,984 52,122
2,768,106 (51,258)
2,716,848
2,885,258 48,405
2,933,663 (145,762)
2,787,901
34.1 Relationship between tax expense and accounting profit Accounting profit before tax Tax at the applicable tax rate of 33% (2013: 34%) Tax effect of credits Tax effect of final tax Effect of tax rate change Others Tax expense for the year
9,018,949
2,976,253 (198,452) (234,971)
15,322 158,696
2,716,848
8,904,635
3,027,576 (203,717)
(48,091) (19,759) 31,892
2,787,901
35. CASH AND CASH EQUIVALENTS Cash and bank balances - note 19 Short term borrowings - running finance under mark-up arrangement - note 24
7,837,837
- 7,837,837
4,466,231
(375,401) 4,090,830
36. RELATED PARTY TRANSACTIONS
The related parties comprise of the holding company, its group companies, directors and their close family members, associated undertakings, key management personnel and retirement benefit funds.
The Company in the normal course of business carries out transactions with various related parties. Details of transactions with related parties, other than those which have been specifically disclosed elsewhere are as follows:
46 Unilever Pakistan Limited Annual Report 2014 Unilever Pakistan Limited Annual Report 2014 47
2014 2013(Rupees in thousand)
2014 2013(Rupees in thousand)
32. OTHER INCOME Income from financial assets Dividend income Return on savings accounts Income on term deposit accounts Income from non-financial assets Scrap sales Profit on disposal of property, plant and equipment Sundries Others Service fee from related parties - note 32.1 Liabilities no longer payable written back
12 33,014 12,167
120,123 4,561 2,675
238,384 -
410,936
12 469,802
-
175,973 - -
253,507 30,822
930,116
32.1 This includes amount charged by the Company for certain management and other services rendered to its related party - Unilever Pakistan Foods Limited, in accordance with the Service Agreement between the two companies.
33. FINANCE COST Mark-up on short term borrowings Bank charges Exchange loss
131,675 41,599
144,648 317,922
151,753 73,989
155,545 381,287
2014 2013(Rupees in thousand)
2014 2013(Rupees in thousand)
31.1 This includes amount paid under protest to FBR for tax years 2009 to 2014 against non-collection of withholding tax from distributors.
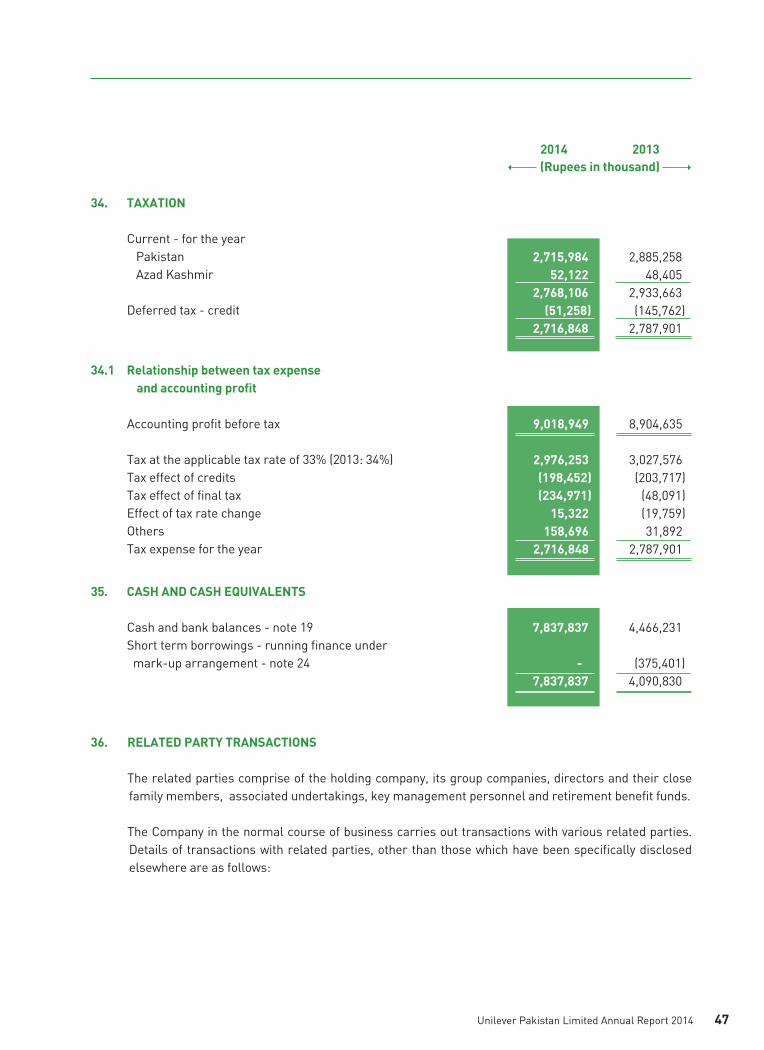

In addition to this, a lump sum amount of Rs. 191.72 million (2013: Rs. 203.81 million) on account of variable pay has been accounted for in the financial statements for the current year payable in 2015 after verification of target achievement.
Out of the variable pay recognised for 2013 and 2012 following payments were made:
37.1 Retirement benefits represent amount contributed towards various retirement benefit plans. The executive directors and chief executive of the Company are provided with free use of cars and
household equipments.
Managerial remuneration and allowances Share based compensation Retirement benefits - note 37.1 Medical expenses Other expenses Number of persons
40,596 52,049 3,286
307 -
96,238 1
53,003 33,641
4,666 2,831
- 94,141
1
60,209 29,668 6,720
240 22,033
118,870 7
39,135 19,781 6,087
261 13,692 78,956
5
CHIEF EXECUTIVEEXECUTIVE DIRECTORS2014 2013 2014 2013
(Rupees in thousand)
Executive Directors Chief Executive Executives Other employees
Paid in 2013relating to
2012
Paid in 2014relating to
2013(Rupees in thousand)
19,108 17,306
186,625 3,017
226,056
8,373 5,913
137,417 795
152,498
Actual Production2014 2013
Annual Capacity2014 2013
Metric Tons
Million Litres
53,150 27,134
34.3
165,582 32,325
37.8
70,584 52,686
78.0
198,000 50,979
60.0
38. CAPACITY
Own manufacture Home and Personal Care Beverages
Ice Cream
The current capacity was under utilised on account of lower demand.
Royalty and Technical fee paid during the year is based on the agreements duly acknowledged by the State Bank of Pakistan. The purchase of goods and services from related parties are made on agreed terms and conditions.
The Company has entered into agreements with its associate, Unilever Pakistan Foods Limited to
share various administrative and other resources. The charges by and service fee from the associate have been disclosed in notes 28, 29, 30 and 32.
The related party status of outstanding balances as at December 31, 2014 is included in other
receivables and trade and other payables respectively. These are settled in the ordinary course of business.
Arrangements with parent company and an associated company for granting of their shares to
employees of Unilever Pakistan Limited are disclosed in note 23.5.
37. REMUNERATION OF EXECUTIVE DIRECTORS AND CHIEF EXECUTIVE The aggregate amounts charged in the financial statements of the year for remuneration including all
benefits to directors and chief executive of the Company are as follows:
i. Ultimate parent company Royalty and technical fee ii. Associated companies Purchase of goods Sale of goods Fee for providing of services to related party Fee for receiving of services from related party Contribution to : - Defined Contribution plans - Defined Benefit plans Settlement on behalf of: - Defined Contribution plans - Defined Benefit plans iii. Key management personnel Salaries and other short-term employee benefits Post-employment benefits
Relationship with the Company
Nature of transactions
2,233,189
9,963,612 4,105
238,384
21,701
147,506 -
119,826 842,324
296,590 10,779
3,088,896
12,437,602 -
825,153
33,170
155,191 8,977
56,088 50,629
118,649 8,458
48 Unilever Pakistan Limited Annual Report 2014 Unilever Pakistan Limited Annual Report 2014 49
2014 2013(Rupees in thousand)

1,245,746 1,146,477
92.03%
1,124,535 1,056,142
93.92%
21.0862.480.00
15.990.45
100.00
22.6662.400.00
14.470.47
100.00
2014 2013(Percentage)
222,629 659,832
- 168,837
4,844 1,056,142
273,586 694,159
- 172,939
5,793 1,146,477
39. PROVIDENT FUND RELATED DISCLOSURE The following information is based on un-audited financial statements of the Fund as at December
31, 2014:
Size of the Fund - Total Assets Fair value of investments
Percentage of investments made
39.1 The cost of above investments amounted to Rs. 1.068 billion (2013: Rs. 984.69 million).
39.2 The break-up of fair value of investments is as follows:
National Savings Schemes Government Securities Debts Securities Equity Securities Unit Trust Schemes
39.3 The investments out of provident fund have been made in accordance with the provision of section 227 of the Companies Ordinance, 1984 and the rules formulated for this purpose.
40. NUMBER OF EMPLOYEES Number of employees including contractual employees at year end Average number of employees
1,768
1,829
1,854
1,890
2014 2013
41. FINANCIAL RISK MANAGEMENT OBJECTIVES AND POLICIES
41.1 Financial risk factors The Company's activities expose it to variety of financial risks: market risk (including currency risk and
interest rate risk), credit risk and liquidity risk. The company's overall risk management programme focuses on having cost effective funding as well as manage financial risk to minimise earnings volatility and provide maximum return to shareholders.
FINANCIAL ASSETS
Loans and advances to employeesDepositsTrade debtsAccrued mark upOther receivablesCash and bank balances Long term investment at cost December 31, 2014December 31, 2013 FINANCIAL LIABILITIES At amortised costTrade and other payables December 31, 2014December 31, 2013 ON BALANCE SHEET GAP December 31, 2014 December 31, 2013 OFF BALANCE SHEET ITEMS Open Letters of credit and guarantees December 31, 2014 December 31, 2013
41.2 Financial assets and liabilities by category and their respective maturities
201,419 67,799
972,405 88,736 87,240
7,837,837
95,202
9,350,638 5,844,622
21,849,036
21,849,036 15,856,346
(12,498,398) (10,011,724)
7,692,575 5,348,917
201,419 67,799
972,405 88,736 87,240
346,752
95,202
1,859,553 1,380,498
19,724,063
19,724,063 14,194,903
(17,864,510) (12,814,405)
141,022 23,394
- - - -
95,202
259,618 261,192
-
- -
259,618 261,192
60,397 44,405
972,405 88,736 87,240
346,752
-
1,599,935 1,119,306
19,724,063
19,724,063 14,194,903
(18,124,128) (13,075,597)
- - - - -
7,491,085
-
7,491,085 4,464,124
2,124,973
2,124,973 1,661,443
5,366,112 2,802,681
- - - - - -
-
- -
-
- -
- -
- - - - -
7,491,085
-
7,491,085 4,464,124
2,124,973
2,124,973 1,661,443
5,366,112 2,802,681
Non-interest bearing TotalInterest bearing
(Rupees in thousand)
Maturityup to one
year
Maturityafter one
year
Sub-total Maturityup to one
year
Maturityafter one
year
Sub-total
The carrying values of all financial assets and liabilities reflected in the financial statements approximate their fair values.
(i) Credit risk Credit risk represents the accounting loss that would be recognised at the reporting date if counter
parties failed to perform as contracted. The maximum exposure to credit risk is equal to the carrying amount of financial assets. Out of the total financial assets of Rs. 9.35 billion (2013: Rs. 5.8 billion) the financial assets that are subject to credit risk amounted to Rs. 1.17 billion.
50 Unilever Pakistan Limited Annual Report 2014 Unilever Pakistan Limited Annual Report 2014 51
2014 2013(Rupees in thousand)
2014 2013(Rupees in thousand)

For trade debts, internal risk assessment process determines the credit quality of the customers, taking into account their financial positions, past experiences and other factors. Individual risk limits are set based on internal or external credit worthiness ratings in accordance with limits set by the management. As of December 31, 2014 trade debts of Rs. 120.39 million (2013: Rs. 34.30 million) were past due but not impaired. The carrying amount of trade debts relates to a number of independent customers for whom there is no recent history of default.
Deposits have been placed mainly against shipping guarantees and letters of credit hence exposed to no significant credit risk.
Loans and advances to employees are not exposed to any material credit risk.
Other receivables constitute mainly receivables from the related parties, therefore, are not exposed to any significant credit risk.
The bank balances represent low credit risk as they are placed with banks having good credit ratings assigned by credit rating agencies.
Accrued interest represent interest on deposit accounts and has low credit risk as they are placed with banks having good credit ratings assigned by credit rating agencies.
The management does not expect any losses from non-performance by these counterparties.
Management believes that it is not exposed to significant credit risk.
(ii) Liquidity risk
Liquidity risk is the risk that the Company will not be able to meet its financial obligations as they fall due. The Company’s approach to managing liquidity risk is to ensure, as far as possible, that it will always have sufficient liquidity to meet its liabilities when due, under both normal and stressed conditions, without incurring unacceptable losses or risking damage to the Company’s reputation.
The Company manages liquidity risk by maintaining sufficient cash and bank balances and the availability of financing through banking arrangements.
(iii) Market risk
Market risk is the risk that changes in foreign exchange rate and interest rates will effect the Company's income or value of its holding in financial instruments. The objective of market risk management is to manage and control market risk exposures within acceptable parameters, while optimizing returns.
a) Foreign exchange risk
Foreign exchange risk arises mainly where receivables and payables exist in foreign currency. As at December 31, 2014, financial assets of Rs. 68.54 million (2013: Rs. 133.64 million) and financial liabilities of Rs. 3.93 billion (2013: Rs. 1.75 billion) were in foreign currency which were exposed to foreign currency risk.
The foreign currency assets are approx 29% in Euro 71% in USD. The foreign currency liabilities are approx 77% in USD and 19% in EURO.
As at December 31, 2014, if the Pakistan Rupee had weakened / strengthened by 6% against US Dollar with all other variables held constant, profit before tax for the year would have been
lower / higher by Rs. 179.37 million (2013: Rs. 70.14 million), mainly as a result of foreign exchange losses / gains on translation of US Dollar denominated financial assets and liabilities.
As at December 31, 2014, if the Pakistan Rupee had weakened / strengthened by 6% against Euro with all other variables held constant, profit before tax for the year would have been lower / higher by Rs. 43.97 million (2013: Rs. 22.52 million), mainly as a result of foreign exchange losses / gains on translation of Euro denominated financial assets and liabilities.
As at December 31, 2014, if the Pakistan Rupee had weakened / strengthened by 6% against Pound Sterling with all other variables held constant, profit before tax for the year would have been lower / higher by Rs. 5.37 million (2013: Rs. 6.79 million), mainly as a result of foreign exchange losses / gains on translation of Pound Sterling denominated financial assets and liabilities.
The sensitivity of foreign exchange rate looks at the outstanding foreign exchange balances of the company only as at the balance sheet date and assumes this is the position for a full twelve-month period.
b) Interest rate risk
Interest rate risk arises due to changes in market interest rates that results in fluctuation in fair value or future cash flows of a financial instrument. Borrowings obtained at variable rates expose the Company to cash flow interest rate risk.
At December 31, 2014, the Company had variable interest bearing financial assets of Rs. 7.49 billion (2013: Rs. 4.46 billion) and financial liabilities of Rs. 2.12 billion (2013: Rs. 1.66 billion), and had the interest rate varied by 200 basis points with all the other variables held constant, profit before tax for the year would have been approximately Rs. 107.32 million (2013: Rs. 56.05 million) lower / higher, mainly as a result of higher / lower interest expense on floating rate borrowings.
42. CAPITAL RISK MANAGEMENT
The Company's objectives when managing capital are to safeguard the Company's ability to continue as a going concern in order to provide returns for shareholders and benefit for other stakeholders and to maintain an optimal capital structure to reduce the cost of capital.
The gearing ratio as at December 31, 2014 and 2013 were as follows:
52 Unilever Pakistan Limited Annual Report 2014 Unilever Pakistan Limited Annual Report 2014 53
Total Borrowings Cash and Bank Net (cash surplus) / debt
Total Equity
Total Capital Gearing Ratio
- (7,837,837) (7,837,837)
3,206,538
3,206,538
-
375,401 (4,466,231) (4,090,830)
3,057,970
3,057,970
-
2014 2013(Rupees in thousand)

Notice of Annual General Meeting
Notice is hereby given that the 66th Annual General Meeting of Unilever Pakistan Limited will be held at The Institute of Chartered Accountants of Pakistan, Chartered Accountants Avenue, Clifton Block 8, Karachi, on Tuesday, April 14, 2015, at 11:00 a.m. to transact the following business:
Ordinary Business
1. To receive, consider and adopt the Company’s Financial Statements for the year ended December 31, 2014, together with the Reports of the Auditors and Directors thereon.
2. To approve and declare dividend (2014) on the Ordinary Shares of the Company. The Directors have recommended a final cash dividend of 254.56% (or Rs.127.28 per share) on the
Ordinary Shares. Together with the Interim dividend of 692% (or Rs. 346.00 per ordinary share), already paid, the total dividend for 2014 will thus amount to 946.56% (or Rs. 473.28 per ordinary share).
3. To appoint Auditors for the ensuing year, and to fix their remuneration. Messrs KPMG Taseer Hadi & Co., Chartered Accountants, retire and being eligible have offered
themselves for re-appointment.
Notes:
1. Share Transfer Books will be closed from April 08, 2015 to April 14, 2015 (both days inclusive) when no transfer of shares will be accepted for registration. Transfers in good order, received at the office of Company’s Share Registrar M/s THK Associates (Private) Limited, 2nd Floor, State Life Building-3, Dr. Ziauddin Ahmed Road, Karachi-75530 by the close of the Business on April 07, 2015 will be treated in time for the purpose of payment of Final Dividend to the transferees.
2. All Members/Shareholders (whether holding Preference or Ordinary Shares) are entitled to attend and vote at the Meeting. A Member may appoint a proxy who need not be a Member of the Company.
3. Duly completed instrument of proxy, and the other authority under which it is signed, or a notarially certified copy thereof, must be lodged with the Company Secretary at the Company’s Registered Office (1st Floor, Avari Plaza, Fatima Jinnah Road, Karachi) at least 48 hours before the time of the Meeting.
4. CDC Account Holders will further have to follow the under-mentioned guidelines as laid down by the Securities and Exchange Commission of Pakistan:
Karachi March 20, 2015
By Order of the Board
Amar NaseerCompany Secretary
54 Unilever Pakistan Limited Annual Report 2014 Unilever Pakistan Limited Annual Report 2014 55
The Company finances its operations through equity, borrowings and management of working capital with a view to maintaining an appropriate mix between various sources of finance.
43. MONOPOLY CONTROL AUTHORITY ORDER
The Order of the Monopoly Control Authority (MCA) dated December 19, 2006, terminating the non-competition agreement and requiring the company to refund the amount of Rs. 250 million to Dalda Foods (Private) Limited (DFL) was appealed by Company before the High Court of Sindh; which appeal was admitted and the operation of MCA's order was stayed. At present, the appeal is pending for hearing.
The management, based on legal advice, is of the view that the agreement between the company and DFL was not in violation of Monopolies and Restrictive Trade Practices Ordinance 1970.
44. PROPOSED AND DECLARED DIVIDENDS
On 5% cumulative preference shares
At the Board meeting held on March 6, 2015, dividend in respect of 2014 of Rs. 239 thousand has been declared (2013: Rs. 239 thousand).
On ordinary shares
At the Board meeting held on March 6, 2015, a final dividend in respect of 2014 of Rs. 127.28 per share amounting to a total dividend of Rs. 1.69 billion is proposed (2013: Rs. 116.09 per share amounting to a total dividend of Rs. 1.54 billion). The Board of Directors in its meeting held on November 26, 2014 declared cash dividend in respect of quarter ended September 30, 2014 of Rs. 346 per share amounting to Rs. 4.6 billion (Interim cash dividend for the three months period ended March 31, 2013: Rs. 51.24 per share amounting to Rs. 681.18 million, six months period ended June 30, 2013: Rs. 123.25 per share amounting to Rs. 1.64 billion and nine months period ended September 30, 2013: Rs. 165.90 per share amounting to Rs. 2.2 billion).
These financial statements do not reflect the proposed final dividend on ordinary shares and the dividend declared on cumulative preference shares as payable, which will be accounted for in the statement of changes in equity as an appropriation from the unappropriated profit in the year ending December 31, 2015.
45. DATE OF AUTHORISATION
These financial statements were authorised for issue on March 6, 2015, by the Board of Directors of the Company.
46. GENERAL
For the purpose of better presentation, withholding tax payable amounting to Rs. 238 million has been reclassified from taxation – net to trade and other payables.
Ehsan A. Malik Ali Tariq Chairman and Chief Executive Director and Chief Financial Officer

Notice of Annual General Meeting Notice of Annual General Meeting
A. For Attending the Meeting:
i) In case of individuals, the account holder or sub-account holder and / or the person whose securities are in group account and their registration details are uploaded as per the Regulations, shall authenticate his / her identity by showing his / her original valid Computerized National Identity Card (CNIC) or original passport at the time of attending the Meeting.
ii) In case of corporate entity, the Board of Directors’ resolution/power of attorney with specimen signature of the nominee shall be produced (unless it has been provided earlier) at the time of the Meeting.
B. For Appointing Proxies:
i) In case of individuals, the account holder or sub-account holder and / or the person whose securities are in group account and their registration details are uploaded as per the Regulations, shall submit the proxy form accordingly.
ii) The proxy form shall be witnessed by two persons whose names, addresses and CNIC numbers shall be mentioned on the form.
iii) Attested copies of valid CNIC or the passport of the beneficial owners and the proxy shall be furnished with the proxy form.
iv) The proxy shall produce his / her original valid CNIC or original passport at the time of Meeting.
v) In case of corporate entity, the Board of Directors’ resolution / power of attorney with specimen signature of the person nominated to represent and vote on behalf of the corporate entity, shall be submitted along with proxy form to the Company.
5. The Individual Members who have not yet submitted photocopy of their valid Computerized National Identity Card (CNIC) to the Company / Share Registrar, are once again reminded to send the same at the earliest directly to Company’s Share Registrar, M/s THK Associates (Private) Limited, 2nd Floor, State Life Building-3, Dr. Ziauddin Ahmed Road, Karachi-75530. The Corporate Entities are requested to provide their National Tax Number (NTN).
Please give Folio Number with the copy of CNIC / NTN details. The Shareholders who hold shares with Participants / Stock Brokers or with Central Depository Company may approach to provide the CNIC number / NTN details to their Participants / Stock Broker or to CDC to update the details in their electronic system. Reference is also made to the Securities and Exchange Commission of Pakistan (SECP) Notifications SRO 779 (I) dated August 18, 2011, and SRO 831 (I) 2012 dated July 05, 2012, which mandates that the dividend warrants should bear CNIC number of the registered member or the authorized person, except in case of minor(s) and corporate members. In case of non-receipt of the copy of a valid CNIC, the Company would be unable to comply with the said SROs of SECP and therefore will be constrained under Section 251 (2) (a) of the Companies Ordinance 1984 to withhold dividend warrants of such Shareholders.
6. (i) The Government of Pakistan through Finance Act, 2014 has made certain amendments in Section 150 of the Income Tax Ordinance 2001 whereby different rates are prescribed for deduction of withholding tax on the amount of dividend paid by the Companies. These rates are as under:
(a) For Filers of Income Tax Return 10% (b) For Non-Filers of Income Tax Return 15%
To enable the Company to make tax deduction on the amount of cash dividend @ 10% instead of 15% all the shareholders whose names are not entered into the Active Tax-payers List (ATL) provided on the website of FBR, despite the fact that they are filers, are advised to make sure that their names are entered into ATL before the date for payment of the cash dividend i.e. May 08, 2015, otherwise tax on their cash dividend will be deducted @ 15% instead of 10%.
(ii) For any query / problem / information, the investor may contact the Share Registrar: Mr. Nauman Saeed Khan, Assistant Manager, telephone number: 111-000-322 (123), e-mail address: [email protected] or Mr. Masood Ahmed, Manager, telephone number: 111-000-322 (124) or +92-21-35682241, e-mail address: [email protected]; and / or the Company: Ms. Wajiha Khan, telephone number: +92-21-35660062, e-mail address: [email protected].
(iii) The corporate shareholders having CDC accounts are required to have their National Tax Number (NTN) updated with their respective participants, whereas corporate physical shareholder should send a copy of their NTN certificate to the company or its Share Registrar M/s THK Associates (Private) Limited. The Shareholders while sending NTN or NTN certificates, as the case may be, must quote Company name and their respective folio numbers.
According to clarification received from Federal Board of Revenue (FBR), withholding tax will be determined separately on ‘Filer/Non-Filer’ status of Principal Shareholder as well as Joint-Holder(s) based on their shareholding proportions, in case of joint holding / joint account. In this regard, all shareholders who hold shares with joint shareholders, are requested to provide shareholding proportions of Principal Shareholder and Joint-Holder(s) in respect of shares held by them, to our Share Registrar, M/s THK Associates (Private) Limited, 2nd Floor, State Life Building-3, Dr. Ziauddin Ahmed Road, Karachi-75530, in writing, otherwise it will be assumed that the shares are equally held by Principal Shareholder and Joint-Holder(s).
7. According to the SECP circular No. 8(4) SM/CDC 2008 of April 05, 2013, Shareholders are entitled to receive their cash dividend directly in their bank accounts instead of receiving the dividend warrants physically. Shareholders having physical holding and desiring to avail this option may submit the prescribed Dividend Mandate Form, to the Company’s Share Registrar. The Shareholders who hold shares with participants / stock brokers or with Central Depository Company may approach to submit the prescribed Dividend Mandate details to their participants / stock broker or to CDC for this option, with a copy of the Dividend Mandate Form to Share Registrar of the Company.
8. Any change of address of Members should be immediately notified to the Company’s Share Registrars, M/s THK Associates (Private) Limited, 2nd Floor, State Life Building-3, Dr. Ziauddin Ahmed Road, Karachi-75530.
56 Unilever Pakistan Limited Annual Report 2014 Unilever Pakistan Limited Annual Report 2014 57

Dividend Mandate Form
I / We, Mr. / Ms. / Mrs. / M/s, _________________________________________________ , holding CNIC No. / Passport No. / NTN __________________________________________________ and being the registered shareholder of Unilever Pakistan Limited hereby authorize the Company to directly credit in my bank account cash dividend, if any declared by the Company in future, instead of issuance of dividend warrant. Following are my details to facilitate the aforementioned request:
SHAREHOLDER’S INFORMATION & BANK DETAILS
Name of Shareholder
Folio No.
CNIC No. / NTN / Passport No. (please attach an attested photocopy)
Title of Bank Account
Bank Account Number (COMPLETE)
Bank’s Name
Bank’s Branch Name
Branch Code
Address of Bank Branch
Telephone Number (Landline)
Mobile Number
It is stated that the above-mentioned information is correct and that I will intimate the changes in the above-mentioned information to the company and its share registrar as soon as these occur.
Signature of Member: ________________________
Name: ____________________________________ (PLEASE WRITE NAME IN BLOCK LETTERS)
THK ASSOCIATES (PVT) LIMITED2ND FLOOR, STATE LIFE BUILDING-3,DR. ZIAUDDIN AHMED ROAD,KARACHI – 75530.
Date: ____ / ____ / ____
Unilever Pakistan Limited Annual Report 2014 59

Form for Deduction of Tax on Dividend Income
Please further note that under Section 150 of the Income Tax Ordinance, 2001 and pursuant to Finance Act 2014 withholding tax on dividend income will be deducted for 'Filer' and 'Non-Filer' shareholders @ 10% and 15% respectively. According to clarification received from Federal Board of Revenue (FBR) withholding tax will be determined separately on 'Filer / Non-Filer' status of Principal shareholder as well as Joint-Holder(s) based on their shareholding proportions, in case of joint accounts. In this regard, all shareholders who hold shares with joint shareholders, are requested to provide shareholding proportions of Principal shareholder and Joint-Holder(s) in respect of shares held by them to our Share Registrar, THK Associates (Private) Limited, 2nd Floor, State Life Building-3, Dr. Ziauddin Ahmed Road, Karachi-75530, in writing.
Following are the details held by Principal / Joint-Holder of the shares of Unilever Pakistan Limited
It is stated that the above-mentioned information is correct and that I will intimate the changes in the above-mentioned information to the company and its share registrar as soon as these occur.
Signature of Member: ________________________
Name: ____________________________________ (PLEASE WRITE NAME IN BLOCK LETTERS)
Signature of Joint-Holder 1: Signature of Joint-Holder 2:
Name: ________________________ Name: ________________________(PLEASE WRITE NAME IN BLOCK LETTERS) (PLEASE WRITE NAME IN BLOCK LETTERS)
THK ASSOCIATES (PVT) LIMITED2ND FLOOR, STATE LIFE BUILDING-3,DR. ZIAUDDIN AHMED ROAD,KARACHI – 75530.
Date: ____ / ____ / ____
Folio/CDS Account #
TotalShares
Principal Shareholder
Name andCNIC #
ShareholdingProportion
(No. of Shares)
Name andCNIC #
Joint Shareholder
ShareholdingProportion
(No. of Shares)
Unilever Pakistan Limited Annual Report 2014 61

The SecretaryUnilever Pakistan LimitedAvari Plaza, Fatima Jinnah RoadKarachi-75530, Pakistan.
I / We ________________________________son/ daughter/ wife of ___________________ shareholder of Unilever Pakistan Limited, holding ________________ordinary / preference shares hereby appoint ___________________________________________ who is my _____________________________ [state relationship (if any) with the proxy; required by Government regulations] and the son / daughter/ wife of ______________________, (holding _____________________ordinary / preference shares in the Company under Folio No. ____________________ ) [required by Government; delete if proxy is not the Company’s shareholder] as my / our proxy, to attend and vote for me / us and on my / our behalf at the 66th Annual General Meeting of the Company to be held on April 14, 2015 and / or any adjournment thereof.
Signed this __________ day of __________________ 2015.
Witness 1:
Signature:
Name:
CNIC #:
Address :
Witness 2:
Signature:
Name:
CNIC #:
Address :
Note:
1. The Member is requested to: (a) Affix Revenue Stamp of Rs. 5/- at the place indicated above. (b) Sign across the Revenue Stamp in the same style of signature as is registered with the Company. (c) Write down his / her / their Folio Number. (d) Attach an attested photocopy of their valid Computerised National Identity Card / Passport /
Board Resolution and the copy of valid CNIC of the proxy, with this proxy form before submission.
2. In order to be valid, this Proxy must be received at the Registered Office of the Company at least48 hours before the time fixed for the Meeting, duly completed in all respects.
3. CDC Shareholders or their Proxies should bring their original valid Computerized National Identity Card or original Passport along with the Participant’s ID Number and their Account Number to facilitate their identification. Detailed procedure is given in the Notes to the Notice of AGM.
(Signature should agree with the specimen signature registered with the Company)
Sign across Rs. 5/-Revenue Stamp
Signature of Member(s)
Shareholder’s Folio No.:
and / or CDC Participant I.D. No.:
and Sub- Account No.:
Shareholder’s CNIC #:
Unilever Pakistan Limited Annual Report 2014 63
Form of Proxy