Embed Size (px)
Citation preview
1
Final addendum to the
Draft Assessment Report (DAR) - public version -
Initial risk assessment provided by the rapporteur Member State The United Kingdom for the new active substance
FLUOPICOLIDE
as referred to in Article 8(1) of Council Directive 91/414/EEC
January 2008
2
Table of contents Addendum 1 to Volume 3 November 2007.......................................................3 B.2 Physical and Chemical Properties
Addendum 1 to Volume 3 November 2007.....................................................15 B.2 Physical and Chemical Properties B.6 Toxicology and Metabolism B.8 Environmental Fate and Behaviour B.9 Ecotoxicology
Addendum 1 to Volume 3 November 2007...................................................213 B.8 Environmental Fate and Behaviour B.9 Ecotoxicology
Addendum 1 to Volume 4 November 2007......................................................... Confidential (Annex C)
Addendum 1 to Volume 4 November 2007...................................................317 revised Confidential (Annex C)
Addendum 2 to Volume 3 November 2007...................................................319 B.8 Environmental Fate and Behaviour
Addendum 2 to Volume 3 December 2008 ...................................................358 B.6 Toxicology and metabolism B.8 Environmental fate and behaviour B.9 Ecotoxicology
Addendum 2 to Volume 4 December 2008 ...................................................490 Confidential
Addendum 3 to Volume 3 February 2009 .....................................................492 B.7 Residue data B.9 Ecotoxicology
Addendum 3 to Volume 4 February 2009 .....................................................507 Confidential
Fluopicolide - Addendum 1 November 2007
3
Council Directive 91/414/EEC
Fluopicolide (AE C638206)
ADDENDUM 1 (Chemistry Only) TO THE DRAFT ASSESSMENT REPORT PREPARED
BY THE UNITED KINGDOM
Draft: November 2007
PESTICIDES SAFETY DIRECTORATEMallard House, Kings Pool, 3 Peasholme Green, York YO1 7PX, UK Website: www.pesticides.gov.uk

Fluopicolide - Addendum 1 November 2007
4
CONTENTS Page
Physical and Chemical Properties 3

Fluopicolide - Addendum 1 November 2007
5
B.2 Physical and Chemical Properties Open point 1.13 The reference Güldner, 2005, Lab. ID. 02-99 should be added to the list of references relied on. The storage stability correction should
be considered in a revised DAR or corrigendum (WG). See reporting table 1(62).
Corrected text to B.2.2.15 (WG) below: B.2.2b Physical, chemical and technical properties of the plant protection product – WG formulation Product name: ‘EXP11074B’ (Water Dispersible Granule containing 4.44%w/w fluopicolide and 66.7%w/w fosetyl-aluminium) Table B.2.3 Summary of the physical and chemical properties of the plant protection product – WG formulation section (Annex point)
study method results comment reference
B.2.2.15 (IIIA 2.7)
Shelf life GIFAP No.17 Chemically and physically stable for two years at ambient. Physical properties tested before and after storage– appearance, particle size, pH, dispersibility, suspensibility, wet sieve, wettability, attrition, acidity, dustiness and persistent foam.
Güldner, 2005a
Fluopicolide - Addendum 1 November 2007
6
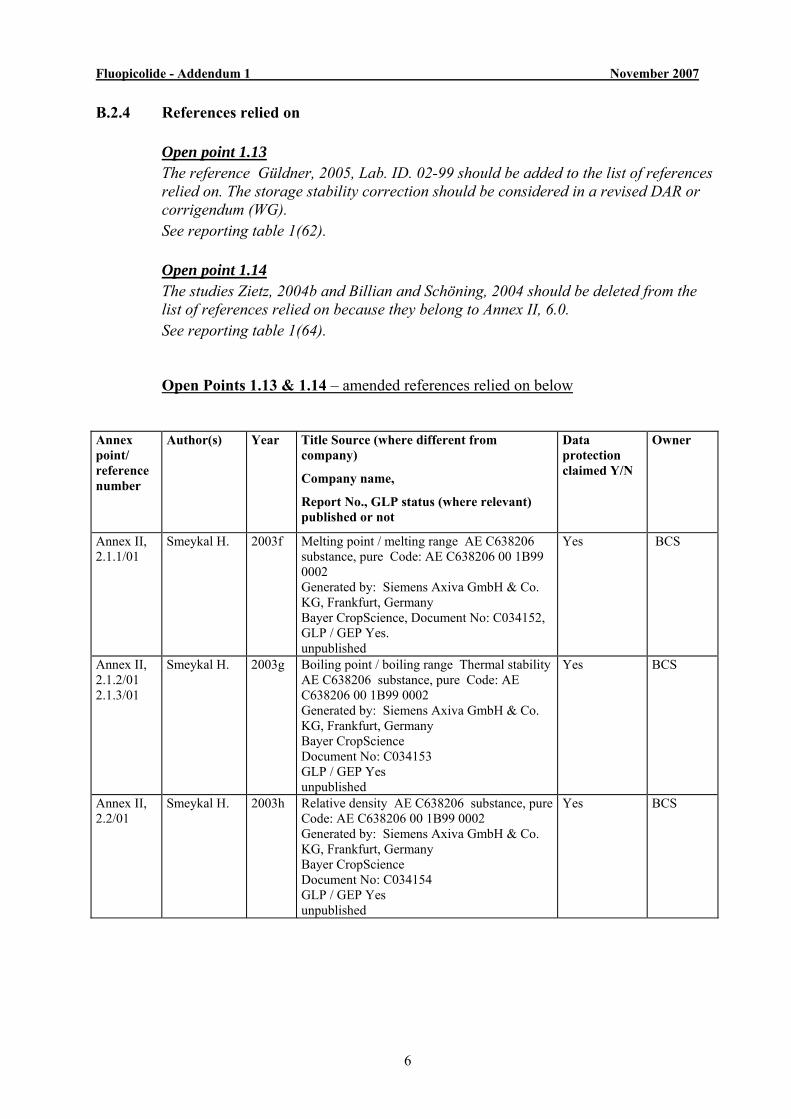
B.2.4 References relied on
Open point 1.13 The reference Güldner, 2005, Lab. ID. 02-99 should be added to the list of references relied on. The storage stability correction should be considered in a revised DAR or corrigendum (WG). See reporting table 1(62).
Open point 1.14 The studies Zietz, 2004b and Billian and Schöning, 2004 should be deleted from the list of references relied on because they belong to Annex II, 6.0. See reporting table 1(64).
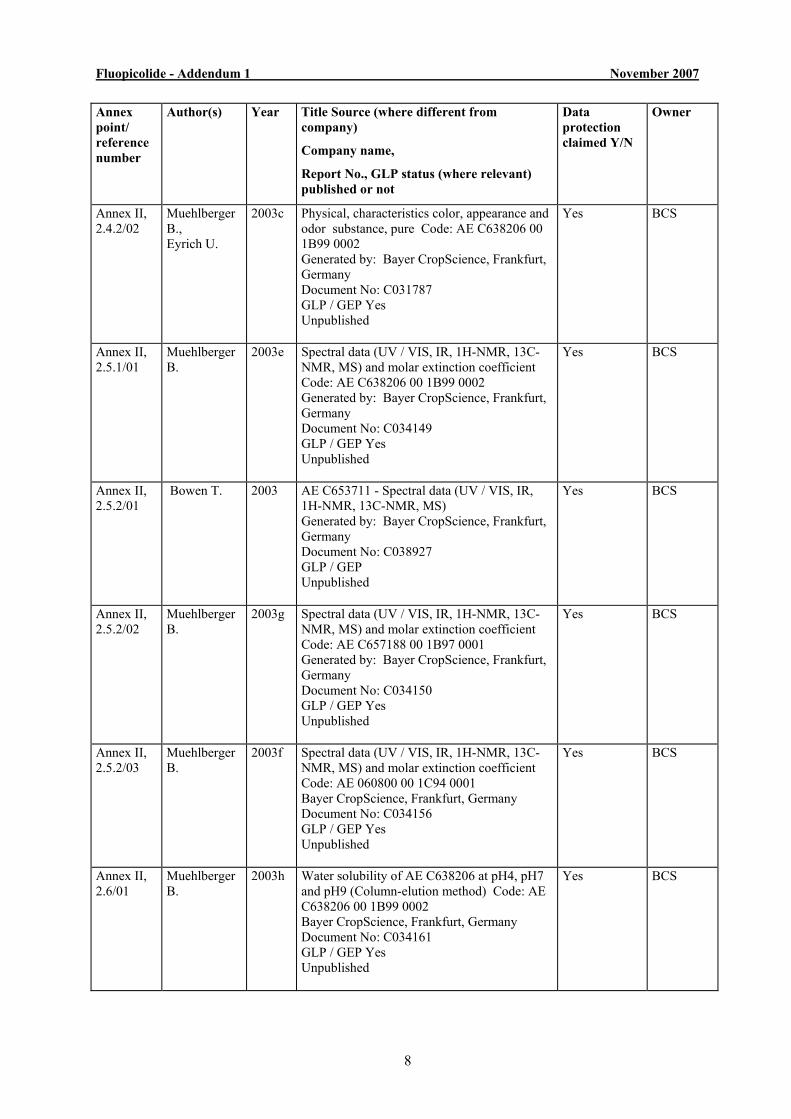
Open Points 1.13 & 1.14 – amended references relied on below Annex point/ reference number
Author(s) Year Title Source (where different from company)
Company name,
Report No., GLP status (where relevant) published or not
Data protection claimed Y/N
Owner
Annex II, 2.1.1/01
Smeykal H. 2003f Melting point / melting range AE C638206 substance, pure Code: AE C638206 00 1B99 0002 Generated by: Siemens Axiva GmbH & Co. KG, Frankfurt, Germany Bayer CropScience, Document No: C034152, GLP / GEP Yes. unpublished
Yes BCS
Annex II, 2.1.2/01 2.1.3/01
Smeykal H. 2003g Boiling point / boiling range Thermal stability AE C638206 substance, pure Code: AE C638206 00 1B99 0002 Generated by: Siemens Axiva GmbH & Co. KG, Frankfurt, Germany Bayer CropScience Document No: C034153 GLP / GEP Yes unpublished
Yes BCS
Annex II, 2.2/01
Smeykal H. 2003h Relative density AE C638206 substance, pure Code: AE C638206 00 1B99 0002 Generated by: Siemens Axiva GmbH & Co. KG, Frankfurt, Germany Bayer CropScience Document No: C034154 GLP / GEP Yes unpublished
Yes BCS
Fluopicolide - Addendum 1 November 2007
7
Annex point/ reference number
Author(s) Year Title Source (where different from company)
Company name,
Report No., GLP status (where relevant) published or not
Data protection claimed Y/N
Owner
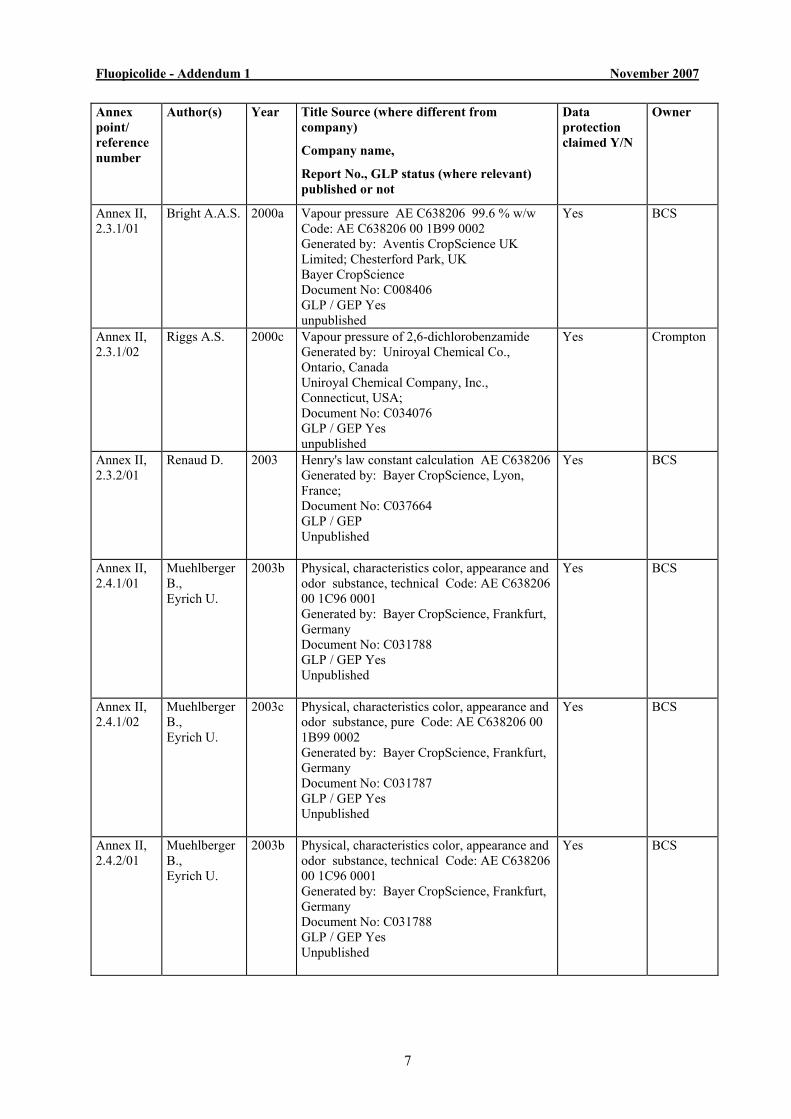
Annex II, 2.3.1/01
Bright A.A.S. 2000a Vapour pressure AE C638206 99.6 % w/w Code: AE C638206 00 1B99 0002 Generated by: Aventis CropScience UK Limited; Chesterford Park, UK Bayer CropScience Document No: C008406 GLP / GEP Yes unpublished
Yes BCS
Annex II, 2.3.1/02
Riggs A.S. 2000c Vapour pressure of 2,6-dichlorobenzamide Generated by: Uniroyal Chemical Co., Ontario, Canada Uniroyal Chemical Company, Inc., Connecticut, USA; Document No: C034076 GLP / GEP Yes unpublished
Yes Crompton
Annex II, 2.3.2/01
Renaud D. 2003 Henry's law constant calculation AE C638206 Generated by: Bayer CropScience, Lyon, France; Document No: C037664 GLP / GEP Unpublished
Yes BCS
Annex II, 2.4.1/01
Muehlberger B., Eyrich U.
2003b Physical, characteristics color, appearance and odor substance, technical Code: AE C638206 00 1C96 0001 Generated by: Bayer CropScience, Frankfurt, Germany Document No: C031788 GLP / GEP Yes Unpublished
Yes
BCS
Annex II, 2.4.1/02
Muehlberger B., Eyrich U.
2003c Physical, characteristics color, appearance and odor substance, pure Code: AE C638206 00 1B99 0002 Generated by: Bayer CropScience, Frankfurt, Germany Document No: C031787 GLP / GEP Yes Unpublished
Yes BCS
Annex II, 2.4.2/01
Muehlberger B., Eyrich U.
2003b Physical, characteristics color, appearance and odor substance, technical Code: AE C638206 00 1C96 0001 Generated by: Bayer CropScience, Frankfurt, Germany Document No: C031788 GLP / GEP Yes Unpublished
Yes BCS
Fluopicolide - Addendum 1 November 2007
8
Annex point/ reference number
Author(s) Year Title Source (where different from company)
Company name,
Report No., GLP status (where relevant) published or not
Data protection claimed Y/N
Owner
Annex II, 2.4.2/02
Muehlberger B., Eyrich U.
2003c Physical, characteristics color, appearance and odor substance, pure Code: AE C638206 00 1B99 0002 Generated by: Bayer CropScience, Frankfurt, Germany Document No: C031787 GLP / GEP Yes Unpublished
Yes BCS
Annex II, 2.5.1/01
Muehlberger B.
2003e Spectral data (UV / VIS, IR, 1H-NMR, 13C-NMR, MS) and molar extinction coefficient Code: AE C638206 00 1B99 0002 Generated by: Bayer CropScience, Frankfurt, Germany Document No: C034149 GLP / GEP Yes Unpublished
Yes
BCS
Annex II, 2.5.2/01
Bowen T. 2003 AE C653711 - Spectral data (UV / VIS, IR, 1H-NMR, 13C-NMR, MS) Generated by: Bayer CropScience, Frankfurt, Germany Document No: C038927 GLP / GEP Unpublished
Yes BCS
Annex II, 2.5.2/02
Muehlberger B.
2003g Spectral data (UV / VIS, IR, 1H-NMR, 13C-NMR, MS) and molar extinction coefficient Code: AE C657188 00 1B97 0001 Generated by: Bayer CropScience, Frankfurt, Germany Document No: C034150 GLP / GEP Yes Unpublished
Yes BCS
Annex II, 2.5.2/03
Muehlberger B.
2003f Spectral data (UV / VIS, IR, 1H-NMR, 13C-NMR, MS) and molar extinction coefficient Code: AE 060800 00 1C94 0001 Bayer CropScience, Frankfurt, Germany Document No: C034156 GLP / GEP Yes Unpublished
Yes
BCS
Annex II, 2.6/01
Muehlberger B.
2003h Water solubility of AE C638206 at pH4, pH7 and pH9 (Column-elution method) Code: AE C638206 00 1B99 0002 Bayer CropScience, Frankfurt, Germany Document No: C034161 GLP / GEP Yes Unpublished
Yes BCS
Fluopicolide - Addendum 1 November 2007
9
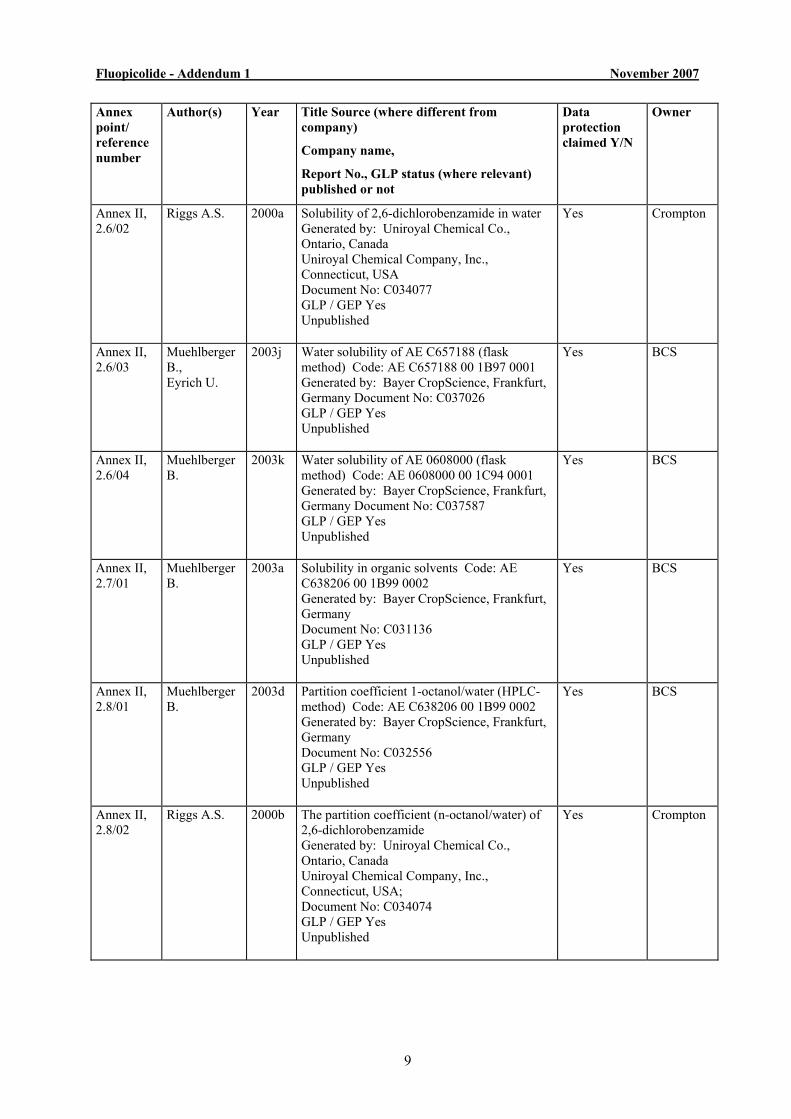
Annex point/ reference number
Author(s) Year Title Source (where different from company)
Company name,
Report No., GLP status (where relevant) published or not
Data protection claimed Y/N
Owner
Annex II, 2.6/02
Riggs A.S. 2000a Solubility of 2,6-dichlorobenzamide in water Generated by: Uniroyal Chemical Co., Ontario, Canada Uniroyal Chemical Company, Inc., Connecticut, USA Document No: C034077 GLP / GEP Yes Unpublished
Yes Crompton
Annex II, 2.6/03
Muehlberger B., Eyrich U.
2003j Water solubility of AE C657188 (flask method) Code: AE C657188 00 1B97 0001 Generated by: Bayer CropScience, Frankfurt, Germany Document No: C037026 GLP / GEP Yes Unpublished
Yes BCS
Annex II, 2.6/04
Muehlberger B.
2003k Water solubility of AE 0608000 (flask method) Code: AE 0608000 00 1C94 0001 Generated by: Bayer CropScience, Frankfurt, Germany Document No: C037587 GLP / GEP Yes Unpublished
Yes BCS
Annex II, 2.7/01
Muehlberger B.
2003a Solubility in organic solvents Code: AE C638206 00 1B99 0002 Generated by: Bayer CropScience, Frankfurt, Germany Document No: C031136 GLP / GEP Yes Unpublished
Yes BCS
Annex II, 2.8/01
Muehlberger B.
2003d Partition coefficient 1-octanol/water (HPLC-method) Code: AE C638206 00 1B99 0002 Generated by: Bayer CropScience, Frankfurt, Germany Document No: C032556 GLP / GEP Yes Unpublished
Yes BCS
Annex II, 2.8/02
Riggs A.S. 2000b The partition coefficient (n-octanol/water) of 2,6-dichlorobenzamide Generated by: Uniroyal Chemical Co., Ontario, Canada Uniroyal Chemical Company, Inc., Connecticut, USA; Document No: C034074 GLP / GEP Yes Unpublished
Yes Crompton

Fluopicolide - Addendum 1 November 2007
10
Annex point/ reference number
Author(s) Year Title Source (where different from company)
Company name,
Report No., GLP status (where relevant) published or not
Data protection claimed Y/N
Owner
Annex II, 2.8/03
Muehlberger B., Eyrich U.
2004a Partition coefficient 1-octanol/ water AE C657188 00 1B97 0001 Generated by: Bayer CropScience, Frankfurt, Germany Document No: C040103 GLP / GEP Yes Unpublished
Yes BCS
Annex II, 2.8/04
Muehlberger B., Eyrich U.
2003i Partition coefficient 1-octanol/ water at pH 5, pH 7 and pH 9 (HPLC-method) AE 0608000 00 1C94 0001 Generated by: Bayer CropScience, Frankfurt, Germany Document No: C035847 GLP / GEP Yes Unpublished
Yes BCS
Annex II, 2.9.1/01
Shepler K., Runes H.
2002 Hydrolysis of [14C]- AE C638206 at pH 4,5,7 and 9 Generated by: PTRL West, Inc., USA; Bayer CropScience; Document No: B004202 GLP / GEP Yes Unpublished
Yes BCS
Annex II, 2.9.2/01
Runes H., Shepler K
2003 Photolysis and Quantum Yield of [14C]- AE C638206 in Buffered Aqueous Solution Generated by: PTRL West, Inc., USA; Bayer CropSience; Document No: B004201 GLP / GEP Yes Unpublished
Yes BCS
Annex II, 2.9.3/01
Runes H., Shepler K
2003 Photolysis and Quantum Yield of [14C]- AE C638206 in Buffered Aqueous Solution Generated by: PTRL West, Inc., USA; Bayer CropSience; Document No: B004201 GLP / GEP Yes Unpublished
Yes BCS
Annex II, 2.9.4/01
Bright A.A.S. 2000b Dissociation constant AE C638206 99.6 % w/w Code: AE C638206 00 1B99 0002 Generated by: Aventis CropScience UK Limited; Chesterford Park, UK Document No: C008405 GLP / GEP Yes Unpublished
Yes BCS
Fluopicolide - Addendum 1 November 2007
11
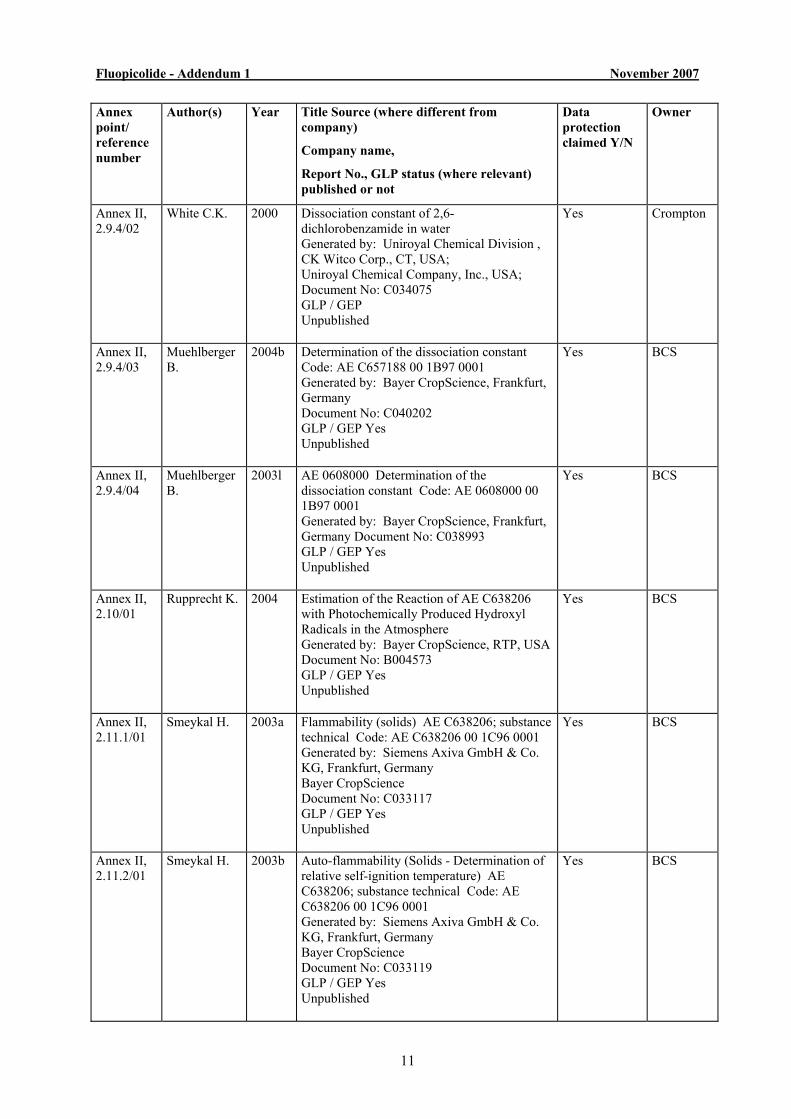
Annex point/ reference number
Author(s) Year Title Source (where different from company)
Company name,
Report No., GLP status (where relevant) published or not
Data protection claimed Y/N
Owner
Annex II, 2.9.4/02
White C.K. 2000 Dissociation constant of 2,6-dichlorobenzamide in water Generated by: Uniroyal Chemical Division , CK Witco Corp., CT, USA; Uniroyal Chemical Company, Inc., USA; Document No: C034075 GLP / GEP Unpublished
Yes Crompton
Annex II, 2.9.4/03
Muehlberger B.
2004b Determination of the dissociation constant Code: AE C657188 00 1B97 0001 Generated by: Bayer CropScience, Frankfurt, Germany Document No: C040202 GLP / GEP Yes Unpublished
Yes BCS
Annex II, 2.9.4/04
Muehlberger B.
2003l AE 0608000 Determination of the dissociation constant Code: AE 0608000 00 1B97 0001 Generated by: Bayer CropScience, Frankfurt, Germany Document No: C038993 GLP / GEP Yes Unpublished
Yes BCS
Annex II, 2.10/01
Rupprecht K. 2004 Estimation of the Reaction of AE C638206 with Photochemically Produced Hydroxyl Radicals in the Atmosphere Generated by: Bayer CropScience, RTP, USA Document No: B004573 GLP / GEP Yes Unpublished
Yes BCS
Annex II, 2.11.1/01
Smeykal H. 2003a Flammability (solids) AE C638206; substance technical Code: AE C638206 00 1C96 0001 Generated by: Siemens Axiva GmbH & Co. KG, Frankfurt, Germany Bayer CropScience Document No: C033117 GLP / GEP Yes Unpublished
Yes
BCS
Annex II, 2.11.2/01
Smeykal H.
2003b Auto-flammability (Solids - Determination of relative self-ignition temperature) AE C638206; substance technical Code: AE C638206 00 1C96 0001 Generated by: Siemens Axiva GmbH & Co. KG, Frankfurt, Germany Bayer CropScience Document No: C033119 GLP / GEP Yes Unpublished
Yes BCS
Fluopicolide - Addendum 1 November 2007
12
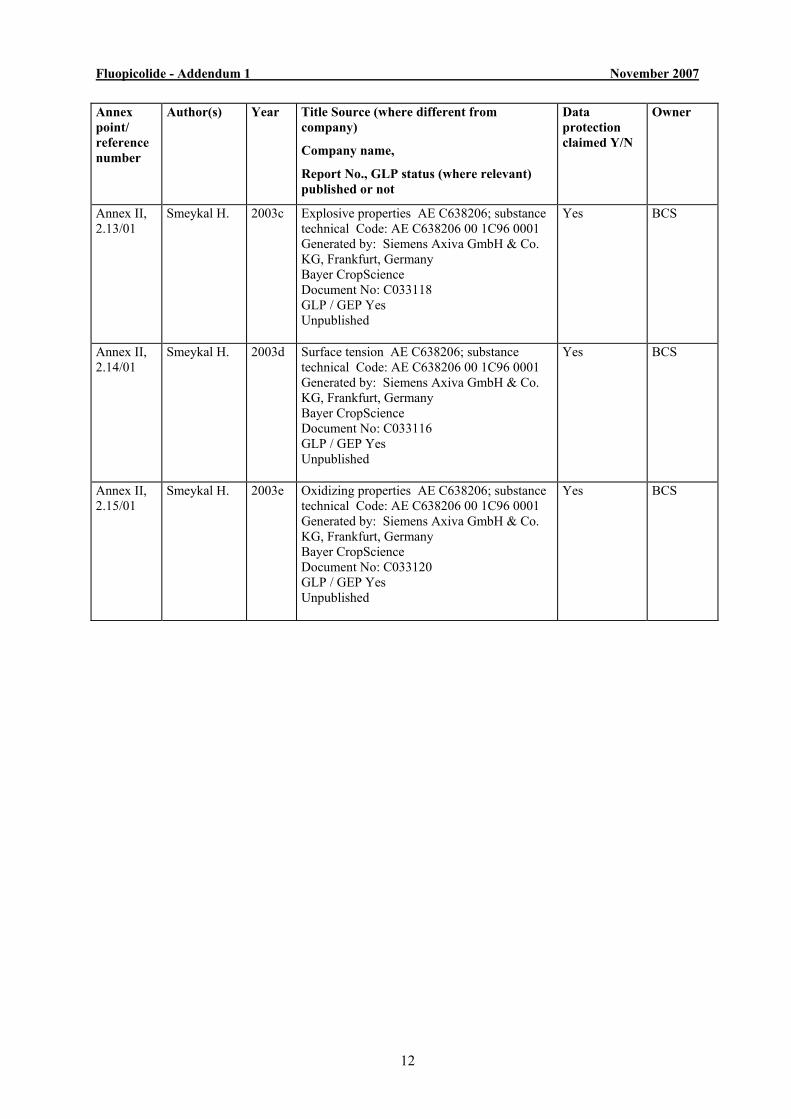
Annex point/ reference number
Author(s) Year Title Source (where different from company)
Company name,
Report No., GLP status (where relevant) published or not
Data protection claimed Y/N
Owner
Annex II, 2.13/01
Smeykal H. 2003c Explosive properties AE C638206; substance technical Code: AE C638206 00 1C96 0001 Generated by: Siemens Axiva GmbH & Co. KG, Frankfurt, Germany Bayer CropScience Document No: C033118 GLP / GEP Yes Unpublished
Yes BCS
Annex II, 2.14/01
Smeykal H. 2003d Surface tension AE C638206; substance technical Code: AE C638206 00 1C96 0001 Generated by: Siemens Axiva GmbH & Co. KG, Frankfurt, Germany Bayer CropScience Document No: C033116 GLP / GEP Yes Unpublished
Yes BCS
Annex II, 2.15/01
Smeykal H. 2003e Oxidizing properties AE C638206; substance technical Code: AE C638206 00 1C96 0001 Generated by: Siemens Axiva GmbH & Co. KG, Frankfurt, Germany Bayer CropScience Document No: C033120 GLP / GEP Yes Unpublished
Yes
BCS

Fluopicolide - Addendum 1 November 2007
13
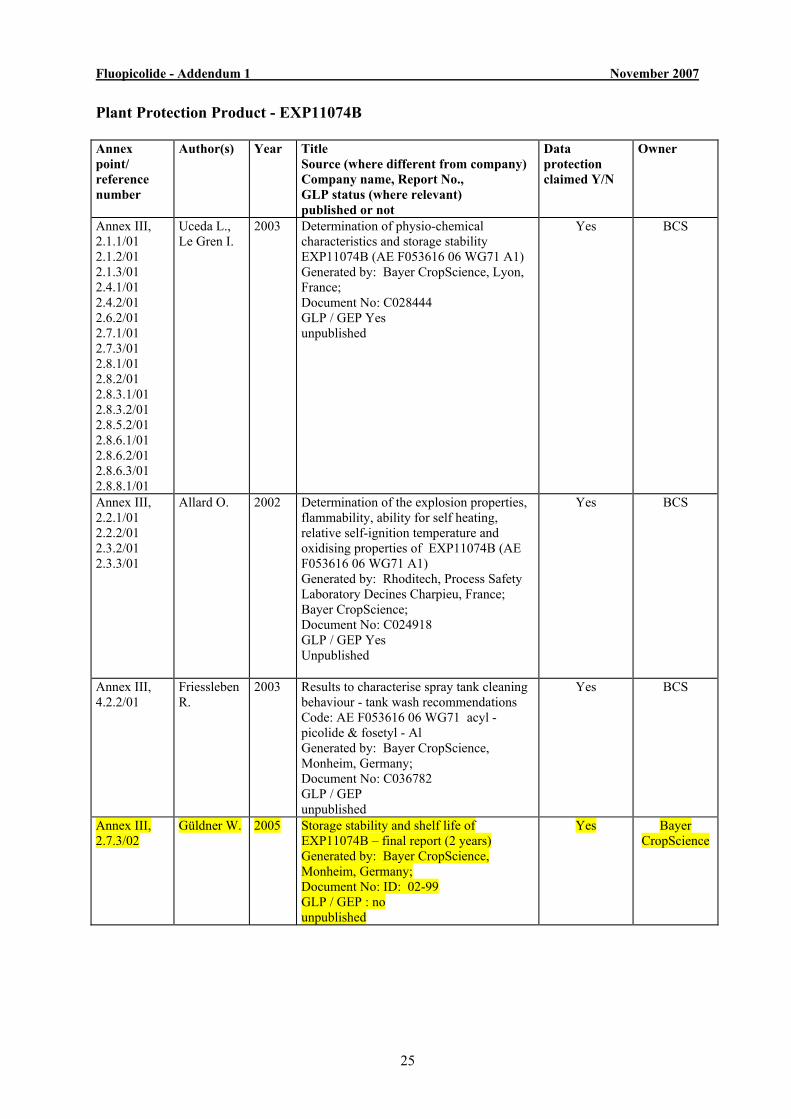
Plant Protection Product - EXP11074B Annex point/ reference number
Author(s) Year Title Source (where different from company) Company name, Report No., GLP status (where relevant) published or not
Data protection claimed Y/N
Owner
Annex III, 2.1.1/01 2.1.2/01 2.1.3/01 2.4.1/01 2.4.2/01 2.6.2/01 2.7.1/01 2.7.3/01 2.8.1/01 2.8.2/01 2.8.3.1/01 2.8.3.2/01 2.8.5.2/01 2.8.6.1/01 2.8.6.2/01 2.8.6.3/01 2.8.8.1/01
Uceda L., Le Gren I.
2003 Determination of physio-chemical characteristics and storage stability EXP11074B (AE F053616 06 WG71 A1) Generated by: Bayer CropScience, Lyon, France; Document No: C028444 GLP / GEP Yes unpublished
Yes BCS
Annex III, 2.2.1/01 2.2.2/01 2.3.2/01 2.3.3/01
Allard O. 2002 Determination of the explosion properties, flammability, ability for self heating, relative self-ignition temperature and oxidising properties of EXP11074B (AE F053616 06 WG71 A1) Generated by: Rhoditech, Process Safety Laboratory Decines Charpieu, France; Bayer CropScience; Document No: C024918 GLP / GEP Yes Unpublished
Yes BCS
Annex III, 4.2.2/01
Friessleben R.
2003 Results to characterise spray tank cleaning behaviour - tank wash recommendations Code: AE F053616 06 WG71 acyl - picolide & fosetyl - Al Generated by: Bayer CropScience, Monheim, Germany; Document No: C036782 GLP / GEP unpublished
Yes BCS
Annex III, 2.7.3/02
Güldner W. 2005 Storage stability and shelf life of EXP11074B – final report (2 years) Generated by: Bayer CropScience, Monheim, Germany; Document No: ID: 02-99 GLP / GEP : no unpublished
Yes Bayer CropScience
Fluopicolide - Addendum 1 November 2007
14
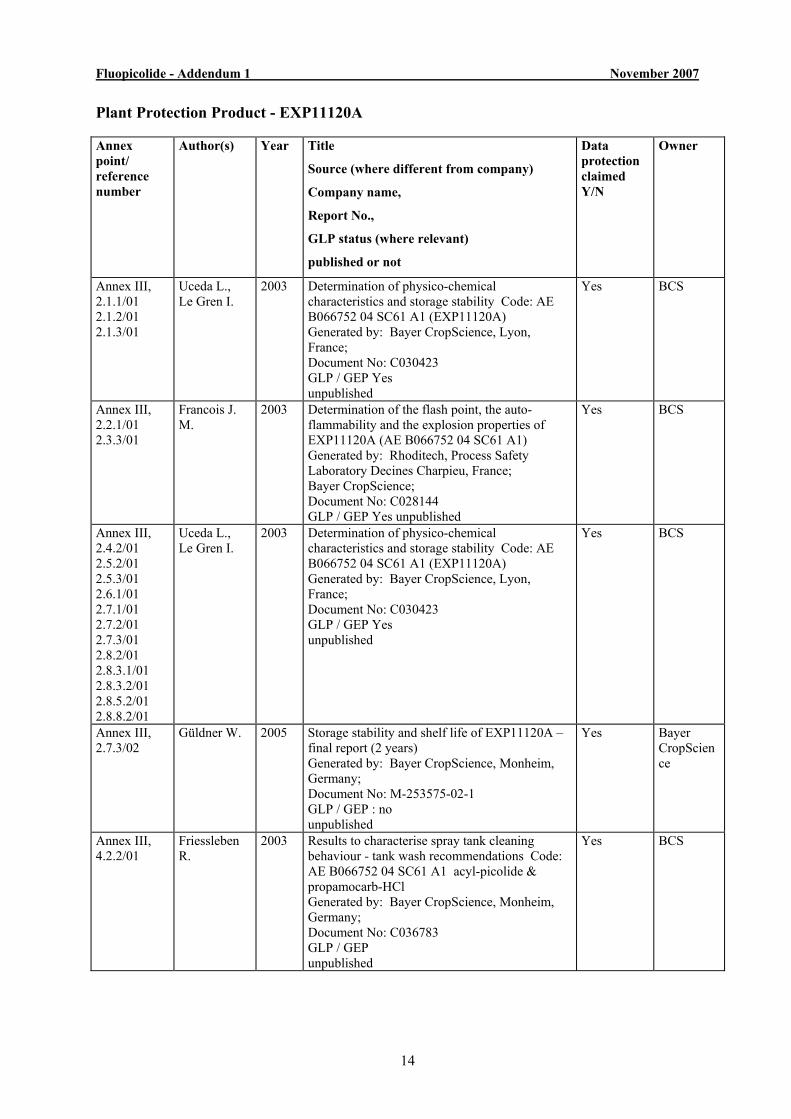
Plant Protection Product - EXP11120A Annex point/ reference number
Author(s) Year Title
Source (where different from company)
Company name,
Report No.,
GLP status (where relevant)
published or not
Data protection claimed Y/N
Owner
Annex III, 2.1.1/01 2.1.2/01 2.1.3/01
Uceda L., Le Gren I.
2003 Determination of physico-chemical characteristics and storage stability Code: AE B066752 04 SC61 A1 (EXP11120A) Generated by: Bayer CropScience, Lyon, France; Document No: C030423 GLP / GEP Yes unpublished
Yes BCS
Annex III, 2.2.1/01 2.3.3/01
Francois J. M.
2003 Determination of the flash point, the auto-flammability and the explosion properties of EXP11120A (AE B066752 04 SC61 A1) Generated by: Rhoditech, Process Safety Laboratory Decines Charpieu, France; Bayer CropScience; Document No: C028144 GLP / GEP Yes unpublished
Yes BCS
Annex III, 2.4.2/01 2.5.2/01 2.5.3/01 2.6.1/01 2.7.1/01 2.7.2/01 2.7.3/01 2.8.2/01 2.8.3.1/01 2.8.3.2/01 2.8.5.2/01 2.8.8.2/01
Uceda L., Le Gren I.
2003 Determination of physico-chemical characteristics and storage stability Code: AE B066752 04 SC61 A1 (EXP11120A) Generated by: Bayer CropScience, Lyon, France; Document No: C030423 GLP / GEP Yes unpublished
Yes BCS
Annex III, 2.7.3/02
Güldner W. 2005 Storage stability and shelf life of EXP11120A – final report (2 years) Generated by: Bayer CropScience, Monheim, Germany; Document No: M-253575-02-1 GLP / GEP : no unpublished
Yes Bayer CropScience
Annex III, 4.2.2/01
Friessleben R.
2003 Results to characterise spray tank cleaning behaviour - tank wash recommendations Code: AE B066752 04 SC61 A1 acyl-picolide & propamocarb-HCl Generated by: Bayer CropScience, Monheim, Germany; Document No: C036783 GLP / GEP unpublished
Yes BCS
Fluopicolide - Addendum 1 November 2007
15
Council Directive 91/414/EEC
Fluopicolide (AE C638206)
ADDENDUM 1 TO THE DRAFT ASSESSMENT REPORT PREPARED BY THE
UNITED KINGDOM
Draft: November 2007
PESTICIDES SAFETY DIRECTORATEMallard House, Kings Pool, 3 Peasholme Green, York YO1 7PX, UK Website: www.pesticides.gov.uk
Fluopicolide - Addendum 1 November 2007
16
CONTENTS Page
PHYSICAL AND CHEMICAL PROPERTIES 3 TOXICOLOGY AND METABOLISM 15 ENVIRONMENTAL FATE AND BEHAVIOUR 54 ECOTOXICOLOGY 134 APPENDIX 1 - Summary of the significant metabolites of fluopicolide
identified in studies in animals, plants and the environment
152 APPENDIX 2 - Fluopicolide soil degradation pathway proposed by
Applicant
156 APPENDIX 3 - B.10.7.5 Effects of Metabolites in Ground Water 157 APPENDIX 4 - Position Paper – Evaluation of the oral bioavailability of
Fluopicolide in the Rat
159 APPENDIX 5 - Position Paper – AEC638206 (fluopicolide): Waiver for an
Acute Reference Dose (ARfD) setting.
173 APPENDIX 6 - Position Paper – AE C638206 (fluopicolide): Assessmentof
hepatocellular proliferation and lack of carcinogenicity potential
180 APPENDIX 7 - Position Paper – Re-Assessment of liver Lesions/Tumors
from Study PDR/49. BAM: Dietary Administration to Rats for 2-Years. Complementary Statistical Analysis of Hepatocellular Tumors in Female Rats
192
Fluopicolide - Addendum 1 November 2007
17
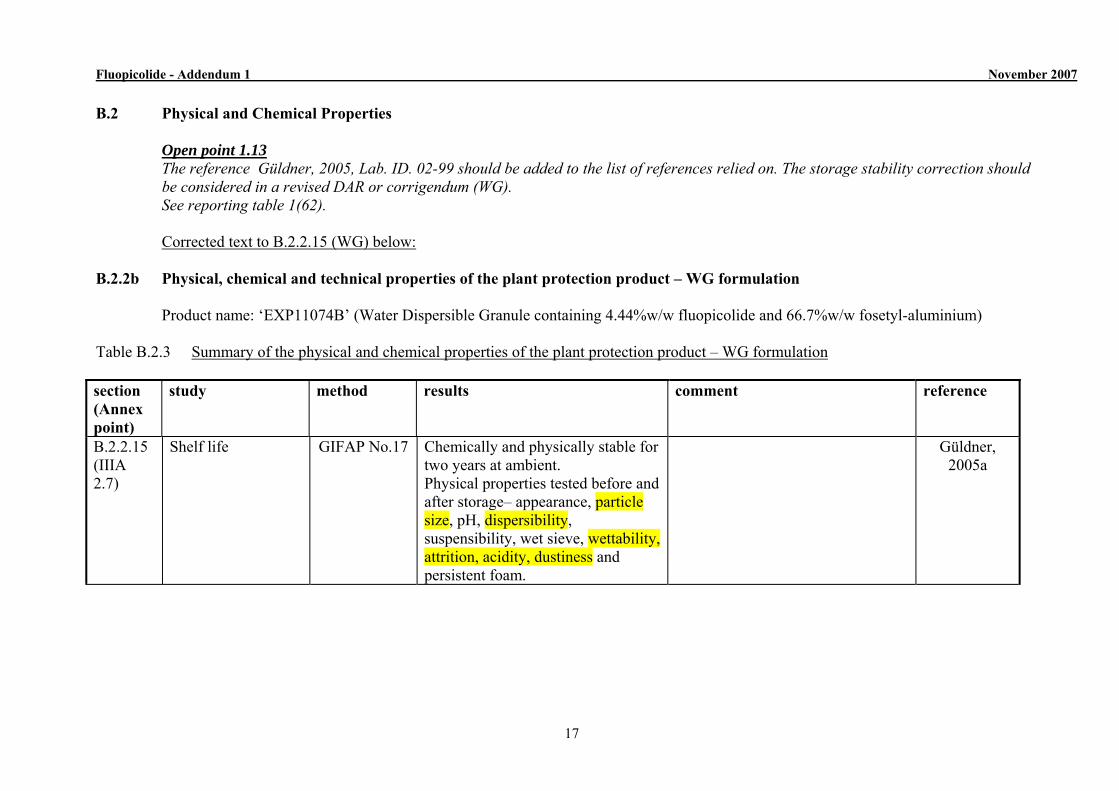
B.2 Physical and Chemical Properties Open point 1.13 The reference Güldner, 2005, Lab. ID. 02-99 should be added to the list of references relied on. The storage stability correction should
be considered in a revised DAR or corrigendum (WG). See reporting table 1(62).
Corrected text to B.2.2.15 (WG) below: B.2.2b Physical, chemical and technical properties of the plant protection product – WG formulation Product name: ‘EXP11074B’ (Water Dispersible Granule containing 4.44%w/w fluopicolide and 66.7%w/w fosetyl-aluminium) Table B.2.3 Summary of the physical and chemical properties of the plant protection product – WG formulation section (Annex point)
study method results comment reference
B.2.2.15 (IIIA 2.7)
Shelf life GIFAP No.17 Chemically and physically stable for two years at ambient. Physical properties tested before and after storage– appearance, particle size, pH, dispersibility, suspensibility, wet sieve, wettability, attrition, acidity, dustiness and persistent foam.
Güldner, 2005a
Fluopicolide - Addendum 1 November 2007
18
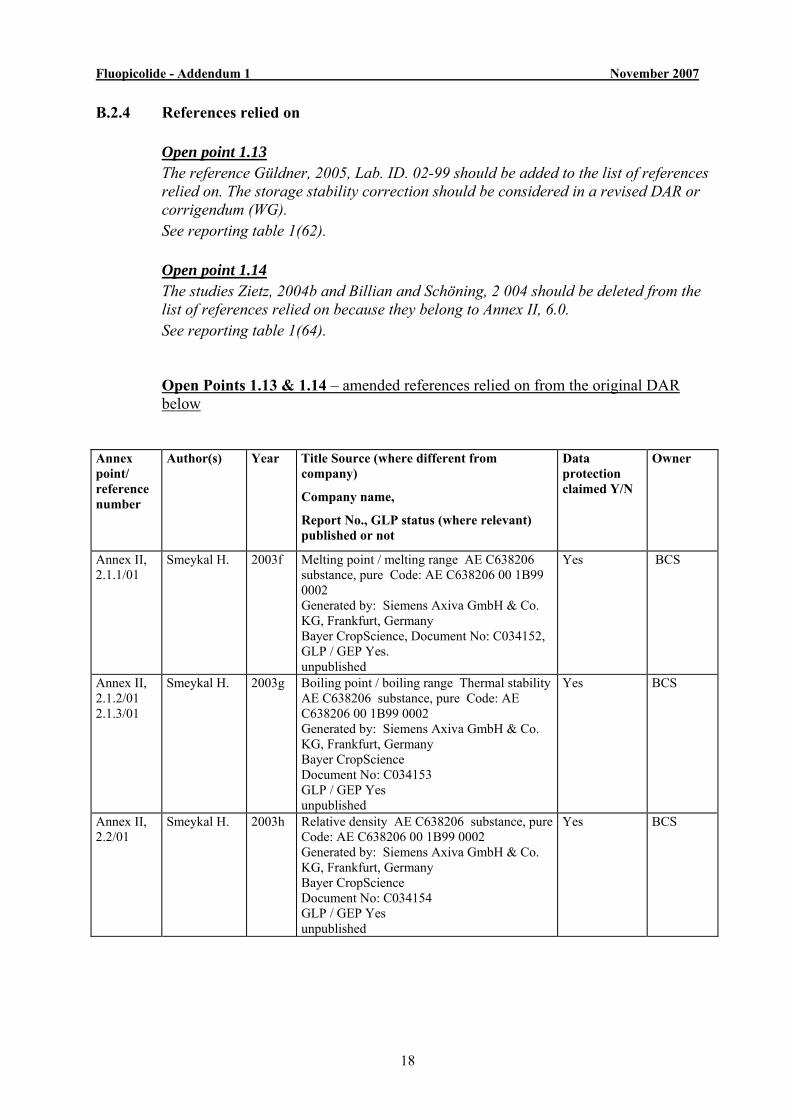
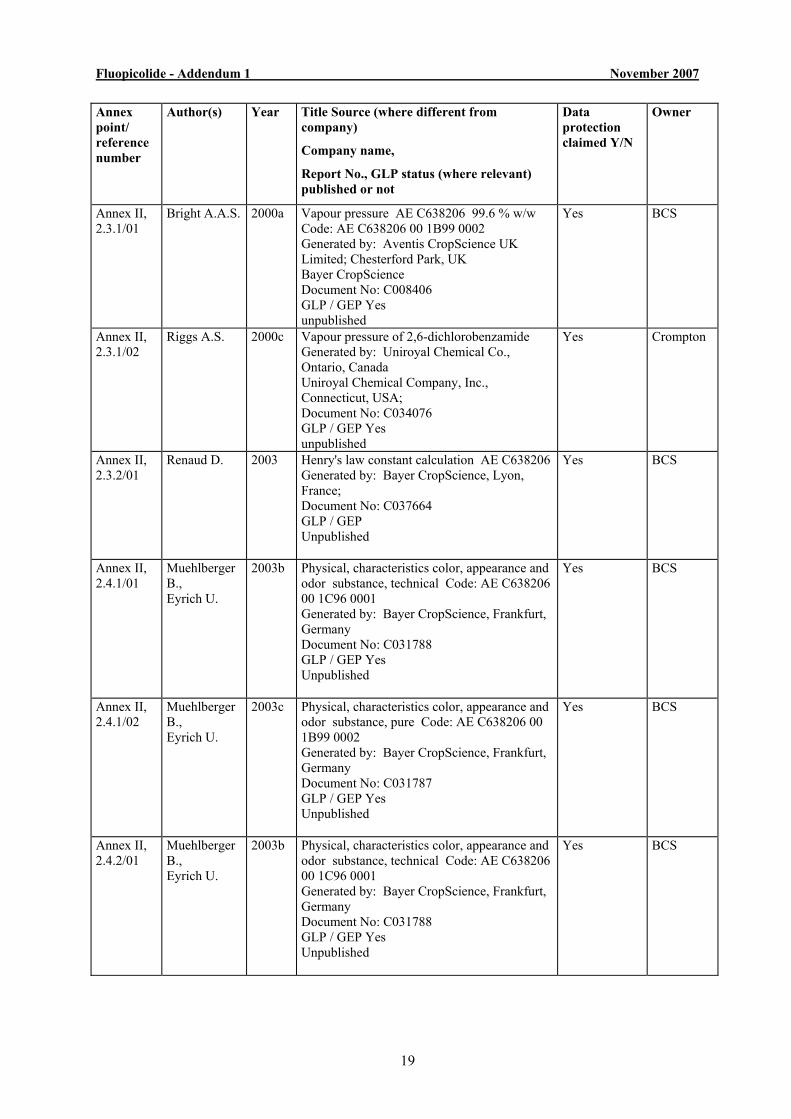
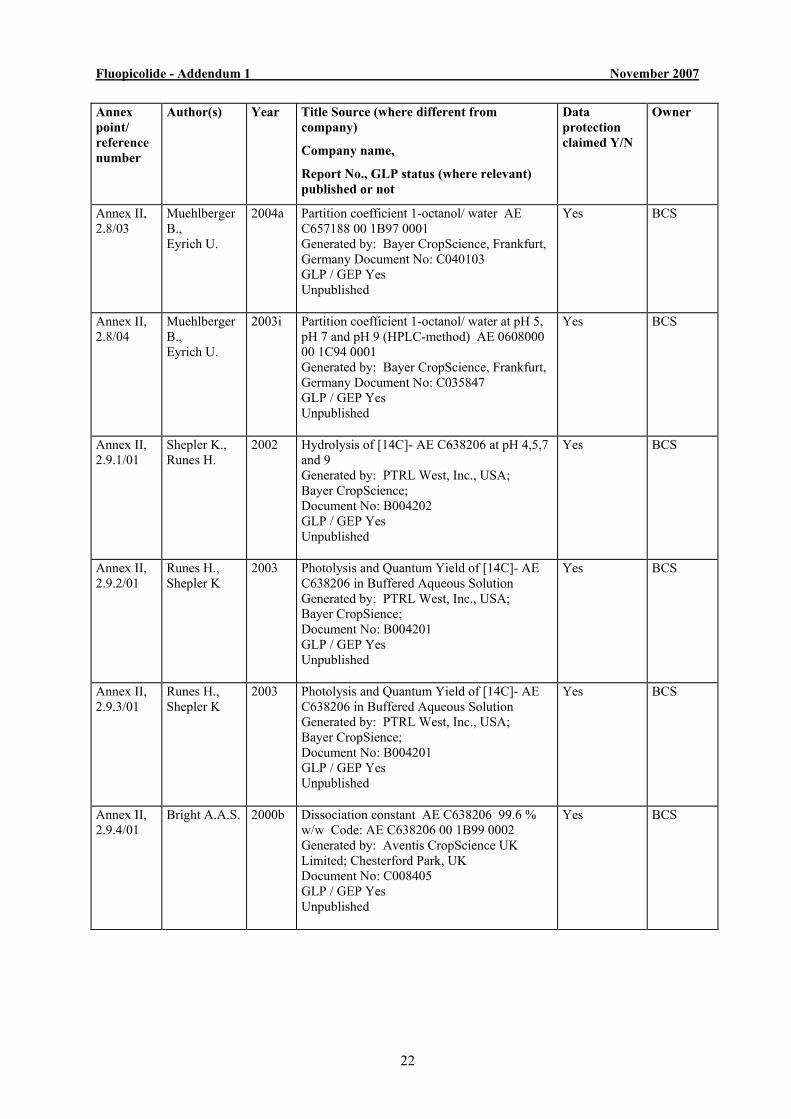
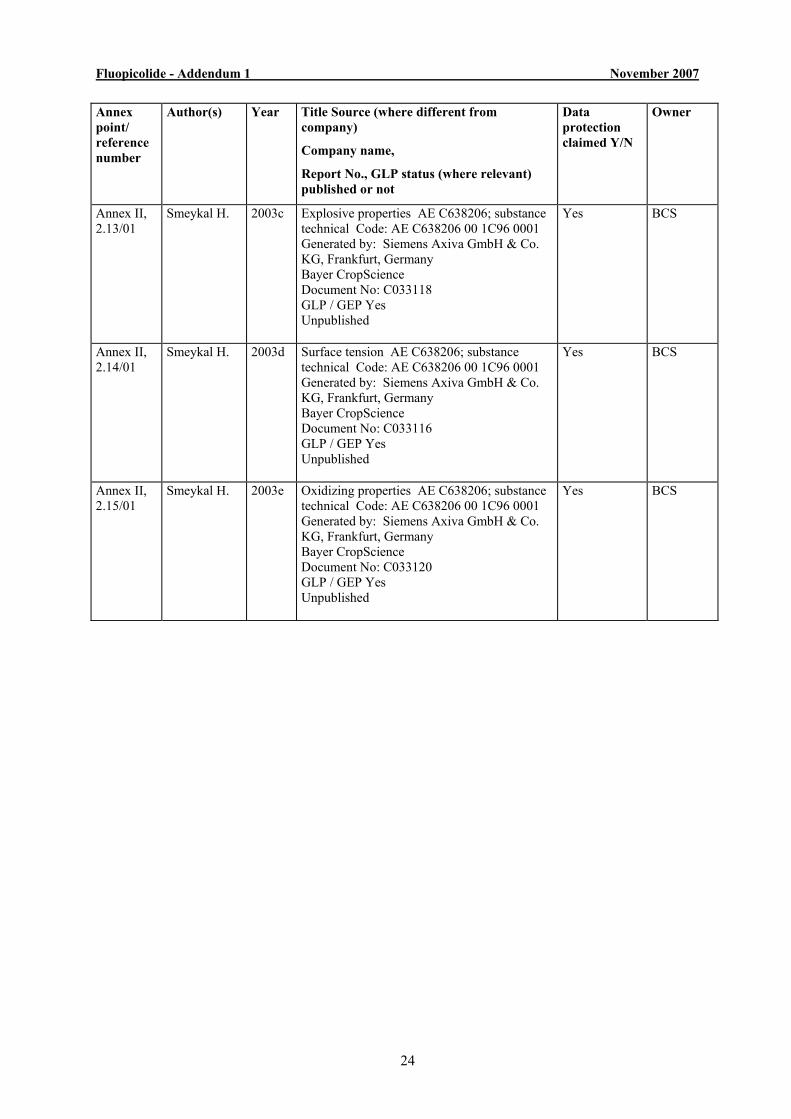
B.2.4 References relied on
Open point 1.13 The reference Güldner, 2005, Lab. ID. 02-99 should be added to the list of references relied on. The storage stability correction should be considered in a revised DAR or corrigendum (WG). See reporting table 1(62).
Open point 1.14 The studies Zietz, 2004b and Billian and Schöning, 2 004 should be deleted from the list of references relied on because they belong to Annex II, 6.0. See reporting table 1(64).
Open Points 1.13 & 1.14 – amended references relied on from the original DAR below
Annex point/ reference number
Author(s) Year Title Source (where different from company)
Company name,
Report No., GLP status (where relevant) published or not
Data protection claimed Y/N
Owner
Annex II, 2.1.1/01
Smeykal H. 2003f Melting point / melting range AE C638206 substance, pure Code: AE C638206 00 1B99 0002 Generated by: Siemens Axiva GmbH & Co. KG, Frankfurt, Germany Bayer CropScience, Document No: C034152, GLP / GEP Yes. unpublished
Yes BCS
Annex II, 2.1.2/01 2.1.3/01
Smeykal H. 2003g Boiling point / boiling range Thermal stability AE C638206 substance, pure Code: AE C638206 00 1B99 0002 Generated by: Siemens Axiva GmbH & Co. KG, Frankfurt, Germany Bayer CropScience Document No: C034153 GLP / GEP Yes unpublished
Yes BCS
Annex II, 2.2/01
Smeykal H. 2003h Relative density AE C638206 substance, pure Code: AE C638206 00 1B99 0002 Generated by: Siemens Axiva GmbH & Co. KG, Frankfurt, Germany Bayer CropScience Document No: C034154 GLP / GEP Yes unpublished
Yes BCS
Fluopicolide - Addendum 1 November 2007
19
Annex point/ reference number
Author(s) Year Title Source (where different from company)
Company name,
Report No., GLP status (where relevant) published or not
Data protection claimed Y/N
Owner
Annex II, 2.3.1/01
Bright A.A.S. 2000a Vapour pressure AE C638206 99.6 % w/w Code: AE C638206 00 1B99 0002 Generated by: Aventis CropScience UK Limited; Chesterford Park, UK Bayer CropScience Document No: C008406 GLP / GEP Yes unpublished
Yes BCS
Annex II, 2.3.1/02
Riggs A.S. 2000c Vapour pressure of 2,6-dichlorobenzamide Generated by: Uniroyal Chemical Co., Ontario, Canada Uniroyal Chemical Company, Inc., Connecticut, USA; Document No: C034076 GLP / GEP Yes unpublished
Yes Crompton
Annex II, 2.3.2/01
Renaud D. 2003 Henry's law constant calculation AE C638206 Generated by: Bayer CropScience, Lyon, France; Document No: C037664 GLP / GEP Unpublished
Yes BCS
Annex II, 2.4.1/01
Muehlberger B., Eyrich U.
2003b Physical, characteristics color, appearance and odor substance, technical Code: AE C638206 00 1C96 0001 Generated by: Bayer CropScience, Frankfurt, Germany Document No: C031788 GLP / GEP Yes Unpublished
Yes
BCS
Annex II, 2.4.1/02
Muehlberger B., Eyrich U.
2003c Physical, characteristics color, appearance and odor substance, pure Code: AE C638206 00 1B99 0002 Generated by: Bayer CropScience, Frankfurt, Germany Document No: C031787 GLP / GEP Yes Unpublished
Yes BCS
Annex II, 2.4.2/01
Muehlberger B., Eyrich U.
2003b Physical, characteristics color, appearance and odor substance, technical Code: AE C638206 00 1C96 0001 Generated by: Bayer CropScience, Frankfurt, Germany Document No: C031788 GLP / GEP Yes Unpublished
Yes BCS

Fluopicolide - Addendum 1 November 2007
20
Annex point/ reference number
Author(s) Year Title Source (where different from company)
Company name,
Report No., GLP status (where relevant) published or not
Data protection claimed Y/N
Owner
Annex II, 2.4.2/02
Muehlberger B., Eyrich U.
2003c Physical, characteristics color, appearance and odor substance, pure Code: AE C638206 00 1B99 0002 Generated by: Bayer CropScience, Frankfurt, Germany Document No: C031787 GLP / GEP Yes Unpublished
Yes BCS
Annex II, 2.5.1/01
Muehlberger B.
2003e Spectral data (UV / VIS, IR, 1H-NMR, 13C-NMR, MS) and molar extinction coefficient Code: AE C638206 00 1B99 0002 Generated by: Bayer CropScience, Frankfurt, Germany Document No: C034149 GLP / GEP Yes Unpublished
Yes
BCS
Annex II, 2.5.2/01
Bowen T. 2003 AE C653711 - Spectral data (UV / VIS, IR, 1H-NMR, 13C-NMR, MS) Generated by: Bayer CropScience, Frankfurt, Germany Document No: C038927 GLP / GEP Unpublished
Yes BCS
Annex II, 2.5.2/02
Muehlberger B.
2003g Spectral data (UV / VIS, IR, 1H-NMR, 13C-NMR, MS) and molar extinction coefficient Code: AE C657188 00 1B97 0001 Generated by: Bayer CropScience, Frankfurt, Germany Document No: C034150 GLP / GEP Yes Unpublished
Yes BCS
Annex II, 2.5.2/03
Muehlberger B.
2003f Spectral data (UV / VIS, IR, 1H-NMR, 13C-NMR, MS) and molar extinction coefficient Code: AE 060800 00 1C94 0001 Bayer CropScience, Frankfurt, Germany Document No: C034156 GLP / GEP Yes Unpublished
Yes
BCS
Annex II, 2.6/01
Muehlberger B.
2003h Water solubility of AE C638206 at pH4, pH7 and pH9 (Column-elution method) Code: AE C638206 00 1B99 0002 Bayer CropScience, Frankfurt, Germany Document No: C034161 GLP / GEP Yes Unpublished
Yes BCS

Fluopicolide - Addendum 1 November 2007
21
Annex point/ reference number
Author(s) Year Title Source (where different from company)
Company name,
Report No., GLP status (where relevant) published or not
Data protection claimed Y/N
Owner
Annex II, 2.6/02
Riggs A.S. 2000a Solubility of 2,6-dichlorobenzamide in water Generated by: Uniroyal Chemical Co., Ontario, Canada Uniroyal Chemical Company, Inc., Connecticut, USA Document No: C034077 GLP / GEP Yes Unpublished
Yes Crompton
Annex II, 2.6/03
Muehlberger B., Eyrich U.
2003j Water solubility of AE C657188 (flask method) Code: AE C657188 00 1B97 0001 Generated by: Bayer CropScience, Frankfurt, Germany Document No: C037026 GLP / GEP Yes Unpublished
Yes BCS
Annex II, 2.6/04
Muehlberger B.
2003k Water solubility of AE 0608000 (flask method) Code: AE 0608000 00 1C94 0001 Generated by: Bayer CropScience, Frankfurt, Germany Document No: C037587 GLP / GEP Yes Unpublished
Yes BCS
Annex II, 2.7/01
Muehlberger B.
2003a Solubility in organic solvents Code: AE C638206 00 1B99 0002 Generated by: Bayer CropScience, Frankfurt, Germany Document No: C031136 GLP / GEP Yes Unpublished
Yes BCS
Annex II, 2.8/01
Muehlberger B.
2003d Partition coefficient 1-octanol/water (HPLC-method) Code: AE C638206 00 1B99 0002 Generated by: Bayer CropScience, Frankfurt, Germany Document No: C032556 GLP / GEP Yes Unpublished
Yes BCS
Annex II, 2.8/02
Riggs A.S. 2000b The partition coefficient (n-octanol/water) of 2,6-dichlorobenzamide Generated by: Uniroyal Chemical Co., Ontario, Canada Uniroyal Chemical Company, Inc., Connecticut, USA; Document No: C034074 GLP / GEP Yes Unpublished
Yes Crompton
Fluopicolide - Addendum 1 November 2007
22
Annex point/ reference number
Author(s) Year Title Source (where different from company)
Company name,
Report No., GLP status (where relevant) published or not
Data protection claimed Y/N
Owner
Annex II, 2.8/03
Muehlberger B., Eyrich U.
2004a Partition coefficient 1-octanol/ water AE C657188 00 1B97 0001 Generated by: Bayer CropScience, Frankfurt, Germany Document No: C040103 GLP / GEP Yes Unpublished
Yes BCS
Annex II, 2.8/04
Muehlberger B., Eyrich U.
2003i Partition coefficient 1-octanol/ water at pH 5, pH 7 and pH 9 (HPLC-method) AE 0608000 00 1C94 0001 Generated by: Bayer CropScience, Frankfurt, Germany Document No: C035847 GLP / GEP Yes Unpublished
Yes BCS
Annex II, 2.9.1/01
Shepler K., Runes H.
2002 Hydrolysis of [14C]- AE C638206 at pH 4,5,7 and 9 Generated by: PTRL West, Inc., USA; Bayer CropScience; Document No: B004202 GLP / GEP Yes Unpublished
Yes BCS
Annex II, 2.9.2/01
Runes H., Shepler K
2003 Photolysis and Quantum Yield of [14C]- AE C638206 in Buffered Aqueous Solution Generated by: PTRL West, Inc., USA; Bayer CropSience; Document No: B004201 GLP / GEP Yes Unpublished
Yes BCS
Annex II, 2.9.3/01
Runes H., Shepler K
2003 Photolysis and Quantum Yield of [14C]- AE C638206 in Buffered Aqueous Solution Generated by: PTRL West, Inc., USA; Bayer CropSience; Document No: B004201 GLP / GEP Yes Unpublished
Yes BCS
Annex II, 2.9.4/01
Bright A.A.S. 2000b Dissociation constant AE C638206 99.6 % w/w Code: AE C638206 00 1B99 0002 Generated by: Aventis CropScience UK Limited; Chesterford Park, UK Document No: C008405 GLP / GEP Yes Unpublished
Yes BCS

Fluopicolide - Addendum 1 November 2007
23
Annex point/ reference number
Author(s) Year Title Source (where different from company)
Company name,
Report No., GLP status (where relevant) published or not
Data protection claimed Y/N
Owner
Annex II, 2.9.4/02
White C.K. 2000 Dissociation constant of 2,6-dichlorobenzamide in water Generated by: Uniroyal Chemical Division , CK Witco Corp., CT, USA; Uniroyal Chemical Company, Inc., USA; Document No: C034075 GLP / GEP Unpublished
Yes Crompton
Annex II, 2.9.4/03
Muehlberger B.
2004b Determination of the dissociation constant Code: AE C657188 00 1B97 0001 Generated by: Bayer CropScience, Frankfurt, Germany Document No: C040202 GLP / GEP Yes Unpublished
Yes BCS
Annex II, 2.9.4/04
Muehlberger B.
2003l AE 0608000 Determination of the dissociation constant Code: AE 0608000 00 1B97 0001 Generated by: Bayer CropScience, Frankfurt, Germany Document No: C038993 GLP / GEP Yes Unpublished
Yes BCS
Annex II, 2.10/01
Rupprecht K. 2004 Estimation of the Reaction of AE C638206 with Photochemically Produced Hydroxyl Radicals in the Atmosphere Generated by: Bayer CropScience, RTP, USA Document No: B004573 GLP / GEP Yes Unpublished
Yes BCS
Annex II, 2.11.1/01
Smeykal H. 2003a Flammability (solids) AE C638206; substance technical Code: AE C638206 00 1C96 0001 Generated by: Siemens Axiva GmbH & Co. KG, Frankfurt, Germany Bayer CropScience Document No: C033117 GLP / GEP Yes Unpublished
Yes
BCS
Annex II, 2.11.2/01
Smeykal H.
2003b Auto-flammability (Solids - Determination of relative self-ignition temperature) AE C638206; substance technical Code: AE C638206 00 1C96 0001 Generated by: Siemens Axiva GmbH & Co. KG, Frankfurt, Germany Bayer CropScience Document No: C033119 GLP / GEP Yes Unpublished
Yes BCS
Fluopicolide - Addendum 1 November 2007
24
Annex point/ reference number
Author(s) Year Title Source (where different from company)
Company name,
Report No., GLP status (where relevant) published or not
Data protection claimed Y/N
Owner
Annex II, 2.13/01
Smeykal H. 2003c Explosive properties AE C638206; substance technical Code: AE C638206 00 1C96 0001 Generated by: Siemens Axiva GmbH & Co. KG, Frankfurt, Germany Bayer CropScience Document No: C033118 GLP / GEP Yes Unpublished
Yes BCS
Annex II, 2.14/01
Smeykal H. 2003d Surface tension AE C638206; substance technical Code: AE C638206 00 1C96 0001 Generated by: Siemens Axiva GmbH & Co. KG, Frankfurt, Germany Bayer CropScience Document No: C033116 GLP / GEP Yes Unpublished
Yes BCS
Annex II, 2.15/01
Smeykal H. 2003e Oxidizing properties AE C638206; substance technical Code: AE C638206 00 1C96 0001 Generated by: Siemens Axiva GmbH & Co. KG, Frankfurt, Germany Bayer CropScience Document No: C033120 GLP / GEP Yes Unpublished
Yes
BCS
Fluopicolide - Addendum 1 November 2007
25
Plant Protection Product - EXP11074B Annex point/ reference number
Author(s) Year Title Source (where different from company) Company name, Report No., GLP status (where relevant) published or not
Data protection claimed Y/N
Owner
Annex III, 2.1.1/01 2.1.2/01 2.1.3/01 2.4.1/01 2.4.2/01 2.6.2/01 2.7.1/01 2.7.3/01 2.8.1/01 2.8.2/01 2.8.3.1/01 2.8.3.2/01 2.8.5.2/01 2.8.6.1/01 2.8.6.2/01 2.8.6.3/01 2.8.8.1/01
Uceda L., Le Gren I.
2003 Determination of physio-chemical characteristics and storage stability EXP11074B (AE F053616 06 WG71 A1) Generated by: Bayer CropScience, Lyon, France; Document No: C028444 GLP / GEP Yes unpublished
Yes BCS
Annex III, 2.2.1/01 2.2.2/01 2.3.2/01 2.3.3/01
Allard O. 2002 Determination of the explosion properties, flammability, ability for self heating, relative self-ignition temperature and oxidising properties of EXP11074B (AE F053616 06 WG71 A1) Generated by: Rhoditech, Process Safety Laboratory Decines Charpieu, France; Bayer CropScience; Document No: C024918 GLP / GEP Yes Unpublished
Yes BCS
Annex III, 4.2.2/01
Friessleben R.
2003 Results to characterise spray tank cleaning behaviour - tank wash recommendations Code: AE F053616 06 WG71 acyl - picolide & fosetyl - Al Generated by: Bayer CropScience, Monheim, Germany; Document No: C036782 GLP / GEP unpublished
Yes BCS
Annex III, 2.7.3/02
Güldner W. 2005 Storage stability and shelf life of EXP11074B – final report (2 years) Generated by: Bayer CropScience, Monheim, Germany; Document No: ID: 02-99 GLP / GEP : no unpublished
Yes Bayer CropScience

Fluopicolide - Addendum 1 November 2007
26
Plant Protection Product - EXP11120A Annex point/ reference number
Author(s) Year Title
Source (where different from company)
Company name,
Report No.,
GLP status (where relevant)
published or not
Data protection claimed Y/N
Owner
Annex III, 2.1.1/01 2.1.2/01 2.1.3/01
Uceda L., Le Gren I.
2003 Determination of physico-chemical characteristics and storage stability Code: AE B066752 04 SC61 A1 (EXP11120A) Generated by: Bayer CropScience, Lyon, France; Document No: C030423 GLP / GEP Yes unpublished
Yes BCS
Annex III, 2.2.1/01 2.3.3/01
Francois J. M.
2003 Determination of the flash point, the auto-flammability and the explosion properties of EXP11120A (AE B066752 04 SC61 A1) Generated by: Rhoditech, Process Safety Laboratory Decines Charpieu, France; Bayer CropScience; Document No: C028144 GLP / GEP Yes unpublished
Yes BCS
Annex III, 2.4.2/01 2.5.2/01 2.5.3/01 2.6.1/01 2.7.1/01 2.7.2/01 2.7.3/01 2.8.2/01 2.8.3.1/01 2.8.3.2/01 2.8.5.2/01 2.8.8.2/01
Uceda L., Le Gren I.
2003 Determination of physico-chemical characteristics and storage stability Code: AE B066752 04 SC61 A1 (EXP11120A) Generated by: Bayer CropScience, Lyon, France; Document No: C030423 GLP / GEP Yes unpublished
Yes BCS
Annex III, 2.7.3/02
Güldner W. 2005 Storage stability and shelf life of EXP11120A – final report (2 years) Generated by: Bayer CropScience, Monheim, Germany; Document No: M-253575-02-1 GLP / GEP : no unpublished
Yes Bayer CropScience
Annex III, 4.2.2/01
Friessleben R.
2003 Results to characterise spray tank cleaning behaviour - tank wash recommendations Code: AE B066752 04 SC61 A1 acyl-picolide & propamocarb-HCl Generated by: Bayer CropScience, Monheim, Germany; Document No: C036783 GLP / GEP unpublished
Yes BCS
Fluopicolide - Addendum 1 November 2007
27
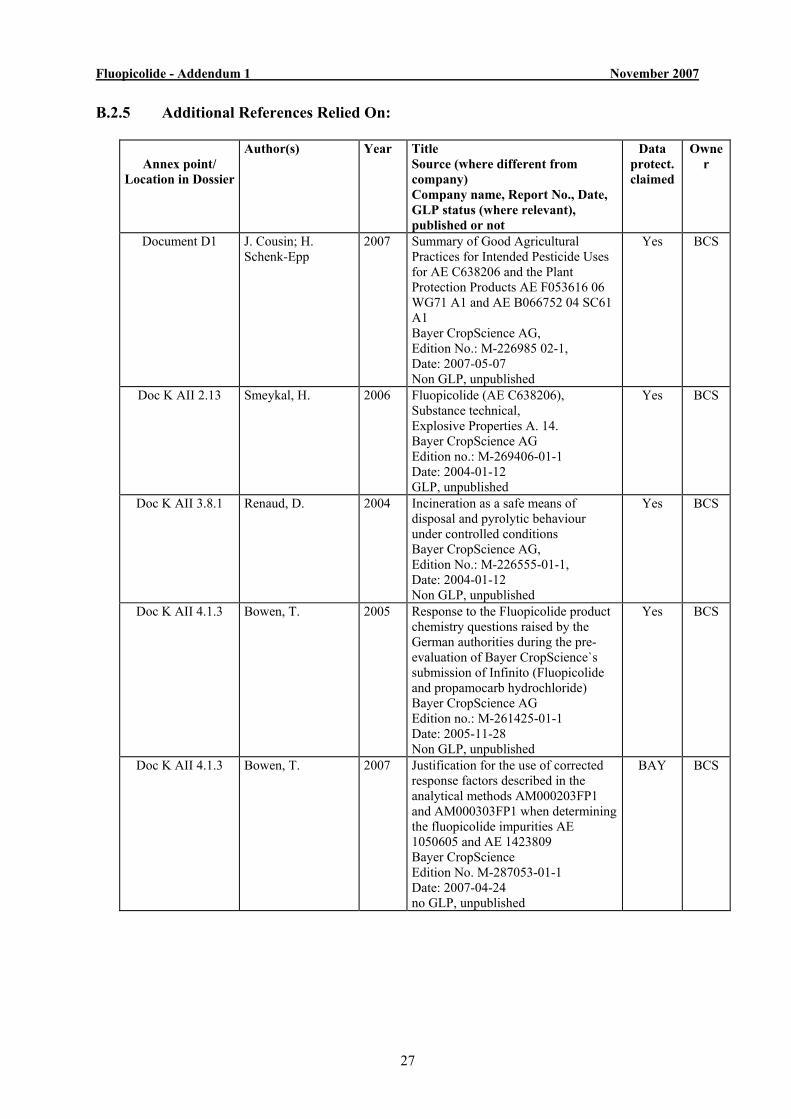
B.2.5 Additional References Relied On:
Annex point/
Location in Dossier
Author(s) Year Title Source (where different from company) Company name, Report No., Date, GLP status (where relevant), published or not
Data protect. claimed
Owner
Document D1 J. Cousin; H. Schenk-Epp
2007 Summary of Good Agricultural Practices for Intended Pesticide Uses for AE C638206 and the Plant Protection Products AE F053616 06 WG71 A1 and AE B066752 04 SC61 A1 Bayer CropScience AG, Edition No.: M-226985 02-1, Date: 2007-05-07 Non GLP, unpublished
Yes BCS
Doc K AII 2.13 Smeykal, H. 2006 Fluopicolide (AE C638206), Substance technical, Explosive Properties A. 14. Bayer CropScience AG Edition no.: M-269406-01-1 Date: 2004-01-12 GLP, unpublished
Yes BCS
Doc K AII 3.8.1 Renaud, D. 2004 Incineration as a safe means of disposal and pyrolytic behaviour under controlled conditions Bayer CropScience AG, Edition No.: M-226555-01-1, Date: 2004-01-12 Non GLP, unpublished
Yes BCS
Doc K AII 4.1.3 Bowen, T. 2005 Response to the Fluopicolide product chemistry questions raised by the German authorities during the pre-evaluation of Bayer CropScience`s submission of Infinito (Fluopicolide and propamocarb hydrochloride) Bayer CropScience AG Edition no.: M-261425-01-1 Date: 2005-11-28 Non GLP, unpublished
Yes BCS
Doc K AII 4.1.3 Bowen, T. 2007 Justification for the use of corrected response factors described in the analytical methods AM000203FP1 and AM000303FP1 when determining the fluopicolide impurities AE 1050605 and AE 1423809 Bayer CropScience Edition No. M-287053-01-1 Date: 2007-04-24 no GLP, unpublished
BAY BCS
Fluopicolide - Addendum 1 November 2007
28
Annex point/
Location in Dossier
Author(s) Year Title Source (where different from company) Company name, Report No., Date, GLP status (where relevant), published or not
Data protect. claimed
Owner
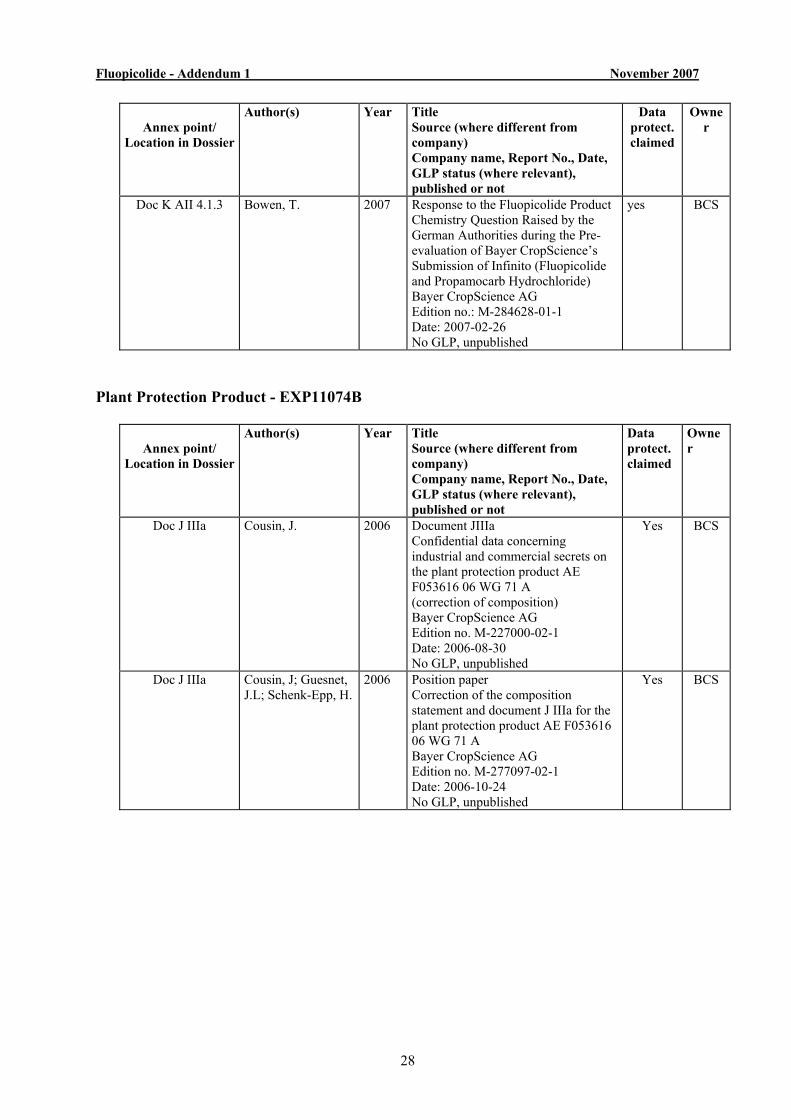
Doc K AII 4.1.3 Bowen, T. 2007 Response to the Fluopicolide Product Chemistry Question Raised by the German Authorities during the Pre-evaluation of Bayer CropScience’s Submission of Infinito (Fluopicolide and Propamocarb Hydrochloride) Bayer CropScience AG Edition no.: M-284628-01-1 Date: 2007-02-26 No GLP, unpublished
yes BCS
Plant Protection Product - EXP11074B
Annex point/
Location in Dossier
Author(s) Year Title Source (where different from company) Company name, Report No., Date, GLP status (where relevant), published or not
Data protect. claimed
Owner
Doc J IIIa Cousin, J. 2006 Document JIIIa Confidential data concerning industrial and commercial secrets on the plant protection product AE F053616 06 WG 71 A (correction of composition) Bayer CropScience AG Edition no. M-227000-02-1 Date: 2006-08-30 No GLP, unpublished
Yes BCS
Doc J IIIa Cousin, J; Guesnet, J.L; Schenk-Epp, H.
2006 Position paper Correction of the composition statement and document J IIIa for the plant protection product AE F053616 06 WG 71 A Bayer CropScience AG Edition no. M-277097-02-1 Date: 2006-10-24 No GLP, unpublished
Yes BCS
Fluopicolide - Addendum 1 November 2007
29
B.6 TOXICOLOGY AND METABOLISM B.6.3 Short-term toxicity studies (IIA 5.3) B.6.3.3 Oral short term toxicity in the dog (IIA 5.3.2)
Open point 2.1 The relevance of the liver weight increase in the 90 day study in dog to be agreed on in an experts’ meeting See reporting table 2(3).
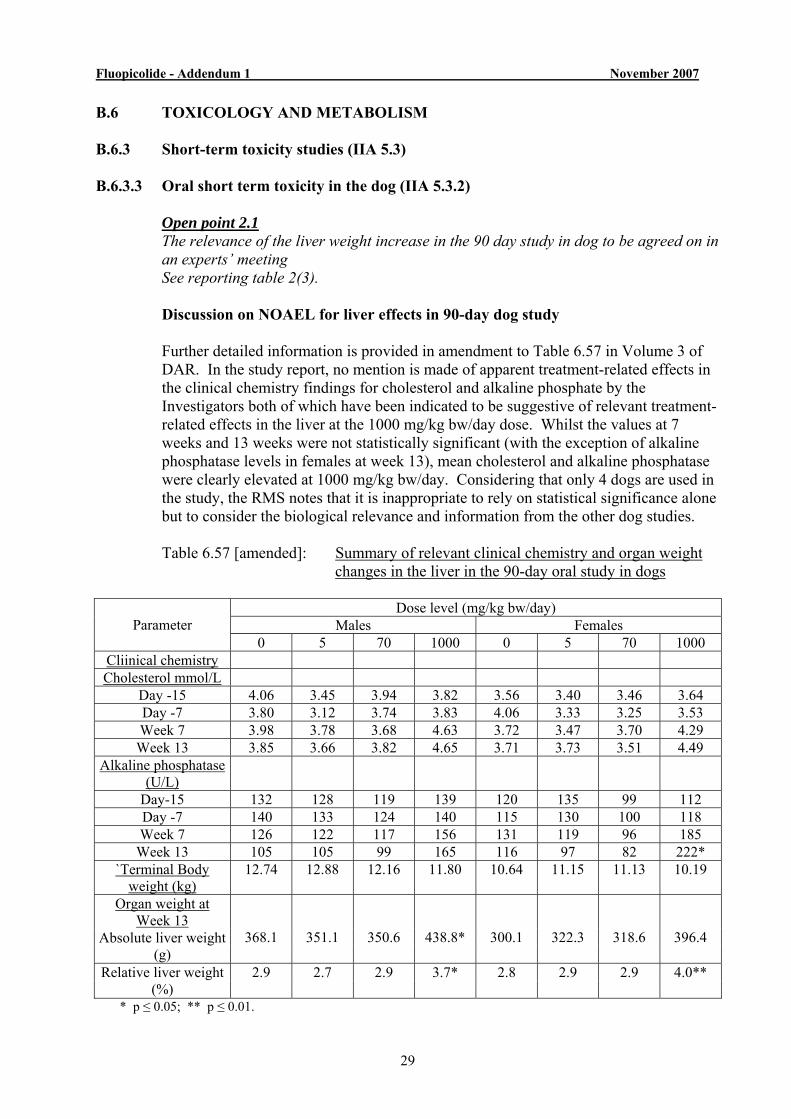
Discussion on NOAEL for liver effects in 90-day dog study Further detailed information is provided in amendment to Table 6.57 in Volume 3 of
DAR. In the study report, no mention is made of apparent treatment-related effects in the clinical chemistry findings for cholesterol and alkaline phosphate by the Investigators both of which have been indicated to be suggestive of relevant treatment-related effects in the liver at the 1000 mg/kg bw/day dose. Whilst the values at 7 weeks and 13 weeks were not statistically significant (with the exception of alkaline phosphatase levels in females at week 13), mean cholesterol and alkaline phosphatase were clearly elevated at 1000 mg/kg bw/day. Considering that only 4 dogs are used in the study, the RMS notes that it is inappropriate to rely on statistical significance alone but to consider the biological relevance and information from the other dog studies.
Table 6.57 [amended]: Summary of relevant clinical chemistry and organ weight
changes in the liver in the 90-day oral study in dogs
Dose level (mg/kg bw/day) Males Females Parameter
0 5 70 1000 0 5 70 1000 Cliinical chemistry Cholesterol mmol/L
Day -15 4.06 3.45 3.94 3.82 3.56 3.40 3.46 3.64 Day -7 3.80 3.12 3.74 3.83 4.06 3.33 3.25 3.53 Week 7 3.98 3.78 3.68 4.63 3.72 3.47 3.70 4.29
Week 13 3.85 3.66 3.82 4.65 3.71 3.73 3.51 4.49 Alkaline phosphatase
(U/L)
Day-15 132 128 119 139 120 135 99 112 Day -7 140 133 124 140 115 130 100 118 Week 7 126 122 117 156 131 119 96 185
Week 13 105 105 99 165 116 97 82 222* `Terminal Body
weight (kg) 12.74 12.88 12.16 11.80 10.64 11.15 11.13 10.19
Organ weight at Week 13
368.1 351.1 350.6 438.8* 300.1 322.3 318.6 396.4 Absolute liver weight (g)
2.9 2.7 2.9 3.7* 2.8 2.9 2.9 4.0** Relative liver weight (%)
* p ≤ 0.05; ** p ≤ 0.01.
Fluopicolide - Addendum 1 November 2007
31
Haematology and clinical chemistry data were subjected to the following statistical
evaluation: Bartlett's Test was used to determine homogeneity of variance between groups; if significant at the 5 % level, a log transformation was applied to the data to attempt to remove the heterogeneity. If homogeneity of variance was demonstrated on either the untransformed or transformed data, parametric tests to detect significant difference between control and test groups at the 5, 1 or 0.1 % level comprised: One-Way Analysis of Variance to establish the significance of variability among all groups and Student's "t" Test, based on a pooled variance estimate, for intergroup comparisons, i.e. control versus each test group. If significant heterogeneity of variance was indicated, even with transformation, then non-parametric analysis was by the Kruskal-Wallis Rank Test to detect any significant group differences at the 5, 1 or 0.1 % level.
The study was certified to be GLP compliant and satisfies the essential requirements of
OECD guideline # 408. Test diets were prepared weekly and analysed for test material content. The mean results for the test diet samples analysed were within the range 94.3 - 105.9 % of nominal (laboratory’s acceptable range was +10% to -15% of nominal). Homogeneity was shown to be satisfactory at all levels i.e. mean values obtained for top, middle and bottom samples were within the acceptable range 90 - 110% of nominal and these mean % nominal values differed by < 10%. Stability was satisfactory over the time of use of the diet (8 days) i.e.: % nominal levels declined by a maximum of 7 % over 15 days of storage at room temperature. The study is considered acceptable.
The dogs were fed daily over a period of at least 1.5 hours with 400 g of expanded
pellet dog diet. On some occasions food bowls were withdrawn earlier if all animals in a pen had consumed all food before 1.5 hours had elapsed. Dogs were normally fed between approximately 1 to 3.5 hours after dosing. A certificate of analysis for each batch of diet was provided by the manufacturer prior to its use.
Prior to the start of treatment, a procedure was developed to reliably prepare
homogeneous and suitably stable mixtures of the test material in the vehicle, 1 % w/v methyl cellulose in distilled water, at the required nominal concentrations of 1, 14 and 200 mg/ml (equivalent to dose levels of 5, 70 and 1000 mg/kg bw/day, respectively).
There were no mortalities or clinical signs of toxicity observed during the study. There
were no treatment-related effects on the eyes, bodyweight, food intake, haematology, biochemistry, urinalysis, macroscopic pathology or histopathology parameters investigated.
At 1000 mg/kg bw/day, absolute liver weight was increased by 19% in males and by
32% in females, compared with controls. Relative liver weight to bodyweight was increased by 28% and 43% in males and females, respectively, when compared with controls. Organ weights were unaffected at 5 or 70 mg/kg bw/day.
Fluopicolide - Addendum 1 November 2007
32
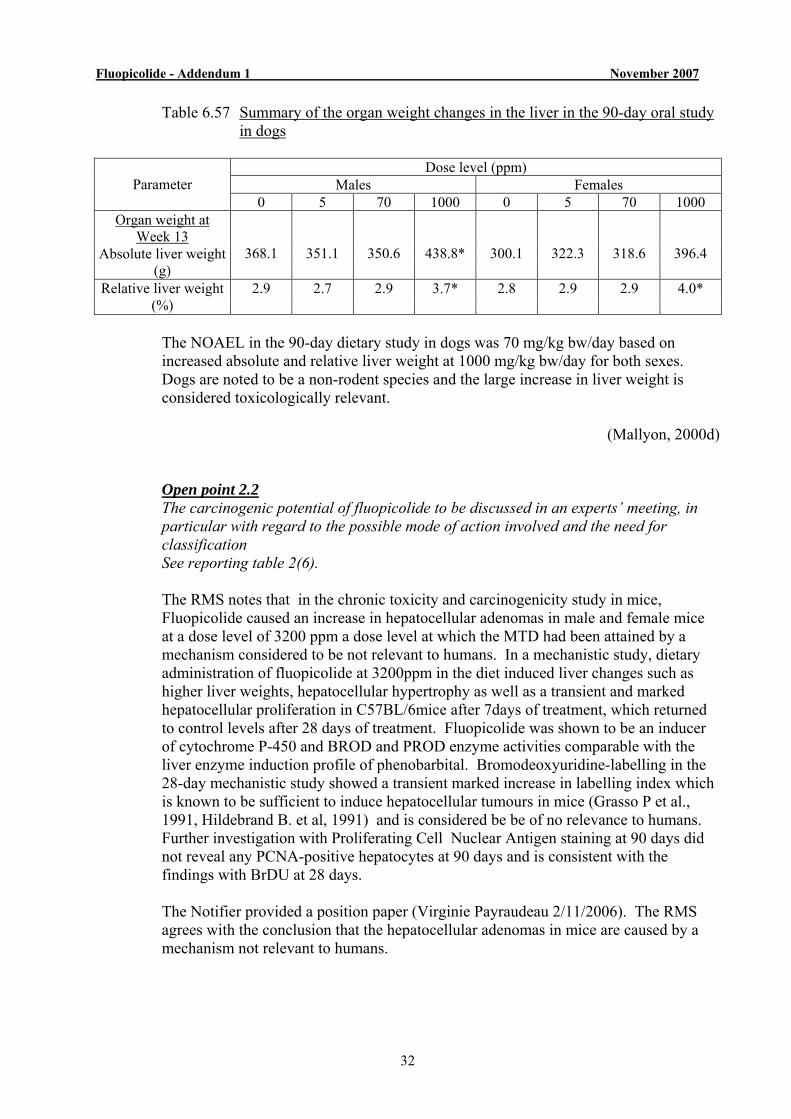
Table 6.57 Summary of the organ weight changes in the liver in the 90-day oral study in dogs
Dose level (ppm)
Males Females Parameter 0 5 70 1000 0 5 70 1000
Organ weight at Week 13
368.1 351.1 350.6 438.8* 300.1 322.3 318.6 396.4 Absolute liver weight (g)
2.9 2.7 2.9 3.7* 2.8 2.9 2.9 4.0* Relative liver weight (%)
The NOAEL in the 90-day dietary study in dogs was 70 mg/kg bw/day based on
increased absolute and relative liver weight at 1000 mg/kg bw/day for both sexes. Dogs are noted to be a non-rodent species and the large increase in liver weight is considered toxicologically relevant.
(Mallyon, 2000d)
Open point 2.2 The carcinogenic potential of fluopicolide to be discussed in an experts’ meeting, in particular with regard to the possible mode of action involved and the need for classification
See reporting table 2(6). The RMS notes that in the chronic toxicity and carcinogenicity study in mice,
Fluopicolide caused an increase in hepatocellular adenomas in male and female mice at a dose level of 3200 ppm a dose level at which the MTD had been attained by a mechanism considered to be not relevant to humans. In a mechanistic study, dietary administration of fluopicolide at 3200ppm in the diet induced liver changes such as higher liver weights, hepatocellular hypertrophy as well as a transient and marked hepatocellular proliferation in C57BL/6mice after 7days of treatment, which returned to control levels after 28 days of treatment. Fluopicolide was shown to be an inducer of cytochrome P-450 and BROD and PROD enzyme activities comparable with the liver enzyme induction profile of phenobarbital. Bromodeoxyuridine-labelling in the 28-day mechanistic study showed a transient marked increase in labelling index which is known to be sufficient to induce hepatocellular tumours in mice (Grasso P et al., 1991, Hildebrand B. et al, 1991) and is considered be be of no relevance to humans. Further investigation with Proliferating Cell Nuclear Antigen staining at 90 days did not reveal any PCNA-positive hepatocytes at 90 days and is consistent with the findings with BrDU at 28 days.
The Notifier provided a position paper (Virginie Payraudeau 2/11/2006). The RMS
agrees with the conclusion that the hepatocellular adenomas in mice are caused by a mechanism not relevant to humans.
Fluopicolide - Addendum 1 November 2007
34
carried out every 6 months confirmed that the purity remained the same throughout the treatment period. The results of the analyses demonstrated the satisfactory homogeneity of each dietary admixture analyzed during the study. Furthermore, there was a good correspondence between the nominal and the measured concentrations of the test item in the diet. Stability of the formulation was shown to be a minimum of 10 days. On the first day of treatment, the animals were approximately 7 weeks old and had a mean body weight of 23.3 g (21.5 - 26.2 g) for the males and 19.5 g (17.7 - 22.3 g) for the females.
The distribution of mortality, as well as the factors contributing to mortality or
premature sacrifice, was similar in the control and treated groups. Survival rate over 78 weeks was in males 82, 88, 90 and 88 % and in females 90, 82, 92 and 82% corresponding to the 0 (control), 50, 400 and 3200 ppm dose groups respectively. The incidence, nature and onset of the clinical signs were similar in the control and treated groups. No signs of neurotoxicity were observed during the study. The frequency, time of onset and size of the few palpable masses recorded were similar in the control and treated groups.
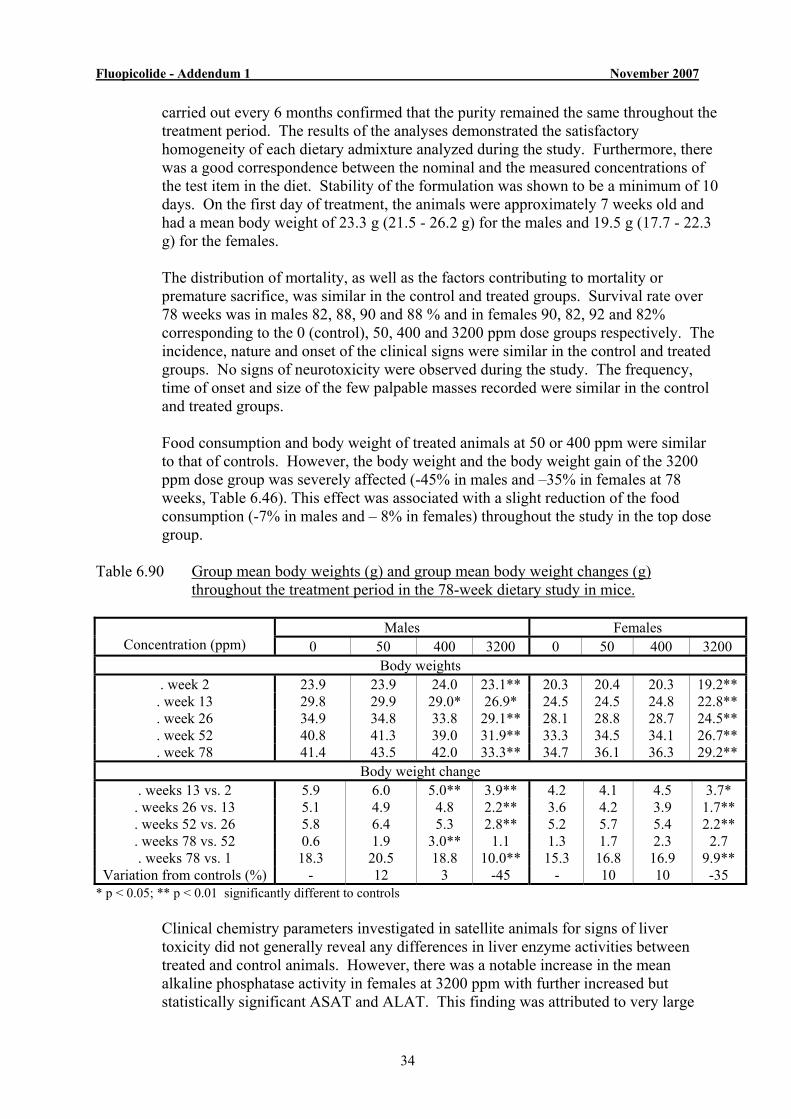
Food consumption and body weight of treated animals at 50 or 400 ppm were similar
to that of controls. However, the body weight and the body weight gain of the 3200 ppm dose group was severely affected (-45% in males and –35% in females at 78 weeks, Table 6.46). This effect was associated with a slight reduction of the food consumption (-7% in males and – 8% in females) throughout the study in the top dose group.
Table 6.90 Group mean body weights (g) and group mean body weight changes (g)
throughout the treatment period in the 78-week dietary study in mice.
Males Females Concentration (ppm) 0 50 400 3200 0 50 400 3200
Body weights . week 2 23.9 23.9 24.0 23.1** 20.3 20.4 20.3 19.2**
. week 13 29.8 29.9 29.0* 26.9* 24.5 24.5 24.8 22.8**
. week 26 34.9 34.8 33.8 29.1** 28.1 28.8 28.7 24.5**
. week 52 40.8 41.3 39.0 31.9** 33.3 34.5 34.1 26.7**
. week 78 41.4 43.5 42.0 33.3** 34.7 36.1 36.3 29.2** Body weight change
. weeks 13 vs. 2 5.9 6.0 5.0** 3.9** 4.2 4.1 4.5 3.7* . weeks 26 vs. 13 5.1 4.9 4.8 2.2** 3.6 4.2 3.9 1.7** . weeks 52 vs. 26 5.8 6.4 5.3 2.8** 5.2 5.7 5.4 2.2** . weeks 78 vs. 52 0.6 1.9 3.0** 1.1 1.3 1.7 2.3 2.7 . weeks 78 vs. 1 18.3 20.5 18.8 10.0** 15.3 16.8 16.9 9.9**
Variation from controls (%) - 12 3 -45 - 10 10 -35 * p < 0.05; ** p < 0.01 significantly different to controls Clinical chemistry parameters investigated in satellite animals for signs of liver
toxicity did not generally reveal any differences in liver enzyme activities between treated and control animals. However, there was a notable increase in the mean alkaline phosphatase activity in females at 3200 ppm with further increased but statistically significant ASAT and ALAT. This finding was attributed to very large
Fluopicolide - Addendum 1 November 2007
35
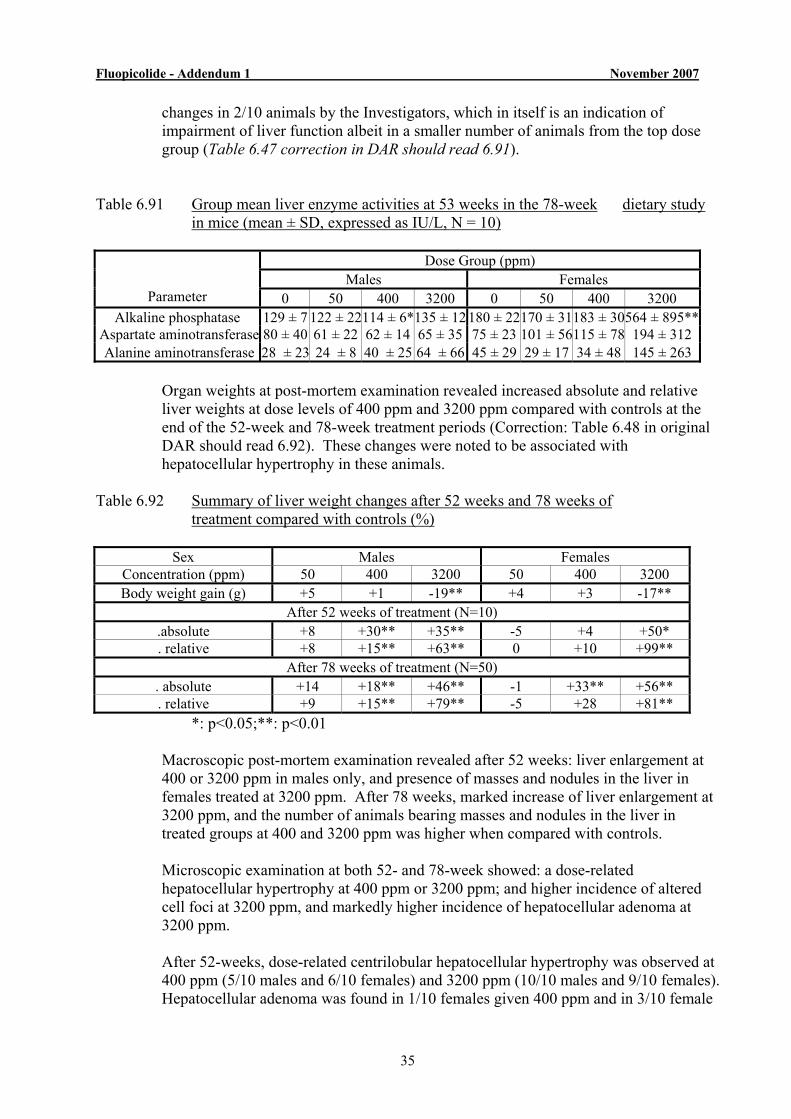
changes in 2/10 animals by the Investigators, which in itself is an indication of impairment of liver function albeit in a smaller number of animals from the top dose group (Table 6.47 correction in DAR should read 6.91).
Table 6.91 Group mean liver enzyme activities at 53 weeks in the 78-week dietary study
in mice (mean ± SD, expressed as IU/L, N = 10)
Dose Group (ppm) Males Females
Parameter 0 50 400 3200 0 50 400 3200 Alkaline phosphatase 129 ± 7 122 ± 22114 ± 6*135 ± 12 180 ± 22170 ± 31183 ± 30564 ± 895**
Aspartate aminotransferase 80 ± 40 61 ± 22 62 ± 14 65 ± 35 75 ± 23 101 ± 56115 ± 78 194 ± 312 Alanine aminotransferase 28 ± 23 24 ± 8 40 ± 25 64 ± 66 45 ± 29 29 ± 17 34 ± 48 145 ± 263
Organ weights at post-mortem examination revealed increased absolute and relative
liver weights at dose levels of 400 ppm and 3200 ppm compared with controls at the end of the 52-week and 78-week treatment periods (Correction: Table 6.48 in original DAR should read 6.92). These changes were noted to be associated with hepatocellular hypertrophy in these animals.
Table 6.92 Summary of liver weight changes after 52 weeks and 78 weeks of
treatment compared with controls (%)
Sex Males Females Concentration (ppm) 50 400 3200 50 400 3200 Body weight gain (g) +5 +1 -19** +4 +3 -17**
After 52 weeks of treatment (N=10) .absolute +8 +30** +35** -5 +4 +50* . relative +8 +15** +63** 0 +10 +99**
After 78 weeks of treatment (N=50) . absolute +14 +18** +46** -1 +33** +56** . relative +9 +15** +79** -5 +28 +81**
*: p<0.05;**: p<0.01 Macroscopic post-mortem examination revealed after 52 weeks: liver enlargement at
400 or 3200 ppm in males only, and presence of masses and nodules in the liver in females treated at 3200 ppm. After 78 weeks, marked increase of liver enlargement at 3200 ppm, and the number of animals bearing masses and nodules in the liver in treated groups at 400 and 3200 ppm was higher when compared with controls.
Microscopic examination at both 52- and 78-week showed: a dose-related
hepatocellular hypertrophy at 400 ppm or 3200 ppm; and higher incidence of altered cell foci at 3200 ppm, and markedly higher incidence of hepatocellular adenoma at 3200 ppm.
After 52-weeks, dose-related centrilobular hepatocellular hypertrophy was observed at
400 ppm (5/10 males and 6/10 females) and 3200 ppm (10/10 males and 9/10 females). Hepatocellular adenoma was found in 1/10 females given 400 ppm and in 3/10 female
Fluopicolide - Addendum 1 November 2007
36
mice given 3200 ppm. The higher incidence of hepatocellular adenoma at 3200 ppm (p< 0.036) was considered to be treatment-related.
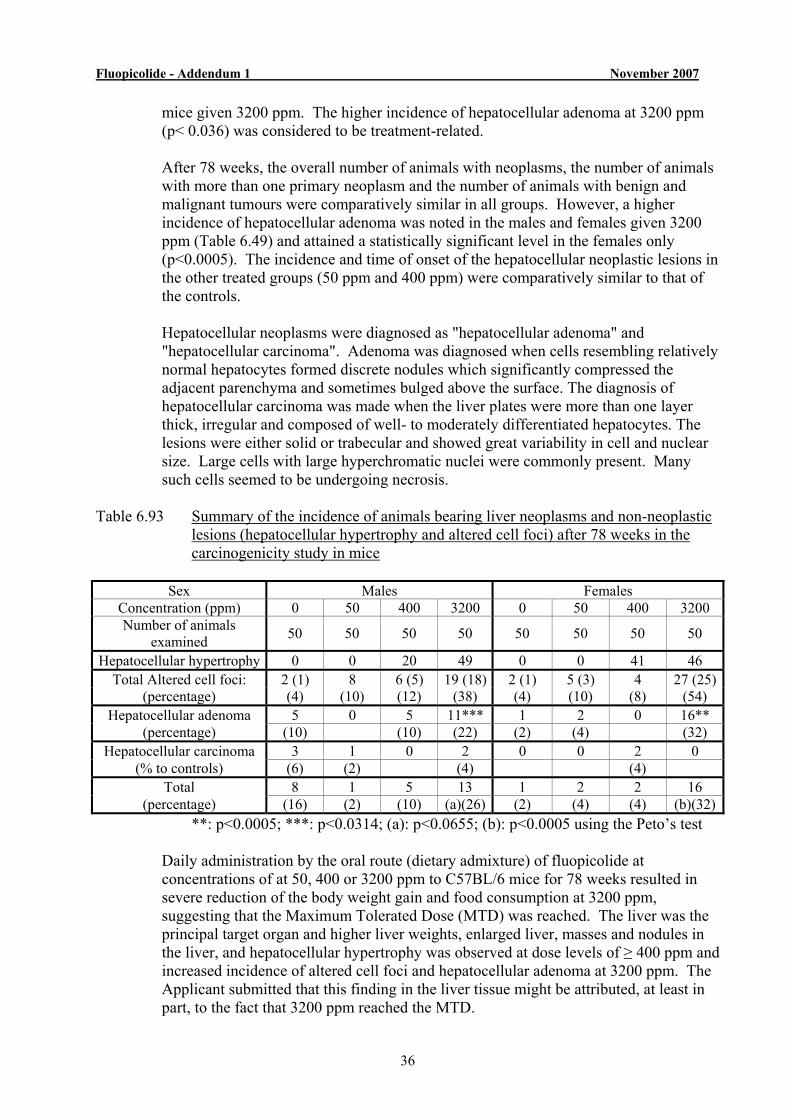
After 78 weeks, the overall number of animals with neoplasms, the number of animals
with more than one primary neoplasm and the number of animals with benign and malignant tumours were comparatively similar in all groups. However, a higher incidence of hepatocellular adenoma was noted in the males and females given 3200 ppm (Table 6.49) and attained a statistically significant level in the females only (p<0.0005). The incidence and time of onset of the hepatocellular neoplastic lesions in the other treated groups (50 ppm and 400 ppm) were comparatively similar to that of the controls.
Hepatocellular neoplasms were diagnosed as "hepatocellular adenoma" and
"hepatocellular carcinoma". Adenoma was diagnosed when cells resembling relatively normal hepatocytes formed discrete nodules which significantly compressed the adjacent parenchyma and sometimes bulged above the surface. The diagnosis of hepatocellular carcinoma was made when the liver plates were more than one layer thick, irregular and composed of well- to moderately differentiated hepatocytes. The lesions were either solid or trabecular and showed great variability in cell and nuclear size. Large cells with large hyperchromatic nuclei were commonly present. Many such cells seemed to be undergoing necrosis.
Table 6.93 Summary of the incidence of animals bearing liver neoplasms and non-neoplastic
lesions (hepatocellular hypertrophy and altered cell foci) after 78 weeks in the carcinogenicity study in mice
Sex Males Females
Concentration (ppm) 0 50 400 3200 0 50 400 3200 Number of animals
examined 50 50 50 50 50 50 50 50
Hepatocellular hypertrophy 0 0 20 49 0 0 41 46 Total Altered cell foci: 2 (1) 8 6 (5) 19 (18) 2 (1) 5 (3) 4 27 (25)
(percentage) (4) (10) (12) (38) (4) (10) (8) (54) Hepatocellular adenoma 5 0 5 11*** 1 2 0 16**
(percentage) (10) (10) (22) (2) (4) (32) Hepatocellular carcinoma 3 1 0 2 0 0 2 0
(% to controls) (6) (2) (4) (4) Total 8 1 5 13 1 2 2 16
(percentage) (16) (2) (10) (a)(26) (2) (4) (4) (b)(32)**: p<0.0005; ***: p<0.0314; (a): p<0.0655; (b): p<0.0005 using the Peto’s test
Daily administration by the oral route (dietary admixture) of fluopicolide at
concentrations of at 50, 400 or 3200 ppm to C57BL/6 mice for 78 weeks resulted in severe reduction of the body weight gain and food consumption at 3200 ppm, suggesting that the Maximum Tolerated Dose (MTD) was reached. The liver was the principal target organ and higher liver weights, enlarged liver, masses and nodules in the liver, and hepatocellular hypertrophy was observed at dose levels of ≥ 400 ppm and increased incidence of altered cell foci and hepatocellular adenoma at 3200 ppm. The Applicant submitted that this finding in the liver tissue might be attributed, at least in part, to the fact that 3200 ppm reached the MTD.
Fluopicolide - Addendum 1 November 2007
37
The NOAEL in the 78-week dietary study in mice was 50 ppm (corresponding to 7.9
mg/kg bw/day in males and 11.5 mg/kg/day in females) based on increased liver weights, enlarged liver, masses and nodules in the liver, and hepatocellular hypertrophy at dose levels of ≥ 400 ppm (corresponding to 64.5 mg/kg bw/day for males and 91.9 mg/kg bw/day for the females). Fluopicolide caused an increase in hepatocellular adenomas in male and female mice at a dose level of 3200 ppm a dose level at which the MTD had been attained by a mechanism considered to be not relevant to humans.
(Chevalier, 2003)
Open point 2.3 The amount of bioavailable fluopicolide after oral administration to be agreed on in an experts’ meeting
See reporting table 2(8).
The Applicant has submitted the position paper - Evaluation of the oral bioavailability of Fluopicolide in the rat. - Fisher, P. Dated: 10th April 2007. See Appendix 4.
RMS Comment: Extent of oral absorption and correction factor for AOEL The main route of elimination of radiolabel is in faeces. The critical point is the
difference in biliary excretion levels between pyridyl and phenyl radiolabel and the biological reasons for such a difference. For the biliary studies, recovery of radiolabel was excellent, approximately 100% so justification for attempting to use another study in which biliary study is unknown is not necessary. "A correction factor of 0.62 was allowed to account for the extent of oral absorption which is based on that determined for the pyridyl radiolabel in the biliary excretion study. The basis for using the lower oral absorption estimate (pyridyl radiolabel - 62% rather than phenyl radiolabel - 80% or an average of the two is because the mechanism or biological reasons for the difference is unclear and hence the more conservative estimate has been relied upon for the derivation of the AOEL."
Fluopicolide - Addendum 1 November 2007
38
B.6.10.2 Acute Reference Dose (ARfD)
Open point 2.4 The need for setting an ARfD, and the most relevant study to be considered, to be discussed in an experts’ meeting See reporting table 2(12).
A positon paper has been submitted by the Applicant – See Appendix 5. AEC63S206
(fluopicolide) - Waiver for an Acute Reference Dose (ARfD) setting. (Payraudeau, V. Dated : 7th March 2006. Report No. M-269338-01-1)
The RMS has proposed an ARfD in the DAR as follows: Fluopicolide is of relatively low acute toxicity. Rabbits appeared to be significantly
more sensitive compared with other species (rats, mice and dogs) investigated but the clinical findings suggest that toxicity in dams at the LOAEL and indeed at higher dose levels occurred only after repeat administrations. Applying the NOAEL in the 28-day dietary study in rats 200 ppm (17.7 mg/kg bw/day) for systemic toxicity based on impaired growth and histopathological changes in the liver and kidney at 1400 ppm (106 mg/kg bw/day), the ARfD is 0.18 mg/kg bw/day and allows for a 100-fold safety margin.
Further discussions of this can also be found in the reporting table and evaluation table. B.6.11.2 Acute dermal toxicity (IIIA 7.1.2)
Data requirement (2.1) Applicant to provide a GLP revision of the acute dermal study (Krotlinger 2003)
The applicant announced in the written procedure that the report M-220872-02-1 (Krotlinger 2003) is available and can be submitted immediately. See reporting table 2(16). The dose applied to animals was 2000 mg/kg/bw. The Applicant has submitted a revised GLP compliant revision of the study report.
Fluopicolide - Addendum 1 November 2007
39
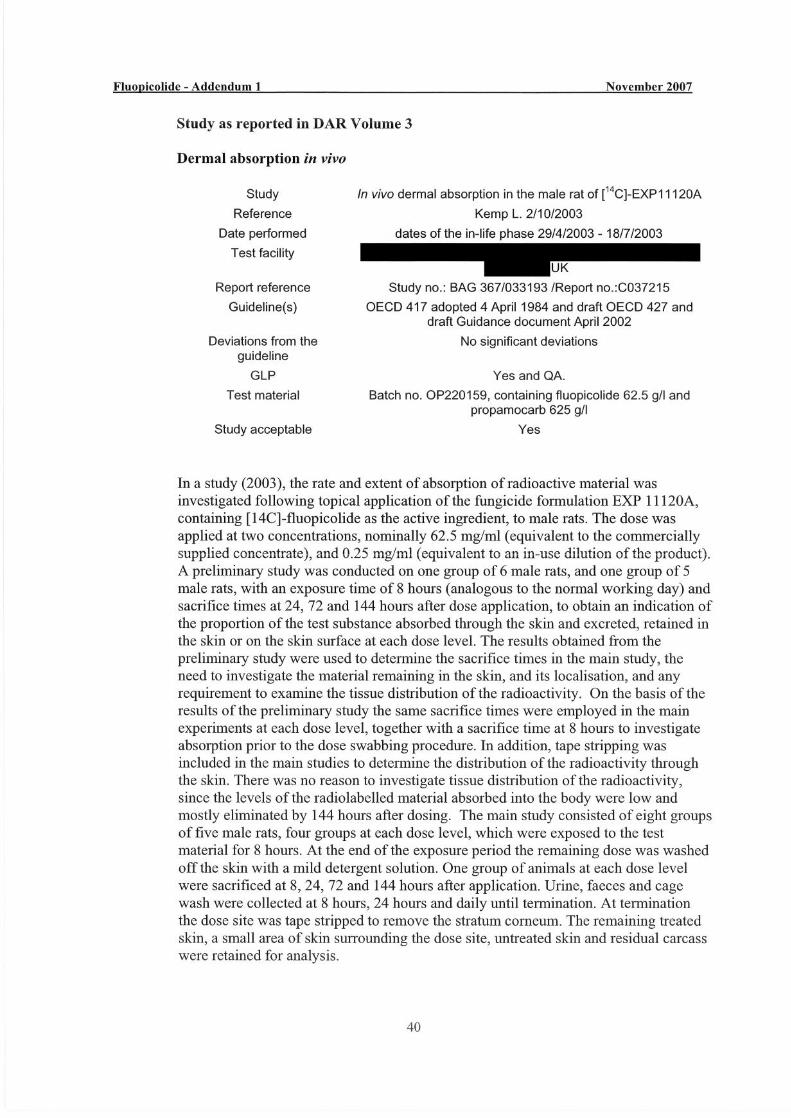
B.6.12 Dermal absorption studies (IIIA 7.3)
Open point 2.5 RMS to provide further details on the results of the in vivo dermal absorption study (see comment by NL) in an addendum
See reporting table 2(18).
Open point 2.6 Dermal absorption to be discussed in a meeting of experts See reporting table 2(19).
Dermal absorption is to be discussed at the Expert Meeting. See DAR and Evaluation
Table for details. As requested, please see below for further details on the results of the in vivo dermal absorption study:
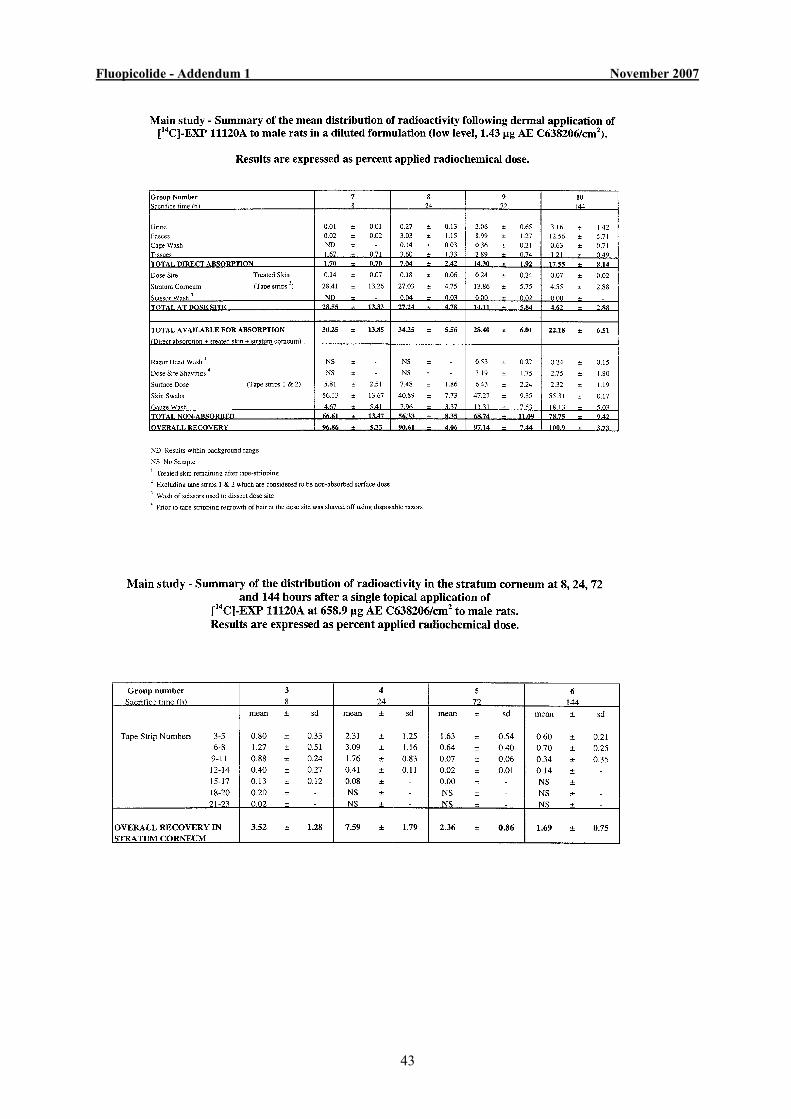
Discussion of in vivo dermal absorption Further information on recoveries from the stratum corneum and urinary elimination
data are been requested. The RMS notes that the relevant information on recoveries are incorporated in summary table provided for the study (reference B 6.12.2). It appears from the table that the row for sacrifice times is not completed and this is corrected in the text in the addendum below.
The RMS notes in the estimate of dermal absorption (reference B6.12.3 DAR Vol 3)
that correcting for comparative absorption for rat and human skin on the basis that absorption for rat skin is 11.48x greater for the concentrate and 8.07x greater for the in-use dilution the estimates of dermal absorption for human skin are 0.24 % for the concentrate and 2.75 % for the in-use dilution.
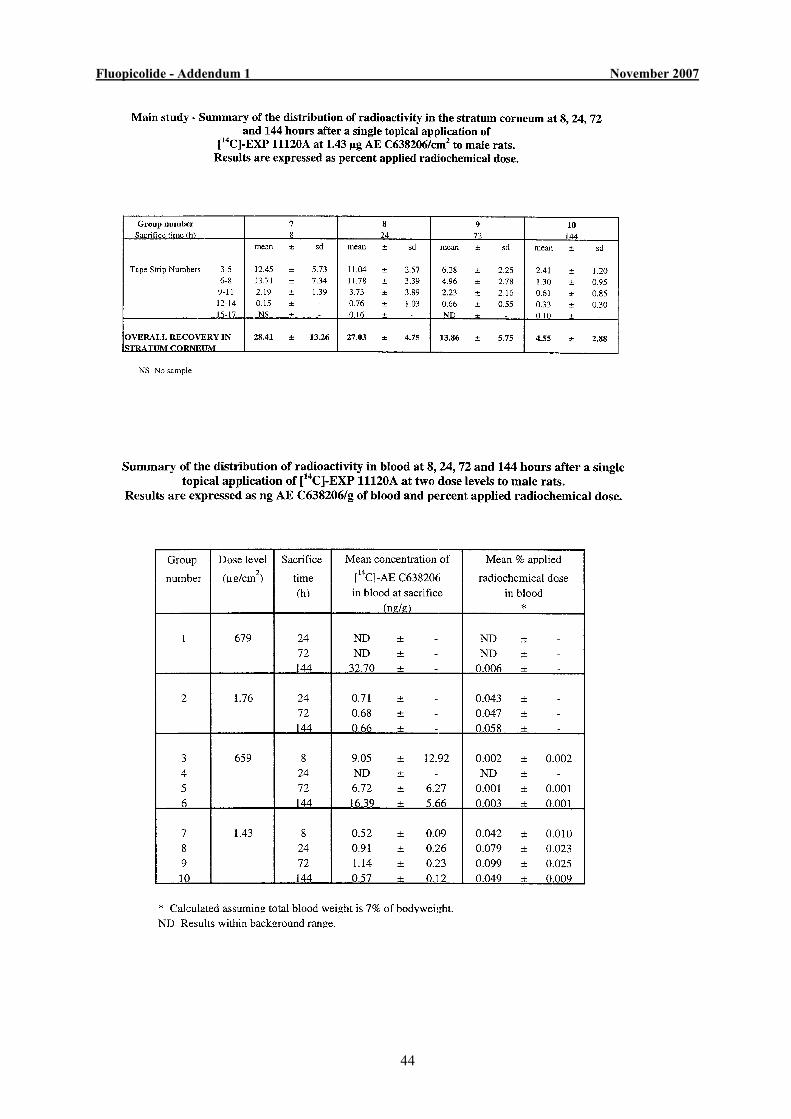
The estimates of dermal absorption were based on all the material present in the skin
after 144 hours collection of urine as the amount of radiolabel in recovered in the urine continued to increase up to 144 h whilst the amount of radiolabel recovered in the skin including the stratum corneum continued to decrease over this period such that no conclusions can be drawn on which fraction of radiolabel in the stratum corneum is not bioavailable.
The most critical factor in the estimate of the dermal absorption are the findings in the
in vitro dermal absorption study in rat and human skin used as a correction for dermal absorption for the in vivo rat study. No questions have been raised on this critical aspect of the assessment. Considering the already very low estimates of dermal absorption obtained, there is unlikely to be any value in a discussion over which number of tape stripping should be considered relevant, noting that the Rapporteur has taken the worst case estimates.
Nonetheless the relevant tables have been provided below for discussion at the expert
meeting.
Fluopicolide - Addendum 1 November 2007
41
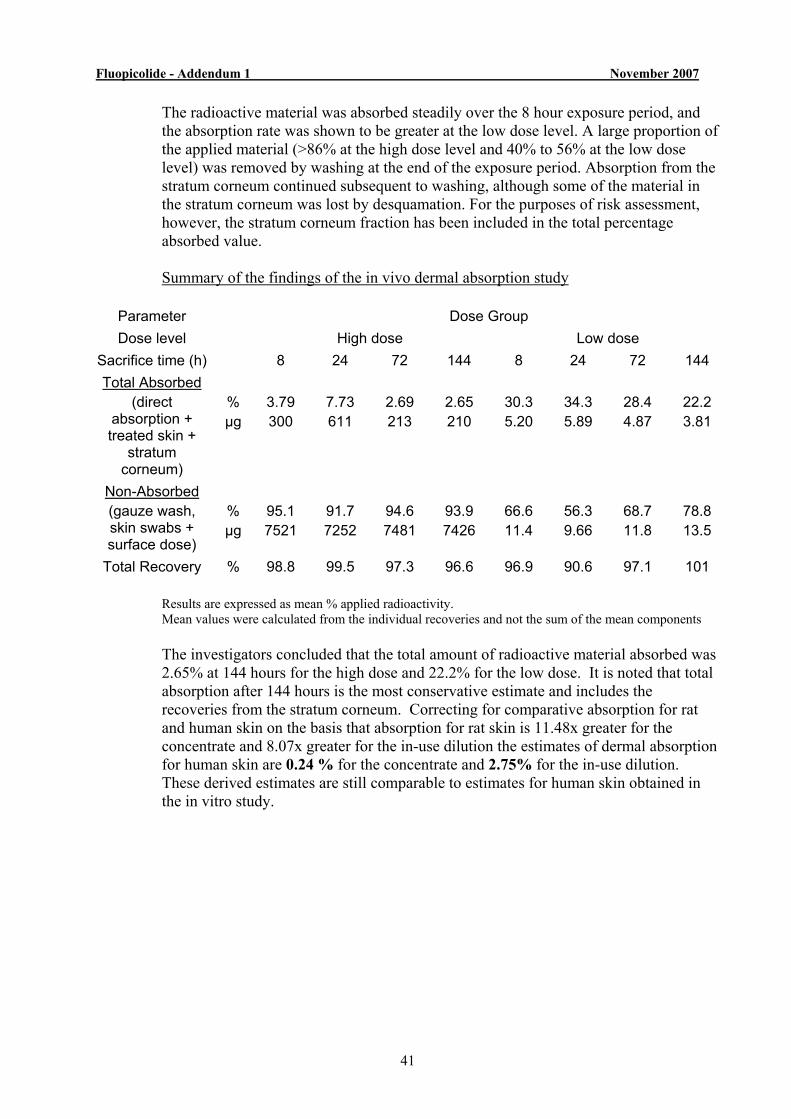
The radioactive material was absorbed steadily over the 8 hour exposure period, and the absorption rate was shown to be greater at the low dose level. A large proportion of the applied material (>86% at the high dose level and 40% to 56% at the low dose level) was removed by washing at the end of the exposure period. Absorption from the stratum corneum continued subsequent to washing, although some of the material in the stratum corneum was lost by desquamation. For the purposes of risk assessment, however, the stratum corneum fraction has been included in the total percentage absorbed value.
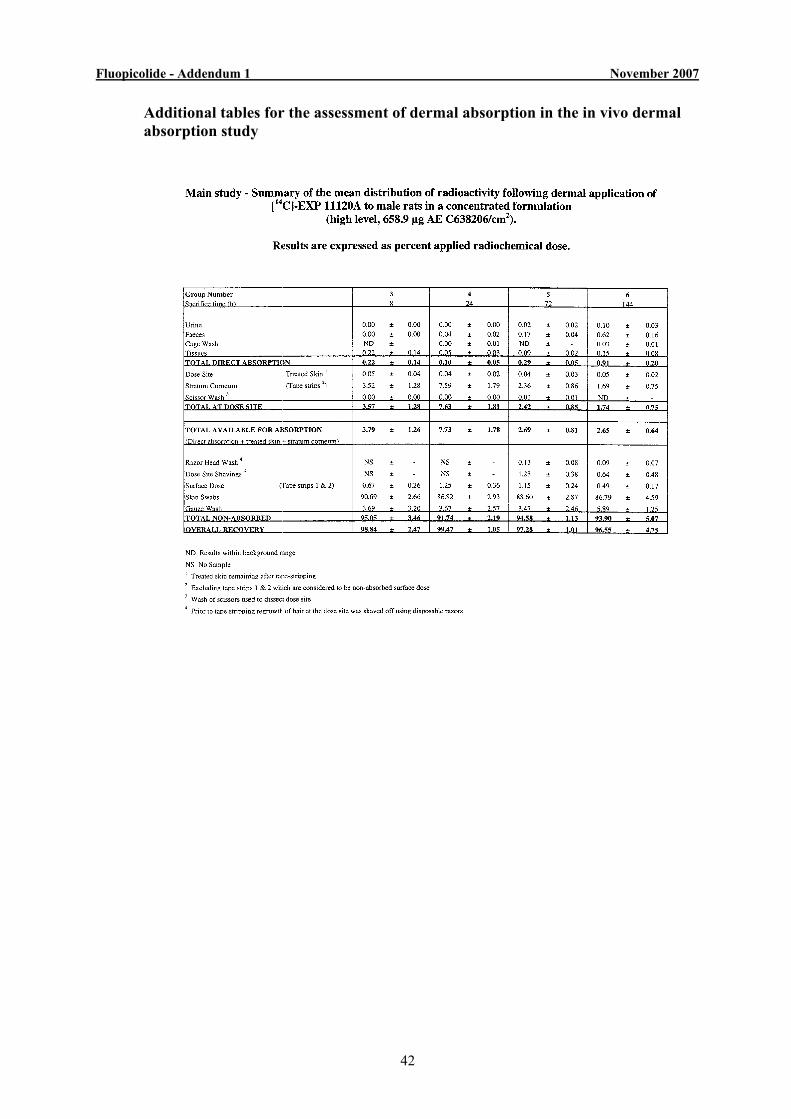
Summary of the findings of the in vivo dermal absorption study
Parameter Dose Group Dose level High dose Low dose
Sacrifice time (h) 8 24 72 144 8 24 72 144 Total Absorbed
(direct absorption + treated skin +
stratum corneum)
% µg
3.79 300
7.73 611
2.69 213
2.65 210
30.3 5.20
34.3 5.89
28.4 4.87
22.2 3.81
Non-Absorbed (gauze wash, skin swabs + surface dose)
% µg
95.1 7521
91.7 7252
94.6 7481
93.9 7426
66.6 11.4
56.3 9.66
68.7 11.8
78.8 13.5
Total Recovery % 98.8 99.5 97.3 96.6 96.9 90.6 97.1 101 Results are expressed as mean % applied radioactivity. Mean values were calculated from the individual recoveries and not the sum of the mean components The investigators concluded that the total amount of radioactive material absorbed was
2.65% at 144 hours for the high dose and 22.2% for the low dose. It is noted that total absorption after 144 hours is the most conservative estimate and includes the recoveries from the stratum corneum. Correcting for comparative absorption for rat and human skin on the basis that absorption for rat skin is 11.48x greater for the concentrate and 8.07x greater for the in-use dilution the estimates of dermal absorption for human skin are 0.24 % for the concentrate and 2.75% for the in-use dilution. These derived estimates are still comparable to estimates for human skin obtained in the in vitro study.
Fluopicolide - Addendum 1 November 2007
42
Additional tables for the assessment of dermal absorption in the in vivo dermal absorption study
Fluopicolide - Addendum 1 November 2007
43
Fluopicolide - Addendum 1 November 2007
44
Fluopicolide - Addendum 1 November 2007
45
B.6.12.3 Summary of dermal absorption and calculation of dermal absorption values
(As reported in DAR Volume 3) In an in vitro dermal absorption study using rat and human skin, the investigators
concluded that the data showed the total amounts of applied radioactivity absorbed by 24 hours at the high dose level were 0.022% and 0.172% while at the low dose level the amounts absorbed were 1.454% and 14.26% in human and rat skin, respectively. The total amount of applied radioactivity absorbed by 24 hours was 7.800 times greater for rat skin than human skin following application of the high level formulation, and 9.807 times greater for rat skin than human skin following the low dose application.
However, the reviewer noted that estimates of dermal absorption for risk assessment
must include the absorbed and absorbable fraction present and biologically available in particular from in vitro skin samples. Hence the estimates of comparative relative dermal absorption for rat skin compared with human skin were 11.48 times greater for the high dose and 8.07 times greater for the low dose. In vivo data in rats showed that the amount of radiolabel in blood continued to increase up to 144 hours suggesting that bioavailable radiolabel in the skin should not be discounted.
In the in vivo dermal absorption study in rats, the investigators concluded that the total
amount of radioactive material absorbed was 2.65% at 144 hours for the high dose and 22.2% for the low dose. It is noted that total absorption after 144 hours is the most conservative estimate and includes the recoveries from the stratum corneum. Correcting for comparative absorption for rat and human skin on the basis that absorption for rat skin is 11.48x greater for the concentrate and 8.07x greater for the in-use dilution the estimates of dermal absorption for human skin are 0.24 % for the concentrate and 2.75 % for the in-use dilution. These derived estimates are still comparable to estimates for human skin obtained in the in vitro study.
Fluopicolide - Addendum 1 November 2007
46
B.6.1.4.1 Assessment of Relevance of Groundwater metabolites
Open Point 2.10, 3.6, 4.20 & 5.12: RMS to present the complete assessment for the relevance of ground water metabolites in an addendum. Special attention should be paid to the fact that at this stage for metabolites M-01, M-05 and M-10 the trigger of 0.75 μg/L is also exceeded either in the lysimeter or the FOCUS modelling.
In the environmental fate and behaviour assessments Sections B8.9 and B8.10, of the original DAR, a need for an assessment of the relevance of the metabolites M-01, M-05, M-10, M-11, M-12, M-13 and M-14 was identified. These metabolites were either predicted to occur in groundwater at >0.1 µg/l or were found in lysimeter leachate at an annual average concentration >0.1 µg/l. New FOCUS groundwater modelling has now been submitted by the applicant and this has been evaluated by the RMS and presented in Section B.8.6.2 of Addendum 1 (November 2007). Following consideration of this new FOCUS groundwater modelling, the following metabolites are predicted to have potential to exceed 0.1 µg/l in groundwater: M-01, M-03 (acidic soils), M-05, M-10, M-11, M-12 and M-13 (NB. M-14 was not predicted >0.1 µg/l in the new modelling, but it was >0.1 µg/l in the lysimeter leachate). Following these findings, a full revised relevance of metabolites in groundwater assessment following EU Guidance Document - Sanco/221/200-rev 10, 25 February 2003 is presented below for all those metabolites that exceed 0.1 µg/l in either consideration:
The assessment follows the step-wise approaches as outlined in the Guidance Document.
STEP 1: EXCLUSION OF DEGRADATION PRODUCTS OF NO CONCERN All of the metabolites observed in the soil metabolism and lysimeter studies contain
either the pyridine ring or the phenyl ring and therefore are not automatically of no concern. In addition there was insufficient information available on their possible natural occurrence and/or of their toxicological or ecotoxicological properties prior to initiating the testing program (See Appendix 1 for chemical structures).
STEP 2: QUANTIFICATION OF POTENTIAL GROUNDWATER
CONTAMINATION
As summarised in the original DAR a comprehensive range of studies have been conducted under laboratory, outdoor and field conditions to quantify the potential concentrations in groundwater. The following metabolites were identified in the original DAR to be < 0.l µg/l: M-15 (AE 1413903 or P8) and M-02 (AE C657188 or PCA). Based on the new FOCUS groundwater modelling the following metabolites are predicted to have potential to exceed 0.1 µg/l in groundwater: M-01, M-03 (acidic soils), M-05, M-10, M-11, M-12 and M-13. Therefore, a summary of the overall
Fluopicolide - Addendum 1 November 2007
47
position comparing both results are presented below (See Section B.8.6.2 for full details):
Comparison of results with original groundwater assessment in DAR, B.8.6.2
Metabolites exceeding 0.1 µg/l The original groundwater assessment for fluopicolide and its metabolites (reported in
the DAR, B.8.6.2) was carried out using FOCUS PELMO with standard degradation and sorption parameters and for use on vines, assumed greater crop interception than considered here. The results indicated that parent and the metabolites, M-01, M-03, M-05, M-10, M-11, M-12 and M-13 had potential to exceed 0.1 µg/l at various scenarios (see Table 8.32, Addendum 1(Nov 2007)).
The new groundwater modelling with PELMO (assuming less crop interception for
vines) and PEARL (incorporating sorption kinetics), results in the same metabolites being predicted to have potential to contaminate groundwater above 0.1 µg/l. No additional metabolites are predicted to exceed 0.1 µg/l, following proposed use of fluopicolide to vines.
The original groundwater assessment (DAR, B.8.6.2) with FOCUS PELMO assumed
application to potatoes, once every 3 years. It resulted in predicted concentrations of fluopicolide being < 0.1 µg/l, but metabolites M-01, M-5, M-10, M-11, M-12 and M-13 were predicted to have potential to contaminate groundwater > 0.1 µg/l.
The new groundwater modelling with PELMO (assuming application to potatoes also
every 2 and every 3 years) and with PEARL (incorporating sorption kinetics), results in the same metabolites being predicted to have potential to contaminate groundwater above 0.1 µg/l. However, for application every year, parent compound and M-03 are also predicted to exceed 0.1 µg/l for certain scenarios.
Predicted concentrations of M-03 exceed 0.1 µg/l in both the PEARL and PELMO
models, following application to potatoes every 2 years, and also in PEARL after application every 3 years, (though not in PELMO). Following application to potatoes every 3 years, M-13 did not exceed 0.1 µg/l in PEARL, though it did at one scenario in PELMO.
Number of scenarios where 0.1 µg/l is exceeded For use of fluopicolide on vines, the number of scenarios where 0.1 µg/l was exceeded
by parent or metabolites is almost the same, when comparing the results of new and previous PELMO modelling. Incorporation of sorption kinetics in PEARL modelling, gave slightly fewer scenarios exceeding 0.1 µg/l for parent, M-05, M-10 and M-12, but otherwise was similar.
For use of fluopicolide on potatoes, the results of PELMO modelling for application
once every 3 years are essentially the same as previously reported in the DAR. Assuming more frequent application, i.e. every year or every 2 years, modelling with PELMO gave a greater number of scenarios where 0.1 µg/l was exceeded, as shown in Table 8.39.
Fluopicolide - Addendum 1 November 2007
48
Incorporation of sorption kinetics in PEARL modelling for use on potatoes generally
gave an increased number of scenarios at which concentrations of metabolites exceeded 0.1 µg/l, (increasing with frequency of application). There were some exceptions: for M-13, the number of scenarios with concentrations > 0.1 µg/l were similar to those with PELMO and for application every 3 years were all <0.1 µg/l in PEARL. For M-12, the number of scenarios with concentrations >0.1µg/l were slightly fewer in PEARL, than those with PELMO. For M-11, the number of scenarios with concentrations >0.1µg/l were one less than in PEARL, for application once every 3 years).
Differences in 80th percentile concentrations of parent and metabolites
For use of fluopicolide on vines, the assumption of less crop interception in PELMO modelling resulted in higher 80th percentile annual average concentrations for parent and metabolites, as would be expected. The incorporation of sorption kinetics in PEARL modelling gave lower PECgw values for parent fluopicolide, than in the original PELMO assessment, but in some cases concentrations of metabolites were higher (e.g. M-01, M-03, M-05, M-10, M-11, M-12 and M-13. Compare Tables 8.31 and 8.32).
For use of fluopicolide on potatoes, revised PELMO modelling assuming more frequent
application (every year or every 2 years) gave higher PECgw values for parent and metabolites, as would be expected. Incorporating sorption kinetics into PEARL modelling generally gave similar or slightly lower PECgw, compared to the results of PELMO modelling, with application every 3 years. (See Table 8.38 compared with the column for “application 1 in 3 years” of Table 8.39, the results of which are equivalent to those originally reported in the DAR).
For application to potatoes every 2 years, PEARL modelling gave a slightly higher 80th
percentile concentration for M-05, but similar or lower concentrations for parent and other metabolites, compared to corresponding results with PELMO. For application every 3 years, PEARL gave higher 80th percentile concentrations for M-03, M-05 and M-14, but similar or lower concentrations for parent and the other metabolites, compared to corresponding results with PELMO.
Conclusion on potential groundwater contamination: For use on vines, fluopicolide is predicted to contaminate groundwater above the maximum acceptable concentration (0.1 µg/l) at one or two of the 7 scenarios modelled, (Châteaudun and or Piacenza). Concentrations of the metabolites M-01, M-05, M-10, M-11, M-12 and M-13 were predicted to exceed 0.1 µg/l in groundwater. Of these, M-01, M-05, M-10, M-11 and M-12 exceeded 0.1 µg/l in all, or almost all of the scenarios simulated in both PELMO and PEARL. In particular, predicted concentrations of M-01 were significantly higher than this limit (range 1.6-6.3 µg/l). Metabolites M-03 and M-13 only exceeded 0.1 µg/l in some scenarios, (and for M-03 the scenarios were those with acidic soils). Therefore, the relevance of these metabolites needs to be assessed further, in accordance with the EU Guidance Document on the assessment of the relevance of metabolites in groundwater.
Fluopicolide - Addendum 1 November 2007
49
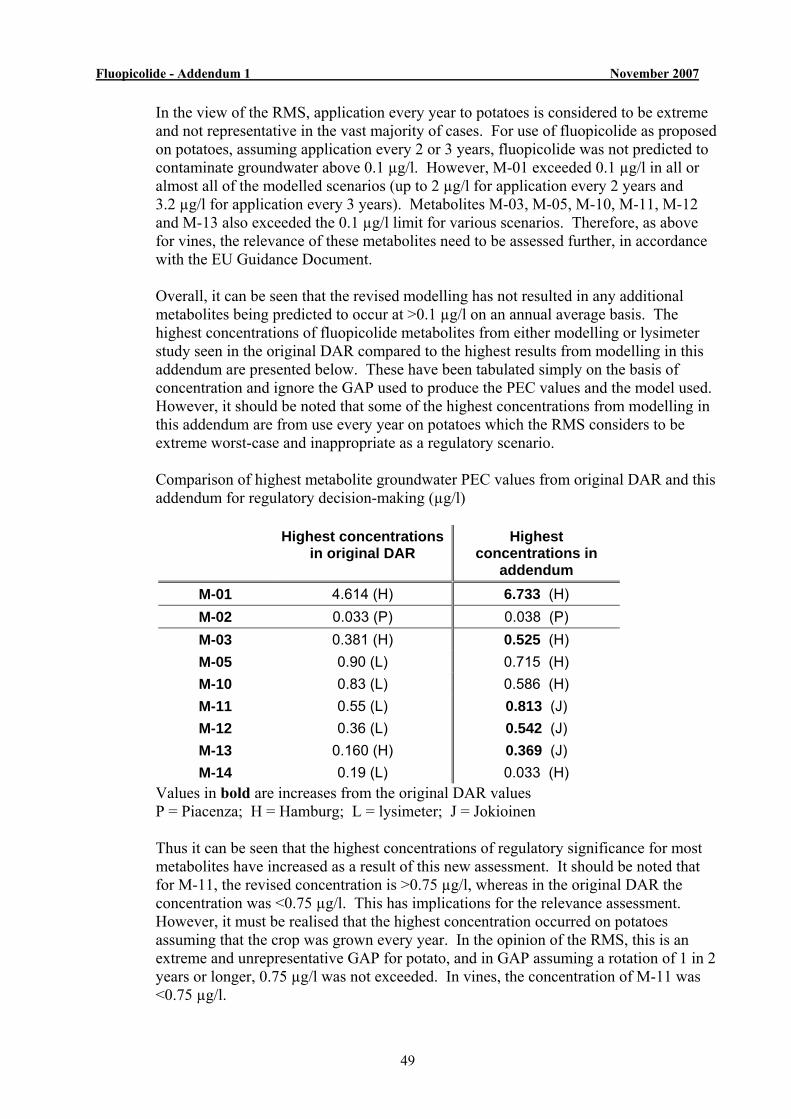
In the view of the RMS, application every year to potatoes is considered to be extreme and not representative in the vast majority of cases. For use of fluopicolide as proposed on potatoes, assuming application every 2 or 3 years, fluopicolide was not predicted to contaminate groundwater above 0.1 µg/l. However, M-01 exceeded 0.1 µg/l in all or almost all of the modelled scenarios (up to 2 µg/l for application every 2 years and 3.2 µg/l for application every 3 years). Metabolites M-03, M-05, M-10, M-11, M-12 and M-13 also exceeded the 0.1 µg/l limit for various scenarios. Therefore, as above for vines, the relevance of these metabolites need to be assessed further, in accordance with the EU Guidance Document. Overall, it can be seen that the revised modelling has not resulted in any additional metabolites being predicted to occur at >0.1 µg/l on an annual average basis. The highest concentrations of fluopicolide metabolites from either modelling or lysimeter study seen in the original DAR compared to the highest results from modelling in this addendum are presented below. These have been tabulated simply on the basis of concentration and ignore the GAP used to produce the PEC values and the model used. However, it should be noted that some of the highest concentrations from modelling in this addendum are from use every year on potatoes which the RMS considers to be extreme worst-case and inappropriate as a regulatory scenario. Comparison of highest metabolite groundwater PEC values from original DAR and this addendum for regulatory decision-making (µg/l)
Highest concentrations in original DAR
Highest concentrations in
addendum M-01 4.614 (H) 6.733 (H) M-02 0.033 (P) 0.038 (P) M-03 0.381 (H) 0.525 (H) M-05 0.90 (L) 0.715 (H) M-10 0.83 (L) 0.586 (H) M-11 0.55 (L) 0.813 (J) M-12 0.36 (L) 0.542 (J) M-13 0.160 (H) 0.369 (J) M-14 0.19 (L) 0.033 (H)
Values in bold are increases from the original DAR values P = Piacenza; H = Hamburg; L = lysimeter; J = Jokioinen Thus it can be seen that the highest concentrations of regulatory significance for most metabolites have increased as a result of this new assessment. It should be noted that for M-11, the revised concentration is >0.75 µg/l, whereas in the original DAR the concentration was <0.75 µg/l. This has implications for the relevance assessment. However, it must be realised that the highest concentration occurred on potatoes assuming that the crop was grown every year. In the opinion of the RMS, this is an extreme and unrepresentative GAP for potato, and in GAP assuming a rotation of 1 in 2 years or longer, 0.75 µg/l was not exceeded. In vines, the concentration of M-11 was <0.75 µg/l.
Fluopicolide - Addendum 1 November 2007
50
STEP 3: HAZARD ASSESSMENT -- IDENTIFICATION OF RELEVANT METABOLITES
Progressing to step 3 requires the assessment to be conducted in three stages:
• Stage 1: screening for biological activity • Stage 2: screening for genotoxicity • Stage 3: screening for toxicity
STEP 3, Stage 1: screening for biological activity Based on the quantification of potential groundwater contamination the following metabolites are identified as metabolites with the potential to exceed the 0.1 µg/l and need to be considered for biological activity: M-01, M-03, M-05, M-10, M-11, M-12, M-13 and M-14.
One of the key stages in the assessment of potential relevance of a metabolite is the determination of biological activity. Many small molecules with molecular weights below 200 can be found to occur naturally in soil as a result of organic matter decomposition. The key distinguishing feature of the metabolites formed from plant protection products is the potential to have biological activity and therefore retain the properties of the xenobiotic.
As stated in the Guidance Document Sanco/221/2000, rev. 10, 25 Feb 2003, the goal is to identify metabolites which have comparable target activity as the parent active ingredient. It also states that efficacy testing should be focused on the question of comparing the activity against the biological target. Included in this assessment is the structure-activity relationship and the necessary functional groups to give the fungicidal activity that is present in the parent fluopicolide (AE C638206) molecule. The metabolites M-01 (AE C653711), M-02 (AE C657188), M-05 (AE 1344122), M-10 (AE 1344123), M-14 (AE 1388273) and M-15 (AE 1413903) were therefore tested for their fungicidal activity in comparison with the parent AE C638206 (Latorse, M.P., Flahout, J. 2004, C038369) (see Appendix 3 (B.10.7.5). The six metabolites did not show any biological activity in comparative tests with the parent fluopicolide, which showed biological effects in the range of 80 -100%. It is known from the biological screens that both the pyridine and phenyl ring parts of the molecule are required for fungicidal activity therefore the metabolites without both these rings would be predicted to have no fungicidal activity. It is also known that adding functional groups, especially polar ones, to the phenyl ring causes loss of fungicidal activity. Therefore the addition of SO3H in the case of M-15 or SO3H and OH in the case of M-16 would result in the loss of fungicidal activity. Of the remaining metabolites that triggered a consideration of biological activity only M-03, M-11, M-12 (mixture of 2 isomers) and M-13 were not tested for fungicidal activity. Three (M-11, M-12 and M-13) are all single pyridine ring structures and are unlikely to have any significant fungicidal activity. M-03 is a structurally-related transient hydroxylated-derivative of fluopicolide and is an unstable intermediate prior to cleavage of fluopicolide to M-01 and M-02. It is very unstable in water and at

Fluopicolide - Addendum 1 November 2007
51
environmental pH will rapidly degrade to M-01 and M-02 and the RMS considers it inconceivable that significant exposure to M-03 will occur via groundwater. The RMS concludes that all metabolites theoretically occurring in groundwater >0.1µg/L will not retain or express biological activity of the parent, fluopicolide. STEP 3, Stage 2: screening for genotoxicity
In the guidance document Sanco/221/2000 rev.l0, there is a requirement that
metabolites that have shown some potential to be mobile and are not biologically active should be screened for their genotoxic activity in a series of three in vitro genotoxicity studies. These three study types are the Ames test, gene mutation test with mammalian cells and the chromosome aberration test. The guidance document also states that equivocal results in in-vitro studies should be substantiated by in vivo experiments.
Metabolite M-01 The genotoxicity profile of M-01 was assessed in three in vitro and one in vivo assays
and no evidence of genotoxicity was observed in any assays. The in vitro studies were the bacterial gene mutation assay in bacterial cells, V79/HPRT gene locus assay, and unscheduled DNA synthesis (UDS) assay and the mouse micronucleus assay in vivo. Overall, M-01 is not considered a genotoxic compound. Although no in vitro chromosmal aberration study has been performed, the liver UDS assay is considered an acceptable equivalent given the hepatotoxicity of M-01.
Metabolite M-02 The new FOCUS modelling has confirmed the findings of the original DAR and M-02
not to be a significant groundwater metabolite (See Section B.8.6.2, Addendum 1, November 2007). However, genotoxicity data are presented here as supporting information to metabolites with similar structures. The genotoxicity profile of M-02 was assessed in three in vitro assays which included the bacterial gene mutation assay in S. typhimurium strain and E. coli strains, chromosomal aberration assay in cultured human peripheral blood lymphocytes and the V79/HPRT gene locus assay. There was no evidence of genotoxicity in any of the assays. Therefore, as the M-02 is not a significant metabolite or genotoxic it can be considered as non-relevant.
Metabolite M-05 The genotoxicity profile of M-05 was assessed in three in vitro assays which included
the bacterial gene mutation assay, chromosomal aberration assay and the V79/HPRT gene locus assay for forward mutations. There was no evidence of genotoxicity in any of the assays.
Fluopicolide - Addendum 1 November 2007
52
Metabolite M-10 The genotoxicity profile of M-10 was assessed in three in vitro and two in vivo assays.
M-10 was devoid of any mutagenicity potential in the bacterial reverse mutation assay as well as in the chromosome aberration assay performed in human lymphocytes. A positive response was observed in the in vitro mammalian HPRT gene locus assay in Chinese hamster V79 cells. A mouse micronucleus assay and a rat UDS assay were run to assess the genotoxic potential of M-10 in the whole animal. No evidence of genotoxicity was observed in these two in vivo assays at concentrations showing cytotoxicity of the target organs. Therefore, these findings clearly show that the metabolite M-10 is not a genotoxic compound.
Metabolite M-14 The genotoxicity profile of M-14 (AE 1388273 or P7) was assessed in three in vitro
and two in vivo assays. M-14 was devoid of any mutagenicity potential in the bacterial reverse mutation assay as well as in the mammalian HPRT assay in cultured Chinese hamster V79 cells. A positive response was observed in the in vitro chromosomal aberration assay performed in human lymphocytes. A mouse micronucleus assay and a rat UDS assay were run to assess the genotoxic potential of M-14 in the whole animal. There was no evidence of genotoxicity in the two in vivo assays at concentrations showing cytotoxicity of the target organs. Overall, M-14 has no genotoxic potential. In the new groundwater modelling assessment (see See Section B.8.6.2, Addendum 1, November 2007), M-14 has been shown not to be a significant groundwater metabolite. It is therefore concluded that M-14 is a non-relevant metabolite.
Metabolites M-03, M-11, M-12 and M-13 Specific genotoxicity data has not been provided for M-03, M-11, M-12 and M-13. M-03 (P3) is a proposed transient intermediate metabolite of fluopicolide in rats,
formed by hydroxylation of the methyl group adjoining the benzamide group before further metabolism by cleavage to provide M-02, M-01 and their derivative metabolites and conjugates (Figure 6.6). Approximately 10% of a dose of fluopicolide appears to be metabolised via M-03 (based on Table 6.25 of the original DAR). The genotoxic potential of M-03 is considered to be addressed by the specific information on the genotoxic potential of fluopicolide, and the metabolites M-01 and M-02 (see above). M-03 is considered unlikely to be genotoxic.
M-11, M-12 (mixtures of isomers P2a & P2b), M-13 and indeed M-14 have been
shown in the threshold of concern assessment for exposure by the Applicant to be not relevant. Nonetheless, comparison of the molecular structures of the metabolites M-11, M-12 and M-13 with that of M-10 and M-14 for which genotoxicity studies have been conducted suggests that M-11, M-12 and M-13 are quite similar and unlikely to possess a significantly different biological and genotoxic properties than that assessed for M-10 and M-14. M-11, M-12 & M-13 do not have any structural alerts for genotoxicity and are considered unlikely to be genotoxic.
Fluopicolide - Addendum 1 November 2007
53
STEP 3, Stage 3: screening for toxicity
Stage 3 of Step 3 is aimed at the question of whether a metabolite has certain toxicological properties, which - from a regulatory perspective - qualify for considering it “relevant”. A metabolite is considered “relevant” if its toxicological properties lead to a classification as toxic of very toxic (T or T+) according to Directive 67/548/EEC. Therefore, in addition to genotoxicity testing, further toxicity testing has been conducted to determine whether the metabolite has certain toxicological properties which from a regulatory perspective would qualify it to be classified as relevant. These studies include metabolism studies to understand the adsorption, distribution, metabolism and elimination from the body.
Metabolite M-01 Following single oral administration of [14C]-M-01 to the male and female rat at the
rates of 10 and 150 mg/kg most of the administered radioactivity was eliminated in the urine (ca 82 %dose) although the rate of elimination was relatively slow. Lower levels (ca 13 %dose) were eliminated via the faeces. The highest concentrations in tissues were seen in the kidney (ca 0.57 µg equiv./g) and liver (ca 0.44 µg equiv./g) for the 10mg/kg dose group and in the skin & fur (3.8 to 5.0 µg equiv./g), kidneys (2.8 to 3.0 µg equiv./g) and liver (2.1 to 2.3 µg equiv./g) for the 150 mg/kg dose group. Tissue concentrations therefore increased by approximately five-fold for a fifteen-fold increase in dose rate. Overall, multiple dosing (14 daily doses at 10 mg/kg) did not have any significant impact in the absorption, distribution, metabolism and elimination compared to results after single oral dosing. Thus, the results in this study showed that the routes and the rates of excretion were maintained despite the multiple dosing, which meant that most of the radioactivity was eliminated via the urinary route. The distribution pattern in the tissues was also similar between single and multiple dosing with the highest mean concentrations observed in the skin & fur (3.0 µg equiv./g), kidney (1.9 µg equiv./g) and liver (1.3 µg equiv./g). Bioretention or accumulation was therefore not indicated. The routes of biotransformation was similar between dose levels and sexes with hydrolysis of the amide group to form AE C416656, hydroxylation to form hydroxy-BAM (M-04) and subsequent conjugation with either glucuronic acid or sulphate, and the loss of a chlorine atom following glutathione conjugation. Further metabolism of the glutathione group to the mercapturic acid or S-methyl metabolites was observed.
M-01 was shown to be of relatively low acute oral toxicity, however the available data
indicate that it is of greater acute oral toxicity than fluopicolide (LD50 >5000 mg/kg bw). The LD50 of M-01 was found to be >2000 mg/kg bw in males and >500 mg/kg bw in females in a modern study using the acute toxic class method (OECD 423). However, in an older non-GLP study (performed to OECD 401) LD50 values of 1470 (951–2270) and 2330 (1430–3780) mg/kg bw were calculated for male and female rats respectively. The findings of the two studies are therefore inconsistent, but taken together do indicate that M-01 is of slightly greater acute oral toxicity than fluopicolide.
In a 13-week toxicity study performed in CD rats with M-01 at doses up to 2300 ppm,
reduced body weight gains and food consumption was observed at dose levels of ≥ 600 ppm but no target organ toxicity was observed. The NOAEL of M-01 was 180 ppm (equivalent to 14 mg/kg bw/day) in both males and females.
Fluopicolide - Addendum 1 November 2007
54
In comparison, the NOAEL for the fluopicolide 90-day rat study was 100 ppm (equivalent to 7.4 or 8.4 mg/kg bw/d in males and females respectively), based on treatment-related haematological (reduced haemoglobin and haematocrit in male rats), clinical chemistry (increased cholesterol) and urinalysis findings (increased urine volume and specific gravity in females); organ weight changes (increased relative liver and kidney weights in males and relative spleen weight in females) and histopathological changes in the liver and kidneys at the LOAEL of 1400 ppm (equivalent to 109 or 119 mg/kg bw/d in males and females respectively). Findings show that the short-term toxicity of fluopicolide and M-01 is comparable, and therefore that further (long-term) studies with M-01 are not required.
Notifier has, however, provided a 2-year rat chronic toxicity study performed with M-
01. The results of this study indicate that the liver is the target organ of toxicity; a NOAEL of 180 ppm (equivalent to 5.7 and 8.6 mg/kg bw/d in males and females respectively) can be determined. The NOAEL in this study is therefore comparable to the NOAEL of 200 ppm from the rat chronic toxicity/carcinogenicity study performed with fluopicolide, indicating similar long-term toxicity. In the M-01 study, a slight (but not statistically significant) increase in the incidence of hepatocellular adenoma was seen in males at the top dose level of 500 ppm; a dose level considered to exceed the MTD. No evidence of carcinogenicity was seen in this study. A detailed assessment of the carcinogenic potential of M-01 is presented after the conclusion section below.
In conclusion, these data showed that the toxicological profile of the metabolite M-01
is similar to that of fluopicolide. Metabolite M-02 Metabolism studies in rats dosed with [pyridyl-2,6-14C]-M-02 at a nominal dose level
of 10 mg/kg bw showed that the rate of elimination was rapid for both male and female rats with at least 90% of the total administered radioactivity eliminated within the first 48 hours post dose. The total recovery in urine accounted for a mean of 78.5 % dose. Lower levels were found in the faeces with mean values that accounted for cumulative mean values of 6.6 %dose. No pulmonary excretion was detected. The estimated minimum mean level of absorption was calculated to be 87%. Thus this metabolite of fluopicolide demonstrated high oral bioavailability and low potential for bioaccumulation. No sex difference was observed in terms of the routes and rates of elimination of [14C]-M-02. There was little remaining radioactivity in the tissues with 0.23% and 0.30% of the administered dose for males and females respectively. The metabolism investigations showed that M-02 was the major fraction excreted in urine and faeces.
M-02 was shown to be of very low acute toxicity with an oral LD50 of
> 2000 mg/kg bw in rats. Therefore, no classification is required for acute oral toxicity. In a 28-day toxicity study in CD rats with M-02 at doses up to 20000 ppm, there was
no evidence any effects up to and including the top dose ; no target organ toxicity was identified. The NOAEL of M-02 was 20000 ppm, equivalent to 1500 mg/kg bw/day in both males and females.
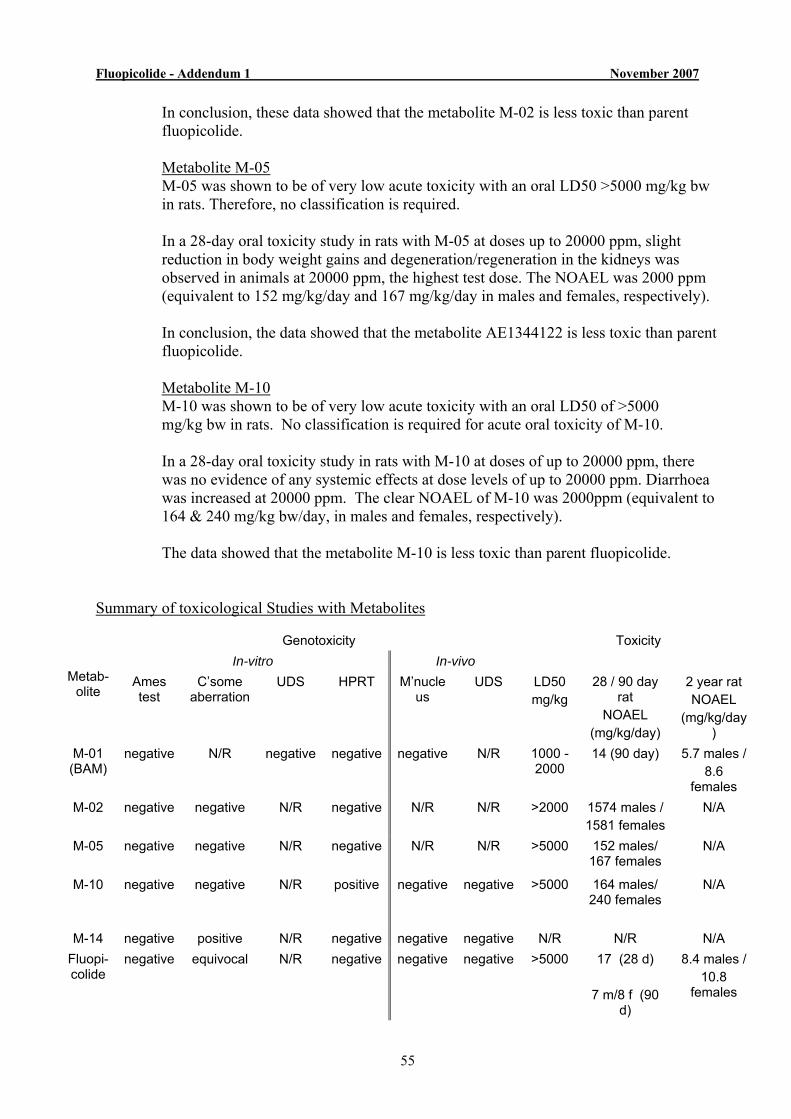
Fluopicolide - Addendum 1 November 2007
55
In conclusion, these data showed that the metabolite M-02 is less toxic than parent fluopicolide.
Metabolite M-05
M-05 was shown to be of very low acute toxicity with an oral LD50 >5000 mg/kg bw in rats. Therefore, no classification is required.
In a 28-day oral toxicity study in rats with M-05 at doses up to 20000 ppm, slight
reduction in body weight gains and degeneration/regeneration in the kidneys was observed in animals at 20000 ppm, the highest test dose. The NOAEL was 2000 ppm (equivalent to 152 mg/kg/day and 167 mg/kg/day in males and females, respectively).
In conclusion, the data showed that the metabolite AE1344122 is less toxic than parent
fluopicolide.
Metabolite M-10 M-10 was shown to be of very low acute toxicity with an oral LD50 of >5000
mg/kg bw in rats. No classification is required for acute oral toxicity of M-10. In a 28-day oral toxicity study in rats with M-10 at doses of up to 20000 ppm, there
was no evidence of any systemic effects at dose levels of up to 20000 ppm. Diarrhoea was increased at 20000 ppm. The clear NOAEL of M-10 was 2000ppm (equivalent to 164 & 240 mg/kg bw/day, in males and females, respectively).
The data showed that the metabolite M-10 is less toxic than parent fluopicolide. Summary of toxicological Studies with Metabolites
Genotoxicity Toxicity In-vitro In-vivo
Metab-olite
Ames test
C’some aberration
UDS
HPRT M’nucleus
UDS LD50 mg/kg
28 / 90 day rat
NOAEL (mg/kg/day)
2 year rat NOAEL
(mg/kg/day)
M-01 (BAM)
negative N/R negative
negative negative N/R 1000 - 2000
14 (90 day)
5.7 males / 8.6
females M-02 negative negative N/R negative N/R N/R >2000 1574 males /
1581 femalesN/A
M-05 negative negative
N/R negative N/R N/R >5000 152 males/ 167 females
N/A
M-10 negative negative
N/R positive negative negative >5000 164 males/ 240 females
N/A
M-14 negative positive N/R negative negative negative N/R N/R N/A Fluopi-colide
negative equivocal N/R negative negative negative >5000 17 (28 d)
7 m/8 f (90 d)
8.4 males / 10.8
females
Fluopicolide - Addendum 1 November 2007
56
N/R – not required according to EC guidance documents Therefore, it can be concluded that none of the metabolites M-01 (BAM), M-02, M-05,
M-10 and M-14 lead to a classification as toxic (T) or very toxic (T+). In addition since the parent is not classified as a reproductive toxicant and is not carcinogenic the metabolites also have no reason to qualify for reproductive or carcinogenic testing. It has been confirmed that none of the metabolites are genotoxic. Therefore from a toxicological perspective all the metabolites pass the assessment of Stages 2 and 3 and are considered non-relevant.
STEP 4: EXPOSURE ASSESSMENT - THRESHOLD OF CONCERN
APPROACH For those metabolites for which the exposure assessment shows they are below the
threshold of concern which is given in the Guidance Document as 0.75 µg/L they can be determined to be non relevant at Step 4. Therefore, based on the data presented in the original DAR and following the new modelling, the following metabolites can be deemed non relevant at this Step: M-03, M-12, M-13 and M-14. However, the following metabolites are identified as requiring a refined risk assessment as the highest concentration in the DAR or addendum evaluation is predicted to be above 0.75 µg/l: M-01, M-05, M-10 and M-11.
Based on the proposed ADI for fluopicolide, 0.08 mg/kg bw, a health based drinking
water limit of 240μg/L can be proposed. This is based on a 60kg person consuming 2L of water per day and allocating 10% of the ADI to drinking water. Predicted levels of the fluopicolide metabolites are all <5% of the health based drinking water limit for fluopicolide. Therefore the metabolites are not considered to present a concern to human health.
STEP 5: REFINED RISK ASSESSMENTS FOR THE REMAINING
METABOLITES The metabolites: M-01, M-05, M-10 and M-11 have been found to lie in the
concentration range between 0.75 µg/L and 10 µg/L. Therefore, a refined risk assessment is presented below:
M-05 was negative in three in vitro genotoxicity assays and is of low acute oral
toxicity and of lower repeat dose toxicity than fluopicolide. M-10 exhibited evidence of genotoxicity in an in vitro assay for gene mutation in
mammalian cells, but was negative in in vivo assays for micronucleus formation and UDS. M-10 is of low acute toxicity and significantly lower repeat dose toxicity than fluopicolide.
M-11 is structurally very similar to M-10. The only difference is the presence of a
hydroxy- group on the pyridinyl ring, which is not a structural alert for genotoxicity. This minor change is considered unlikely to have a significant effect on the observed toxicity of M-11 relative to M-10. The hydroxy- group is likely to enhance the
Fluopicolide - Addendum 1 November 2007
57
excretion of M-11 relative to M-10. Metabolite M-14 is also of a similar structure to M-11, having a hydroxy- group on the ring in place of the carboxy acid moiety and a methylated sulphonic acid group. It is considered that the toxicity of M-11 will be similar to that of M-10 and M-14 and thus lower than that of fluopicolide.
M-01 was negative in three in vitro genotoxicity assays and in an in vivo assay for
micronuclei induction. M-01 is more acutely toxic than fluopicolide, but in 90 day and 2-year studies the toxicity of both compounds is considered equivalent, taking account of dose spacing and relative molecular weights. M-01 had no biological (fungicidal) activity. Predicted exposures to M-01 from fluopicolide use are <5% of the health based Maximum Acceptable Concentration (MAC) of fluopicolide in drinking water.
Predicted Dietary exposure to M-01, M-05, M-10 and M-11 is also expected to be low and would not add significantly to consumer exposure via sources other than drinking water. Therefore the metabolites are not considered to present a concern to human health.
CONCLUSION
To conclude, all the metabolites meet the criteria of the guidance document and are found to be toxicologically non-relevant in groundwater. In addition, the ecotoxocological assessment (see Section B.9.2) also concludes that the metabolites can be considered environmentally 'non-relevant'.
Fluopicolide - Addendum 1 November 2007
58
A FURTHER DETAILED DISCUSSION ON THE CARCINOGENIC POTENTIAL OF M-01 (BAM/ 2.6-DICHLOROBENZAMIDE)
Genotoxicity
BAM has no genotoxic potential and is not considered toxicologically relevant for this criterion. It was negative in a complete range of studies required for the assessment of genotoxic potential.
i) BAM was not mutagenic without and with S9 mix in the plate incorporation as
well as in the pre-incubation modification of the Salmonella/microsome test. ii) BAM was not mutagenic in the V79/HPRT Forward Mutation Assay both with
and without metabolic activation under the conditions of the assay. iii) BAM was negative in the unscheduled DNA synthesis or DNA repair assay using
primary cell cultures of rat hepatocytes. iv) BAM was not genotoxic in the in vivo mouse micronucleus assay in bone marrow
erythrocytes.
Carcinogenicity The RMS has considered the incidence of adenomas in top dose females in the 2-year dietary study in rats with BAM together with other the indications of liver toxicity, evidence of systemic toxicity and the strengths and weaknesses in the two year study. These are covered in more detail in the text and tables below. Evidence of significant toxicity in both sexes was characterised by significant reduction in body weight gain in both sexes at 500 ppm, slightly greater in females than in males (Table 1 and significant reduction in erythrocyte parameters (haemoglobin concentration, erythrocyte counts and haematocrit) occasionally mainly in males and to a lesser extent in females at 500 ppm (Table 2) although statistical significance was not attained on every occasion. These effects on body weight and red blood cell parameters would suggest that at a dose of 500 ppm, the maximum tolerated dose was exceeded. The re-evaluation of the pathological findings in slides produced from liver sections taken in a rat study forms the basis for the assessment of the histopathological findings in the toxicity study. The complete summary of liver findings is provided in Tables 3, 4 and 5a, b & c. i. The incidence of benign hepatocellular adenomas in female rats at the top dose
level was stated to be marginally statistically significant (P=0.049) according to the report of the reviewing pathologist. However the investigating laboratory have subsequently stated that the statistical methods used in this report were not appropriate, and that the tumour incidence in this group is not in fact significant. A statistical re-evaluation by the Notifier identified a P-value of 0.14. However, it should be noted that the statistical evaluation comparing control and top-dose animals is complicated by the small population size for this kind of study and the absence of adenomas in all dose groups except for top dose females.
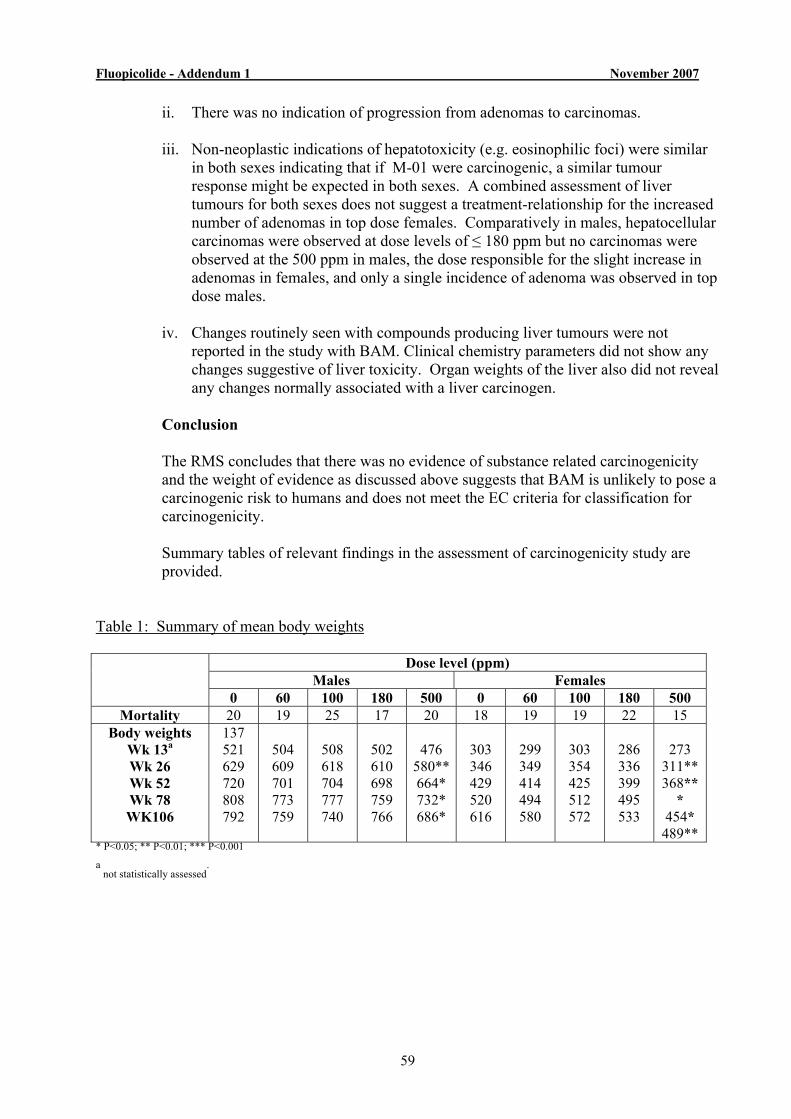
Fluopicolide - Addendum 1 November 2007
59
ii. There was no indication of progression from adenomas to carcinomas. iii. Non-neoplastic indications of hepatotoxicity (e.g. eosinophilic foci) were similar
in both sexes indicating that if M-01 were carcinogenic, a similar tumour response might be expected in both sexes. A combined assessment of liver tumours for both sexes does not suggest a treatment-relationship for the increased number of adenomas in top dose females. Comparatively in males, hepatocellular carcinomas were observed at dose levels of ≤ 180 ppm but no carcinomas were observed at the 500 ppm in males, the dose responsible for the slight increase in adenomas in females, and only a single incidence of adenoma was observed in top dose males.
iv. Changes routinely seen with compounds producing liver tumours were not
reported in the study with BAM. Clinical chemistry parameters did not show any changes suggestive of liver toxicity. Organ weights of the liver also did not reveal any changes normally associated with a liver carcinogen.
Conclusion The RMS concludes that there was no evidence of substance related carcinogenicity and the weight of evidence as discussed above suggests that BAM is unlikely to pose a carcinogenic risk to humans and does not meet the EC criteria for classification for carcinogenicity. Summary tables of relevant findings in the assessment of carcinogenicity study are provided.
Table 1: Summary of mean body weights
Dose level (ppm) Males Females
0 60 100 180 500 0 60 100 180 500 Mortality 20 19 25 17 20 18 19 19 22 15
Body weights Wk 13a
Wk 26 Wk 52 Wk 78 WK106
137 521 629 720 808 792
504 609 701 773 759
508 618 704 777 740
502 610 698 759 766
476
580**664* 732* 686*
303 346 429 520 616
299 349 414 494 580
303 354 425 512 572
286 336 399 495 533
273
311** 368**
* 454* 489**
* P<0.05; ** P<0.01; *** P<0.001
a not statistically assessed
.
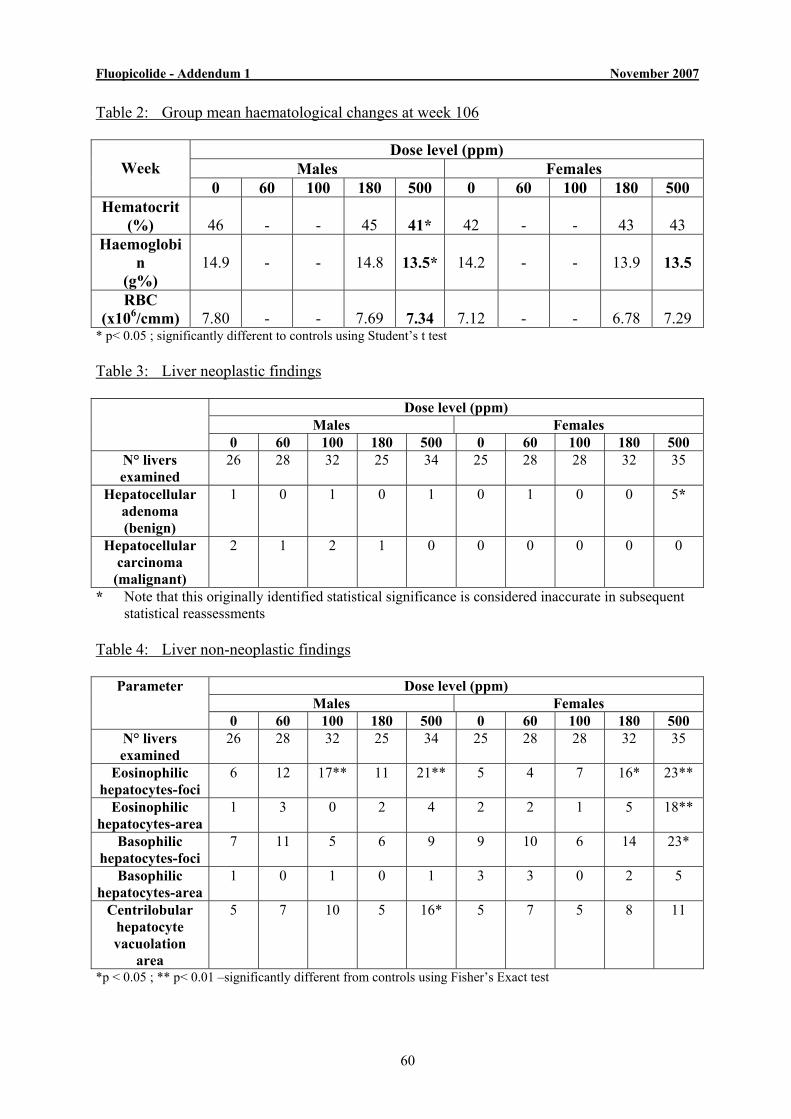
Fluopicolide - Addendum 1 November 2007
60
Table 2: Group mean haematological changes at week 106
Dose level (ppm) Males Females
Week
0 60 100 180 500 0 60 100 180 500 Hematocrit
(%)
46 -
-
45
41*
42
-
-
43
43
Haemoglobin
(g%)
14.9
-
-
14.8
13.5*
14.2
-
-
13.9
13.5
RBC (x106/cmm)
7.80
-
-
7.69
7.34
7.12
-
-
6.78
7.29
* p< 0.05 ; significantly different to controls using Student’s t test Table 3: Liver neoplastic findings
Dose level (ppm) Males Females
0 60 100 180 500 0 60 100 180 500 N° livers examined
26 28 32 25 34 25 28 28 32 35
Hepatocellular adenoma (benign)
1 0 1 0 1 0 1 0 0 5*
Hepatocellular carcinoma
(malignant)
2 1 2 1 0 0 0 0 0 0
* Note that this originally identified statistical significance is considered inaccurate in subsequent statistical reassessments
Table 4: Liver non-neoplastic findings
Dose level (ppm) Males Females
Parameter
0 60 100 180 500 0 60 100 180 500 N° livers examined
26 28 32 25 34 25 28 28 32 35
Eosinophilic hepatocytes-foci
6 12 17** 11 21** 5 4 7 16* 23**
Eosinophilic hepatocytes-area
1 3 0 2 4 2 2 1 5 18**
Basophilic hepatocytes-foci
7 11 5 6 9 9 10 6 14 23*
Basophilic hepatocytes-area
1 0 1 0 1 3 3 0 2 5
Centrilobular hepatocyte vacuolation
area
5 7 10 5 16* 5 7 5 8 11
*p < 0.05 ; ** p< 0.01 –significantly different from controls using Fisher’s Exact test
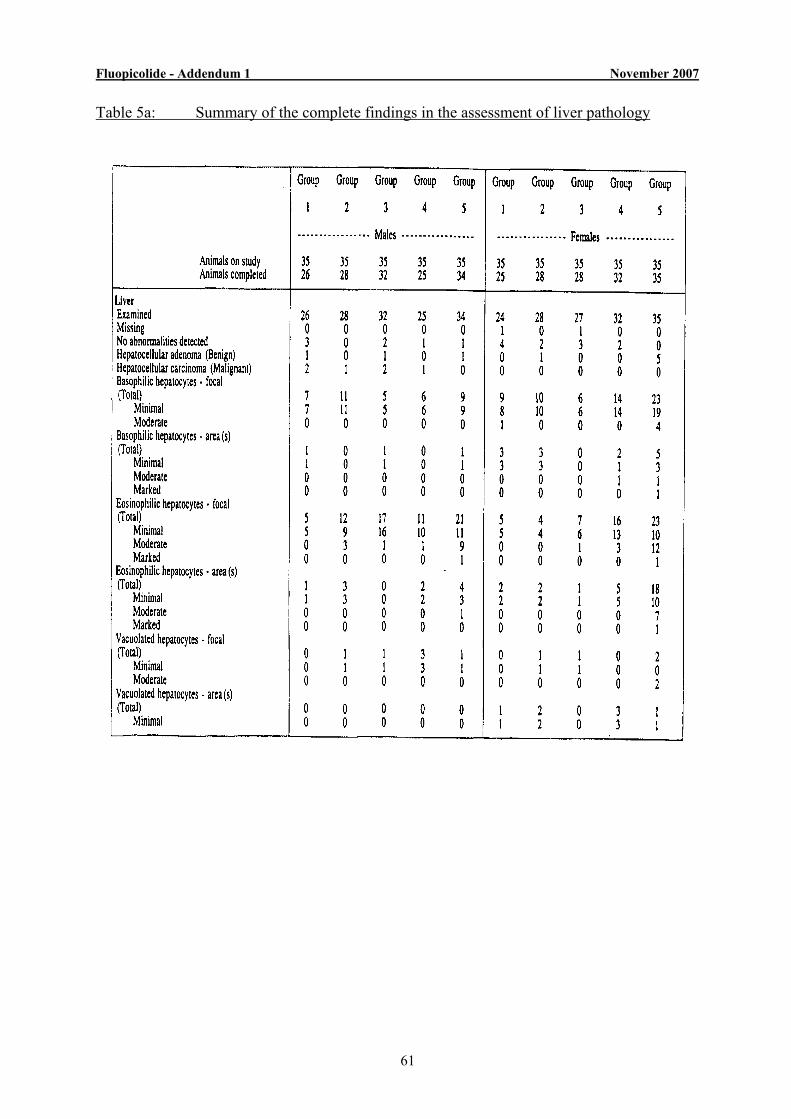
Fluopicolide - Addendum 1 November 2007
61
Table 5a: Summary of the complete findings in the assessment of liver pathology
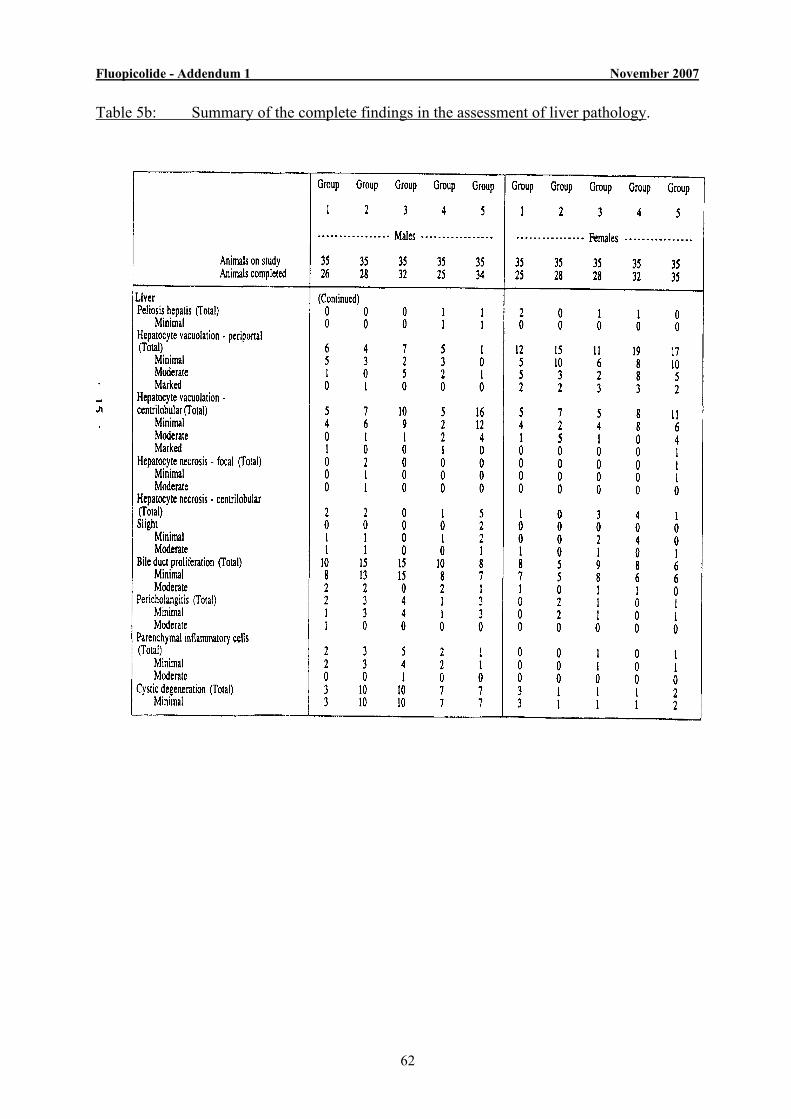
Fluopicolide - Addendum 1 November 2007
62
Table 5b: Summary of the complete findings in the assessment of liver pathology.
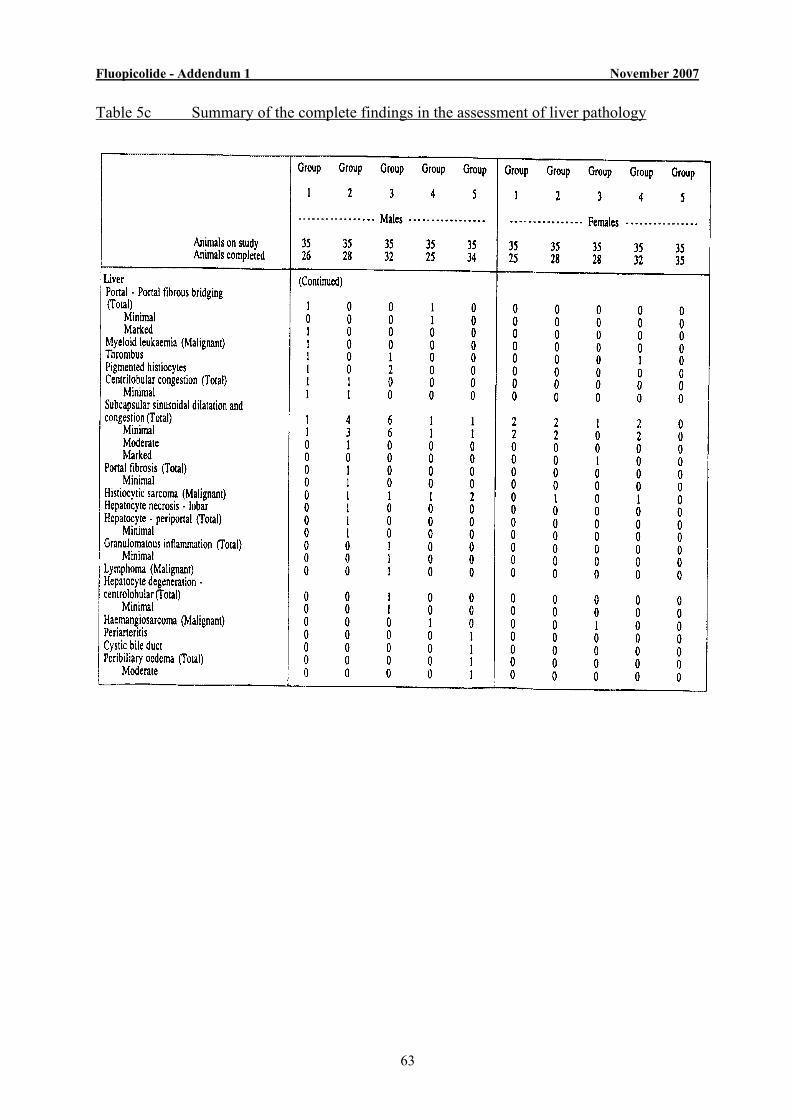
Fluopicolide - Addendum 1 November 2007
63
Table 5c Summary of the complete findings in the assessment of liver pathology
Fluopicolide - Addendum 1 November 2007
64
B.6.8.1 Toxicity studies on metabolites
Open point 2.11 Some metabolites are found in rotational crops. Their toxicity should be discussed compared to the toxicological properties of the parent. See reporting table 2(26). Assessment of toxicological significance of metabolites found in rotational crops but not identified in rat metabolism studies
The metabolites M-04, M-05, M-08 and M-09 found in rotational crops were not found in the rat metabolism studies and therefore and assessment of toxicological relevance is provided. The metabolites are not considered to present any specific significant hazard as they are considered to share the same intermediate metabolic pathways as those found in the rat and share substantial structural similarities with identified or tested rat metabolites. Metabolite M-04 The genotoxicity profile of M-04 was assessed in three in vitro and two in vivo assays. M-04 did not show any mutagenicity potential in the bacterial reverse mutation assay as well as in the mammalian HPRT gene locus in Chinese hamster V79 cells. A positive response was observed after 20 h but not after 3 hours in the test without metabolic activation in the in vitro chromosome aberration assay in human lymphocytes. However, the mouse micronucleus assay and a rat UDS assay run to assess the genotoxic potential of M-04 in the whole animal were negative at concentrations showing cytotoxicity of the target organs. Overall M-04 is not considered to present a genotoxic potential to humans. In a 28-day toxicity study in rats with M-04 at doses up to 20000 ppm, slight reduction in body weight was observed at the top dose. The target organs identified were the liver and the kidneys. The NOAEL of M-04 was 2000 ppm (equivalent to 159.2 and 230.6 mg/kg bw/day in males and females respectively). In conclusion, the data showed that the metabolite M-04 is less toxic than parent fluopicolide. Metabolite M-05 The genotoxicity profile of M-05 was assessed in three in vitro assays which included the bacterial gene mutation assay, chromosomal aberration assay and the V79/HPRT gene locus assay for forward mutations. There was no evidence of genotoxicity in any of the assays. M-05 is noted to be structurally similar to M-14. In a 28-day oral toxicity study in rats with M-05 at doses up to 20000 ppm, slight reduction in body weight gains and degeneration/regeneration in the kidneys was observed in animals at 20000 ppm, the highest test dose. The NOAEL was 2000 ppm (equivalent to 152 mg/kg/day and 167 mg/kg/day in males and females, respectively). In conclusion, the data showed that the metabolite M-05 (AE1344122) is less toxic than parent fluopicolide.
Fluopicolide - Addendum 1 November 2007
65
Metabolite M-08 M-08 has no specific toxicity data, but it is considered to share the same intermediate metabolic pathways as metabolite M-02, which is also a rat metabolites and with which it shows substantial structural similarities. The genotoxicity profile of M-02 was assessed in three in vitro assays which included the bacterial gene mutation assay in S. typhimurium strain and E. coli strains, chromosomal aberration assay in cultured human peripheral blood lymphocytes and the V79/HPRT gene locus assay. There was no evidence of genotoxicity in any of the assays. M-02 was shown to be of very low acute toxicity with an oral LD50 of > 5000 mg/kg bw in rats. Therefore, no classification is required for acute oral toxicity. In a 28-day toxicity study in CD rats with M-02 at doses up to 20000 ppm, there was no evidence any effects up to and including the top dose ; no target organ toxicity was identified. The NOAEL of M-02 was 20000 ppm, equivalent to 1500 mg/kg bw/day in both males and females. In conclusion, these data showed that the metabolite M-02 is less toxic than parent fluopicolide. One way in which M-08 differs from M-02 is in the presence of a benzamide grouping. Metabolite M-01, which is produced in rats, posesses a benzamide group but is based on a phenyl ring rather than a pyridyl ring. M-01 was negative in three in vitro genotoxicity assays and in an in vivo assay for micronuclei induction. M-01 is more acutely toxic than flupicolide, but in 90 day and 2-year studies the toxicity of both compounds is considered equivalent, taking account of dose spacing and relative molecular weights. The toxicity profile of M-08 is predicted to be similar to that of M-02 and no worse than that of M-01. Taking account of the relative levels of M-08 (<25% of the levels of fluopicolide plus M-01), the fact that absolute levels of M-08 are very low (<0.05 mg/kg) and did not increase over time, the RMS considers that residues of M-08 in rotational crops are not of toxicological relevance.
Metabolite M-09 M-09 has no specific toxicity data, but it is considered to share the same intermediate metabolic pathways as metabolite M-02, which is also a rat metabolite and with which it shows substantial structural similarities. M-09 differs from M-02 only in the presence of a hydroxy group in place of a carboxy group on M-02. The toxicity profile of M-09 is unlikely to differ significantly from that of M-02. The genotoxicity profile of M-02 was assessed in three in vitro assays which included the bacterial gene mutation assay in S. typhimurium strain and E. coli strains, chromosomal aberration assay in cultured human peripheral blood lymphocytes and the V79/HPRT gene locus assay. There was no evidence of genotoxicity in any of the assays. M-02 was shown to be of very low acute toxicity with an oral LD50 of > 5000 mg/kg bw in rats. Therefore, no classification is required for acute oral toxicity. In a 28-day toxicity study in CD rats with M-02 at doses up to 20000 ppm, there was no evidence any effects up to and including the top dose ; no target organ toxicity was identified. The NOAEL of M-02 was 20000 ppm, equivalent to 1500 mg/kg bw/day in both males and females. In conclusion, these data showed that the metabolite M-02 is less toxic than parent fluopicolide and the same is predicted to apply to M-09
Fluopicolide - Addendum 1 November 2007
66
B.6.16 Additional References Relied On:
Location in Dossier Author(s) Year Title Source (where different from company) Company name, Report No., Date, GLP status (where relevant), published or not
Data protect. claimed
Owner
Doc K AII 5.5.3 Payraudeau, V. 2006 AE C638206 (fluopicolide): Assessment of hepatocellular proliferation and lack of carcinogenicity potential Bayer CropScience AG, Edition No.: M-275342-01-1, Date: 2006-08-02 Non GLP, unpublished
Yes BCS
Doc K AII 5.8.1.1 Payraudeau, V; Freeman, E.
2006 2,6-dichlorobenzamide (BAM): Toxicity profile and lack of carcinogenicity potential Bayer CropScience AG, Edition No.: M-274220-02-1, Date: 2006-07-13 Non GLP, unpublished
Yes BCS / Chem-
tura
Doc K AII 5.8.1.1 Pallen, C. 2006 Re-assessment of liver lesions/tumors from study PDR/49 BAM: Dietary administration to rats for 2 years, complementary statistical analysis of hepatocellular tumors in female rats Bayer CropScience AG, Edition No.: M-273467-01-1, Date: 2006-06-13 Non GLP, unpublished
Yes BCS
Doc K AII 5.8.1.1 Gopinath, C. 2007 Expert opinion on the carcinogenic potential of BAM (2,6-dichlorobenzamide) Huntingtdon Life Science Bayer CropScience Report no: Edition No. M-287543-01-1 Date: 2007-04-26 no GLP, unpublished
BAY BCS / Chemt
ura
Doc Kb Position Papers
Payraudeau, V. 2006 AE C638206 (fluopicolide) Waiver for an Acute Reference Dose (ARfD) setting Bayer CropScience AG, Edition No.: M-269338-01-1, Date: 2006-03-07 Non GLP, unpublished
Yes BCS
Doc Kb Position Papers
Payraudeau, V. 2007 Toxicological relevance of the solvent toluene present as an impurity in the technical grade active substance Bayer CropScience AG Edition no.: M-284199-01-1 Date: 08.02.2007 Non GLP, unpublished
Yes BCS
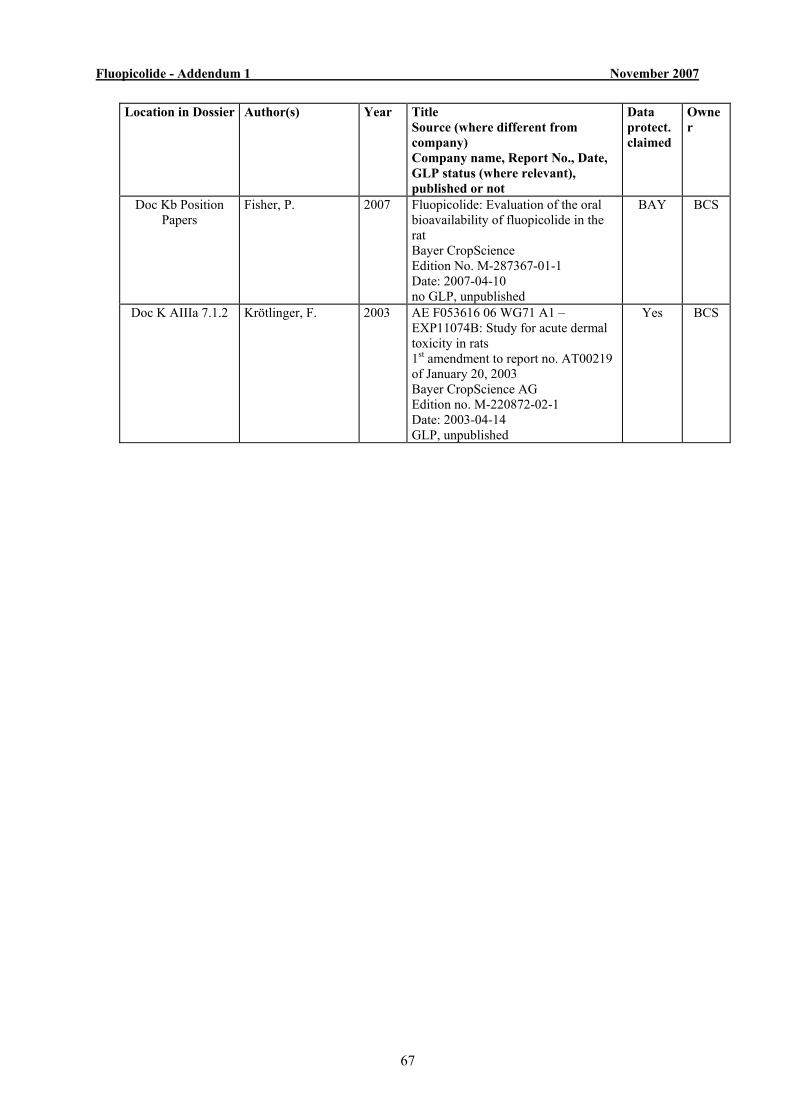
Fluopicolide - Addendum 1 November 2007
67
Location in Dossier Author(s) Year Title Source (where different from company) Company name, Report No., Date, GLP status (where relevant), published or not
Data protect. claimed
Owner
Doc Kb Position Papers
Fisher, P. 2007 Fluopicolide: Evaluation of the oral bioavailability of fluopicolide in the rat Bayer CropScience Edition No. M-287367-01-1 Date: 2007-04-10 no GLP, unpublished
BAY BCS
Doc K AIIIa 7.1.2 Krötlinger, F. 2003 AE F053616 06 WG71 A1 – EXP11074B: Study for acute dermal toxicity in rats 1st amendment to report no. AT00219 of January 20, 2003 Bayer CropScience AG Edition no. M-220872-02-1 Date: 2003-04-14 GLP, unpublished
Yes BCS
Fluopicolide - Addendum 1 November 2007
68
B.8 ENVIRONMENTAL FATE AND BEHAVIOUR B.8.1 Route and rate of degradation in soil
Open point 4.1 “Half lives for metabolites derived in the studies where they are dosed as starting material are seen by the RMS as more reliable, specially with respect to M14 (see DAR p 661). Therefore, only these DT50 should be reported in the list of end points. RMS to amend the list of end points accordingly. MS experts to discuss if the half lives derived from the study dosed with M02 may however still be used for modelling. See reporting table 4(6)”
Open point 4.8 “MS experts to discuss in an experts meeting the kinetic evaluation of field dissipation studies. See reporting table 4(36).” See Addendum 2 (Nov 2007) – For further details on the above Open points.
Open point 4.2 “RMS to clarify normalized laboratory DT50’s values for fluopicolide and metabolites, i.e., for fluopicolide in LoEP the range is 194 – 333 d when for example in Allan 2003 c study degradation in one soil results in a normalized DT50 = 373 d (or for another example 664 d for Lamberton soil in Allan 2003e). Please do it in an addendum or in an updated list of end points following the updated template where the origin of the different end points and normalization procedures may be easily tracked. See reporting table 4(10)” To clarify the values given in the list of endpoints, reference is made to DAR Volume 3, Section B.8.1.8, p. 715, Table B.8.142. The values given in the LoEP for laboratory degradation rate of fluopicolide are values from the Applicants calculations, rather than from the RMS calculations. This the reason why the range given in the endpoints differs from the specific values stated in the Open Point 4.2 of 373 and 664 days which are from the RMS calculations. The differences between the outcome of the Applicant and RMS calculations can in part be explained by the fact that the Applicant used all data points, whereas the RMS only used data points from within the first 120 days of the study, given that this is the length of study specified by SETAC guidelines and that it is known that microbial viability of soils can become compromised over longer study duration periods. In addition, the DT50 of 664 days is extrapolated well beyond study duration and is associated with an r2 value of only 0.583, i.e. below the 0.85 value specified in the ‘Persistence Guidance Document’ for acceptability for use in comparison with Directive persistence triggers,
Fluopicolide - Addendum 1 November 2007
69
and below the 0.7 value specified for used in exposure modelling. If the 664 day DT50 is excluded due to low r2 and results from 2 different radiolabels for the same soil in individual studies are geometrically meaned, the subsequent geometric mean of RMS calculated DT50 values is 260.5 days, comparable with the overall geometric mean of 271 days for the applicant’s calculations. The values quoted for the metabolites are also from the Applicant calculations. The LoEP has been updated according to the latest template. In relation to the point made above relating to the ‘Persistence Guidance Document’, the RMS recognises that whilst the kinetics and associated statistics for this evaluation were not derived in strict accordance with the FOCUS Degradation Kinetics guidance, the evaluation was conducted significantly before agreement/adoption of the guidance document. We are not convinced that applying the principles of the guidance document would significantly influence the endpoints selected for exposure assessment.
Fluopicolide - Addendum 1 November 2007
70
Route and rate of degradation in soil
Open point 4.5 “MS experts to discuss potential influence of the different extraction method employed on the respective results of the laboratory and field studies. Applicant provided an explanatory note in the “Comments to the reporting table”. To be considered by MSs experts in their discussion. See reporting table 4(26).”
As a reminder to MS experts, lab studies used 3-4 extractions with acetonitrile/water at ambient temperature followed by an acetonitrile Soxhlet extraction. Field studies used 2 extractions of acetonitrile/water/formic acid under ambient conditions. RMS notes the Applicants statement, however, the RMS has further investigated extraction in the lab studies. Considering the representative chromatograms presented in studies, (in the Allen, 2003c study), Soxhlet extractions at 369 DAT accounted for 14.2 – 23.3% AR, with fluopicolide accounting for 9.7 – 17.6% AR in the Soxhlet extracts. In the Allen, 2003b study, at 98 DAT Soxhlet extractions accounted for a further 5.4 – 6.1% AR as fluopicolide. Information relating to the amount of fluopicolide extracted with each successive ambient extraction in lab studies is not available. RMS considers that in light of this information, there is still some uncertainty over the suitability of the extraction methods for the field dissipation studies and that this should discussed by MS experts with a view to obtaining an appropriate resolution.
B.8.1.3. Route and rate of degradation in soil - photolysis
Data Requirement 4.1 “Notifier to provide an estimation of soil photolysis half lives at other latitudes (i.e. 40 ºN and 45 ºN). Applicant indicated to submit a position paper (Report MEF-06/495) by April 2007. See reporting table 4(14).” Background: Soil photolysis was performed by simulating irradiation in Scotland, (latitude 55°N). As fluopicolide is also intended for use in Southern EU Member States, further estimates were requested of the contribution of photolysis to soil degradation at latitudes around 40°N-45°N. In the field dissipation studies (DAR B.8.1.8), fluopicolide was sprayed to bare soil surface. This also prompted discussion over the influence of photolysis on the results of field dissipation studies, compared to under normal conditions of use in the field and
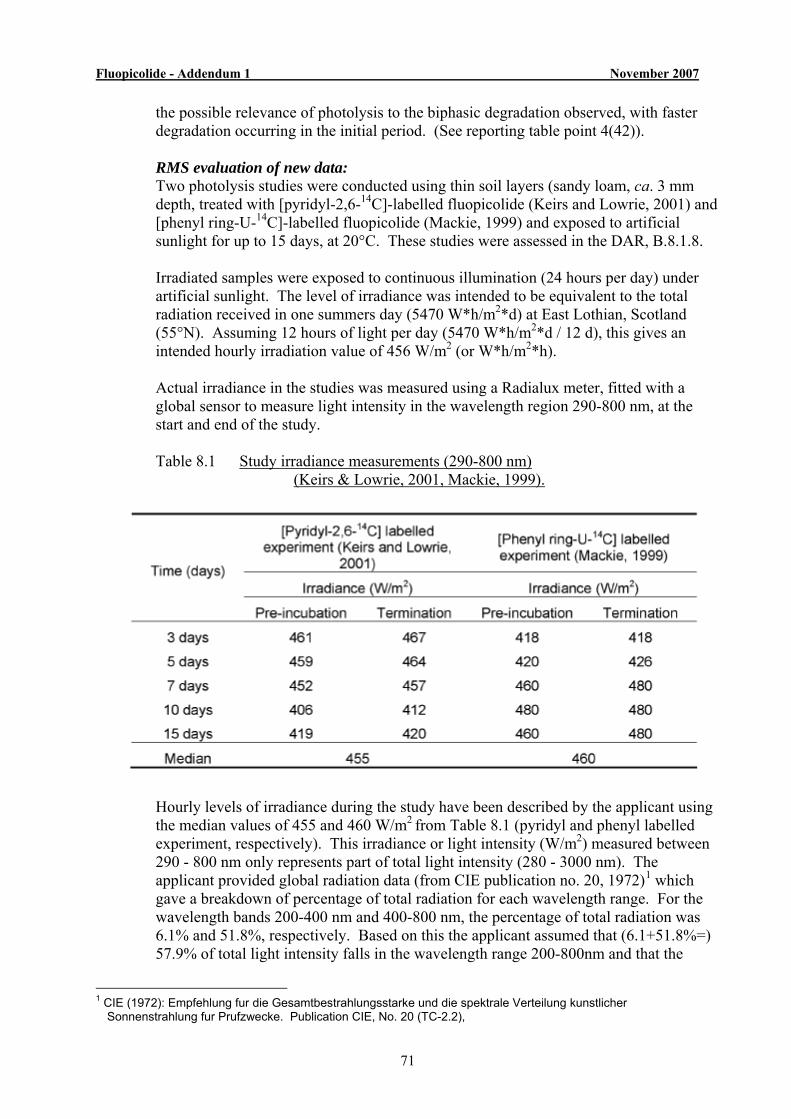
Fluopicolide - Addendum 1 November 2007
71
the possible relevance of photolysis to the biphasic degradation observed, with faster degradation occurring in the initial period. (See reporting table point 4(42)). RMS evaluation of new data: Two photolysis studies were conducted using thin soil layers (sandy loam, ca. 3 mm depth, treated with [pyridyl-2,6-14C]-labelled fluopicolide (Keirs and Lowrie, 2001) and [phenyl ring-U-14C]-labelled fluopicolide (Mackie, 1999) and exposed to artificial sunlight for up to 15 days, at 20°C. These studies were assessed in the DAR, B.8.1.8. Irradiated samples were exposed to continuous illumination (24 hours per day) under artificial sunlight. The level of irradiance was intended to be equivalent to the total radiation received in one summers day (5470 W*h/m2*d) at East Lothian, Scotland (55°N). Assuming 12 hours of light per day (5470 W*h/m2*d / 12 d), this gives an intended hourly irradiation value of 456 W/m2 (or W*h/m2*h). Actual irradiance in the studies was measured using a Radialux meter, fitted with a global sensor to measure light intensity in the wavelength region 290-800 nm, at the start and end of the study. Table 8.1 Study irradiance measurements (290-800 nm)
(Keirs & Lowrie, 2001, Mackie, 1999).
Hourly levels of irradiance during the study have been described by the applicant using the median values of 455 and 460 W/m2 from Table 8.1 (pyridyl and phenyl labelled experiment, respectively). This irradiance or light intensity (W/m2) measured between 290 - 800 nm only represents part of total light intensity (280 - 3000 nm). The applicant provided global radiation data (from CIE publication no. 20, 1972)1 which gave a breakdown of percentage of total radiation for each wavelength range. For the wavelength bands 200-400 nm and 400-800 nm, the percentage of total radiation was 6.1% and 51.8%, respectively. Based on this the applicant assumed that (6.1+51.8%=) 57.9% of total light intensity falls in the wavelength range 200-800nm and that the
1 CIE (1972): Empfehlung fur die Gesamtbestrahlungsstarke und die spektrale Verteilung kunstlicher
Sonnenstrahlung fur Prufzwecke. Publication CIE, No. 20 (TC-2.2),
Fluopicolide - Addendum 1 November 2007
72
filtered light intensity measured in the study represents 57.9% of total light intensity, recalculated as below2. Total irradiance (W/m2, 280-3000 nm) = measured irradiance (W/m2, 290-800 nm)/ 0.579 Total irradiance = 455 or 460 W/m2 / 0.579 Total irradiance = 785 or 794 W/m2 (pyridyl or phenyl label, respectively) The hourly or instantaneous solar radiation (W/m2) was then converted into an energy yield of the solar radiation per day (kJ/m2*d) by: instantaneous total irradiance (W/m2, 280 - 3000 nm) * 86400 (seconds/day) /1000 (note: 1 hour = 3600 seconds x 24 hour = 86400 seconds/day)
Assuming total irradiance of 785 W/m2 or 794 W/m2, in the above equation gives an energy yield of solar radiation of 67.82 and 68.64 MJ/m2 per day, respectively for the [pyridyl-2,6-14C] and [phenyl ring-U-14C]-labelled experiments. The applicant has recalculated the photodegradation rate of fluopicolide, based on these studies, assuming single exponential first-order kinetics using Excel Solver to obtain the best 'least squares fit'. Due to the variability of the recovery data, the soil residue data (%AR) were normalised for total recovery at each time point, with no correction for dark control residues, (since no significant decline was observed in the dark).
2 using Chemtec, (1995): Solar radiation data - Handbook of Material Weathering, 2nd edition. Chemtec Publishing,
Ontario, Canada.

Fluopicolide - Addendum 1 November 2007
73
Table 8.2 Decline of [pyridyl-2-6-14C]-fluopicolide (normalised for total recovery) in soil photolysis.
Table 8.3 Decline of [phenyl-2-6-14C]-fluopicolide (normalised for total recovery) in soil photolysis.
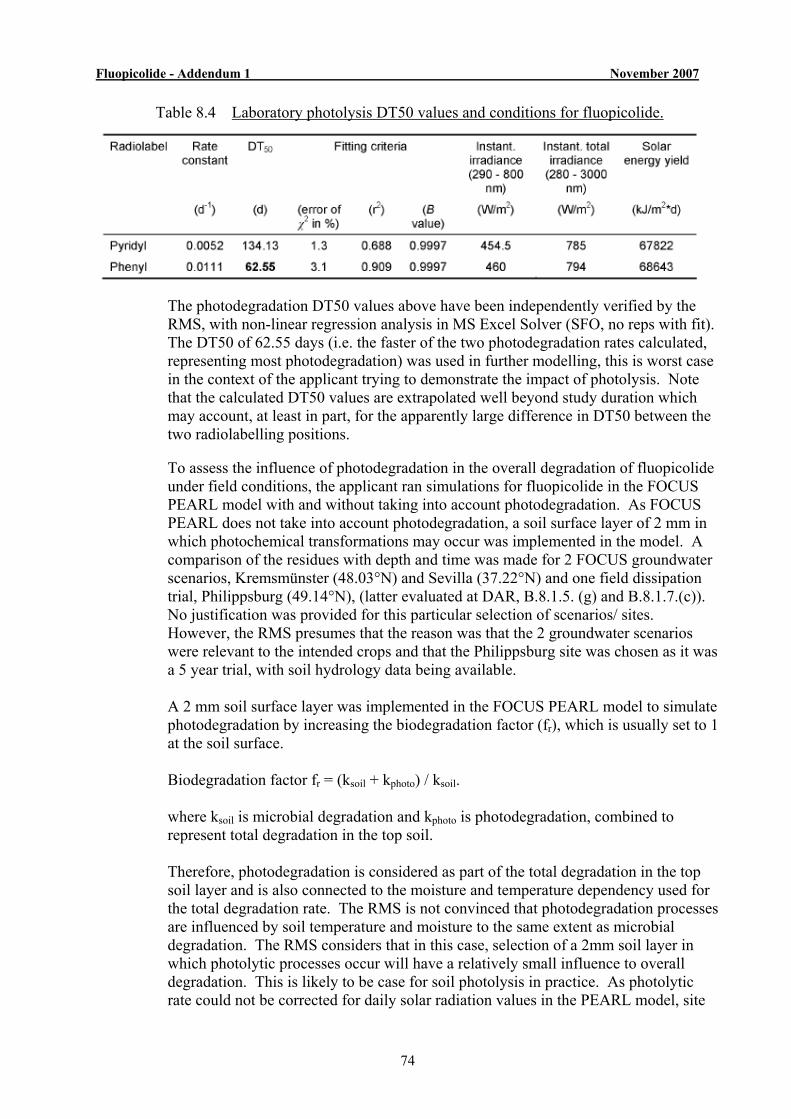
Fluopicolide - Addendum 1 November 2007
74
Table 8.4 Laboratory photolysis DT50 values and conditions for fluopicolide.
The photodegradation DT50 values above have been independently verified by the RMS, with non-linear regression analysis in MS Excel Solver (SFO, no reps with fit). The DT50 of 62.55 days (i.e. the faster of the two photodegradation rates calculated, representing most photodegradation) was used in further modelling, this is worst case in the context of the applicant trying to demonstrate the impact of photolysis. Note that the calculated DT50 values are extrapolated well beyond study duration which may account, at least in part, for the apparently large difference in DT50 between the two radiolabelling positions. To assess the influence of photodegradation in the overall degradation of fluopicolide under field conditions, the applicant ran simulations for fluopicolide in the FOCUS PEARL model with and without taking into account photodegradation. As FOCUS PEARL does not take into account photodegradation, a soil surface layer of 2 mm in which photochemical transformations may occur was implemented in the model. A comparison of the residues with depth and time was made for 2 FOCUS groundwater scenarios, Kremsmünster (48.03°N) and Sevilla (37.22°N) and one field dissipation trial, Philippsburg (49.14°N), (latter evaluated at DAR, B.8.1.5. (g) and B.8.1.7.(c)). No justification was provided for this particular selection of scenarios/ sites. However, the RMS presumes that the reason was that the 2 groundwater scenarios were relevant to the intended crops and that the Philippsburg site was chosen as it was a 5 year trial, with soil hydrology data being available. A 2 mm soil surface layer was implemented in the FOCUS PEARL model to simulate photodegradation by increasing the biodegradation factor (fr), which is usually set to 1 at the soil surface. Biodegradation factor fr = (ksoil + kphoto) / ksoil. where ksoil is microbial degradation and kphoto is photodegradation, combined to represent total degradation in the top soil. Therefore, photodegradation is considered as part of the total degradation in the top soil layer and is also connected to the moisture and temperature dependency used for the total degradation rate. The RMS is not convinced that photodegradation processes are influenced by soil temperature and moisture to the same extent as microbial degradation. The RMS considers that in this case, selection of a 2mm soil layer in which photolytic processes occur will have a relatively small influence to overall degradation. This is likely to be case for soil photolysis in practice. As photolytic rate could not be corrected for daily solar radiation values in the PEARL model, site
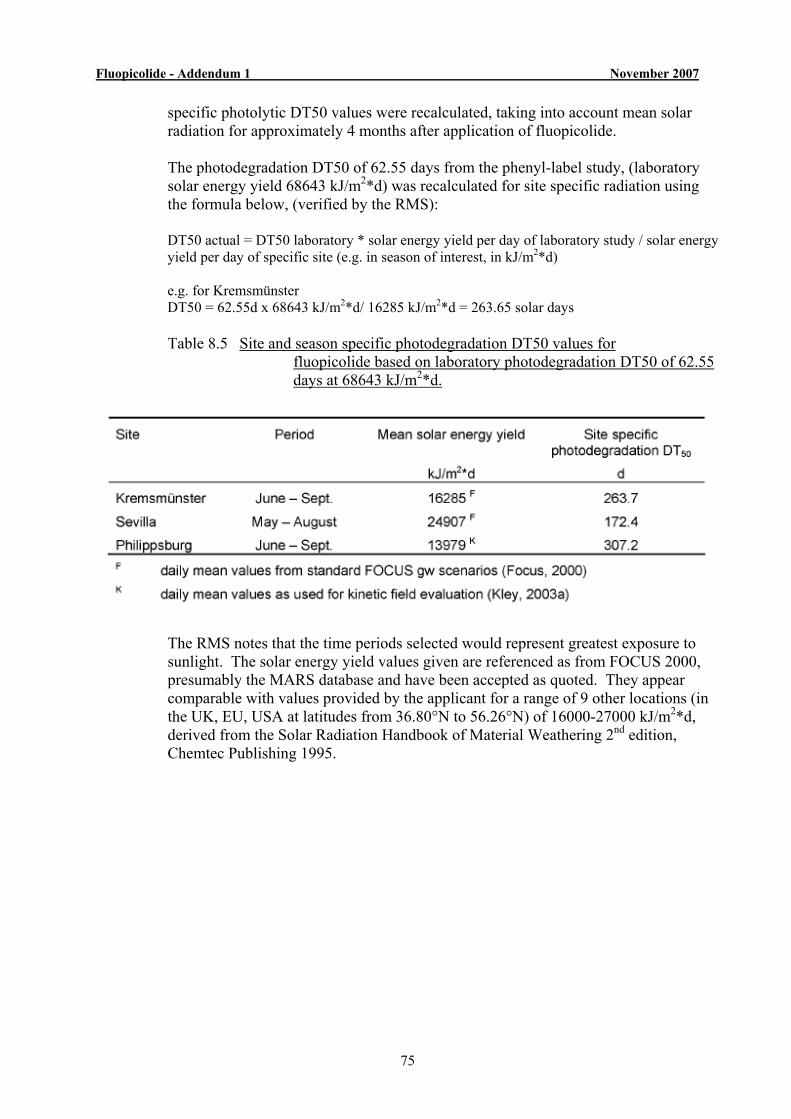
Fluopicolide - Addendum 1 November 2007
75
specific photolytic DT50 values were recalculated, taking into account mean solar radiation for approximately 4 months after application of fluopicolide. The photodegradation DT50 of 62.55 days from the phenyl-label study, (laboratory solar energy yield 68643 kJ/m2*d) was recalculated for site specific radiation using the formula below, (verified by the RMS): DT50 actual = DT50 laboratory * solar energy yield per day of laboratory study / solar energy yield per day of specific site (e.g. in season of interest, in kJ/m2*d) e.g. for Kremsmünster DT50 = 62.55d x 68643 kJ/m2*d/ 16285 kJ/m2*d = 263.65 solar days Table 8.5 Site and season specific photodegradation DT50 values for
fluopicolide based on laboratory photodegradation DT50 of 62.55 days at 68643 kJ/m2*d.
The RMS notes that the time periods selected would represent greatest exposure to sunlight. The solar energy yield values given are referenced as from FOCUS 2000, presumably the MARS database and have been accepted as quoted. They appear comparable with values provided by the applicant for a range of 9 other locations (in the UK, EU, USA at latitudes from 36.80°N to 56.26°N) of 16000-27000 kJ/m2*d, derived from the Solar Radiation Handbook of Material Weathering 2nd edition, Chemtec Publishing 1995.
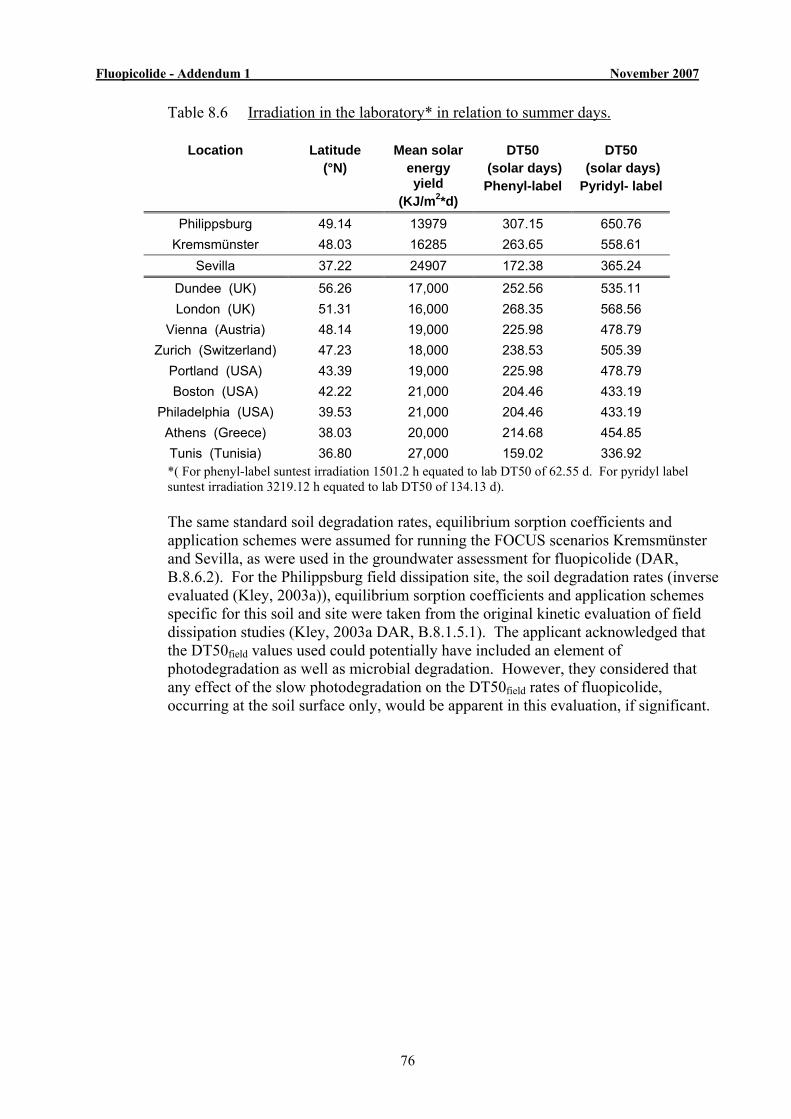
Fluopicolide - Addendum 1 November 2007
76
Table 8.6 Irradiation in the laboratory* in relation to summer days.
Location Latitude (°N)
Mean solar energy yield
(KJ/m2*d)
DT50 (solar days) Phenyl-label
DT50 (solar days) Pyridyl- label
Philippsburg 49.14 13979 307.15 650.76 Kremsmünster 48.03 16285 263.65 558.61
Sevilla 37.22 24907 172.38 365.24
Dundee (UK) 56.26 17,000 252.56 535.11 London (UK) 51.31 16,000 268.35 568.56
Vienna (Austria) 48.14 19,000 225.98 478.79 Zurich (Switzerland) 47.23 18,000 238.53 505.39
Portland (USA) 43.39 19,000 225.98 478.79 Boston (USA) 42.22 21,000 204.46 433.19
Philadelphia (USA) 39.53 21,000 204.46 433.19 Athens (Greece) 38.03 20,000 214.68 454.85 Tunis (Tunisia) 36.80 27,000 159.02 336.92 *( For phenyl-label suntest irradiation 1501.2 h equated to lab DT50 of 62.55 d. For pyridyl label suntest irradiation 3219.12 h equated to lab DT50 of 134.13 d). The same standard soil degradation rates, equilibrium sorption coefficients and application schemes were assumed for running the FOCUS scenarios Kremsmünster and Sevilla, as were used in the groundwater assessment for fluopicolide (DAR, B.8.6.2). For the Philippsburg field dissipation site, the soil degradation rates (inverse evaluated (Kley, 2003a)), equilibrium sorption coefficients and application schemes specific for this soil and site were taken from the original kinetic evaluation of field dissipation studies (Kley, 2003a DAR, B.8.1.5.1). The applicant acknowledged that the DT50field values used could potentially have included an element of photodegradation as well as microbial degradation. However, they considered that any effect of the slow photodegradation on the DT50field rates of fluopicolide, occurring at the soil surface only, would be apparent in this evaluation, if significant.
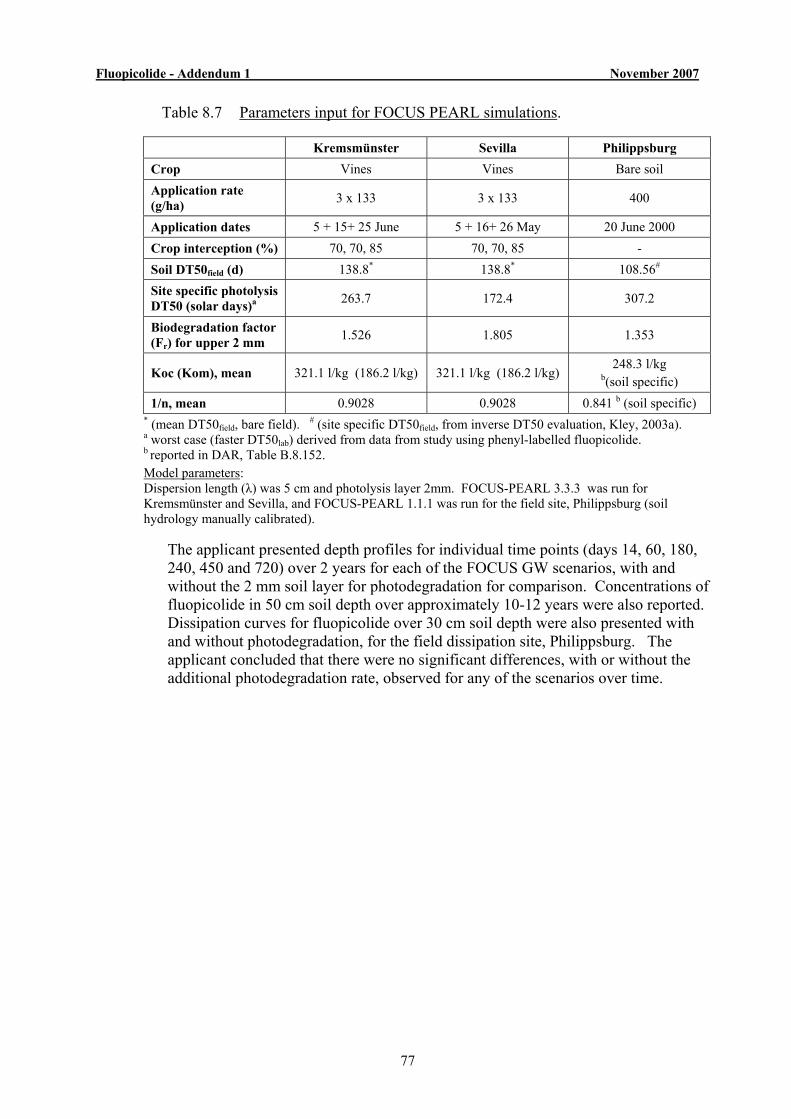
Fluopicolide - Addendum 1 November 2007
77
Table 8.7 Parameters input for FOCUS PEARL simulations.
Kremsmünster Sevilla Philippsburg Crop Vines Vines Bare soil Application rate (g/ha) 3 x 133 3 x 133 400
Application dates 5 + 15+ 25 June 5 + 16+ 26 May 20 June 2000 Crop interception (%) 70, 70, 85 70, 70, 85 - Soil DT50field (d) 138.8* 138.8* 108.56# Site specific photolysis DT50 (solar days)a 263.7 172.4 307.2
Biodegradation factor (Fr) for upper 2 mm 1.526 1.805 1.353
Koc (Kom), mean 321.1 l/kg (186.2 l/kg) 321.1 l/kg (186.2 l/kg) 248.3 l/kg
b(soil specific) 1/n, mean 0.9028 0.9028 0.841 b (soil specific)
* (mean DT50field, bare field). # (site specific DT50field, from inverse DT50 evaluation, Kley, 2003a). a worst case (faster DT50lab) derived from data from study using phenyl-labelled fluopicolide. b reported in DAR, Table B.8.152. Model parameters: Dispersion length (λ) was 5 cm and photolysis layer 2mm. FOCUS-PEARL 3.3.3 was run for Kremsmünster and Sevilla, and FOCUS-PEARL 1.1.1 was run for the field site, Philippsburg (soil hydrology manually calibrated).
The applicant presented depth profiles for individual time points (days 14, 60, 180, 240, 450 and 720) over 2 years for each of the FOCUS GW scenarios, with and without the 2 mm soil layer for photodegradation for comparison. Concentrations of fluopicolide in 50 cm soil depth over approximately 10-12 years were also reported. Dissipation curves for fluopicolide over 30 cm soil depth were also presented with and without photodegradation, for the field dissipation site, Philippsburg. The applicant concluded that there were no significant differences, with or without the additional photodegradation rate, observed for any of the scenarios over time.
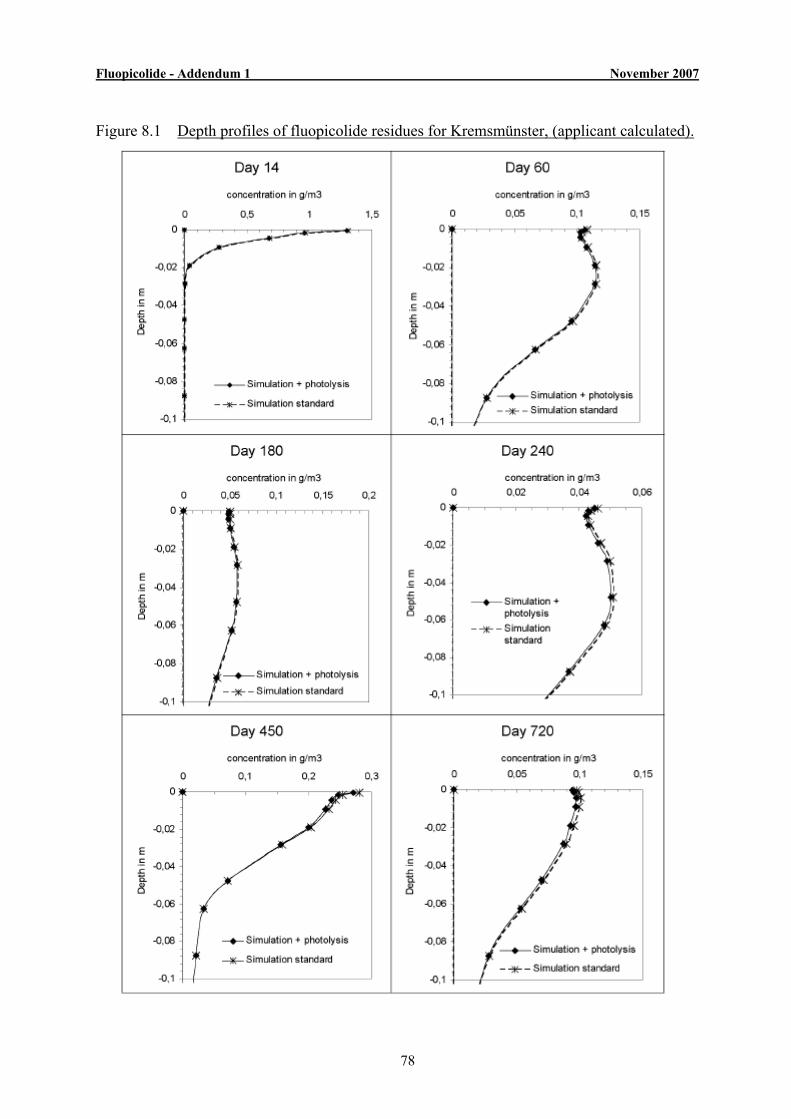
Fluopicolide - Addendum 1 November 2007
78
Figure 8.1 Depth profiles of fluopicolide residues for Kremsmünster, (applicant calculated).

Fluopicolide - Addendum 1 November 2007
79
Figure 8.2 Depth profiles of fluopicolide residues for Sevilla (applicant calculated).

Fluopicolide - Addendum 1 November 2007
80
Figure 8.3 Concentration of fluopicolide residues in upper soil layers (50cm) for Kremsmünster scenario.
Figure 8.4 Concentration of fluopicolide residues in upper soil layers (50cm) for Sevilla scenario.

Fluopicolide - Addendum 1 November 2007
81
Figure 8.5 Concentration of fluopicolide residues in upper soil layers (30cm) for Philippsburg field dissipation trial.
The applicant concluded that photodegradation did not appear to contribute to the biphasic dissipation pattern seen in the field. Possible alternative explanations for the biphasic dissipation behaviour of fluopicolide in the field were proposed by the applicant, such as experimental artefacts, seasonal climatic changes, or the effect of time dependent sorption. Experimental artefacts may be due to insufficient soil homogenisation or compression of the soil due to cultivation methods, which could cause artificially high residues at the start of the study. However, the applicant considered that if this explanation was likely it would be expected that biphasic degradation would be seen in only some trials, with other trials appearing to follow SFO kinetics. The applicant considered that climatic changes were a possible explanation, as the degradation of fluopicolide in the field was moisture and temperature dependent. Degradation occurred more rapidly initially in spring/summer, then slowed over colder winter months. The effect of time dependent sorption contributing to biphasic dissipation was also investigated by the applicant. The full assessment of this investigation is described later in this Addendum, at B.8.6.2 in the context of the groundwater assessment. To summarise, sorption of pesticides on soil is described with a Freundlich-type equation. It is assumed in the FOCUS PEARL model that degradation and sorption in soil may be described by both instantaneous (equilibrium sorption) and long-term or gradual sorption processes (non-equilibrium sorption). Transformation of active substance is assumed to only occur in the equilibrium domain, with slow release of compound from the non-equilibrium domain.

Fluopicolide - Addendum 1 November 2007
82
The applicant provided additional reports (Kley 2004, MEF-04/346 and MEF -04/347) describing their approach to calculating a degradation rate constant specific to the equilibrium domain (kt) and kinetic sorption parameters for use in the PEARL model, (kinetic-sorption rate constant, kd and the ratio between the Freundlich coefficients in the non-equilibrium and in the equilibrium domain, fne). In these reports the applicant fitted the data from previously assessed studies to a kinetic-sorption model implemented in FOCUS-PEARL, using ACSL Optimise 1.2, (Kley 2004, MEF 04/346, Addendum B.8.X). The data used for fitting, were derived from two studies on the effect of ageing on sorption, which were reported in the DAR at B.8.2.1(c/d), (though they were not considered essential to the risk assessment in the original DAR, Allan, 2003b; Fitzmaurice, 2003). This approach was then also applied to the field dissipation data from 6 trials (reported at DAR B.8.1.5.) to derive a more realistic field degradation rate constant specific to the equilibrium domain, for use in the PEARL model, (Kley 2004, MEF 04/347, Addendum B.8.6.2) The optimised parameters for the kinetic-sorption rate constant (kd) and the ratio between the Freundlich coefficients in the non-equilibrium and in the equilibrium domain (fne) are shown in Table 8.8.
Table 8.8 Evaluated parameters of the kinetic-sorption model of all soils in the
laboratory time dependent sorption study (Kley, 2004, MEF-04/346)
A biphasic dissipation pattern may result from kinetically controlled sorption, due to the combination of degradation rate in the equilibrium domain (kt) and the rate of transfer from the non-equilibrium to the equilibrium domain (kd). The mean ratio between the Freundlich coefficients in the non-equilibrium and equilibrium domain (fne) calculated for fluopicolide was 0.395. The applicant claimed that this indicated that fluopicolide underwent a moderate, but measurable kinetic sorption with time, with a kinetically controlled "sorption capacity" of about 40% of the instantaneous "sorption capacity". (i.e. 60% of applied residue is available for degradation in the equilibrium domain, compared with 40% of applied residue in the non-equilibrium domain, where no degradation is assumed).
Fluopicolide - Addendum 1 November 2007
83
RMS Risk Assessment and Conclusions: The RMS concludes that soil photolysis at more southerly latitudes is unlikely to significantly influence the degradation of fluopicolide. Kinetic adsorption aspects, if implemented into FOCUS modelling of environmental exposure, would be likely to result in lower peak and annual average concentrations. Implications for Ecotoxicogical Assessment: No change from the relevant endpoints reported in the DAR.
(Kley, C; Mackenzie, E; MEF-06/495, 2007)
Fluopicolide - Addendum 1 November 2007
84
B.8.1.7 Route and rate of degradation in soil – field soil accumulation
Data Requirement 4.2 “Applicant to present the position paper with their evaluation of the accumulation studies. Applicant indicated to submit a position paper assessing the field accumulation studies (Kley, C; Mackenzie, E.; Report no. M-267721-01-1) by April 2007.
See reporting table 4(41).” Background: The applicant has submitted a position paper presenting further evaluation of the field accumulation studies, (originally assessed at DAR B.8.1.7. and B.8.1.8), in response to the conclusion of the RMS that residues of fluopicolide and M-01 had not reached a plateau at study termination in the trial at Appilly and that results at Senas were inconclusive. The applicant has also submitted the time-points at which maximum concentrations were estimated to be reached, not previously given. (See reporting table, points 4(41), 4(51) and 4(73)). RMS Evaluation of new data: Field dissipation/ accumulation trials with fluopicolide were conducted over a 4 year period at sites in Philippsburg (Southern Germany), Appilly (Northern France) and at Senas (Southern France). Concentrations of fluopicolide and its metabolites, M-01, M-03 and M-02, in soil were measured following repeated annual applications of 400 or 500 g/ha p.a. to bare soil. See the assessment in the DAR at B.8.1.7. and B.8.1.8 for further details. These data have since been evaluated further by the applicant to assess whether the plateau concentrations of fluopicolide measured in the field were reached after 4 years, or if further increases would be expected in successive years. The accumulation potential of fluopicolide and its metabolite M-01 have been evaluated at each site, using SFO kinetics. Metabolite M-01 was shown to have potential to be mobile and persistent. The metabolite M-02 was only detected at a few time points at low levels and metabolite M-03 was only detected in acidic soils, being degraded rapidly in soils with pH>7. Throughout this evaluation the applicant converted concentrations in mg/kg to g/ha for the total soil depth assuming a soil density of 1.5 g/cm3. PHILIPPSBURG (S. Germany, loamy sand, pH 6.4 and 0.27% oc content) Fluopicolide was applied annually as detailed below. The applicant measured the unused formulation remaining in the spray tank to confirm the actual amount applied (‘calibrated application rate’). Three plots, each 3 m x 26 m, were treated with fluopicolide and a fourth plot left untreated as a control. The treated plots were subdivided into separate areas for the dissipation phase treated once in the first year and for the accumulation phase treated annually for up to 5 years. Details of the treatment and sampling areas were provided. Samples for the dissipation phase were taken for up to 2 years after the first application. Samples for the accumulation phase were taken
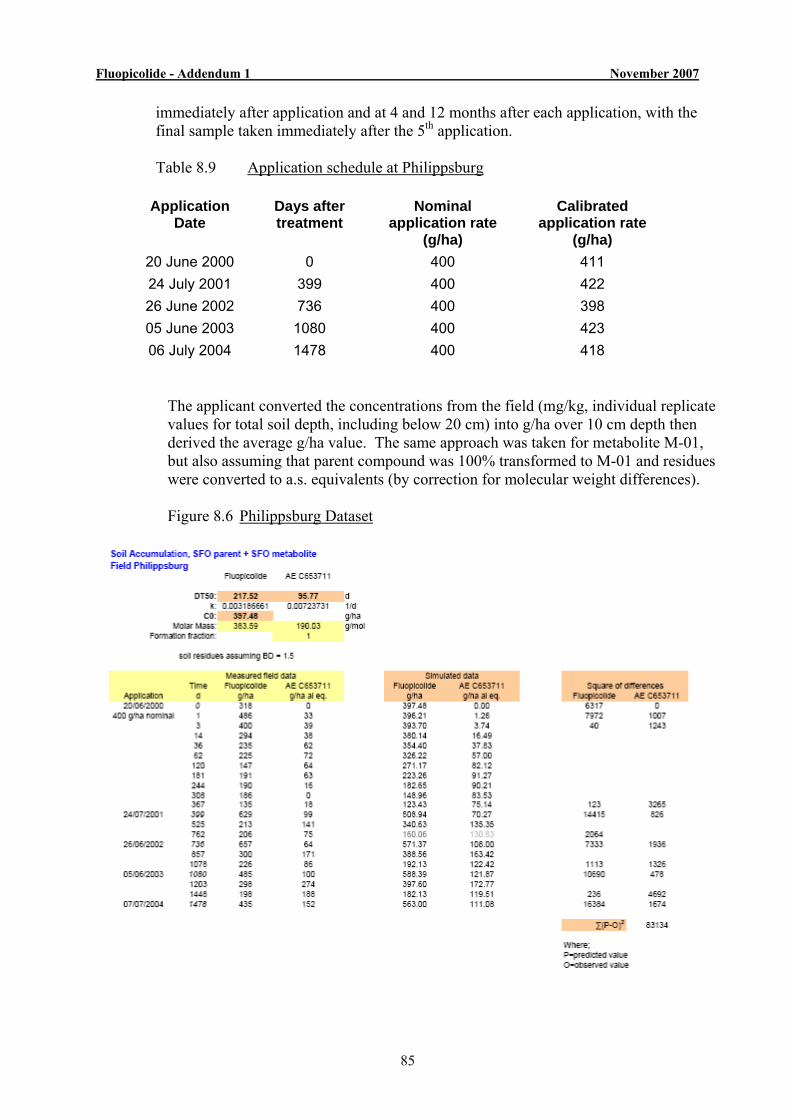
Fluopicolide - Addendum 1 November 2007
85
immediately after application and at 4 and 12 months after each application, with the final sample taken immediately after the 5th application. Table 8.9 Application schedule at Philippsburg
Application Date
Days after treatment
Nominal application rate
(g/ha)
Calibrated application rate
(g/ha) 20 June 2000 0 400 411 24 July 2001 399 400 422 26 June 2002 736 400 398 05 June 2003 1080 400 423 06 July 2004 1478 400 418
The applicant converted the concentrations from the field (mg/kg, individual replicate values for total soil depth, including below 20 cm) into g/ha over 10 cm depth then derived the average g/ha value. The same approach was taken for metabolite M-01, but also assuming that parent compound was 100% transformed to M-01 and residues were converted to a.s. equivalents (by correction for molecular weight differences). Figure 8.6 Philippsburg Dataset
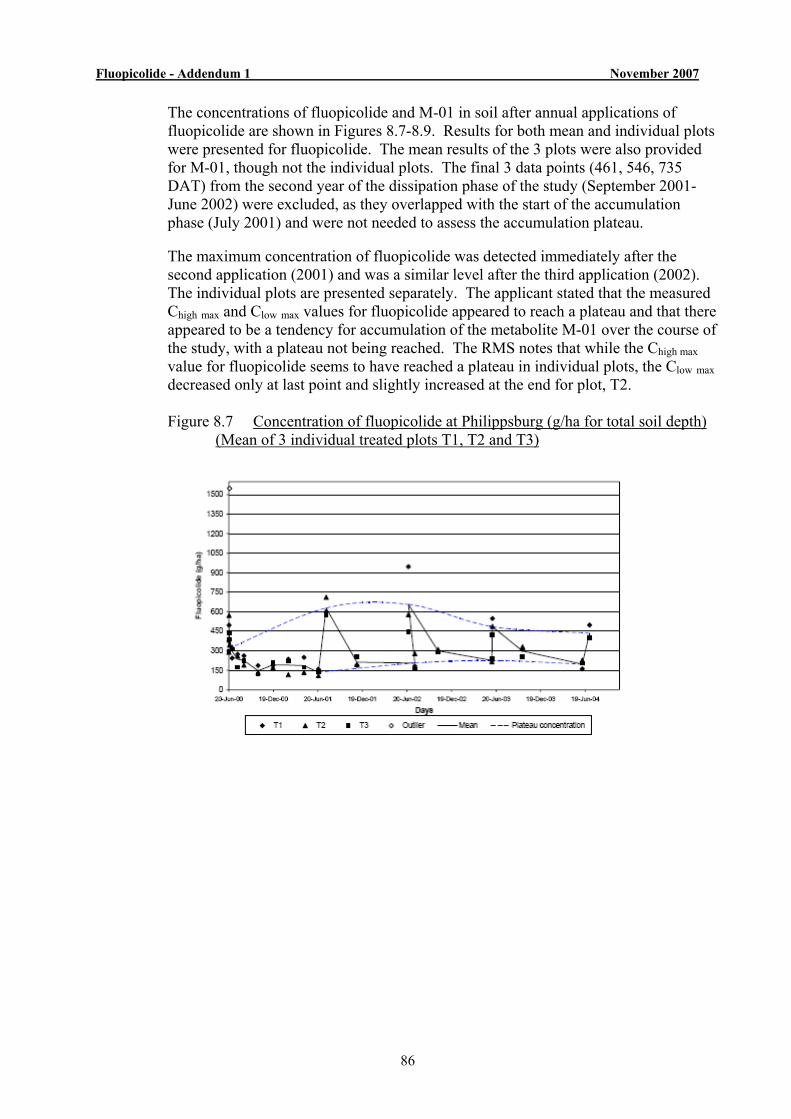
Fluopicolide - Addendum 1 November 2007
86
The concentrations of fluopicolide and M-01 in soil after annual applications of fluopicolide are shown in Figures 8.7-8.9. Results for both mean and individual plots were presented for fluopicolide. The mean results of the 3 plots were also provided for M-01, though not the individual plots. The final 3 data points (461, 546, 735 DAT) from the second year of the dissipation phase of the study (September 2001-June 2002) were excluded, as they overlapped with the start of the accumulation phase (July 2001) and were not needed to assess the accumulation plateau. The maximum concentration of fluopicolide was detected immediately after the second application (2001) and was a similar level after the third application (2002). The individual plots are presented separately. The applicant stated that the measured Chigh max and Clow max values for fluopicolide appeared to reach a plateau and that there appeared to be a tendency for accumulation of the metabolite M-01 over the course of the study, with a plateau not being reached. The RMS notes that while the Chigh max value for fluopicolide seems to have reached a plateau in individual plots, the Clow max decreased only at last point and slightly increased at the end for plot, T2. Figure 8.7 Concentration of fluopicolide at Philippsburg (g/ha for total soil depth) (Mean of 3 individual treated plots T1, T2 and T3)
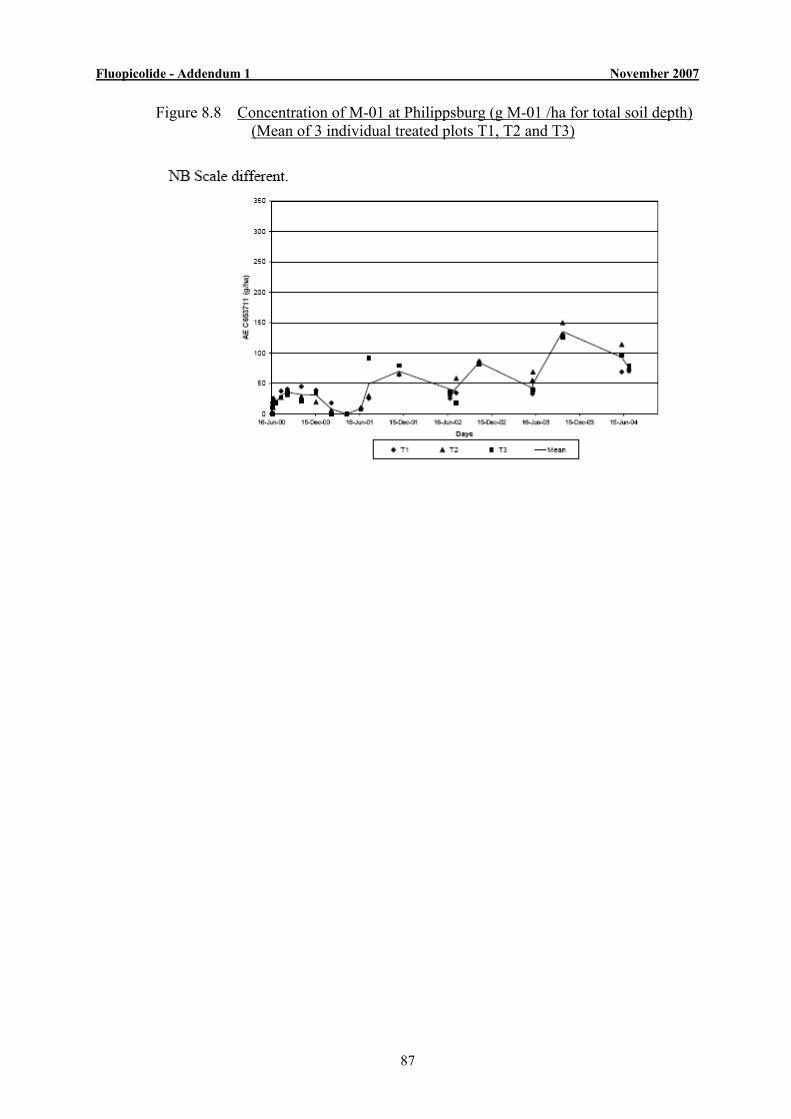
Fluopicolide - Addendum 1 November 2007
87
Figure 8.8 Concentration of M-01 at Philippsburg (g M-01 /ha for total soil depth) (Mean of 3 individual treated plots T1, T2 and T3)
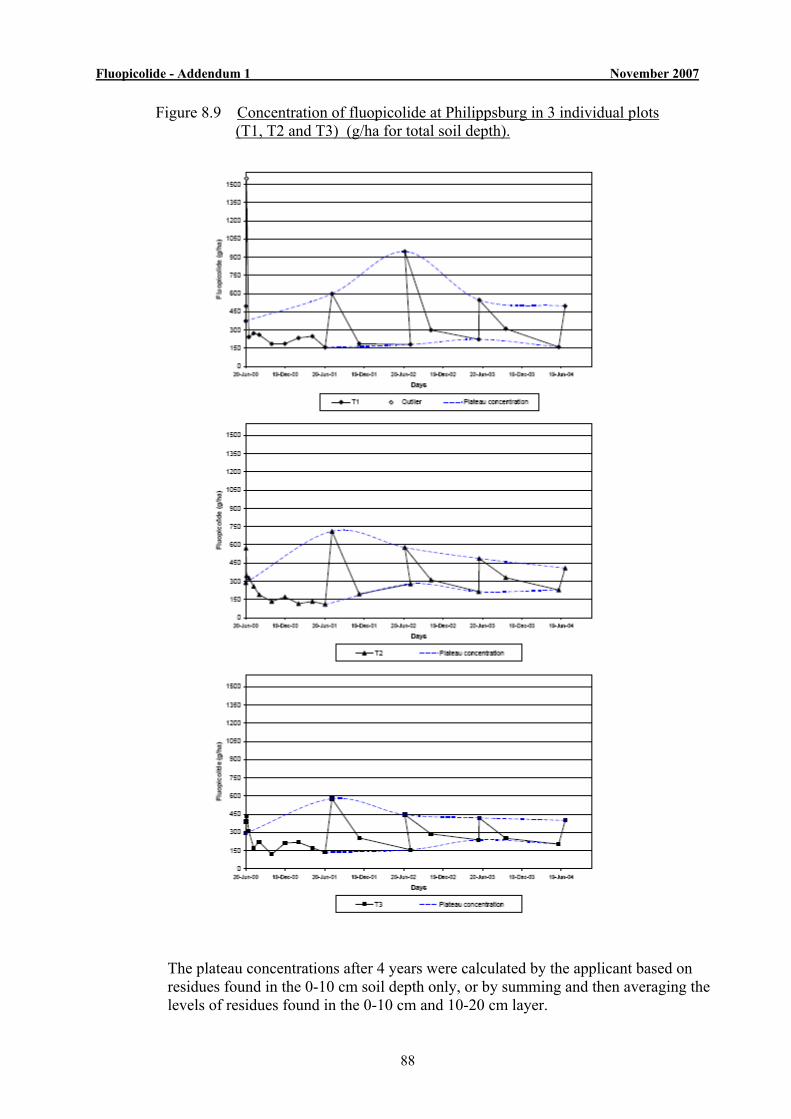
Fluopicolide - Addendum 1 November 2007
88
Figure 8.9 Concentration of fluopicolide at Philippsburg in 3 individual plots (T1, T2 and T3) (g/ha for total soil depth).
The plateau concentrations after 4 years were calculated by the applicant based on residues found in the 0-10 cm soil depth only, or by summing and then averaging the levels of residues found in the 0-10 cm and 10-20 cm layer.
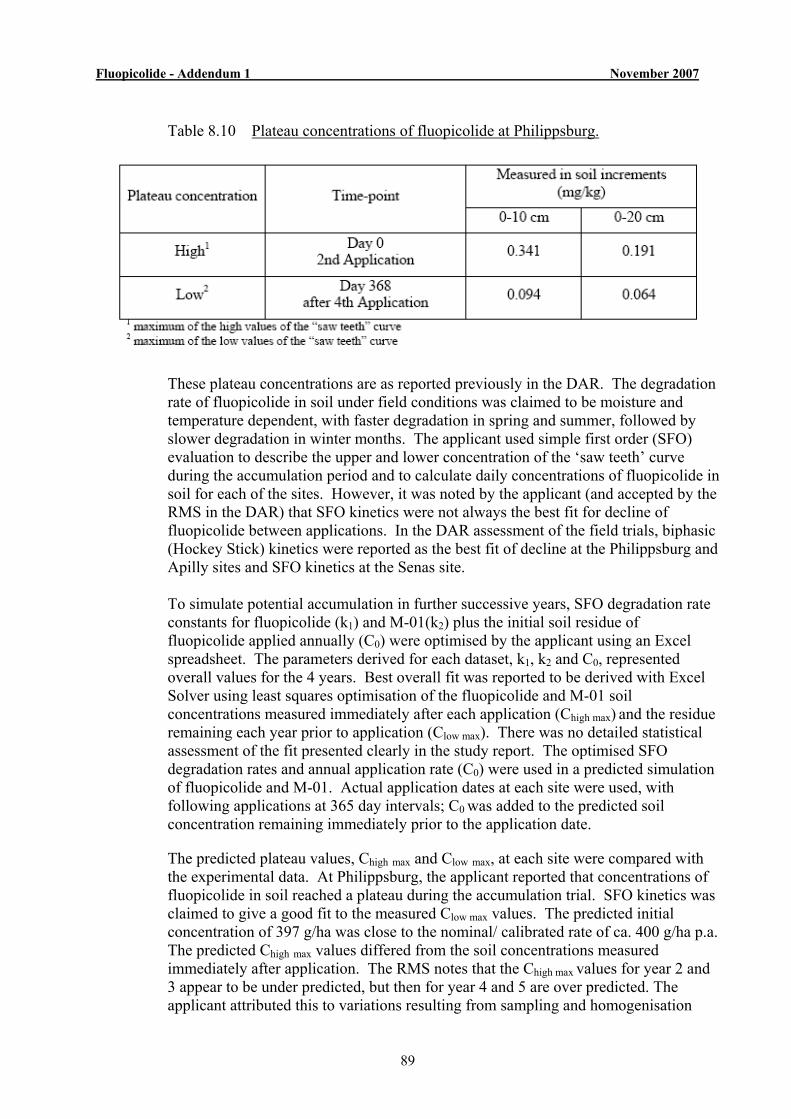
Fluopicolide - Addendum 1 November 2007
89
Table 8.10 Plateau concentrations of fluopicolide at Philippsburg.
These plateau concentrations are as reported previously in the DAR. The degradation rate of fluopicolide in soil under field conditions was claimed to be moisture and temperature dependent, with faster degradation in spring and summer, followed by slower degradation in winter months. The applicant used simple first order (SFO) evaluation to describe the upper and lower concentration of the ‘saw teeth’ curve during the accumulation period and to calculate daily concentrations of fluopicolide in soil for each of the sites. However, it was noted by the applicant (and accepted by the RMS in the DAR) that SFO kinetics were not always the best fit for decline of fluopicolide between applications. In the DAR assessment of the field trials, biphasic (Hockey Stick) kinetics were reported as the best fit of decline at the Philippsburg and Apilly sites and SFO kinetics at the Senas site. To simulate potential accumulation in further successive years, SFO degradation rate constants for fluopicolide (k1) and M-01(k2) plus the initial soil residue of fluopicolide applied annually (C0) were optimised by the applicant using an Excel spreadsheet. The parameters derived for each dataset, k1, k2 and C0, represented overall values for the 4 years. Best overall fit was reported to be derived with Excel Solver using least squares optimisation of the fluopicolide and M-01 soil concentrations measured immediately after each application (Chigh max) and the residue remaining each year prior to application (Clow max). There was no detailed statistical assessment of the fit presented clearly in the study report. The optimised SFO degradation rates and annual application rate (C0) were used in a predicted simulation of fluopicolide and M-01. Actual application dates at each site were used, with following applications at 365 day intervals; C0 was added to the predicted soil concentration remaining immediately prior to the application date.
The predicted plateau values, Chigh max and Clow max, at each site were compared with the experimental data. At Philippsburg, the applicant reported that concentrations of fluopicolide in soil reached a plateau during the accumulation trial. SFO kinetics was claimed to give a good fit to the measured Clow max values. The predicted initial concentration of 397 g/ha was close to the nominal/ calibrated rate of ca. 400 g/ha p.a. The predicted Chigh max values differed from the soil concentrations measured immediately after application. The RMS notes that the Chigh max values for year 2 and 3 appear to be under predicted, but then for year 4 and 5 are over predicted. The applicant attributed this to variations resulting from sampling and homogenisation
Fluopicolide - Addendum 1 November 2007
90
processes. Concentrations measured 1 and 3 days after the 1st application (2000) as well as the initial measured soil residue were included in the optimisation procedure.
Figure 8.10 Fluopicolide residues at Philippsburg
Predicted Clow max values were calculated on dates immediately prior to the application dates, which did not always occur in practice, as some measured Clow max samples were taken earlier than the next application date. At the end of Year 2 (22 July 2002, 762 days) Clow max samples were taken after the 3rd application (26 June 2002, 736 days), this was made to a different area of the replicate plots, so did not affect the Year 2 sampling. The applicant concluded that fluopicolide concentrations in soil increased slightly, then reached a plateau during the accumulation study, but that repeated applications were not predicted to result in further increases in soil concentration beyond the duration of the trial. The RMS agrees that accumulation of fluopicolide in soil is not predicted beyond the duration of the study trial at Philippsburg. The predicted plateau concentration was reached by the 5th year (predicted peak plateau concentration 578 g/ha and steady state concentration of 181 g/ha, equivalent to 0.385 mg/kg and 0.121 mg/kg over 10 cm, respectively).
Fluopicolide - Addendum 1 November 2007
91
Figure 8.11 M-01 residues at Philippsburg
The fit to the measured concentrations of metabolite M-01 was considered reasonable by the applicant for the 2nd and 3rd years, but in the 1st and 4th years concentrations were over and under predicted, respectively. The RMS considers that the results are not sufficient to conclude that the metabolite M-01 will not accumulate in soil following repeated use of fluopicolide at this site.
Table 8.11 Results of SFO evaluation at Philippsburg
Fluopicolide Initial concentration (C0) 397 g/ha SFO rate constant (k) 0.00319 d-1
DT50 217.5 days C high max 578 g/ha (0.385 mg/kg over 10 cm) C low max 181 g/ha (0.121 mg/kg over 10 cm)
M-01 DT50 95.8 days
SFO rate constant (k) 0.00724 d-1 C high max 169 g as equivalents (84 g M-01/ha) C low max 118 g as equivalents (58 g M-01/ha)
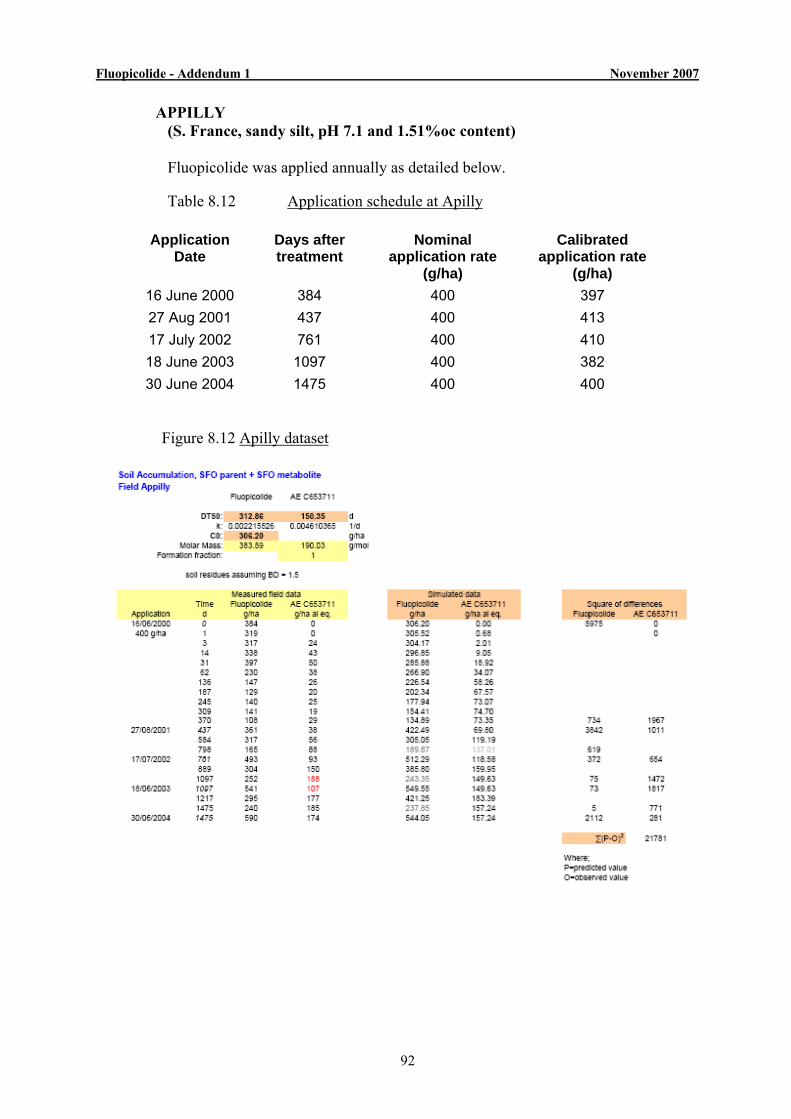
Fluopicolide - Addendum 1 November 2007
92
APPILLY (S. France, sandy silt, pH 7.1 and 1.51%oc content) Fluopicolide was applied annually as detailed below.
Table 8.12 Application schedule at Apilly
Application
Date Days after treatment
Nominal application rate
(g/ha)
Calibrated application rate
(g/ha) 16 June 2000 384 400 397 27 Aug 2001 437 400 413 17 July 2002 761 400 410 18 June 2003 1097 400 382 30 June 2004 1475 400 400
Figure 8.12 Apilly dataset
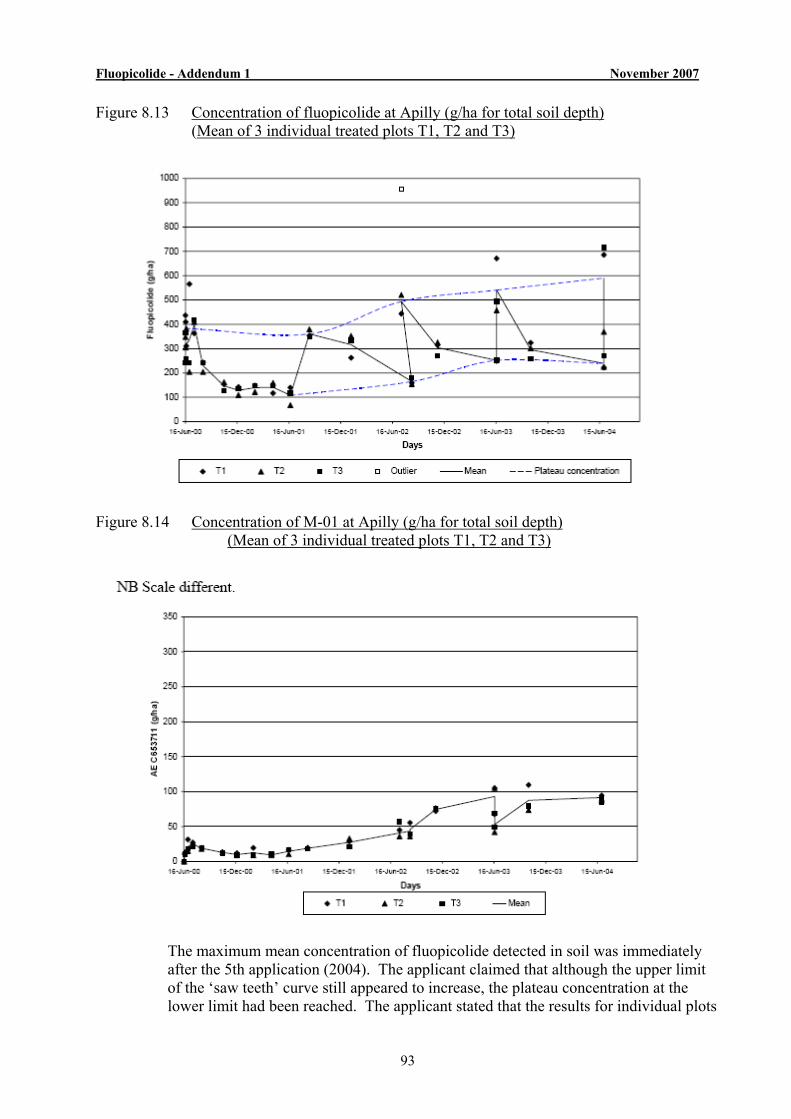
Fluopicolide - Addendum 1 November 2007
93
Figure 8.13 Concentration of fluopicolide at Apilly (g/ha for total soil depth) (Mean of 3 individual treated plots T1, T2 and T3)
Figure 8.14 Concentration of M-01 at Apilly (g/ha for total soil depth)
(Mean of 3 individual treated plots T1, T2 and T3)
The maximum mean concentration of fluopicolide detected in soil was immediately after the 5th application (2004). The applicant claimed that although the upper limit of the ‘saw teeth’ curve still appeared to increase, the plateau concentration at the lower limit had been reached. The applicant stated that the results for individual plots

Fluopicolide - Addendum 1 November 2007
94
showed good replication between the plots immediately prior to each application and that the Clow max values reached a plateau by the study end. There was some variation in concentrations immediately after application (Chigh max) between replicate plots, Chigh max appeared level at last point in plot T1, slightly declined in plot T2 and increased in plot T3, (in which one of the applications was excluded as an outlier). The applicant noted that this was compared to good replication at later time points and attributed the variation to the uncertainties of sampling and homogenising soil samples after application when residues were only present in the top ≤1 cm layer of soil core. The applicant concluded that measured Chigh max values reached a plateau in two of the three experimental plots. The RMS notes that for individual plot T3, the Clow max showed a very slight increase and although for plots T1 and T2, Clow max decreased by the study end, this was only at the last sample point. The RMS does not consider that there is sufficient evidence to show that a plateau concentration was reached at this site at two of the three plots. The RMS considers there is insufficient evidence to show that the metabolite M-01 had reached a plateau concentration at this site during the study.
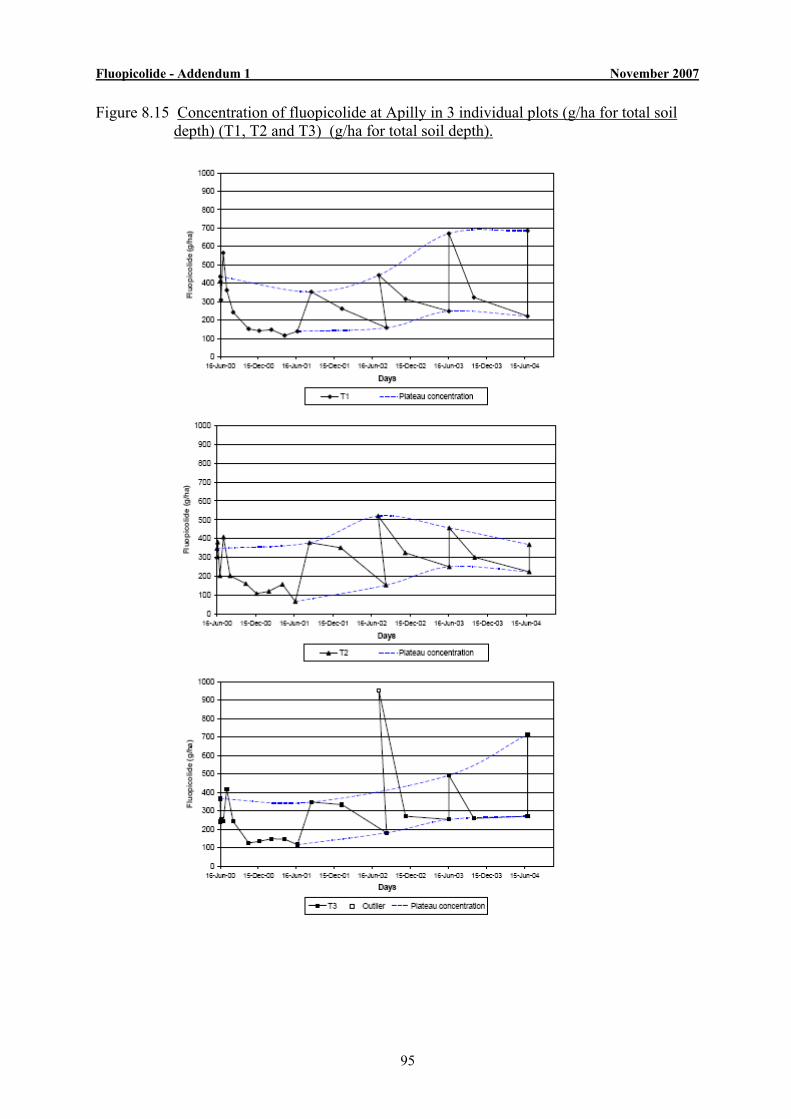
Fluopicolide - Addendum 1 November 2007
95
Figure 8.15 Concentration of fluopicolide at Apilly in 3 individual plots (g/ha for total soil depth) (T1, T2 and T3) (g/ha for total soil depth).
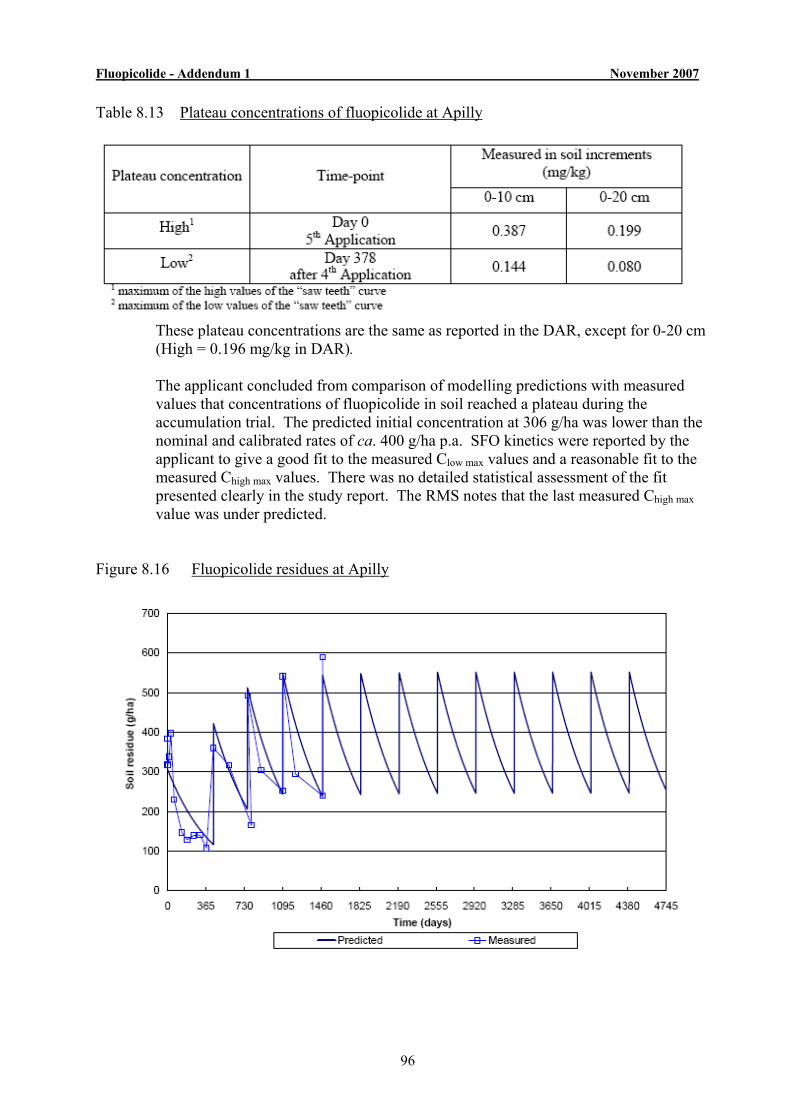
Fluopicolide - Addendum 1 November 2007
96
Table 8.13 Plateau concentrations of fluopicolide at Apilly
These plateau concentrations are the same as reported in the DAR, except for 0-20 cm (High = 0.196 mg/kg in DAR). The applicant concluded from comparison of modelling predictions with measured values that concentrations of fluopicolide in soil reached a plateau during the accumulation trial. The predicted initial concentration at 306 g/ha was lower than the nominal and calibrated rates of ca. 400 g/ha p.a. SFO kinetics were reported by the applicant to give a good fit to the measured Clow max values and a reasonable fit to the measured Chigh max values. There was no detailed statistical assessment of the fit presented clearly in the study report. The RMS notes that the last measured Chigh max value was under predicted.
Figure 8.16 Fluopicolide residues at Apilly
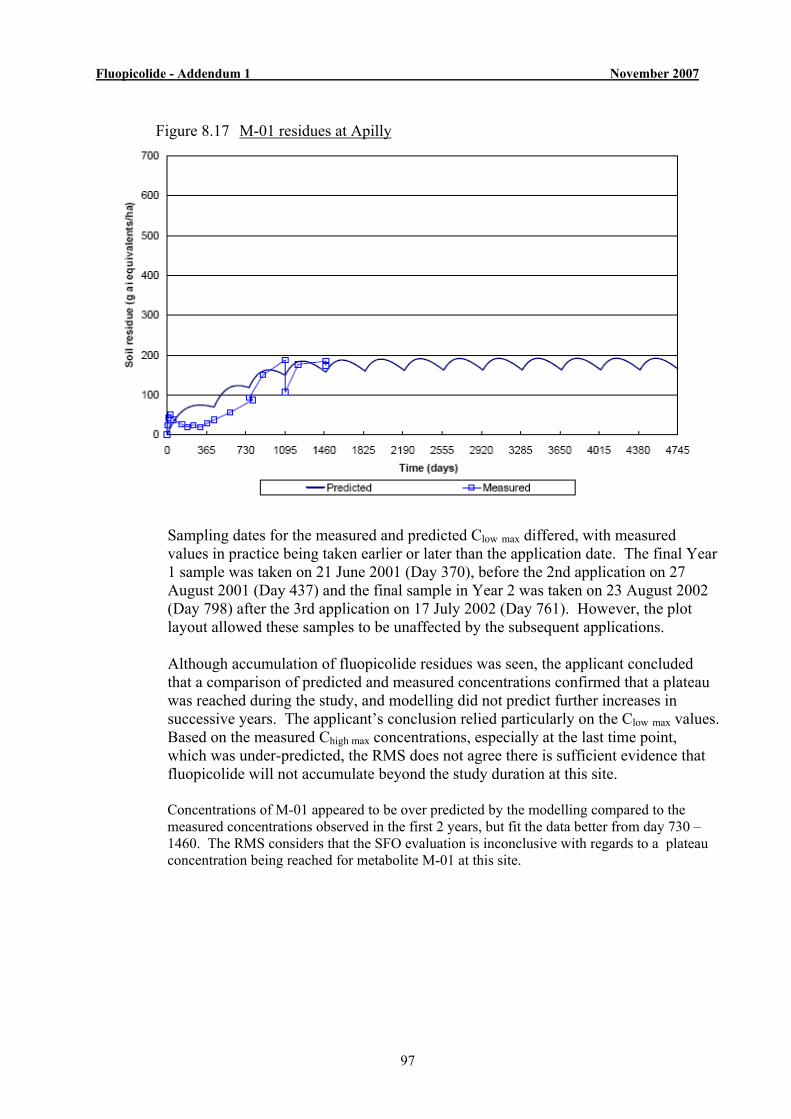
Fluopicolide - Addendum 1 November 2007
97
Figure 8.17 M-01 residues at Apilly
Sampling dates for the measured and predicted Clow max differed, with measured values in practice being taken earlier or later than the application date. The final Year 1 sample was taken on 21 June 2001 (Day 370), before the 2nd application on 27 August 2001 (Day 437) and the final sample in Year 2 was taken on 23 August 2002 (Day 798) after the 3rd application on 17 July 2002 (Day 761). However, the plot layout allowed these samples to be unaffected by the subsequent applications. Although accumulation of fluopicolide residues was seen, the applicant concluded that a comparison of predicted and measured concentrations confirmed that a plateau was reached during the study, and modelling did not predict further increases in successive years. The applicant’s conclusion relied particularly on the Clow max values. Based on the measured Chigh max concentrations, especially at the last time point, which was under-predicted, the RMS does not agree there is sufficient evidence that fluopicolide will not accumulate beyond the study duration at this site.
Concentrations of M-01 appeared to be over predicted by the modelling compared to the measured concentrations observed in the first 2 years, but fit the data better from day 730 –1460. The RMS considers that the SFO evaluation is inconclusive with regards to a plateau concentration being reached for metabolite M-01 at this site.
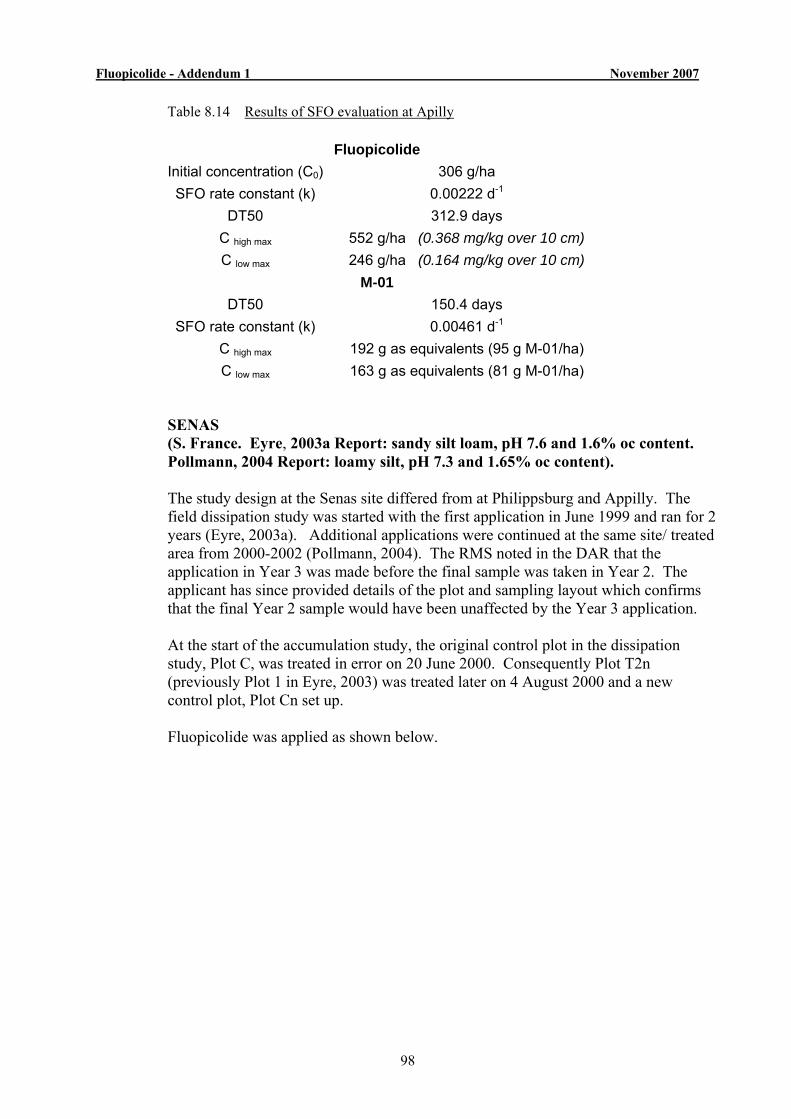
Fluopicolide - Addendum 1 November 2007
98
Table 8.14 Results of SFO evaluation at Apilly
Fluopicolide Initial concentration (C0) 306 g/ha SFO rate constant (k) 0.00222 d-1
DT50 312.9 days C high max 552 g/ha (0.368 mg/kg over 10 cm) C low max 246 g/ha (0.164 mg/kg over 10 cm)
M-01 DT50 150.4 days
SFO rate constant (k) 0.00461 d-1 C high max 192 g as equivalents (95 g M-01/ha) C low max 163 g as equivalents (81 g M-01/ha)
SENAS (S. France. Eyre, 2003a Report: sandy silt loam, pH 7.6 and 1.6% oc content. Pollmann, 2004 Report: loamy silt, pH 7.3 and 1.65% oc content). The study design at the Senas site differed from at Philippsburg and Appilly. The field dissipation study was started with the first application in June 1999 and ran for 2 years (Eyre, 2003a). Additional applications were continued at the same site/ treated area from 2000-2002 (Pollmann, 2004). The RMS noted in the DAR that the application in Year 3 was made before the final sample was taken in Year 2. The applicant has since provided details of the plot and sampling layout which confirms that the final Year 2 sample would have been unaffected by the Year 3 application. At the start of the accumulation study, the original control plot in the dissipation study, Plot C, was treated in error on 20 June 2000. Consequently Plot T2n (previously Plot 1 in Eyre, 2003) was treated later on 4 August 2000 and a new control plot, Plot Cn set up. Fluopicolide was applied as shown below.
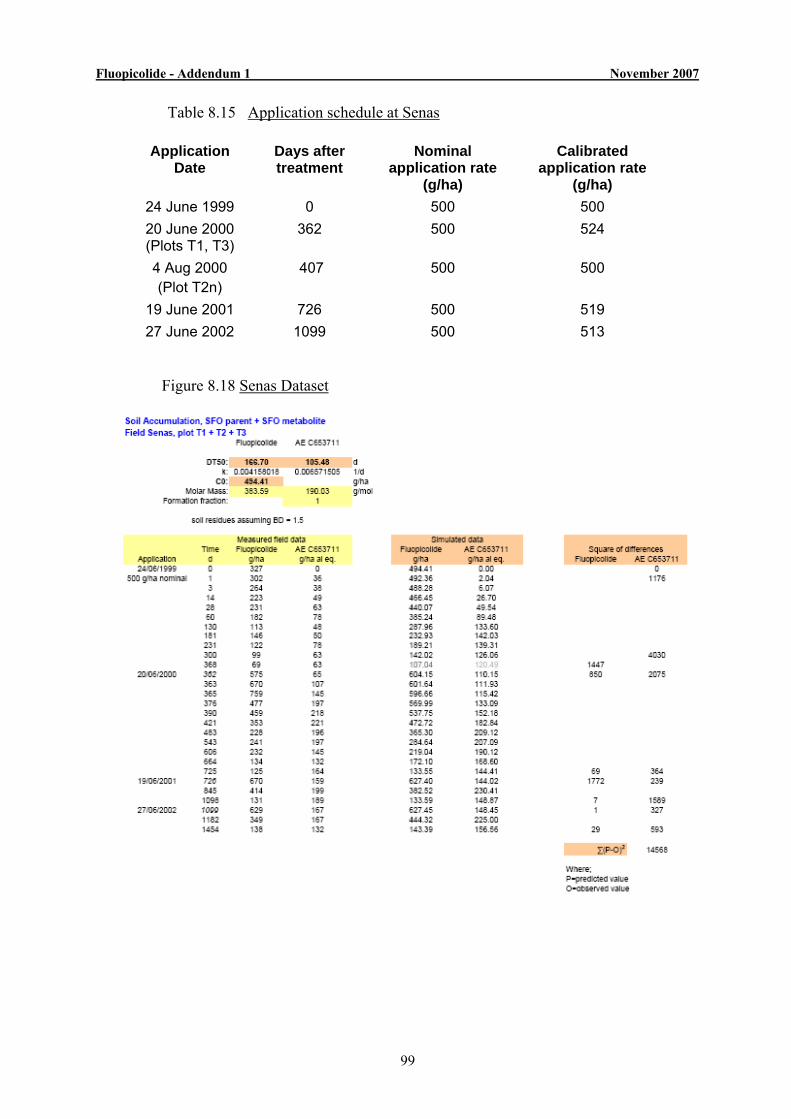
Fluopicolide - Addendum 1 November 2007
99
Table 8.15 Application schedule at Senas
Application Date
Days after treatment
Nominal application rate
(g/ha)
Calibrated application rate
(g/ha) 24 June 1999 0 500 500 20 June 2000 (Plots T1, T3)
362 500 524
4 Aug 2000 (Plot T2n)
407 500 500
19 June 2001 726 500 519 27 June 2002 1099 500 513
Figure 8.18 Senas Dataset
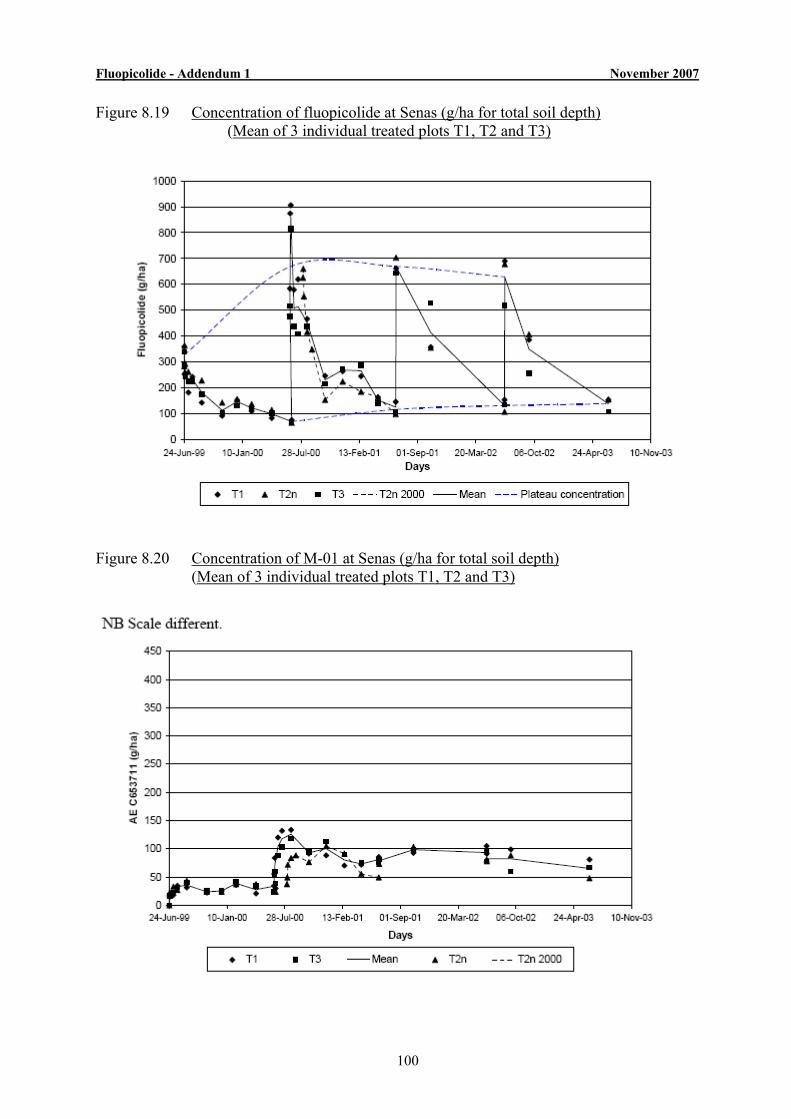
Fluopicolide - Addendum 1 November 2007
100
Figure 8.19 Concentration of fluopicolide at Senas (g/ha for total soil depth) (Mean of 3 individual treated plots T1, T2 and T3)
Figure 8.20 Concentration of M-01 at Senas (g/ha for total soil depth)
(Mean of 3 individual treated plots T1, T2 and T3)
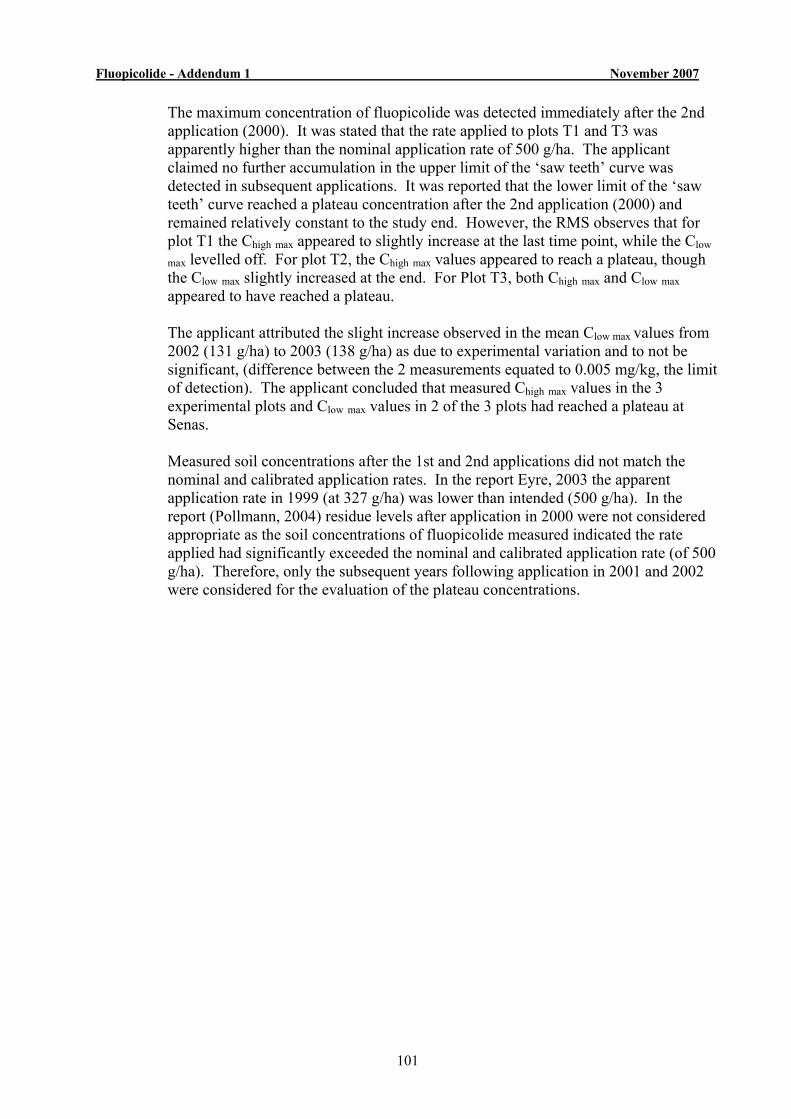
Fluopicolide - Addendum 1 November 2007
101
The maximum concentration of fluopicolide was detected immediately after the 2nd application (2000). It was stated that the rate applied to plots T1 and T3 was apparently higher than the nominal application rate of 500 g/ha. The applicant claimed no further accumulation in the upper limit of the ‘saw teeth’ curve was detected in subsequent applications. It was reported that the lower limit of the ‘saw teeth’ curve reached a plateau concentration after the 2nd application (2000) and remained relatively constant to the study end. However, the RMS observes that for plot T1 the Chigh max appeared to slightly increase at the last time point, while the Clow max levelled off. For plot T2, the Chigh max values appeared to reach a plateau, though the Clow max slightly increased at the end. For Plot T3, both Chigh max and Clow max appeared to have reached a plateau. The applicant attributed the slight increase observed in the mean Clow max values from 2002 (131 g/ha) to 2003 (138 g/ha) as due to experimental variation and to not be significant, (difference between the 2 measurements equated to 0.005 mg/kg, the limit of detection). The applicant concluded that measured Chigh max values in the 3 experimental plots and Clow max values in 2 of the 3 plots had reached a plateau at Senas. Measured soil concentrations after the 1st and 2nd applications did not match the nominal and calibrated application rates. In the report Eyre, 2003 the apparent application rate in 1999 (at 327 g/ha) was lower than intended (500 g/ha). In the report (Pollmann, 2004) residue levels after application in 2000 were not considered appropriate as the soil concentrations of fluopicolide measured indicated the rate applied had significantly exceeded the nominal and calibrated application rate (of 500 g/ha). Therefore, only the subsequent years following application in 2001 and 2002 were considered for the evaluation of the plateau concentrations.
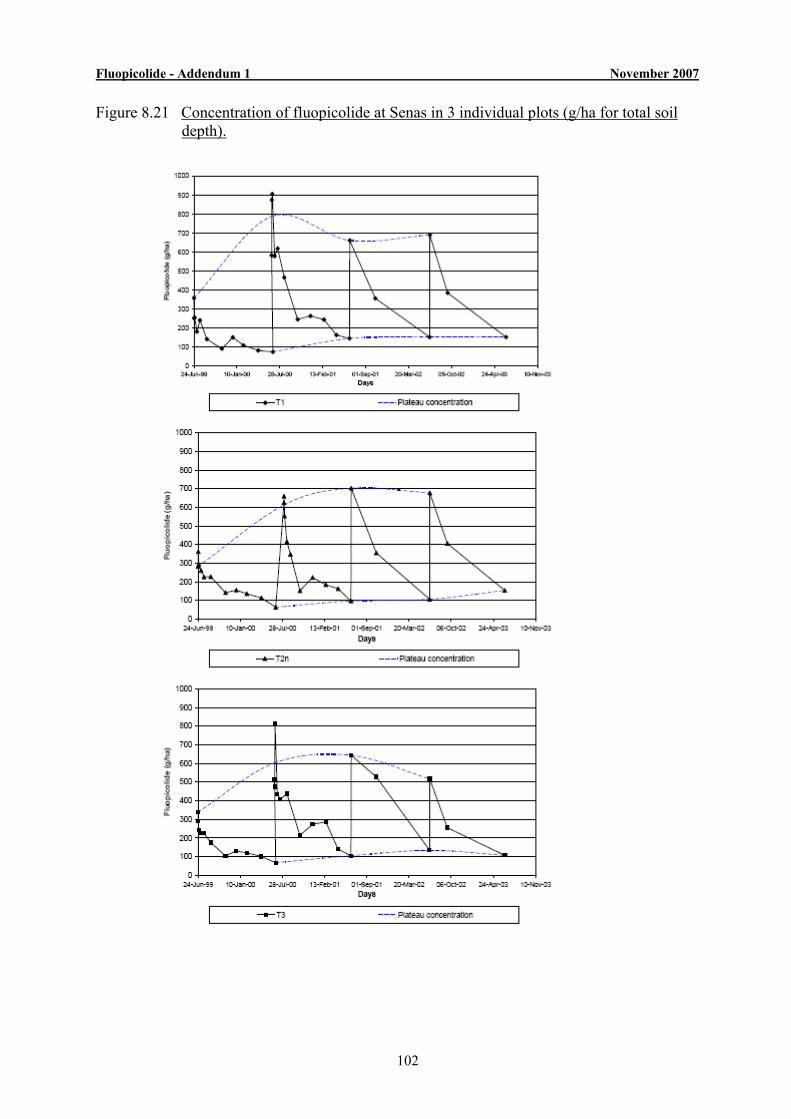
Fluopicolide - Addendum 1 November 2007
102
Figure 8.21 Concentration of fluopicolide at Senas in 3 individual plots (g/ha for total soil depth).
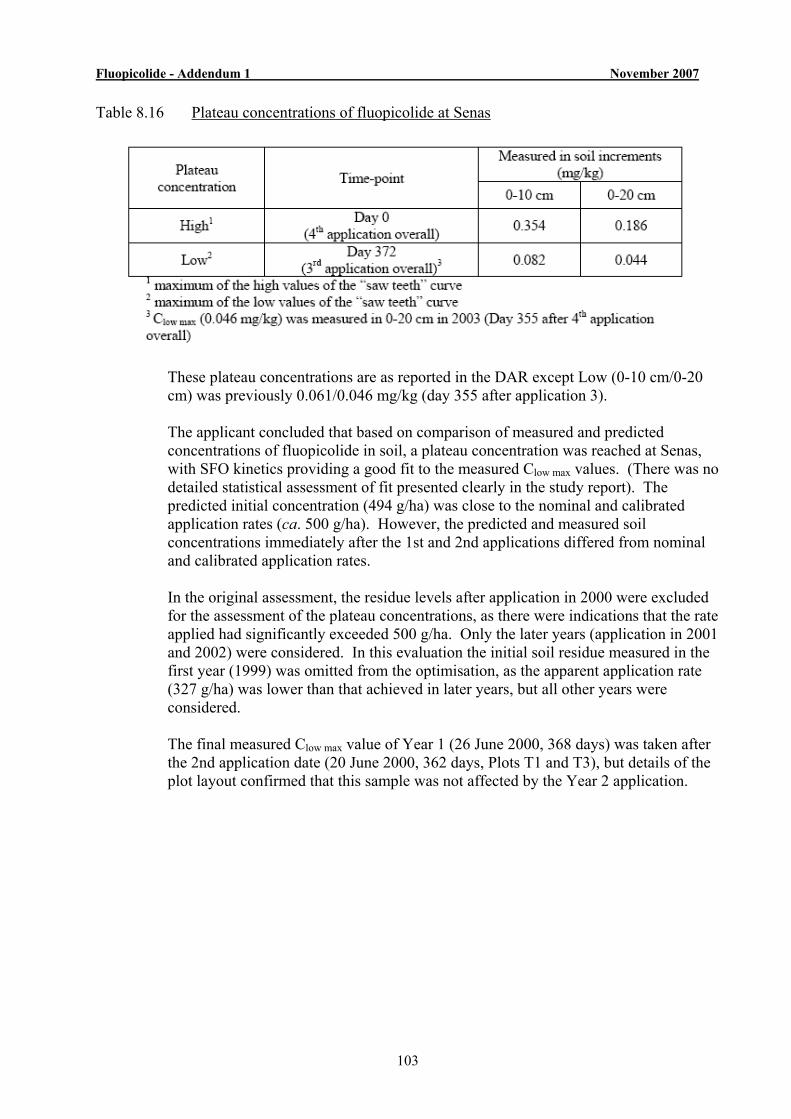
Fluopicolide - Addendum 1 November 2007
103
Table 8.16 Plateau concentrations of fluopicolide at Senas
These plateau concentrations are as reported in the DAR except Low (0-10 cm/0-20 cm) was previously 0.061/0.046 mg/kg (day 355 after application 3). The applicant concluded that based on comparison of measured and predicted concentrations of fluopicolide in soil, a plateau concentration was reached at Senas, with SFO kinetics providing a good fit to the measured Clow max values. (There was no detailed statistical assessment of fit presented clearly in the study report). The predicted initial concentration (494 g/ha) was close to the nominal and calibrated application rates (ca. 500 g/ha). However, the predicted and measured soil concentrations immediately after the 1st and 2nd applications differed from nominal and calibrated application rates. In the original assessment, the residue levels after application in 2000 were excluded for the assessment of the plateau concentrations, as there were indications that the rate applied had significantly exceeded 500 g/ha. Only the later years (application in 2001 and 2002) were considered. In this evaluation the initial soil residue measured in the first year (1999) was omitted from the optimisation, as the apparent application rate (327 g/ha) was lower than that achieved in later years, but all other years were considered. The final measured Clow max value of Year 1 (26 June 2000, 368 days) was taken after the 2nd application date (20 June 2000, 362 days, Plots T1 and T3), but details of the plot layout confirmed that this sample was not affected by the Year 2 application.
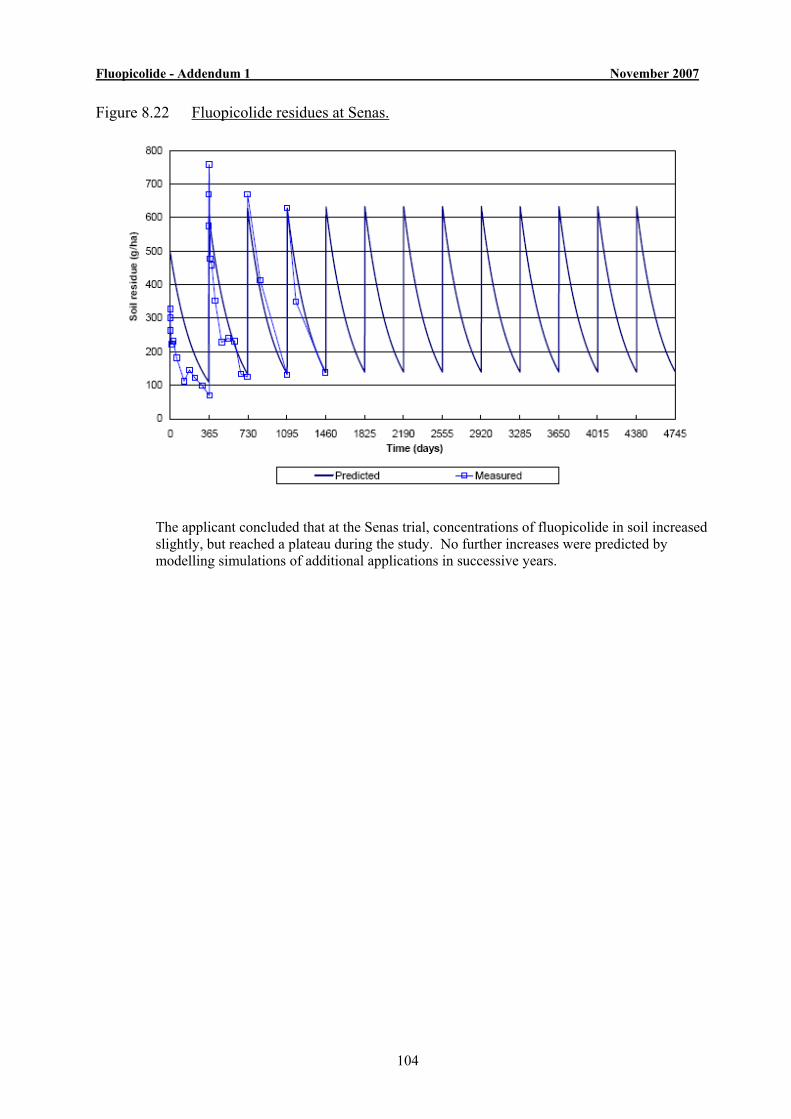
Fluopicolide - Addendum 1 November 2007
104
Figure 8.22 Fluopicolide residues at Senas.
The applicant concluded that at the Senas trial, concentrations of fluopicolide in soil increased slightly, but reached a plateau during the study. No further increases were predicted by modelling simulations of additional applications in successive years.
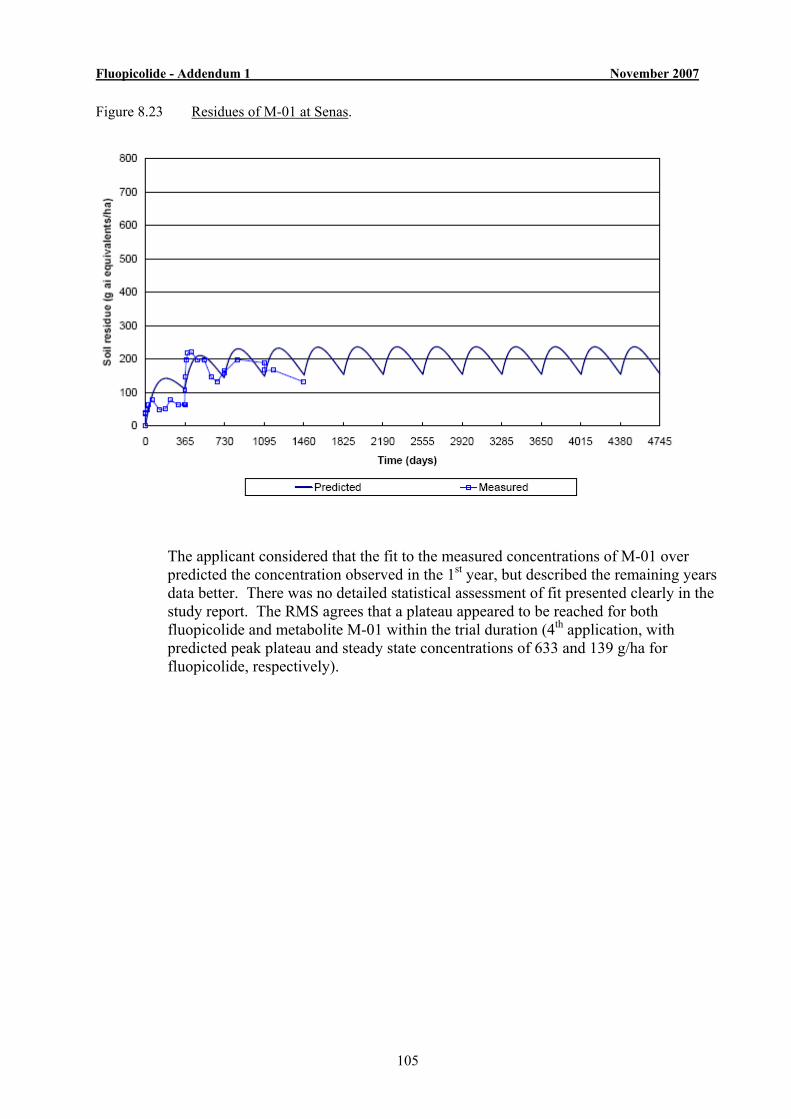
Fluopicolide - Addendum 1 November 2007
105
Figure 8.23 Residues of M-01 at Senas.
The applicant considered that the fit to the measured concentrations of M-01 over predicted the concentration observed in the 1st year, but described the remaining years data better. There was no detailed statistical assessment of fit presented clearly in the study report. The RMS agrees that a plateau appeared to be reached for both fluopicolide and metabolite M-01 within the trial duration (4th application, with predicted peak plateau and steady state concentrations of 633 and 139 g/ha for fluopicolide, respectively).
Fluopicolide - Addendum 1 November 2007
106
Table 8.17 Results of the SFO evaluation at Senas.
Fluopicolide
Initial concentration (C0) 494ha SFO rate constant (k) 0.00416 d-1
DT50 166.7 days C high max 633 g/ha (0.422 mg/kg over 10 cm) C low max 139 g/ha (0.026 mg/kg over 10 cm)
M-01 DT50 105.5 days
SFO rate constant (k) 0.00657 d-1 C high max 237 g as equivalents (117 g M-01/ha) C low max 154 g as equivalents (76 g M-01/ha)
RMS Risk Assessment and Conclusions:
Fluopicolide To summarise the results from the three sites: At the Philippsburg site, the measured concentrations of fluopicolide from two of three trial plots (T1 and T3) indicated that a plateau concentration was likely to have been reached during the trial. For the third plot T2, the Chigh max values appeared to have plateaued by the study end, though Clow
max slightly increased at the last sampling point. However, based on mean values a plateau concentration appeared to be reached by the study end. Modelling, with SFO kinetics predicted no further increase in residues from repeated applications in successive years after the trial. This modelling underestimated measured Chigh max residues at the 2nd and 3rd applications, but overestimated them for the 4th and 5th applications. The plateau concentration was predicted to be reached by the 5th year with Chigh max and Clow max values of 578 and 181 g/ha, respectively. The RMS considers that the overall data indicate that fluopicolide appeared to have reached a plateau concentration within the study duration. At the Apilly site, the measured concentrations of fluopicolide from one of three trial plots (T3) indicated that a plateau was not reached, both Chigh max and Clow max values were still increasing at the study end. In plot T1, Chigh max and Clow max appeared to plateau, but only at the last sampling point and at plot T2, Chigh max clearly declined, though Clow max values were again only level at the last point. Based on mean values the Clow max values appeared to plateau but the Chigh max values did not. No further increase in residues beyond the trial was predicted by modelling, with SFO kinetics after repeated applications in successive years. The plateau concentration was predicted by the applicant to be reached by the 5th year with Chigh max and Clow max values of 552and 246 g/ha, respectively. The RMS considers that this modelling underestimated measured Chigh max residues at last (5th) application and that the data are inconclusive as to whether a plateau was reached during the trial.
Fluopicolide - Addendum 1 November 2007
107
At the Senas site, the measured concentrations of fluopicolide from one of three trial plots (T3) indicated that a plateau was reached. At the T1 plot, Chigh max slightly increased at the last point though Clow max had reached a plateau. For plot T2, Chigh max values had plateaued, though the Clow max value was still increasing at the study end. The RMS considers that overall, based on mean Chigh max values, concentrations had reached a plateau and the Clow max values, though close to levelling off, were very slightly increasing at the study end. Modelling, assuming SFO kinetics predicted no further increases based on repeated applications in successive years after the trial. This modelling underestimated measured Chigh max residues at 2nd application, but the fit to later years was reasonable. The plateau concentration was predicted by the applicant to be reached by the last (4th) year with Chigh max and Clow max values of 633and 139 g/ha, respectively. Therefore, the RMS accepts that a plateau concentration appeared to have been reached for fluopicolide at the Senas site within the study duration. The applicant compared the maximum residue level observed for fluopicolide at each site after 4 years (Chigh max 0.341-0.387 mg/kg over 10 cm) as equivalent to 1.1 -1.5 times the residue in soil after a single application. (In support of this, the RMS estimates an initial PECsoil after a single application of 400-500 g a.s/ha of 0.267-0.333 mg/kg over 10 cm soil depth, based on a simple first tier calculation with no interception assumed). M-01 Concentrations of the metabolite M-01 (AE C653711) were not predicted by the applicant to significantly increase in soil, in successive years after the study duration at each site. However, the agreement between the concentrations predicted by SFO modelling and the measured concentrations was less robust. The RMS considered that based on the measured data there was insufficient evidence of a plateau concentration being reached for M-01 at the Philippsburg and Apilly sites during the trials, although a plateau concentration for M-01 did appear to be reached at the Senas site. The RMS considered that for Philippsburg site the modelling clearly underestimated the concentrations of M-01 at the last time point. For the Apilly site, the RMS considered that the predicted concentrations for M-01 were closer to the measured data (except for under-estimations in the first year) and that at the Senas site, the modelling appeared to generally over predict concentrations of M-01. The RMS proposes that further discussion is needed at the expert meeting over the general acceptability of this type of higher tier approach, versus a simple first tier calculation of PECsoil accumulation. Further discussion may also be warranted over how best to interpret measured versus predicted concentrations in soil and the results of individual plots compared to mean results at each site, in reaching an overall conclusion on the potential for accumulation of an active substance. Implications for Ecotoxicogical Assessment: No implications for the ecotoxicolgical assessment at present. However, the PECsoil may need to be reassessed on the basis of the PRAPeR expert meeting discussion.
Fluopicolide - Addendum 1 November 2007
108
(Kley, C; Mackenzie, E; M-267721-01-1, 2007) B.8.6.2 Predicted environmental concentrations in groundwater.
Data Requirement 4.3 “Applicant to provide results with a second FOCUS model following the recommendations given in the PPR Opinion: Opinion of the Scientific Panel on Plant Health, Plant Protection Products and their Residues on a request of EFSA related to FOCUS groundwater models. The EFSA Journal (2004) 93, 1-20. For some of the metabolites it may not be confirmed that the triggers of 0.75 µg/L and 10 µg/L are not exceeded in some scenarios. A second model is necessary to reduce the uncertainty and confirm the non relevance of the metabolites. Applicant indicated to submit new PEC GW calculations with a second model and lower interception rate for vines by May 2007. See reporting table 4(79).” Data Requirement 4.4 “Applicant to repeat the FOCUS GW calculations following the GAP as reported in the Representative uses table. Applicant indicated to submit repeated PEC GW calculations with a lower interception rate for vines by May 2007. See reporting table 4(80).” Background: Potential contamination of groundwater by fluopicolide was assessed with only one FOCUS model, (DAR, B.8.6.2), as the submission was made prior to the PPR Opinion3
recommending the results of two models are needed to complete the risk assessment. The applicant was requested to provide results for FOCUS GW modelling with a second FOCUS model to reduce uncertainty and confirm the non-relevance of metabolites, following recommendations given in the PPR Opinion (EFSA Journal (2004) 93, 1-20). For the PECgw calculation (DAR, B.8.6.2) it was assumed a one in three year crop rotation was representative of good agricultural practice in potatoes. However, as crop rotation is not mandatory and the ‘representative’ use concept implies the assessment is also applicable to other crops represented by the specific crop listed, the applicant was requested to repeat the FOCUS GW calculations following the GAP as reported in the Representative uses table. Similarly, the applicant was requested to repeat the FOCUS
3 Opinion of the Scientific Panel on Plant Health, Plant Protection Products and their Residues on a request of EFSA
related to FOCUS groundwater models. The EFSA Journal (2004) 93, 1-20.
Fluopicolide - Addendum 1 November 2007
109
GW modelling with a lower interception rate for vines. (Reporting Table, points 4(79), 4(80) and 4(81)).
Summary of approach taken to address Data requirements 4.3 and 4.4 The applicant has performed new FOCUS groundwater modelling with PELMO. These simulations include lower interception rates for use on vines and also for modelling of use on potatoes, application of fluopicolide once every year and every 2 years, as well the previously assessed 1-in-3 year crop rotation pattern. Furthermore, as a second FOCUS groundwater model was required, in accordance with the PPR opinion (EFSA Journal (2004) 93, 1-20), the applicant has performed PECgw calculations for use of fluopicolide on vines and potatoes, using the PEARL model. In the original assessment, batch equilibrium studies (Rupprecht 2003 & Simmonds 2003) were previously evaluated in the DAR B.8.2.1 (a) and (b) and sorption of fluopicolide was correlated with organic carbon/matter content of the soil. However, these studies do not take into account kinetically controlled sorption behaviour and so may, in the view of the applicant, underestimate sorption and overestimate mobility. Time-dependent laboratory sorption studies (Fitzmaurice, 2003, Allan, 2003b) were carried out to investigate kinetic sorption and reported in the DAR, B.8.2.1.(c) & (d), although these were not relied on for the exposure assessment presented in the original DAR. The Koc was increased by a factor of ca. 2.1 over 23 days (Fitzmaurice, 2003) and ca. 2.3 over 121 days (Allan, 2003b) indicating stronger sorption of fluopicolide with time. Time-dependent sorption is proposed by the applicant, as a possible explanation for the bi-phasic behaviour of fluopicolide in some field dissipation trials. In this new assessment, the applicant has taken into account data on time-dependent sorption for fluopicolide using the PEARL model and its ability to simulate non-equilibrium sorption (PEARL NEQ). In the PEARL NEQ model, sorption of substances in soil is described by a Freundlich type equation, with both equilibrium and non-equilibrium (kinetic) sorption being able to be considered. Sorption in the equilibrium domain of the soil system is assumed to occur instantaneously, whereas sorption in the non-equilibrium domain proceeds gradually. As pesticide is assumed to be present in both domains, 2 mass balance equations are needed.4 The mass balance equation for sorption in the non-equilibrium domain requires additional parameters i.e. the desorption rate coefficient (kd) and a
4 From RIVM report 711401 008. Alterra report 28. Manual of FOCUS PEARL v 1.1.1. November 2000. A. Tiktak,
F. van den Berg, J.j.T.I Doesten, D.van Kraalingen, M.Leistra & A.M.A. van der Linden: 2.5.3. …..two mass balances apply: ∂c*
eq / ∂t = -Rs - ∂J p,L / ∂z - ∂J p,g / ∂z – Rt – Ru - Rd and ∂c*
neq / ∂t = Rs
where c*
eq (kg m-3) and c*neq (kg m-3) are the pesticide concentrations in the equilibrium and non-equilibrium domains of
the soil system, respectively. Rs (kg m-3 d-1) is the volumic mass rate of pesticide sorption. J p,L and J p,g (kg m-2 d-1) are the mass flux of pesticide in the liquid and gas phases, respectively. Rt and Rt (kg m-3 d-1) are the transformation and formation rates , respectively. Ru (kg m-3 d-1) is the rate of pesticide uptake by plant roots and Rd (kg m-3 d-1) is the lateral discharge rate of pesticides.
Fluopicolide - Addendum 1 November 2007
110
factor describing the ratio (FNE) between the Freundlich coefficients at the equilibrium (EQ) and non-equilibrium (NEQ) sites i.e. (FNE = Kf, NEQ/ Kf,EQ). In the PEARL NEQ model, it is assumed that transformation of a pesticide only occurs in the equilibrium domain. Therefore, as the transformation half-life can only apply to the equilibrium domain, it must be obtained using an alternative approach for this purpose, (whereas DT50 values commonly reported for pesticides usually refer to the total mass content of pesticide). An example of such an approach for transformation of compound in case of sorption/ desorption kinetics is described in section 3.2.10 of the RIVM report 711401 008.5 To take into account time-dependent sorption in the PEARL model, new parameters were needed for degradation rate constant for a.s. in equilibrium phases, desorption rate constant (kd) and ratio of Freundlich coefficients for equilibrium and non-equilibrium sites (fNE). Two new studies have been submitted (Kley, 2004 MEF-04/346 and MEF -04/347) in which the applicant has used a kinetic sorption model to describe the kinetic processes influencing sorption of fluopicolide and to obtain parameter values that could be used in a higher tier assessment. (Metabolites were not considered). The applicant has evaluated the time-dependent sorption of fluopicolide using batch equilibrium data (Kley, 2004, MEF-04/346), to obtain the necessary parameters and then also applied the results from this approach to an evaluation of field dissipation data to obtain a suitable field DT50, for use in the PEARL kinetic sorption model, (Kley, 2004, MEF 04/347). These kinetic sorption parameters have then been implemented into the FOCUS PEARL modelling (Kley, C. & Ellerich C. 2007 (a) and (b)). PECgw estimates conducted with the FOCUS PEARL model, using standard degradation parameters as a first step, before implementing kinetic sorption parameters, have not been provided. It was not possible to implement sorption kinetics in the PELMO model, which was instead performed using standard degradation kinetic and sorption parameters. Each of these studies is assessed in more detail below. RMS Evaluation of new data – Kley, C. 2004 (MEF-04/346) Kinetic evaluation of batch equilibrium data considering time-dependent sorption:
This report describes a kinetic sorption model used by the applicant to derive degradation rates for use in FOCUS PEARL groundwater modelling. The study author claims that “it is equivalent to the one implemented in the PEARL model, which is used to calculate predicted environmental concentrations in groundwater”. The following description of this kinetic evaluation is complex and as such is largely reproduced from the study report. (The complete reports are also appended for information). In order to conclude whether this is a valid approach, the RMS considers
5 RIVM report 711401 008. Alterra report 28. Manual of FOCUS PEARL v 1.1.1. November 2000. A. Tiktak, F. van
den Berg, J.J.T.I Boesten, D.van Kraalingen, M.Leistra & A.M.A. van der Linden.
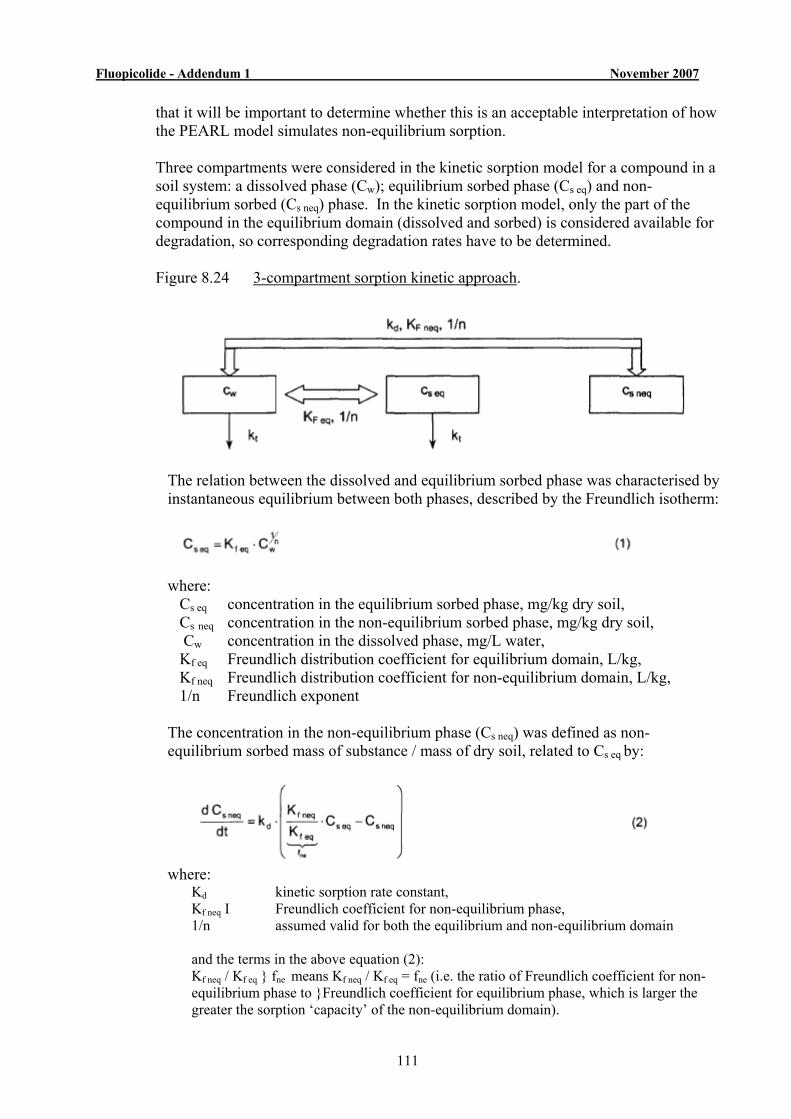
Fluopicolide - Addendum 1 November 2007
111
that it will be important to determine whether this is an acceptable interpretation of how the PEARL model simulates non-equilibrium sorption. Three compartments were considered in the kinetic sorption model for a compound in a soil system: a dissolved phase (Cw); equilibrium sorbed phase (Cs eq) and non-equilibrium sorbed (Cs neq) phase. In the kinetic sorption model, only the part of the compound in the equilibrium domain (dissolved and sorbed) is considered available for degradation, so corresponding degradation rates have to be determined. Figure 8.24 3-compartment sorption kinetic approach.
The relation between the dissolved and equilibrium sorbed phase was characterised by instantaneous equilibrium between both phases, described by the Freundlich isotherm:
where:
Cs eq concentration in the equilibrium sorbed phase, mg/kg dry soil, Cs neq concentration in the non-equilibrium sorbed phase, mg/kg dry soil, Cw concentration in the dissolved phase, mg/L water, Kf eq Freundlich distribution coefficient for equilibrium domain, L/kg, Kf neq Freundlich distribution coefficient for non-equilibrium domain, L/kg, 1/n Freundlich exponent
The concentration in the non-equilibrium phase (Cs neq) was defined as non-equilibrium sorbed mass of substance / mass of dry soil, related to Cs eq by:
where:
Kd kinetic sorption rate constant, Kf neq I Freundlich coefficient for non-equilibrium phase, 1/n assumed valid for both the equilibrium and non-equilibrium domain
and the terms in the above equation (2): Kf neq / Kf eq } fne means Kf neq / Kf eq = fne (i.e. the ratio of Freundlich coefficient for non-equilibrium phase to }Freundlich coefficient for equilibrium phase, which is larger the greater the sorption ‘capacity’ of the non-equilibrium domain).
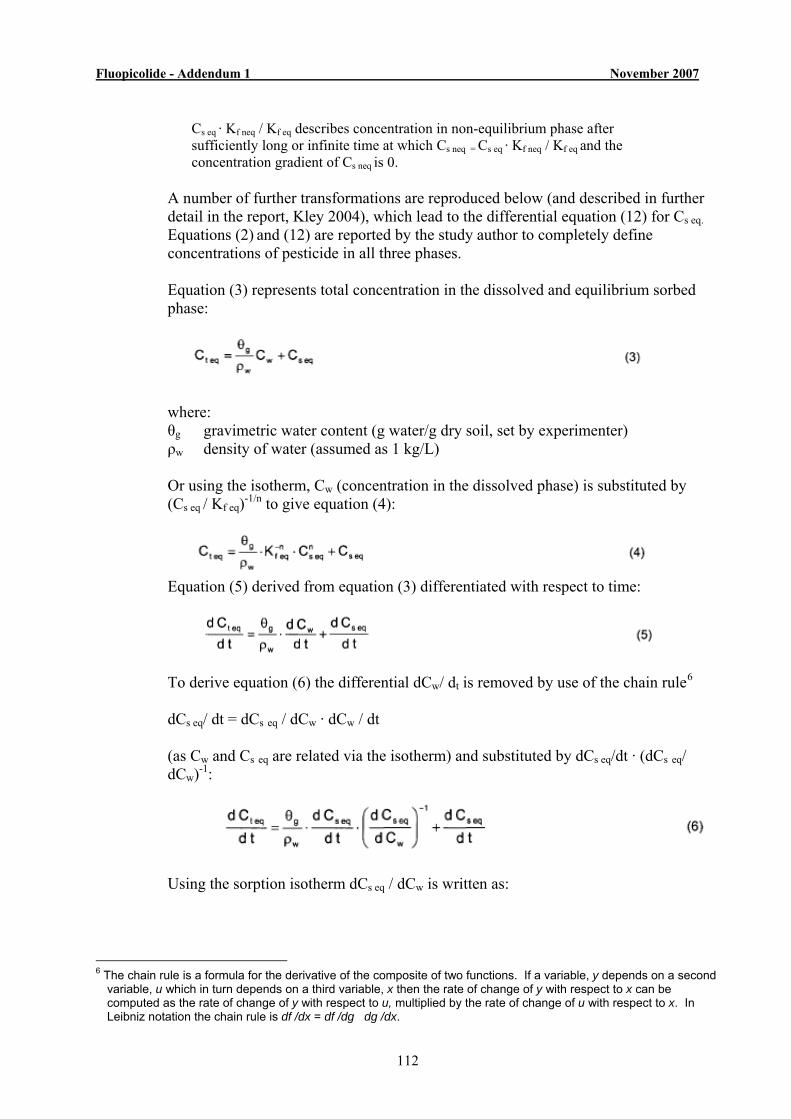
Fluopicolide - Addendum 1 November 2007
112
Cs eq · Kf neq / Kf eq describes concentration in non-equilibrium phase after sufficiently long or infinite time at which Cs neq = Cs eq · Kf neq / Kf eq and the concentration gradient of Cs neq is 0.
A number of further transformations are reproduced below (and described in further detail in the report, Kley 2004), which lead to the differential equation (12) for Cs eq. Equations (2) and (12) are reported by the study author to completely define concentrations of pesticide in all three phases. Equation (3) represents total concentration in the dissolved and equilibrium sorbed phase:
where: θg gravimetric water content (g water/g dry soil, set by experimenter) ρw density of water (assumed as 1 kg/L) Or using the isotherm, Cw (concentration in the dissolved phase) is substituted by (Cs eq / Kf eq)-1/n to give equation (4):
Equation (5) derived from equation (3) differentiated with respect to time:
To derive equation (6) the differential dCw/ dt is removed by use of the chain rule6 dCs eq/ dt = dCs eq / dCw · dCw / dt (as Cw and Cs eq are related via the isotherm) and substituted by dCs eq/dt · (dCs eq/ dCw)-1:
Using the sorption isotherm dCs eq / dCw is written as:
6 The chain rule is a formula for the derivative of the composite of two functions. If a variable, y depends on a second
variable, u which in turn depends on a third variable, x then the rate of change of y with respect to x can be computed as the rate of change of y with respect to u, multiplied by the rate of change of u with respect to x. In Leibniz notation the chain rule is df /dx = df /dg · dg /dx.
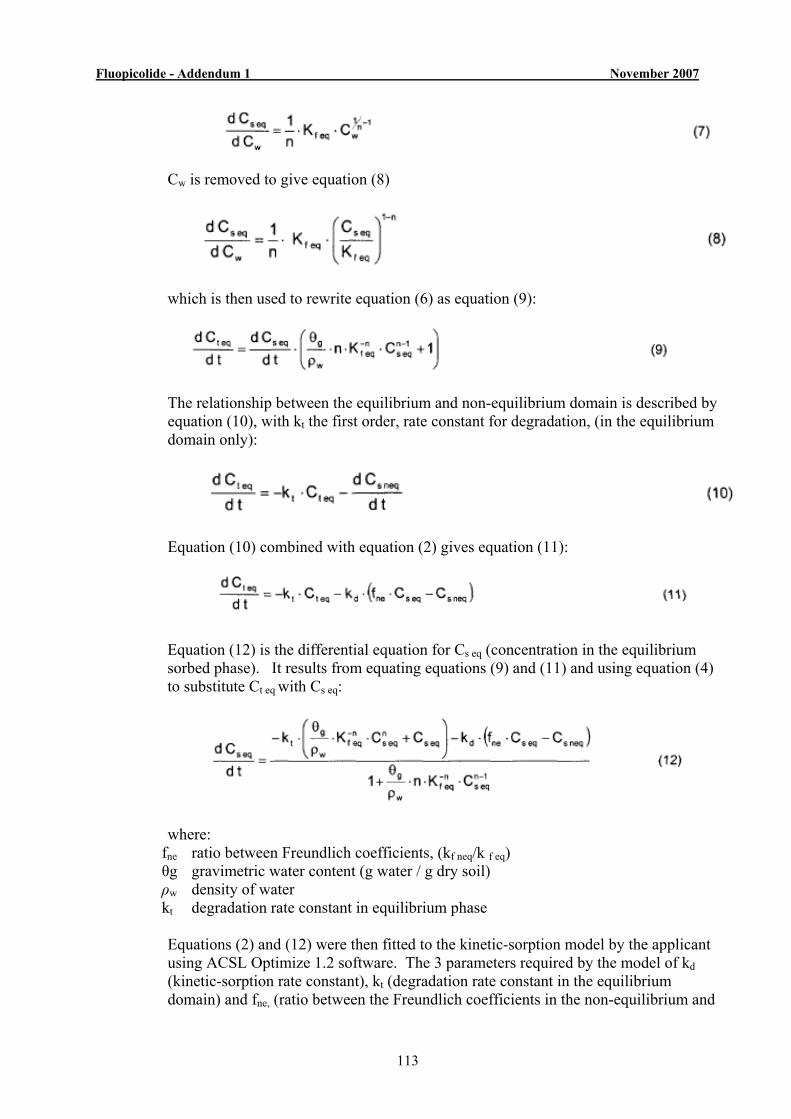
Fluopicolide - Addendum 1 November 2007
113
Cw is removed to give equation (8)
which is then used to rewrite equation (6) as equation (9):
The relationship between the equilibrium and non-equilibrium domain is described by equation (10), with kt the first order, rate constant for degradation, (in the equilibrium domain only):
Equation (10) combined with equation (2) gives equation (11):
Equation (12) is the differential equation for Cs eq (concentration in the equilibrium sorbed phase). It results from equating equations (9) and (11) and using equation (4) to substitute Ct eq with Cs eq:
where:
fne ratio between Freundlich coefficients, (kf neq/k f eq) θg gravimetric water content (g water / g dry soil) ρw density of water kt degradation rate constant in equilibrium phase Equations (2) and (12) were then fitted to the kinetic-sorption model by the applicant using ACSL Optimize 1.2 software. The 3 parameters required by the model of kd (kinetic-sorption rate constant), kt (degradation rate constant in the equilibrium domain) and fne, (ratio between the Freundlich coefficients in the non-equilibrium and
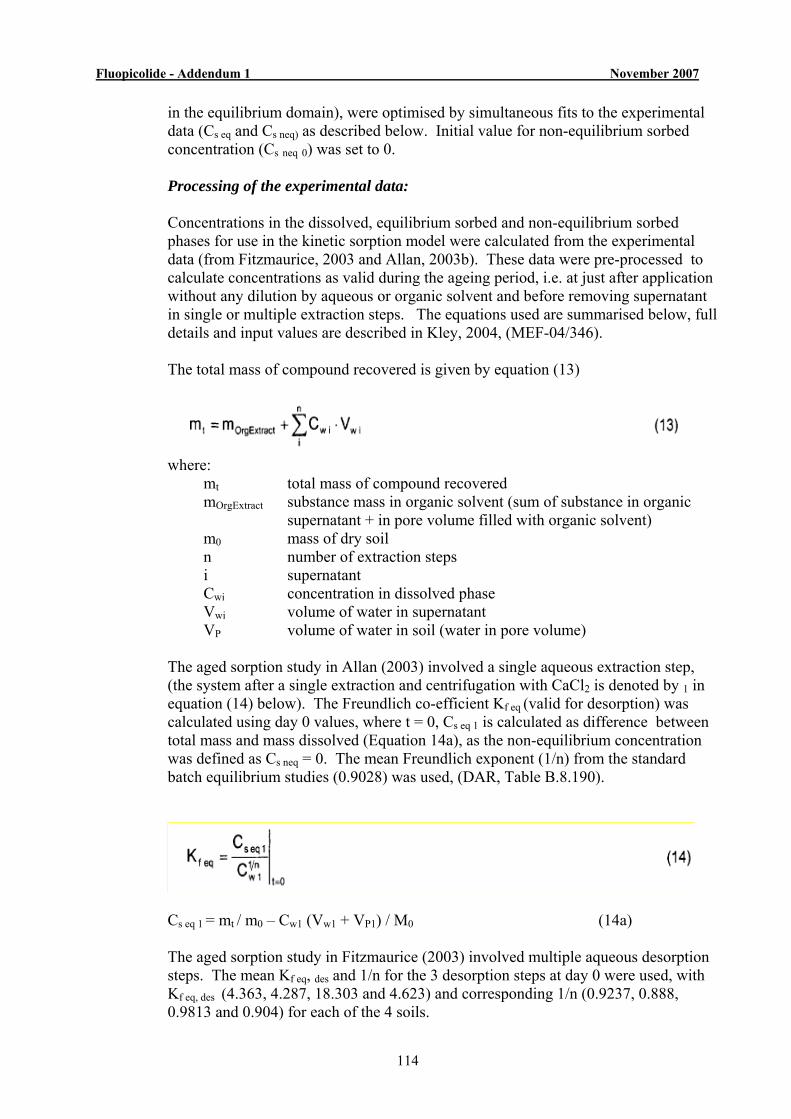
Fluopicolide - Addendum 1 November 2007
114
in the equilibrium domain), were optimised by simultaneous fits to the experimental data (Cs eq and Cs neq) as described below. Initial value for non-equilibrium sorbed concentration (Cs neq 0) was set to 0. Processing of the experimental data: Concentrations in the dissolved, equilibrium sorbed and non-equilibrium sorbed phases for use in the kinetic sorption model were calculated from the experimental data (from Fitzmaurice, 2003 and Allan, 2003b). These data were pre-processed to calculate concentrations as valid during the ageing period, i.e. at just after application without any dilution by aqueous or organic solvent and before removing supernatant in single or multiple extraction steps. The equations used are summarised below, full details and input values are described in Kley, 2004, (MEF-04/346). The total mass of compound recovered is given by equation (13)
where:
mt total mass of compound recovered mOrgExtract substance mass in organic solvent (sum of substance in organic supernatant + in pore volume filled with organic solvent) m0 mass of dry soil n number of extraction steps i supernatant Cwi concentration in dissolved phase Vwi volume of water in supernatant VP volume of water in soil (water in pore volume)
The aged sorption study in Allan (2003) involved a single aqueous extraction step, (the system after a single extraction and centrifugation with CaCl2 is denoted by 1 in equation (14) below). The Freundlich co-efficient Kf eq (valid for desorption) was calculated using day 0 values, where t = 0, Cs eq 1 is calculated as difference between total mass and mass dissolved (Equation 14a), as the non-equilibrium concentration was defined as Cs neq = 0. The mean Freundlich exponent (1/n) from the standard batch equilibrium studies (0.9028) was used, (DAR, Table B.8.190).
Cs eq 1 = mt / m0 – Cw1 (Vw1 + VP1) / M0 (14a) The aged sorption study in Fitzmaurice (2003) involved multiple aqueous desorption steps. The mean Kf eq, des and 1/n for the 3 desorption steps at day 0 were used, with Kf eq, des (4.363, 4.287, 18.303 and 4.623) and corresponding 1/n (0.9237, 0.888, 0.9813 and 0.904) for each of the 4 soils.
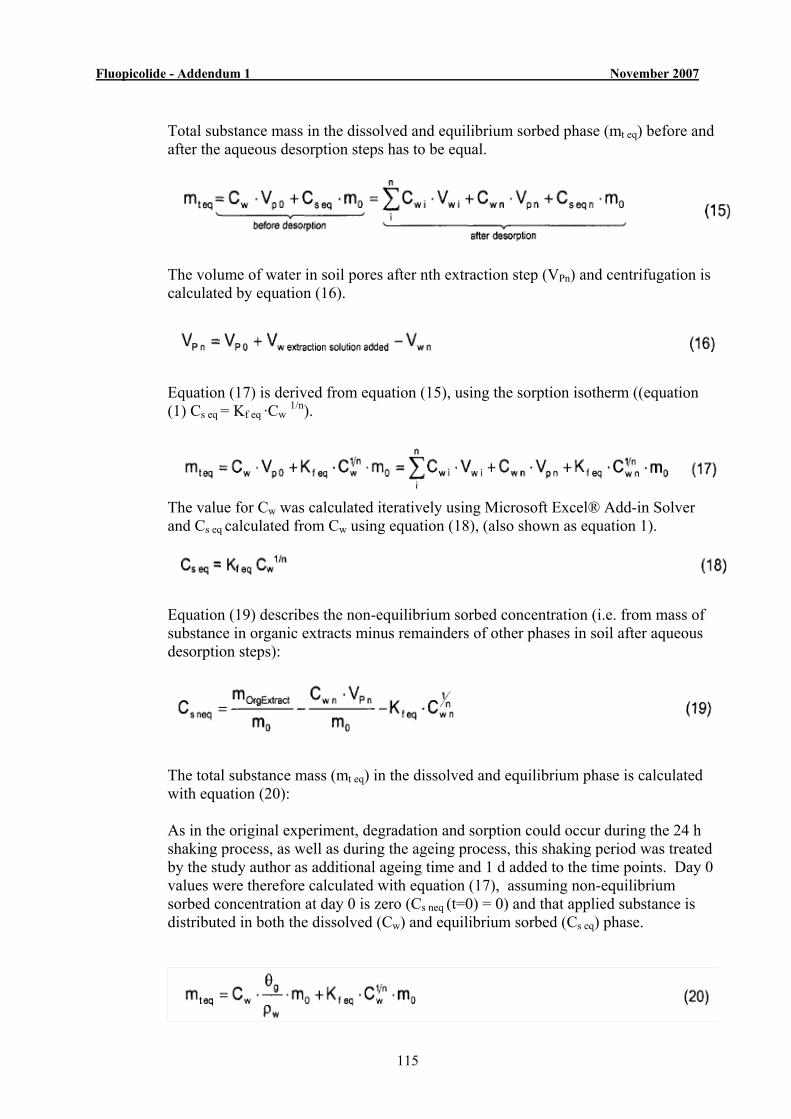
Fluopicolide - Addendum 1 November 2007
115
Total substance mass in the dissolved and equilibrium sorbed phase (mt eq) before and after the aqueous desorption steps has to be equal.
The volume of water in soil pores after nth extraction step (VPn) and centrifugation is calculated by equation (16).
Equation (17) is derived from equation (15), using the sorption isotherm ((equation (1) Cs eq = Kf eq ·Cw 1/n).
The value for Cw was calculated iteratively using Microsoft Excel® Add-in Solver and Cs eq calculated from Cw using equation (18), (also shown as equation 1).
Equation (19) describes the non-equilibrium sorbed concentration (i.e. from mass of substance in organic extracts minus remainders of other phases in soil after aqueous desorption steps):
The total substance mass (mt eq) in the dissolved and equilibrium phase is calculated with equation (20): As in the original experiment, degradation and sorption could occur during the 24 h shaking process, as well as during the ageing process, this shaking period was treated by the study author as additional ageing time and 1 d added to the time points. Day 0 values were therefore calculated with equation (17), assuming non-equilibrium sorbed concentration at day 0 is zero (Cs neq (t=0) = 0) and that applied substance is distributed in both the dissolved (Cw) and equilibrium sorbed (Cs eq) phase.
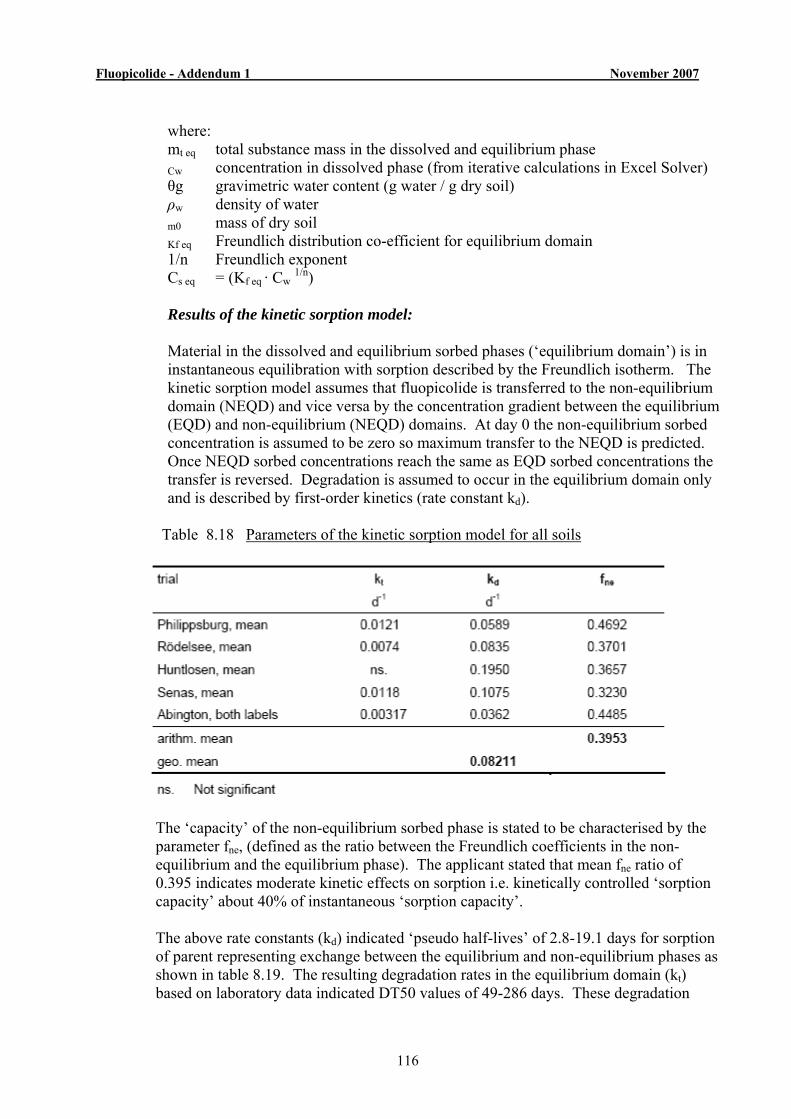
Fluopicolide - Addendum 1 November 2007
116
where: mt eq total substance mass in the dissolved and equilibrium phase
Cw concentration in dissolved phase (from iterative calculations in Excel Solver) θg gravimetric water content (g water / g dry soil) ρw density of water m0 mass of dry soil
Kf eq Freundlich distribution co-efficient for equilibrium domain 1/n Freundlich exponent Cs eq = (Kf eq · Cw 1/n) Results of the kinetic sorption model: Material in the dissolved and equilibrium sorbed phases (‘equilibrium domain’) is in instantaneous equilibration with sorption described by the Freundlich isotherm. The kinetic sorption model assumes that fluopicolide is transferred to the non-equilibrium domain (NEQD) and vice versa by the concentration gradient between the equilibrium (EQD) and non-equilibrium (NEQD) domains. At day 0 the non-equilibrium sorbed concentration is assumed to be zero so maximum transfer to the NEQD is predicted. Once NEQD sorbed concentrations reach the same as EQD sorbed concentrations the transfer is reversed. Degradation is assumed to occur in the equilibrium domain only and is described by first-order kinetics (rate constant kd).
Table 8.18 Parameters of the kinetic sorption model for all soils
The ‘capacity’ of the non-equilibrium sorbed phase is stated to be characterised by the parameter fne, (defined as the ratio between the Freundlich coefficients in the non-equilibrium and the equilibrium phase). The applicant stated that mean fne ratio of 0.395 indicates moderate kinetic effects on sorption i.e. kinetically controlled ‘sorption capacity’ about 40% of instantaneous ‘sorption capacity’. The above rate constants (kd) indicated ‘pseudo half-lives’ of 2.8-19.1 days for sorption of parent representing exchange between the equilibrium and non-equilibrium phases as shown in table 8.19. The resulting degradation rates in the equilibrium domain (kt) based on laboratory data indicated DT50 values of 49-286 days. These degradation
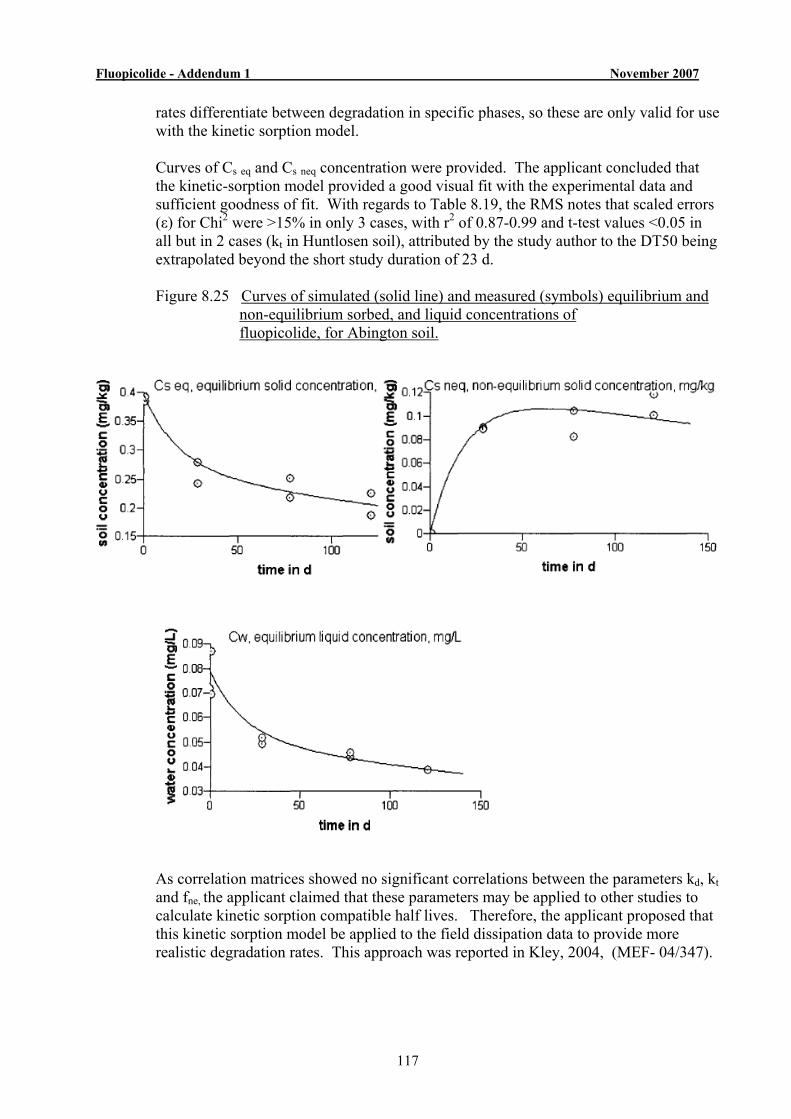
Fluopicolide - Addendum 1 November 2007
117
rates differentiate between degradation in specific phases, so these are only valid for use with the kinetic sorption model. Curves of Cs eq and Cs neq concentration were provided. The applicant concluded that the kinetic-sorption model provided a good visual fit with the experimental data and sufficient goodness of fit. With regards to Table 8.19, the RMS notes that scaled errors (ε) for Chi2 were >15% in only 3 cases, with r2 of 0.87-0.99 and t-test values <0.05 in all but in 2 cases (kt in Huntlosen soil), attributed by the study author to the DT50 being extrapolated beyond the short study duration of 23 d. Figure 8.25 Curves of simulated (solid line) and measured (symbols) equilibrium and non-equilibrium sorbed, and liquid concentrations of fluopicolide, for Abington soil.
As correlation matrices showed no significant correlations between the parameters kd, kt and fne, the applicant claimed that these parameters may be applied to other studies to calculate kinetic sorption compatible half lives. Therefore, the applicant proposed that this kinetic sorption model be applied to the field dissipation data to provide more realistic degradation rates. This approach was reported in Kley, 2004, (MEF- 04/347).

Fluopicolide - Addendum 1 November 2007
118
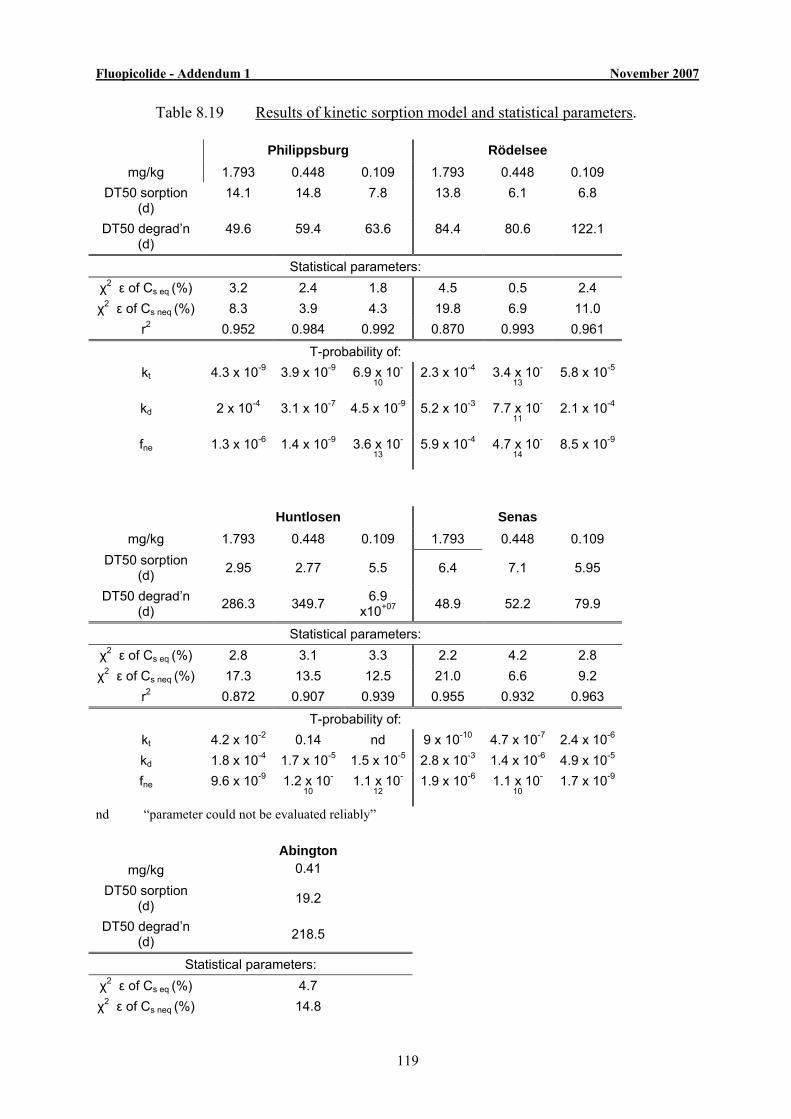
Fluopicolide - Addendum 1 November 2007
119
Table 8.19 Results of kinetic sorption model and statistical parameters.
Philippsburg Rödelsee mg/kg 1.793 0.448 0.109 1.793 0.448 0.109
DT50 sorption (d)
14.1 14.8 7.8 13.8 6.1 6.8
DT50 degrad’n (d)
49.6 59.4 63.6 84.4 80.6 122.1
Statistical parameters: χ2 ε of Cs eq (%) 3.2 2.4 1.8 4.5 0.5 2.4 χ2 ε of Cs neq (%) 8.3 3.9 4.3 19.8 6.9 11.0
r2 0.952 0.984 0.992 0.870 0.993 0.961
T-probability of: kt 4.3 x 10⁻⁹ 3.9 x 10⁻⁹ 6.9 x 10-
10 2.3 x 10⁻⁴ 3.4 x 10-
13 5.8 x 10⁻⁵
kd 2 x 10⁻⁴ 3.1 x 10⁻⁷ 4.5 x 10⁻⁹ 5.2 x 10⁻³ 7.7 x 10-
11 2.1 x 10⁻⁴
fne 1.3 x 10⁻⁶ 1.4 x 10⁻⁹ 3.6 x 10-
13 5.9 x 10⁻⁴ 4.7 x 10-
14 8.5 x 10⁻⁹
Huntlosen Senas mg/kg 1.793 0.448 0.109 1.793 0.448 0.109
DT50 sorption (d) 2.95 2.77 5.5 6.4 7.1 5.95
DT50 degrad’n (d) 286.3 349.7 6.9
x10+07 48.9 52.2 79.9
Statistical parameters: χ2 ε of Cs eq (%) 2.8 3.1 3.3 2.2 4.2 2.8 χ2 ε of Cs neq (%) 17.3 13.5 12.5 21.0 6.6 9.2
r2 0.872 0.907 0.939 0.955 0.932 0.963
T-probability of: kt 4.2 x 10⁻² 0.14 nd 9 x 10⁻¹⁰ 4.7 x 10⁻⁷ 2.4 x 10⁻⁶ kd 1.8 x 10⁻⁴ 1.7 x 10⁻⁵ 1.5 x 10⁻⁵ 2.8 x 10⁻³ 1.4 x 10⁻⁶ 4.9 x 10⁻⁵ fne 9.6 x 10⁻⁹ 1.2 x 10-
10 1.1 x 10-
12 1.9 x 10⁻⁶ 1.1 x 10-
10 1.7 x 10⁻⁹
nd “parameter could not be evaluated reliably”
mg/kg
Abington 0.41
DT50 sorption (d) 19.2
DT50 degrad’n (d) 218.5
Statistical parameters: χ2 ε of Cs eq (%) 4.7 χ2 ε of Cs neq (%) 14.8
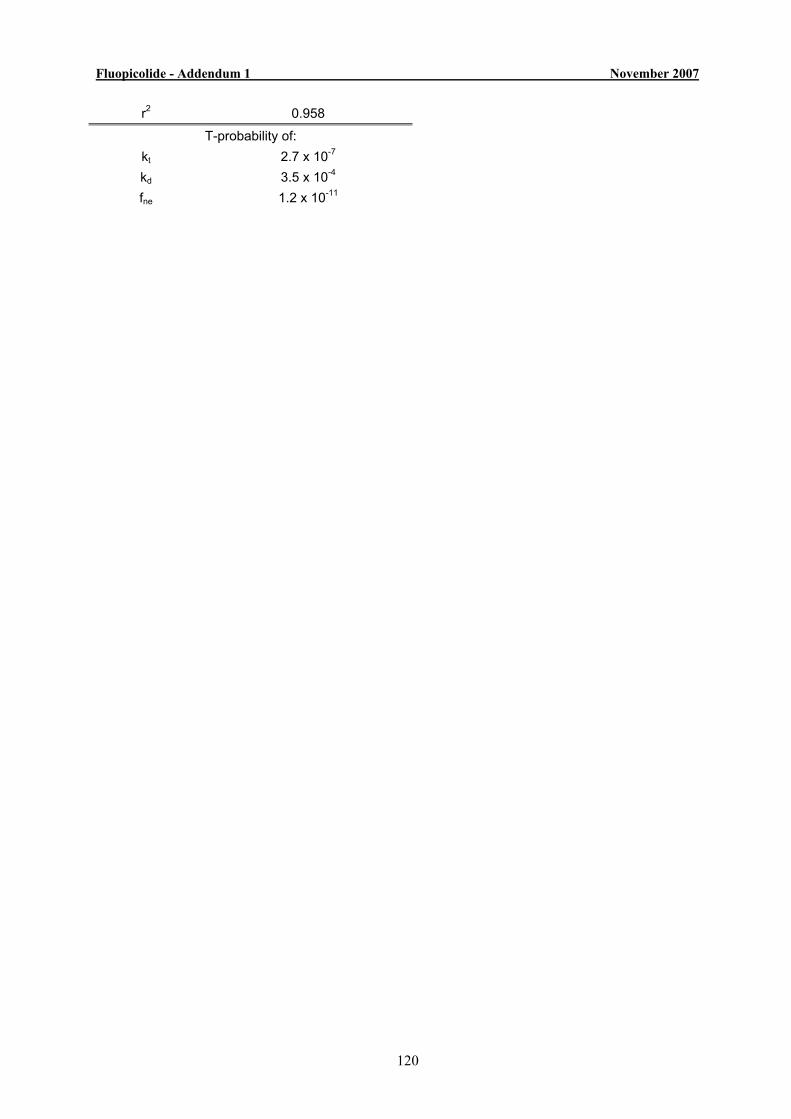
Fluopicolide - Addendum 1 November 2007
120
r2 0.958
T-probability of: kt 2.7 x 10⁻⁷ kd 3.5 x 10⁻⁴ fne 1.2 x 10⁻¹¹
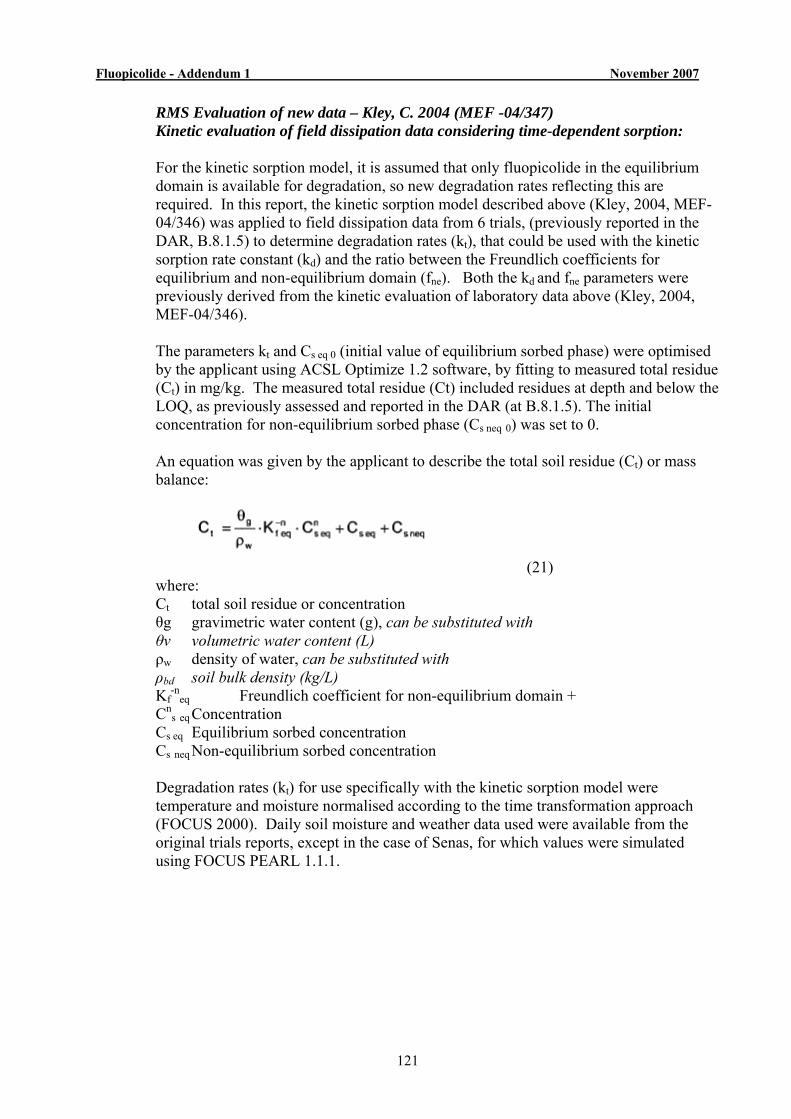
Fluopicolide - Addendum 1 November 2007
121
RMS Evaluation of new data – Kley, C. 2004 (MEF -04/347) Kinetic evaluation of field dissipation data considering time-dependent sorption: For the kinetic sorption model, it is assumed that only fluopicolide in the equilibrium domain is available for degradation, so new degradation rates reflecting this are required. In this report, the kinetic sorption model described above (Kley, 2004, MEF-04/346) was applied to field dissipation data from 6 trials, (previously reported in the DAR, B.8.1.5) to determine degradation rates (kt), that could be used with the kinetic sorption rate constant (kd) and the ratio between the Freundlich coefficients for equilibrium and non-equilibrium domain (fne). Both the kd and fne parameters were previously derived from the kinetic evaluation of laboratory data above (Kley, 2004, MEF-04/346). The parameters kt and Cs eq 0 (initial value of equilibrium sorbed phase) were optimised by the applicant using ACSL Optimize 1.2 software, by fitting to measured total residue (Ct) in mg/kg. The measured total residue (Ct) included residues at depth and below the LOQ, as previously assessed and reported in the DAR (at B.8.1.5). The initial concentration for non-equilibrium sorbed phase (Cs neq 0) was set to 0. An equation was given by the applicant to describe the total soil residue (Ct) or mass balance:
(21) where: Ct total soil residue or concentration θg gravimetric water content (g), can be substituted with θv volumetric water content (L) ρw density of water, can be substituted with ρbd soil bulk density (kg/L) Kf
-neq Freundlich coefficient for non-equilibrium domain +
Cns eq Concentration
Cs eq Equilibrium sorbed concentration Cs neq Non-equilibrium sorbed concentration Degradation rates (kt) for use specifically with the kinetic sorption model were temperature and moisture normalised according to the time transformation approach (FOCUS 2000). Daily soil moisture and weather data used were available from the original trials reports, except in the case of Senas, for which values were simulated using FOCUS PEARL 1.1.1.

Fluopicolide - Addendum 1 November 2007
122
Table 8.20 Soil specific input parameters for fluopicolide.
Table 8.21 below shows Ct 0 (g/ha) values, which have been calculated from the fitted Cs eq 0, alongside the nominal application rates, together with the fitted degradation rates (kt). The kinetic sorption DT50 values range from 53-108 days (representing degradation in the equilibrium domain only, compared to the DT50 values from the standard field dissipation assessment (DAR B.8.1.5) which were 77-224 days, with a geometric mean of 138.8 days). The applicant states that total degradation is determined by both the degradation rate constant (kt) and the transfer rate (kd), since any substance in the non-equilibrium domain will only be degraded upon transfer to the equilibrium domain. The applicant considered that that the geometric mean field degradation rate (kt) of 87.8 days above, which takes into account kinetic sorption, was more realistic than the laboratory derived values (Kley 2004, MEF -04/346). Therefore, this has been used subsequently as the appropriate degradation parameter for fluopicolide in the FOCUS PEARL model to estimate PECgw values. The applicant considered that the SFO degradation model in, combination with sorption kinetic, was acceptable to describe the field residues of fluopicolide, with good visual fits and sufficient statistical goodness of fit between the experimental and modelled data. The results of Chi2 statistical test, single sided t-test and coefficient of determination (r2) were reported, see Table 8.22. Scaled errors (ε) were <15% in all but 3 cases, with r2 of 0.81-0.97 and low t-test values, all <0.05.
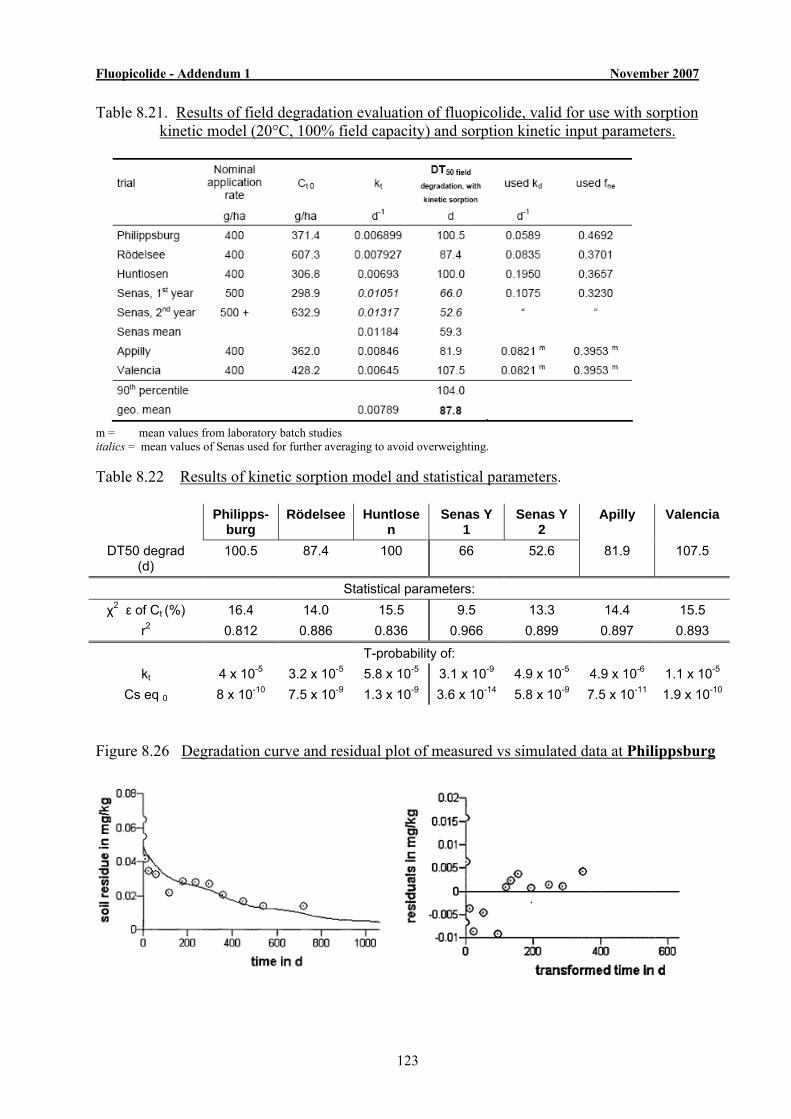
Fluopicolide - Addendum 1 November 2007
123
Table 8.21. Results of field degradation evaluation of fluopicolide, valid for use with sorption kinetic model (20°C, 100% field capacity) and sorption kinetic input parameters.
m = mean values from laboratory batch studies italics = mean values of Senas used for further averaging to avoid overweighting. Table 8.22 Results of kinetic sorption model and statistical parameters.
Philipps-
burg Rödelsee Huntlose
n Senas Y
1 Senas Y
2 Apilly Valencia
DT50 degrad (d)
100.5 87.4 100 66 52.6 81.9 107.5
Statistical parameters: χ2 ε of Ct (%) 16.4 14.0 15.5 9.5 13.3 14.4 15.5
r2 0.812 0.886 0.836 0.966 0.899 0.897 0.893
T-probability of: kt 4 x 10⁻⁵ 3.2 x 10⁻⁵ 5.8 x 10⁻⁵ 3.1 x 10⁻⁹ 4.9 x 10⁻⁵ 4.9 x 10⁻⁶ 1.1 x 10⁻⁵
Cs eq 0 8 x 10⁻¹⁰ 7.5 x 10⁻⁹ 1.3 x 10⁻⁹ 3.6 x 10⁻¹⁴ 5.8 x 10⁻⁹ 7.5 x 10⁻¹¹ 1.9 x 10⁻¹⁰ Figure 8.26 Degradation curve and residual plot of measured vs simulated data at Philippsburg
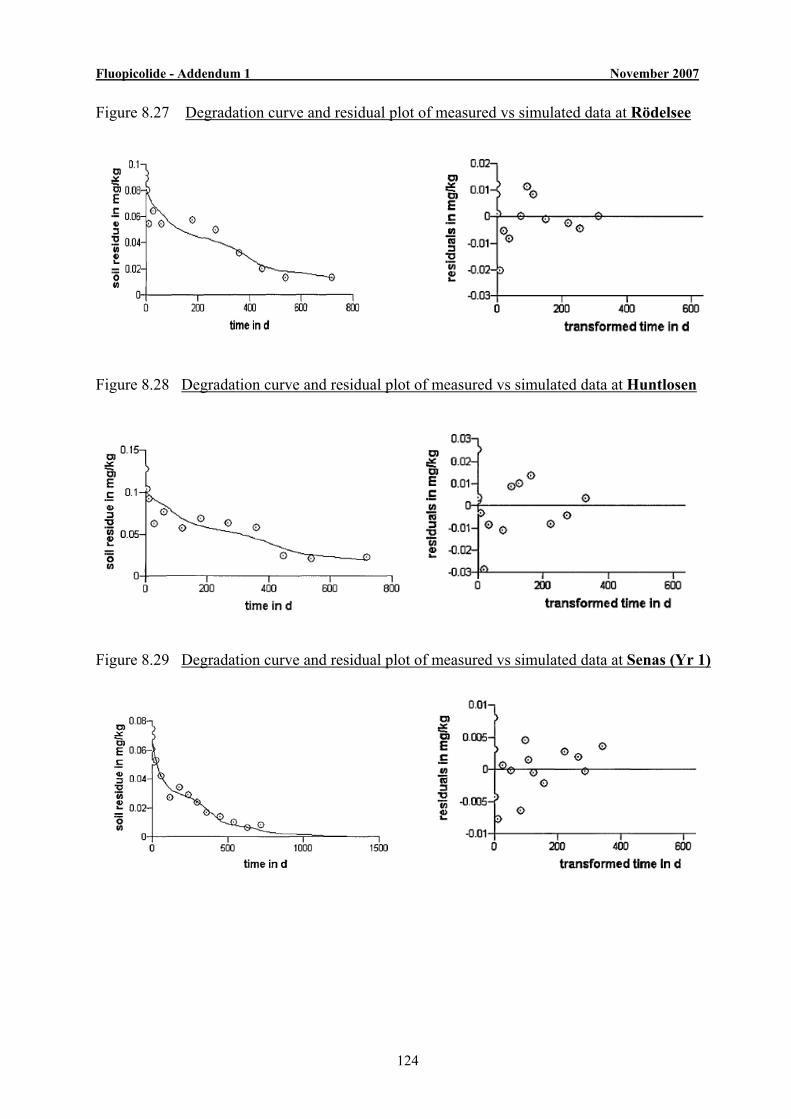
Fluopicolide - Addendum 1 November 2007
124
Figure 8.27 Degradation curve and residual plot of measured vs simulated data at Rödelsee
Figure 8.28 Degradation curve and residual plot of measured vs simulated data at Huntlosen
Figure 8.29 Degradation curve and residual plot of measured vs simulated data at Senas (Yr 1)
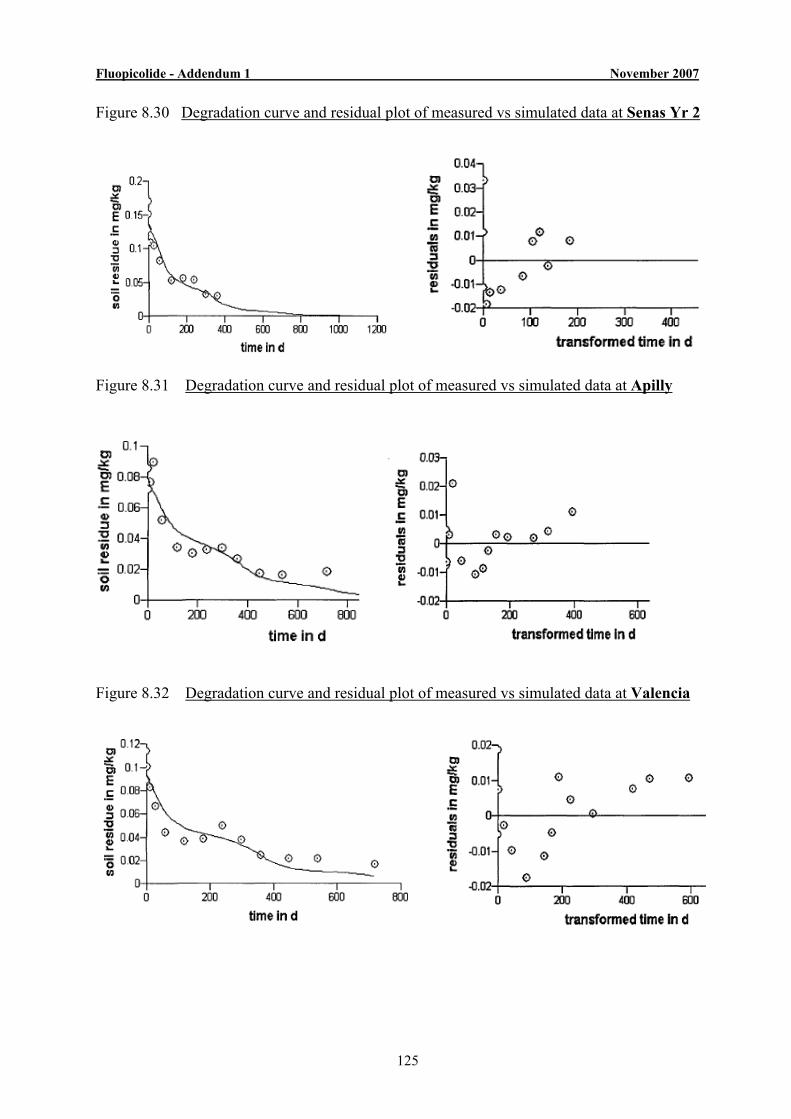
Fluopicolide - Addendum 1 November 2007
125
Figure 8.30 Degradation curve and residual plot of measured vs simulated data at Senas Yr 2
Figure 8.31 Degradation curve and residual plot of measured vs simulated data at Apilly
Figure 8.32 Degradation curve and residual plot of measured vs simulated data at Valencia
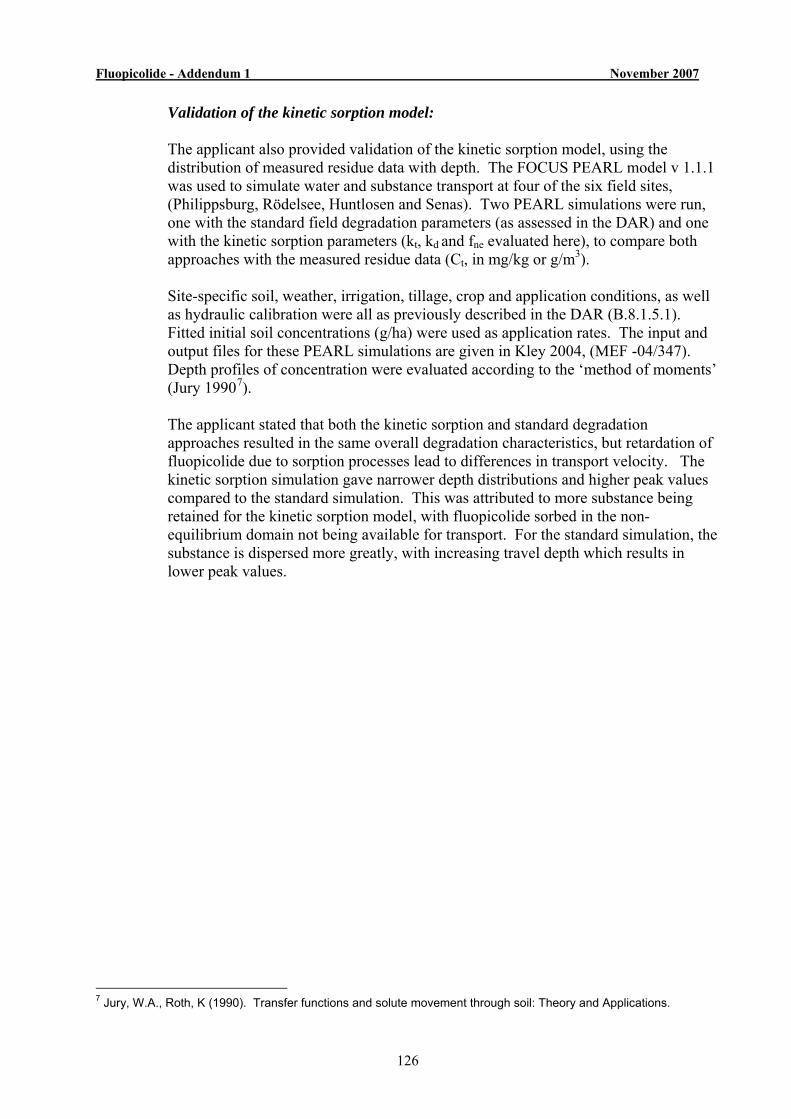
Fluopicolide - Addendum 1 November 2007
126
Validation of the kinetic sorption model: The applicant also provided validation of the kinetic sorption model, using the distribution of measured residue data with depth. The FOCUS PEARL model v 1.1.1 was used to simulate water and substance transport at four of the six field sites, (Philippsburg, Rödelsee, Huntlosen and Senas). Two PEARL simulations were run, one with the standard field degradation parameters (as assessed in the DAR) and one with the kinetic sorption parameters (kt, kd and fne evaluated here), to compare both approaches with the measured residue data (Ct, in mg/kg or g/m3). Site-specific soil, weather, irrigation, tillage, crop and application conditions, as well as hydraulic calibration were all as previously described in the DAR (B.8.1.5.1). Fitted initial soil concentrations (g/ha) were used as application rates. The input and output files for these PEARL simulations are given in Kley 2004, (MEF -04/347). Depth profiles of concentration were evaluated according to the ‘method of moments’ (Jury 19907). The applicant stated that both the kinetic sorption and standard degradation approaches resulted in the same overall degradation characteristics, but retardation of fluopicolide due to sorption processes lead to differences in transport velocity. The kinetic sorption simulation gave narrower depth distributions and higher peak values compared to the standard simulation. This was attributed to more substance being retained for the kinetic sorption model, with fluopicolide sorbed in the non-equilibrium domain not being available for transport. For the standard simulation, the substance is dispersed more greatly, with increasing travel depth which results in lower peak values.
7 Jury, W.A., Roth, K (1990). Transfer functions and solute movement through soil: Theory and Applications.
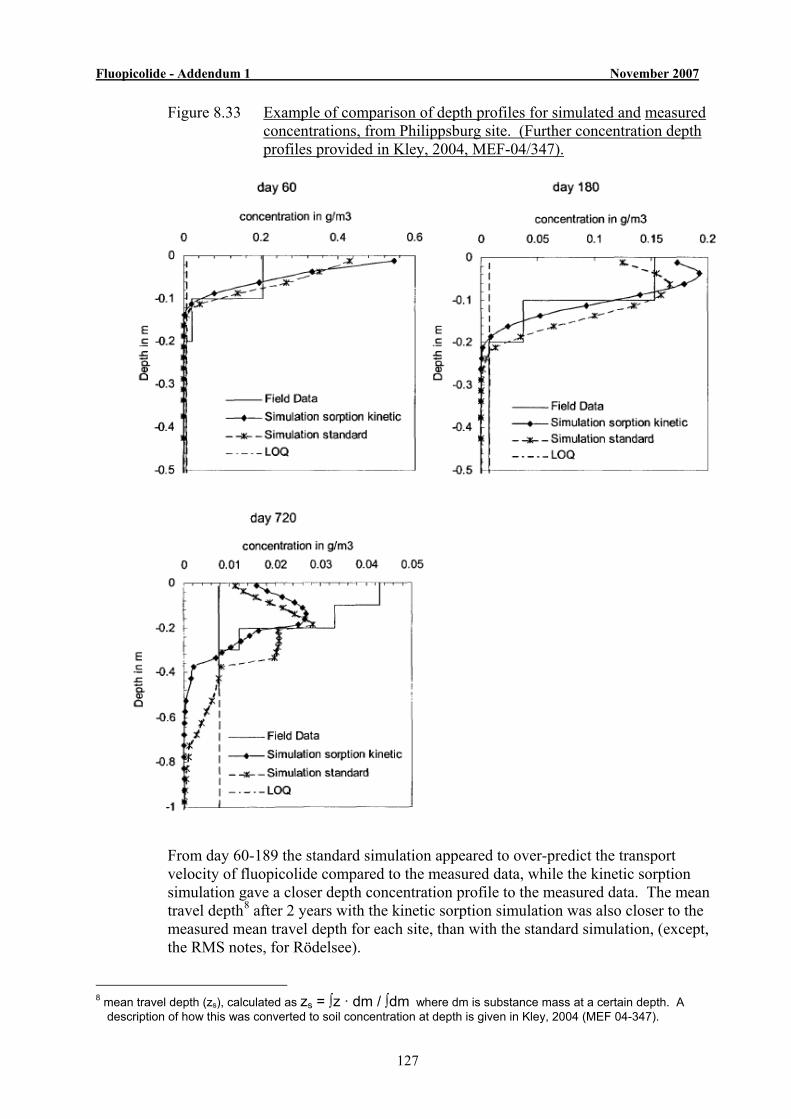
Fluopicolide - Addendum 1 November 2007
127
Figure 8.33 Example of comparison of depth profiles for simulated and measured concentrations, from Philippsburg site. (Further concentration depth profiles provided in Kley, 2004, MEF-04/347).
From day 60-189 the standard simulation appeared to over-predict the transport velocity of fluopicolide compared to the measured data, while the kinetic sorption simulation gave a closer depth concentration profile to the measured data. The mean travel depth8 after 2 years with the kinetic sorption simulation was also closer to the measured mean travel depth for each site, than with the standard simulation, (except, the RMS notes, for Rödelsee).
8 mean travel depth (zs), calculated as zs = ∫z · dm / ∫dm where dm is substance mass at a certain depth. A
description of how this was converted to soil concentration at depth is given in Kley, 2004 (MEF 04-347).
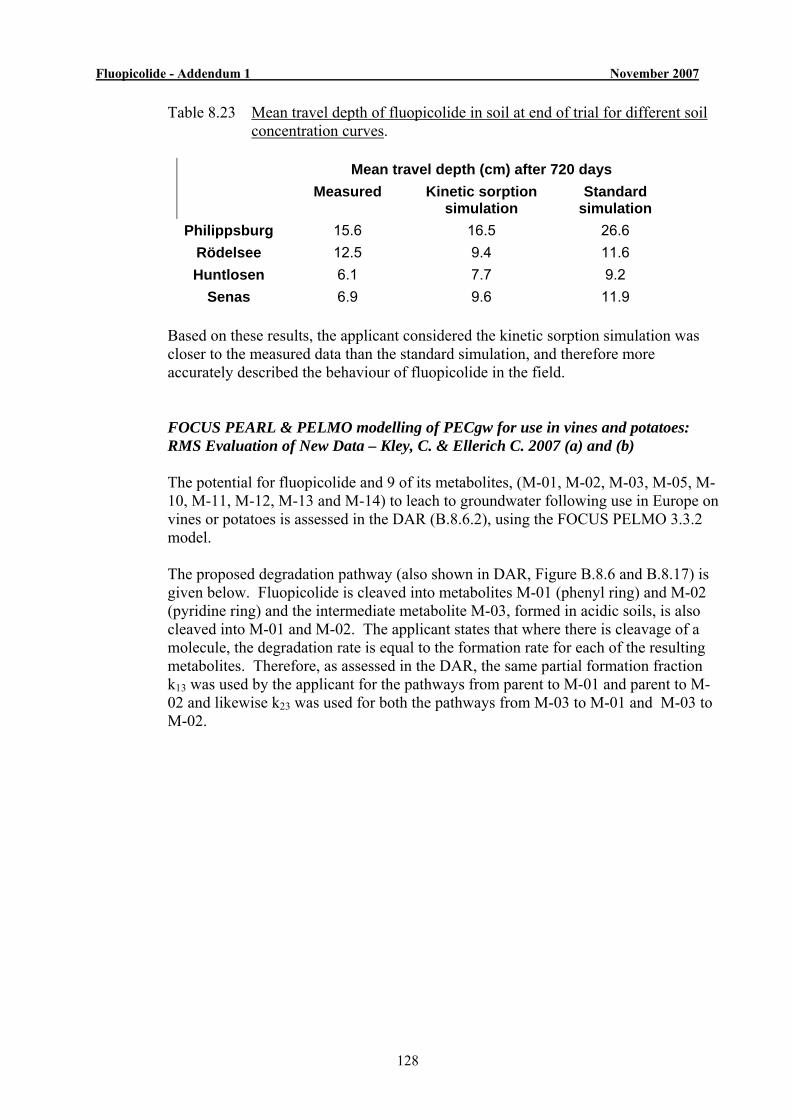
Fluopicolide - Addendum 1 November 2007
128
Table 8.23 Mean travel depth of fluopicolide in soil at end of trial for different soil concentration curves.
Mean travel depth (cm) after 720 days Measured Kinetic sorption
simulation Standard
simulation Philippsburg 15.6 16.5 26.6
Rödelsee 12.5 9.4 11.6 Huntlosen 6.1 7.7 9.2
Senas 6.9 9.6 11.9 Based on these results, the applicant considered the kinetic sorption simulation was closer to the measured data than the standard simulation, and therefore more accurately described the behaviour of fluopicolide in the field.
FOCUS PEARL & PELMO modelling of PECgw for use in vines and potatoes: RMS Evaluation of New Data – Kley, C. & Ellerich C. 2007 (a) and (b) The potential for fluopicolide and 9 of its metabolites, (M-01, M-02, M-03, M-05, M-10, M-11, M-12, M-13 and M-14) to leach to groundwater following use in Europe on vines or potatoes is assessed in the DAR (B.8.6.2), using the FOCUS PELMO 3.3.2 model. The proposed degradation pathway (also shown in DAR, Figure B.8.6 and B.8.17) is given below. Fluopicolide is cleaved into metabolites M-01 (phenyl ring) and M-02 (pyridine ring) and the intermediate metabolite M-03, formed in acidic soils, is also cleaved into M-01 and M-02. The applicant states that where there is cleavage of a molecule, the degradation rate is equal to the formation rate for each of the resulting metabolites. Therefore, as assessed in the DAR, the same partial formation fraction k13 was used by the applicant for the pathways from parent to M-01 and parent to M-02 and likewise k23 was used for both the pathways from M-03 to M-01 and M-03 to M-02.
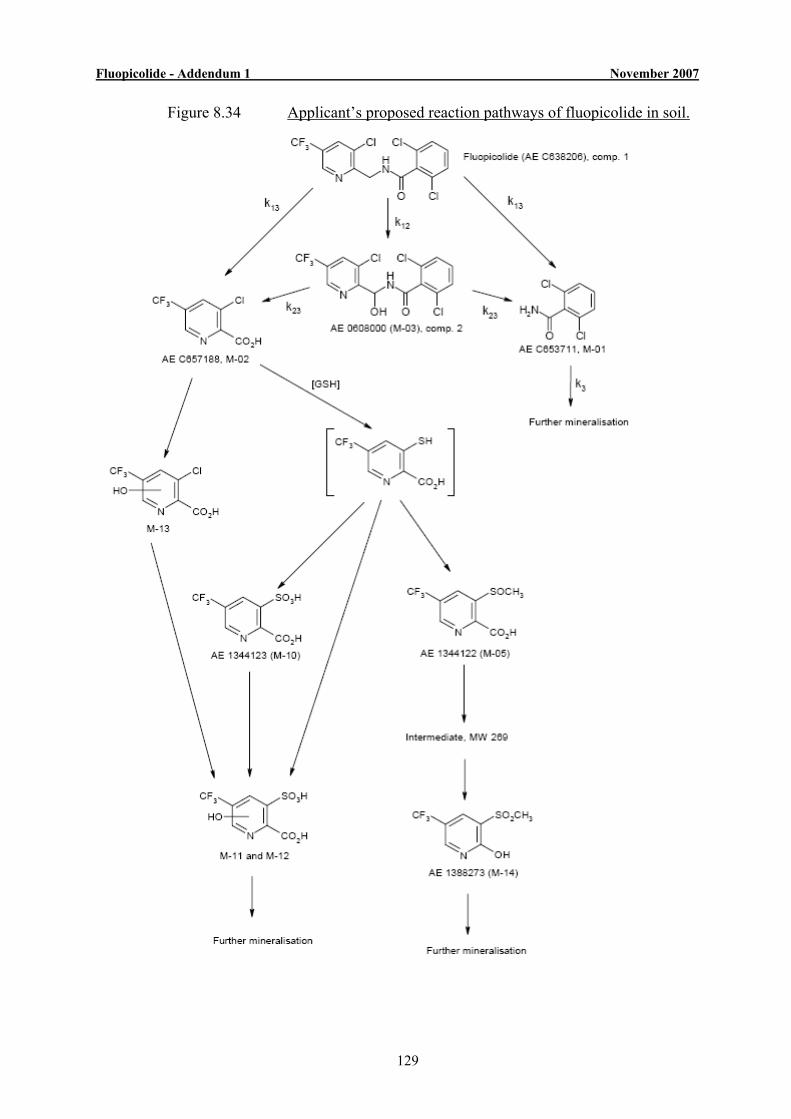
Fluopicolide - Addendum 1 November 2007
129
Figure 8.34 Applicant’s proposed reaction pathways of fluopicolide in soil.
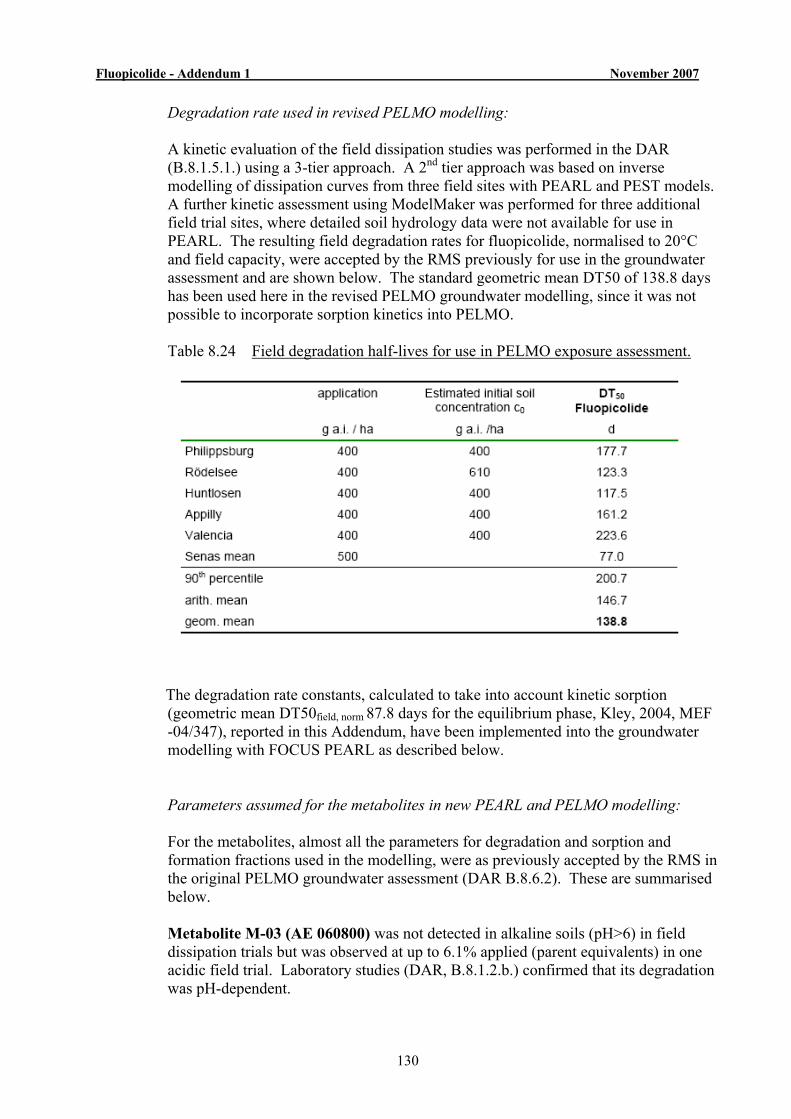
Fluopicolide - Addendum 1 November 2007
130
Degradation rate used in revised PELMO modelling: A kinetic evaluation of the field dissipation studies was performed in the DAR (B.8.1.5.1.) using a 3-tier approach. A 2nd tier approach was based on inverse modelling of dissipation curves from three field sites with PEARL and PEST models. A further kinetic assessment using ModelMaker was performed for three additional field trial sites, where detailed soil hydrology data were not available for use in PEARL. The resulting field degradation rates for fluopicolide, normalised to 20°C and field capacity, were accepted by the RMS previously for use in the groundwater assessment and are shown below. The standard geometric mean DT50 of 138.8 days has been used here in the revised PELMO groundwater modelling, since it was not possible to incorporate sorption kinetics into PELMO. Table 8.24 Field degradation half-lives for use in PELMO exposure assessment.
The degradation rate constants, calculated to take into account kinetic sorption (geometric mean DT50field, norm 87.8 days for the equilibrium phase, Kley, 2004, MEF -04/347), reported in this Addendum, have been implemented into the groundwater modelling with FOCUS PEARL as described below.
Parameters assumed for the metabolites in new PEARL and PELMO modelling: For the metabolites, almost all the parameters for degradation and sorption and formation fractions used in the modelling, were as previously accepted by the RMS in the original PELMO groundwater assessment (DAR B.8.6.2). These are summarised below. Metabolite M-03 (AE 060800) was not detected in alkaline soils (pH>6) in field dissipation trials but was observed at up to 6.1% applied (parent equivalents) in one acidic field trial. Laboratory studies (DAR, B.8.1.2.b.) confirmed that its degradation was pH-dependent.
Fluopicolide - Addendum 1 November 2007
131
For alkaline scenarios (pH>6) fluopicolide was assumed to be completely degraded via M-03, with the geometric mean DT50 lab, norm of 0.09 days. For acidic scenarios (pH<6) parallel degradation of fluopicolide to M01 and M-02 directly (k13) and also via M-03 (k12) was assumed, with the geometric mean DT50 field, norm of 55.5 days for M-03. Formation fractions assumed were 0.288 for M-03 and 0.712 for M-01/M-02. An arithmetic mean Koc of 108.8 L/kg, with mean 1/n of 0.971 was previously estimated and used in the groundwater assessment. M-03 was also rapidly hydrolysed in laboratory studies to form M-01/M-02 with DT50 from 8.1 minutes (pH 8) to 45.5 hours (pH 5), (DAR, B.8.4.1.d.). Metabolite M-01 (AE C653711) reached up to 24.1% (parent equivalents, excluding Senas, 2nd year data) and 40.2% applied (parent equivalents) in the field and laboratory, respectively. A geometric mean DT50field, norm of 137.7 days, arithmetic mean Koc of 40.9 L/kg and 1/n of 0.9158 were previously accepted for use in the original PELMO groundwater assessment. Metabolite M-02 (AE C657188) reached a maximum of 16.4% (parent equivalents, excluding Senas, 2nd year data) and 7.3% applied (parent equivalents) in field and laboratory studies, respectively. It was not possible to calculate reliable field degradation rates for M-02, as residues were only detected at low levels and early time points, so a geometric mean, DT50lab, norm of 2.82 days (using ModelMaker), together with an arithmetic mean Koc of 5.99 L/kg and 1/n of 0.7737, was previously used for the original PELMO groundwater assessment. Metabolite M-05 (AE 1344122) reached a maximum of 17.99% of applied M-02 in a laboratory soil degradation study with M-02 (DAR, B.8.1.2.c). A geometric mean, DT50lab, norm of 42.6 days, arithmetic mean Koc of 25.9 L/kg and 1/n of 0.9182 were previously accepted for use in the original PELMO groundwater assessment. As no M-14 was formed in one of the soils tested, (attributed by the applicant as possibly due to slow degradation of M-05), the worst case formation fraction of 0.384 was selected by the applicant for M-05 into M-14. The mean formation fraction of 0.252 was used in the DAR. This also gives a slightly different partial reaction rate of 0.006248 d-1, (compared to 0.0041 d-1 in the DAR). Metabolite M-10 (AE 1344123) reached up 4.97% of applied M-02 in a soil degradation study with M-02 (DAR, B.8.1.2.c). A geometric mean, DT50lab, norm of 26.4 days, arithmetic mean Koc of 6.3 L/kg and 1/n set to 0.9 were previously accepted for use in the original PELMO groundwater assessment. Metabolite M-11/12 (P2a/P2b) are two isomers (60:40 ratio) formed at up to 6.55% of applied M-02 in a soil degradation study with M-02 (DAR, B.8.1.2.c). A geometric mean, DT50lab, norm of 35.95 days, was previously accepted for use in the original PELMO groundwater assessment. No reliable Koc value could be determined and this was set at 0 (with 1/n of 0.9) as a worst case. Metabolite M-13 (P3) reached up to 4.38% of applied M-02 in a soil degradation study with M-02 (DAR, B.8.1.2.c). A geometric mean, DT50lab, norm of 11.8 days was previously accepted for use in the original PELMO groundwater assessment. At pH 6
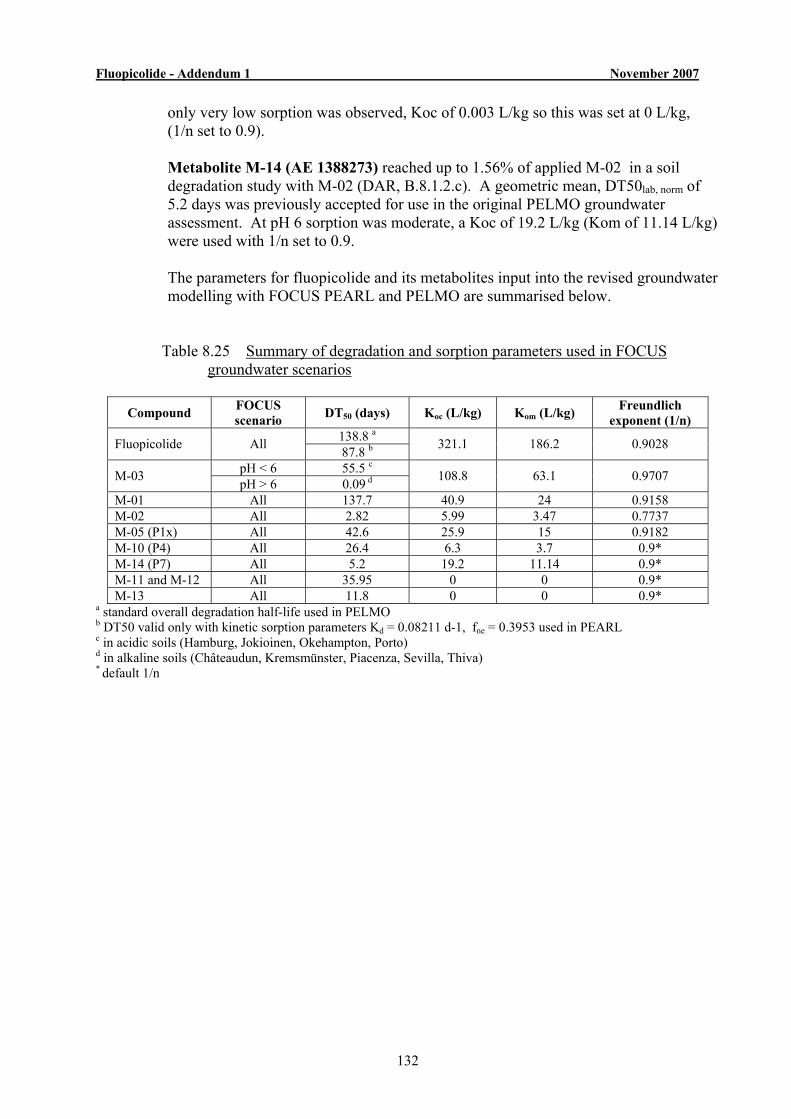
Fluopicolide - Addendum 1 November 2007
132
only very low sorption was observed, Koc of 0.003 L/kg so this was set at 0 L/kg, (1/n set to 0.9). Metabolite M-14 (AE 1388273) reached up to 1.56% of applied M-02 in a soil degradation study with M-02 (DAR, B.8.1.2.c). A geometric mean, DT50lab, norm of 5.2 days was previously accepted for use in the original PELMO groundwater assessment. At pH 6 sorption was moderate, a Koc of 19.2 L/kg (Kom of 11.14 L/kg) were used with 1/n set to 0.9. The parameters for fluopicolide and its metabolites input into the revised groundwater modelling with FOCUS PEARL and PELMO are summarised below.
Table 8.25 Summary of degradation and sorption parameters used in FOCUS groundwater scenarios
Compound FOCUS scenario DT50 (days) Koc (L/kg) Kom (L/kg) Freundlich
exponent (1/n) 138.8 a Fluopicolide All 87.8 b 321.1 186.2 0.9028
pH < 6 55.5 c M-03 pH > 6 0.09 d 108.8 63.1 0.9707
M-01 All 137.7 40.9 24 0.9158 M-02 All 2.82 5.99 3.47 0.7737 M-05 (P1x) All 42.6 25.9 15 0.9182 M-10 (P4) All 26.4 6.3 3.7 0.9* M-14 (P7) All 5.2 19.2 11.14 0.9* M-11 and M-12 All 35.95 0 0 0.9* M-13 All 11.8 0 0 0.9*
a standard overall degradation half-life used in PELMO b DT50 valid only with kinetic sorption parameters Kd = 0.08211 d-1, fne = 0.3953 used in PEARL c in acidic soils (Hamburg, Jokioinen, Okehampton, Porto) d in alkaline soils (Châteaudun, Kremsmünster, Piacenza, Sevilla, Thiva) * default 1/n
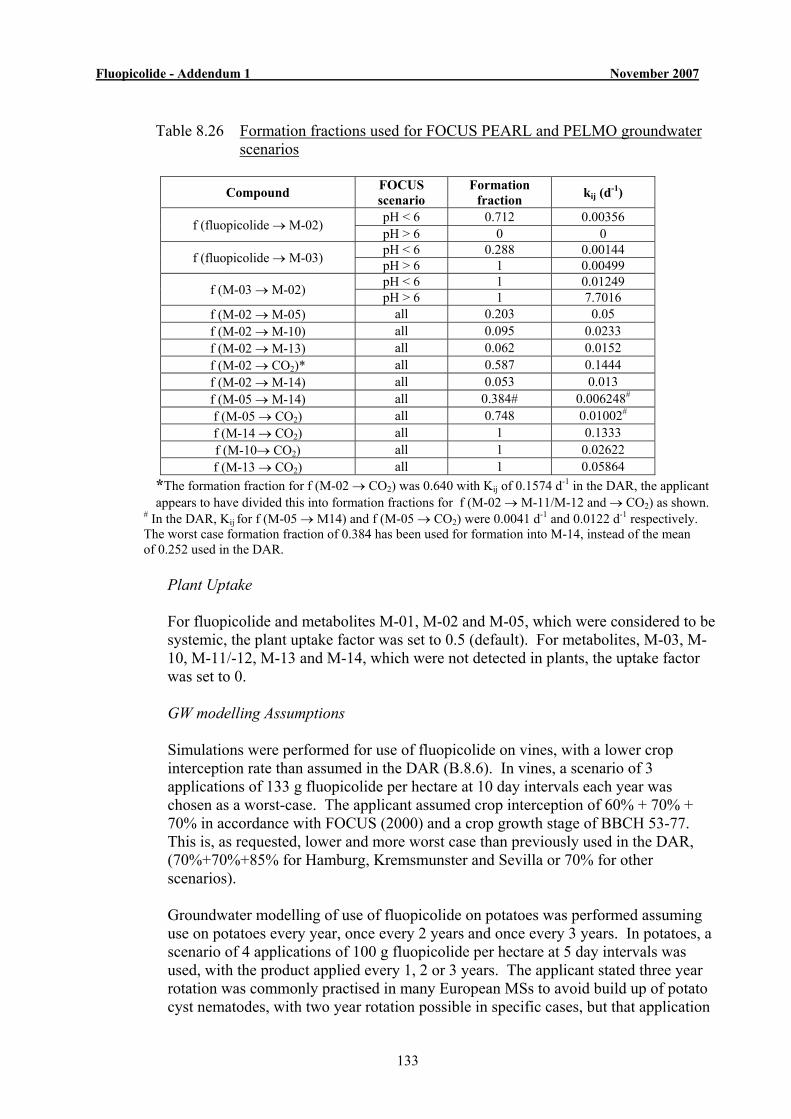
Fluopicolide - Addendum 1 November 2007
133
Table 8.26 Formation fractions used for FOCUS PEARL and PELMO groundwater
scenarios
Compound FOCUS scenario
Formation fraction kij (d-1)
pH < 6 0.712 0.00356 f (fluopicolide → M-02) pH > 6 0 0 pH < 6 0.288 0.00144 f (fluopicolide → M-03) pH > 6 1 0.00499 pH < 6 1 0.01249 f (M-03 → M-02) pH > 6 1 7.7016
f (M-02 → M-05) all 0.203 0.05 f (M-02 → M-10) all 0.095 0.0233 f (M-02 → M-13) all 0.062 0.0152 f (M-02 → CO2)* all 0.587 0.1444 f (M-02 → M-14) all 0.053 0.013 f (M-05 → M-14) all 0.384# 0.006248# f (M-05 → CO2) all 0.748 0.01002# f (M-14 → CO2) all 1 0.1333 f (M-10→ CO2) all 1 0.02622 f (M-13 → CO2) all 1 0.05864
*The formation fraction for f (M-02 → CO2) was 0.640 with Kij of 0.1574 d-1 in the DAR, the applicant appears to have divided this into formation fractions for f (M-02 → M-11/M-12 and → CO2) as shown.
# In the DAR, Kij for f (M-05 → M14) and f (M-05 → CO2) were 0.0041 d-1 and 0.0122 d-1 respectively. The worst case formation fraction of 0.384 has been used for formation into M-14, instead of the mean of 0.252 used in the DAR.
Plant Uptake For fluopicolide and metabolites M-01, M-02 and M-05, which were considered to be systemic, the plant uptake factor was set to 0.5 (default). For metabolites, M-03, M-10, M-11/-12, M-13 and M-14, which were not detected in plants, the uptake factor was set to 0. GW modelling Assumptions Simulations were performed for use of fluopicolide on vines, with a lower crop interception rate than assumed in the DAR (B.8.6). In vines, a scenario of 3 applications of 133 g fluopicolide per hectare at 10 day intervals each year was chosen as a worst-case. The applicant assumed crop interception of 60% + 70% + 70% in accordance with FOCUS (2000) and a crop growth stage of BBCH 53-77. This is, as requested, lower and more worst case than previously used in the DAR, (70%+70%+85% for Hamburg, Kremsmunster and Sevilla or 70% for other scenarios). Groundwater modelling of use of fluopicolide on potatoes was performed assuming use on potatoes every year, once every 2 years and once every 3 years. In potatoes, a scenario of 4 applications of 100 g fluopicolide per hectare at 5 day intervals was used, with the product applied every 1, 2 or 3 years. The applicant stated three year rotation was commonly practised in many European MSs to avoid build up of potato cyst nematodes, with two year rotation possible in specific cases, but that application
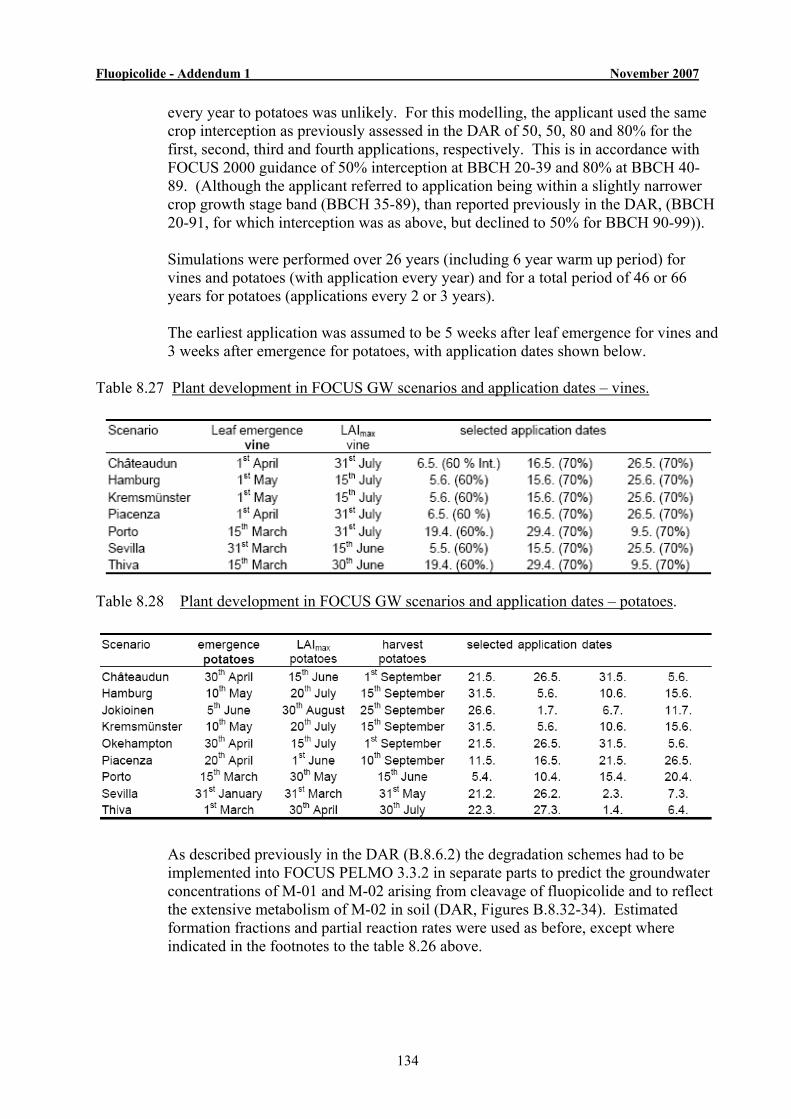
Fluopicolide - Addendum 1 November 2007
134
every year to potatoes was unlikely. For this modelling, the applicant used the same crop interception as previously assessed in the DAR of 50, 50, 80 and 80% for the first, second, third and fourth applications, respectively. This is in accordance with FOCUS 2000 guidance of 50% interception at BBCH 20-39 and 80% at BBCH 40-89. (Although the applicant referred to application being within a slightly narrower crop growth stage band (BBCH 35-89), than reported previously in the DAR, (BBCH 20-91, for which interception was as above, but declined to 50% for BBCH 90-99)). Simulations were performed over 26 years (including 6 year warm up period) for vines and potatoes (with application every year) and for a total period of 46 or 66 years for potatoes (applications every 2 or 3 years). The earliest application was assumed to be 5 weeks after leaf emergence for vines and
3 weeks after emergence for potatoes, with application dates shown below. Table 8.27 Plant development in FOCUS GW scenarios and application dates – vines.
Table 8.28 Plant development in FOCUS GW scenarios and application dates – potatoes.
As described previously in the DAR (B.8.6.2) the degradation schemes had to be implemented into FOCUS PELMO 3.3.2 in separate parts to predict the groundwater concentrations of M-01 and M-02 arising from cleavage of fluopicolide and to reflect the extensive metabolism of M-02 in soil (DAR, Figures B.8.32-34). Estimated formation fractions and partial reaction rates were used as before, except where indicated in the footnotes to the table 8.26 above.
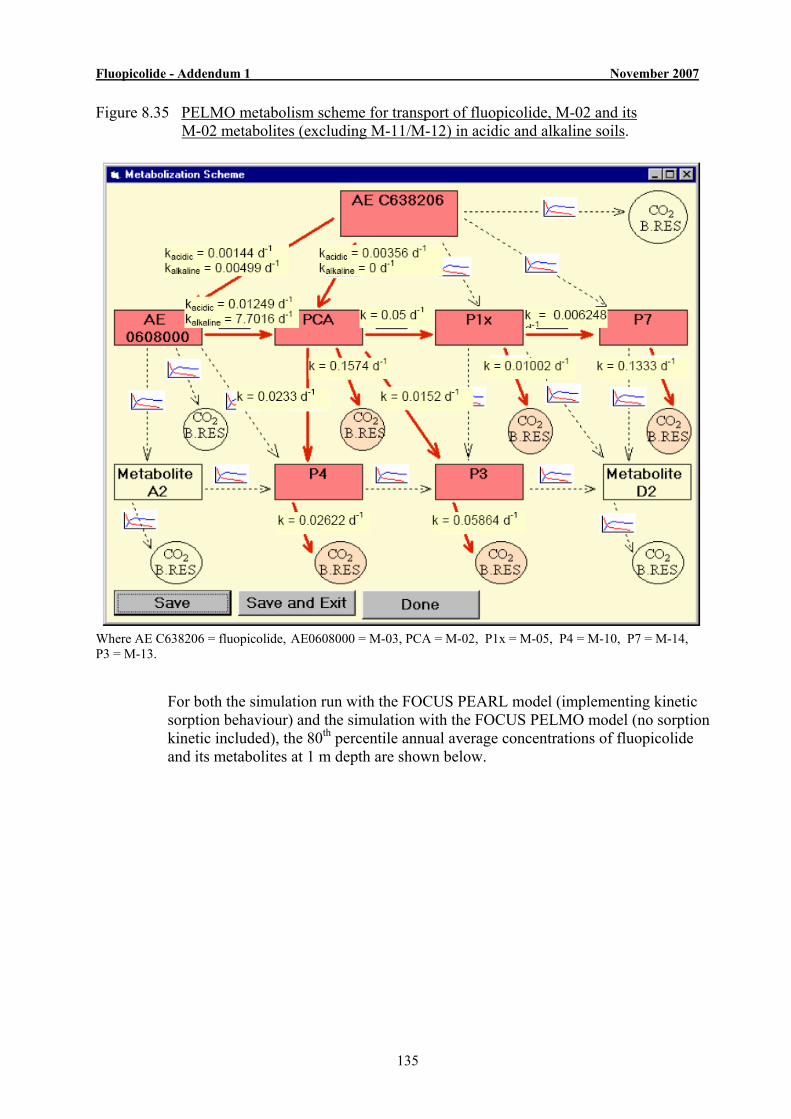
Fluopicolide - Addendum 1 November 2007
135
Figure 8.35 PELMO metabolism scheme for transport of fluopicolide, M-02 and its M-02 metabolites (excluding M-11/M-12) in acidic and alkaline soils.
Where AE C638206 = fluopicolide, AE0608000 = M-03, PCA = M-02, P1x = M-05, P4 = M-10, P7 = M-14, P3 = M-13.
For both the simulation run with the FOCUS PEARL model (implementing kinetic sorption behaviour) and the simulation with the FOCUS PELMO model (no sorption kinetic included), the 80th percentile annual average concentrations of fluopicolide and its metabolites at 1 m depth are shown below.
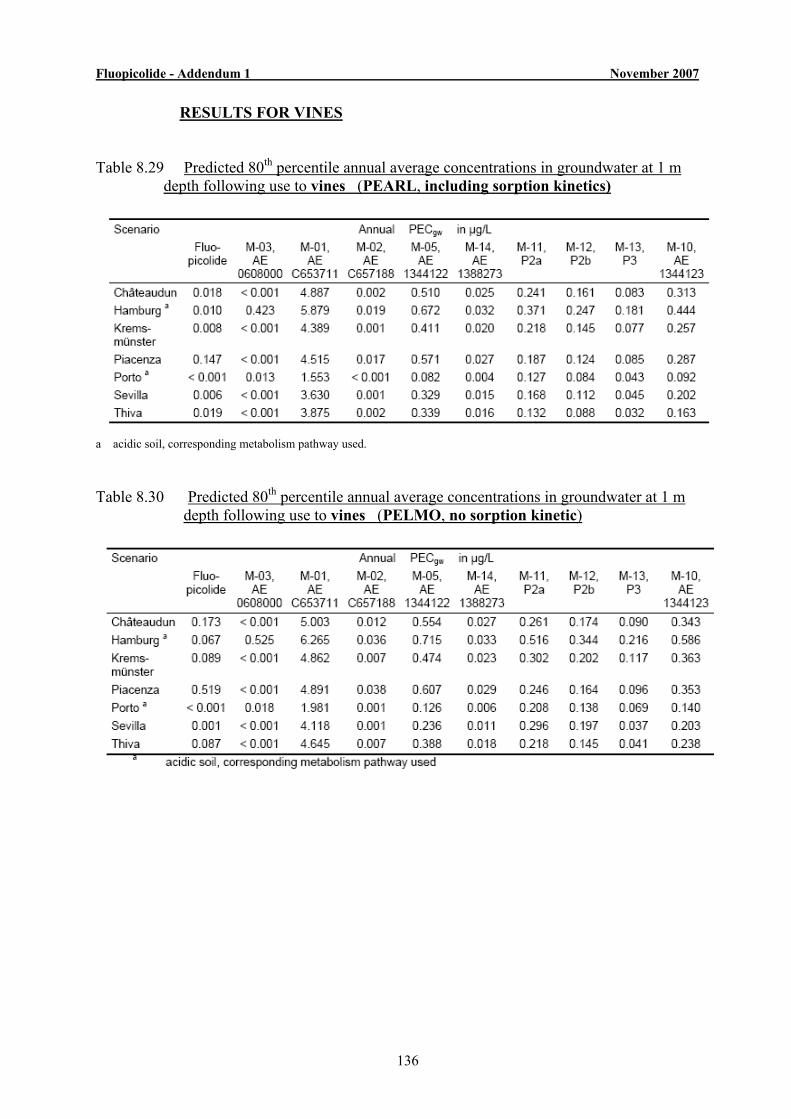
Fluopicolide - Addendum 1 November 2007
136
RESULTS FOR VINES Table 8.29 Predicted 80th percentile annual average concentrations in groundwater at 1 m depth following use to vines (PEARL, including sorption kinetics)
a acidic soil, corresponding metabolism pathway used. Table 8.30 Predicted 80th percentile annual average concentrations in groundwater at 1 m depth following use to vines (PELMO, no sorption kinetic)
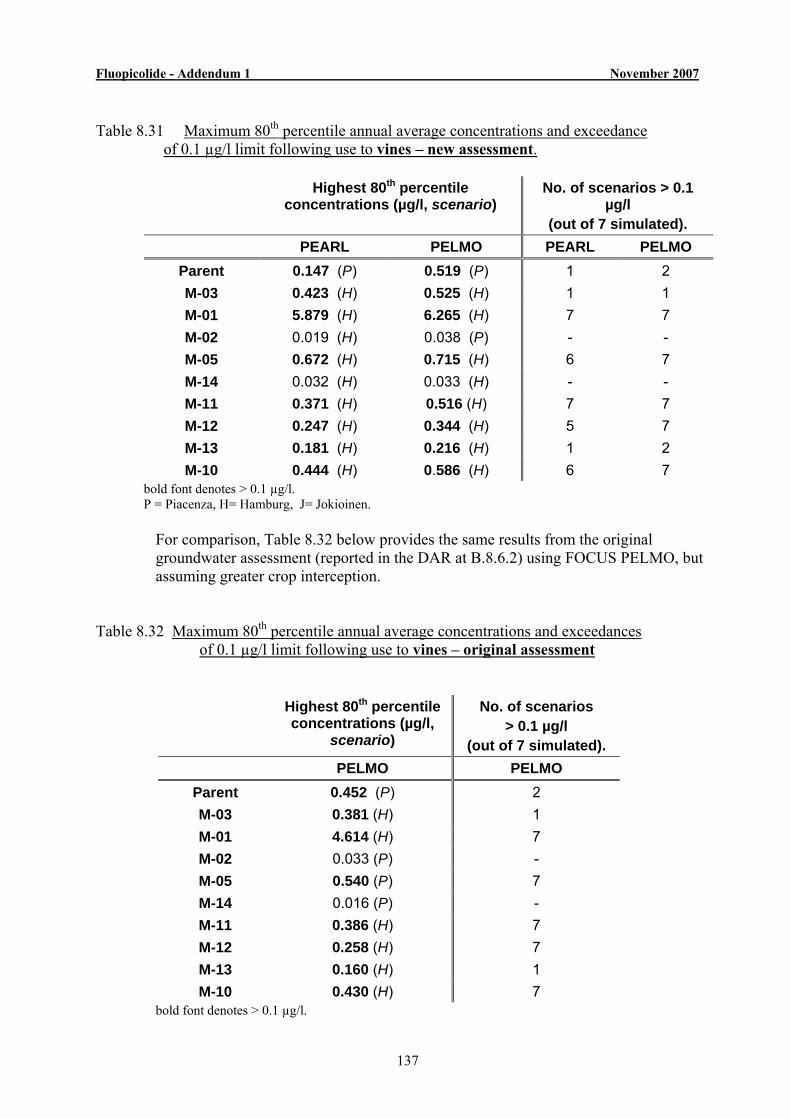
Fluopicolide - Addendum 1 November 2007
137
Table 8.31 Maximum 80th percentile annual average concentrations and exceedance of 0.1 µg/l limit following use to vines – new assessment.
Highest 80th percentile
concentrations (µg/l, scenario) No. of scenarios > 0.1
µg/l (out of 7 simulated).
PEARL PELMO PEARL PELMO Parent 0.147 (P) 0.519 (P) 1 2 M-03 0.423 (H) 0.525 (H) 1 1 M-01 5.879 (H) 6.265 (H) 7 7 M-02 0.019 (H) 0.038 (P) - - M-05 0.672 (H) 0.715 (H) 6 7 M-14 0.032 (H) 0.033 (H) - - M-11 0.371 (H) 0.516 (H) 7 7 M-12 0.247 (H) 0.344 (H) 5 7 M-13 0.181 (H) 0.216 (H) 1 2 M-10 0.444 (H) 0.586 (H) 6 7
bold font denotes > 0.1 µg/l. P = Piacenza, H= Hamburg, J= Jokioinen.
For comparison, Table 8.32 below provides the same results from the original groundwater assessment (reported in the DAR at B.8.6.2) using FOCUS PELMO, but assuming greater crop interception.
Table 8.32 Maximum 80th percentile annual average concentrations and exceedances of 0.1 µg/l limit following use to vines – original assessment
Highest 80th percentile concentrations (µg/l,
scenario)
No. of scenarios > 0.1 µg/l
(out of 7 simulated). PELMO PELMO
Parent 0.452 (P) 2 M-03 0.381 (H) 1 M-01 4.614 (H) 7 M-02 0.033 (P) - M-05 0.540 (P) 7 M-14 0.016 (P) - M-11 0.386 (H) 7 M-12 0.258 (H) 7 M-13 0.160 (H) 1 M-10 0.430 (H) 7
bold font denotes > 0.1 µg/l.
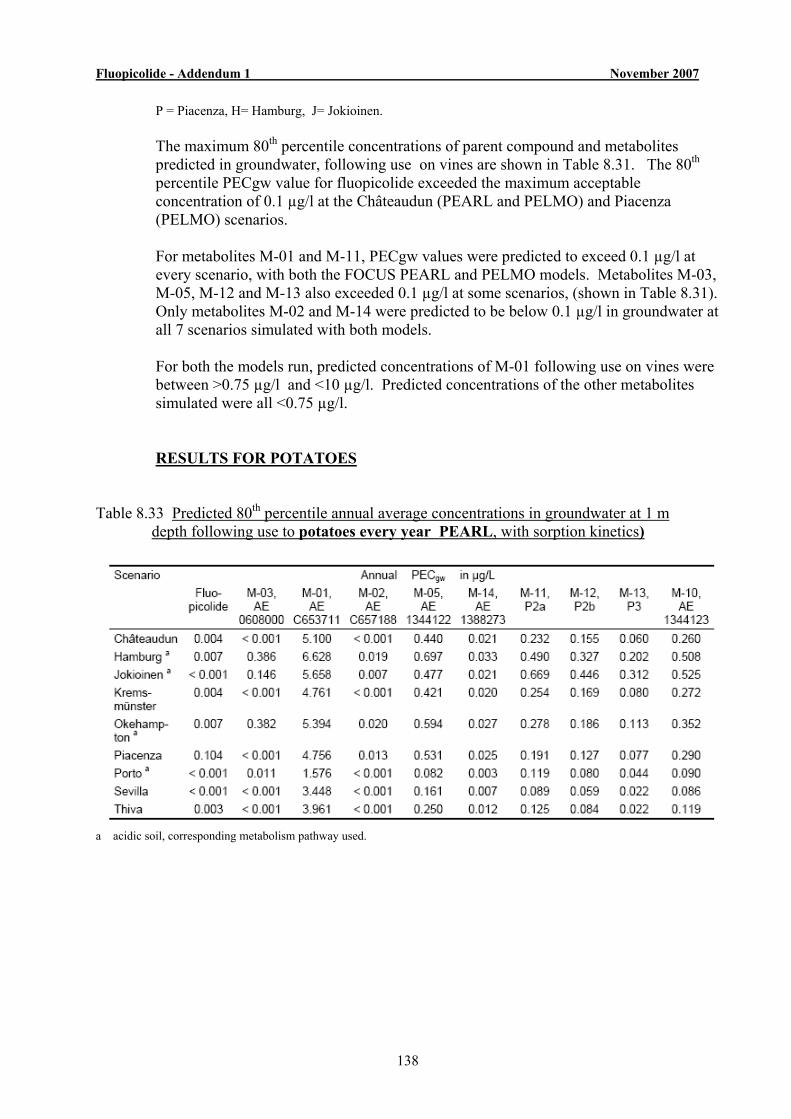
Fluopicolide - Addendum 1 November 2007
138
P = Piacenza, H= Hamburg, J= Jokioinen.
The maximum 80th percentile concentrations of parent compound and metabolites predicted in groundwater, following use on vines are shown in Table 8.31. The 80th percentile PECgw value for fluopicolide exceeded the maximum acceptable concentration of 0.1 µg/l at the Châteaudun (PEARL and PELMO) and Piacenza (PELMO) scenarios. For metabolites M-01 and M-11, PECgw values were predicted to exceed 0.1 µg/l at every scenario, with both the FOCUS PEARL and PELMO models. Metabolites M-03, M-05, M-12 and M-13 also exceeded 0.1 µg/l at some scenarios, (shown in Table 8.31). Only metabolites M-02 and M-14 were predicted to be below 0.1 µg/l in groundwater at all 7 scenarios simulated with both models. For both the models run, predicted concentrations of M-01 following use on vines were between >0.75 µg/l and <10 µg/l. Predicted concentrations of the other metabolites simulated were all <0.75 µg/l.
RESULTS FOR POTATOES Table 8.33 Predicted 80th percentile annual average concentrations in groundwater at 1 m depth following use to potatoes every year PEARL, with sorption kinetics)
a acidic soil, corresponding metabolism pathway used.
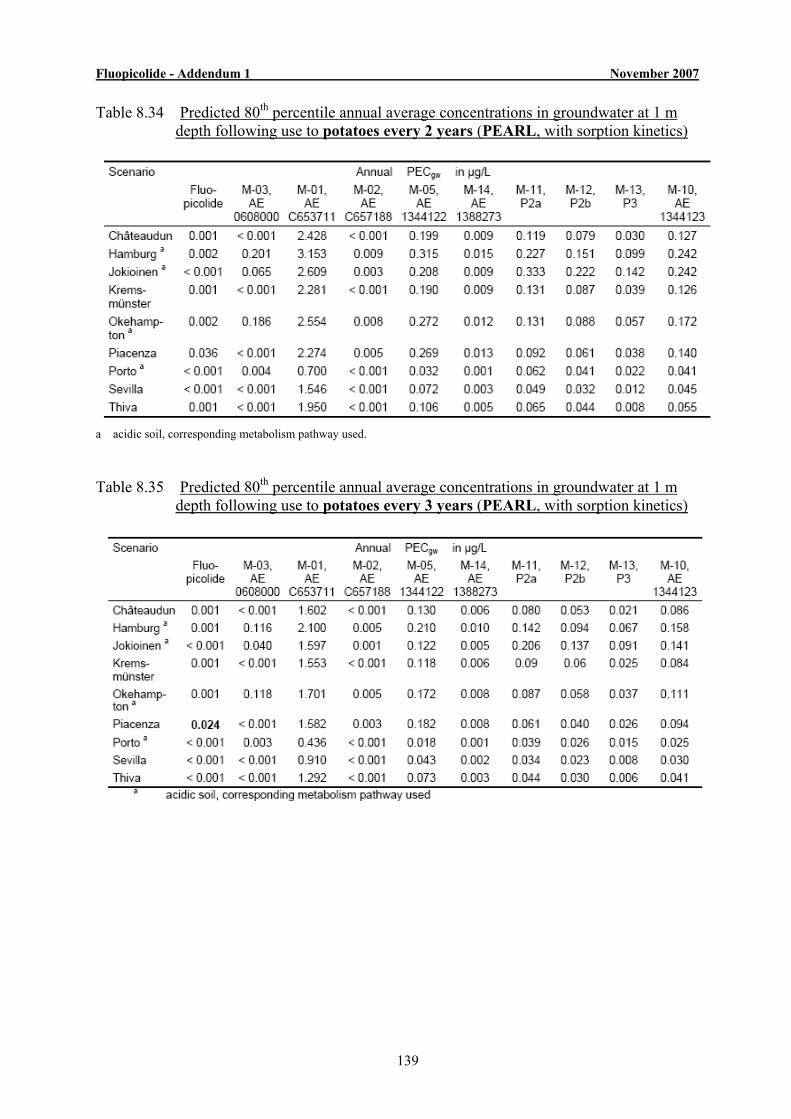
Fluopicolide - Addendum 1 November 2007
139
Table 8.34 Predicted 80th percentile annual average concentrations in groundwater at 1 m depth following use to potatoes every 2 years (PEARL, with sorption kinetics)
a acidic soil, corresponding metabolism pathway used. Table 8.35 Predicted 80th percentile annual average concentrations in groundwater at 1 m depth following use to potatoes every 3 years (PEARL, with sorption kinetics)
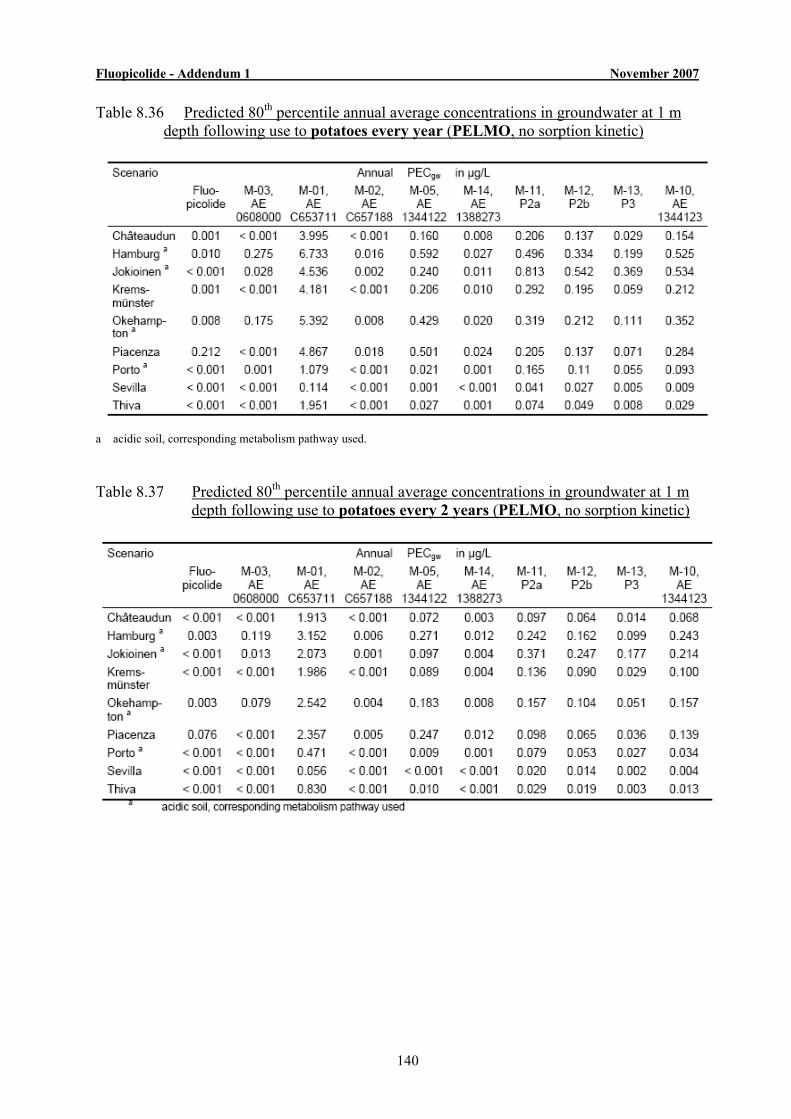
Fluopicolide - Addendum 1 November 2007
140
Table 8.36 Predicted 80th percentile annual average concentrations in groundwater at 1 m depth following use to potatoes every year (PELMO, no sorption kinetic)
a acidic soil, corresponding metabolism pathway used. Table 8.37 Predicted 80th percentile annual average concentrations in groundwater at 1 m depth following use to potatoes every 2 years (PELMO, no sorption kinetic)
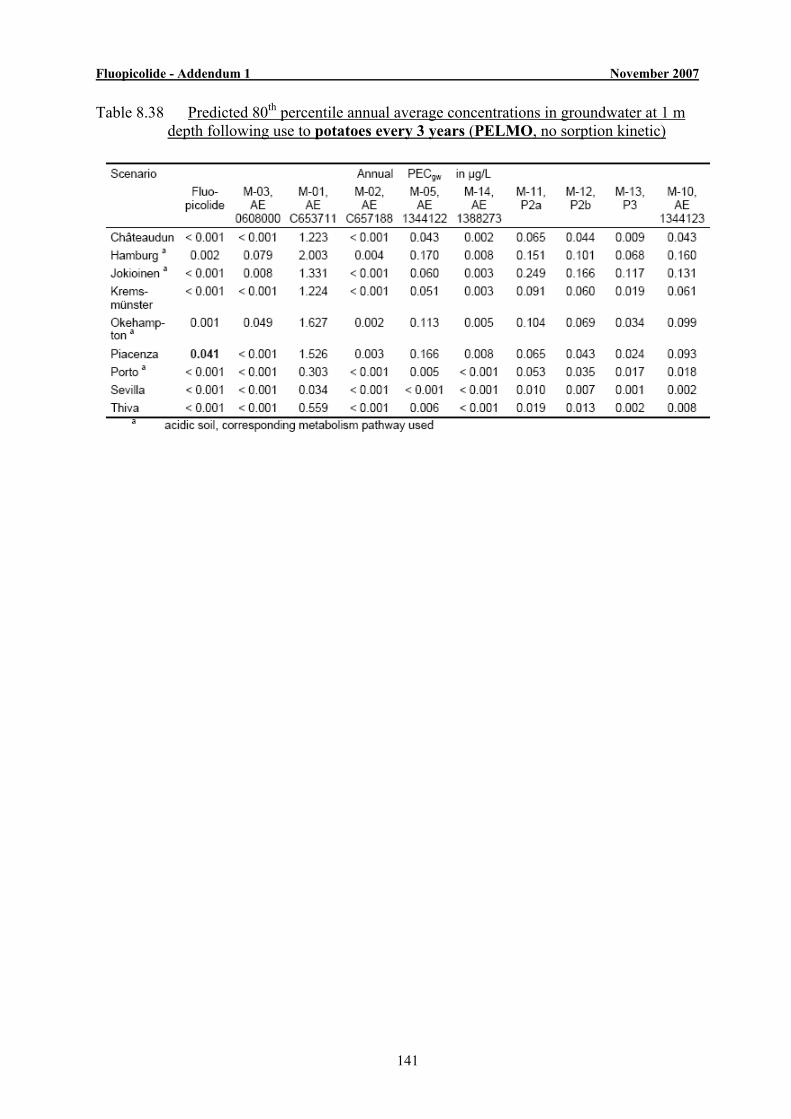
Fluopicolide - Addendum 1 November 2007
141
Table 8.38 Predicted 80th percentile annual average concentrations in groundwater at 1 m depth following use to potatoes every 3 years (PELMO, no sorption kinetic)
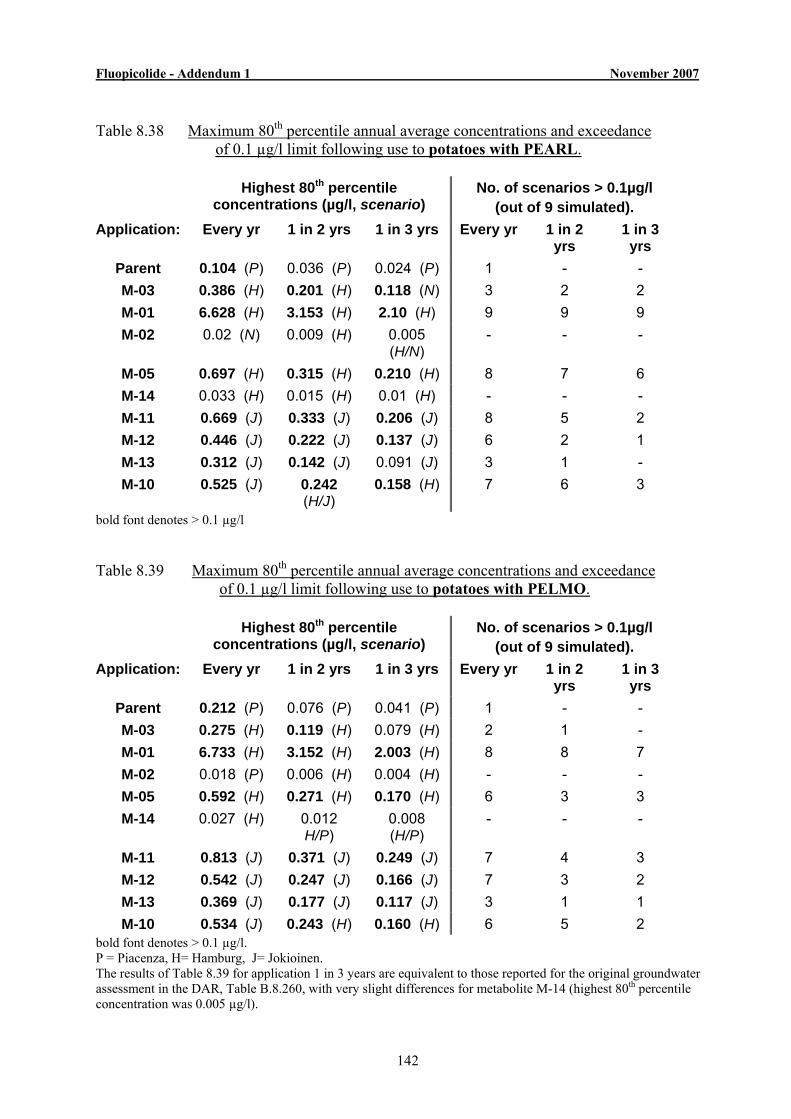
Fluopicolide - Addendum 1 November 2007
142
Table 8.38 Maximum 80th percentile annual average concentrations and exceedance
of 0.1 µg/l limit following use to potatoes with PEARL.
Highest 80th percentile concentrations (µg/l, scenario)
No. of scenarios > 0.1µg/l (out of 9 simulated).
Application: Every yr 1 in 2 yrs 1 in 3 yrs Every yr 1 in 2 yrs
1 in 3 yrs
Parent 0.104 (P) 0.036 (P) 0.024 (P) 1 - - M-03 0.386 (H) 0.201 (H) 0.118 (N) 3 2 2 M-01 6.628 (H) 3.153 (H) 2.10 (H) 9 9 9 M-02 0.02 (N) 0.009 (H) 0.005
(H/N) - - -
M-05 0.697 (H) 0.315 (H) 0.210 (H) 8 7 6 M-14 0.033 (H) 0.015 (H) 0.01 (H) - - - M-11 0.669 (J) 0.333 (J) 0.206 (J) 8 5 2 M-12 0.446 (J) 0.222 (J) 0.137 (J) 6 2 1 M-13 0.312 (J) 0.142 (J) 0.091 (J) 3 1 - M-10 0.525 (J) 0.242
(H/J) 0.158 (H) 7 6 3
bold font denotes > 0.1 µg/l
Table 8.39 Maximum 80th percentile annual average concentrations and exceedance of 0.1 µg/l limit following use to potatoes with PELMO.
Highest 80th percentile concentrations (µg/l, scenario)
No. of scenarios > 0.1µg/l (out of 9 simulated).
Application: Every yr 1 in 2 yrs 1 in 3 yrs Every yr 1 in 2 yrs
1 in 3 yrs
Parent 0.212 (P) 0.076 (P) 0.041 (P) 1 - - M-03 0.275 (H) 0.119 (H) 0.079 (H) 2 1 - M-01 6.733 (H) 3.152 (H) 2.003 (H) 8 8 7 M-02 0.018 (P) 0.006 (H) 0.004 (H) - - - M-05 0.592 (H) 0.271 (H) 0.170 (H) 6 3 3 M-14 0.027 (H) 0.012
H/P) 0.008 (H/P)
- - -
M-11 0.813 (J) 0.371 (J) 0.249 (J) 7 4 3 M-12 0.542 (J) 0.247 (J) 0.166 (J) 7 3 2 M-13 0.369 (J) 0.177 (J) 0.117 (J) 3 1 1 M-10 0.534 (J) 0.243 (H) 0.160 (H) 6 5 2
bold font denotes > 0.1 µg/l. P = Piacenza, H= Hamburg, J= Jokioinen. The results of Table 8.39 for application 1 in 3 years are equivalent to those reported for the original groundwater assessment in the DAR, Table B.8.260, with very slight differences for metabolite M-14 (highest 80th percentile concentration was 0.005 µg/l).
Fluopicolide - Addendum 1 November 2007
143
The maximum predicted 80th percentile concentrations of fluopicolide and metabolites in groundwater following use on potatoes, and the number of scenarios where 0.1 µg/l is exceeded, are shown in Tables 8.38 and 8.39. Following use to potatoes, PECgw values for fluopicolide exceeded the maximum acceptable concentration of 0.1 µg/l at Piacenza (PEARL and PELMO), when application was assumed every year. If crop rotation was taken into account (application assumed every 2 or 3 years), then PECgw values for fluopicolide were less than 0.1 µg/l. PECgw values of metabolite M-01 exceeded 0.1 µg/l at every scenario (PEARL and PELMO) when application was assumed every year. When application to potatoes was assumed every 2 or 3 years instead, M-01 still exceeded 0.1 µg/l at every scenario (PEARL) and all but Sevilla (PELMO). Only metabolites M-02 and M-14 were predicted to be below 0.1 µg/l in groundwater at every scenario (and application regime simulated), for both models. For both models, following use in potatoes, PECgw for all the metabolites simulated were <0.75 µg/l, with these exceptions, which were between >0.75 µg/l and <10 µg/l: M-11 at Jokioinen (PELMO, application every year) M-01 at every scenario/ application regime simulated, except Sevilla (PELMO, application every 1, 2 and 3 years which were <0.75 µg/l). Comparison of results with original groundwater assessment in DAR, B.8.6.2.
Metabolites exceeding 0.1 µg/l The original groundwater assessment for fluopicolide and its metabolites (reported in
the DAR, B.8.6.2) was carried out using FOCUS PELMO with standard degradation and sorption parameters and for use on vines, assumed greater crop interception than considered here. The results indicated that parent and the metabolites, M-01, M-03, M-05, M-10, M-11, M-12 and M-13 had potential to exceed 0.1 µg/l at various scenarios (see Table 8.32).
The new groundwater modelling with PELMO (assuming less crop interception for
vines) and PEARL (incorporating sorption kinetics), results in the same metabolites being predicted to have potential to contaminate groundwater above 0.1 µg/l. No additional metabolites are predicted to exceed 0.1 µg/l, following proposed use of fluopicolide to vines.
The original groundwater assessment (DAR, B.8.6.2) with FOCUS PELMO assumed
application to potatoes, once every 3 years. It resulted in predicted concentrations of fluopicolide being < 0.1 µg/l, but metabolites M-01, M-5, M-10, M-11, M-12 and M-13 were predicted to have potential to contaminate groundwater > 0.1 µg/l.
Fluopicolide - Addendum 1 November 2007
144
The new groundwater modelling with PELMO (assuming application to potatoes also every 2 and every 3 years) and with PEARL (incorporating sorption kinetics), results in the same metabolites being predicted to have potential to contaminate groundwater above 0.1 µg/l. However, for application every year, parent compound and M-03 are also predicted to exceed 0.1 µg/l for certain scenarios.
Predicted concentrations of M-03 exceed 0.1 µg/l in both the PEARL and PELMO
models, following application to potatoes every 2 years, and also in PEARL after application every 3 years, (though not in PELMO). Following application to potatoes every 3 years, M-13 did not exceed 0.1 µg/l in PEARL, though it did at one scenario in PELMO.
Number of scenarios where 0.1 µg/l is exceeded For use of fluopicolide on vines, the number of scenarios where 0.1 µg/l was exceeded
by parent or metabolites is almost the same, when comparing the results of new and previous PELMO modelling. Incorporation of sorption kinetics in PEARL modelling, gave slightly fewer scenarios exceeding 0.1 µg/l for parent, M-05, M-10 and M-12, but otherwise was similar.
For use of fluopicolide on potatoes, the results of PELMO modelling for application
once every 3 years are essentially the same as previously reported in the DAR. Assuming more frequent application, i.e. every year or every 2 years, modelling with PELMO gave a greater number of scenarios where 0.1 µg/l was exceeded, as shown in Table 8.39.
Incorporation of sorption kinetics in PEARL modelling for use on potatoes generally
gave an increased number of scenarios at which concentrations of metabolites exceeded 0.1 µg/l, (increasing with frequency of application). There were some exceptions: for M-13, the number of scenarios with concentrations > 0.1 µg/l were similar to those with PELMO and for application every 3 years were all <0.1 µg/l in PEARL. For M-12, the number of scenarios with concentrations >0.1µg/l were slightly fewer in PEARL, than those with PELMO. For M-11, the number of scenarios with concentrations >0.1µg/l were one less than in PEARL, for application once every 3 years).
Differences in 80th percentile concentrations of parent and metabolites
For use of fluopicolide on vines, the assumption of less crop interception in PELMO modelling resulted in higher 80th percentile annual average concentrations for parent and metabolites, as would be expected. The incorporation of sorption kinetics in PEARL modelling gave lower PECgw values for parent fluopicolide, than in the original PELMO assessment, but in some cases concentrations of metabolites were higher (e.g. M-01, M-03, M-05, M-10, M-11, M-13 and M-14. Compare Tables 8.31 and 8.32).
For use of fluopicolide on potatoes, revised PELMO modelling assuming more frequent
application (every year or every 2 years) gave higher PECgw values for parent and metabolites, as would be expected. Incorporating sorption kinetics into PEARL modelling generally gave similar or slightly lower PECgw, compared to the results of PELMO modelling, with application every 3 years. (See Table 8.38 compared with the
Fluopicolide - Addendum 1 November 2007
145
column for “application 1 in 3 years” of Table 8.39, the results of which are equivalent to those originally reported in the DAR).
For application to potatoes every 2 years, PEARL modelling gave a slightly higher 80th
percentile concentration for M-05, but similar or lower concentrations for parent and other metabolites, compared to corresponding results with PELMO. For application every 3 years, PEARL gave higher 80th percentile concentrations for M-03, M-05 and M-14, but similar or lower concentrations for parent and the other metabolites, compared to corresponding results with PELMO.
RMS Risk Assessment and Conclusions: For use on vines, fluopicolide is predicted to contaminate groundwater above the maximum acceptable concentration (0.1 µg/l) at one or two of the 7 scenarios modelled, (Châteaudun and or Piacenza). Concentrations of the metabolites M-01, M-05, M-10, M-11, M-12 and M-13 were predicted to exceed 0.1 µg/l in groundwater. Of these, M-01, M-05, M-10, M-11 and M-12 exceeded 0.1 µg/l in all, or almost all of the scenarios simulated in both PELMO and PEARL. In particular, predicted concentrations of M-01 were many orders of magnitude higher than this limit (range 1.6-6.3 µg/l). Metabolites M-03 and M-13 only exceeded 0.1 µg/l at a couple of scenarios, (and for M-03 the scenarios were those with acidic soils). Therefore, the relevance of these metabolites needs to be assessed further, in accordance with the EU Guidance Document on the assessment of the relevance of metabolites in groundwater.9
In the view of the RMS, application every year to potatoes is considered to be extreme and not representative in the vast majority of cases. For use of fluopicolide as proposed on potatoes, assuming application every 2 or 3 years, fluopicolide was not predicted to contaminate groundwater above 0.1 µg/l. However, M-01 exceeded 0.1 µg/l in all or almost all of the modelled scenarios (up to 2 µg/l and 3.2 µg/l, for application every 2 and 3 years, respectively). Metabolites M-03, M-05, M-10, M-11, M-12 and M-13 also exceeded the 0.1 µg/l limit for various scenarios. Therefore, as above for vines, the relevance of these metabolites need to be assessed further, in accordance with the EU Guidance Document. Overall, it can be seen that the revised modelling has not resulted in any additional metabolites being predicted to occur at >0.1 µg/l on an annual average basis. The highest concentrations of fluopicolide metabolites from either modelling or lysimeter study seen in the original DAR compared to the highest results from modelling in this addendum are presented below. These have been tabulated simply on the basis of concentration and ignore the GAP used to produce the PEC values and the model used. However, it should be noted that some of the highest concentrations from modelling in this addendum are from use every year on potatoes which the RMS considers to be extreme worst-case and inappropriate as a regulatory scenario.
9 EU Guidance Document on the assessment of the relevance of metabolites in groundwater of substances regulated
under Council Directive 91/414/EEC – Sanco/221/2000-rev 10, 25 February 2003.
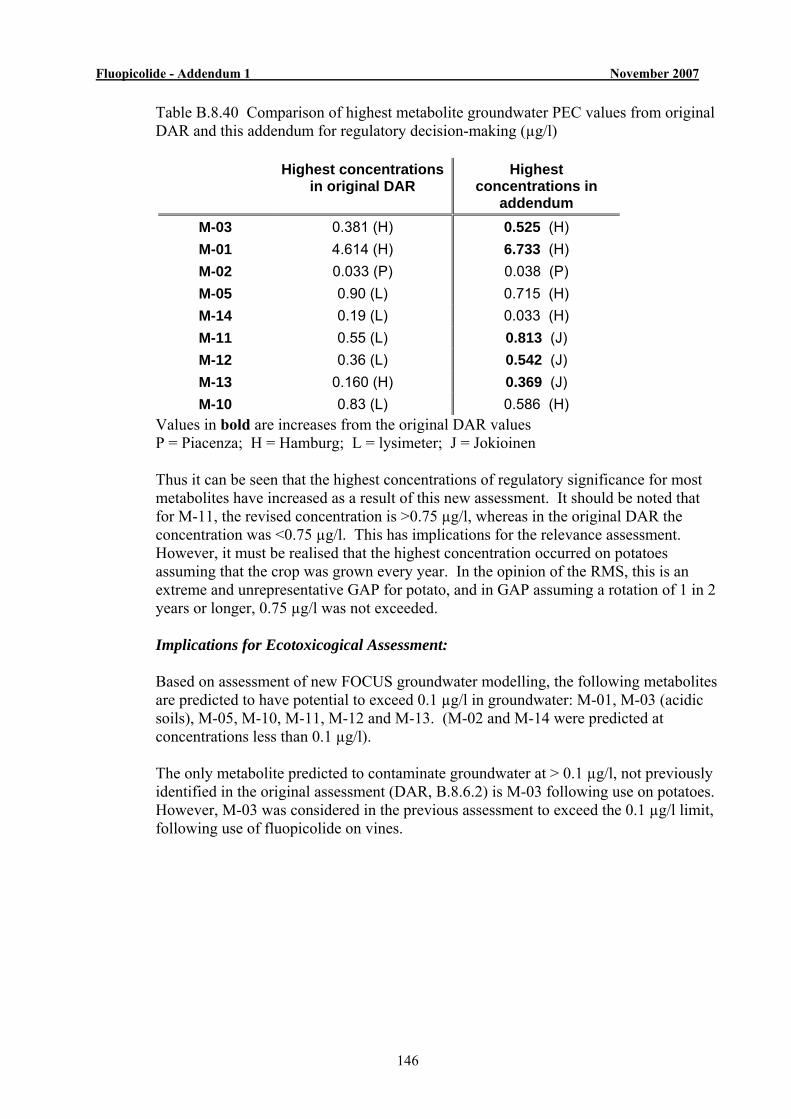
Fluopicolide - Addendum 1 November 2007
146
Table B.8.40 Comparison of highest metabolite groundwater PEC values from original DAR and this addendum for regulatory decision-making (µg/l)
Highest concentrations in original DAR
Highest concentrations in
addendum M-03 0.381 (H) 0.525 (H) M-01 4.614 (H) 6.733 (H) M-02 0.033 (P) 0.038 (P) M-05 0.90 (L) 0.715 (H) M-14 0.19 (L) 0.033 (H) M-11 0.55 (L) 0.813 (J) M-12 0.36 (L) 0.542 (J) M-13 0.160 (H) 0.369 (J) M-10 0.83 (L) 0.586 (H)
Values in bold are increases from the original DAR values P = Piacenza; H = Hamburg; L = lysimeter; J = Jokioinen Thus it can be seen that the highest concentrations of regulatory significance for most metabolites have increased as a result of this new assessment. It should be noted that for M-11, the revised concentration is >0.75 µg/l, whereas in the original DAR the concentration was <0.75 µg/l. This has implications for the relevance assessment. However, it must be realised that the highest concentration occurred on potatoes assuming that the crop was grown every year. In the opinion of the RMS, this is an extreme and unrepresentative GAP for potato, and in GAP assuming a rotation of 1 in 2 years or longer, 0.75 µg/l was not exceeded. Implications for Ecotoxicogical Assessment: Based on assessment of new FOCUS groundwater modelling, the following metabolites are predicted to have potential to exceed 0.1 µg/l in groundwater: M-01, M-03 (acidic soils), M-05, M-10, M-11, M-12 and M-13. (M-02 and M-14 were predicted at concentrations less than 0.1 µg/l). The only metabolite predicted to contaminate groundwater at > 0.1 µg/l, not previously identified in the original assessment (DAR, B.8.6.2) is M-03 following use on potatoes. However, M-03 was considered in the previous assessment to exceed the 0.1 µg/l limit, following use of fluopicolide on vines.
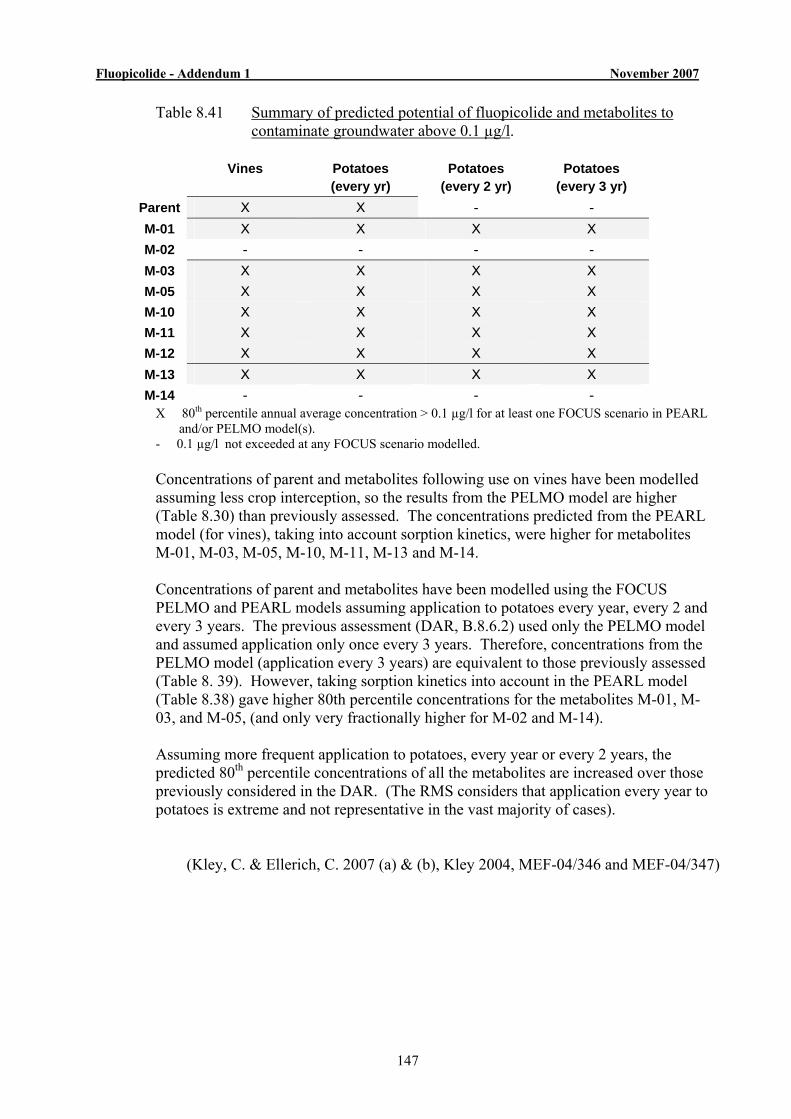
Fluopicolide - Addendum 1 November 2007
147
Table 8.41 Summary of predicted potential of fluopicolide and metabolites to contaminate groundwater above 0.1 µg/l. Vines Potatoes
(every yr) Potatoes
(every 2 yr) Potatoes
(every 3 yr) Parent X X - - M-01 X X X X M-02 - - - - M-03 X X X X M-05 X X X X M-10 X X X X M-11 X X X X M-12 X X X X M-13 X X X X M-14 - - - -
X 80th percentile annual average concentration > 0.1 µg/l for at least one FOCUS scenario in PEARL and/or PELMO model(s). - 0.1 µg/l not exceeded at any FOCUS scenario modelled. Concentrations of parent and metabolites following use on vines have been modelled assuming less crop interception, so the results from the PELMO model are higher (Table 8.30) than previously assessed. The concentrations predicted from the PEARL model (for vines), taking into account sorption kinetics, were higher for metabolites M-01, M-03, M-05, M-10, M-11, M-13 and M-14. Concentrations of parent and metabolites have been modelled using the FOCUS PELMO and PEARL models assuming application to potatoes every year, every 2 and every 3 years. The previous assessment (DAR, B.8.6.2) used only the PELMO model and assumed application only once every 3 years. Therefore, concentrations from the PELMO model (application every 3 years) are equivalent to those previously assessed (Table 8. 39). However, taking sorption kinetics into account in the PEARL model (Table 8.38) gave higher 80th percentile concentrations for the metabolites M-01, M-03, and M-05, (and only very fractionally higher for M-02 and M-14). Assuming more frequent application to potatoes, every year or every 2 years, the predicted 80th percentile concentrations of all the metabolites are increased over those previously considered in the DAR. (The RMS considers that application every year to potatoes is extreme and not representative in the vast majority of cases).
(Kley, C. & Ellerich, C. 2007 (a) & (b), Kley 2004, MEF-04/346 and MEF-04/347)
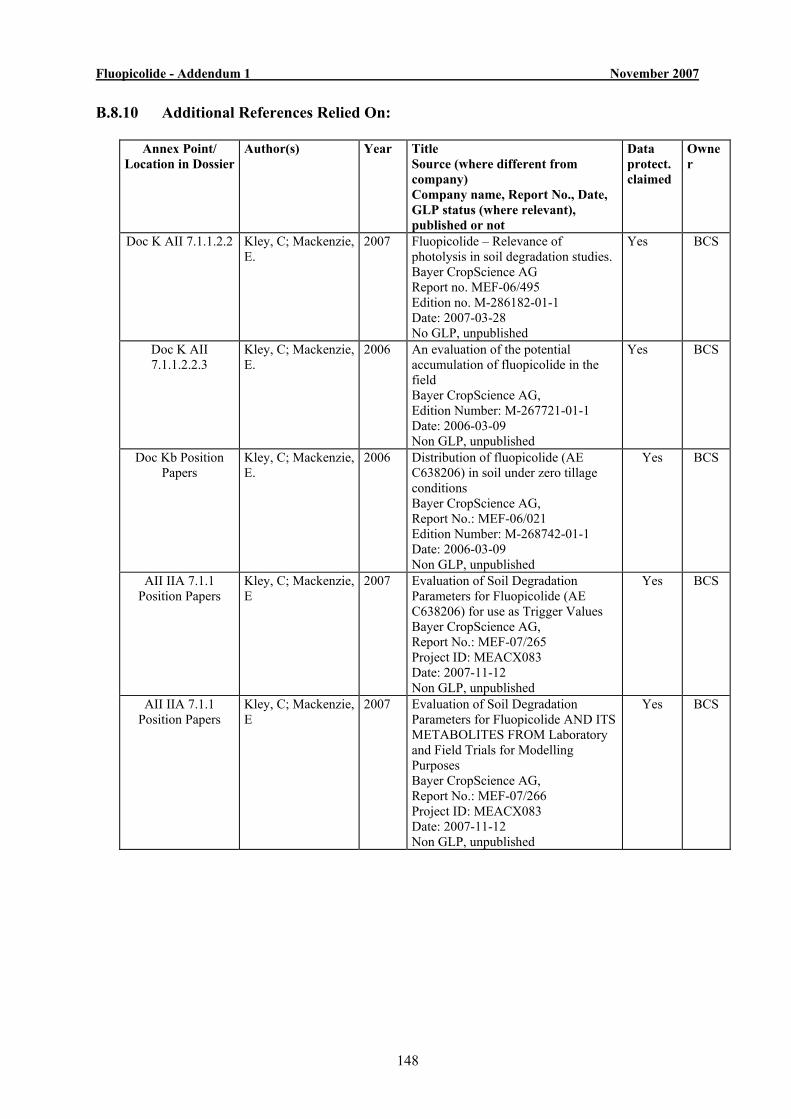
Fluopicolide - Addendum 1 November 2007
148
B.8.10 Additional References Relied On:
Annex Point/ Location in Dossier
Author(s) Year Title Source (where different from company) Company name, Report No., Date, GLP status (where relevant), published or not
Data protect. claimed
Owner
Doc K AII 7.1.1.2.2 Kley, C; Mackenzie, E.
2007 Fluopicolide – Relevance of photolysis in soil degradation studies. Bayer CropScience AG Report no. MEF-06/495 Edition no. M-286182-01-1 Date: 2007-03-28 No GLP, unpublished
Yes BCS
Doc K AII 7.1.1.2.2.3
Kley, C; Mackenzie, E.
2006 An evaluation of the potential accumulation of fluopicolide in the field Bayer CropScience AG, Edition Number: M-267721-01-1 Date: 2006-03-09 Non GLP, unpublished
Yes BCS
Doc Kb Position Papers
Kley, C; Mackenzie, E.
2006 Distribution of fluopicolide (AE C638206) in soil under zero tillage conditions Bayer CropScience AG, Report No.: MEF-06/021 Edition Number: M-268742-01-1 Date: 2006-03-09 Non GLP, unpublished
Yes BCS
AII IIA 7.1.1 Position Papers
Kley, C; Mackenzie, E
2007 Evaluation of Soil Degradation Parameters for Fluopicolide (AE C638206) for use as Trigger Values Bayer CropScience AG, Report No.: MEF-07/265 Project ID: MEACX083 Date: 2007-11-12 Non GLP, unpublished
Yes BCS
AII IIA 7.1.1 Position Papers
Kley, C; Mackenzie, E
2007 Evaluation of Soil Degradation Parameters for Fluopicolide AND ITS METABOLITES FROM Laboratory and Field Trials for Modelling Purposes Bayer CropScience AG, Report No.: MEF-07/266 Project ID: MEACX083 Date: 2007-11-12 Non GLP, unpublished
Yes BCS
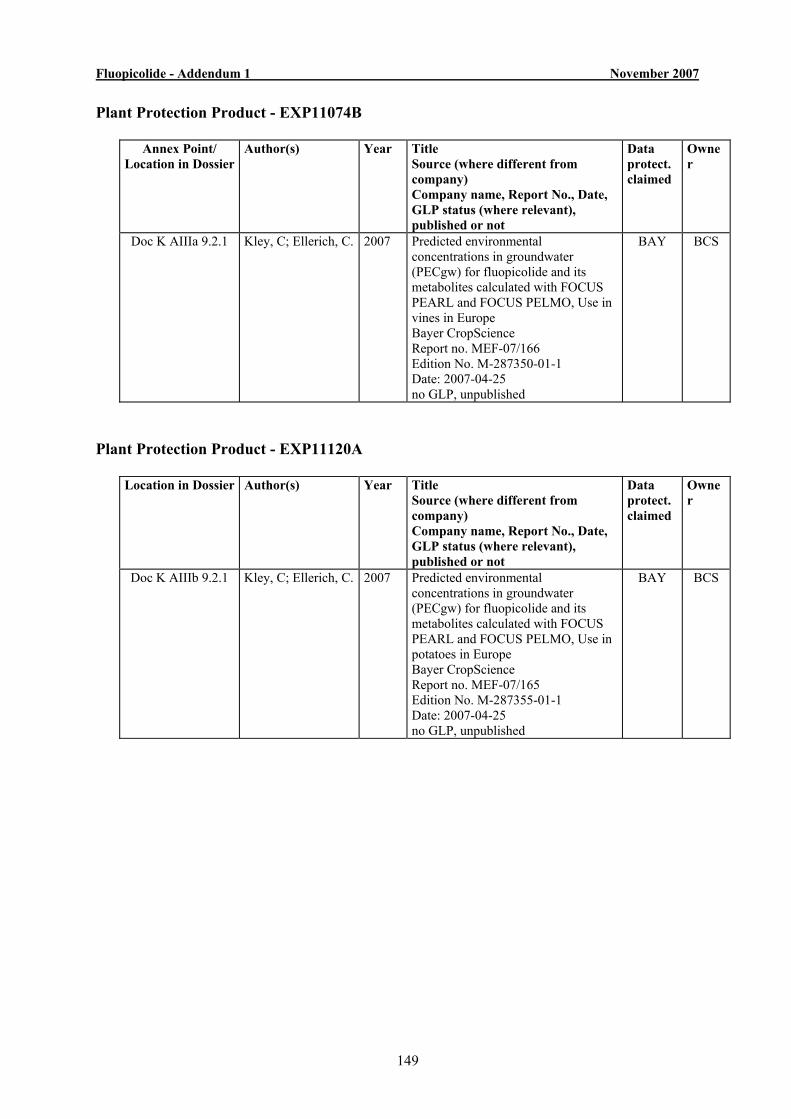
Fluopicolide - Addendum 1 November 2007
149
Plant Protection Product - EXP11074B
Annex Point/ Location in Dossier
Author(s) Year Title Source (where different from company) Company name, Report No., Date, GLP status (where relevant), published or not
Data protect. claimed
Owner
Doc K AIIIa 9.2.1 Kley, C; Ellerich, C. 2007 Predicted environmental concentrations in groundwater (PECgw) for fluopicolide and its metabolites calculated with FOCUS PEARL and FOCUS PELMO, Use in vines in Europe Bayer CropScience Report no. MEF-07/166 Edition No. M-287350-01-1 Date: 2007-04-25 no GLP, unpublished
BAY BCS
Plant Protection Product - EXP11120A
Location in Dossier Author(s) Year Title Source (where different from company) Company name, Report No., Date, GLP status (where relevant), published or not
Data protect. claimed
Owner
Doc K AIIIb 9.2.1 Kley, C; Ellerich, C. 2007 Predicted environmental concentrations in groundwater (PECgw) for fluopicolide and its metabolites calculated with FOCUS PEARL and FOCUS PELMO, Use in potatoes in Europe Bayer CropScience Report no. MEF-07/165 Edition No. M-287355-01-1 Date: 2007-04-25 no GLP, unpublished
BAY BCS
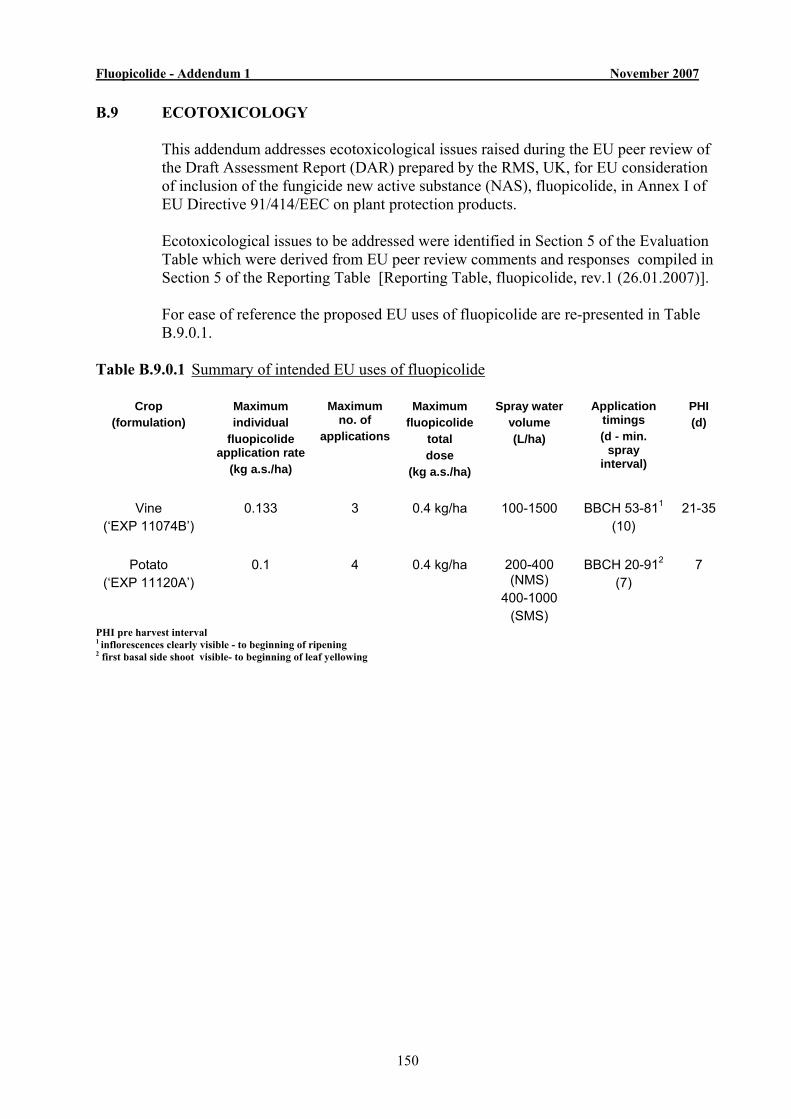
Fluopicolide - Addendum 1 November 2007
150
B.9 ECOTOXICOLOGY This addendum addresses ecotoxicological issues raised during the EU peer review of
the Draft Assessment Report (DAR) prepared by the RMS, UK, for EU consideration of inclusion of the fungicide new active substance (NAS), fluopicolide, in Annex I of EU Directive 91/414/EEC on plant protection products.
Ecotoxicological issues to be addressed were identified in Section 5 of the Evaluation
Table which were derived from EU peer review comments and responses compiled in Section 5 of the Reporting Table [Reporting Table, fluopicolide, rev.1 (26.01.2007)].
For ease of reference the proposed EU uses of fluopicolide are re-presented in Table
B.9.0.1. Table B.9.0.1 Summary of intended EU uses of fluopicolide
Crop (formulation)
Maximum individual
fluopicolide application rate
(kg a.s./ha)
Maximum no. of
applications
Maximum fluopicolide
total dose
(kg a.s./ha)
Spray water volume (L/ha)
Application timings (d - min.
spray interval)
PHI (d)
Vine (‘EXP 11074B’)
0.133
3 0.4 kg/ha 100-1500
BBCH 53-811
(10)
21-35
Potato (‘EXP 11120A’)
0.1 4 0.4 kg/ha 200-400 (NMS)
400-1000 (SMS)
BBCH 20-912
(7) 7
PHI pre harvest interval 1 inflorescences clearly visible - to beginning of ripening 2 first basal side shoot visible- to beginning of leaf yellowing
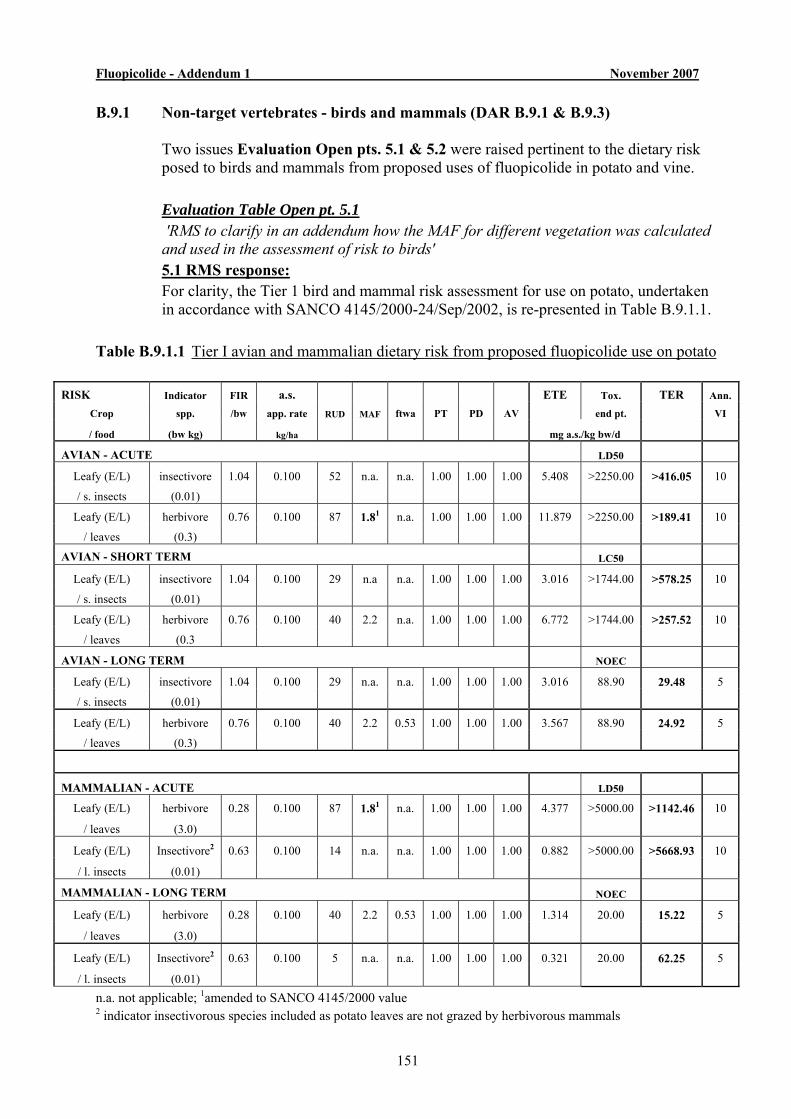
Fluopicolide - Addendum 1 November 2007
151
B.9.1 Non-target vertebrates - birds and mammals (DAR B.9.1 & B.9.3) Two issues Evaluation Open pts. 5.1 & 5.2 were raised pertinent to the dietary risk
posed to birds and mammals from proposed uses of fluopicolide in potato and vine.
Evaluation Table Open pt. 5.1 'RMS to clarify in an addendum how the MAF for different vegetation was calculated
and used in the assessment of risk to birds' 5.1 RMS response:
For clarity, the Tier 1 bird and mammal risk assessment for use on potato, undertaken in accordance with SANCO 4145/2000-24/Sep/2002, is re-presented in Table B.9.1.1.
Table B.9.1.1 Tier I avian and mammalian dietary risk from proposed fluopicolide use on potato
RISK Indicator FIR a.s. ETE Tox. TER Ann.
Crop spp. /bw app. rate RUD MAF ftwa PT PD AV end pt. VI
/ food (bw kg) kg/ha mg a.s./kg bw/d AVIAN - ACUTE LD50
Leafy (E/L) insectivore 1.04 0.100 52 n.a. n.a. 1.00 1.00 1.00 5.408 >2250.00 >416.05 10
/ s. insects (0.01)
Leafy (E/L) herbivore 0.76 0.100 87 1.81 n.a. 1.00 1.00 1.00 11.879 >2250.00 >189.41 10
/ leaves (0.3)
AVIAN - SHORT TERM LC50 Leafy (E/L) insectivore 1.04 0.100 29 n.a n.a. 1.00 1.00 1.00 3.016 >1744.00 >578.25 10
/ s. insects (0.01)
Leafy (E/L) herbivore 0.76 0.100 40 2.2 n.a. 1.00 1.00 1.00 6.772 >1744.00 >257.52 10
/ leaves (0.3
AVIAN - LONG TERM NOEC Leafy (E/L) insectivore 1.04 0.100 29 n.a. n.a. 1.00 1.00 1.00 3.016 88.90 29.48 5
/ s. insects (0.01)
Leafy (E/L) herbivore 0.76 0.100 40 2.2 0.53 1.00 1.00 1.00 3.567 88.90 24.92 5
/ leaves (0.3)
MAMMALIAN - ACUTE LD50
Leafy (E/L) herbivore 0.28 0.100 87 1.81 n.a. 1.00 1.00 1.00 4.377 >5000.00 >1142.46 10
/ leaves (3.0)
Leafy (E/L) Insectivore2 0.63 0.100 14 n.a. n.a. 1.00 1.00 1.00 0.882 >5000.00 >5668.93 10
/ l. insects (0.01)
MAMMALIAN - LONG TERM NOEC Leafy (E/L) herbivore 0.28 0.100 40 2.2 0.53 1.00 1.00 1.00 1.314 20.00 15.22 5
/ leaves (3.0)
Leafy (E/L) Insectivore2 0.63 0.100 5 n.a. n.a. 1.00 1.00 1.00 0.321 20.00 62.25 5
/ l. insects (0.01) n.a. not applicable; 1amended to SANCO 4145/2000 value 2 indicator insectivorous species included as potato leaves are not grazed by herbivorous mammals
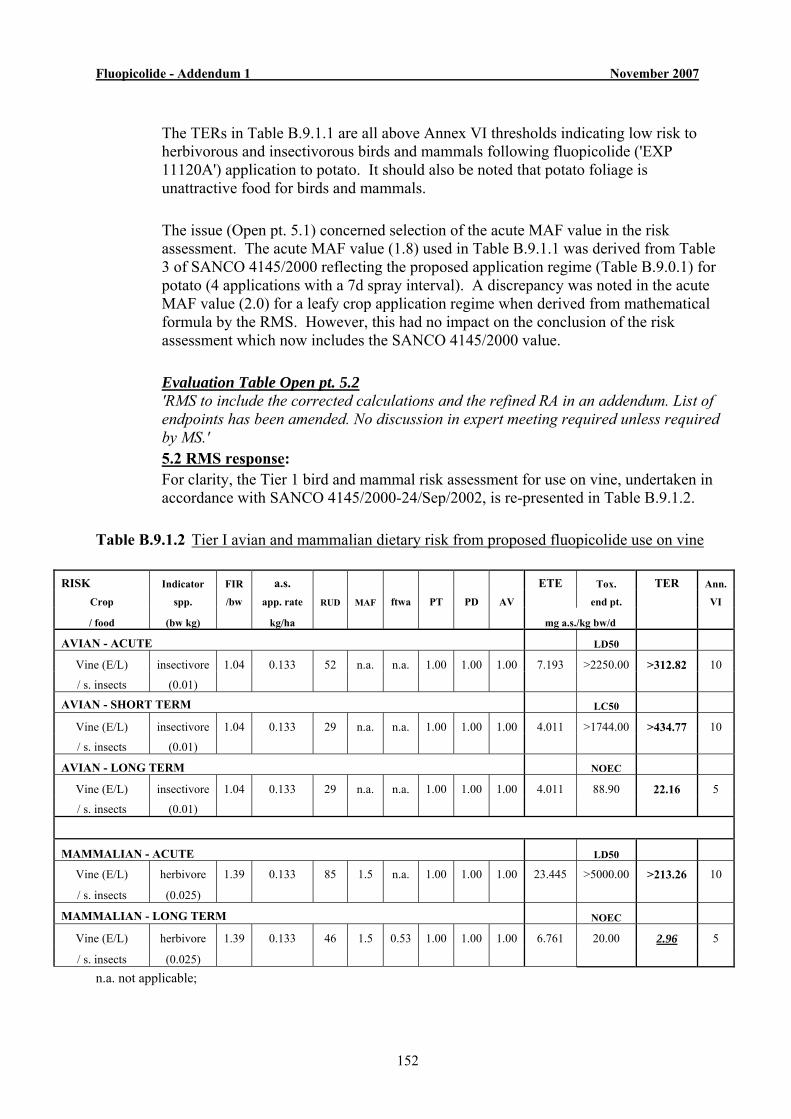
Fluopicolide - Addendum 1 November 2007
152
The TERs in Table B.9.1.1 are all above Annex VI thresholds indicating low risk to
herbivorous and insectivorous birds and mammals following fluopicolide ('EXP 11120A') application to potato. It should also be noted that potato foliage is unattractive food for birds and mammals.
The issue (Open pt. 5.1) concerned selection of the acute MAF value in the risk
assessment. The acute MAF value (1.8) used in Table B.9.1.1 was derived from Table 3 of SANCO 4145/2000 reflecting the proposed application regime (Table B.9.0.1) for potato (4 applications with a 7d spray interval). A discrepancy was noted in the acute MAF value (2.0) for a leafy crop application regime when derived from mathematical formula by the RMS. However, this had no impact on the conclusion of the risk assessment which now includes the SANCO 4145/2000 value.
Evaluation Table Open pt. 5.2
'RMS to include the corrected calculations and the refined RA in an addendum. List of endpoints has been amended. No discussion in expert meeting required unless required by MS.' 5.2 RMS response:
For clarity, the Tier 1 bird and mammal risk assessment for use on vine, undertaken in accordance with SANCO 4145/2000-24/Sep/2002, is re-presented in Table B.9.1.2.
Table B.9.1.2 Tier I avian and mammalian dietary risk from proposed fluopicolide use on vine
RISK Indicator FIR a.s. ETE Tox. TER Ann.
Crop spp. /bw app. rate RUD MAF ftwa PT PD AV end pt. VI
/ food (bw kg) kg/ha mg a.s./kg bw/d AVIAN - ACUTE LD50
Vine (E/L) insectivore 1.04 0.133 52 n.a. n.a. 1.00 1.00 1.00 7.193 >2250.00 >312.82 10
/ s. insects (0.01)
AVIAN - SHORT TERM LC50 Vine (E/L) insectivore 1.04 0.133 29 n.a. n.a. 1.00 1.00 1.00 4.011 >1744.00 >434.77 10
/ s. insects (0.01)
AVIAN - LONG TERM NOEC Vine (E/L) insectivore 1.04 0.133 29 n.a. n.a. 1.00 1.00 1.00 4.011 88.90 22.16 5
/ s. insects (0.01)
MAMMALIAN - ACUTE LD50
Vine (E/L) herbivore 1.39 0.133 85 1.5 n.a. 1.00 1.00 1.00 23.445 >5000.00 >213.26 10
/ s. insects (0.025)
MAMMALIAN - LONG TERM NOEC Vine (E/L) herbivore 1.39 0.133 46 1.5 0.53 1.00 1.00 1.00 6.761 20.00 2.96 5
/ s. insects (0.025) n.a. not applicable;
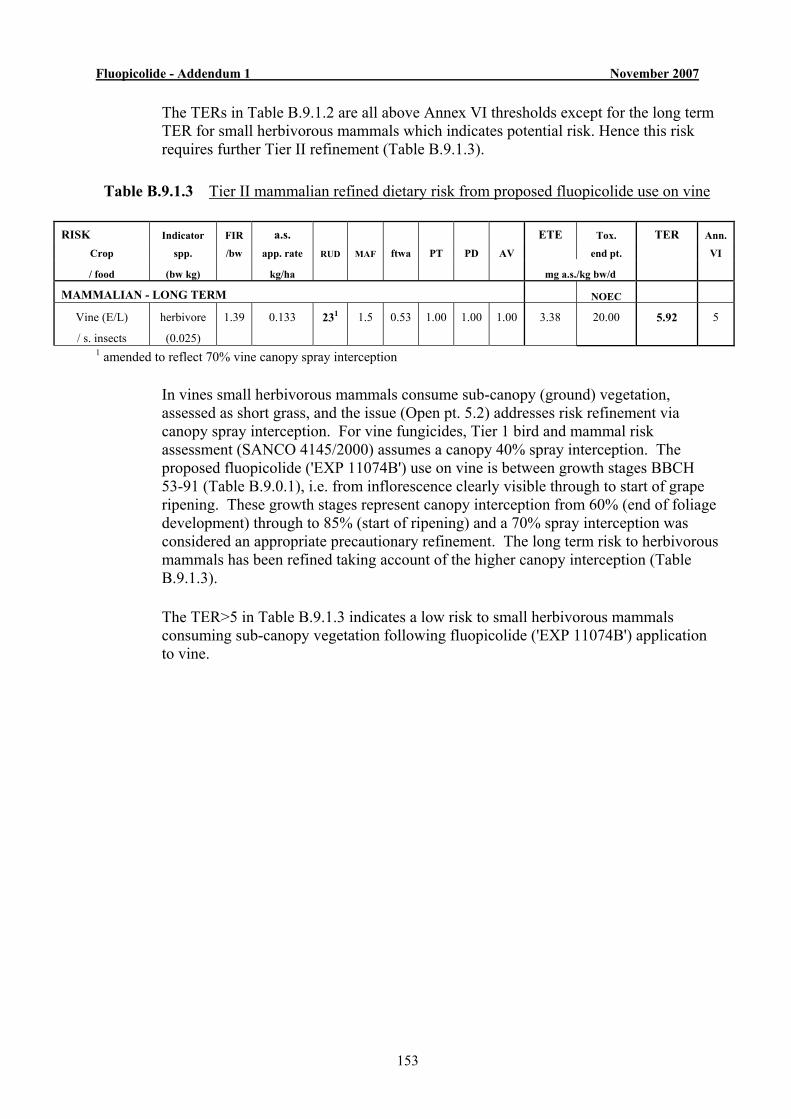
Fluopicolide - Addendum 1 November 2007
153
The TERs in Table B.9.1.2 are all above Annex VI thresholds except for the long term TER for small herbivorous mammals which indicates potential risk. Hence this risk requires further Tier II refinement (Table B.9.1.3).
Table B.9.1.3 Tier II mammalian refined dietary risk from proposed fluopicolide use on vine
RISK Indicator FIR a.s. ETE Tox. TER Ann.
Crop spp. /bw app. rate RUD MAF ftwa PT PD AV end pt. VI
/ food (bw kg) kg/ha mg a.s./kg bw/d MAMMALIAN - LONG TERM NOEC
Vine (E/L) herbivore 1.39 0.133 231 1.5 0.53 1.00 1.00 1.00 3.38 20.00 5.92 5
/ s. insects (0.025) 1 amended to reflect 70% vine canopy spray interception In vines small herbivorous mammals consume sub-canopy (ground) vegetation,
assessed as short grass, and the issue (Open pt. 5.2) addresses risk refinement via canopy spray interception. For vine fungicides, Tier 1 bird and mammal risk assessment (SANCO 4145/2000) assumes a canopy 40% spray interception. The proposed fluopicolide ('EXP 11074B') use on vine is between growth stages BBCH 53-91 (Table B.9.0.1), i.e. from inflorescence clearly visible through to start of grape ripening. These growth stages represent canopy interception from 60% (end of foliage development) through to 85% (start of ripening) and a 70% spray interception was considered an appropriate precautionary refinement. The long term risk to herbivorous mammals has been refined taking account of the higher canopy interception (Table B.9.1.3).
The TER>5 in Table B.9.1.3 indicates a low risk to small herbivorous mammals
consuming sub-canopy vegetation following fluopicolide ('EXP 11074B') application to vine.
Fluopicolide - Addendum 1 November 2007
154
B.9.2 Aquatic organisms Four issues (Evaluation Table Open points 5.3, 5.4, 5.5 & 5.12) were raised
pertinent to the risk to aquatic organisms from proposed uses of fluopicolide in potato and vine crops:
Evaluation Table Open pt. 5.3
'RMS to include the information on Log Pow values for the metabolites in an addendum (only data for M02 and M03 are available in Vol.B.2.1 of the DAR). No discussion in an experts meeting is required.' 5.3 RMS response:
Log Pow values of parent and metabolites are considered in ecotoxicological risk assessment of potential bioconcentration potential.
A fish bioconcentration study was conducted (see DAR B.9.2.3.4) as fluopicolide has a
logPow of 2.9, i.e. close to the logPow Annex VI threshold of >3.0 for bioconcentration assessment. The results showed that fluopicolide had bioconcentration factor (BCF) in fish of 121. Clearance of fluopicolide from fish tissues, CT50 and CT90, were 0.51 and 1.7d, respectively, and 5% of total residue remained after 18d depuration.
The overall conclusion for fluopicolide was that the low BCF and rapid clearance
times of fluopicolide from fish tissues indicated a low propensity to bioaccumulate in fish. Potential for fluopicolide bioconcentration in worm- and fish-eating bird and mammals was also considered to be low (DAR B.9.15 & B.9.3.3).
Key aquatic metabolites M03, M02 and M01 (see Appendix 1) have log Pow values of
2.34, -2.0 and 0.51 (DAR Volume B.2.1), respectively, and a lower propensity for bioaccumulation than parent fluopicolide would hence be expected. M03 is also not stable in aquatic systems at environmental pH and degraded to form M02 and M01 and hence also likely to have a very low bioavailability. All other aquatic metabolites M05, M10, M11, M12, M13 and M14 are similarly structured hydroxylated and/or sulphonated derivatives of M02 (see Appendix 2). Thus such derivatives will likely have logPow values approximating to that of M02 and hence it can also be concluded that all the key aquatic fluopicolide metabolites will have little potential to bioaccumulate.
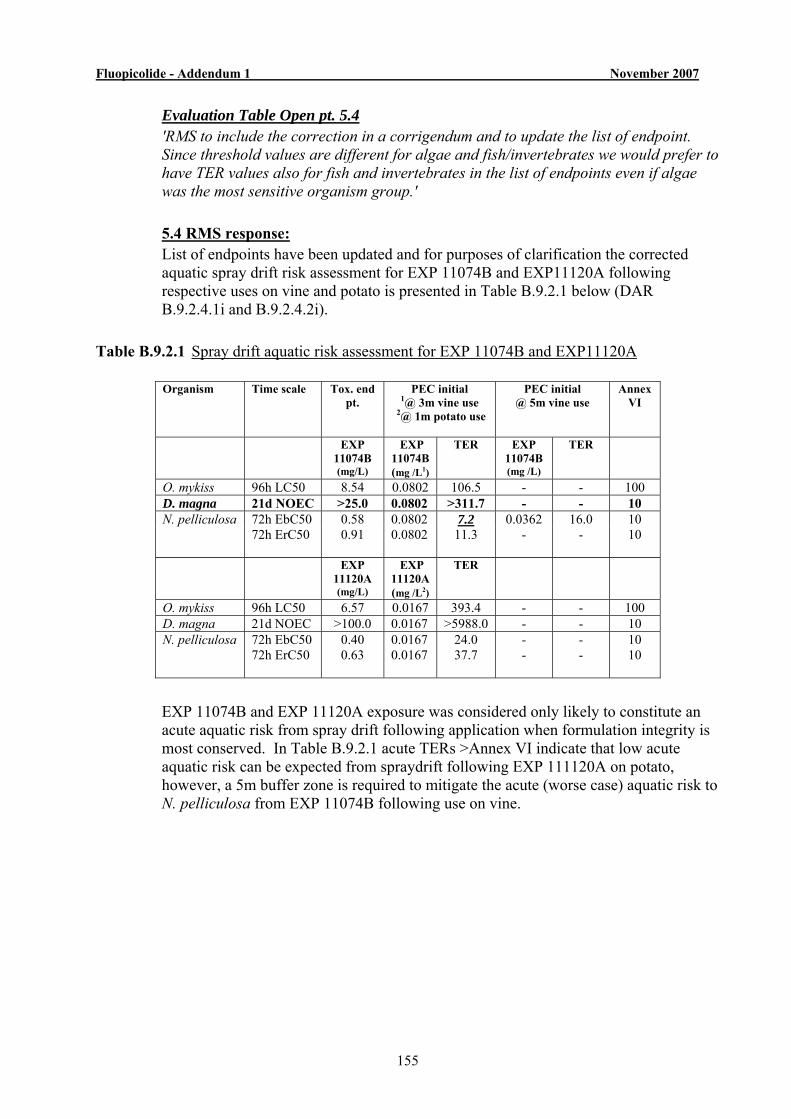
Fluopicolide - Addendum 1 November 2007
155
Evaluation Table Open pt. 5.4 'RMS to include the correction in a corrigendum and to update the list of endpoint.
Since threshold values are different for algae and fish/invertebrates we would prefer to have TER values also for fish and invertebrates in the list of endpoints even if algae was the most sensitive organism group.'
5.4 RMS response:
List of endpoints have been updated and for purposes of clarification the corrected aquatic spray drift risk assessment for EXP 11074B and EXP11120A following respective uses on vine and potato is presented in Table B.9.2.1 below (DAR B.9.2.4.1i and B.9.2.4.2i).
Table B.9.2.1 Spray drift aquatic risk assessment for EXP 11074B and EXP11120A
Organism Time scale Tox. end pt.
PEC initial 1@ 3m vine use
2@ 1m potato use
PEC initial @ 5m vine use
Annex VI
EXP 11074B (mg/L)
EXP 11074B (mg /L1)
TER EXP 11074B (mg /L)
TER
O. mykiss 96h LC50 8.54 0.0802 106.5 - - 100 D. magna 21d NOEC >25.0 0.0802 >311.7 - - 10 N. pelliculosa 72h EbC50 0.58 0.0802 7.2 0.0362 16.0 10 72h ErC50
0.91 0.0802 11.3 - - 10
EXP 11120A (mg/L)
EXP 11120A (mg /L2)
TER
O. mykiss 96h LC50 6.57 0.0167 393.4 - - 100 D. magna 21d NOEC >100.0 0.0167 >5988.0 - - 10 N. pelliculosa 72h EbC50 0.40 0.0167 24.0 - - 10 72h ErC50
0.63 0.0167 37.7 - - 10
EXP 11074B and EXP 11120A exposure was considered only likely to constitute an
acute aquatic risk from spray drift following application when formulation integrity is most conserved. In Table B.9.2.1 acute TERs >Annex VI indicate that low acute aquatic risk can be expected from spraydrift following EXP 111120A on potato, however, a 5m buffer zone is required to mitigate the acute (worse case) aquatic risk to N. pelliculosa from EXP 11074B following use on vine.
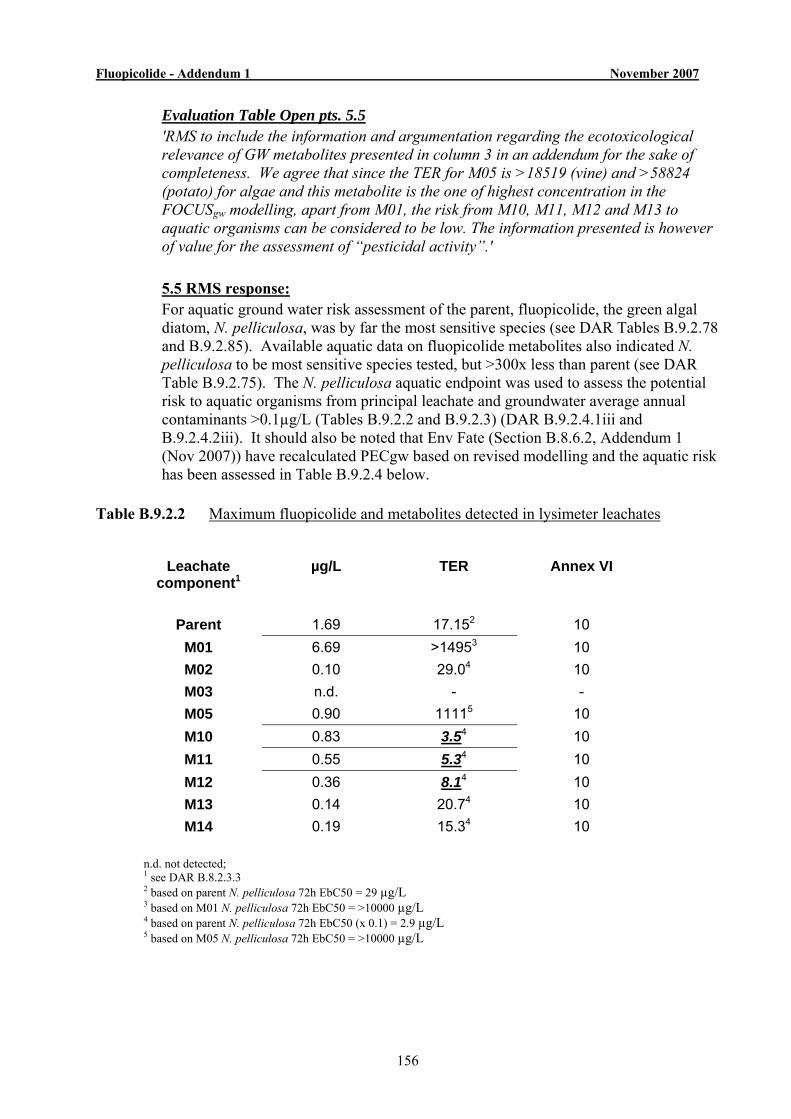
Fluopicolide - Addendum 1 November 2007
156
Evaluation Table Open pts. 5.5 'RMS to include the information and argumentation regarding the ecotoxicological
relevance of GW metabolites presented in column 3 in an addendum for the sake of completeness. We agree that since the TER for M05 is >18519 (vine) and >58824 (potato) for algae and this metabolite is the one of highest concentration in the FOCUSgw modelling, apart from M01, the risk from M10, M11, M12 and M13 to aquatic organisms can be considered to be low. The information presented is however of value for the assessment of “pesticidal activity”.'
5.5 RMS response:
For aquatic ground water risk assessment of the parent, fluopicolide, the green algal diatom, N. pelliculosa, was by far the most sensitive species (see DAR Tables B.9.2.78 and B.9.2.85). Available aquatic data on fluopicolide metabolites also indicated N. pelliculosa to be most sensitive species tested, but >300x less than parent (see DAR Table B.9.2.75). The N. pelliculosa aquatic endpoint was used to assess the potential risk to aquatic organisms from principal leachate and groundwater average annual contaminants >0.1µg/L (Tables B.9.2.2 and B.9.2.3) (DAR B.9.2.4.1iii and B.9.2.4.2iii). It should also be noted that Env Fate (Section B.8.6.2, Addendum 1 (Nov 2007)) have recalculated PECgw based on revised modelling and the aquatic risk has been assessed in Table B.9.2.4 below.
Table B.9.2.2 Maximum fluopicolide and metabolites detected in lysimeter leachates
Leachate component1
µg/L TER Annex VI
Parent 1.69 17.152 10 M01 6.69 >14953 10 M02 0.10 29.04 10 M03 n.d. - - M05 0.90 11115 10 M10 0.83 3.54 10 M11 0.55 5.34 10 M12 0.36 8.14 10 M13 0.14 20.74 10 M14
0.19 15.34 10
n.d. not detected; 1 see DAR B.8.2.3.3 2 based on parent N. pelliculosa 72h EbC50 = 29 µg/L 3 based on M01 N. pelliculosa 72h EbC50 = >10000 µg/L 4 based on parent N. pelliculosa 72h EbC50 (x 0.1) = 2.9 µg/L 5 based on M05 N. pelliculosa 72h EbC50 = >10000 µg/L
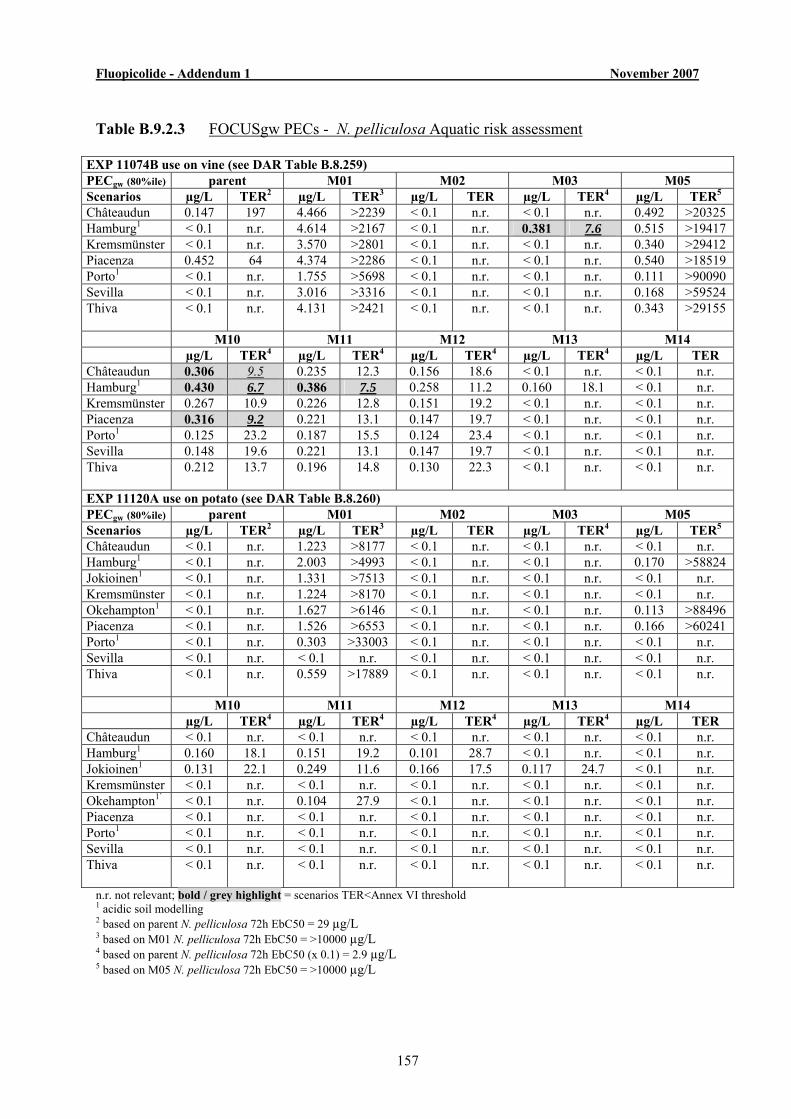
Fluopicolide - Addendum 1 November 2007
157
Table B.9.2.3 FOCUSgw PECs - N. pelliculosa Aquatic risk assessment
EXP 11074B use on vine (see DAR Table B.8.259) PECgw (80%ile) parent M01 M02 M03 M05 Scenarios µg/L TER2 µg/L TER3 µg/L TER µg/L TER4 µg/L TER5
Châteaudun 0.147 197 4.466 >2239 < 0.1 n.r. < 0.1 n.r. 0.492 >20325 Hamburg1 < 0.1 n.r. 4.614 >2167 < 0.1 n.r. 0.381 7.6 0.515 >19417 Kremsmünster < 0.1 n.r. 3.570 >2801 < 0.1 n.r. < 0.1 n.r. 0.340 >29412 Piacenza 0.452 64 4.374 >2286 < 0.1 n.r. < 0.1 n.r. 0.540 >18519 Porto1 < 0.1 n.r. 1.755 >5698 < 0.1 n.r. < 0.1 n.r. 0.111 >90090 Sevilla < 0.1 n.r. 3.016 >3316 < 0.1 n.r. < 0.1 n.r. 0.168 >59524 Thiva
< 0.1
n.r. 4.131
>2421 < 0.1
n.r. < 0.1
n.r. 0.343
>29155
M10 M11 M12 M13 M14 µg/L TER4 µg/L TER4 µg/L TER4 µg/L TER4 µg/L TER Châteaudun 0.306 9.5 0.235 12.3 0.156 18.6 < 0.1 n.r. < 0.1 n.r. Hamburg1 0.430 6.7 0.386 7.5 0.258 11.2 0.160 18.1 < 0.1 n.r. Kremsmünster 0.267 10.9 0.226 12.8 0.151 19.2 < 0.1 n.r. < 0.1 n.r. Piacenza 0.316 9.2 0.221 13.1 0.147 19.7 < 0.1 n.r. < 0.1 n.r. Porto1 0.125 23.2 0.187 15.5 0.124 23.4 < 0.1 n.r. < 0.1 n.r. Sevilla 0.148 19.6 0.221 13.1 0.147 19.7 < 0.1 n.r. < 0.1 n.r. Thiva
0.212
13.7 0.196
14.8 0.130
22.3 < 0.1
n.r. < 0.1
n.r.
EXP 11120A use on potato (see DAR Table B.8.260) PECgw (80%ile) parent M01 M02 M03 M05 Scenarios µg/L TER2 µg/L TER3 µg/L TER µg/L TER4 µg/L TER5
Châteaudun < 0.1 n.r. 1.223 >8177 < 0.1 n.r. < 0.1 n.r. < 0.1 n.r. Hamburg1 < 0.1 n.r. 2.003 >4993 < 0.1 n.r. < 0.1 n.r. 0.170 >58824 Jokioinen1 < 0.1 n.r. 1.331 >7513 < 0.1 n.r. < 0.1 n.r. < 0.1 n.r. Kremsmünster < 0.1 n.r. 1.224 >8170 < 0.1 n.r. < 0.1 n.r. < 0.1 n.r. Okehampton1 < 0.1 n.r. 1.627 >6146 < 0.1 n.r. < 0.1 n.r. 0.113 >88496 Piacenza < 0.1 n.r. 1.526 >6553 < 0.1 n.r. < 0.1 n.r. 0.166 >60241 Porto1 < 0.1 n.r. 0.303 >33003 < 0.1 n.r. < 0.1 n.r. < 0.1 n.r. Sevilla < 0.1 n.r. < 0.1 n.r. < 0.1 n.r. < 0.1 n.r. < 0.1 n.r. Thiva
< 0.1
n.r. 0.559
>17889 < 0.1
n.r. < 0.1
n.r. < 0.1
n.r.
M10 M11 M12 M13 M14 µg/L TER4 µg/L TER4 µg/L TER4 µg/L TER4 µg/L TER Châteaudun < 0.1 n.r. < 0.1 n.r. < 0.1 n.r. < 0.1 n.r. < 0.1 n.r. Hamburg1 0.160 18.1 0.151 19.2 0.101 28.7 < 0.1 n.r. < 0.1 n.r. Jokioinen1 0.131 22.1 0.249 11.6 0.166 17.5 0.117 24.7 < 0.1 n.r. Kremsmünster < 0.1 n.r. < 0.1 n.r. < 0.1 n.r. < 0.1 n.r. < 0.1 n.r. Okehampton1` < 0.1 n.r. 0.104 27.9 < 0.1 n.r. < 0.1 n.r. < 0.1 n.r. Piacenza < 0.1 n.r. < 0.1 n.r. < 0.1 n.r. < 0.1 n.r. < 0.1 n.r. Porto1 < 0.1 n.r. < 0.1 n.r. < 0.1 n.r. < 0.1 n.r. < 0.1 n.r. Sevilla < 0.1 n.r. < 0.1 n.r. < 0.1 n.r. < 0.1 n.r. < 0.1 n.r. Thiva
< 0.1
n.r. < 0.1
n.r. < 0.1
n.r. < 0.1
n.r. < 0.1
n.r.
n.r. not relevant; bold / grey highlight = scenarios TER<Annex VI threshold 1 acidic soil modelling 2 based on parent N. pelliculosa 72h EbC50 = 29 µg/L 3 based on M01 N. pelliculosa 72h EbC50 = >10000 µg/L 4 based on parent N. pelliculosa 72h EbC50 (x 0.1) = 2.9 µg/L 5 based on M05 N. pelliculosa 72h EbC50 = >10000 µg/L
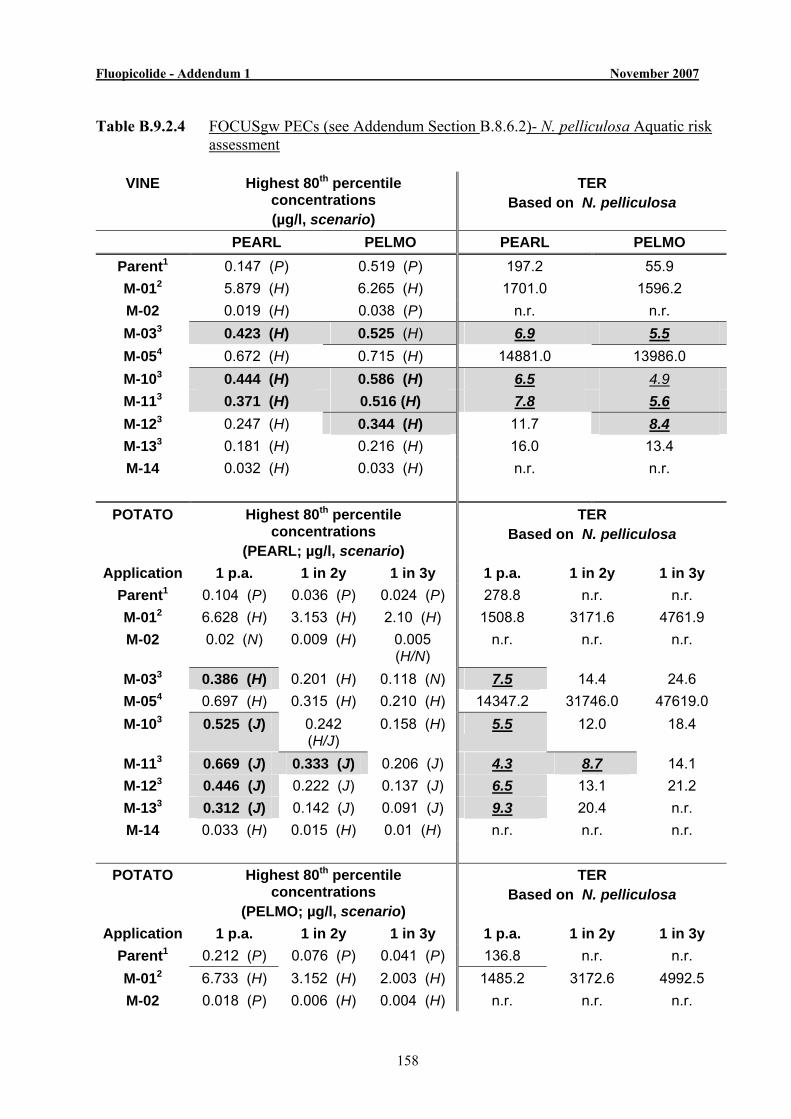
Fluopicolide - Addendum 1 November 2007
158
Table B.9.2.4 FOCUSgw PECs (see Addendum Section B.8.6.2)- N. pelliculosa Aquatic risk
assessment
VINE Highest 80th percentile concentrations (µg/l, scenario)
TER Based on N. pelliculosa
PEARL PELMO PEARL PELMO Parent1 0.147 (P) 0.519 (P) 197.2 55.9 M-012 5.879 (H) 6.265 (H) 1701.0 1596.2 M-02 0.019 (H) 0.038 (P) n.r. n.r. M-033 0.423 (H) 0.525 (H) 6.9 5.5 M-054 0.672 (H) 0.715 (H) 14881.0 13986.0 M-103 0.444 (H) 0.586 (H) 6.5 4.9 M-113 0.371 (H) 0.516 (H) 7.8 5.6 M-123 0.247 (H) 0.344 (H) 11.7 8.4 M-133 0.181 (H) 0.216 (H) 16.0 13.4 M-14 0.032 (H) 0.033 (H) n.r. n.r.
POTATO Highest 80th percentile
concentrations (PEARL; µg/l, scenario)
TER Based on N. pelliculosa
Application 1 p.a. 1 in 2y 1 in 3y 1 p.a. 1 in 2y 1 in 3y Parent1 0.104 (P) 0.036 (P) 0.024 (P) 278.8 n.r. n.r. M-012 6.628 (H) 3.153 (H) 2.10 (H) 1508.8 3171.6 4761.9 M-02 0.02 (N) 0.009 (H) 0.005
(H/N) n.r. n.r. n.r.
M-033 0.386 (H) 0.201 (H) 0.118 (N) 7.5 14.4 24.6 M-054 0.697 (H) 0.315 (H) 0.210 (H) 14347.2 31746.0 47619.0 M-103 0.525 (J) 0.242
(H/J) 0.158 (H) 5.5 12.0 18.4
M-113 0.669 (J) 0.333 (J) 0.206 (J) 4.3 8.7 14.1 M-123 0.446 (J) 0.222 (J) 0.137 (J) 6.5 13.1 21.2 M-133 0.312 (J) 0.142 (J) 0.091 (J) 9.3 20.4 n.r. M-14 0.033 (H) 0.015 (H) 0.01 (H) n.r. n.r. n.r.
POTATO Highest 80th percentile
concentrations (PELMO; µg/l, scenario)
TER Based on N. pelliculosa
Application 1 p.a. 1 in 2y 1 in 3y 1 p.a. 1 in 2y 1 in 3y Parent1 0.212 (P) 0.076 (P) 0.041 (P) 136.8 n.r. n.r. M-012 6.733 (H) 3.152 (H) 2.003 (H) 1485.2 3172.6 4992.5 M-02 0.018 (P) 0.006 (H) 0.004 (H) n.r. n.r. n.r.
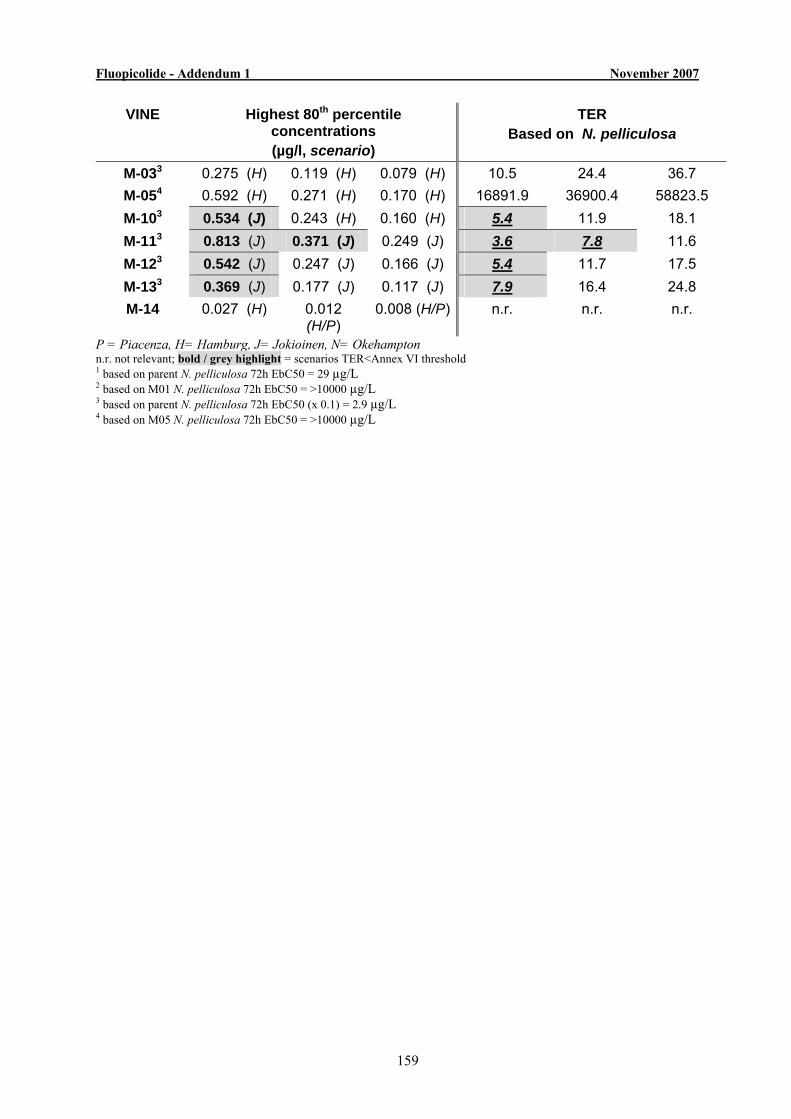
Fluopicolide - Addendum 1 November 2007
159
VINE Highest 80th percentile concentrations (µg/l, scenario)
TER Based on N. pelliculosa
M-033 0.275 (H) 0.119 (H) 0.079 (H) 10.5 24.4 36.7 M-054 0.592 (H) 0.271 (H) 0.170 (H) 16891.9 36900.4 58823.5 M-103 0.534 (J) 0.243 (H) 0.160 (H) 5.4 11.9 18.1 M-113 0.813 (J) 0.371 (J) 0.249 (J) 3.6 7.8 11.6 M-123 0.542 (J) 0.247 (J) 0.166 (J) 5.4 11.7 17.5 M-133 0.369 (J) 0.177 (J) 0.117 (J) 7.9 16.4 24.8 M-14 0.027 (H) 0.012
(H/P) 0.008 (H/P) n.r. n.r. n.r.
P = Piacenza, H= Hamburg, J= Jokioinen, N= Okehampton n.r. not relevant; bold / grey highlight = scenarios TER<Annex VI threshold 1 based on parent N. pelliculosa 72h EbC50 = 29 µg/L 2 based on M01 N. pelliculosa 72h EbC50 = >10000 µg/L 3 based on parent N. pelliculosa 72h EbC50 (x 0.1) = 2.9 µg/L 4 based on M05 N. pelliculosa 72h EbC50 = >10000 µg/L
Fluopicolide - Addendum 1 November 2007
160
From TERs (Table B.9.2.2) based on available parent and metabolite N. pelliculosa toxicological end points (see DAR Table B.9.2.75) and, in the absence of data, the parent N. pelliculosa endpoint with a 10x safety factor (SANCO 3268/2001 rev. 4), a low aquatic risk was indicated for parent and metabolites, M01, M02, M05, M13 and M014, detected in lysimeter leachate. However, metabolites, M10, M11 and M12, gave TERs < Annex VI threshold using the surrogate parent endpoint, requiring further consideration.
It is considered that M10, M11 and M12 are not structurally related to fluopicolide and
do not contain the biological toxophore (see pt. 5.12 below). They are derived from M02, and are structurally related to, M05 and for these metabolites N. pelliculosa is >100x less sensitive than fluopicolide, therefore the toxicity profile of M10, M11 and M12 will likely be closer to M02/M05 than parent and a risk assessment based these endpoints (with a 10x safety factor) would indicate low risk. Furthermore, theoretical FOCUS estimations predict lower GW contamination than that detected in lysimeter leachate by these metabolites in all scenarios (see below).
The GW risk assessment (Table B.9.2.3) was conducted using PECs derived from
FOCUS groundwater modelling (DAR Tables B.8.259 & B.8.260) following proposed respective uses of EXP11074B and EXP 11120A on vine and potato at the proposed EU GAPs. A further aquatic risk assessment was undertaken (Table B.9.2.4) using refined PECgws derived from further environmental modelling (see Addendum 1, Section B.8.6.2).
Following EXP11074B use on vine (Tables B.9.2.3-4), PECgws for M02 and M14
from all modelled scenarios were <0.1µg/L and hence were not considered further. For parent, metabolites, M01, M05, M12 (PEARL) and M13, in scenarios where the PECgw >0.1µg/L, all TERs were > Annex VI threshold indicating low risk to aquatic organisms. In two scenarios M10 was the only metabolite with TERs (9.5 & 9.2) < Annex VI threshold (10) and in one scenario (Hamburg) metabolites M03, M10, M11 and M12 (PELMO) had respective TERs (7.6, 6.7, 7.5 & 8.4) < Annex VI threshold.
Following EXP11120A use on potato (Table B.9.2.3), PECgws for parent
(fluopicolide), M02, M03 and M14 from all scenarios were <0.1µg/L and hence were not considered further. For metabolites, M01, M05, M10-M13, in scenarios where the PECgw >0.1µg/L, all TERs were > Annex VI threshold indicating low risk to aquatic organisms. However, further PECgw modelling refinement (Table B.9.2.4) gave TERs <10 for M03 (PEARL - Hamburg), M10, M11, M12 & M13 in PEARL and PELMO GW modelling in Hamburg and Jokioinen scenarios based on one treatment regime per annum. From biennial treatment only TERs for M11 (PEARL and PELMO - Jokioinen) were < Annex VI threshold and following triennial treatment no TERs were < Annex VI threshold.
However, it should be noted that the risk is assessed presuming aquatic organisms will
be exposed at the groundwater PECs, whereas it is reasonable to assume that at least a 10x dilution would likely occur (SANCO 3268/2001). For vine application a correction for 60% canopy interception would also have further reduced potential exposure (see DAR B.8.2.3.3). It should also be noted that M10 and M11 are chemically structurally related to M05 and M11 is purported to be an isomer of M12
Fluopicolide - Addendum 1 November 2007
161
(Appendix 2), hence these metabolites would likely exhibit similar aquatic toxicity, i.e. approximately 300x less toxicity than parent. M03 is structurally closely related to parent (Appendix 2) and was not seen in lysimeter leachate and only detected in two PECgw scenarios; it is unstable in water at most environmental pH and therefore negligible exposure via groundwater is expected.
Therefore, overall the weight of evidence indicates a low risk to aquatic organisms
from predicted exposure to fluopicolide and principal metabolites occurring in groundwater following proposed uses of EXP 11074B and EXP 11120A on vine and potato.
Evaluation Table Open pt. 5.12
'RMS to present the complete assessment for the relevance of ground water metabolites in and addendum. Special attention should be paid to the fact that at this stage for metabolites M01, M05 and M10 the threshold of 0.75 μg/L is also exceeded either in the lysimeter or the FOCUS modelling.'
(See also Section B.6.1.4.1, Addendum 1 (Nov 2007) for full Relevance Assessment of
Groundwater Metabolites).
5.12 RMS response: Environmental relevance of GW metabolites Formation of metabolites Fluopicolide is a pyridinyl-benzamide fungicide (see Appendix 2). In soil the
proposed fluopicolide degradation is initiated via cleavage at the amide bridge to a pyridinyl (M02) and a benzyl (M01) derivative after formation of transient hydroxylated fluopicolide intermediate (M03). M01 is relatively stable before undergoing mineralization but M02 undergoes further transformation. M02 can be sulphated by substitution of the chlorine group at the 3' position on the pyridine ring forming M05 and M10. Further ring hydroxylation of M02, M05 and M10 can also occur forming M13, M11/M12 (isomers) and M14 derivatives (Appendix 2). Parent and metabolites, M01, M02, M05, M10, M11, M12, M13 and M14, were identified in lysimeter leachate at an annual average >0.1μg/L (Table B.9.2.2) whereas parent and metabolites, M01, M03 (2 scenarios only), M05, M10, M11, M12 and M13, were predicted to occur at an annual average >0.1μg/L in some groundwater scenarios by FOCUS modelling (Table B.9.2.3); hence consideration of overall environmental relevance is required (SANCO 221/2000 rev.10).
Biological activity Initial efficacy active substance screening and numerous tests on vegetative vigour and
seedling emergence indicated that fluopicolide has no significant herbicidal activity (see DAR B.9.9.1.1). In laboratory screening (see DAR B.9.9.4) fluopicolide also did not exhibit insecticidal activity. Furthermore, in screens on 5 soil fungal species of different classes fluopicolide fungicidal sensitivity was specific to only one species, Phytophora (oomycetes) [Lechelt-Kunze, 2003e-m]. In tests on fluopicolide-sensitive fungi, grape downy mildew (Plasmopara viticola) and potato late blight (Phytophthora
Fluopicolide - Addendum 1 November 2007
162
infestans), fluopicolide metabolites M01, M02, M05, M10, M14 and M15 were all shown to be <<50% active compared with parent [Lechelt-Kunze, 2003e-m, Latorse & Flahout, 2004]. The fact that M01and M02, benzyl and pyridinyl derivatives formed from fluopicolide cleavage at the amide bridge (and their derivatives M05, M10 and M14) all retain no fungicidal activity is strongly indicative that the fluopicolide biological activity toxophore comprises of the intact pyridinyl-benzamide molecule.
Untested GW pyridinyl metabolites M11 and M12 (isomers), tentatively identified as
hydroxylated derivatives of M10, and M13, a hydroxylated derivative of M02, are structurally similar and hence do not contain the toxophore and will not retain biological activity. M03 is a structurally-related transient hydroxylated-derivative of fluopicolide and is an unstable intermediate prior to cleavage of fluopicolide to M01 and M02. It is very unstable in water and at environmental pH will rapidly degrade to M01 and M02 and the RMS considers it inconceivable that significant exposure to M03 will occur via GW. Thus the RMS concludes that all metabolites theoretically occurring in GW >0.1µg/L will not retain or express biological activity of the parent, fluopicolide.
Other GW metabolite ecotoxicological testing
All GW metabolites were considered to be irrelevant in terms of mammalian risk (see
DAR B.6.1.4 and B.6.80, Addendum 1, B.6.1.4.1) and M01 was considered of low ecotoxicological risk to mammals (B.9.1, DAR B.9.3). M01 was formed in the hen metabolism study (DAR B.7.2.2) indicating that fluopicolide avian toxicity test encompass M01 effects, and, on a molar basis, M01 was not more acutely toxic to birds and low avian risk from M01 was also indicated (DAR B.9.1). In aquatic tests M01, M02 and M05 were at least 10x < toxic than fluopicolide which included the most sensitive species, N. Pelliculosa (DAR Table B.9.2.75). M10, M11, M12 and M13 are GW metabolites not tested on aquatic species, are structurally similar to M02 and M05, which were significantly less toxic than fluopicolide when tested on most sensitive fish and algae species (DAR Table B.9.2.75). Low aquatic risk was concluded for all fluopicolide GW metabolites (B.9.2.1.2, DAR B.9.2). Furthermore, M01, M02 and M03 were not more toxic to worms than fluopicolide and constituted less overall risk (DAR B.9.6). Folsomia, soil microbes, soil fungi and litter decomposition, non-target plants were not more sensitive to M01 than fluopicolide and hence low ecotoxicological terrestrial risk was indicated (DAR B.9.7-9). None of the GW metabolites is predicted to have bioconcentration/bioaccumulation potential. Thus overall fluopicolide metabolites were considered unlikely to express significant ecotoxicological activity and the RMS considers that the weight of evidence suggests that GW metabolites can be regarded as not ecotoxicologically relevant.
Conclusion From an ecotoxicological viewpoint, sufficient evidence is considered available to
support the contention that all metabolites identified in groundwater at an average annual concentration >0.1µg/L can be considered environmentally 'non-relevant'.
Fluopicolide - Addendum 1 November 2007
163
B.9.3 Non-target vertebrates - mammals (see B.9.1 above) B.9.4 Bees - no Open pts. to address. B.9.5 Non Target Arthropods One issue (Evaluation Table Open point 5.6) was raised pertinent to the risk to
NTAs from proposed uses of fluopicolide in potato and vine crops:
Evaluation table Open pt. 5.6 RMS to correct the list of endpoint with exact %-age effect on fecundity instead of
<50%. Note that highest conc. with effects <50% for A. rhopalosiphi was 2 L/ha.
5.6 RMS response For clarity the results from NTA fluopicolide data are re-presented in Table B.9.5.1
below.
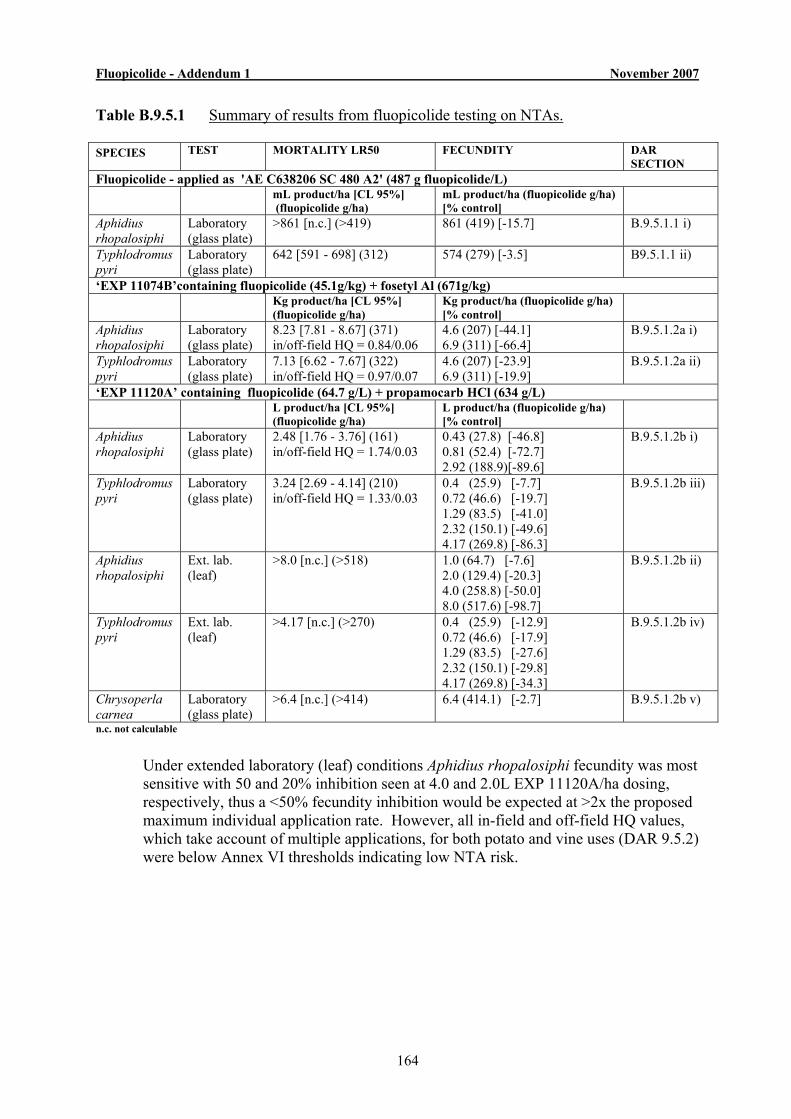
Fluopicolide - Addendum 1 November 2007
164
Table B.9.5.1 Summary of results from fluopicolide testing on NTAs. SPECIES TEST MORTALITY LR50 FECUNDITY DAR
SECTION Fluopicolide - applied as 'AE C638206 SC 480 A2' (487 g fluopicolide/L) mL product/ha [CL 95%]
(fluopicolide g/ha) mL product/ha (fluopicolide g/ha) [% control]
Aphidius rhopalosiphi
Laboratory (glass plate)
>861 [n.c.] (>419)
861 (419) [-15.7] B.9.5.1.1 i)
Typhlodromus pyri
Laboratory (glass plate)
642 [591 - 698] (312)
574 (279) [-3.5] B9.5.1.1 ii)
‘EXP 11074B’containing fluopicolide (45.1g/kg) + fosetyl Al (671g/kg) Kg product/ha [CL 95%]
(fluopicolide g/ha) Kg product/ha (fluopicolide g/ha) [% control]
Aphidius rhopalosiphi
Laboratory (glass plate)
8.23 [7.81 - 8.67] (371) in/off-field HQ = 0.84/0.06
4.6 (207) [-44.1] 6.9 (311) [-66.4]
B.9.5.1.2a i)
Typhlodromus pyri
Laboratory (glass plate)
7.13 [6.62 - 7.67] (322) in/off-field HQ = 0.97/0.07
4.6 (207) [-23.9] 6.9 (311) [-19.9]
B.9.5.1.2a ii)
‘EXP 11120A’ containing fluopicolide (64.7 g/L) + propamocarb HCl (634 g/L) L product/ha [CL 95%]
(fluopicolide g/ha) L product/ha (fluopicolide g/ha) [% control]
Aphidius rhopalosiphi
Laboratory (glass plate)
2.48 [1.76 - 3.76] (161) in/off-field HQ = 1.74/0.03
0.43 (27.8) [-46.8] 0.81 (52.4) [-72.7] 2.92 (188.9)[-89.6]
B.9.5.1.2b i)
Typhlodromus pyri
Laboratory (glass plate)
3.24 [2.69 - 4.14] (210) in/off-field HQ = 1.33/0.03
0.4 (25.9) [-7.7] 0.72 (46.6) [-19.7] 1.29 (83.5) [-41.0] 2.32 (150.1) [-49.6] 4.17 (269.8) [-86.3]
B.9.5.1.2b iii)
Aphidius rhopalosiphi
Ext. lab. (leaf)
>8.0 [n.c.] (>518) 1.0 (64.7) [-7.6] 2.0 (129.4) [-20.3] 4.0 (258.8) [-50.0] 8.0 (517.6) [-98.7]
B.9.5.1.2b ii)
Typhlodromus pyri
Ext. lab. (leaf)
>4.17 [n.c.] (>270)
0.4 (25.9) [-12.9] 0.72 (46.6) [-17.9] 1.29 (83.5) [-27.6] 2.32 (150.1) [-29.8] 4.17 (269.8) [-34.3]
B.9.5.1.2b iv)
Chrysoperla carnea
Laboratory (glass plate)
>6.4 [n.c.] (>414) 6.4 (414.1) [-2.7]
B.9.5.1.2b v)
n.c. not calculable
Under extended laboratory (leaf) conditions Aphidius rhopalosiphi fecundity was most
sensitive with 50 and 20% inhibition seen at 4.0 and 2.0L EXP 11120A/ha dosing, respectively, thus a <50% fecundity inhibition would be expected at >2x the proposed maximum individual application rate. However, all in-field and off-field HQ values, which take account of multiple applications, for both potato and vine uses (DAR 9.5.2) were below Annex VI thresholds indicating low NTA risk.

Fluopicolide - Addendum 1 November 2007
165
B.9.6-8 Effects on soil organisms Four issues (Evaluation Table Open points 5.7, 5.8, 5.9, 5.10) were raised pertinent
to the risk to soil organisms from proposed uses of fluopicolide in potato and vine crops.
B.9.6 Earthworm
Evaluation Table Open pt. 5.7 'RMS to update the list of endpoints for earthworms. It is still not clear if the values for the formulation are based on a.s. or formulation concentrations. Furthermore, values should be given as mg/kg DS.'
5.7 RMS response:
For clarity, the revised earthworm endpoints and risk assessment are presented in Table B.9.6.1 (DAR B.9.6.3.1 and B.9.6.3.2).
Table B.9.6.1 Summary of acute and chronic toxicity end points, PECsoil values and TERs for
earthworms from EXP 11074B use on vine APPLICATION Test Substance
Toxic end point mg/kg DS (corrected)
Max. PECsoil (mg/kg DS)
Toxicity exposure
ratio
Annex VI threshold
EXP 11074B on vine
Acute 14dLC50 TERa Fluopicolide (log Pow = 2.9) >1000 (>5002) 0.2681 >1866 10 M-01 (log Pow = 0.51) 750 0.0431 17442 10 M-02 (logPow = -2.0 ) >1000 0.0261 >19230 10 M-03 (logPow = 2.34) >1000 (>5002) 0.0171 >29412 10 EXP 11074B (fluopicolide) >43.5 (>21.752) 0.2681 >81.1 Chronic 28/56dNOEC TERlt Fluopicolide 62.53,5 0.2681 233 5 M-01 2504 0.0461 5435 5 EXP 11074B (fluopicolide)
2.4355 0.2681 9.1 5
EXP 11120A on potato
Acute 14dLC50 TERa Fluopicolide (log Pow = 2.9) >1000 (>5002) 0.20161 >2480 10 M-01 (log Pow = 0.51) 750 0.01741 43103 10 M-02 (logPow = -2.0 ) >1000 0.0191 >26316 10 M-03 (logPow = 2.34) >1000 (>5002) 0.0131 >38462 10 EXP 11120A (fluopicolide) >57.3 (>28.652) 0.20161 >142 10 Chronic 28/56dNOEC TERlt Fluopicolide 62.53,5 0.20161 233 5 M-01 2504 0.01741 5435 5 EXP 11120A (fluopicolide)
2.5875 0.20161 12.8 5
DS = dry soil 1 peak accumulated 5cm depth (see DAR Table B.8.198) 2 value reduced by a factor of 2 (logKow>2/10% soil OM) 3 based on growth (28d) 4 based on reproduction 5 conducted in 5% soil OM (correction not required)
Fluopicolide - Addendum 1 November 2007
166
For Table B.9.6.1 correction (x0.5) was required for fluopicolide, M03 and product acute endpoints as log Pow > 2 and 10% soil OM was used, in chronic studies 5% soil OM was used and no correction was required. Revised TERs indicate low acute and chronic risk to earthworms from fluopicolide and principal soil metabolites, M01, M02 and M03, following application of EXP 11074B and EXP 11120A to vine and potato.
B.9.7 Other soil non-target macro-organisms
Evaluation Table Open pts. 5.8 & 5.9 'Pending on the discussion on the PECsoil in the section on Fate and behaviour, a
revision of the risk assessment for soil organisms might be necessary.' (Reporting Table comment at 5(45) and 5(47)
5.8 & 5.9 RMS response: RMS will address, as appropriate, if evaluation/discussion of Applicant's response by
Environmental Fate results in PECsoil amendment. B.9.8 Non-target soil microorganisms
Evaluation Table Open pt. 5.10 'RMS to include the argumentation for why no studies with soil micro-organisms are
required with M 03 in an addendum for the sake of completeness. No discussion in an expert meeting is required.'
5.10 RMS response:
OECD 216/217 guidance for soil microbial activity recommends tests to be undertaken at soil pH 5.5 - 7.5. At these pHs M03 has a DT50 <1.0d and in acidic soils pH5.0 - 5.5 M03 has a DT50 of <5d (DAR B.8.1.8). Therefore rapid decay would be expected in these soils and any resulting toxicity mostly expressed via M01 and M02 derivatives of M03. Furthermore, it is likely that soil microorganisms could be exposed transiently to M03 in fluopicolide and product soil microorganism studies which were all conducted at soil pH5.4 - 5.9 over 28d where no effects were reported at up to 10x proposed application rate (DAR B.9.8.1). M03 has a very similar chemical structure to fluopicolide (Appendix 2) and significantly increased toxicity would not be anticipated. Moreover, no effects of M03 on earthworm at 1000 mg/kg DS (pH 5.7-6.0) over 14d were reported and TERs for acute (14d) and long term fluopicolide effects > Annex VI (soil pH 6 -7) over 56d, where some transient M03 formation may be expected. Fluopicolide also did not affect straw litter bag decomposition in soil (pH 6.72) over 184d again where some transient exposure to M03 might be assumed. Where tested M01 and M02, both M03 soil degradation products, also had no significant impact on soil organisms and processes. Therefore overall the RMS considered that there was sufficient weight of evidence to suggest that M03 would not have a significant effect on soil organisms and processes in the absence of a specific soil microbial M03 study.
Fluopicolide - Addendum 1 November 2007
167
B.9.9 Non-target flora One issue (Evaluation Table Open point 5.11) was raised pertinent to the risk to off-
field non-target plants from proposed uses of fluopicolide in potato and vine crops:
Evaluation Table Open pt. 5.11 'RMS to include the argumentation regarding risk to non-target plants from exposure
to M 01 in an addendum for the sake of completeness. No discussion in an expert meeting is required.'
5.11 RMS response:
For non-target plants off-field risk is only considered and contamination will result primarily from spray drift. M01 is a soil metabolite and not present in spray applications. Hence, pre-emergent effects on non-target plants following M01 formation in off-field soil contaminated with fluopicolide by spray drift are most relevant.
The pre-emergent M01 non-target plant study revealed no effects >50% on seedling germination and growth at rates ≤ 0.0121 mg/kg soil and an ER50 of >0.0121 mg M01/kg DS (5 cm) was established. From theoretical in-field PECsoils (Table B.8.198) for fluopicolide and M01 and spray drift values (6.9% for vine; 1.9% for potato), max. M01 off-field PECsoils of 0.00196 and 0.00039 mg/kg (5cm) can be derived for vine and potato use, respectively. Thus TERs of >6 and >31 can be established for M01 off-field pre-emergent effects on non-target plants indicating low risk. This is considered to be a worse case scenario as the ER50 is > highest dose tested and no off-field interception of spray drift deposition is assumed.
B.9.13 Additional References Relied On:
Annex Point/
Location in DossierAuthor(s) Year Title
Source (where different from company) Company name, Report No., Date, GLP status (where relevant), published or not
Data protect. claimed
Owner
Doc Kb Position Papers
Radix,P; Payraudeau, V.
2006 Fluopicolide (AE C638206) - Position paper regarding the endpoint used for the ecotoxicological long term risk assessment for mammals Bayer CropScience AG, Edition No.: M-268483-01-1, Date: 2006-03-23 Non GLP, unpublished
Yes BCS

Fluopicolide - Addendum 1 November 2007
168
B.9 ECOTOXICOLOGY - CORRIGENDUM Please note the following correction to the original DAR:
i) Tables B.9.2.60 and B.9.2.63 need amendment (2nd a.s. is propamocarbHCl not fosetyl-Al as reported)
ii) Tables B.9.5.1-4; B.9.9.3-4. 'SC 40' should be 'SC480' iii) B.9.2.2.1 S phrases (and Vol 1) should be amended to 'S60 This material and its
container must be disposed of as hazardous waste' and 'S61 Avoid release to the environment. Refer to special instructions/safety data sheets'
Justification 'Recommended for substances that may cause effects in the environment'.
iv) Tables B.9.5.10, 9.5.12 'kg/ha' should be 'L/ha' v) B.9.5.1.2b iii) 2nd para '2.04-10.35 kg/ha' should be '0.4-4.7 L/ha) vi) B.9.7.3.2/9.8.3.2 '10cm' should be '5 and 10cm' vii) B.9.7.3.1/9.8.3.1 '10cm' should be '5cm' viii) Table B.9.9.15 M01 '0.046' should be '0.043'. ix) Table B.9.2.77 Heading 'AE F05361606 WG71 A1' should be 'EXP 11074B'
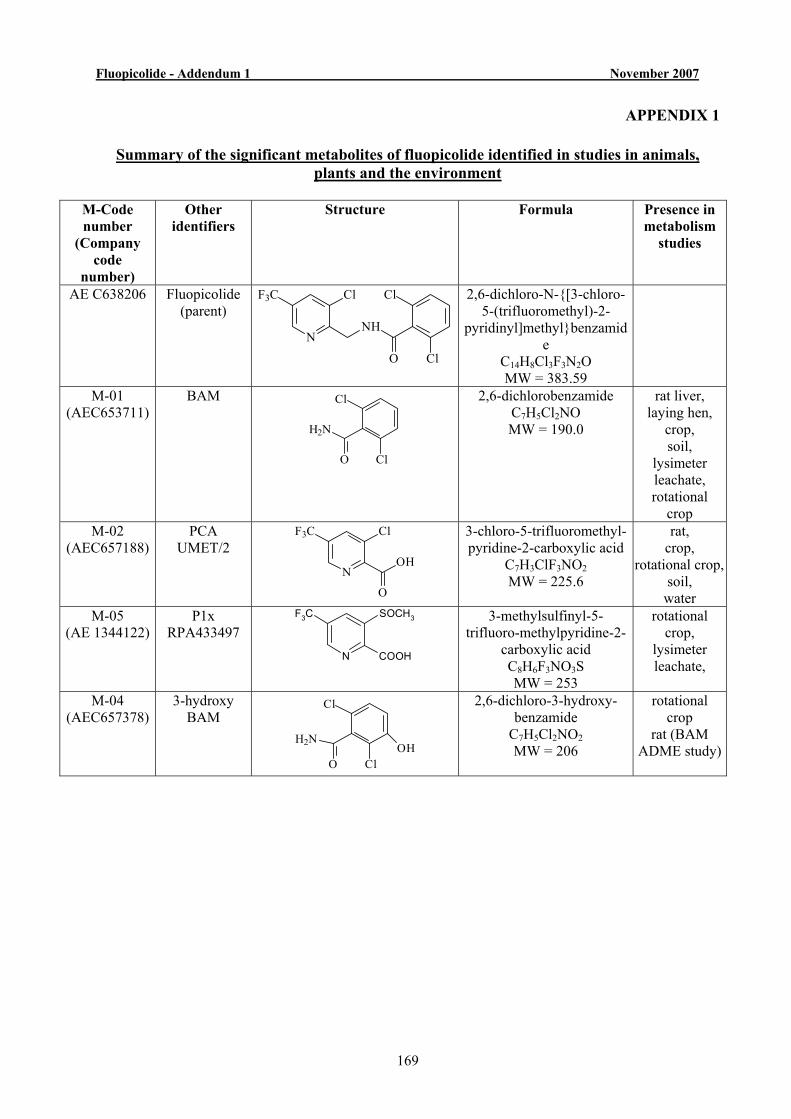
Fluopicolide - Addendum 1 November 2007
169
APPENDIX 1
Summary of the significant metabolites of fluopicolide identified in studies in animals, plants and the environment
M-Code number
(Company code
number)
Other identifiers
Structure Formula Presence in metabolism
studies
AE C638206 Fluopicolide (parent)
N
F3C Cl
NH
O
Cl
Cl
2,6-dichloro-N-{[3-chloro-5-(trifluoromethyl)-2-
pyridinyl]methyl}benzamide
C14H8Cl3F3N2O MW = 383.59
M-01 (AEC653711)
BAM
Cl
Cl
H2N
O
2,6-dichlorobenzamide C7H5Cl2NO MW = 190.0
rat liver, laying hen,
crop, soil,
lysimeter leachate, rotational
crop M-02
(AEC657188) PCA
UMET/2 N
F3C Cl
OH
O
3-chloro-5-trifluoromethyl-pyridine-2-carboxylic acid
C7H3ClF3NO2 MW = 225.6
rat, crop,
rotational crop, soil,
water M-05
(AE 1344122) P1x
RPA433497 N
F3C SOCH3
COOH
3-methylsulfinyl-5-trifluoro-methylpyridine-2-
carboxylic acid C8H6F3NO3S MW = 253
rotational crop,
lysimeter leachate,
M-04 (AEC657378)
3-hydroxy BAM
Cl
Cl
H2N
OOH
2,6-dichloro-3-hydroxy-benzamide
C7H5Cl2NO2 MW = 206
rotational crop
rat (BAM ADME study)

Fluopicolide - Addendum 1 November 2007
170
List of metabolites continued Company code
number Other
identifiers Structure Formula Presence in
metabolism studies
M-06 (AEC643890)
3-OH 206 MET IV
MET.F/16 FMET/38 UMET/51 FMET/8
UMET/44 UMET/53 FMET/33
N
F3C Cl
NH
O Cl
Cl
OH
2,6-dichloro-N-[(3-chloro-5-trifluoromethylpyridin-2-
yl) methyl]-3-hydroxybenzamide
C14H8Cl3F3N2O2 MW = 399
laying hen, lactating cow
crop, confined rotational
crop, rat
M-07 (AE 0712556)
4-OH 206 UMET/54 UMET/26 N
F3C Cl
NH
O Cl
Cl OH
2,6-dichloro-N-[(3-chloro-5-trifluoromethylpyridin-2-
yl) methyl]-4-hydroxybenzamide
C14H8Cl3F3N2O2 MW = 399
laying hen, lactating cow
rat
M-08 (AEC653598)
N
F3C Cl
NH2
O
3-chloro-5-trifluoromethyl pyridine-2-carboxamide
C7H4ClF3N2O MW = 224.57
confined rotational
crop
M-09 (AE B102859)
N OH
ClF3C
3-chloro-2-hydroxy-5-trifluoromethylpyridine
C6H3ClF3NO MW = 197.54
confined rotational
crop
M-03 (AE060800)
RPA427967
N
F3C Cl
OH
NH
O
Cl
Cl
4-N-[3-chloro-5-trifluoro-methylpyridin-2-yl)
(hydroxyl)methyl]-2,6-dichlorobenzamide
C14H8Cl3F3N2O2
MW = 399.58
soil
M-10 (AE 1344123)
P4 RPA433965
N
F3C SO3H
COOH
3-sulfo-5-trifluoromethyl pyridine-2-carboxylic acid
C7H4F3NO5S MW = 271.17
lysimeter leachate,
soil (PCA soil degradation
study)
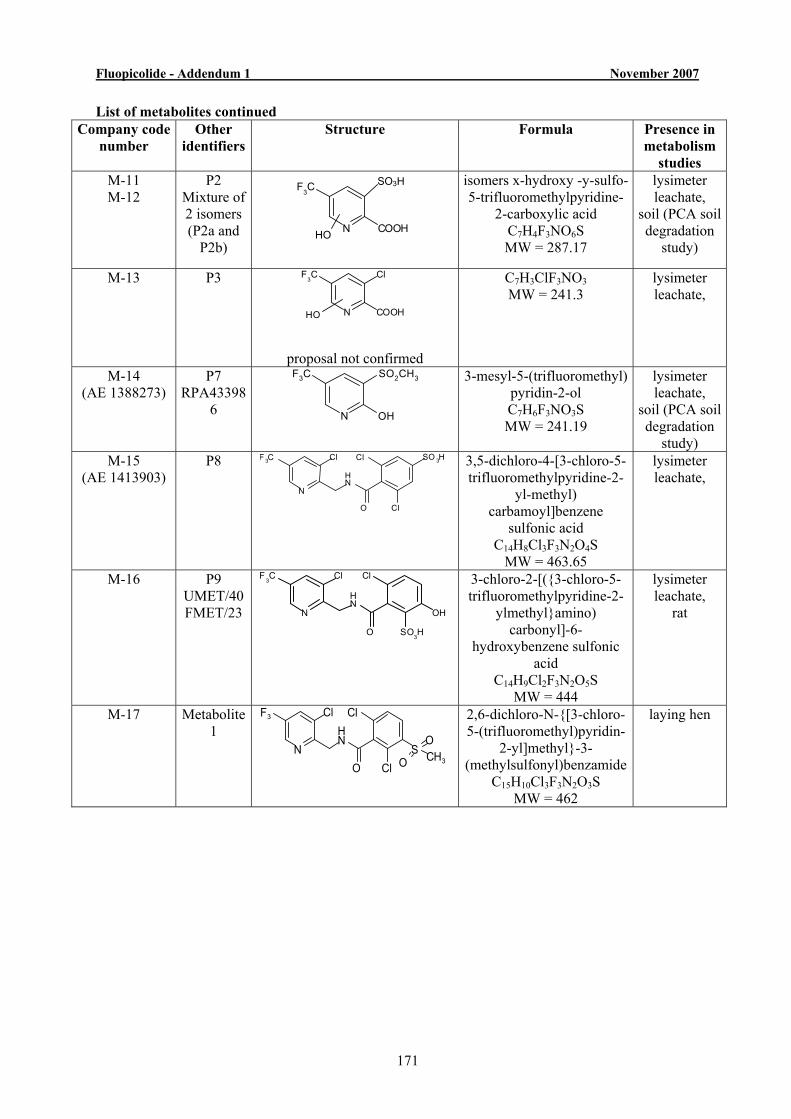
Fluopicolide - Addendum 1 November 2007
171
List of metabolites continued Company code
number Other
identifiers Structure Formula Presence in
metabolism studies
M-11 M-12
P2 Mixture of 2 isomers (P2a and
P2b)
N
F 3 C
COOHOH
SO3H
isomers x-hydroxy -y-sulfo-5-trifluoromethylpyridine-
2-carboxylic acid C7H4F3NO6S MW = 287.17
lysimeter leachate,
soil (PCA soil degradation
study)
M-13 P3
N
F3C Cl
COOHOH
proposal not confirmed
C7H3ClF3NO3 MW = 241.3
lysimeter leachate,
M-14 (AE 1388273)
P7 RPA43398
6
F3C SO2CH3
N OH
3-mesyl-5-(trifluoromethyl) pyridin-2-ol C7H6F3NO3S MW = 241.19
lysimeter leachate,
soil (PCA soil degradation
study) M-15
(AE 1413903) P8
N
Cl
NH
O
Cl
Cl
F 3C SO 3H
3,5-dichloro-4-[3-chloro-5-trifluoromethylpyridine-2-
yl-methyl) carbamoyl]benzene
sulfonic acid C14H8Cl3F3N2O4S
MW = 463.65
lysimeter leachate,
M-16 P9 UMET/40 FMET/23 N
Cl
NH
O
ClF3C
SO3H
OH
3-chloro-2-[({3-chloro-5-trifluoromethylpyridine-2-
ylmethyl}amino) carbonyl]-6-
hydroxybenzene sulfonic acid
C14H9Cl2F3N2O5S MW = 444
lysimeter leachate,
rat
M-17 Metabolite 1
N
F3 Cl
NH
Cl
Cl
O
O
OS CH3
2,6-dichloro-N-{[3-chloro-5-(trifluoromethyl)pyridin-
2-yl]methyl}-3-(methylsulfonyl)benzamide
C15H10Cl3F3N2O3S MW = 462
laying hen

Fluopicolide - Addendum 1 November 2007
172
List of metabolites continued Company
code number
Other identifiers
Structure Formula Presence in metabolism
studies M-18 HS
(hydroxy sulphate of
fluopicolide) UMET/45 UMET/47
N
F3C Cl ClHN
O ClOSO3H
or
N
F3C Cl ClHN
O Cl
OSO3H
2,4-dichloro-3-[({[3-chloro-5-(trifluoromethyl)pyridin-
2-yl]methyl}amino)carbonyl]
phenyl hydrogen sulfate or
3,5-dichloro-4-[({[3-chloro-5-(trifluoromethyl)pyridin-
2-yl]methyl}amino)carbonyl]
phenyl hydrogen sulfate C14H7Cl3F3N2O5S
MW = 477
laying hen lactating cow
rat
M-19 DHS (dihydroxy sulphate of
fluopicolide) UMET/23 UMET/39 UMET/46 UMET/49
N
F3C Cl ClHN
O Cl
OH
OSO3H
3,5-dichloro-4-[({[3-chloro-5-(trifluoromethyl)pyridin-
2-yl]methyl}amino)carbonyl] hydroxyphenyl hydrogen
sulfate C14H7Cl3F3N2O6S
MW = 493
laying hen lactating cow
rat

Fluopicolide - Addendum 1 November 2007
173
APPENDIX 2 Fluopicolide soil degradation pathway proposed by Applicant
fluopicolide MOO
MO3
MO2
M13
MO5M1O
M11/M12 M14
MO1
N
F3C Cl
NH
O Cl
Cl
N
F3C Cl
NH
OH O Cl
Cl
H2N
O Cl
Cl
N
F3C Cl
COOH
N
F3C Cl
COOH
HO
N
F3C
COOH
SO3H
HO
N
F3C
COOH
SO3H
N
F3C
COOH
SO2CH3
N
F3C
COOH
SH
N
F3C SO2CH3
OH
Fluopicolide - Addendum 1 November 2007
174
APPENDIX 3 [NB. Section B.10 is the UK Efficacy assessment which is not included in the EU DAR. The following section relates to the biologically activity assessment and is presented for completeness in response to the Reporting Table point 2(25). It has not been updated, therefore for a full assessment of the relevance of groundwater metabolites - please see Section B.6.1.4.1, Addendum 1 (November 2007)]. B.10.7.5 Effects of Metabolites in Ground Water The applicant identified the potential metabolites in groundwater as M-01, M-02, M05,
M10, M14 and M-15. Evidence had been provided from the initial screening data to indicate that fluopicolide has no significant insecticidal or herbicidal activity (B10.7.1). The applicant therefore tested these metabolites for fungicidal activity only. Reference was made to fate and behaviour metabolite studies submitted under Annex II.
(Latorse & Flahaut 2004)
In vitro tests for powdery mildew and late blight showed no activity for any of these metabolites tested at 100 mg/l (equivalent to 100 g/ha). This included a range of doses for the major metabolite, AE C653711. These results were summarised further in a position paper on the non-relevance of metabolites found in lysimeter leachate and field leaching studies. The paper argued that the data from the biological screens indicated that both the pyridine and phenyl rings of the molecule are required for fungicidal activity. Any metabolites without both these rings would be predicted to have no fungicidal activity. It was also noted that functional groups, especially polar ones to the phenyl ring causes loss of fungicidal activity.
(Leake & Payraudeau 2004a) The position paper also summarised further studies with M-01 against five species of fungi. These showed M-01 gave no inhibition of growth at rates between 0.3 and 30 mg/kg dry soil.
(Lechelt –Kunze 2003k, 2003f, 2003m) Further supporting evidence of the lack of activity of AE C653711 was referenced from a Tier II seedling emergence and vigour study showing no effects on ten different non-target plants.
(Pallett & Gosch, 2004) Further evidence of lack of insecticidal activity was provided in the Ecotoxicology studies with no effect against Collembola.
(Klein & Luhrs 2003a)
Fluopicolide - Addendum 1 November 2007
175
Assessment Various biological screening data confirmed that neither fluopicolide nor its metabolites have herbicidal or insecticidal activity. Metabolites were therefore investigated for any fungicidal effects, and the studies indicate that none of those tested had any significant biological activity. The rapporteur differed in their assessment of which metabolites have the potential to occur in groundwater above the 0.1 µg/L level, specifying M-01, M-05 and M-10 to M-14 (see B8.6.2). Of these only M11 and M12 (mixture of 2 isomers) and M13 were not tested for fungicidal activity. These three are all single pyridine ring structures and are unlikely to have any significant fungicidal activity.
Fluopicolide - Addendum 1 November 2007
176
APPENDIX 4
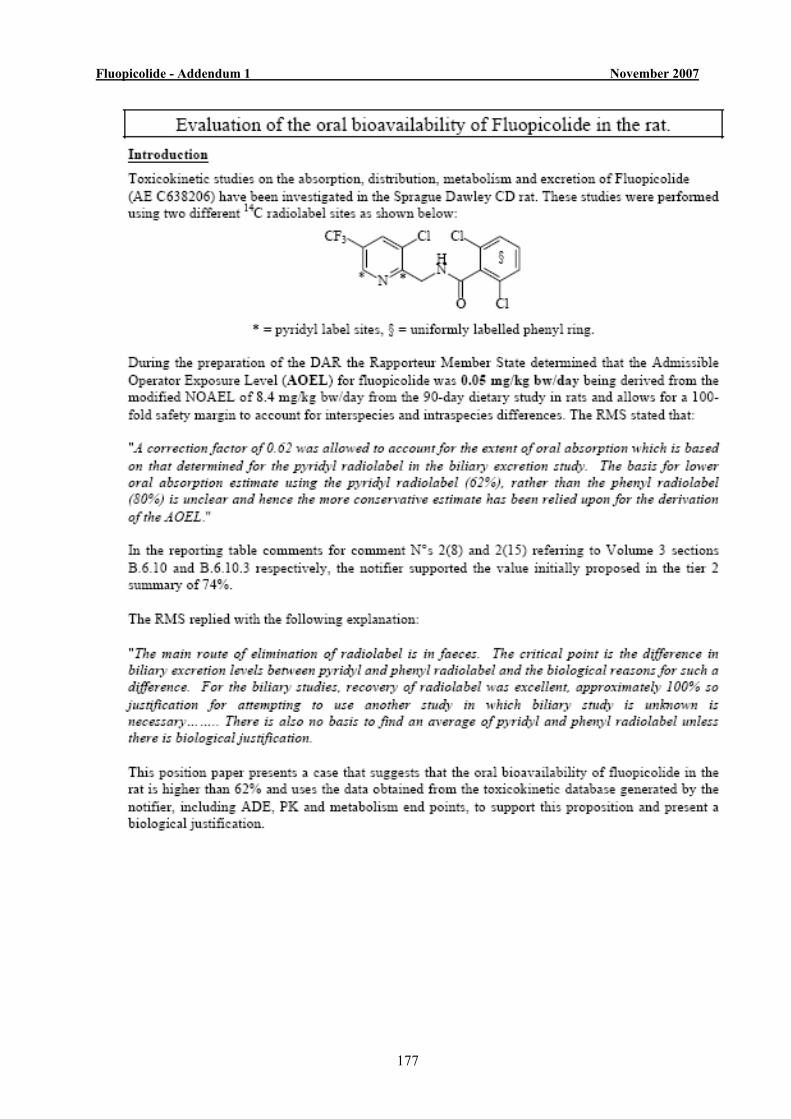
Fluopicolide - Addendum 1 November 2007
177
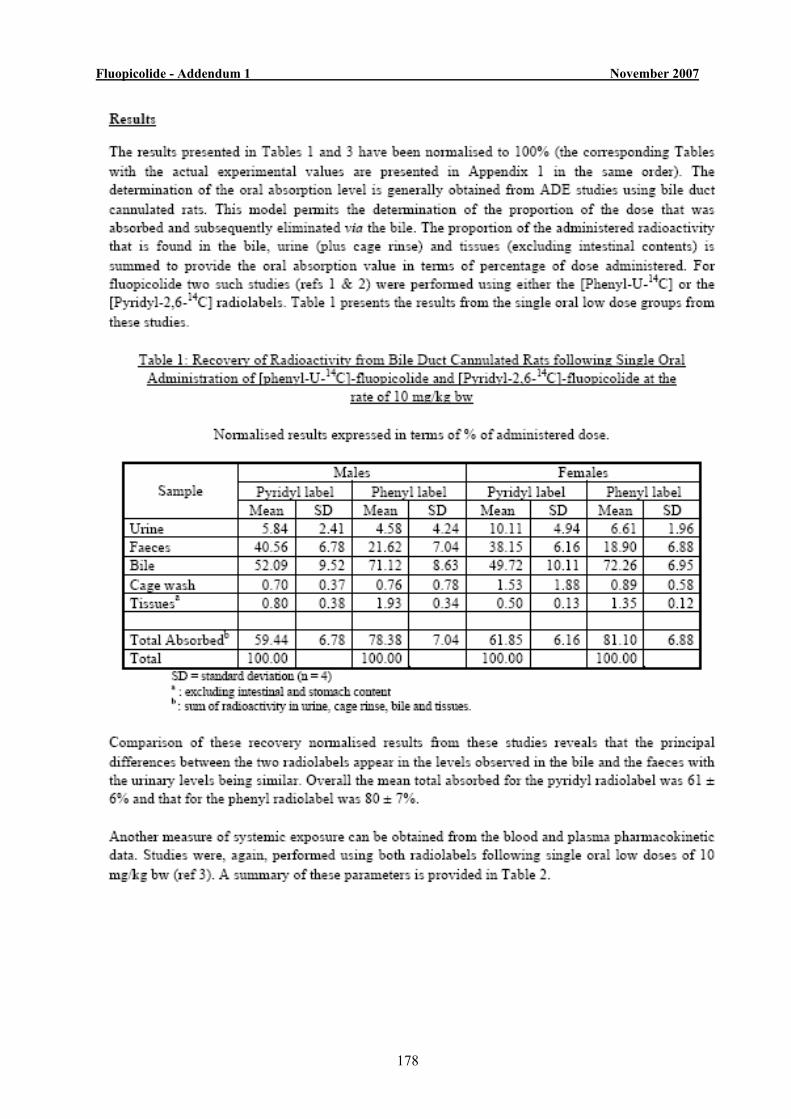
Fluopicolide - Addendum 1 November 2007
178
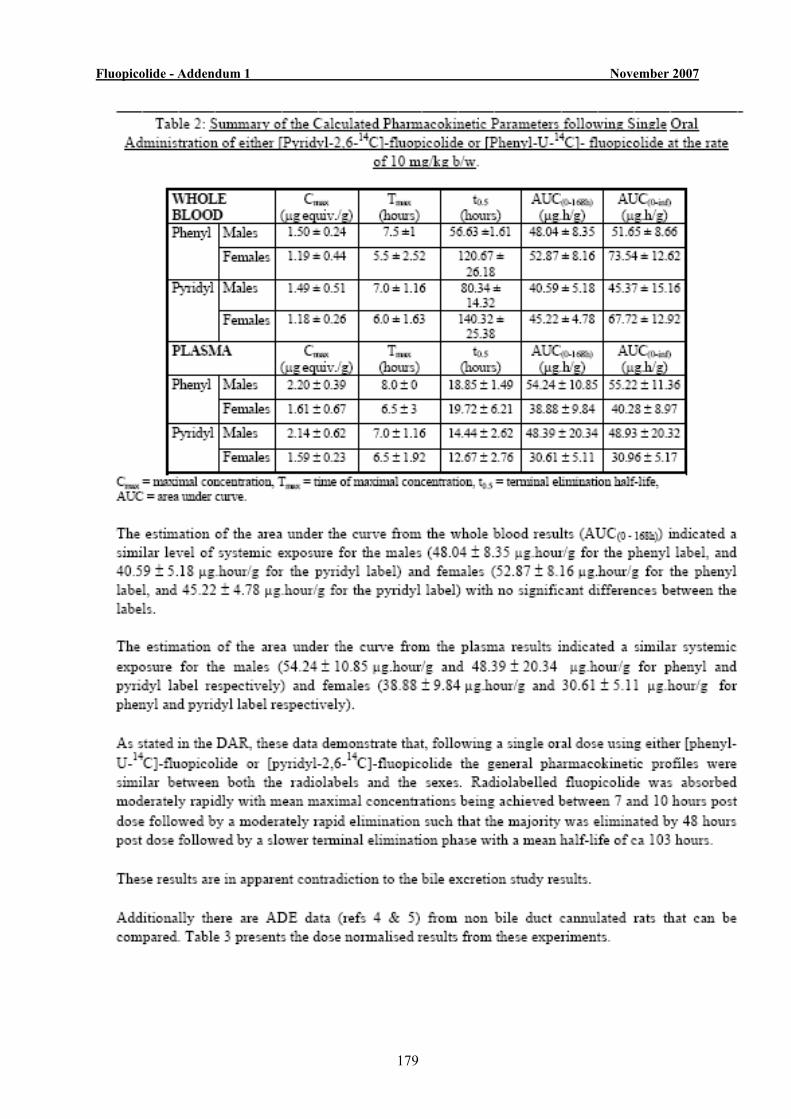
Fluopicolide - Addendum 1 November 2007
179
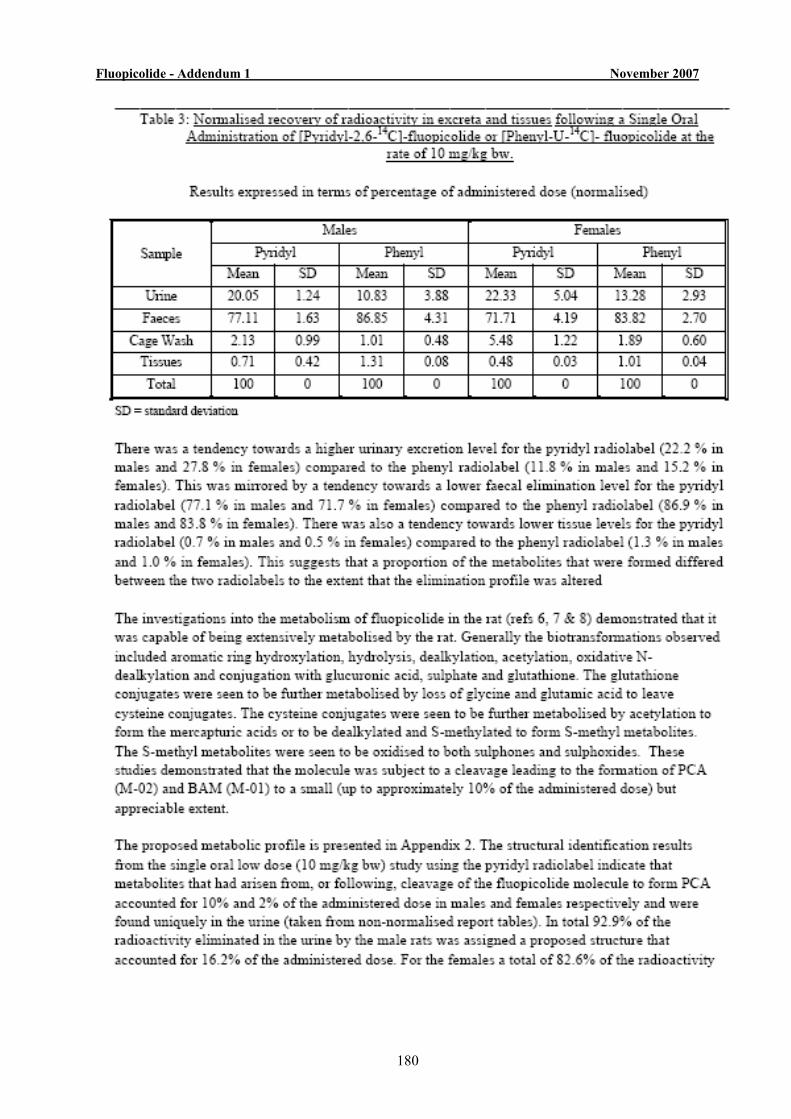
Fluopicolide - Addendum 1 November 2007
180
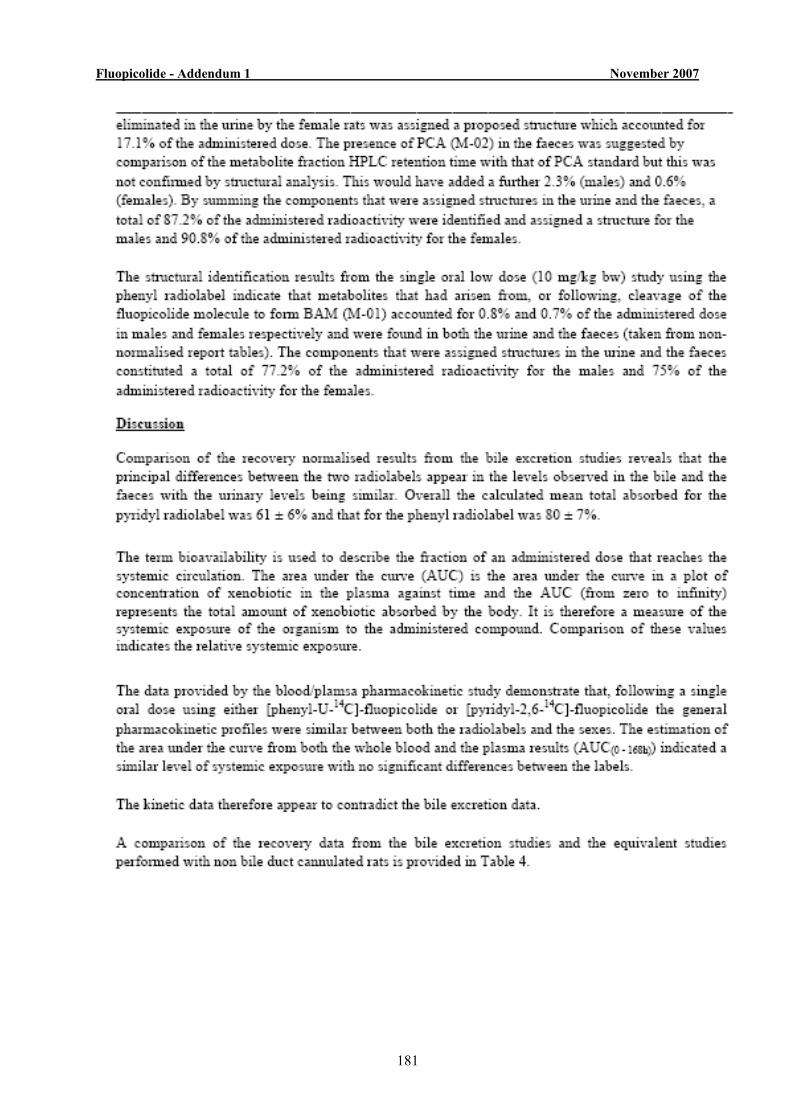
Fluopicolide - Addendum 1 November 2007
181
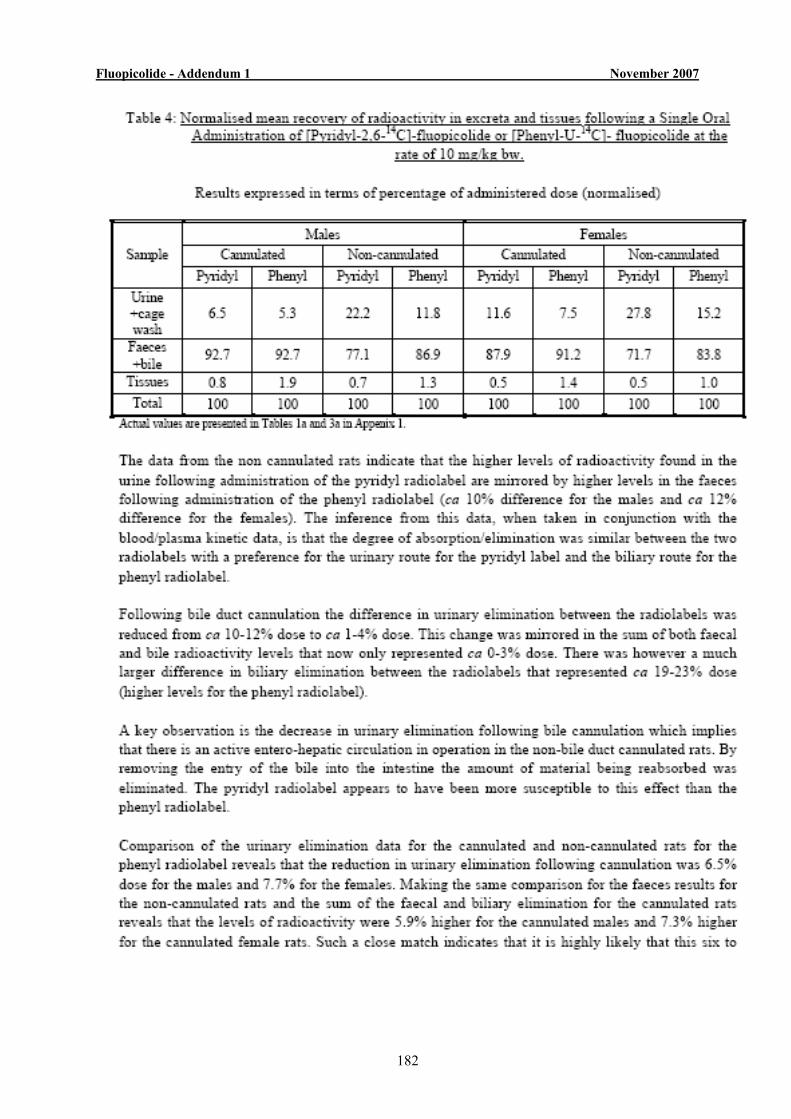
Fluopicolide - Addendum 1 November 2007
182
Fluopicolide - Addendum 1 November 2007
183
Fluopicolide - Addendum 1 November 2007
184
Fluopicolide - Addendum 1 November 2007
185
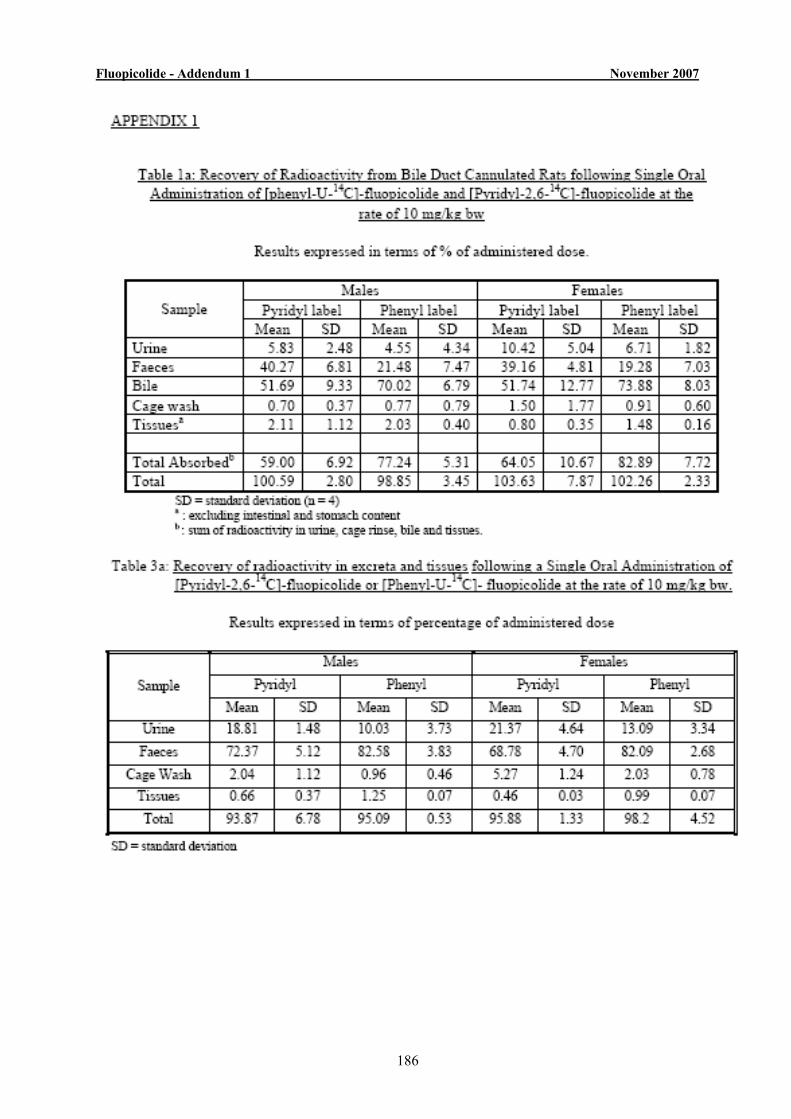
Fluopicolide - Addendum 1 November 2007
186
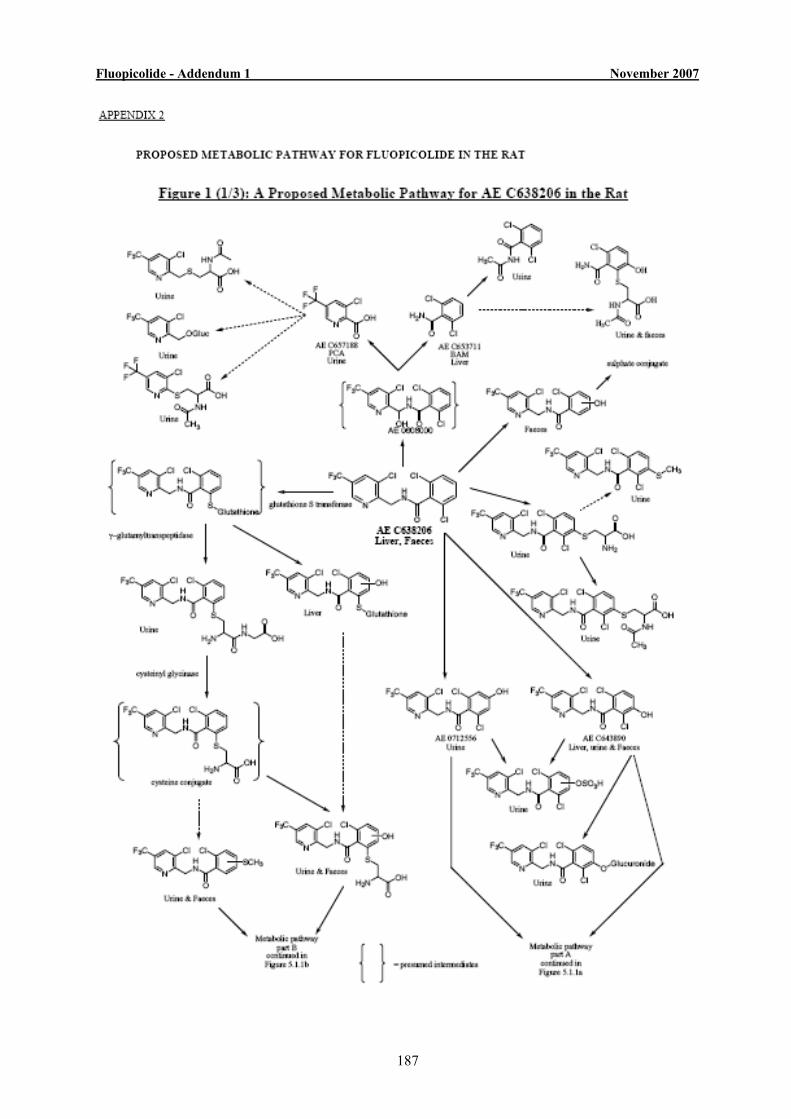
Fluopicolide - Addendum 1 November 2007
187
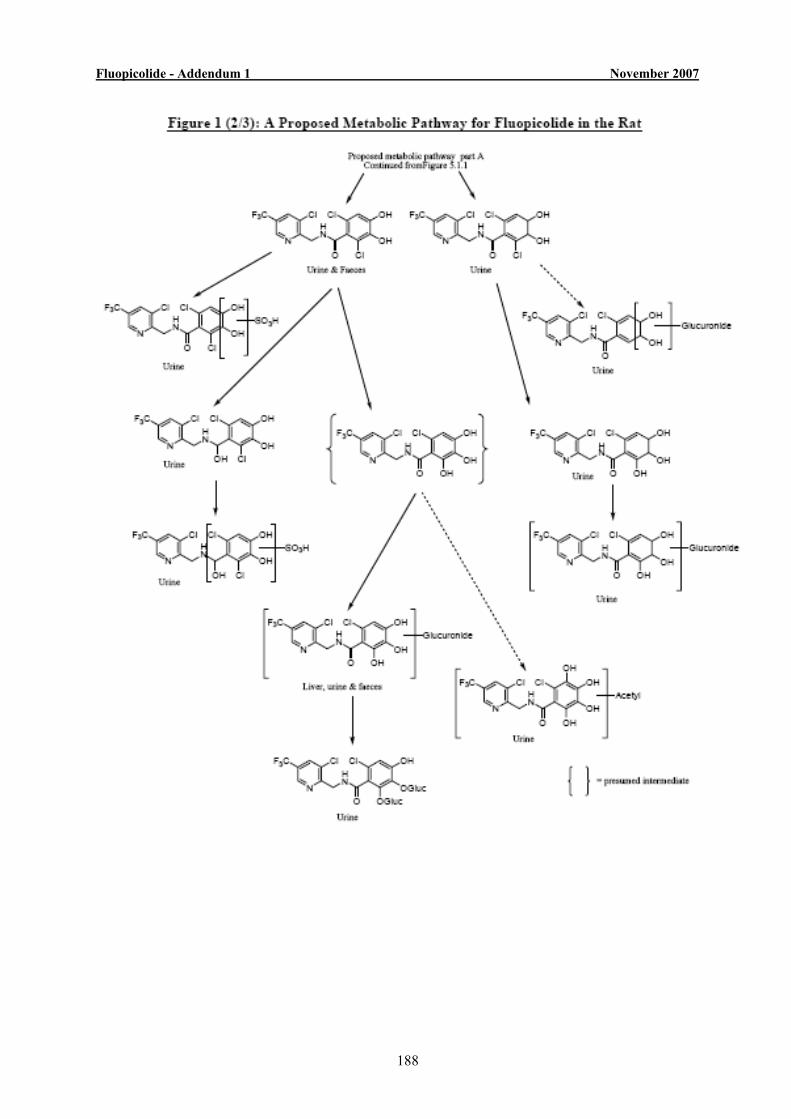
Fluopicolide - Addendum 1 November 2007
188
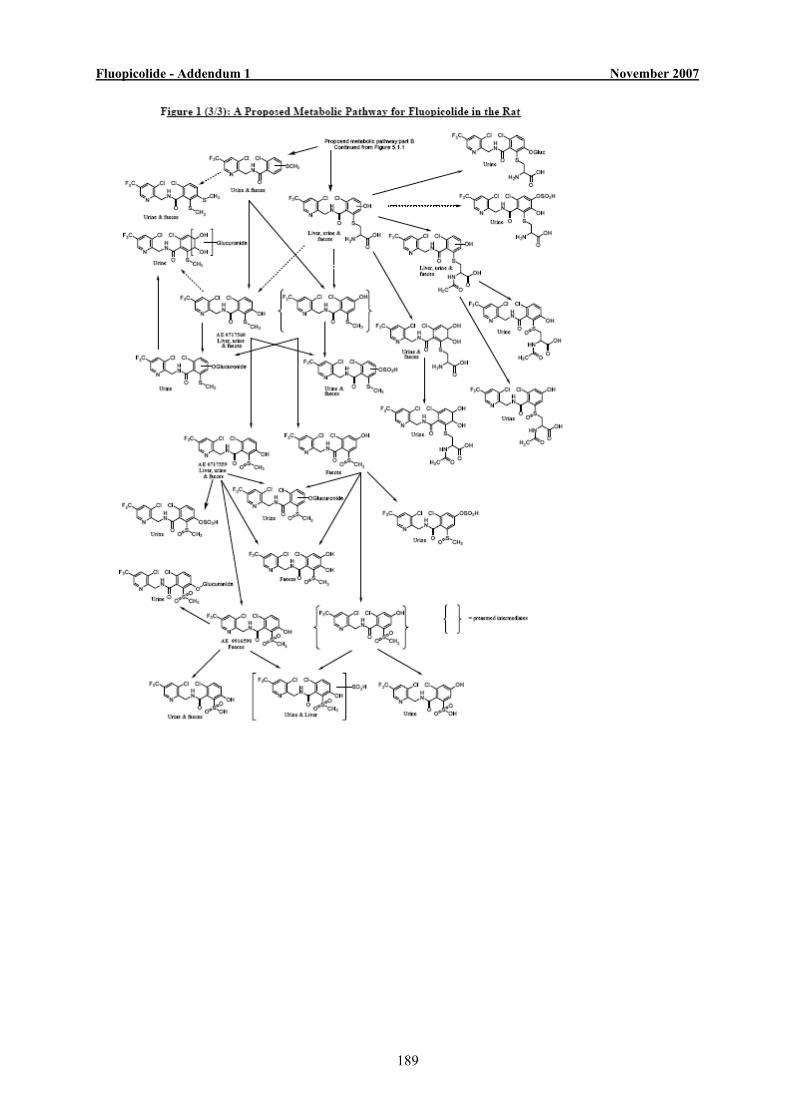
Fluopicolide - Addendum 1 November 2007
189
Fluopicolide - Addendum 1 November 2007
190
APPENDIX 5
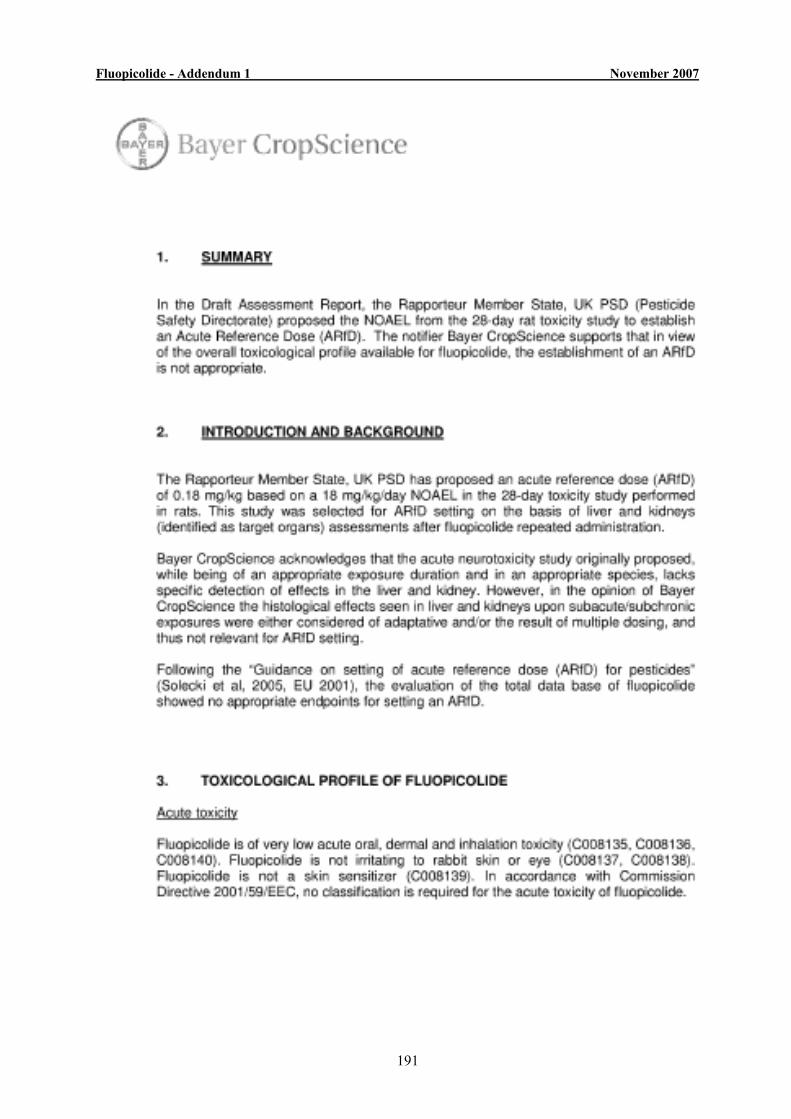
Fluopicolide - Addendum 1 November 2007
191
Fluopicolide - Addendum 1 November 2007
192
Fluopicolide - Addendum 1 November 2007
193
Fluopicolide - Addendum 1 November 2007
194
Fluopicolide - Addendum 1 November 2007
195
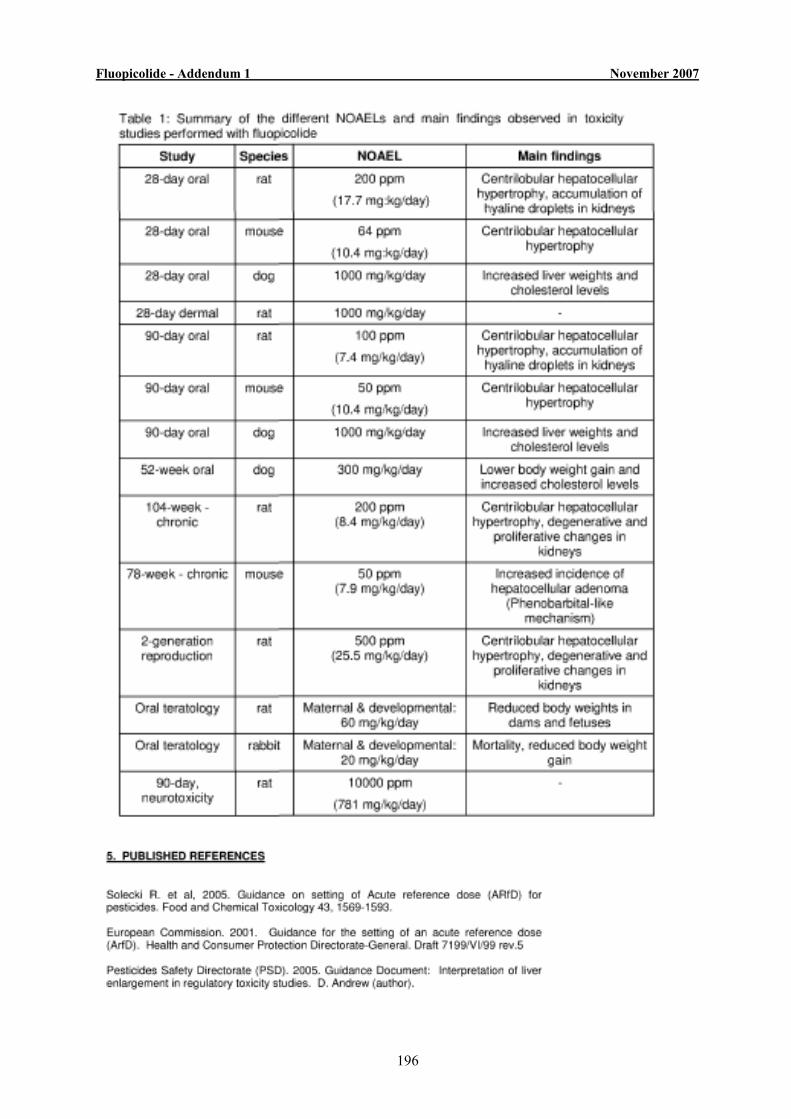
Fluopicolide - Addendum 1 November 2007
196
Fluopicolide - Addendum 1 November 2007
197
APPENDIX 6
Fluopicolide - Addendum 1 November 2007
198
Fluopicolide - Addendum 1 November 2007
199
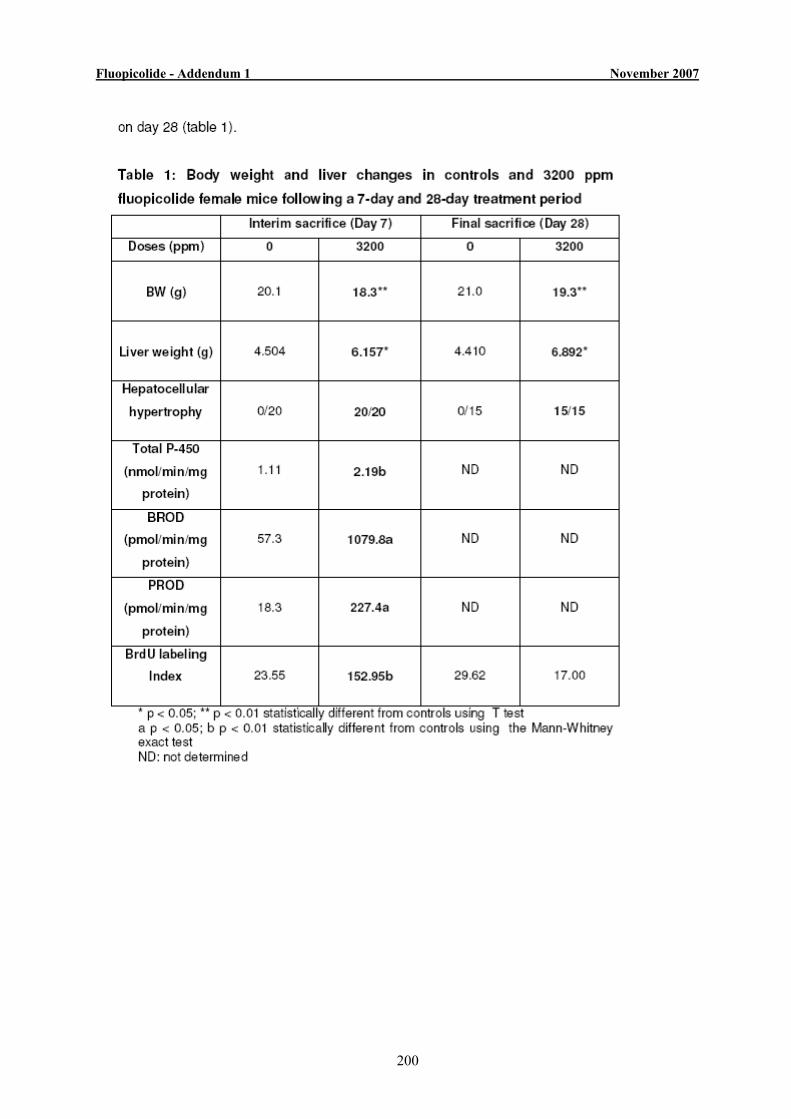
Fluopicolide - Addendum 1 November 2007
200
Fluopicolide - Addendum 1 November 2007
201
Fluopicolide - Addendum 1 November 2007
202
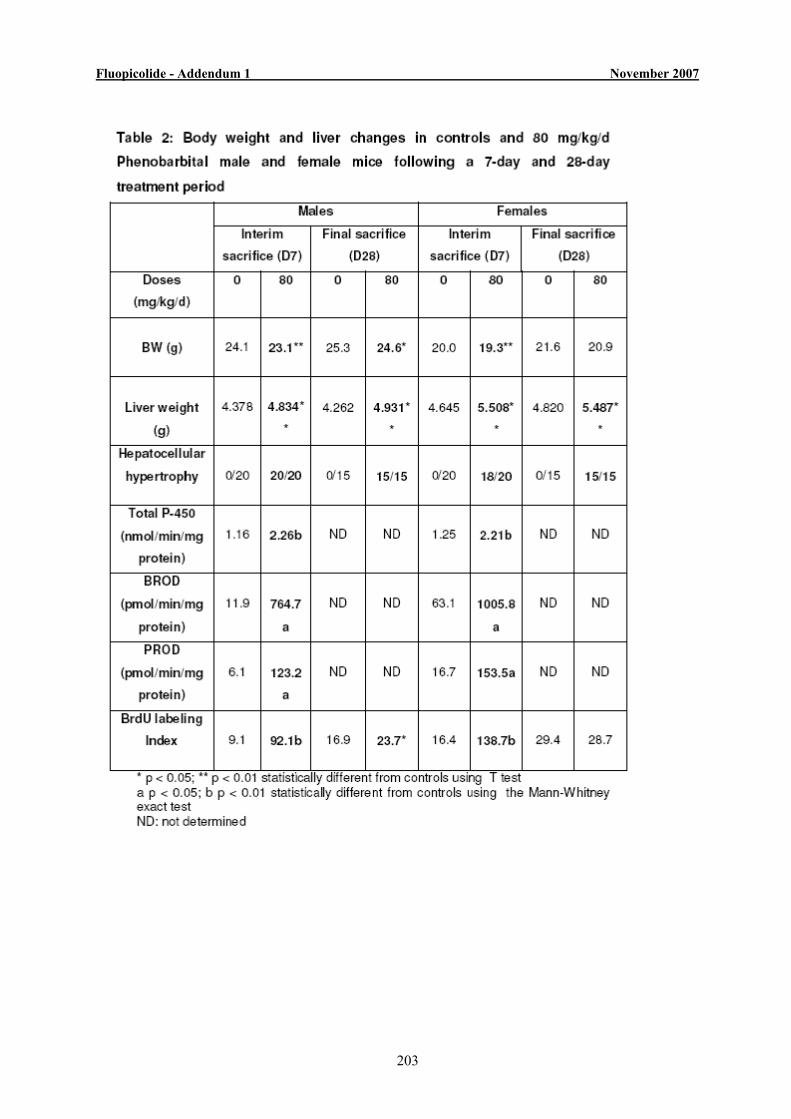
Fluopicolide - Addendum 1 November 2007
203
Fluopicolide - Addendum 1 November 2007
204
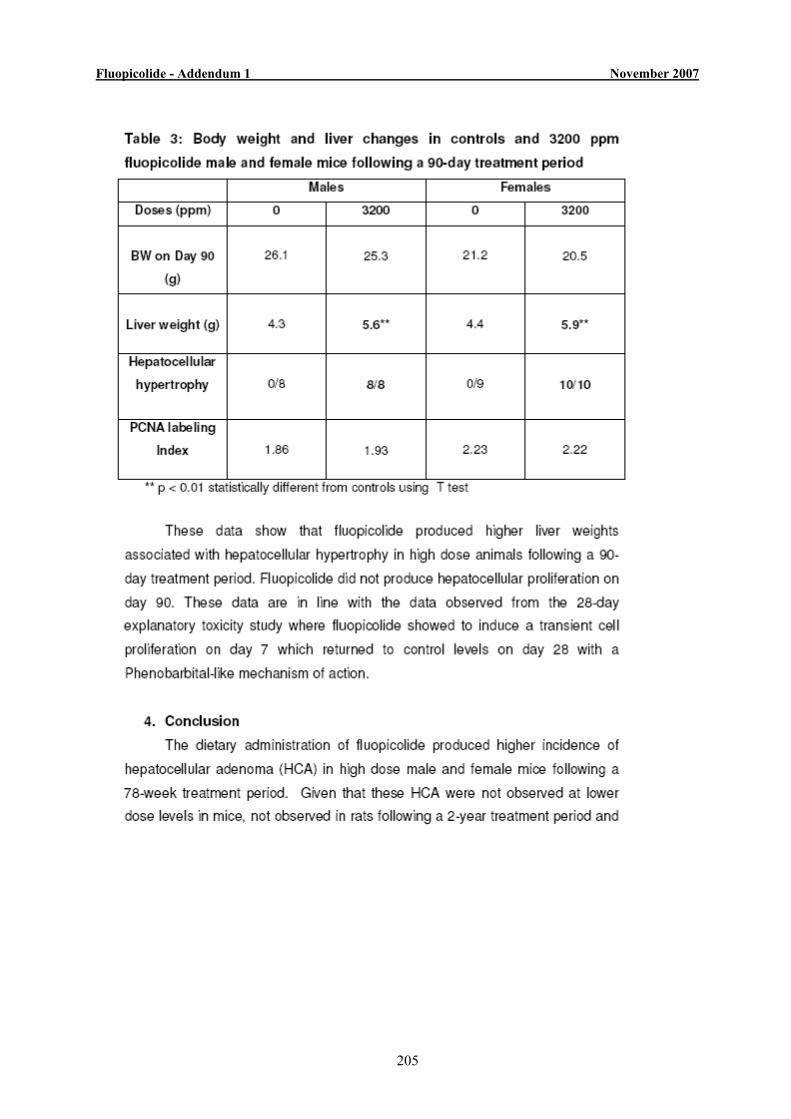
Fluopicolide - Addendum 1 November 2007
205
Fluopicolide - Addendum 1 November 2007
206
Fluopicolide - Addendum 1 November 2007
207
Fluopicolide - Addendum 1 November 2007
208
Fluopicolide - Addendum 1 November 2007
209
APPENDIX 6
Fluopicolide - Addendum 1 November 2007
210
Fluopicolide - Addendum 1 November 2007
211
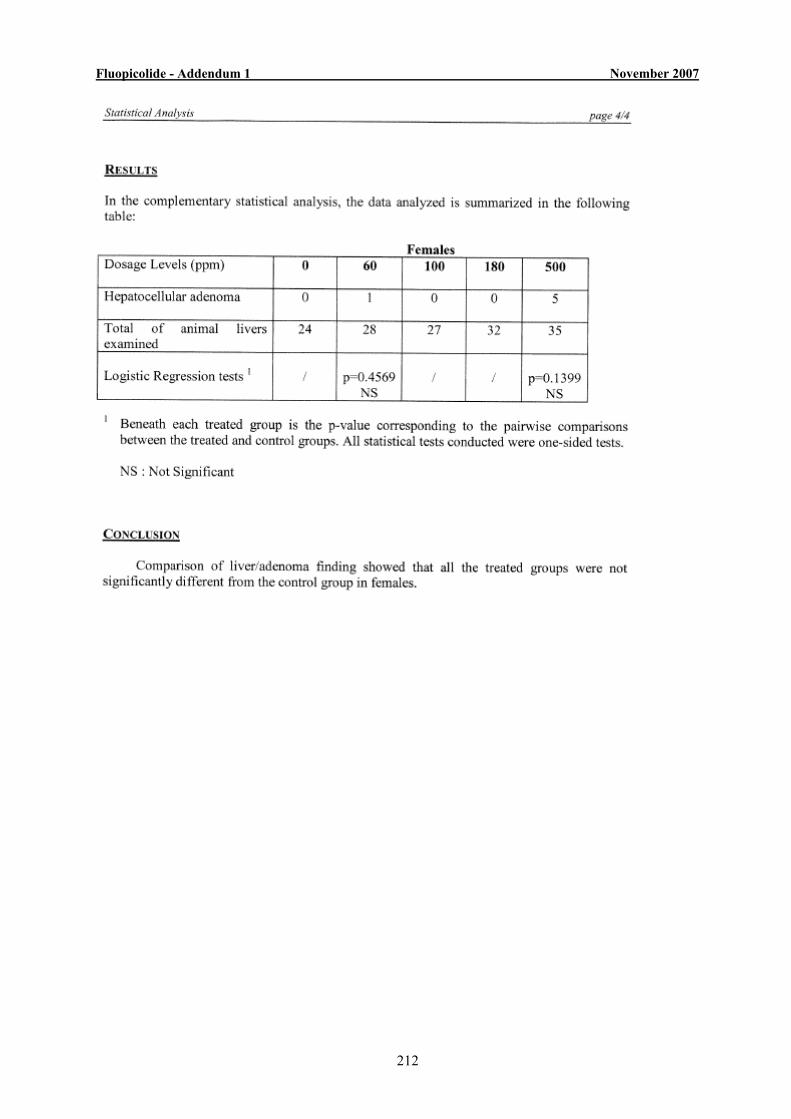
Fluopicolide - Addendum 1 November 2007
212
Fluopicolide - Addendum 1 November 2007
213
Council Directive 91/414/EEC
Fluopicolide (AE C638206)
ADDENDUM 1 (FATE & ECOTOX ONLY) TO THE DRAFT ASSESSMENT REPORT PREPARED BY THE
UNITED KINGDOM
Draft: November 2007
PESTICIDES SAFETY DIRECTORATEMallard House, Kings Pool, 3 Peasholme Green, York YO1 7PX, UK Website: www.pesticides.gov.uk
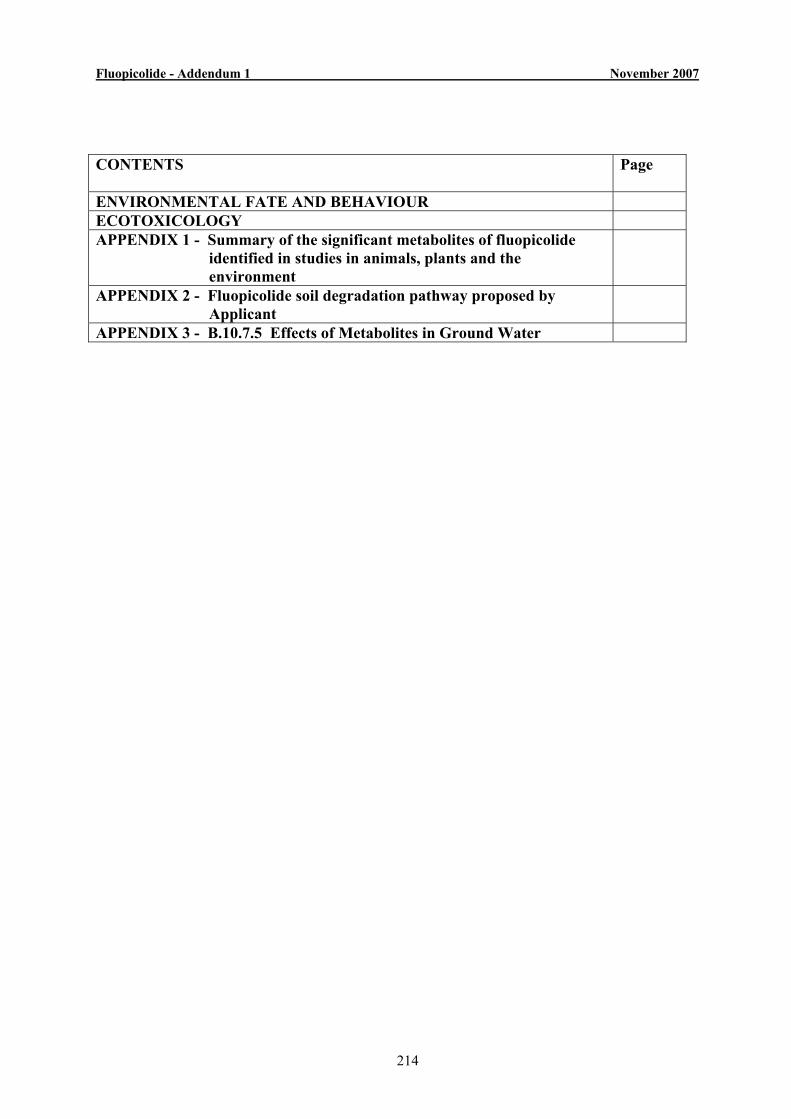
Fluopicolide - Addendum 1 November 2007
214
CONTENTS Page
ENVIRONMENTAL FATE AND BEHAVIOUR ECOTOXICOLOGY APPENDIX 1 - Summary of the significant metabolites of fluopicolide
identified in studies in animals, plants and the environment
APPENDIX 2 - Fluopicolide soil degradation pathway proposed by Applicant
APPENDIX 3 - B.10.7.5 Effects of Metabolites in Ground Water
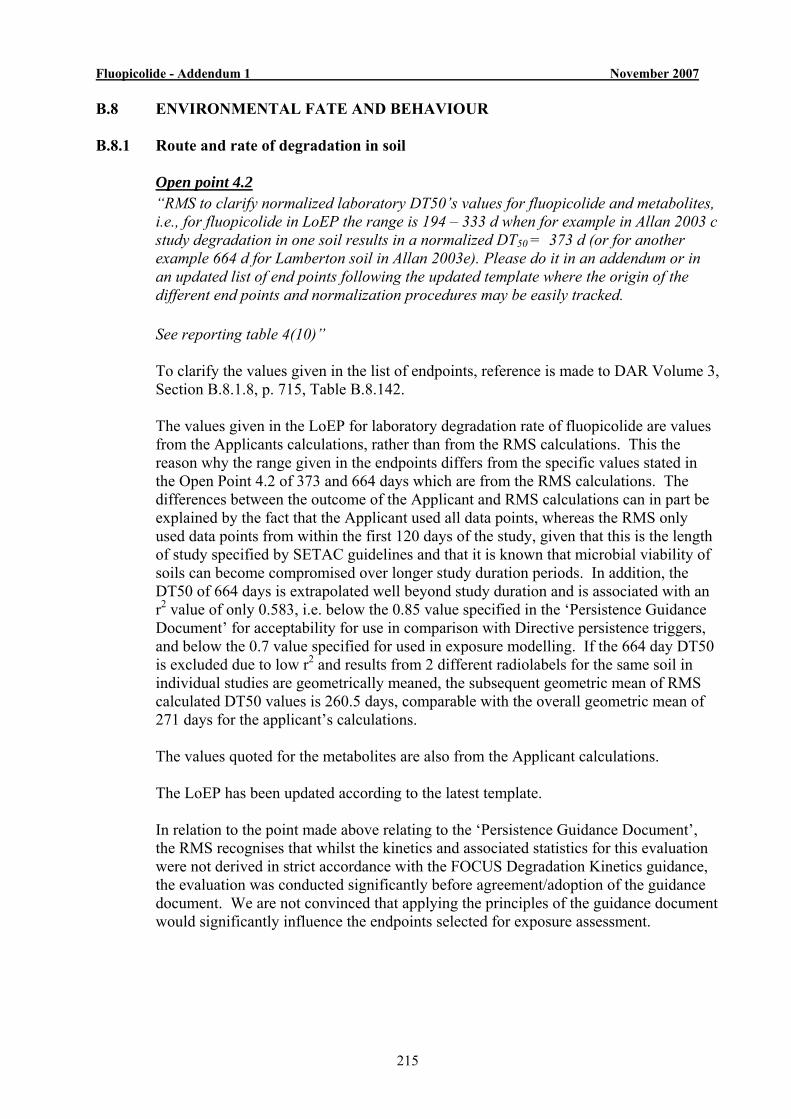
Fluopicolide - Addendum 1 November 2007
215
B.8 ENVIRONMENTAL FATE AND BEHAVIOUR B.8.1 Route and rate of degradation in soil
Open point 4.2 “RMS to clarify normalized laboratory DT50’s values for fluopicolide and metabolites, i.e., for fluopicolide in LoEP the range is 194 – 333 d when for example in Allan 2003 c study degradation in one soil results in a normalized DT50 = 373 d (or for another example 664 d for Lamberton soil in Allan 2003e). Please do it in an addendum or in an updated list of end points following the updated template where the origin of the different end points and normalization procedures may be easily tracked. See reporting table 4(10)” To clarify the values given in the list of endpoints, reference is made to DAR Volume 3, Section B.8.1.8, p. 715, Table B.8.142. The values given in the LoEP for laboratory degradation rate of fluopicolide are values from the Applicants calculations, rather than from the RMS calculations. This the reason why the range given in the endpoints differs from the specific values stated in the Open Point 4.2 of 373 and 664 days which are from the RMS calculations. The differences between the outcome of the Applicant and RMS calculations can in part be explained by the fact that the Applicant used all data points, whereas the RMS only used data points from within the first 120 days of the study, given that this is the length of study specified by SETAC guidelines and that it is known that microbial viability of soils can become compromised over longer study duration periods. In addition, the DT50 of 664 days is extrapolated well beyond study duration and is associated with an r2 value of only 0.583, i.e. below the 0.85 value specified in the ‘Persistence Guidance Document’ for acceptability for use in comparison with Directive persistence triggers, and below the 0.7 value specified for used in exposure modelling. If the 664 day DT50 is excluded due to low r2 and results from 2 different radiolabels for the same soil in individual studies are geometrically meaned, the subsequent geometric mean of RMS calculated DT50 values is 260.5 days, comparable with the overall geometric mean of 271 days for the applicant’s calculations. The values quoted for the metabolites are also from the Applicant calculations. The LoEP has been updated according to the latest template. In relation to the point made above relating to the ‘Persistence Guidance Document’, the RMS recognises that whilst the kinetics and associated statistics for this evaluation were not derived in strict accordance with the FOCUS Degradation Kinetics guidance, the evaluation was conducted significantly before agreement/adoption of the guidance document. We are not convinced that applying the principles of the guidance document would significantly influence the endpoints selected for exposure assessment.
Fluopicolide - Addendum 1 November 2007
216
Route and rate of degradation in soil
Open point 4.5 “MS experts to discuss potential influence of the different extraction method employed on the respective results of the laboratory and field studies. Applicant provided an explanatory note in the “Comments to the reporting table”. To be considered by MSs experts in their discussion. See reporting table 4(26).”
As a reminder to MS experts, lab studies used 3-4 extractions with acetonitrile/water at ambient temperature followed by an acetonitrile Soxhlet extraction. Field studies used 2 extractions of acetonitrile/water/formic acid under ambient conditions. RMS notes the Applicants statement, however, the RMS has further investigated extraction in the lab studies. Considering the representative chromatograms presented in studies, (in the Allen, 2003c study), Soxhlet extractions at 369 DAT accounted for 14.2 – 23.3% AR, with fluopicolide accounting for 9.7 – 17.6% AR in the Soxhlet extracts. In the Allen, 2003b study, at 98 DAT Soxhlet extractions accounted for a further 5.4 – 6.1% AR as fluopicolide. Information relating to the amount of fluopicolide extracted with each successive ambient extraction in lab studies is not available. RMS considers that in light of this information, there is still some uncertainty over the suitability of the extraction methods for the field dissipation studies and that this should discussed by MS experts with a view to obtaining an appropriate resolution.
B.8.1.3. Route and rate of degradation in soil - photolysis
Data Requirement 4.1 “Notifier to provide an estimation of soil photolysis half lives at other latitudes (i.e. 40 ºN and 45 ºN). Applicant indicated to submit a position paper (Report MEF-06/495) by April 2007. See reporting table 4(14).” Background: Soil photolysis was performed by simulating irradiation in Scotland, (latitude 55°N). As fluopicolide is also intended for use in Southern EU Member States, further estimates were requested of the contribution of photolysis to soil degradation at latitudes around 40°N-45°N. In the field dissipation studies (DAR B.8.1.8), fluopicolide was sprayed to bare soil surface. This also prompted discussion over the influence of photolysis on the results of field dissipation studies, compared to under normal conditions of use in the field and
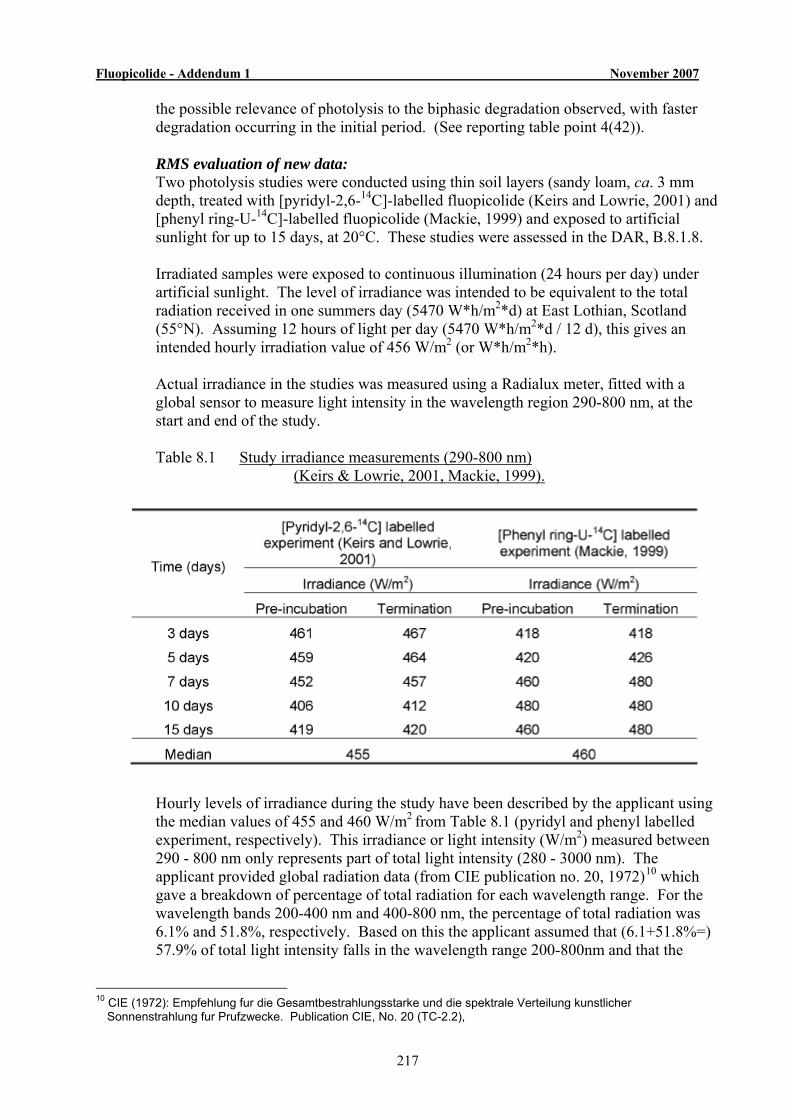
Fluopicolide - Addendum 1 November 2007
217
the possible relevance of photolysis to the biphasic degradation observed, with faster degradation occurring in the initial period. (See reporting table point 4(42)). RMS evaluation of new data: Two photolysis studies were conducted using thin soil layers (sandy loam, ca. 3 mm depth, treated with [pyridyl-2,6-14C]-labelled fluopicolide (Keirs and Lowrie, 2001) and [phenyl ring-U-14C]-labelled fluopicolide (Mackie, 1999) and exposed to artificial sunlight for up to 15 days, at 20°C. These studies were assessed in the DAR, B.8.1.8. Irradiated samples were exposed to continuous illumination (24 hours per day) under artificial sunlight. The level of irradiance was intended to be equivalent to the total radiation received in one summers day (5470 W*h/m2*d) at East Lothian, Scotland (55°N). Assuming 12 hours of light per day (5470 W*h/m2*d / 12 d), this gives an intended hourly irradiation value of 456 W/m2 (or W*h/m2*h). Actual irradiance in the studies was measured using a Radialux meter, fitted with a global sensor to measure light intensity in the wavelength region 290-800 nm, at the start and end of the study. Table 8.1 Study irradiance measurements (290-800 nm)
(Keirs & Lowrie, 2001, Mackie, 1999).
Hourly levels of irradiance during the study have been described by the applicant using the median values of 455 and 460 W/m2 from Table 8.1 (pyridyl and phenyl labelled experiment, respectively). This irradiance or light intensity (W/m2) measured between 290 - 800 nm only represents part of total light intensity (280 - 3000 nm). The applicant provided global radiation data (from CIE publication no. 20, 1972)10 which gave a breakdown of percentage of total radiation for each wavelength range. For the wavelength bands 200-400 nm and 400-800 nm, the percentage of total radiation was 6.1% and 51.8%, respectively. Based on this the applicant assumed that (6.1+51.8%=) 57.9% of total light intensity falls in the wavelength range 200-800nm and that the
10 CIE (1972): Empfehlung fur die Gesamtbestrahlungsstarke und die spektrale Verteilung kunstlicher
Sonnenstrahlung fur Prufzwecke. Publication CIE, No. 20 (TC-2.2),
Fluopicolide - Addendum 1 November 2007
218
filtered light intensity measured in the study represents 57.9% of total light intensity, recalculated as below11. Total irradiance (W/m2, 280-3000 nm) = measured irradiance (W/m2, 290-800 nm)/ 0.579 Total irradiance = 455 or 460 W/m2 / 0.579 Total irradiance = 785 or 794 W/m2 (pyridyl or phenyl label, respectively) The hourly or instantaneous solar radiation (W/m2) was then converted into an energy yield of the solar radiation per day (kJ/m2*d) by: instantaneous total irradiance (W/m2, 280 - 3000 nm) * 86400 (seconds/day) /1000 (note: 1 hour = 3600 seconds x 24 hour = 86400 seconds/day)
Assuming total irradiance of 785 W/m2 or 794 W/m2, in the above equation gives an energy yield of solar radiation of 67.82 and 68.64 MJ/m2 per day, respectively for the [pyridyl-2,6-14C] and [phenyl ring-U-14C]-labelled experiments. The applicant has recalculated the photodegradation rate of fluopicolide, based on these studies, assuming single exponential first-order kinetics using Excel Solver to obtain the best 'least squares fit'. Due to the variability of the recovery data, the soil residue data (%AR) were normalised for total recovery at each time point, with no correction for dark control residues, (since no significant decline was observed in the dark).
11 using Chemtec, (1995): Solar radiation data - Handbook of Material Weathering, 2nd edition. Chemtec Publishing,
Ontario, Canada.
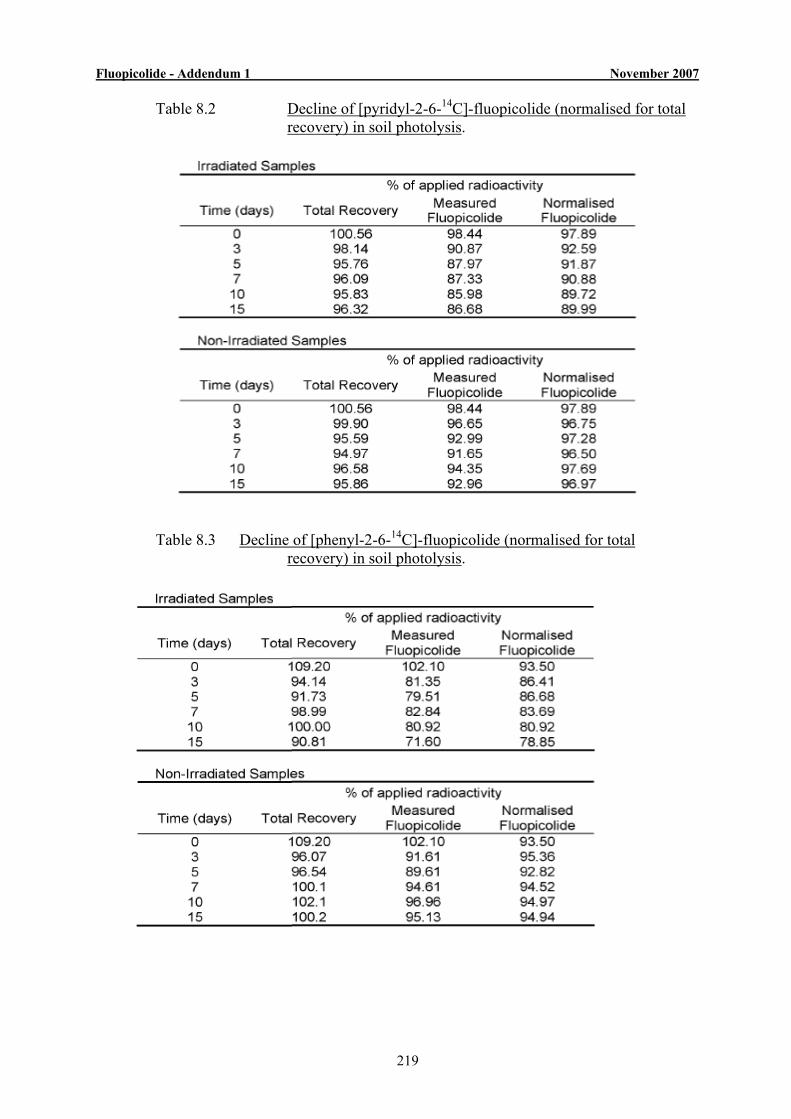
Fluopicolide - Addendum 1 November 2007
219
Table 8.2 Decline of [pyridyl-2-6-14C]-fluopicolide (normalised for total recovery) in soil photolysis.
Table 8.3 Decline of [phenyl-2-6-14C]-fluopicolide (normalised for total recovery) in soil photolysis.
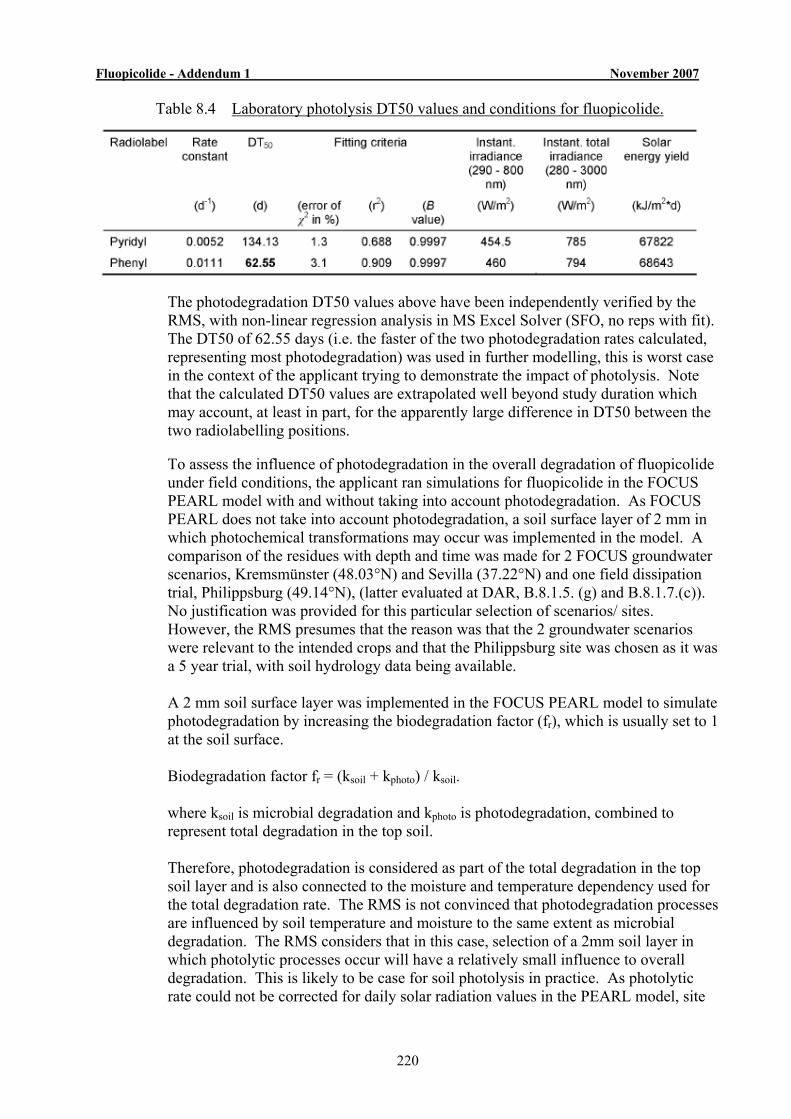
Fluopicolide - Addendum 1 November 2007
220
Table 8.4 Laboratory photolysis DT50 values and conditions for fluopicolide.
The photodegradation DT50 values above have been independently verified by the RMS, with non-linear regression analysis in MS Excel Solver (SFO, no reps with fit). The DT50 of 62.55 days (i.e. the faster of the two photodegradation rates calculated, representing most photodegradation) was used in further modelling, this is worst case in the context of the applicant trying to demonstrate the impact of photolysis. Note that the calculated DT50 values are extrapolated well beyond study duration which may account, at least in part, for the apparently large difference in DT50 between the two radiolabelling positions. To assess the influence of photodegradation in the overall degradation of fluopicolide under field conditions, the applicant ran simulations for fluopicolide in the FOCUS PEARL model with and without taking into account photodegradation. As FOCUS PEARL does not take into account photodegradation, a soil surface layer of 2 mm in which photochemical transformations may occur was implemented in the model. A comparison of the residues with depth and time was made for 2 FOCUS groundwater scenarios, Kremsmünster (48.03°N) and Sevilla (37.22°N) and one field dissipation trial, Philippsburg (49.14°N), (latter evaluated at DAR, B.8.1.5. (g) and B.8.1.7.(c)). No justification was provided for this particular selection of scenarios/ sites. However, the RMS presumes that the reason was that the 2 groundwater scenarios were relevant to the intended crops and that the Philippsburg site was chosen as it was a 5 year trial, with soil hydrology data being available. A 2 mm soil surface layer was implemented in the FOCUS PEARL model to simulate photodegradation by increasing the biodegradation factor (fr), which is usually set to 1 at the soil surface. Biodegradation factor fr = (ksoil + kphoto) / ksoil. where ksoil is microbial degradation and kphoto is photodegradation, combined to represent total degradation in the top soil. Therefore, photodegradation is considered as part of the total degradation in the top soil layer and is also connected to the moisture and temperature dependency used for the total degradation rate. The RMS is not convinced that photodegradation processes are influenced by soil temperature and moisture to the same extent as microbial degradation. The RMS considers that in this case, selection of a 2mm soil layer in which photolytic processes occur will have a relatively small influence to overall degradation. This is likely to be case for soil photolysis in practice. As photolytic rate could not be corrected for daily solar radiation values in the PEARL model, site
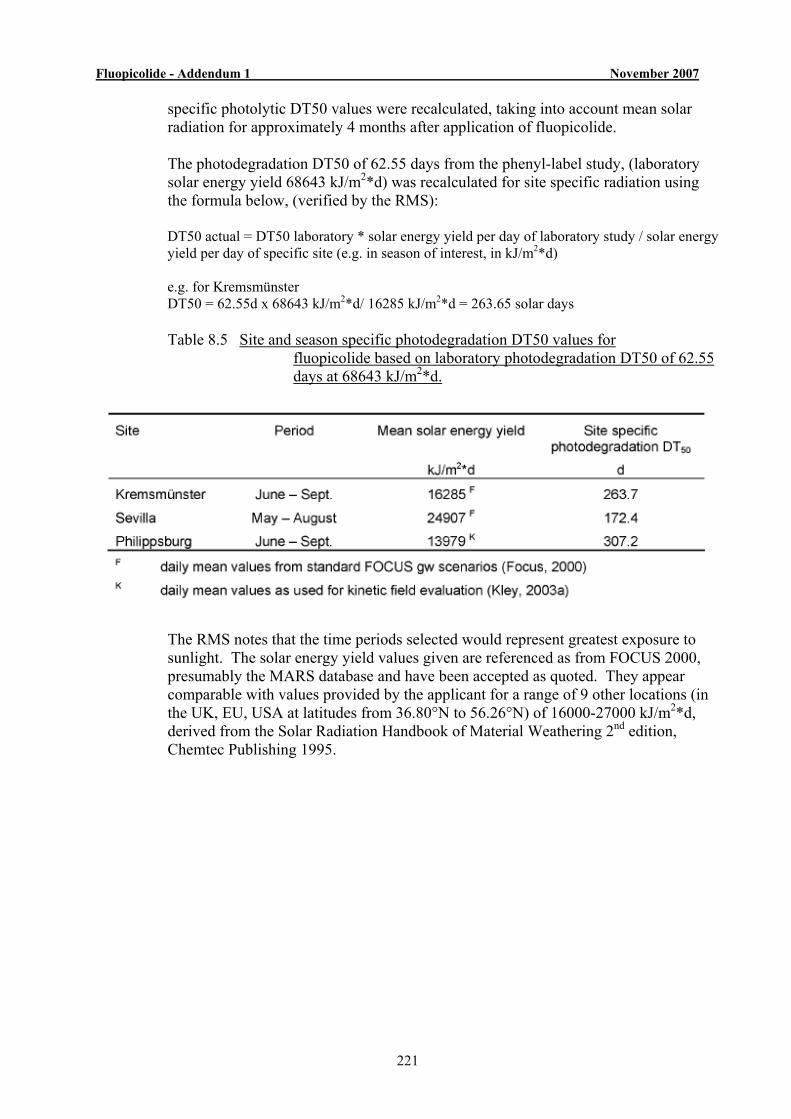
Fluopicolide - Addendum 1 November 2007
221
specific photolytic DT50 values were recalculated, taking into account mean solar radiation for approximately 4 months after application of fluopicolide. The photodegradation DT50 of 62.55 days from the phenyl-label study, (laboratory solar energy yield 68643 kJ/m2*d) was recalculated for site specific radiation using the formula below, (verified by the RMS): DT50 actual = DT50 laboratory * solar energy yield per day of laboratory study / solar energy yield per day of specific site (e.g. in season of interest, in kJ/m2*d) e.g. for Kremsmünster DT50 = 62.55d x 68643 kJ/m2*d/ 16285 kJ/m2*d = 263.65 solar days Table 8.5 Site and season specific photodegradation DT50 values for
fluopicolide based on laboratory photodegradation DT50 of 62.55 days at 68643 kJ/m2*d.
The RMS notes that the time periods selected would represent greatest exposure to sunlight. The solar energy yield values given are referenced as from FOCUS 2000, presumably the MARS database and have been accepted as quoted. They appear comparable with values provided by the applicant for a range of 9 other locations (in the UK, EU, USA at latitudes from 36.80°N to 56.26°N) of 16000-27000 kJ/m2*d, derived from the Solar Radiation Handbook of Material Weathering 2nd edition, Chemtec Publishing 1995.
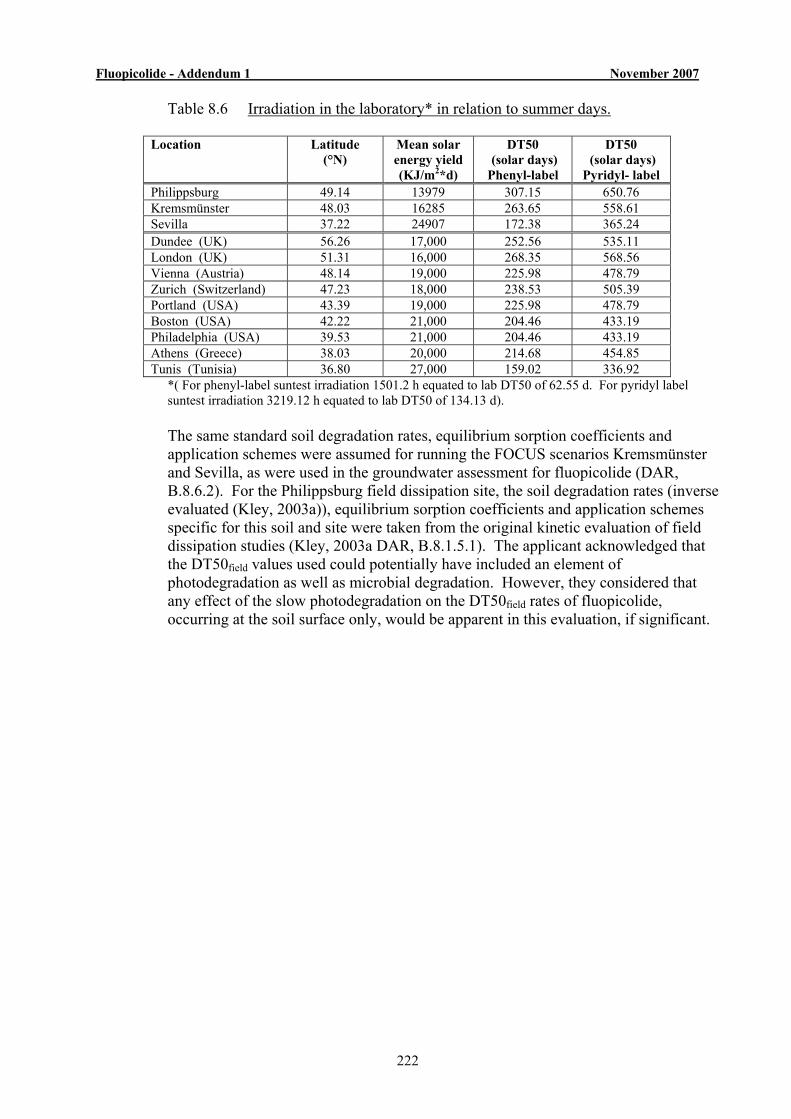
Fluopicolide - Addendum 1 November 2007
222
Table 8.6 Irradiation in the laboratory* in relation to summer days.
Location Latitude (°N)
Mean solar energy yield (KJ/m2*d)
DT50 (solar days) Phenyl-label
DT50 (solar days)
Pyridyl- label Philippsburg 49.14 13979 307.15 650.76 Kremsmünster 48.03 16285 263.65 558.61 Sevilla 37.22 24907 172.38 365.24 Dundee (UK) 56.26 17,000 252.56 535.11 London (UK) 51.31 16,000 268.35 568.56 Vienna (Austria) 48.14 19,000 225.98 478.79 Zurich (Switzerland) 47.23 18,000 238.53 505.39 Portland (USA) 43.39 19,000 225.98 478.79 Boston (USA) 42.22 21,000 204.46 433.19 Philadelphia (USA) 39.53 21,000 204.46 433.19 Athens (Greece) 38.03 20,000 214.68 454.85 Tunis (Tunisia) 36.80 27,000 159.02 336.92
*( For phenyl-label suntest irradiation 1501.2 h equated to lab DT50 of 62.55 d. For pyridyl label suntest irradiation 3219.12 h equated to lab DT50 of 134.13 d). The same standard soil degradation rates, equilibrium sorption coefficients and application schemes were assumed for running the FOCUS scenarios Kremsmünster and Sevilla, as were used in the groundwater assessment for fluopicolide (DAR, B.8.6.2). For the Philippsburg field dissipation site, the soil degradation rates (inverse evaluated (Kley, 2003a)), equilibrium sorption coefficients and application schemes specific for this soil and site were taken from the original kinetic evaluation of field dissipation studies (Kley, 2003a DAR, B.8.1.5.1). The applicant acknowledged that the DT50field values used could potentially have included an element of photodegradation as well as microbial degradation. However, they considered that any effect of the slow photodegradation on the DT50field rates of fluopicolide, occurring at the soil surface only, would be apparent in this evaluation, if significant.

Fluopicolide - Addendum 1 November 2007
223
Table 8.7 Parameters input for FOCUS PEARL simulations.
Kremsmünster Sevilla Philippsburg Crop Vines Vines Bare soil Application rate (g/ha) 3 x 133 3 x 133 400
Application dates 5 + 15+ 25 June 5 + 16+ 26 May 20 June 2000 Crop interception (%) 70, 70, 85 70, 70, 85 - Soil DT50field (d) 138.8* 138.8* 108.56# Site specific photolysis DT50 (solar days)a 263.7 172.4 307.2
Biodegradation factor (Fr) for upper 2 mm 1.526 1.805 1.353
Koc (Kom), mean 321.1 l/kg (186.2 l/kg) 321.1 l/kg (186.2 l/kg) 248.3 l/kg
b(soil specific) 1/n, mean 0.9028 0.9028 0.841 b (soil specific)
* (mean DT50field, bare field). # (site specific DT50field, from inverse DT50 evaluation, Kley, 2003a). a worst case (faster DT50lab) derived from data from study using phenyl-labelled fluopicolide. b reported in DAR, Table B.8.152. Model parameters: Dispersion length (λ) was 5 cm and photolysis layer 2mm. FOCUS-PEARL 3.3.3 was run for Kremsmünster and Sevilla, and FOCUS-PEARL 1.1.1 was run for the field site, Philippsburg (soil hydrology manually calibrated).
The applicant presented depth profiles for individual time points (days 14, 60, 180, 240, 450 and 720) over 2 years for each of the FOCUS GW scenarios, with and without the 2 mm soil layer for photodegradation for comparison. Concentrations of fluopicolide in 50 cm soil depth over approximately 10-12 years were also reported. Dissipation curves for fluopicolide over 30 cm soil depth were also presented with and without photodegradation, for the field dissipation site, Philippsburg. The applicant concluded that there were no significant differences, with or without the additional photodegradation rate, observed for any of the scenarios over time.
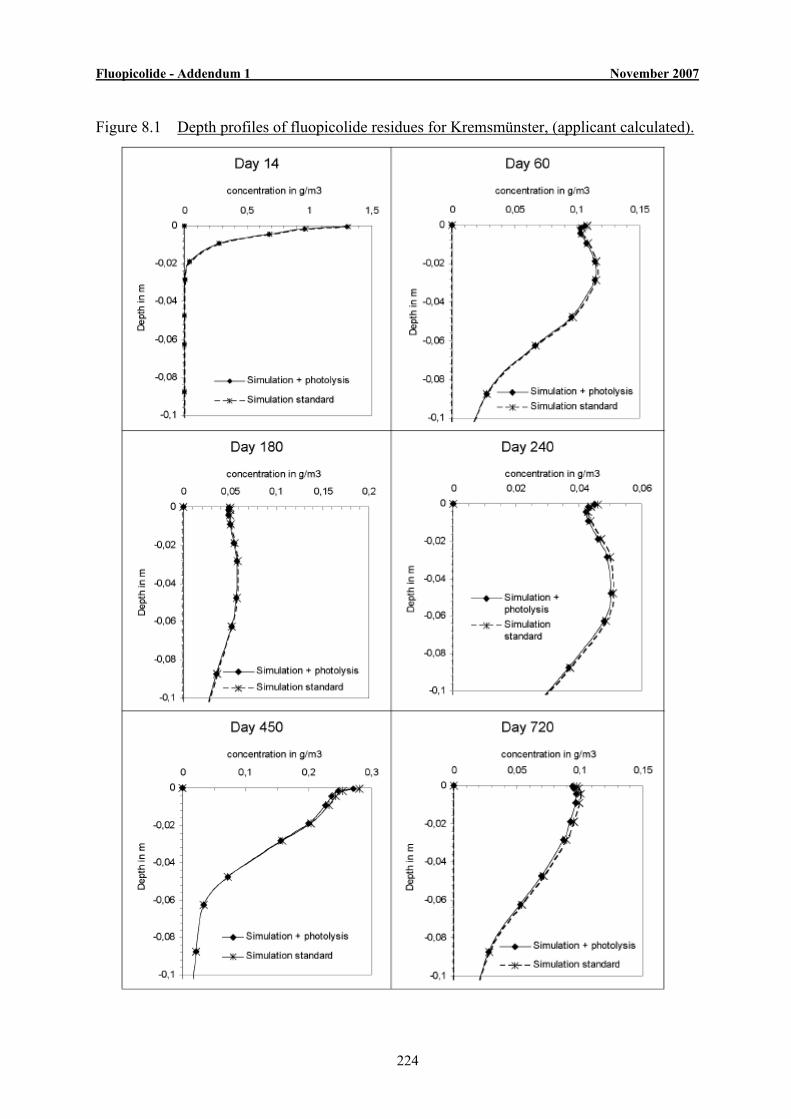
Fluopicolide - Addendum 1 November 2007
224
Figure 8.1 Depth profiles of fluopicolide residues for Kremsmünster, (applicant calculated).
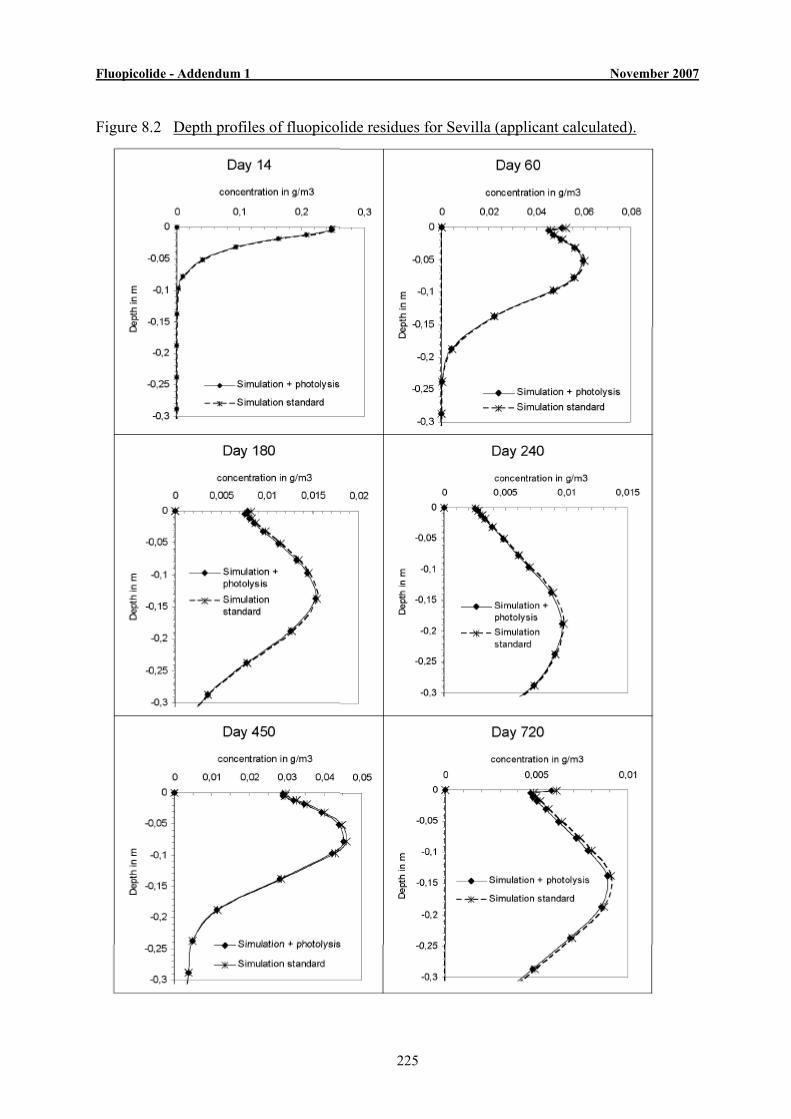
Fluopicolide - Addendum 1 November 2007
225
Figure 8.2 Depth profiles of fluopicolide residues for Sevilla (applicant calculated).
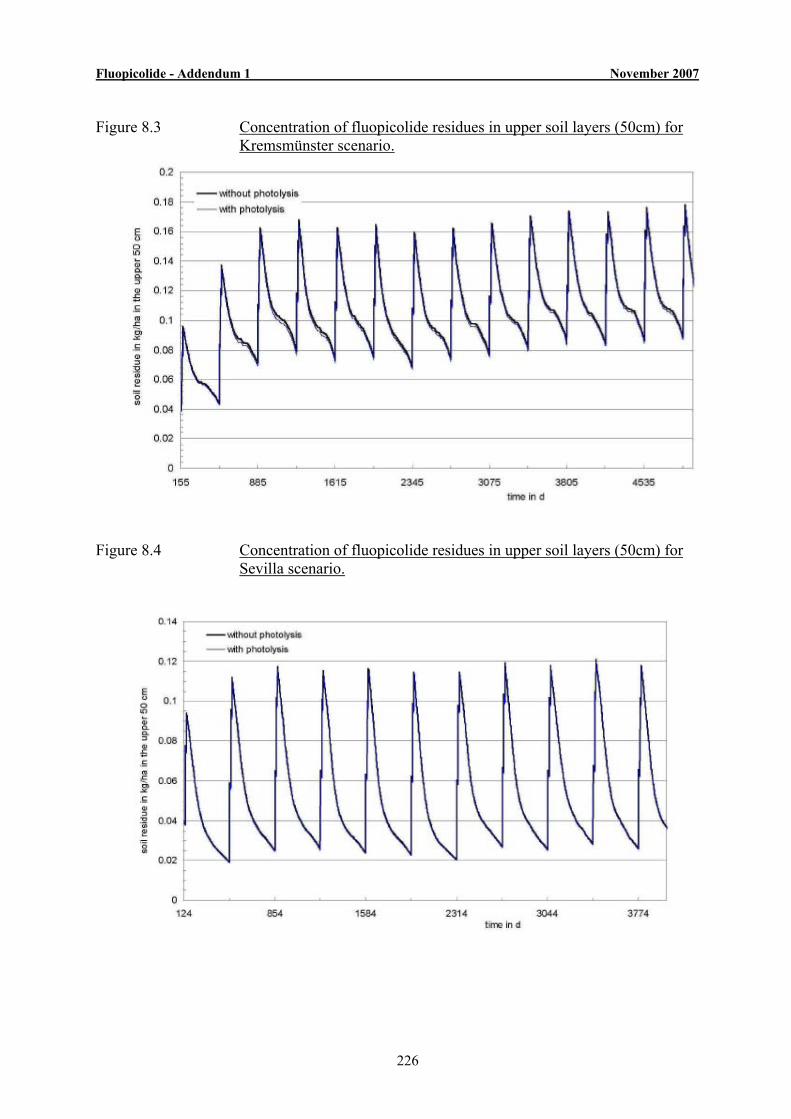
Fluopicolide - Addendum 1 November 2007
226
Figure 8.3 Concentration of fluopicolide residues in upper soil layers (50cm) for Kremsmünster scenario.
Figure 8.4 Concentration of fluopicolide residues in upper soil layers (50cm) for Sevilla scenario.
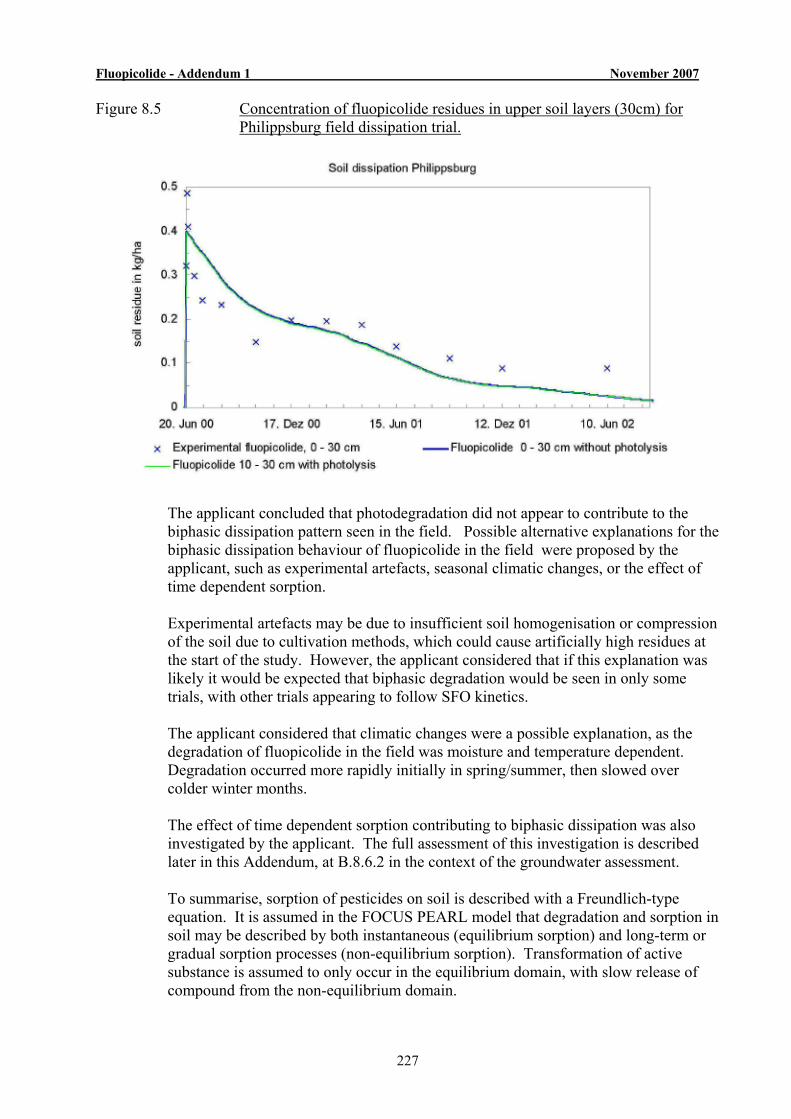
Fluopicolide - Addendum 1 November 2007
227
Figure 8.5 Concentration of fluopicolide residues in upper soil layers (30cm) for Philippsburg field dissipation trial.
The applicant concluded that photodegradation did not appear to contribute to the biphasic dissipation pattern seen in the field. Possible alternative explanations for the biphasic dissipation behaviour of fluopicolide in the field were proposed by the applicant, such as experimental artefacts, seasonal climatic changes, or the effect of time dependent sorption. Experimental artefacts may be due to insufficient soil homogenisation or compression of the soil due to cultivation methods, which could cause artificially high residues at the start of the study. However, the applicant considered that if this explanation was likely it would be expected that biphasic degradation would be seen in only some trials, with other trials appearing to follow SFO kinetics. The applicant considered that climatic changes were a possible explanation, as the degradation of fluopicolide in the field was moisture and temperature dependent. Degradation occurred more rapidly initially in spring/summer, then slowed over colder winter months. The effect of time dependent sorption contributing to biphasic dissipation was also investigated by the applicant. The full assessment of this investigation is described later in this Addendum, at B.8.6.2 in the context of the groundwater assessment. To summarise, sorption of pesticides on soil is described with a Freundlich-type equation. It is assumed in the FOCUS PEARL model that degradation and sorption in soil may be described by both instantaneous (equilibrium sorption) and long-term or gradual sorption processes (non-equilibrium sorption). Transformation of active substance is assumed to only occur in the equilibrium domain, with slow release of compound from the non-equilibrium domain.
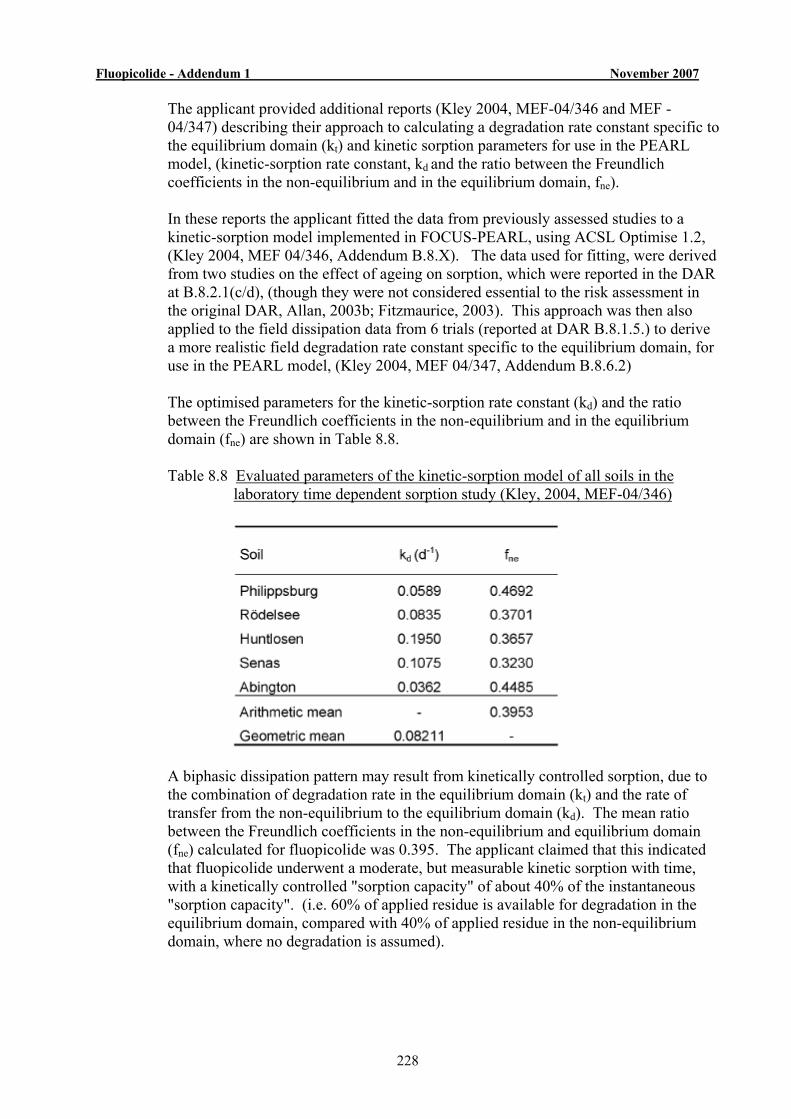
Fluopicolide - Addendum 1 November 2007
228
The applicant provided additional reports (Kley 2004, MEF-04/346 and MEF -04/347) describing their approach to calculating a degradation rate constant specific to the equilibrium domain (kt) and kinetic sorption parameters for use in the PEARL model, (kinetic-sorption rate constant, kd and the ratio between the Freundlich coefficients in the non-equilibrium and in the equilibrium domain, fne). In these reports the applicant fitted the data from previously assessed studies to a kinetic-sorption model implemented in FOCUS-PEARL, using ACSL Optimise 1.2, (Kley 2004, MEF 04/346, Addendum B.8.X). The data used for fitting, were derived from two studies on the effect of ageing on sorption, which were reported in the DAR at B.8.2.1(c/d), (though they were not considered essential to the risk assessment in the original DAR, Allan, 2003b; Fitzmaurice, 2003). This approach was then also applied to the field dissipation data from 6 trials (reported at DAR B.8.1.5.) to derive a more realistic field degradation rate constant specific to the equilibrium domain, for use in the PEARL model, (Kley 2004, MEF 04/347, Addendum B.8.6.2) The optimised parameters for the kinetic-sorption rate constant (kd) and the ratio between the Freundlich coefficients in the non-equilibrium and in the equilibrium domain (fne) are shown in Table 8.8.
Table 8.8 Evaluated parameters of the kinetic-sorption model of all soils in the
laboratory time dependent sorption study (Kley, 2004, MEF-04/346)
A biphasic dissipation pattern may result from kinetically controlled sorption, due to the combination of degradation rate in the equilibrium domain (kt) and the rate of transfer from the non-equilibrium to the equilibrium domain (kd). The mean ratio between the Freundlich coefficients in the non-equilibrium and equilibrium domain (fne) calculated for fluopicolide was 0.395. The applicant claimed that this indicated that fluopicolide underwent a moderate, but measurable kinetic sorption with time, with a kinetically controlled "sorption capacity" of about 40% of the instantaneous "sorption capacity". (i.e. 60% of applied residue is available for degradation in the equilibrium domain, compared with 40% of applied residue in the non-equilibrium domain, where no degradation is assumed).

Fluopicolide - Addendum 1 November 2007
229
RMS Risk Assessment and Conclusions: The RMS concludes that soil photolysis at more southerly latitudes is unlikely to significantly influence the degradation of fluopicolide. Kinetic adsorption aspects, if implemented into FOCUS modelling of environmental exposure, would be likely to result in lower peak and annual average concentrations. Implications for Ecotoxicogical Assessment: No change from the relevant endpoints reported in the DAR.
(Kley, C; Mackenzie, E; MEF-06/495, 2007)

Fluopicolide - Addendum 1 November 2007
230
B.8.1.7 Route and rate of degradation in soil – field soil accumulation
Data Requirement 4.2 “Applicant to present the position paper with their evaluation of the accumulation studies. Applicant indicated to submit a position paper assessing the field accumulation studies (Kley, C; Mackenzie, E.; Report no. M-267721-01-1) by April 2007.
See reporting table 4(41).” Background: The applicant has submitted a position paper presenting further evaluation of the field accumulation studies, (originally assessed at DAR B.8.1.7. and B.8.1.8), in response to the conclusion of the RMS that residues of fluopicolide and M-01 had not reached a plateau at study termination in the trial at Appilly and that results at Senas were inconclusive. The applicant has also submitted the time-points at which maximum concentrations were estimated to be reached, not previously given. (See reporting table, points 4(41), 4(51) and 4(73)). RMS Evaluation of new data: Field dissipation/ accumulation trials with fluopicolide were conducted over a 4 year period at sites in Philippsburg (Southern Germany), Appilly (Northern France) and at Senas (Southern France). Concentrations of fluopicolide and its metabolites, M-01, M-03 and M-02, in soil were measured following repeated annual applications of 400 or 500 g/ha p.a. to bare soil. See the assessment in the DAR at B.8.1.7. and B.8.1.8 for further details. These data have since been evaluated further by the applicant to assess whether the plateau concentrations of fluopicolide measured in the field were reached after 4 years, or if further increases would be expected in successive years. The accumulation potential of fluopicolide and its metabolite M-01 have been evaluated at each site, using SFO kinetics. Metabolite M-01 was shown to have potential to be mobile and persistent. The metabolite M-02 was only detected at a few time points at low levels and metabolite M-03 was only detected in acidic soils, being degraded rapidly in soils with pH>7. Throughout this evaluation the applicant converted concentrations in mg/kg to g/ha for the total soil depth assuming a soil density of 1.5 g/cm3. PHILIPPSBURG (S. Germany, loamy sand, pH 6.4 and 0.27% oc content) Fluopicolide was applied annually as detailed below. The applicant measured the unused formulation remaining in the spray tank to confirm the actual amount applied (‘calibrated application rate’). Three plots, each 3 m x 26 m, were treated with fluopicolide and a fourth plot left untreated as a control. The treated plots were subdivided into separate areas for the dissipation phase treated once in the first year and for the accumulation phase treated annually for up to 5 years. Details of the treatment and sampling areas were provided. Samples for the dissipation phase were taken for up to 2 years after the first application. Samples for the accumulation phase were taken
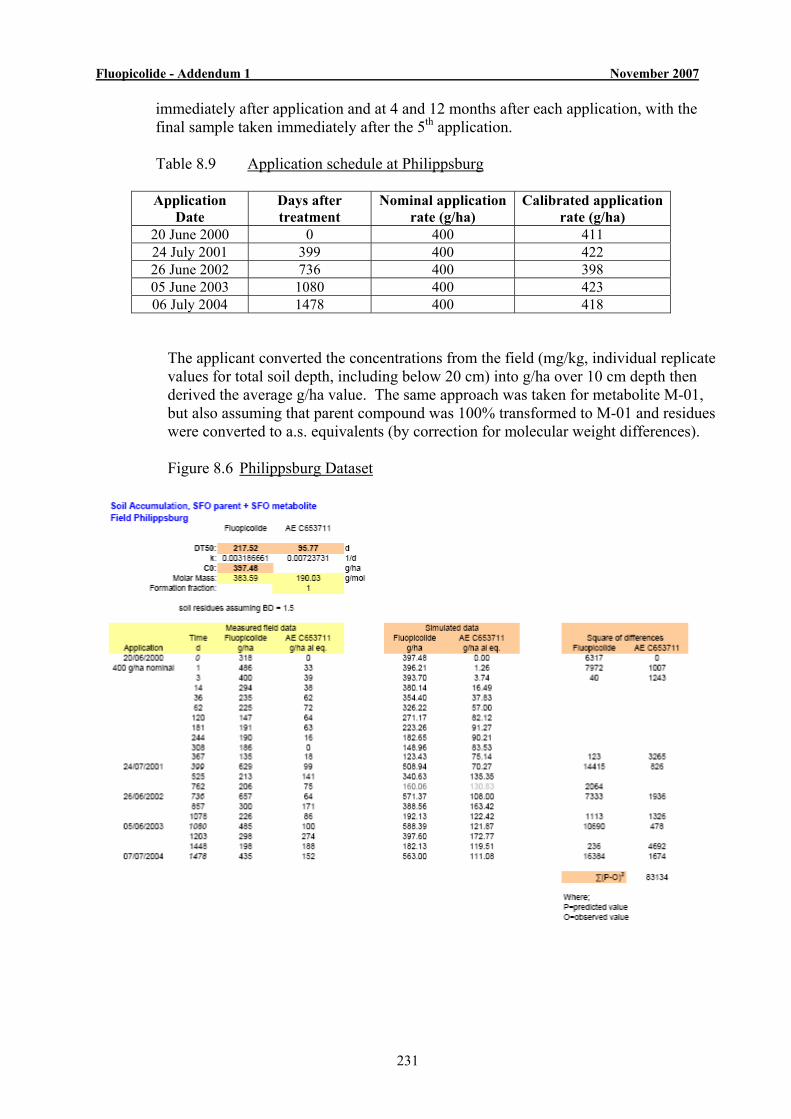
Fluopicolide - Addendum 1 November 2007
231
immediately after application and at 4 and 12 months after each application, with the final sample taken immediately after the 5th application. Table 8.9 Application schedule at Philippsburg Application
Date Days after treatment
Nominal application rate (g/ha)
Calibrated application rate (g/ha)
20 June 2000 0 400 411 24 July 2001 399 400 422 26 June 2002 736 400 398 05 June 2003 1080 400 423 06 July 2004 1478 400 418
The applicant converted the concentrations from the field (mg/kg, individual replicate values for total soil depth, including below 20 cm) into g/ha over 10 cm depth then derived the average g/ha value. The same approach was taken for metabolite M-01, but also assuming that parent compound was 100% transformed to M-01 and residues were converted to a.s. equivalents (by correction for molecular weight differences). Figure 8.6 Philippsburg Dataset

Fluopicolide - Addendum 1 November 2007
232
The concentrations of fluopicolide and M-01 in soil after annual applications of fluopicolide are shown in Figures 8.7-8.9. Results for both mean and individual plots were presented for fluopicolide. The mean results of the 3 plots were also provided for M-01, though not the individual plots. The final 3 data points (461, 546, 735 DAT) from the second year of the dissipation phase of the study (September 2001-June 2002) were excluded, as they overlapped with the start of the accumulation phase (July 2001) and were not needed to assess the accumulation plateau. The maximum concentration of fluopicolide was detected immediately after the second application (2001) and was a similar level after the third application (2002). The individual plots are presented separately. The applicant stated that the measured Chigh max and Clow max values for fluopicolide appeared to reach a plateau and that there appeared to be a tendency for accumulation of the metabolite M-01 over the course of the study, with a plateau not being reached. The RMS notes that while the Chigh max value for fluopicolide seems to have reached a plateau in individual plots, the Clow max decreased only at last point and slightly increased at the end for plot, T2. Figure 8.7 Concentration of fluopicolide at Philippsburg (g/ha for total soil depth) (Mean of 3 individual treated plots T1, T2 and T3)
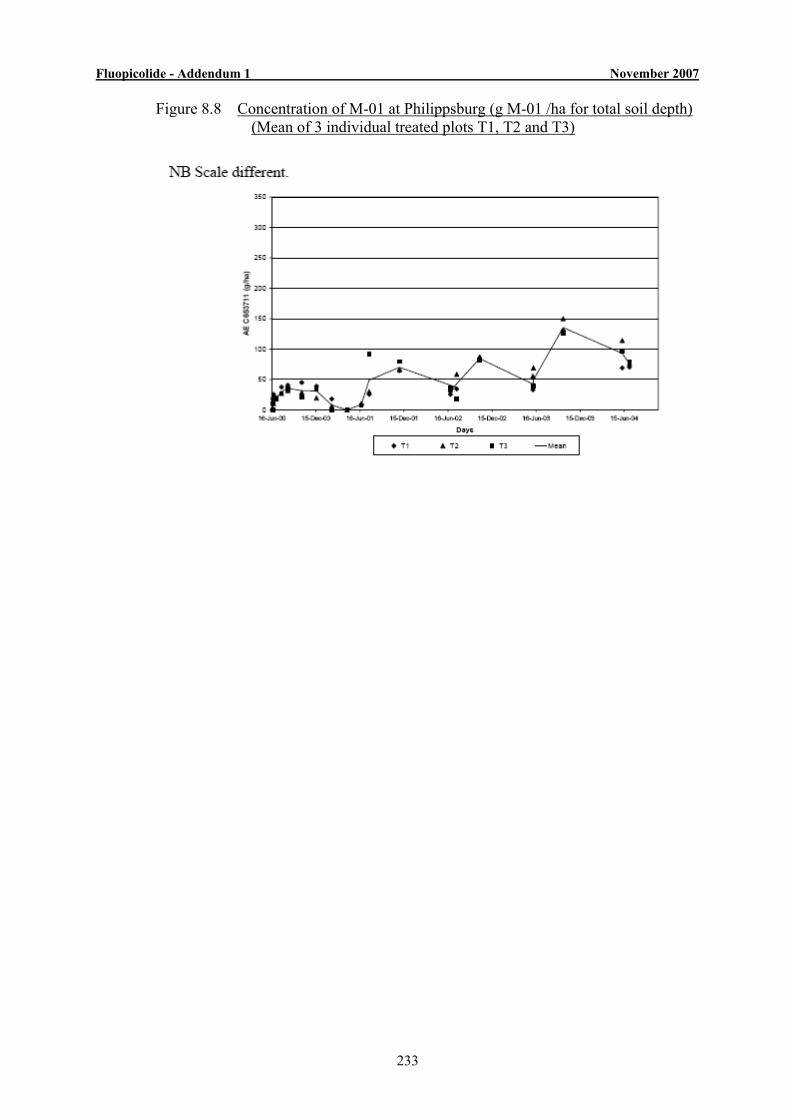
Fluopicolide - Addendum 1 November 2007
233
Figure 8.8 Concentration of M-01 at Philippsburg (g M-01 /ha for total soil depth) (Mean of 3 individual treated plots T1, T2 and T3)
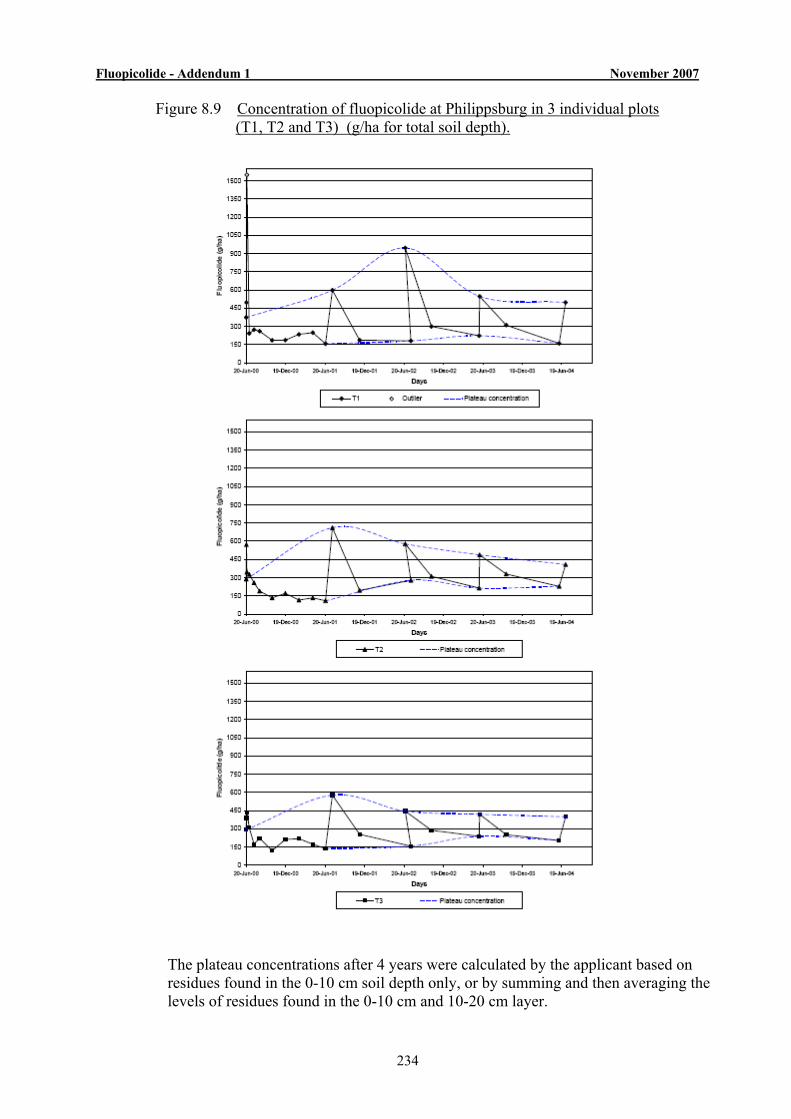
Fluopicolide - Addendum 1 November 2007
234
Figure 8.9 Concentration of fluopicolide at Philippsburg in 3 individual plots (T1, T2 and T3) (g/ha for total soil depth).
The plateau concentrations after 4 years were calculated by the applicant based on residues found in the 0-10 cm soil depth only, or by summing and then averaging the levels of residues found in the 0-10 cm and 10-20 cm layer.
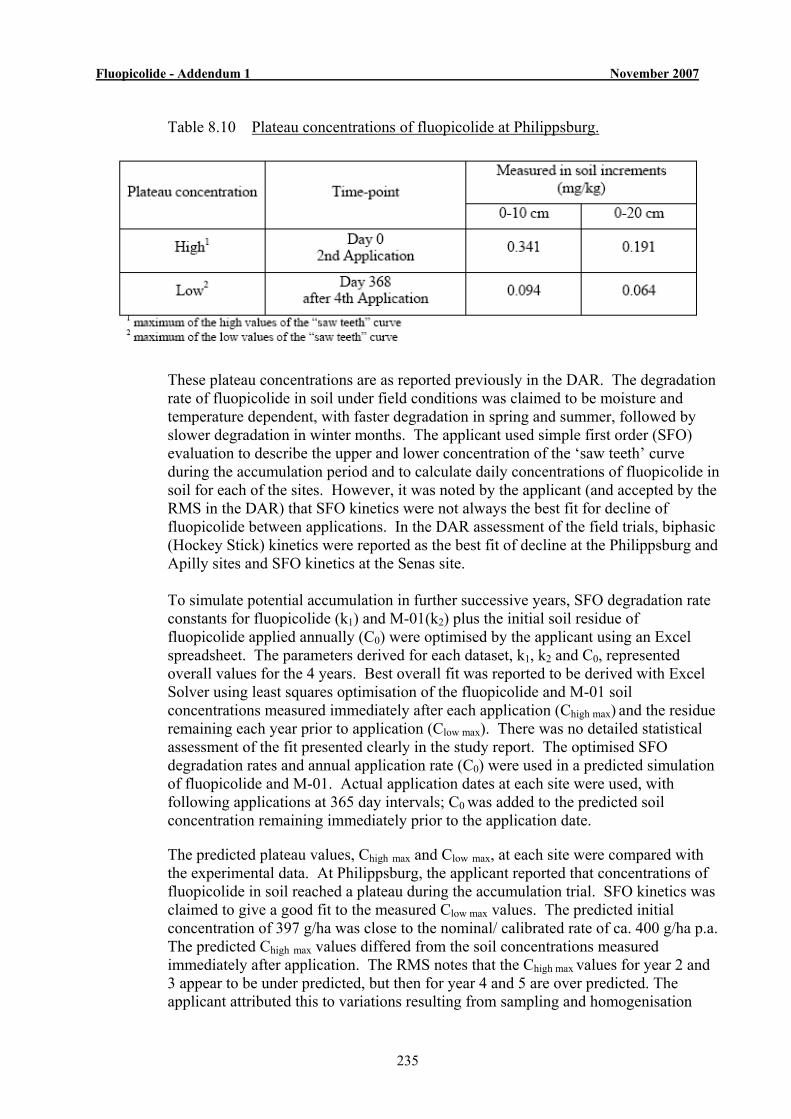
Fluopicolide - Addendum 1 November 2007
235
Table 8.10 Plateau concentrations of fluopicolide at Philippsburg.
These plateau concentrations are as reported previously in the DAR. The degradation rate of fluopicolide in soil under field conditions was claimed to be moisture and temperature dependent, with faster degradation in spring and summer, followed by slower degradation in winter months. The applicant used simple first order (SFO) evaluation to describe the upper and lower concentration of the ‘saw teeth’ curve during the accumulation period and to calculate daily concentrations of fluopicolide in soil for each of the sites. However, it was noted by the applicant (and accepted by the RMS in the DAR) that SFO kinetics were not always the best fit for decline of fluopicolide between applications. In the DAR assessment of the field trials, biphasic (Hockey Stick) kinetics were reported as the best fit of decline at the Philippsburg and Apilly sites and SFO kinetics at the Senas site. To simulate potential accumulation in further successive years, SFO degradation rate constants for fluopicolide (k1) and M-01(k2) plus the initial soil residue of fluopicolide applied annually (C0) were optimised by the applicant using an Excel spreadsheet. The parameters derived for each dataset, k1, k2 and C0, represented overall values for the 4 years. Best overall fit was reported to be derived with Excel Solver using least squares optimisation of the fluopicolide and M-01 soil concentrations measured immediately after each application (Chigh max) and the residue remaining each year prior to application (Clow max). There was no detailed statistical assessment of the fit presented clearly in the study report. The optimised SFO degradation rates and annual application rate (C0) were used in a predicted simulation of fluopicolide and M-01. Actual application dates at each site were used, with following applications at 365 day intervals; C0 was added to the predicted soil concentration remaining immediately prior to the application date.
The predicted plateau values, Chigh max and Clow max, at each site were compared with the experimental data. At Philippsburg, the applicant reported that concentrations of fluopicolide in soil reached a plateau during the accumulation trial. SFO kinetics was claimed to give a good fit to the measured Clow max values. The predicted initial concentration of 397 g/ha was close to the nominal/ calibrated rate of ca. 400 g/ha p.a. The predicted Chigh max values differed from the soil concentrations measured immediately after application. The RMS notes that the Chigh max values for year 2 and 3 appear to be under predicted, but then for year 4 and 5 are over predicted. The applicant attributed this to variations resulting from sampling and homogenisation
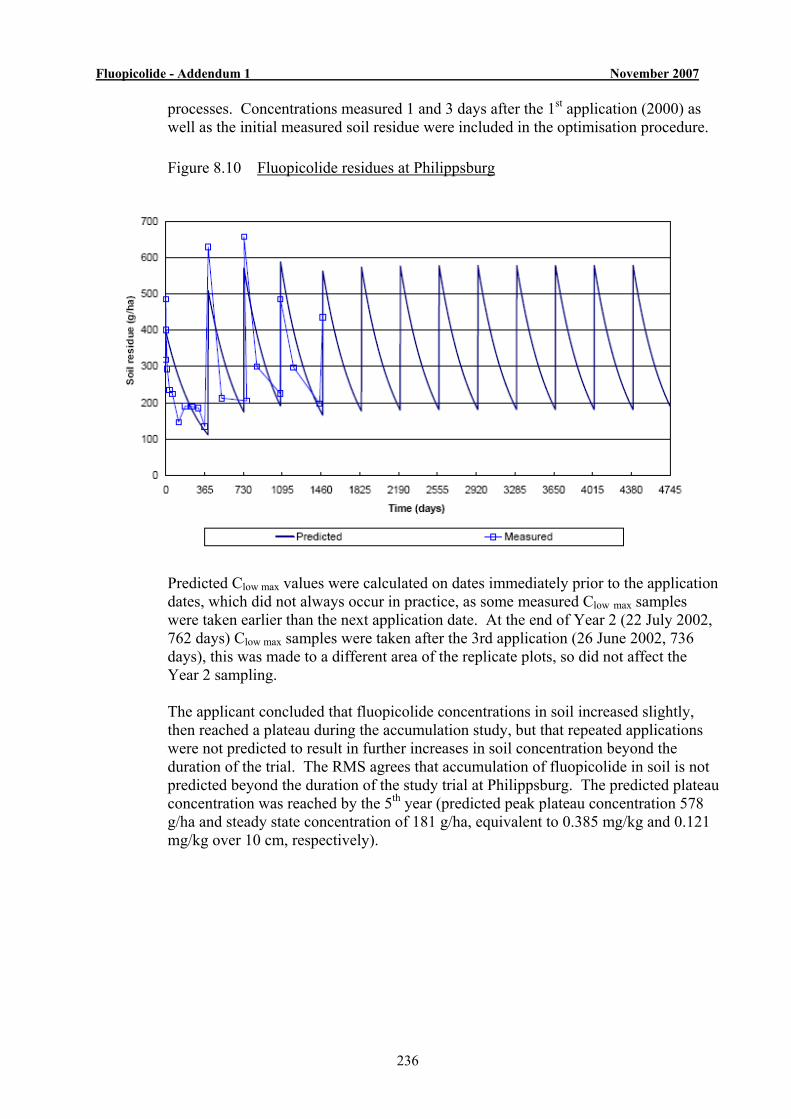
Fluopicolide - Addendum 1 November 2007
236
processes. Concentrations measured 1 and 3 days after the 1st application (2000) as well as the initial measured soil residue were included in the optimisation procedure.
Figure 8.10 Fluopicolide residues at Philippsburg
Predicted Clow max values were calculated on dates immediately prior to the application dates, which did not always occur in practice, as some measured Clow max samples were taken earlier than the next application date. At the end of Year 2 (22 July 2002, 762 days) Clow max samples were taken after the 3rd application (26 June 2002, 736 days), this was made to a different area of the replicate plots, so did not affect the Year 2 sampling. The applicant concluded that fluopicolide concentrations in soil increased slightly, then reached a plateau during the accumulation study, but that repeated applications were not predicted to result in further increases in soil concentration beyond the duration of the trial. The RMS agrees that accumulation of fluopicolide in soil is not predicted beyond the duration of the study trial at Philippsburg. The predicted plateau concentration was reached by the 5th year (predicted peak plateau concentration 578 g/ha and steady state concentration of 181 g/ha, equivalent to 0.385 mg/kg and 0.121 mg/kg over 10 cm, respectively).
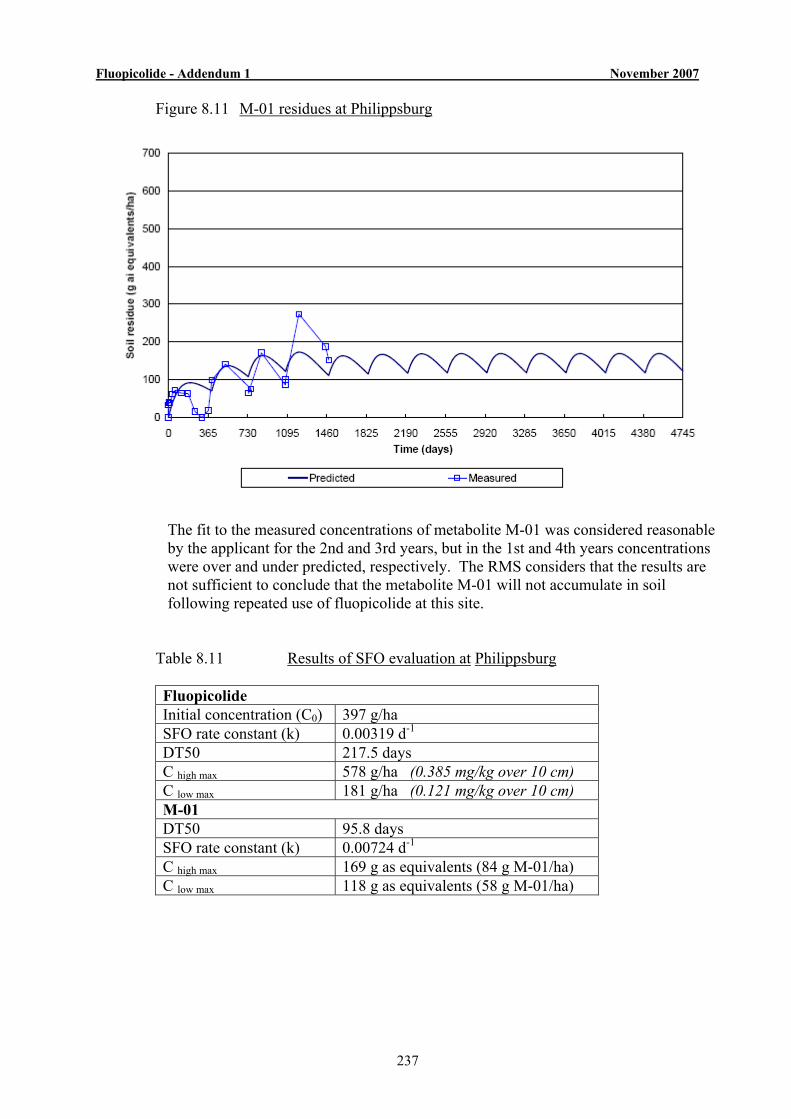
Fluopicolide - Addendum 1 November 2007
237
Figure 8.11 M-01 residues at Philippsburg
The fit to the measured concentrations of metabolite M-01 was considered reasonable by the applicant for the 2nd and 3rd years, but in the 1st and 4th years concentrations were over and under predicted, respectively. The RMS considers that the results are not sufficient to conclude that the metabolite M-01 will not accumulate in soil following repeated use of fluopicolide at this site.
Table 8.11 Results of SFO evaluation at Philippsburg Fluopicolide Initial concentration (C0) 397 g/ha SFO rate constant (k) 0.00319 d-1 DT50 217.5 days C high max 578 g/ha (0.385 mg/kg over 10 cm) C low max 181 g/ha (0.121 mg/kg over 10 cm) M-01 DT50 95.8 days SFO rate constant (k) 0.00724 d-1 C high max 169 g as equivalents (84 g M-01/ha) C low max 118 g as equivalents (58 g M-01/ha)
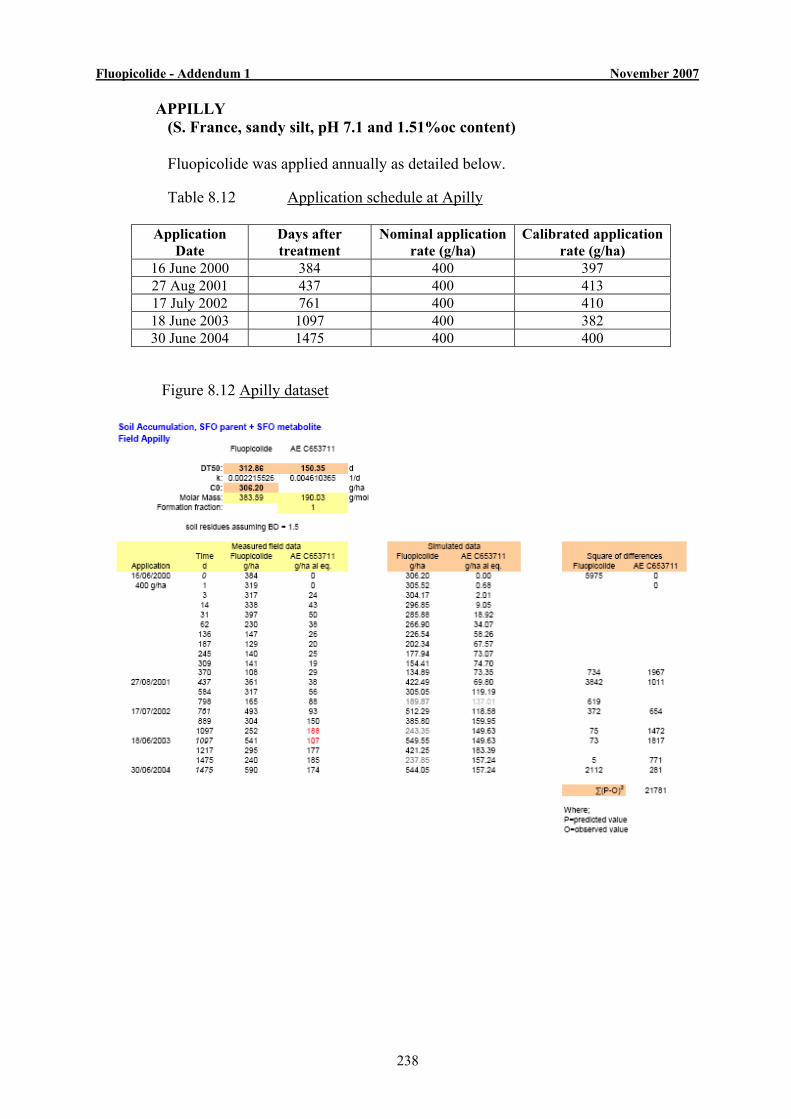
Fluopicolide - Addendum 1 November 2007
238
APPILLY (S. France, sandy silt, pH 7.1 and 1.51%oc content) Fluopicolide was applied annually as detailed below.
Table 8.12 Application schedule at Apilly
Application
Date Days after treatment
Nominal application rate (g/ha)
Calibrated application rate (g/ha)
16 June 2000 384 400 397 27 Aug 2001 437 400 413 17 July 2002 761 400 410 18 June 2003 1097 400 382 30 June 2004 1475 400 400
Figure 8.12 Apilly dataset
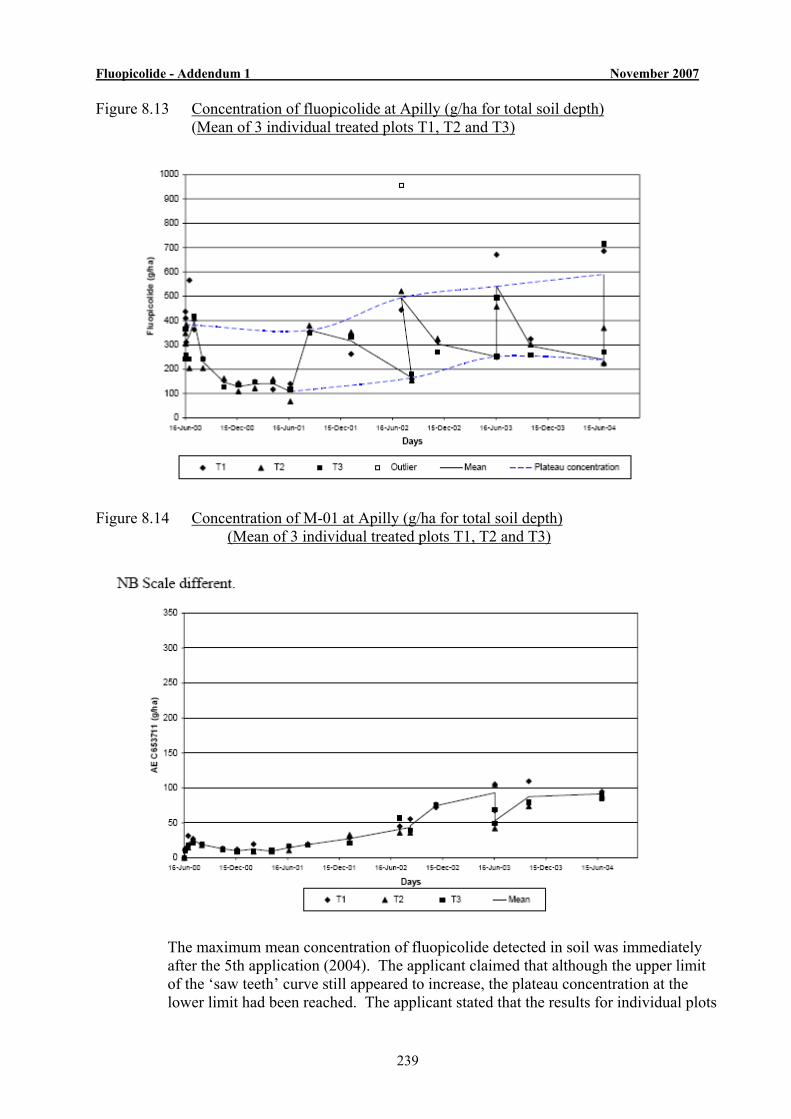
Fluopicolide - Addendum 1 November 2007
239
Figure 8.13 Concentration of fluopicolide at Apilly (g/ha for total soil depth) (Mean of 3 individual treated plots T1, T2 and T3)
Figure 8.14 Concentration of M-01 at Apilly (g/ha for total soil depth)
(Mean of 3 individual treated plots T1, T2 and T3)
The maximum mean concentration of fluopicolide detected in soil was immediately after the 5th application (2004). The applicant claimed that although the upper limit of the ‘saw teeth’ curve still appeared to increase, the plateau concentration at the lower limit had been reached. The applicant stated that the results for individual plots
Fluopicolide - Addendum 1 November 2007
240
showed good replication between the plots immediately prior to each application and that the Clow max values reached a plateau by the study end. There was some variation in concentrations immediately after application (Chigh max) between replicate plots, Chigh max appeared level at last point in plot T1, slightly declined in plot T2 and increased in plot T3, (in which one of the applications was excluded as an outlier). The applicant noted that this was compared to good replication at later time points and attributed the variation to the uncertainties of sampling and homogenising soil samples after application when residues were only present in the top ≤1 cm layer of soil core. The applicant concluded that measured Chigh max values reached a plateau in two of the three experimental plots. The RMS notes that for individual plot T3, the Clow max showed a very slight increase and although for plots T1 and T2, Clow max decreased by the study end, this was only at the last sample point. The RMS does not consider that there is sufficient evidence to show that a plateau concentration was reached at this site at two of the three plots. The RMS considers there is insufficient evidence to show that the metabolite M-01 had reached a plateau concentration at this site during the study.
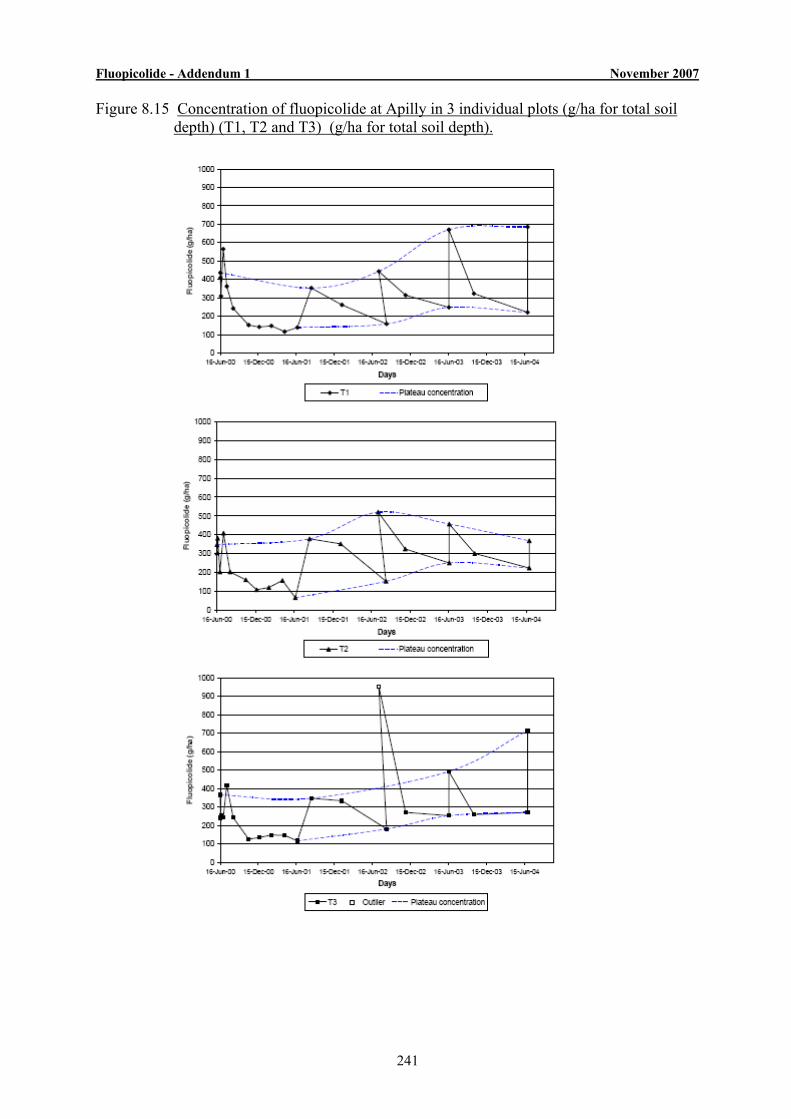
Fluopicolide - Addendum 1 November 2007
241
Figure 8.15 Concentration of fluopicolide at Apilly in 3 individual plots (g/ha for total soil depth) (T1, T2 and T3) (g/ha for total soil depth).
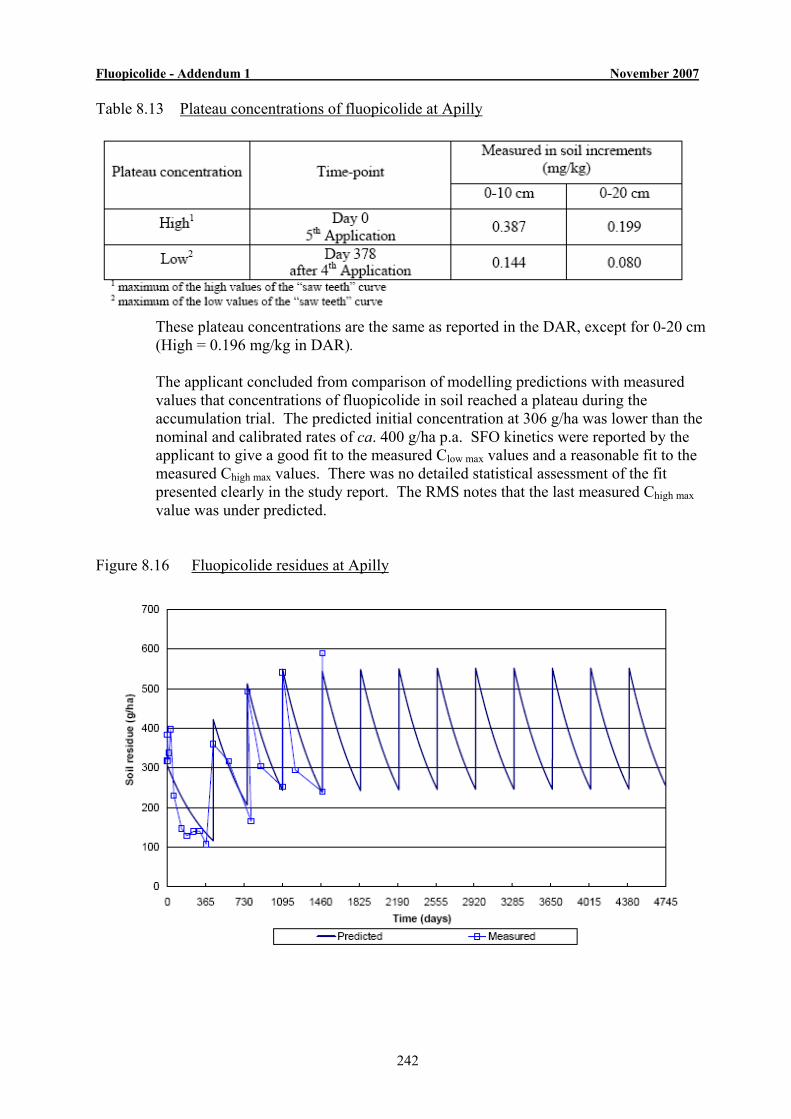
Fluopicolide - Addendum 1 November 2007
242
Table 8.13 Plateau concentrations of fluopicolide at Apilly
These plateau concentrations are the same as reported in the DAR, except for 0-20 cm (High = 0.196 mg/kg in DAR). The applicant concluded from comparison of modelling predictions with measured values that concentrations of fluopicolide in soil reached a plateau during the accumulation trial. The predicted initial concentration at 306 g/ha was lower than the nominal and calibrated rates of ca. 400 g/ha p.a. SFO kinetics were reported by the applicant to give a good fit to the measured Clow max values and a reasonable fit to the measured Chigh max values. There was no detailed statistical assessment of the fit presented clearly in the study report. The RMS notes that the last measured Chigh max value was under predicted.
Figure 8.16 Fluopicolide residues at Apilly
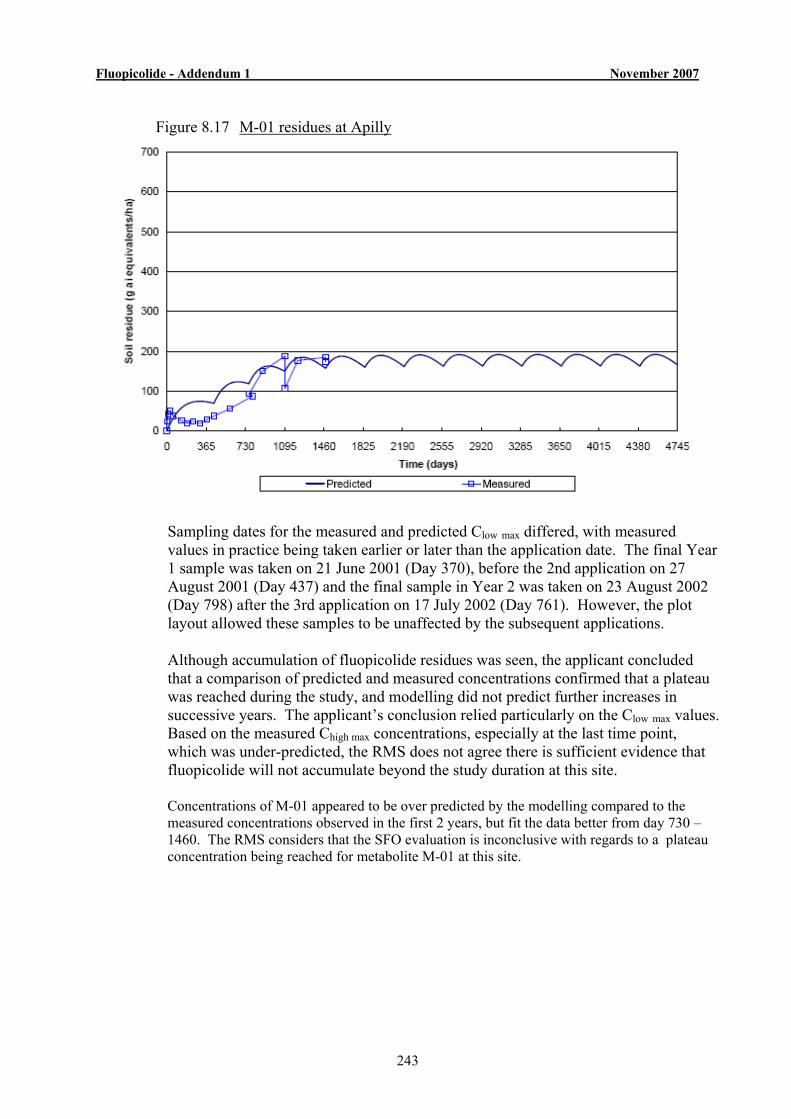
Fluopicolide - Addendum 1 November 2007
243
Figure 8.17 M-01 residues at Apilly
Sampling dates for the measured and predicted Clow max differed, with measured values in practice being taken earlier or later than the application date. The final Year 1 sample was taken on 21 June 2001 (Day 370), before the 2nd application on 27 August 2001 (Day 437) and the final sample in Year 2 was taken on 23 August 2002 (Day 798) after the 3rd application on 17 July 2002 (Day 761). However, the plot layout allowed these samples to be unaffected by the subsequent applications. Although accumulation of fluopicolide residues was seen, the applicant concluded that a comparison of predicted and measured concentrations confirmed that a plateau was reached during the study, and modelling did not predict further increases in successive years. The applicant’s conclusion relied particularly on the Clow max values. Based on the measured Chigh max concentrations, especially at the last time point, which was under-predicted, the RMS does not agree there is sufficient evidence that fluopicolide will not accumulate beyond the study duration at this site.
Concentrations of M-01 appeared to be over predicted by the modelling compared to the measured concentrations observed in the first 2 years, but fit the data better from day 730 –1460. The RMS considers that the SFO evaluation is inconclusive with regards to a plateau concentration being reached for metabolite M-01 at this site.
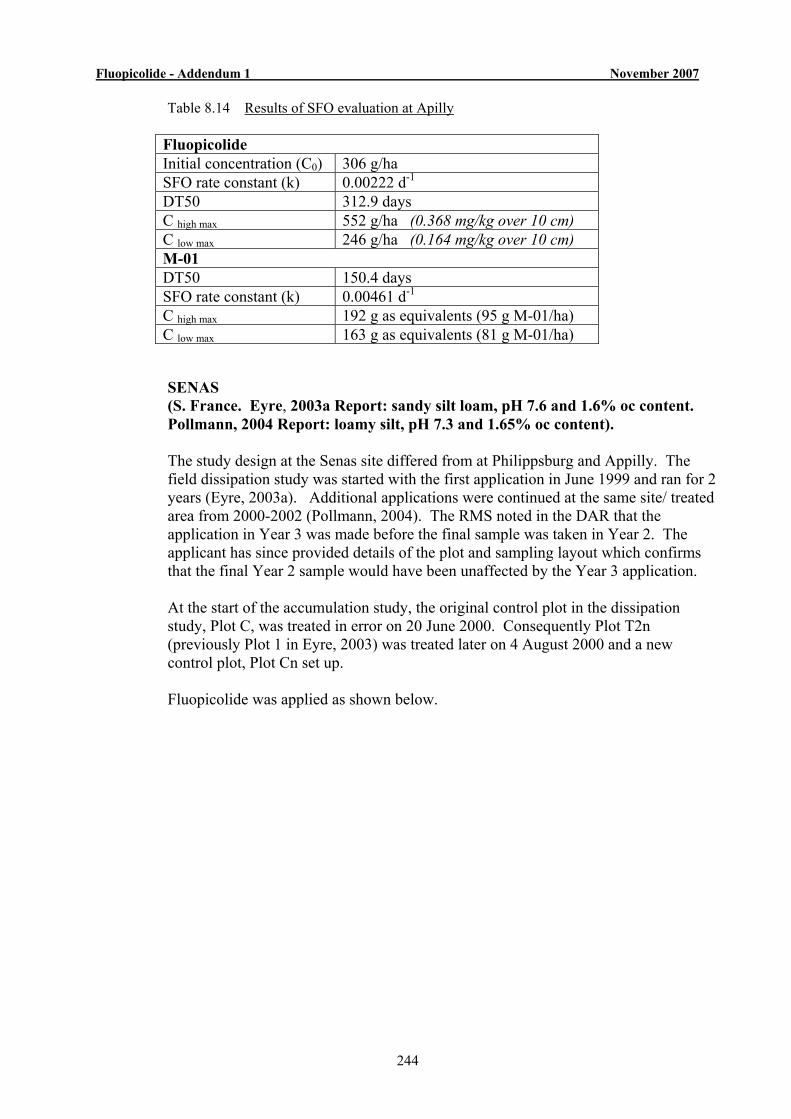
Fluopicolide - Addendum 1 November 2007
244
Table 8.14 Results of SFO evaluation at Apilly Fluopicolide Initial concentration (C0) 306 g/ha SFO rate constant (k) 0.00222 d-1 DT50 312.9 days C high max 552 g/ha (0.368 mg/kg over 10 cm) C low max 246 g/ha (0.164 mg/kg over 10 cm) M-01 DT50 150.4 days SFO rate constant (k) 0.00461 d-1 C high max 192 g as equivalents (95 g M-01/ha) C low max 163 g as equivalents (81 g M-01/ha) SENAS (S. France. Eyre, 2003a Report: sandy silt loam, pH 7.6 and 1.6% oc content. Pollmann, 2004 Report: loamy silt, pH 7.3 and 1.65% oc content). The study design at the Senas site differed from at Philippsburg and Appilly. The field dissipation study was started with the first application in June 1999 and ran for 2 years (Eyre, 2003a). Additional applications were continued at the same site/ treated area from 2000-2002 (Pollmann, 2004). The RMS noted in the DAR that the application in Year 3 was made before the final sample was taken in Year 2. The applicant has since provided details of the plot and sampling layout which confirms that the final Year 2 sample would have been unaffected by the Year 3 application. At the start of the accumulation study, the original control plot in the dissipation study, Plot C, was treated in error on 20 June 2000. Consequently Plot T2n (previously Plot 1 in Eyre, 2003) was treated later on 4 August 2000 and a new control plot, Plot Cn set up. Fluopicolide was applied as shown below.
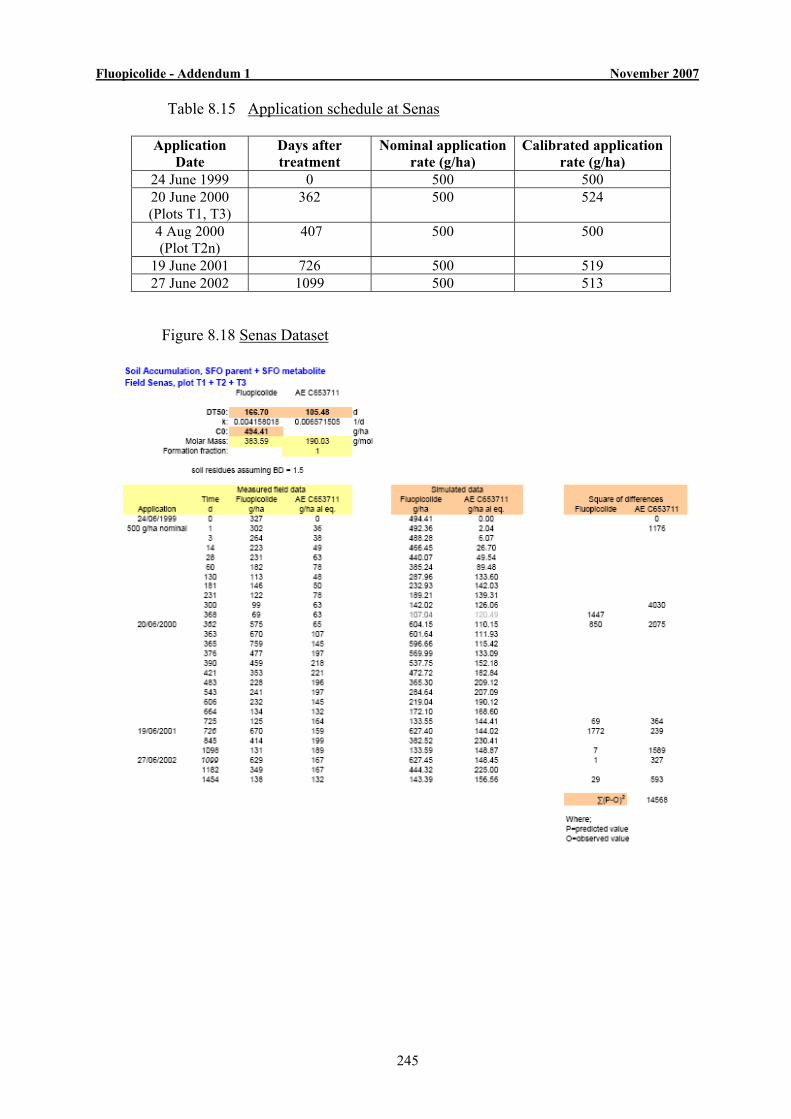
Fluopicolide - Addendum 1 November 2007
245
Table 8.15 Application schedule at Senas Application
Date Days after treatment
Nominal application rate (g/ha)
Calibrated application rate (g/ha)
24 June 1999 0 500 500 20 June 2000 (Plots T1, T3)
362 500 524
4 Aug 2000 (Plot T2n)
407 500 500
19 June 2001 726 500 519 27 June 2002 1099 500 513
Figure 8.18 Senas Dataset
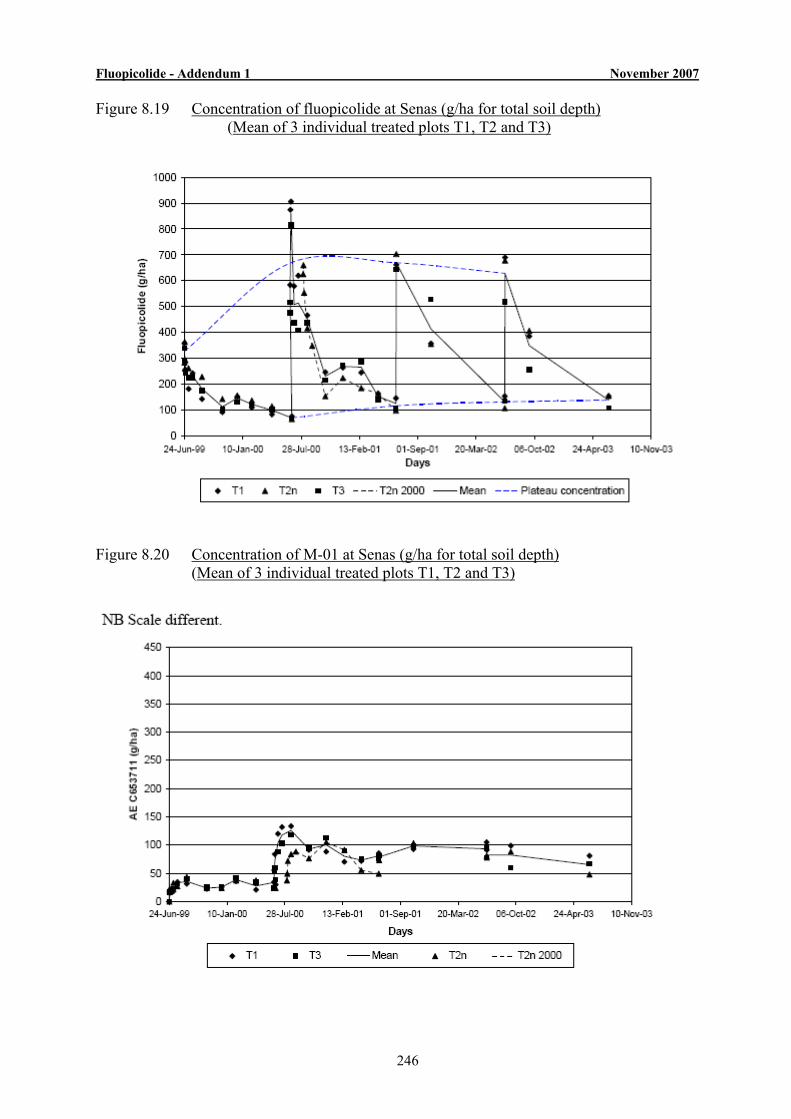
Fluopicolide - Addendum 1 November 2007
246
Figure 8.19 Concentration of fluopicolide at Senas (g/ha for total soil depth) (Mean of 3 individual treated plots T1, T2 and T3)
Figure 8.20 Concentration of M-01 at Senas (g/ha for total soil depth)
(Mean of 3 individual treated plots T1, T2 and T3)

Fluopicolide - Addendum 1 November 2007
247
The maximum concentration of fluopicolide was detected immediately after the 2nd application (2000). It was stated that the rate applied to plots T1 and T3 was apparently higher than the nominal application rate of 500 g/ha. The applicant claimed no further accumulation in the upper limit of the ‘saw teeth’ curve was detected in subsequent applications. It was reported that the lower limit of the ‘saw teeth’ curve reached a plateau concentration after the 2nd application (2000) and remained relatively constant to the study end. However, the RMS observes that for plot T1 the Chigh max appeared to slightly increase at the last time point, while the Clow max levelled off. For plot T2, the Chigh max values appeared to reach a plateau, though the Clow max slightly increased at the end. For Plot T3, both Chigh max and Clow max appeared to have reached a plateau. The applicant attributed the slight increase observed in the mean Clow max values from 2002 (131 g/ha) to 2003 (138 g/ha) as due to experimental variation and to not be significant, (difference between the 2 measurements equated to 0.005 mg/kg, the limit of detection). The applicant concluded that measured Chigh max values in the 3 experimental plots and Clow max values in 2 of the 3 plots had reached a plateau at Senas. Measured soil concentrations after the 1st and 2nd applications did not match the nominal and calibrated application rates. In the report Eyre, 2003 the apparent application rate in 1999 (at 327 g/ha) was lower than intended (500 g/ha). In the report (Pollmann, 2004) residue levels after application in 2000 were not considered appropriate as the soil concentrations of fluopicolide measured indicated the rate applied had significantly exceeded the nominal and calibrated application rate (of 500 g/ha). Therefore, only the subsequent years following application in 2001 and 2002 were considered for the evaluation of the plateau concentrations.
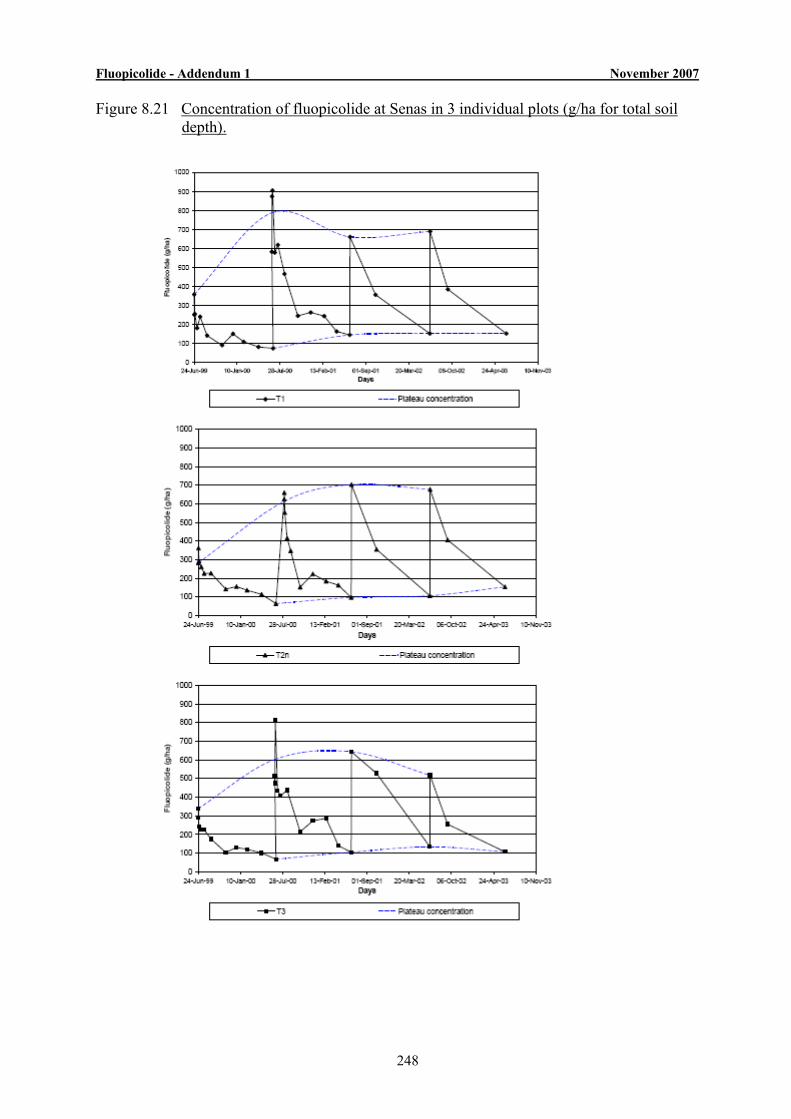
Fluopicolide - Addendum 1 November 2007
248
Figure 8.21 Concentration of fluopicolide at Senas in 3 individual plots (g/ha for total soil depth).

Fluopicolide - Addendum 1 November 2007
249
Table 8.16 Plateau concentrations of fluopicolide at Senas
These plateau concentrations are as reported in the DAR except Low (0-10 cm/0-20 cm) was previously 0.061/0.046 mg/kg (day 355 after application 3). The applicant concluded that based on comparison of measured and predicted concentrations of fluopicolide in soil, a plateau concentration was reached at Senas, with SFO kinetics providing a good fit to the measured Clow max values. (There was no detailed statistical assessment of fit presented clearly in the study report). The predicted initial concentration (494 g/ha) was close to the nominal and calibrated application rates (ca. 500 g/ha). However, the predicted and measured soil concentrations immediately after the 1st and 2nd applications differed from nominal and calibrated application rates. In the original assessment, the residue levels after application in 2000 were excluded for the assessment of the plateau concentrations, as there were indications that the rate applied had significantly exceeded 500 g/ha. Only the later years (application in 2001 and 2002) were considered. In this evaluation the initial soil residue measured in the first year (1999) was omitted from the optimisation, as the apparent application rate (327 g/ha) was lower than that achieved in later years, but all other years were considered. The final measured Clow max value of Year 1 (26 June 2000, 368 days) was taken after the 2nd application date (20 June 2000, 362 days, Plots T1 and T3), but details of the plot layout confirmed that this sample was not affected by the Year 2 application.
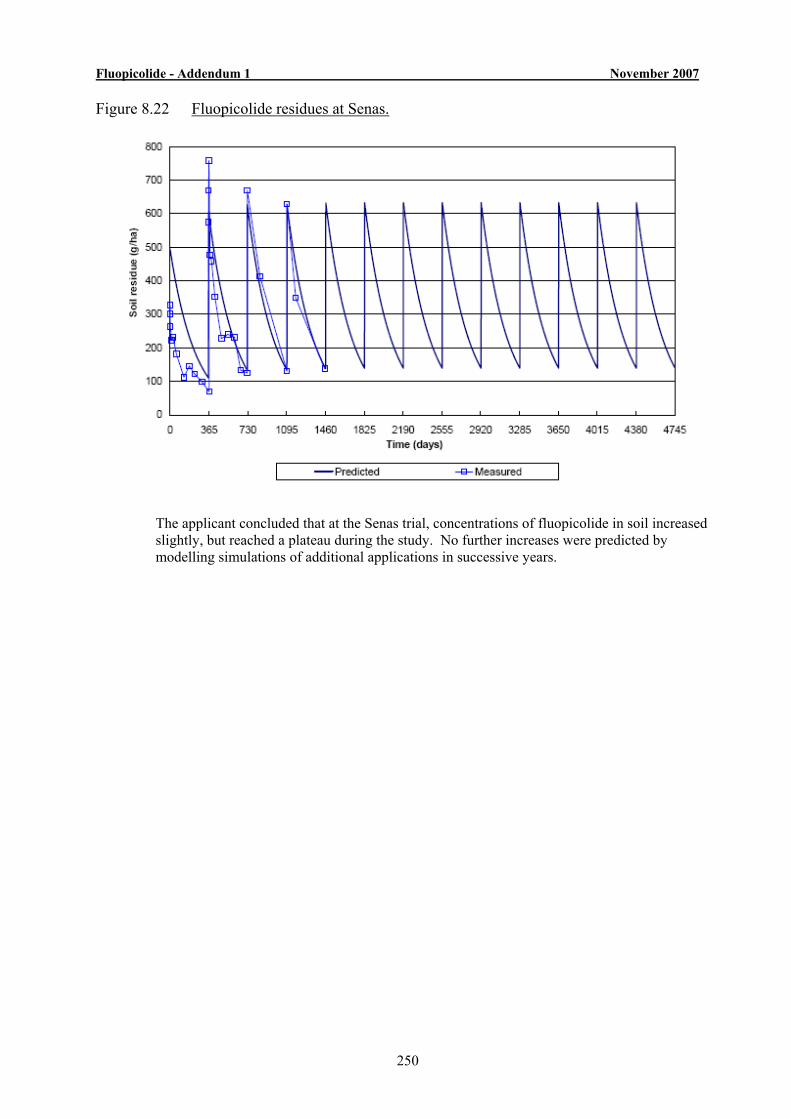
Fluopicolide - Addendum 1 November 2007
250
Figure 8.22 Fluopicolide residues at Senas.
The applicant concluded that at the Senas trial, concentrations of fluopicolide in soil increased slightly, but reached a plateau during the study. No further increases were predicted by modelling simulations of additional applications in successive years.
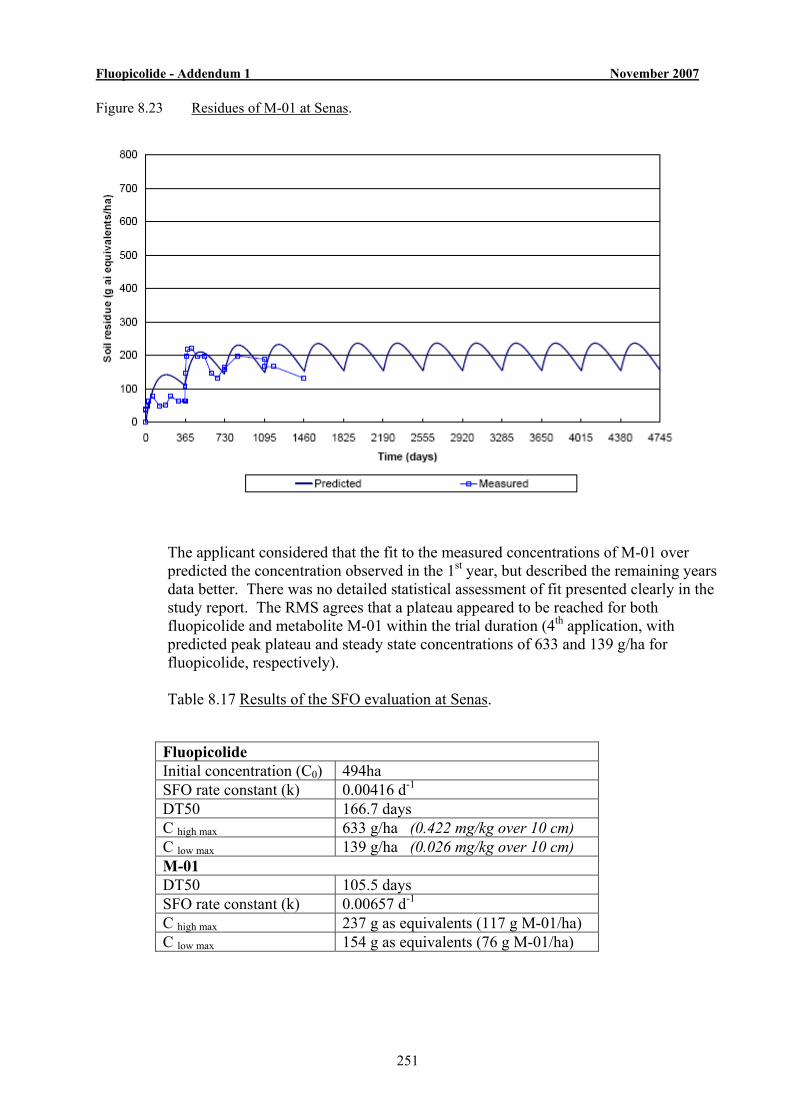
Fluopicolide - Addendum 1 November 2007
251
Figure 8.23 Residues of M-01 at Senas.
The applicant considered that the fit to the measured concentrations of M-01 over predicted the concentration observed in the 1st year, but described the remaining years data better. There was no detailed statistical assessment of fit presented clearly in the study report. The RMS agrees that a plateau appeared to be reached for both fluopicolide and metabolite M-01 within the trial duration (4th application, with predicted peak plateau and steady state concentrations of 633 and 139 g/ha for fluopicolide, respectively). Table 8.17 Results of the SFO evaluation at Senas.
Fluopicolide Initial concentration (C0) 494ha SFO rate constant (k) 0.00416 d-1 DT50 166.7 days C high max 633 g/ha (0.422 mg/kg over 10 cm) C low max 139 g/ha (0.026 mg/kg over 10 cm) M-01 DT50 105.5 days SFO rate constant (k) 0.00657 d-1 C high max 237 g as equivalents (117 g M-01/ha) C low max 154 g as equivalents (76 g M-01/ha)
Fluopicolide - Addendum 1 November 2007
252
RMS Risk Assessment and Conclusions:
Fluopicolide To summarise the results from the three sites: At the Philippsburg site, the measured concentrations of fluopicolide from two of three trial plots (T1 and T3) indicated that a plateau concentration was likely to have been reached during the trial. For the third plot T2, the Chigh max values appeared to have plateaued by the study end, though Clow
max slightly increased at the last sampling point. However, based on mean values a plateau concentration appeared to be reached by the study end. Modelling, with SFO kinetics predicted no further increase in residues from repeated applications in successive years after the trial. This modelling underestimated measured Chigh max residues at the 2nd and 3rd applications, but overestimated them for the 4th and 5th applications. The plateau concentration was predicted to be reached by the 5th year with Chigh max and Clow max values of 578 and 181 g/ha, respectively. The RMS considers that the overall data indicate that fluopicolide appeared to have reached a plateau concentration within the study duration. At the Apilly site, the measured concentrations of fluopicolide from one of three trial plots (T3) indicated that a plateau was not reached, both Chigh max and Clow max values were still increasing at the study end. In plot T1, Chigh max and Clow max appeared to plateau, but only at the last sampling point and at plot T2, Chigh max clearly declined, though Clow max values were again only level at the last point. Based on mean values the Clow max values appeared to plateau but the Chigh max values did not. No further increase in residues beyond the trial was predicted by modelling, with SFO kinetics after repeated applications in successive years. The plateau concentration was predicted by the applicant to be reached by the 5th year with Chigh max and Clow max values of 552and 246 g/ha, respectively. The RMS considers that this modelling underestimated measured Chigh max residues at last (5th) application and that the data are inconclusive as to whether a plateau was reached during the trial. At the Senas site, the measured concentrations of fluopicolide from one of three trial plots (T3) indicated that a plateau was reached. At the T1 plot, Chigh max slightly increased at the last point though Clow max had reached a plateau. For plot T2, Chigh max values had plateaued, though the Clow max value was still increasing at the study end. The RMS considers that overall, based on mean Chigh max values, concentrations had reached a plateau and the Clow max values, though close to levelling off, were very slightly increasing at the study end. Modelling, assuming SFO kinetics predicted no further increases based on repeated applications in successive years after the trial. This modelling underestimated measured Chigh max residues at 2nd application, but the fit to later years was reasonable. The plateau concentration was predicted by the applicant to be reached by the last (4th) year with Chigh max and Clow max values of 633and 139 g/ha, respectively. Therefore, the RMS accepts that a plateau concentration appeared to have been reached for fluopicolide at the Senas site within the study duration. The applicant compared the maximum residue level observed for fluopicolide at each site after 4 years (Chigh max 0.341-0.387 mg/kg over 10 cm) as equivalent to 1.1 -1.5 times the residue in soil after a single application. (In support of this, the RMS estimates an initial PECsoil after a single application of 400-500 g a.s/ha of 0.267-
Fluopicolide - Addendum 1 November 2007
253
0.333 mg/kg over 10 cm soil depth, based on a simple first tier calculation with no interception assumed). M-01 Concentrations of the metabolite M-01 (AE C653711) were not predicted by the applicant to significantly increase in soil, in successive years after the study duration at each site. However, the agreement between the concentrations predicted by SFO modelling and the measured concentrations was less robust. The RMS considered that based on the measured data there was insufficient evidence of a plateau concentration being reached for M-01 at the Philippsburg and Apilly sites during the trials, although a plateau concentration for M-01 did appear to be reached at the Senas site. The RMS considered that for Philippsburg site the modelling clearly underestimated the concentrations of M-01 at the last time point. For the Apilly site, the RMS considered that the predicted concentrations for M-01 were closer to the measured data (except for under-estimations in the first year) and that at the Senas site, the modelling appeared to generally over predict concentrations of M-01. The RMS proposes that further discussion is needed at the expert meeting over the general acceptability of this type of higher tier approach, versus a simple first tier calculation of PECsoil accumulation. Further discussion may also be warranted over how best to interpret measured versus predicted concentrations in soil and the results of individual plots compared to mean results at each site, in reaching an overall conclusion on the potential for accumulation of an active substance. Implications for Ecotoxicogical Assessment: No implications for the ecotoxicolgical assessment at present. However, the PECsoil may need to be reassessed on the basis of the PRAPeR expert meeting discussion.
(Kley, C; Mackenzie, E; M-267721-01-1, 2007) B.8.6.2 Predicted environmental concentrations in groundwater.
Data Requirement 4.3 “Applicant to provide results with a second FOCUS model following the recommendations given in the PPR Opinion: Opinion of the Scientific Panel on Plant Health, Plant Protection Products and their Residues on a request of EFSA related to FOCUS groundwater models. The EFSA Journal (2004) 93, 1-20. For some of the metabolites it may not be confirmed that the triggers of 0.75 µg/L and 10 µg/L are not exceeded in some scenarios. A second model is necessary to reduce the uncertainty and confirm the non relevance of the metabolites. Applicant indicated to submit new PEC GW calculations with a second model and lower interception rate for vines by May 2007.
Fluopicolide - Addendum 1 November 2007
254
See reporting table 4(79).” Data Requirement 4.4 “Applicant to repeat the FOCUS GW calculations following the GAP as reported in the Representative uses table. Applicant indicated to submit repeated PEC GW calculations with a lower interception rate for vines by May 2007. See reporting table 4(80).” Background: Potential contamination of groundwater by fluopicolide was assessed with only one FOCUS model, (DAR, B.8.6.2), as the submission was made prior to the PPR Opinion12 recommending the results of two models are needed to complete the risk assessment. The applicant was requested to provide results for FOCUS GW modelling with a second FOCUS model to reduce uncertainty and confirm the non-relevance of metabolites, following recommendations given in the PPR Opinion (EFSA Journal (2004) 93, 1-20). For the PECgw calculation (DAR, B.8.6.2) it was assumed a one in three year crop rotation was representative of good agricultural practice in potatoes. However, as crop rotation is not mandatory and the ‘representative’ use concept implies the assessment is also applicable to other crops represented by the specific crop listed, the applicant was requested to repeat the FOCUS GW calculations following the GAP as reported in the Representative uses table. Similarly, the applicant was requested to repeat the FOCUS GW modelling with a lower interception rate for vines. (Reporting Table, points 4(79), 4(80) and 4(81)).
Summary of approach taken to address Data requirements 4.3 and 4.4 The applicant has performed new FOCUS groundwater modelling with PELMO. These simulations include lower interception rates for use on vines and also for modelling of use on potatoes, application of fluopicolide once every year and every 2 years, as well the previously assessed 1-in-3 year crop rotation pattern. Furthermore, as a second FOCUS groundwater model was required, in accordance with the PPR opinion (EFSA Journal (2004) 93, 1-20), the applicant has performed PECgw calculations for use of fluopicolide on vines and potatoes, using the PEARL model. In the original assessment, batch equilibrium studies (Rupprecht 2003 & Simmonds 2003) were previously evaluated in the DAR B.8.2.1 (a) and (b) and sorption of fluopicolide was correlated with organic carbon/matter content of the soil. However, these studies do not take into account kinetically controlled sorption behaviour and so may, in the view of the applicant, underestimate sorption and overestimate mobility.
12 Opinion of the Scientific Panel on Plant Health, Plant Protection Products and their Residues on a request of EFSA
related to FOCUS groundwater models. The EFSA Journal (2004) 93, 1-20.
Fluopicolide - Addendum 1 November 2007
255
Time-dependent laboratory sorption studies (Fitzmaurice, 2003, Allan, 2003b) were carried out to investigate kinetic sorption and reported in the DAR, B.8.2.1.(c) & (d), although these were not relied on for the exposure assessment presented in the original DAR. The Koc was increased by a factor of ca. 2.1 over 23 days (Fitzmaurice, 2003) and ca. 2.3 over 121 days (Allan, 2003b) indicating stronger sorption of fluopicolide with time. Time-dependent sorption is proposed by the applicant, as a possible explanation for the bi-phasic behaviour of fluopicolide in some field dissipation trials. In this new assessment, the applicant has taken into account data on time-dependent sorption for fluopicolide using the PEARL model and its ability to simulate non-equilibrium sorption (PEARL NEQ). In the PEARL NEQ model, sorption of substances in soil is described by a Freundlich type equation, with both equilibrium and non-equilibrium (kinetic) sorption being able to be considered. Sorption in the equilibrium domain of the soil system is assumed to occur instantaneously, whereas sorption in the non-equilibrium domain proceeds gradually. As pesticide is assumed to be present in both domains, 2 mass balance equations are needed.13 The mass balance equation for sorption in the non-equilibrium domain requires additional parameters i.e. the desorption rate coefficient (kd) and a factor describing the ratio (FNE) between the Freundlich coefficients at the equilibrium (EQ) and non-equilibrium (NEQ) sites i.e. (FNE = Kf, NEQ/ Kf,EQ). In the PEARL NEQ model, it is assumed that transformation of a pesticide only occurs in the equilibrium domain. Therefore, as the transformation half-life can only apply to the equilibrium domain, it must be obtained using an alternative approach for this purpose, (whereas DT50 values commonly reported for pesticides usually refer to the total mass content of pesticide). An example of such an approach for transformation of compound in case of sorption/ desorption kinetics is described in section 3.2.10 of the RIVM report 711401 008.14 To take into account time-dependent sorption in the PEARL model, new parameters were needed for degradation rate constant for a.s. in equilibrium phases, desorption rate constant (kd) and ratio of Freundlich coefficients for equilibrium and non-equilibrium sites (fNE). Two new studies have been submitted (Kley, 2004 MEF-04/346 and MEF -04/347) in which the applicant has used a kinetic sorption model to describe the kinetic processes influencing sorption of fluopicolide and to obtain parameter values that could be used in a higher tier assessment. (Metabolites were not considered).
13 From RIVM report 711401 008. Alterra report 28. Manual of FOCUS PEARL v 1.1.1. November 2000. A. Tiktak,
F. van den Berg, J.j.T.I Doesten, D.van Kraalingen, M.Leistra & A.M.A. van der Linden: 2.5.3. …..two mass balances apply: ∂c*
eq / ∂t = -Rs - ∂J p,L / ∂z - ∂J p,g / ∂z – Rt – Ru - Rd and ∂c*
neq / ∂t = Rs
where c*
eq (kg m-3) and c*neq (kg m-3) are the pesticide concentrations in the equilibrium and non-equilibrium domains of
the soil system, respectively. Rs (kg m-3 d-1) is the volumic mass rate of pesticide sorption. J p,L and J p,g (kg m-2 d-1) are the mass flux of pesticide in the liquid and gas phases, respectively. Rt and Rt (kg m-3 d-1) are the transformation and formation rates , respectively. Ru (kg m-3 d-1) is the rate of pesticide uptake by plant roots and Rd (kg m-3 d-1) is the lateral discharge rate of pesticides.
14 RIVM report 711401 008. Alterra report 28. Manual of FOCUS PEARL v 1.1.1. November 2000. A. Tiktak, F.
van den Berg, J.J.T.I Boesten, D.van Kraalingen, M.Leistra & A.M.A. van der Linden.
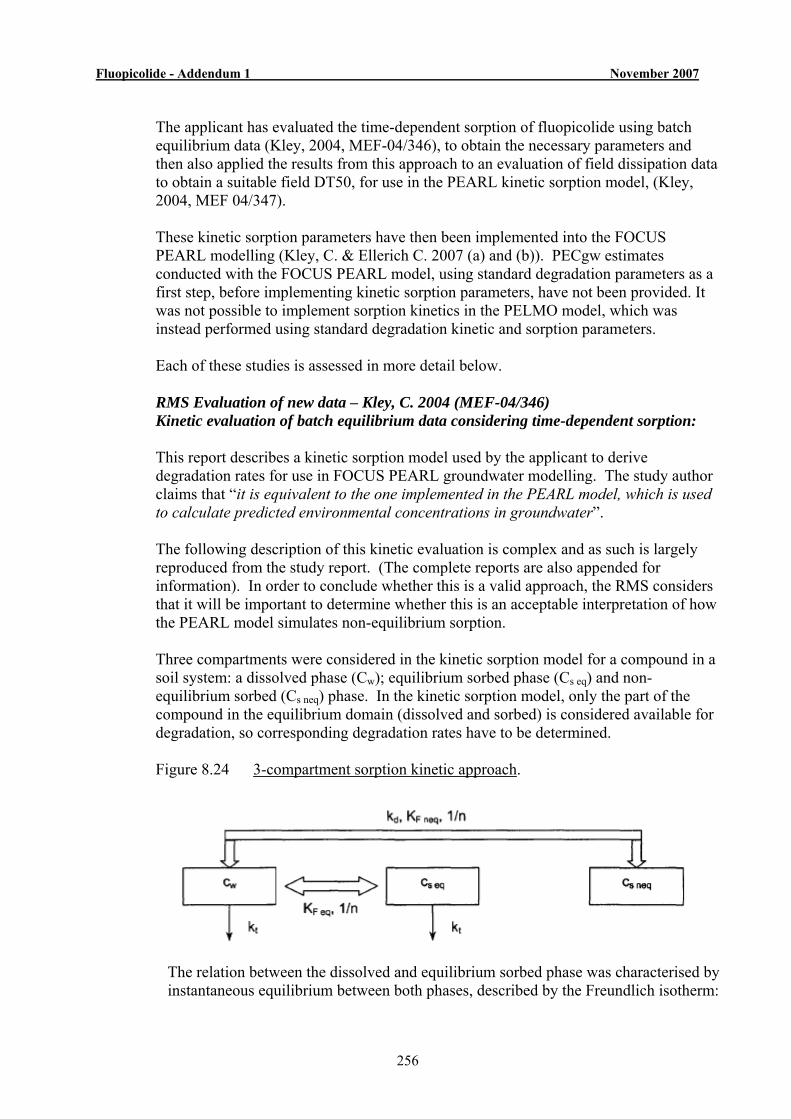
Fluopicolide - Addendum 1 November 2007
256
The applicant has evaluated the time-dependent sorption of fluopicolide using batch equilibrium data (Kley, 2004, MEF-04/346), to obtain the necessary parameters and then also applied the results from this approach to an evaluation of field dissipation data to obtain a suitable field DT50, for use in the PEARL kinetic sorption model, (Kley, 2004, MEF 04/347). These kinetic sorption parameters have then been implemented into the FOCUS PEARL modelling (Kley, C. & Ellerich C. 2007 (a) and (b)). PECgw estimates conducted with the FOCUS PEARL model, using standard degradation parameters as a first step, before implementing kinetic sorption parameters, have not been provided. It was not possible to implement sorption kinetics in the PELMO model, which was instead performed using standard degradation kinetic and sorption parameters. Each of these studies is assessed in more detail below. RMS Evaluation of new data – Kley, C. 2004 (MEF-04/346) Kinetic evaluation of batch equilibrium data considering time-dependent sorption:
This report describes a kinetic sorption model used by the applicant to derive degradation rates for use in FOCUS PEARL groundwater modelling. The study author claims that “it is equivalent to the one implemented in the PEARL model, which is used to calculate predicted environmental concentrations in groundwater”. The following description of this kinetic evaluation is complex and as such is largely reproduced from the study report. (The complete reports are also appended for information). In order to conclude whether this is a valid approach, the RMS considers that it will be important to determine whether this is an acceptable interpretation of how the PEARL model simulates non-equilibrium sorption. Three compartments were considered in the kinetic sorption model for a compound in a soil system: a dissolved phase (Cw); equilibrium sorbed phase (Cs eq) and non-equilibrium sorbed (Cs neq) phase. In the kinetic sorption model, only the part of the compound in the equilibrium domain (dissolved and sorbed) is considered available for degradation, so corresponding degradation rates have to be determined. Figure 8.24 3-compartment sorption kinetic approach.
The relation between the dissolved and equilibrium sorbed phase was characterised by instantaneous equilibrium between both phases, described by the Freundlich isotherm:
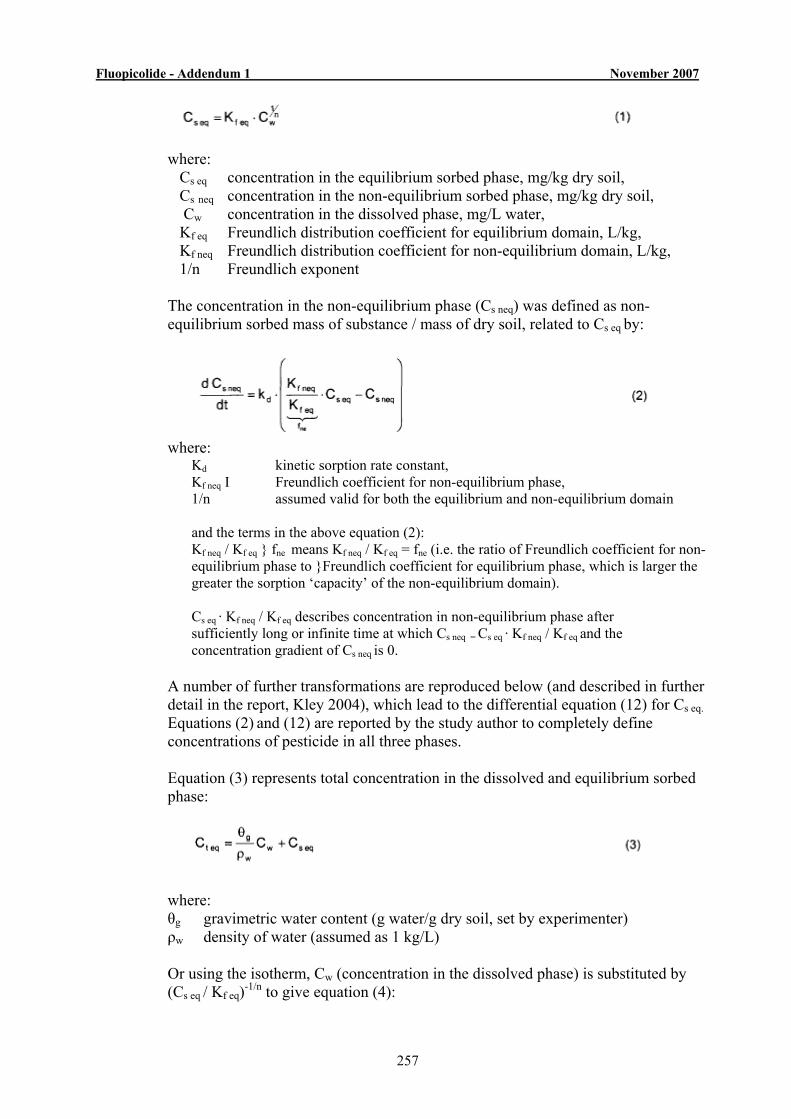
Fluopicolide - Addendum 1 November 2007
257
where:
Cs eq concentration in the equilibrium sorbed phase, mg/kg dry soil, Cs neq concentration in the non-equilibrium sorbed phase, mg/kg dry soil, Cw concentration in the dissolved phase, mg/L water, Kf eq Freundlich distribution coefficient for equilibrium domain, L/kg, Kf neq Freundlich distribution coefficient for non-equilibrium domain, L/kg, 1/n Freundlich exponent
The concentration in the non-equilibrium phase (Cs neq) was defined as non-equilibrium sorbed mass of substance / mass of dry soil, related to Cs eq by:
where:
Kd kinetic sorption rate constant, Kf neq I Freundlich coefficient for non-equilibrium phase, 1/n assumed valid for both the equilibrium and non-equilibrium domain
and the terms in the above equation (2): Kf neq / Kf eq } fne means Kf neq / Kf eq = fne (i.e. the ratio of Freundlich coefficient for non-equilibrium phase to }Freundlich coefficient for equilibrium phase, which is larger the greater the sorption ‘capacity’ of the non-equilibrium domain). Cs eq · Kf neq / Kf eq describes concentration in non-equilibrium phase after sufficiently long or infinite time at which Cs neq = Cs eq · Kf neq / Kf eq and the concentration gradient of Cs neq is 0.
A number of further transformations are reproduced below (and described in further detail in the report, Kley 2004), which lead to the differential equation (12) for Cs eq. Equations (2) and (12) are reported by the study author to completely define concentrations of pesticide in all three phases. Equation (3) represents total concentration in the dissolved and equilibrium sorbed phase:
where: θg gravimetric water content (g water/g dry soil, set by experimenter) ρw density of water (assumed as 1 kg/L) Or using the isotherm, Cw (concentration in the dissolved phase) is substituted by (Cs eq / Kf eq)-1/n to give equation (4):
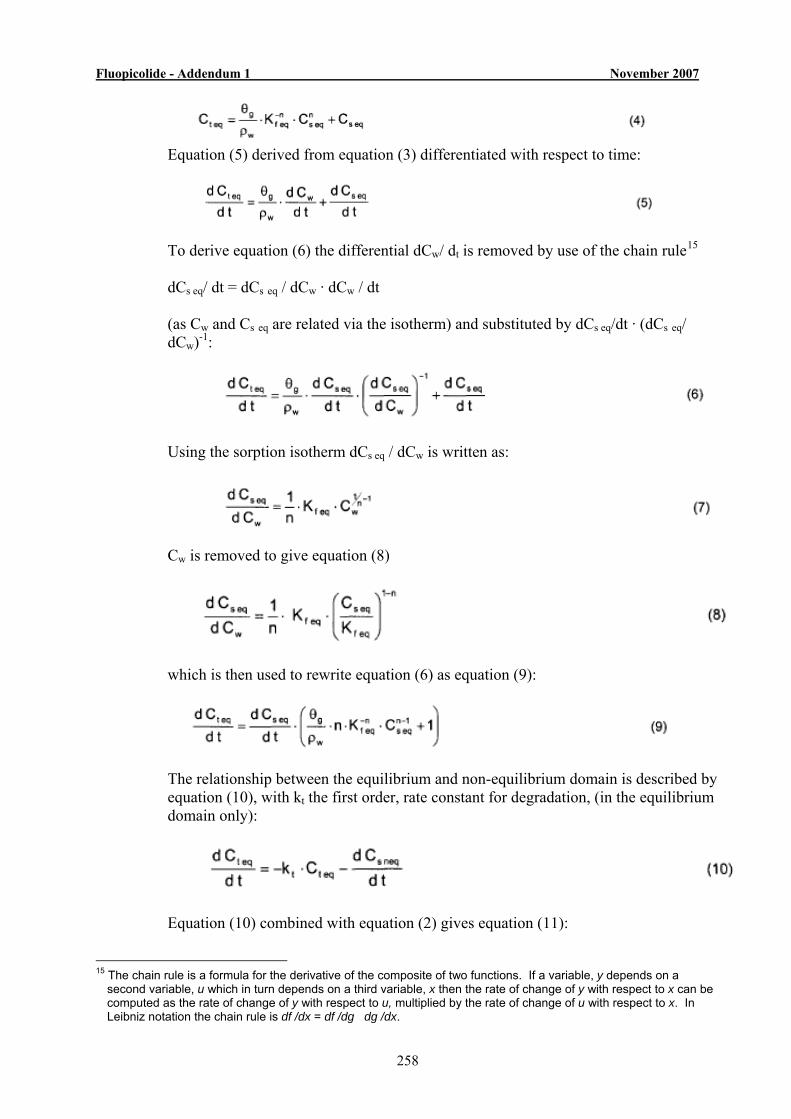
Fluopicolide - Addendum 1 November 2007
258
Equation (5) derived from equation (3) differentiated with respect to time:
To derive equation (6) the differential dCw/ dt is removed by use of the chain rule15 dCs eq/ dt = dCs eq / dCw · dCw / dt (as Cw and Cs eq are related via the isotherm) and substituted by dCs eq/dt · (dCs eq/ dCw)-1:
Using the sorption isotherm dCs eq / dCw is written as:
Cw is removed to give equation (8)
which is then used to rewrite equation (6) as equation (9):
The relationship between the equilibrium and non-equilibrium domain is described by equation (10), with kt the first order, rate constant for degradation, (in the equilibrium domain only):
Equation (10) combined with equation (2) gives equation (11):
15 The chain rule is a formula for the derivative of the composite of two functions. If a variable, y depends on a
second variable, u which in turn depends on a third variable, x then the rate of change of y with respect to x can be computed as the rate of change of y with respect to u, multiplied by the rate of change of u with respect to x. In Leibniz notation the chain rule is df /dx = df /dg · dg /dx.
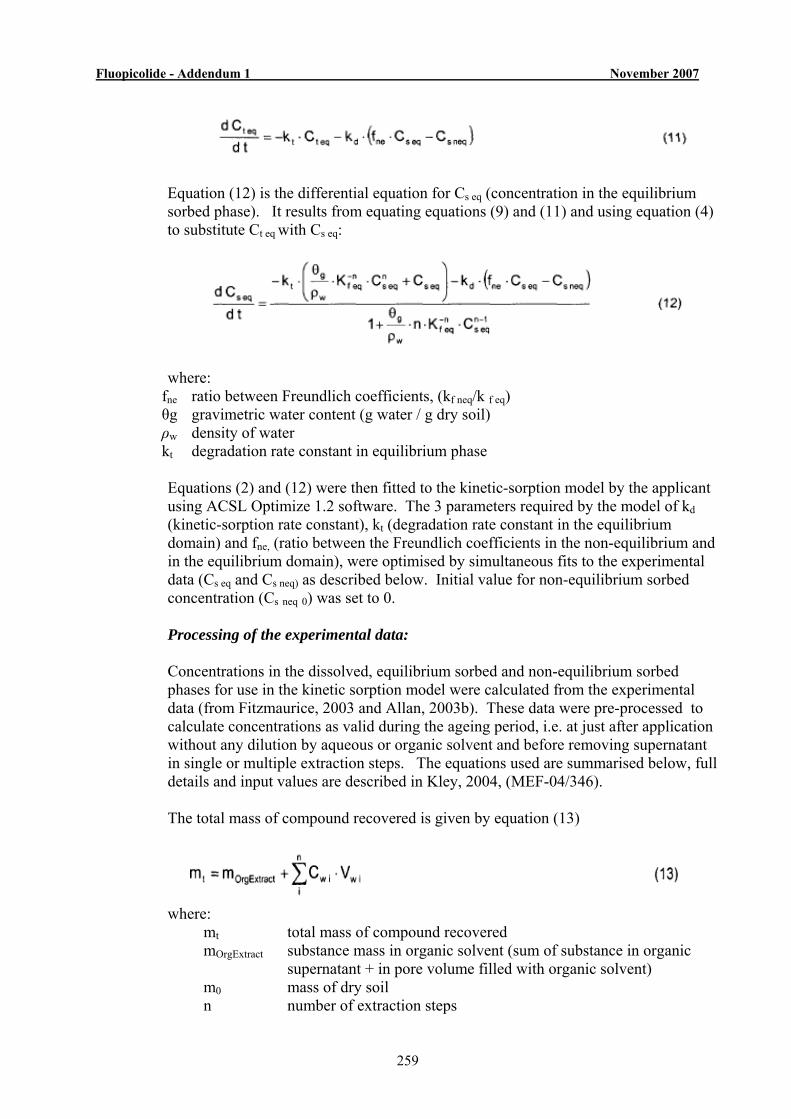
Fluopicolide - Addendum 1 November 2007
259
Equation (12) is the differential equation for Cs eq (concentration in the equilibrium sorbed phase). It results from equating equations (9) and (11) and using equation (4) to substitute Ct eq with Cs eq:
where:
fne ratio between Freundlich coefficients, (kf neq/k f eq) θg gravimetric water content (g water / g dry soil) ρw density of water kt degradation rate constant in equilibrium phase Equations (2) and (12) were then fitted to the kinetic-sorption model by the applicant using ACSL Optimize 1.2 software. The 3 parameters required by the model of kd (kinetic-sorption rate constant), kt (degradation rate constant in the equilibrium domain) and fne, (ratio between the Freundlich coefficients in the non-equilibrium and in the equilibrium domain), were optimised by simultaneous fits to the experimental data (Cs eq and Cs neq) as described below. Initial value for non-equilibrium sorbed concentration (Cs neq 0) was set to 0. Processing of the experimental data: Concentrations in the dissolved, equilibrium sorbed and non-equilibrium sorbed phases for use in the kinetic sorption model were calculated from the experimental data (from Fitzmaurice, 2003 and Allan, 2003b). These data were pre-processed to calculate concentrations as valid during the ageing period, i.e. at just after application without any dilution by aqueous or organic solvent and before removing supernatant in single or multiple extraction steps. The equations used are summarised below, full details and input values are described in Kley, 2004, (MEF-04/346). The total mass of compound recovered is given by equation (13)
where:
mt total mass of compound recovered mOrgExtract substance mass in organic solvent (sum of substance in organic supernatant + in pore volume filled with organic solvent) m0 mass of dry soil n number of extraction steps
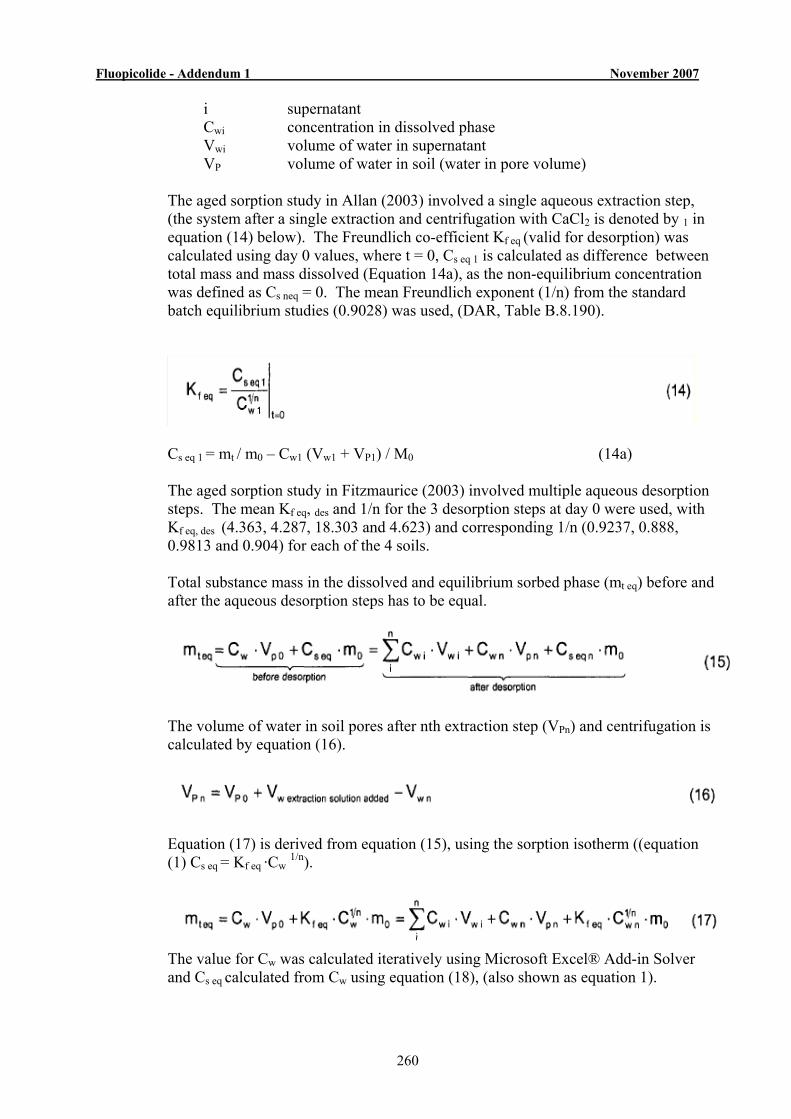
Fluopicolide - Addendum 1 November 2007
260
i supernatant Cwi concentration in dissolved phase Vwi volume of water in supernatant VP volume of water in soil (water in pore volume)
The aged sorption study in Allan (2003) involved a single aqueous extraction step, (the system after a single extraction and centrifugation with CaCl2 is denoted by 1 in equation (14) below). The Freundlich co-efficient Kf eq (valid for desorption) was calculated using day 0 values, where t = 0, Cs eq 1 is calculated as difference between total mass and mass dissolved (Equation 14a), as the non-equilibrium concentration was defined as Cs neq = 0. The mean Freundlich exponent (1/n) from the standard batch equilibrium studies (0.9028) was used, (DAR, Table B.8.190).
Cs eq 1 = mt / m0 – Cw1 (Vw1 + VP1) / M0 (14a) The aged sorption study in Fitzmaurice (2003) involved multiple aqueous desorption steps. The mean Kf eq, des and 1/n for the 3 desorption steps at day 0 were used, with Kf eq, des (4.363, 4.287, 18.303 and 4.623) and corresponding 1/n (0.9237, 0.888, 0.9813 and 0.904) for each of the 4 soils. Total substance mass in the dissolved and equilibrium sorbed phase (mt eq) before and after the aqueous desorption steps has to be equal.
The volume of water in soil pores after nth extraction step (VPn) and centrifugation is calculated by equation (16).
Equation (17) is derived from equation (15), using the sorption isotherm ((equation (1) Cs eq = Kf eq ·Cw 1/n).
The value for Cw was calculated iteratively using Microsoft Excel® Add-in Solver and Cs eq calculated from Cw using equation (18), (also shown as equation 1).
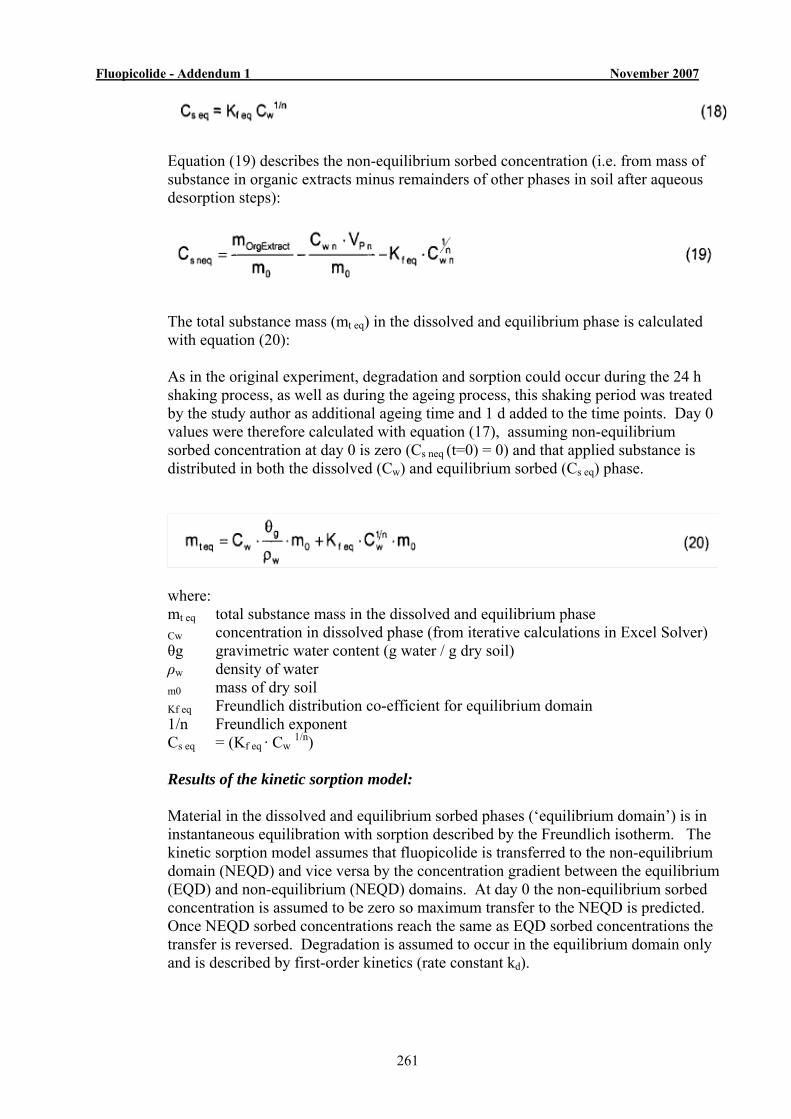
Fluopicolide - Addendum 1 November 2007
261
Equation (19) describes the non-equilibrium sorbed concentration (i.e. from mass of substance in organic extracts minus remainders of other phases in soil after aqueous desorption steps):
The total substance mass (mt eq) in the dissolved and equilibrium phase is calculated with equation (20): As in the original experiment, degradation and sorption could occur during the 24 h shaking process, as well as during the ageing process, this shaking period was treated by the study author as additional ageing time and 1 d added to the time points. Day 0 values were therefore calculated with equation (17), assuming non-equilibrium sorbed concentration at day 0 is zero (Cs neq (t=0) = 0) and that applied substance is distributed in both the dissolved (Cw) and equilibrium sorbed (Cs eq) phase.
where: mt eq total substance mass in the dissolved and equilibrium phase
Cw concentration in dissolved phase (from iterative calculations in Excel Solver) θg gravimetric water content (g water / g dry soil) ρw density of water m0 mass of dry soil
Kf eq Freundlich distribution co-efficient for equilibrium domain 1/n Freundlich exponent Cs eq = (Kf eq · Cw 1/n) Results of the kinetic sorption model: Material in the dissolved and equilibrium sorbed phases (‘equilibrium domain’) is in instantaneous equilibration with sorption described by the Freundlich isotherm. The kinetic sorption model assumes that fluopicolide is transferred to the non-equilibrium domain (NEQD) and vice versa by the concentration gradient between the equilibrium (EQD) and non-equilibrium (NEQD) domains. At day 0 the non-equilibrium sorbed concentration is assumed to be zero so maximum transfer to the NEQD is predicted. Once NEQD sorbed concentrations reach the same as EQD sorbed concentrations the transfer is reversed. Degradation is assumed to occur in the equilibrium domain only and is described by first-order kinetics (rate constant kd).
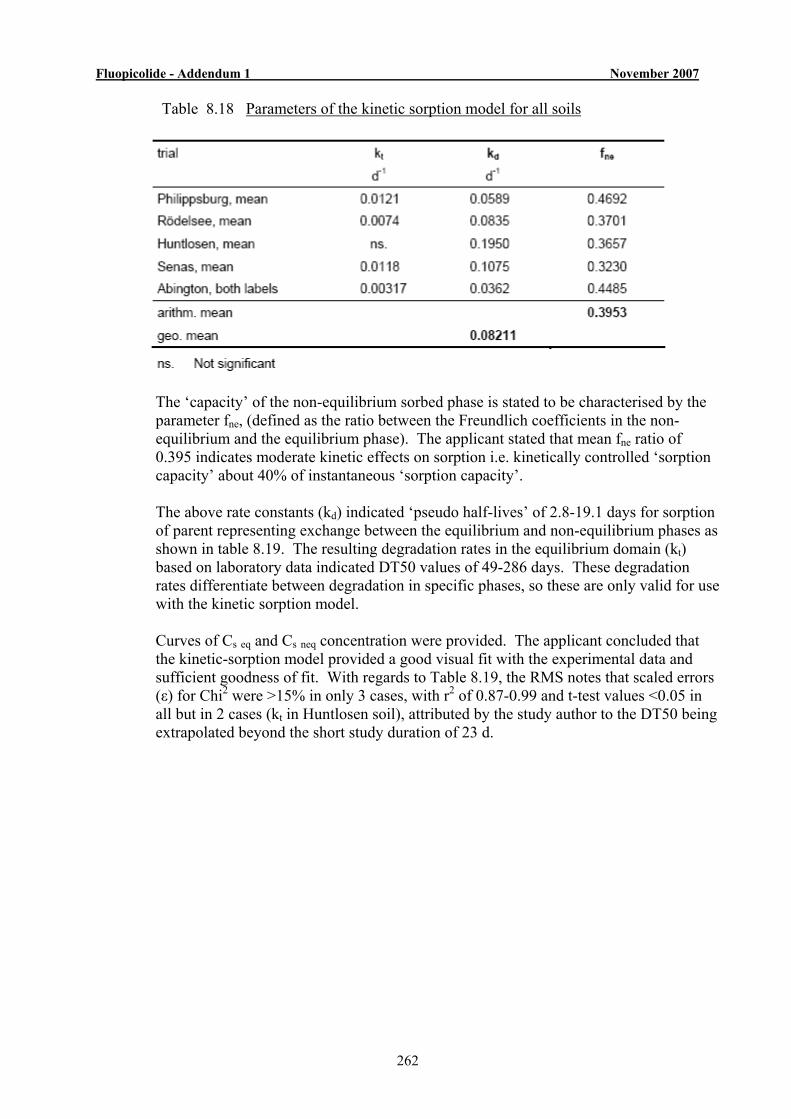
Fluopicolide - Addendum 1 November 2007
262
Table 8.18 Parameters of the kinetic sorption model for all soils
The ‘capacity’ of the non-equilibrium sorbed phase is stated to be characterised by the parameter fne, (defined as the ratio between the Freundlich coefficients in the non-equilibrium and the equilibrium phase). The applicant stated that mean fne ratio of 0.395 indicates moderate kinetic effects on sorption i.e. kinetically controlled ‘sorption capacity’ about 40% of instantaneous ‘sorption capacity’. The above rate constants (kd) indicated ‘pseudo half-lives’ of 2.8-19.1 days for sorption of parent representing exchange between the equilibrium and non-equilibrium phases as shown in table 8.19. The resulting degradation rates in the equilibrium domain (kt) based on laboratory data indicated DT50 values of 49-286 days. These degradation rates differentiate between degradation in specific phases, so these are only valid for use with the kinetic sorption model. Curves of Cs eq and Cs neq concentration were provided. The applicant concluded that the kinetic-sorption model provided a good visual fit with the experimental data and sufficient goodness of fit. With regards to Table 8.19, the RMS notes that scaled errors (ε) for Chi2 were >15% in only 3 cases, with r2 of 0.87-0.99 and t-test values <0.05 in all but in 2 cases (kt in Huntlosen soil), attributed by the study author to the DT50 being extrapolated beyond the short study duration of 23 d.
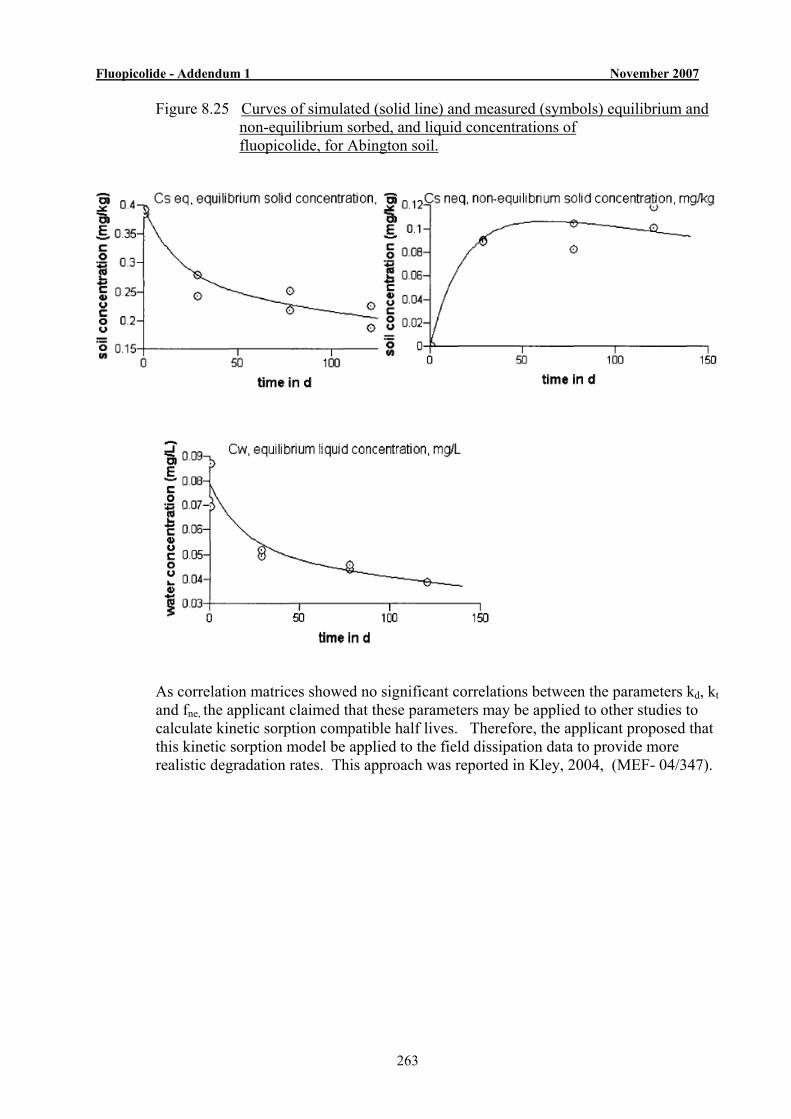
Fluopicolide - Addendum 1 November 2007
263
Figure 8.25 Curves of simulated (solid line) and measured (symbols) equilibrium and non-equilibrium sorbed, and liquid concentrations of fluopicolide, for Abington soil.
As correlation matrices showed no significant correlations between the parameters kd, kt and fne, the applicant claimed that these parameters may be applied to other studies to calculate kinetic sorption compatible half lives. Therefore, the applicant proposed that this kinetic sorption model be applied to the field dissipation data to provide more realistic degradation rates. This approach was reported in Kley, 2004, (MEF- 04/347).
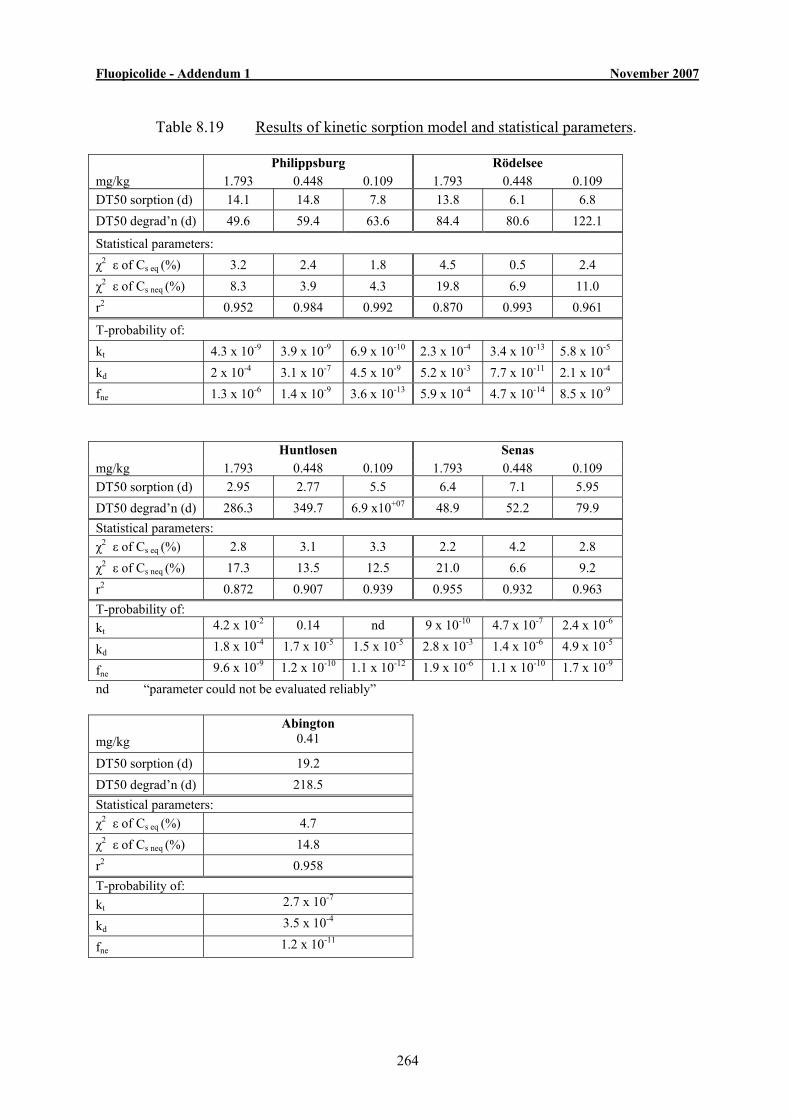
Fluopicolide - Addendum 1 November 2007
264
Table 8.19 Results of kinetic sorption model and statistical parameters.
Philippsburg Rödelsee mg/kg 1.793 0.448 0.109 1.793 0.448 0.109 DT50 sorption (d) 14.1 14.8 7.8 13.8 6.1 6.8 DT50 degrad’n (d) 49.6 59.4 63.6 84.4 80.6 122.1
Statistical parameters: χ2 ε of Cs eq (%) 3.2 2.4 1.8 4.5 0.5 2.4 χ2 ε of Cs neq (%) 8.3 3.9 4.3 19.8 6.9 11.0 r2 0.952 0.984 0.992 0.870 0.993 0.961
T-probability of: kt 4.3 x 10⁻⁹ 3.9 x 10⁻⁹ 6.9 x 10⁻¹⁰ 2.3 x 10⁻⁴ 3.4 x 10⁻¹³ 5.8 x 10⁻⁵ kd 2 x 10⁻⁴ 3.1 x 10⁻⁷ 4.5 x 10⁻⁹ 5.2 x 10⁻³ 7.7 x 10⁻¹¹ 2.1 x 10⁻⁴ fne 1.3 x 10⁻⁶ 1.4 x 10⁻⁹ 3.6 x 10⁻¹³ 5.9 x 10⁻⁴ 4.7 x 10⁻¹⁴ 8.5 x 10⁻⁹ Huntlosen Senas mg/kg 1.793 0.448 0.109 1.793 0.448 0.109 DT50 sorption (d) 2.95 2.77 5.5 6.4 7.1 5.95 DT50 degrad’n (d) 286.3 349.7 6.9 x10+07 48.9 52.2 79.9 Statistical parameters: χ2 ε of Cs eq (%) 2.8 3.1 3.3 2.2 4.2 2.8 χ2 ε of Cs neq (%) 17.3 13.5 12.5 21.0 6.6 9.2 r2 0.872 0.907 0.939 0.955 0.932 0.963 T-probability of: kt 4.2 x 10⁻² 0.14 nd 9 x 10⁻¹⁰ 4.7 x 10⁻⁷ 2.4 x 10⁻⁶
kd 1.8 x 10⁻⁴ 1.7 x 10⁻⁵ 1.5 x 10⁻⁵ 2.8 x 10⁻³ 1.4 x 10⁻⁶ 4.9 x 10⁻⁵
fne 9.6 x 10⁻⁹ 1.2 x 10⁻¹⁰ 1.1 x 10⁻¹² 1.9 x 10⁻⁶ 1.1 x 10⁻¹⁰ 1.7 x 10⁻⁹ nd “parameter could not be evaluated reliably” mg/kg
Abington 0.41
DT50 sorption (d) 19.2 DT50 degrad’n (d) 218.5 Statistical parameters: χ2 ε of Cs eq (%) 4.7 χ2 ε of Cs neq (%) 14.8 r2 0.958 T-probability of: kt 2.7 x 10⁻⁷
kd 3.5 x 10⁻⁴
fne 1.2 x 10⁻¹¹

Fluopicolide - Addendum 1 November 2007
265
RMS Evaluation of new data – Kley, C. 2004 (MEF -04/347) Kinetic evaluation of field dissipation data considering time-dependent sorption: For the kinetic sorption model, it is assumed that only fluopicolide in the equilibrium domain is available for degradation, so new degradation rates reflecting this are required. In this report, the kinetic sorption model described above (Kley, 2004, MEF-04/346) was applied to field dissipation data from 6 trials, (previously reported in the DAR, B.8.1.5) to determine degradation rates (kt), that could be used with the kinetic sorption rate constant (kd) and the ratio between the Freundlich coefficients for equilibrium and non-equilibrium domain (fne). Both the kd and fne parameters were previously derived from the kinetic evaluation of laboratory data above (Kley, 2004, MEF-04/346). The parameters kt and Cs eq 0 (initial value of equilibrium sorbed phase) were optimised by the applicant using ACSL Optimize 1.2 software, by fitting to measured total residue (Ct) in mg/kg. The measured total residue (Ct) included residues at depth and below the LOQ, as previously assessed and reported in the DAR (at B.8.1.5). The initial concentration for non-equilibrium sorbed phase (Cs neq 0) was set to 0. An equation was given by the applicant to describe the total soil residue (Ct) or mass balance:
(21) where: Ct total soil residue or concentration θg gravimetric water content (g), can be substituted with θv volumetric water content (L) ρw density of water, can be substituted with ρbd soil bulk density (kg/L) Kf
-neq Freundlich coefficient for non-equilibrium domain +
Cns eq Concentration
Cs eq Equilibrium sorbed concentration Cs neq Non-equilibrium sorbed concentration Degradation rates (kt) for use specifically with the kinetic sorption model were temperature and moisture normalised according to the time transformation approach (FOCUS 2000). Daily soil moisture and weather data used were available from the original trials reports, except in the case of Senas, for which values were simulated using FOCUS PEARL 1.1.1.
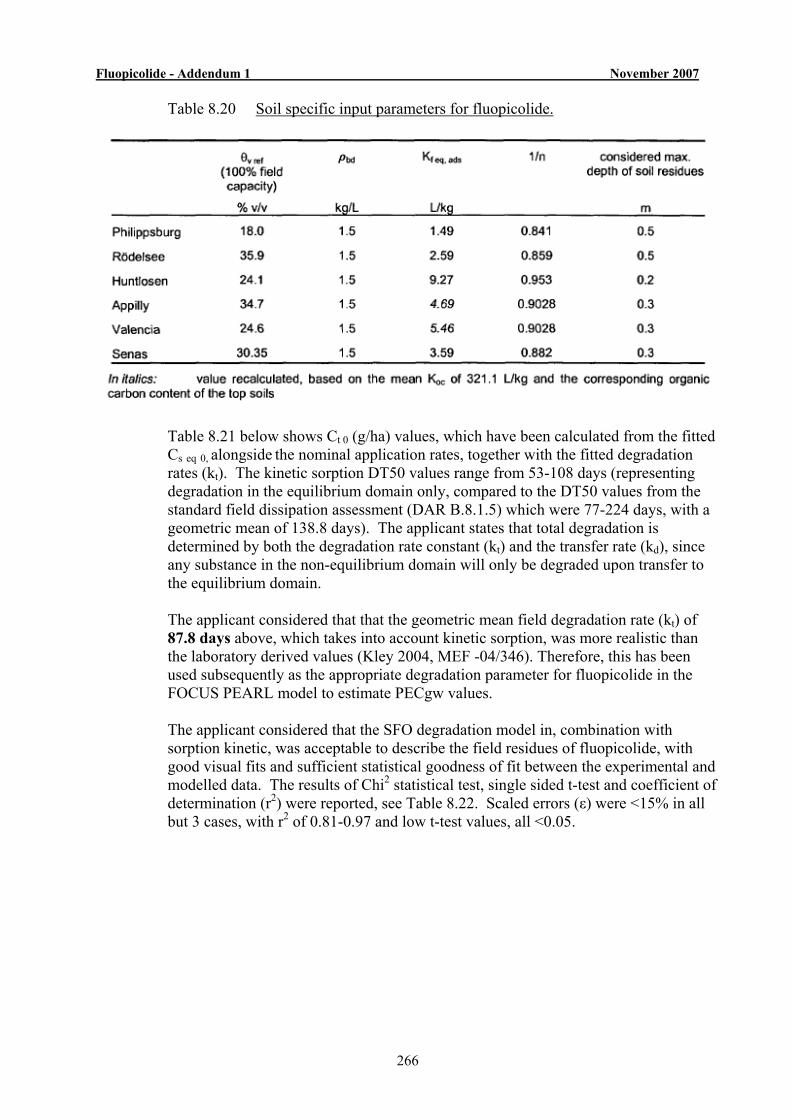
Fluopicolide - Addendum 1 November 2007
266
Table 8.20 Soil specific input parameters for fluopicolide.
Table 8.21 below shows Ct 0 (g/ha) values, which have been calculated from the fitted Cs eq 0, alongside the nominal application rates, together with the fitted degradation rates (kt). The kinetic sorption DT50 values range from 53-108 days (representing degradation in the equilibrium domain only, compared to the DT50 values from the standard field dissipation assessment (DAR B.8.1.5) which were 77-224 days, with a geometric mean of 138.8 days). The applicant states that total degradation is determined by both the degradation rate constant (kt) and the transfer rate (kd), since any substance in the non-equilibrium domain will only be degraded upon transfer to the equilibrium domain. The applicant considered that that the geometric mean field degradation rate (kt) of 87.8 days above, which takes into account kinetic sorption, was more realistic than the laboratory derived values (Kley 2004, MEF -04/346). Therefore, this has been used subsequently as the appropriate degradation parameter for fluopicolide in the FOCUS PEARL model to estimate PECgw values. The applicant considered that the SFO degradation model in, combination with sorption kinetic, was acceptable to describe the field residues of fluopicolide, with good visual fits and sufficient statistical goodness of fit between the experimental and modelled data. The results of Chi2 statistical test, single sided t-test and coefficient of determination (r2) were reported, see Table 8.22. Scaled errors (ε) were <15% in all but 3 cases, with r2 of 0.81-0.97 and low t-test values, all <0.05.
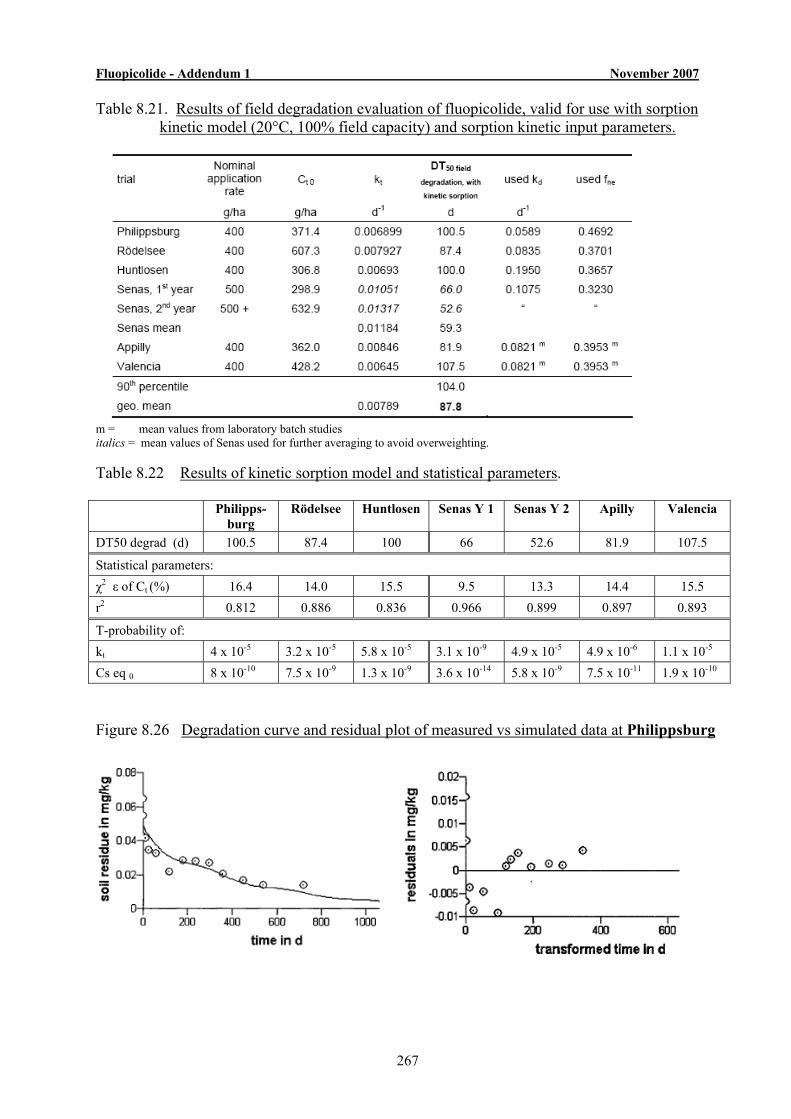
Fluopicolide - Addendum 1 November 2007
267
Table 8.21. Results of field degradation evaluation of fluopicolide, valid for use with sorption kinetic model (20°C, 100% field capacity) and sorption kinetic input parameters.
m = mean values from laboratory batch studies italics = mean values of Senas used for further averaging to avoid overweighting. Table 8.22 Results of kinetic sorption model and statistical parameters.
Philipps-
burg Rödelsee Huntlosen Senas Y 1 Senas Y 2 Apilly Valencia
DT50 degrad (d) 100.5 87.4 100 66 52.6 81.9 107.5
Statistical parameters: χ2 ε of Ct (%) 16.4 14.0 15.5 9.5 13.3 14.4 15.5 r2 0.812 0.886 0.836 0.966 0.899 0.897 0.893
T-probability of: kt 4 x 10⁻⁵ 3.2 x 10⁻⁵ 5.8 x 10⁻⁵ 3.1 x 10⁻⁹ 4.9 x 10⁻⁵ 4.9 x 10⁻⁶ 1.1 x 10⁻⁵ Cs eq 0 8 x 10⁻¹⁰ 7.5 x 10⁻⁹ 1.3 x 10⁻⁹ 3.6 x 10⁻¹⁴ 5.8 x 10⁻⁹ 7.5 x 10⁻¹¹ 1.9 x 10⁻¹⁰ Figure 8.26 Degradation curve and residual plot of measured vs simulated data at Philippsburg
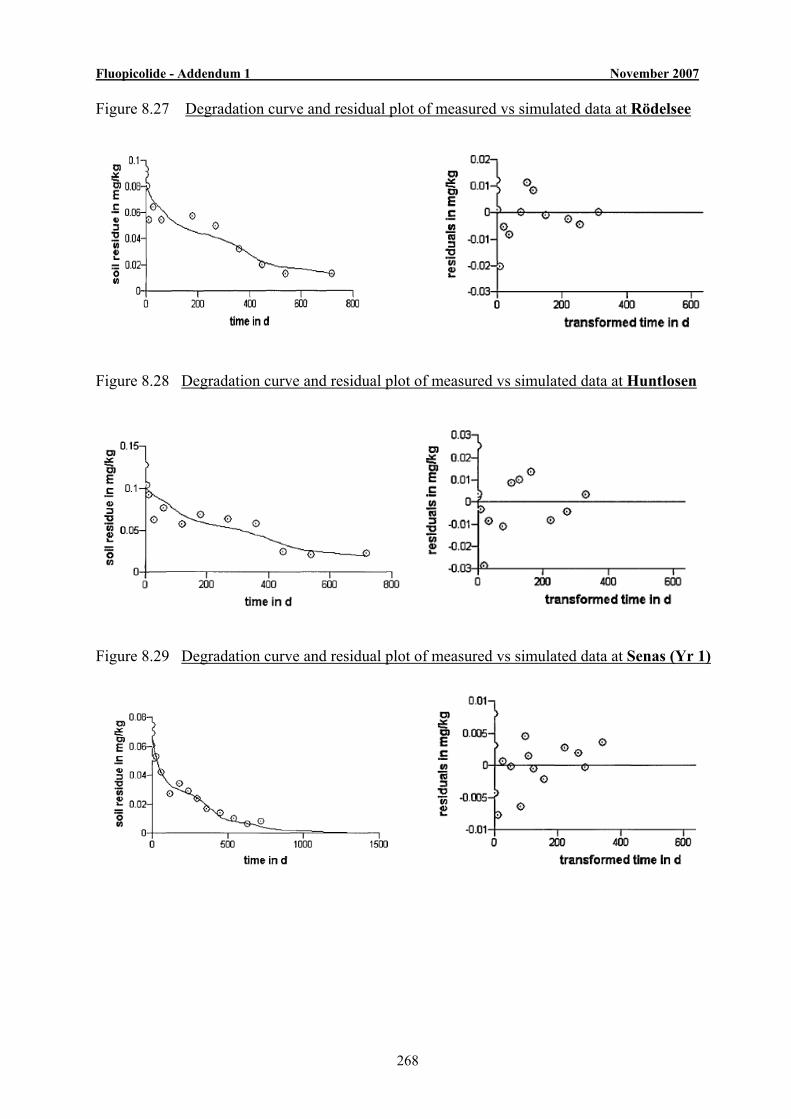
Fluopicolide - Addendum 1 November 2007
268
Figure 8.27 Degradation curve and residual plot of measured vs simulated data at Rödelsee
Figure 8.28 Degradation curve and residual plot of measured vs simulated data at Huntlosen
Figure 8.29 Degradation curve and residual plot of measured vs simulated data at Senas (Yr 1)

Fluopicolide - Addendum 1 November 2007
269
Figure 8.30 Degradation curve and residual plot of measured vs simulated data at Senas Yr 2
Figure 8.31 Degradation curve and residual plot of measured vs simulated data at Apilly
Figure 8.32 Degradation curve and residual plot of measured vs simulated data at Valencia
Fluopicolide - Addendum 1 November 2007
270
Validation of the kinetic sorption model: The applicant also provided validation of the kinetic sorption model, using the distribution of measured residue data with depth. The FOCUS PEARL model v 1.1.1 was used to simulate water and substance transport at four of the six field sites, (Philippsburg, Rödelsee, Huntlosen and Senas). Two PEARL simulations were run, one with the standard field degradation parameters (as assessed in the DAR) and one with the kinetic sorption parameters (kt, kd and fne evaluated here), to compare both approaches with the measured residue data (Ct, in mg/kg or g/m3). Site-specific soil, weather, irrigation, tillage, crop and application conditions, as well as hydraulic calibration were all as previously described in the DAR (B.8.1.5.1). Fitted initial soil concentrations (g/ha) were used as application rates. The input and output files for these PEARL simulations are given in Kley 2004, (MEF -04/347). Depth profiles of concentration were evaluated according to the ‘method of moments’ (Jury 199016). The applicant stated that both the kinetic sorption and standard degradation approaches resulted in the same overall degradation characteristics, but retardation of fluopicolide due to sorption processes lead to differences in transport velocity. The kinetic sorption simulation gave narrower depth distributions and higher peak values compared to the standard simulation. This was attributed to more substance being retained for the kinetic sorption model, with fluopicolide sorbed in the non-equilibrium domain not being available for transport. For the standard simulation, the substance is dispersed more greatly, with increasing travel depth which results in lower peak values.
16 Jury, W.A., Roth, K (1990). Transfer functions and solute movement through soil: Theory and Applications.
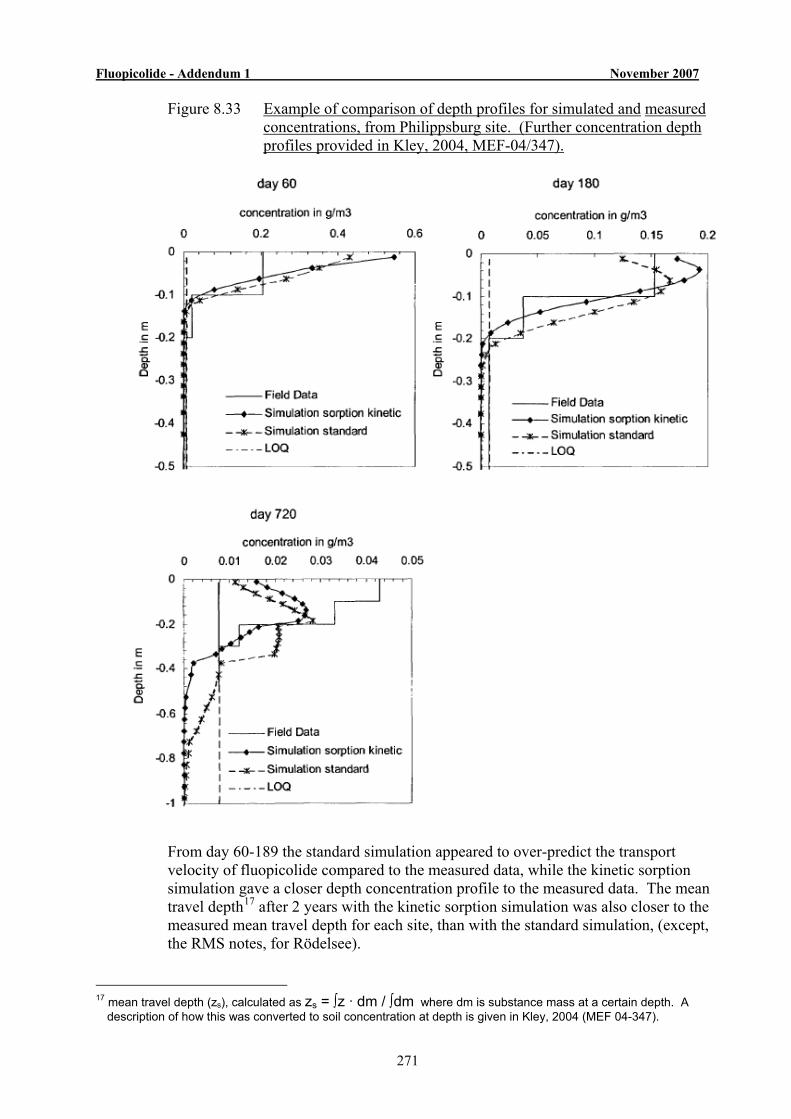
Fluopicolide - Addendum 1 November 2007
271
Figure 8.33 Example of comparison of depth profiles for simulated and measured concentrations, from Philippsburg site. (Further concentration depth profiles provided in Kley, 2004, MEF-04/347).
From day 60-189 the standard simulation appeared to over-predict the transport velocity of fluopicolide compared to the measured data, while the kinetic sorption simulation gave a closer depth concentration profile to the measured data. The mean travel depth17 after 2 years with the kinetic sorption simulation was also closer to the measured mean travel depth for each site, than with the standard simulation, (except, the RMS notes, for Rödelsee).
17 mean travel depth (zs), calculated as zs = ∫z · dm / ∫dm where dm is substance mass at a certain depth. A
description of how this was converted to soil concentration at depth is given in Kley, 2004 (MEF 04-347).
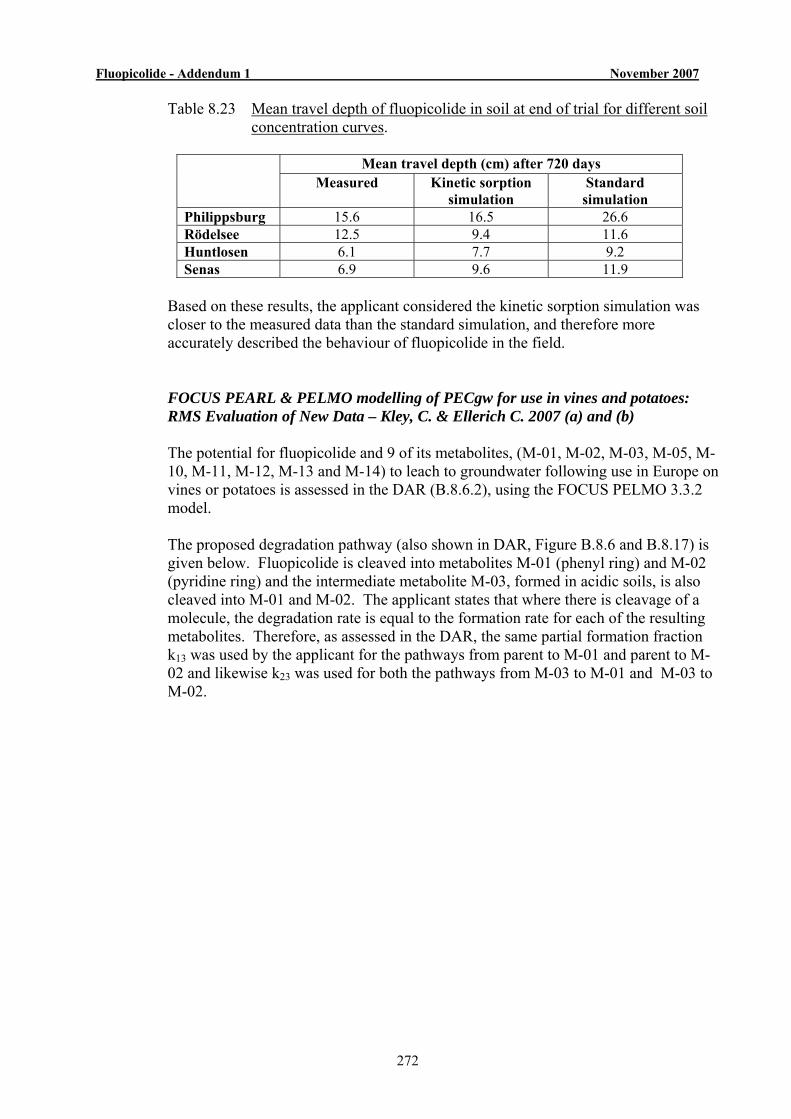
Fluopicolide - Addendum 1 November 2007
272
Table 8.23 Mean travel depth of fluopicolide in soil at end of trial for different soil concentration curves.
Mean travel depth (cm) after 720 days Measured Kinetic sorption
simulation Standard simulation
Philippsburg 15.6 16.5 26.6 Rödelsee 12.5 9.4 11.6 Huntlosen 6.1 7.7 9.2 Senas 6.9 9.6 11.9
Based on these results, the applicant considered the kinetic sorption simulation was closer to the measured data than the standard simulation, and therefore more accurately described the behaviour of fluopicolide in the field.
FOCUS PEARL & PELMO modelling of PECgw for use in vines and potatoes: RMS Evaluation of New Data – Kley, C. & Ellerich C. 2007 (a) and (b) The potential for fluopicolide and 9 of its metabolites, (M-01, M-02, M-03, M-05, M-10, M-11, M-12, M-13 and M-14) to leach to groundwater following use in Europe on vines or potatoes is assessed in the DAR (B.8.6.2), using the FOCUS PELMO 3.3.2 model. The proposed degradation pathway (also shown in DAR, Figure B.8.6 and B.8.17) is given below. Fluopicolide is cleaved into metabolites M-01 (phenyl ring) and M-02 (pyridine ring) and the intermediate metabolite M-03, formed in acidic soils, is also cleaved into M-01 and M-02. The applicant states that where there is cleavage of a molecule, the degradation rate is equal to the formation rate for each of the resulting metabolites. Therefore, as assessed in the DAR, the same partial formation fraction k13 was used by the applicant for the pathways from parent to M-01 and parent to M-02 and likewise k23 was used for both the pathways from M-03 to M-01 and M-03 to M-02.
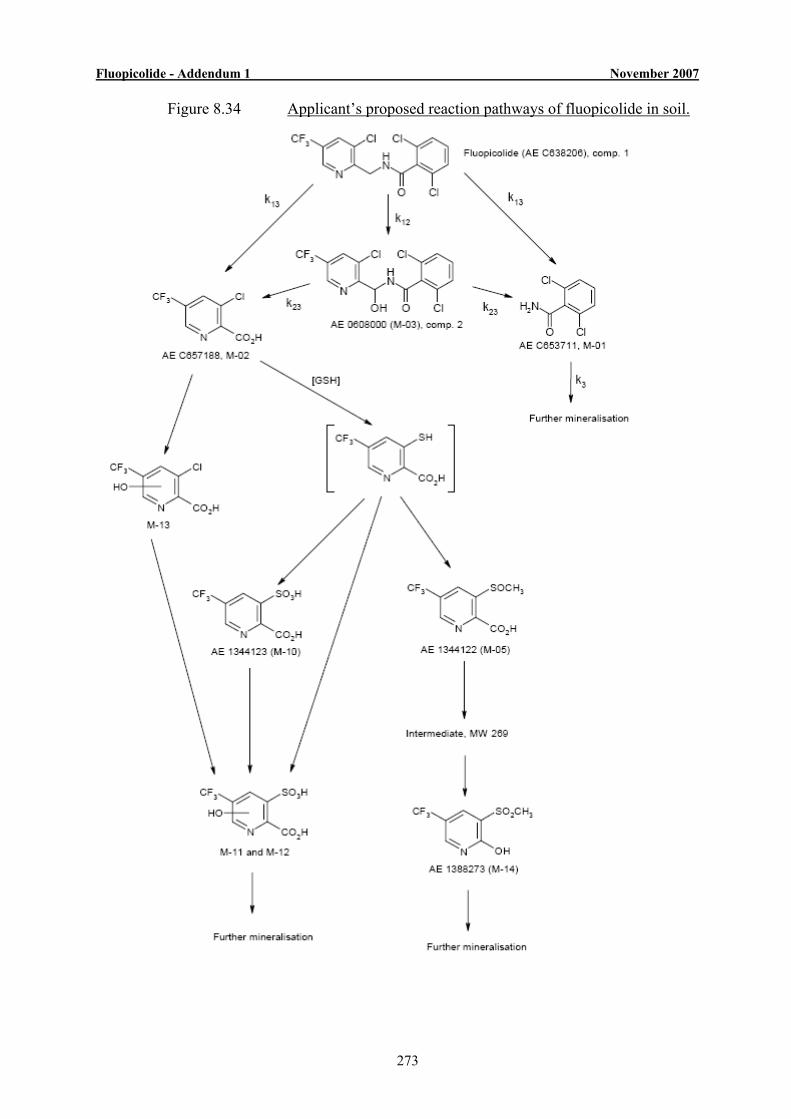
Fluopicolide - Addendum 1 November 2007
273
Figure 8.34 Applicant’s proposed reaction pathways of fluopicolide in soil.
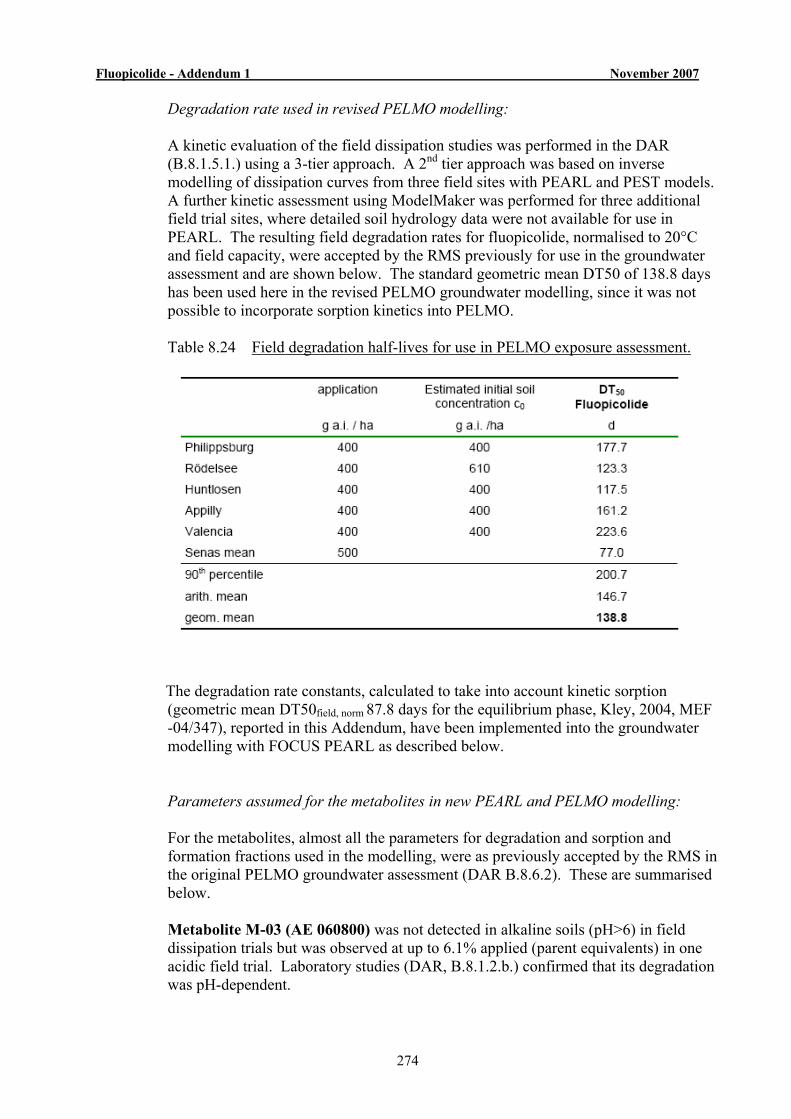
Fluopicolide - Addendum 1 November 2007
274
Degradation rate used in revised PELMO modelling: A kinetic evaluation of the field dissipation studies was performed in the DAR (B.8.1.5.1.) using a 3-tier approach. A 2nd tier approach was based on inverse modelling of dissipation curves from three field sites with PEARL and PEST models. A further kinetic assessment using ModelMaker was performed for three additional field trial sites, where detailed soil hydrology data were not available for use in PEARL. The resulting field degradation rates for fluopicolide, normalised to 20°C and field capacity, were accepted by the RMS previously for use in the groundwater assessment and are shown below. The standard geometric mean DT50 of 138.8 days has been used here in the revised PELMO groundwater modelling, since it was not possible to incorporate sorption kinetics into PELMO. Table 8.24 Field degradation half-lives for use in PELMO exposure assessment.
The degradation rate constants, calculated to take into account kinetic sorption (geometric mean DT50field, norm 87.8 days for the equilibrium phase, Kley, 2004, MEF -04/347), reported in this Addendum, have been implemented into the groundwater modelling with FOCUS PEARL as described below.
Parameters assumed for the metabolites in new PEARL and PELMO modelling: For the metabolites, almost all the parameters for degradation and sorption and formation fractions used in the modelling, were as previously accepted by the RMS in the original PELMO groundwater assessment (DAR B.8.6.2). These are summarised below. Metabolite M-03 (AE 060800) was not detected in alkaline soils (pH>6) in field dissipation trials but was observed at up to 6.1% applied (parent equivalents) in one acidic field trial. Laboratory studies (DAR, B.8.1.2.b.) confirmed that its degradation was pH-dependent.
Fluopicolide - Addendum 1 November 2007
275
For alkaline scenarios (pH>6) fluopicolide was assumed to be completely degraded via M-03, with the geometric mean DT50 lab, norm of 0.09 days. For acidic scenarios (pH<6) parallel degradation of fluopicolide to M01 and M-02 directly (k13) and also via M-03 (k12) was assumed, with the geometric mean DT50 field, norm of 55.5 days for M-03. Formation fractions assumed were 0.288 for M-03 and 0.712 for M-01/M-02. An arithmetic mean Koc of 108.8 L/kg, with mean 1/n of 0.971 was previously estimated and used in the groundwater assessment. M-03 was also rapidly hydrolysed in laboratory studies to form M-01/M-02 with DT50 from 8.1 minutes (pH 8) to 45.5 hours (pH 5), (DAR, B.8.4.1.d.). Metabolite M-01 (AE C653711) reached up to 24.1% (parent equivalents, excluding Senas, 2nd year data) and 40.2% applied (parent equivalents) in the field and laboratory, respectively. A geometric mean DT50field, norm of 137.7 days, arithmetic mean Koc of 40.9 L/kg and 1/n of 0.9158 were previously accepted for use in the original PELMO groundwater assessment. Metabolite M-02 (AE C657188) reached a maximum of 16.4% (parent equivalents, excluding Senas, 2nd year data) and 7.3% applied (parent equivalents) in field and laboratory studies, respectively. It was not possible to calculate reliable field degradation rates for M-02, as residues were only detected at low levels and early time points, so a geometric mean, DT50lab, norm of 2.82 days (using ModelMaker), together with an arithmetic mean Koc of 5.99 L/kg and 1/n of 0.7737, was previously used for the original PELMO groundwater assessment. Metabolite M-05 (AE 1344122) reached a maximum of 17.99% of applied M-02 in a laboratory soil degradation study with M-02 (DAR, B.8.1.2.c). A geometric mean, DT50lab, norm of 42.6 days, arithmetic mean Koc of 25.9 L/kg and 1/n of 0.9182 were previously accepted for use in the original PELMO groundwater assessment. As no M-14 was formed in one of the soils tested, (attributed by the applicant as possibly due to slow degradation of M-05), the worst case formation fraction of 0.384 was selected by the applicant for M-05 into M-14. The mean formation fraction of 0.252 was used in the DAR. This also gives a slightly different partial reaction rate of 0.006248 d-1, (compared to 0.0041 d-1 in the DAR). Metabolite M-10 (AE 1344123) reached up 4.97% of applied M-02 in a soil degradation study with M-02 (DAR, B.8.1.2.c). A geometric mean, DT50lab, norm of 26.4 days, arithmetic mean Koc of 6.3 L/kg and 1/n set to 0.9 were previously accepted for use in the original PELMO groundwater assessment. Metabolite M-11/12 (P2a/P2b) are two isomers (60:40 ratio) formed at up to 6.55% of applied M-02 in a soil degradation study with M-02 (DAR, B.8.1.2.c). A geometric mean, DT50lab, norm of 35.95 days, was previously accepted for use in the original PELMO groundwater assessment. No reliable Koc value could be determined and this was set at 0 (with 1/n of 0.9) as a worst case. Metabolite M-13 (P3) reached up to 4.38% of applied M-02 in a soil degradation study with M-02 (DAR, B.8.1.2.c). A geometric mean, DT50lab, norm of 11.8 days was previously accepted for use in the original PELMO groundwater assessment. At pH 6
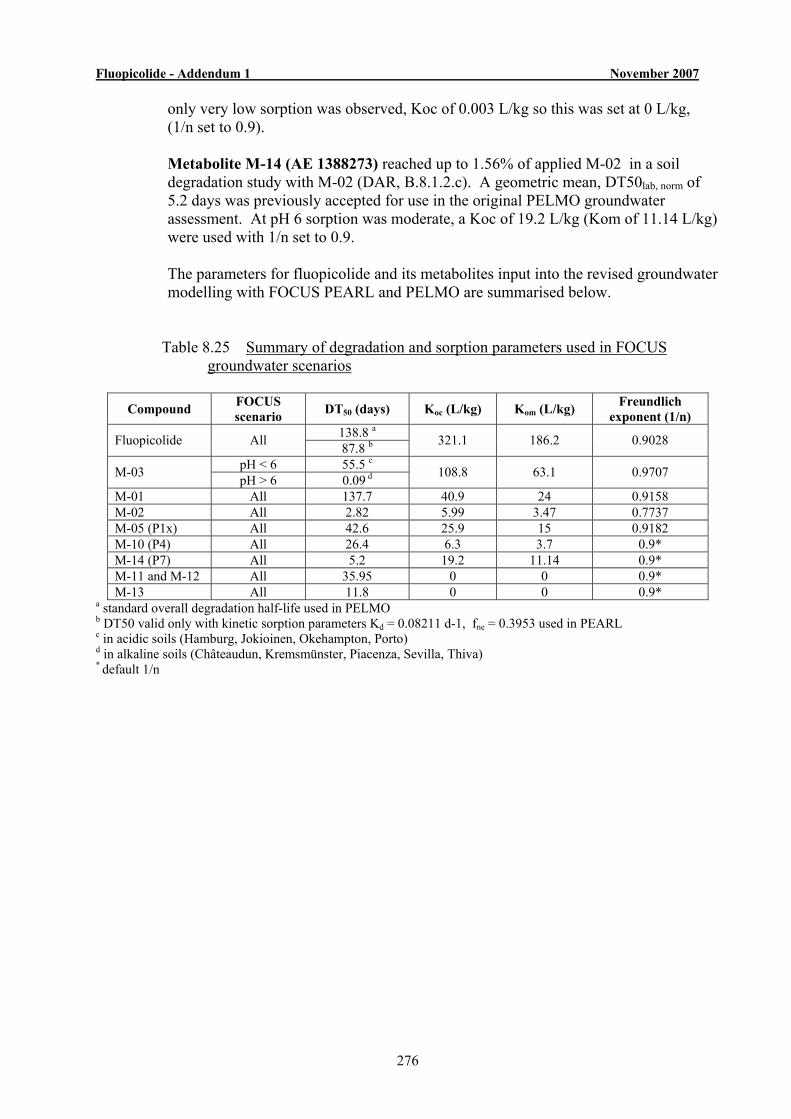
Fluopicolide - Addendum 1 November 2007
276
only very low sorption was observed, Koc of 0.003 L/kg so this was set at 0 L/kg, (1/n set to 0.9). Metabolite M-14 (AE 1388273) reached up to 1.56% of applied M-02 in a soil degradation study with M-02 (DAR, B.8.1.2.c). A geometric mean, DT50lab, norm of 5.2 days was previously accepted for use in the original PELMO groundwater assessment. At pH 6 sorption was moderate, a Koc of 19.2 L/kg (Kom of 11.14 L/kg) were used with 1/n set to 0.9. The parameters for fluopicolide and its metabolites input into the revised groundwater modelling with FOCUS PEARL and PELMO are summarised below.
Table 8.25 Summary of degradation and sorption parameters used in FOCUS groundwater scenarios
Compound FOCUS scenario DT50 (days) Koc (L/kg) Kom (L/kg) Freundlich
exponent (1/n) 138.8 a Fluopicolide All 87.8 b 321.1 186.2 0.9028
pH < 6 55.5 c M-03 pH > 6 0.09 d 108.8 63.1 0.9707
M-01 All 137.7 40.9 24 0.9158 M-02 All 2.82 5.99 3.47 0.7737 M-05 (P1x) All 42.6 25.9 15 0.9182 M-10 (P4) All 26.4 6.3 3.7 0.9* M-14 (P7) All 5.2 19.2 11.14 0.9* M-11 and M-12 All 35.95 0 0 0.9* M-13 All 11.8 0 0 0.9*
a standard overall degradation half-life used in PELMO b DT50 valid only with kinetic sorption parameters Kd = 0.08211 d-1, fne = 0.3953 used in PEARL c in acidic soils (Hamburg, Jokioinen, Okehampton, Porto) d in alkaline soils (Châteaudun, Kremsmünster, Piacenza, Sevilla, Thiva) * default 1/n
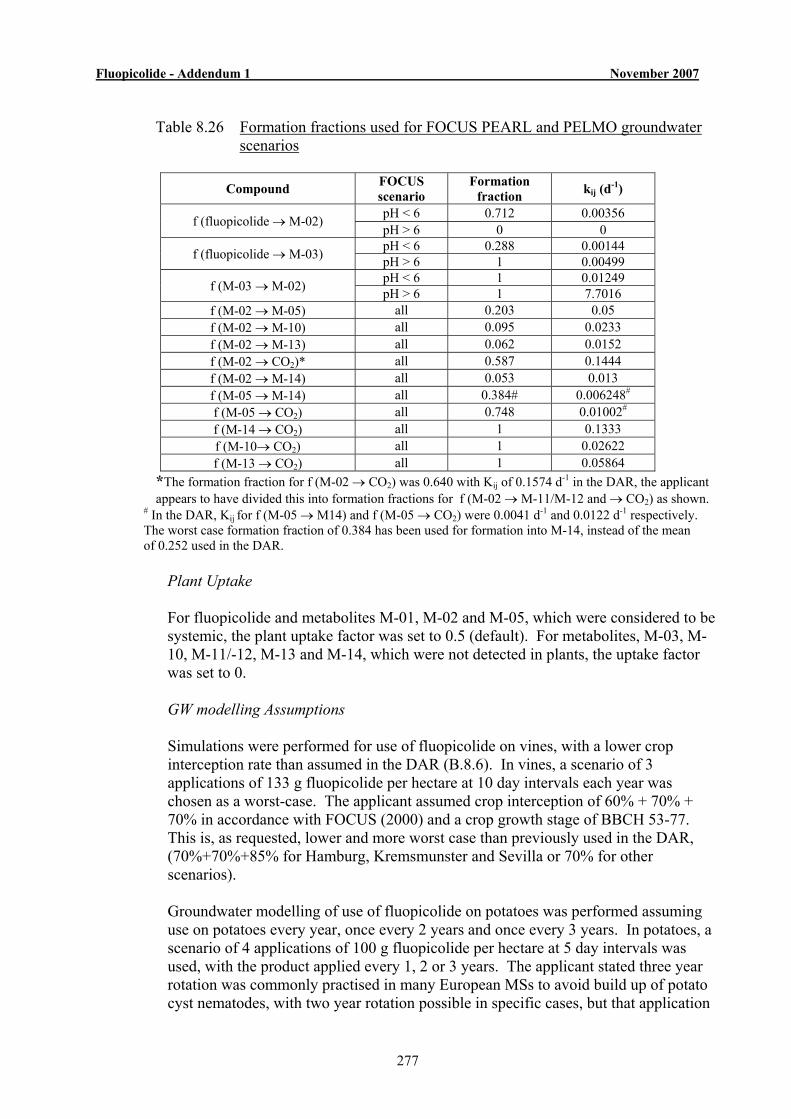
Fluopicolide - Addendum 1 November 2007
277
Table 8.26 Formation fractions used for FOCUS PEARL and PELMO groundwater
scenarios
Compound FOCUS scenario
Formation fraction kij (d-1)
pH < 6 0.712 0.00356 f (fluopicolide → M-02) pH > 6 0 0 pH < 6 0.288 0.00144 f (fluopicolide → M-03) pH > 6 1 0.00499 pH < 6 1 0.01249 f (M-03 → M-02) pH > 6 1 7.7016
f (M-02 → M-05) all 0.203 0.05 f (M-02 → M-10) all 0.095 0.0233 f (M-02 → M-13) all 0.062 0.0152 f (M-02 → CO2)* all 0.587 0.1444 f (M-02 → M-14) all 0.053 0.013 f (M-05 → M-14) all 0.384# 0.006248# f (M-05 → CO2) all 0.748 0.01002# f (M-14 → CO2) all 1 0.1333 f (M-10→ CO2) all 1 0.02622 f (M-13 → CO2) all 1 0.05864
*The formation fraction for f (M-02 → CO2) was 0.640 with Kij of 0.1574 d-1 in the DAR, the applicant appears to have divided this into formation fractions for f (M-02 → M-11/M-12 and → CO2) as shown.
# In the DAR, Kij for f (M-05 → M14) and f (M-05 → CO2) were 0.0041 d-1 and 0.0122 d-1 respectively. The worst case formation fraction of 0.384 has been used for formation into M-14, instead of the mean of 0.252 used in the DAR.
Plant Uptake For fluopicolide and metabolites M-01, M-02 and M-05, which were considered to be systemic, the plant uptake factor was set to 0.5 (default). For metabolites, M-03, M-10, M-11/-12, M-13 and M-14, which were not detected in plants, the uptake factor was set to 0. GW modelling Assumptions Simulations were performed for use of fluopicolide on vines, with a lower crop interception rate than assumed in the DAR (B.8.6). In vines, a scenario of 3 applications of 133 g fluopicolide per hectare at 10 day intervals each year was chosen as a worst-case. The applicant assumed crop interception of 60% + 70% + 70% in accordance with FOCUS (2000) and a crop growth stage of BBCH 53-77. This is, as requested, lower and more worst case than previously used in the DAR, (70%+70%+85% for Hamburg, Kremsmunster and Sevilla or 70% for other scenarios). Groundwater modelling of use of fluopicolide on potatoes was performed assuming use on potatoes every year, once every 2 years and once every 3 years. In potatoes, a scenario of 4 applications of 100 g fluopicolide per hectare at 5 day intervals was used, with the product applied every 1, 2 or 3 years. The applicant stated three year rotation was commonly practised in many European MSs to avoid build up of potato cyst nematodes, with two year rotation possible in specific cases, but that application
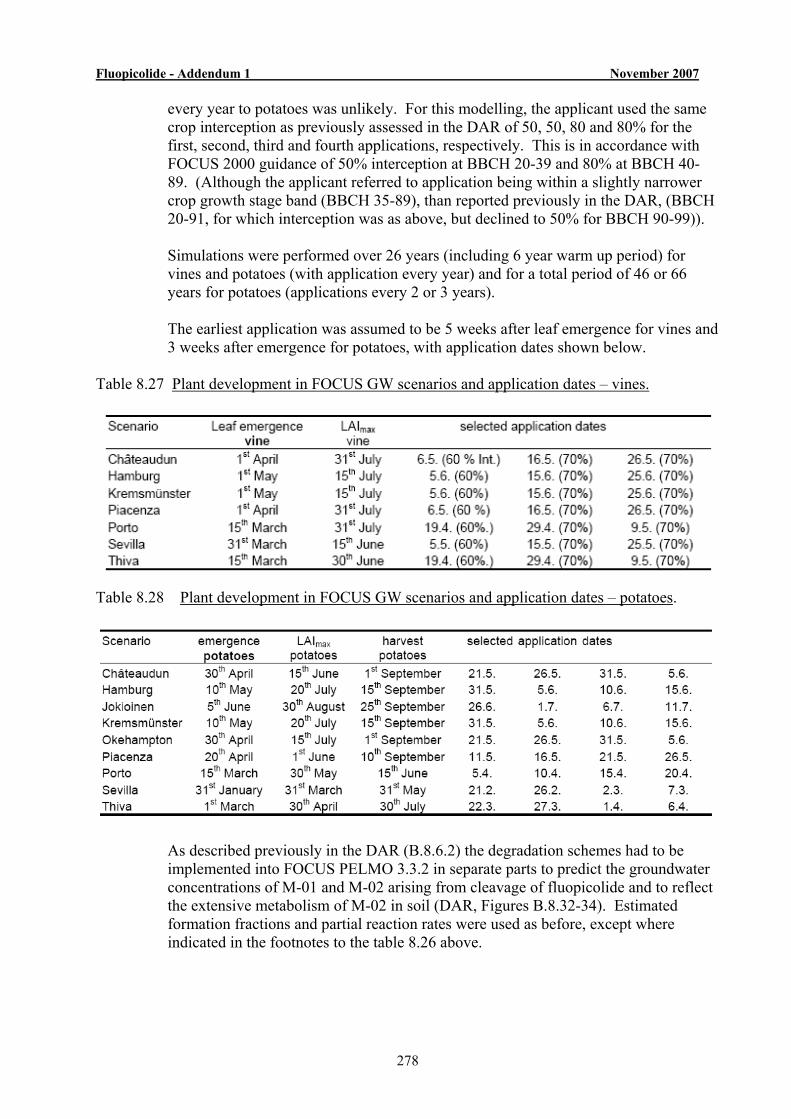
Fluopicolide - Addendum 1 November 2007
278
every year to potatoes was unlikely. For this modelling, the applicant used the same crop interception as previously assessed in the DAR of 50, 50, 80 and 80% for the first, second, third and fourth applications, respectively. This is in accordance with FOCUS 2000 guidance of 50% interception at BBCH 20-39 and 80% at BBCH 40-89. (Although the applicant referred to application being within a slightly narrower crop growth stage band (BBCH 35-89), than reported previously in the DAR, (BBCH 20-91, for which interception was as above, but declined to 50% for BBCH 90-99)). Simulations were performed over 26 years (including 6 year warm up period) for vines and potatoes (with application every year) and for a total period of 46 or 66 years for potatoes (applications every 2 or 3 years). The earliest application was assumed to be 5 weeks after leaf emergence for vines and
3 weeks after emergence for potatoes, with application dates shown below. Table 8.27 Plant development in FOCUS GW scenarios and application dates – vines.
Table 8.28 Plant development in FOCUS GW scenarios and application dates – potatoes.
As described previously in the DAR (B.8.6.2) the degradation schemes had to be implemented into FOCUS PELMO 3.3.2 in separate parts to predict the groundwater concentrations of M-01 and M-02 arising from cleavage of fluopicolide and to reflect the extensive metabolism of M-02 in soil (DAR, Figures B.8.32-34). Estimated formation fractions and partial reaction rates were used as before, except where indicated in the footnotes to the table 8.26 above.
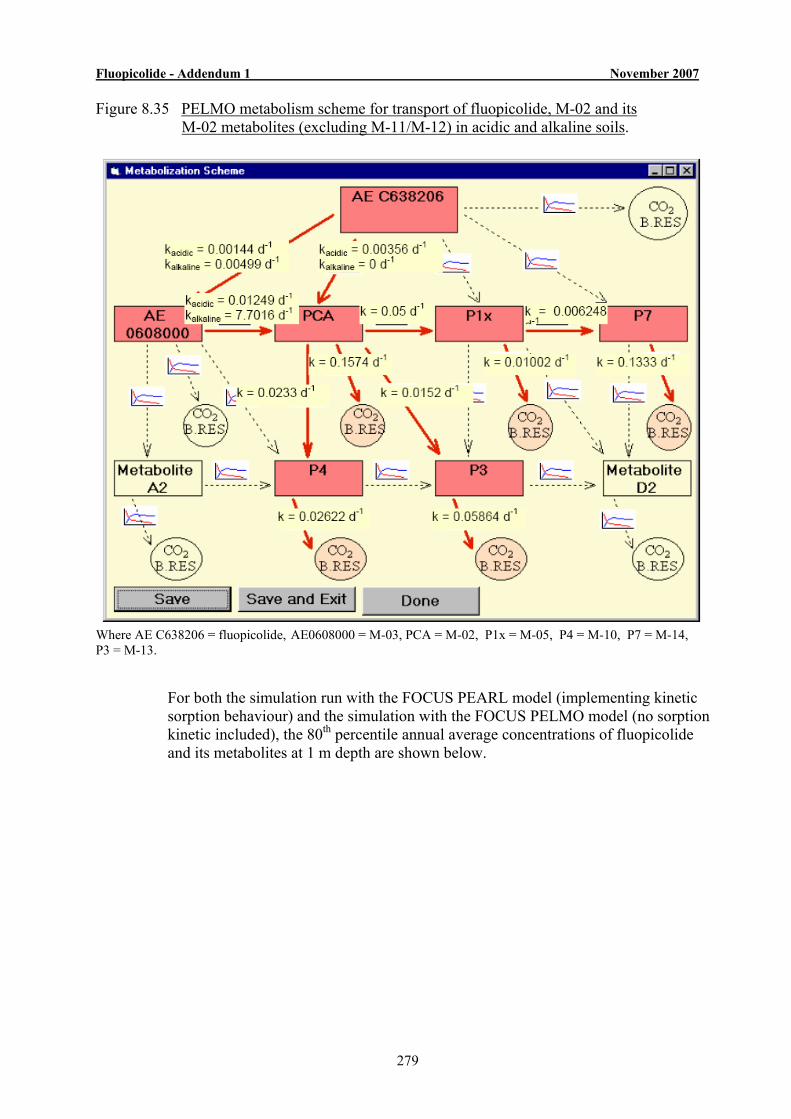
Fluopicolide - Addendum 1 November 2007
279
Figure 8.35 PELMO metabolism scheme for transport of fluopicolide, M-02 and its M-02 metabolites (excluding M-11/M-12) in acidic and alkaline soils.
Where AE C638206 = fluopicolide, AE0608000 = M-03, PCA = M-02, P1x = M-05, P4 = M-10, P7 = M-14, P3 = M-13.
For both the simulation run with the FOCUS PEARL model (implementing kinetic sorption behaviour) and the simulation with the FOCUS PELMO model (no sorption kinetic included), the 80th percentile annual average concentrations of fluopicolide and its metabolites at 1 m depth are shown below.
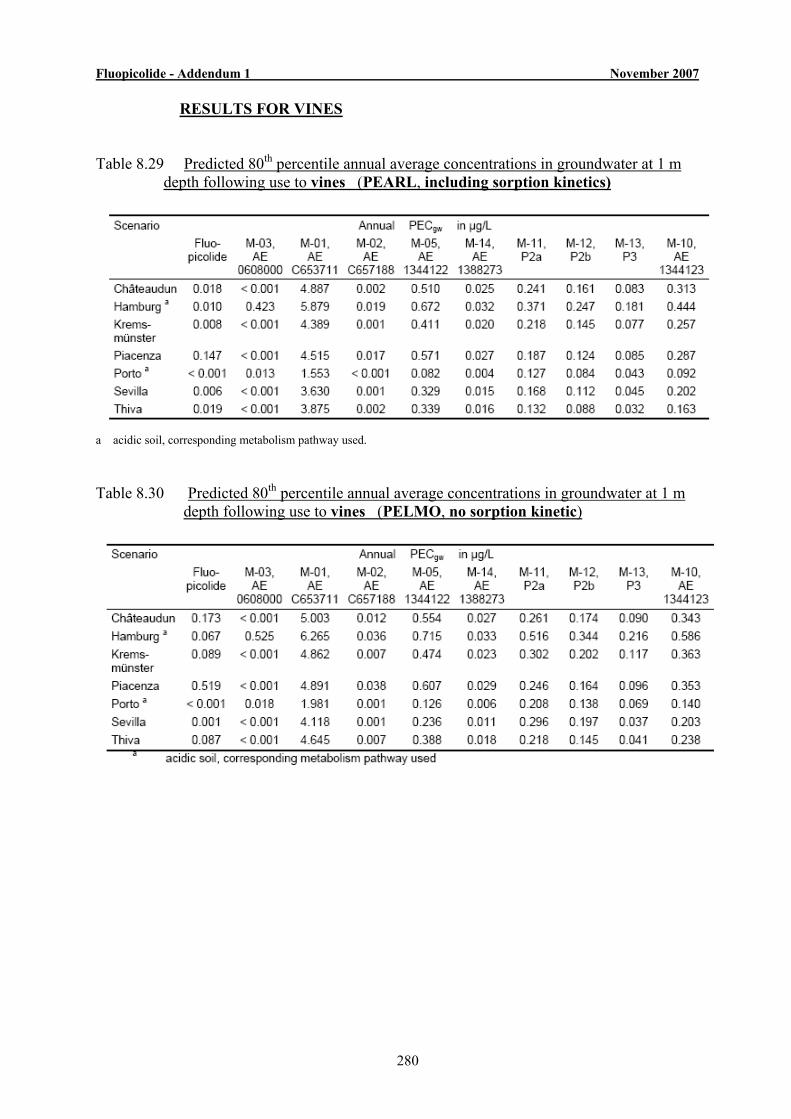
Fluopicolide - Addendum 1 November 2007
280
RESULTS FOR VINES Table 8.29 Predicted 80th percentile annual average concentrations in groundwater at 1 m depth following use to vines (PEARL, including sorption kinetics)
a acidic soil, corresponding metabolism pathway used. Table 8.30 Predicted 80th percentile annual average concentrations in groundwater at 1 m depth following use to vines (PELMO, no sorption kinetic)
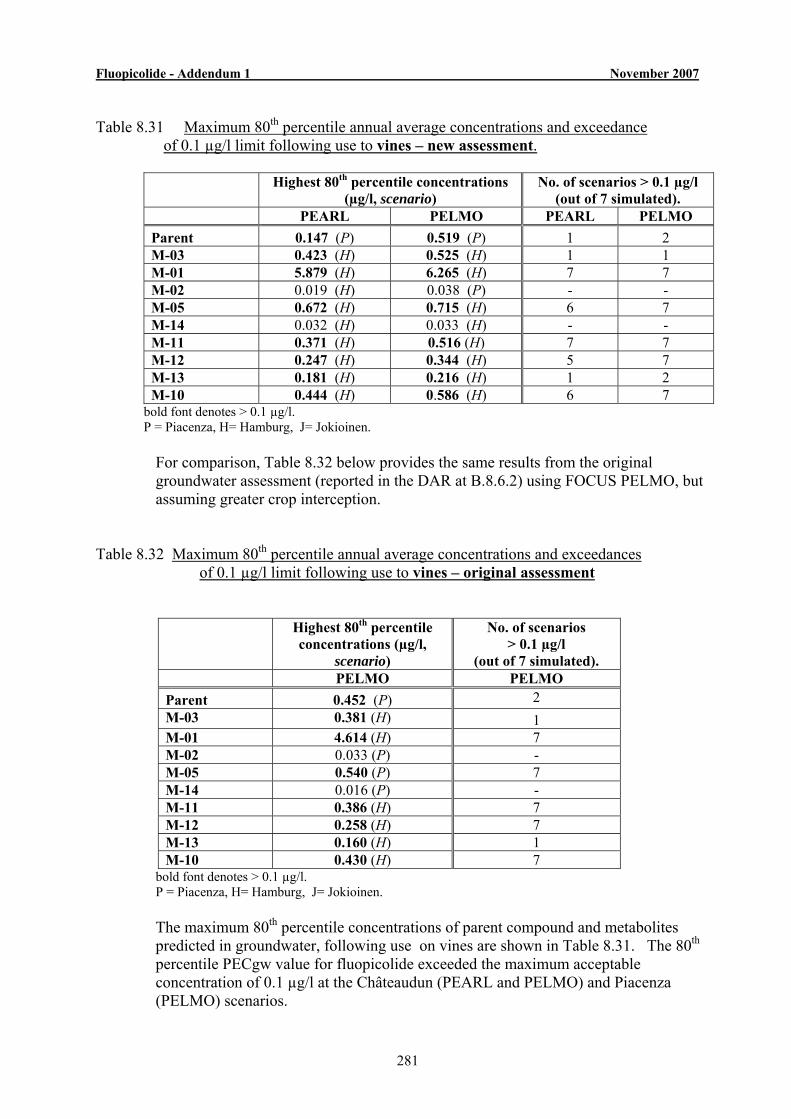
Fluopicolide - Addendum 1 November 2007
281
Table 8.31 Maximum 80th percentile annual average concentrations and exceedance of 0.1 µg/l limit following use to vines – new assessment.
Highest 80th percentile concentrations
(µg/l, scenario) No. of scenarios > 0.1 µg/l
(out of 7 simulated). PEARL PELMO PEARL PELMO
Parent 0.147 (P) 0.519 (P) 1 2 M-03 0.423 (H) 0.525 (H) 1 1 M-01 5.879 (H) 6.265 (H) 7 7 M-02 0.019 (H) 0.038 (P) - - M-05 0.672 (H) 0.715 (H) 6 7 M-14 0.032 (H) 0.033 (H) - - M-11 0.371 (H) 0.516 (H) 7 7 M-12 0.247 (H) 0.344 (H) 5 7 M-13 0.181 (H) 0.216 (H) 1 2 M-10 0.444 (H) 0.586 (H) 6 7
bold font denotes > 0.1 µg/l. P = Piacenza, H= Hamburg, J= Jokioinen.
For comparison, Table 8.32 below provides the same results from the original groundwater assessment (reported in the DAR at B.8.6.2) using FOCUS PELMO, but assuming greater crop interception.
Table 8.32 Maximum 80th percentile annual average concentrations and exceedances of 0.1 µg/l limit following use to vines – original assessment
Highest 80th percentile concentrations (µg/l,
scenario)
No. of scenarios > 0.1 µg/l
(out of 7 simulated). PELMO PELMO
Parent 0.452 (P) 2 M-03 0.381 (H) 1 M-01 4.614 (H) 7 M-02 0.033 (P) - M-05 0.540 (P) 7 M-14 0.016 (P) - M-11 0.386 (H) 7 M-12 0.258 (H) 7 M-13 0.160 (H) 1 M-10 0.430 (H) 7
bold font denotes > 0.1 µg/l. P = Piacenza, H= Hamburg, J= Jokioinen.
The maximum 80th percentile concentrations of parent compound and metabolites predicted in groundwater, following use on vines are shown in Table 8.31. The 80th percentile PECgw value for fluopicolide exceeded the maximum acceptable concentration of 0.1 µg/l at the Châteaudun (PEARL and PELMO) and Piacenza (PELMO) scenarios.
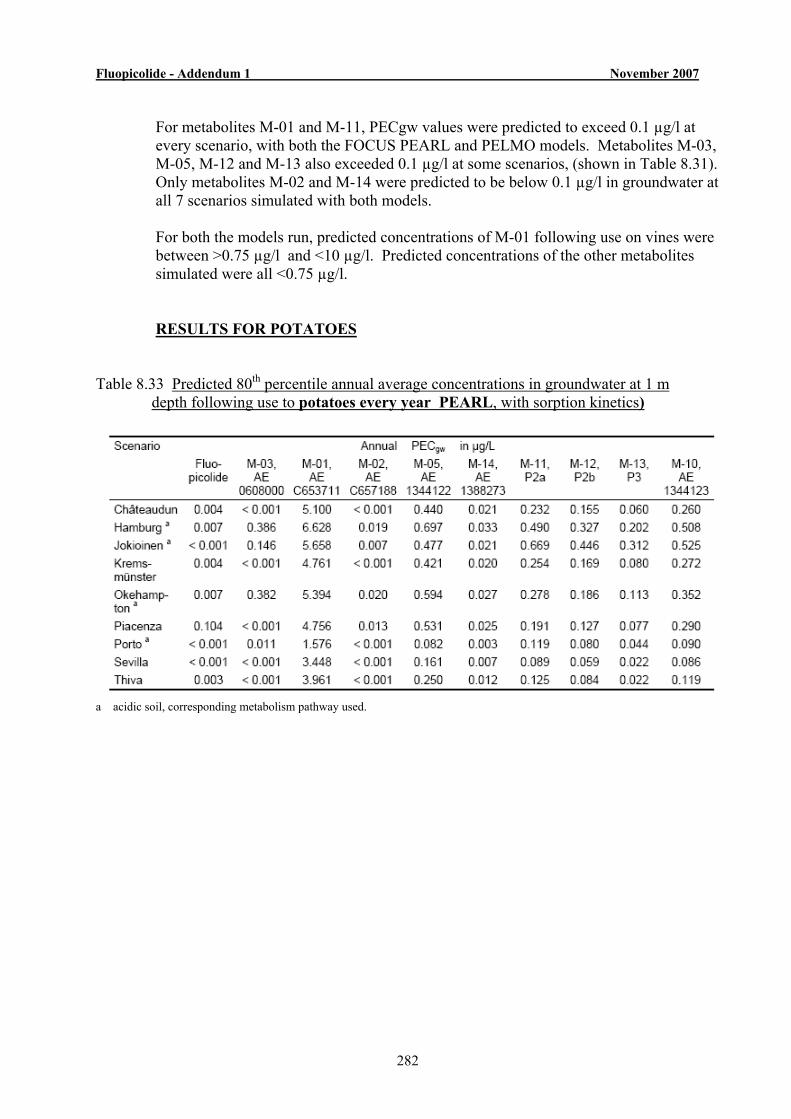
Fluopicolide - Addendum 1 November 2007
282
For metabolites M-01 and M-11, PECgw values were predicted to exceed 0.1 µg/l at every scenario, with both the FOCUS PEARL and PELMO models. Metabolites M-03, M-05, M-12 and M-13 also exceeded 0.1 µg/l at some scenarios, (shown in Table 8.31). Only metabolites M-02 and M-14 were predicted to be below 0.1 µg/l in groundwater at all 7 scenarios simulated with both models. For both the models run, predicted concentrations of M-01 following use on vines were between >0.75 µg/l and <10 µg/l. Predicted concentrations of the other metabolites simulated were all <0.75 µg/l.
RESULTS FOR POTATOES Table 8.33 Predicted 80th percentile annual average concentrations in groundwater at 1 m depth following use to potatoes every year PEARL, with sorption kinetics)
a acidic soil, corresponding metabolism pathway used.
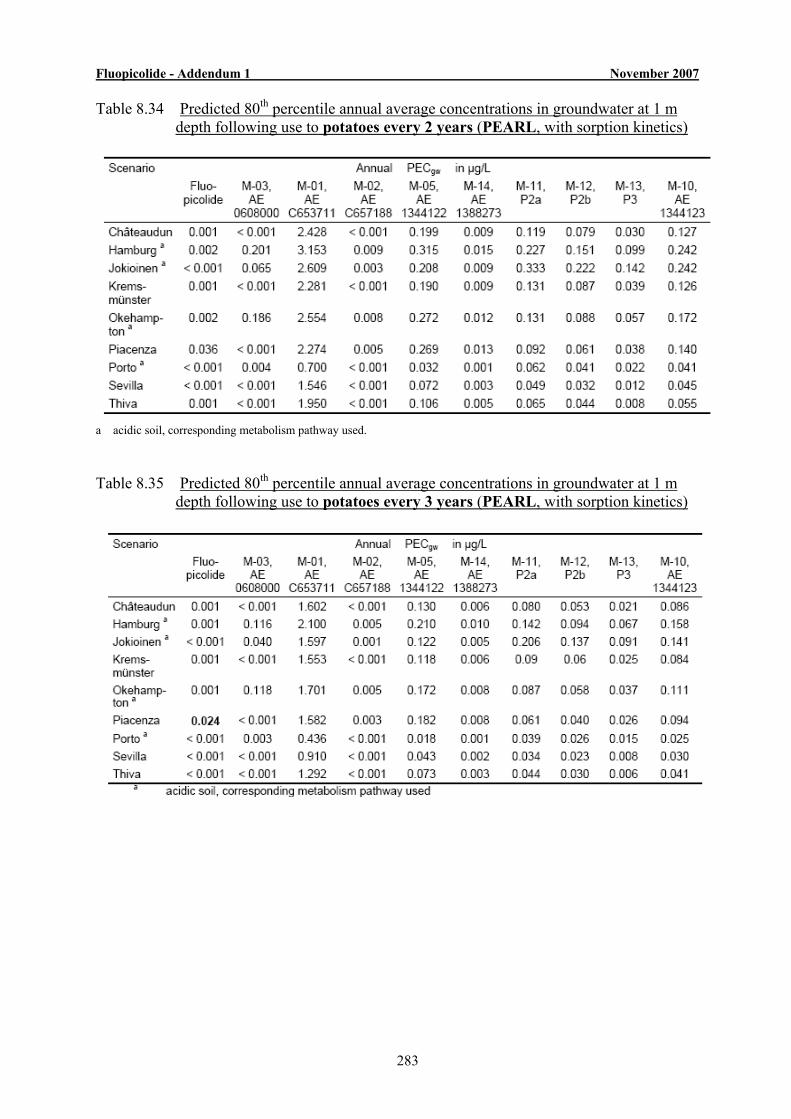
Fluopicolide - Addendum 1 November 2007
283
Table 8.34 Predicted 80th percentile annual average concentrations in groundwater at 1 m depth following use to potatoes every 2 years (PEARL, with sorption kinetics)
a acidic soil, corresponding metabolism pathway used. Table 8.35 Predicted 80th percentile annual average concentrations in groundwater at 1 m depth following use to potatoes every 3 years (PEARL, with sorption kinetics)
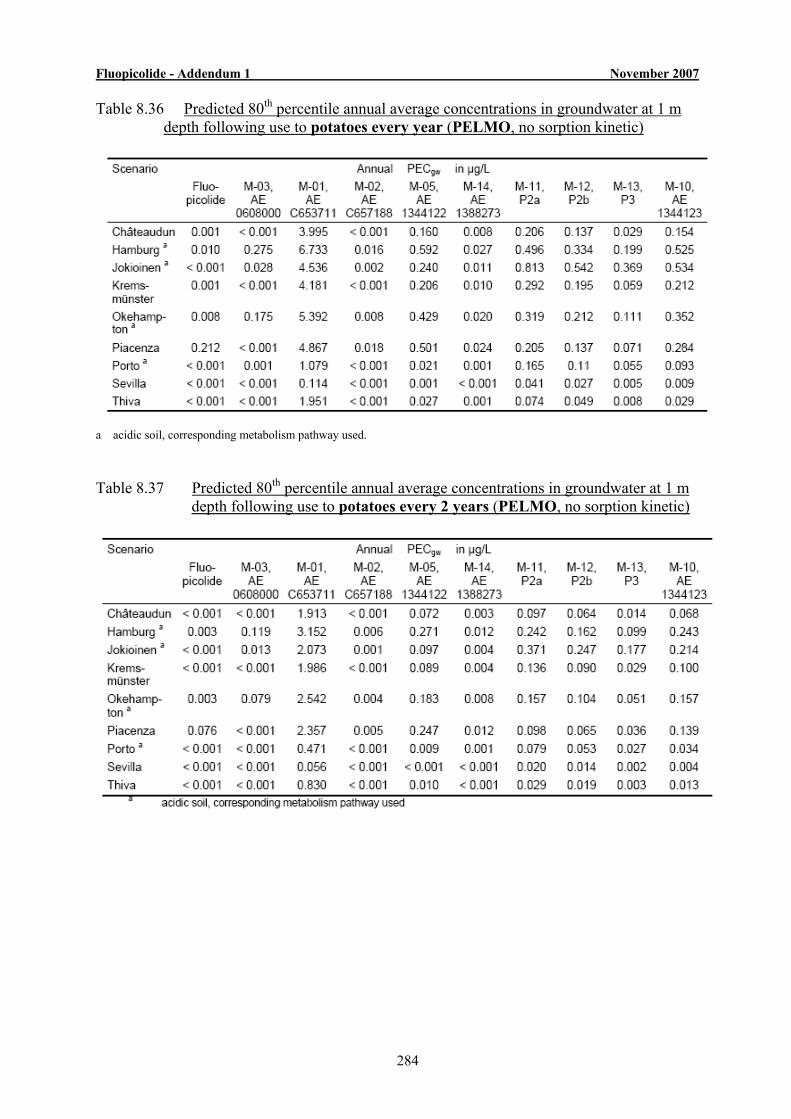
Fluopicolide - Addendum 1 November 2007
284
Table 8.36 Predicted 80th percentile annual average concentrations in groundwater at 1 m depth following use to potatoes every year (PELMO, no sorption kinetic)
a acidic soil, corresponding metabolism pathway used. Table 8.37 Predicted 80th percentile annual average concentrations in groundwater at 1 m depth following use to potatoes every 2 years (PELMO, no sorption kinetic)
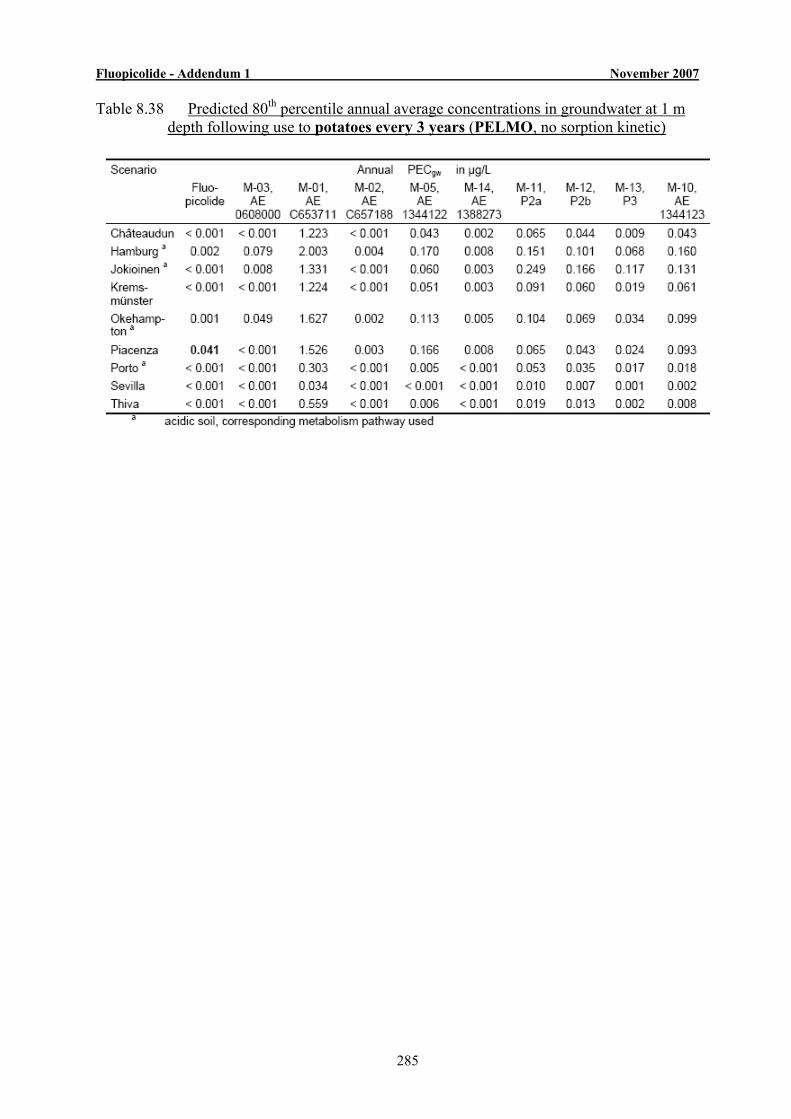
Fluopicolide - Addendum 1 November 2007
285
Table 8.38 Predicted 80th percentile annual average concentrations in groundwater at 1 m depth following use to potatoes every 3 years (PELMO, no sorption kinetic)
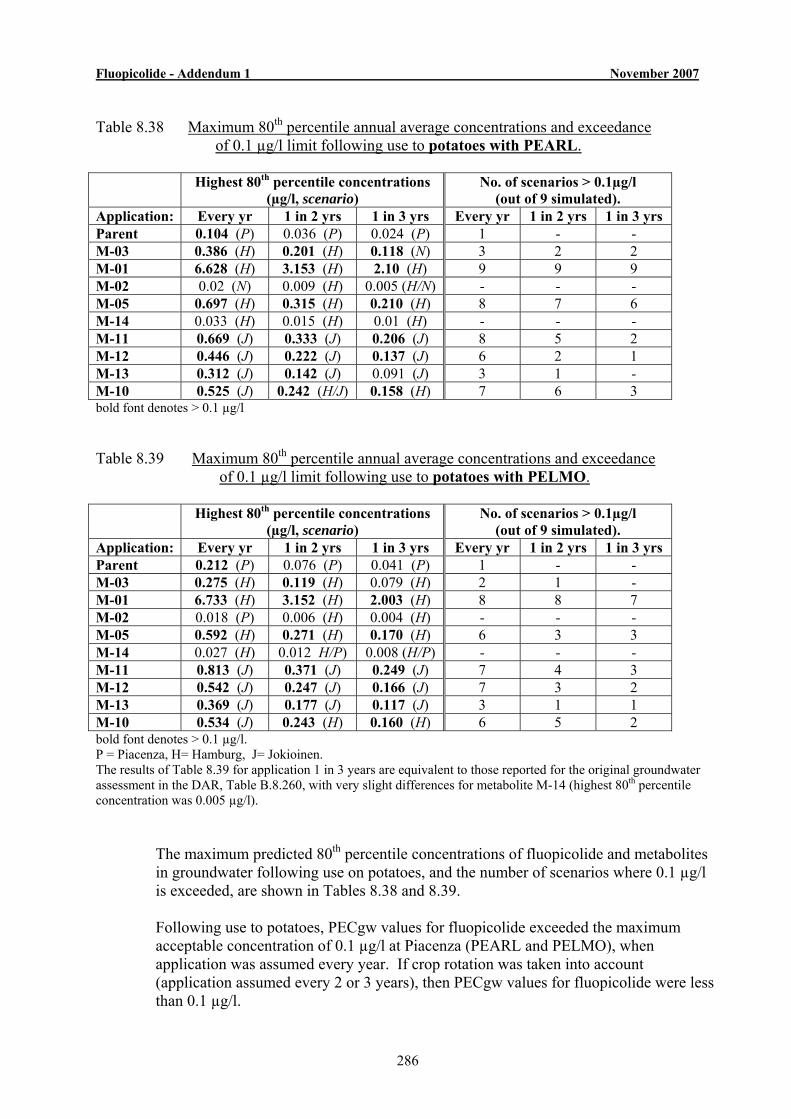
Fluopicolide - Addendum 1 November 2007
286
Table 8.38 Maximum 80th percentile annual average concentrations and exceedance
of 0.1 µg/l limit following use to potatoes with PEARL.
Highest 80th percentile concentrations (µg/l, scenario)
No. of scenarios > 0.1µg/l (out of 9 simulated).
Application: Every yr 1 in 2 yrs 1 in 3 yrs Every yr 1 in 2 yrs 1 in 3 yrs Parent 0.104 (P) 0.036 (P) 0.024 (P) 1 - - M-03 0.386 (H) 0.201 (H) 0.118 (N) 3 2 2 M-01 6.628 (H) 3.153 (H) 2.10 (H) 9 9 9 M-02 0.02 (N) 0.009 (H) 0.005 (H/N) - - - M-05 0.697 (H) 0.315 (H) 0.210 (H) 8 7 6 M-14 0.033 (H) 0.015 (H) 0.01 (H) - - - M-11 0.669 (J) 0.333 (J) 0.206 (J) 8 5 2 M-12 0.446 (J) 0.222 (J) 0.137 (J) 6 2 1 M-13 0.312 (J) 0.142 (J) 0.091 (J) 3 1 - M-10 0.525 (J) 0.242 (H/J) 0.158 (H) 7 6 3 bold font denotes > 0.1 µg/l
Table 8.39 Maximum 80th percentile annual average concentrations and exceedance of 0.1 µg/l limit following use to potatoes with PELMO.
Highest 80th percentile concentrations (µg/l, scenario)
No. of scenarios > 0.1µg/l (out of 9 simulated).
Application: Every yr 1 in 2 yrs 1 in 3 yrs Every yr 1 in 2 yrs 1 in 3 yrs Parent 0.212 (P) 0.076 (P) 0.041 (P) 1 - - M-03 0.275 (H) 0.119 (H) 0.079 (H) 2 1 - M-01 6.733 (H) 3.152 (H) 2.003 (H) 8 8 7 M-02 0.018 (P) 0.006 (H) 0.004 (H) - - - M-05 0.592 (H) 0.271 (H) 0.170 (H) 6 3 3 M-14 0.027 (H) 0.012 H/P) 0.008 (H/P) - - - M-11 0.813 (J) 0.371 (J) 0.249 (J) 7 4 3 M-12 0.542 (J) 0.247 (J) 0.166 (J) 7 3 2 M-13 0.369 (J) 0.177 (J) 0.117 (J) 3 1 1 M-10 0.534 (J) 0.243 (H) 0.160 (H) 6 5 2 bold font denotes > 0.1 µg/l. P = Piacenza, H= Hamburg, J= Jokioinen. The results of Table 8.39 for application 1 in 3 years are equivalent to those reported for the original groundwater assessment in the DAR, Table B.8.260, with very slight differences for metabolite M-14 (highest 80th percentile concentration was 0.005 µg/l).
The maximum predicted 80th percentile concentrations of fluopicolide and metabolites in groundwater following use on potatoes, and the number of scenarios where 0.1 µg/l is exceeded, are shown in Tables 8.38 and 8.39. Following use to potatoes, PECgw values for fluopicolide exceeded the maximum acceptable concentration of 0.1 µg/l at Piacenza (PEARL and PELMO), when application was assumed every year. If crop rotation was taken into account (application assumed every 2 or 3 years), then PECgw values for fluopicolide were less than 0.1 µg/l.
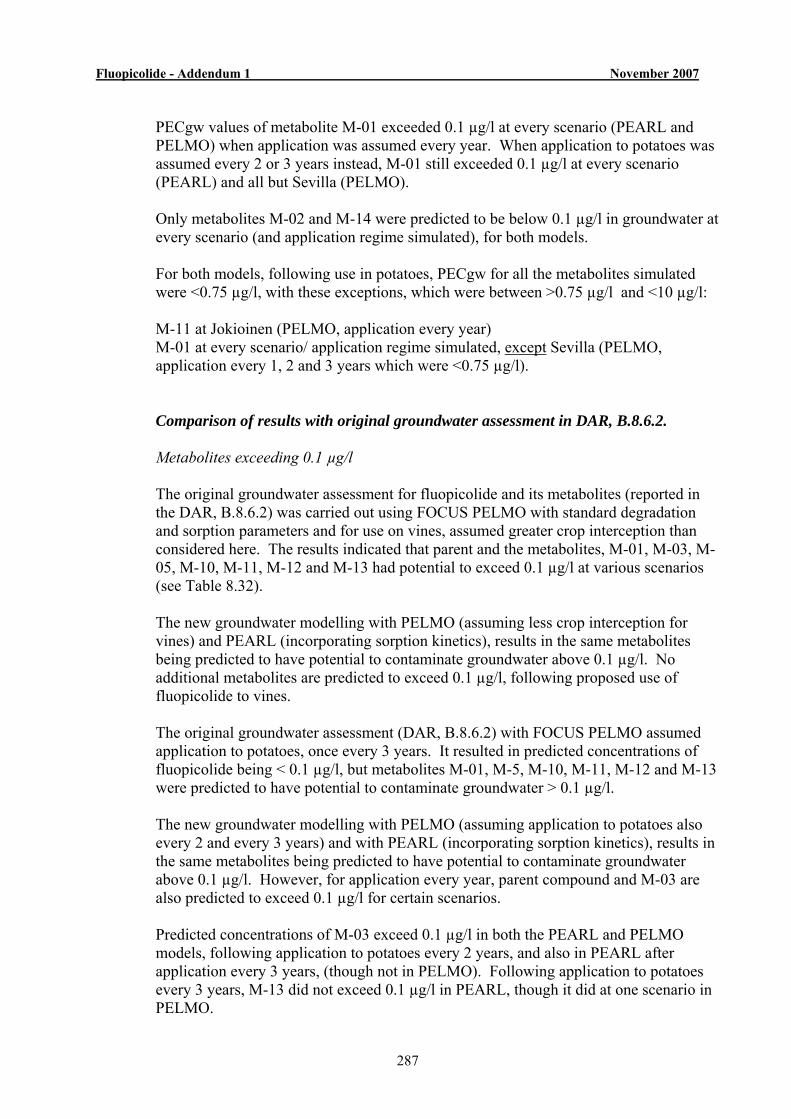
Fluopicolide - Addendum 1 November 2007
287
PECgw values of metabolite M-01 exceeded 0.1 µg/l at every scenario (PEARL and PELMO) when application was assumed every year. When application to potatoes was assumed every 2 or 3 years instead, M-01 still exceeded 0.1 µg/l at every scenario (PEARL) and all but Sevilla (PELMO). Only metabolites M-02 and M-14 were predicted to be below 0.1 µg/l in groundwater at every scenario (and application regime simulated), for both models. For both models, following use in potatoes, PECgw for all the metabolites simulated were <0.75 µg/l, with these exceptions, which were between >0.75 µg/l and <10 µg/l: M-11 at Jokioinen (PELMO, application every year) M-01 at every scenario/ application regime simulated, except Sevilla (PELMO, application every 1, 2 and 3 years which were <0.75 µg/l). Comparison of results with original groundwater assessment in DAR, B.8.6.2.
Metabolites exceeding 0.1 µg/l The original groundwater assessment for fluopicolide and its metabolites (reported in
the DAR, B.8.6.2) was carried out using FOCUS PELMO with standard degradation and sorption parameters and for use on vines, assumed greater crop interception than considered here. The results indicated that parent and the metabolites, M-01, M-03, M-05, M-10, M-11, M-12 and M-13 had potential to exceed 0.1 µg/l at various scenarios (see Table 8.32).
The new groundwater modelling with PELMO (assuming less crop interception for
vines) and PEARL (incorporating sorption kinetics), results in the same metabolites being predicted to have potential to contaminate groundwater above 0.1 µg/l. No additional metabolites are predicted to exceed 0.1 µg/l, following proposed use of fluopicolide to vines.
The original groundwater assessment (DAR, B.8.6.2) with FOCUS PELMO assumed
application to potatoes, once every 3 years. It resulted in predicted concentrations of fluopicolide being < 0.1 µg/l, but metabolites M-01, M-5, M-10, M-11, M-12 and M-13 were predicted to have potential to contaminate groundwater > 0.1 µg/l.
The new groundwater modelling with PELMO (assuming application to potatoes also
every 2 and every 3 years) and with PEARL (incorporating sorption kinetics), results in the same metabolites being predicted to have potential to contaminate groundwater above 0.1 µg/l. However, for application every year, parent compound and M-03 are also predicted to exceed 0.1 µg/l for certain scenarios.
Predicted concentrations of M-03 exceed 0.1 µg/l in both the PEARL and PELMO
models, following application to potatoes every 2 years, and also in PEARL after application every 3 years, (though not in PELMO). Following application to potatoes every 3 years, M-13 did not exceed 0.1 µg/l in PEARL, though it did at one scenario in PELMO.
Fluopicolide - Addendum 1 November 2007
288
Number of scenarios where 0.1 µg/l is exceeded For use of fluopicolide on vines, the number of scenarios where 0.1 µg/l was exceeded
by parent or metabolites is almost the same, when comparing the results of new and previous PELMO modelling. Incorporation of sorption kinetics in PEARL modelling, gave slightly fewer scenarios exceeding 0.1 µg/l for parent, M-05, M-10 and M-12, but otherwise was similar.
For use of fluopicolide on potatoes, the results of PELMO modelling for application
once every 3 years are essentially the same as previously reported in the DAR. Assuming more frequent application, i.e. every year or every 2 years, modelling with PELMO gave a greater number of scenarios where 0.1 µg/l was exceeded, as shown in Table 8.39.
Incorporation of sorption kinetics in PEARL modelling for use on potatoes generally
gave an increased number of scenarios at which concentrations of metabolites exceeded 0.1 µg/l, (increasing with frequency of application). There were some exceptions: for M-13, the number of scenarios with concentrations > 0.1 µg/l were similar to those with PELMO and for application every 3 years were all <0.1 µg/l in PEARL. For M-12, the number of scenarios with concentrations >0.1µg/l were slightly fewer in PEARL, than those with PELMO. For M-11, the number of scenarios with concentrations >0.1µg/l were one less than in PEARL, for application once every 3 years).
Differences in 80th percentile concentrations of parent and metabolites
For use of fluopicolide on vines, the assumption of less crop interception in PELMO modelling resulted in higher 80th percentile annual average concentrations for parent and metabolites, as would be expected. The incorporation of sorption kinetics in PEARL modelling gave lower PECgw values for parent fluopicolide, than in the original PELMO assessment, but in some cases concentrations of metabolites were higher (e.g. M-01, M-03, M-05, M-10, M-11, M-13 and M-14. Compare Tables 8.31 and 8.32).
For use of fluopicolide on potatoes, revised PELMO modelling assuming more frequent
application (every year or every 2 years) gave higher PECgw values for parent and metabolites, as would be expected. Incorporating sorption kinetics into PEARL modelling generally gave similar or slightly lower PECgw, compared to the results of PELMO modelling, with application every 3 years. (See Table 8.38 compared with the column for “application 1 in 3 years” of Table 8.39, the results of which are equivalent to those originally reported in the DAR).
For application to potatoes every 2 years, PEARL modelling gave a slightly higher 80th
percentile concentration for M-05, but similar or lower concentrations for parent and other metabolites, compared to corresponding results with PELMO. For application every 3 years, PEARL gave higher 80th percentile concentrations for M-03, M-05 and M-14, but similar or lower concentrations for parent and the other metabolites, compared to corresponding results with PELMO.
Fluopicolide - Addendum 1 November 2007
289
RMS Risk Assessment and Conclusions: For use on vines, fluopicolide is predicted to contaminate groundwater above the maximum acceptable concentration (0.1 µg/l) at one or two of the 7 scenarios modelled, (Châteaudun and or Piacenza). Concentrations of the metabolites M-01, M-05, M-10, M-11, M-12 and M-13 were predicted to exceed 0.1 µg/l in groundwater. Of these, M-01, M-05, M-10, M-11 and M-12 exceeded 0.1 µg/l in all, or almost all of the scenarios simulated in both PELMO and PEARL. In particular, predicted concentrations of M-01 were many orders of magnitude higher than this limit (range 1.6-6.3 µg/l). Metabolites M-03 and M-13 only exceeded 0.1 µg/l at a couple of scenarios, (and for M-03 the scenarios were those with acidic soils). Therefore, the relevance of these metabolites needs to be assessed further, in accordance with the EU Guidance Document on the assessment of the relevance of metabolites in groundwater.18
In the view of the RMS, application every year to potatoes is considered to be extreme and not representative in the vast majority of cases. For use of fluopicolide as proposed on potatoes, assuming application every 2 or 3 years, fluopicolide was not predicted to contaminate groundwater above 0.1 µg/l. However, M-01 exceeded 0.1 µg/l in all or almost all of the modelled scenarios (up to 2 µg/l and 3.2 µg/l, for application every 2 and 3 years, respectively). Metabolites M-03, M-05, M-10, M-11, M-12 and M-13 also exceeded the 0.1 µg/l limit for various scenarios. Therefore, as above for vines, the relevance of these metabolites need to be assessed further, in accordance with the EU Guidance Document. Overall, it can be seen that the revised modelling has not resulted in any additional metabolites being predicted to occur at >0.1 µg/l on an annual average basis. The highest concentrations of fluopicolide metabolites from either modelling or lysimeter study seen in the original DAR compared to the highest results from modelling in this addendum are presented below. These have been tabulated simply on the basis of concentration and ignore the GAP used to produce the PEC values and the model used. However, it should be noted that some of the highest concentrations from modelling in this addendum are from use every year on potatoes which the RMS considers to be extreme worst-case and inappropriate as a regulatory scenario.
18 EU Guidance Document on the assessment of the relevance of metabolites in groundwater of substances
regulated under Council Directive 91/414/EEC – Sanco/221/2000-rev 10, 25 February 2003.
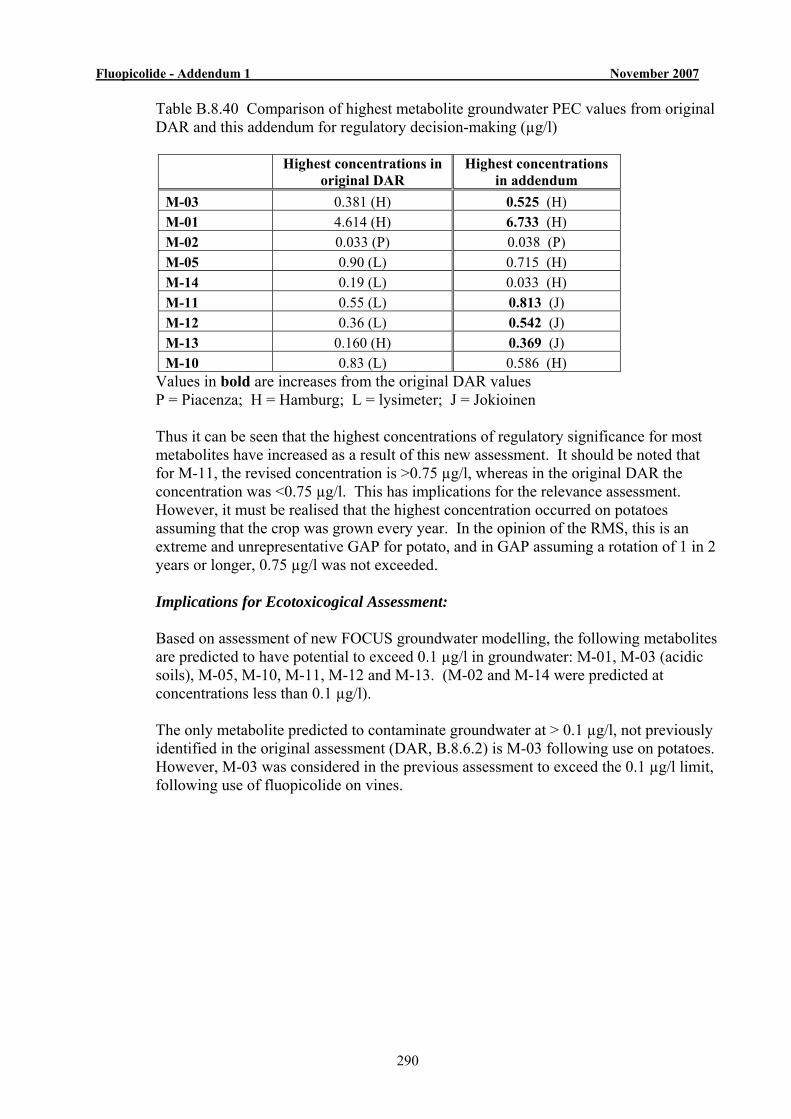
Fluopicolide - Addendum 1 November 2007
290
Table B.8.40 Comparison of highest metabolite groundwater PEC values from original DAR and this addendum for regulatory decision-making (µg/l)
Highest concentrations in original DAR
Highest concentrations in addendum
M-03 0.381 (H) 0.525 (H) M-01 4.614 (H) 6.733 (H) M-02 0.033 (P) 0.038 (P) M-05 0.90 (L) 0.715 (H) M-14 0.19 (L) 0.033 (H) M-11 0.55 (L) 0.813 (J) M-12 0.36 (L) 0.542 (J) M-13 0.160 (H) 0.369 (J) M-10 0.83 (L) 0.586 (H)
Values in bold are increases from the original DAR values P = Piacenza; H = Hamburg; L = lysimeter; J = Jokioinen Thus it can be seen that the highest concentrations of regulatory significance for most metabolites have increased as a result of this new assessment. It should be noted that for M-11, the revised concentration is >0.75 µg/l, whereas in the original DAR the concentration was <0.75 µg/l. This has implications for the relevance assessment. However, it must be realised that the highest concentration occurred on potatoes assuming that the crop was grown every year. In the opinion of the RMS, this is an extreme and unrepresentative GAP for potato, and in GAP assuming a rotation of 1 in 2 years or longer, 0.75 µg/l was not exceeded. Implications for Ecotoxicogical Assessment: Based on assessment of new FOCUS groundwater modelling, the following metabolites are predicted to have potential to exceed 0.1 µg/l in groundwater: M-01, M-03 (acidic soils), M-05, M-10, M-11, M-12 and M-13. (M-02 and M-14 were predicted at concentrations less than 0.1 µg/l). The only metabolite predicted to contaminate groundwater at > 0.1 µg/l, not previously identified in the original assessment (DAR, B.8.6.2) is M-03 following use on potatoes. However, M-03 was considered in the previous assessment to exceed the 0.1 µg/l limit, following use of fluopicolide on vines.
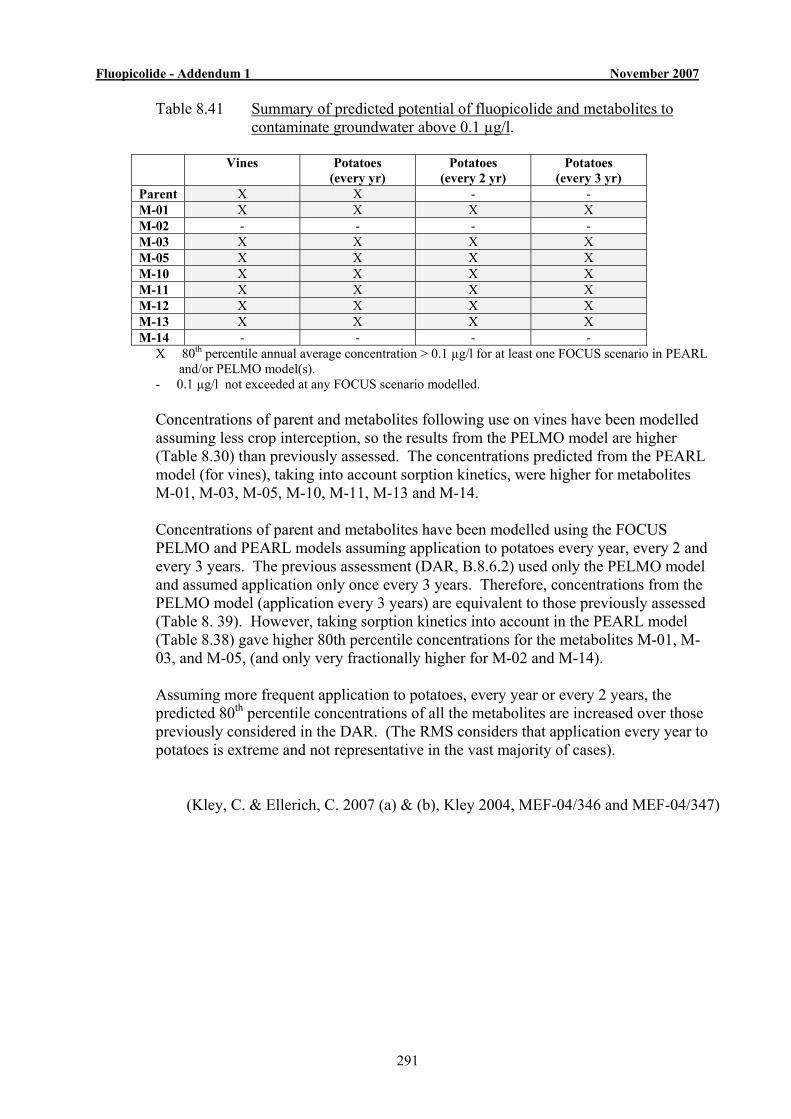
Fluopicolide - Addendum 1 November 2007
291
Table 8.41 Summary of predicted potential of fluopicolide and metabolites to contaminate groundwater above 0.1 µg/l.
Vines Potatoes (every yr)
Potatoes (every 2 yr)
Potatoes (every 3 yr)
Parent X X - - M-01 X X X X M-02 - - - - M-03 X X X X M-05 X X X X M-10 X X X X M-11 X X X X M-12 X X X X M-13 X X X X M-14 - - - -
X 80th percentile annual average concentration > 0.1 µg/l for at least one FOCUS scenario in PEARL and/or PELMO model(s). - 0.1 µg/l not exceeded at any FOCUS scenario modelled. Concentrations of parent and metabolites following use on vines have been modelled assuming less crop interception, so the results from the PELMO model are higher (Table 8.30) than previously assessed. The concentrations predicted from the PEARL model (for vines), taking into account sorption kinetics, were higher for metabolites M-01, M-03, M-05, M-10, M-11, M-13 and M-14. Concentrations of parent and metabolites have been modelled using the FOCUS PELMO and PEARL models assuming application to potatoes every year, every 2 and every 3 years. The previous assessment (DAR, B.8.6.2) used only the PELMO model and assumed application only once every 3 years. Therefore, concentrations from the PELMO model (application every 3 years) are equivalent to those previously assessed (Table 8. 39). However, taking sorption kinetics into account in the PEARL model (Table 8.38) gave higher 80th percentile concentrations for the metabolites M-01, M-03, and M-05, (and only very fractionally higher for M-02 and M-14). Assuming more frequent application to potatoes, every year or every 2 years, the predicted 80th percentile concentrations of all the metabolites are increased over those previously considered in the DAR. (The RMS considers that application every year to potatoes is extreme and not representative in the vast majority of cases).
(Kley, C. & Ellerich, C. 2007 (a) & (b), Kley 2004, MEF-04/346 and MEF-04/347)
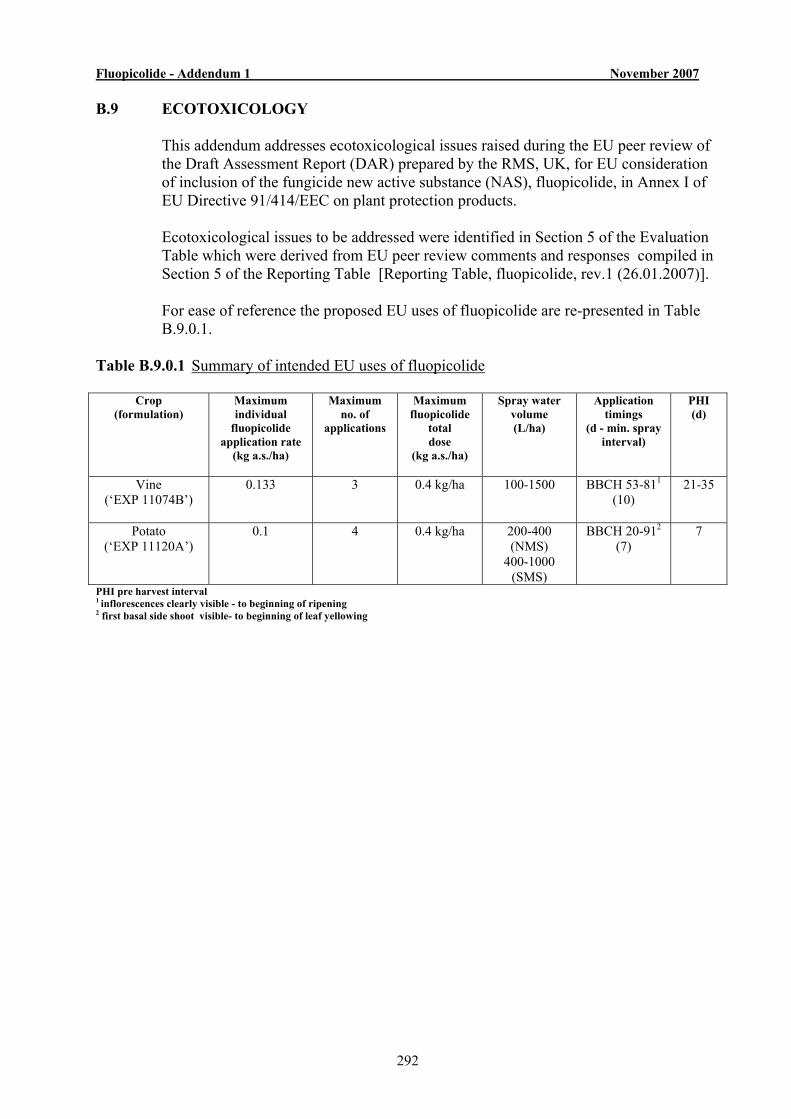
Fluopicolide - Addendum 1 November 2007
292
B.9 ECOTOXICOLOGY This addendum addresses ecotoxicological issues raised during the EU peer review of
the Draft Assessment Report (DAR) prepared by the RMS, UK, for EU consideration of inclusion of the fungicide new active substance (NAS), fluopicolide, in Annex I of EU Directive 91/414/EEC on plant protection products.
Ecotoxicological issues to be addressed were identified in Section 5 of the Evaluation
Table which were derived from EU peer review comments and responses compiled in Section 5 of the Reporting Table [Reporting Table, fluopicolide, rev.1 (26.01.2007)].
For ease of reference the proposed EU uses of fluopicolide are re-presented in Table
B.9.0.1. Table B.9.0.1 Summary of intended EU uses of fluopicolide
Crop (formulation)
Maximum individual
fluopicolide application rate
(kg a.s./ha)
Maximum no. of
applications
Maximum fluopicolide
total dose
(kg a.s./ha)
Spray water volume (L/ha)
Application timings
(d - min. spray interval)
PHI (d)
Vine (‘EXP 11074B’)
0.133
3 0.4 kg/ha 100-1500
BBCH 53-811
(10)
21-35
Potato (‘EXP 11120A’)
0.1 4 0.4 kg/ha 200-400 (NMS)
400-1000 (SMS)
BBCH 20-912
(7) 7
PHI pre harvest interval 1 inflorescences clearly visible - to beginning of ripening 2 first basal side shoot visible- to beginning of leaf yellowing

Fluopicolide - Addendum 1 November 2007
293
B.9.1 Non-target vertebrates - birds and mammals (DAR B.9.1 & B.9.3) Two issues Evaluation Open pts. 5.1 & 5.2 were raised pertinent to the dietary risk
posed to birds and mammals from proposed uses of fluopicolide in potato and vine.
Evaluation Table Open pt. 5.1 'RMS to clarify in an addendum how the MAF for different vegetation was calculated
and used in the assessment of risk to birds' 5.1 RMS response:
For clarity, the Tier 1 bird and mammal risk assessment for use on potato, undertaken in accordance with SANCO 4145/2000-24/Sep/2002, is re-presented in Table B.9.1.1.
Table B.9.1.1 Tier I avian and mammalian dietary risk from proposed fluopicolide use on potato
RISK Indicator FIR a.s. ETE Tox. TER Ann.
Crop spp. /bw app. rate RUD MAF ftwa PT PD AV end pt. VI
/ food (bw kg) kg/ha mg a.s./kg bw/d AVIAN - ACUTE LD50
Leafy (E/L) insectivore 1.04 0.100 52 n.a. n.a. 1.00 1.00 1.00 5.408 >2250.00 >416.05 10
/ s. insects (0.01)
Leafy (E/L) herbivore 0.76 0.100 87 1.81 n.a. 1.00 1.00 1.00 11.879 >2250.00 >189.41 10
/ leaves (0.3)
AVIAN - SHORT TERM LC50 Leafy (E/L) insectivore 1.04 0.100 29 n.a n.a. 1.00 1.00 1.00 3.016 >1744.00 >578.25 10
/ s. insects (0.01)
Leafy (E/L) herbivore 0.76 0.100 40 2.2 n.a. 1.00 1.00 1.00 6.772 >1744.00 >257.52 10
/ leaves (0.3
AVIAN - LONG TERM NOEC Leafy (E/L) insectivore 1.04 0.100 29 n.a. n.a. 1.00 1.00 1.00 3.016 88.90 29.48 5
/ s. insects (0.01)
Leafy (E/L) herbivore 0.76 0.100 40 2.2 0.53 1.00 1.00 1.00 3.567 88.90 24.92 5
/ leaves (0.3)
MAMMALIAN - ACUTE LD50
Leafy (E/L) herbivore 0.28 0.100 87 1.81 n.a. 1.00 1.00 1.00 4.377 >5000.00 >1142.46 10
/ leaves (3.0)
Leafy (E/L) Insectivore2 0.63 0.100 14 n.a. n.a. 1.00 1.00 1.00 0.882 >5000.00 >5668.93 10
/ l. insects (0.01)
MAMMALIAN - LONG TERM NOEC Leafy (E/L) herbivore 0.28 0.100 40 2.2 0.53 1.00 1.00 1.00 1.314 20.00 15.22 5
/ leaves (3.0)
Leafy (E/L) Insectivore2 0.63 0.100 5 n.a. n.a. 1.00 1.00 1.00 0.321 20.00 62.25 5
/ l. insects (0.01) n.a. not applicable; 1amended to SANCO 4145/2000 value 2 indicator insectivorous species included as potato leaves are not grazed by herbivorous mammals
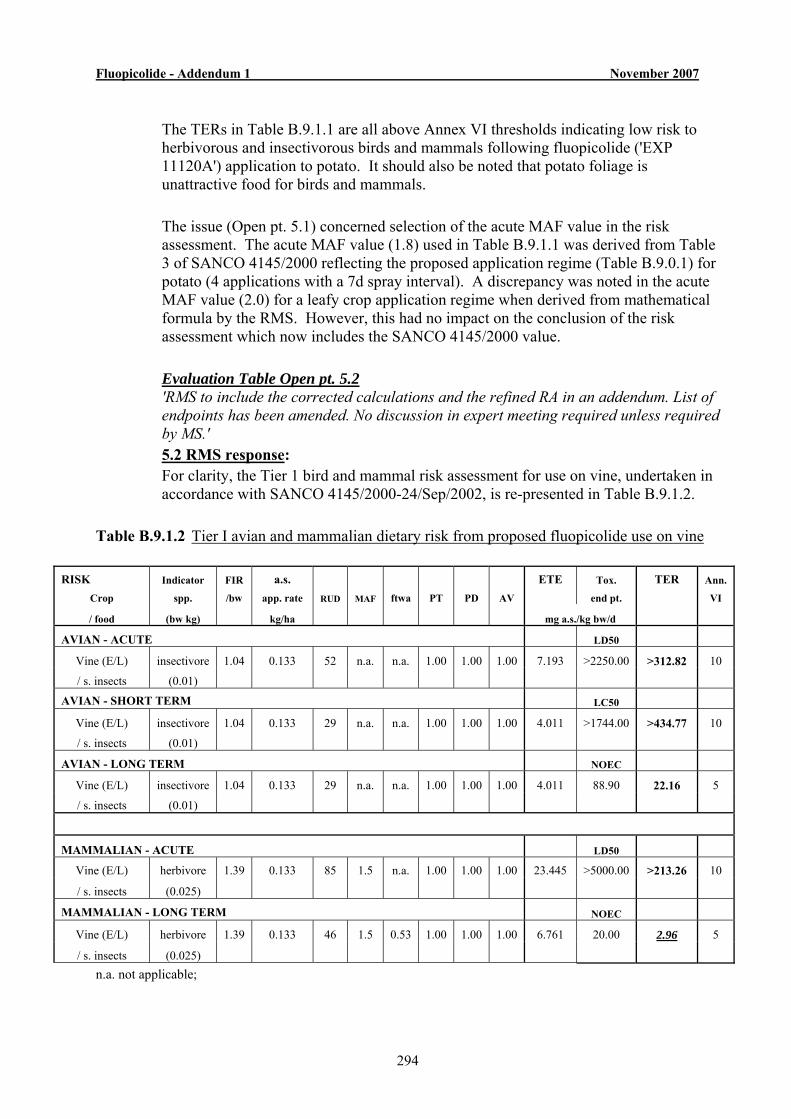
Fluopicolide - Addendum 1 November 2007
294
The TERs in Table B.9.1.1 are all above Annex VI thresholds indicating low risk to
herbivorous and insectivorous birds and mammals following fluopicolide ('EXP 11120A') application to potato. It should also be noted that potato foliage is unattractive food for birds and mammals.
The issue (Open pt. 5.1) concerned selection of the acute MAF value in the risk
assessment. The acute MAF value (1.8) used in Table B.9.1.1 was derived from Table 3 of SANCO 4145/2000 reflecting the proposed application regime (Table B.9.0.1) for potato (4 applications with a 7d spray interval). A discrepancy was noted in the acute MAF value (2.0) for a leafy crop application regime when derived from mathematical formula by the RMS. However, this had no impact on the conclusion of the risk assessment which now includes the SANCO 4145/2000 value.
Evaluation Table Open pt. 5.2
'RMS to include the corrected calculations and the refined RA in an addendum. List of endpoints has been amended. No discussion in expert meeting required unless required by MS.' 5.2 RMS response:
For clarity, the Tier 1 bird and mammal risk assessment for use on vine, undertaken in accordance with SANCO 4145/2000-24/Sep/2002, is re-presented in Table B.9.1.2.
Table B.9.1.2 Tier I avian and mammalian dietary risk from proposed fluopicolide use on vine
RISK Indicator FIR a.s. ETE Tox. TER Ann.
Crop spp. /bw app. rate RUD MAF ftwa PT PD AV end pt. VI
/ food (bw kg) kg/ha mg a.s./kg bw/d AVIAN - ACUTE LD50
Vine (E/L) insectivore 1.04 0.133 52 n.a. n.a. 1.00 1.00 1.00 7.193 >2250.00 >312.82 10
/ s. insects (0.01)
AVIAN - SHORT TERM LC50 Vine (E/L) insectivore 1.04 0.133 29 n.a. n.a. 1.00 1.00 1.00 4.011 >1744.00 >434.77 10
/ s. insects (0.01)
AVIAN - LONG TERM NOEC Vine (E/L) insectivore 1.04 0.133 29 n.a. n.a. 1.00 1.00 1.00 4.011 88.90 22.16 5
/ s. insects (0.01)
MAMMALIAN - ACUTE LD50
Vine (E/L) herbivore 1.39 0.133 85 1.5 n.a. 1.00 1.00 1.00 23.445 >5000.00 >213.26 10
/ s. insects (0.025)
MAMMALIAN - LONG TERM NOEC Vine (E/L) herbivore 1.39 0.133 46 1.5 0.53 1.00 1.00 1.00 6.761 20.00 2.96 5
/ s. insects (0.025) n.a. not applicable;
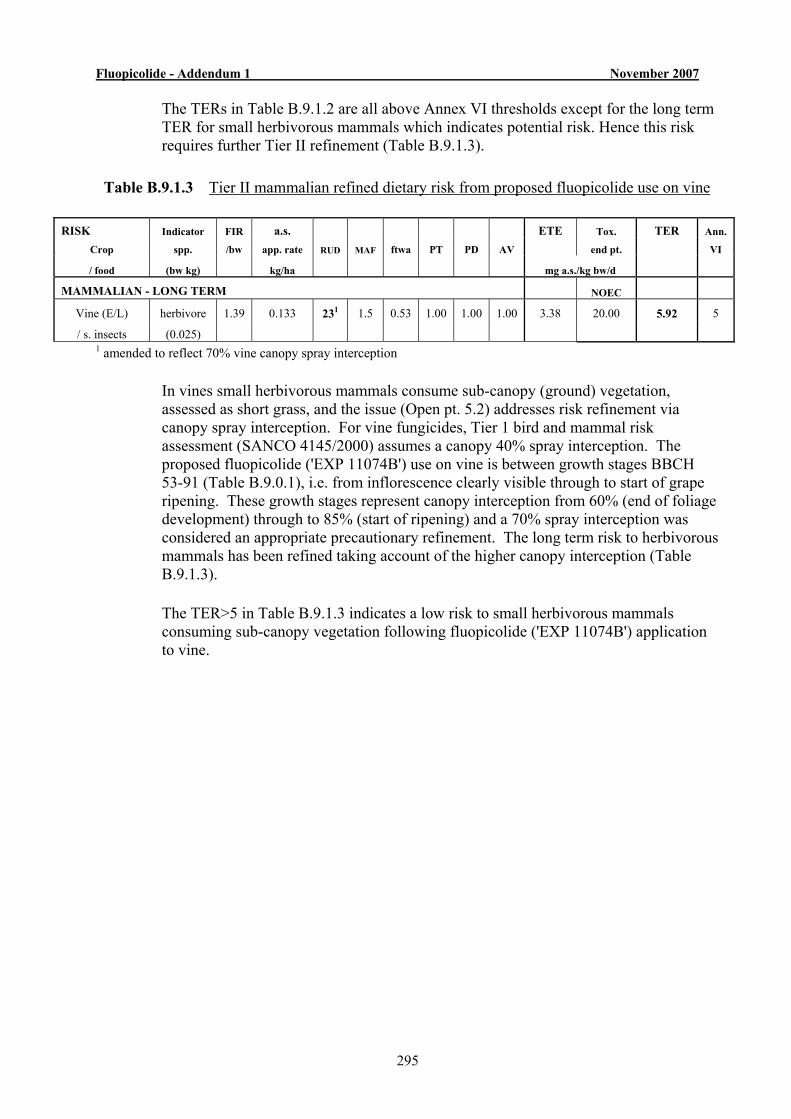
Fluopicolide - Addendum 1 November 2007
295
The TERs in Table B.9.1.2 are all above Annex VI thresholds except for the long term TER for small herbivorous mammals which indicates potential risk. Hence this risk requires further Tier II refinement (Table B.9.1.3).
Table B.9.1.3 Tier II mammalian refined dietary risk from proposed fluopicolide use on vine
RISK Indicator FIR a.s. ETE Tox. TER Ann.
Crop spp. /bw app. rate RUD MAF ftwa PT PD AV end pt. VI
/ food (bw kg) kg/ha mg a.s./kg bw/d MAMMALIAN - LONG TERM NOEC
Vine (E/L) herbivore 1.39 0.133 231 1.5 0.53 1.00 1.00 1.00 3.38 20.00 5.92 5
/ s. insects (0.025) 1 amended to reflect 70% vine canopy spray interception In vines small herbivorous mammals consume sub-canopy (ground) vegetation,
assessed as short grass, and the issue (Open pt. 5.2) addresses risk refinement via canopy spray interception. For vine fungicides, Tier 1 bird and mammal risk assessment (SANCO 4145/2000) assumes a canopy 40% spray interception. The proposed fluopicolide ('EXP 11074B') use on vine is between growth stages BBCH 53-91 (Table B.9.0.1), i.e. from inflorescence clearly visible through to start of grape ripening. These growth stages represent canopy interception from 60% (end of foliage development) through to 85% (start of ripening) and a 70% spray interception was considered an appropriate precautionary refinement. The long term risk to herbivorous mammals has been refined taking account of the higher canopy interception (Table B.9.1.3).
The TER>5 in Table B.9.1.3 indicates a low risk to small herbivorous mammals
consuming sub-canopy vegetation following fluopicolide ('EXP 11074B') application to vine.
Fluopicolide - Addendum 1 November 2007
296
B.9.2 Aquatic organisms Four issues (Evaluation Table Open points 5.3, 5.4, 5.5 & 5.12) were raised
pertinent to the risk to aquatic organisms from proposed uses of fluopicolide in potato and vine crops:
Evaluation Table Open pt. 5.3
'RMS to include the information on Log Pow values for the metabolites in an addendum (only data for M02 and M03 are available in Vol.B.2.1 of the DAR). No discussion in an experts meeting is required.' 5.3 RMS response:
Log Pow values of parent and metabolites are considered in ecotoxicological risk assessment of potential bioconcentration potential.
A fish bioconcentration study was conducted (see DAR B.9.2.3.4) as fluopicolide has a
logPow of 2.9, i.e. close to the logPow Annex VI threshold of >3.0 for bioconcentration assessment. The results showed that fluopicolide had bioconcentration factor (BCF) in fish of 121. Clearance of fluopicolide from fish tissues, CT50 and CT90, were 0.51 and 1.7d, respectively, and 5% of total residue remained after 18d depuration.
The overall conclusion for fluopicolide was that the low BCF and rapid clearance
times of fluopicolide from fish tissues indicated a low propensity to bioaccumulate in fish. Potential for fluopicolide bioconcentration in worm- and fish-eating bird and mammals was also considered to be low (DAR B.9.15 & B.9.3.3).
Key aquatic metabolites M03, M02 and M01 (see Appendix 1) have log Pow values of
2.34, -2.0 and 0.51 (DAR Volume B.2.1), respectively, and a lower propensity for bioaccumulation than parent fluopicolide would hence be expected. M03 is also not stable in aquatic systems at environmental pH and degraded to form M02 and M01 and hence also likely to have a very low bioavailability. All other aquatic metabolites M05, M10, M11, M12, M13 and M14 are similarly structured hydroxylated and/or sulphonated derivatives of M02 (see Appendix 2). Thus such derivatives will likely have logPow values approximating to that of M02 and hence it can also be concluded that all the key aquatic fluopicolide metabolites will have little potential to bioaccumulate.
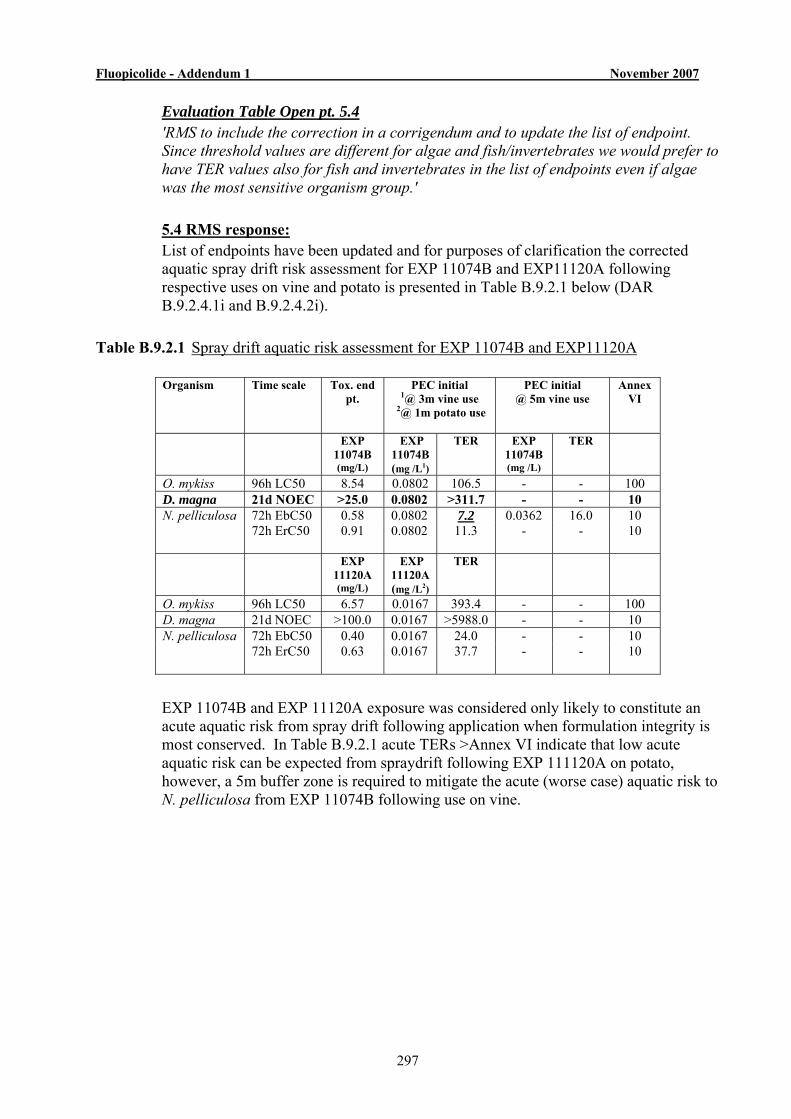
Fluopicolide - Addendum 1 November 2007
297
Evaluation Table Open pt. 5.4 'RMS to include the correction in a corrigendum and to update the list of endpoint.
Since threshold values are different for algae and fish/invertebrates we would prefer to have TER values also for fish and invertebrates in the list of endpoints even if algae was the most sensitive organism group.'
5.4 RMS response:
List of endpoints have been updated and for purposes of clarification the corrected aquatic spray drift risk assessment for EXP 11074B and EXP11120A following respective uses on vine and potato is presented in Table B.9.2.1 below (DAR B.9.2.4.1i and B.9.2.4.2i).
Table B.9.2.1 Spray drift aquatic risk assessment for EXP 11074B and EXP11120A
Organism Time scale Tox. end pt.
PEC initial 1@ 3m vine use
2@ 1m potato use
PEC initial @ 5m vine use
Annex VI
EXP 11074B (mg/L)
EXP 11074B (mg /L1)
TER EXP 11074B (mg /L)
TER
O. mykiss 96h LC50 8.54 0.0802 106.5 - - 100 D. magna 21d NOEC >25.0 0.0802 >311.7 - - 10 N. pelliculosa 72h EbC50 0.58 0.0802 7.2 0.0362 16.0 10 72h ErC50
0.91 0.0802 11.3 - - 10
EXP 11120A (mg/L)
EXP 11120A (mg /L2)
TER
O. mykiss 96h LC50 6.57 0.0167 393.4 - - 100 D. magna 21d NOEC >100.0 0.0167 >5988.0 - - 10 N. pelliculosa 72h EbC50 0.40 0.0167 24.0 - - 10 72h ErC50
0.63 0.0167 37.7 - - 10
EXP 11074B and EXP 11120A exposure was considered only likely to constitute an
acute aquatic risk from spray drift following application when formulation integrity is most conserved. In Table B.9.2.1 acute TERs >Annex VI indicate that low acute aquatic risk can be expected from spraydrift following EXP 111120A on potato, however, a 5m buffer zone is required to mitigate the acute (worse case) aquatic risk to N. pelliculosa from EXP 11074B following use on vine.
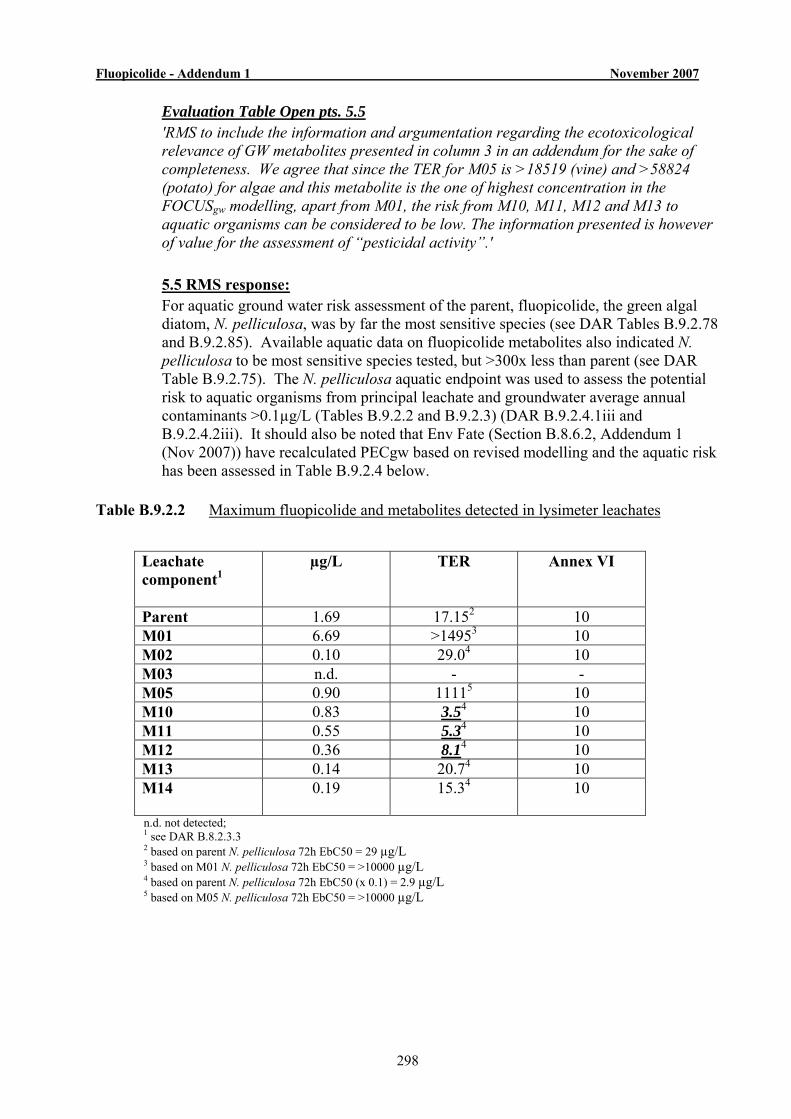
Fluopicolide - Addendum 1 November 2007
298
Evaluation Table Open pts. 5.5 'RMS to include the information and argumentation regarding the ecotoxicological
relevance of GW metabolites presented in column 3 in an addendum for the sake of completeness. We agree that since the TER for M05 is >18519 (vine) and >58824 (potato) for algae and this metabolite is the one of highest concentration in the FOCUSgw modelling, apart from M01, the risk from M10, M11, M12 and M13 to aquatic organisms can be considered to be low. The information presented is however of value for the assessment of “pesticidal activity”.'
5.5 RMS response:
For aquatic ground water risk assessment of the parent, fluopicolide, the green algal diatom, N. pelliculosa, was by far the most sensitive species (see DAR Tables B.9.2.78 and B.9.2.85). Available aquatic data on fluopicolide metabolites also indicated N. pelliculosa to be most sensitive species tested, but >300x less than parent (see DAR Table B.9.2.75). The N. pelliculosa aquatic endpoint was used to assess the potential risk to aquatic organisms from principal leachate and groundwater average annual contaminants >0.1µg/L (Tables B.9.2.2 and B.9.2.3) (DAR B.9.2.4.1iii and B.9.2.4.2iii). It should also be noted that Env Fate (Section B.8.6.2, Addendum 1 (Nov 2007)) have recalculated PECgw based on revised modelling and the aquatic risk has been assessed in Table B.9.2.4 below.
Table B.9.2.2 Maximum fluopicolide and metabolites detected in lysimeter leachates
Leachate component1
µg/L TER Annex VI
Parent 1.69 17.152 10 M01 6.69 >14953 10 M02 0.10 29.04 10 M03 n.d. - - M05 0.90 11115 10 M10 0.83 3.54 10 M11 0.55 5.34 10 M12 0.36 8.14 10 M13 0.14 20.74 10 M14
0.19 15.34 10
n.d. not detected; 1 see DAR B.8.2.3.3 2 based on parent N. pelliculosa 72h EbC50 = 29 µg/L 3 based on M01 N. pelliculosa 72h EbC50 = >10000 µg/L 4 based on parent N. pelliculosa 72h EbC50 (x 0.1) = 2.9 µg/L 5 based on M05 N. pelliculosa 72h EbC50 = >10000 µg/L

Fluopicolide - Addendum 1 November 2007
299
Table B.9.2.3 FOCUSgw PECs - N. pelliculosa Aquatic risk assessment
EXP 11074B use on vine (see DAR Table B.8.259) PECgw (80%ile) parent M01 M02 M03 M05 Scenarios µg/L TER2 µg/L TER3 µg/L TER µg/L TER4 µg/L TER5
Châteaudun 0.147 197 4.466 >2239 < 0.1 n.r. < 0.1 n.r. 0.492 >20325 Hamburg1 < 0.1 n.r. 4.614 >2167 < 0.1 n.r. 0.381 7.6 0.515 >19417 Kremsmünster < 0.1 n.r. 3.570 >2801 < 0.1 n.r. < 0.1 n.r. 0.340 >29412 Piacenza 0.452 64 4.374 >2286 < 0.1 n.r. < 0.1 n.r. 0.540 >18519 Porto1 < 0.1 n.r. 1.755 >5698 < 0.1 n.r. < 0.1 n.r. 0.111 >90090 Sevilla < 0.1 n.r. 3.016 >3316 < 0.1 n.r. < 0.1 n.r. 0.168 >59524 Thiva
< 0.1
n.r. 4.131
>2421 < 0.1
n.r. < 0.1
n.r. 0.343
>29155
M10 M11 M12 M13 M14 µg/L TER4 µg/L TER4 µg/L TER4 µg/L TER4 µg/L TER Châteaudun 0.306 9.5 0.235 12.3 0.156 18.6 < 0.1 n.r. < 0.1 n.r. Hamburg1 0.430 6.7 0.386 7.5 0.258 11.2 0.160 18.1 < 0.1 n.r. Kremsmünster 0.267 10.9 0.226 12.8 0.151 19.2 < 0.1 n.r. < 0.1 n.r. Piacenza 0.316 9.2 0.221 13.1 0.147 19.7 < 0.1 n.r. < 0.1 n.r. Porto1 0.125 23.2 0.187 15.5 0.124 23.4 < 0.1 n.r. < 0.1 n.r. Sevilla 0.148 19.6 0.221 13.1 0.147 19.7 < 0.1 n.r. < 0.1 n.r. Thiva
0.212
13.7 0.196
14.8 0.130
22.3 < 0.1
n.r. < 0.1
n.r.
EXP 11120A use on potato (see DAR Table B.8.260) PECgw (80%ile) parent M01 M02 M03 M05 Scenarios µg/L TER2 µg/L TER3 µg/L TER µg/L TER4 µg/L TER5
Châteaudun < 0.1 n.r. 1.223 >8177 < 0.1 n.r. < 0.1 n.r. < 0.1 n.r. Hamburg1 < 0.1 n.r. 2.003 >4993 < 0.1 n.r. < 0.1 n.r. 0.170 >58824 Jokioinen1 < 0.1 n.r. 1.331 >7513 < 0.1 n.r. < 0.1 n.r. < 0.1 n.r. Kremsmünster < 0.1 n.r. 1.224 >8170 < 0.1 n.r. < 0.1 n.r. < 0.1 n.r. Okehampton1 < 0.1 n.r. 1.627 >6146 < 0.1 n.r. < 0.1 n.r. 0.113 >88496 Piacenza < 0.1 n.r. 1.526 >6553 < 0.1 n.r. < 0.1 n.r. 0.166 >60241 Porto1 < 0.1 n.r. 0.303 >33003 < 0.1 n.r. < 0.1 n.r. < 0.1 n.r. Sevilla < 0.1 n.r. < 0.1 n.r. < 0.1 n.r. < 0.1 n.r. < 0.1 n.r. Thiva
< 0.1
n.r. 0.559
>17889 < 0.1
n.r. < 0.1
n.r. < 0.1
n.r.
M10 M11 M12 M13 M14 µg/L TER4 µg/L TER4 µg/L TER4 µg/L TER4 µg/L TER Châteaudun < 0.1 n.r. < 0.1 n.r. < 0.1 n.r. < 0.1 n.r. < 0.1 n.r. Hamburg1 0.160 18.1 0.151 19.2 0.101 28.7 < 0.1 n.r. < 0.1 n.r. Jokioinen1 0.131 22.1 0.249 11.6 0.166 17.5 0.117 24.7 < 0.1 n.r. Kremsmünster < 0.1 n.r. < 0.1 n.r. < 0.1 n.r. < 0.1 n.r. < 0.1 n.r. Okehampton1` < 0.1 n.r. 0.104 27.9 < 0.1 n.r. < 0.1 n.r. < 0.1 n.r. Piacenza < 0.1 n.r. < 0.1 n.r. < 0.1 n.r. < 0.1 n.r. < 0.1 n.r. Porto1 < 0.1 n.r. < 0.1 n.r. < 0.1 n.r. < 0.1 n.r. < 0.1 n.r. Sevilla < 0.1 n.r. < 0.1 n.r. < 0.1 n.r. < 0.1 n.r. < 0.1 n.r. Thiva
< 0.1
n.r. < 0.1
n.r. < 0.1
n.r. < 0.1
n.r. < 0.1
n.r.
n.r. not relevant; bold / grey highlight = scenarios TER<Annex VI threshold 1 acidic soil modelling 2 based on parent N. pelliculosa 72h EbC50 = 29 µg/L 3 based on M01 N. pelliculosa 72h EbC50 = >10000 µg/L 4 based on parent N. pelliculosa 72h EbC50 (x 0.1) = 2.9 µg/L 5 based on M05 N. pelliculosa 72h EbC50 = >10000 µg/L
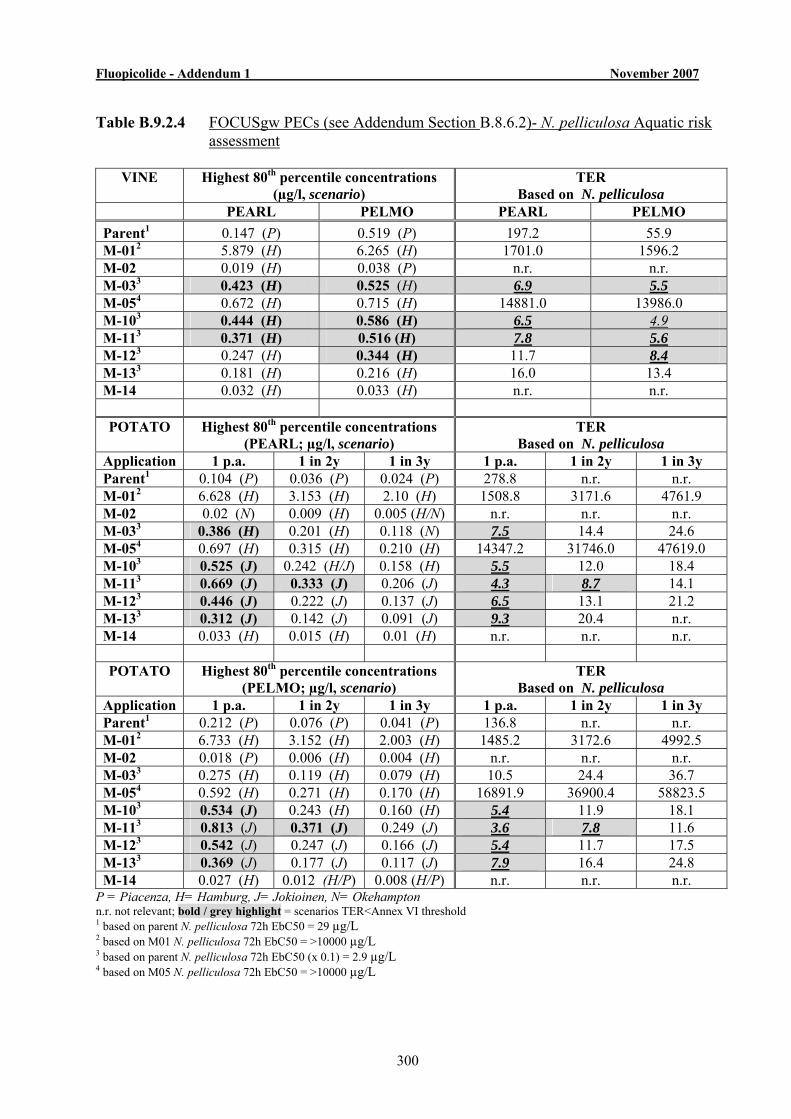
Fluopicolide - Addendum 1 November 2007
300
Table B.9.2.4 FOCUSgw PECs (see Addendum Section B.8.6.2)- N. pelliculosa Aquatic risk
assessment
VINE Highest 80th percentile concentrations (µg/l, scenario)
TER Based on N. pelliculosa
PEARL PELMO PEARL PELMO Parent1 0.147 (P) 0.519 (P) 197.2 55.9 M-012 5.879 (H) 6.265 (H) 1701.0 1596.2 M-02 0.019 (H) 0.038 (P) n.r. n.r. M-033 0.423 (H) 0.525 (H) 6.9 5.5 M-054 0.672 (H) 0.715 (H) 14881.0 13986.0 M-103 0.444 (H) 0.586 (H) 6.5 4.9 M-113 0.371 (H) 0.516 (H) 7.8 5.6 M-123 0.247 (H) 0.344 (H) 11.7 8.4 M-133 0.181 (H) 0.216 (H) 16.0 13.4 M-14 0.032 (H) 0.033 (H) n.r. n.r. POTATO Highest 80th percentile concentrations
(PEARL; µg/l, scenario) TER
Based on N. pelliculosa Application 1 p.a. 1 in 2y 1 in 3y 1 p.a. 1 in 2y 1 in 3y Parent1 0.104 (P) 0.036 (P) 0.024 (P) 278.8 n.r. n.r. M-012 6.628 (H) 3.153 (H) 2.10 (H) 1508.8 3171.6 4761.9 M-02 0.02 (N) 0.009 (H) 0.005 (H/N) n.r. n.r. n.r. M-033 0.386 (H) 0.201 (H) 0.118 (N) 7.5 14.4 24.6 M-054 0.697 (H) 0.315 (H) 0.210 (H) 14347.2 31746.0 47619.0 M-103 0.525 (J) 0.242 (H/J) 0.158 (H) 5.5 12.0 18.4 M-113 0.669 (J) 0.333 (J) 0.206 (J) 4.3 8.7 14.1 M-123 0.446 (J) 0.222 (J) 0.137 (J) 6.5 13.1 21.2 M-133 0.312 (J) 0.142 (J) 0.091 (J) 9.3 20.4 n.r. M-14 0.033 (H) 0.015 (H) 0.01 (H) n.r. n.r. n.r. POTATO Highest 80th percentile concentrations
(PELMO; µg/l, scenario) TER
Based on N. pelliculosa Application 1 p.a. 1 in 2y 1 in 3y 1 p.a. 1 in 2y 1 in 3y Parent1 0.212 (P) 0.076 (P) 0.041 (P) 136.8 n.r. n.r. M-012 6.733 (H) 3.152 (H) 2.003 (H) 1485.2 3172.6 4992.5 M-02 0.018 (P) 0.006 (H) 0.004 (H) n.r. n.r. n.r. M-033 0.275 (H) 0.119 (H) 0.079 (H) 10.5 24.4 36.7 M-054 0.592 (H) 0.271 (H) 0.170 (H) 16891.9 36900.4 58823.5 M-103 0.534 (J) 0.243 (H) 0.160 (H) 5.4 11.9 18.1 M-113 0.813 (J) 0.371 (J) 0.249 (J) 3.6 7.8 11.6 M-123 0.542 (J) 0.247 (J) 0.166 (J) 5.4 11.7 17.5 M-133 0.369 (J) 0.177 (J) 0.117 (J) 7.9 16.4 24.8 M-14 0.027 (H) 0.012 (H/P) 0.008 (H/P) n.r. n.r. n.r.
P = Piacenza, H= Hamburg, J= Jokioinen, N= Okehampton n.r. not relevant; bold / grey highlight = scenarios TER<Annex VI threshold 1 based on parent N. pelliculosa 72h EbC50 = 29 µg/L 2 based on M01 N. pelliculosa 72h EbC50 = >10000 µg/L 3 based on parent N. pelliculosa 72h EbC50 (x 0.1) = 2.9 µg/L 4 based on M05 N. pelliculosa 72h EbC50 = >10000 µg/L
Fluopicolide - Addendum 1 November 2007
301
From TERs (Table B.9.2.2) based on available parent and metabolite N. pelliculosa toxicological end points (see DAR Table B.9.2.75) and, in the absence of data, the parent N. pelliculosa endpoint with a 10x safety factor (SANCO 3268/2001 rev. 4), a low aquatic risk was indicated for parent and metabolites, M01, M02, M05, M13 and M014, detected in lysimeter leachate. However, metabolites, M10, M11 and M12, gave TERs < Annex VI threshold using the surrogate parent endpoint, requiring further consideration.
It is considered that M10, M11 and M12 are not structurally related to fluopicolide and
do not contain the biological toxophore (see pt. 5.12 below). They are derived from M02, and are structurally related to, M05 and for these metabolites N. pelliculosa is >100x less sensitive than fluopicolide, therefore the toxicity profile of M10, M11 and M12 will likely be closer to M02/M05 than parent and a risk assessment based these endpoints (with a 10x safety factor) would indicate low risk. Furthermore, theoretical FOCUS estimations predict lower GW contamination than that detected in lysimeter leachate by these metabolites in all scenarios (see below).
The GW risk assessment (Table B.9.2.3) was conducted using PECs derived from
FOCUS groundwater modelling (DAR Tables B.8.259 & B.8.260) following proposed respective uses of EXP11074B and EXP 11120A on vine and potato at the proposed EU GAPs. A further aquatic risk assessment was undertaken (Table B.9.2.4) using refined PECgws derived from further environmental modelling (see Addendum 1, Section B.8.6.2).
Following EXP11074B use on vine (Tables B.9.2.3-4), PECgws for M02 and M14
from all modelled scenarios were <0.1µg/L and hence were not considered further. For parent, metabolites, M01, M05, M12 (PEARL) and M13, in scenarios where the PECgw >0.1µg/L, all TERs were > Annex VI threshold indicating low risk to aquatic organisms. In two scenarios M10 was the only metabolite with TERs (9.5 & 9.2) < Annex VI threshold (10) and in one scenario (Hamburg) metabolites M03, M10, M11 and M12 (PELMO) had respective TERs (7.6, 6.7, 7.5 & 8.4) < Annex VI threshold.
Following EXP11120A use on potato (Table B.9.2.3), PECgws for parent
(fluopicolide), M02, M03 and M14 from all scenarios were <0.1µg/L and hence were not considered further. For metabolites, M01, M05, M10-M13, in scenarios where the PECgw >0.1µg/L, all TERs were > Annex VI threshold indicating low risk to aquatic organisms. However, further PECgw modelling refinement (Table B.9.2.4) gave TERs <10 for M03 (PEARL - Hamburg), M10, M11, M12 & M13 in PEARL and PELMO GW modelling in Hamburg and Jokioinen scenarios based on one treatment regime per annum. From biennial treatment only TERs for M11 (PEARL and PELMO - Jokioinen) were < Annex VI threshold and following triennial treatment no TERs were < Annex VI threshold.
However, it should be noted that the risk is assessed presuming aquatic organisms will
be exposed at the groundwater PECs, whereas it is reasonable to assume that at least a 10x dilution would likely occur (SANCO 3268/2001). For vine application a correction for 60% canopy interception would also have further reduced potential exposure (see DAR B.8.2.3.3). It should also be noted that M10 and M11 are chemically structurally related to M05 and M11 is purported to be an isomer of M12
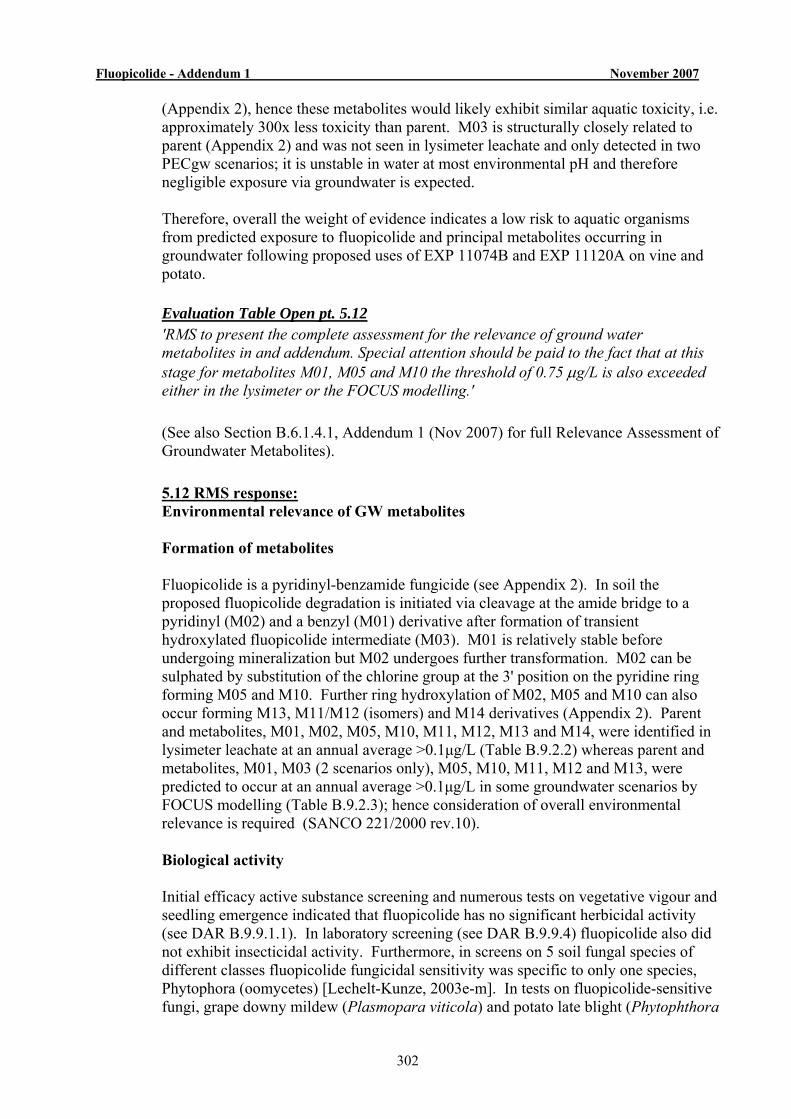
Fluopicolide - Addendum 1 November 2007
302
(Appendix 2), hence these metabolites would likely exhibit similar aquatic toxicity, i.e. approximately 300x less toxicity than parent. M03 is structurally closely related to parent (Appendix 2) and was not seen in lysimeter leachate and only detected in two PECgw scenarios; it is unstable in water at most environmental pH and therefore negligible exposure via groundwater is expected.
Therefore, overall the weight of evidence indicates a low risk to aquatic organisms
from predicted exposure to fluopicolide and principal metabolites occurring in groundwater following proposed uses of EXP 11074B and EXP 11120A on vine and potato.
Evaluation Table Open pt. 5.12
'RMS to present the complete assessment for the relevance of ground water metabolites in and addendum. Special attention should be paid to the fact that at this stage for metabolites M01, M05 and M10 the threshold of 0.75 μg/L is also exceeded either in the lysimeter or the FOCUS modelling.'
(See also Section B.6.1.4.1, Addendum 1 (Nov 2007) for full Relevance Assessment of
Groundwater Metabolites).
5.12 RMS response: Environmental relevance of GW metabolites Formation of metabolites Fluopicolide is a pyridinyl-benzamide fungicide (see Appendix 2). In soil the
proposed fluopicolide degradation is initiated via cleavage at the amide bridge to a pyridinyl (M02) and a benzyl (M01) derivative after formation of transient hydroxylated fluopicolide intermediate (M03). M01 is relatively stable before undergoing mineralization but M02 undergoes further transformation. M02 can be sulphated by substitution of the chlorine group at the 3' position on the pyridine ring forming M05 and M10. Further ring hydroxylation of M02, M05 and M10 can also occur forming M13, M11/M12 (isomers) and M14 derivatives (Appendix 2). Parent and metabolites, M01, M02, M05, M10, M11, M12, M13 and M14, were identified in lysimeter leachate at an annual average >0.1μg/L (Table B.9.2.2) whereas parent and metabolites, M01, M03 (2 scenarios only), M05, M10, M11, M12 and M13, were predicted to occur at an annual average >0.1μg/L in some groundwater scenarios by FOCUS modelling (Table B.9.2.3); hence consideration of overall environmental relevance is required (SANCO 221/2000 rev.10).
Biological activity Initial efficacy active substance screening and numerous tests on vegetative vigour and
seedling emergence indicated that fluopicolide has no significant herbicidal activity (see DAR B.9.9.1.1). In laboratory screening (see DAR B.9.9.4) fluopicolide also did not exhibit insecticidal activity. Furthermore, in screens on 5 soil fungal species of different classes fluopicolide fungicidal sensitivity was specific to only one species, Phytophora (oomycetes) [Lechelt-Kunze, 2003e-m]. In tests on fluopicolide-sensitive fungi, grape downy mildew (Plasmopara viticola) and potato late blight (Phytophthora
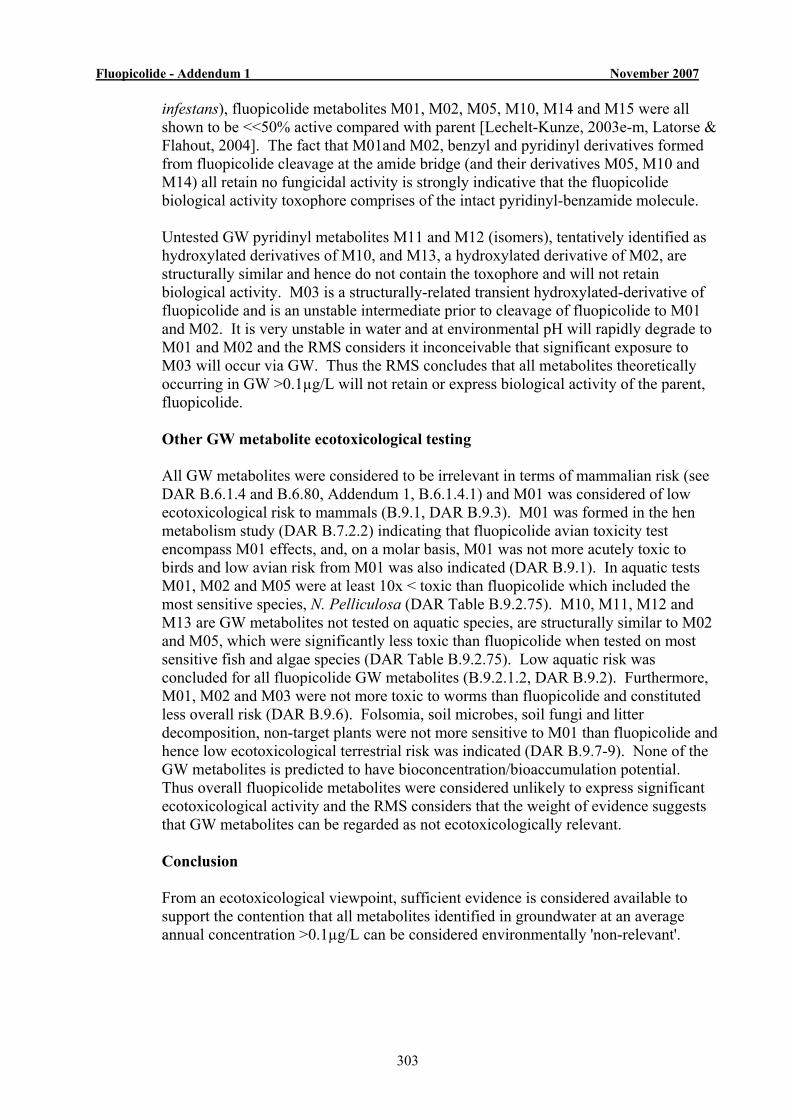
Fluopicolide - Addendum 1 November 2007
303
infestans), fluopicolide metabolites M01, M02, M05, M10, M14 and M15 were all shown to be <<50% active compared with parent [Lechelt-Kunze, 2003e-m, Latorse & Flahout, 2004]. The fact that M01and M02, benzyl and pyridinyl derivatives formed from fluopicolide cleavage at the amide bridge (and their derivatives M05, M10 and M14) all retain no fungicidal activity is strongly indicative that the fluopicolide biological activity toxophore comprises of the intact pyridinyl-benzamide molecule.
Untested GW pyridinyl metabolites M11 and M12 (isomers), tentatively identified as
hydroxylated derivatives of M10, and M13, a hydroxylated derivative of M02, are structurally similar and hence do not contain the toxophore and will not retain biological activity. M03 is a structurally-related transient hydroxylated-derivative of fluopicolide and is an unstable intermediate prior to cleavage of fluopicolide to M01 and M02. It is very unstable in water and at environmental pH will rapidly degrade to M01 and M02 and the RMS considers it inconceivable that significant exposure to M03 will occur via GW. Thus the RMS concludes that all metabolites theoretically occurring in GW >0.1µg/L will not retain or express biological activity of the parent, fluopicolide.
Other GW metabolite ecotoxicological testing
All GW metabolites were considered to be irrelevant in terms of mammalian risk (see
DAR B.6.1.4 and B.6.80, Addendum 1, B.6.1.4.1) and M01 was considered of low ecotoxicological risk to mammals (B.9.1, DAR B.9.3). M01 was formed in the hen metabolism study (DAR B.7.2.2) indicating that fluopicolide avian toxicity test encompass M01 effects, and, on a molar basis, M01 was not more acutely toxic to birds and low avian risk from M01 was also indicated (DAR B.9.1). In aquatic tests M01, M02 and M05 were at least 10x < toxic than fluopicolide which included the most sensitive species, N. Pelliculosa (DAR Table B.9.2.75). M10, M11, M12 and M13 are GW metabolites not tested on aquatic species, are structurally similar to M02 and M05, which were significantly less toxic than fluopicolide when tested on most sensitive fish and algae species (DAR Table B.9.2.75). Low aquatic risk was concluded for all fluopicolide GW metabolites (B.9.2.1.2, DAR B.9.2). Furthermore, M01, M02 and M03 were not more toxic to worms than fluopicolide and constituted less overall risk (DAR B.9.6). Folsomia, soil microbes, soil fungi and litter decomposition, non-target plants were not more sensitive to M01 than fluopicolide and hence low ecotoxicological terrestrial risk was indicated (DAR B.9.7-9). None of the GW metabolites is predicted to have bioconcentration/bioaccumulation potential. Thus overall fluopicolide metabolites were considered unlikely to express significant ecotoxicological activity and the RMS considers that the weight of evidence suggests that GW metabolites can be regarded as not ecotoxicologically relevant.
Conclusion From an ecotoxicological viewpoint, sufficient evidence is considered available to
support the contention that all metabolites identified in groundwater at an average annual concentration >0.1µg/L can be considered environmentally 'non-relevant'.
Fluopicolide - Addendum 1 November 2007
304
B.9.3 Non-target vertebrates - mammals (see B.9.1 above) B.9.4 Bees - no Open pts. to address. B.9.5 Non Target Arthropods One issue (Evaluation Table Open point 5.6) was raised pertinent to the risk to
NTAs from proposed uses of fluopicolide in potato and vine crops:
Evaluation table Open pt. 5.6 RMS to correct the list of endpoint with exact %-age effect on fecundity instead of
<50%. Note that highest conc. with effects <50% for A. rhopalosiphi was 2 L/ha.
5.6 RMS response For clarity the results from NTA fluopicolide data are re-presented in Table B.9.5.1
below.
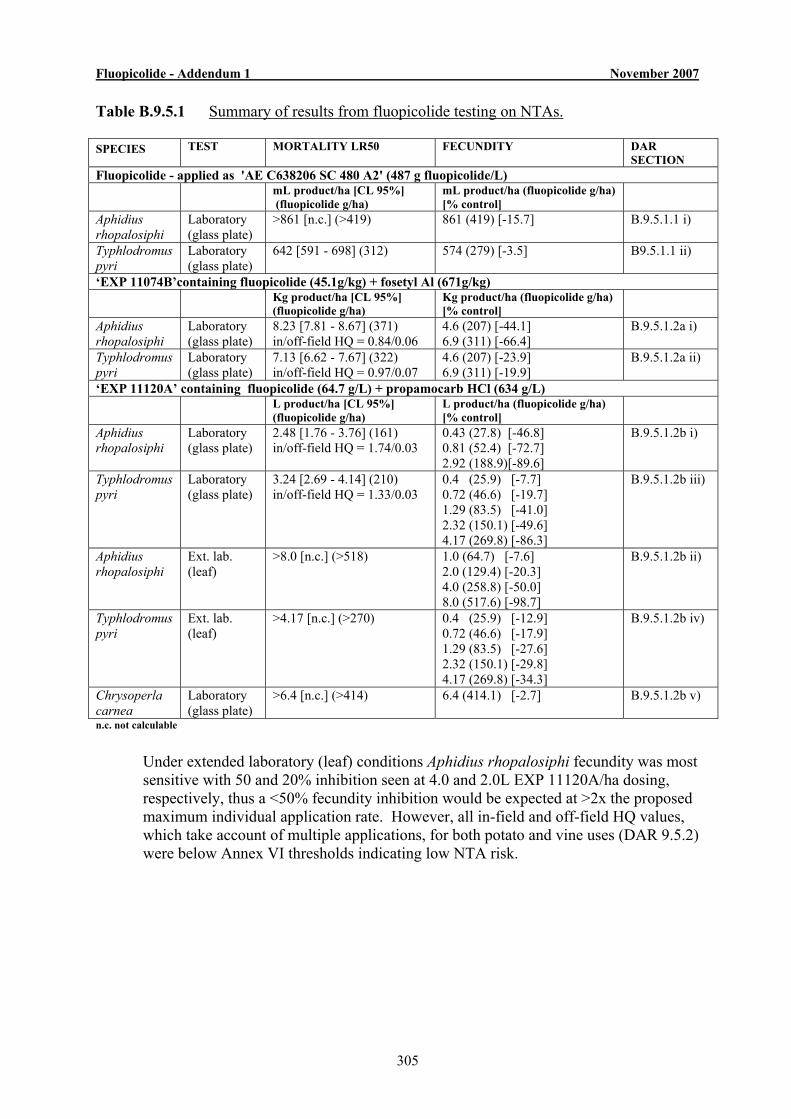
Fluopicolide - Addendum 1 November 2007
305
Table B.9.5.1 Summary of results from fluopicolide testing on NTAs. SPECIES TEST MORTALITY LR50 FECUNDITY DAR
SECTION Fluopicolide - applied as 'AE C638206 SC 480 A2' (487 g fluopicolide/L) mL product/ha [CL 95%]
(fluopicolide g/ha) mL product/ha (fluopicolide g/ha) [% control]
Aphidius rhopalosiphi
Laboratory (glass plate)
>861 [n.c.] (>419)
861 (419) [-15.7] B.9.5.1.1 i)
Typhlodromus pyri
Laboratory (glass plate)
642 [591 - 698] (312)
574 (279) [-3.5] B9.5.1.1 ii)
‘EXP 11074B’containing fluopicolide (45.1g/kg) + fosetyl Al (671g/kg) Kg product/ha [CL 95%]
(fluopicolide g/ha) Kg product/ha (fluopicolide g/ha) [% control]
Aphidius rhopalosiphi
Laboratory (glass plate)
8.23 [7.81 - 8.67] (371) in/off-field HQ = 0.84/0.06
4.6 (207) [-44.1] 6.9 (311) [-66.4]
B.9.5.1.2a i)
Typhlodromus pyri
Laboratory (glass plate)
7.13 [6.62 - 7.67] (322) in/off-field HQ = 0.97/0.07
4.6 (207) [-23.9] 6.9 (311) [-19.9]
B.9.5.1.2a ii)
‘EXP 11120A’ containing fluopicolide (64.7 g/L) + propamocarb HCl (634 g/L) L product/ha [CL 95%]
(fluopicolide g/ha) L product/ha (fluopicolide g/ha) [% control]
Aphidius rhopalosiphi
Laboratory (glass plate)
2.48 [1.76 - 3.76] (161) in/off-field HQ = 1.74/0.03
0.43 (27.8) [-46.8] 0.81 (52.4) [-72.7] 2.92 (188.9)[-89.6]
B.9.5.1.2b i)
Typhlodromus pyri
Laboratory (glass plate)
3.24 [2.69 - 4.14] (210) in/off-field HQ = 1.33/0.03
0.4 (25.9) [-7.7] 0.72 (46.6) [-19.7] 1.29 (83.5) [-41.0] 2.32 (150.1) [-49.6] 4.17 (269.8) [-86.3]
B.9.5.1.2b iii)
Aphidius rhopalosiphi
Ext. lab. (leaf)
>8.0 [n.c.] (>518) 1.0 (64.7) [-7.6] 2.0 (129.4) [-20.3] 4.0 (258.8) [-50.0] 8.0 (517.6) [-98.7]
B.9.5.1.2b ii)
Typhlodromus pyri
Ext. lab. (leaf)
>4.17 [n.c.] (>270)
0.4 (25.9) [-12.9] 0.72 (46.6) [-17.9] 1.29 (83.5) [-27.6] 2.32 (150.1) [-29.8] 4.17 (269.8) [-34.3]
B.9.5.1.2b iv)
Chrysoperla carnea
Laboratory (glass plate)
>6.4 [n.c.] (>414) 6.4 (414.1) [-2.7]
B.9.5.1.2b v)
n.c. not calculable
Under extended laboratory (leaf) conditions Aphidius rhopalosiphi fecundity was most
sensitive with 50 and 20% inhibition seen at 4.0 and 2.0L EXP 11120A/ha dosing, respectively, thus a <50% fecundity inhibition would be expected at >2x the proposed maximum individual application rate. However, all in-field and off-field HQ values, which take account of multiple applications, for both potato and vine uses (DAR 9.5.2) were below Annex VI thresholds indicating low NTA risk.
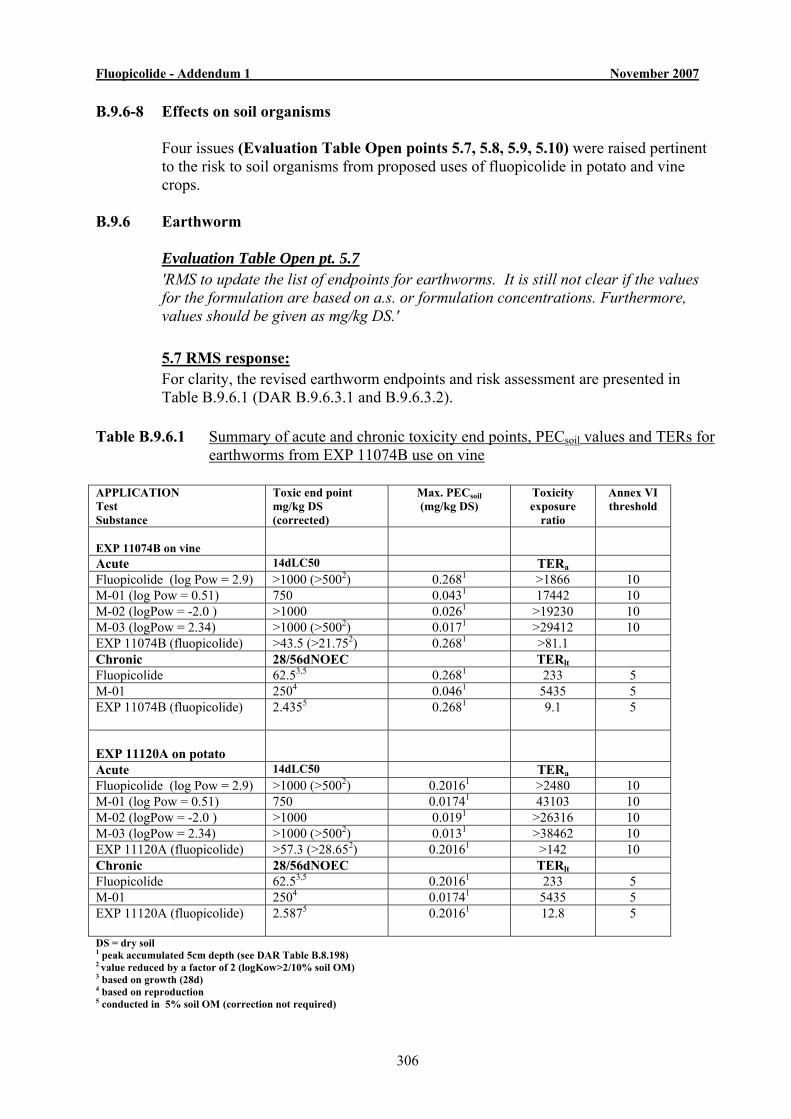
Fluopicolide - Addendum 1 November 2007
306
B.9.6-8 Effects on soil organisms Four issues (Evaluation Table Open points 5.7, 5.8, 5.9, 5.10) were raised pertinent
to the risk to soil organisms from proposed uses of fluopicolide in potato and vine crops.
B.9.6 Earthworm
Evaluation Table Open pt. 5.7 'RMS to update the list of endpoints for earthworms. It is still not clear if the values for the formulation are based on a.s. or formulation concentrations. Furthermore, values should be given as mg/kg DS.'
5.7 RMS response:
For clarity, the revised earthworm endpoints and risk assessment are presented in Table B.9.6.1 (DAR B.9.6.3.1 and B.9.6.3.2).
Table B.9.6.1 Summary of acute and chronic toxicity end points, PECsoil values and TERs for
earthworms from EXP 11074B use on vine APPLICATION Test Substance
Toxic end point mg/kg DS (corrected)
Max. PECsoil (mg/kg DS)
Toxicity exposure
ratio
Annex VI threshold
EXP 11074B on vine
Acute 14dLC50 TERa Fluopicolide (log Pow = 2.9) >1000 (>5002) 0.2681 >1866 10 M-01 (log Pow = 0.51) 750 0.0431 17442 10 M-02 (logPow = -2.0 ) >1000 0.0261 >19230 10 M-03 (logPow = 2.34) >1000 (>5002) 0.0171 >29412 10 EXP 11074B (fluopicolide) >43.5 (>21.752) 0.2681 >81.1 Chronic 28/56dNOEC TERlt Fluopicolide 62.53,5 0.2681 233 5 M-01 2504 0.0461 5435 5 EXP 11074B (fluopicolide)
2.4355 0.2681 9.1 5
EXP 11120A on potato
Acute 14dLC50 TERa Fluopicolide (log Pow = 2.9) >1000 (>5002) 0.20161 >2480 10 M-01 (log Pow = 0.51) 750 0.01741 43103 10 M-02 (logPow = -2.0 ) >1000 0.0191 >26316 10 M-03 (logPow = 2.34) >1000 (>5002) 0.0131 >38462 10 EXP 11120A (fluopicolide) >57.3 (>28.652) 0.20161 >142 10 Chronic 28/56dNOEC TERlt Fluopicolide 62.53,5 0.20161 233 5 M-01 2504 0.01741 5435 5 EXP 11120A (fluopicolide)
2.5875 0.20161 12.8 5
DS = dry soil 1 peak accumulated 5cm depth (see DAR Table B.8.198) 2 value reduced by a factor of 2 (logKow>2/10% soil OM) 3 based on growth (28d) 4 based on reproduction 5 conducted in 5% soil OM (correction not required)
Fluopicolide - Addendum 1 November 2007
307
For Table B.9.6.1 correction (x0.5) was required for fluopicolide, M03 and product acute endpoints as log Pow > 2 and 10% soil OM was used, in chronic studies 5% soil OM was used and no correction was required. Revised TERs indicate low acute and chronic risk to earthworms from fluopicolide and principal soil metabolites, M01, M02 and M03, following application of EXP 11074B and EXP 11120A to vine and potato.
B.9.7 Other soil non-target macro-organisms
Evaluation Table Open pts. 5.8 & 5.9 'Pending on the discussion on the PECsoil in the section on Fate and behaviour, a
revision of the risk assessment for soil organisms might be necessary.' (Reporting Table comment at 5(45) and 5(47)
5.8 & 5.9 RMS response: RMS will address, as appropriate, if evaluation/discussion of Applicant's response by
Environmental Fate results in PECsoil amendment. B.9.8 Non-target soil microorganisms
Evaluation Table Open pt. 5.10 'RMS to include the argumentation for why no studies with soil micro-organisms are
required with M 03 in an addendum for the sake of completeness. No discussion in an expert meeting is required.'
5.10 RMS response:
OECD 216/217 guidance for soil microbial activity recommends tests to be undertaken at soil pH 5.5 - 7.5. At these pHs M03 has a DT50 <1.0d and in acidic soils pH5.0 - 5.5 M03 has a DT50 of <5d (DAR B.8.1.8). Therefore rapid decay would be expected in these soils and any resulting toxicity mostly expressed via M01 and M02 derivatives of M03. Furthermore, it is likely that soil microorganisms could be exposed transiently to M03 in fluopicolide and product soil microorganism studies which were all conducted at soil pH5.4 - 5.9 over 28d where no effects were reported at up to 10x proposed application rate (DAR B.9.8.1). M03 has a very similar chemical structure to fluopicolide (Appendix 2) and significantly increased toxicity would not be anticipated. Moreover, no effects of M03 on earthworm at 1000 mg/kg DS (pH 5.7-6.0) over 14d were reported and TERs for acute (14d) and long term fluopicolide effects > Annex VI (soil pH 6 -7) over 56d, where some transient M03 formation may be expected. Fluopicolide also did not affect straw litter bag decomposition in soil (pH 6.72) over 184d again where some transient exposure to M03 might be assumed. Where tested M01 and M02, both M03 soil degradation products, also had no significant impact on soil organisms and processes. Therefore overall the RMS considered that there was sufficient weight of evidence to suggest that M03 would not have a significant effect on soil organisms and processes in the absence of a specific soil microbial M03 study.
Fluopicolide - Addendum 1 November 2007
308
B.9.9 Non-target flora One issue (Evaluation Table Open point 5.11) was raised pertinent to the risk to off-
field non-target plants from proposed uses of fluopicolide in potato and vine crops:
Evaluation Table Open pt. 5.11 'RMS to include the argumentation regarding risk to non-target plants from exposure
to M 01 in an addendum for the sake of completeness. No discussion in an expert meeting is required.'
5.11 RMS response:
For non-target plants off-field risk is only considered and contamination will result primarily from spray drift. M01 is a soil metabolite and not present in spray applications. Hence, pre-emergent effects on non-target plants following M01 formation in off-field soil contaminated with fluopicolide by spray drift are most relevant.
The pre-emergent M01 non-target plant study revealed no effects >50% on seedling germination and growth at rates ≤ 0.0121 mg/kg soil and an ER50 of >0.0121 mg M01/kg DS (5 cm) was established. From theoretical in-field PECsoils (Table B.8.198) for fluopicolide and M01 and spray drift values (6.9% for vine; 1.9% for potato), max. M01 off-field PECsoils of 0.00196 and 0.00039 mg/kg (5cm) can be derived for vine and potato use, respectively. Thus TERs of >6 and >31 can be established for M01 off-field pre-emergent effects on non-target plants indicating low risk. This is considered to be a worse case scenario as the ER50 is > highest dose tested and no off-field interception of spray drift deposition is assumed.
Fluopicolide - Addendum 1 November 2007
309
B.9 ECOTOXICOLOGY - CORRIGENDUM Please note the following correction to the original DAR:
i) Tables B.9.2.60 and B.9.2.63 need amendment (2nd a.s. is propamocarbHCl not fosetyl-Al as reported)
ii) Tables B.9.5.1-4; B.9.9.3-4. 'SC 40' should be 'SC480' iii) B.9.2.2.1 S phrases (and Vol 1) should be amended to 'S60 This material and its
container must be disposed of as hazardous waste' and 'S61 Avoid release to the environment. Refer to special instructions/safety data sheets'
Justification 'Recommended for substances that may cause effects in the environment'.
iv) Tables B.9.5.10, 9.5.12 'kg/ha' should be 'L/ha' v) B.9.5.1.2b iii) 2nd para '2.04-10.35 kg/ha' should be '0.4-4.7 L/ha) vi) B.9.7.3.2/9.8.3.2 '10cm' should be '5 and 10cm' vii) B.9.7.3.1/9.8.3.1 '10cm' should be '5cm' viii) Table B.9.9.15 M01 '0.046' should be '0.043'. ix) Table B.9.2.77 Heading 'AE F05361606 WG71 A1' should be 'EXP 11074B'

Fluopicolide - Addendum 1 November 2007
310
APPENDIX 1
Summary of the significant metabolites of fluopicolide identified in studies in animals, plants and the environment
M-Code number
(Company code
number)
Other identifiers
Structure Formula Presence in metabolism
studies
AE C638206 Fluopicolide (parent)
N
F3C Cl
NH
O
Cl
Cl
2,6-dichloro-N-{[3-chloro-5-(trifluoromethyl)-2-
pyridinyl]methyl}benzamide
C14H8Cl3F3N2O MW = 383.59
M-01 (AEC653711)
BAM
Cl
Cl
H2N
O
2,6-dichlorobenzamide C7H5Cl2NO MW = 190.0
rat liver, laying hen,
crop, soil,
lysimeter leachate, rotational
crop M-02
(AEC657188) PCA
UMET/2 N
F3C Cl
OH
O
3-chloro-5-trifluoromethyl-pyridine-2-carboxylic acid
C7H3ClF3NO2 MW = 225.6
rat, crop,
rotational crop, soil,
water M-05
(AE 1344122) P1x
RPA433497 N
F3C SOCH3
COOH
3-methylsulfinyl-5-trifluoro-methylpyridine-2-
carboxylic acid C8H6F3NO3S MW = 253
rotational crop,
lysimeter leachate,
M-04 (AEC657378)
3-hydroxy BAM
Cl
Cl
H2N
OOH
2,6-dichloro-3-hydroxy-benzamide
C7H5Cl2NO2 MW = 206
rotational crop
rat (BAM ADME study)
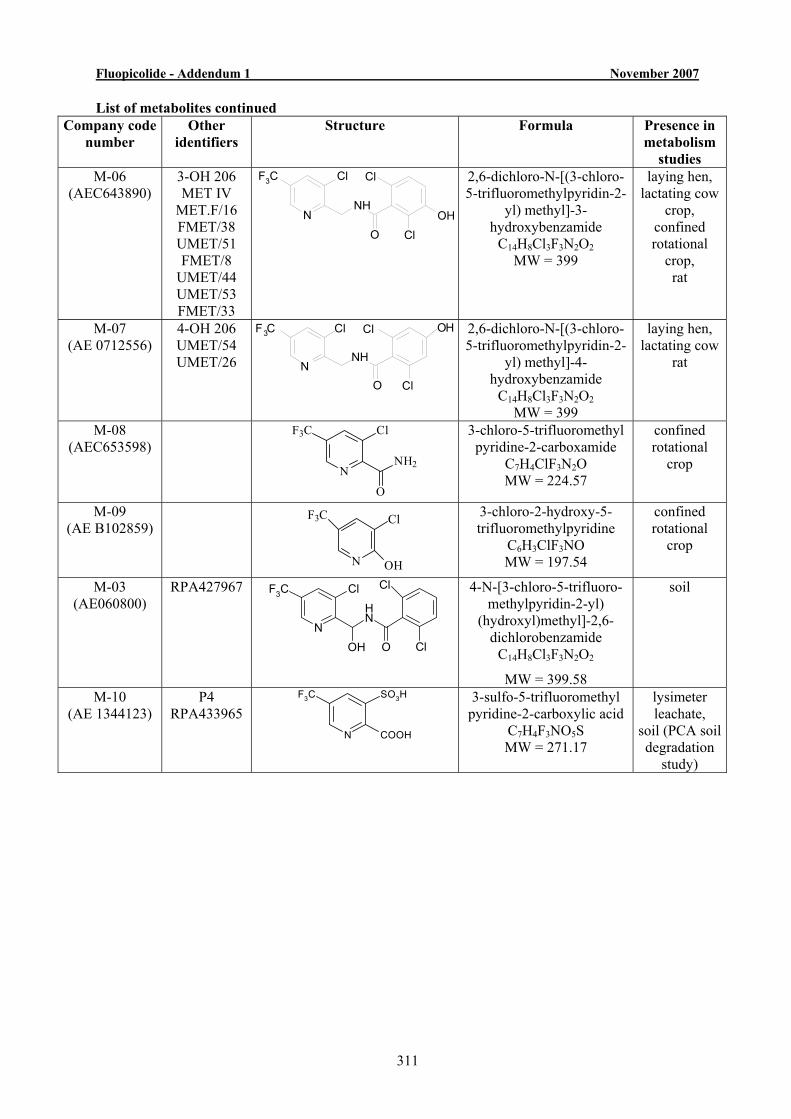
Fluopicolide - Addendum 1 November 2007
311
List of metabolites continued Company code
number Other
identifiers Structure Formula Presence in
metabolism studies
M-06 (AEC643890)
3-OH 206 MET IV
MET.F/16 FMET/38 UMET/51 FMET/8
UMET/44 UMET/53 FMET/33
N
F3C Cl
NH
O Cl
Cl
OH
2,6-dichloro-N-[(3-chloro-5-trifluoromethylpyridin-2-
yl) methyl]-3-hydroxybenzamide
C14H8Cl3F3N2O2 MW = 399
laying hen, lactating cow
crop, confined rotational
crop, rat
M-07 (AE 0712556)
4-OH 206 UMET/54 UMET/26 N
F3C Cl
NH
O Cl
Cl OH
2,6-dichloro-N-[(3-chloro-5-trifluoromethylpyridin-2-
yl) methyl]-4-hydroxybenzamide
C14H8Cl3F3N2O2 MW = 399
laying hen, lactating cow
rat
M-08 (AEC653598)
N
F3C Cl
NH2
O
3-chloro-5-trifluoromethyl pyridine-2-carboxamide
C7H4ClF3N2O MW = 224.57
confined rotational
crop
M-09 (AE B102859)
N OH
ClF3C
3-chloro-2-hydroxy-5-trifluoromethylpyridine
C6H3ClF3NO MW = 197.54
confined rotational
crop
M-03 (AE060800)
RPA427967
N
F3C Cl
OH
NH
O
Cl
Cl
4-N-[3-chloro-5-trifluoro-methylpyridin-2-yl)
(hydroxyl)methyl]-2,6-dichlorobenzamide
C14H8Cl3F3N2O2
MW = 399.58
soil
M-10 (AE 1344123)
P4 RPA433965
N
F3C SO3H
COOH
3-sulfo-5-trifluoromethyl pyridine-2-carboxylic acid
C7H4F3NO5S MW = 271.17
lysimeter leachate,
soil (PCA soil degradation
study)
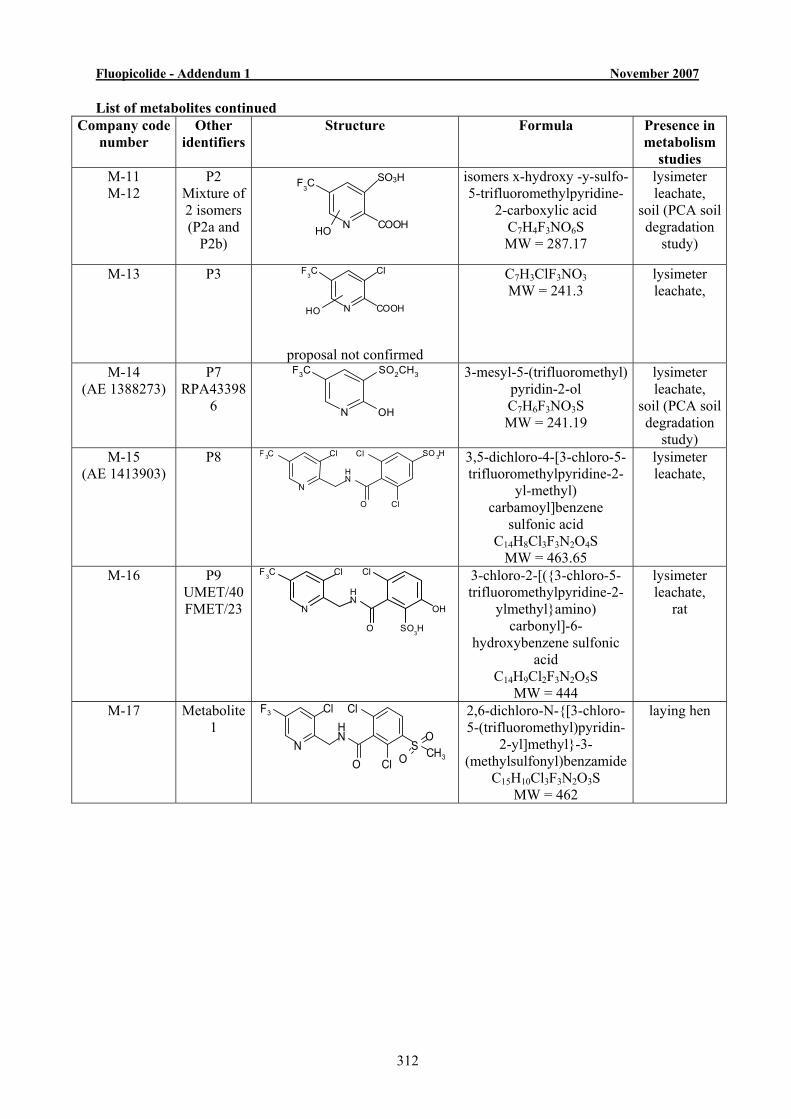
Fluopicolide - Addendum 1 November 2007
312
List of metabolites continued Company code
number Other
identifiers Structure Formula Presence in
metabolism studies
M-11 M-12
P2 Mixture of 2 isomers (P2a and
P2b)
N
F 3 C
COOHOH
SO3H
isomers x-hydroxy -y-sulfo-5-trifluoromethylpyridine-
2-carboxylic acid C7H4F3NO6S MW = 287.17
lysimeter leachate,
soil (PCA soil degradation
study)
M-13 P3
N
F3C Cl
COOHOH
proposal not confirmed
C7H3ClF3NO3 MW = 241.3
lysimeter leachate,
M-14 (AE 1388273)
P7 RPA43398
6
F3C SO2CH3
N OH
3-mesyl-5-(trifluoromethyl) pyridin-2-ol C7H6F3NO3S MW = 241.19
lysimeter leachate,
soil (PCA soil degradation
study) M-15
(AE 1413903) P8
N
Cl
NH
O
Cl
Cl
F 3C SO 3H
3,5-dichloro-4-[3-chloro-5-trifluoromethylpyridine-2-
yl-methyl) carbamoyl]benzene
sulfonic acid C14H8Cl3F3N2O4S
MW = 463.65
lysimeter leachate,
M-16 P9 UMET/40 FMET/23 N
Cl
NH
O
ClF3C
SO3H
OH
3-chloro-2-[({3-chloro-5-trifluoromethylpyridine-2-
ylmethyl}amino) carbonyl]-6-
hydroxybenzene sulfonic acid
C14H9Cl2F3N2O5S MW = 444
lysimeter leachate,
rat
M-17 Metabolite 1
N
F3 Cl
NH
Cl
Cl
O
O
OS CH3
2,6-dichloro-N-{[3-chloro-5-(trifluoromethyl)pyridin-
2-yl]methyl}-3-(methylsulfonyl)benzamide
C15H10Cl3F3N2O3S MW = 462
laying hen
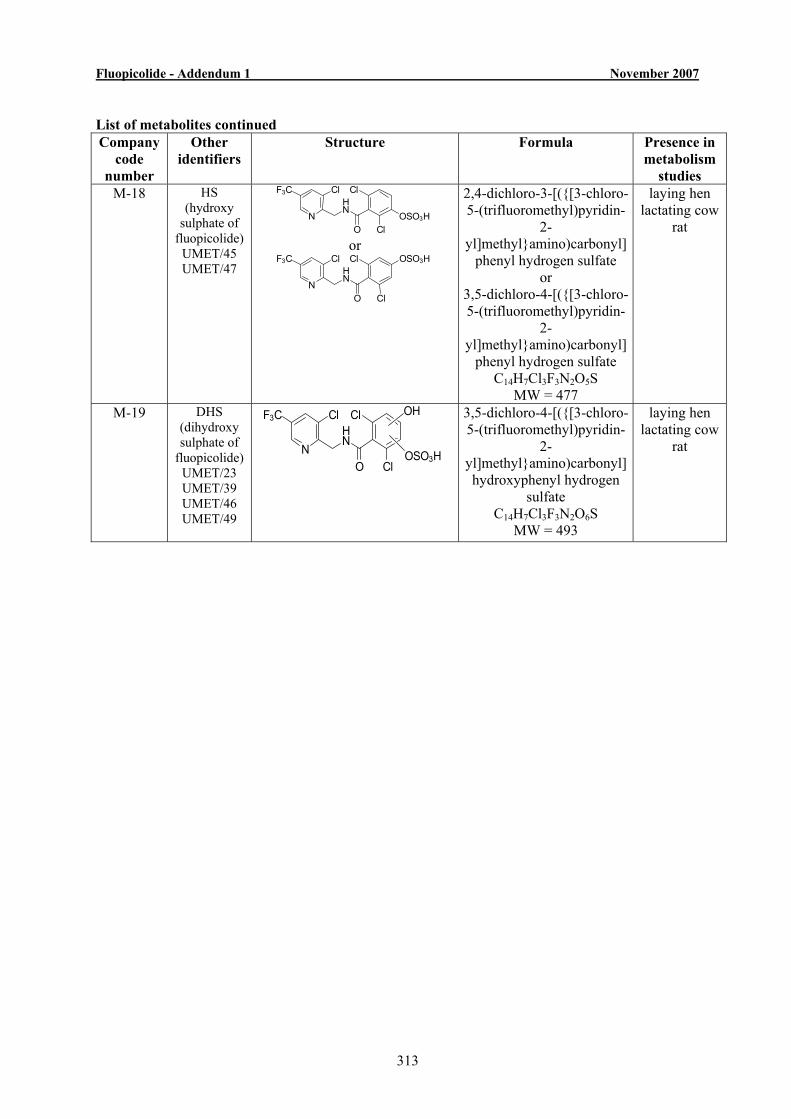
Fluopicolide - Addendum 1 November 2007
313
List of metabolites continued Company
code number
Other identifiers
Structure Formula Presence in metabolism
studies M-18 HS
(hydroxy sulphate of
fluopicolide) UMET/45 UMET/47
N
F3C Cl ClHN
O ClOSO3H
or
N
F3C Cl ClHN
O Cl
OSO3H
2,4-dichloro-3-[({[3-chloro-5-(trifluoromethyl)pyridin-
2-yl]methyl}amino)carbonyl]
phenyl hydrogen sulfate or
3,5-dichloro-4-[({[3-chloro-5-(trifluoromethyl)pyridin-
2-yl]methyl}amino)carbonyl]
phenyl hydrogen sulfate C14H7Cl3F3N2O5S
MW = 477
laying hen lactating cow
rat
M-19 DHS (dihydroxy sulphate of
fluopicolide) UMET/23 UMET/39 UMET/46 UMET/49
N
F3C Cl ClHN
O Cl
OH
OSO3H
3,5-dichloro-4-[({[3-chloro-5-(trifluoromethyl)pyridin-
2-yl]methyl}amino)carbonyl] hydroxyphenyl hydrogen
sulfate C14H7Cl3F3N2O6S
MW = 493
laying hen lactating cow
rat
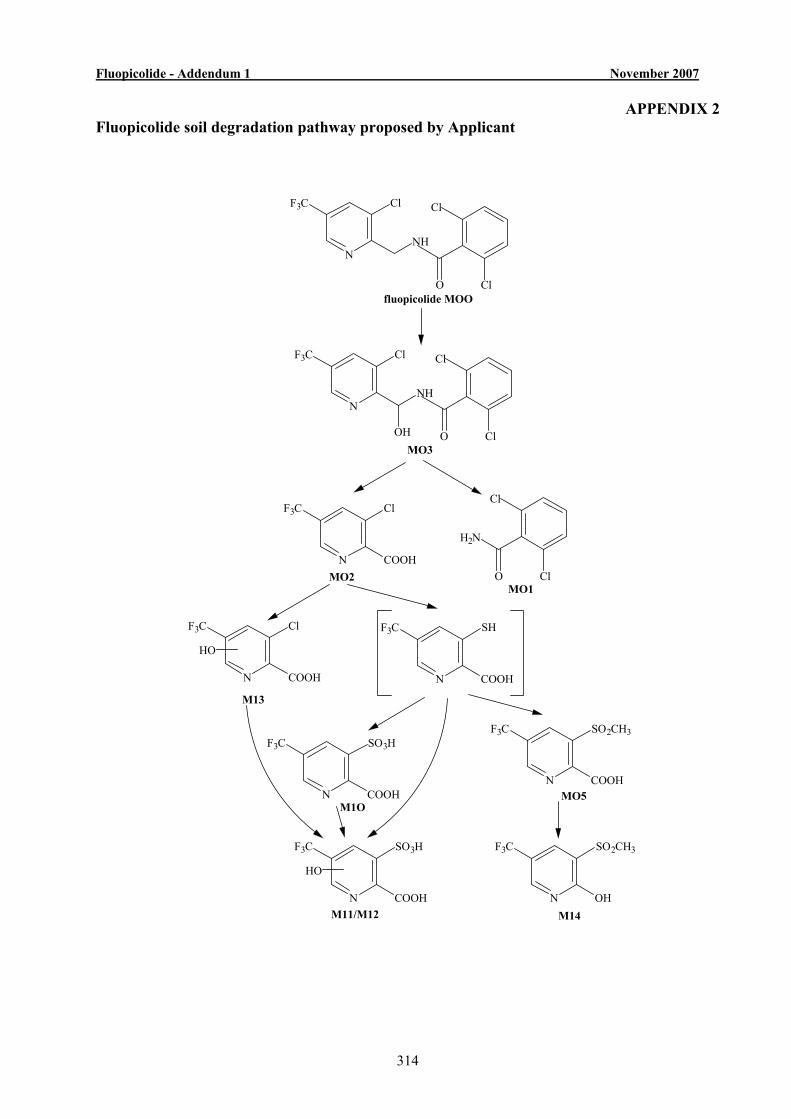
Fluopicolide - Addendum 1 November 2007
314
APPENDIX 2 Fluopicolide soil degradation pathway proposed by Applicant
fluopicolide MOO
MO3
MO2
M13
MO5M1O
M11/M12 M14
MO1
N
F3C Cl
NH
O Cl
Cl
N
F3C Cl
NH
OH O Cl
Cl
H2N
O Cl
Cl
N
F3C Cl
COOH
N
F3C Cl
COOH
HO
N
F3C
COOH
SO3H
HO
N
F3C
COOH
SO3H
N
F3C
COOH
SO2CH3
N
F3C
COOH
SH
N
F3C SO2CH3
OH
Fluopicolide - Addendum 1 November 2007
315
APPENDIX 3 [NB. Section B.10 is the UK Efficacy assessment which is not included in the EU DAR. The following section relates to the biologically activity assessment and is presented for completeness in response to the Reporting Table point 2(25). It has not been updated, therefore for a full assessment of the relevance of groundwater metabolites - please see Section B.6.1.4.1, Addendum 1 (November 2007)]. B.10.7.5 Effects of Metabolites in Ground Water The applicant identified the potential metabolites in groundwater as M-01, M-02, M05,
M10, M14 and M-15. Evidence had been provided from the initial screening data to indicate that fluopicolide has no significant insecticidal or herbicidal activity (B10.7.1). The applicant therefore tested these metabolites for fungicidal activity only. Reference was made to fate and behaviour metabolite studies submitted under Annex II.
(Latorse & Flahaut 2004)
In vitro tests for powdery mildew and late blight showed no activity for any of these metabolites tested at 100 mg/l (equivalent to 100 g/ha). This included a range of doses for the major metabolite, AE C653711. These results were summarised further in a position paper on the non-relevance of metabolites found in lysimeter leachate and field leaching studies. The paper argued that the data from the biological screens indicated that both the pyridine and phenyl rings of the molecule are required for fungicidal activity. Any metabolites without both these rings would be predicted to have no fungicidal activity. It was also noted that functional groups, especially polar ones to the phenyl ring causes loss of fungicidal activity.
(Leake & Payraudeau 2004a) The position paper also summarised further studies with M-01 against five species of fungi. These showed M-01 gave no inhibition of growth at rates between 0.3 and 30 mg/kg dry soil.
(Lechelt –Kunze 2003k, 2003f, 2003m) Further supporting evidence of the lack of activity of AE C653711 was referenced from a Tier II seedling emergence and vigour study showing no effects on ten different non-target plants.
(Pallett & Gosch, 2004) Further evidence of lack of insecticidal activity was provided in the Ecotoxicology studies with no effect against Collembola.
(Klein & Luhrs 2003a)
Fluopicolide - Addendum 1 November 2007
316
Assessment Various biological screening data confirmed that neither fluopicolide nor its metabolites have herbicidal or insecticidal activity. Metabolites were therefore investigated for any fungicidal effects, and the studies indicate that none of those tested had any significant biological activity. The rapporteur differed in their assessment of which metabolites have the potential to occur in groundwater above the 0.1 µg/L level, specifying M-01, M-05 and M-10 to M-14 (see B8.6.2). Of these only M11 and M12 (mixture of 2 isomers) and M13 were not tested for fungicidal activity. These three are all single pyridine ring structures and are unlikely to have any significant fungicidal activity.

317
Council Directive 91/414/EEC
Fluopicolide (AE C638206)
Volume 4 ADDENDUM 1
Annex C to the Report and Proposed Decision of the United Kingdom
made to the European Commission under Article 8(1) of 91/414/EEC
Confidential Information
November 2007

Fluopicolide - Volume 4, Annex C: Confidential Information November 2005
318
CONFIDENTIAL BUSINESS INFORMATION:
available at RMS
Fluopicolide - DAR Addendum 2 November 2007 RMS:UK
319
Council Directive 91/414/EEC
Fluopicolide
ADDENDUM 2 TO THE DRAFT ASSESSMENT REPORT PREPARED BY THE
UNITED KINGDOM
Draft: November 2007
PESTICIDES SAFETY DIRECTORATEMallard House, Kings Pool, 3 Peasholme Green, York YO1 7PX, UK Website: www.pesticides.gov.uk
Fluopicolide - DAR Addendum 2 November 2007 RMS:UK
320
CONTENTS Page B.8 Environmental Fate and Behaviour 3 B.8.1. Route and rate of degradation in soil – (open point 4.8) 3
Fluopicolide - DAR Addendum 2 November 2007 RMS:UK
321
B.8 ENVIRONMENTAL FATE AND BEHAVIOUR B.8.1 Route and rate of degradation in soil
Open point 4.8 “MS experts to discuss in an experts meeting the kinetic evaluation of field dissipation studies. See reporting table 4(36).” Background This open point was the result of the following comment from EFSA in the Reporting Table in relation to the kinetics of the field dissipation studies, “for some of the sites “measured initial concentration” is relatively far of the “nominal application rate” and the “calibrated application rate”. Reasons for these differences are not clear. Also the selection of the fixed “initial concentration” may need to be examined case by case in order to confirm the reliability of the results obtained in this fitting exercise.” The RMS agreed that discussion of the kinetic approaches at an expert meting would be useful. Open point 4.1 “Half lives for metabolites derived in the studies where they are dosed as starting material are seen by the RMS as more reliable, specially with respect to M14 (see DAR p 661). Therefore, only these DT50 should be reported in the list of end points. RMS to amend the list of end points accordingly. MS experts to discuss if the half lives derived from the study dosed with M02 may however still be used for modelling. See reporting table 4(6)” Background This open point arose from discussion following the Applicants request to include degradation endpoints for metabolites which were derived from a study where M-02 had been the starting material, rather than simply metabolite endpoints where specific metabolites had been used as starting material. In response, the Applicant has submitted two position papers. The first is in relation to evaluation of the field dissipation studies to derive end points for comparison against regulatory ‘trigger’ values. The second is in relation to derivation of soil degradation parameters from field studies for use in modelling and relevance of the M-02 study for derivation of degradation endpoints for other metabolites.
Fluopicolide - DAR Addendum 2 November 2007 RMS:UK
322
i) Kley & Mackenzie 2007a, Evaluation of soil Degradation Parameters for Fluopicolide (AE C638206) for use as Trigger Values (Report No MEF-07/265) This position paper is an evaluation of field dissipation data originally presented in the DAR under Volume 3, Section B.8.1.5. It appears to build on arguments submitted by the Applicant which were presented by the RMS in the Summary and Assessment section (B.8.1.8) in relation initial concentration fixing issues. It has been noted that some, but not all DT50 and DT90 values presented in this position paper are the same as those in Table B.8.143a of the DAR for Hockey Stick kinetics. In summary, the Applicant has evaluated the field dissipation data using Hockey Stick (HS) kinetics and excluding the step of fixing the initial concentration to assess the impact on statistical fit. The step of fixing initial concentration was the subject of discussion between RMS and Applicant in the original evaluation, and subsequently attracted comments from EFSA and MSs. In addition to removal of the step whereby initial concentration was fixed, the principles of curve fitting evaluation (as recommended by the FOCUS Degradation Kinetics guidance document) have been applied, in the form of visual fit, plotting of residual fit and chi2 evaluation. The t-test has not been assessed, however, from the magnitude of fitted parameters presented, it is assumed by the RMS than these will be significantly different from 0. It should be noted that the FOCUS Degradation Kinetics guidance document states that the HS model is not recommend in the core set of models to be used for the evaluation of kinetic parameters for assessment against regulatory trigger values (see section 7.1, pages 108 – 112 of the FOCUS Kinetics guidance document). However, the document demonstrates what may be achieved without initial concentration fixing. Evaluation of the field dissipation data started with addition of residues (in mg/kg) at each individual sample time from all soil horizons where quantifiable residues were found. The summed residue was then converted to a g/ha basis assuming a soil bulk density of 1.5 g/cm3. The summed residues for each field site were then subjected to kinetic modelling with the HS model allowing free optimisation of initial concentration (C0). Following initial HS modelling, the statistical and graphical outputs were compared with those from a subsequent kinetic evaluation using SFO kinetics on the same dataset. As with the HS evaluation, free optimisation of C0 was allowed with SFO. As a follow-up step, SFO fitting was also attempted with C0 fixed to the optimised initial concentration from the HS modelling. It should be noted that the re-evaluation does not follow FOCUS Kinetics advice, which is to start with an initial assessment using both SFO and FOMC, and then to follow with DFOP if necessary. Summaries of the optimised parameters from HS with free-fitting (Table B.8.1), SFO with free optimisation (“free fitting”) (Table B.8.2) and SFO with C0 fixed (Table B.8.3) are presented below. Example graphical outputs associated the kinetic assessments from the Philippsburg site are also presented in Figures B.8.1 - 3. Graphical outputs for the other sites are presented in Appendix 1.
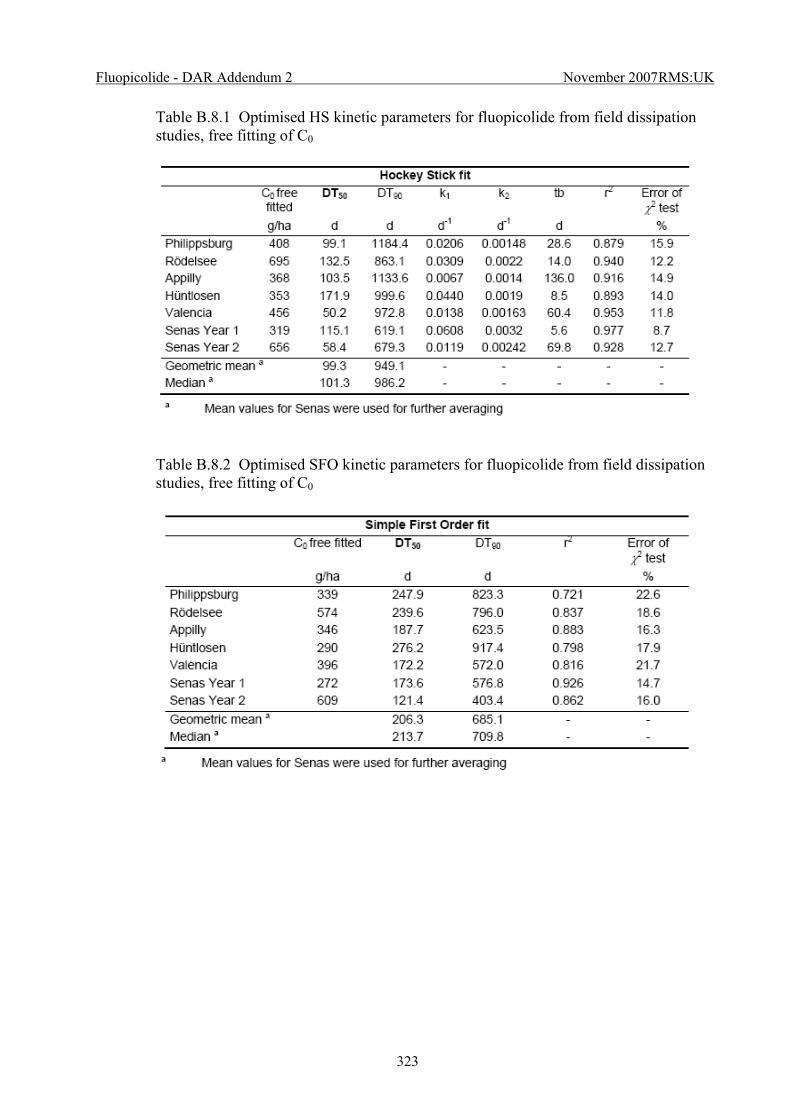
Fluopicolide - DAR Addendum 2 November 2007 RMS:UK
323
Table B.8.1 Optimised HS kinetic parameters for fluopicolide from field dissipation studies, free fitting of C0
Table B.8.2 Optimised SFO kinetic parameters for fluopicolide from field dissipation studies, free fitting of C0
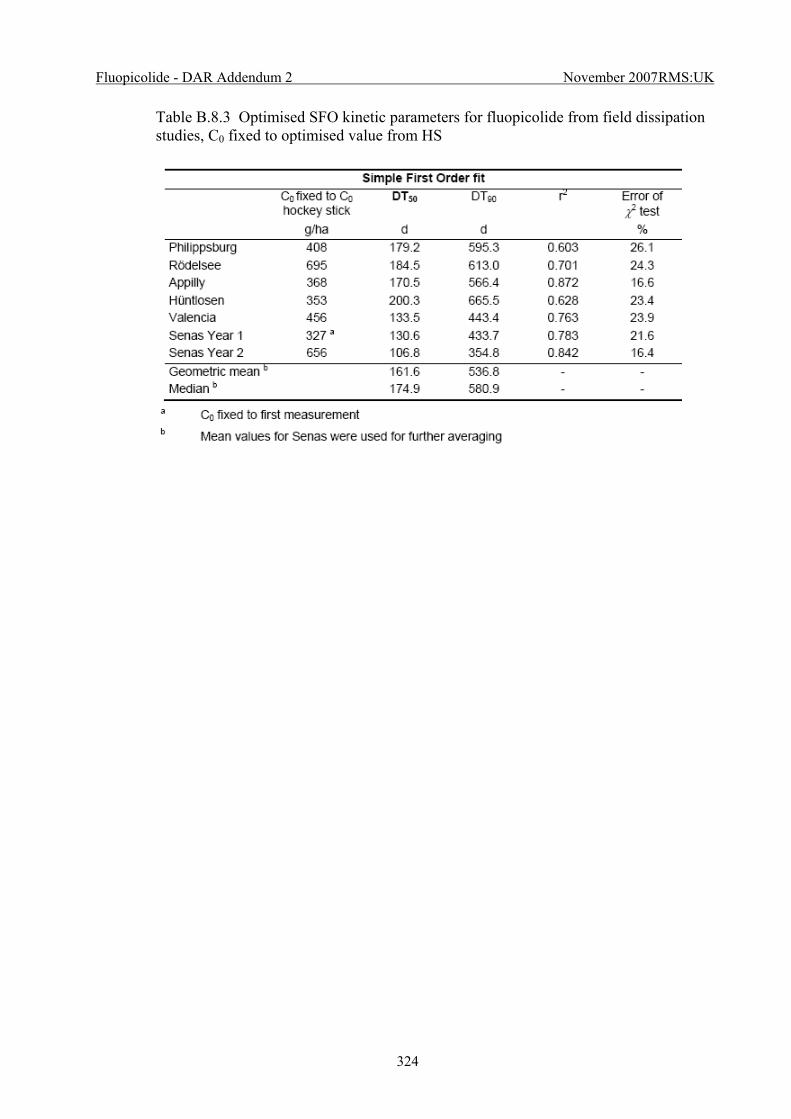
Fluopicolide - DAR Addendum 2 November 2007 RMS:UK
324
Table B.8.3 Optimised SFO kinetic parameters for fluopicolide from field dissipation studies, C0 fixed to optimised value from HS
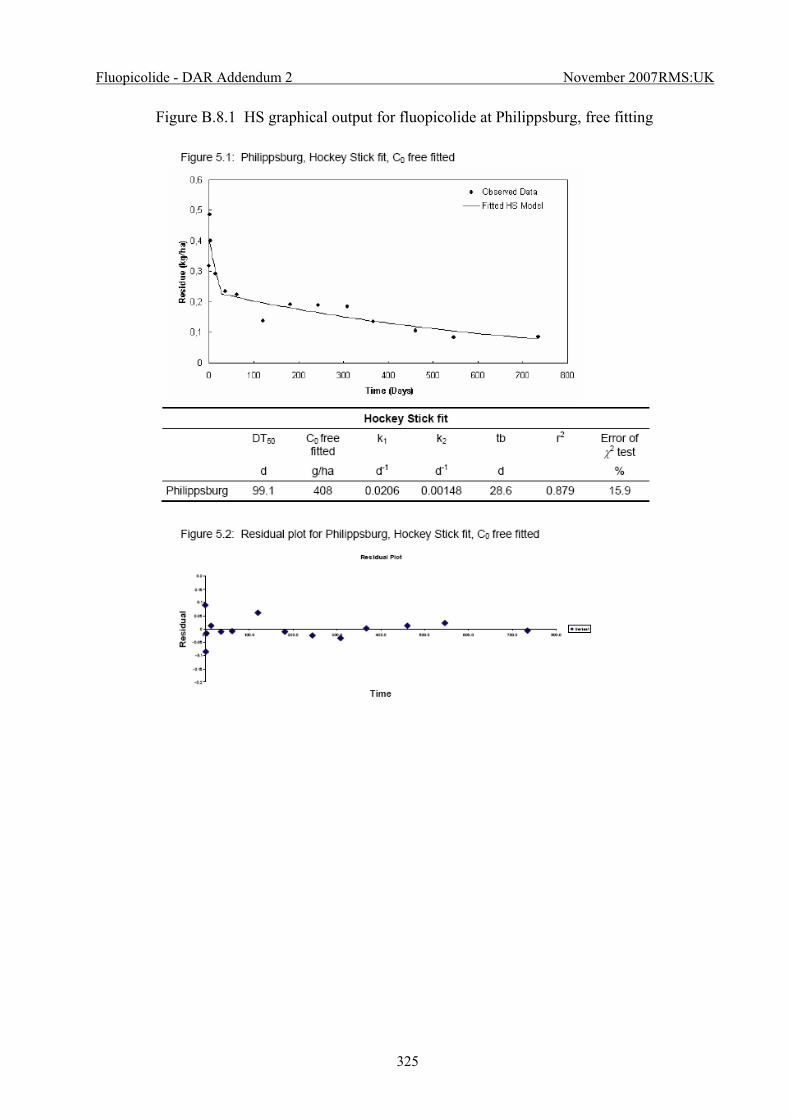
Fluopicolide - DAR Addendum 2 November 2007 RMS:UK
325
Figure B.8.1 HS graphical output for fluopicolide at Philippsburg, free fitting
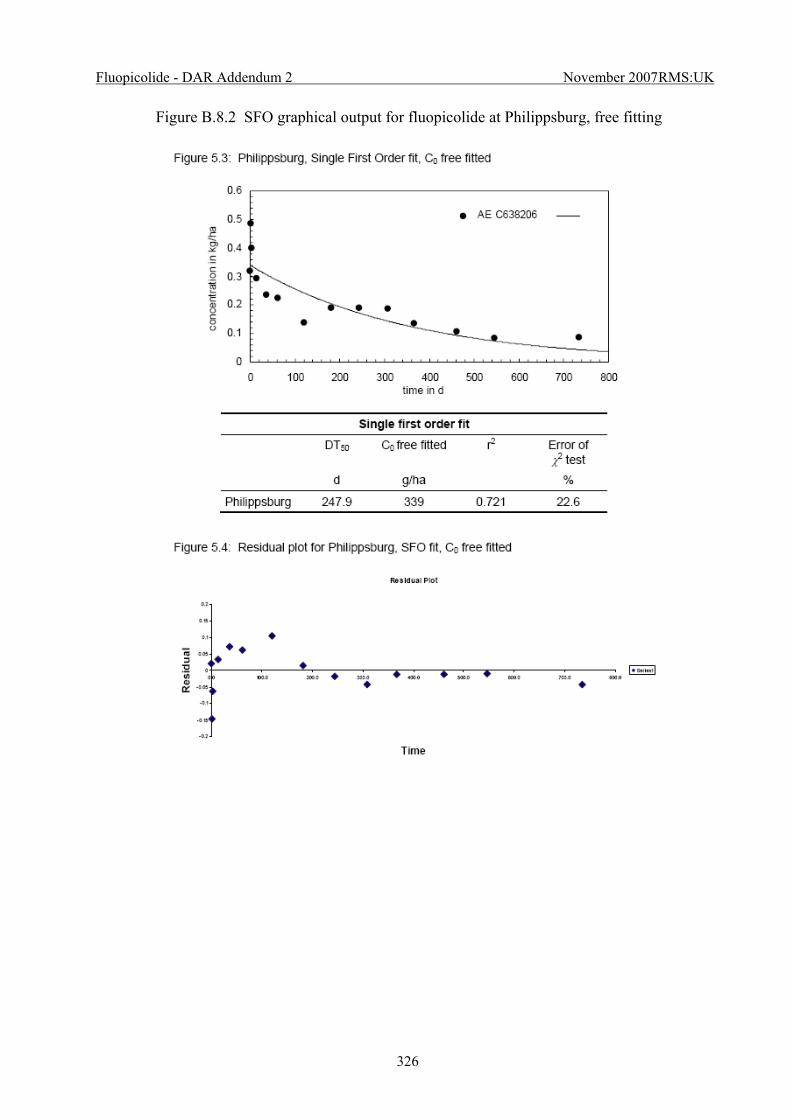
Fluopicolide - DAR Addendum 2 November 2007 RMS:UK
326
Figure B.8.2 SFO graphical output for fluopicolide at Philippsburg, free fitting
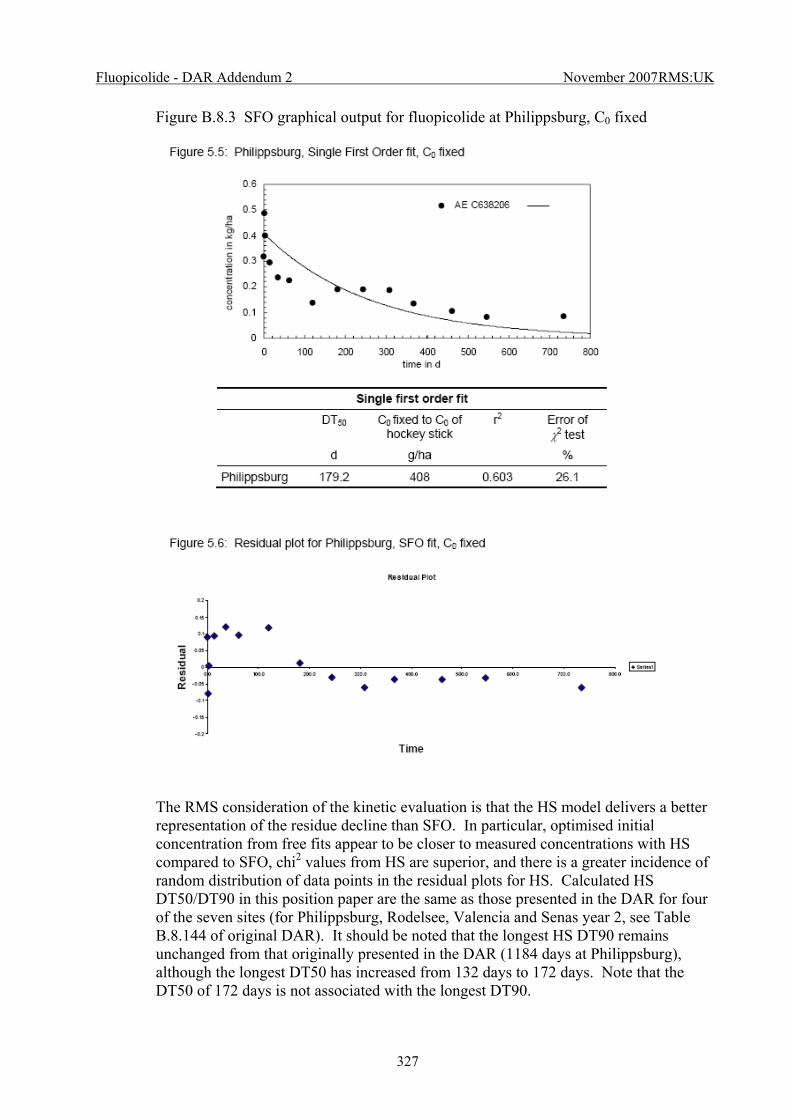
Fluopicolide - DAR Addendum 2 November 2007 RMS:UK
327
Figure B.8.3 SFO graphical output for fluopicolide at Philippsburg, C0 fixed
The RMS consideration of the kinetic evaluation is that the HS model delivers a better representation of the residue decline than SFO. In particular, optimised initial concentration from free fits appear to be closer to measured concentrations with HS compared to SFO, chi2 values from HS are superior, and there is a greater incidence of random distribution of data points in the residual plots for HS. Calculated HS DT50/DT90 in this position paper are the same as those presented in the DAR for four of the seven sites (for Philippsburg, Rodelsee, Valencia and Senas year 2, see Table B.8.144 of original DAR). It should be noted that the longest HS DT90 remains unchanged from that originally presented in the DAR (1184 days at Philippsburg), although the longest DT50 has increased from 132 days to 172 days. Note that the DT50 of 172 days is not associated with the longest DT90.
Fluopicolide - DAR Addendum 2 November 2007 RMS:UK
328
Unfortunately, whilst this position paper was written in 2007, its origins date back to HS assessments conducted before agreement of the FOCUS kinetics guidance document. Thus, whilst the graphical and statistical evaluation are more in line with the current guidance, the step-wise procedure is not as recommended by FOCUS. However, it demonstrates that bi-phasic kinetics seem to be more appropriate than SFO for assessment of the un-normalised field data. In addition, for the Huntlosen site, which was originally assessed in the DAR with HS with fixed C0, the new assessment demonstrated that free fitting of C0 can have a significant influence on the outcome of the kinetic assessment (new DT50/DT90 172/1000 days, DAR DT50/DT90 122/893 days).
(Kley & Mackenzie 2007a)
i) Kley & Mackenzie 2007b, Evaluation of Soil Degradation Parameters for Fluopicolide and its Metabolites from Laboratory and Field Trials for Modelling Purposes (Report No MEF-07/266) The first area that this position paper addresses is the reliability of the normalisation procedure for the field dissipation studies presented in the original DAR in Volume 3, Section B.8.1.5.1. In general, the position paper revisits the original assessment, rather than applying the fully agreed FOCUS degradation kinetics approaches to fitting parent and metabolite data to support the outcome of the original assessment. Reasoning for fixing initial a.s. concentration was re-iterated, i.e. to achieve the best overall fit for both parent and metabolites. The Applicant gave additional statistical values for goodness of fit for the Huntlosen site which was a more complex situation due to the need to simulate the metabolite M-03 in addition to M-01 and M-02. It appears that these values are meant to serve as an illustration of the complexity of the decision making process with respect to the kinetics for the field studies. These statistics demonstrated the overall impact of fixing initial a.s. concentration at various values as compared to a free-fitting approach. Note that the calibrated dose in this study was calculated to be 399 g/ha, and the measured initial soil concentration was 375 g/ha. It appears that M-02 data are not given here because the there was only one detection >LOQ at this particular site. Plots of the a.s. and metabolite fits for this site ate included in Appendix 2 for information. Note that no plots of residuals have been presented.
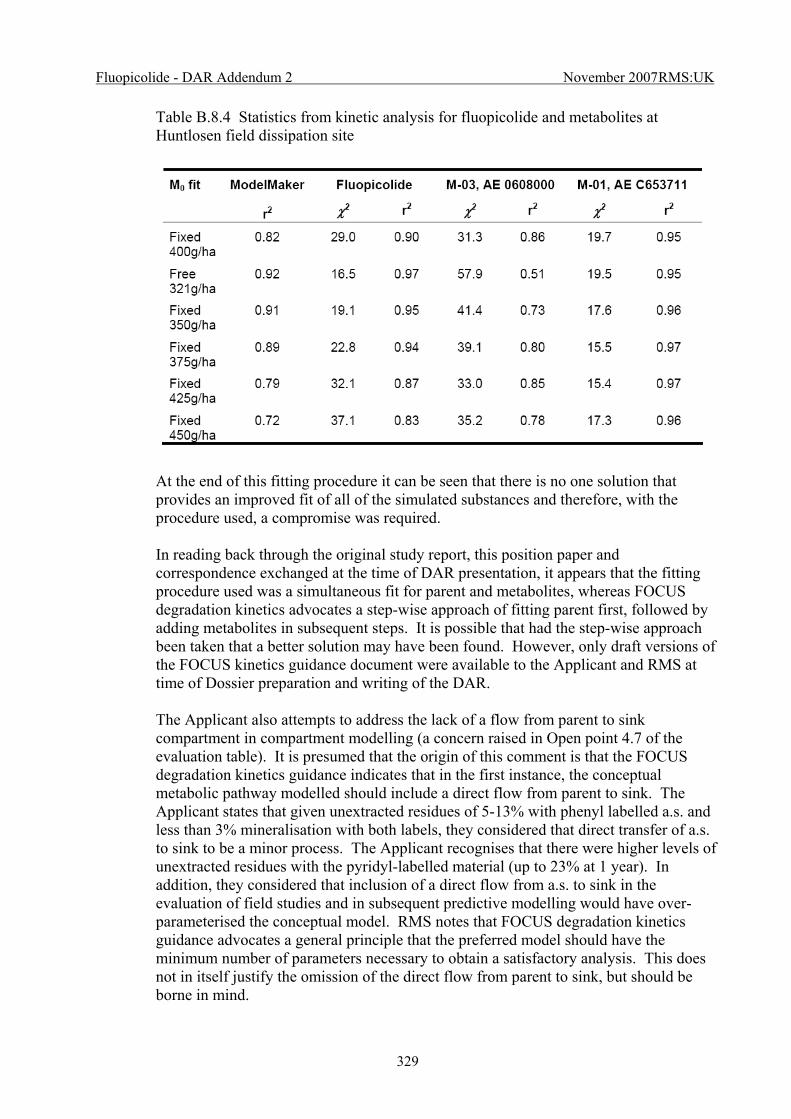
Fluopicolide - DAR Addendum 2 November 2007 RMS:UK
329
Table B.8.4 Statistics from kinetic analysis for fluopicolide and metabolites at Huntlosen field dissipation site
At the end of this fitting procedure it can be seen that there is no one solution that provides an improved fit of all of the simulated substances and therefore, with the procedure used, a compromise was required. In reading back through the original study report, this position paper and correspondence exchanged at the time of DAR presentation, it appears that the fitting procedure used was a simultaneous fit for parent and metabolites, whereas FOCUS degradation kinetics advocates a step-wise approach of fitting parent first, followed by adding metabolites in subsequent steps. It is possible that had the step-wise approach been taken that a better solution may have been found. However, only draft versions of the FOCUS kinetics guidance document were available to the Applicant and RMS at time of Dossier preparation and writing of the DAR. The Applicant also attempts to address the lack of a flow from parent to sink compartment in compartment modelling (a concern raised in Open point 4.7 of the evaluation table). It is presumed that the origin of this comment is that the FOCUS degradation kinetics guidance indicates that in the first instance, the conceptual metabolic pathway modelled should include a direct flow from parent to sink. The Applicant states that given unextracted residues of 5-13% with phenyl labelled a.s. and less than 3% mineralisation with both labels, they considered that direct transfer of a.s. to sink to be a minor process. The Applicant recognises that there were higher levels of unextracted residues with the pyridyl-labelled material (up to 23% at 1 year). In addition, they considered that inclusion of a direct flow from a.s. to sink in the evaluation of field studies and in subsequent predictive modelling would have over-parameterised the conceptual model. RMS notes that FOCUS degradation kinetics guidance advocates a general principle that the preferred model should have the minimum number of parameters necessary to obtain a satisfactory analysis. This does not in itself justify the omission of the direct flow from parent to sink, but should be borne in mind.
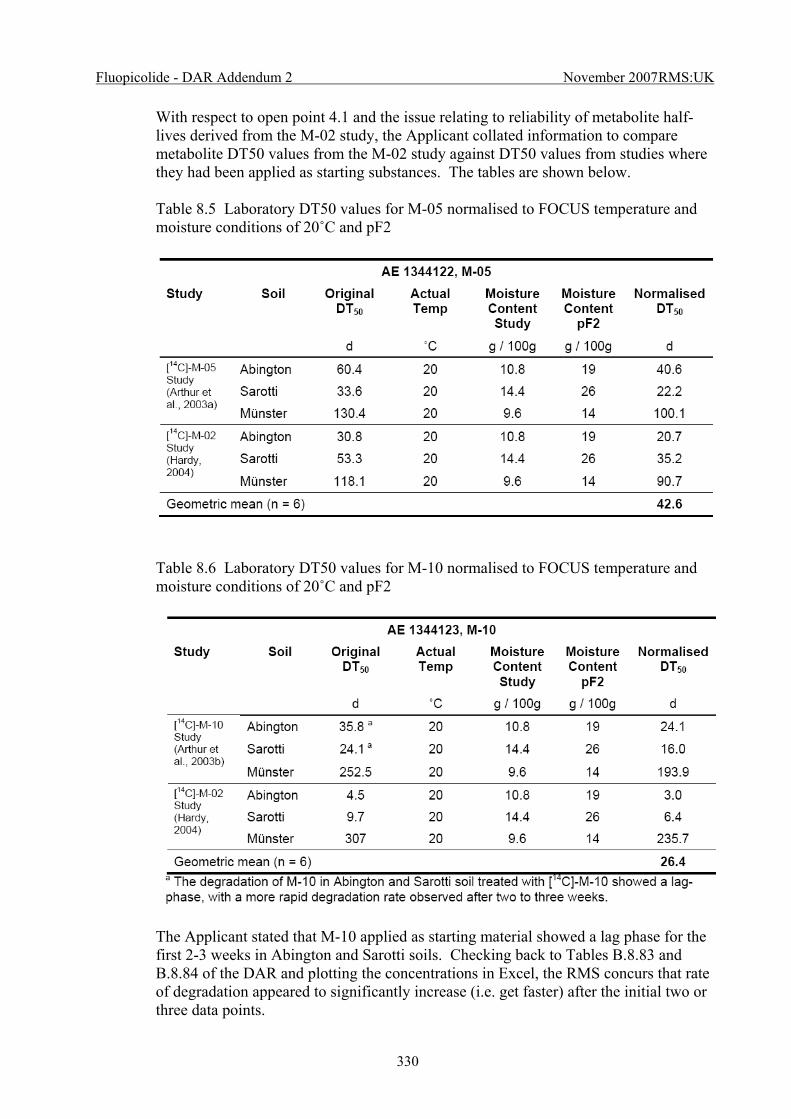
Fluopicolide - DAR Addendum 2 November 2007 RMS:UK
330
With respect to open point 4.1 and the issue relating to reliability of metabolite half-lives derived from the M-02 study, the Applicant collated information to compare metabolite DT50 values from the M-02 study against DT50 values from studies where they had been applied as starting substances. The tables are shown below. Table 8.5 Laboratory DT50 values for M-05 normalised to FOCUS temperature and moisture conditions of 20˚C and pF2
Table 8.6 Laboratory DT50 values for M-10 normalised to FOCUS temperature and moisture conditions of 20˚C and pF2
The Applicant stated that M-10 applied as starting material showed a lag phase for the first 2-3 weeks in Abington and Sarotti soils. Checking back to Tables B.8.83 and B.8.84 of the DAR and plotting the concentrations in Excel, the RMS concurs that rate of degradation appeared to significantly increase (i.e. get faster) after the initial two or three data points.
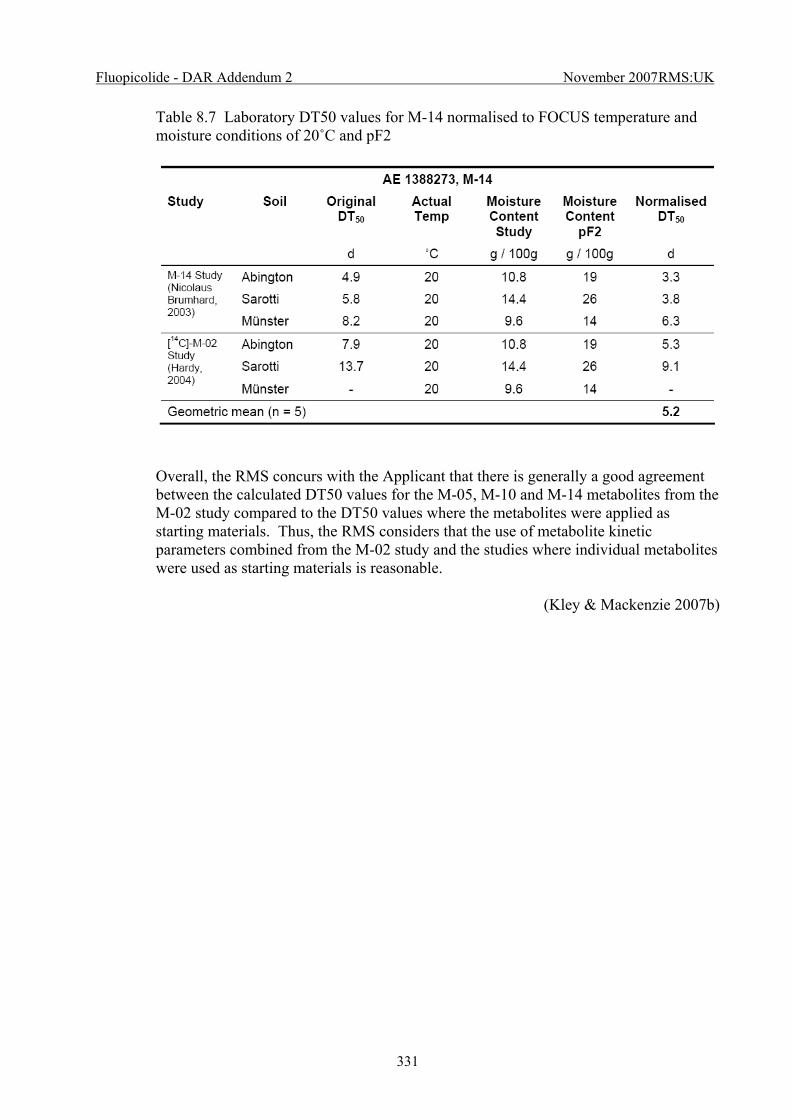
Fluopicolide - DAR Addendum 2 November 2007 RMS:UK
331
Table 8.7 Laboratory DT50 values for M-14 normalised to FOCUS temperature and moisture conditions of 20˚C and pF2
Overall, the RMS concurs with the Applicant that there is generally a good agreement between the calculated DT50 values for the M-05, M-10 and M-14 metabolites from the M-02 study compared to the DT50 values where the metabolites were applied as starting materials. Thus, the RMS considers that the use of metabolite kinetic parameters combined from the M-02 study and the studies where individual metabolites were used as starting materials is reasonable.
(Kley & Mackenzie 2007b)
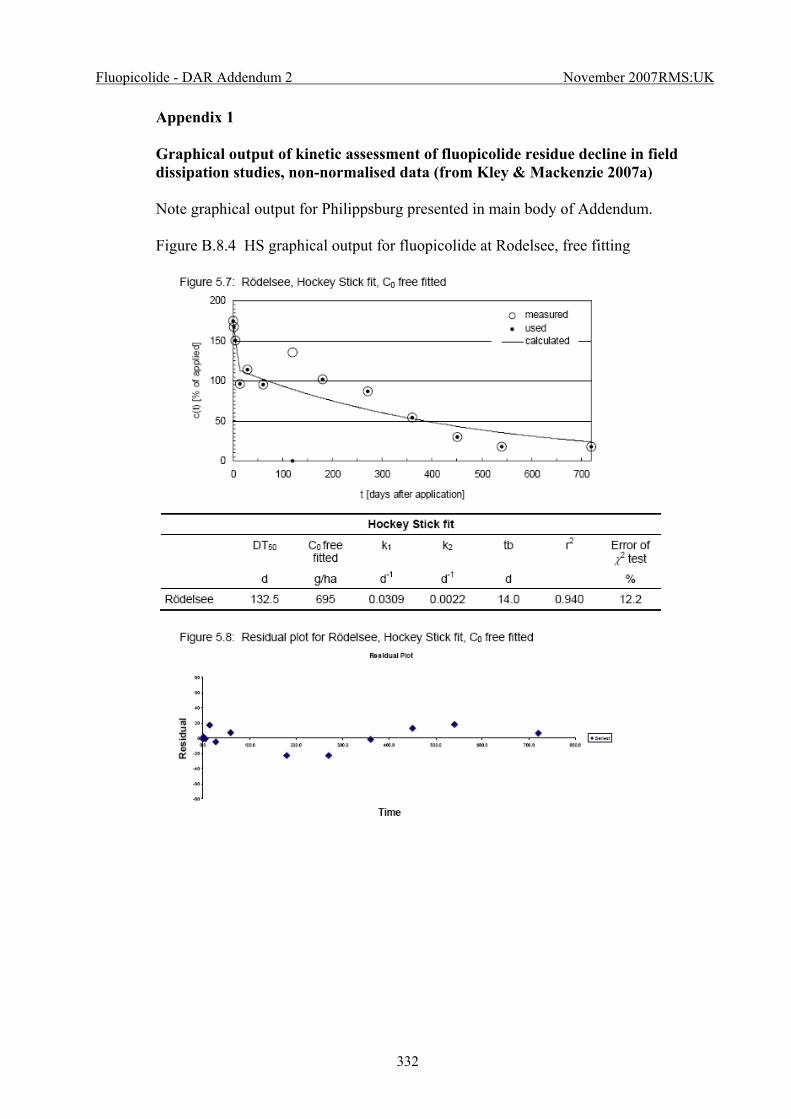
Fluopicolide - DAR Addendum 2 November 2007 RMS:UK
332
Appendix 1 Graphical output of kinetic assessment of fluopicolide residue decline in field dissipation studies, non-normalised data (from Kley & Mackenzie 2007a) Note graphical output for Philippsburg presented in main body of Addendum. Figure B.8.4 HS graphical output for fluopicolide at Rodelsee, free fitting
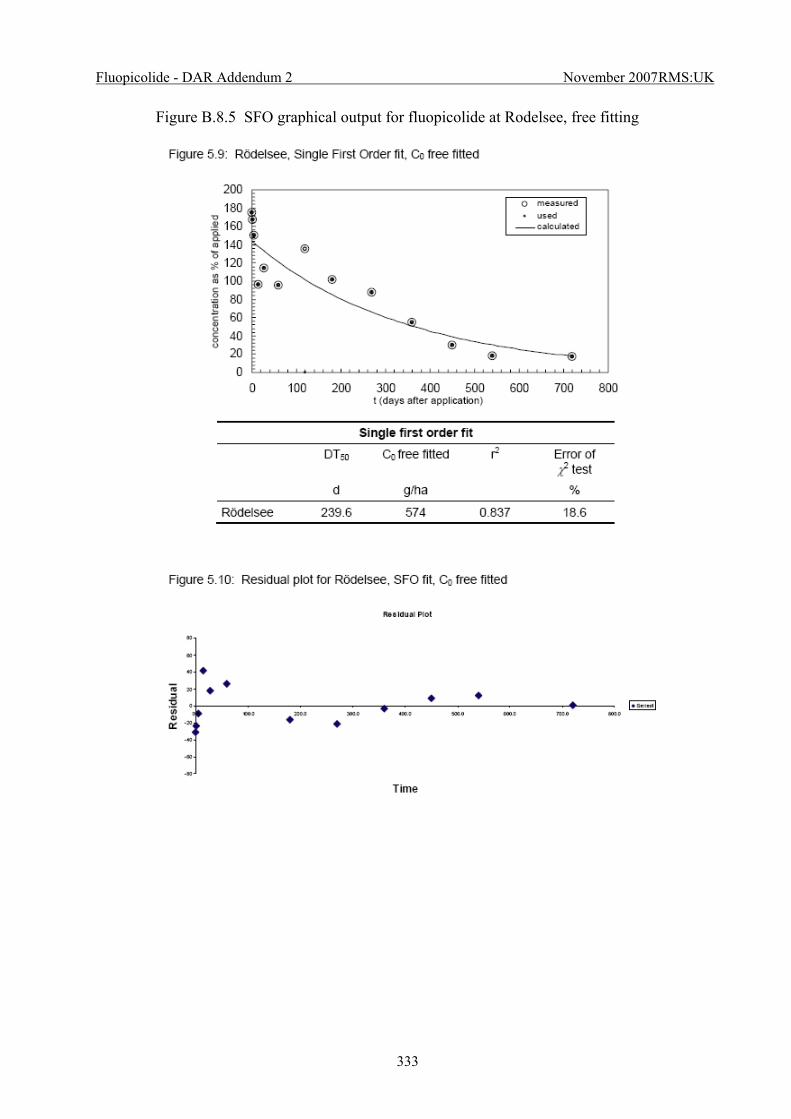
Fluopicolide - DAR Addendum 2 November 2007 RMS:UK
333
Figure B.8.5 SFO graphical output for fluopicolide at Rodelsee, free fitting
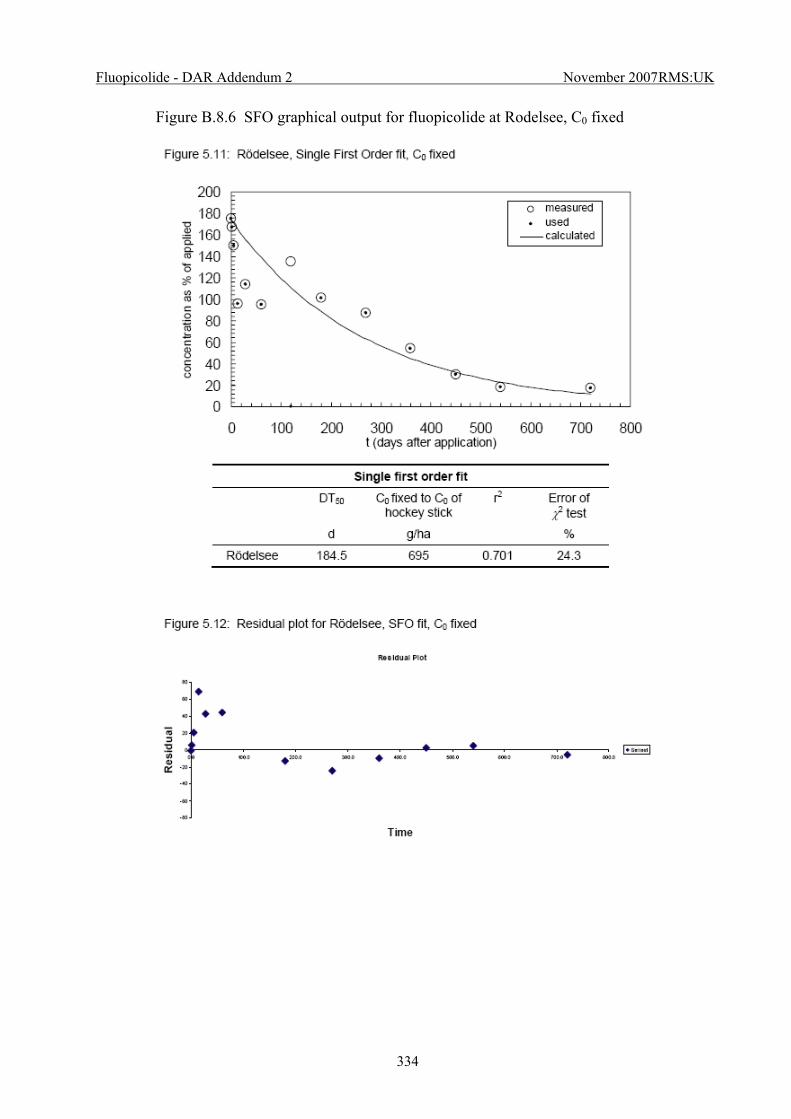
Fluopicolide - DAR Addendum 2 November 2007 RMS:UK
334
Figure B.8.6 SFO graphical output for fluopicolide at Rodelsee, C0 fixed
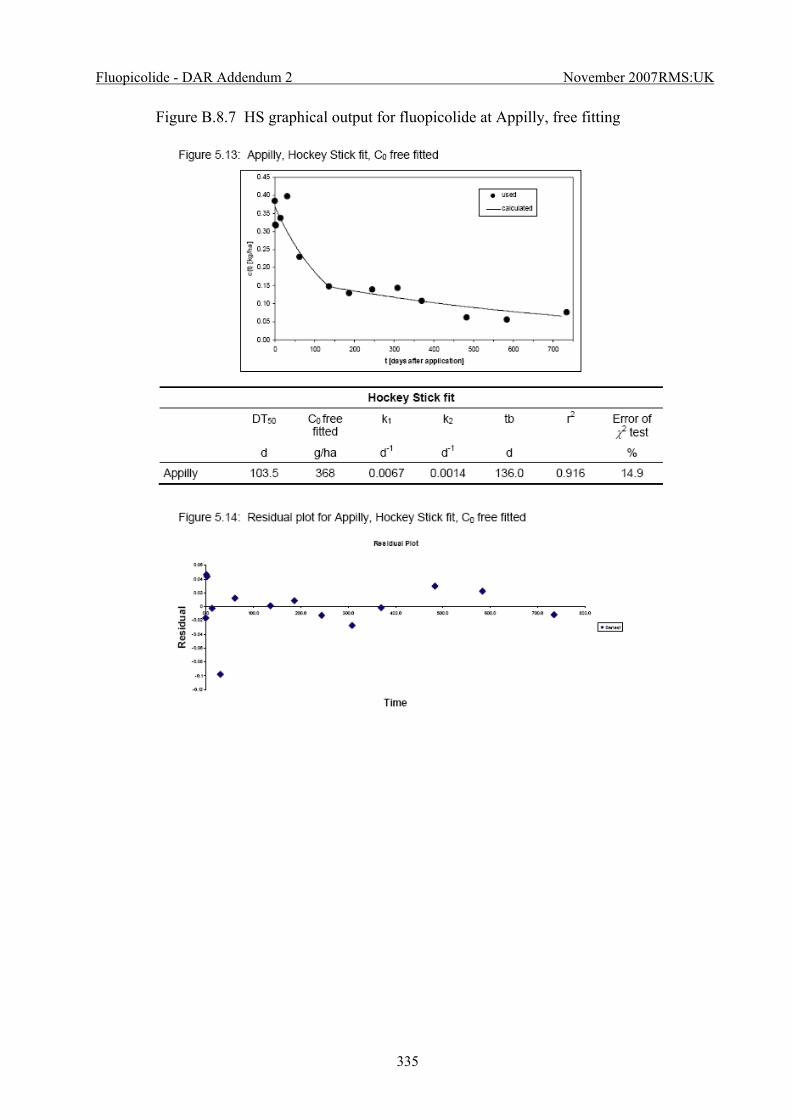
Fluopicolide - DAR Addendum 2 November 2007 RMS:UK
335
Figure B.8.7 HS graphical output for fluopicolide at Appilly, free fitting
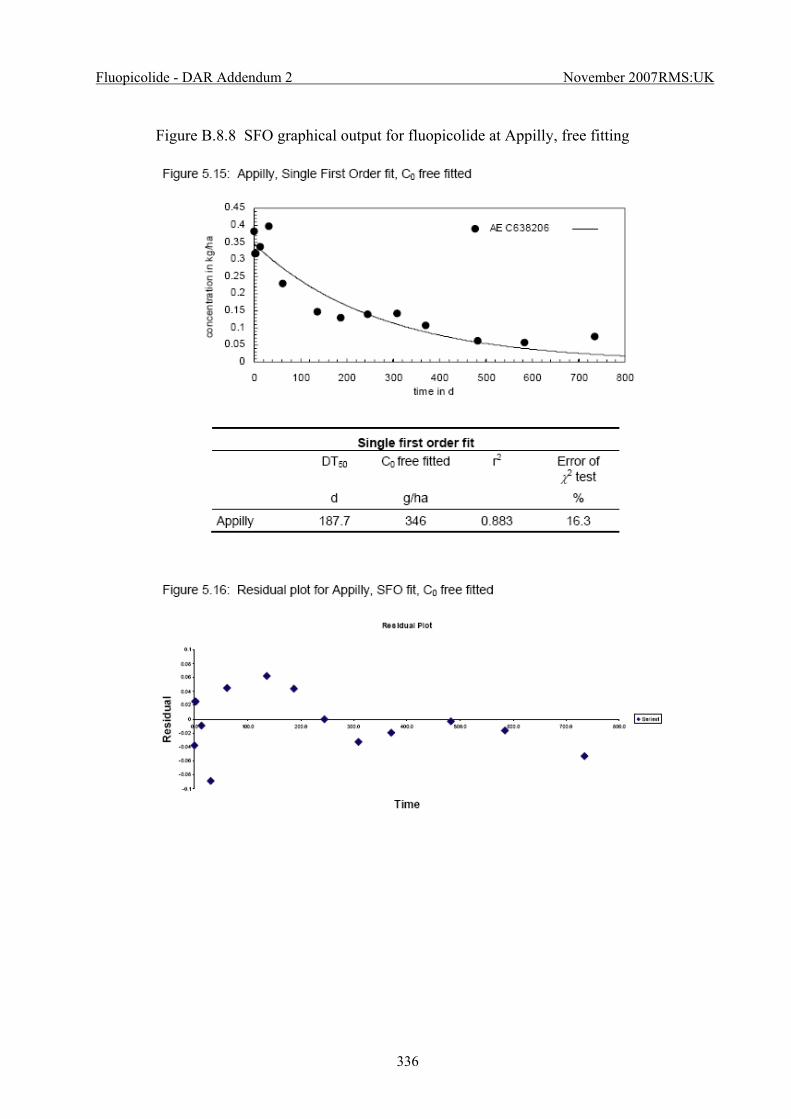
Fluopicolide - DAR Addendum 2 November 2007 RMS:UK
336
Figure B.8.8 SFO graphical output for fluopicolide at Appilly, free fitting
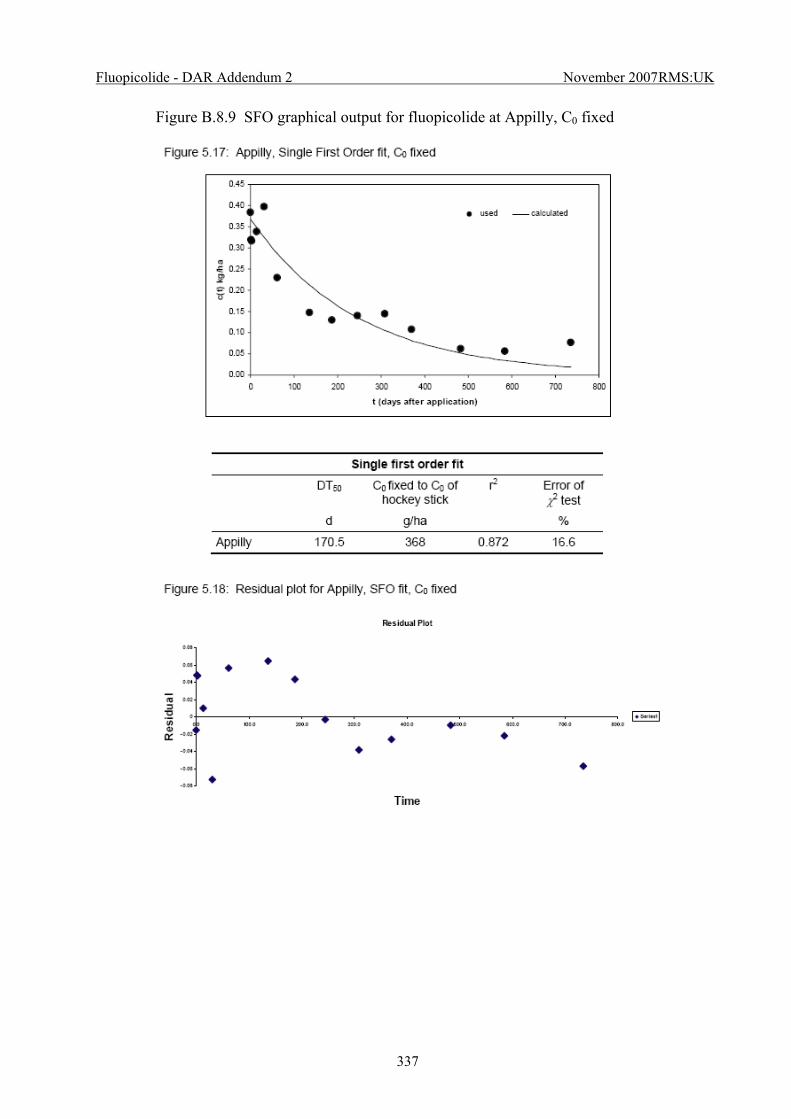
Fluopicolide - DAR Addendum 2 November 2007 RMS:UK
337
Figure B.8.9 SFO graphical output for fluopicolide at Appilly, C0 fixed
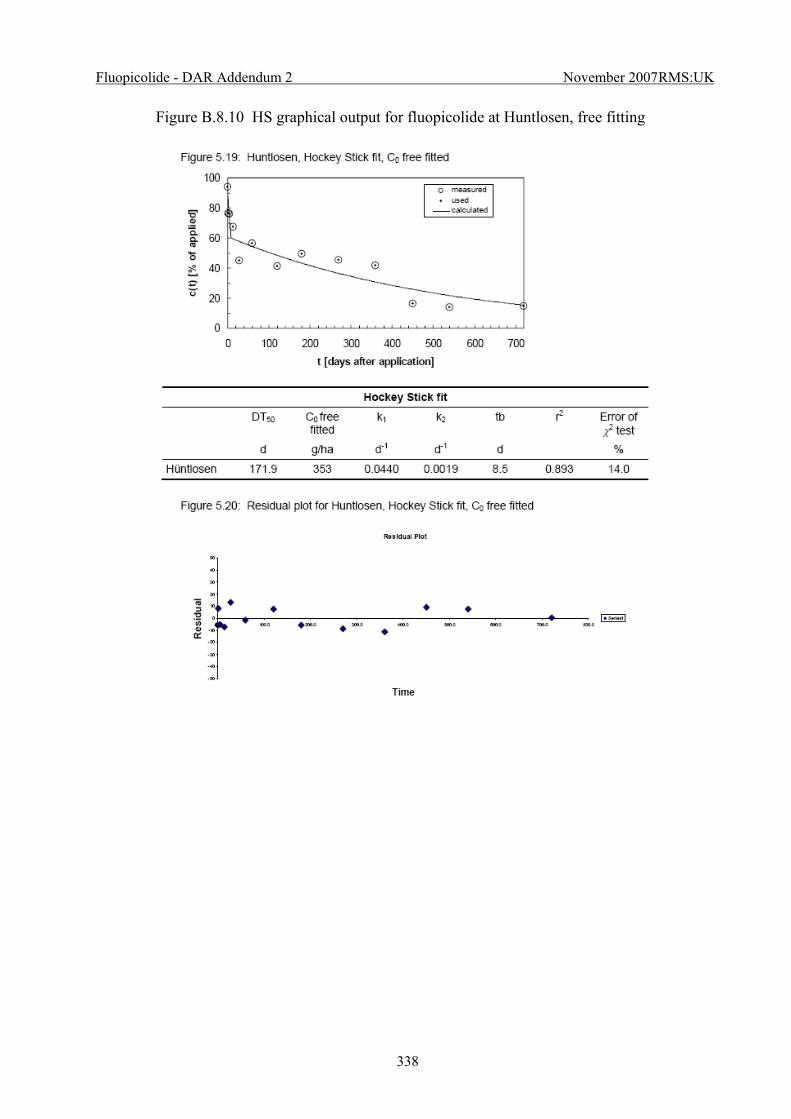
Fluopicolide - DAR Addendum 2 November 2007 RMS:UK
338
Figure B.8.10 HS graphical output for fluopicolide at Huntlosen, free fitting
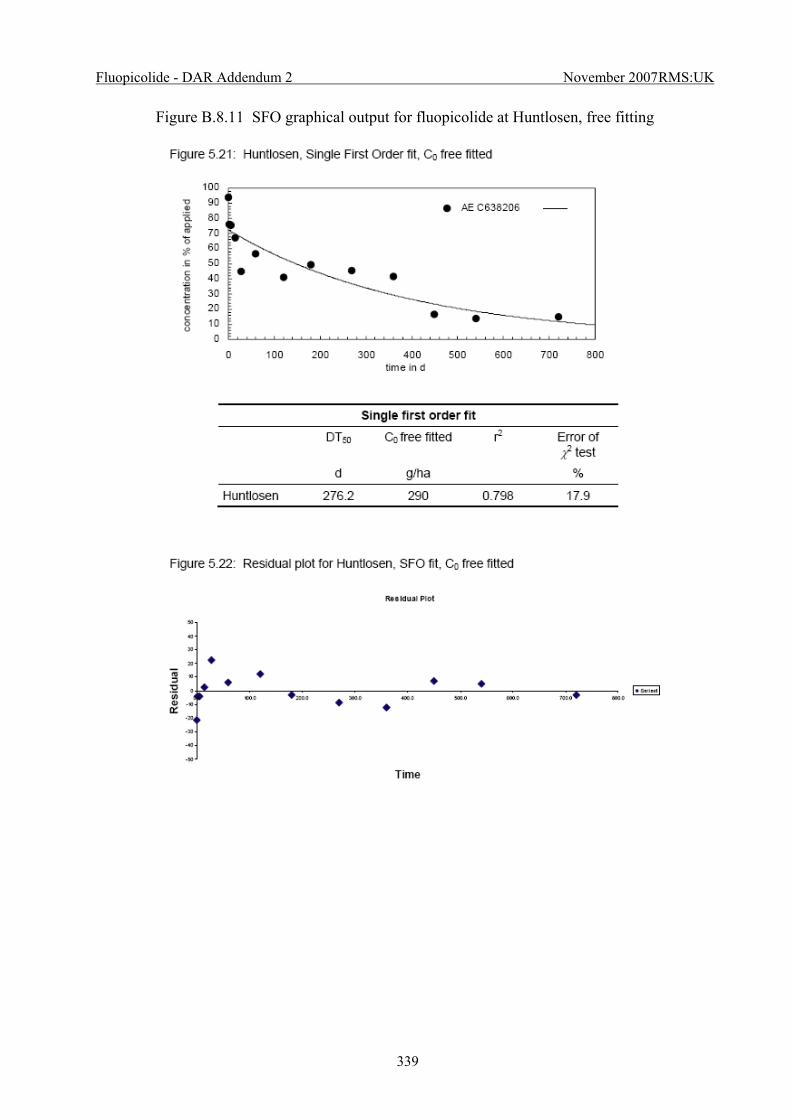
Fluopicolide - DAR Addendum 2 November 2007 RMS:UK
339
Figure B.8.11 SFO graphical output for fluopicolide at Huntlosen, free fitting
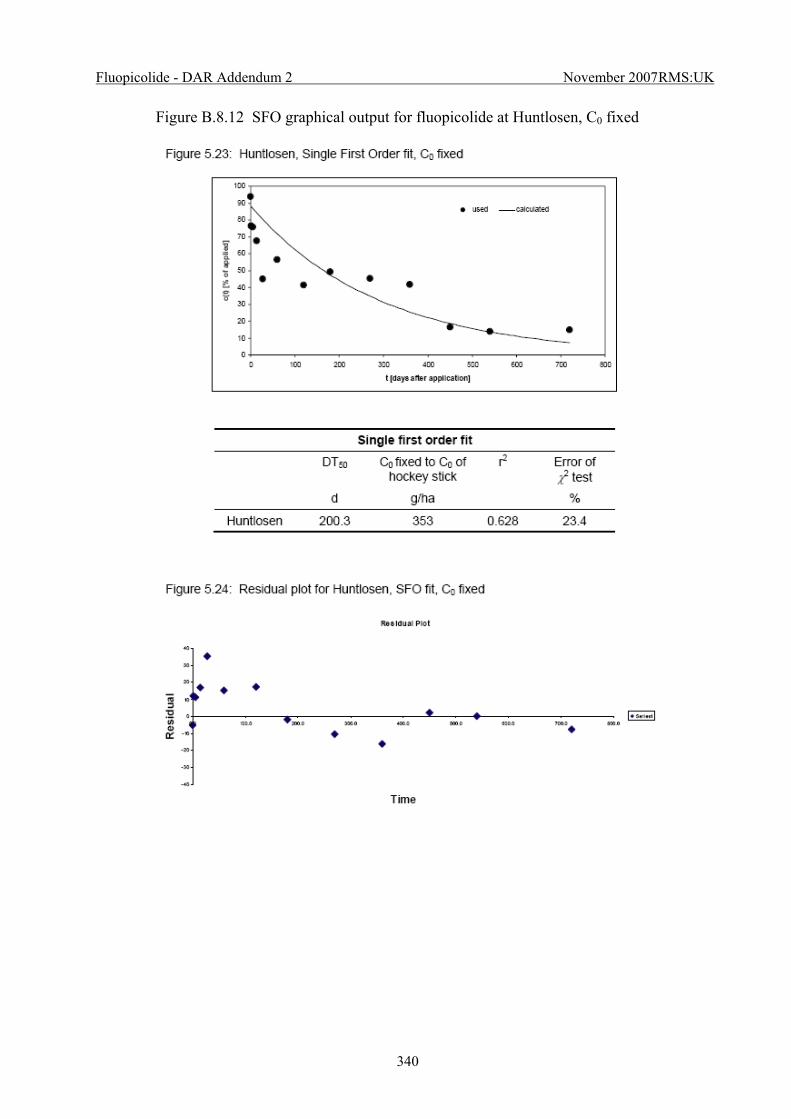
Fluopicolide - DAR Addendum 2 November 2007 RMS:UK
340
Figure B.8.12 SFO graphical output for fluopicolide at Huntlosen, C0 fixed
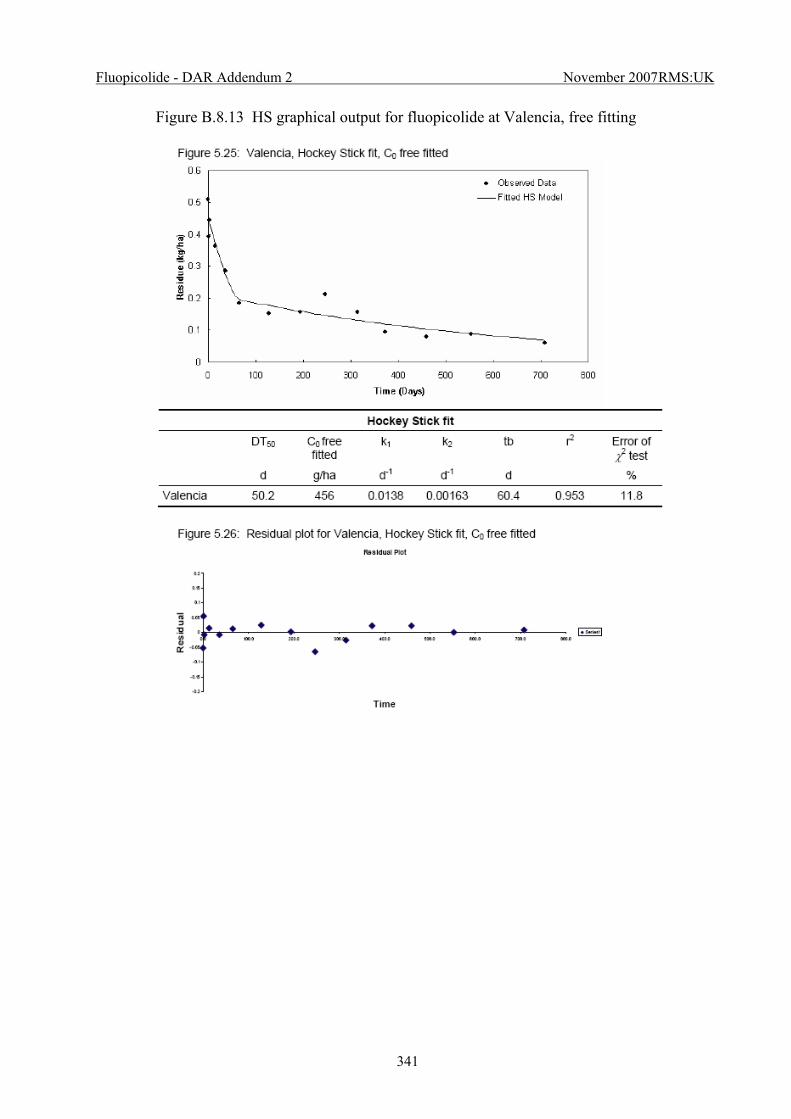
Fluopicolide - DAR Addendum 2 November 2007 RMS:UK
341
Figure B.8.13 HS graphical output for fluopicolide at Valencia, free fitting
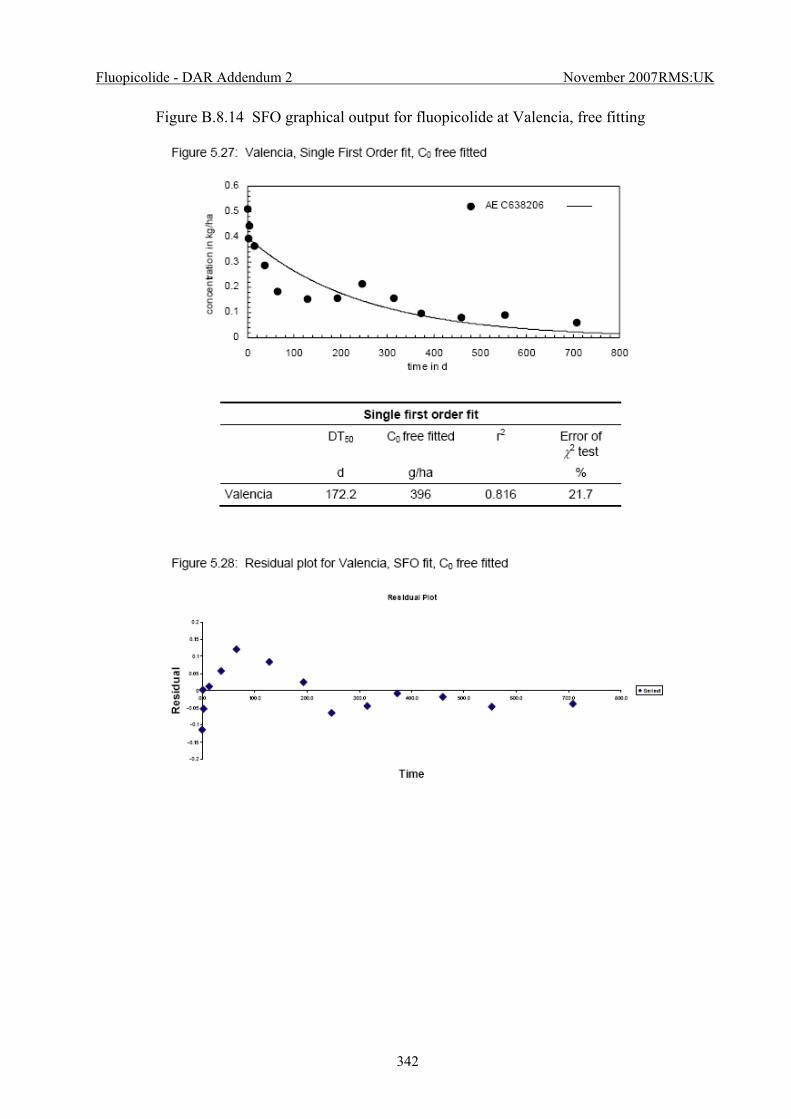
Fluopicolide - DAR Addendum 2 November 2007 RMS:UK
342
Figure B.8.14 SFO graphical output for fluopicolide at Valencia, free fitting
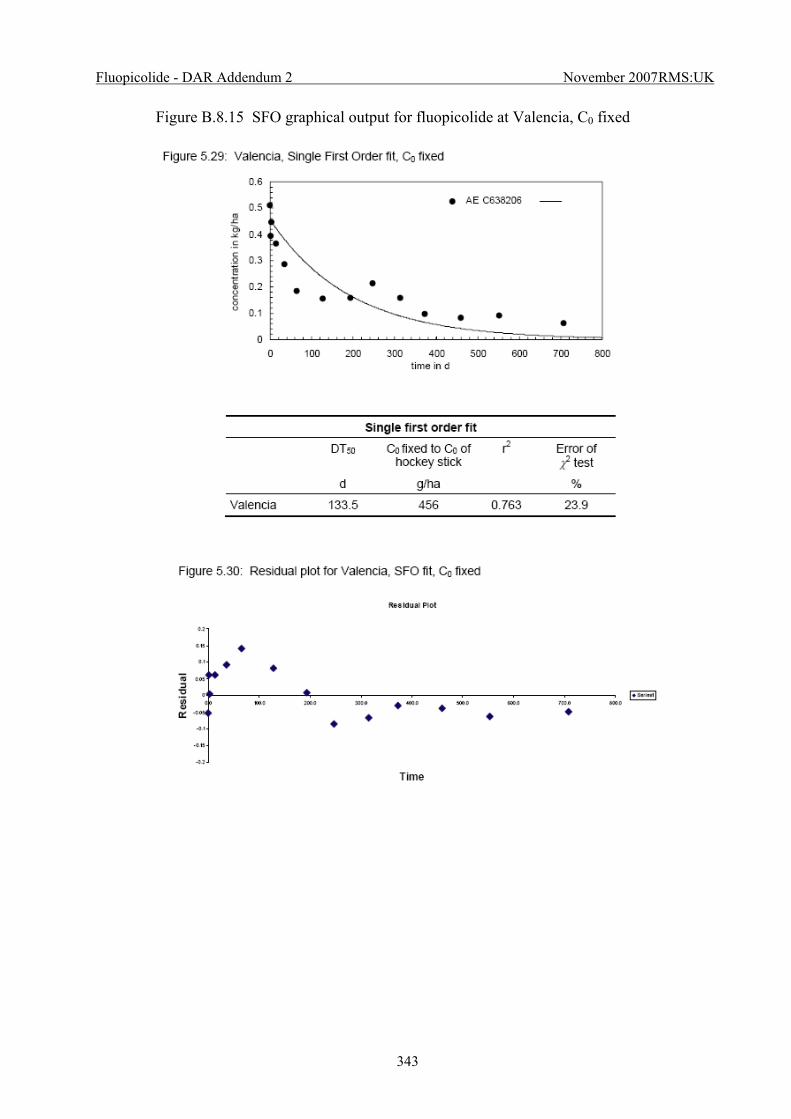
Fluopicolide - DAR Addendum 2 November 2007 RMS:UK
343
Figure B.8.15 SFO graphical output for fluopicolide at Valencia, C0 fixed
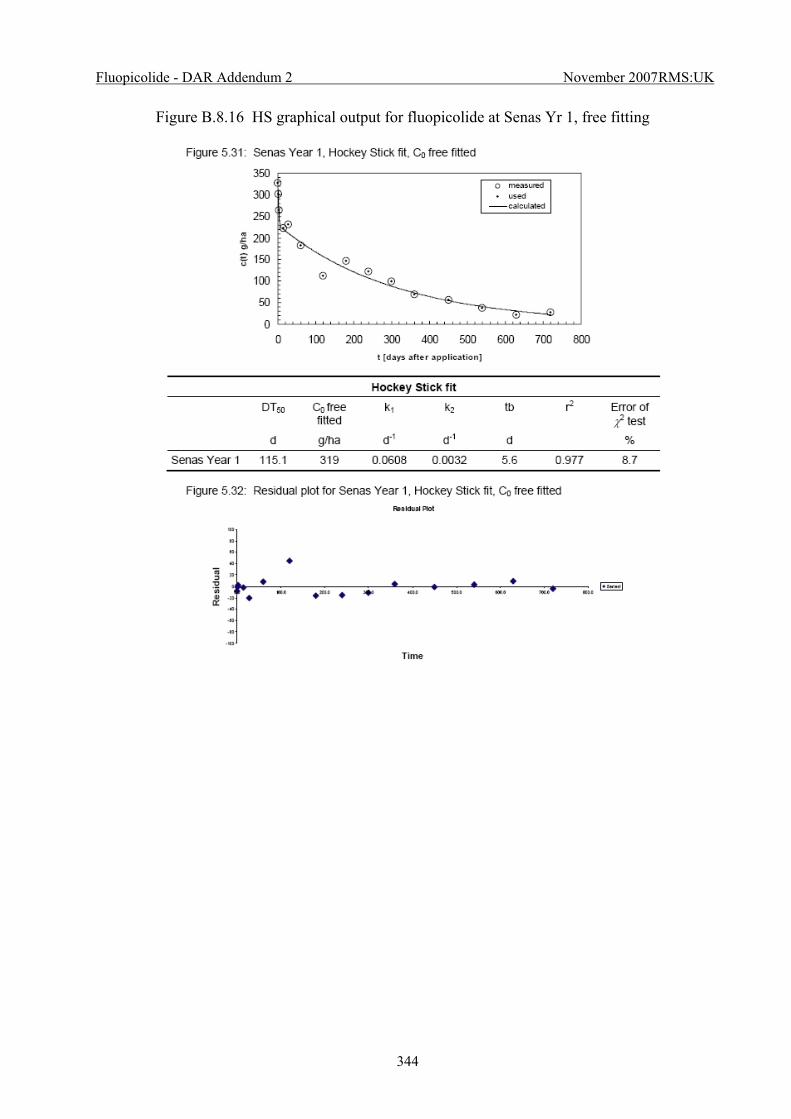
Fluopicolide - DAR Addendum 2 November 2007 RMS:UK
344
Figure B.8.16 HS graphical output for fluopicolide at Senas Yr 1, free fitting
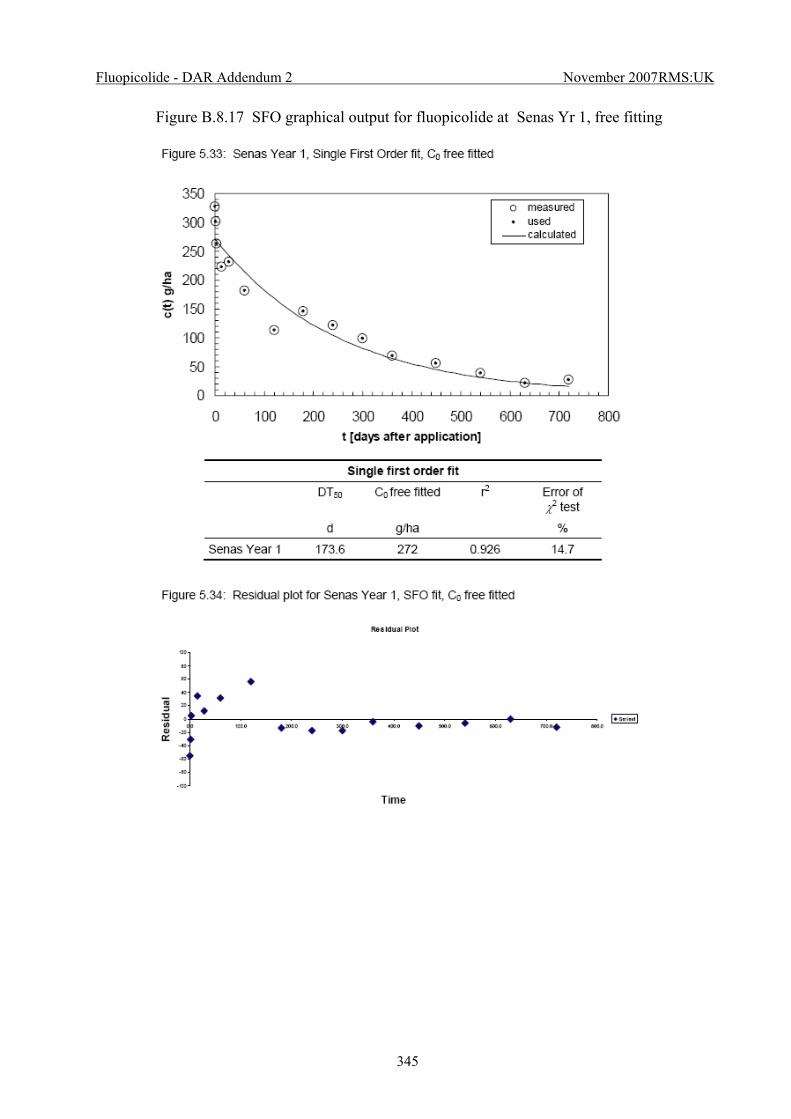
Fluopicolide - DAR Addendum 2 November 2007 RMS:UK
345
Figure B.8.17 SFO graphical output for fluopicolide at Senas Yr 1, free fitting
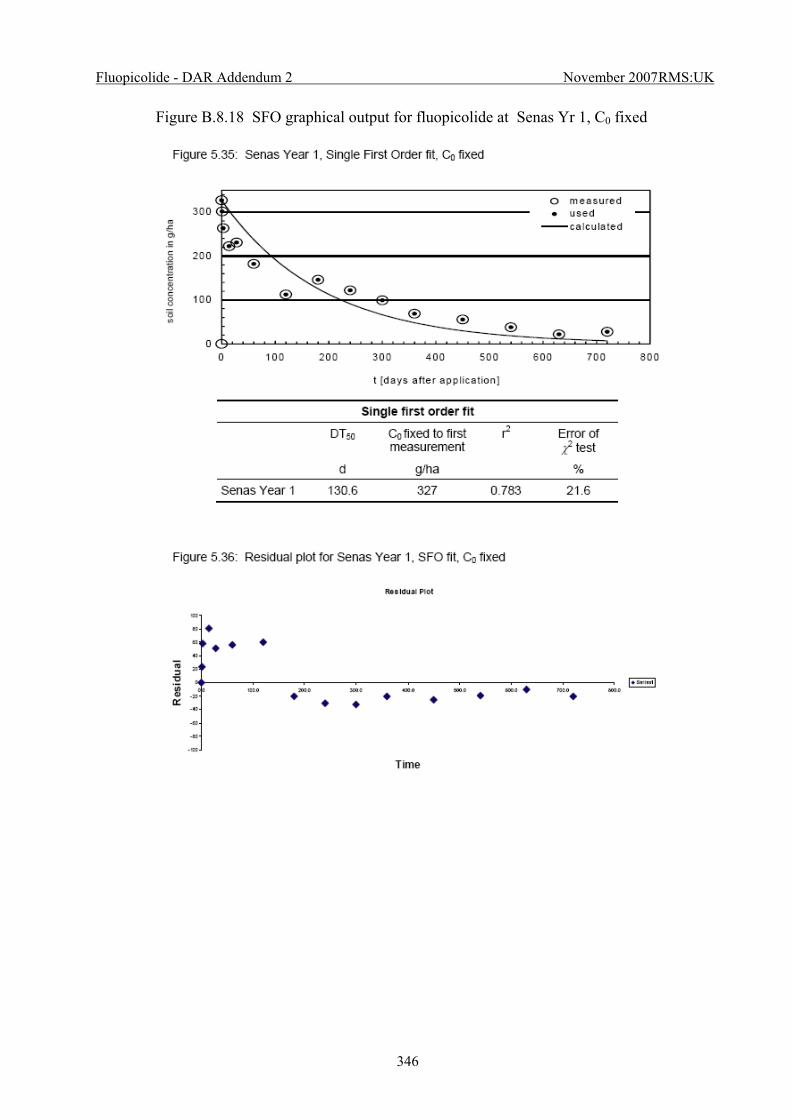
Fluopicolide - DAR Addendum 2 November 2007 RMS:UK
346
Figure B.8.18 SFO graphical output for fluopicolide at Senas Yr 1, C0 fixed
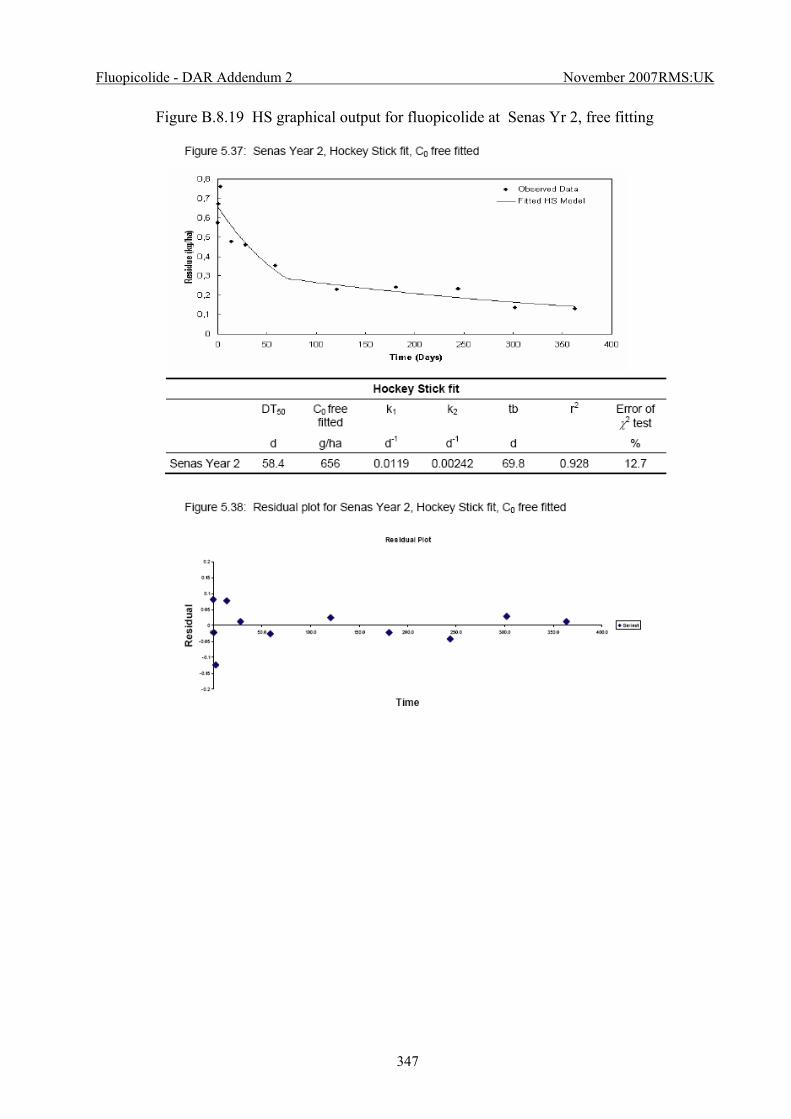
Fluopicolide - DAR Addendum 2 November 2007 RMS:UK
347
Figure B.8.19 HS graphical output for fluopicolide at Senas Yr 2, free fitting
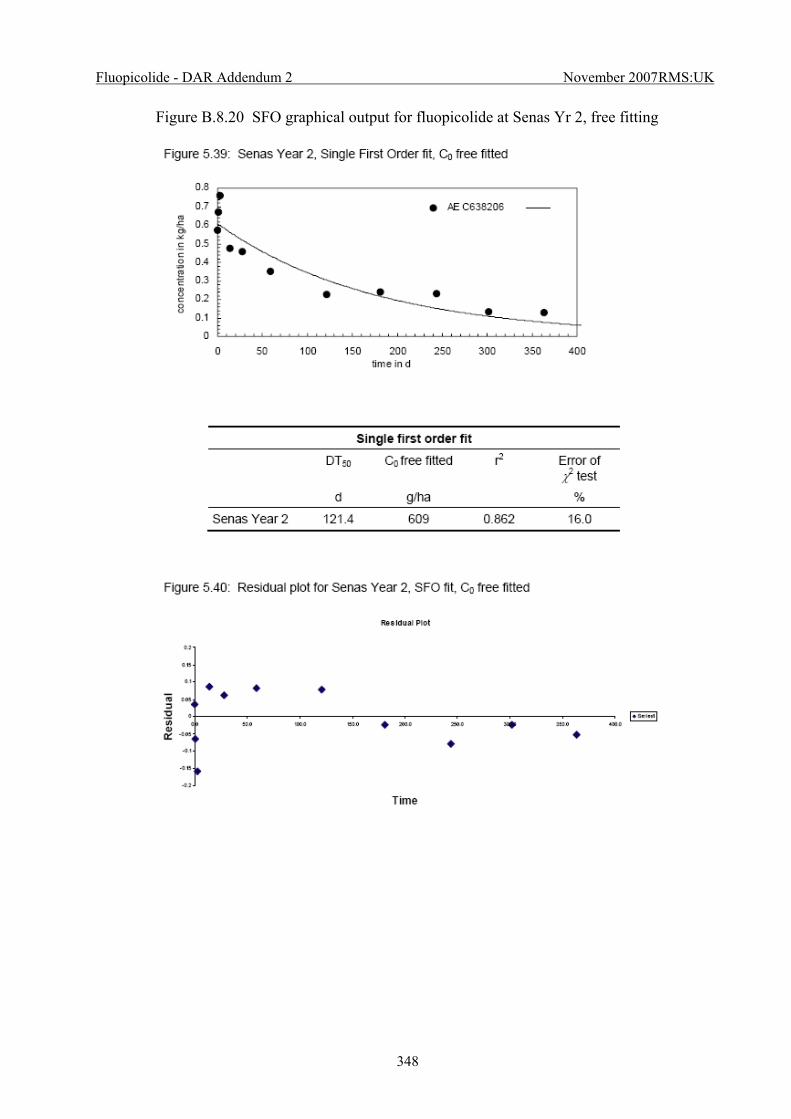
Fluopicolide - DAR Addendum 2 November 2007 RMS:UK
348
Figure B.8.20 SFO graphical output for fluopicolide at Senas Yr 2, free fitting
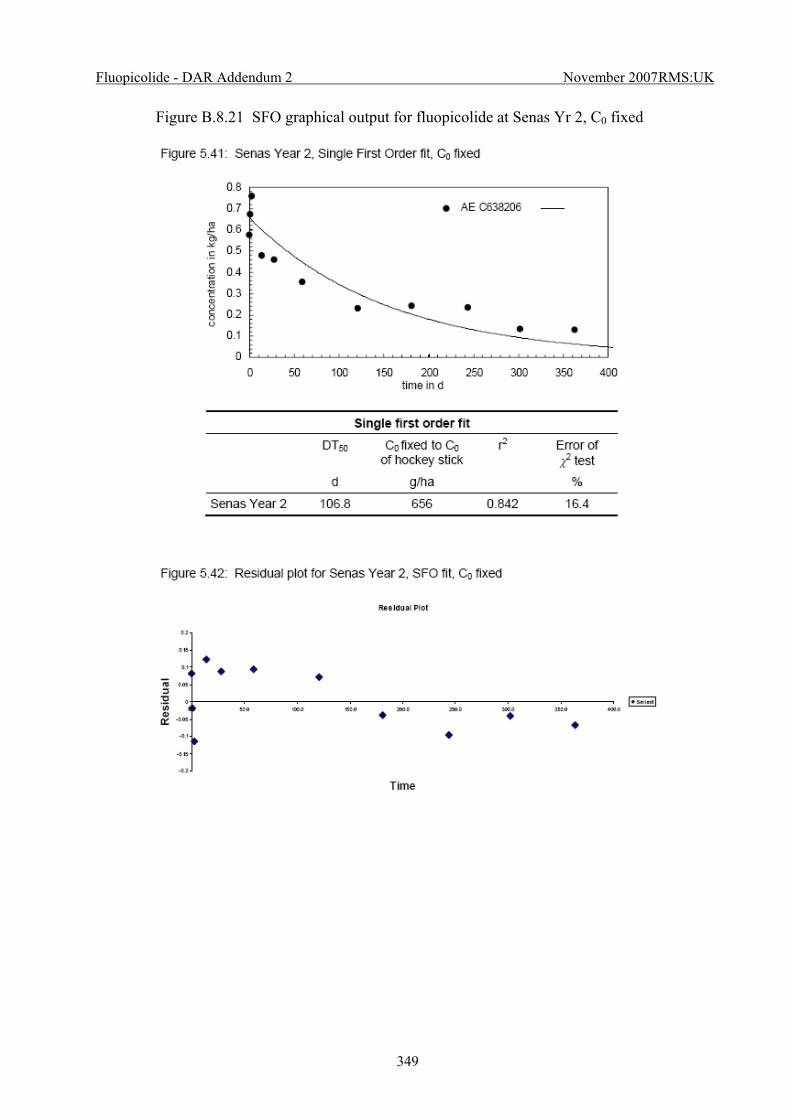
Fluopicolide - DAR Addendum 2 November 2007 RMS:UK
349
Figure B.8.21 SFO graphical output for fluopicolide at Senas Yr 2, C0 fixed
Fluopicolide - DAR Addendum 2 November 2007 RMS:UK
350
Appendix 2 Graphical output of kinetic assessment of fluopicolide and soil metabolites residue decline at Huntlosen field dissipation study, rate constant-normalised data, demonstrating impact of fixing initial concentration at a range of values and free optimisation of C0 (from Kley & Mackenzie 2007b) NOTE: Care to be taken over interpretation, graphs have different scales
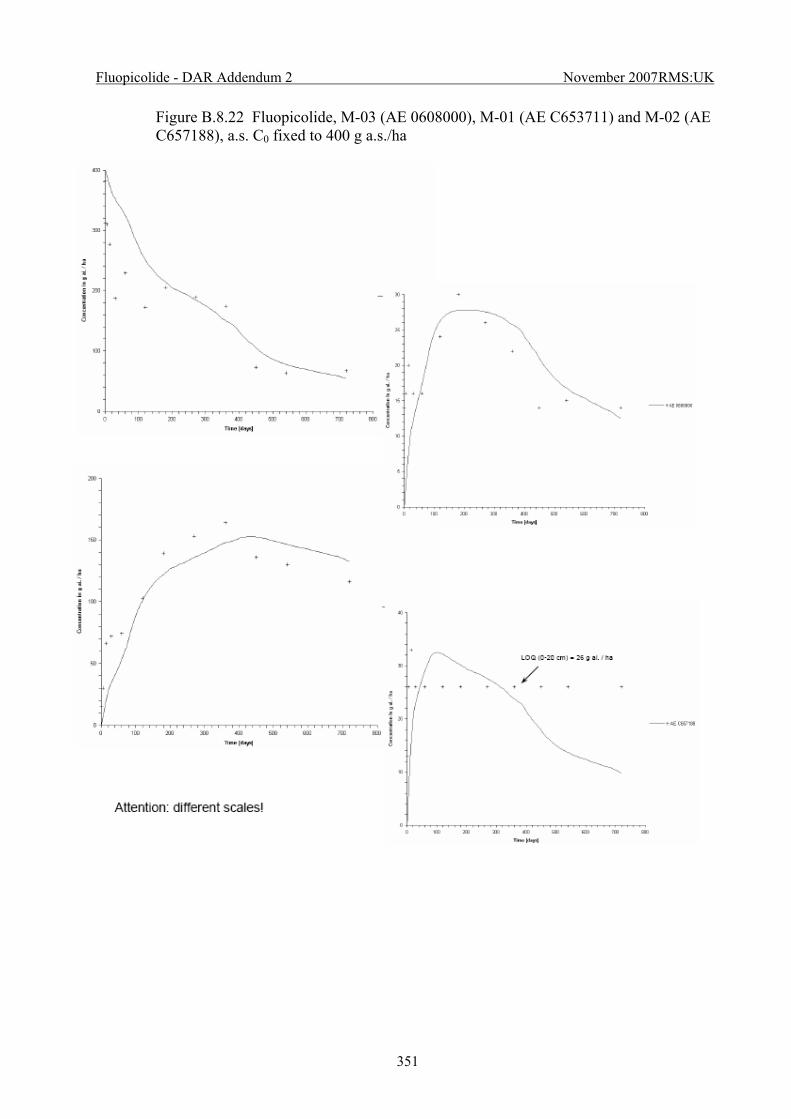
Fluopicolide - DAR Addendum 2 November 2007 RMS:UK
351
Figure B.8.22 Fluopicolide, M-03 (AE 0608000), M-01 (AE C653711) and M-02 (AE C657188), a.s. C0 fixed to 400 g a.s./ha
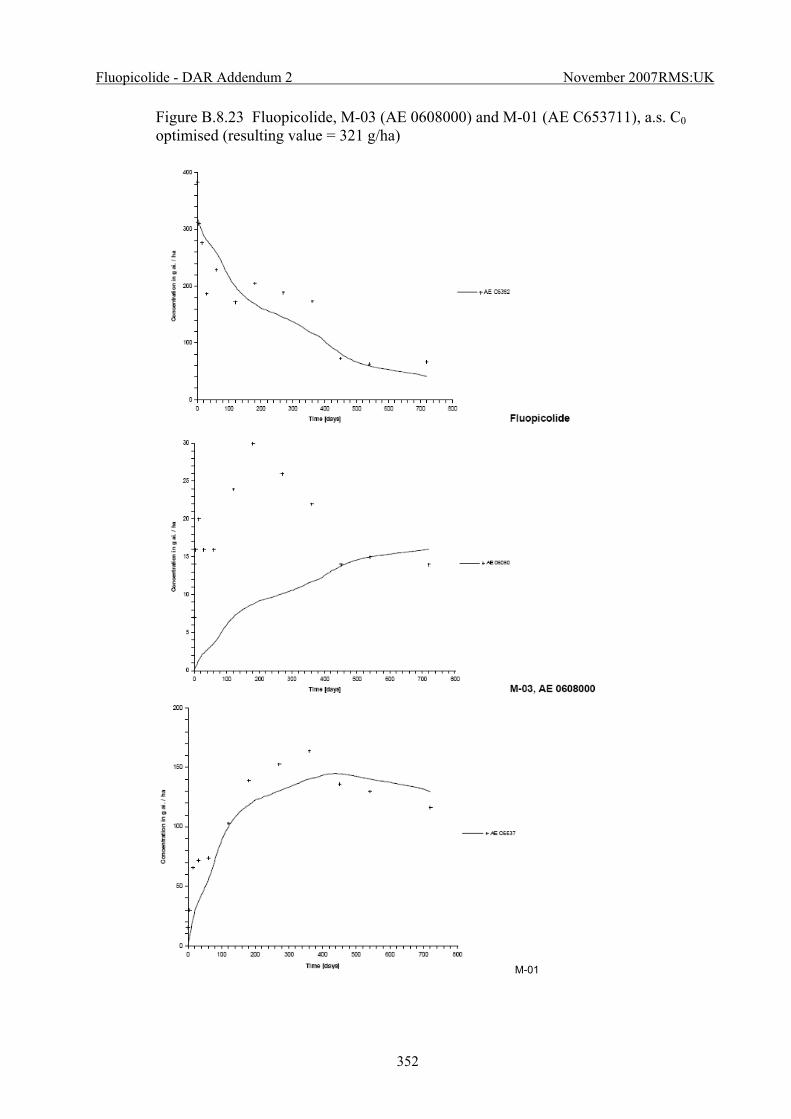
Fluopicolide - DAR Addendum 2 November 2007 RMS:UK
352
Figure B.8.23 Fluopicolide, M-03 (AE 0608000) and M-01 (AE C653711), a.s. C0 optimised (resulting value = 321 g/ha)
M-01

Fluopicolide - DAR Addendum 2 November 2007 RMS:UK
353
Figure B.8.24 Fluopicolide, M-03 (AE 0608000) and M-01 (AE C653711), a.s. C0 fixed at 350 g/ha
M-01
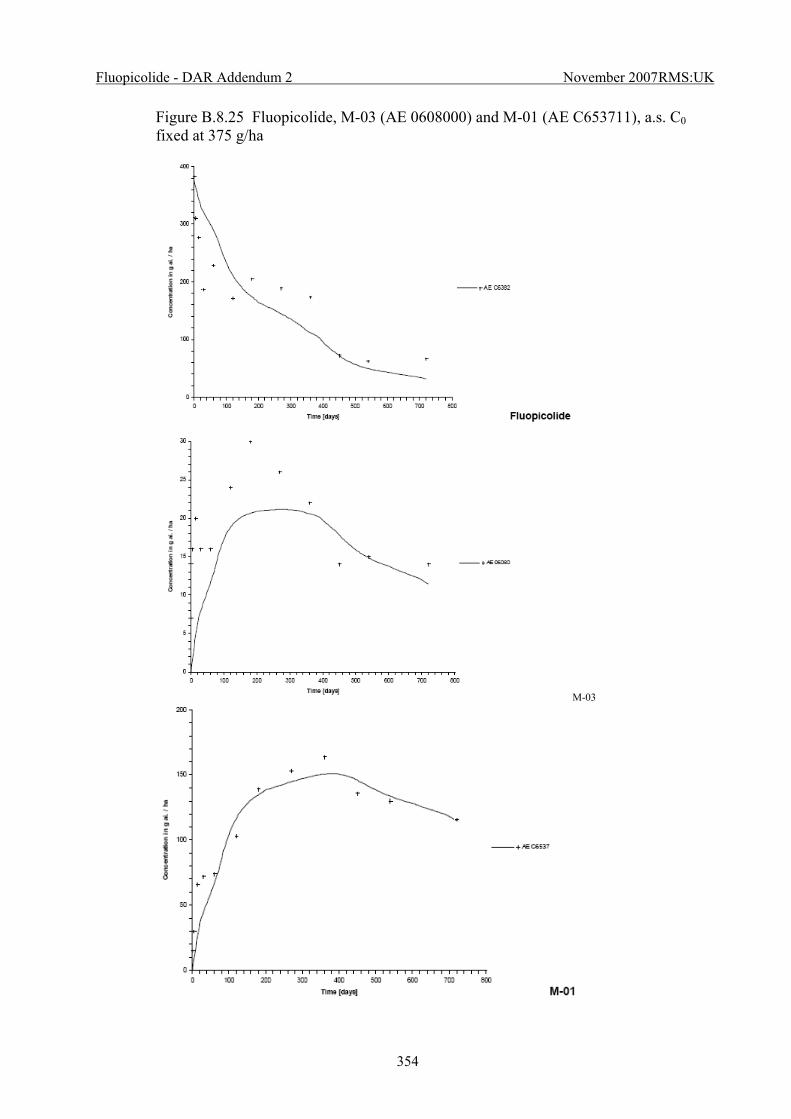
Fluopicolide - DAR Addendum 2 November 2007 RMS:UK
354
Figure B.8.25 Fluopicolide, M-03 (AE 0608000) and M-01 (AE C653711), a.s. C0 fixed at 375 g/ha
M-03
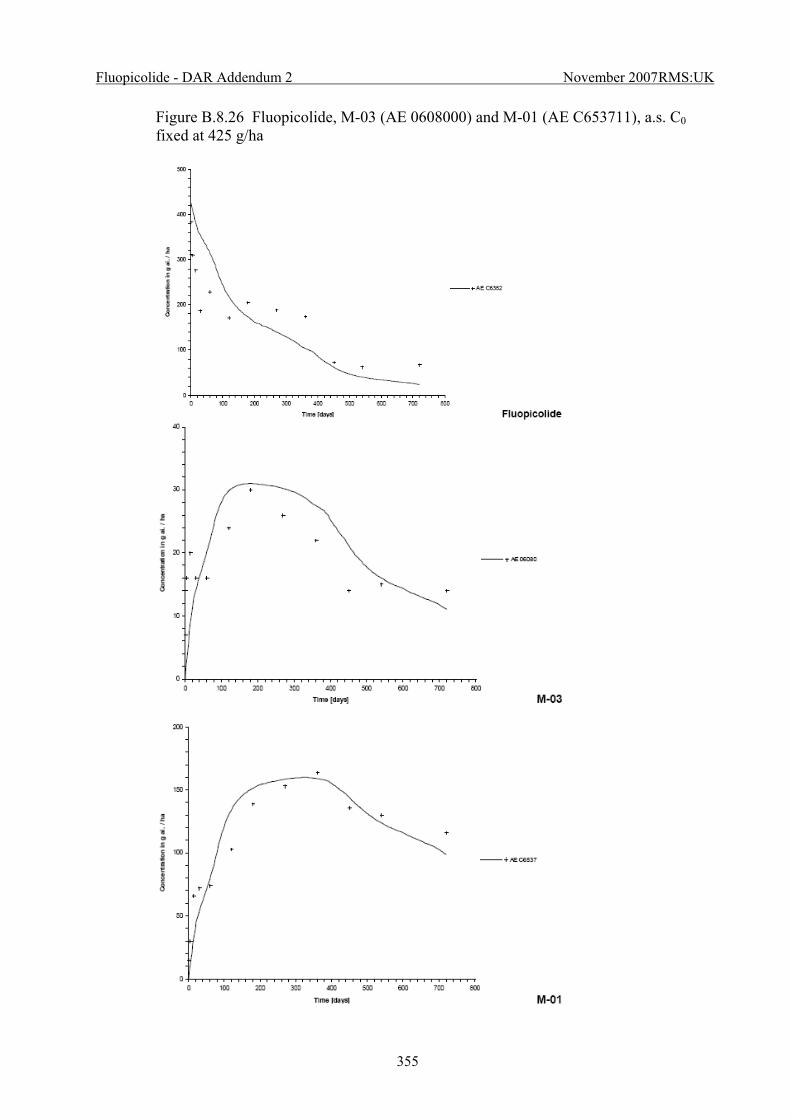
Fluopicolide - DAR Addendum 2 November 2007 RMS:UK
355
Figure B.8.26 Fluopicolide, M-03 (AE 0608000) and M-01 (AE C653711), a.s. C0 fixed at 425 g/ha
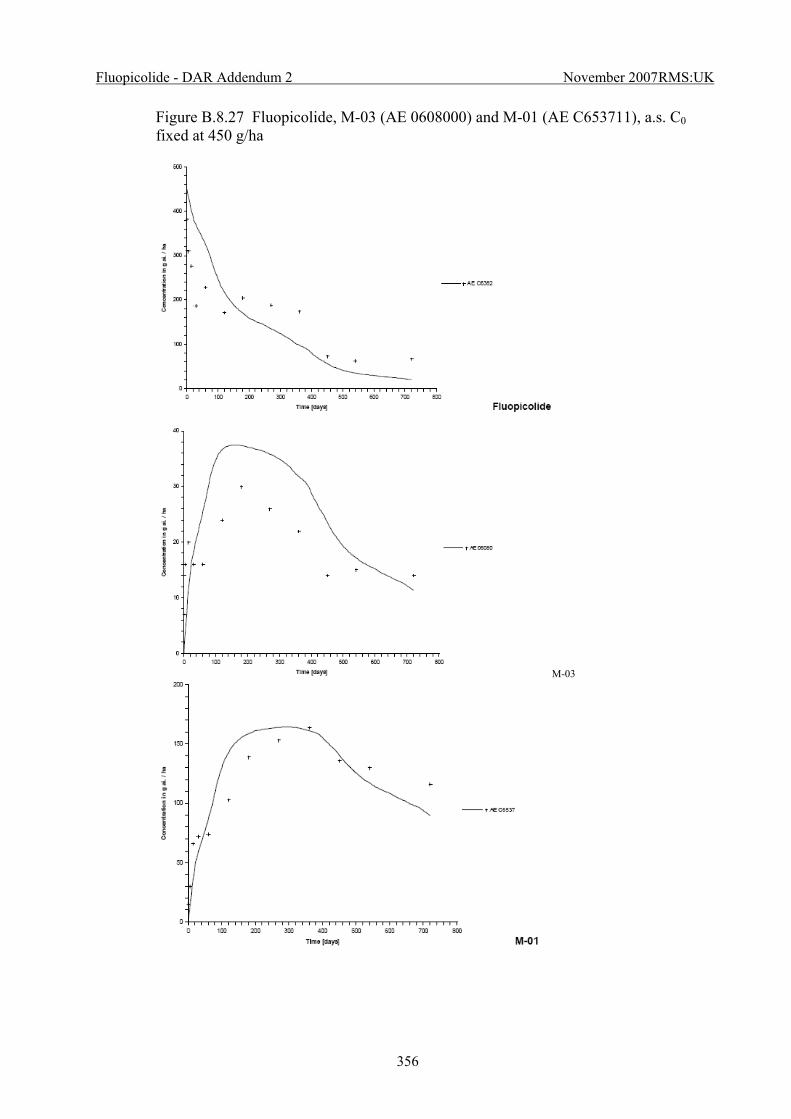
Fluopicolide - DAR Addendum 2 November 2007 RMS:UK
356
Figure B.8.27 Fluopicolide, M-03 (AE 0608000) and M-01 (AE C653711), a.s. C0 fixed at 450 g/ha
M-03
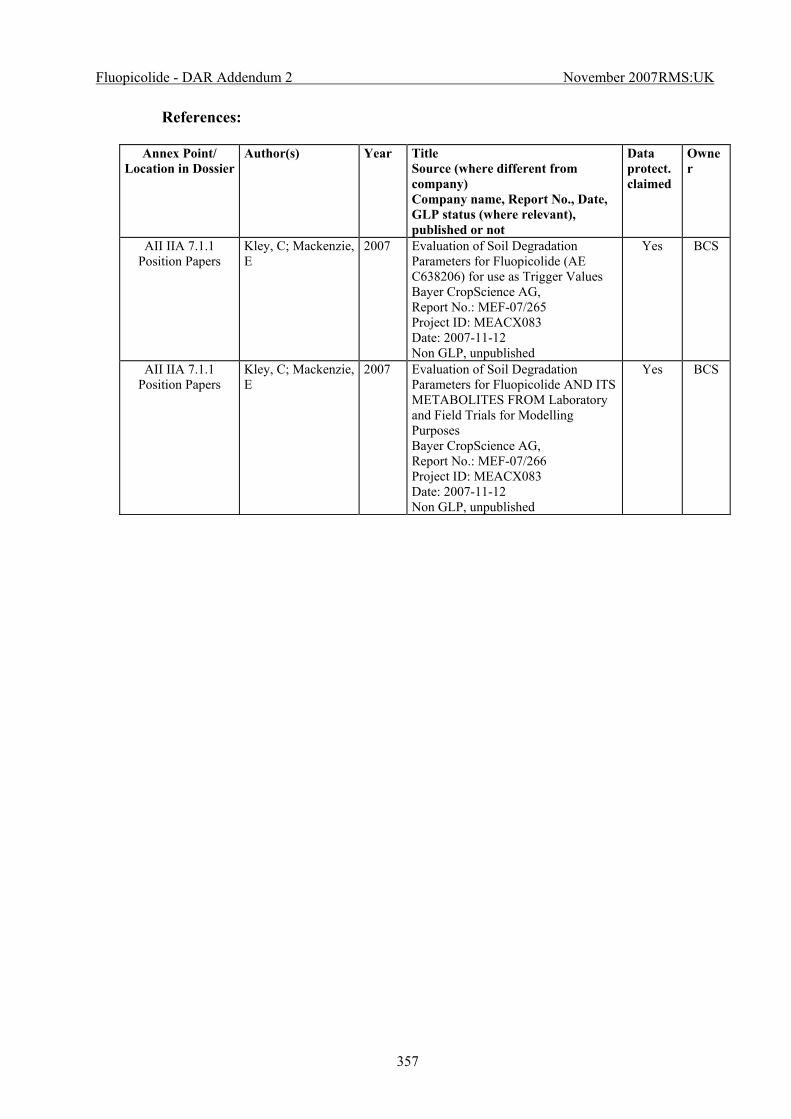
Fluopicolide - DAR Addendum 2 November 2007 RMS:UK
357
References:
Annex Point/ Location in Dossier
Author(s) Year Title Source (where different from company) Company name, Report No., Date, GLP status (where relevant), published or not
Data protect. claimed
Owner
AII IIA 7.1.1 Position Papers
Kley, C; Mackenzie, E
2007 Evaluation of Soil Degradation Parameters for Fluopicolide (AE C638206) for use as Trigger Values Bayer CropScience AG, Report No.: MEF-07/265 Project ID: MEACX083 Date: 2007-11-12 Non GLP, unpublished
Yes BCS
AII IIA 7.1.1 Position Papers
Kley, C; Mackenzie, E
2007 Evaluation of Soil Degradation Parameters for Fluopicolide AND ITS METABOLITES FROM Laboratory and Field Trials for Modelling Purposes Bayer CropScience AG, Report No.: MEF-07/266 Project ID: MEACX083 Date: 2007-11-12 Non GLP, unpublished
Yes BCS
Fluopicolide - Addendum 2 December 2008
358
Council Directive 91/414/EEC
Fluopicolide (AE C638206)
ADDENDUM 2 TO THE DRAFT ASSESSMENT REPORT PREPARED BY THE
UNITED KINGDOM
December 2008
PESTICIDES SAFETY DIRECTORATEMallard House, Kings Pool, 3 Peasholme Green, York YO1 7PX, UK Website: www.pesticides.gov.uk
Fluopicolide - Addendum 2 December 2008
359
CONTENTS Page
TOXICOLOGY AND METABOLISM 3 ENVIRONMENTAL FATE AND BEHAVIOUR 34 ECOTOXICOLOGY 45 Appendix 1: Summary of the significant metabolites of fluopicolide
identified in studies in animals, plants and the environment
48
Appendix 2: DETAILED STUDIES AS REPORTED IN ORIGINAL DAR 52 Appendix 3: Position Paper - The non-relevance of the fluopicolide
metabolite M01 (AE C653711): 2,6-dichlorobenzamide (also known as BAM)
95
Fluopicolide - Addendum 2 December 2008
360
B.6 TOXICOLOGY AND METABOLISM
Open Point 2.3: Data gap identified at PRAPeR 39: Notifier to provide further information on M-01 if deemed necessary.
In order to address this data gap the notifier has a new position paper (Leake et al, 2008, report no. M-300114-01-1), title ‘The non-relevance of the fluopicolide metabolite M01 (AE C653711): 2,6-dichlorobenzamide (also known as BAM)’. This position paper takes into account:
o data already submitted with the fluopicolide dossier o toxicology data on M-01 (BAM) submitted in the US for dichlobenil which were
not submitted in Europe for neither fluopicolide nor dichlobenil but were included into the negative reference list of the dichlobenil dossier.
Therefore this addendum contains the RMS’s toxicology assessment of M-01 (BAM)
and consists of 3 parts:
1) Evaluation of studies on 2,6-dichlorobenzamide (M-01/BAM) which were noted to have been considered by the EPA but were not available for consideration at the PRAPeR expert meeting and were suggested to at the expert meeting as potentially relevant studies.
2) Overview of the toxicology of M-01 (BAM), including all the available studies considered relevant in the assessment of toxicological relevance and proposals of regulatory reference dose levels.
3) An updated assessment of the relevance of M-01 (BAM) following ‘Guidance Document on the Assessment of the Relevenace of Metabolites in Groundwater of Substances Regulated Under Council Directive 91/414/EEC (SANCO/221/2000-rev.10-final, 25 February 2003).
PART ONE: Evaluation of additional studies on 2,6-dichlorobenzamide (M-01/ BAM)
The following studies were noted to be reported in the US EPA’s assessment of M-01 (BAM) during PRAPeR 39 (10 – 13 12.2007) and as a consequence of ensuing discussions on relevance for the risk assessment of M-01 (BAM), a data gap was opened for ‘the Notifier to provide further information on M-01 if deemed necessary’. The additional data mentioned have been evaluated and considered in the assessment of the toxicity of M-01 (BAM).
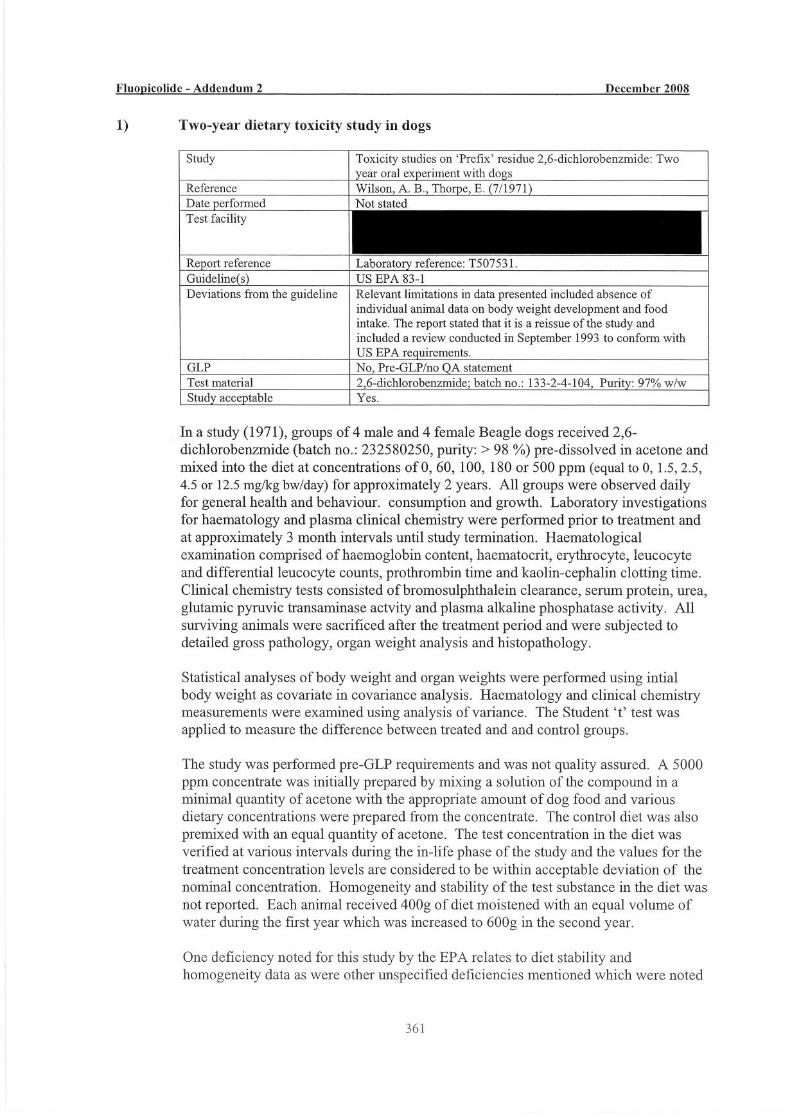
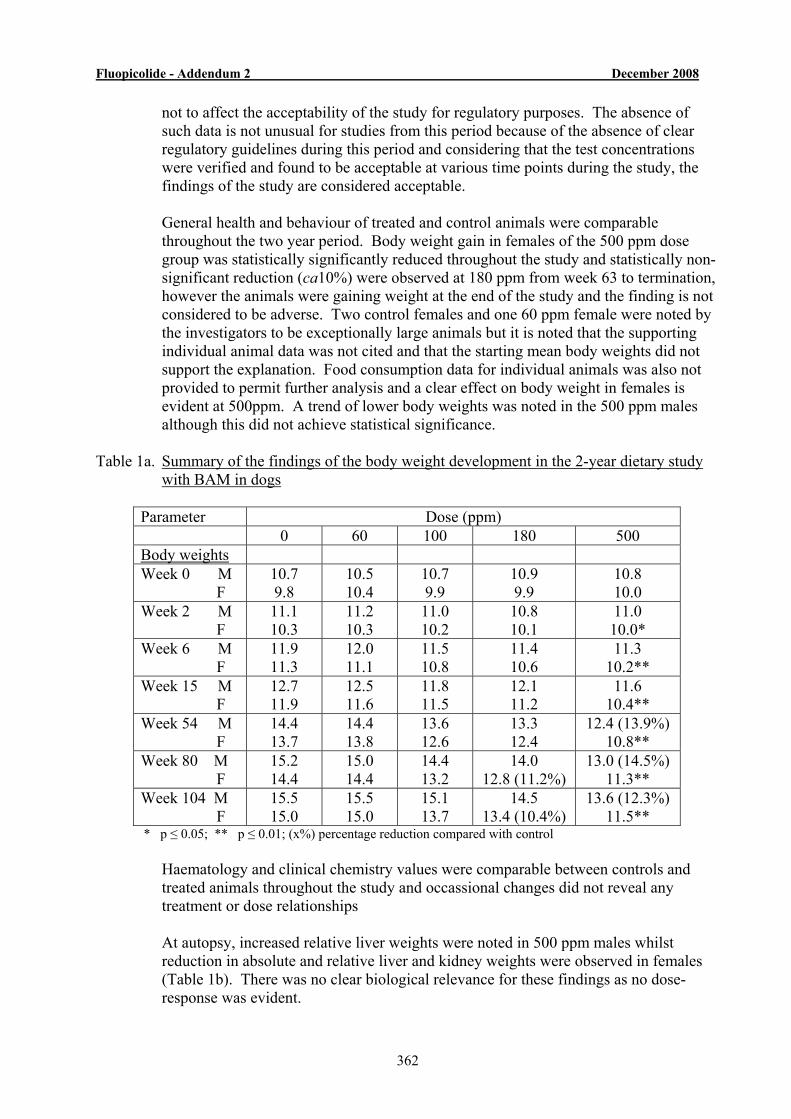
Fluopicolide - Addendum 2 December 2008
362
not to affect the acceptability of the study for regulatory purposes. The absence of such data is not unusual for studies from this period because of the absence of clear regulatory guidelines during this period and considering that the test concentrations were verified and found to be acceptable at various time points during the study, the findings of the study are considered acceptable.
General health and behaviour of treated and control animals were comparable
throughout the two year period. Body weight gain in females of the 500 ppm dose group was statistically significantly reduced throughout the study and statistically non-significant reduction (ca10%) were observed at 180 ppm from week 63 to termination, however the animals were gaining weight at the end of the study and the finding is not considered to be adverse. Two control females and one 60 ppm female were noted by the investigators to be exceptionally large animals but it is noted that the supporting individual animal data was not cited and that the starting mean body weights did not support the explanation. Food consumption data for individual animals was also not provided to permit further analysis and a clear effect on body weight in females is evident at 500ppm. A trend of lower body weights was noted in the 500 ppm males although this did not achieve statistical significance.
Table 1a. Summary of the findings of the body weight development in the 2-year dietary study
with BAM in dogs
Parameter Dose (ppm) 0 60 100 180 500 Body weights Week 0 M F
10.7 9.8
10.5 10.4
10.7 9.9
10.9 9.9
10.8 10.0
Week 2 M F
11.1 10.3
11.2 10.3
11.0 10.2
10.8 10.1
11.0 10.0*
Week 6 M F
11.9 11.3
12.0 11.1
11.5 10.8
11.4 10.6
11.3 10.2**
Week 15 M F
12.7 11.9
12.5 11.6
11.8 11.5
12.1 11.2
11.6 10.4**
Week 54 M F
14.4 13.7
14.4 13.8
13.6 12.6
13.3 12.4
12.4 (13.9%) 10.8**
Week 80 M F
15.2 14.4
15.0 14.4
14.4 13.2
14.0 12.8 (11.2%)
13.0 (14.5%) 11.3**
Week 104 M F
15.5 15.0
15.5 15.0
15.1 13.7
14.5 13.4 (10.4%)
13.6 (12.3%) 11.5**
* p ≤ 0.05; ** p ≤ 0.01; (x%) percentage reduction compared with control Haematology and clinical chemistry values were comparable between controls and
treated animals throughout the study and occassional changes did not reveal any treatment or dose relationships
At autopsy, increased relative liver weights were noted in 500 ppm males whilst
reduction in absolute and relative liver and kidney weights were observed in females (Table 1b). There was no clear biological relevance for these findings as no dose-response was evident.
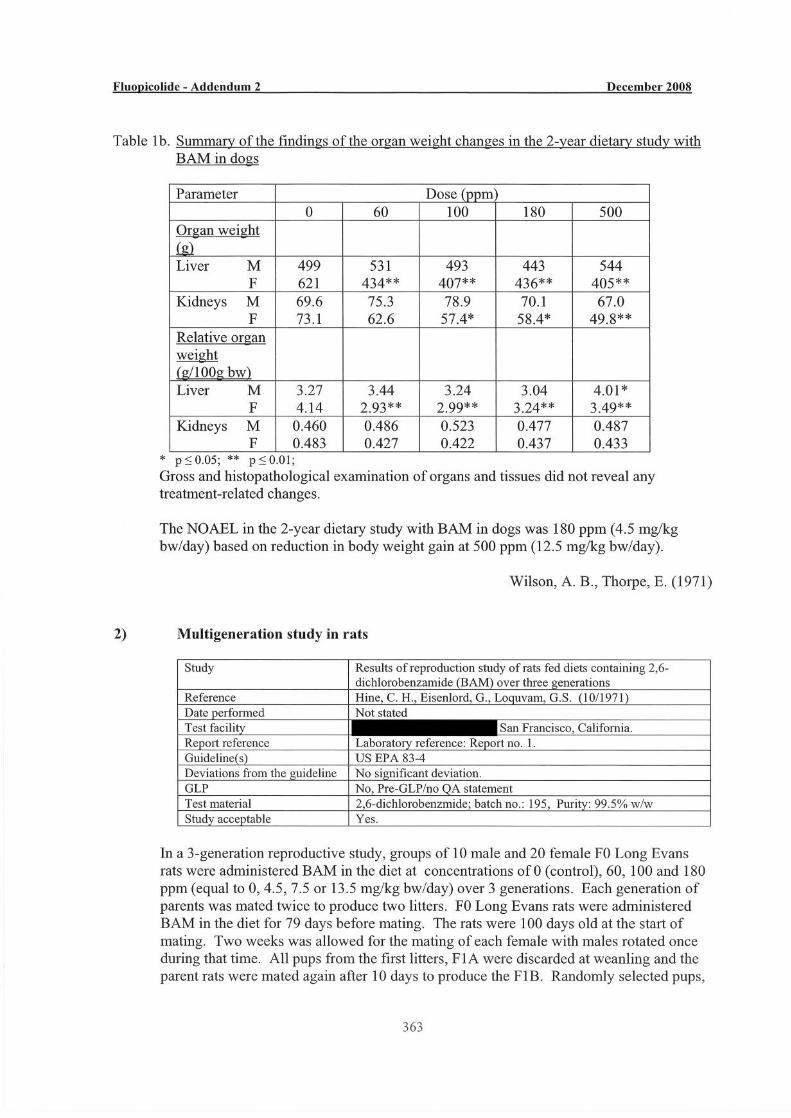
Fluopicolide - Addendum 2 December 2008
364
excluding runts from the second litters were maintained on the diets and mated in turn when 100 days old to produce the F2A and F2B litters. Randomly selected F2B were allowed to mate when 100 days old to produce the F3A and F3B litters.
The number of pups in each litter was counted on the day of birth and on the 5th day.
Litters greater than 10 were reduced to 10 on the 5th day. On day 21, the weanlings were counted and weighed and either sacrificed or saved for continuation on the diets. Parent rats were weighed, sacrificed and examined grossly when no longer required. Ten male and 10 female F3B weanlings from the control and 180 ppm dose groups and 5 males and 5 females from the 60 and 100 ppm dose groups were selected for autopsy. Individual body weights and brain, liver and kidney weights were recorded. Sections of brain, heart, lung, liver, spleen, kidney and testes were preserved for histological examination.
Statistical analysis was performed of numbers of pups, survival at 21 days, body weights
of weanlings at 21 days and weights of parent rats at time of sacrifice and relative organ weights of F3B weanlings. Dunnett’s test was applied for the comparison of treated and control animals for significance of changes. Fertility, gestation, viability and lactation indices were calculated from litter production and mortality and tested for significance using chi-square.
The study was performed pre-GLP regulations. The test substance was analysed and
found to contain BAM (99.5%), phenol (0.1%) and iron (0.21%).
The Notifier has observed that the study is of poor quality and presents several deficiencies amongst which include the absence of any individual data, the absence of measurement of several parameters to evaluate the reproductive performance (mating index, pre-coital time, pregnancy rate, length of gestation), and the absence on fetal body weight evolution from birth up to weaning. Given the laboratory that conducted the work is no longer in existence it will not be possible to get further information.
The Rapporteur considers the study is acceptable with the proviso that the limitations mentioned are considered in the assessment. A significant range of core reproductive toxicity parameters were investigated. A new study is considered unnecessary as there are no indications for further concern.
There were no treatment-related signs of toxicity or differences in behaviour and appearance during the study. Hyperexcitability was noted in a few pups of the F1B generation only and is not considered treatment-related.
Fertility was not affected by the treatment and ranged from 85 – 100% throughout the
study with no significant intergroup differences (Table 2a).
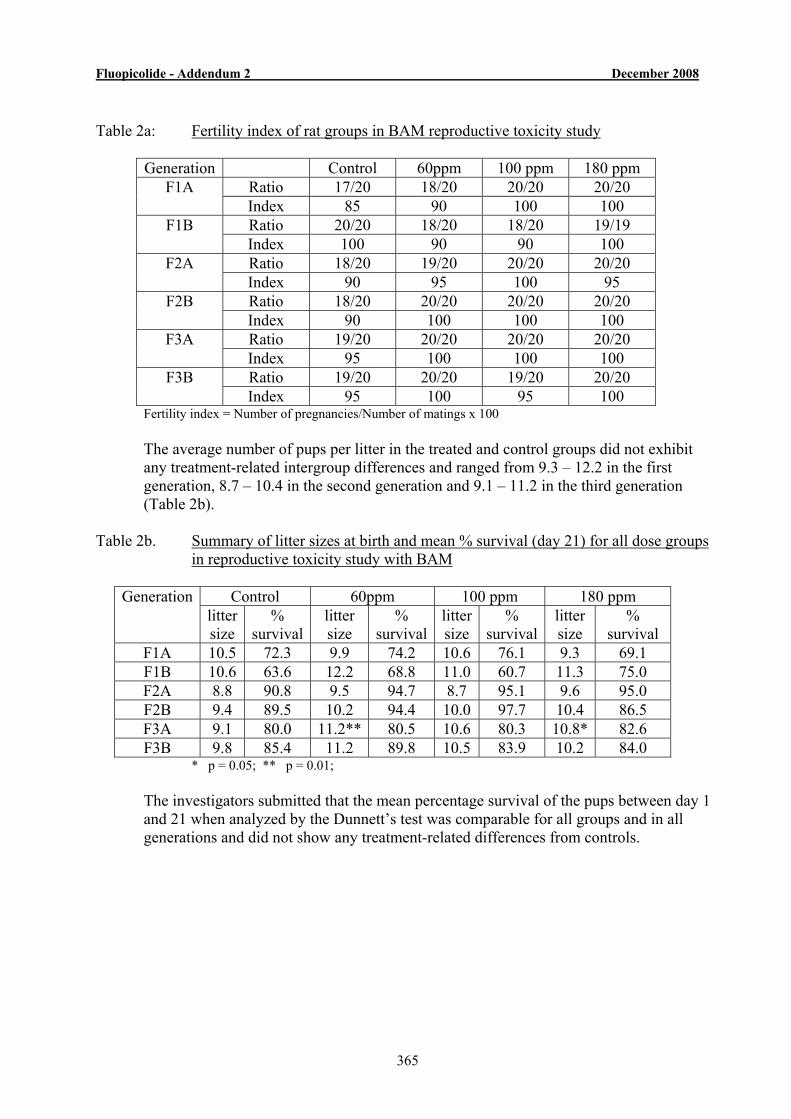
Fluopicolide - Addendum 2 December 2008
365
Table 2a: Fertility index of rat groups in BAM reproductive toxicity study
Generation Control 60ppm 100 ppm 180 ppm
Ratio 17/20 18/20 20/20 20/20 F1A Index 85 90 100 100 Ratio 20/20 18/20 18/20 19/19 F1B Index 100 90 90 100 Ratio 18/20 19/20 20/20 20/20 F2A Index 90 95 100 95 Ratio 18/20 20/20 20/20 20/20 F2B Index 90 100 100 100 Ratio 19/20 20/20 20/20 20/20 F3A Index 95 100 100 100 Ratio 19/20 20/20 19/20 20/20 F3B Index 95 100 95 100
Fertility index = Number of pregnancies/Number of matings x 100 The average number of pups per litter in the treated and control groups did not exhibit
any treatment-related intergroup differences and ranged from 9.3 – 12.2 in the first generation, 8.7 – 10.4 in the second generation and 9.1 – 11.2 in the third generation (Table 2b).
Table 2b. Summary of litter sizes at birth and mean % survival (day 21) for all dose groups
in reproductive toxicity study with BAM
Control 60ppm 100 ppm 180 ppm Generation litter size
% survival
litter size
% survival
litter size
% survival
litter size
% survival
F1A 10.5 72.3 9.9 74.2 10.6 76.1 9.3 69.1 F1B 10.6 63.6 12.2 68.8 11.0 60.7 11.3 75.0 F2A 8.8 90.8 9.5 94.7 8.7 95.1 9.6 95.0 F2B 9.4 89.5 10.2 94.4 10.0 97.7 10.4 86.5 F3A 9.1 80.0 11.2** 80.5 10.6 80.3 10.8* 82.6 F3B 9.8 85.4 11.2 89.8 10.5 83.9 10.2 84.0
* p = 0.05; ** p = 0.01; The investigators submitted that the mean percentage survival of the pups between day 1
and 21 when analyzed by the Dunnett’s test was comparable for all groups and in all generations and did not show any treatment-related differences from controls.

Fluopicolide - Addendum 2 December 2008
366
Gestation index were comparable for all dose groups and in all generations (Table 2c) Table 2c: Gestation index of rat groups in BAM reproductive toxicity study
Generation Control 60ppm 100 ppm 180 ppm
Ratio 17/17 18/18 20/20 20/20 F1A Index 100 100 100 100 Ratio 20/20 18/18 18/18 19/19 F1B Index 100 100 100 100 Ratio 18/18 19/19 20/20 19/19 F2A Index 100 100 100 100 Ratio 18/18 20/20 20/20 20/20 F2B Index 100 100 100 100 Ratio 19/19 20/20 20/20 20/20 F3A Index 100 100 100 100 Ratio 19/19 20/20 20/20 20/20 F3B Index 100 100 100 100
Gestation index = Number of litters with live pups/Number of pregnancies x 100 Viability index showed occasional statistically significance for the number of pups alive
at day 5 when investigated by the chi-test. However, these differences did not show any dose response or treatment-relationship. Although, a treatment-relationship cannot be ruled out for the observation for the F3B 180 ppm dose group, it has to be considered against the absence of any significant effect in 5 litters from the other generations and the total numbers of pups alive in the 180 ppm group (Table 2d)
Commenting on this finding, the Notifier has stated that the study report mentioned a
slight decrease in the viability index at 180 ppm in the F3b generation. However, taking into account that: there was no dose-response; there were no consistent effects across generations; the survival of pups from birth to weaning as measured by the lactation index was not affected and that this change was considered to be of very limited significance.
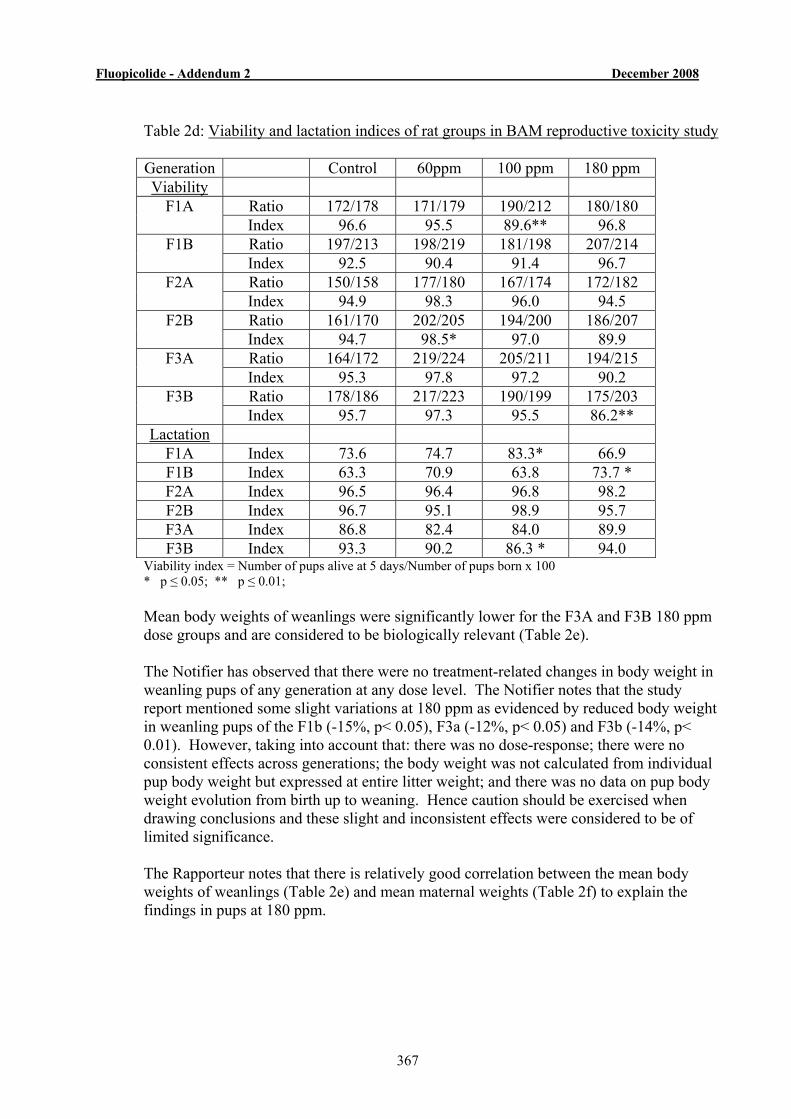
Fluopicolide - Addendum 2 December 2008
367
Table 2d: Viability and lactation indices of rat groups in BAM reproductive toxicity study
Generation Control 60ppm 100 ppm 180 ppm Viability
Ratio 172/178 171/179 190/212 180/180 F1A Index 96.6 95.5 89.6** 96.8 Ratio 197/213 198/219 181/198 207/214 F1B Index 92.5 90.4 91.4 96.7 Ratio 150/158 177/180 167/174 172/182 F2A Index 94.9 98.3 96.0 94.5 Ratio 161/170 202/205 194/200 186/207 F2B Index 94.7 98.5* 97.0 89.9 Ratio 164/172 219/224 205/211 194/215 F3A Index 95.3 97.8 97.2 90.2 Ratio 178/186 217/223 190/199 175/203 F3B Index 95.7 97.3 95.5 86.2**
Lactation F1A Index 73.6 74.7 83.3* 66.9 F1B Index 63.3 70.9 63.8 73.7 * F2A Index 96.5 96.4 96.8 98.2 F2B Index 96.7 95.1 98.9 95.7 F3A Index 86.8 82.4 84.0 89.9 F3B Index 93.3 90.2 86.3 * 94.0
Viability index = Number of pups alive at 5 days/Number of pups born x 100 * p ≤ 0.05; ** p ≤ 0.01; Mean body weights of weanlings were significantly lower for the F3A and F3B 180 ppm dose groups and are considered to be biologically relevant (Table 2e). The Notifier has observed that there were no treatment-related changes in body weight in weanling pups of any generation at any dose level. The Notifier notes that the study report mentioned some slight variations at 180 ppm as evidenced by reduced body weight in weanling pups of the F1b (-15%, p< 0.05), F3a (-12%, p< 0.05) and F3b (-14%, p< 0.01). However, taking into account that: there was no dose-response; there were no consistent effects across generations; the body weight was not calculated from individual pup body weight but expressed at entire litter weight; and there was no data on pup body weight evolution from birth up to weaning. Hence caution should be exercised when drawing conclusions and these slight and inconsistent effects were considered to be of limited significance. The Rapporteur notes that there is relatively good correlation between the mean body weights of weanlings (Table 2e) and mean maternal weights (Table 2f) to explain the findings in pups at 180 ppm.
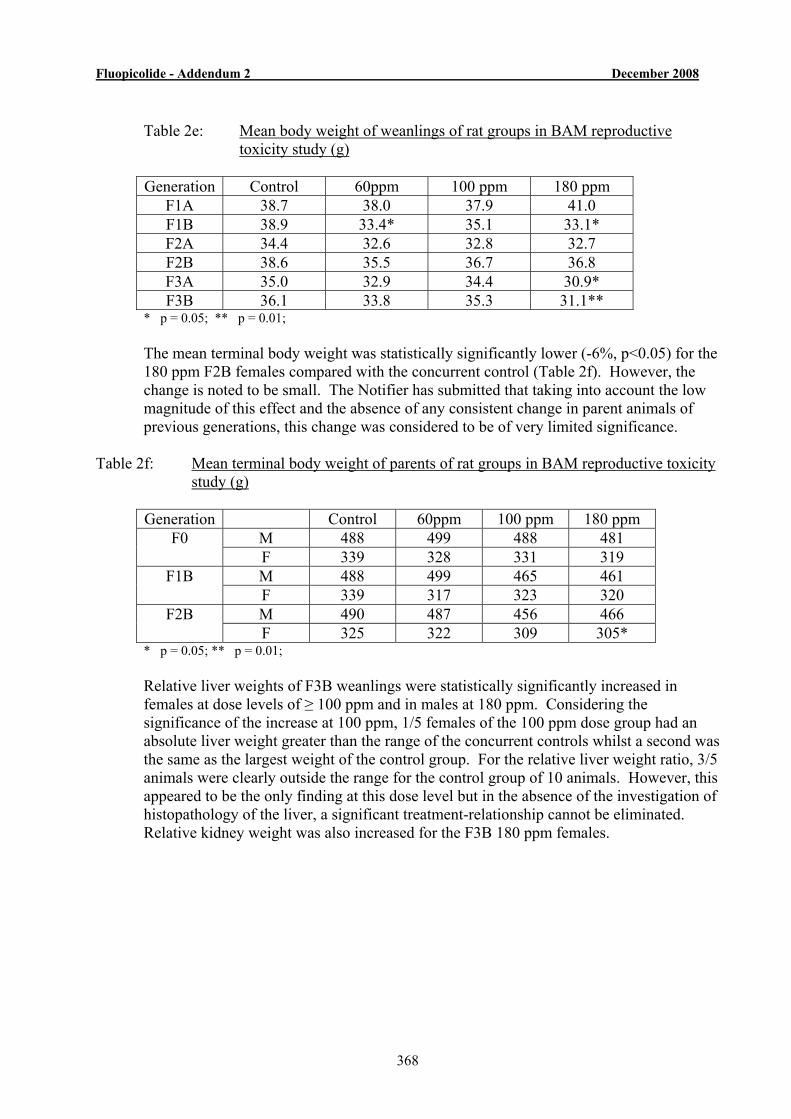
Fluopicolide - Addendum 2 December 2008
368
Table 2e: Mean body weight of weanlings of rat groups in BAM reproductive
toxicity study (g) Generation Control 60ppm 100 ppm 180 ppm
F1A 38.7 38.0 37.9 41.0 F1B 38.9 33.4* 35.1 33.1* F2A 34.4 32.6 32.8 32.7 F2B 38.6 35.5 36.7 36.8 F3A 35.0 32.9 34.4 30.9* F3B 36.1 33.8 35.3 31.1**
* p = 0.05; ** p = 0.01; The mean terminal body weight was statistically significantly lower (-6%, p<0.05) for the
180 ppm F2B females compared with the concurrent control (Table 2f). However, the change is noted to be small. The Notifier has submitted that taking into account the low magnitude of this effect and the absence of any consistent change in parent animals of previous generations, this change was considered to be of very limited significance.
Table 2f: Mean terminal body weight of parents of rat groups in BAM reproductive toxicity
study (g)
Generation Control 60ppm 100 ppm 180 ppm M 488 499 488 481 F0 F 339 328 331 319 M 488 499 465 461 F1B F 339 317 323 320 M 490 487 456 466 F2B F 325 322 309 305*
* p = 0.05; ** p = 0.01; Relative liver weights of F3B weanlings were statistically significantly increased in
females at dose levels of ≥ 100 ppm and in males at 180 ppm. Considering the significance of the increase at 100 ppm, 1/5 females of the 100 ppm dose group had an absolute liver weight greater than the range of the concurrent controls whilst a second was the same as the largest weight of the control group. For the relative liver weight ratio, 3/5 animals were clearly outside the range for the control group of 10 animals. However, this appeared to be the only finding at this dose level but in the absence of the investigation of histopathology of the liver, a significant treatment-relationship cannot be eliminated. Relative kidney weight was also increased for the F3B 180 ppm females.
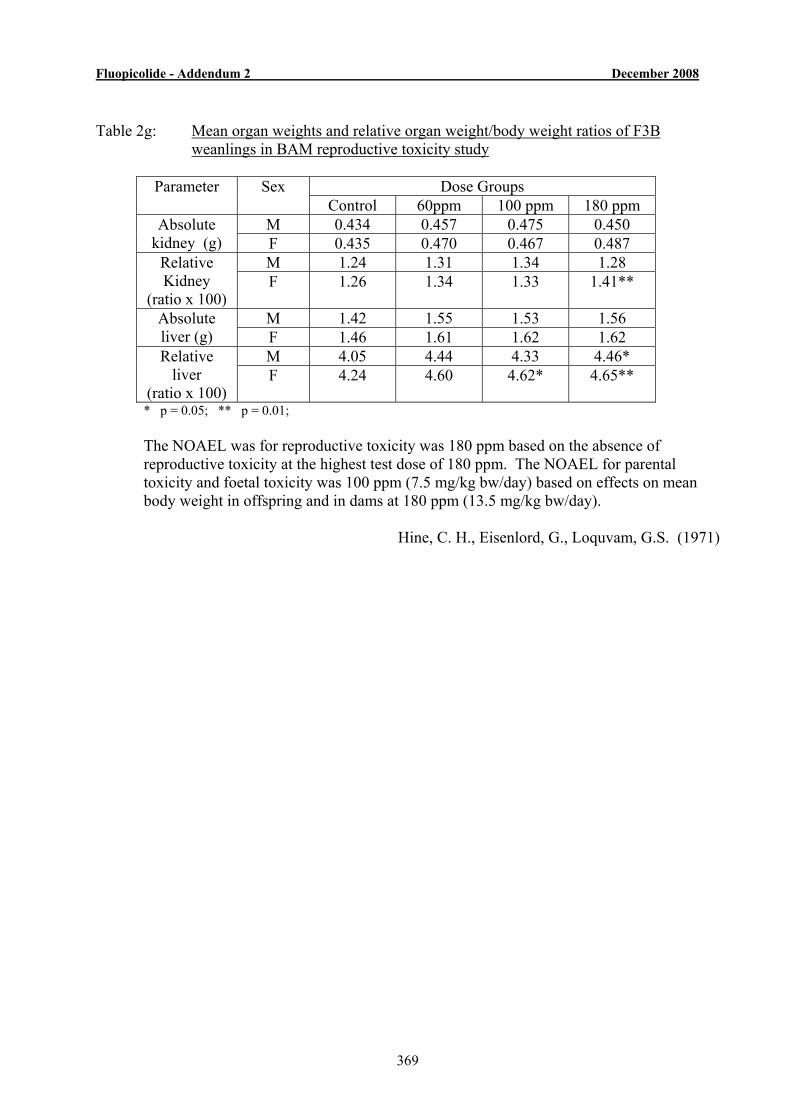
Fluopicolide - Addendum 2 December 2008
369
Table 2g: Mean organ weights and relative organ weight/body weight ratios of F3B
weanlings in BAM reproductive toxicity study
Dose Groups Parameter Sex Control 60ppm 100 ppm 180 ppm
M 0.434 0.457 0.475 0.450 Absolute kidney (g) F 0.435 0.470 0.467 0.487
M 1.24 1.31 1.34 1.28 Relative Kidney
(ratio x 100) F 1.26 1.34 1.33 1.41**
M 1.42 1.55 1.53 1.56 Absolute liver (g) F 1.46 1.61 1.62 1.62
M 4.05 4.44 4.33 4.46* Relative liver
(ratio x 100) F 4.24 4.60 4.62* 4.65**
* p = 0.05; ** p = 0.01; The NOAEL was for reproductive toxicity was 180 ppm based on the absence of
reproductive toxicity at the highest test dose of 180 ppm. The NOAEL for parental toxicity and foetal toxicity was 100 ppm (7.5 mg/kg bw/day) based on effects on mean body weight in offspring and in dams at 180 ppm (13.5 mg/kg bw/day).
Hine, C. H., Eisenlord, G., Loquvam, G.S. (1971)
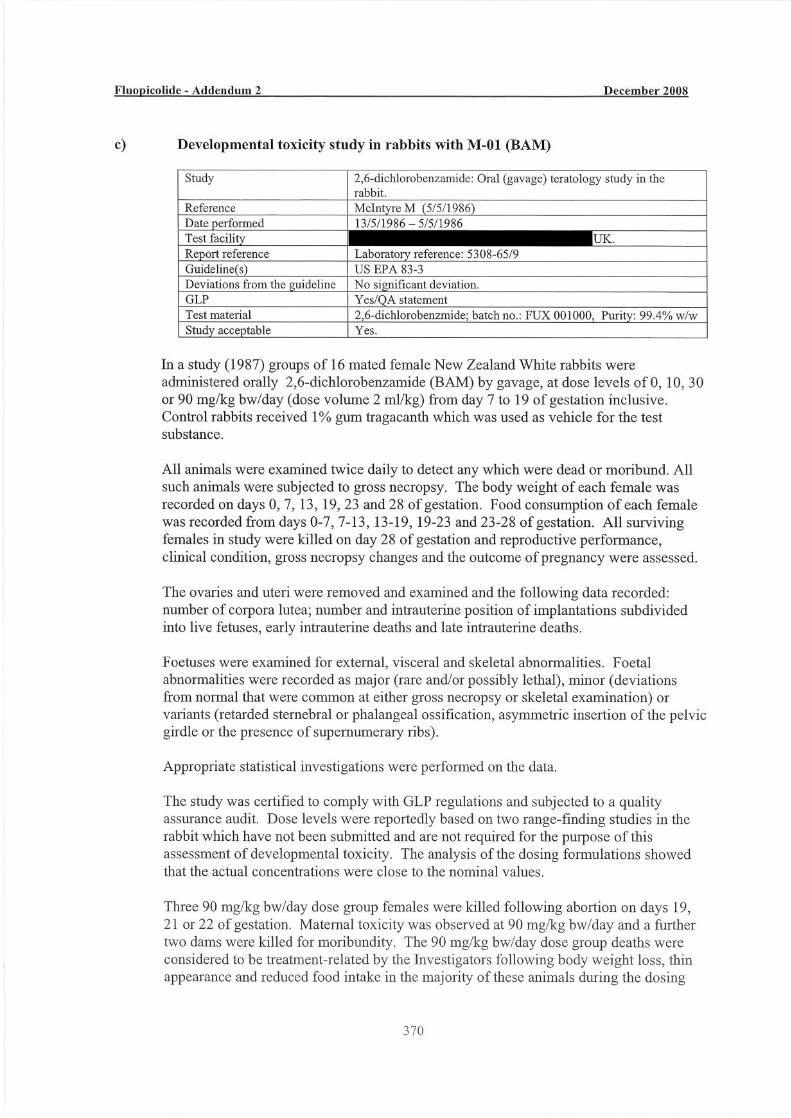
Fluopicolide - Addendum 2 December 2008
371
period. However, no consistent treatment-related macroscopic changes were observed at examination post-mortem.
In the 30 mg/kg bw/day dose group, 2 females were killed for moribundity on days 12
and 14 of gestation. The Investigators noted that although a treatment-relationship could not be entirely excluded, it was considered unlikely as similar incidences of mortality were observed in the concurrent control group and similar mortalities have previously been recorded in this strain of rabbit in these laboratories. No consistent, treatment-related findings were recorded at necropsy in these animals.
However, it is noted that the pattern of reduced food consumption, thin appearance
(reported for at least one of the two deaths at 30 mg/kg bw/day) and fur staining prior to death is consistent for deaths and moribundity in all dose groups. Animals which aborted also showed lower body weights reduced food intake and or fur staining and there appears to be no clear basis for the exclusion of a treatment-relationship for the 30 mg/kg bw/day dose group other than on a comparison of incidences. The summary of body weights and food consumption across dose groups suggests that toxicity resulting in effects on body weight and food consumption was only apparent in the top dose group (Table 3.1).
One control female was killed following abortion on day 20 of gestation and a further
female was killed for moribundity following deterioration in physical condition on day 24 of gestation. Both control animals showed reduced food consumption before termination. One 10 mg/kg bw/day dose group female was killed following abortion on day 23 of gestation.
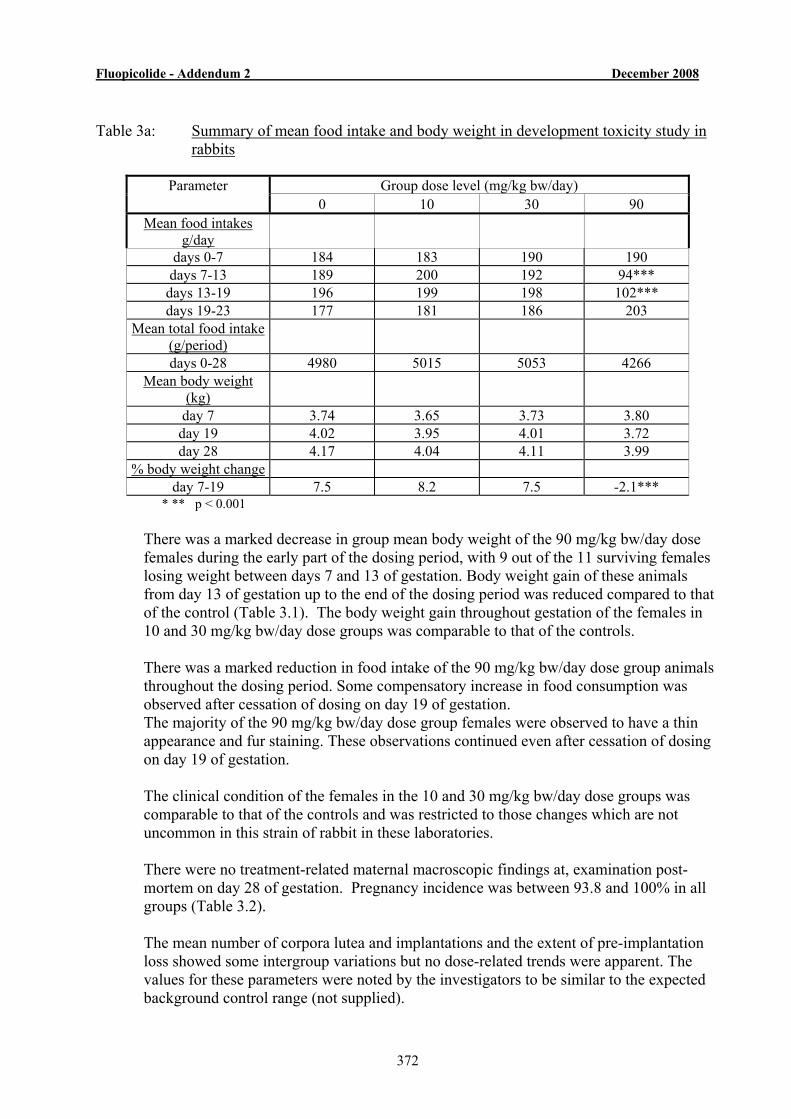
Fluopicolide - Addendum 2 December 2008
372
Table 3a: Summary of mean food intake and body weight in development toxicity study in
rabbits
Group dose level (mg/kg bw/day) Parameter 0 10 30 90
Mean food intakes g/day
days 0-7 184 183 190 190 days 7-13 189 200 192 94***
days 13-19 196 199 198 102*** days 19-23 177 181 186 203
Mean total food intake (g/period)
days 0-28 4980 5015 5053 4266 Mean body weight
(kg)
day 7 3.74 3.65 3.73 3.80 day 19 4.02 3.95 4.01 3.72 day 28 4.17 4.04 4.11 3.99
% body weight change day 7-19 7.5 8.2 7.5 -2.1***
* ** p < 0.001 There was a marked decrease in group mean body weight of the 90 mg/kg bw/day dose
females during the early part of the dosing period, with 9 out of the 11 surviving females losing weight between days 7 and 13 of gestation. Body weight gain of these animals from day 13 of gestation up to the end of the dosing period was reduced compared to that of the control (Table 3.1). The body weight gain throughout gestation of the females in 10 and 30 mg/kg bw/day dose groups was comparable to that of the controls.
There was a marked reduction in food intake of the 90 mg/kg bw/day dose group animals
throughout the dosing period. Some compensatory increase in food consumption was observed after cessation of dosing on day 19 of gestation.
The majority of the 90 mg/kg bw/day dose group females were observed to have a thin appearance and fur staining. These observations continued even after cessation of dosing on day 19 of gestation.
The clinical condition of the females in the 10 and 30 mg/kg bw/day dose groups was
comparable to that of the controls and was restricted to those changes which are not uncommon in this strain of rabbit in these laboratories.
There were no treatment-related maternal macroscopic findings at, examination post-
mortem on day 28 of gestation. Pregnancy incidence was between 93.8 and 100% in all groups (Table 3.2).
The mean number of corpora lutea and implantations and the extent of pre-implantation
loss showed some intergroup variations but no dose-related trends were apparent. The values for these parameters were noted by the investigators to be similar to the expected background control range (not supplied).
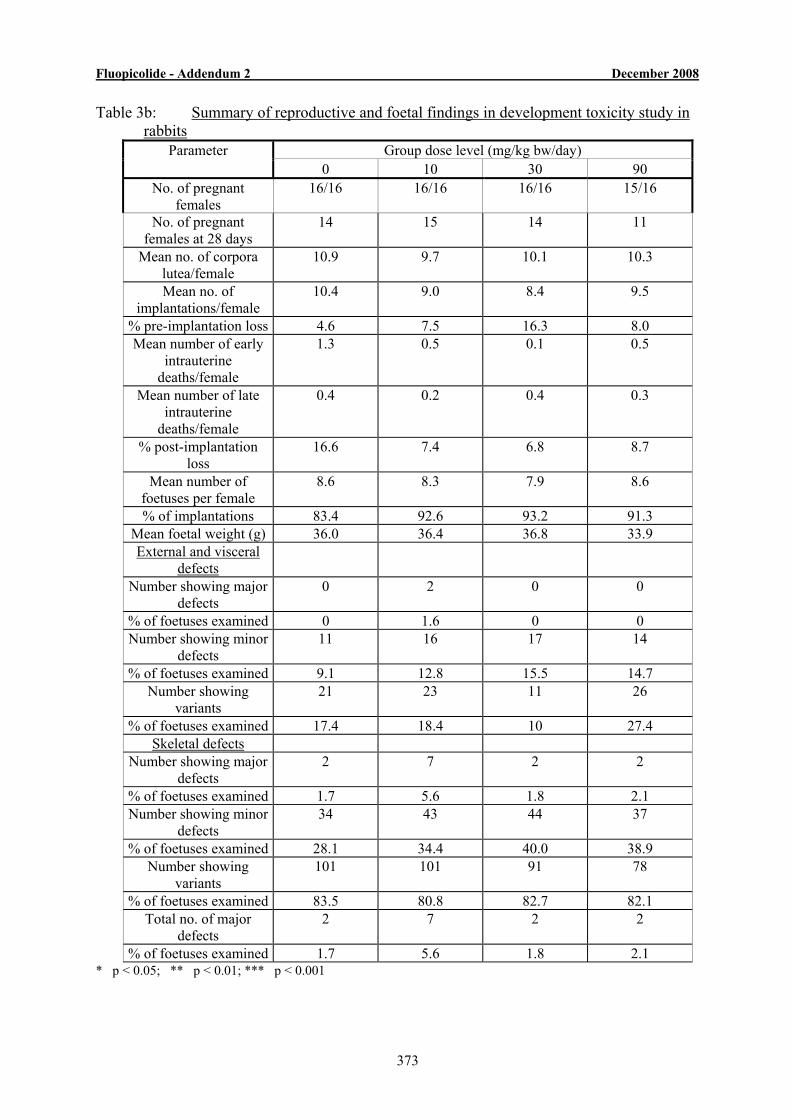
Fluopicolide - Addendum 2 December 2008
373
Table 3b: Summary of reproductive and foetal findings in development toxicity study in rabbits
Group dose level (mg/kg bw/day) Parameter 0 10 30 90
No. of pregnant females
16/16 16/16 16/16 15/16
No. of pregnant females at 28 days
14 15 14 11
Mean no. of corpora lutea/female
10.9 9.7 10.1 10.3
Mean no. of implantations/female
10.4 9.0 8.4 9.5
% pre-implantation loss 4.6 7.5 16.3 8.0 Mean number of early
intrauterine deaths/female
1.3 0.5 0.1 0.5
Mean number of late intrauterine
deaths/female
0.4 0.2 0.4 0.3
% post-implantation loss
16.6 7.4 6.8 8.7
Mean number of foetuses per female
8.6 8.3 7.9 8.6
% of implantations 83.4 92.6 93.2 91.3 Mean foetal weight (g) 36.0 36.4 36.8 33.9 External and visceral
defects
Number showing major defects
0 2 0 0
% of foetuses examined 0 1.6 0 0 Number showing minor
defects 11 16 17 14
% of foetuses examined 9.1 12.8 15.5 14.7 Number showing
variants 21 23 11 26
% of foetuses examined 17.4 18.4 10 27.4 Skeletal defects
Number showing major defects
2 7 2 2
% of foetuses examined 1.7 5.6 1.8 2.1 Number showing minor
defects 34 43 44 37
% of foetuses examined 28.1 34.4 40.0 38.9 Number showing
variants 101 101 91 78
% of foetuses examined 83.5 80.8 82.7 82.1 Total no. of major
defects 2 7 2 2
% of foetuses examined 1.7 5.6 1.8 2.1 * p < 0.05; ** p < 0.01; *** p < 0.001
Fluopicolide - Addendum 2 December 2008
375
health food consumption and body weight gain. Laboratory investigations for haematology and plasma clinical chemistry investigations were performed throughout the study. Liver function tests were performed during the treatment period on control and top dose animals.
Haematological examination included of haemoglobin content, packed cell volume,
erythrocyte, leucocyte and differential leucocyte counts. Clinical chemistry tests included of bromosulphthalein clearance, serum protein, urea, glutamic pyruvic transaminase actvity and plasma alkaline phosphatase activity.
All surviving animals were sacrificed after the treatment period and were subjected to
gross pathology, organ weight measurements and histopathology of a wide range of organs and tissues was performed.
Statistical analyses of terminal body weight and organ weights were performed using
intial body weight as covariate in covariance analysis. Haematology and clinical chemistry measurements were examined using analysis of variance.
The study was performed pre-GLP requirements and was not quality assured.
Homogeneity and stability of the test substance in the diet was not reported. Verification of the test concentration in the diet was not reported or performed. Diets for the dose groups were prepared from concentrates after pre-dissolving the test sample in acetone. Concentrates were well mixed until considered homogenous with a mixer and the solvent was allowed to evaporate. The control diet was also pre-mixed with an equal quantity of acetone. Diets were prepared every 4 weeks.
In a range-finding acute toxicity study, 2 male dogs were administered orally 500
mg/kg bw BAM in a capsule. One male dog received 100 mg/kg bw dose in the same manner . The dogs were observed for 72 h, killed and autopsied. Within 1h of dosing , the 500 mg/kg bw animals showed a lack of coordination in their gait which progressed to inability to rise within 2 h. However, within 24 h, complete recovery was reported without any further information about the intervening period. No effects were seen at 100 mg/kg bw. Post-mortem examination did not reveal any treatment-related findings.
In the 13-week study, observations on health and food intake did not reveal any
treatment-related findings. In the 2000 ppm dose group, loss of condition, thin dull lifeless coat and loss of hair was observed from week 4 onwards but food consumption was not affected.
The mean body weights of the 2,000 ppm dose group were lower than those of the
other treatments. This decrease in body weight was observed in males by the third week and in females by the fifth week of treatment.
Haematology in males showed no evidence of any treatment-related effect The increased haemoglobin in the 2,000 ppm dose group after 13 weeks exposure was due to one animal and was not considered of any toxicological significance. ln females, a decreased packed cell volume in the 2,000 ppm group was observed during the 13 weeks of exposure.
Fluopicolide - Addendum 2 December 2008
376
Clinical chemistry parameters in males did not show any treatment-relationship. However, in females the only apparent treatment-related change was increase in alkaline phosphatase in the 2000 ppm dose group. Liver function test measuring bromosulphthalein clearance rate did not show any significant treatment-related differences.
Urinalysis showed all samples to be normal and no evidence of intergroup differences
were observed. In the 2,000 ppm group, the terminal body weight of both sexes was decreased and the
liver weight of the females increased, while in the 300 ppm dose group females both liver and left kidney weights were statistically significantly increased but the biological significance was unclear.
Microscopic examination of tissues taken at autopsy were reported to be normal with
no evidence of structural changes. Findings suggested by the investigators to be related to parasitic infection included granulomas of the lungs, liver and kidneys with incidences unrelated to dose, interstitial nephritis and pneumonitis described as resulting from “mild spontaneous disease present in animals”. These observations emphasise the limitations of this study for toxicological risk assessment
The NOAEL in the 13-week dietary study in dogs was 300 ppm (22.5 mg/kg bw/day)
based on clinical signs in males and females including thin appearance, dull coat, and hair loss, decreased body weight gain in males and females, and increased liver weight and serum alkaline phosphatase concentrations in females only at 2000 ppm (150 mg/kg bw/day)
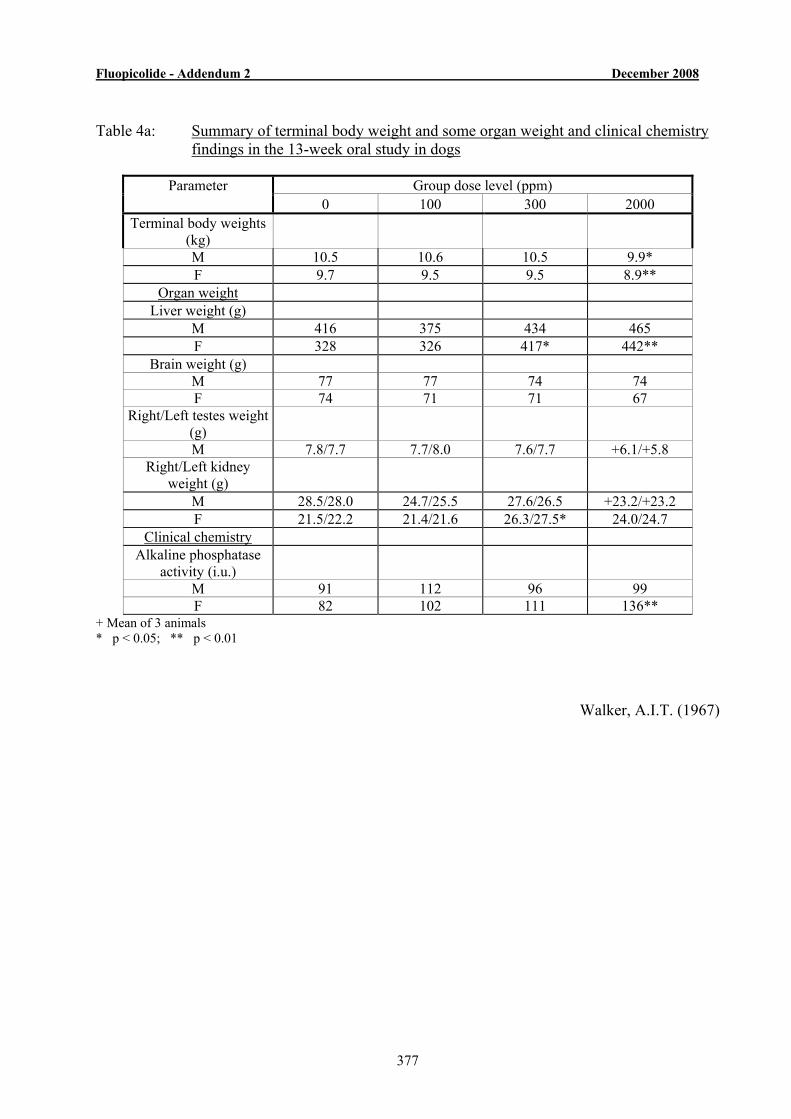
Fluopicolide - Addendum 2 December 2008
377
Table 4a: Summary of terminal body weight and some organ weight and clinical chemistry
findings in the 13-week oral study in dogs
Group dose level (ppm) Parameter 0 100 300 2000
Terminal body weights (kg)
M 10.5 10.6 10.5 9.9* F 9.7 9.5 9.5 8.9**
Organ weight Liver weight (g)
M 416 375 434 465 F 328 326 417* 442**
Brain weight (g) M 77 77 74 74 F 74 71 71 67
Right/Left testes weight (g)
M 7.8/7.7 7.7/8.0 7.6/7.7 +6.1/+5.8 Right/Left kidney
weight (g)
M 28.5/28.0 24.7/25.5 27.6/26.5 +23.2/+23.2 F 21.5/22.2 21.4/21.6 26.3/27.5* 24.0/24.7
Clinical chemistry Alkaline phosphatase
activity (i.u.)
M 91 112 96 99 F 82 102 111 136**
+ Mean of 3 animals * p < 0.05; ** p < 0.01
Walker, A.I.T. (1967)
Fluopicolide - Addendum 2 December 2008
378
Part 2: OVERVIEW OF THE METABOLISM AND TOXICITY DATA ON THE METABOLITE M-01 (BAM)
The Notifier has submitted a range of bridging studies and an argued case for the
equivalence in toxicity of BAM and Fluopicolide considering all relevant studies available in the original DAR and additional studies summarised in this Addendum at Appendix 2 (Leake et al, 2008, report no. M-300114-01-1, title ‘The non-relevance of the fluopicolide metabolite M01 (AE C653711): 2,6-dichlorobenzamide (also known as BAM))’. The Rapporteur has assessed the case for the equivalence in toxicity of BAM and Fluopicolide.
Full details of these studies, as presented in the DAR, can be found in Appendix 2. ADME Following single oral administration of [14C]-M-01 to the male and female rat at the
rates of 10 and 150 mg/kg most of the administered radioactivity was eliminated in the urine (ca 82 %dose) although the rate of elimination was relatively slow. Lower levels (ca 13 % dose) were eliminated via the faeces. The highest concentrations in tissues were seen in the kidney (ca 0.57 µg equiv./g) and liver (ca 0.44 µg equiv./g) for the 10mg/kg dose group and in the skin & fur (3.8 to 5.0 µg equiv./g), kidneys (2.8 to 3.0 µg equiv./g) and liver (2.1 to 2.3 µg equiv./g) for the 150 mg/kg dose group. Tissue concentrations therefore increased by approximately five-fold for a fifteen-fold increase in dose rate. Overall, multiple dosing (14 daily doses at 10 mg/kg) did not have any significant impact on the absorption, distribution, metabolism and elimination compared to results after single oral dosing. Thus, the results in this study showed that the routes and the rates of excretion were maintained despite the multiple dosing, which meant that most of the radioactivity was eliminated via the urinary route. The distribution pattern in the tissues was also similar between single and multiple dosing with the highest mean concentrations observed in the skin & fur (3.0 µg equiv./g), kidney (1.9 µg equiv./g) and liver (1.3 µg equiv./g). Bioretention or accumulation was therefore not indicated. The routes of biotransformation were similar between dose levels and sexes with hydrolysis of the amide group to form AE C416656, hydroxylation to form hydroxy-BAM (M-04) and subsequent conjugation with either glucuronic acid or sulphate, and the loss of a chlorine atom following glutathione conjugation. Further metabolism of the glutathione group to the mercapturic acid or S-methyl metabolites was observed.
ACUTE TOXICITY M-01 was shown to be of relatively low acute oral toxicity. In a study by the acute
toxic class method, the acute oral LD50 of M-01 was 2000 mg/kg bw in males and 500 mg/kg bw in females. According to the OECD 423 guideline, M-01 should be classified as harmful if swallowed. In an older, pre-GLP but acceptable study, the LD50 values with 95% confidence levels were calculated after a 14-day observation period to be 1470 (951–2270) and 2330 (1430–3780) mg/kg bw for male and female rats, respectively. In the older study, toxicity to females was less than in males. M-01 qualifies for an Xn classification according to the current European directive. It is notable that this metabolite is of greater acute oral toxicity than the parent, fluopicolide (LD50 > 5000 mg/kg bw), but not particularly hazardous in absolute terms. However,
Fluopicolide - Addendum 2 December 2008
379
this difference in toxicity between Fluopicolide and BAM for acute toxicity is not considered relevant under the groundwater metabolite assessment guidance because BAM is not classified as TOXIC nor is Fluopicolide.
MUTAGENICITY/GENOTOXOCITY The genotoxicity profile of M-01 was assessed in three in vitro and one in vivo assays
and no evidence of genotoxicity was observed in any assays. The in vitro studies were the bacterial gene mutation assay in bacterial cells, V79/HPRT gene locus assay, and unscheduled DNA synthesis assay and the mouse micronucleus assay in vivo. BAM is not considered to be a genotoxic compound.
SUBACUTE/SUBCHRONIC TOXICITY In a 13-week toxicity study performed in CD rats with M-01 at doses up to 2300 ppm,
reduced body weight gains and food consumption was observed at dose levels of ≥ 600 ppm (49 mg/kg bw/day) but no target organ toxicity was observed. The NOAEL of M-01 was 180 ppm (equivalent to 14 mg/kg bw/day) in males and females based on decreased body weight gain (M), food intake and clinical signs (M&F). In a 90-day study in dogs, the NOAEL was 300 ppm (equivalent 22.5 mg/kg bw/day) based on clinical signs (thin appearance, dull coat, hair loss) and increased liver weight and serum alkaline phosphatase concentrations (F) at dose levels of 2000 ppm (equivalent 150 mg/kg bw/day). However, this study is noted to be unreliable for regulatory purposes considering significant infestation with ascariasis. In a 2-year dietary study in dogs, the NOAEL was 4.5 mg/kg bw/day based on decreased body weight and body weight gain at the higher dose level of 12.5 mg/kg bw/day
CARCINOGENICITY In a carcinogenicity study performed in CD rats with M-01 at doses up to 500 ppm, the
liver as the principal target organ with a slightly increased incidence (of non statistical significance) of hepatocellular adenoma in females at 500 ppm. No carcinogenic effect was seen after a 2-year treatment with M-01. The NOAEL was (180 ppm) 5.7 mg/kg bw/day in males and 8.6 mg/kg bw/day in females. It was agreed at PRAPeR 39 (10– 13 12.2007) that neither for fluopicolide nor for metabolite M01 should be classified for carcinogenicity.
REPRODUCTION/DEVELOPMENTAL TOXICITY
In a multigeneration study, the NOAEL for reproductive toxicity was 180 ppm based on the absence of reproductive toxicity at the highest test dose of 180 ppm. The NOAEL for parental toxicity and foetal toxicity was 100 ppm (7.5 mg/kg bw/day) based on effects on mean body weight in offspring and in dams at 180 ppm (13.5 mg/kg bw/day. In a developmental toxicity study in rabbits, the NOAEL for maternal toxicity was 30 mg/kg bw/day based on maternal deaths and increased incidence of abortions most likely a consequence of body weight loss at 90 mg/kg bw/day and for foetotoxicity 30 mg/kg bw/day based on statistically non-significant reduction in foetal birth weights at
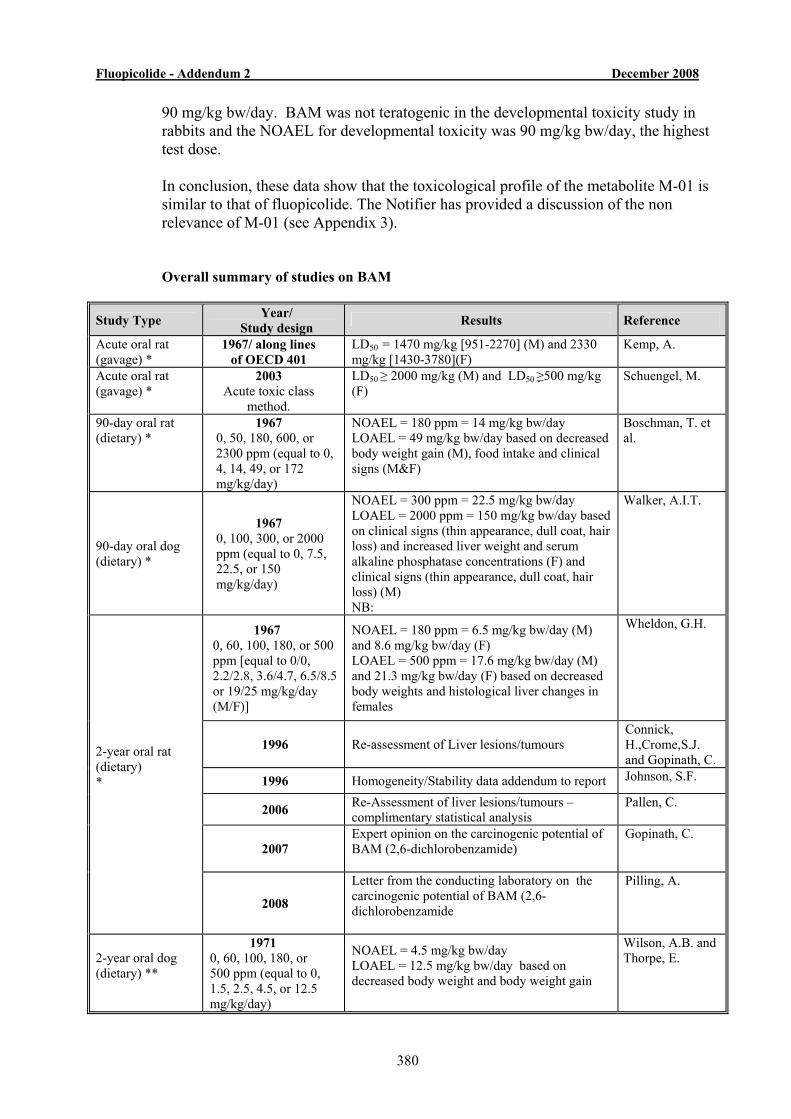
Fluopicolide - Addendum 2 December 2008
380
90 mg/kg bw/day. BAM was not teratogenic in the developmental toxicity study in rabbits and the NOAEL for developmental toxicity was 90 mg/kg bw/day, the highest test dose.
In conclusion, these data show that the toxicological profile of the metabolite M-01 is
similar to that of fluopicolide. The Notifier has provided a discussion of the non relevance of M-01 (see Appendix 3).
Overall summary of studies on BAM
Study Type Year/ Study design Results Reference
Acute oral rat (gavage) *
1967/ along lines of OECD 401
LD50 = 1470 mg/kg [951-2270] (M) and 2330 mg/kg [1430-3780](F)
Kemp, A.
Acute oral rat (gavage) *
2003 Acute toxic class
method.
LD50 ≥ 2000 mg/kg (M) and LD50 ≥500 mg/kg (F)
Schuengel, M.
90-day oral rat (dietary) *
1967 0, 50, 180, 600, or 2300 ppm (equal to 0, 4, 14, 49, or 172 mg/kg/day)
NOAEL = 180 ppm = 14 mg/kg bw/day LOAEL = 49 mg/kg bw/day based on decreased body weight gain (M), food intake and clinical signs (M&F)
Boschman, T. et al.
90-day oral dog (dietary) *
1967 0, 100, 300, or 2000 ppm (equal to 0, 7.5, 22.5, or 150 mg/kg/day)
NOAEL = 300 ppm = 22.5 mg/kg bw/day LOAEL = 2000 ppm = 150 mg/kg bw/day based on clinical signs (thin appearance, dull coat, hair loss) and increased liver weight and serum alkaline phosphatase concentrations (F) and clinical signs (thin appearance, dull coat, hair loss) (M) NB:
Walker, A.I.T.
1967 0, 60, 100, 180, or 500 ppm [equal to 0/0, 2.2/2.8, 3.6/4.7, 6.5/8.5 or 19/25 mg/kg/day (M/F)]
NOAEL = 180 ppm = 6.5 mg/kg bw/day (M) and 8.6 mg/kg bw/day (F) LOAEL = 500 ppm = 17.6 mg/kg bw/day (M) and 21.3 mg/kg bw/day (F) based on decreased body weights and histological liver changes in females
Wheldon, G.H.
1996 Re-assessment of Liver lesions/tumours Connick, H.,Crome,S.J. and Gopinath, C.
1996 Homogeneity/Stability data addendum to report Johnson, S.F.
2006 Re-Assessment of liver lesions/tumours – complimentary statistical analysis
Pallen, C.
2007 Expert opinion on the carcinogenic potential of BAM (2,6-dichlorobenzamide)
Gopinath, C.
2-year oral rat (dietary) *
2008
Letter from the conducting laboratory on the carcinogenic potential of BAM (2,6-dichlorobenzamide
Pilling, A.
2-year oral dog (dietary) **
1971 0, 60, 100, 180, or 500 ppm (equal to 0, 1.5, 2.5, 4.5, or 12.5 mg/kg/day)
NOAEL = 4.5 mg/kg bw/day LOAEL = 12.5 mg/kg bw/day based on decreased body weight and body weight gain
Wilson, A.B. and Thorpe, E.
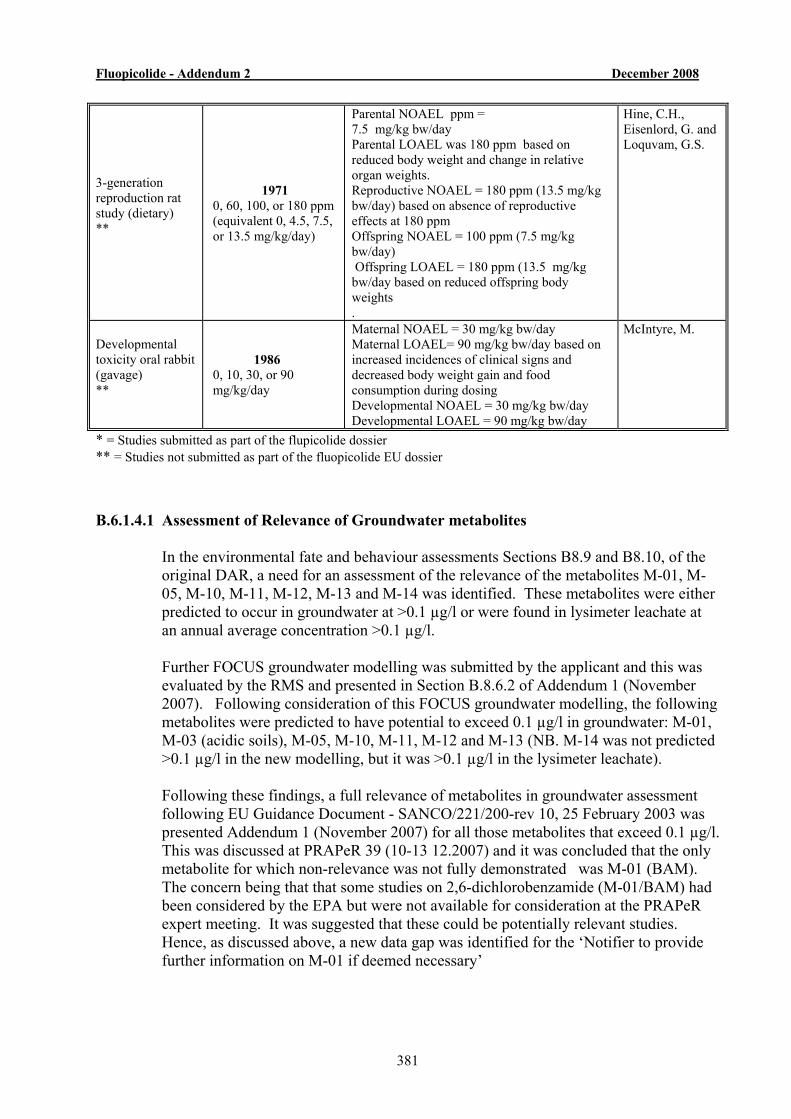
Fluopicolide - Addendum 2 December 2008
381
3-generation reproduction rat study (dietary) **
1971 0, 60, 100, or 180 ppm (equivalent 0, 4.5, 7.5, or 13.5 mg/kg/day)
Parental NOAEL ppm = 7.5 mg/kg bw/day Parental LOAEL was 180 ppm based on reduced body weight and change in relative organ weights. Reproductive NOAEL = 180 ppm (13.5 mg/kg bw/day) based on absence of reproductive effects at 180 ppm Offspring NOAEL = 100 ppm (7.5 mg/kg bw/day) Offspring LOAEL = 180 ppm (13.5 mg/kg bw/day based on reduced offspring body weights .
Hine, C.H., Eisenlord, G. and Loquvam, G.S.
Developmental toxicity oral rabbit (gavage) **
1986 0, 10, 30, or 90 mg/kg/day
Maternal NOAEL = 30 mg/kg bw/day Maternal LOAEL= 90 mg/kg bw/day based on increased incidences of clinical signs and decreased body weight gain and food consumption during dosing Developmental NOAEL = 30 mg/kg bw/day Developmental LOAEL = 90 mg/kg bw/day
McIntyre, M.
* = Studies submitted as part of the flupicolide dossier ** = Studies not submitted as part of the fluopicolide EU dossier B.6.1.4.1 Assessment of Relevance of Groundwater metabolites
In the environmental fate and behaviour assessments Sections B8.9 and B8.10, of the
original DAR, a need for an assessment of the relevance of the metabolites M-01, M-05, M-10, M-11, M-12, M-13 and M-14 was identified. These metabolites were either predicted to occur in groundwater at >0.1 µg/l or were found in lysimeter leachate at an annual average concentration >0.1 µg/l. Further FOCUS groundwater modelling was submitted by the applicant and this was evaluated by the RMS and presented in Section B.8.6.2 of Addendum 1 (November 2007). Following consideration of this FOCUS groundwater modelling, the following metabolites were predicted to have potential to exceed 0.1 µg/l in groundwater: M-01, M-03 (acidic soils), M-05, M-10, M-11, M-12 and M-13 (NB. M-14 was not predicted >0.1 µg/l in the new modelling, but it was >0.1 µg/l in the lysimeter leachate). Following these findings, a full relevance of metabolites in groundwater assessment following EU Guidance Document - SANCO/221/200-rev 10, 25 February 2003 was presented Addendum 1 (November 2007) for all those metabolites that exceed 0.1 µg/l. This was discussed at PRAPeR 39 (10-13 12.2007) and it was concluded that the only metabolite for which non-relevance was not fully demonstrated was M-01 (BAM). The concern being that that some studies on 2,6-dichlorobenzamide (M-01/BAM) had been considered by the EPA but were not available for consideration at the PRAPeR expert meeting. It was suggested that these could be potentially relevant studies. Hence, as discussed above, a new data gap was identified for the ‘Notifier to provide further information on M-01 if deemed necessary’
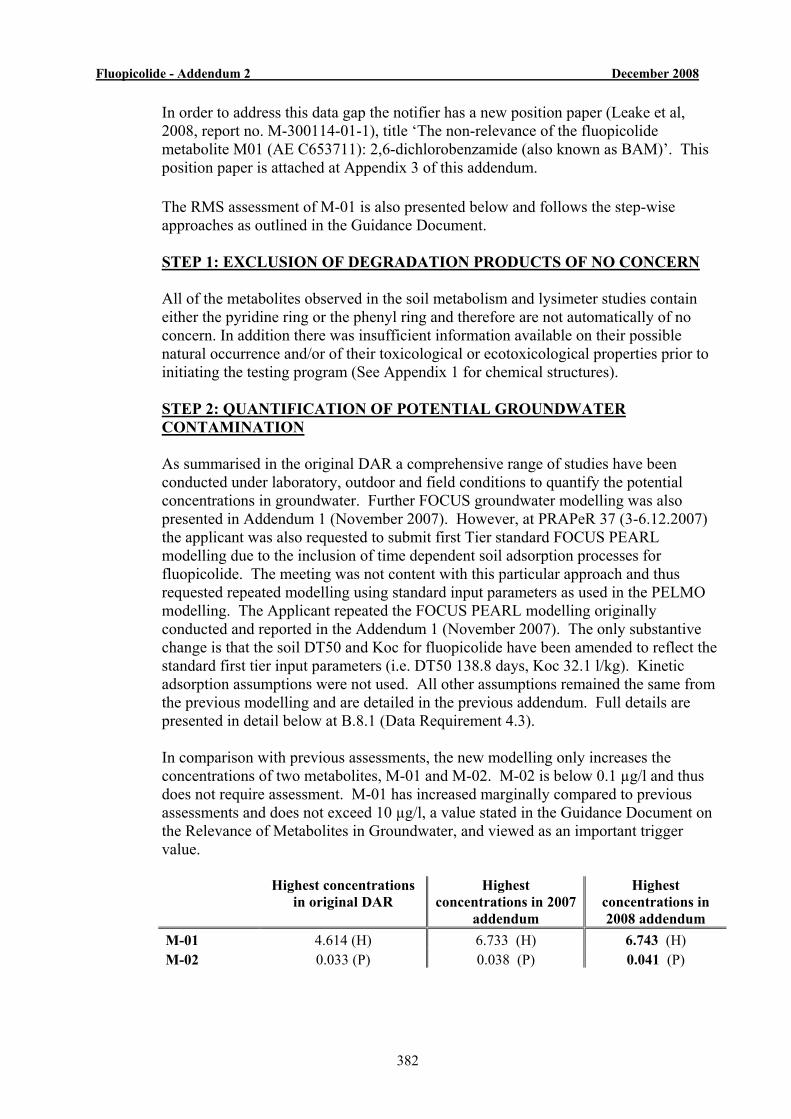
Fluopicolide - Addendum 2 December 2008
382
In order to address this data gap the notifier has a new position paper (Leake et al, 2008, report no. M-300114-01-1), title ‘The non-relevance of the fluopicolide metabolite M01 (AE C653711): 2,6-dichlorobenzamide (also known as BAM)’. This position paper is attached at Appendix 3 of this addendum.
The RMS assessment of M-01 is also presented below and follows the step-wise approaches as outlined in the Guidance Document.
STEP 1: EXCLUSION OF DEGRADATION PRODUCTS OF NO CONCERN All of the metabolites observed in the soil metabolism and lysimeter studies contain
either the pyridine ring or the phenyl ring and therefore are not automatically of no concern. In addition there was insufficient information available on their possible natural occurrence and/or of their toxicological or ecotoxicological properties prior to initiating the testing program (See Appendix 1 for chemical structures).
STEP 2: QUANTIFICATION OF POTENTIAL GROUNDWATER
CONTAMINATION
As summarised in the original DAR a comprehensive range of studies have been conducted under laboratory, outdoor and field conditions to quantify the potential concentrations in groundwater. Further FOCUS groundwater modelling was also presented in Addendum 1 (November 2007). However, at PRAPeR 37 (3-6.12.2007) the applicant was also requested to submit first Tier standard FOCUS PEARL modelling due to the inclusion of time dependent soil adsorption processes for fluopicolide. The meeting was not content with this particular approach and thus requested repeated modelling using standard input parameters as used in the PELMO modelling. The Applicant repeated the FOCUS PEARL modelling originally conducted and reported in the Addendum 1 (November 2007). The only substantive change is that the soil DT50 and Koc for fluopicolide have been amended to reflect the standard first tier input parameters (i.e. DT50 138.8 days, Koc 32.1 l/kg). Kinetic adsorption assumptions were not used. All other assumptions remained the same from the previous modelling and are detailed in the previous addendum. Full details are presented in detail below at B.8.1 (Data Requirement 4.3).
In comparison with previous assessments, the new modelling only increases the concentrations of two metabolites, M-01 and M-02. M-02 is below 0.1 µg/l and thus does not require assessment. M-01 has increased marginally compared to previous assessments and does not exceed 10 µg/l, a value stated in the Guidance Document on the Relevance of Metabolites in Groundwater, and viewed as an important trigger value.
Highest concentrations in original DAR
Highest concentrations in 2007
addendum
Highest concentrations in 2008 addendum
M-01 4.614 (H) 6.733 (H) 6.743 (H) M-02 0.033 (P) 0.038 (P) 0.041 (P)
Fluopicolide - Addendum 2 December 2008
383
STEP 3: HAZARD ASSESSMENT -- IDENTIFICATION OF RELEVANT METABOLITES
Progressing to step 3 requires the assessment to be conducted in three stages:
• Stage 1: screening for biological activity • Stage 2: screening for genotoxicity • Stage 3: screening for toxicity
STEP 3, Stage 1: screening for biological activity
One of the key stages in the assessment of potential relevance of a metabolite is the determination of biological activity. Many small molecules with molecular weights below 200 can be found to occur naturally in soil as a result of organic matter decomposition. The key distinguishing feature of the metabolites formed from plant protection products is the potential to have biological activity and therefore retain the properties of the xenobiotic.
As stated in the Guidance Document Sanco/221/2000, rev. 10, 25 Feb 2003, the goal is to identify metabolites which have comparable target activity as the parent active ingredient. It also states that efficacy testing should be focused on the question of comparing the activity against the biological target. Included in this assessment is the structure-activity relationship and the necessary functional groups to give the fungicidal activity that is present in the parent fluopicolide (AE C638206) molecule. The metabolites M-01 (AE C653711), M-02 (AE C657188), M-05 (AE 1344122), M-10 (AE 1344123), M-14 (AE 1388273) and M-15 (AE 1413903) were therefore tested for their fungicidal activity in comparison with the parent AE C638206 (Latorse, M.P., Flahout, J. 2004, C038369) (see Appendix 3 (B.10.7.5, Addendum 1 (November 2007)). The six metabolites did not show any biological activity in comparative tests with the parent fluopicolide, which showed biological effects in the range of 80 -100%. It is known from the biological screens that both the pyridine and phenyl ring parts of the molecule are required for fungicidal activity therefore the metabolites without both these rings would be predicted to have no fungicidal activity. It is also known that adding functional groups, especially polar ones, to the phenyl ring causes loss of fungicidal activity. Therefore the addition of SO3H in the case of M-15 or SO3H and OH in the case of M-16 would result in the loss of fungicidal activity. Of the remaining metabolites that triggered a consideration of biological activity only M-03, M-11, M-12 (mixture of 2 isomers) and M-13 were not tested for fungicidal activity. Three (M-11, M-12 and M-13) are all single pyridine ring structures and are unlikely to have any significant fungicidal activity. M-03 is a structurally-related transient hydroxylated-derivative of fluopicolide and is an unstable intermediate prior to cleavage of fluopicolide to M-01 and M-02. It is very unstable in water and at environmental pH will rapidly degrade to M-01 and M-02 and the RMS considers it inconceivable that significant exposure to M-03 will occur via groundwater. The RMS concludes that all metabolites theoretically occurring in groundwater >0.1µg/L will not retain or express biological activity of the parent, fluopicolide.
Fluopicolide - Addendum 2 December 2008
384
STEP 3, Stage 2: screening for genotoxicity In the guidance document Sanco/221/2000 rev.l0, there is a requirement that
metabolites that have shown some potential to be mobile and are not biologically active should be screened for their genotoxic activity in a series of three in vitro genotoxicity studies. These three study types are the Ames test, gene mutation test with mammalian cells and the chromosome aberration test. The guidance document also states that equivocal results in in-vitro studies should be substantiated by in vivo experiments.
Metabolite M-01 The genotoxicity profile of M-01 was assessed in three in vitro and one in vivo assays
and no evidence of genotoxicity was observed in any assays. The in vitro studies were the bacterial gene mutation assay in bacterial cells, V79/HPRT gene locus assay, and unscheduled DNA synthesis (UDS) assay and for in vivo, the mouse micronucleus assay. Overall, M-01 is not considered a genotoxic compound. Although no in vitro chromosomal aberration study has been performed, the liver UDS assay is considered an acceptable equivalent given the investigation of genotoxic potential in the liver whilst the in vivo assay adequately investigates potential for clastogenicity of M-01.
STEP 3, Stage 3: screening for toxicity
Stage 3 of Step 3 is aimed at the question of whether a metabolite has certain toxicological properties, which - from a regulatory perspective - qualify for considering it “relevant”. A metabolite is considered “relevant” if its toxicological properties lead to a classification as toxic or very toxic (T or T+) according to Directive 67/548/EEC. Therefore, in addition to genotoxicity testing, further toxicity testing has been conducted to determine whether the metabolite has certain toxicological properties which from a regulatory perspective would qualify it to be classified as relevant. These studies include metabolism studies to understand the adsorption, distribution, metabolism and elimination from the body.
Metabolite M-01 Following single oral administration of [14C]-M-01 to the male and female rat at the
rates of 10 and 150 mg/kg most of the administered radioactivity was eliminated in the urine (ca 82 %dose) although the rate of elimination was relatively slow. Lower levels (ca 13 %dose) were eliminated via the faeces. The highest concentrations in tissues were seen in the kidney (ca 0.57 µg equiv./g) and liver (ca 0.44 µg equiv./g) for the 10mg/kg dose group and in the skin & fur (3.8 to 5.0 µg equiv./g), kidneys (2.8 to 3.0 µg equiv./g) and liver (2.1 to 2.3 µg equiv./g) for the 150 mg/kg dose group. Tissue concentrations therefore increased by approximately five-fold for a fifteen-fold increase in dose rate. Overall, multiple dosing (14 daily doses at 10 mg/kg) did not have any significant impact in the absorption, distribution, metabolism and elimination compared to results after single oral dosing. Thus, the results in this study showed that the routes and the rates of excretion were maintained despite the multiple dosing, which meant that most of the radioactivity was eliminated via the urinary route. The distribution pattern in the tissues was also similar between single and multiple dosing with the highest mean concentrations observed in the skin & fur (3.0 µg equiv./g), kidney (1.9 µg equiv./g) and liver (1.3 µg equiv./g). Bioretention or accumulation was therefore not indicated. The routes of biotransformation was similar between dose
Fluopicolide - Addendum 2 December 2008
385
levels and sexes with hydrolysis of the amide group to form AE C416656, hydroxylation to form hydroxy-BAM (M-04) and subsequent conjugation with either glucuronic acid or sulphate, and the loss of a chlorine atom following glutathione conjugation. Further metabolism of the glutathione group to the mercapturic acid or S-methyl metabolites was observed.
M-01 was shown to be of relatively low acute oral toxicity, however the available data
indicate that it is of greater acute oral toxicity than fluopicolide (LD50 >5000 mg/kg bw). The LD50 of M-01 was found to be >2000 mg/kg bw in males and >500 mg/kg bw in females in a modern study using the acute toxic class method (OECD 423). However, in an older non-GLP study (performed to OECD 401) LD50 values of 1470 (951–2270) and 2330 (1430–3780) mg/kg bw were calculated for male and female rats respectively. The findings of the two studies are therefore inconsistent, but taken together do indicate that M-01 is of greater acute oral toxicity than fluopicolide, but is not particularly hazardous in absolute terms. M-01 is not classified as toxic and at the maximum levels predicted to occur in groundwater it is not considered relevant for acute toxicity.
In a 13-week toxicity study performed in CD rats with M-01 at doses up to 2300 ppm,
reduced body weight gains and food consumption was observed at dose levels of ≥ 600 ppm but no target organ toxicity was observed. The NOAEL of M-01 was 180 ppm (equivalent to 14 mg/kg bw/day) in both males and females.
In comparison, the NOAEL for the fluopicolide 90-day rat study was 100 ppm (equivalent to 7.4 or 8.4 mg/kg bw/d in males and females respectively), based on treatment-related haematological (reduced haemoglobin and haematocrit in male rats), clinical chemistry (increased cholesterol) and urinalysis findings (increased urine volume and specific gravity in females); organ weight changes (increased relative liver and kidney weights in males and relative spleen weight in females) and histopathological changes in the liver and kidneys at the LOAEL of 1400 ppm (equivalent to 109 or 119 mg/kg bw/d in males and females respectively). Findings show that the short-term toxicity of fluopicolide and M-01 is comparable, and therefore that further (long-term) studies with M-01 are not required. In a 2-year dog study with M-01 (BAM), the NOAEL was 4.5 mg/kg bw/day based on effects on body weight gain at the higher dose of 12.5 mg/kg bw/day.
The Notifier has, however, provided a 2-year rat chronic toxicity study performed with
M-01. The results of this study indicate that the liver is the target organ of toxicity; a NOAEL of 180 ppm (equivalent to 5.7 and 8.6 mg/kg bw/d in males and females respectively) can be determined. The NOAEL in this study is therefore comparable to the NOAEL of 200 ppm from the rat chronic toxicity/carcinogenicity study performed with fluopicolide, indicating similar long-term toxicity. In the M-01 study, a slight (but not statistically significant) increase in the incidence of hepatocellular adenoma was seen in males at the top dose level of 500 ppm; a dose level considered exceeding the MTD. No evidence of carcinogenicity was seen in this study.
In conclusion, these data show that the toxicological profile of the metabolite M-01 is
similar to that of fluopicolide. The relevant NOAEL for the risk assessment of M-01 (BAM) obtained in the 2-year dietary study in dogs does not differ substantial for that derived from long-term toxicity and carcinogenicity in rats and mice for Fluopicolide.
Fluopicolide - Addendum 2 December 2008
386
When dose spacing between the NOAELs and LOAELs is taken in to account there is some degree of overlap.
It can be concluded that M-01 (BAM), does not require classification as toxic (T) or
very toxic (T+). In addition since the parent is not classified as a reproductive toxicant and is not carcinogenic, there is in principle no reason to require reproductive or carcinogenic testing. Nonetheless, data on carcinogenicity and reproductive toxicity of BAM are available and the assessment reveals that BAM is not classifiable as a carcinogen or reproductive toxicant. It has been confirmed that BAM is not genotoxic. Therefore from a toxicological perspective BAM passes the assessment of Stages 2 and 3 and is considered as a non-relevant metabolite under the rules for the assessment of relevance of groundwater metabolites.
STEP 4: EXPOSURE ASSESSMENT - THRESHOLD OF CONCERN
APPROACH For those metabolites for which the exposure assessment shows they are below the
threshold of concern which is given in the Guidance Document as 0.75 µg/L they can be determined to be non relevant at Step 4. However, M-01 is identified as requiring a refined risk assessment as the highest concentration in the DAR or addenda evaluations is predicted to be above 0.75 µg/l.
Based on the proposed ADI for fluopicolide, 0.08 mg/kg bw, a health based drinking
water limit of 240μg/L can be proposed. This is based on a 60kg person consuming 2L of water per day and allocating 10% of the ADI to drinking water. Predicted levels of the fluopicolide metabolites are all <5% of the health based drinking water limit for fluopicolide. Therefore the metabolites are not considered to present a concern to human health.
STEP 5: REFINED RISK ASSESSMENTS FOR THE REMAINING
METABOLITES The metabolite M-01has been found to lie in the concentration range between 0.75
µg/L and 10 µg/L. Therefore, a refined risk assessment is presented below: M-01 was negative in three in vitro genotoxicity assays and in an in vivo assay for
micronuclei induction. M-01 is more acutely toxic than fluopicolide, but in 90 day and 2-year studies in the rat the toxicity of both compounds is considered equivalent, taking account of dose spacing and relative molecular weights. For the dog, the overall NOAEL was 4.5 mg/kg bw/day based on the M-01 had no biological (fungicidal) activity. This NOAEL is of the same order of magnitude as that determined for the rats if allowance is made for dose spacing. It is proposed that an ADI for BAM of 0.045 mg/kg bw/day based on the NOAEL of 4.5 mg/kg bw/day in the 2-year dog study can be set as a basis for the risk assessment of exposures via drinking water and via diet.
For exposure via drinking water, in accordance with Council Directive 97/57/EC,
exposure to BAM through the drinking water should account for not more than 10% of
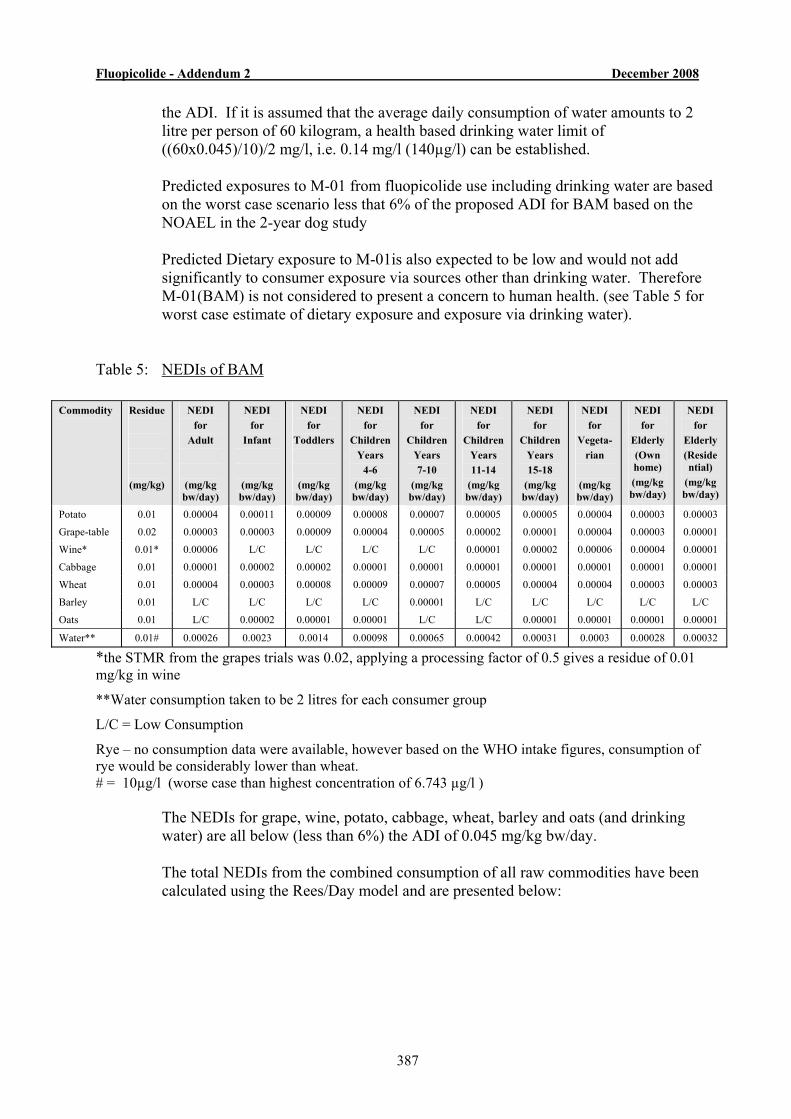
Fluopicolide - Addendum 2 December 2008
387
the ADI. If it is assumed that the average daily consumption of water amounts to 2 litre per person of 60 kilogram, a health based drinking water limit of ((60x0.045)/10)/2 mg/l, i.e. 0.14 mg/l (140µg/l) can be established.
Predicted exposures to M-01 from fluopicolide use including drinking water are based
on the worst case scenario less that 6% of the proposed ADI for BAM based on the NOAEL in the 2-year dog study
Predicted Dietary exposure to M-01is also expected to be low and would not add significantly to consumer exposure via sources other than drinking water. Therefore M-01(BAM) is not considered to present a concern to human health. (see Table 5 for worst case estimate of dietary exposure and exposure via drinking water).
Table 5: NEDIs of BAM
Commodity Residue
(mg/kg)
NEDI for
Adult
(mg/kg bw/day)
NEDI for
Infant
(mg/kg bw/day)
NEDI for
Toddlers
(mg/kg bw/day)
NEDI for
Children Years
4-6 (mg/kg bw/day)
NEDI for
Children Years 7-10
(mg/kg bw/day)
NEDI for
Children Years 11-14
(mg/kg bw/day)
NEDI for
Children Years 15-18
(mg/kg bw/day)
NEDI for
Vegeta- rian
(mg/kg bw/day)
NEDI for
Elderly (Own home) (mg/kg bw/day)
NEDI for
Elderly (Residential)
(mg/kg bw/day)
Potato 0.01 0.00004 0.00011 0.00009 0.00008 0.00007 0.00005 0.00005 0.00004 0.00003 0.00003
Grape-table 0.02 0.00003 0.00003 0.00009 0.00004 0.00005 0.00002 0.00001 0.00004 0.00003 0.00001
Wine* 0.01* 0.00006 L/C L/C L/C L/C 0.00001 0.00002 0.00006 0.00004 0.00001
Cabbage 0.01 0.00001 0.00002 0.00002 0.00001 0.00001 0.00001 0.00001 0.00001 0.00001 0.00001
Wheat 0.01 0.00004 0.00003 0.00008 0.00009 0.00007 0.00005 0.00004 0.00004 0.00003 0.00003
Barley 0.01 L/C L/C L/C L/C 0.00001 L/C L/C L/C L/C L/C
Oats 0.01 L/C 0.00002 0.00001 0.00001 L/C L/C 0.00001 0.00001 0.00001 0.00001
Water** 0.01# 0.00026 0.0023 0.0014 0.00098 0.00065 0.00042 0.00031 0.0003 0.00028 0.00032
*the STMR from the grapes trials was 0.02, applying a processing factor of 0.5 gives a residue of 0.01 mg/kg in wine
**Water consumption taken to be 2 litres for each consumer group
L/C = Low Consumption
Rye – no consumption data were available, however based on the WHO intake figures, consumption of rye would be considerably lower than wheat. # = 10µg/l (worse case than highest concentration of 6.743 µg/l ) The NEDIs for grape, wine, potato, cabbage, wheat, barley and oats (and drinking
water) are all below (less than 6%) the ADI of 0.045 mg/kg bw/day. The total NEDIs from the combined consumption of all raw commodities have been
calculated using the Rees/Day model and are presented below:
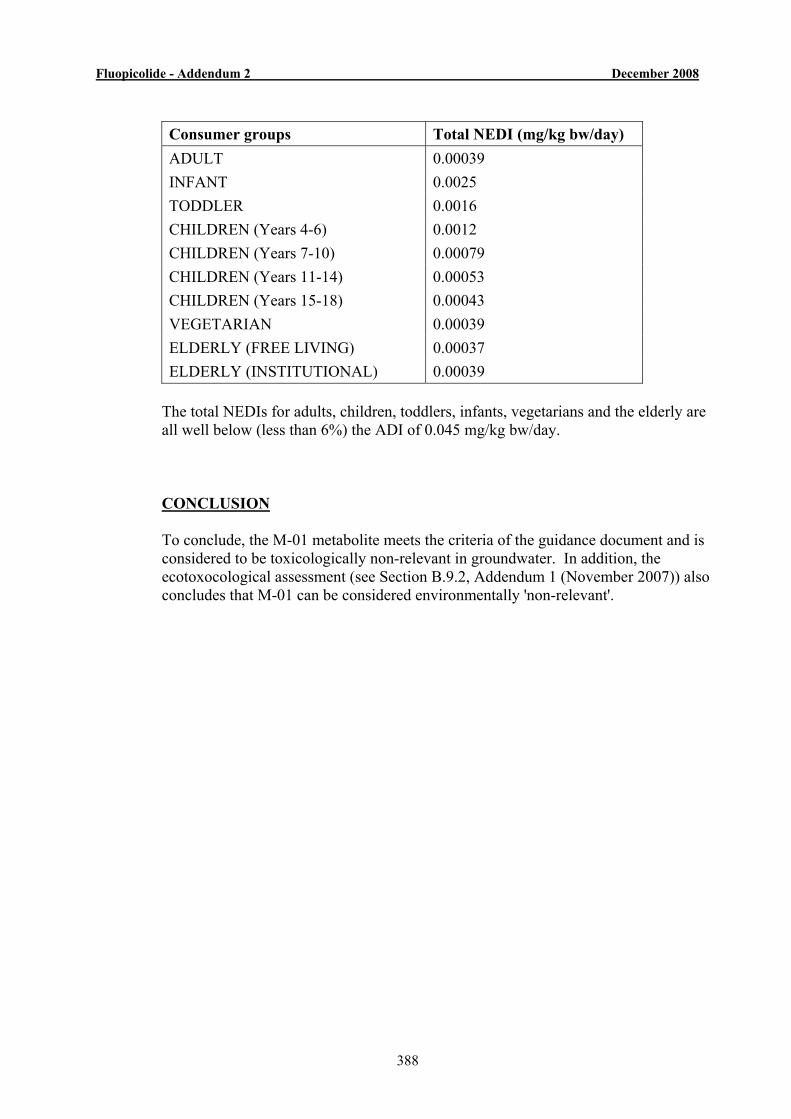
Fluopicolide - Addendum 2 December 2008
388
Consumer groups Total NEDI (mg/kg bw/day) ADULT 0.00039 INFANT 0.0025 TODDLER 0.0016 CHILDREN (Years 4-6) 0.0012 CHILDREN (Years 7-10) 0.00079 CHILDREN (Years 11-14) 0.00053 CHILDREN (Years 15-18) 0.00043 VEGETARIAN 0.00039 ELDERLY (FREE LIVING) 0.00037 ELDERLY (INSTITUTIONAL) 0.00039
The total NEDIs for adults, children, toddlers, infants, vegetarians and the elderly are
all well below (less than 6%) the ADI of 0.045 mg/kg bw/day. CONCLUSION
To conclude, the M-01 metabolite meets the criteria of the guidance document and is considered to be toxicologically non-relevant in groundwater. In addition, the ecotoxocological assessment (see Section B.9.2, Addendum 1 (November 2007)) also concludes that M-01 can be considered environmentally 'non-relevant'.
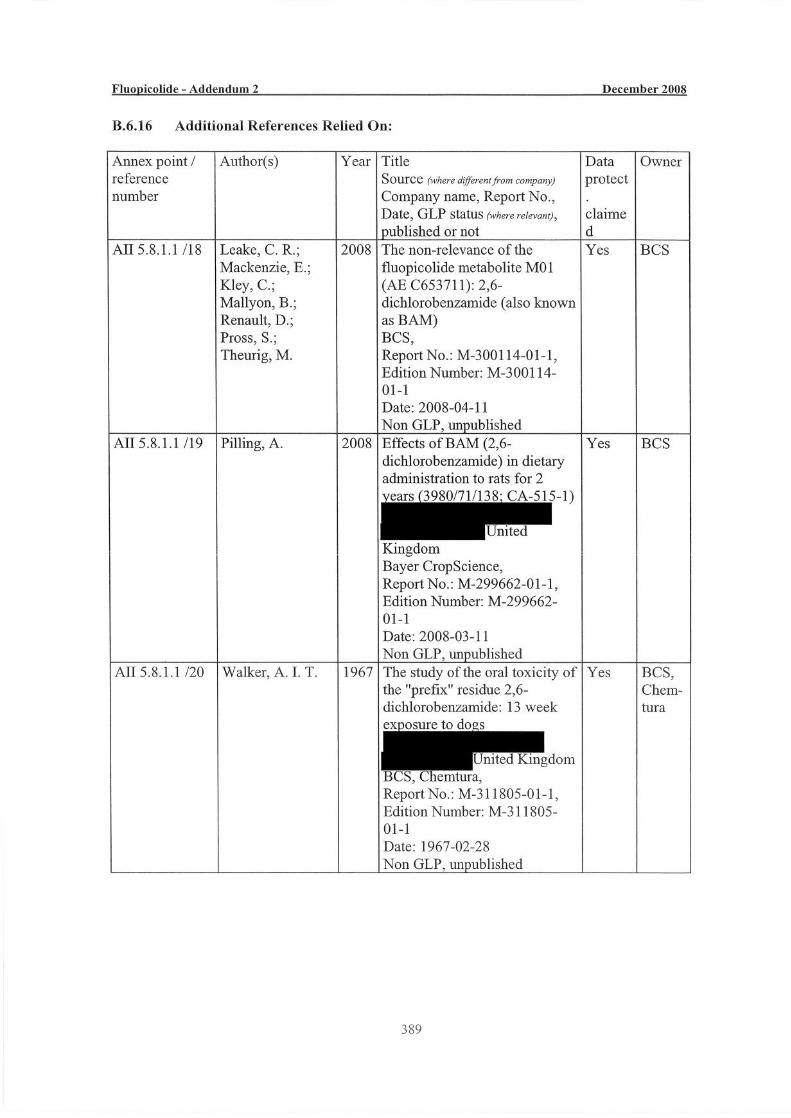
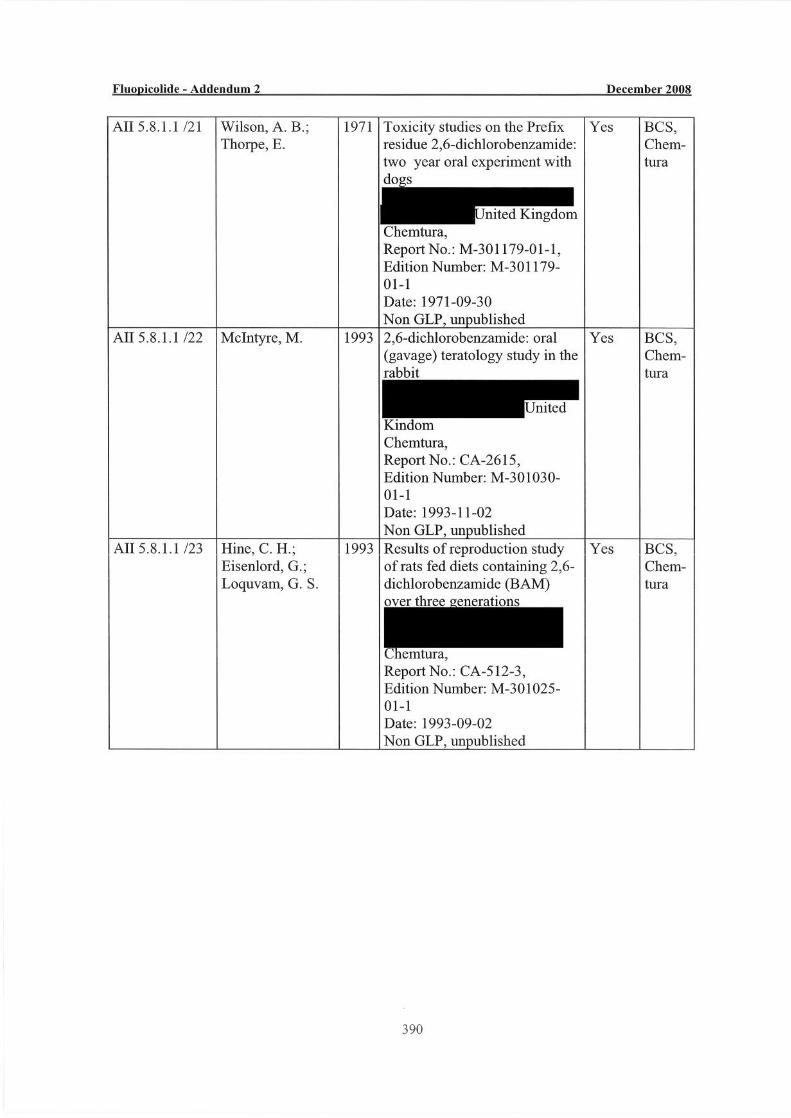
Fluopicolide - Addendum 2 December 2008
391
B.8 ENVIRONMENTAL FATE AND BEHAVIOUR B.8.1 Route and rate of degradation in soil
Data requirement 4.1 “Calculation of DT50photolysis for adequate latitudes in Europe.” To recap, questions were originally raised on the significance of soil photolysis and the Notifier was requested to provide estimates of soil photolysis at other latitudes, e.g. 40ºN and 45ºN. The Notifier submitted a very complex assessment, described in a previously submitted addendum which was considered at the PRAPeR 37 meeting. Experts at PRAPeR 37 were not convinced by the Notifiers arguments, particularly noting the apparent contradictions that light energy in the laboratory soil photolysis studies were claimed to be equivalent to those at the location in Scotland, but also that these light levels were higher than those expected in other Southern EU locations; a summary of the discussions can be found in the report of the PRAPeR 37 meeting. This prompted the re-setting of the data requirement. The Notifier has responded by submitting a position paper on soil photolysis. RMS evaluation of new information: The major part of the Notifier’s case rests on comparison of light energy output in the soil photolysis studies reported in the DAR with published data on environmental light levels in Europe. Key to this comparison is the need (according to the Notifier) to adjust the measured light levels in the soil photolysis studies to account for differences in the wavelengths over which measurements were taken. Light energy in the soil photolysis studies was measured over the wavelength range 290-800 nm, however, measured natural light levels were measured over a range of 300 – 3000 nm, and thus the two sets of information cannot be compared directly. To correct for this difference in measured wavelength ranges, the Notifier cited published information on the distribution of light intensity in a standard natural light spectrum (Commission Internationale de L'Eclairage, International Commission on Illumination, Publication No. 20, TC 2.2, 1972; RMS notes that this publication is now withdrawn and replaced by a new version, TC 2.17, published in 1989). Within the range of 280 – 3000 nm, it was stated that wavelengths 280 – 400 nm accounted for 6.1% of intensity and the range 400 – 800 nm accounted for 51.8% of intensity. Thus, the range 280 – 800 nm accounts for 57.9% of intensity. Using this value, the light energy output of the lamps used in the soil photolysis tests was extrapolated to the wider range of 300 – 3000 nm. The average hourly light energy emitted by the photolysis equipment was 456 W/m2 in the range 280 – 800 nm, and the Notifier calculated that this was equivalent to an output of 787.6 W/m2 in the range 300 – 3000 nm.
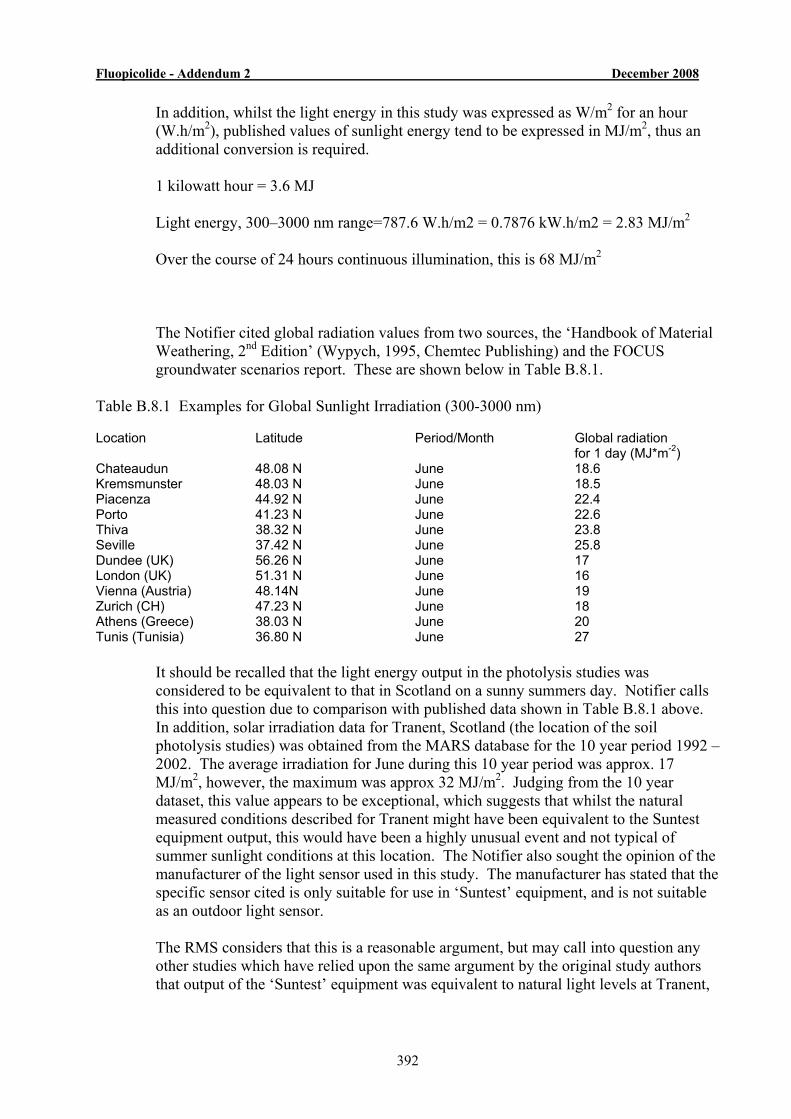
Fluopicolide - Addendum 2 December 2008
392
In addition, whilst the light energy in this study was expressed as W/m2 for an hour (W.h/m2), published values of sunlight energy tend to be expressed in MJ/m2, thus an additional conversion is required. 1 kilowatt hour = 3.6 MJ Light energy, 300–3000 nm range=787.6 W.h/m2 = 0.7876 kW.h/m2 = 2.83 MJ/m2 Over the course of 24 hours continuous illumination, this is 68 MJ/m2 The Notifier cited global radiation values from two sources, the ‘Handbook of Material Weathering, 2nd Edition’ (Wypych, 1995, Chemtec Publishing) and the FOCUS groundwater scenarios report. These are shown below in Table B.8.1.
Table B.8.1 Examples for Global Sunlight Irradiation (300-3000 nm) Location Latitude Period/Month Global radiation
for 1 day (MJ*m-2) Chateaudun 48.08 N June 18.6 Kremsmunster 48.03 N June 18.5 Piacenza 44.92 N June 22.4 Porto 41.23 N June 22.6 Thiva 38.32 N June 23.8 Seville 37.42 N June 25.8 Dundee (UK) 56.26 N June 17 London (UK) 51.31 N June 16 Vienna (Austria) 48.14N June 19 Zurich (CH) 47.23 N June 18 Athens (Greece) 38.03 N June 20 Tunis (Tunisia) 36.80 N June 27
It should be recalled that the light energy output in the photolysis studies was considered to be equivalent to that in Scotland on a sunny summers day. Notifier calls this into question due to comparison with published data shown in Table B.8.1 above. In addition, solar irradiation data for Tranent, Scotland (the location of the soil photolysis studies) was obtained from the MARS database for the 10 year period 1992 – 2002. The average irradiation for June during this 10 year period was approx. 17 MJ/m2, however, the maximum was approx 32 MJ/m2. Judging from the 10 year dataset, this value appears to be exceptional, which suggests that whilst the natural measured conditions described for Tranent might have been equivalent to the Suntest equipment output, this would have been a highly unusual event and not typical of summer sunlight conditions at this location. The Notifier also sought the opinion of the manufacturer of the light sensor used in this study. The manufacturer has stated that the specific sensor cited is only suitable for use in ‘Suntest’ equipment, and is not suitable as an outdoor light sensor. The RMS considers that this is a reasonable argument, but may call into question any other studies which have relied upon the same argument by the original study authors that output of the ‘Suntest’ equipment was equivalent to natural light levels at Tranent,
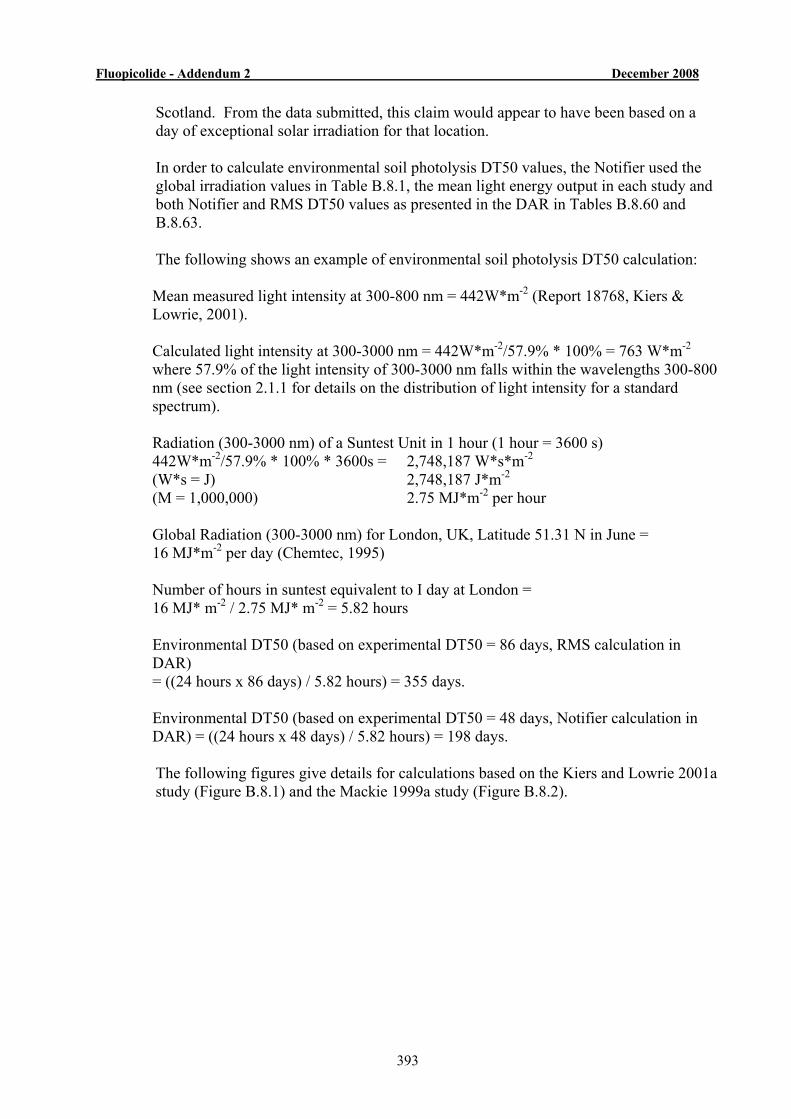
Fluopicolide - Addendum 2 December 2008
393
Scotland. From the data submitted, this claim would appear to have been based on a day of exceptional solar irradiation for that location. In order to calculate environmental soil photolysis DT50 values, the Notifier used the global irradiation values in Table B.8.1, the mean light energy output in each study and both Notifier and RMS DT50 values as presented in the DAR in Tables B.8.60 and B.8.63. The following shows an example of environmental soil photolysis DT50 calculation: Mean measured light intensity at 300-800 nm = 442W*m-2 (Report 18768, Kiers & Lowrie, 2001). Calculated light intensity at 300-3000 nm = 442W*m-2/57.9% * 100% = 763 W*m-2 where 57.9% of the light intensity of 300-3000 nm falls within the wavelengths 300-800 nm (see section 2.1.1 for details on the distribution of light intensity for a standard spectrum). Radiation (300-3000 nm) of a Suntest Unit in 1 hour (1 hour = 3600 s) 442W*m-2/57.9% * 100% * 3600s = 2,748,187 W*s*m-2 (W*s = J) 2,748,187 J*m-2 (M = 1,000,000) 2.75 MJ*m-2 per hour Global Radiation (300-3000 nm) for London, UK, Latitude 51.31 N in June = 16 MJ*m-2 per day (Chemtec, 1995) Number of hours in suntest equivalent to I day at London = 16 MJ* m-2 / 2.75 MJ* m-2 = 5.82 hours Environmental DT50 (based on experimental DT50 = 86 days, RMS calculation in DAR) = ((24 hours x 86 days) / 5.82 hours) = 355 days. Environmental DT50 (based on experimental DT50 = 48 days, Notifier calculation in DAR) = ((24 hours x 48 days) / 5.82 hours) = 198 days. The following figures give details for calculations based on the Kiers and Lowrie 2001a study (Figure B.8.1) and the Mackie 1999a study (Figure B.8.2).
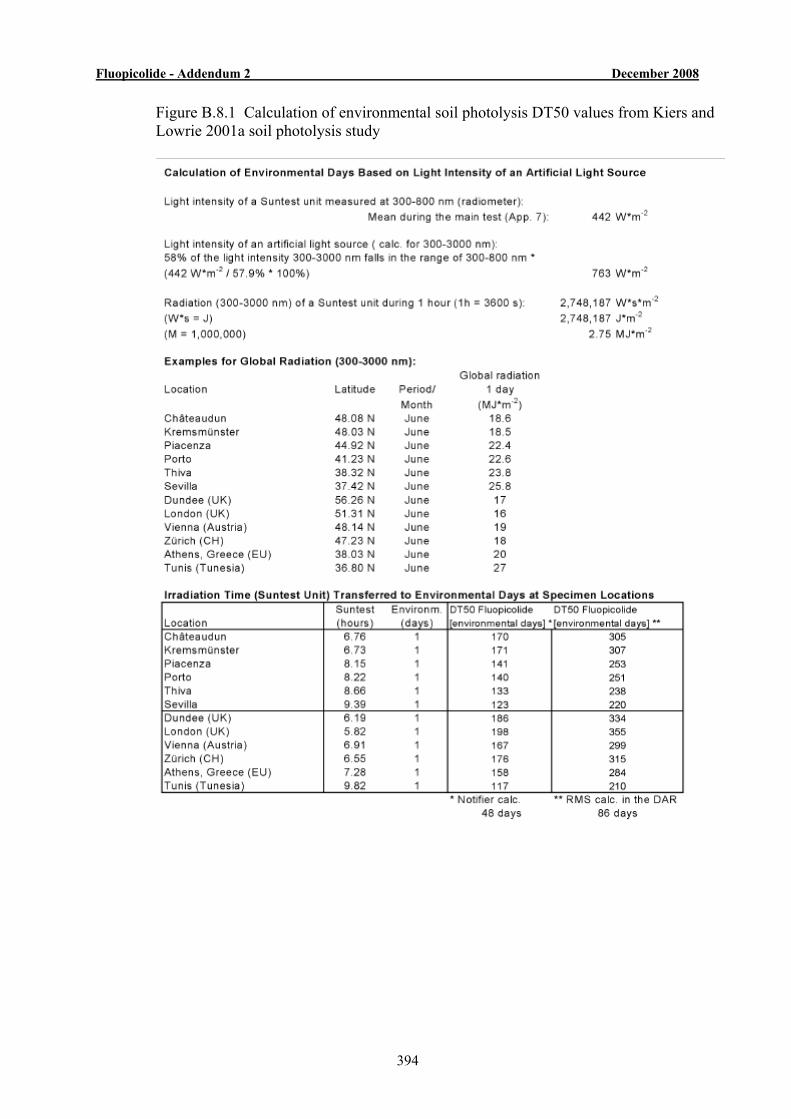
Fluopicolide - Addendum 2 December 2008
394
Figure B.8.1 Calculation of environmental soil photolysis DT50 values from Kiers and Lowrie 2001a soil photolysis study
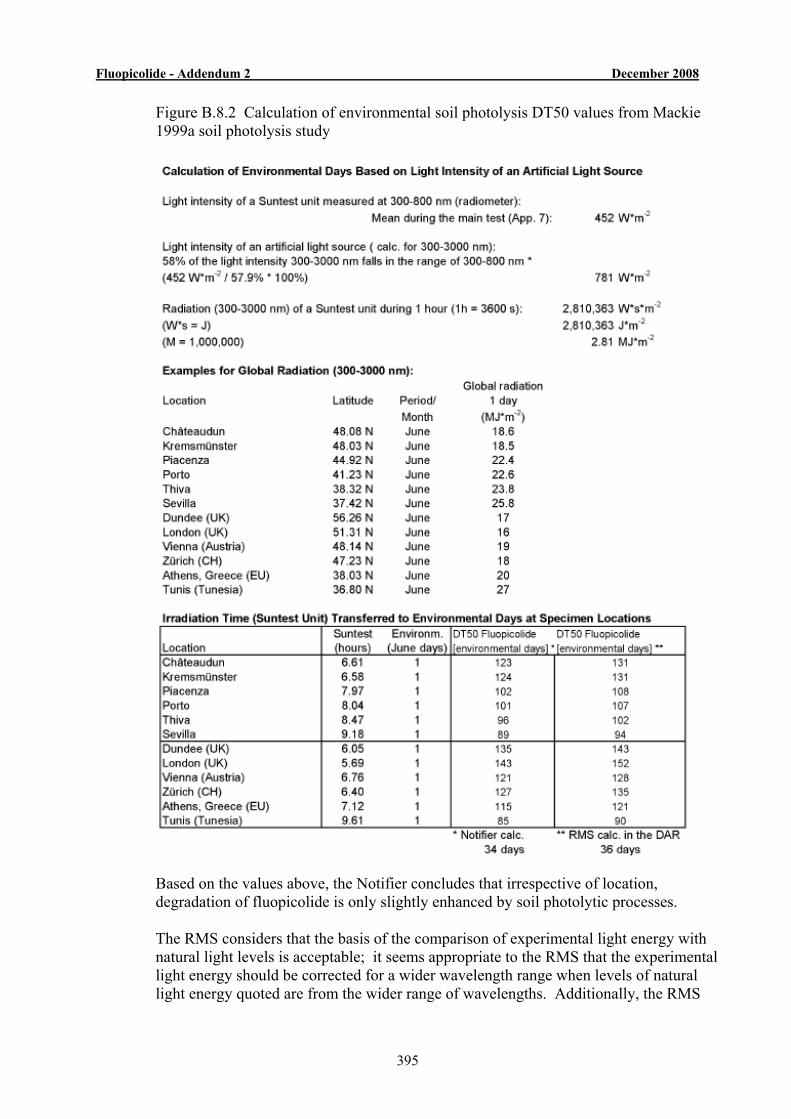
Fluopicolide - Addendum 2 December 2008
395
Figure B.8.2 Calculation of environmental soil photolysis DT50 values from Mackie 1999a soil photolysis study
Based on the values above, the Notifier concludes that irrespective of location, degradation of fluopicolide is only slightly enhanced by soil photolytic processes. The RMS considers that the basis of the comparison of experimental light energy with natural light levels is acceptable; it seems appropriate to the RMS that the experimental light energy should be corrected for a wider wavelength range when levels of natural light energy quoted are from the wider range of wavelengths. Additionally, the RMS
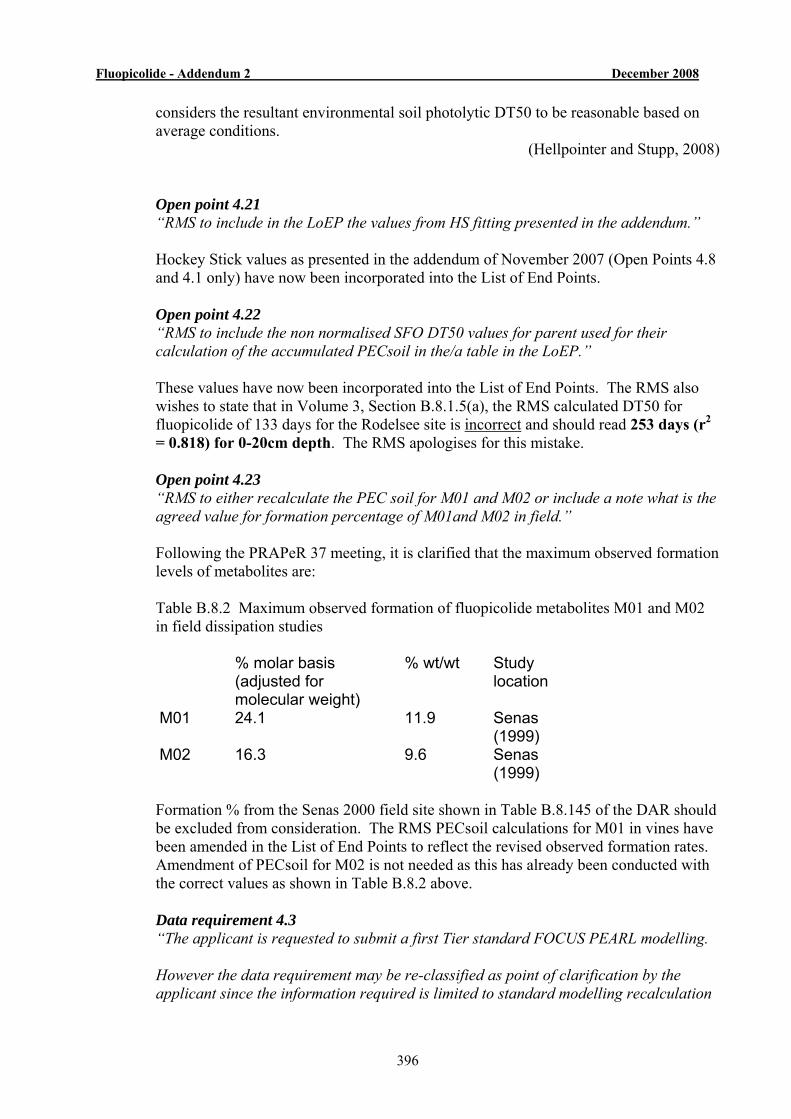
Fluopicolide - Addendum 2 December 2008
396
considers the resultant environmental soil photolytic DT50 to be reasonable based on average conditions.
(Hellpointer and Stupp, 2008) Open point 4.21 “RMS to include in the LoEP the values from HS fitting presented in the addendum.” Hockey Stick values as presented in the addendum of November 2007 (Open Points 4.8 and 4.1 only) have now been incorporated into the List of End Points. Open point 4.22 “RMS to include the non normalised SFO DT50 values for parent used for their calculation of the accumulated PECsoil in the/a table in the LoEP.” These values have now been incorporated into the List of End Points. The RMS also wishes to state that in Volume 3, Section B.8.1.5(a), the RMS calculated DT50 for fluopicolide of 133 days for the Rodelsee site is incorrect and should read 253 days (r2 = 0.818) for 0-20cm depth. The RMS apologises for this mistake. Open point 4.23 “RMS to either recalculate the PEC soil for M01 and M02 or include a note what is the agreed value for formation percentage of M01and M02 in field.” Following the PRAPeR 37 meeting, it is clarified that the maximum observed formation levels of metabolites are: Table B.8.2 Maximum observed formation of fluopicolide metabolites M01 and M02 in field dissipation studies % molar basis
(adjusted for molecular weight)
% wt/wt Study location
M01 24.1 11.9 Senas (1999)
M02 16.3 9.6 Senas (1999)
Formation % from the Senas 2000 field site shown in Table B.8.145 of the DAR should be excluded from consideration. The RMS PECsoil calculations for M01 in vines have been amended in the List of End Points to reflect the revised observed formation rates. Amendment of PECsoil for M02 is not needed as this has already been conducted with the correct values as shown in Table B.8.2 above. Data requirement 4.3 “The applicant is requested to submit a first Tier standard FOCUS PEARL modelling. However the data requirement may be re-classified as point of clarification by the applicant since the information required is limited to standard modelling recalculation
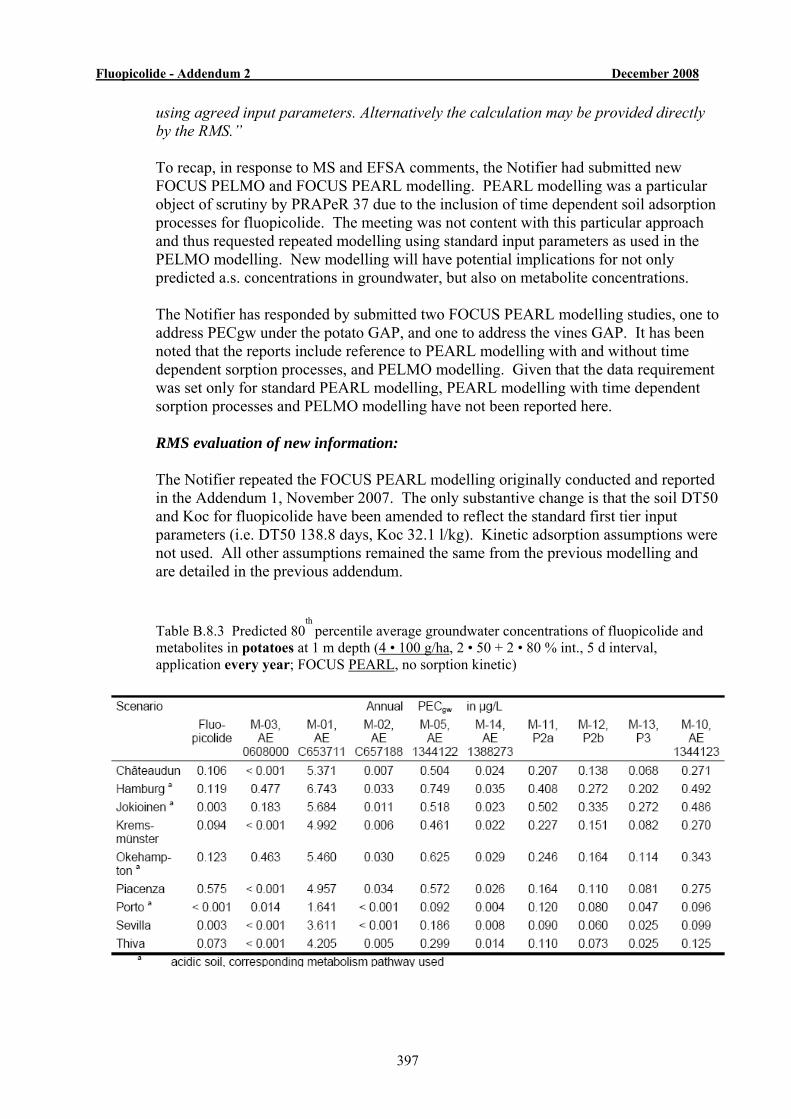
Fluopicolide - Addendum 2 December 2008
397
using agreed input parameters. Alternatively the calculation may be provided directly by the RMS.” To recap, in response to MS and EFSA comments, the Notifier had submitted new FOCUS PELMO and FOCUS PEARL modelling. PEARL modelling was a particular object of scrutiny by PRAPeR 37 due to the inclusion of time dependent soil adsorption processes for fluopicolide. The meeting was not content with this particular approach and thus requested repeated modelling using standard input parameters as used in the PELMO modelling. New modelling will have potential implications for not only predicted a.s. concentrations in groundwater, but also on metabolite concentrations. The Notifier has responded by submitted two FOCUS PEARL modelling studies, one to address PECgw under the potato GAP, and one to address the vines GAP. It has been noted that the reports include reference to PEARL modelling with and without time dependent sorption processes, and PELMO modelling. Given that the data requirement was set only for standard PEARL modelling, PEARL modelling with time dependent sorption processes and PELMO modelling have not been reported here. RMS evaluation of new information: The Notifier repeated the FOCUS PEARL modelling originally conducted and reported in the Addendum 1, November 2007. The only substantive change is that the soil DT50 and Koc for fluopicolide have been amended to reflect the standard first tier input parameters (i.e. DT50 138.8 days, Koc 32.1 l/kg). Kinetic adsorption assumptions were not used. All other assumptions remained the same from the previous modelling and are detailed in the previous addendum. Table B.8.3 Predicted 80
th percentile average groundwater concentrations of fluopicolide and
metabolites in potatoes at 1 m depth (4 • 100 g/ha, 2 • 50 + 2 • 80 % int., 5 d interval, application every year; FOCUS PEARL, no sorption kinetic)
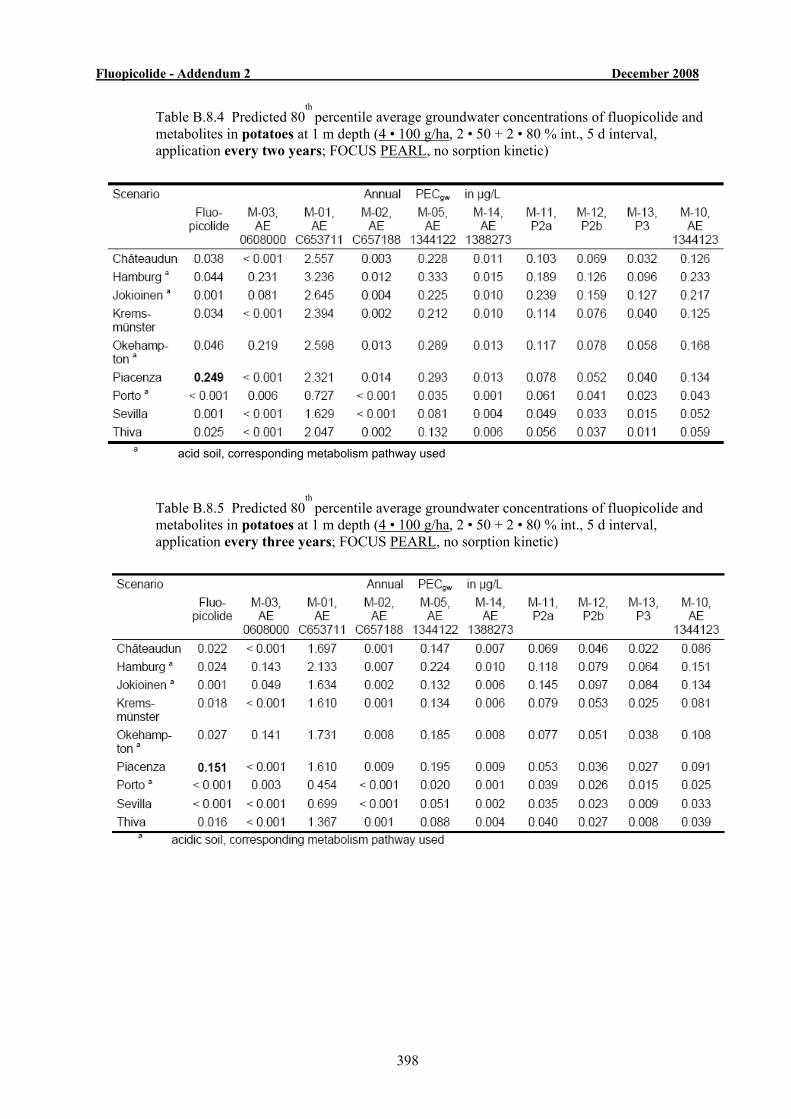
Fluopicolide - Addendum 2 December 2008
398
Table B.8.4 Predicted 80th
percentile average groundwater concentrations of fluopicolide and metabolites in potatoes at 1 m depth (4 • 100 g/ha, 2 • 50 + 2 • 80 % int., 5 d interval, application every two years; FOCUS PEARL, no sorption kinetic)
a acid soil, corresponding metabolism pathway used Table B.8.5 Predicted 80
th percentile average groundwater concentrations of fluopicolide and
metabolites in potatoes at 1 m depth (4 • 100 g/ha, 2 • 50 + 2 • 80 % int., 5 d interval, application every three years; FOCUS PEARL, no sorption kinetic)
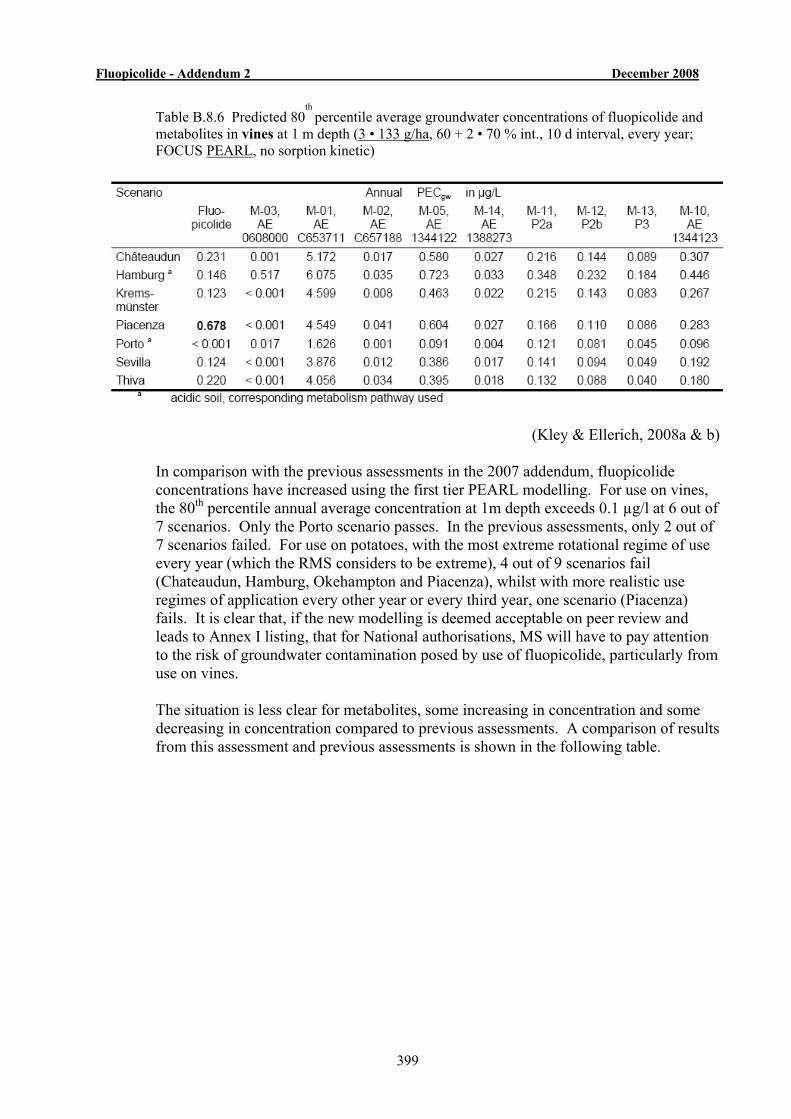
Fluopicolide - Addendum 2 December 2008
399
Table B.8.6 Predicted 80th
percentile average groundwater concentrations of fluopicolide and metabolites in vines at 1 m depth (3 • 133 g/ha, 60 + 2 • 70 % int., 10 d interval, every year; FOCUS PEARL, no sorption kinetic)
(Kley & Ellerich, 2008a & b) In comparison with the previous assessments in the 2007 addendum, fluopicolide concentrations have increased using the first tier PEARL modelling. For use on vines, the 80th percentile annual average concentration at 1m depth exceeds 0.1 µg/l at 6 out of 7 scenarios. Only the Porto scenario passes. In the previous assessments, only 2 out of 7 scenarios failed. For use on potatoes, with the most extreme rotational regime of use every year (which the RMS considers to be extreme), 4 out of 9 scenarios fail (Chateaudun, Hamburg, Okehampton and Piacenza), whilst with more realistic use regimes of application every other year or every third year, one scenario (Piacenza) fails. It is clear that, if the new modelling is deemed acceptable on peer review and leads to Annex I listing, that for National authorisations, MS will have to pay attention to the risk of groundwater contamination posed by use of fluopicolide, particularly from use on vines. The situation is less clear for metabolites, some increasing in concentration and some decreasing in concentration compared to previous assessments. A comparison of results from this assessment and previous assessments is shown in the following table.
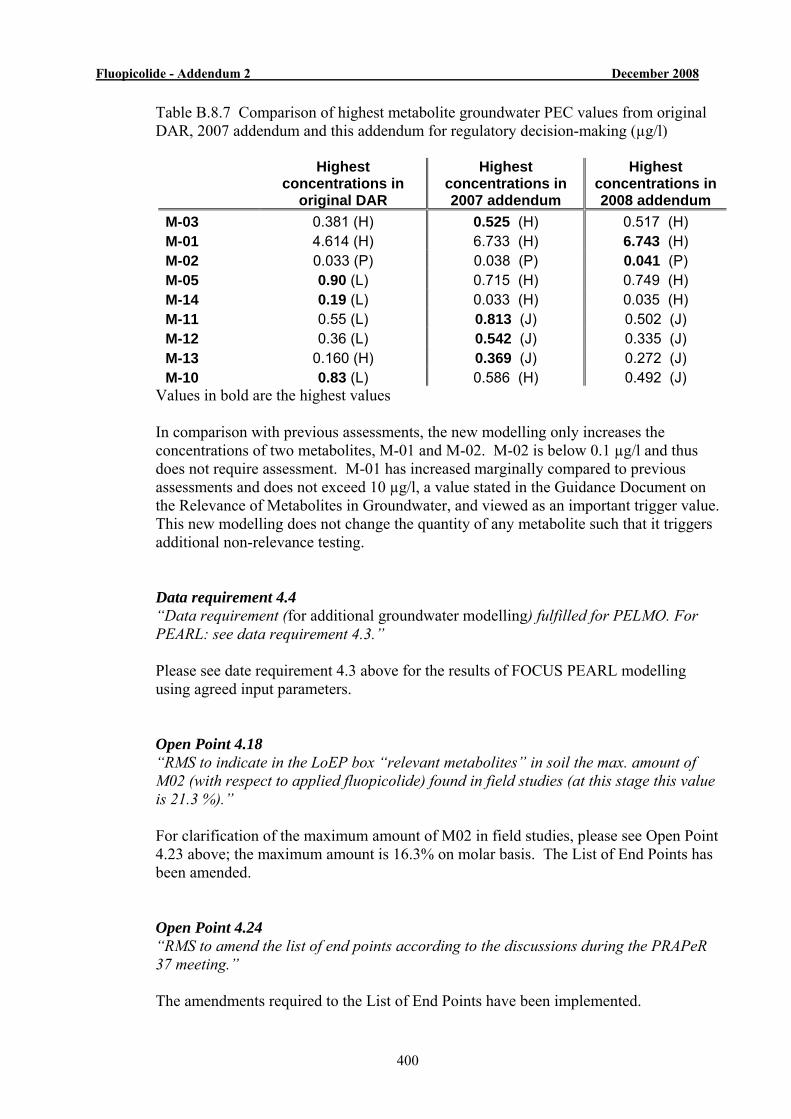
Fluopicolide - Addendum 2 December 2008
400
Table B.8.7 Comparison of highest metabolite groundwater PEC values from original DAR, 2007 addendum and this addendum for regulatory decision-making (µg/l)
Highest concentrations in
original DAR
Highest concentrations in 2007 addendum
Highest concentrations in 2008 addendum
M-03 0.381 (H) 0.525 (H) 0.517 (H) M-01 4.614 (H) 6.733 (H) 6.743 (H) M-02 0.033 (P) 0.038 (P) 0.041 (P) M-05 0.90 (L) 0.715 (H) 0.749 (H) M-14 0.19 (L) 0.033 (H) 0.035 (H) M-11 0.55 (L) 0.813 (J) 0.502 (J) M-12 0.36 (L) 0.542 (J) 0.335 (J) M-13 0.160 (H) 0.369 (J) 0.272 (J) M-10 0.83 (L) 0.586 (H) 0.492 (J)
Values in bold are the highest values In comparison with previous assessments, the new modelling only increases the concentrations of two metabolites, M-01 and M-02. M-02 is below 0.1 µg/l and thus does not require assessment. M-01 has increased marginally compared to previous assessments and does not exceed 10 µg/l, a value stated in the Guidance Document on the Relevance of Metabolites in Groundwater, and viewed as an important trigger value. This new modelling does not change the quantity of any metabolite such that it triggers additional non-relevance testing. Data requirement 4.4 “Data requirement (for additional groundwater modelling) fulfilled for PELMO. For PEARL: see data requirement 4.3.” Please see date requirement 4.3 above for the results of FOCUS PEARL modelling using agreed input parameters. Open Point 4.18 “RMS to indicate in the LoEP box “relevant metabolites” in soil the max. amount of M02 (with respect to applied fluopicolide) found in field studies (at this stage this value is 21.3 %).” For clarification of the maximum amount of M02 in field studies, please see Open Point 4.23 above; the maximum amount is 16.3% on molar basis. The List of End Points has been amended. Open Point 4.24 “RMS to amend the list of end points according to the discussions during the PRAPeR 37 meeting.” The amendments required to the List of End Points have been implemented.
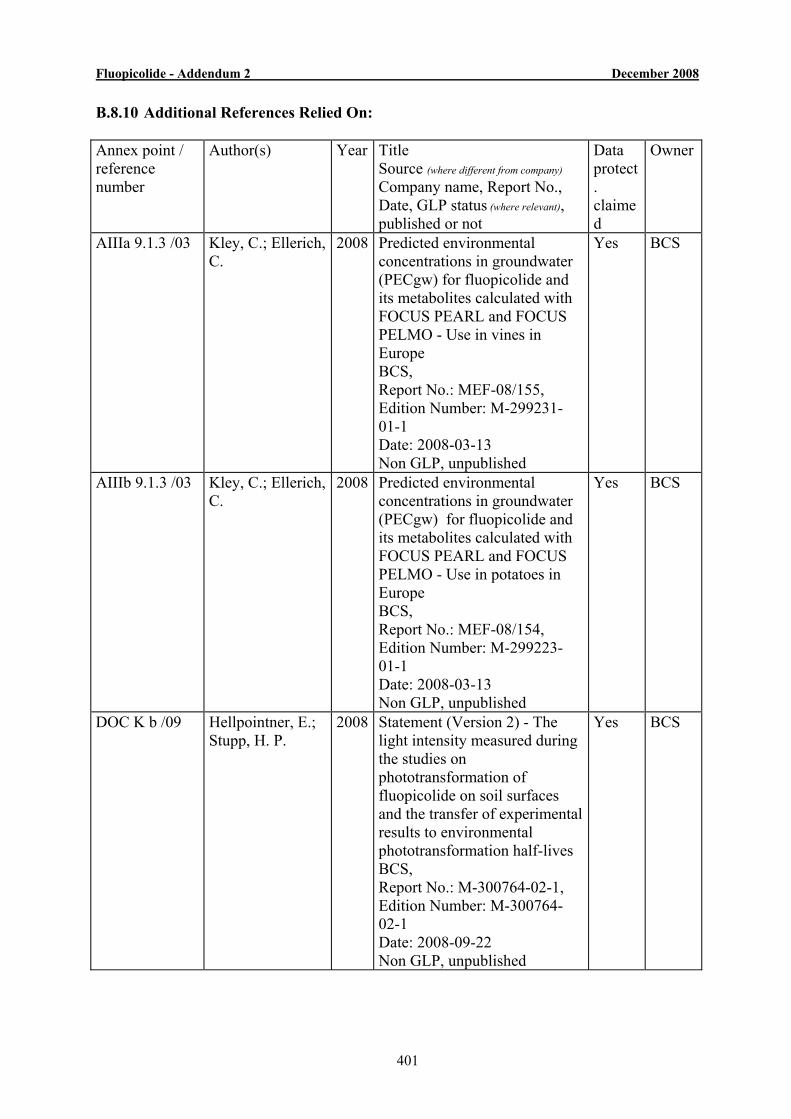
Fluopicolide - Addendum 2 December 2008
401
B.8.10 Additional References Relied On:
Annex point / reference number
Author(s) Year Title Source (where different from company) Company name, Report No., Date, GLP status (where relevant), published or not
Data protect. claimed
Owner
AIIIa 9.1.3 /03 Kley, C.; Ellerich, C.
2008 Predicted environmental concentrations in groundwater (PECgw) for fluopicolide and its metabolites calculated with FOCUS PEARL and FOCUS PELMO - Use in vines in Europe BCS, Report No.: MEF-08/155, Edition Number: M-299231-01-1 Date: 2008-03-13 Non GLP, unpublished
Yes BCS
AIIIb 9.1.3 /03 Kley, C.; Ellerich, C.
2008 Predicted environmental concentrations in groundwater (PECgw) for fluopicolide and its metabolites calculated with FOCUS PEARL and FOCUS PELMO - Use in potatoes in Europe BCS, Report No.: MEF-08/154, Edition Number: M-299223-01-1 Date: 2008-03-13 Non GLP, unpublished
Yes BCS
DOC K b /09 Hellpointner, E.; Stupp, H. P.
2008 Statement (Version 2) - The light intensity measured during the studies on phototransformation of fluopicolide on soil surfaces and the transfer of experimental results to environmental phototransformation half-lives BCS, Report No.: M-300764-02-1, Edition Number: M-300764-02-1 Date: 2008-09-22 Non GLP, unpublished
Yes BCS
Fluopicolide - Addendum 2 December 2008
402
B.9 ECOTOXICOLOGY
New open point 5.13: RMS to include a note in the LoEP for the long-term risk assessment for herbivours mammals with the explanations, that the current risk assessment of mammals covers only one out of three applications in vineyards during early growth stages (up to BBCH 57).
New open point 5.14: RMS to revise LoEP with correct short-term bird endpoint.
The RMS has amended the List of Endpoints as requested.
Open point 5.5 RMS to include the information and argumentation regarding the ecotoxicological relevance of GW metabolites presented in column 3 in an addendum for the sake of completeness.
We agree that since the TER for M05 is >18519 (vine) and >58824 (potato) for algae and this metabolite is the one of highest concentration in the FOCUSgw modelling, apart from M01, the risk from M10, M11, M12 and M13 to aquatic organisms can be considered to be low. The information presented is however of value for the assessment of “pesticidal activity”.
No discussion in an experts meeting is required. See reporting table 5(27).
The RMS has reassessed the aquatic risk posed by groundwater metabolites formed >0.1ug/L using revised PECgw values (see Addendum 2, 2008) and included a table in the LOEPs. No risk to aquatic organisms is indicated. Other conclusions with respect to biological activity of the metabolites and the overall absence of relevance of fluopicolide GW metabolites from an ecotoxicological perspective remain as presented in Addendum 1, 2007.
Open point 5.6 RMS to correct the list of endpoint with exact %-age effect on fecundity instead of <50%. Note that highest conc. with effects <50% for A. rhopalosiphi was 2 L/ha See reporting table 5(38).
The RMS has amended the List of Endpoints as requested.
Fluopicolide - Addendum 2 December 2008
403
Open point 5.7 RMS to update the list of endpoints for earthworms. It is still not clear if the values for the formulation are based on a.s. or formulation concentrations. Furthermore, values should be given as mg/kg DS. Corrected calculations should be included in a corrigendum. See also the comment from the applicant on the reporting table to be discussed in an experts meeting. See reporting table 5(39).
The soil macroorganism LOEPs has been revised and are expressed as mg/kg d.wt. soil and to clarify where correction for logPow and soil organic matter is appropriate. Some TERs have been also been amended (see Open pt. 5.8). No change in low risk conclusion.
Data gap5.1 - identified at PRAPeR 38: ‘Notifier to address the ecotoxicological relevance of toluene in the technical material’. The RMS has considered the case proposed the Notifier (Pross, 2008). Ecotoxicological testing was undertaken using fluopicolide technical material (batches OP2050046, OP2050190, OP2350005, R001737, OP20500045) containing 0.1-0.4% w/w toluene (AEF125577) (see DAR Vol 4,Table C.1). Therefore the ecotoxicological risk assessment for technical fluopicolide essentially encompasses the risk from toluene in technical material (max. <0.5%w/w pilot plant; <0.3%w/w manufacturing plant – Volume 4, Addendum 2, C 2.2). Furthermore, the ecotoxicological profile of “pure” toluene shows it not to be more toxic than fluopicolide technical. A risk assessment using worse case toluene PECsoil (0.0009 mg/kg) and PECsw (0.000046 mg/L) initial values based on theoretical toluene content in fluopicolide PECs generate respective TERs of 16667, 16087 and 76087 with worse toxic toluene endpoints for worm(28dNOEC=15 mg/kg d.wt soil), Daphnia (96hEC50=3.5 mg/L) and Ceriodaphnia (7dNOEC=0.74 mg/L). The TERs clearly exceed relevant Annex VI EU 91/414 thresholds indicating low risk. Toluene also has low bioaccumulation potential (BCF=90). Thus all evidence indicates that environmental toluene derived from fluopicolide technical use in PPPs will not cause concern from an ecotoxicological perspective.
Fluopicolide - Addendum 2 December 2008
404
B.9.13 Additional References Relied On:
Annex point / reference number
Author(s) Year Title Source (where different from company) Company name, Report No., Date, GLP status (where relevant), published or not
Data protect. claimed
Owner
DOC K b /10 Pross, S. 2008 Ecotoxicological relevance of toluene as impurity in Fluopicolide technical material BCS, Report No.: M-300968-01-1, Edition Number: M-300968-01-1 Date: 2008-04-23 Non GLP, unpublished
Yes BCS

Fluopicolide - Addendum 2 December 2008
405
APPENDIX 1
Summary of the significant metabolites of fluopicolide identified in studies in animals, plants and the environment
M-Code number
(Company code
number)
Other identifiers
Structure Formula Presence in metabolism
studies
AE C638206 Fluopicolide (parent)
N
F3C Cl
NH
O
Cl
Cl
2,6-dichloro-N-{[3-chloro-5-(trifluoromethyl)-2-
pyridinyl]methyl}benzamide
C14H8Cl3F3N2O MW = 383.59
M-01 (AEC653711)
BAM
Cl
Cl
H2N
O
2,6-dichlorobenzamide C7H5Cl2NO MW = 190.0
rat liver, laying hen,
crop, soil,
lysimeter leachate, rotational
crop M-02
(AEC657188) PCA
UMET/2 N
F3C Cl
OH
O
3-chloro-5-trifluoromethyl-pyridine-2-carboxylic acid
C7H3ClF3NO2 MW = 225.6
rat, crop,
rotational crop, soil,
water M-05
(AE 1344122) P1x
RPA433497 N
F3C SOCH3
COOH
3-methylsulfinyl-5-trifluoro-methylpyridine-2-
carboxylic acid C8H6F3NO3S MW = 253
rotational crop,
lysimeter leachate,
M-04 (AEC657378)
3-hydroxy BAM
Cl
Cl
H2N
OOH
2,6-dichloro-3-hydroxy-benzamide
C7H5Cl2NO2 MW = 206
rotational crop
rat (BAM ADME study)
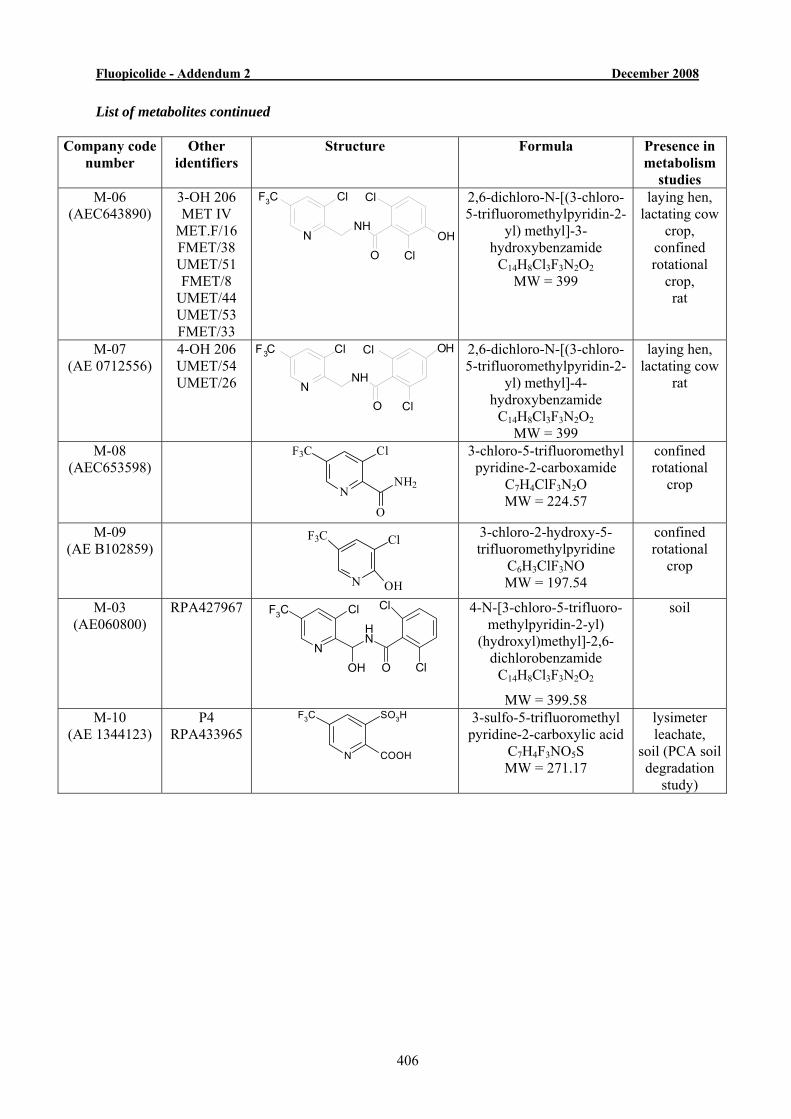
Fluopicolide - Addendum 2 December 2008
406
List of metabolites continued
Company code number
Other identifiers
Structure Formula Presence in metabolism
studies M-06
(AEC643890) 3-OH 206 MET IV
MET.F/16 FMET/38 UMET/51 FMET/8
UMET/44 UMET/53 FMET/33
N
F3C Cl
NH
O Cl
Cl
OH
2,6-dichloro-N-[(3-chloro-5-trifluoromethylpyridin-2-
yl) methyl]-3-hydroxybenzamide
C14H8Cl3F3N2O2 MW = 399
laying hen, lactating cow
crop, confined rotational
crop, rat
M-07 (AE 0712556)
4-OH 206 UMET/54 UMET/26 N
F3C Cl
NH
O Cl
Cl OH
2,6-dichloro-N-[(3-chloro-5-trifluoromethylpyridin-2-
yl) methyl]-4-hydroxybenzamide
C14H8Cl3F3N2O2 MW = 399
laying hen, lactating cow
rat
M-08 (AEC653598)
N
F3C Cl
NH2
O
3-chloro-5-trifluoromethyl pyridine-2-carboxamide
C7H4ClF3N2O MW = 224.57
confined rotational
crop
M-09 (AE B102859)
N OH
ClF3C
3-chloro-2-hydroxy-5-trifluoromethylpyridine
C6H3ClF3NO MW = 197.54
confined rotational
crop
M-03 (AE060800)
RPA427967
N
F3C Cl
OH
NH
O
Cl
Cl
4-N-[3-chloro-5-trifluoro-methylpyridin-2-yl)
(hydroxyl)methyl]-2,6-dichlorobenzamide
C14H8Cl3F3N2O2
MW = 399.58
soil
M-10 (AE 1344123)
P4 RPA433965
N
F3C SO3H
COOH
3-sulfo-5-trifluoromethyl pyridine-2-carboxylic acid
C7H4F3NO5S MW = 271.17
lysimeter leachate,
soil (PCA soil degradation
study)

Fluopicolide - Addendum 2 December 2008
407
List of metabolites continued Company code
number Other
identifiers Structure Formula Presence in
metabolism studies
M-11 M-12
P2 Mixture of 2 isomers (P2a and
P2b)
N
F 3 C
COOHOH
SO3H
isomers x-hydroxy -y-sulfo-5-trifluoromethylpyridine-
2-carboxylic acid C7H4F3NO6S MW = 287.17
lysimeter leachate,
soil (PCA soil degradation
study)
M-13 P3
N
F3C Cl
COOHOH
proposal not confirmed
C7H3ClF3NO3 MW = 241.3
lysimeter leachate,
M-14 (AE 1388273)
P7 RPA43398
6
F3C SO2CH3
N OH
3-mesyl-5-(trifluoromethyl) pyridin-2-ol C7H6F3NO3S MW = 241.19
lysimeter leachate,
soil (PCA soil degradation
study) M-15
(AE 1413903) P8
N
Cl
NH
O
Cl
Cl
F 3C SO 3H
3,5-dichloro-4-[3-chloro-5-trifluoromethylpyridine-2-
yl-methyl) carbamoyl]benzene
sulfonic acid C14H8Cl3F3N2O4S
MW = 463.65
lysimeter leachate,
M-16 P9 UMET/40 FMET/23 N
Cl
NH
O
ClF3C
SO3H
OH
3-chloro-2-[({3-chloro-5-trifluoromethylpyridine-2-
ylmethyl}amino) carbonyl]-6-
hydroxybenzene sulfonic acid
C14H9Cl2F3N2O5S MW = 444
lysimeter leachate,
rat
M-17 Metabolite 1
N
F3 Cl
NH
Cl
Cl
O
O
OS CH3
2,6-dichloro-N-{[3-chloro-5-(trifluoromethyl)pyridin-
2-yl]methyl}-3-(methylsulfonyl)benzamide
C15H10Cl3F3N2O3S MW = 462
laying hen

Fluopicolide - Addendum 2 December 2008
408
List of metabolites continued Company
code number
Other identifiers
Structure Formula Presence in metabolism
studies M-18 HS
(hydroxy sulphate of
fluopicolide) UMET/45 UMET/47
N
F3C Cl ClHN
O ClOSO3H
or
N
F3C Cl ClHN
O Cl
OSO3H
2,4-dichloro-3-[({[3-chloro-5-(trifluoromethyl)pyridin-
2-yl]methyl}amino)carbonyl]
phenyl hydrogen sulfate or
3,5-dichloro-4-[({[3-chloro-5-(trifluoromethyl)pyridin-
2-yl]methyl}amino)carbonyl]
phenyl hydrogen sulfate C14H7Cl3F3N2O5S
MW = 477
laying hen lactating cow
rat
M-19 DHS (dihydroxy sulphate of
fluopicolide) UMET/23 UMET/39 UMET/46 UMET/49
N
F3C Cl ClHN
O Cl
OH
OSO3H
3,5-dichloro-4-[({[3-chloro-5-(trifluoromethyl)pyridin-
2-yl]methyl}amino)carbonyl] hydroxyphenyl hydrogen
sulfate C14H7Cl3F3N2O6S
MW = 493
laying hen lactating cow
rat
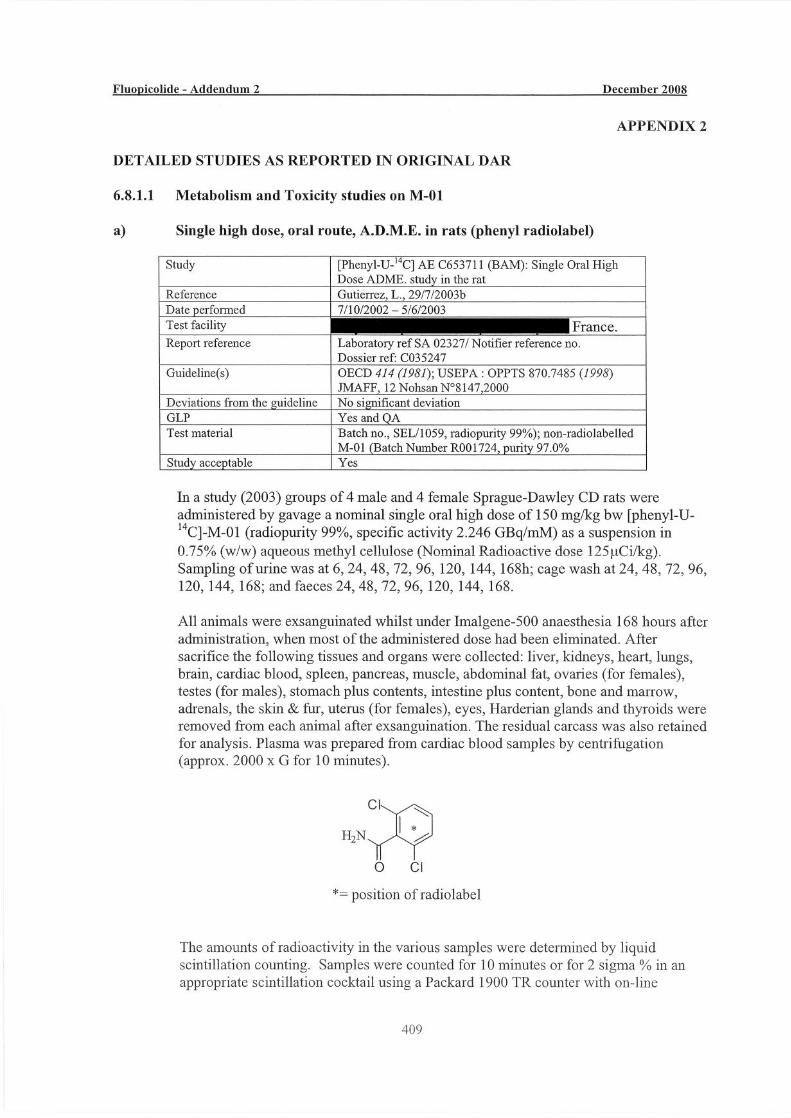
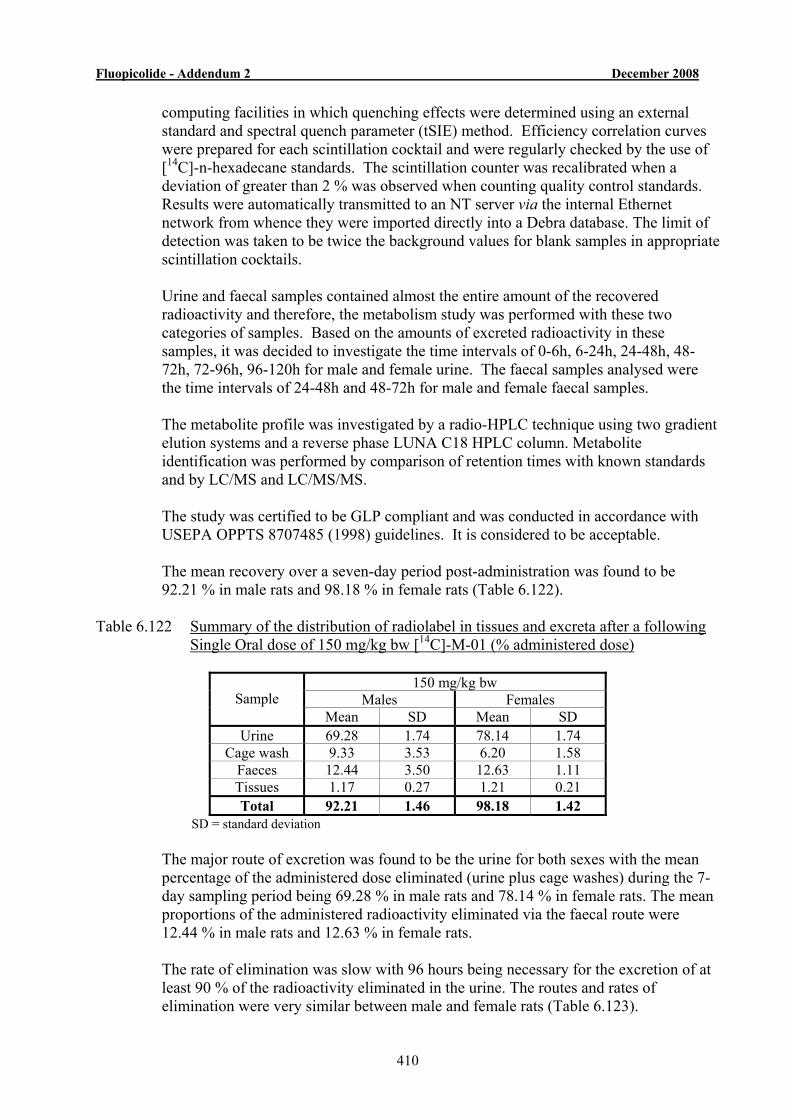
Fluopicolide - Addendum 2 December 2008
410
computing facilities in which quenching effects were determined using an external standard and spectral quench parameter (tSIE) method. Efficiency correlation curves were prepared for each scintillation cocktail and were regularly checked by the use of [14C]-n-hexadecane standards. The scintillation counter was recalibrated when a deviation of greater than 2 % was observed when counting quality control standards. Results were automatically transmitted to an NT server via the internal Ethernet network from whence they were imported directly into a Debra database. The limit of detection was taken to be twice the background values for blank samples in appropriate scintillation cocktails.
Urine and faecal samples contained almost the entire amount of the recovered
radioactivity and therefore, the metabolism study was performed with these two categories of samples. Based on the amounts of excreted radioactivity in these samples, it was decided to investigate the time intervals of 0-6h, 6-24h, 24-48h, 48-72h, 72-96h, 96-120h for male and female urine. The faecal samples analysed were the time intervals of 24-48h and 48-72h for male and female faecal samples.
The metabolite profile was investigated by a radio-HPLC technique using two gradient
elution systems and a reverse phase LUNA C18 HPLC column. Metabolite identification was performed by comparison of retention times with known standards and by LC/MS and LC/MS/MS.
The study was certified to be GLP compliant and was conducted in accordance with
USEPA OPPTS 8707485 (1998) guidelines. It is considered to be acceptable. The mean recovery over a seven-day period post-administration was found to be
92.21 % in male rats and 98.18 % in female rats (Table 6.122). Table 6.122 Summary of the distribution of radiolabel in tissues and excreta after a following
Single Oral dose of 150 mg/kg bw [14C]-M-01 (% administered dose)
150 mg/kg bw Males Females Sample
Mean SD Mean SD Urine 69.28 1.74 78.14 1.74
Cage wash 9.33 3.53 6.20 1.58 Faeces 12.44 3.50 12.63 1.11 Tissues 1.17 0.27 1.21 0.21 Total 92.21 1.46 98.18 1.42
SD = standard deviation The major route of excretion was found to be the urine for both sexes with the mean
percentage of the administered dose eliminated (urine plus cage washes) during the 7-day sampling period being 69.28 % in male rats and 78.14 % in female rats. The mean proportions of the administered radioactivity eliminated via the faecal route were 12.44 % in male rats and 12.63 % in female rats.
The rate of elimination was slow with 96 hours being necessary for the excretion of at
least 90 % of the radioactivity eliminated in the urine. The routes and rates of elimination were very similar between male and female rats (Table 6.123).
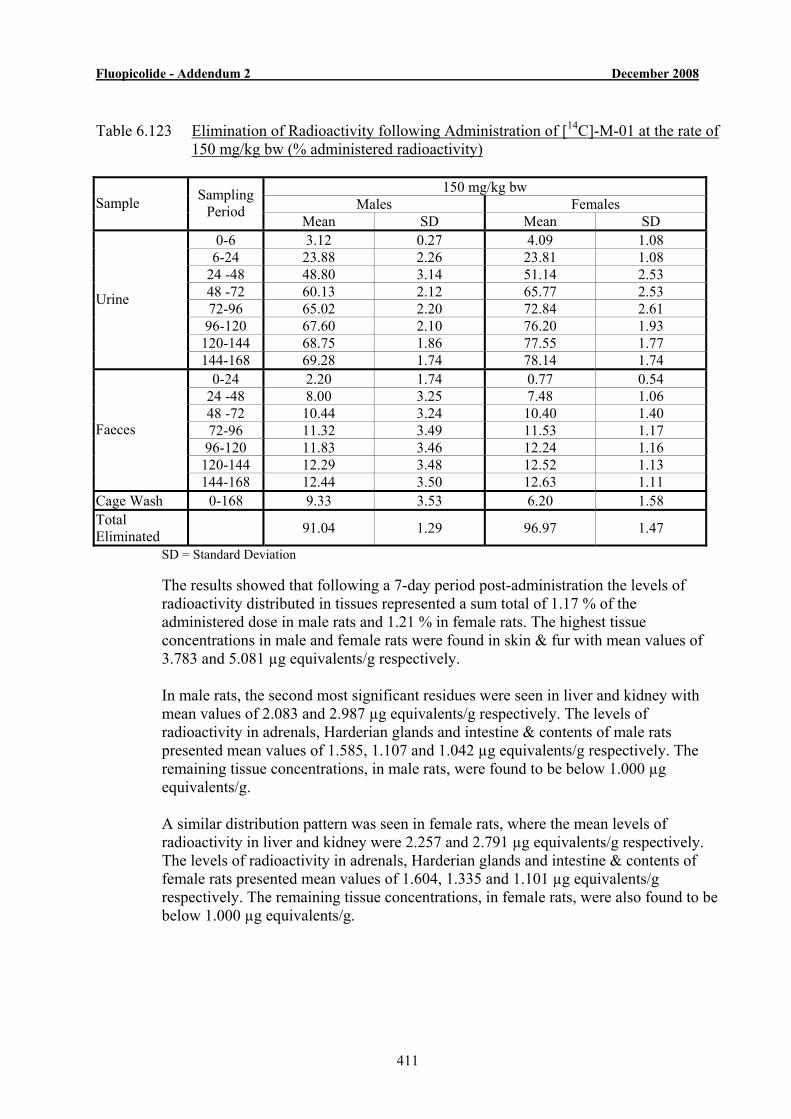
Fluopicolide - Addendum 2 December 2008
411
Table 6.123 Elimination of Radioactivity following Administration of [14C]-M-01 at the rate of
150 mg/kg bw (% administered radioactivity)
150 mg/kg bw Males Females Sample Sampling
Period Mean SD Mean SD
0-6 3.12 0.27 4.09 1.08 6-24 23.88 2.26 23.81 1.08
24 -48 48.80 3.14 51.14 2.53 48 -72 60.13 2.12 65.77 2.53 72-96 65.02 2.20 72.84 2.61
96-120 67.60 2.10 76.20 1.93 120-144 68.75 1.86 77.55 1.77
Urine
144-168 69.28 1.74 78.14 1.74 0-24 2.20 1.74 0.77 0.54
24 -48 8.00 3.25 7.48 1.06 48 -72 10.44 3.24 10.40 1.40 72-96 11.32 3.49 11.53 1.17
96-120 11.83 3.46 12.24 1.16 120-144 12.29 3.48 12.52 1.13
Faeces
144-168 12.44 3.50 12.63 1.11 Cage Wash 0-168 9.33 3.53 6.20 1.58 Total Eliminated 91.04 1.29 96.97 1.47
SD = Standard Deviation The results showed that following a 7-day period post-administration the levels of
radioactivity distributed in tissues represented a sum total of 1.17 % of the administered dose in male rats and 1.21 % in female rats. The highest tissue concentrations in male and female rats were found in skin & fur with mean values of 3.783 and 5.081 µg equivalents/g respectively.
In male rats, the second most significant residues were seen in liver and kidney with
mean values of 2.083 and 2.987 µg equivalents/g respectively. The levels of radioactivity in adrenals, Harderian glands and intestine & contents of male rats presented mean values of 1.585, 1.107 and 1.042 µg equivalents/g respectively. The remaining tissue concentrations, in male rats, were found to be below 1.000 µg equivalents/g.
A similar distribution pattern was seen in female rats, where the mean levels of
radioactivity in liver and kidney were 2.257 and 2.791 µg equivalents/g respectively. The levels of radioactivity in adrenals, Harderian glands and intestine & contents of female rats presented mean values of 1.604, 1.335 and 1.101 µg equivalents/g respectively. The remaining tissue concentrations, in female rats, were also found to be below 1.000 µg equivalents/g.
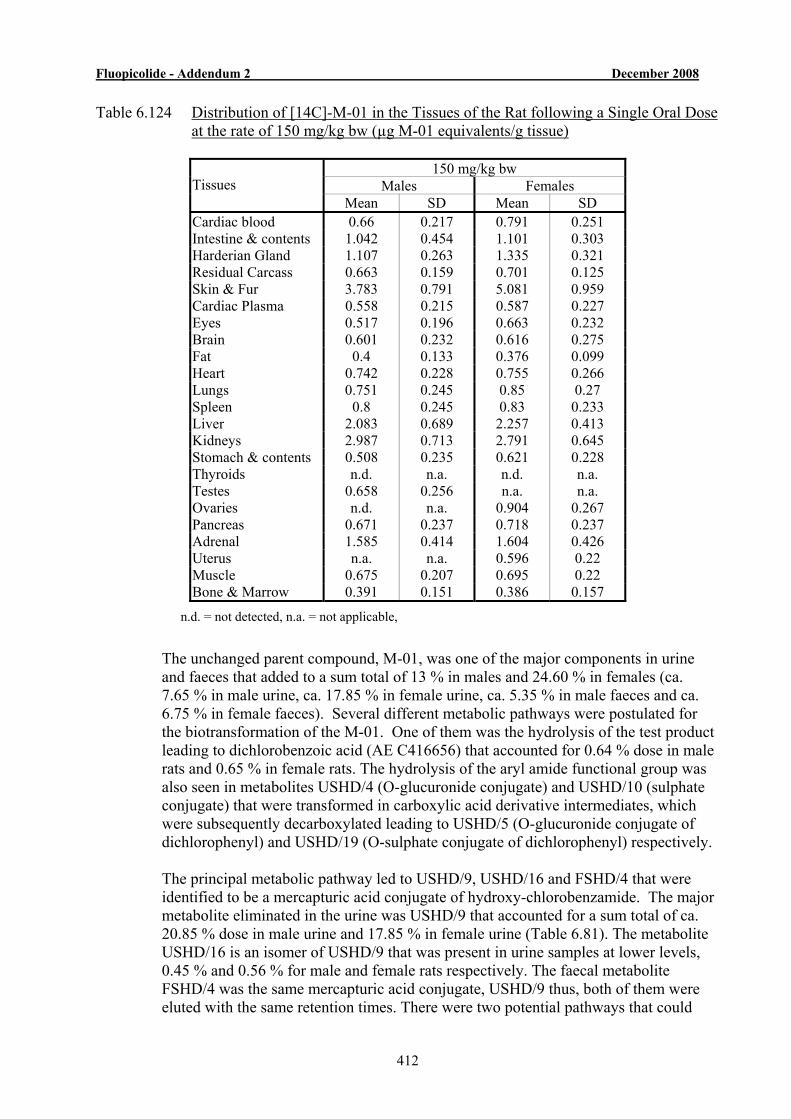
Fluopicolide - Addendum 2 December 2008
412
Table 6.124 Distribution of [14C]-M-01 in the Tissues of the Rat following a Single Oral Dose at the rate of 150 mg/kg bw (µg M-01 equivalents/g tissue)
150 mg/kg bw
Males Females Tissues Mean SD Mean SD
Cardiac blood 0.66 0.217 0.791 0.251 Intestine & contents 1.042 0.454 1.101 0.303 Harderian Gland 1.107 0.263 1.335 0.321 Residual Carcass 0.663 0.159 0.701 0.125 Skin & Fur 3.783 0.791 5.081 0.959 Cardiac Plasma 0.558 0.215 0.587 0.227 Eyes 0.517 0.196 0.663 0.232 Brain 0.601 0.232 0.616 0.275 Fat 0.4 0.133 0.376 0.099 Heart 0.742 0.228 0.755 0.266 Lungs 0.751 0.245 0.85 0.27 Spleen 0.8 0.245 0.83 0.233 Liver 2.083 0.689 2.257 0.413 Kidneys 2.987 0.713 2.791 0.645 Stomach & contents 0.508 0.235 0.621 0.228 Thyroids n.d. n.a. n.d. n.a. Testes 0.658 0.256 n.a. n.a. Ovaries n.d. n.a. 0.904 0.267 Pancreas 0.671 0.237 0.718 0.237 Adrenal 1.585 0.414 1.604 0.426 Uterus n.a. n.a. 0.596 0.22 Muscle 0.675 0.207 0.695 0.22 Bone & Marrow 0.391 0.151 0.386 0.157
n.d. = not detected, n.a. = not applicable,
The unchanged parent compound, M-01, was one of the major components in urine
and faeces that added to a sum total of 13 % in males and 24.60 % in females (ca. 7.65 % in male urine, ca. 17.85 % in female urine, ca. 5.35 % in male faeces and ca. 6.75 % in female faeces). Several different metabolic pathways were postulated for the biotransformation of the M-01. One of them was the hydrolysis of the test product leading to dichlorobenzoic acid (AE C416656) that accounted for 0.64 % dose in male rats and 0.65 % in female rats. The hydrolysis of the aryl amide functional group was also seen in metabolites USHD/4 (O-glucuronide conjugate) and USHD/10 (sulphate conjugate) that were transformed in carboxylic acid derivative intermediates, which were subsequently decarboxylated leading to USHD/5 (O-glucuronide conjugate of dichlorophenyl) and USHD/19 (O-sulphate conjugate of dichlorophenyl) respectively.
The principal metabolic pathway led to USHD/9, USHD/16 and FSHD/4 that were
identified to be a mercapturic acid conjugate of hydroxy-chlorobenzamide. The major metabolite eliminated in the urine was USHD/9 that accounted for a sum total of ca. 20.85 % dose in male urine and 17.85 % in female urine (Table 6.81). The metabolite USHD/16 is an isomer of USHD/9 that was present in urine samples at lower levels, 0.45 % and 0.56 % for male and female rats respectively. The faecal metabolite FSHD/4 was the same mercapturic acid conjugate, USHD/9 thus, both of them were eluted with the same retention times. There were two potential pathways that could
Fluopicolide - Addendum 2 December 2008
413
have led to the mercapturic acid conjugate of hydroxy-chlorobenzamide, the first one was the aromatic dehalogenation of M-01 that was subsequently followed by the action of glutathione S-transferase leading to a glutathione conjugate intermediate. The GS-intermediate would have been further biotransformed (losing glutamic acid and glycine) leading to a cysteine conjugate that was subsequently hydroxylated in the aromatic ring, resulting in USHD/6. The metabolite USHD/6 was the cysteine conjugate of hydroxy-chlorobenzamide that was subsequently N-acetylated leading to its derivative mercapturic acid conjugate. We have postulated that the aromatic position of the hydroxyl group and/or the S-cysteine group could have led to isomers (USHD/9 and USHD/16). The second proposed metabolic pathway leading to USHD/9, USHD/16 and FSHD/4 was the aromatic hydroxylation on the test product, which was subsequently dehalogenated and followed by the action of GSH enzymes, loss of glutamic acid and glycine. See the metabolic pathway described below for further details of the two biotransformation pathways leading to the major metabolite (mercapturic acid conjugate).
There were at least two different hydroxy derivative metabolites of M-01, one of them
was USHD/11 that was co-eluted with M-04, which was found in urine samples. The other one was an isomer of position (FSHD/7) that was seen in faeces. The hydroxyl metabolite was a potential intermediate leading to USHD/9, USHD/16 and FSHD/4, as described above, but was also the intermediate leading to O-glucuronide and O-sulphate conjugates, by the action of glucuronidase and sulphatase enzymes. A different glucuronide conjugate was USHD/8 that was obtained by the action of N-glucuronide enzymes. The metabolite USHD/8 added to a sum total of 0.53 % in male urine and 0.43 % in female urine. The metabolite USHD/6 accounted for ca. 4.52 % in male rats and ca. 10.76 % in female rats. USHD/6 was further metabolised by the action of glucuronide enzymes leading to USHD/3 that was identified to be the O-glucuronide conjugate derived from USHD/6. The metabolite USHD/3 accounted for a sum total of ca. 4.97 % in male urine and ca. 3.78 % in female urine. A different biotransformation of USHD/6 was obtained by the action of S-dealkylation enzymes (aryl cysteine lost) leading to thiomethyl hydroxy-chlorobenzamide (FSHD/8) that was subsequently metabolised by the action of sulphatase enzymes leading to O-sulphate conjugate of thiomethyl-chlorobenzamide (USHD/10). The thiomethyl hydroxy-chlorobenzamide (FSHD/8) could also have been obtained by hydroxylation of the thiomethyl intermediate (FSHD/10).
The distribution of identified metabolites in urine and faeces in presented in the
following table (Table 6.81).
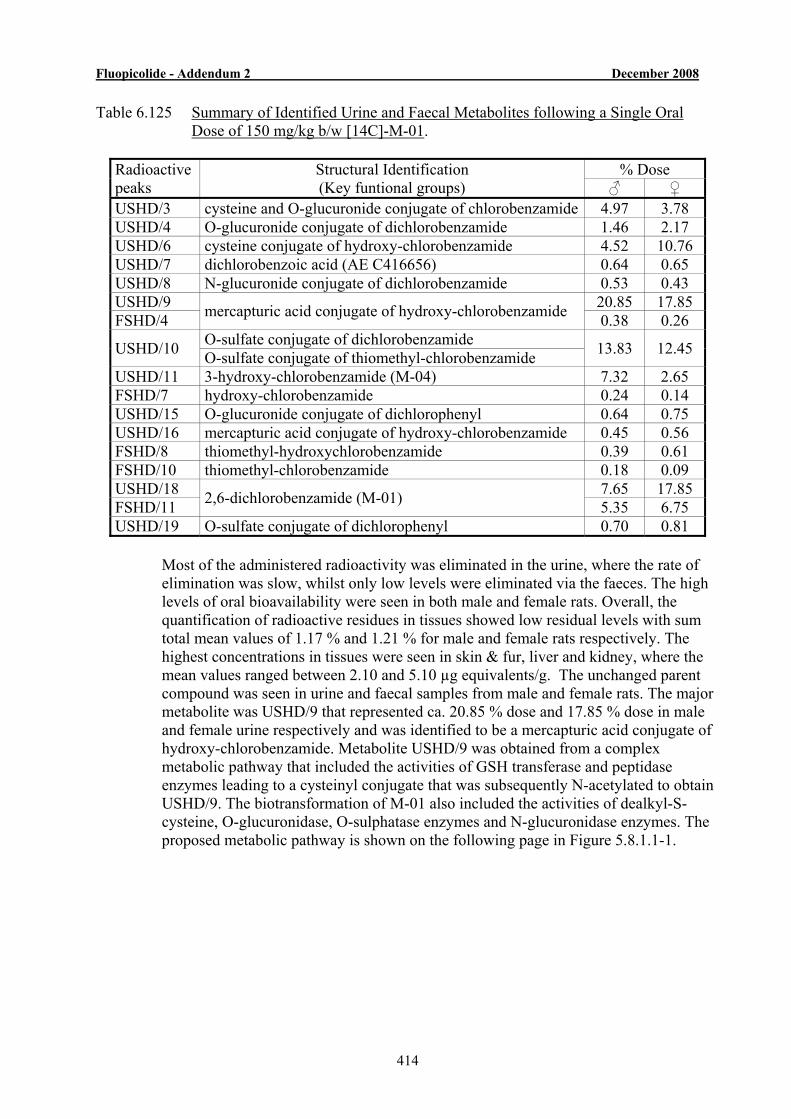
Fluopicolide - Addendum 2 December 2008
414
Table 6.125 Summary of Identified Urine and Faecal Metabolites following a Single Oral Dose of 150 mg/kg b/w [14C]-M-01.
% Dose Radioactive
peaks Structural Identification (Key funtional groups) ♂ ♀
USHD/3 cysteine and O-glucuronide conjugate of chlorobenzamide 4.97 3.78 USHD/4 O-glucuronide conjugate of dichlorobenzamide 1.46 2.17 USHD/6 cysteine conjugate of hydroxy-chlorobenzamide 4.52 10.76 USHD/7 dichlorobenzoic acid (AE C416656) 0.64 0.65 USHD/8 N-glucuronide conjugate of dichlorobenzamide 0.53 0.43 USHD/9 20.85 17.85 FSHD/4 mercapturic acid conjugate of hydroxy-chlorobenzamide 0.38 0.26
O-sulfate conjugate of dichlorobenzamide USHD/10 O-sulfate conjugate of thiomethyl-chlorobenzamide 13.83 12.45
USHD/11 3-hydroxy-chlorobenzamide (M-04) 7.32 2.65 FSHD/7 hydroxy-chlorobenzamide 0.24 0.14 USHD/15 O-glucuronide conjugate of dichlorophenyl 0.64 0.75 USHD/16 mercapturic acid conjugate of hydroxy-chlorobenzamide 0.45 0.56 FSHD/8 thiomethyl-hydroxychlorobenzamide 0.39 0.61 FSHD/10 thiomethyl-chlorobenzamide 0.18 0.09 USHD/18 7.65 17.85 FSHD/11 2,6-dichlorobenzamide (M-01) 5.35 6.75 USHD/19 O-sulfate conjugate of dichlorophenyl 0.70 0.81
Most of the administered radioactivity was eliminated in the urine, where the rate of
elimination was slow, whilst only low levels were eliminated via the faeces. The high levels of oral bioavailability were seen in both male and female rats. Overall, the quantification of radioactive residues in tissues showed low residual levels with sum total mean values of 1.17 % and 1.21 % for male and female rats respectively. The highest concentrations in tissues were seen in skin & fur, liver and kidney, where the mean values ranged between 2.10 and 5.10 µg equivalents/g. The unchanged parent compound was seen in urine and faecal samples from male and female rats. The major metabolite was USHD/9 that represented ca. 20.85 % dose and 17.85 % dose in male and female urine respectively and was identified to be a mercapturic acid conjugate of hydroxy-chlorobenzamide. Metabolite USHD/9 was obtained from a complex metabolic pathway that included the activities of GSH transferase and peptidase enzymes leading to a cysteinyl conjugate that was subsequently N-acetylated to obtain USHD/9. The biotransformation of M-01 also included the activities of dealkyl-S-cysteine, O-glucuronidase, O-sulphatase enzymes and N-glucuronidase enzymes. The proposed metabolic pathway is shown on the following page in Figure 5.8.1.1-1.
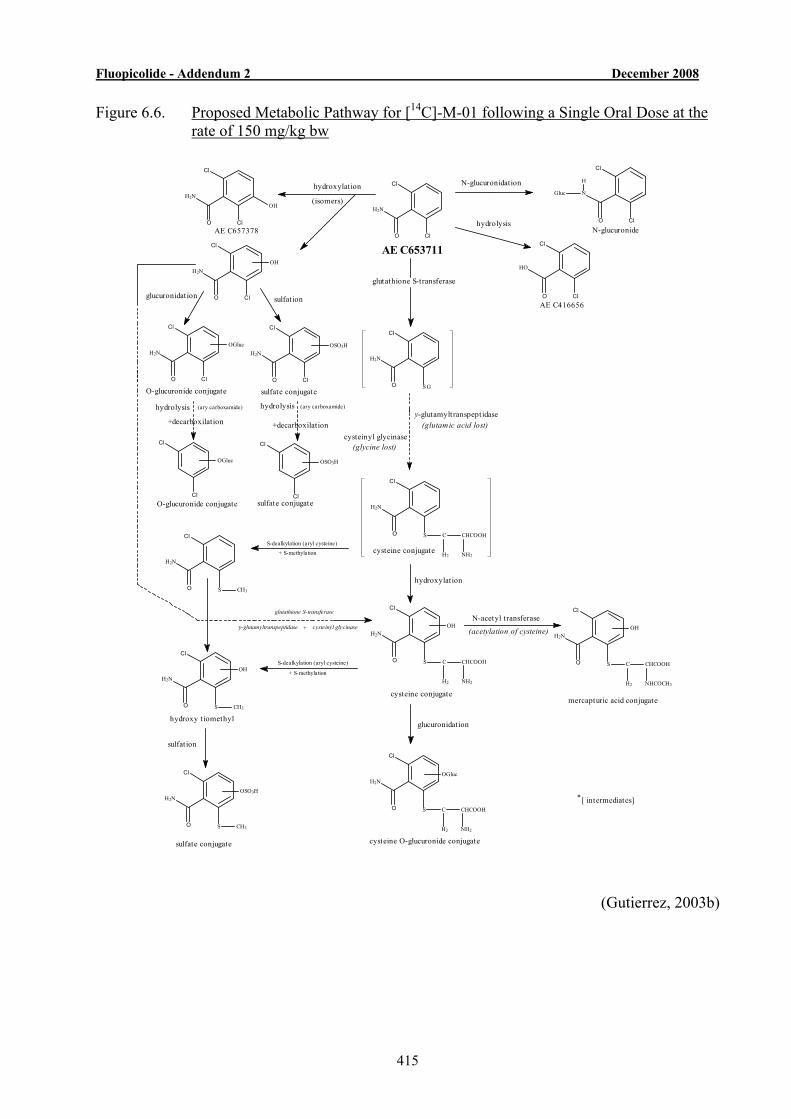
Fluopicolide - Addendum 2 December 2008
415
Figure 6.6. Proposed Metabolic Pathway for [14C]-M-01 following a Single Oral Dose at the rate of 150 mg/kg bw
H2N
O
Cl
Cl
OH
AE C653711
H
N
O
Cl
Cl
Gluc
H2N
O
Cl
Cl
H2N
O
Cl
Cl
OH
H2N
O
Cl
Cl
OGluc
hydroxylat ion
(isomers)
H2N
O
Cl
Cl
OSO3H
sulfat ionglucuronidat ion
hydrolysis
O
Cl
Cl
HO
N-glucuronidation
OGluc OSO3H
Cl
Cl
(glycine lost)
y-glutamyltranspept idase(glutamic acid lost)
AE C657378
AE C416656
sulfate conjugate
cysteinyl glycinase
H2N
O
Cl
S C
H2
CHCOOH
NH2
OGluc
H2N
O
Cl
S CH3
H2N
O
Cl
S C
H2
CHCOOH
NH2
OH
H2N
O
Cl
S C
H2
CHCOOH
NHCOCH3
OH
mercapturic acid conjugate
glucuronidation
H2N
O
Cl
S CH3
OH
hydroxylation
H2N
O
Cl
S CH3
OSO3H
sulfat ion
N-acetyl transferase
(acetylation of cysteine)
cysteine O-glucuronide conjugate
hydroxy t iomethyl
cysteine conjugate
sulfate conjugate
glutathione S-transferase
y-glutamyltranspeptidase + cysteinyl glycinase
H2N
O
Cl
S C
H2
CHCOOH
NH2cysteine conjugate
glutathione S-transferase
sulfate conjugate
O-glucuronide conjugate
O-glucuronide conjugate
N-glucuronide
[ intermediates]*
H2N
O
Cl
S G
S-dealkylation (aryl cysteine)+ S-methylation
S-dealkylation (aryl cysteine)
+ S-methylation
hydrolysis (ary carboxamide)
Cl
Cl
+decarboxilation
hydrolysis (ary carboxamide)
+decarboxilation
(Gutierrez, 2003b)
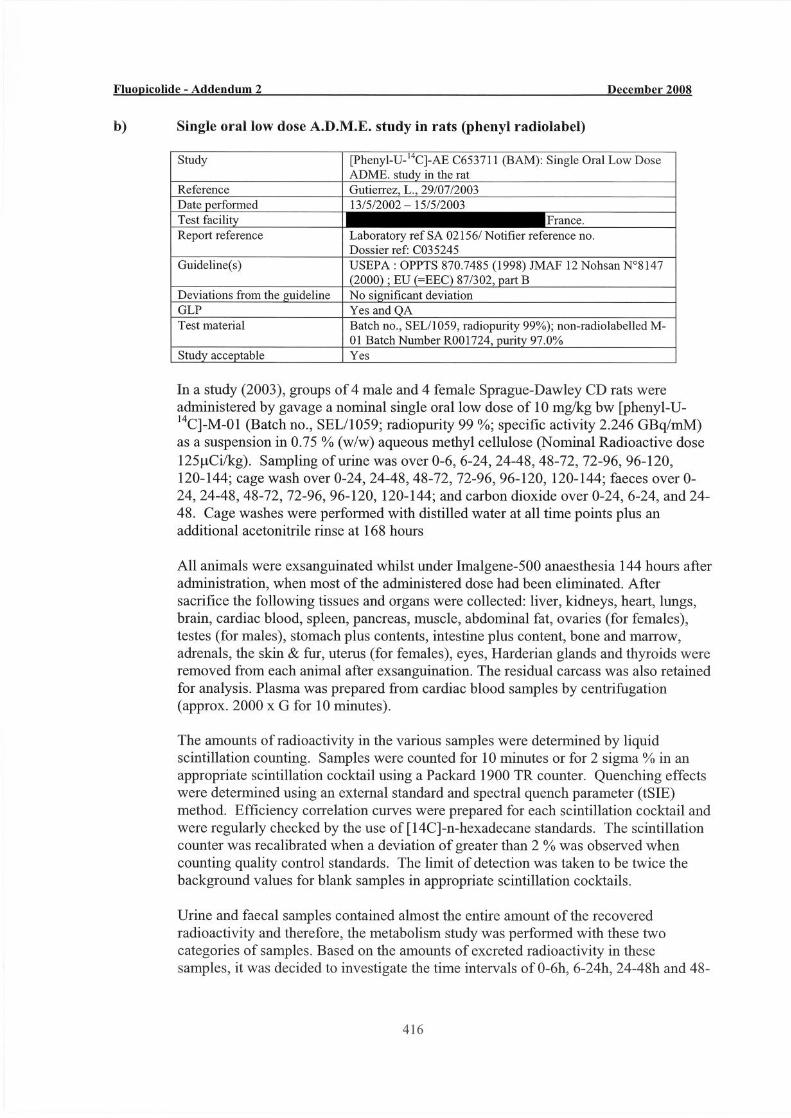
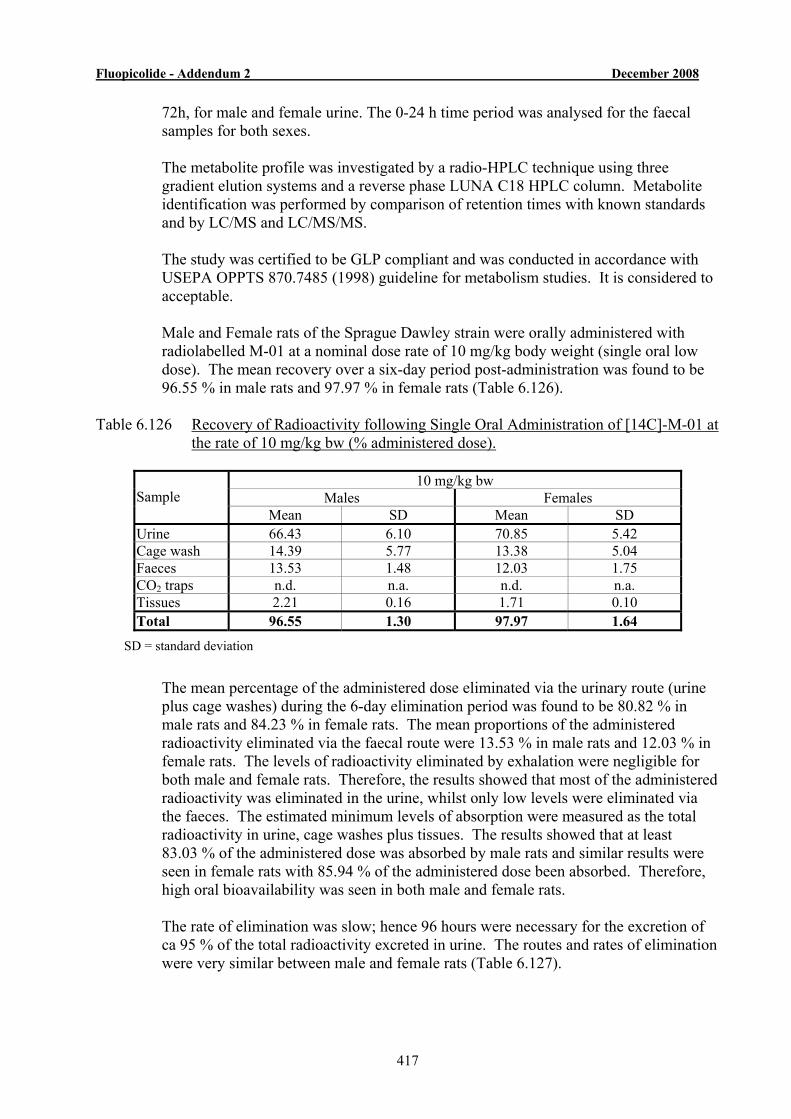
Fluopicolide - Addendum 2 December 2008
417
72h, for male and female urine. The 0-24 h time period was analysed for the faecal samples for both sexes.
The metabolite profile was investigated by a radio-HPLC technique using three
gradient elution systems and a reverse phase LUNA C18 HPLC column. Metabolite identification was performed by comparison of retention times with known standards and by LC/MS and LC/MS/MS.
The study was certified to be GLP compliant and was conducted in accordance with
USEPA OPPTS 870.7485 (1998) guideline for metabolism studies. It is considered to acceptable.
Male and Female rats of the Sprague Dawley strain were orally administered with
radiolabelled M-01 at a nominal dose rate of 10 mg/kg body weight (single oral low dose). The mean recovery over a six-day period post-administration was found to be 96.55 % in male rats and 97.97 % in female rats (Table 6.126).
Table 6.126 Recovery of Radioactivity following Single Oral Administration of [14C]-M-01 at
the rate of 10 mg/kg bw (% administered dose).
10 mg/kg bw Males Females Sample
Mean SD Mean SD Urine 66.43 6.10 70.85 5.42 Cage wash 14.39 5.77 13.38 5.04 Faeces 13.53 1.48 12.03 1.75 CO2 traps n.d. n.a. n.d. n.a. Tissues 2.21 0.16 1.71 0.10 Total 96.55 1.30 97.97 1.64
SD = standard deviation
The mean percentage of the administered dose eliminated via the urinary route (urine
plus cage washes) during the 6-day elimination period was found to be 80.82 % in male rats and 84.23 % in female rats. The mean proportions of the administered radioactivity eliminated via the faecal route were 13.53 % in male rats and 12.03 % in female rats. The levels of radioactivity eliminated by exhalation were negligible for both male and female rats. Therefore, the results showed that most of the administered radioactivity was eliminated in the urine, whilst only low levels were eliminated via the faeces. The estimated minimum levels of absorption were measured as the total radioactivity in urine, cage washes plus tissues. The results showed that at least 83.03 % of the administered dose was absorbed by male rats and similar results were seen in female rats with 85.94 % of the administered dose been absorbed. Therefore, high oral bioavailability was seen in both male and female rats.
The rate of elimination was slow; hence 96 hours were necessary for the excretion of
ca 95 % of the total radioactivity excreted in urine. The routes and rates of elimination were very similar between male and female rats (Table 6.127).
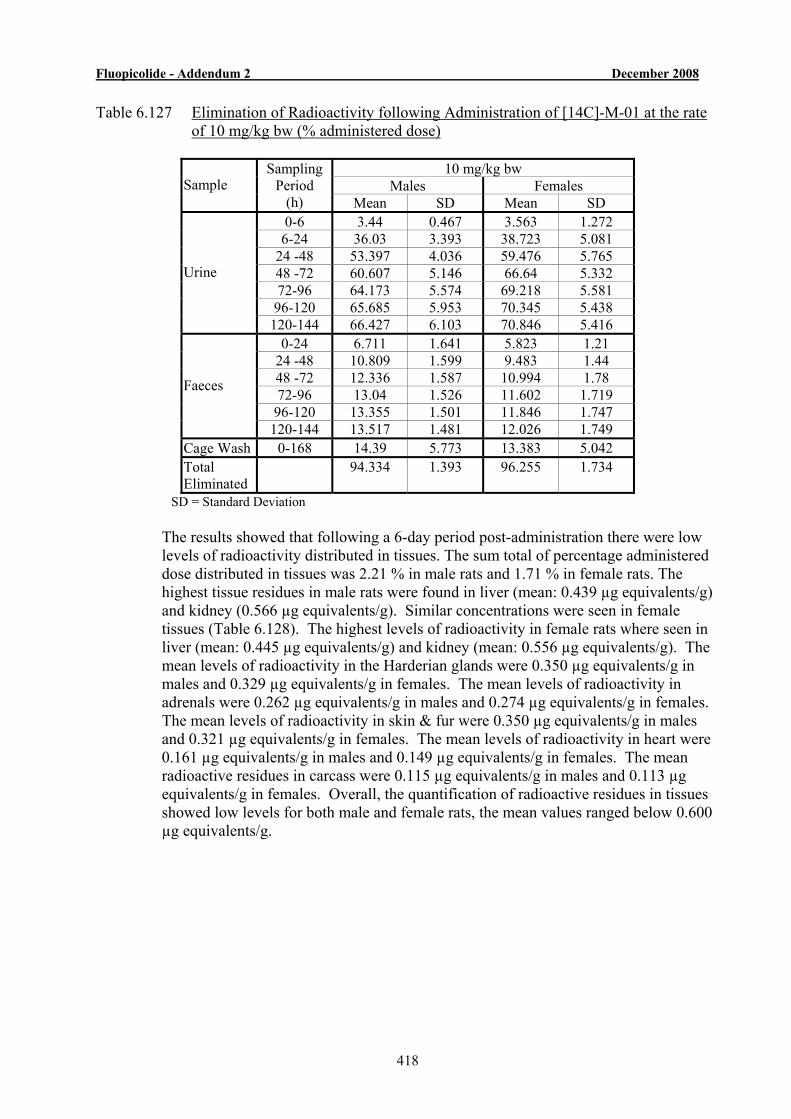
Fluopicolide - Addendum 2 December 2008
418
Table 6.127 Elimination of Radioactivity following Administration of [14C]-M-01 at the rate of 10 mg/kg bw (% administered dose)
10 mg/kg bw
Males Females Sample Sampling
Period (h) Mean SD Mean SD 0-6 3.44 0.467 3.563 1.272
6-24 36.03 3.393 38.723 5.081 24 -48 53.397 4.036 59.476 5.765 48 -72 60.607 5.146 66.64 5.332 72-96 64.173 5.574 69.218 5.581
96-120 65.685 5.953 70.345 5.438
Urine
120-144 66.427 6.103 70.846 5.416 0-24 6.711 1.641 5.823 1.21
24 -48 10.809 1.599 9.483 1.44 48 -72 12.336 1.587 10.994 1.78 72-96 13.04 1.526 11.602 1.719
96-120 13.355 1.501 11.846 1.747
Faeces
120-144 13.517 1.481 12.026 1.749 Cage Wash 0-168 14.39 5.773 13.383 5.042 Total Eliminated
94.334 1.393 96.255 1.734
SD = Standard Deviation The results showed that following a 6-day period post-administration there were low
levels of radioactivity distributed in tissues. The sum total of percentage administered dose distributed in tissues was 2.21 % in male rats and 1.71 % in female rats. The highest tissue residues in male rats were found in liver (mean: 0.439 µg equivalents/g) and kidney (0.566 µg equivalents/g). Similar concentrations were seen in female tissues (Table 6.128). The highest levels of radioactivity in female rats where seen in liver (mean: 0.445 µg equivalents/g) and kidney (mean: 0.556 µg equivalents/g). The mean levels of radioactivity in the Harderian glands were 0.350 µg equivalents/g in males and 0.329 µg equivalents/g in females. The mean levels of radioactivity in adrenals were 0.262 µg equivalents/g in males and 0.274 µg equivalents/g in females. The mean levels of radioactivity in skin & fur were 0.350 µg equivalents/g in males and 0.321 µg equivalents/g in females. The mean levels of radioactivity in heart were 0.161 µg equivalents/g in males and 0.149 µg equivalents/g in females. The mean radioactive residues in carcass were 0.115 µg equivalents/g in males and 0.113 µg equivalents/g in females. Overall, the quantification of radioactive residues in tissues showed low levels for both male and female rats, the mean values ranged below 0.600 µg equivalents/g.
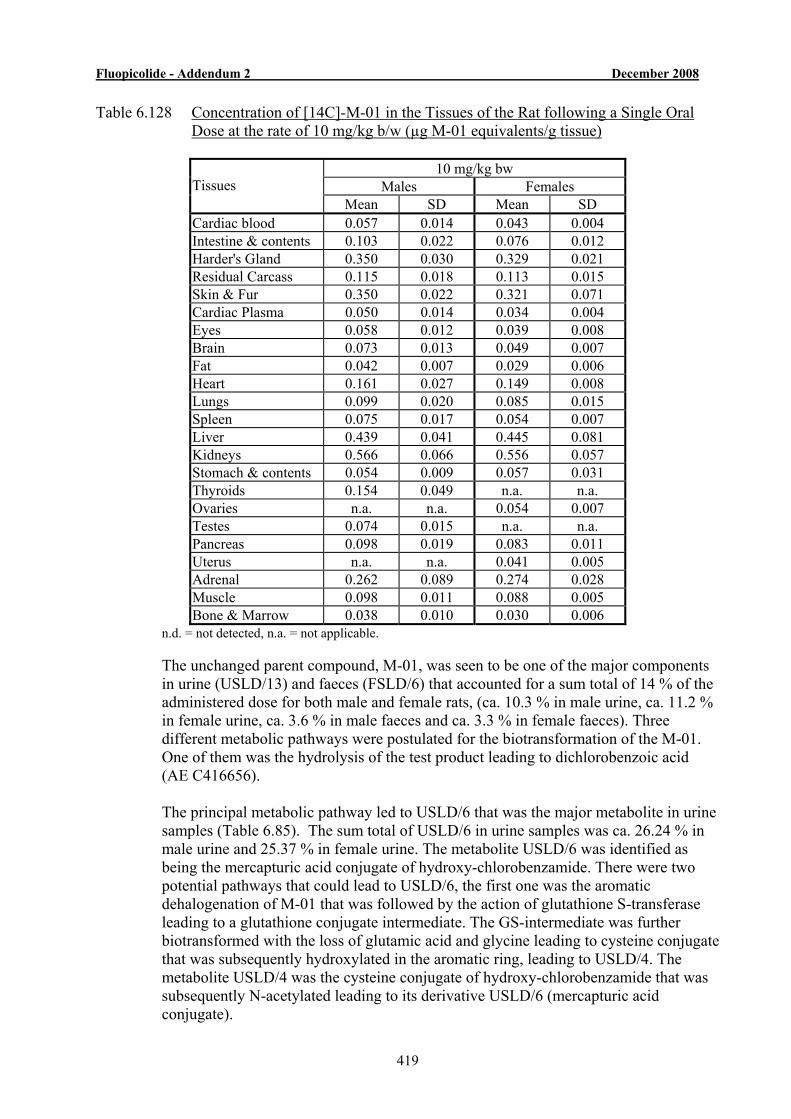
Fluopicolide - Addendum 2 December 2008
419
Table 6.128 Concentration of [14C]-M-01 in the Tissues of the Rat following a Single Oral Dose at the rate of 10 mg/kg b/w (µg M-01 equivalents/g tissue)
10 mg/kg bw
Males Females Tissues Mean SD Mean SD
Cardiac blood 0.057 0.014 0.043 0.004 Intestine & contents 0.103 0.022 0.076 0.012 Harder's Gland 0.350 0.030 0.329 0.021 Residual Carcass 0.115 0.018 0.113 0.015 Skin & Fur 0.350 0.022 0.321 0.071 Cardiac Plasma 0.050 0.014 0.034 0.004 Eyes 0.058 0.012 0.039 0.008 Brain 0.073 0.013 0.049 0.007 Fat 0.042 0.007 0.029 0.006 Heart 0.161 0.027 0.149 0.008 Lungs 0.099 0.020 0.085 0.015 Spleen 0.075 0.017 0.054 0.007 Liver 0.439 0.041 0.445 0.081 Kidneys 0.566 0.066 0.556 0.057 Stomach & contents 0.054 0.009 0.057 0.031 Thyroids 0.154 0.049 n.a. n.a. Ovaries n.a. n.a. 0.054 0.007 Testes 0.074 0.015 n.a. n.a. Pancreas 0.098 0.019 0.083 0.011 Uterus n.a. n.a. 0.041 0.005 Adrenal 0.262 0.089 0.274 0.028 Muscle 0.098 0.011 0.088 0.005 Bone & Marrow 0.038 0.010 0.030 0.006
n.d. = not detected, n.a. = not applicable. The unchanged parent compound, M-01, was seen to be one of the major components
in urine (USLD/13) and faeces (FSLD/6) that accounted for a sum total of 14 % of the administered dose for both male and female rats, (ca. 10.3 % in male urine, ca. 11.2 % in female urine, ca. 3.6 % in male faeces and ca. 3.3 % in female faeces). Three different metabolic pathways were postulated for the biotransformation of the M-01. One of them was the hydrolysis of the test product leading to dichlorobenzoic acid (AE C416656).
The principal metabolic pathway led to USLD/6 that was the major metabolite in urine
samples (Table 6.85). The sum total of USLD/6 in urine samples was ca. 26.24 % in male urine and 25.37 % in female urine. The metabolite USLD/6 was identified as being the mercapturic acid conjugate of hydroxy-chlorobenzamide. There were two potential pathways that could lead to USLD/6, the first one was the aromatic dehalogenation of M-01 that was followed by the action of glutathione S-transferase leading to a glutathione conjugate intermediate. The GS-intermediate was further biotransformed with the loss of glutamic acid and glycine leading to cysteine conjugate that was subsequently hydroxylated in the aromatic ring, leading to USLD/4. The metabolite USLD/4 was the cysteine conjugate of hydroxy-chlorobenzamide that was subsequently N-acetylated leading to its derivative USLD/6 (mercapturic acid conjugate).
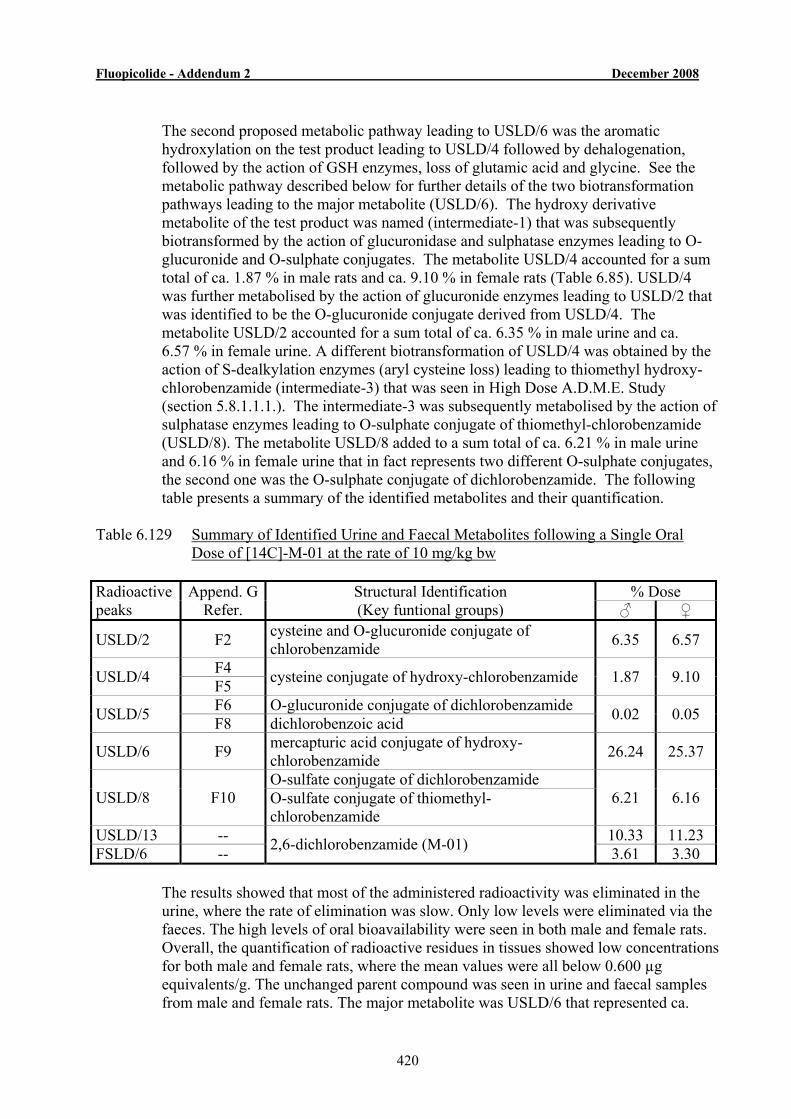
Fluopicolide - Addendum 2 December 2008
420
The second proposed metabolic pathway leading to USLD/6 was the aromatic
hydroxylation on the test product leading to USLD/4 followed by dehalogenation, followed by the action of GSH enzymes, loss of glutamic acid and glycine. See the metabolic pathway described below for further details of the two biotransformation pathways leading to the major metabolite (USLD/6). The hydroxy derivative metabolite of the test product was named (intermediate-1) that was subsequently biotransformed by the action of glucuronidase and sulphatase enzymes leading to O-glucuronide and O-sulphate conjugates. The metabolite USLD/4 accounted for a sum total of ca. 1.87 % in male rats and ca. 9.10 % in female rats (Table 6.85). USLD/4 was further metabolised by the action of glucuronide enzymes leading to USLD/2 that was identified to be the O-glucuronide conjugate derived from USLD/4. The metabolite USLD/2 accounted for a sum total of ca. 6.35 % in male urine and ca. 6.57 % in female urine. A different biotransformation of USLD/4 was obtained by the action of S-dealkylation enzymes (aryl cysteine loss) leading to thiomethyl hydroxy-chlorobenzamide (intermediate-3) that was seen in High Dose A.D.M.E. Study (section 5.8.1.1.1.). The intermediate-3 was subsequently metabolised by the action of sulphatase enzymes leading to O-sulphate conjugate of thiomethyl-chlorobenzamide (USLD/8). The metabolite USLD/8 added to a sum total of ca. 6.21 % in male urine and 6.16 % in female urine that in fact represents two different O-sulphate conjugates, the second one was the O-sulphate conjugate of dichlorobenzamide. The following table presents a summary of the identified metabolites and their quantification.
Table 6.129 Summary of Identified Urine and Faecal Metabolites following a Single Oral
Dose of [14C]-M-01 at the rate of 10 mg/kg bw
% Dose Radioactive peaks
Append. G Refer.
Structural Identification (Key funtional groups) ♂ ♀
USLD/2 F2 cysteine and O-glucuronide conjugate of chlorobenzamide 6.35 6.57
F4 USLD/4 F5 cysteine conjugate of hydroxy-chlorobenzamide 1.87 9.10
F6 O-glucuronide conjugate of dichlorobenzamide USLD/5 F8 dichlorobenzoic acid 0.02 0.05
USLD/6 F9 mercapturic acid conjugate of hydroxy-chlorobenzamide 26.24 25.37
O-sulfate conjugate of dichlorobenzamide USLD/8 F10 O-sulfate conjugate of thiomethyl-
chlorobenzamide 6.21 6.16
USLD/13 -- 10.33 11.23 FSLD/6 -- 2,6-dichlorobenzamide (M-01) 3.61 3.30
The results showed that most of the administered radioactivity was eliminated in the urine, where the rate of elimination was slow. Only low levels were eliminated via the faeces. The high levels of oral bioavailability were seen in both male and female rats. Overall, the quantification of radioactive residues in tissues showed low concentrations for both male and female rats, where the mean values were all below 0.600 µg equivalents/g. The unchanged parent compound was seen in urine and faecal samples from male and female rats. The major metabolite was USLD/6 that represented ca.
Fluopicolide - Addendum 2 December 2008
421
26.24 % and 25.37 % in male and female urine respectively and was identified to be a mercapturic acid conjugate of hydroxy-chlorobenzamide. Metabolite USLD/6 was obtained from a complex metabolic pathway that included the activities of GSH transferase and peptidase enzymes leading to a cysteinyl conjugate that was subsequently N-acetylated to obtain USLD/6. The biotransformation of M-01 also included the activities of dealkyl-S-cysteine, O-glucuronidase and O-sulphatase enzymes. The proposed metabolic pathway is shown on the following page in Figure 6.7.
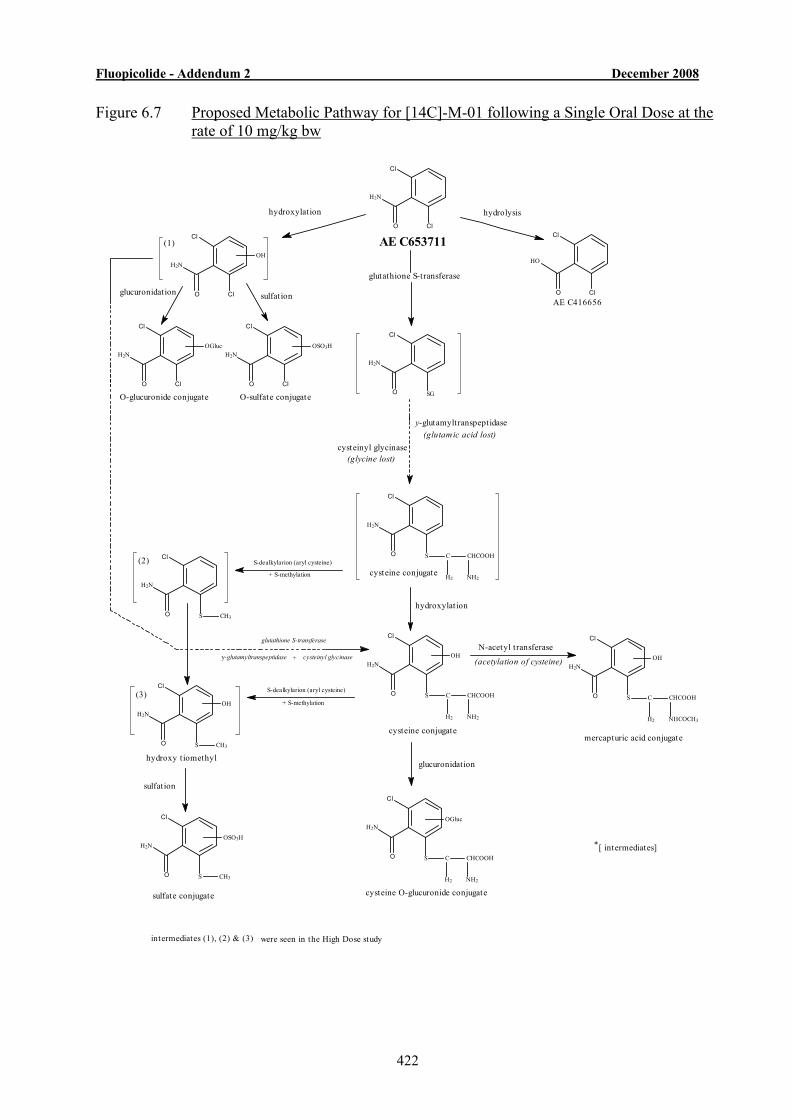
Fluopicolide - Addendum 2 December 2008
422
Figure 6.7 Proposed Metabolic Pathway for [14C]-M-01 following a Single Oral Dose at the rate of 10 mg/kg bw
AE C653711
H2N
O
Cl
Cl
H2N
O
Cl
Cl
OH
H2N
O
Cl
Cl
OGlucH2N
O
Cl
Cl
OSO3H
sulfat ionglucuronidation
hydrolysis
O
Cl
Cl
HO
(glycine lost)
y-glutamyltranspeptidase(glutamic acid lost)
AE C416656
cysteinyl glycinase
H2N
O
Cl
S C
H2
CHCOOH
NH2
OGluc
H2N
O
Cl
S CH3
H2N
O
Cl
S C
H2
CHCOOH
NH2
OH
H2N
O
Cl
S C
H2
CHCOOH
NHCOCH3
OH
mercapturic acid conjugate
glucuronidation
H2N
O
Cl
S CH3
OH
hydroxylation
H2N
O
Cl
S CH3
OSO3H
sulfat ion
N-acetyl t ransferase
(acetylation of cysteine)
cysteine O-glucuronide conjugate
hydroxy t iomethyl
cysteine conjugate
sulfate conjugate
glutathione S-transferase
y-glutamyltranspeptidase + cysteinyl glycinase
H2N
O
Cl
S C
H2
CHCOOH
NH2cysteine conjugate
glutathione S-transferase
O-glucuronide conjugate
[ intermediates]*
hydroxylation
(1)
(2)
(3)
intermediates (1), (2) & (3) were seen in the High Dose study
H2N
O
Cl
SG
S-dealkylarion (aryl cysteine)
S-dealkylarion (aryl cysteine)
+ S-methylation
+ S-methylation
O-sulfate conjugate
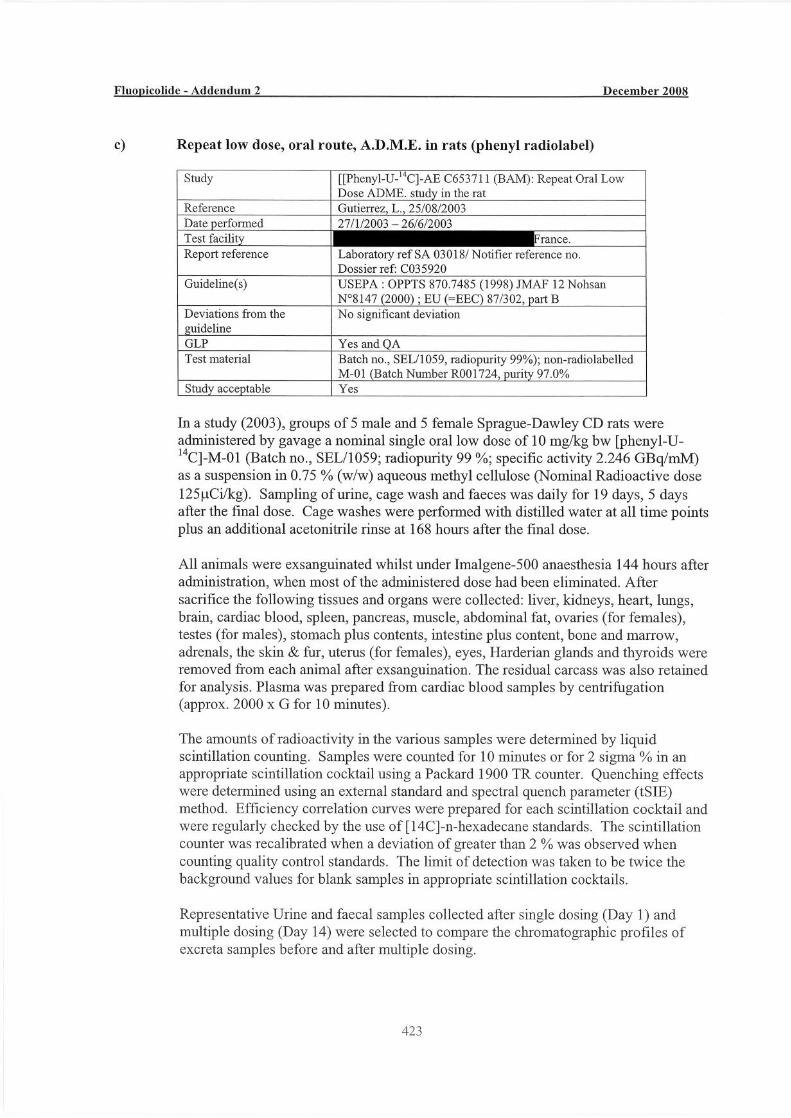
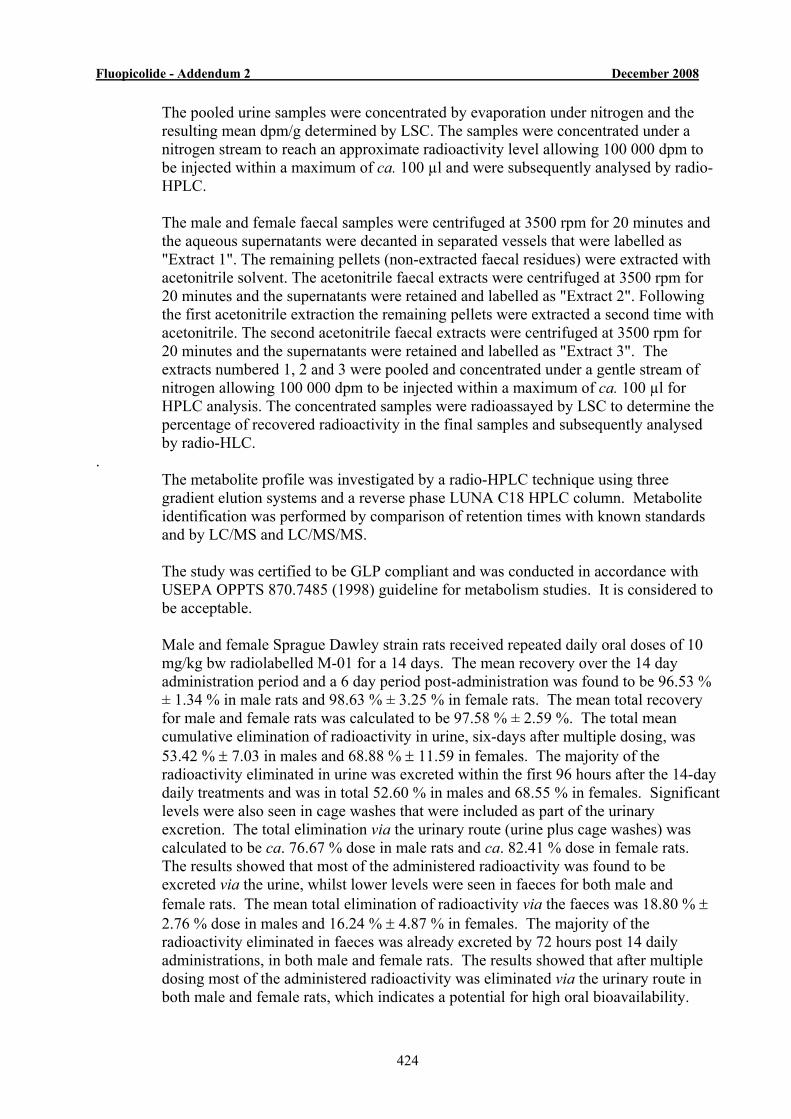
Fluopicolide - Addendum 2 December 2008
424
The pooled urine samples were concentrated by evaporation under nitrogen and the resulting mean dpm/g determined by LSC. The samples were concentrated under a nitrogen stream to reach an approximate radioactivity level allowing 100 000 dpm to be injected within a maximum of ca. 100 µl and were subsequently analysed by radio-HPLC.
The male and female faecal samples were centrifuged at 3500 rpm for 20 minutes and
the aqueous supernatants were decanted in separated vessels that were labelled as "Extract 1". The remaining pellets (non-extracted faecal residues) were extracted with acetonitrile solvent. The acetonitrile faecal extracts were centrifuged at 3500 rpm for 20 minutes and the supernatants were retained and labelled as "Extract 2". Following the first acetonitrile extraction the remaining pellets were extracted a second time with acetonitrile. The second acetonitrile faecal extracts were centrifuged at 3500 rpm for 20 minutes and the supernatants were retained and labelled as "Extract 3". The extracts numbered 1, 2 and 3 were pooled and concentrated under a gentle stream of nitrogen allowing 100 000 dpm to be injected within a maximum of ca. 100 µl for HPLC analysis. The concentrated samples were radioassayed by LSC to determine the percentage of recovered radioactivity in the final samples and subsequently analysed by radio-HLC.
. The metabolite profile was investigated by a radio-HPLC technique using three
gradient elution systems and a reverse phase LUNA C18 HPLC column. Metabolite identification was performed by comparison of retention times with known standards and by LC/MS and LC/MS/MS.
The study was certified to be GLP compliant and was conducted in accordance with
USEPA OPPTS 870.7485 (1998) guideline for metabolism studies. It is considered to be acceptable.
Male and female Sprague Dawley strain rats received repeated daily oral doses of 10
mg/kg bw radiolabelled M-01 for a 14 days. The mean recovery over the 14 day administration period and a 6 day period post-administration was found to be 96.53 % ± 1.34 % in male rats and 98.63 % ± 3.25 % in female rats. The mean total recovery for male and female rats was calculated to be 97.58 % ± 2.59 %. The total mean cumulative elimination of radioactivity in urine, six-days after multiple dosing, was 53.42 % ± 7.03 in males and 68.88 % ± 11.59 in females. The majority of the radioactivity eliminated in urine was excreted within the first 96 hours after the 14-day daily treatments and was in total 52.60 % in males and 68.55 % in females. Significant levels were also seen in cage washes that were included as part of the urinary excretion. The total elimination via the urinary route (urine plus cage washes) was calculated to be ca. 76.67 % dose in male rats and ca. 82.41 % dose in female rats. The results showed that most of the administered radioactivity was found to be excreted via the urine, whilst lower levels were seen in faeces for both male and female rats. The mean total elimination of radioactivity via the faeces was 18.80 % ± 2.76 % dose in males and 16.24 % ± 4.87 % in females. The majority of the radioactivity eliminated in faeces was already excreted by 72 hours post 14 daily administrations, in both male and female rats. The results showed that after multiple dosing most of the administered radioactivity was eliminated via the urinary route in both male and female rats, which indicates a potential for high oral bioavailability.
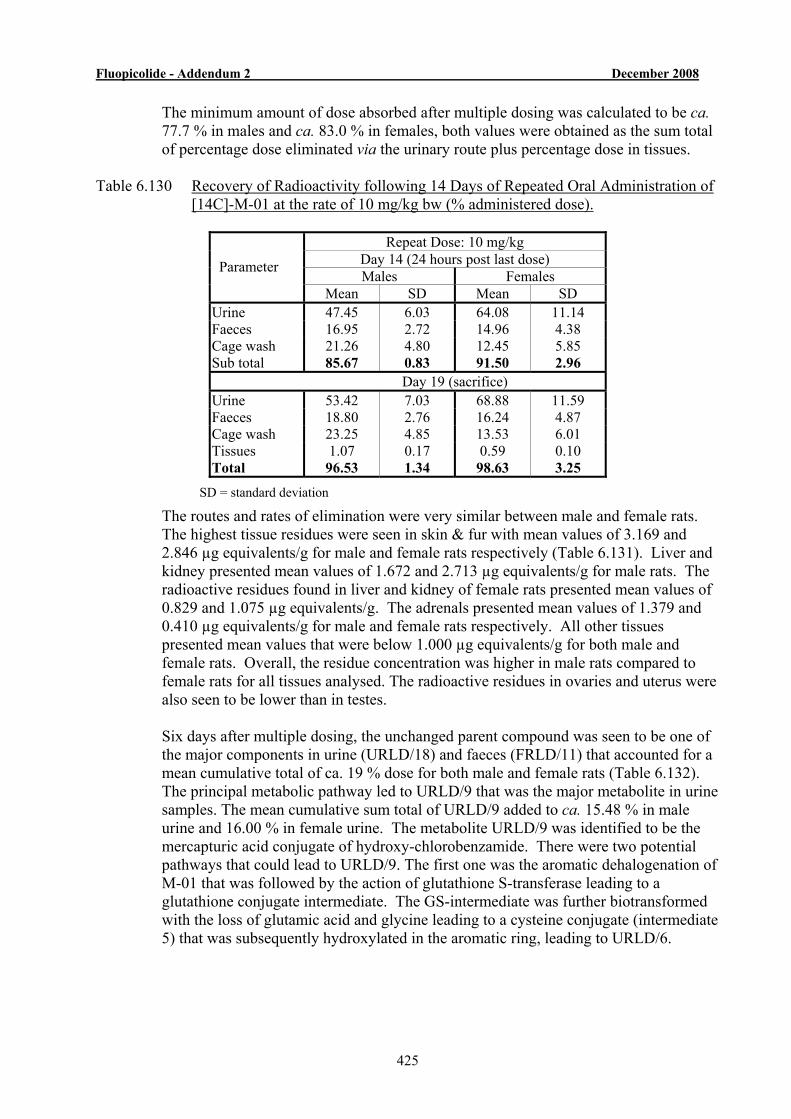
Fluopicolide - Addendum 2 December 2008
425
The minimum amount of dose absorbed after multiple dosing was calculated to be ca. 77.7 % in males and ca. 83.0 % in females, both values were obtained as the sum total of percentage dose eliminated via the urinary route plus percentage dose in tissues.
Table 6.130 Recovery of Radioactivity following 14 Days of Repeated Oral Administration of
[14C]-M-01 at the rate of 10 mg/kg bw (% administered dose).
Repeat Dose: 10 mg/kg Day 14 (24 hours post last dose) Males Females Parameter
Mean SD Mean SD Urine 47.45 6.03 64.08 11.14 Faeces 16.95 2.72 14.96 4.38 Cage wash 21.26 4.80 12.45 5.85 Sub total 85.67 0.83 91.50 2.96 Day 19 (sacrifice) Urine 53.42 7.03 68.88 11.59 Faeces 18.80 2.76 16.24 4.87 Cage wash 23.25 4.85 13.53 6.01 Tissues 1.07 0.17 0.59 0.10 Total 96.53 1.34 98.63 3.25
SD = standard deviation
The routes and rates of elimination were very similar between male and female rats. The highest tissue residues were seen in skin & fur with mean values of 3.169 and 2.846 µg equivalents/g for male and female rats respectively (Table 6.131). Liver and kidney presented mean values of 1.672 and 2.713 µg equivalents/g for male rats. The radioactive residues found in liver and kidney of female rats presented mean values of 0.829 and 1.075 µg equivalents/g. The adrenals presented mean values of 1.379 and 0.410 µg equivalents/g for male and female rats respectively. All other tissues presented mean values that were below 1.000 µg equivalents/g for both male and female rats. Overall, the residue concentration was higher in male rats compared to female rats for all tissues analysed. The radioactive residues in ovaries and uterus were also seen to be lower than in testes.
Six days after multiple dosing, the unchanged parent compound was seen to be one of
the major components in urine (URLD/18) and faeces (FRLD/11) that accounted for a mean cumulative total of ca. 19 % dose for both male and female rats (Table 6.132). The principal metabolic pathway led to URLD/9 that was the major metabolite in urine samples. The mean cumulative sum total of URLD/9 added to ca. 15.48 % in male urine and 16.00 % in female urine. The metabolite URLD/9 was identified to be the mercapturic acid conjugate of hydroxy-chlorobenzamide. There were two potential pathways that could lead to URLD/9. The first one was the aromatic dehalogenation of M-01 that was followed by the action of glutathione S-transferase leading to a glutathione conjugate intermediate. The GS-intermediate was further biotransformed with the loss of glutamic acid and glycine leading to a cysteine conjugate (intermediate 5) that was subsequently hydroxylated in the aromatic ring, leading to URLD/6.
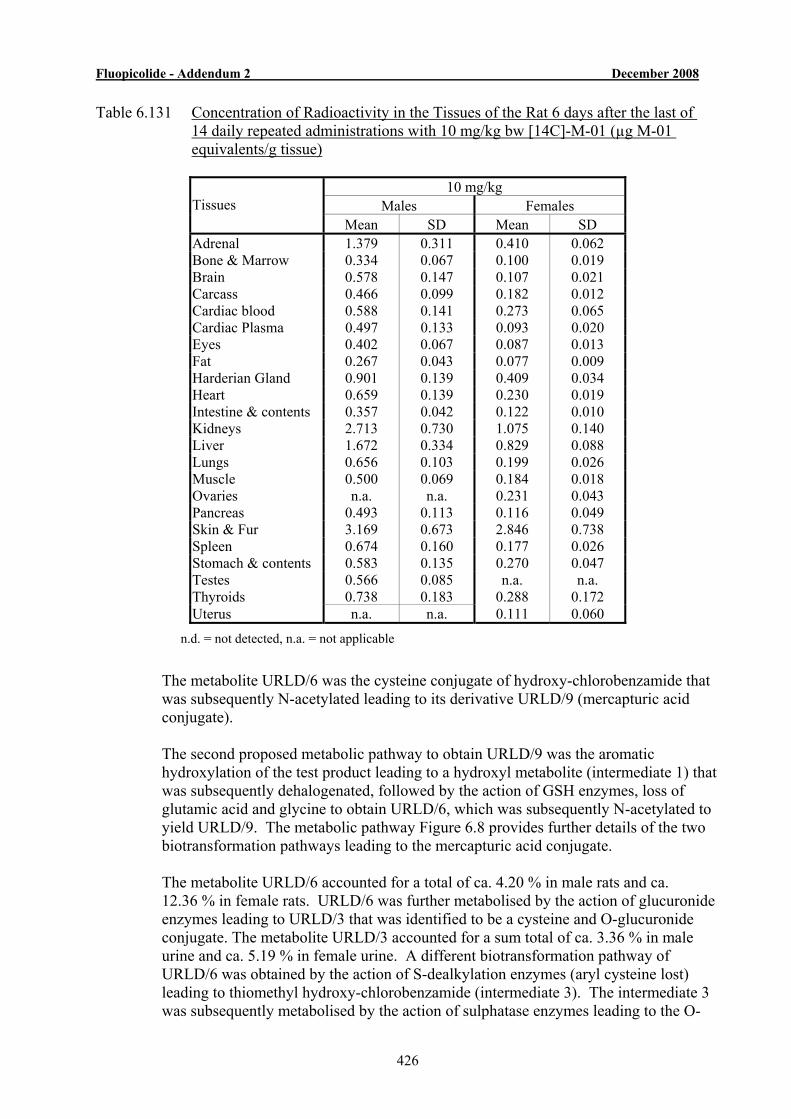
Fluopicolide - Addendum 2 December 2008
426
Table 6.131 Concentration of Radioactivity in the Tissues of the Rat 6 days after the last of 14 daily repeated administrations with 10 mg/kg bw [14C]-M-01 (µg M-01 equivalents/g tissue)
10 mg/kg
Males Females Tissues Mean SD Mean SD
Adrenal 1.379 0.311 0.410 0.062 Bone & Marrow 0.334 0.067 0.100 0.019 Brain 0.578 0.147 0.107 0.021 Carcass 0.466 0.099 0.182 0.012 Cardiac blood 0.588 0.141 0.273 0.065 Cardiac Plasma 0.497 0.133 0.093 0.020 Eyes 0.402 0.067 0.087 0.013 Fat 0.267 0.043 0.077 0.009 Harderian Gland 0.901 0.139 0.409 0.034 Heart 0.659 0.139 0.230 0.019 Intestine & contents 0.357 0.042 0.122 0.010 Kidneys 2.713 0.730 1.075 0.140 Liver 1.672 0.334 0.829 0.088 Lungs 0.656 0.103 0.199 0.026 Muscle 0.500 0.069 0.184 0.018 Ovaries n.a. n.a. 0.231 0.043 Pancreas 0.493 0.113 0.116 0.049 Skin & Fur 3.169 0.673 2.846 0.738 Spleen 0.674 0.160 0.177 0.026 Stomach & contents 0.583 0.135 0.270 0.047 Testes 0.566 0.085 n.a. n.a. Thyroids 0.738 0.183 0.288 0.172 Uterus n.a. n.a. 0.111 0.060
n.d. = not detected, n.a. = not applicable
The metabolite URLD/6 was the cysteine conjugate of hydroxy-chlorobenzamide that
was subsequently N-acetylated leading to its derivative URLD/9 (mercapturic acid conjugate).
The second proposed metabolic pathway to obtain URLD/9 was the aromatic
hydroxylation of the test product leading to a hydroxyl metabolite (intermediate 1) that was subsequently dehalogenated, followed by the action of GSH enzymes, loss of glutamic acid and glycine to obtain URLD/6, which was subsequently N-acetylated to yield URLD/9. The metabolic pathway Figure 6.8 provides further details of the two biotransformation pathways leading to the mercapturic acid conjugate.
The metabolite URLD/6 accounted for a total of ca. 4.20 % in male rats and ca.
12.36 % in female rats. URLD/6 was further metabolised by the action of glucuronide enzymes leading to URLD/3 that was identified to be a cysteine and O-glucuronide conjugate. The metabolite URLD/3 accounted for a sum total of ca. 3.36 % in male urine and ca. 5.19 % in female urine. A different biotransformation pathway of URLD/6 was obtained by the action of S-dealkylation enzymes (aryl cysteine lost) leading to thiomethyl hydroxy-chlorobenzamide (intermediate 3). The intermediate 3 was subsequently metabolised by the action of sulphatase enzymes leading to the O-
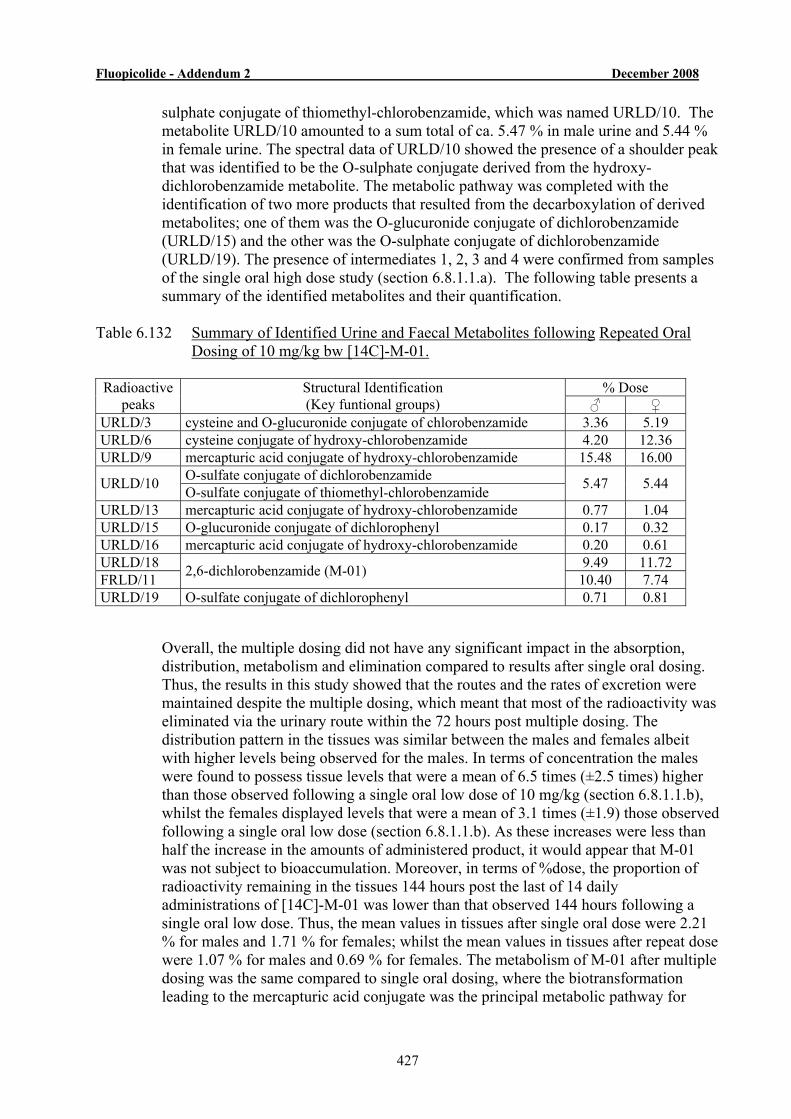
Fluopicolide - Addendum 2 December 2008
427
sulphate conjugate of thiomethyl-chlorobenzamide, which was named URLD/10. The metabolite URLD/10 amounted to a sum total of ca. 5.47 % in male urine and 5.44 % in female urine. The spectral data of URLD/10 showed the presence of a shoulder peak that was identified to be the O-sulphate conjugate derived from the hydroxy-dichlorobenzamide metabolite. The metabolic pathway was completed with the identification of two more products that resulted from the decarboxylation of derived metabolites; one of them was the O-glucuronide conjugate of dichlorobenzamide (URLD/15) and the other was the O-sulphate conjugate of dichlorobenzamide (URLD/19). The presence of intermediates 1, 2, 3 and 4 were confirmed from samples of the single oral high dose study (section 6.8.1.1.a). The following table presents a summary of the identified metabolites and their quantification.
Table 6.132 Summary of Identified Urine and Faecal Metabolites following Repeated Oral
Dosing of 10 mg/kg bw [14C]-M-01.
% Dose Radioactive peaks
Structural Identification (Key funtional groups) ♂ ♀
URLD/3 cysteine and O-glucuronide conjugate of chlorobenzamide 3.36 5.19 URLD/6 cysteine conjugate of hydroxy-chlorobenzamide 4.20 12.36 URLD/9 mercapturic acid conjugate of hydroxy-chlorobenzamide 15.48 16.00
O-sulfate conjugate of dichlorobenzamide URLD/10 O-sulfate conjugate of thiomethyl-chlorobenzamide 5.47 5.44
URLD/13 mercapturic acid conjugate of hydroxy-chlorobenzamide 0.77 1.04 URLD/15 O-glucuronide conjugate of dichlorophenyl 0.17 0.32 URLD/16 mercapturic acid conjugate of hydroxy-chlorobenzamide 0.20 0.61 URLD/18 9.49 11.72 FRLD/11 2,6-dichlorobenzamide (M-01) 10.40 7.74 URLD/19 O-sulfate conjugate of dichlorophenyl 0.71 0.81
Overall, the multiple dosing did not have any significant impact in the absorption,
distribution, metabolism and elimination compared to results after single oral dosing. Thus, the results in this study showed that the routes and the rates of excretion were maintained despite the multiple dosing, which meant that most of the radioactivity was eliminated via the urinary route within the 72 hours post multiple dosing. The distribution pattern in the tissues was similar between the males and females albeit with higher levels being observed for the males. In terms of concentration the males were found to possess tissue levels that were a mean of 6.5 times (±2.5 times) higher than those observed following a single oral low dose of 10 mg/kg (section 6.8.1.1.b), whilst the females displayed levels that were a mean of 3.1 times (±1.9) those observed following a single oral low dose (section 6.8.1.1.b). As these increases were less than half the increase in the amounts of administered product, it would appear that M-01 was not subject to bioaccumulation. Moreover, in terms of %dose, the proportion of radioactivity remaining in the tissues 144 hours post the last of 14 daily administrations of [14C]-M-01 was lower than that observed 144 hours following a single oral low dose. Thus, the mean values in tissues after single oral dose were 2.21 % for males and 1.71 % for females; whilst the mean values in tissues after repeat dose were 1.07 % for males and 0.69 % for females. The metabolism of M-01 after multiple dosing was the same compared to single oral dosing, where the biotransformation leading to the mercapturic acid conjugate was the principal metabolic pathway for
Fluopicolide - Addendum 2 December 2008
428
elimination of the test product. The metabolism of M-01 was completed with the excretion of several O-sulphate and O-glucuronide conjugates that were mainly eliminated in urine. The unchanged pared compound was seen in urine and faecal samples.
The proposed metabolic pathway is shown on the following page in Figure 6.8.
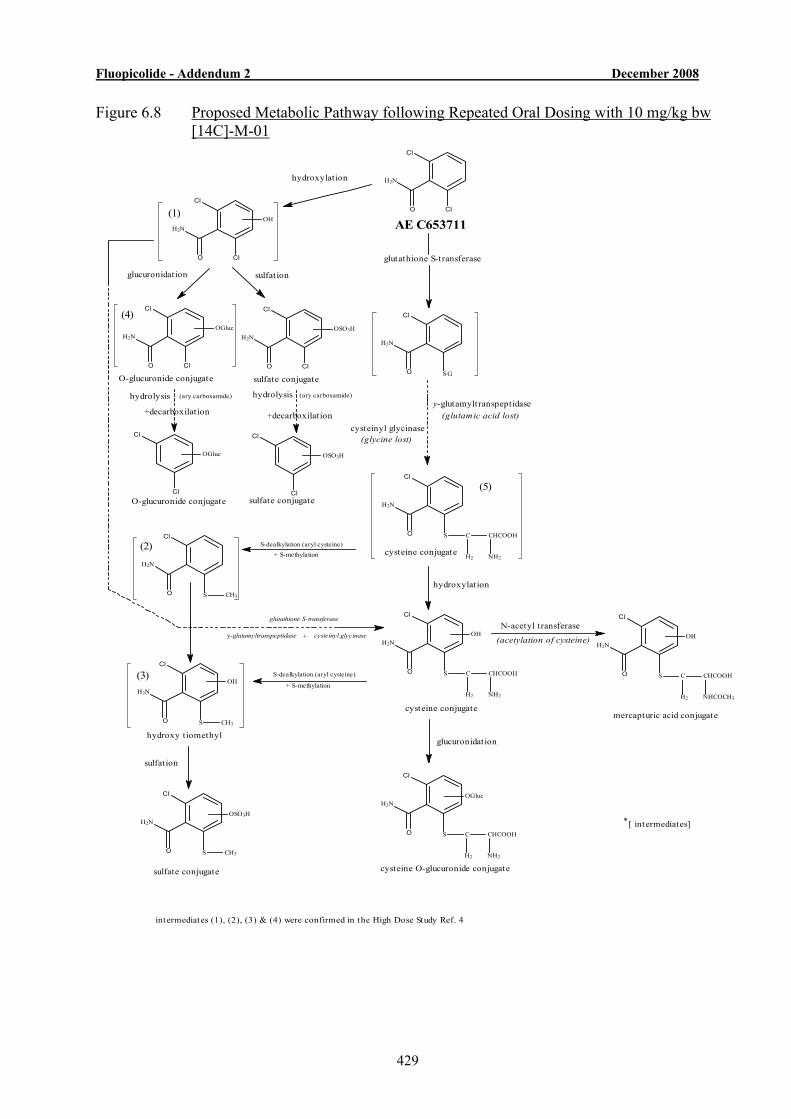
Fluopicolide - Addendum 2 December 2008
429
Figure 6.8 Proposed Metabolic Pathway following Repeated Oral Dosing with 10 mg/kg bw [14C]-M-01
AE C653711
H2N
O
Cl
Cl
H2N
O
Cl
Cl
OH
H2N
O
Cl
Cl
OGlucH2N
O
Cl
Cl
OSO3H
sulfat ionglucuronidation
OGluc OSO3H
Cl
Cl
(glycine lost)
y-glutamyltranspeptidase(glutamic acid lost)
sulfate conjugate
cysteinyl glycinase
H2N
O
Cl
S C
H2
CHCOOH
NH2
OGluc
H2N
O
Cl
S CH3
H2N
O
Cl
S C
H2
CHCOOH
NH2
OH
H2N
O
Cl
S C
H2
CHCOOH
NHCOCH3
OH
mercapturic acid conjugate
glucuronidat ion
H2N
O
Cl
S CH3
OH
hydroxylat ion
H2N
O
Cl
S CH3
OSO3H
sulfat ion
N-acetyl t ransferase
(acetylation of cysteine)
cysteine O-glucuronide conjugate
hydroxy tiomethyl
cysteine conjugate
sulfate conjugate
glutathione S-transferase
y-glutamyltranspeptidase + cysteinyl glycinase
H2N
O
Cl
S C
H2
CHCOOH
NH2cysteine conjugate
glutathione S-transferase
sulfate conjugate
O-glucuronide conjugate
O-glucuronide conjugate
[ intermediates]*
H2N
O
Cl
SG
S-dealkylation (aryl cysteine)+ S-methylation
S-dealkylation (aryl cysteine)
+ S-methylation
hydrolysis (ary carboxamide)
Cl
Cl
+decarboxilat ion
hydrolysis (ary carboxamide)
+decarboxilation
hydroxylat ion
(1)
(3)
(4)
(2)
(5)
intermediates (1), (2), (3) & (4) were confirmed in the High Dose Study Ref. 4
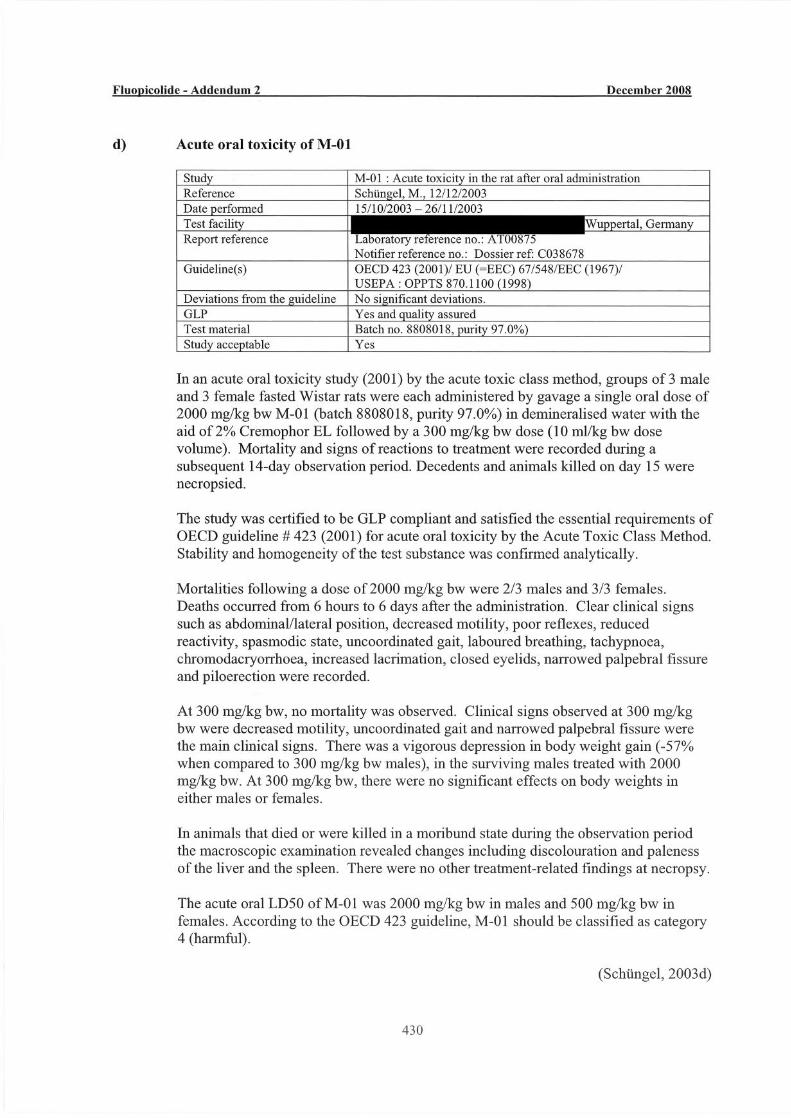
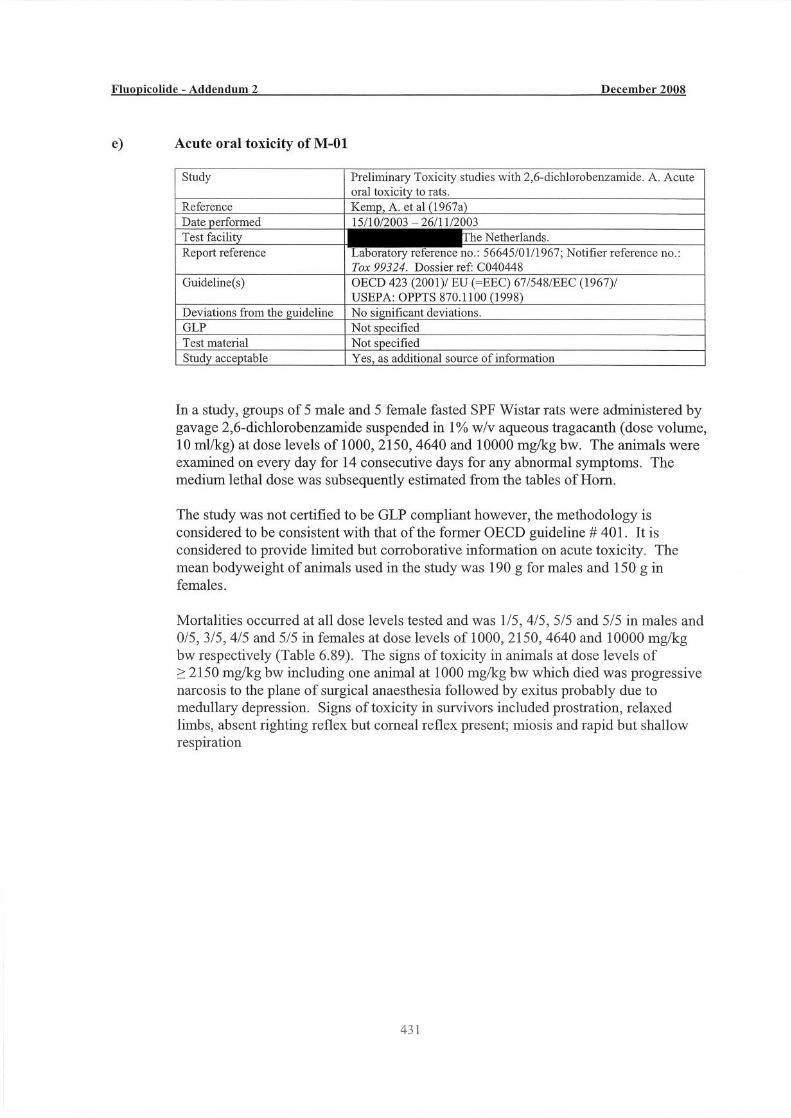
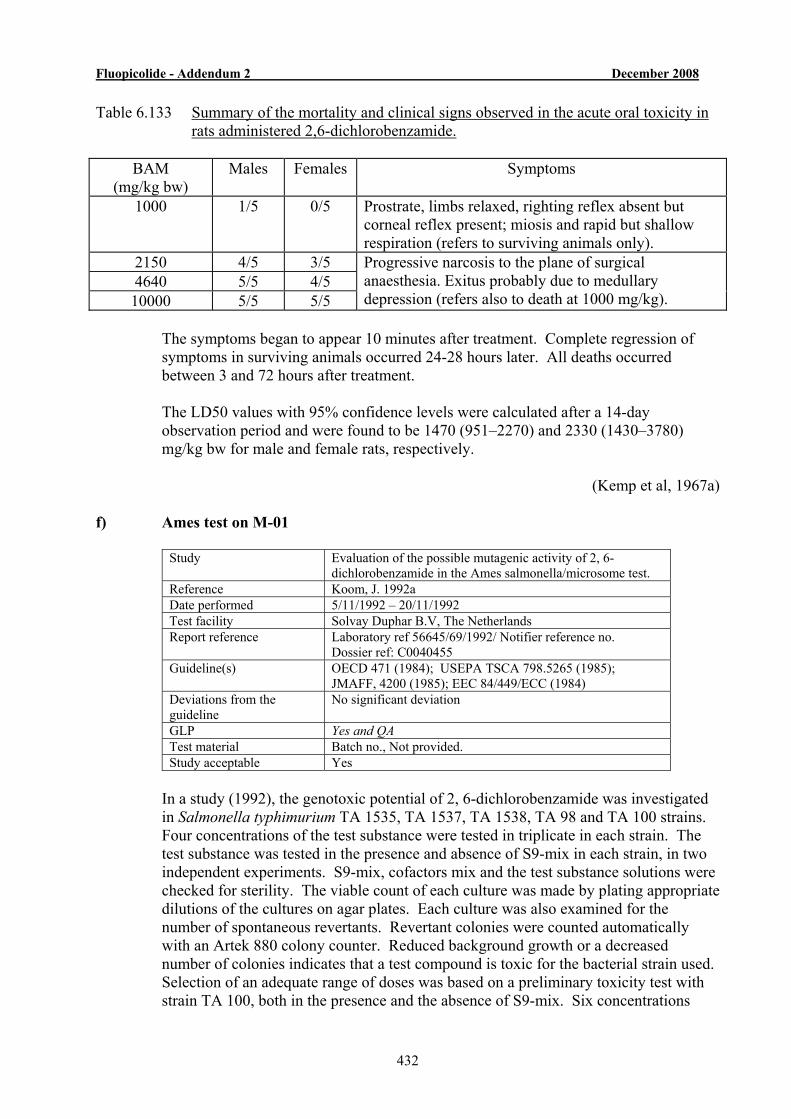
Fluopicolide - Addendum 2 December 2008
432
Table 6.133 Summary of the mortality and clinical signs observed in the acute oral toxicity in rats administered 2,6-dichlorobenzamide.
BAM
(mg/kg bw) Males Females Symptoms
1000 1/5 0/5 Prostrate, limbs relaxed, righting reflex absent but corneal reflex present; miosis and rapid but shallow respiration (refers to surviving animals only).
2150 4/5 3/5 4640 5/5 4/5 10000 5/5 5/5
Progressive narcosis to the plane of surgical anaesthesia. Exitus probably due to medullary depression (refers also to death at 1000 mg/kg).
The symptoms began to appear 10 minutes after treatment. Complete regression of
symptoms in surviving animals occurred 24-28 hours later. All deaths occurred between 3 and 72 hours after treatment.
The LD50 values with 95% confidence levels were calculated after a 14-day
observation period and were found to be 1470 (951–2270) and 2330 (1430–3780) mg/kg bw for male and female rats, respectively.
(Kemp et al, 1967a)
f) Ames test on M-01
Study Evaluation of the possible mutagenic activity of 2, 6-dichlorobenzamide in the Ames salmonella/microsome test.
Reference Koom, J. 1992a Date performed 5/11/1992 – 20/11/1992 Test facility Solvay Duphar B.V, The Netherlands Report reference Laboratory ref 56645/69/1992/ Notifier reference no.
Dossier ref: C0040455 Guideline(s) OECD 471 (1984); USEPA TSCA 798.5265 (1985);
JMAFF, 4200 (1985); EEC 84/449/ECC (1984) Deviations from the guideline
No significant deviation
GLP Yes and QA Test material Batch no., Not provided. Study acceptable Yes
In a study (1992), the genotoxic potential of 2, 6-dichlorobenzamide was investigated
in Salmonella typhimurium TA 1535, TA 1537, TA 1538, TA 98 and TA 100 strains. Four concentrations of the test substance were tested in triplicate in each strain. The test substance was tested in the presence and absence of S9-mix in each strain, in two independent experiments. S9-mix, cofactors mix and the test substance solutions were checked for sterility. The viable count of each culture was made by plating appropriate dilutions of the cultures on agar plates. Each culture was also examined for the number of spontaneous revertants. Revertant colonies were counted automatically with an Artek 880 colony counter. Reduced background growth or a decreased number of colonies indicates that a test compound is toxic for the bacterial strain used. Selection of an adequate range of doses was based on a preliminary toxicity test with strain TA 100, both in the presence and the absence of S9-mix. Six concentrations
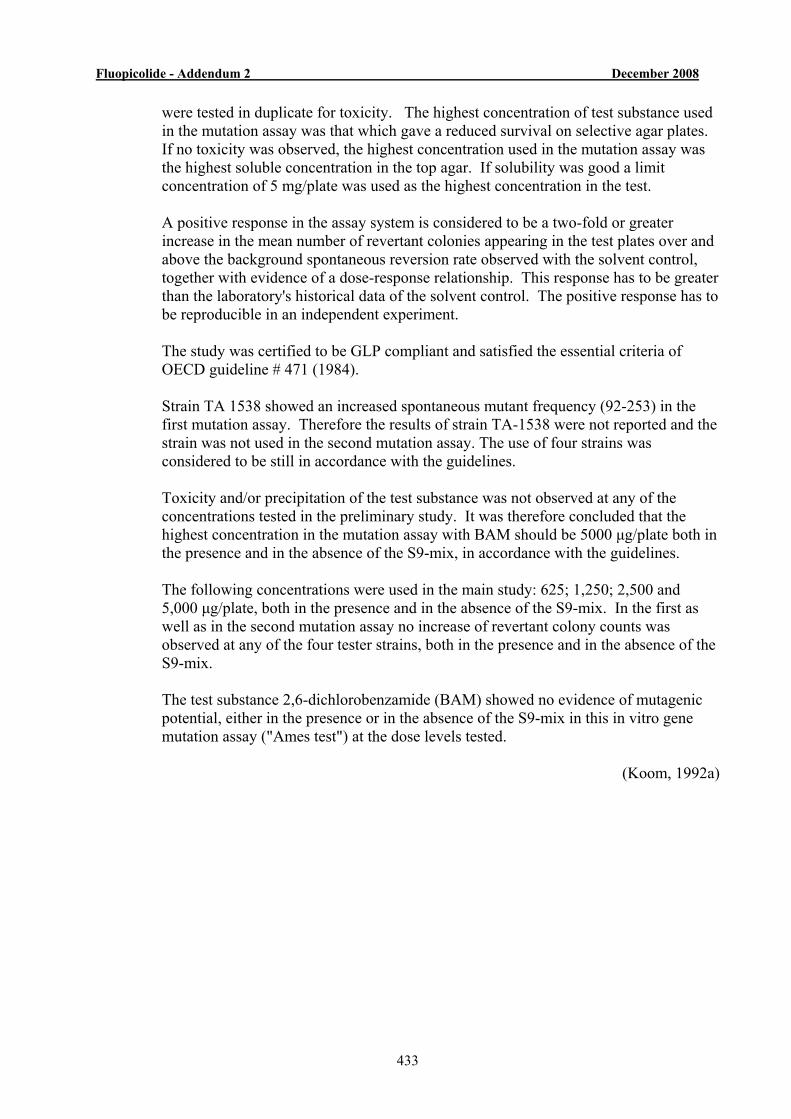
Fluopicolide - Addendum 2 December 2008
433
were tested in duplicate for toxicity. The highest concentration of test substance used in the mutation assay was that which gave a reduced survival on selective agar plates. If no toxicity was observed, the highest concentration used in the mutation assay was the highest soluble concentration in the top agar. If solubility was good a limit concentration of 5 mg/plate was used as the highest concentration in the test.
A positive response in the assay system is considered to be a two-fold or greater
increase in the mean number of revertant colonies appearing in the test plates over and above the background spontaneous reversion rate observed with the solvent control, together with evidence of a dose-response relationship. This response has to be greater than the laboratory's historical data of the solvent control. The positive response has to be reproducible in an independent experiment.
The study was certified to be GLP compliant and satisfied the essential criteria of
OECD guideline # 471 (1984). Strain TA 1538 showed an increased spontaneous mutant frequency (92-253) in the
first mutation assay. Therefore the results of strain TA-1538 were not reported and the strain was not used in the second mutation assay. The use of four strains was considered to be still in accordance with the guidelines.
Toxicity and/or precipitation of the test substance was not observed at any of the
concentrations tested in the preliminary study. It was therefore concluded that the highest concentration in the mutation assay with BAM should be 5000 μg/plate both in the presence and in the absence of the S9-mix, in accordance with the guidelines.
The following concentrations were used in the main study: 625; 1,250; 2,500 and
5,000 μg/plate, both in the presence and in the absence of the S9-mix. In the first as well as in the second mutation assay no increase of revertant colony counts was observed at any of the four tester strains, both in the presence and in the absence of the S9-mix.
The test substance 2,6-dichlorobenzamide (BAM) showed no evidence of mutagenic
potential, either in the presence or in the absence of the S9-mix in this in vitro gene mutation assay ("Ames test") at the dose levels tested.
(Koom, 1992a)
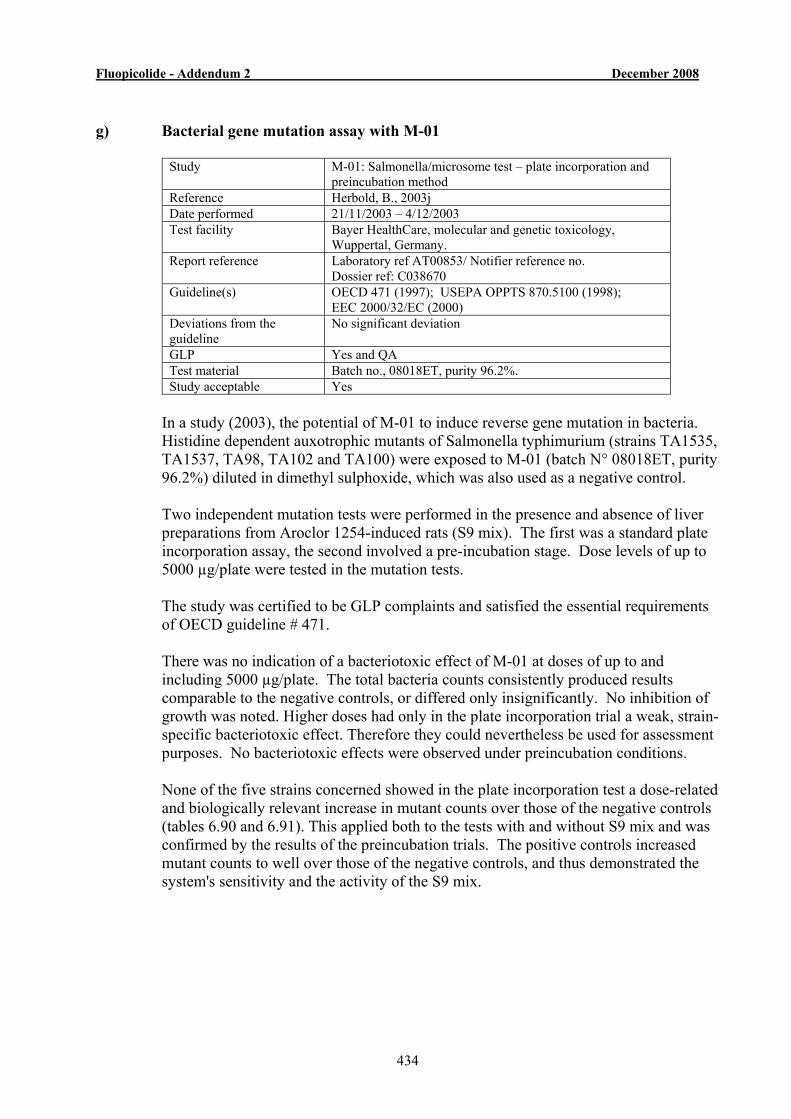
Fluopicolide - Addendum 2 December 2008
434
g) Bacterial gene mutation assay with M-01
Study M-01: Salmonella/microsome test – plate incorporation and preincubation method
Reference Herbold, B., 2003j Date performed 21/11/2003 – 4/12/2003 Test facility Bayer HealthCare, molecular and genetic toxicology,
Wuppertal, Germany. Report reference Laboratory ref AT00853/ Notifier reference no.
Dossier ref: C038670 Guideline(s) OECD 471 (1997); USEPA OPPTS 870.5100 (1998);
EEC 2000/32/EC (2000) Deviations from the guideline
No significant deviation
GLP Yes and QA Test material Batch no., 08018ET, purity 96.2%. Study acceptable Yes
In a study (2003), the potential of M-01 to induce reverse gene mutation in bacteria.
Histidine dependent auxotrophic mutants of Salmonella typhimurium (strains TA1535, TA1537, TA98, TA102 and TA100) were exposed to M-01 (batch N° 08018ET, purity 96.2%) diluted in dimethyl sulphoxide, which was also used as a negative control.
Two independent mutation tests were performed in the presence and absence of liver
preparations from Aroclor 1254-induced rats (S9 mix). The first was a standard plate incorporation assay, the second involved a pre-incubation stage. Dose levels of up to 5000 µg/plate were tested in the mutation tests.
The study was certified to be GLP complaints and satisfied the essential requirements
of OECD guideline # 471. There was no indication of a bacteriotoxic effect of M-01 at doses of up to and
including 5000 µg/plate. The total bacteria counts consistently produced results comparable to the negative controls, or differed only insignificantly. No inhibition of growth was noted. Higher doses had only in the plate incorporation trial a weak, strain-specific bacteriotoxic effect. Therefore they could nevertheless be used for assessment purposes. No bacteriotoxic effects were observed under preincubation conditions.
None of the five strains concerned showed in the plate incorporation test a dose-related
and biologically relevant increase in mutant counts over those of the negative controls (tables 6.90 and 6.91). This applied both to the tests with and without S9 mix and was confirmed by the results of the preincubation trials. The positive controls increased mutant counts to well over those of the negative controls, and thus demonstrated the system's sensitivity and the activity of the S9 mix.
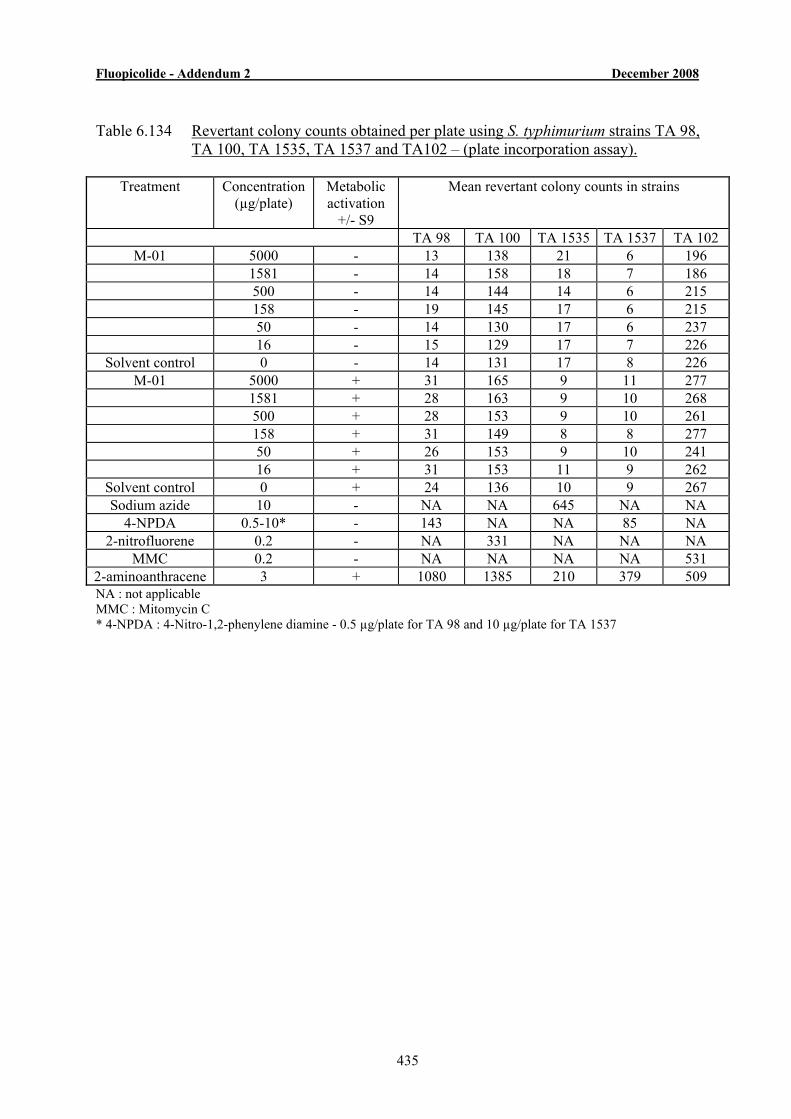
Fluopicolide - Addendum 2 December 2008
435
Table 6.134 Revertant colony counts obtained per plate using S. typhimurium strains TA 98,
TA 100, TA 1535, TA 1537 and TA102 – (plate incorporation assay).
Treatment Concentration (µg/plate)
Metabolic activation
+/- S9
Mean revertant colony counts in strains
TA 98 TA 100 TA 1535 TA 1537 TA 102 M-01 5000 - 13 138 21 6 196
1581 - 14 158 18 7 186 500 - 14 144 14 6 215 158 - 19 145 17 6 215 50 - 14 130 17 6 237 16 - 15 129 17 7 226
Solvent control 0 - 14 131 17 8 226 M-01 5000 + 31 165 9 11 277
1581 + 28 163 9 10 268 500 + 28 153 9 10 261 158 + 31 149 8 8 277 50 + 26 153 9 10 241 16 + 31 153 11 9 262
Solvent control 0 + 24 136 10 9 267 Sodium azide 10 - NA NA 645 NA NA
4-NPDA 0.5-10* - 143 NA NA 85 NA 2-nitrofluorene 0.2 - NA 331 NA NA NA
MMC 0.2 - NA NA NA NA 531 2-aminoanthracene 3 + 1080 1385 210 379 509 NA : not applicable MMC : Mitomycin C * 4-NPDA : 4-Nitro-1,2-phenylene diamine - 0.5 µg/plate for TA 98 and 10 µg/plate for TA 1537
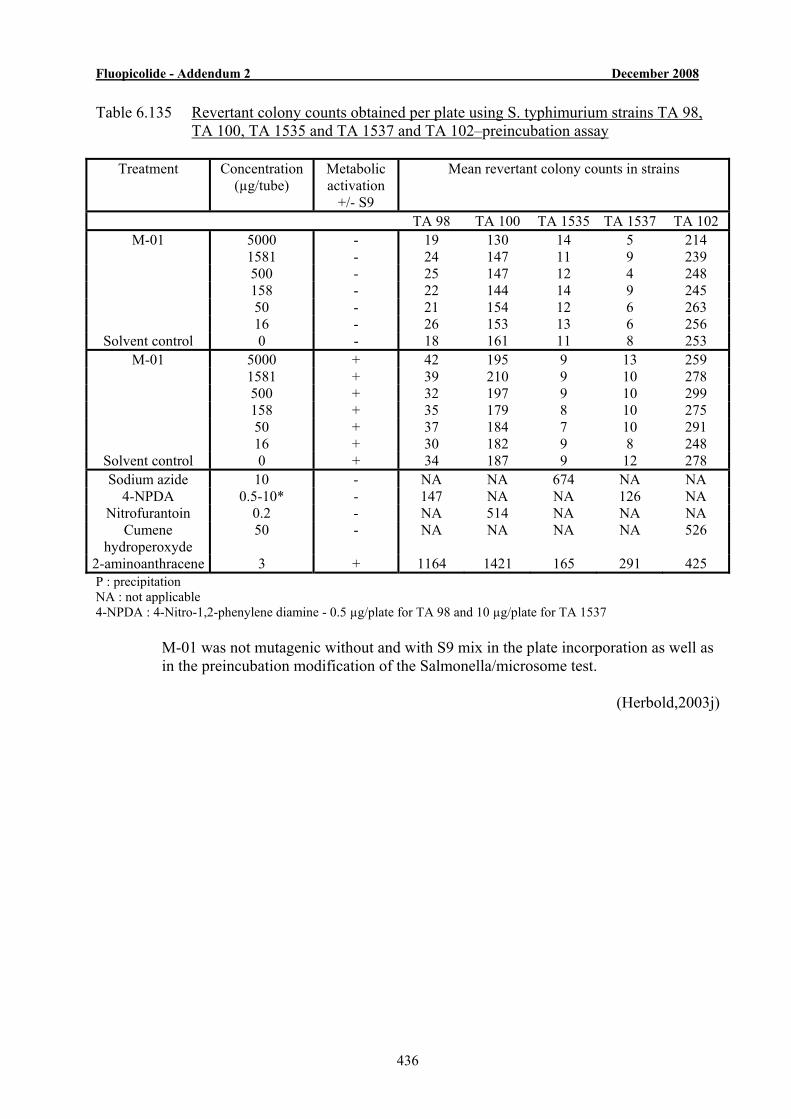
Fluopicolide - Addendum 2 December 2008
436
Table 6.135 Revertant colony counts obtained per plate using S. typhimurium strains TA 98, TA 100, TA 1535 and TA 1537 and TA 102–preincubation assay
Treatment Concentration
(µg/tube) Metabolic activation
+/- S9
Mean revertant colony counts in strains
TA 98 TA 100 TA 1535 TA 1537 TA 102 M-01 5000 - 19 130 14 5 214
1581 - 24 147 11 9 239 500 - 25 147 12 4 248 158 - 22 144 14 9 245 50 - 21 154 12 6 263 16 - 26 153 13 6 256
Solvent control 0 - 18 161 11 8 253 M-01 5000 + 42 195 9 13 259
1581 + 39 210 9 10 278 500 + 32 197 9 10 299 158 + 35 179 8 10 275 50 + 37 184 7 10 291 16 + 30 182 9 8 248
Solvent control 0 + 34 187 9 12 278 Sodium azide 10 - NA NA 674 NA NA
4-NPDA 0.5-10* - 147 NA NA 126 NA Nitrofurantoin 0.2 - NA 514 NA NA NA
Cumene hydroperoxyde
50 - NA NA NA NA 526
2-aminoanthracene 3 + 1164 1421 165 291 425 P : precipitation NA : not applicable 4-NPDA : 4-Nitro-1,2-phenylene diamine - 0.5 µg/plate for TA 98 and 10 µg/plate for TA 1537 M-01 was not mutagenic without and with S9 mix in the plate incorporation as well as
in the preincubation modification of the Salmonella/microsome test.
(Herbold,2003j)
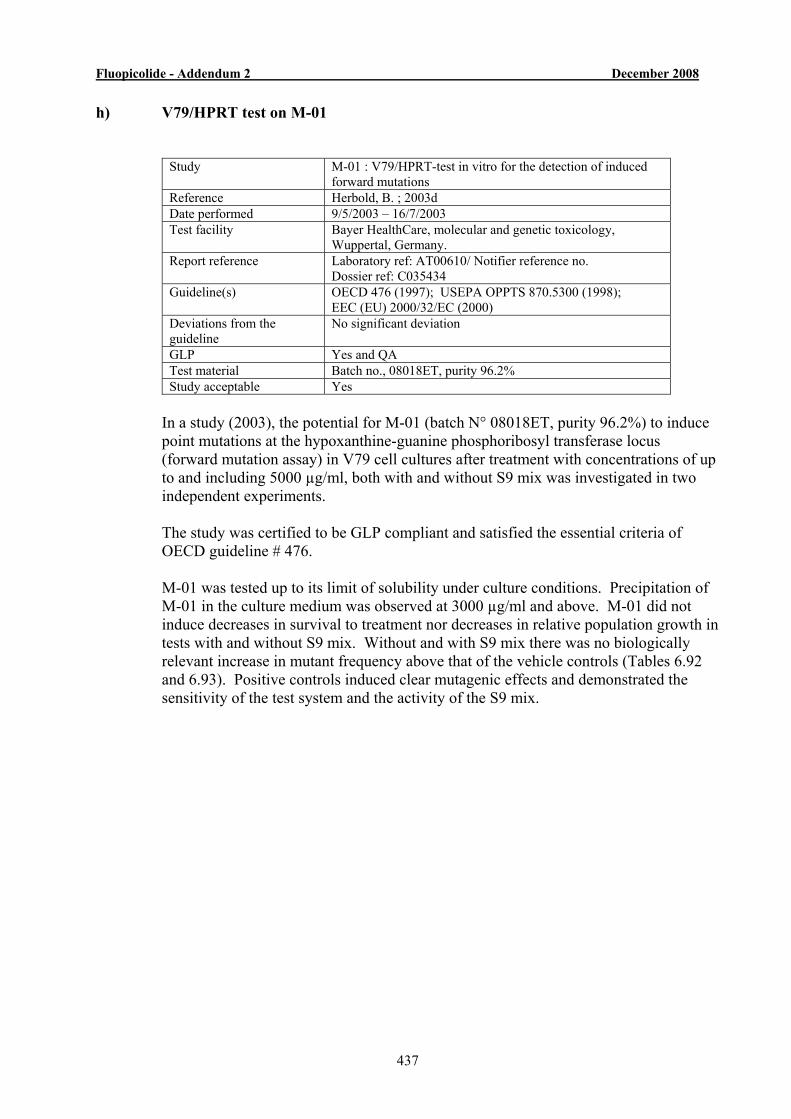
Fluopicolide - Addendum 2 December 2008
437
h) V79/HPRT test on M-01
Study M-01 : V79/HPRT-test in vitro for the detection of induced forward mutations
Reference Herbold, B. ; 2003d Date performed 9/5/2003 – 16/7/2003 Test facility Bayer HealthCare, molecular and genetic toxicology,
Wuppertal, Germany. Report reference Laboratory ref: AT00610/ Notifier reference no.
Dossier ref: C035434 Guideline(s) OECD 476 (1997); USEPA OPPTS 870.5300 (1998);
EEC (EU) 2000/32/EC (2000) Deviations from the guideline
No significant deviation
GLP Yes and QA Test material Batch no., 08018ET, purity 96.2% Study acceptable Yes
In a study (2003), the potential for M-01 (batch N° 08018ET, purity 96.2%) to induce
point mutations at the hypoxanthine-guanine phosphoribosyl transferase locus (forward mutation assay) in V79 cell cultures after treatment with concentrations of up to and including 5000 µg/ml, both with and without S9 mix was investigated in two independent experiments.
The study was certified to be GLP compliant and satisfied the essential criteria of
OECD guideline # 476. M-01 was tested up to its limit of solubility under culture conditions. Precipitation of
M-01 in the culture medium was observed at 3000 µg/ml and above. M-01 did not induce decreases in survival to treatment nor decreases in relative population growth in tests with and without S9 mix. Without and with S9 mix there was no biologically relevant increase in mutant frequency above that of the vehicle controls (Tables 6.92 and 6.93). Positive controls induced clear mutagenic effects and demonstrated the sensitivity of the test system and the activity of the S9 mix.
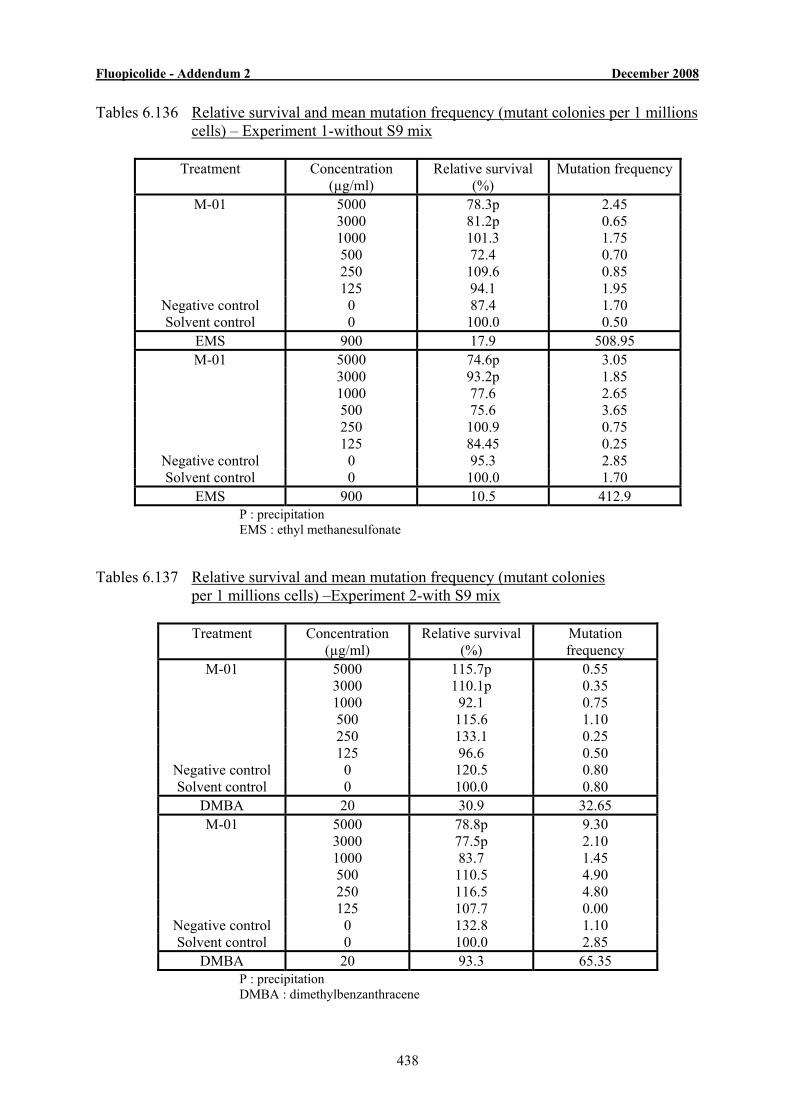
Fluopicolide - Addendum 2 December 2008
438
Tables 6.136 Relative survival and mean mutation frequency (mutant colonies per 1 millions cells) – Experiment 1-without S9 mix
Treatment Concentration
(µg/ml) Relative survival
(%) Mutation frequency
M-01 5000 78.3p 2.45 3000 81.2p 0.65 1000 101.3 1.75 500 72.4 0.70 250 109.6 0.85 125 94.1 1.95
Negative control 0 87.4 1.70 Solvent control 0 100.0 0.50
EMS 900 17.9 508.95 M-01 5000 74.6p 3.05
3000 93.2p 1.85 1000 77.6 2.65 500 75.6 3.65 250 100.9 0.75 125 84.45 0.25
Negative control 0 95.3 2.85 Solvent control 0 100.0 1.70
EMS 900 10.5 412.9 P : precipitation EMS : ethyl methanesulfonate
Tables 6.137 Relative survival and mean mutation frequency (mutant colonies per 1 millions cells) –Experiment 2-with S9 mix
Treatment Concentration (µg/ml)
Relative survival (%)
Mutation frequency
M-01 5000 115.7p 0.55 3000 110.1p 0.35 1000 92.1 0.75 500 115.6 1.10 250 133.1 0.25 125 96.6 0.50
Negative control 0 120.5 0.80 Solvent control 0 100.0 0.80
DMBA 20 30.9 32.65 M-01 5000 78.8p 9.30
3000 77.5p 2.10 1000 83.7 1.45 500 110.5 4.90 250 116.5 4.80 125 107.7 0.00
Negative control 0 132.8 1.10 Solvent control 0 100.0 2.85
DMBA 20 93.3 65.35 P : precipitation DMBA : dimethylbenzanthracene
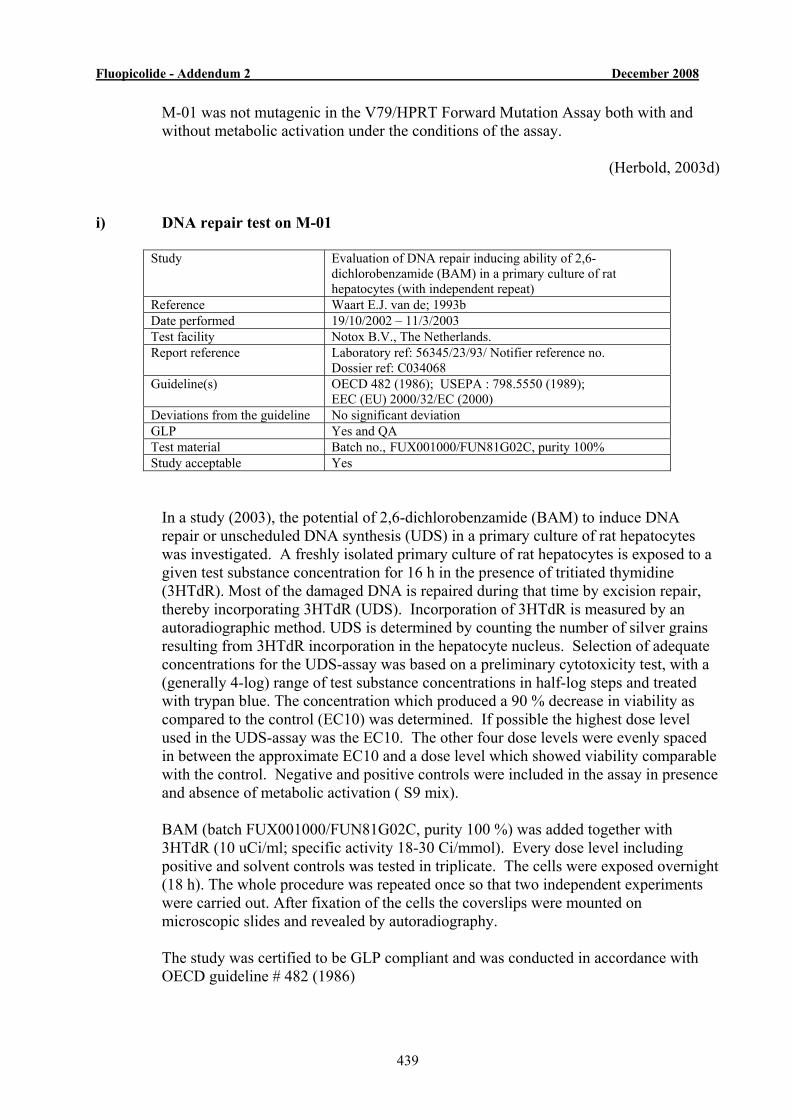
Fluopicolide - Addendum 2 December 2008
439
M-01 was not mutagenic in the V79/HPRT Forward Mutation Assay both with and without metabolic activation under the conditions of the assay.
(Herbold, 2003d)
i) DNA repair test on M-01
Study Evaluation of DNA repair inducing ability of 2,6-dichlorobenzamide (BAM) in a primary culture of rat hepatocytes (with independent repeat)
Reference Waart E.J. van de; 1993b Date performed 19/10/2002 – 11/3/2003 Test facility Notox B.V., The Netherlands. Report reference Laboratory ref: 56345/23/93/ Notifier reference no.
Dossier ref: C034068 Guideline(s) OECD 482 (1986); USEPA : 798.5550 (1989);
EEC (EU) 2000/32/EC (2000) Deviations from the guideline No significant deviation GLP Yes and QA Test material Batch no., FUX001000/FUN81G02C, purity 100% Study acceptable Yes
In a study (2003), the potential of 2,6-dichlorobenzamide (BAM) to induce DNA
repair or unscheduled DNA synthesis (UDS) in a primary culture of rat hepatocytes was investigated. A freshly isolated primary culture of rat hepatocytes is exposed to a given test substance concentration for 16 h in the presence of tritiated thymidine (3HTdR). Most of the damaged DNA is repaired during that time by excision repair, thereby incorporating 3HTdR (UDS). Incorporation of 3HTdR is measured by an autoradiographic method. UDS is determined by counting the number of silver grains resulting from 3HTdR incorporation in the hepatocyte nucleus. Selection of adequate concentrations for the UDS-assay was based on a preliminary cytotoxicity test, with a (generally 4-log) range of test substance concentrations in half-log steps and treated with trypan blue. The concentration which produced a 90 % decrease in viability as compared to the control (EC10) was determined. If possible the highest dose level used in the UDS-assay was the EC10. The other four dose levels were evenly spaced in between the approximate EC10 and a dose level which showed viability comparable with the control. Negative and positive controls were included in the assay in presence and absence of metabolic activation ( S9 mix).
BAM (batch FUX001000/FUN81G02C, purity 100 %) was added together with
3HTdR (10 uCi/ml; specific activity 18-30 Ci/mmol). Every dose level including positive and solvent controls was tested in triplicate. The cells were exposed overnight (18 h). The whole procedure was repeated once so that two independent experiments were carried out. After fixation of the cells the coverslips were mounted on microscopic slides and revealed by autoradiography.
The study was certified to be GLP compliant and was conducted in accordance with
OECD guideline # 482 (1986)
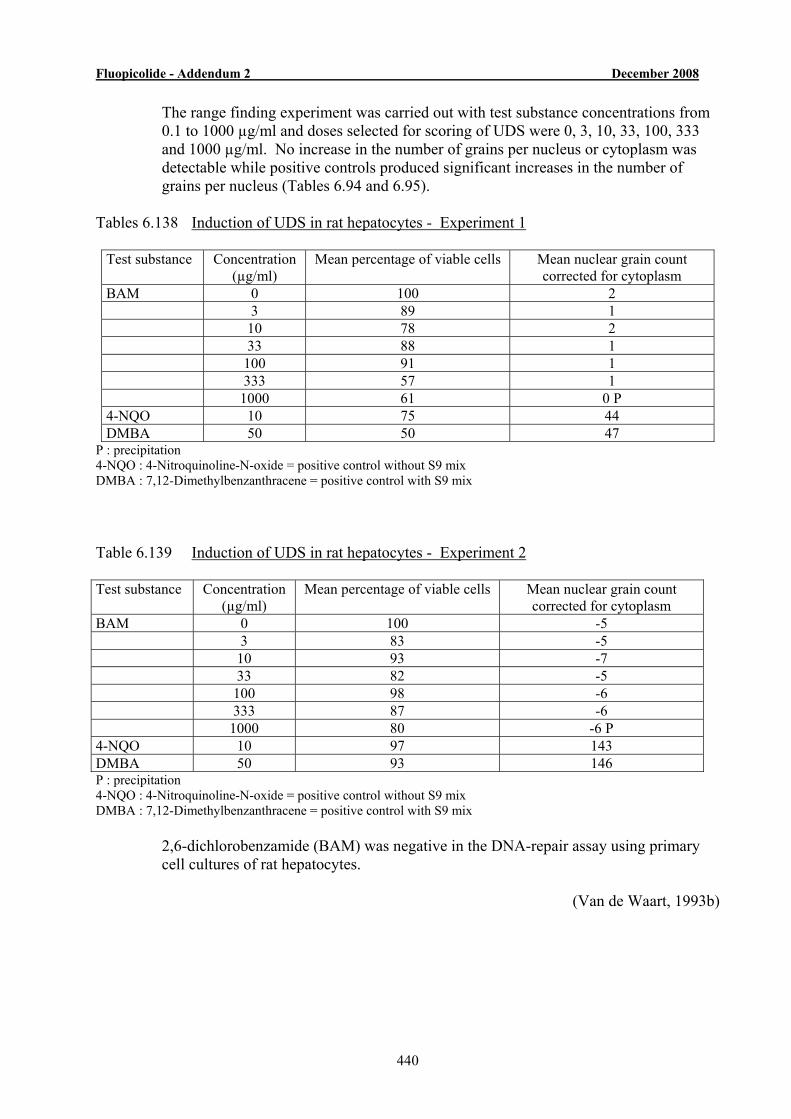
Fluopicolide - Addendum 2 December 2008
440
The range finding experiment was carried out with test substance concentrations from 0.1 to 1000 µg/ml and doses selected for scoring of UDS were 0, 3, 10, 33, 100, 333 and 1000 µg/ml. No increase in the number of grains per nucleus or cytoplasm was detectable while positive controls produced significant increases in the number of grains per nucleus (Tables 6.94 and 6.95).
Tables 6.138 Induction of UDS in rat hepatocytes - Experiment 1
Test substance Concentration (µg/ml)
Mean percentage of viable cells Mean nuclear grain count corrected for cytoplasm
BAM 0 100 2 3 89 1 10 78 2 33 88 1 100 91 1 333 57 1 1000 61 0 P 4-NQO 10 75 44 DMBA 50 50 47
P : precipitation 4-NQO : 4-Nitroquinoline-N-oxide = positive control without S9 mix DMBA : 7,12-Dimethylbenzanthracene = positive control with S9 mix Table 6.139 Induction of UDS in rat hepatocytes - Experiment 2 Test substance Concentration
(µg/ml) Mean percentage of viable cells Mean nuclear grain count
corrected for cytoplasm BAM 0 100 -5 3 83 -5 10 93 -7 33 82 -5 100 98 -6 333 87 -6 1000 80 -6 P 4-NQO 10 97 143 DMBA 50 93 146 P : precipitation 4-NQO : 4-Nitroquinoline-N-oxide = positive control without S9 mix DMBA : 7,12-Dimethylbenzanthracene = positive control with S9 mix 2,6-dichlorobenzamide (BAM) was negative in the DNA-repair assay using primary
cell cultures of rat hepatocytes.
(Van de Waart, 1993b)
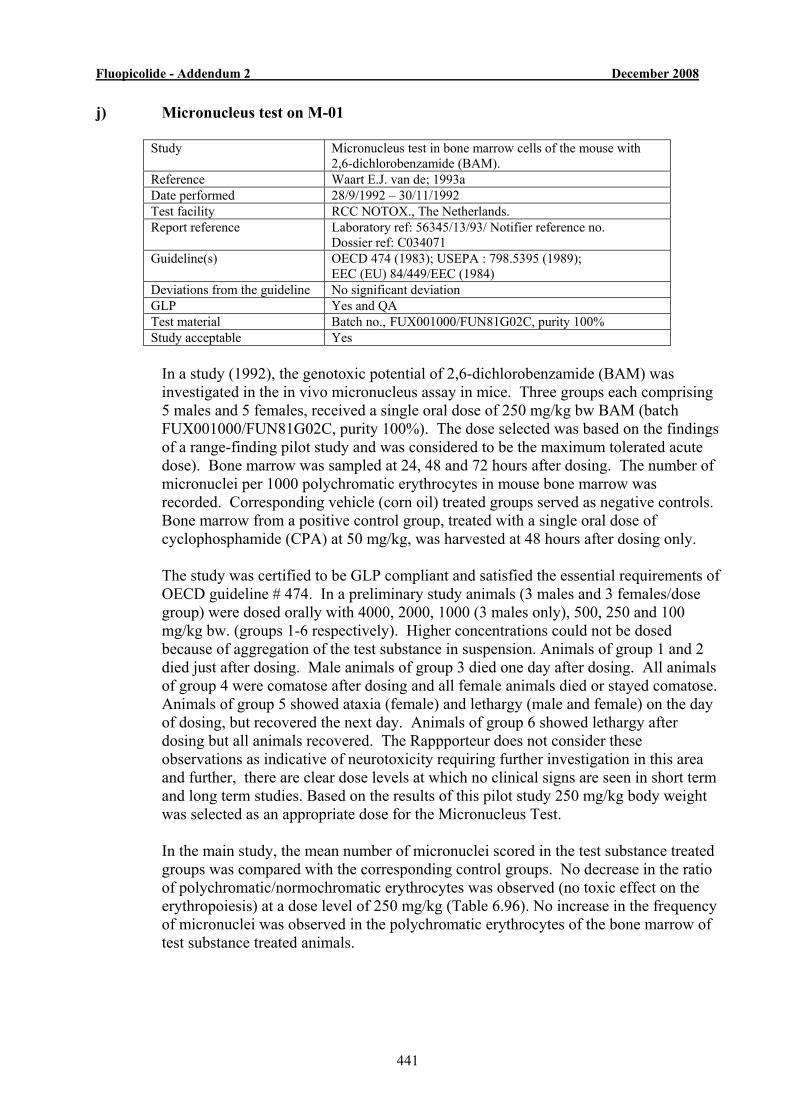
Fluopicolide - Addendum 2 December 2008
441
j) Micronucleus test on M-01
Study Micronucleus test in bone marrow cells of the mouse with 2,6-dichlorobenzamide (BAM).
Reference Waart E.J. van de; 1993a Date performed 28/9/1992 – 30/11/1992 Test facility RCC NOTOX., The Netherlands. Report reference Laboratory ref: 56345/13/93/ Notifier reference no.
Dossier ref: C034071 Guideline(s) OECD 474 (1983); USEPA : 798.5395 (1989);
EEC (EU) 84/449/EEC (1984) Deviations from the guideline No significant deviation GLP Yes and QA Test material Batch no., FUX001000/FUN81G02C, purity 100% Study acceptable Yes
In a study (1992), the genotoxic potential of 2,6-dichlorobenzamide (BAM) was
investigated in the in vivo micronucleus assay in mice. Three groups each comprising 5 males and 5 females, received a single oral dose of 250 mg/kg bw BAM (batch FUX001000/FUN81G02C, purity 100%). The dose selected was based on the findings of a range-finding pilot study and was considered to be the maximum tolerated acute dose). Bone marrow was sampled at 24, 48 and 72 hours after dosing. The number of micronuclei per 1000 polychromatic erythrocytes in mouse bone marrow was recorded. Corresponding vehicle (corn oil) treated groups served as negative controls. Bone marrow from a positive control group, treated with a single oral dose of cyclophosphamide (CPA) at 50 mg/kg, was harvested at 48 hours after dosing only.
The study was certified to be GLP compliant and satisfied the essential requirements of OECD guideline # 474. In a preliminary study animals (3 males and 3 females/dose group) were dosed orally with 4000, 2000, 1000 (3 males only), 500, 250 and 100 mg/kg bw. (groups 1-6 respectively). Higher concentrations could not be dosed because of aggregation of the test substance in suspension. Animals of group 1 and 2 died just after dosing. Male animals of group 3 died one day after dosing. All animals of group 4 were comatose after dosing and all female animals died or stayed comatose. Animals of group 5 showed ataxia (female) and lethargy (male and female) on the day of dosing, but recovered the next day. Animals of group 6 showed lethargy after dosing but all animals recovered. The Rappporteur does not consider these observations as indicative of neurotoxicity requiring further investigation in this area and further, there are clear dose levels at which no clinical signs are seen in short term and long term studies. Based on the results of this pilot study 250 mg/kg body weight was selected as an appropriate dose for the Micronucleus Test.
In the main study, the mean number of micronuclei scored in the test substance treated
groups was compared with the corresponding control groups. No decrease in the ratio of polychromatic/normochromatic erythrocytes was observed (no toxic effect on the erythropoiesis) at a dose level of 250 mg/kg (Table 6.96). No increase in the frequency of micronuclei was observed in the polychromatic erythrocytes of the bone marrow of test substance treated animals.
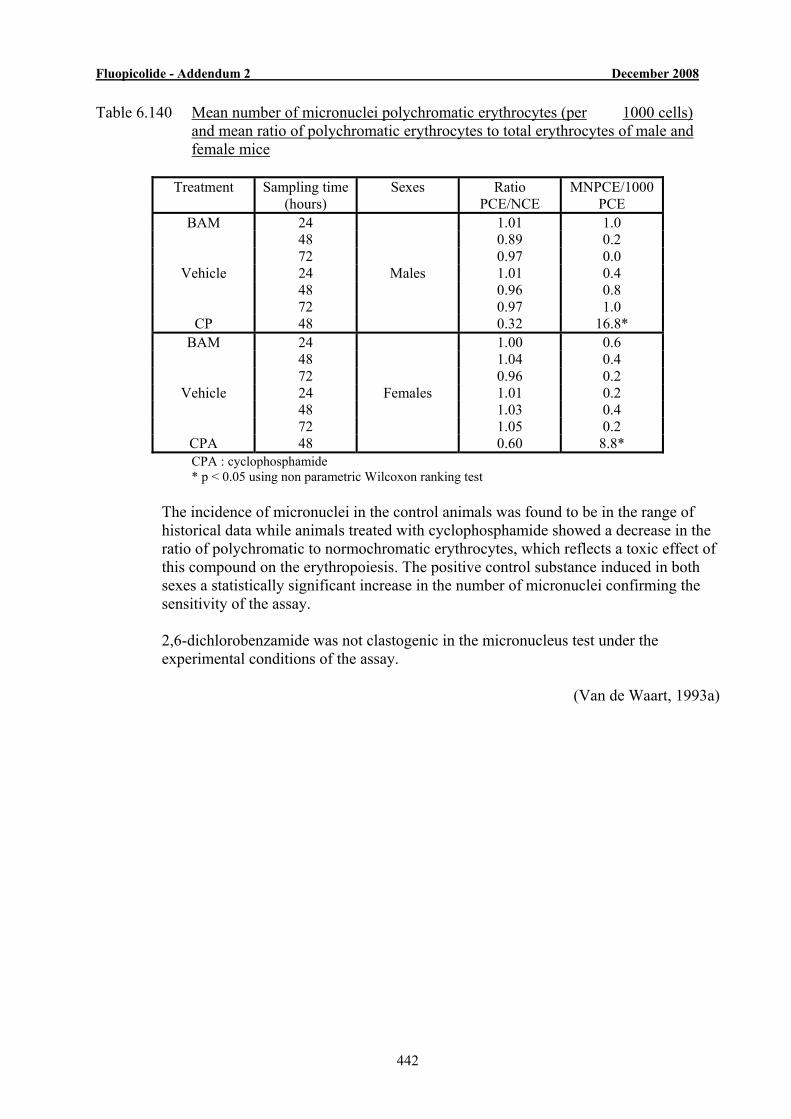
Fluopicolide - Addendum 2 December 2008
442
Table 6.140 Mean number of micronuclei polychromatic erythrocytes (per 1000 cells) and mean ratio of polychromatic erythrocytes to total erythrocytes of male and female mice
Treatment Sampling time
(hours) Sexes Ratio
PCE/NCE MNPCE/1000
PCE BAM 24 1.01 1.0
48 0.89 0.2 72 0.97 0.0
Vehicle 24 1.01 0.4 48 0.96 0.8 72 0.97 1.0
CP 48
Males
0.32 16.8* BAM 24 1.00 0.6
48 1.04 0.4 72 0.96 0.2
Vehicle 24 1.01 0.2 48 1.03 0.4 72 1.05 0.2
CPA 48
Females
0.60 8.8* CPA : cyclophosphamide * p < 0.05 using non parametric Wilcoxon ranking test The incidence of micronuclei in the control animals was found to be in the range of
historical data while animals treated with cyclophosphamide showed a decrease in the ratio of polychromatic to normochromatic erythrocytes, which reflects a toxic effect of this compound on the erythropoiesis. The positive control substance induced in both sexes a statistically significant increase in the number of micronuclei confirming the sensitivity of the assay.
2,6-dichlorobenzamide was not clastogenic in the micronucleus test under the
experimental conditions of the assay.
(Van de Waart, 1993a)
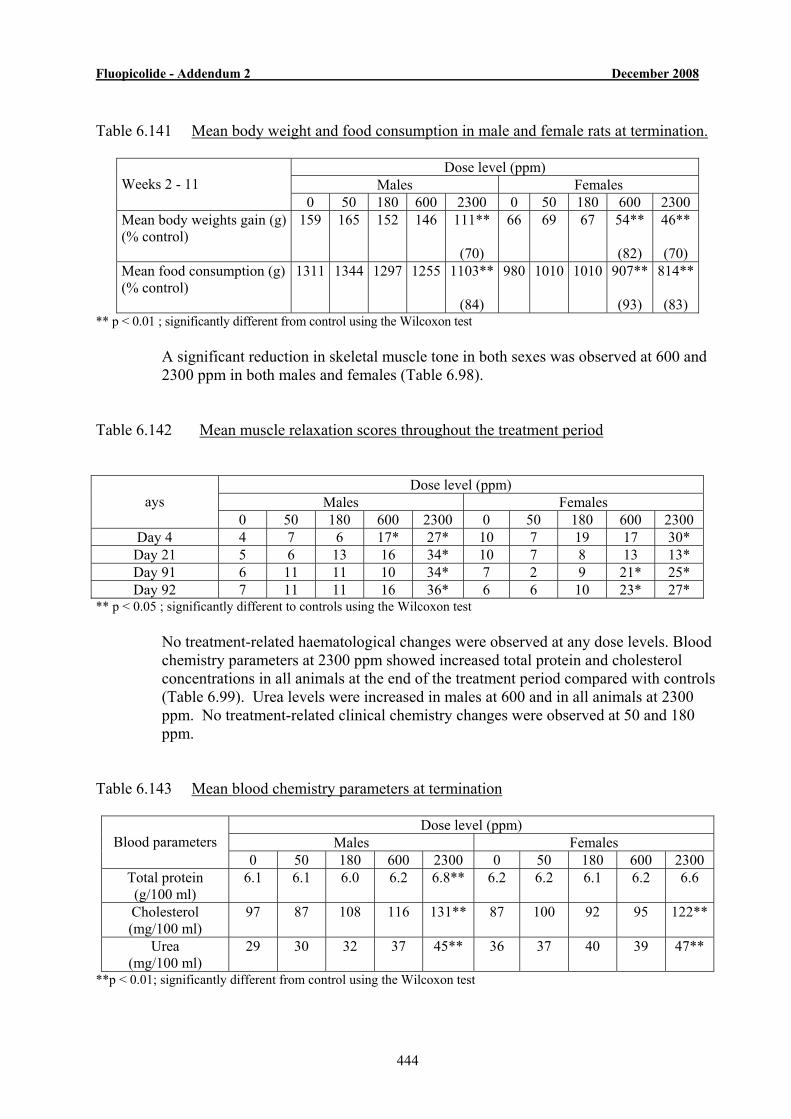
Fluopicolide - Addendum 2 December 2008
444
Table 6.141 Mean body weight and food consumption in male and female rats at termination.
Dose level (ppm) Males Females
Weeks 2 - 11
0 50 180 600 2300 0 50 180 600 2300 Mean body weights gain (g) (% control)
159 165 152 146 111**
(70)
66 69 67 54**
(82)
46**
(70) Mean food consumption (g) (% control)
1311 1344 1297 1255 1103**
(84)
980 1010 1010 907**
(93)
814**
(83) ** p < 0.01 ; significantly different from control using the Wilcoxon test A significant reduction in skeletal muscle tone in both sexes was observed at 600 and
2300 ppm in both males and females (Table 6.98). Table 6.142 Mean muscle relaxation scores throughout the treatment period
Dose level (ppm) Males Females
ays
0 50 180 600 2300 0 50 180 600 2300 Day 4 4 7 6 17* 27* 10 7 19 17 30*
Day 21 5 6 13 16 34* 10 7 8 13 13* Day 91 6 11 11 10 34* 7 2 9 21* 25* Day 92 7 11 11 16 36* 6 6 10 23* 27*
** p < 0.05 ; significantly different to controls using the Wilcoxon test No treatment-related haematological changes were observed at any dose levels. Blood
chemistry parameters at 2300 ppm showed increased total protein and cholesterol concentrations in all animals at the end of the treatment period compared with controls (Table 6.99). Urea levels were increased in males at 600 and in all animals at 2300 ppm. No treatment-related clinical chemistry changes were observed at 50 and 180 ppm.
Table 6.143 Mean blood chemistry parameters at termination
Dose level (ppm) Males Females
Blood parameters
0 50 180 600 2300 0 50 180 600 2300 Total protein (g/100 ml)
6.1 6.1 6.0 6.2 6.8** 6.2 6.2 6.1 6.2 6.6
Cholesterol (mg/100 ml)
97 87 108 116 131** 87 100 92 95 122**
Urea (mg/100 ml)
29 30 32 37 45** 36 37 40 39 47**
**p < 0.01; significantly different from control using the Wilcoxon test
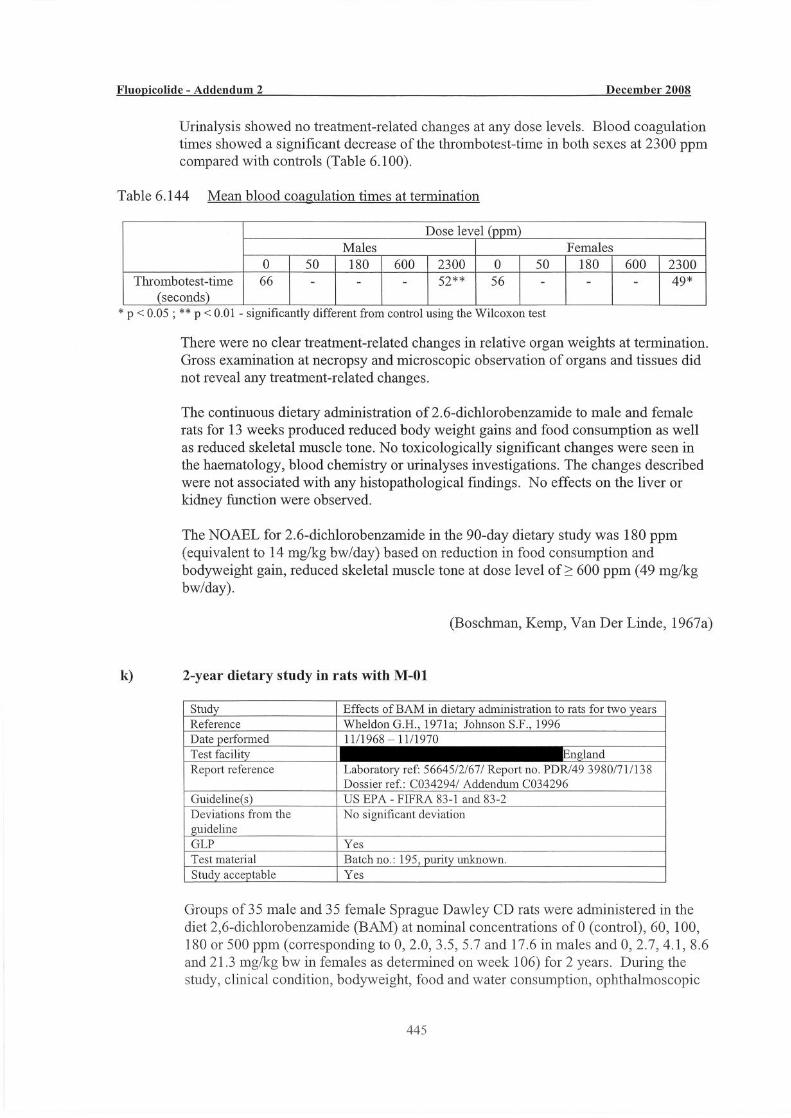
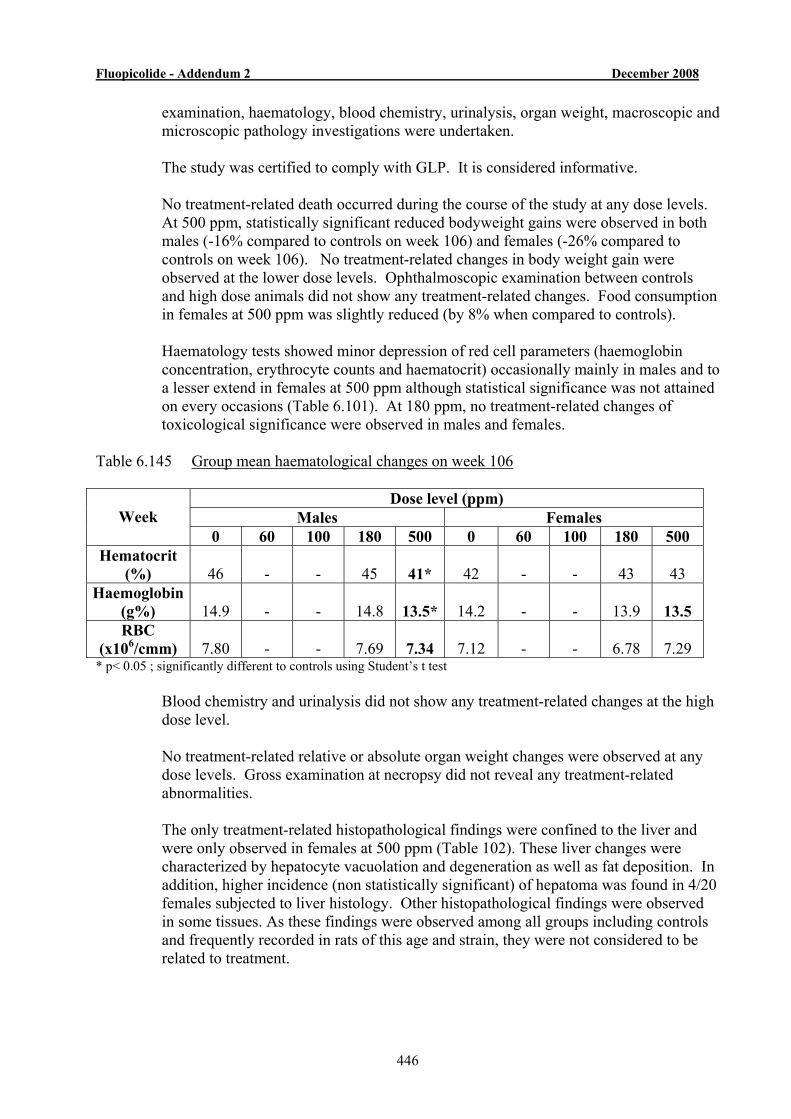
Fluopicolide - Addendum 2 December 2008
446
examination, haematology, blood chemistry, urinalysis, organ weight, macroscopic and microscopic pathology investigations were undertaken.
The study was certified to comply with GLP. It is considered informative. No treatment-related death occurred during the course of the study at any dose levels.
At 500 ppm, statistically significant reduced bodyweight gains were observed in both males (-16% compared to controls on week 106) and females (-26% compared to controls on week 106). No treatment-related changes in body weight gain were observed at the lower dose levels. Ophthalmoscopic examination between controls and high dose animals did not show any treatment-related changes. Food consumption in females at 500 ppm was slightly reduced (by 8% when compared to controls).
Haematology tests showed minor depression of red cell parameters (haemoglobin
concentration, erythrocyte counts and haematocrit) occasionally mainly in males and to a lesser extend in females at 500 ppm although statistical significance was not attained on every occasions (Table 6.101). At 180 ppm, no treatment-related changes of toxicological significance were observed in males and females.
Table 6.145 Group mean haematological changes on week 106
Dose level (ppm) Males Females
Week
0 60 100 180 500 0 60 100 180 500 Hematocrit
(%)
46 -
-
45
41*
42
-
-
43
43
Haemoglobin (g%)
14.9
-
-
14.8
13.5*
14.2
-
-
13.9
13.5
RBC (x106/cmm)
7.80
-
-
7.69
7.34
7.12
-
-
6.78
7.29
* p< 0.05 ; significantly different to controls using Student’s t test Blood chemistry and urinalysis did not show any treatment-related changes at the high
dose level. No treatment-related relative or absolute organ weight changes were observed at any
dose levels. Gross examination at necropsy did not reveal any treatment-related abnormalities.
The only treatment-related histopathological findings were confined to the liver and
were only observed in females at 500 ppm (Table 102). These liver changes were characterized by hepatocyte vacuolation and degeneration as well as fat deposition. In addition, higher incidence (non statistically significant) of hepatoma was found in 4/20 females subjected to liver histology. Other histopathological findings were observed in some tissues. As these findings were observed among all groups including controls and frequently recorded in rats of this age and strain, they were not considered to be related to treatment.
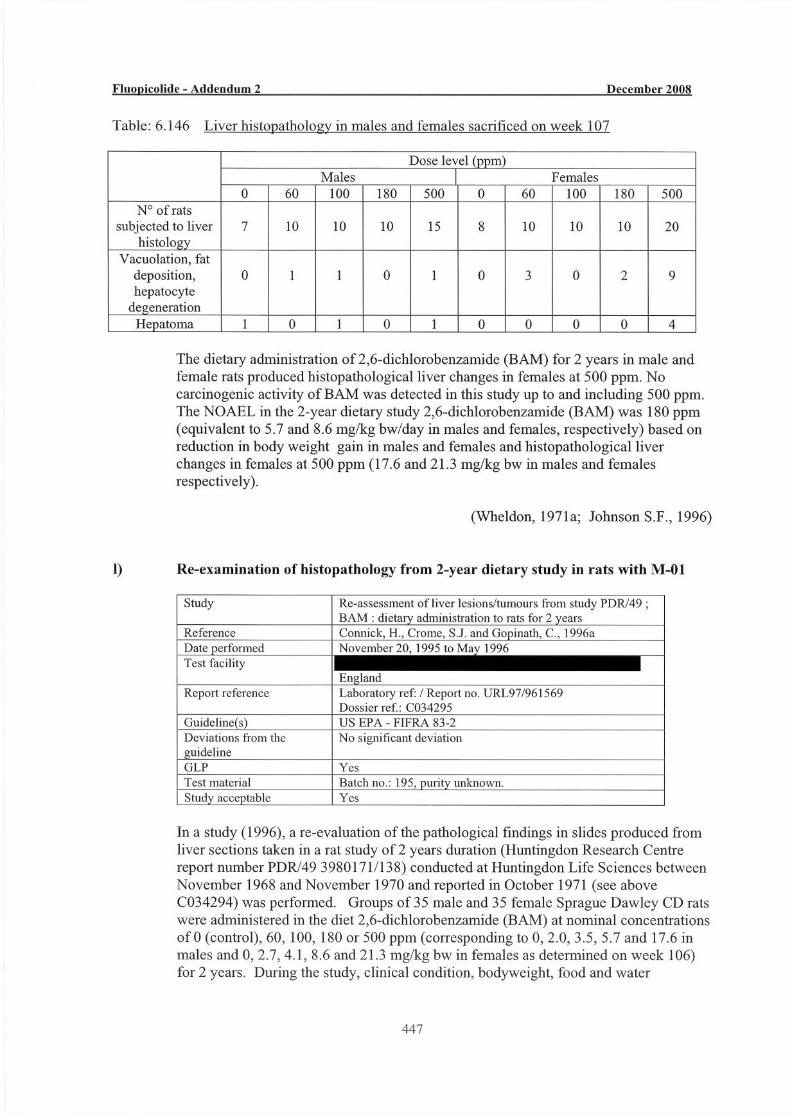
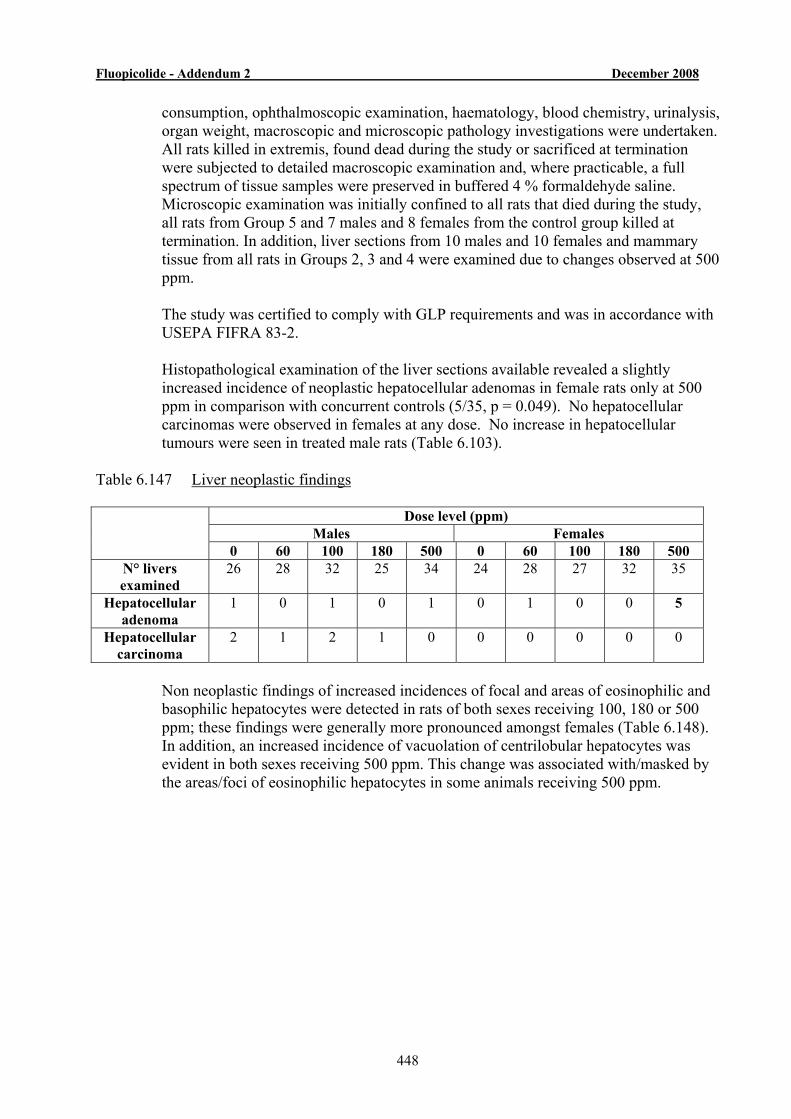
Fluopicolide - Addendum 2 December 2008
448
consumption, ophthalmoscopic examination, haematology, blood chemistry, urinalysis, organ weight, macroscopic and microscopic pathology investigations were undertaken. All rats killed in extremis, found dead during the study or sacrificed at termination were subjected to detailed macroscopic examination and, where practicable, a full spectrum of tissue samples were preserved in buffered 4 % formaldehyde saline. Microscopic examination was initially confined to all rats that died during the study, all rats from Group 5 and 7 males and 8 females from the control group killed at termination. In addition, liver sections from 10 males and 10 females and mammary tissue from all rats in Groups 2, 3 and 4 were examined due to changes observed at 500 ppm.
The study was certified to comply with GLP requirements and was in accordance with
USEPA FIFRA 83-2. Histopathological examination of the liver sections available revealed a slightly
increased incidence of neoplastic hepatocellular adenomas in female rats only at 500 ppm in comparison with concurrent controls (5/35, p = 0.049). No hepatocellular carcinomas were observed in females at any dose. No increase in hepatocellular tumours were seen in treated male rats (Table 6.103).
Table 6.147 Liver neoplastic findings
Dose level (ppm) Males Females
0 60 100 180 500 0 60 100 180 500 N° livers examined
26 28 32 25 34 24 28 27 32 35
Hepatocellular adenoma
1 0 1 0 1 0 1 0 0 5
Hepatocellular carcinoma
2 1 2 1 0 0 0 0 0 0
Non neoplastic findings of increased incidences of focal and areas of eosinophilic and
basophilic hepatocytes were detected in rats of both sexes receiving 100, 180 or 500 ppm; these findings were generally more pronounced amongst females (Table 6.148). In addition, an increased incidence of vacuolation of centrilobular hepatocytes was evident in both sexes receiving 500 ppm. This change was associated with/masked by the areas/foci of eosinophilic hepatocytes in some animals receiving 500 ppm.
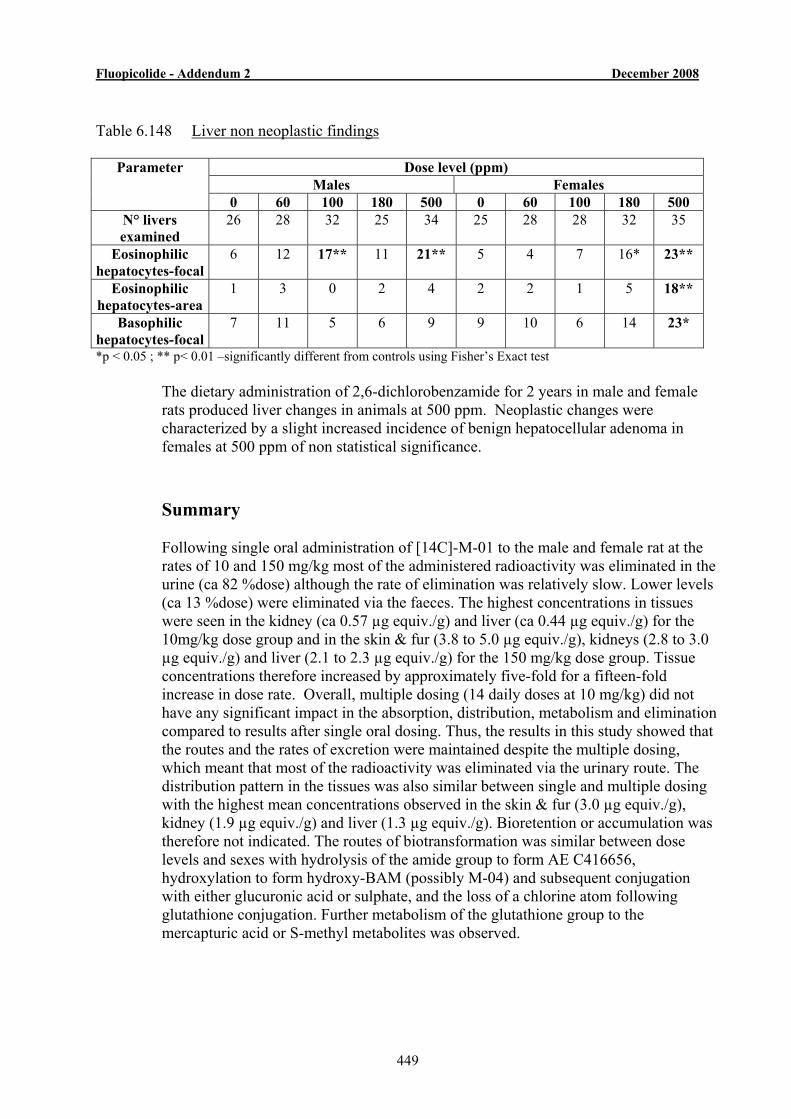
Fluopicolide - Addendum 2 December 2008
449
Table 6.148 Liver non neoplastic findings
Dose level (ppm) Males Females
Parameter
0 60 100 180 500 0 60 100 180 500 N° livers examined
26 28 32 25 34 25 28 28 32 35
Eosinophilic hepatocytes-focal
6 12 17** 11 21** 5 4 7 16* 23**
Eosinophilic hepatocytes-area
1 3 0 2 4 2 2 1 5 18**
Basophilic hepatocytes-focal
7 11 5 6 9 9 10 6 14 23*
*p < 0.05 ; ** p< 0.01 –significantly different from controls using Fisher’s Exact test The dietary administration of 2,6-dichlorobenzamide for 2 years in male and female
rats produced liver changes in animals at 500 ppm. Neoplastic changes were characterized by a slight increased incidence of benign hepatocellular adenoma in females at 500 ppm of non statistical significance.
Summary
Following single oral administration of [14C]-M-01 to the male and female rat at the
rates of 10 and 150 mg/kg most of the administered radioactivity was eliminated in the urine (ca 82 %dose) although the rate of elimination was relatively slow. Lower levels (ca 13 %dose) were eliminated via the faeces. The highest concentrations in tissues were seen in the kidney (ca 0.57 µg equiv./g) and liver (ca 0.44 µg equiv./g) for the 10mg/kg dose group and in the skin & fur (3.8 to 5.0 µg equiv./g), kidneys (2.8 to 3.0 µg equiv./g) and liver (2.1 to 2.3 µg equiv./g) for the 150 mg/kg dose group. Tissue concentrations therefore increased by approximately five-fold for a fifteen-fold increase in dose rate. Overall, multiple dosing (14 daily doses at 10 mg/kg) did not have any significant impact in the absorption, distribution, metabolism and elimination compared to results after single oral dosing. Thus, the results in this study showed that the routes and the rates of excretion were maintained despite the multiple dosing, which meant that most of the radioactivity was eliminated via the urinary route. The distribution pattern in the tissues was also similar between single and multiple dosing with the highest mean concentrations observed in the skin & fur (3.0 µg equiv./g), kidney (1.9 µg equiv./g) and liver (1.3 µg equiv./g). Bioretention or accumulation was therefore not indicated. The routes of biotransformation was similar between dose levels and sexes with hydrolysis of the amide group to form AE C416656, hydroxylation to form hydroxy-BAM (possibly M-04) and subsequent conjugation with either glucuronic acid or sulphate, and the loss of a chlorine atom following glutathione conjugation. Further metabolism of the glutathione group to the mercapturic acid or S-methyl metabolites was observed.
Fluopicolide - Addendum 2 December 2008
450
M-01 was shown to be of relatively low acute oral toxicity with an LD50 of 500 mg/kg in female rats and 2000 mg/kg bw determined by the acute toxic class method. Hi=owever, an LD50 of 1470 (951–2270) and 2330 (1430–3780) mg/kg bw for male and female rats was determined in an older pre-GLP study in which toxicity to females was less than in males. M-01 thus qualifies for an Xn classification according to the current European directive. It is notable that this metabolite is of greater acute oral toxicity than the parent, fluopicolide (LD50 > 5000 mg/kg bw), However, this difference in toxicity between fluopicolide and BAM for acute toxicity is not considered relevant under the groundwater metabolite assessment guidance because BAM is not classified as TOXIC nor is Fluopicolide.
The genotoxicity profile of M-01 was assessed in three in vitro and one in vivo assays
and no evidence of genotoxicity was observed in any assays. The in vitro studies were the bacterial gene mutation assay in bacterial cells, V79/HPRT gene locus assay, and unscheduled DNA synthesis assay and the mouse micronucleus assay in vivo.
In a 13-week toxicity study performed in CD rats with M-01 at doses up to 2300 ppm
reduced body weight gains and food consumption was observed at dose levels of ≥ 600 ppm but no target organ toxicity was observed. The NOAEL of M-01 was 180 ppm (equivalent to 14 mg/kg bw/day) in both males and females.
In a carcinogenicity study performed in CD rats with M-01 at doses up to 500 ppm, the
liver as the principal target organ with a slightly increased incidence (of non statistical significance) of hepatocellular adenoma in females at 500 ppm. No carcinogenic effect was seen after a 2-year treatment with M-01. The NOAEL was 180 ppm, 5.7 mg/kg bw/day in males and 8.6 mg/kg bw/day in females based on reduction in bodyweight gain in both sexes and histopathological changes in the liver in females only.
In conclusion, these data showed that the toxicological profile of the metabolite M-01
is similar to that of fluopicolide based on the principles of the guidance document for the assessment of groundwater metabolites (EU Guidance Document - SANCO/221/200-rev 10, 25 February 2003).
Fluopicolide - Addendum 2 December 2008
451
APPENDIX 3 Position Paper
Subject:
The non-relevance of the fluopicolide metabolite
M01 (AE C653711): 2,6-dichlorobenzamide (also known as BAM)
Authors: C. Leake, E. Mackenzie, C. Kley, B. Mallyon, D. Renault,
S. Pross, M. Theurig
Date:
11th April 2008
Bayer CropScience AG Alfred Nobel Straße 50
D-40789 Monheim/Rhein Germany
Fluopicolide - Addendum 2 December 2008
452
CONFIDENTIALITY STATEMENT
This report is confidential. No part of this report or any information contained there in may be disclosed to any third party without the prior written authorisation of Bayer CropScience.
Fluopicolide - Addendum 2 December 2008
453
TABLE OF CONTENTS
1. Summary .........................................................................................................
2. Introduction.....................................................................................................
3. Environmental behaviour of M01 (AE C653711) ..........................................
3.1. Degradation of Fluopicolide in soil resulting in the formation of M01 (AE C653711)...................................................................................................
3.2 Field leaching study ......................................... Error! Bookmark not defined.
3.3 Predicted Environmental Concentrations in groundwater – FOCUS calculations.....................................................................................................
4. Assessment of the relevance of the metabolite M01 (AE C653711)
4.1 Step 3 Hazard assessment- screening for biological relevance
4.2 Step 3 Hazard assessment- screening for genotoxicity..............................
4.3 Step 3 Hazard assessment- screening for toxicity ......................................
4.3.1 Overview of metabolism studies in rats .......................................................
4.3.2 Overview of acute oral toxicity studies ........................................................
4.3.3 Overview of the key studies to evaluate the acute/chronic/long-term toxicity of M01 (AE C653711).........................................................................
4.3.4 Determination of the Acceptable Daily Intake of M01 (AE C653711)..........
4.3.5 Comparative Toxicological Assessment ......................................................
4.3.6 Summary .........................................................................................................
4.4 Step 4 Exposure assessment - threshold of concern approach.
4.5 Step 5 Refined risk assessments for non-relevant metabolites.................
5 Assessment of ecotoxicological relevance..................................................
6 Overall conclusions .......................................................................................
7 References ......................................................................................................
Appendix I: Flow diagram of testing for relevance .................................................
Fluopicolide - Addendum 2 December 2008
454
Appendix II: Evaluation and Consideration of the 2-year rat study conducted with M01 (AE C653711)...................................................................................
Appendix III: Summaries of the 2 year Dog Study, the Rat Multigeneration Study and the Rabbit developmental study conducted on M01 (AE C653711)..........................................................................................................
Fluopicolide - Addendum 2 December 2008
455
1. Summary Fluopicolide is a novel fungicide discovered and developed by Bayer CropScience, active against Oomycetes fungi which are responsible for late blight diseases on a wide range of crops including potatoes and vines. In 2007 it was rated by independent potato experts in Europe as the best potato late blight product (showed the best biological performance in independent trials as well as the best spectrum in controlling leaf, stem and tuber blight). During the toxicology expert meeting organised by EFSA (European Food Safety Authority) it was requested to demonstrate the non relevance of one of the metabolites, namely M01 (AE C657311) also known as 2,6-dichlorobenzamide or BAM. This document has been prepared to summarise all the available information on this metabolite, to provide the risk assessment and to demonstrate that all the criteria for non-relevance have been met.
Exposure Assessment A maximum PECgw value for M01 (AE C653711) was estimated to be 6.3 µg/L in vines, and 3.2 µg/L and 2.1 µg/L in potatoes for the representative scenarios of application one year in two or one year in three, respectively.
Pesticidal / biological assessment M01 (AE C653711) showed no evidence of biological activity in fungicide assessment studies whereas the parent fluopicolide showed >90% control. It has also been assessed as part of the dichlobenil dossier and shown no herbicidal activity.
Toxicological assessment M01 has been shown:
♦ not to be genotoxic in an Ames, HPRT and UDS tests in-vitro, and in a micronucleus test in-vivo
♦ the majority is excreted via urine, both unchanged and following biotransformation, small quantities were excreted via the faeces and very low quantities were retained, showing that it is not subject to bioaccumulation
♦ to have a LD50 in the range between 500 and 2330 mg/kg and is therefore not toxic (T) or very toxic (T+)
♦ not to be carcinogenic ♦ not to be a reproductive toxicant
and is therefore not toxicologically relevant.
Fluopicolide - Addendum 2 December 2008
456
Refined Risk Assessment.
♦ A worst-case exposure assessment as recommended by the Rapporteur Member State, UK (PSD), was conducted based on the intake of M01 (AE C653711) by an infant weighing 8.7 kg and drinking 2 litres of water (e.g. in infant formula) containing 10 µg M01 (AE C653711)/litre water (in excess of the maximum predicted concentration) and also taking into account exposure via food intake from fluopicolide residues. The Theoretical Maximum Daily Intake on this basis was 0.00274 mg/kg/day.
♦ It has been shown that when all sources of the diet are included; primary crops, rotational crops and water, M01 will contribute, as a worst-case, no more than 6% of the acceptable daily intake in total. The worst-case contribution from water is only 5% of the ADI.
Calculation of Margin of Safety
♦ In comparison with the lowest NOEL for M01 (AE C653711) from the dog 2-year study (i.e. 4.5 mg/kg/day), on which basis an ADI of 0.045 mg/kg/day is proposed, it can be seen that the Margin of Safety (MOS) is 1642 (i.e. 4.5 mg/kg/day divided by 0.00274 mg/kg/day).
♦ In comparison with the ADI for the parent fluopicolide of 0.08 mg/kg/day it can be seen
that the MOS from the NOEL for the parent fluopicolide is 2920.
♦ In either case it is clear that there is no significant risk to consumers from exposure of M01 (AE C653711) based on the proposed uses of fluopicolide.
Ecotoxicological assessment
♦ M01 (AE C653711) has shown to be not toxic to any of the tested aquatic organisms.
Therefore it can be considered as not ecotoxicologically relevant in aquatic systems.
Therefore, it is concluded that M01 (AE C653711) is not relevant as it fully meets the criteria for non-relevance according to the EU guidance document 91/414/EEC – Sanco/221/2000-rev 10, 25 February 2003.
M01 (AE C653711) has clearly and comprehensively been shown to be non-relevant.
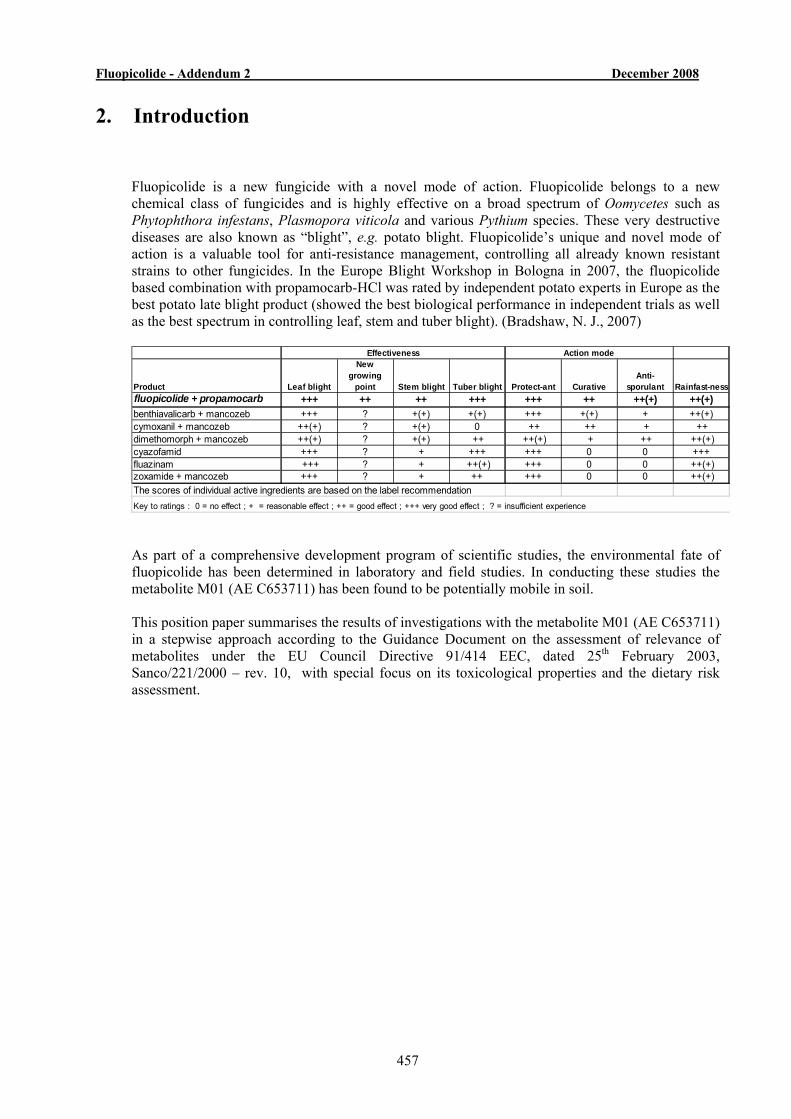
Fluopicolide - Addendum 2 December 2008
457
2. Introduction Fluopicolide is a new fungicide with a novel mode of action. Fluopicolide belongs to a new chemical class of fungicides and is highly effective on a broad spectrum of Oomycetes such as Phytophthora infestans, Plasmopora viticola and various Pythium species. These very destructive diseases are also known as “blight”, e.g. potato blight. Fluopicolide’s unique and novel mode of action is a valuable tool for anti-resistance management, controlling all already known resistant strains to other fungicides. In the Europe Blight Workshop in Bologna in 2007, the fluopicolide based combination with propamocarb-HCl was rated by independent potato experts in Europe as the best potato late blight product (showed the best biological performance in independent trials as well as the best spectrum in controlling leaf, stem and tuber blight). (Bradshaw, N. J., 2007)
Product Leaf blight
New growing
point Stem blight Tuber blight Protect-ant CurativeAnti-
sporulant Rainfast-nessfluopicolide + propamocarb +++ ++ ++ +++ +++ ++ ++(+) ++(+)benthiavalicarb + mancozeb +++ ? +(+) +(+) +++ +(+) + ++(+)cymoxanil + mancozeb ++(+) ? +(+) 0 ++ ++ + ++dimethomorph + mancozeb ++(+) ? +(+) ++ ++(+) + ++ ++(+)cyazofamid +++ ? + +++ +++ 0 0 +++fluazinam +++ ? + ++(+) +++ 0 0 ++(+)zoxamide + mancozeb +++ ? + ++ +++ 0 0 ++(+)The scores of individual active ingredients are based on the label recommendation
Effectiveness Action mode
Key to ratings : 0 = no effect ; + = reasonable effect ; ++ = good effect ; +++ very good effect ; ? = insufficient experience
As part of a comprehensive development program of scientific studies, the environmental fate of fluopicolide has been determined in laboratory and field studies. In conducting these studies the metabolite M01 (AE C653711) has been found to be potentially mobile in soil. This position paper summarises the results of investigations with the metabolite M01 (AE C653711) in a stepwise approach according to the Guidance Document on the assessment of relevance of metabolites under the EU Council Directive 91/414 EEC, dated 25th February 2003, Sanco/221/2000 – rev. 10, with special focus on its toxicological properties and the dietary risk assessment.
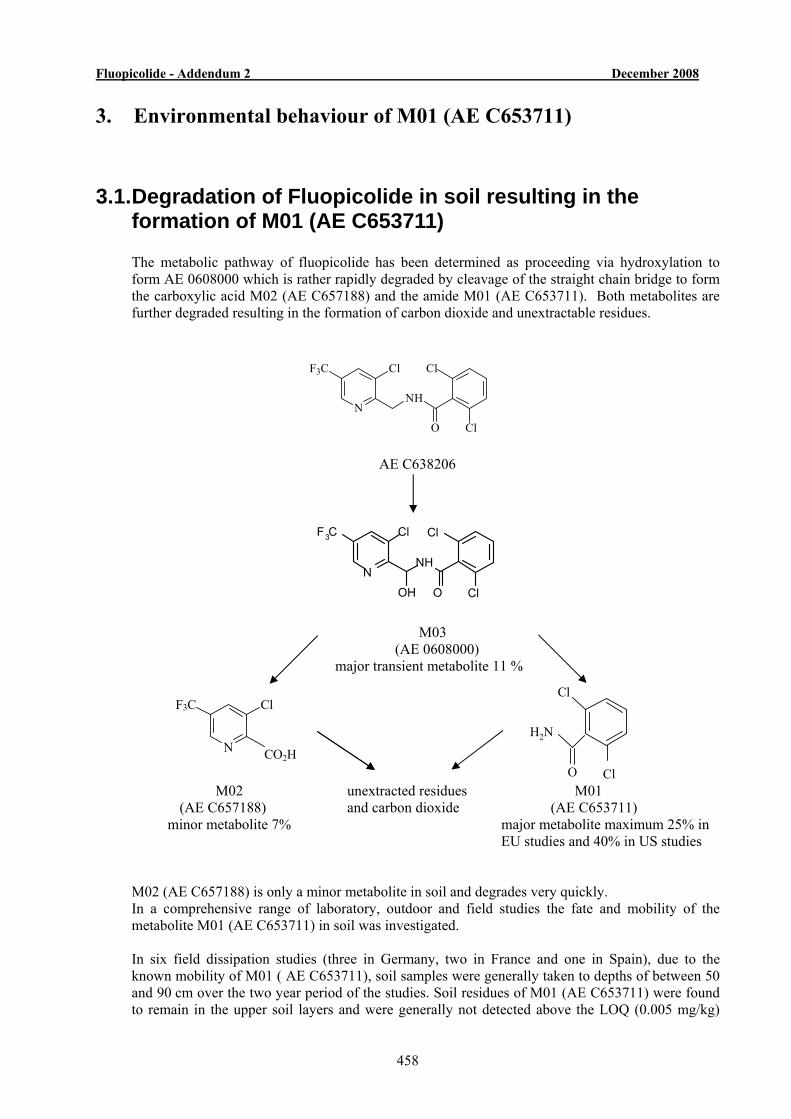
Fluopicolide - Addendum 2 December 2008
458
N
F3C Cl
NH
O Cl
Cl
OH
3. Environmental behaviour of M01 (AE C653711)
3.1. Degradation of Fluopicolide in soil resulting in the formation of M01 (AE C653711) The metabolic pathway of fluopicolide has been determined as proceeding via hydroxylation to form AE 0608000 which is rather rapidly degraded by cleavage of the straight chain bridge to form the carboxylic acid M02 (AE C657188) and the amide M01 (AE C653711). Both metabolites are further degraded resulting in the formation of carbon dioxide and unextractable residues.
AE C638206 M03
(AE 0608000) major transient metabolite 11 %
M02 unextracted residues M01 (AE C657188) and carbon dioxide (AE C653711) minor metabolite 7% major metabolite maximum 25% in
EU studies and 40% in US studies M02 (AE C657188) is only a minor metabolite in soil and degrades very quickly. In a comprehensive range of laboratory, outdoor and field studies the fate and mobility of the metabolite M01 (AE C653711) in soil was investigated. In six field dissipation studies (three in Germany, two in France and one in Spain), due to the known mobility of M01 ( AE C653711), soil samples were generally taken to depths of between 50 and 90 cm over the two year period of the studies. Soil residues of M01 (AE C653711) were found to remain in the upper soil layers and were generally not detected above the LOQ (0.005 mg/kg)
N
F3C Cl
NH
O
Cl
Cl
N
F3C Cl
CO2H
Cl
ClO
H2N
Fluopicolide - Addendum 2 December 2008
459
below a depth of 30 cm. However since there was a possibility of M01 (AE C653711) leaching at low levels below this LOQ a field leaching study was conducted to quantify the amount present in soil water at lower depths.
3.2 Field leaching study The field leaching study was conducted with fluopicolide by Pollman, B., 2003, on a sandy soil in Germany to quantify the leaching potential of fluopicolide and its primary metabolite M01 (AE C653711) under realistic worst case conditions. The top soil was a low organic carbon silty sand, overlying sand subsoil. The soil properties were significantly more stringent than the lysimeter guideline requirements. Fluopicolide, formulated as a suspo-emulsion was applied to lettuce at growth stage BBCH 14 to 19 between May and October 2000, at the rate required to achieve a total application of 400 g a.i./ha. A total of 45 suction samplers were employed to collect soil water at 5 different depths throughout the soil profile down to 150 cm. Samples of soil water were collected at intervals over a three year period and analysed by a LC/MS/MS method. Soil leaching conditions were prevalent between May and July 2000 and from September 2000 to May 2001 in the first year of the study. Unusually wet conditions caused immediate downward movement of the bromide tracer and of the parent compound and metabolites. In the second year the leaching period was from September 2001 to June 2002 and in the third year from October 2002 to March 2003. Annual average concentrations of fluopicolide throughout the study in the deeper soil layers were below < 0.1 µg/L. The metabolites M03 (AE 0608000) and M02 (AE C657188) were rapidly degraded, were not mobile and would not be expected to reach groundwater at concentrations exceeding 0.1 µg/L. The metabolite M01 (AE C653711) was found to be mobile and moderately degraded in soil and consequently residues were detected in soil water at all soil depths. Maximum annual average concentrations for each of the three years of the study in the deeper soil layers were 4.4 µg/L at 85 cm (second year), 2.9 µg/L at 120 cm (third year) and 2.4 µg/L at 150 cm depth (third year).
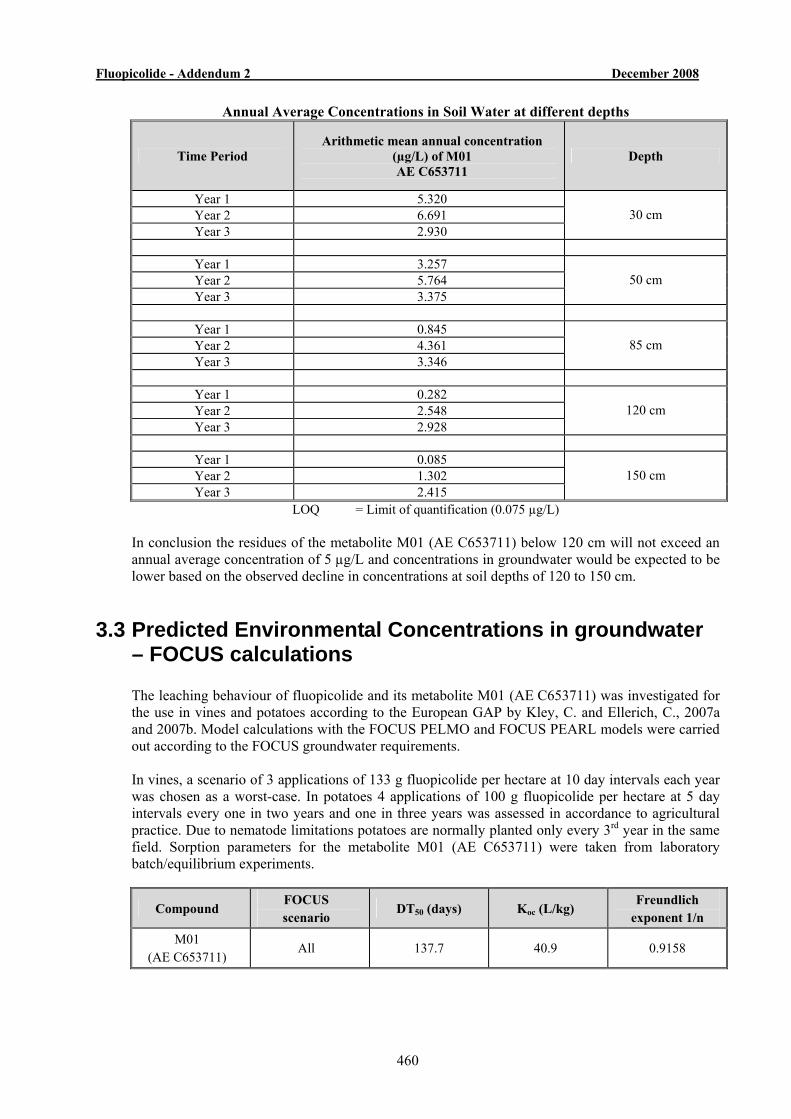
Fluopicolide - Addendum 2 December 2008
460
Annual Average Concentrations in Soil Water at different depths
Time Period Arithmetic mean annual concentration
(µg/L) of M01 AE C653711
Depth
Year 1 5.320 Year 2 6.691 Year 3 2.930
30 cm
Year 1 3.257 Year 2 5.764 Year 3 3.375
50 cm
Year 1 0.845 Year 2 4.361 Year 3 3.346
85 cm
Year 1 0.282 Year 2 2.548 Year 3 2.928
120 cm
Year 1 0.085 Year 2 1.302 Year 3 2.415
150 cm
LOQ = Limit of quantification (0.075 µg/L)
In conclusion the residues of the metabolite M01 (AE C653711) below 120 cm will not exceed an annual average concentration of 5 µg/L and concentrations in groundwater would be expected to be lower based on the observed decline in concentrations at soil depths of 120 to 150 cm.
3.3 Predicted Environmental Concentrations in groundwater – FOCUS calculations The leaching behaviour of fluopicolide and its metabolite M01 (AE C653711) was investigated for the use in vines and potatoes according to the European GAP by Kley, C. and Ellerich, C., 2007a and 2007b. Model calculations with the FOCUS PELMO and FOCUS PEARL models were carried out according to the FOCUS groundwater requirements. In vines, a scenario of 3 applications of 133 g fluopicolide per hectare at 10 day intervals each year was chosen as a worst-case. In potatoes 4 applications of 100 g fluopicolide per hectare at 5 day intervals every one in two years and one in three years was assessed in accordance to agricultural practice. Due to nematode limitations potatoes are normally planted only every 3rd year in the same field. Sorption parameters for the metabolite M01 (AE C653711) were taken from laboratory batch/equilibrium experiments.
Compound FOCUS scenario
DT50 (days) Koc (L/kg) Freundlich
exponent 1/n M01
(AE C653711) All 137.7 40.9 0.9158
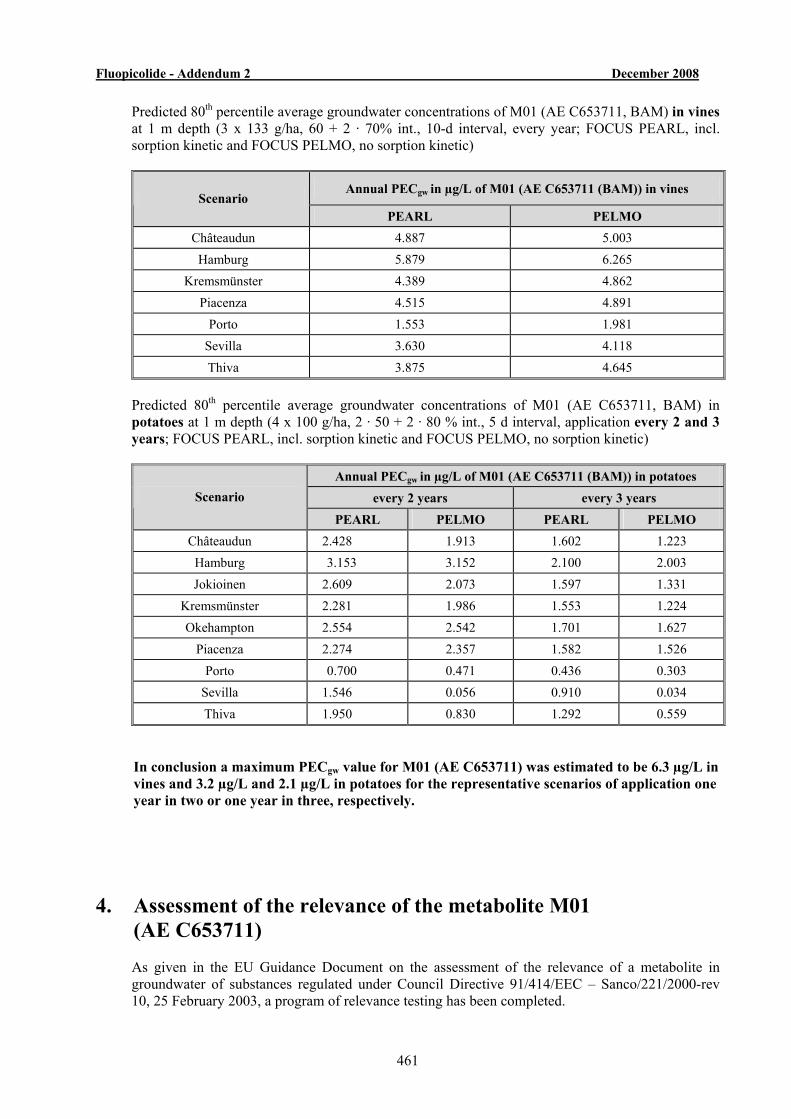
Fluopicolide - Addendum 2 December 2008
461
Predicted 80th percentile average groundwater concentrations of M01 (AE C653711, BAM) in vines at 1 m depth (3 x 133 g/ha, 60 + 2 · 70% int., 10-d interval, every year; FOCUS PEARL, incl. sorption kinetic and FOCUS PELMO, no sorption kinetic)
Annual PECgw in µg/L of M01 (AE C653711 (BAM)) in vines Scenario
PEARL PELMO Châteaudun 4.887 5.003
Hamburg 5.879 6.265 Kremsmünster 4.389 4.862
Piacenza 4.515 4.891 Porto 1.553 1.981
Sevilla 3.630 4.118 Thiva 3.875 4.645
Predicted 80th percentile average groundwater concentrations of M01 (AE C653711, BAM) in potatoes at 1 m depth (4 x 100 g/ha, 2 · 50 + 2 · 80 % int., 5 d interval, application every 2 and 3 years; FOCUS PEARL, incl. sorption kinetic and FOCUS PELMO, no sorption kinetic)
Annual PECgw in µg/L of M01 (AE C653711 (BAM)) in potatoes every 2 years every 3 years Scenario
PEARL PELMO PEARL PELMO Châteaudun 2.428 1.913 1.602 1.223
Hamburg 3.153 3.152 2.100 2.003 Jokioinen 2.609 2.073 1.597 1.331
Kremsmünster 2.281 1.986 1.553 1.224 Okehampton 2.554 2.542 1.701 1.627
Piacenza 2.274 2.357 1.582 1.526 Porto 0.700 0.471 0.436 0.303
Sevilla 1.546 0.056 0.910 0.034 Thiva 1.950 0.830 1.292 0.559
In conclusion a maximum PECgw value for M01 (AE C653711) was estimated to be 6.3 µg/L in vines and 3.2 µg/L and 2.1 µg/L in potatoes for the representative scenarios of application one year in two or one year in three, respectively.
4. Assessment of the relevance of the metabolite M01 (AE C653711)
As given in the EU Guidance Document on the assessment of the relevance of a metabolite in groundwater of substances regulated under Council Directive 91/414/EEC – Sanco/221/2000-rev 10, 25 February 2003, a program of relevance testing has been completed.
Fluopicolide - Addendum 2 December 2008
462
The program followed the step-wise approaches as outlined in the Guidance Document: Step 1: Exclusion of degradation products of no concern
The metabolite M01 (AE C653711) contains a phenyl ring and is similar to natural substances from soil organic matter. However, since it contains more than four carbon atoms and it is therefore not automatically of no concern.
Step 2: Quantification of potential groundwater contamination
A comprehensive range of studies have been conducted under laboratory, outdoor and field conditions to quantify the potential concentrations in groundwater and these have shown highest concentrations in the range of 2 µg/L to 6.3 µg/L.
Step 3: Hazard assessment – identification of relevant metabolites
Progressing to step 3 requires the assessment to be conducted in three stages:
Stage 1: screening for biological activity Stage 2: screening for genotoxicity Stage 3: screening for toxicity
A comprehensive series of hazard assessment studies have been conducted according to Step 3 and M01 (AE C653711) has been shown to have no fungicidal activity, no herbicidal activity and not to be genotoxic or classified for toxicity. These results are summarised on the next pages.
Step 4: Exposure assessment – threshold of concern approach
The exposure assessment shows that M01 (AE C653711) is above threshold of concern which is given in the Guidance Document as 0.75 µg/L and therefore has been subject to a refined risk assessment.
Step 5: Refined risk assessments for the non relevant metabolites
The refined risk assessment using a worst-case value of 10µg/L (trigger value described in the above-mentioned guidance document) has shown there is no concern when taking all contributions to the diet into consideration (overall intake being less than 6% of the ADI).
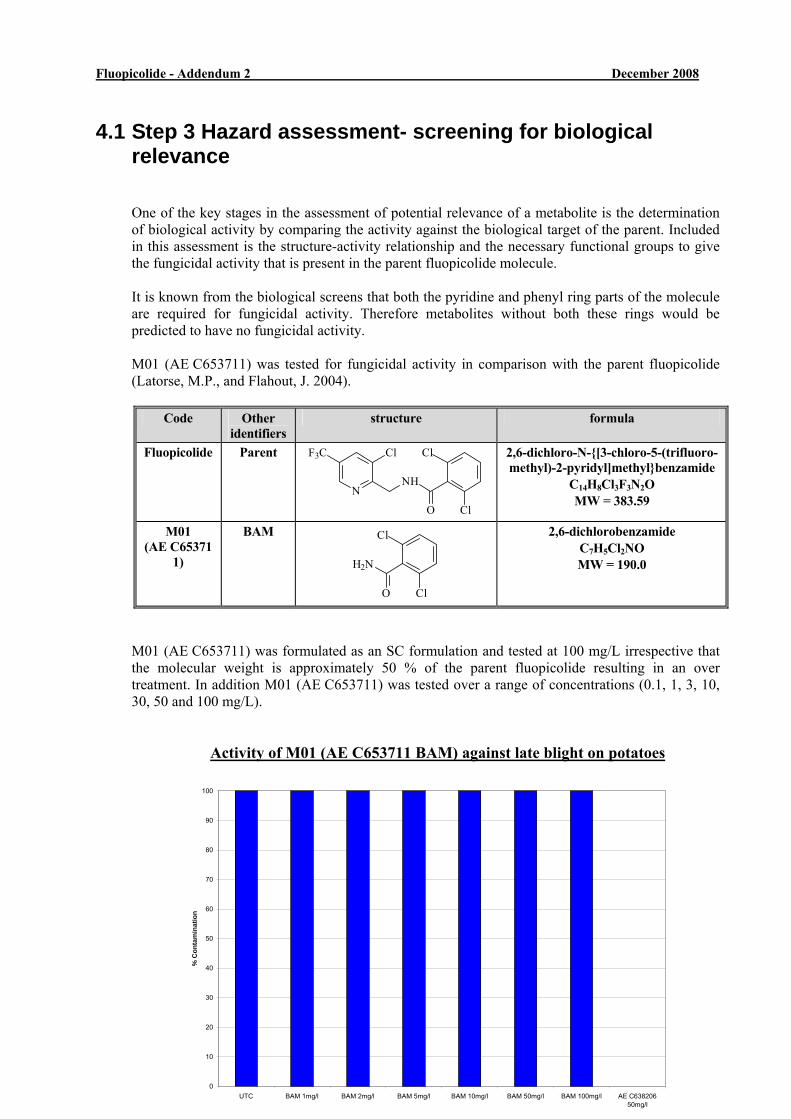
Fluopicolide - Addendum 2 December 2008
463
4.1 Step 3 Hazard assessment- screening for biological relevance One of the key stages in the assessment of potential relevance of a metabolite is the determination of biological activity by comparing the activity against the biological target of the parent. Included in this assessment is the structure-activity relationship and the necessary functional groups to give the fungicidal activity that is present in the parent fluopicolide molecule. It is known from the biological screens that both the pyridine and phenyl ring parts of the molecule are required for fungicidal activity. Therefore metabolites without both these rings would be predicted to have no fungicidal activity. M01 (AE C653711) was tested for fungicidal activity in comparison with the parent fluopicolide (Latorse, M.P., and Flahout, J. 2004).
Code Other identifiers
structure formula
Fluopicolide Parent
N
F3C Cl
NH
O
Cl
Cl
2,6-dichloro-N-{[3-chloro-5-(trifluoro-methyl)-2-pyridyl]methyl}benzamide
C14H8Cl3F3N2O MW = 383.59
M01 (AE C65371
1)
BAM
Cl
Cl
H2N
O
2,6-dichlorobenzamide C7H5Cl2NO MW = 190.0
M01 (AE C653711) was formulated as an SC formulation and tested at 100 mg/L irrespective that the molecular weight is approximately 50 % of the parent fluopicolide resulting in an over treatment. In addition M01 (AE C653711) was tested over a range of concentrations (0.1, 1, 3, 10, 30, 50 and 100 mg/L).
Activity of M01 (AE C653711 BAM) against late blight on potatoes
0
10
20
30
40
50
60
70
80
90
100
UTC BAM 1mg/l BAM 2mg/l BAM 5mg/l BAM 10mg/l BAM 50mg/l BAM 100mg/l AE C63820650mg/l
% C
onta
min
atio
n
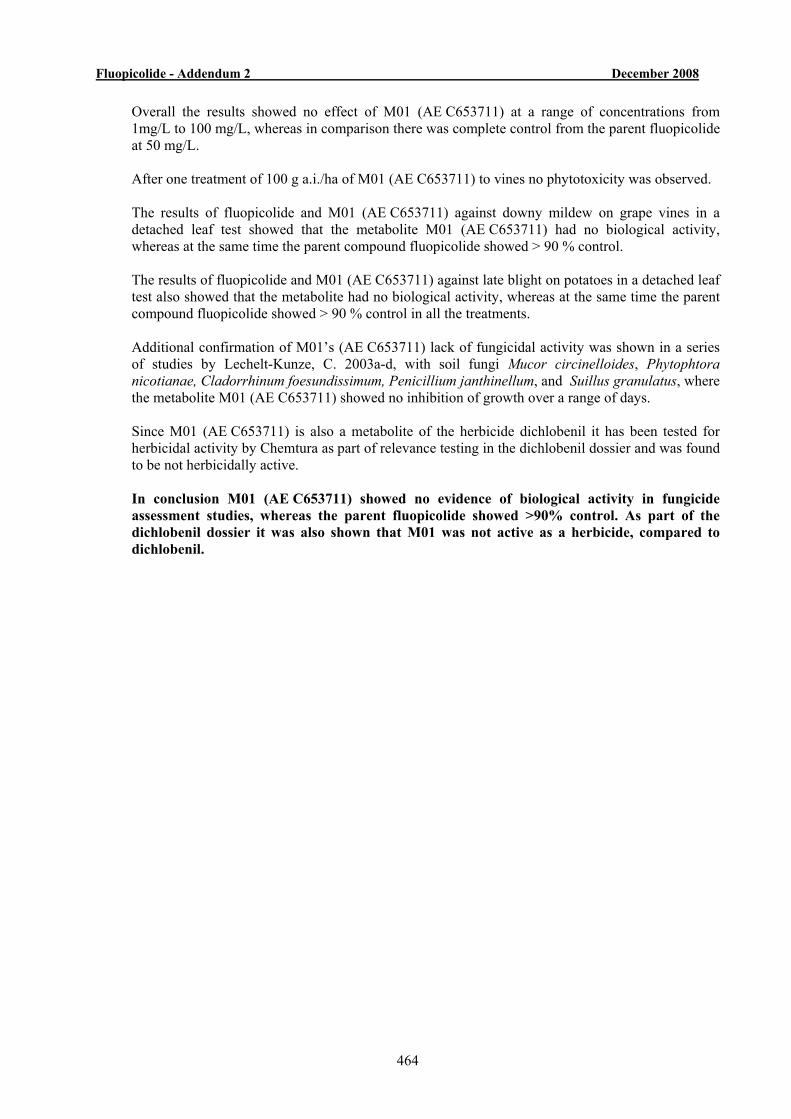
Fluopicolide - Addendum 2 December 2008
464
Overall the results showed no effect of M01 (AE C653711) at a range of concentrations from 1mg/L to 100 mg/L, whereas in comparison there was complete control from the parent fluopicolide at 50 mg/L. After one treatment of 100 g a.i./ha of M01 (AE C653711) to vines no phytotoxicity was observed. The results of fluopicolide and M01 (AE C653711) against downy mildew on grape vines in a detached leaf test showed that the metabolite M01 (AE C653711) had no biological activity, whereas at the same time the parent compound fluopicolide showed > 90 % control. The results of fluopicolide and M01 (AE C653711) against late blight on potatoes in a detached leaf test also showed that the metabolite had no biological activity, whereas at the same time the parent compound fluopicolide showed > 90 % control in all the treatments.
Additional confirmation of M01’s (AE C653711) lack of fungicidal activity was shown in a series of studies by Lechelt-Kunze, C. 2003a-d, with soil fungi Mucor circinelloides, Phytophtora nicotianae, Cladorrhinum foesundissimum, Penicillium janthinellum, and Suillus granulatus, where the metabolite M01 (AE C653711) showed no inhibition of growth over a range of days. Since M01 (AE C653711) is also a metabolite of the herbicide dichlobenil it has been tested for herbicidal activity by Chemtura as part of relevance testing in the dichlobenil dossier and was found to be not herbicidally active. In conclusion M01 (AE C653711) showed no evidence of biological activity in fungicide assessment studies, whereas the parent fluopicolide showed >90% control. As part of the dichlobenil dossier it was also shown that M01 was not active as a herbicide, compared to dichlobenil.
Fluopicolide - Addendum 2 December 2008
465
4.2 Step 3 Hazard assessment- screening for genotoxicity In the guidance document there is a requirement that metabolites that have shown some potential to be mobile and are not biologically active should be screened for their genotoxic activity in a series of three in vitro genotoxicity studies. These three study types are the Ames test, gene mutation test with mammalian cells and the chromosome aberration test. The guidance document also states that any equivocal results from in vitro studies should be substantiated by in vivo experiments. The genotoxicity of M01 (AE C653711) was actually assessed in four in vitro assays and one in vivo assay and no evidence of genotoxicity was observed in any of these assays. In two in vitro Ames tests run in a bacterial system (Koorn, J., 1992 and Herbold, B., 2003) M01 (AE C653711) was considered to be non-mutagenic with and without metabolic activation in the several bacteria strains assayed. In an in vitro V79/HPRT-test for the detection of induced forward mutations (Herbold, B., 2003a,), M01 (AE C653711) was shown to be non-mutagenic both with and without metabolic activation. M01 (AE C653711) was also negative in a DNA-repair assay using primary cell cultures of rat hepatocytes (Waart E.J. van der, 1993a). In addition, an in vivo assay was conducted in mouse bone marrow cells (Waart E.J. van de 1993b), clearly showing that M01 (AE C653711) was not clastogenic.
Summary of genotoxicity testing with M01 (AE C653711)
Test system Results Reference Ames test Negative Koorn J., 1992
Herbold B., 2003 HPRT test V79 Negative Herbold B., 2003a
In vitro
UDS in rat hepatocyte Negative Waart E.J. van der, 1993a
In vivo
Micronucleus test in mouse bone marrow
Negative Waart E.J. van der, 1993b
In conclusion, M01 (AE C653711) is not genotoxic.
Fluopicolide - Addendum 2 December 2008
466
4.3 Step 3 Hazard assessment- screening for toxicity In addition to genotoxicity testing, toxicity testing has been conducted to determine whether the metabolite has certain toxicological properties which from a regulatory perspective would qualify it to be classified as relevant. The EU Guidance Document states that if the parent compound is:
o acutely or chronically toxic or very toxic (T followed by R25, R24, R23 or R48, or T+ followed by R28, R27, R26 or R39), the metabolite must be tested for acute or chronic toxicity.
o toxic to reproduction (any category with R60, R61, R62 or R63), the metabolite must be shown not to qualify for the same classification,
o a carcinogen (category 1 or 2 followed by R45) all metabolites are considered to be relevant. For parent active substances classified as carcinogen category 3 (followed by R40) convincing evidence must be provided that the metabolite will not lead to any risk of carcinogenicity.
Taking into account that the parent compound fluopicolide was not classified for any endpoint, there is no strict requirement to undertake further testing with M01 (AE C653711) to evaluate its potential for acute, chronic, reproductive or carcinogenic potential. However, there are several studies available on M01 (AE C653711) which were conducted a long while ago for historic reasons, and in addition there are some newer studies which were conducted to assess the relevance of M01 (AE C653711) and to better characterise the toxicity of this metabolite. None of these studies provide evidence that M01 (AE C653711) should be classified for acute, chronic, reproduction or carcinogenic effects. Furthermore, the expert meeting (PRAPeR 39) concluded that M01 (AE C653711) should not be classified R40 for carcinogenicity.
4.3.1 Overview of metabolism studies in rats The metabolite M01 (AE C653711) has been observed in the rat, where it was found in both male and female rat liver at 8 hours post-dosing of fluopicolide. (Fisher P.J., 2003). Hence M01 (AE C653711) is termed a “common metabolite”. The metabolism of [14C-phenyl] M01 has been investigated following a single oral high dose by Gutierrez, L. 2003 and also by the same author at a single oral low dose Gutierrez, L. 2003a. In addition a study has been conducted in which M01 was repeatedly dosed to rats at a low dose rate, Gutierrez, L 2003b. The results of the single oral high dose showed that most of the administered radioactivity was eliminated in the urine (69-78 %) whilst only low levels were eliminated via the faeces (Gutierrez, L. 2003). Overall the quantification of radioactivity in the tissues showed low residual levels with sum totals of 1.17 % and 1.21 % for male and female rats, respectively (mean values). The highest concentration in tissues were seen in skin and fur, liver and kidney where the mean values ranged between 2.10 and 5.10 µg equivalents/g. Unchanged M01 (AE C653711) was seen in urine and
Fluopicolide - Addendum 2 December 2008
467
faecal samples from male and female rats. The biotransformation of M01 proceeded via diethyl-s-cysteine, o-glucuronidase, o-sulphatase enzymes and N-glucuronidase enzymes. A similar result was obtained from the single oral low dose (Gutierrez, L., 2003a), with 66-70 % excreted via urine and 12-13 % via the faeces. Again levels in the tissues were relatively low. In the repeat low dose oral A.D.M.E. study, Gutierrez, L., 2003b, it was shown that multiple dosing had no significant impact in the absorption, distribution, metabolism and elimination compared to the results after single oral dosing. The majority of the radioactivity was eliminated via the urinary route within 72 hour post multiple dosing. In terms of concentration the males were found to possess tissue levels that were a mean of 6.5 times (± 2.5 times) higher than those observed following a single oral low dose of 10 mg/kg, whilst the females displayed levels that were a mean of 3.1 times (± 1.9) those observed following a single oral low dose. As these increases where less than half the increase in the amounts of administered M01 it can be concluded that M01 is not subject to bio-retention. In conclusion, the majority of the M01 (AE C653711) is excreted via urine, both unchanged and following biotransformation, small quantities were excreted via the faeces and very low quantities were retained showing that it was not subject to bioaccumulation.
4.3.2 Overview of acute oral toxicity studies
M01 (AE C653711) was shown to be of low acute oral toxicity. In a first non-GLP study the LD50 values (with 95% confidence intervals) for males and females were found to be 1470 (951-2270) mg/kg and 2330 (1430-3780) mg/kg, respectively (Kemp, A. van der Linde, H.M. 1967).
A more recent GLP-study was conducted according to the current OECD 423 guideline (Schuengel, M., 2003). The highest starting dose level, which was selected to be 2000 mg/kg, induced mortality in 2 out of 3 males and 3 out of 3 females. Following the recommendations of the stepwise procedure with fixed dose levels, a second experiment was carried out at 2000 mg/kg in males and at 300 mg/kg in females. No mortality occurred in either sex. On the basis of the testing scheme presented on page 13 of the guideline, the LD50 cut-off was established at 2000 mg/kg in males and at 500 mg/kg in females. The value observed in females in this study is slightly lower than the one reported in the first non-GLP study. This minor difference likely results from the experimental procedure set by the OECD 423 guideline, which requires to test 2000 mg/kg as a starting point and then 300 mg/kg as a second step without any possibility to test intermediate dose levels in between in order to establish a precise experimental LD50. In conclusion, the results of both studies consistently showed that M01 (AE C653711) was not toxic (T) or very toxic (T+).
Fluopicolide - Addendum 2 December 2008
468
4.3.3 Overview of the key studies to evaluate the acute/chronic/long-term toxicity of M01 (AE C653711)
A number of studies have been conducted with M01 (AE C653711) to investigate its potential acute, short-term, long-term and reproductive toxicity. This study list was prepared from the US EPA Reregistration Eligibility Decision (RED) of dichlobenil (1998) and the US EPA Human Health Risk Assessment for fluopicolide (November 2007) see references.
Study Type Year/
Study design Results Reference
Acute oral rat (gavage) *
1967 LD50 = 1470 mg/kg [951-2270] (M) and 2330 mg/kg [1430-3780](F)
Kemp, A.
Acute oral rat (gavage) *
2003 LD50 ≥ 2000 mg/kg (M) and LD50 ≥500 mg/kg (F) Schuengel, M.
90-day oral rat (dietary) *
1967
0, 50, 180, 600, or 2300 ppm (equal to 0, 4, 14, 49, or 172 mg/kg/day)
NOAEL = 180 ppm = 14 mg/kg/day
LOAEL = 49 mg/kg/day based on decreased body weight gain (M), food intake and clinical signs (M&F)
Boschman, T.
90-day oral dog
(dietary) *
1967
0, 100, 300, or 2000 ppm (equal to 0, 7.5, 22.5, or 150 mg/kg/day)
NOAEL = 300 ppm = 22.5 mg/kg/day
LOAEL = 2000 ppm = 150 mg/kg/day based on clinical signs (thin appearance, dull coat, hair loss) and increased liver weight and serum alkaline phosphatase concentrations (F) and clinical signs (thin appearance, dull coat, hair loss) (M)
Walker, A.I.T.
1967
0, 60, 100, 180, or 500 ppm [equal to 0/0, 2.2/2.8, 3.6/4.7, 6.5/8.5 or 19/25 mg/kg/day (M/F)]
NOAEL = 180 ppm = 6.5 mg/kg/day (M) and 100 ppm = 4.7 mg/kg/day (F)
LOAEL = 500 ppm = 19 mg/kg/day (M) and 180 ppm = 8.5 mg/kg/day (F) based on decreased body weights and histological liver changes in females
Wheldon, G.H.
1996 Re-assessment of Liver lesions/tumours
Connick, H.,Crome,S.J. and Gopinath, C.
1996 Homogeneity/Stability data addendum to report Johnson, S.F.
2006 Re-Assessment of liver lesions/tumours – complimentary statistical analysis
Pallen, C.
2-year oral rat
(dietary)
*
***
2007 Expert opinion on the carcinogenic potential of BAM (2,6-dichlorobenzamide)
Gopinath, C.
Fluopicolide - Addendum 2 December 2008
469
2008
Letter from the conducting laboratory on the carcinogenic potential of BAM (2,6-dichlorobenzamide
Pilling, A.
2-year oral dog
(dietary) **
***
1971
0, 60, 100, 180, or 500 ppm (equal to 0, 1.5, 2.5, 4.5, or 12.5 mg/kg/day)
NOAEL = 4.5 mg/kg/day
LOAEL = 12.5 mg/kg/day based on decreased body weight and body weight gain
Wilson, A.B. and Thorpe, E.
3-generation reproduction rat study (dietary)
**
***
1971
0, 60, 100, or 180 ppm (equivalent 0, 4.5, 7.5, or 13.5 mg/kg/day)
Parental NOAEL = 180 ppm =
13.5 mg/kg/day
Parental LOAEL was not observed.
Reproductive NOAEL = 180 ppm =
13.5 mg/kg/day
Reproductive LOAEL was not observed.
Offspring NOAEL = 180 ppm =
13.5 mg/kg/day
Offspring LOAEL was not observed.
Hine, C.H., Eisenlord, G. and Loquvam, G.S.
Developmental toxicity oral rabbit (gavage)
**
***
1986
0, 10, 30, or 90 mg/kg/day
Maternal NOAEL = 30 mg/kg/day
Maternal LOAEL= 90 mg/kg/day based on increased incidences of clinical signs and decreased body weight gain and food consumption during dosing
Developmental NOAEL = 30 mg/kg/day
Developmental LOAEL = 90 mg/kg/day
McIntyre, M.
* = Studies submitted as part of the flupicolide dossier ** = Studies not submitted as part of the fluopicolide EU dossier
*** See appendix III for a summary of this study Summary of US EPA review program and fluopicolide registration. Studies that were included in the fluopicolide dossier submission in the EU are included in this list and marked with a single asterisk “*”. Some studies are included in this list that were not submitted as part of the European fluopicolide dossier, since they were not required but were included in the negative reference list of the dichlobenil dossier for completeness. These studies are shown with a double asterisk “**”. This includes a 2-year dog study, a rat multi-generation study and a rabbit developmental study. These studies did not raise any concerns. The 2-year dog study was chosen by US EPA for endpoint setting for risk assessment purposes.
During the fluopicolide EU Expert Meeting on Toxicology (PRAPeR 39 expert meeting) it was indicated that in the US EPA RED of dichlobenil (1998) EPA raised concerns about the quality of
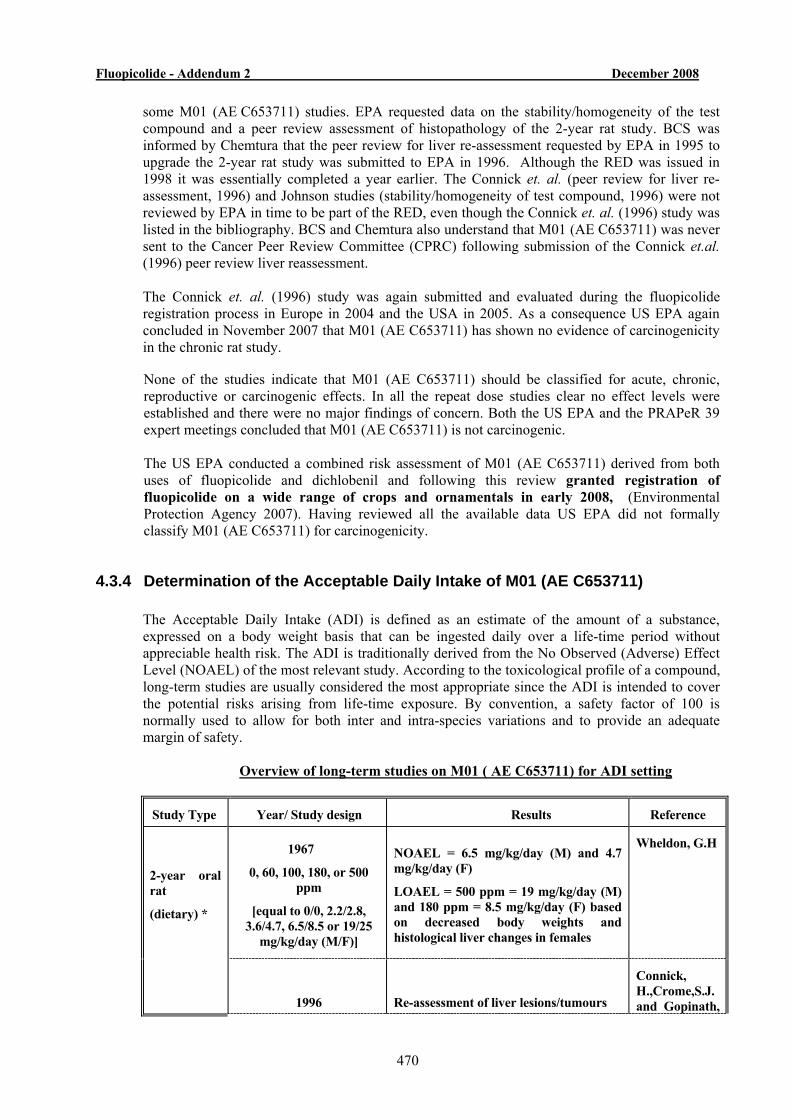
Fluopicolide - Addendum 2 December 2008
470
some M01 (AE C653711) studies. EPA requested data on the stability/homogeneity of the test compound and a peer review assessment of histopathology of the 2-year rat study. BCS was informed by Chemtura that the peer review for liver re-assessment requested by EPA in 1995 to upgrade the 2-year rat study was submitted to EPA in 1996. Although the RED was issued in 1998 it was essentially completed a year earlier. The Connick et. al. (peer review for liver re-assessment, 1996) and Johnson studies (stability/homogeneity of test compound, 1996) were not reviewed by EPA in time to be part of the RED, even though the Connick et. al. (1996) study was listed in the bibliography. BCS and Chemtura also understand that M01 (AE C653711) was never sent to the Cancer Peer Review Committee (CPRC) following submission of the Connick et.al. (1996) peer review liver reassessment.
The Connick et. al. (1996) study was again submitted and evaluated during the fluopicolide registration process in Europe in 2004 and the USA in 2005. As a consequence US EPA again concluded in November 2007 that M01 (AE C653711) has shown no evidence of carcinogenicity in the chronic rat study.
None of the studies indicate that M01 (AE C653711) should be classified for acute, chronic, reproductive or carcinogenic effects. In all the repeat dose studies clear no effect levels were established and there were no major findings of concern. Both the US EPA and the PRAPeR 39 expert meetings concluded that M01 (AE C653711) is not carcinogenic. The US EPA conducted a combined risk assessment of M01 (AE C653711) derived from both uses of fluopicolide and dichlobenil and following this review granted registration of fluopicolide on a wide range of crops and ornamentals in early 2008, (Environmental Protection Agency 2007). Having reviewed all the available data US EPA did not formally classify M01 (AE C653711) for carcinogenicity.
4.3.4 Determination of the Acceptable Daily Intake of M01 (AE C653711) The Acceptable Daily Intake (ADI) is defined as an estimate of the amount of a substance, expressed on a body weight basis that can be ingested daily over a life-time period without appreciable health risk. The ADI is traditionally derived from the No Observed (Adverse) Effect Level (NOAEL) of the most relevant study. According to the toxicological profile of a compound, long-term studies are usually considered the most appropriate since the ADI is intended to cover the potential risks arising from life-time exposure. By convention, a safety factor of 100 is normally used to allow for both inter and intra-species variations and to provide an adequate margin of safety.
Overview of long-term studies on M01 ( AE C653711) for ADI setting
Study Type Year/ Study design Results Reference
1967
0, 60, 100, 180, or 500 ppm
[equal to 0/0, 2.2/2.8, 3.6/4.7, 6.5/8.5 or 19/25
mg/kg/day (M/F)]
NOAEL = 6.5 mg/kg/day (M) and 4.7 mg/kg/day (F)
LOAEL = 500 ppm = 19 mg/kg/day (M) and 180 ppm = 8.5 mg/kg/day (F) based on decreased body weights and histological liver changes in females
Wheldon, G.H
2-year oral rat
(dietary) *
1996 Re-assessment of liver lesions/tumours
Connick, H.,Crome,S.J. and Gopinath,
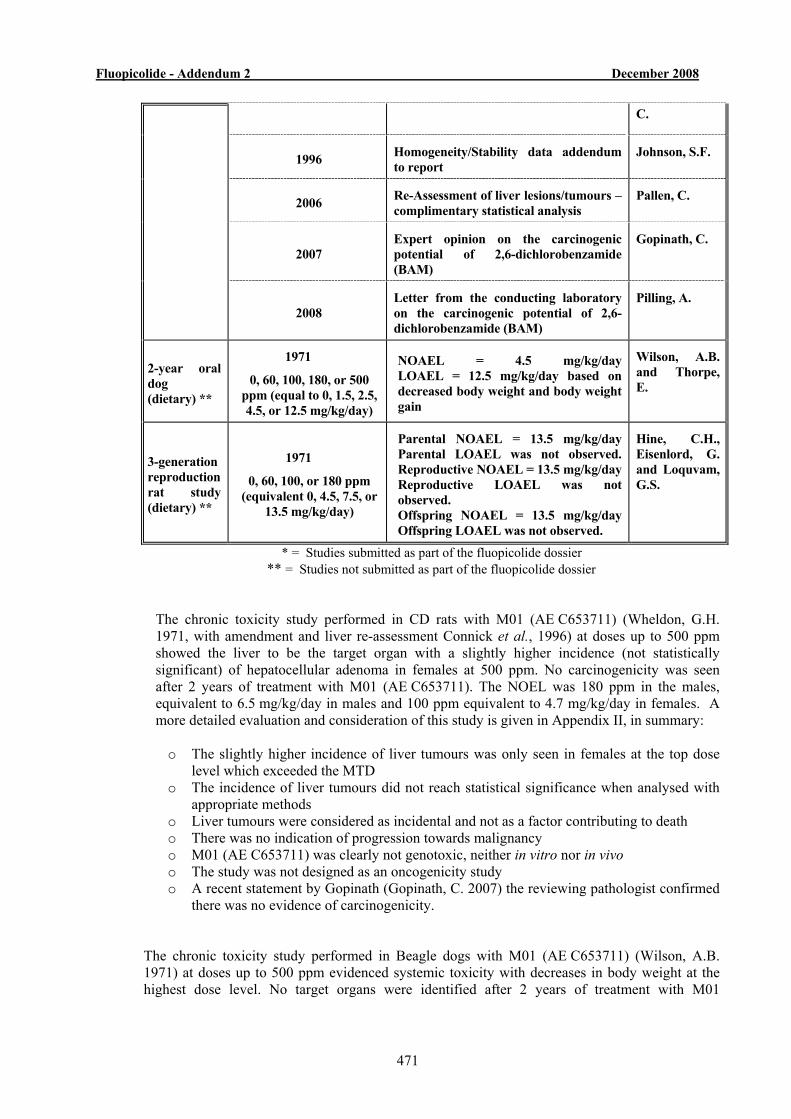
Fluopicolide - Addendum 2 December 2008
471
C.
1996 Homogeneity/Stability data addendum to report
Johnson, S.F.
2006 Re-Assessment of liver lesions/tumours – complimentary statistical analysis
Pallen, C.
2007 Expert opinion on the carcinogenic potential of 2,6-dichlorobenzamide (BAM)
Gopinath, C.
2008 Letter from the conducting laboratory on the carcinogenic potential of 2,6-dichlorobenzamide (BAM)
Pilling, A.
2-year oral dog (dietary) **
1971
0, 60, 100, 180, or 500 ppm (equal to 0, 1.5, 2.5, 4.5, or 12.5 mg/kg/day)
NOAEL = 4.5 mg/kg/day LOAEL = 12.5 mg/kg/day based on decreased body weight and body weight gain
Wilson, A.B.and Thorpe, E.
3-generation reproduction rat study (dietary) **
1971
0, 60, 100, or 180 ppm (equivalent 0, 4.5, 7.5, or
13.5 mg/kg/day)
Parental NOAEL = 13.5 mg/kg/day Parental LOAEL was not observed. Reproductive NOAEL = 13.5 mg/kg/day Reproductive LOAEL was not observed. Offspring NOAEL = 13.5 mg/kg/day Offspring LOAEL was not observed.
Hine, C.H., Eisenlord, G. and Loquvam, G.S.
* = Studies submitted as part of the fluopicolide dossier ** = Studies not submitted as part of the fluopicolide dossier
The chronic toxicity study performed in CD rats with M01 (AE C653711) (Wheldon, G.H. 1971, with amendment and liver re-assessment Connick et al., 1996) at doses up to 500 ppm showed the liver to be the target organ with a slightly higher incidence (not statistically significant) of hepatocellular adenoma in females at 500 ppm. No carcinogenicity was seen after 2 years of treatment with M01 (AE C653711). The NOEL was 180 ppm in the males, equivalent to 6.5 mg/kg/day in males and 100 ppm equivalent to 4.7 mg/kg/day in females. A more detailed evaluation and consideration of this study is given in Appendix II, in summary:
o The slightly higher incidence of liver tumours was only seen in females at the top dose
level which exceeded the MTD o The incidence of liver tumours did not reach statistical significance when analysed with
appropriate methods o Liver tumours were considered as incidental and not as a factor contributing to death o There was no indication of progression towards malignancy o M01 (AE C653711) was clearly not genotoxic, neither in vitro nor in vivo o The study was not designed as an oncogenicity study o A recent statement by Gopinath (Gopinath, C. 2007) the reviewing pathologist confirmed
there was no evidence of carcinogenicity.
The chronic toxicity study performed in Beagle dogs with M01 (AE C653711) (Wilson, A.B. 1971) at doses up to 500 ppm evidenced systemic toxicity with decreases in body weight at the highest dose level. No target organs were identified after 2 years of treatment with M01
Fluopicolide - Addendum 2 December 2008
472
(AE C653711). The NOAEL was 180 ppm, equivalent to 4.5 mg/kg/day. A more detailed evaluation and consideration of this study is given in Appendix III.
The 3-generation study performed in Long Evans rats with M01 (AE C653711) (Hine, C.H., 1971) at doses up to 180 ppm evidenced no critical findings. The NOAEL for parental systemic and offspring toxicity and the NOAEL for reproduction was 180 ppm, equivalent to 13.5 mg/kg/day. A more detailed evaluation and consideration of this study is given in Appendix III.
The NOAELs determined in these three studies are essentially comparable and ranged from 4.5 mg/kg/day to 13.5 mg/kg/day in the 2-year dog and rat multi-generation studies, respectively. However taking the most conservative approach, Bayer CropScience considers that the most relevant study to set the ADI is the 2-year dog study, in which the lowest NOAEL was determined. Hence the ADI from this study would be 0.045 mg/kg bw/day with a 100 fold safety factor.
ADI = 4.5 /100 = 0.045 mg/kg bw/day The US EPA also used the dog study for setting the chronic reference dose for M01 (AE C653711). The NOEL in the rat two year study was 6.5 for males and 4.7 for females mg/kg bw/day and was therefore very similar to the dog study.
Despite the fact there were no critical findings in the 2-year dog study US EPA gave an additional 3-fold safety factor due to lack of details in the study report but concluded that a new study was not required, (see page 21 of the dichlobenil RED document). However this is not customary and Bayer CropScience does not believe this is necessary as the toxicology database available on M01 (AE C653711) is very extensive in comparison with most metabolites.
4.3.5 Comparative Toxicological Assessment
The guidance document for the assessment of the relevance of metabolites provides the scientific basis for the tests to be conducted to enable decision making on relevance. There is a misconception that a metabolite must always be shown to be less toxic than the parent molecule in order that it can be considered as non-relevant. This thinking was discussed extensively during the preparation of the EU guidance document on relevant metabolites in groundwater and whilst this was part of the initial proposals, it was removed from later versions as it was obvious that it would mean that active substances which had more severe toxicological properties would more readily be shown to have less toxic metabolites and hence would be registerable. Whereas active substances which have no severe toxicological properties it would not so readily be shown that the metabolite was less toxic and so would not be so readily registerable. The major arguments for this decision are highlighted below and are still valid:
• if parent and metabolite are not tested under the same conditions a fair comparison is not possible • in case parent shows more or less no toxicological findings and a very favorable profile, how to
show the non relevance for metabolites? • if two parent molecules have the same metabolite and one compound is very toxic and the other
compound is very favourable, the metabolite would be not relevant in case of the toxic parent but relevant in case of the favourable parent.
• As a consequence of this comparison favourable parents would suffer and toxic parents would benefit. This is clearly not in the interest of the consumer.
Fluopicolide - Addendum 2 December 2008
473
It was for this reason that the logic was developed to use a classification system as given in EU Directive 67/548/EEC, based on absolute properties rather than a comparative assessment. This logic is well illustrated in the case of the M01 (AE C653711) metabolite coming from two different active substances. Even so, if a comparison were to be made between ADI’s, the ADI of fluopicolide is 0.08 mg/kg bw/day and that of M01 (AE C653711) is 0.045 mg/kg bw/day since the two values come from different species (mice 18 month chronic compared to two year dog) and within the dose setting variations the two ADI’s can be regarded as comparable. In addition if one compares on a molar basis, since the molecular weight of M01 (AE C653711) is almost half that of fluopicolide and is formed on an equimolar basis from parent, then on a mole for mole basis the ADI’s are virtually identical.
4.3.6 Summary
In conclusion, these data show that the toxicological profile of the metabolite M01 (AE C653711) is similar to that of fluopicolide and that M01 passes all the hazard assessment criteria of the guidance document. Therefore from a toxicological perspective the metabolite M01 (AE C653711) passes the assessment of stages 2 and 3 of the EU guidance document and is considered non-relevant.
4.4 Step 4 Exposure assessment - threshold of concern approach.
The metabolite M01 (AE C653711) has been shown to potentially exceed 0.75 µg/L in groundwater. There are also small contributions coming from other dietary sources. A refined risk assessment as given in step 5 has therefore been conducted.
4.5 Step 5 Refined risk assessments for non-relevant metabolites.
Metabolites which have passed steps 1 to 3 and for which levels of estimated concentrations in groundwater are between 0.75 µg/L and 10 µg/L require a refined assessment. Presence in Target Crops – Metabolism Studies The metabolite M01 (AE C653711) has also been observed in plant metabolism studies. In lettuce (Rupprecht, J.K. 2004) quantities of M01 ranged from 0.009 mg/kg at day 0 to 0.112 mg/kg expressed in fluopicolide parent equivalents, which is 0.0045 to 0.055 mg/kg of M01. In grapes (Rupprecht, J.K. 2004a) quantities of M01 ranged from 0.026 mg/kg parent equivalents following application of fluopicolide at the 1x rate to 0.133 mg/kg fluopicolide parent equivalents at the 10x rate, which is 0.013 and 0.066 mg/kg of M01.
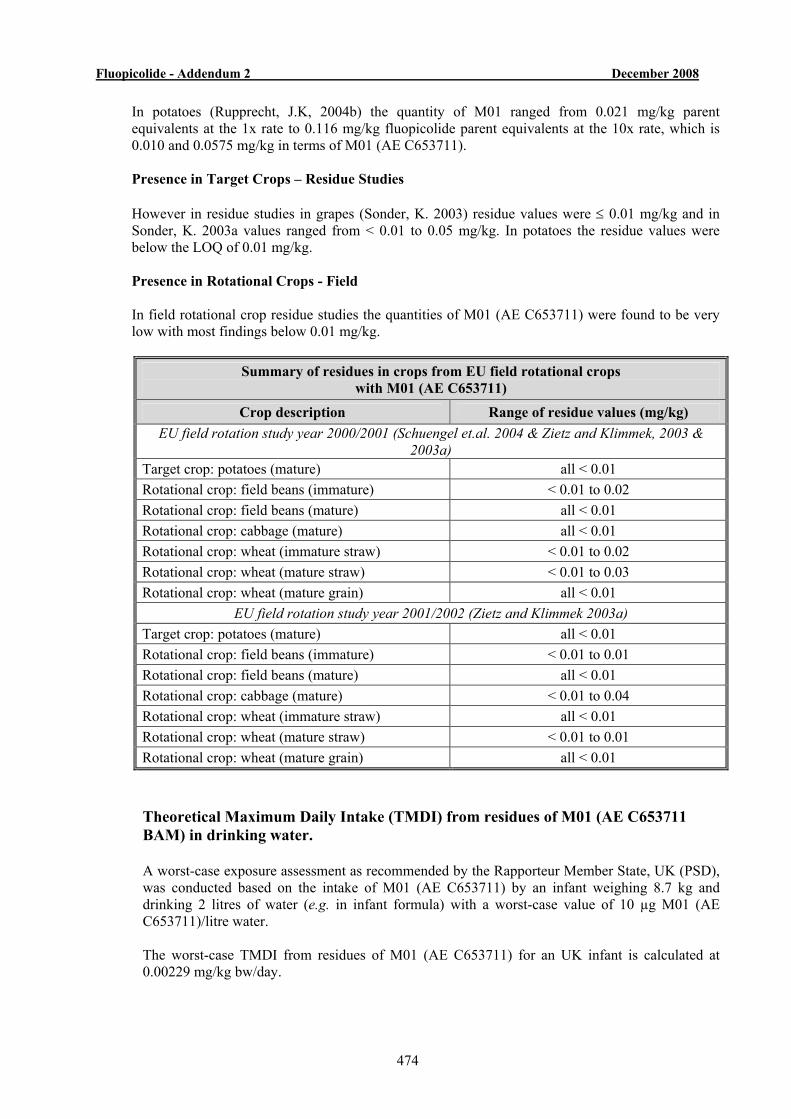
Fluopicolide - Addendum 2 December 2008
474
In potatoes (Rupprecht, J.K, 2004b) the quantity of M01 ranged from 0.021 mg/kg parent equivalents at the 1x rate to 0.116 mg/kg fluopicolide parent equivalents at the 10x rate, which is 0.010 and 0.0575 mg/kg in terms of M01 (AE C653711). Presence in Target Crops – Residue Studies However in residue studies in grapes (Sonder, K. 2003) residue values were ≤ 0.01 mg/kg and in Sonder, K. 2003a values ranged from < 0.01 to 0.05 mg/kg. In potatoes the residue values were below the LOQ of 0.01 mg/kg.
Presence in Rotational Crops - Field
In field rotational crop residue studies the quantities of M01 (AE C653711) were found to be very low with most findings below 0.01 mg/kg.
Summary of residues in crops from EU field rotational crops
with M01 (AE C653711)
Crop description Range of residue values (mg/kg) EU field rotation study year 2000/2001 (Schuengel et.al. 2004 & Zietz and Klimmek, 2003 &
2003a) Target crop: potatoes (mature) all < 0.01 Rotational crop: field beans (immature) < 0.01 to 0.02 Rotational crop: field beans (mature) all < 0.01 Rotational crop: cabbage (mature) all < 0.01 Rotational crop: wheat (immature straw) < 0.01 to 0.02 Rotational crop: wheat (mature straw) < 0.01 to 0.03 Rotational crop: wheat (mature grain) all < 0.01
EU field rotation study year 2001/2002 (Zietz and Klimmek 2003a) Target crop: potatoes (mature) all < 0.01 Rotational crop: field beans (immature) < 0.01 to 0.01 Rotational crop: field beans (mature) all < 0.01 Rotational crop: cabbage (mature) < 0.01 to 0.04 Rotational crop: wheat (immature straw) all < 0.01 Rotational crop: wheat (mature straw) < 0.01 to 0.01 Rotational crop: wheat (mature grain) all < 0.01 Theoretical Maximum Daily Intake (TMDI) from residues of M01 (AE C653711 BAM) in drinking water. A worst-case exposure assessment as recommended by the Rapporteur Member State, UK (PSD), was conducted based on the intake of M01 (AE C653711) by an infant weighing 8.7 kg and drinking 2 litres of water (e.g. in infant formula) with a worst-case value of 10 µg M01 (AE C653711)/litre water. The worst-case TMDI from residues of M01 (AE C653711) for an UK infant is calculated at 0.00229 mg/kg bw/day.
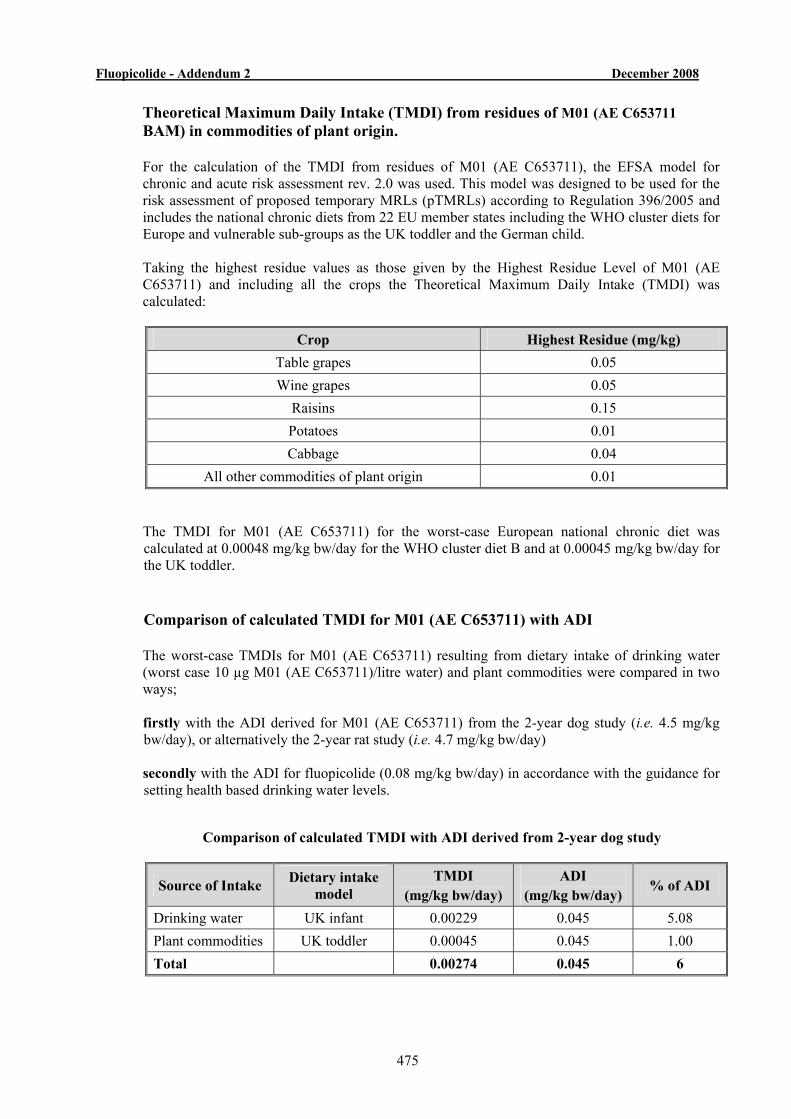
Fluopicolide - Addendum 2 December 2008
475
Theoretical Maximum Daily Intake (TMDI) from residues of M01 (AE C653711 BAM) in commodities of plant origin. For the calculation of the TMDI from residues of M01 (AE C653711), the EFSA model for chronic and acute risk assessment rev. 2.0 was used. This model was designed to be used for the risk assessment of proposed temporary MRLs (pTMRLs) according to Regulation 396/2005 and includes the national chronic diets from 22 EU member states including the WHO cluster diets for Europe and vulnerable sub-groups as the UK toddler and the German child. Taking the highest residue values as those given by the Highest Residue Level of M01 (AE C653711) and including all the crops the Theoretical Maximum Daily Intake (TMDI) was calculated:
Crop Highest Residue (mg/kg) Table grapes 0.05 Wine grapes 0.05
Raisins 0.15 Potatoes 0.01 Cabbage 0.04
All other commodities of plant origin 0.01 The TMDI for M01 (AE C653711) for the worst-case European national chronic diet was calculated at 0.00048 mg/kg bw/day for the WHO cluster diet B and at 0.00045 mg/kg bw/day for the UK toddler. Comparison of calculated TMDI for M01 (AE C653711) with ADI The worst-case TMDIs for M01 (AE C653711) resulting from dietary intake of drinking water (worst case 10 µg M01 (AE C653711)/litre water) and plant commodities were compared in two ways; firstly with the ADI derived for M01 (AE C653711) from the 2-year dog study (i.e. 4.5 mg/kg bw/day), or alternatively the 2-year rat study (i.e. 4.7 mg/kg bw/day) secondly with the ADI for fluopicolide (0.08 mg/kg bw/day) in accordance with the guidance for setting health based drinking water levels.
Comparison of calculated TMDI with ADI derived from 2-year dog study
Source of Intake Dietary intake model
TMDI (mg/kg bw/day)
ADI (mg/kg bw/day)
% of ADI
Drinking water UK infant 0.00229 0.045 5.08 Plant commodities UK toddler 0.00045 0.045 1.00 Total 0.00274 0.045 6
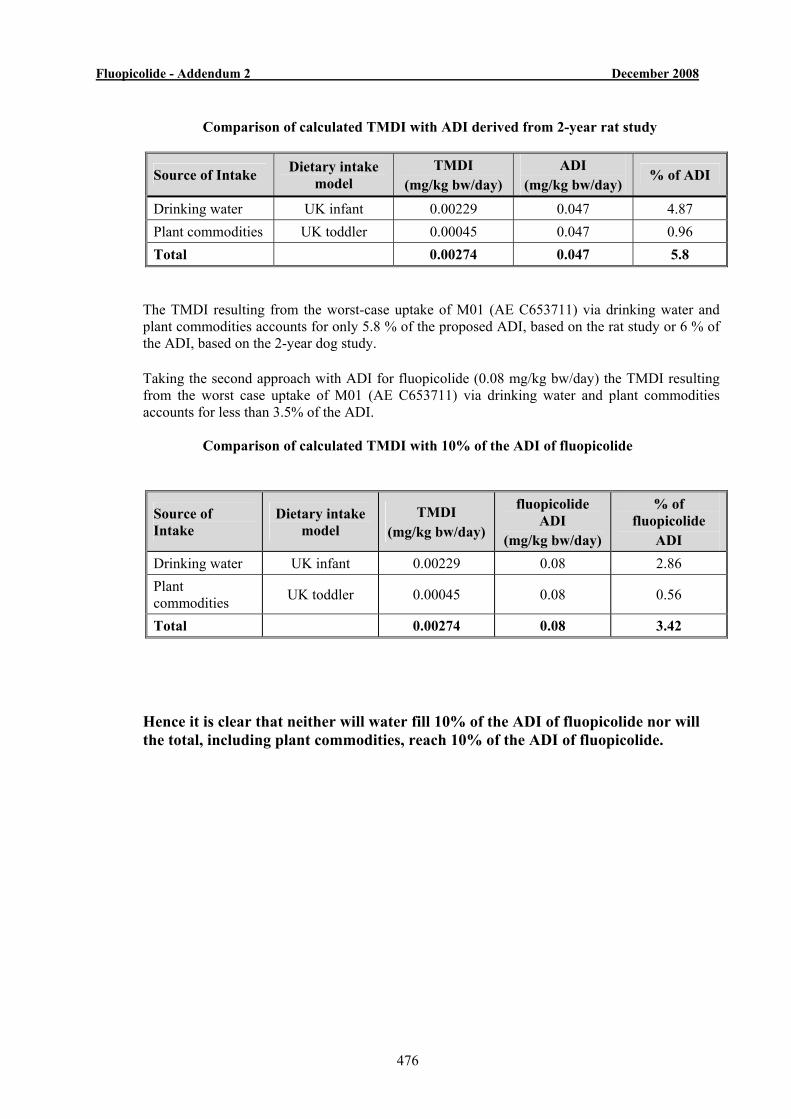
Fluopicolide - Addendum 2 December 2008
476
Comparison of calculated TMDI with ADI derived from 2-year rat study
Source of Intake Dietary intake model
TMDI (mg/kg bw/day)
ADI (mg/kg bw/day)
% of ADI
Drinking water UK infant 0.00229 0.047 4.87 Plant commodities UK toddler 0.00045 0.047 0.96 Total 0.00274 0.047 5.8
The TMDI resulting from the worst-case uptake of M01 (AE C653711) via drinking water and plant commodities accounts for only 5.8 % of the proposed ADI, based on the rat study or 6 % of the ADI, based on the 2-year dog study.
Taking the second approach with ADI for fluopicolide (0.08 mg/kg bw/day) the TMDI resulting from the worst case uptake of M01 (AE C653711) via drinking water and plant commodities accounts for less than 3.5% of the ADI.
Comparison of calculated TMDI with 10% of the ADI of fluopicolide
Source of Intake
Dietary intake model
TMDI (mg/kg bw/day)
fluopicolide ADI
(mg/kg bw/day)
% of fluopicolide
ADI Drinking water UK infant 0.00229 0.08 2.86 Plant commodities UK toddler 0.00045 0.08 0.56
Total 0.00274 0.08 3.42 Hence it is clear that neither will water fill 10% of the ADI of fluopicolide nor will the total, including plant commodities, reach 10% of the ADI of fluopicolide.
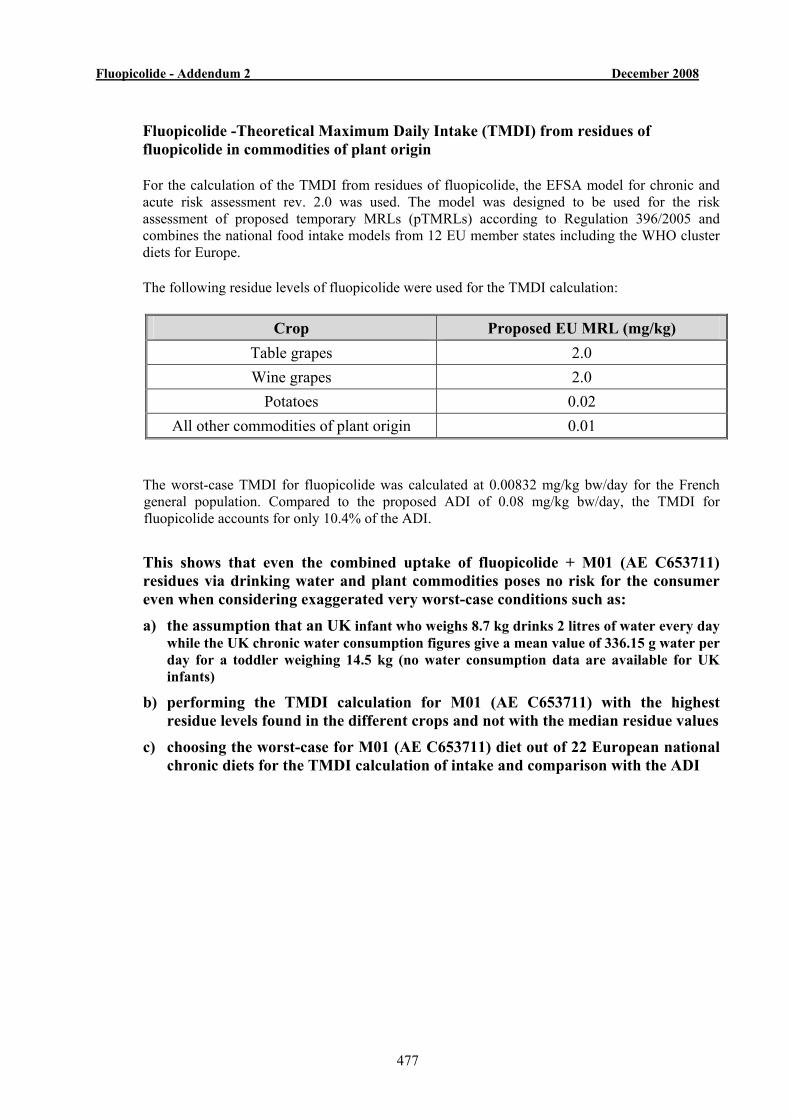
Fluopicolide - Addendum 2 December 2008
477
Fluopicolide -Theoretical Maximum Daily Intake (TMDI) from residues of fluopicolide in commodities of plant origin For the calculation of the TMDI from residues of fluopicolide, the EFSA model for chronic and acute risk assessment rev. 2.0 was used. The model was designed to be used for the risk assessment of proposed temporary MRLs (pTMRLs) according to Regulation 396/2005 and combines the national food intake models from 12 EU member states including the WHO cluster diets for Europe. The following residue levels of fluopicolide were used for the TMDI calculation:
Crop Proposed EU MRL (mg/kg) Table grapes 2.0 Wine grapes 2.0
Potatoes 0.02 All other commodities of plant origin 0.01
The worst-case TMDI for fluopicolide was calculated at 0.00832 mg/kg bw/day for the French general population. Compared to the proposed ADI of 0.08 mg/kg bw/day, the TMDI for fluopicolide accounts for only 10.4% of the ADI.
This shows that even the combined uptake of fluopicolide + M01 (AE C653711) residues via drinking water and plant commodities poses no risk for the consumer even when considering exaggerated very worst-case conditions such as:
a) the assumption that an UK infant who weighs 8.7 kg drinks 2 litres of water every day while the UK chronic water consumption figures give a mean value of 336.15 g water per day for a toddler weighing 14.5 kg (no water consumption data are available for UK infants)
b) performing the TMDI calculation for M01 (AE C653711) with the highest residue levels found in the different crops and not with the median residue values
c) choosing the worst-case for M01 (AE C653711) diet out of 22 European national chronic diets for the TMDI calculation of intake and comparison with the ADI
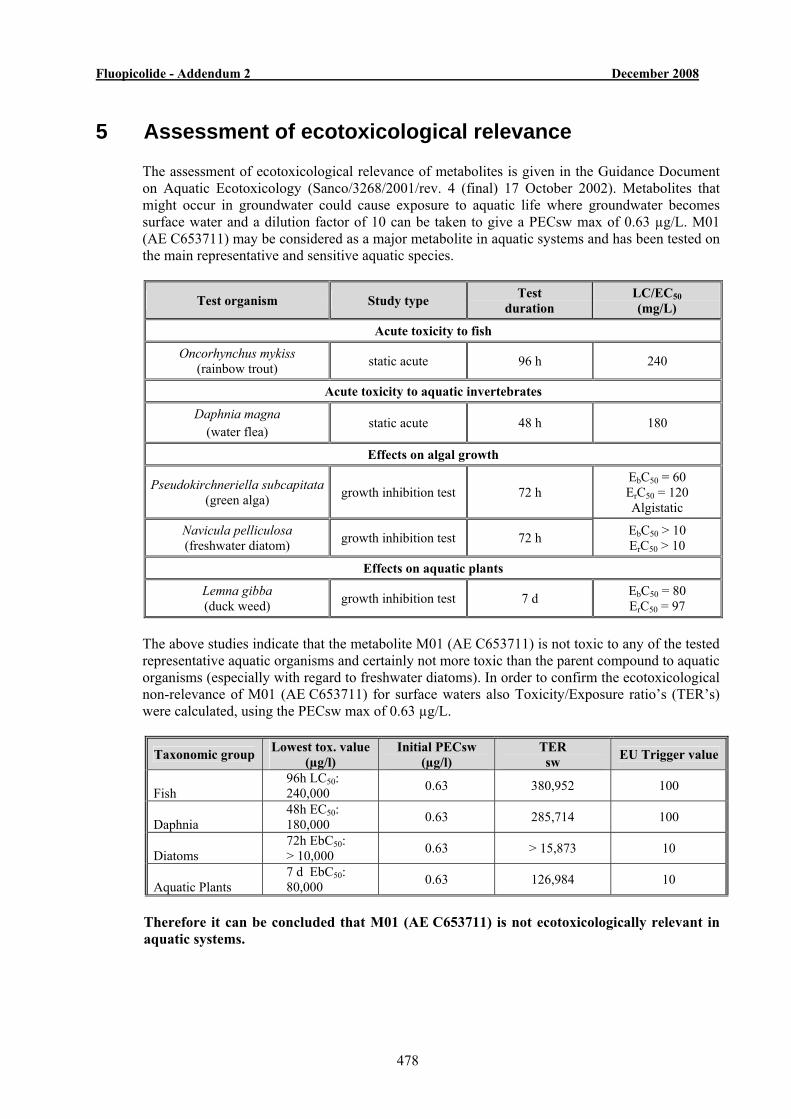
Fluopicolide - Addendum 2 December 2008
478
5 Assessment of ecotoxicological relevance
The assessment of ecotoxicological relevance of metabolites is given in the Guidance Document on Aquatic Ecotoxicology (Sanco/3268/2001/rev. 4 (final) 17 October 2002). Metabolites that might occur in groundwater could cause exposure to aquatic life where groundwater becomes surface water and a dilution factor of 10 can be taken to give a PECsw max of 0.63 µg/L. M01 (AE C653711) may be considered as a major metabolite in aquatic systems and has been tested on the main representative and sensitive aquatic species.
Test organism Study type Test duration
LC/EC50 (mg/L)
Acute toxicity to fish
Oncorhynchus mykiss (rainbow trout) static acute 96 h 240
Acute toxicity to aquatic invertebrates
Daphnia magna (water flea)
static acute 48 h 180
Effects on algal growth
Pseudokirchneriella subcapitata (green alga) growth inhibition test 72 h
EbC50 = 60 ErC50 = 120 Algistatic
Navicula pelliculosa (freshwater diatom) growth inhibition test 72 h EbC50 > 10
ErC50 > 10
Effects on aquatic plants
Lemna gibba (duck weed) growth inhibition test 7 d EbC50 = 80
ErC50 = 97
The above studies indicate that the metabolite M01 (AE C653711) is not toxic to any of the tested representative aquatic organisms and certainly not more toxic than the parent compound to aquatic organisms (especially with regard to freshwater diatoms). In order to confirm the ecotoxicological non-relevance of M01 (AE C653711) for surface waters also Toxicity/Exposure ratio’s (TER’s) were calculated, using the PECsw max of 0.63 µg/L.
Taxonomic group Lowest tox. value (µg/l)
Initial PECsw (µg/l)
TER sw EU Trigger value
Fish 96h LC50: 240,000 0.63 380,952 100
Daphnia 48h EC50: 180,000 0.63 285,714 100
Diatoms 72h EbC50: > 10,000 0.63 > 15,873 10
Aquatic Plants 7 d EbC50: 80,000 0.63 126,984 10
Therefore it can be concluded that M01 (AE C653711) is not ecotoxicologically relevant in aquatic systems.
Fluopicolide - Addendum 2 December 2008
479
6 Overall conclusions The metabolite of fluopicolide M01 (AE C653711), also known as 2,6-dichlorobenzamide
(BAM), has been thoroughly investigated and a comprehensive data package is available.
A full and comprehensive risk assessment has been conducted, taking account of all sources of dietary input from fluopicolide.
Exposure Assessment The metabolite M01 (AE C653711) has been shown to have the potential to reach maximum
concentrations between 2 and 6.3 µg/L in shallow groundwater at 1 metre depth, following application of fluopicolide to potatoes and vines. A worst-case value of 10µg/L has been taken for the risk assessment.
Pesticidal /biological assessment – M01 has been shown to have no fungicidal or herbicidal
activity.
Toxicological assessment - M01 has been shown:
♦ not to be genotoxic in an Ames, HPRT and UDS tests in-vitro, and in micronucleus test in-vivo.
♦ that the majority is excreted via urine, both unchanged and following biotransformation, small quantities were excreted via the faeces and very low quantities were retained, showing that it is not subject to bioaccumulation.
♦ to have a LD50 is in the range between 500 and 2330 mg/kg and therefore not toxic (T) or very toxic (T+).
♦ not to be carcinogenic ♦ not to be a reproductive toxicant ♦ therefore to be non-toxicologically relevant
Total Dietary Risk Assessment considering all sources of the diet. It has been shown that
when all sources of the diet are included; primary crops, rotational crops and water, M01 will contribute, as a worst-case, no more than 6% of the acceptable daily intake in total. The worst case contribution from water is only 5% of the ADI.
Ecotoxicological assessment – M01 (AE C653711) has been shown not to be toxic to any of
the tested aquatic organisms. Therefore it can be considered as not ecotoxicologically relevant in aquatic systems.
M01 (AE C653711) has been shown clearly and comprehensively to be non-relevant.
Fluopicolide - Addendum 2 December 2008
480
7 References Anonymous 2003 European Commission, Health and Consumer Protection Directorate- General Guidance Document on the assessment of the relevance of Metabolites in groundwater of Substances regulated under council directive 91/414/EEC. Sanco/221/2000- rev.10 25th February 2003 Bradshaw N. J. 2007 Special Report number 12. Proceedings of the Tenth Workshop of and European Network for development of an Integrated Control Strategy of potato late blight Bologna Italy, 2007. Boschman, T., Kemp, A. and Linde H.M. van der 1967 BCS DART No. M-234461-01-1 Dietary administration of 2,6-dichlorobenzamide to male and female rats for 13 weeks Connick, H., Crome, S.J. and Gopinath, C. 1996 BCS DART No. M-234672-01-1 Re-assessment of Liver Lesions/Tumours from Study PDR/49; BAM: Dietary Administration to Rats for 2 years. Environmental Protection Agency, 1998, Reregistration Eligibility Decision (RED) Dichlobenil Environmental Protection Agency, 2007, 2,6-Dichlorobenzamide (BAM ) as a Metabolite/Degradate of Fluopicolide and Dichlobenil. Human Health Risk Assessment for Proposed Uses of Fluopicolide on Tuberous and Corm Vegetables, Leafy Vegetables (except Brassica), Fruiting Vegetables, Cucurbit Vegetables, Grapes, Turf, and Ornamentals, and for Indirect or Inadvertent Residues on the Rotational Crop Wheat. Fisher, P. J. 2003 BCS DART No. M-221892.01-2 [phenyl-U-14C]-AE C638206: Rat tissue kinetic study Gopinath, C. 2007 BCS DART No. M-287543-01-1 Expert opinion on the carcinogenic potential of BAM (2,6-dichlorobenzamide) Gutierrez, L. 2003 BCS DART No. M-218352-01-1 [phenyl-U-14C]-AE C653711 (BAM): Single oral high dose A.D.M.E. study in the rat Gutierrez, L. 2003a BCS DART No. M-218350-01-1 [phenyl-U-14C]-AE C653711 (BAM): Single oral low dose A.D.M.E. study in the rat Gutierrez, L. 2003b BCS DART No. M-219491-01-1 [phenyl-U-14C]-AE C653711 (BAM): Repeat oral low dose A.D.M.E. study in the rat Herbold, B. 2003 BCS DART No. M-225471-01-1 AE C653711: Salmonella/microsome test-plate incorporation and pre-incubation method Herbold, B. 2003a BCS DART No. M-218535-01-1 AE C653711: V19/HPRT-test in vitro for the detection of induced forward mutations
Fluopicolide - Addendum 2 December 2008
481
Hine, C.H., Eisenlord, G. and Loquvam, G.S., 1971 Results of Reproduction Study of Rats Fed Diets Containing 2,6 dichlorobenzamide (BAM) over three generations. Johnson, S.F. 1996 Validation of an analytical method and determination of the homogeneity and stability of dietary formulations. Report addendum to Wheldon 1971. DART No. M234673-01-1. Kemp, A. van der Linde, H.M. 1967 BCS DART No. M-228905-01-1 Preliminary toxicity studies with 2,6-dichlorobenzamide Kley, C., Ellerich, C. 2007a BCS DART No.M-287350-01-1 Predicted Environmental Concentrations in Groundwater (PECgw) for Fluopicolide and its metabolites calculated with FOCUS PEARL and FOCUS PELMO. Use in Vines in Europe. Kley, C., Ellerich, C. 2007b BCS DART No. M-287355-01-1 Predicted Environmental Concentrations in Groundwater (PECgw) for Fluopicolide and its metabolites calculated with FOCUS PEARL and FOCUS PELMO. Use in Potatoes in Europe. Koorn, J. 1992 BCS DART No. M-228925-01-1 Evaluation of the possible mutagenetic activity of 2,6-dichlorobenzamide in the Ames Salmonella/microsome test Latorse, M.P., Flahaut J. 2004 BCS DART No. M-224842-01-1 Assessment of the biological activity of AE C638206 metabolites Lechelt-Kunze, C. 2003 BCS DART No. M-235067-01-1 AE C653711 (AE C653711 00 IB97 0001): determination of effects on growth of pure cultures of a soil fungus, Mucor circinelloides (Zygomycetes) on nutrient medium Lechelt-Kunze, C. 2003a BCS DART No. M-235068-01-1 AE C653711 (AE C653711 00 IB97 0001): determination of effects on growth of pure cultures of a soil fungus, Phytophtora nicotianae (Oomycetes) on nutrient medium Lechelt-Kunze, C. 2003b BCS DART No. M-235070-01-1 AE C653711 (AE C653711 00 IB97 0001): determination of effects on growth of pure cultures of a soil fungus Cladorrhinum foesundissimum (Deuteromycetes) on nutrient medium Lechelt-Kunze, C. 2003c BCS DART No. M-235072-01-1 AE C653711 (AE C653711 00 IB97 0001): determination of effects on growth of pure cultures of a soil fungus Penicillium janthinellum (Simplicissimum ascomycetes) on nutrient medium Lechelt-Kunze, C. 2003d BCS DART No. M-218466-01-1 AE C653711 (AE C653711 00 IB97 0001): determination of effects on growth of pure cultures of a soil fungus Suillus granolatus (Basidiomycetes) on nutrient medium
Fluopicolide - Addendum 2 December 2008
482
McIntyre, M. 1987 2,6-Dichlorobenzamide: Oral (Gavage) Teratology Study in the Rabbit Pallen C. 2006 Regulatory Toxicology Position Paper – Re-assessment of liver lesions/tumours from study PDR/49 BAM: Dietary Administration to Rats for Two years Complementary Statistical Analysis of Hepatocellular Tumours in Female rats Pesticide Safety Directorate, 2005 Fluopicolide (AE C638206): Draft Assessment Report prepared by United Kingdom Pesticide Safety Directorate, 2007 Fluopicolide (AE C638206): Addendum 1 to the Draft Assessment Report prepared by United Kingdom Pilling A., 2008 Letter from HLS, March 2008, Effects of BAM (2,6-dichlorobenzamide) in dietary administration to rats for 2 years, (3980/71/138;CA-515-1). Pollmann, B. 2003 BCS DART No. M-223180-01-1 (C037580) Field leaching study for AE C638206 on a sandy soil in vegetables Rupprecht, J.K. 2004 BCS DART No. M-241269-01-1 Metabolism of [U-14C]-phenyl and 2,6-14C-pyridinyl]-AE C638266 in lettuce Rupprecht, J.K. 2004a BCS DART No. M-241268-01-1 Metabolism of [U-14C-phenyl] and 2,6-14C-pyridinyl]-AE C638206 in vines Rupprecht, J.K. 2004b BCS DART No. M-241267-01-1 Metabolism of [U-14C-phenyl] and 2,6-14C-pyridinyl]-AE C638206 in potatoes Schoening, R. et al, 2004 BCS DART No. M-227140-01-1 (C039706) Determination of the residues of AE C638206 and metabolites in potatoes and rotational crop following treatment with AE C638206 00 SC18 A1 under field conditions in Southern and Northern Europe 2000 Schuengel, M. 2003 BCS DART No. M-225484-01-1 Acute toxicity in the rat after oral administration Sonder, K. 2003 BCS DART No. M-214899-01-2 Residue behaviour in grape vine European Union (Northern Zone) 2001 Sonder, K. 2003a BCS DART No. M-214901-02-2 Residue behaviour in table grapes and vine grapes European Union (Southern Zone) 2001 Waart, E.J. van de 1993a BCS DART No. M-234323-01-1C034068 Evaluation of DNA repair inducing ability of 2,6-dichlorobenzamide (BAM) in primary culture of rat hepatocytes (with independent repeat C034295 and C034296) Waart, E.J. van der 1993b BCS DART No. M-234329-01-1 Micronucleus test in bone marrow cells of the mouse with 2,6-dichlorobenzamide (BAM) Walker, A.I.T. 1967 The study of the oral toxicity of the “Prefix” residue 2,6-dichlorobenzamide:13 week exposure to dogs. Wheldon, G.H. 1971 BCS DART No. M-234669-01-1
Fluopicolide - Addendum 2 December 2008
483
plus addendum by Johnson S.E. 1996 BCS DART No. M-234673-01-1 Effects of BAM in dietary administration to rats for two years Wilson, A.B. and Thorpe, E. 1971 Toxicity studies on the “Prefix” residue 2,6 dichlorobenzamide : two year oral experiment with dogs. Zietz, E; Klimmek, S. 2003, BCS, DART-No. M-221798-01-1 (C036940) Determination of the residues of AE C638206 and metabolites in potatoes and rotational crop following treatment with AE C638206 00SC18 A1 under field conditions in Southern and Northern Europe 2000. Zietz, E; Klimmek, S. 2003a, BCS, DART-No. M-224665-01-1 (C038284) Determination of the residues of AE C638206 and metabolites in potatoes and rotational crop following treatment with AE C638206 00SC18 A1 under field conditions in Northern Europe 2001.
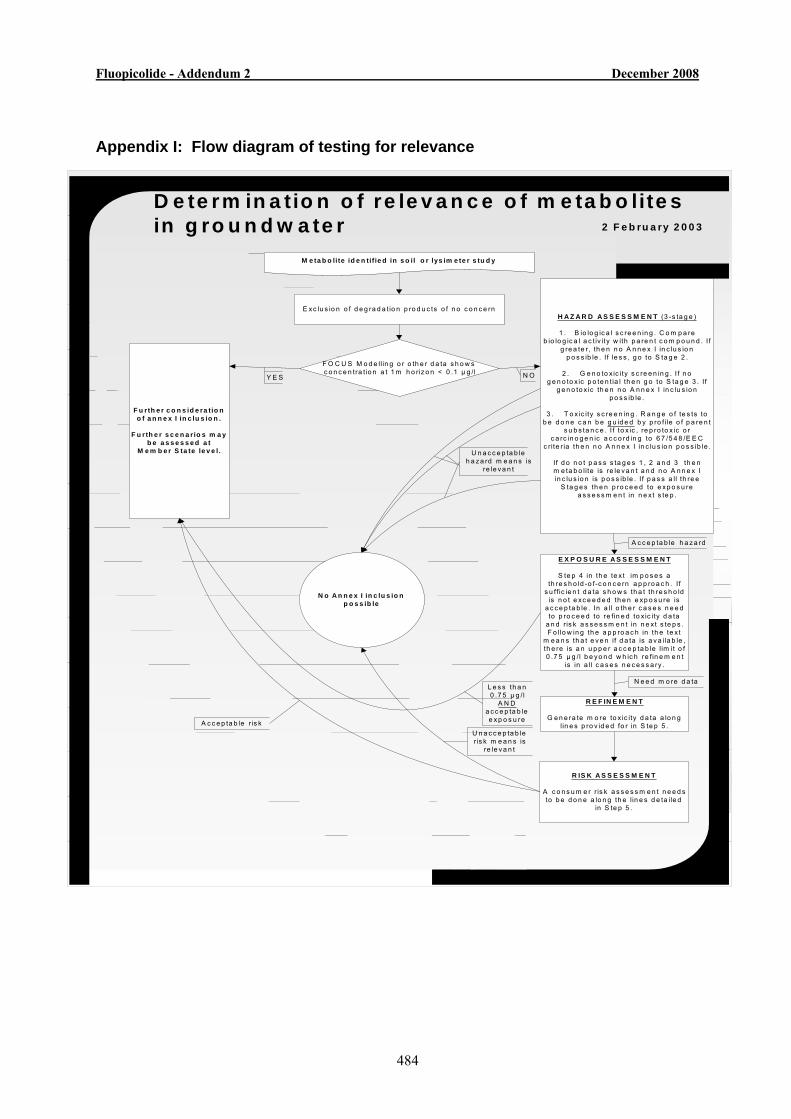
Fluopicolide - Addendum 2 December 2008
484
Appendix I: Flow diagram of testing for relevance
M e ta b o lite id e n tif ie d in s o il o r lys im e te r s tu d y
E xc lu s io n o f d e g ra d a t io n p ro d u c ts o f n o c o n c e rn
D e te rm in a tio n o f re le v a n c e o f m e ta b o lite sin g ro u n d w a te r
F O C U S M o d e llin g o r o th e r d a ta s h o w sc o n c e n tra t io n a t 1 m h o riz o n < 0 .1 µ g / l
F u rth e r c o n s id e ra tio no f a n n e x I in c lu s io n .
F u r th e r s c e n a r io s m a yb e a s s e s s e d a t
M e m b e r S ta te le v e l.
Y E S
H A Z A R D A S S E S S M E N T (3 -s ta g e )
1 . B io lo g ic a l s c re e n in g . C o m p a reb io lo g ic a l a c t iv ity w ith p a re n t c o m p o u n d . I f
g re a te r, th e n n o A n n e x I in c lu s io np o s s ib le . If le s s , g o to S ta g e 2 .
2 . G e n o to x ic ity s c re e n in g . I f n og e n o to x ic p o te n tia l th e n g o to S ta g e 3 . If
g e n o to x ic th e n n o A n n e x I in c lu s io np o s s ib le .
3 . T o x ic ity s c re e n in g . R a n g e o f te s ts tob e d o n e c a n b e g u id e d b y p ro f ile o f p a re n t
s u b s ta n c e . I f to x ic , re p ro to x ic o rc a rc in o g e n ic a c c o rd in g to 6 7 /5 4 8 /E E C
c rite r ia th e n n o A n n e x I in c lu s io n p o s s ib le .
If d o n o t p a s s s ta g e s 1 , 2 a n d 3 th e nm e ta b o lite is re le v a n t a n d n o A n n e x Iin c lu s io n is p o s s ib le . I f p a s s a ll th re e
S ta g e s th e n p ro c e e d to e xp o s u rea s s e s s m e n t in n e x t s te p .
N O
E X P O S U R E A S S E S S M E N T
S te p 4 in th e te x t im p o s e s ath re s h o ld -o f-c o n c e rn a p p ro a c h . I f
s u f f ic ie n t d a ta s h o w s th a t th re s h o ldis n o t e xc e e d e d th e n e xp o s u re is
a c c e p ta b le . In a ll o th e r c a s e s n e e dto p ro c e e d to re fin e d to x ic ity d a ta
a n d r is k a s s e s s m e n t in n e x t s te p s .F o llo w in g th e a p p ro a c h in th e te x t
m e a n s th a t e v e n if d a ta is a v a ila b le ,th e re is a n u p p e r a c c e p ta b le lim it o f0 .7 5 µ g / l b e y o n d w h ic h re fin e m e n t
is in a ll c a s e s n e c e s s a ry .
R E F IN E M E N T
G e n e ra te m o re to x ic ity d a ta a lo n glin e s p ro v id e d fo r in S te p 5 .
R IS K A S S E S S M E N T
A c o n s u m e r r is k a s s e s s m e n t n e e d sto b e d o n e a lo n g th e lin e s d e ta ile d
in S te p 5 .
N o A n n e x I in c lu s io np o s s ib le
A c c e p ta b le r is k
L e s s th a n0 .7 5 µ g / l
A N Da c c e p ta b lee x p o s u re
U n a c c e p ta b ler is k m e a n s is
re le v a n t
N e e d m o re d a ta
A c c e p ta b le h a z a rd
U n a c c e p ta b leh a z a rd m e a n s is
re le v a n t
2 F e b ru a ry 2 0 0 3
Fluopicolide - Addendum 2 December 2008
485
Appendix II: Evaluation and Consideration of the 2-year rat study conducted with M01 (AE C653711)
In this study, which was run in 1968 before the introduction of GLP, groups of 35 male and 35 female CD rats received M01 (AE C653711) in the diet at concentrations of either 0, 60, 100, 180 or 500 ppm (equal to 0/0, 2.2/2.8, 3.6/4.7, 6.5/8.5 or 19/25 mg/kg/day in males and females) for 106 weeks (Wheldon, G.H., 1971). The continuous administration of M01 (AE C653711) produced clear systemic toxicity at 500 ppm and at 180 ppm to a lesser extent. Severe effects on body weights were observed in both sexes at 500 ppm. At Week 106 body weight gains were decreased by 16% in males and by 26% in females at this dose level when compared to controls showing that the Maximum Tolerated Dose (MTD) had been exceeded. Haematological changes that consisted of minor reduction in the red blood cell parameters (haemoglobin concentration, red blood cell count and haematocrit) were observed at 500 ppm in both sexes. Blood chemistry and urinalysis did not show any treatment-related effects. No changes in organ weight were noted at any dose level. Macroscopic examination did not reveal any treatment-related abnormalities. In the original histopathological examination, the liver was identified to be the target organ. This evaluation, which was conducted on a very limited number of animals, showed that liver changes were characterised by hepatocyte vacuolation and degeneration as well as fat deposition. As a consequence of this, additional livers from high dose level animals of both sexes were examined. However, as no additional livers from control animals were evaluated, many more livers were examined in the high dose group than in the control group. Histopathology of females dosed at 500 ppm indicated a higher incidence of liver tumours diagnosed as hepatoma. No malignant tumours were observed. However, it must be noted that all liver tumour bearing high dose females were terminal kill and less than half of terminal control females were examined. Therefore the two groups were not treated in the same manner. A re-assessment of the liver pathology was conducted in 1996 by Huntingdon Research Laboratory in order to bring the terminology up to date (Connick,H., Crome, S.J. and Gopinath., C. 1996). As shown below, non-neoplastic changes were detected in both sexes at 500 ppm and to a lesser extent at 180 ppm in females. Males treated at 500 ppm displayed eosinophilic foci and hepatocytes vacuolation. The slightly higher incidence noted at 100 ppm was considered not to be toxicologically significant since the incidence at the next higher dose was not statistically significant. Females treated at 500 ppm showed eosinophilic foci (focal and diffuse), basophilic foci (focal) whereas females treated at 180 ppm also displayed an increased incidence of eosinophilic foci (focal).
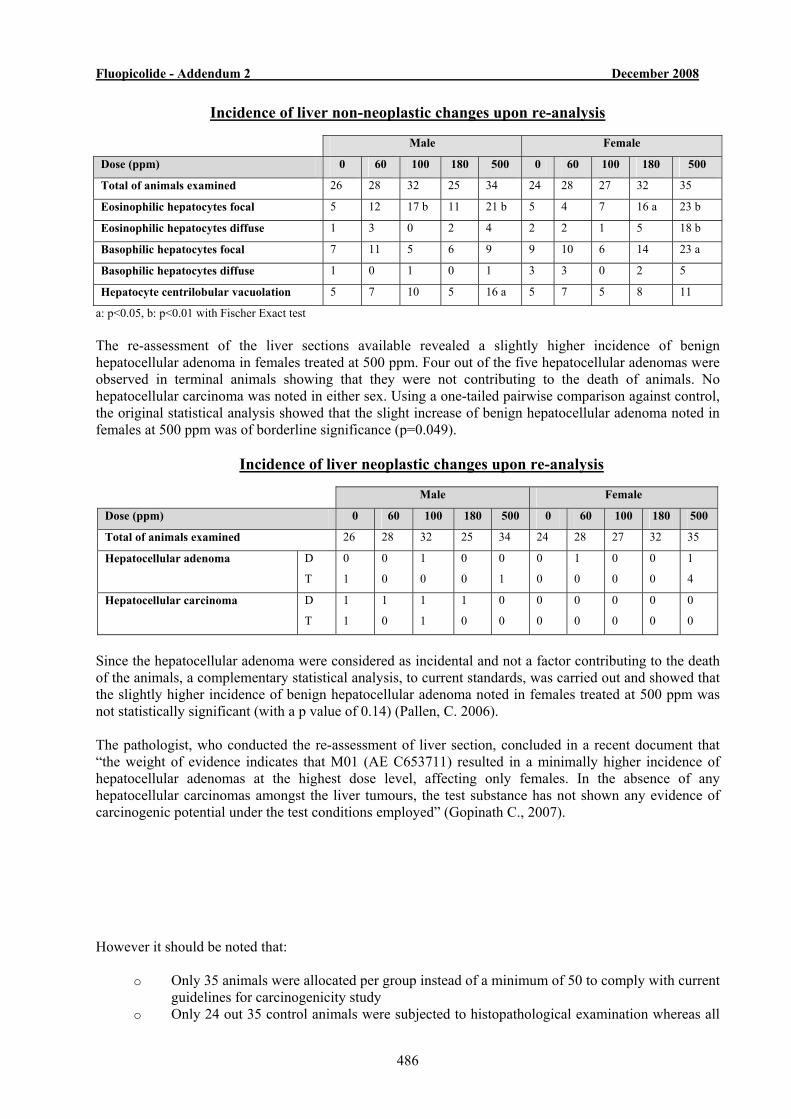
Fluopicolide - Addendum 2 December 2008
486
Incidence of liver non-neoplastic changes upon re-analysis Male Female
Dose (ppm) 0 60 100 180 500 0 60 100 180 500
Total of animals examined 26 28 32 25 34 24 28 27 32 35
Eosinophilic hepatocytes focal 5 12 17 b 11 21 b 5 4 7 16 a 23 b
Eosinophilic hepatocytes diffuse 1 3 0 2 4 2 2 1 5 18 b
Basophilic hepatocytes focal 7 11 5 6 9 9 10 6 14 23 a
Basophilic hepatocytes diffuse 1 0 1 0 1 3 3 0 2 5
Hepatocyte centrilobular vacuolation 5 7 10 5 16 a 5 7 5 8 11
a: p<0.05, b: p<0.01 with Fischer Exact test The re-assessment of the liver sections available revealed a slightly higher incidence of benign hepatocellular adenoma in females treated at 500 ppm. Four out of the five hepatocellular adenomas were observed in terminal animals showing that they were not contributing to the death of animals. No hepatocellular carcinoma was noted in either sex. Using a one-tailed pairwise comparison against control, the original statistical analysis showed that the slight increase of benign hepatocellular adenoma noted in females at 500 ppm was of borderline significance (p=0.049).
Incidence of liver neoplastic changes upon re-analysis
Male Female
Dose (ppm) 0 60 100 180 500 0 60 100 180 500
Total of animals examined 26 28 32 25 34 24 28 27 32 35
Hepatocellular adenoma D
T
0
1
0
0
1
0
0
0
0
1
0
0
1
0
0
0
0
0
1
4
Hepatocellular carcinoma D
T
1
1
1
0
1
1
1
0
0
0
0
0
0
0
0
0
0
0
0
0
Since the hepatocellular adenoma were considered as incidental and not a factor contributing to the death of the animals, a complementary statistical analysis, to current standards, was carried out and showed that the slightly higher incidence of benign hepatocellular adenoma noted in females treated at 500 ppm was not statistically significant (with a p value of 0.14) (Pallen, C. 2006). The pathologist, who conducted the re-assessment of liver section, concluded in a recent document that “the weight of evidence indicates that M01 (AE C653711) resulted in a minimally higher incidence of hepatocellular adenomas at the highest dose level, affecting only females. In the absence of any hepatocellular carcinomas amongst the liver tumours, the test substance has not shown any evidence of carcinogenic potential under the test conditions employed” (Gopinath C., 2007). However it should be noted that:
o Only 35 animals were allocated per group instead of a minimum of 50 to comply with current guidelines for carcinogenicity study
o Only 24 out 35 control animals were subjected to histopathological examination whereas all
Fluopicolide - Addendum 2 December 2008
487
high dose group females were evaluated o Only 8 out 17 terminal control animals were subjected to histopathological examination
whereas all terminal high dose group females were evaluated
The performing laboratory concluded in a recent statement that “in view of the above limitations” caution should be exercised when drawing “firm conclusions regarding the tumorigenic potential of BAM”. “The absence of examination of liver tissue from the terminal control females precludes the possibility of judging whether the slightly higher incidence of liver cell adenoma seen at the high dose level in females was treatment-related” (Pilling A., 2008). Furthermore, the laboratory noted that the original statistical analysis would not have been significant if it had been conducted according to current standards. Taking into account the critical deficiencies of the study and the fact that:
o The slightly higher incidence of liver tumours was only seen in females at the top dose level which exceeded the MTD
o The incidence of liver tumours did not reach statistical significance when analysed with appropriate methods
o Liver tumours were considered as incidental and not as a factor contributing to death o There was no indication of progression towards malignancy o M01 (AE C653711) was clearly not genotoxic, neither in vitro nor in vivo o The study was not designed as an oncogenicity study had some deficiencies.
The rapporteur Member State (UK PSD) considered in the Draft Assessment Report that “no carcinogenic effect was seen after a 2-year treatment period with M01 (AE C653711)” (see page 475). In the Addendum 1 to the Draft Assessment Report the RMS further concluded that “there was no evidence of substance related carcinogenicity and the weight of evidence suggests that M01 (AE C653711) is unlikely to pose a carcinogenic risk to humans and does not meet the EC criteria for classification for carcinogenicity.” (see page 45). These conclusions are in line with those drawn by EPA in 1998 in the Reregistration Eligibility Decision (RED) of dichlobenil where M01 (AE C653711) was considered not to pose any concerns with regard to carcinogenicity and those very recently reached in November 2007 by the Health Effects Division of EPA which concluded that “there was no evidence of carcinogenicity in the 2-year combined chronic toxicity/carcinogencity study of M01 (AE C653711) in rats” (see pages 13 and 22). On the basis of body weight effects and liver changes noted in males at 500 ppm (19 mg/kg/day) and the liver alteration reported in females at 180 ppm (8.5 mg/kg/day), the dose levels of 180 ppm (6.5 mg/kg/day) and 100 ppm (4.7 mg/kg/day) were considered to be the No Adverse Effect Levels (NOAEL) in males and females, respectively.
Fluopicolide - Addendum 2 December 2008
488
Appendix III: Summaries of the 2 year Dog Study, the Rat Multigeneration Study and the Rabbit developmental study conducted on M01 (AE C653711)
The following section specifically summarises those studies that were considered relevant to evaluate the chronic/long-term and reproductive toxicity of M01 (AE C653711). • 2-year dog study In a non-GLP study conducted in 1971, groups of 4 male and 4 female Beagle dogs received M01 (AE C653711) in the diet at concentrations of either 0, 60, 100, 180 and 500 ppm for 2 years (equal to 0, 1.5, 2.5, 4.5 or 12.5 mg/kg/day) (Wilson, A.B. and Thorpe, E. 1971, Toxicity studies on the “Prefix” residue 2,6-dichlorobenzamide : two year oral experiment with dogs). The continuous dietary administration of M01 (AE C653711) at 500 ppm induced clear evidence of systemic toxicity as shown by effects on body weight. Mean body weights of male were decreased by 14 % on Week 54 and by 13% at the end of dosing. Mean body weights of female were reduced by 12% on Week 15 (p<0.01), 21% on Week 54 (p<0.01) and 23% (p<0.01) at the end of dosing. Similar changes were noted with body weight gains. Haematology, blood chemistry and urinalysis did not reveal any treatment-related effects. No changes in organ weight were noted at any dose level. Macroscopic and histopathological examination did not show any treatment-related abnormalities. On the basis of the body weight effects noted at 500 ppm (12.5 mg/kg/day), the dose level of 180 ppm (4.5 mg/kg/day in both sexes) was considered to be the No Adverse Effect Level (NOAEL) of the study. • Rat multigeneration study In a non-GLP study conducted in 1971, groups of 10 male and 20 female Long Evans rats received M01 (AE C653711) in the diet at concentrations of either 0, 60, 100 or 180 ppm (equal to 0, 4.5, 7.5 or 13.5 mg/kg/day) for 3 consecutive generations (Hine, C.H, et al. 1971, Results of Reproduction Study of Rats Fed Diets Containing 2,6 dichlorobenzamide (BAM) over three generations). Two litters were produced in each generation. The number of pups per litter was calculated on Postnatal Day (PND) 1, 5 and 21 and pups were weighed. Litters were culled to 10 animals on PND 5. Parents, F1 and F2 generation parental animals were weighed and examined for gross pathology on the day of sacrifice. Organ weights were measured and histopathology was performed on selected F3 weanling pups. The continuous administration of M01 (AE C653711) throughout 3 generations produced no evidence of parental toxicity up to a dose level of 180 ppm. There were no mortalities, no effects on body weight and no changes at necropsy. Reproductive performance was not affected by treatment at any dose level in any generation. No changes in fertility and gestation indices were observed throughout 3 generations. M01 (AE C653711) produced no evidence of pup toxicity up to a dose level of 180 ppm. There were no changes in the number of pups per litter and survival. No changes in viability and lactation indices were observed throughout 3 generations. There were no consistent effects on pup body weight, changes at necropsy and after histopathological examination.
Fluopicolide - Addendum 2 December 2008
489
On that basis, the dose level of 180 ppm (13.5 mg/kg/day) was considered to be a No Observed Adverse Effect Level (NOAEL) for parental systemic and offspring toxicity. In the absence of any treatment-related effects on reproductive performance throughout the study, the dose level of 180 ppm (13.5 mg/kg/day) was considered to be a No Observed Adverse Effect Level (NOAEL) for reproduction. • Rabbit developmental study In a GLP study conducted in 1987, groups of 16 mated female New Zealand White rabbits were given M01 (AE C653711) orally at dose levels of either 0, 10, 30 or 90 mg/kg/day daily from day 7 to 19 of gestation inclusive (McIntyre, M., 1987, 2,6-dichlorobenzamide: Oral (Gavage) Teratology Study in the Rabbit) Three females at 90 mg/kg/day were killed following abortion on days 19, 21 or 22 of gestation. A further two females at this dose level were killed following deterioration in physical condition on days 21 or 22 of gestation. These deaths were considered to be treatment-related following bodyweight loss, thin appearance and reduced food intake in the majority of these animals during the dosing period. No macroscopic changes were observed at examination post-mortem. Two females at 30 mg/kg/day were killed following deterioration in physical condition on days 12 and 14 of gestation and one female at 10 mg/kg/day was killed following abortion on day 23 of gestation. One control female was killed following abortion on day 20 of gestation and a further female was killed following deterioration in physical condition on day 24 of gestation. All these mortalities were considered unlikely to be related to treatment. The majority of females at 90 mg/kg/day had a thin appearance and fur staining. No clinical signs were seen at 10 or 30 mg/kg/day. There was a marked decrease in group mean bodyweight and food consumption throughout the dosing period of females at 90 mg/kg/day. No change in bodyweight or food consumption was seen in females at 10 or 30 mg/kg/day. No effect was seen on pregnancy rate, implantation rate, pre or post-implantation loss or litter size. Mean foetal weight was slightly reduced at 90 mg/kg/day but was not affected at 10 or 30 mg/kg/day. The overall incidences of major malformations, minor external and visceral and skeletal defects and variants showed no evidence of a treatment-related effect. In conclusion, administration of M01 (AE C653711) at a dose level of 90 mg/kg/day elicited maternal toxicity characterized by maternal deaths and bodyweight loss, and foetal weight was slightly reduced. No evidence of teratogenicity was seen whatsoever. On that basis, the No Adverse Effect level was 30 mg/kg/day in both the dam and the foetus.
490
Council Directive 91/414/EEC
Fluopicolide (AE C638206)
Volume 4 ADDENDUM 2
Annex C to the Report and Proposed Decision of the United Kingdom
made to the European Commission under Article 8(1) of 91/414/EEC
Confidential Information
December 2008

Fluopicolide - Volume 4, Annex C : Confidential Information – Addendum 2 December 2008
491
CONFIDENTIAL INFORMATION AVAILABLE WITH RMS
492
Council Directive 91/414/EEC
Fluopicolide (AE C638206)
ADDENDUM 3 TO THE DRAFT ASSESSMENT REPORT PREPARED BY THE
UNITED KINGDOM
February 2009
PESTICIDES SAFETY DIRECTORATEMallard House, Kings Pool, 3 Peasholme Green, York YO1 7PX, UK Website: www.pesticides.gov.uk

493
CONTENTS Page
RESIDUES 3 ECOTOXICOLOGY 10
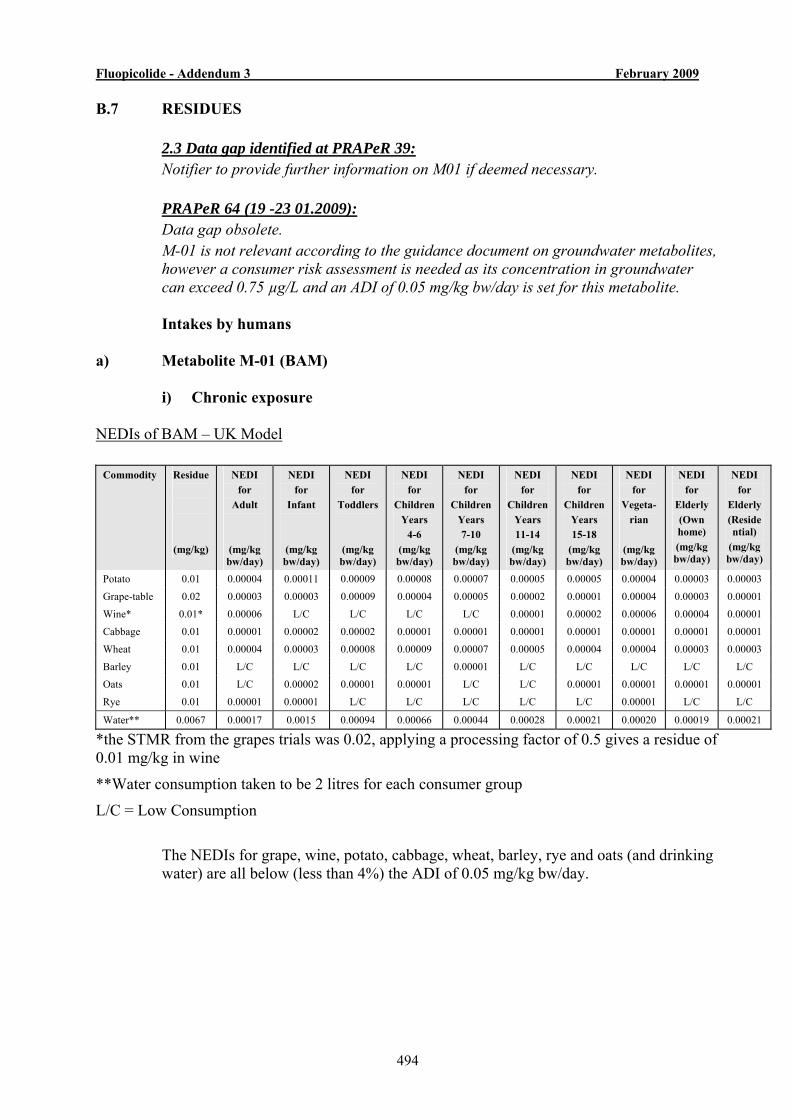
Fluopicolide - Addendum 3 February 2009
494
B.7 RESIDUES
2.3 Data gap identified at PRAPeR 39: Notifier to provide further information on M01 if deemed necessary.
PRAPeR 64 (19 -23 01.2009): Data gap obsolete. M-01 is not relevant according to the guidance document on groundwater metabolites, however a consumer risk assessment is needed as its concentration in groundwater can exceed 0.75 µg/L and an ADI of 0.05 mg/kg bw/day is set for this metabolite.
Intakes by humans a) Metabolite M-01 (BAM)
i) Chronic exposure NEDIs of BAM – UK Model
Commodity Residue
(mg/kg)
NEDI for
Adult
(mg/kg bw/day)
NEDI for
Infant
(mg/kg bw/day)
NEDI for
Toddlers
(mg/kg bw/day)
NEDI for
Children Years
4-6 (mg/kg bw/day)
NEDI for
Children Years 7-10
(mg/kg bw/day)
NEDI for
Children Years 11-14
(mg/kg bw/day)
NEDI for
Children Years 15-18
(mg/kg bw/day)
NEDI for
Vegeta- rian
(mg/kg bw/day)
NEDI for
Elderly (Own home) (mg/kg bw/day)
NEDI for
Elderly (Residential)
(mg/kg bw/day)
Potato 0.01 0.00004 0.00011 0.00009 0.00008 0.00007 0.00005 0.00005 0.00004 0.00003 0.00003
Grape-table 0.02 0.00003 0.00003 0.00009 0.00004 0.00005 0.00002 0.00001 0.00004 0.00003 0.00001
Wine* 0.01* 0.00006 L/C L/C L/C L/C 0.00001 0.00002 0.00006 0.00004 0.00001
Cabbage 0.01 0.00001 0.00002 0.00002 0.00001 0.00001 0.00001 0.00001 0.00001 0.00001 0.00001
Wheat 0.01 0.00004 0.00003 0.00008 0.00009 0.00007 0.00005 0.00004 0.00004 0.00003 0.00003
Barley 0.01 L/C L/C L/C L/C 0.00001 L/C L/C L/C L/C L/C
Oats 0.01 L/C 0.00002 0.00001 0.00001 L/C L/C 0.00001 0.00001 0.00001 0.00001
Rye 0.01 0.00001 0.00001 L/C L/C L/C L/C L/C 0.00001 L/C L/C
Water** 0.0067 0.00017 0.0015 0.00094 0.00066 0.00044 0.00028 0.00021 0.00020 0.00019 0.00021
*the STMR from the grapes trials was 0.02, applying a processing factor of 0.5 gives a residue of 0.01 mg/kg in wine
**Water consumption taken to be 2 litres for each consumer group
L/C = Low Consumption
The NEDIs for grape, wine, potato, cabbage, wheat, barley, rye and oats (and drinking
water) are all below (less than 4%) the ADI of 0.05 mg/kg bw/day.
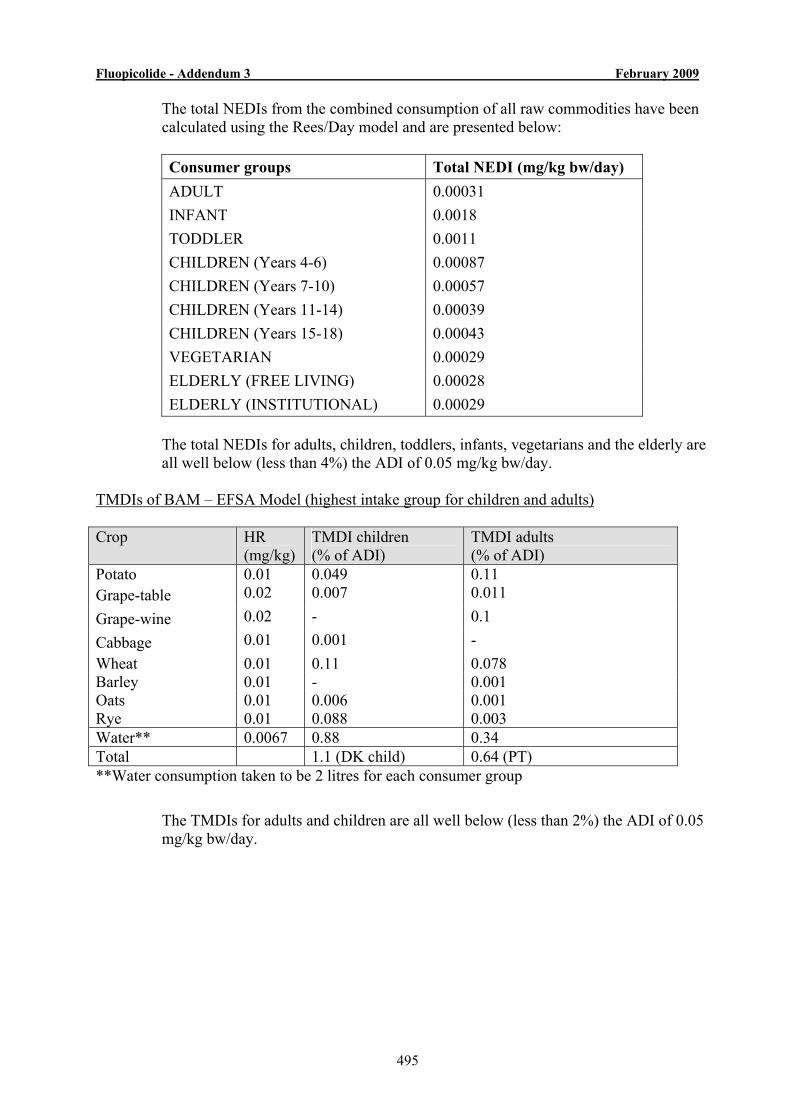
Fluopicolide - Addendum 3 February 2009
495
The total NEDIs from the combined consumption of all raw commodities have been calculated using the Rees/Day model and are presented below:
Consumer groups Total NEDI (mg/kg bw/day) ADULT 0.00031 INFANT 0.0018 TODDLER 0.0011 CHILDREN (Years 4-6) 0.00087 CHILDREN (Years 7-10) 0.00057 CHILDREN (Years 11-14) 0.00039 CHILDREN (Years 15-18) 0.00043 VEGETARIAN 0.00029 ELDERLY (FREE LIVING) 0.00028 ELDERLY (INSTITUTIONAL) 0.00029
The total NEDIs for adults, children, toddlers, infants, vegetarians and the elderly are
all well below (less than 4%) the ADI of 0.05 mg/kg bw/day. TMDIs of BAM – EFSA Model (highest intake group for children and adults) Crop HR
(mg/kg) TMDI children (% of ADI)
TMDI adults (% of ADI)
Potato 0.01 0.049 0.11 Grape-table 0.02 0.007 0.011
Grape-wine 0.02 - 0.1
Cabbage 0.01 0.001 - Wheat 0.01 0.11 0.078 Barley 0.01 - 0.001 Oats 0.01 0.006 0.001 Rye 0.01 0.088 0.003 Water** 0.0067 0.88 0.34 Total 1.1 (DK child) 0.64 (PT) **Water consumption taken to be 2 litres for each consumer group
The TMDIs for adults and children are all well below (less than 2%) the ADI of 0.05
mg/kg bw/day.
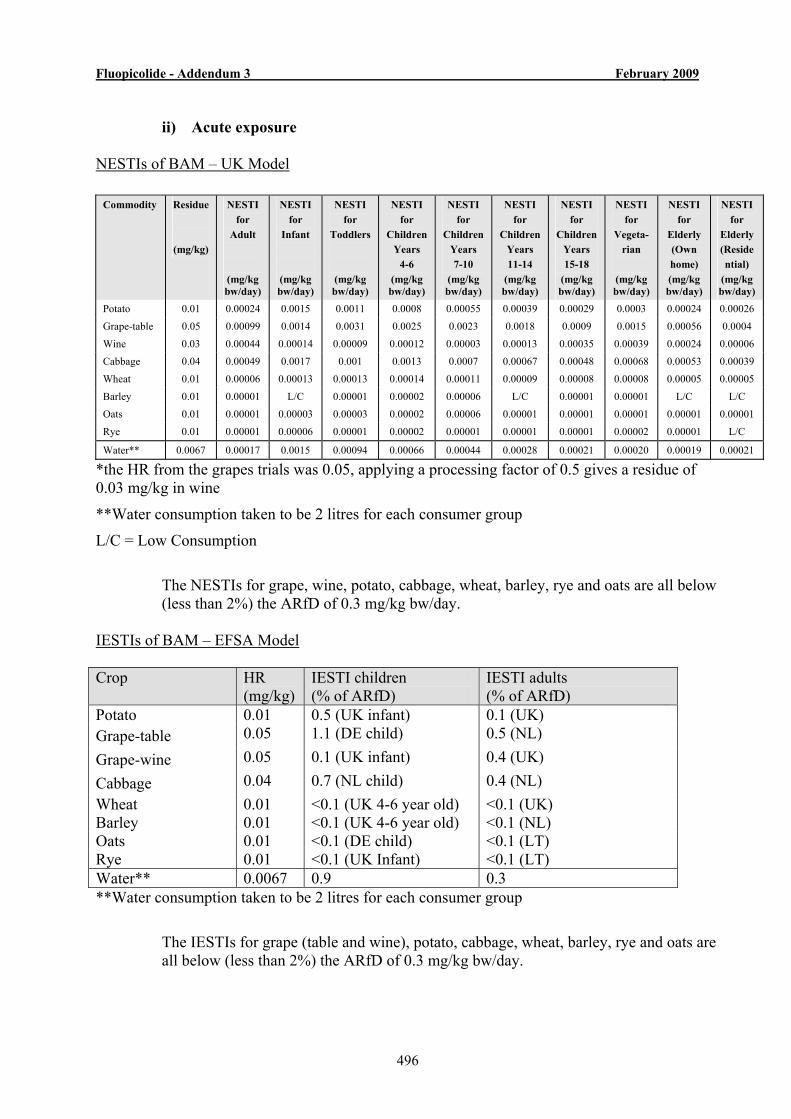
Fluopicolide - Addendum 3 February 2009
496
ii) Acute exposure
NESTIs of BAM – UK Model
Commodity Residue
(mg/kg)
NESTI for
Adult
(mg/kg bw/day)
NESTI for
Infant
(mg/kg bw/day)
NESTI for
Toddlers
(mg/kg bw/day)
NESTI for
Children Years
4-6 (mg/kg bw/day)
NESTI for
Children Years 7-10
(mg/kg bw/day)
NESTI for
Children Years 11-14
(mg/kg bw/day)
NESTI for
Children Years 15-18
(mg/kg bw/day)
NESTI for
Vegeta- rian
(mg/kg bw/day)
NESTI for
Elderly (Own home) (mg/kg bw/day)
NESTI for
Elderly (Reside ntial)
(mg/kg bw/day)
Potato 0.01 0.00024 0.0015 0.0011 0.0008 0.00055 0.00039 0.00029 0.0003 0.00024 0.00026
Grape-table 0.05 0.00099 0.0014 0.0031 0.0025 0.0023 0.0018 0.0009 0.0015 0.00056 0.0004
Wine 0.03 0.00044 0.00014 0.00009 0.00012 0.00003 0.00013 0.00035 0.00039 0.00024 0.00006
Cabbage 0.04 0.00049 0.0017 0.001 0.0013 0.0007 0.00067 0.00048 0.00068 0.00053 0.00039
Wheat 0.01 0.00006 0.00013 0.00013 0.00014 0.00011 0.00009 0.00008 0.00008 0.00005 0.00005
Barley 0.01 0.00001 L/C 0.00001 0.00002 0.00006 L/C 0.00001 0.00001 L/C L/C
Oats 0.01 0.00001 0.00003 0.00003 0.00002 0.00006 0.00001 0.00001 0.00001 0.00001 0.00001
Rye 0.01 0.00001 0.00006 0.00001 0.00002 0.00001 0.00001 0.00001 0.00002 0.00001 L/C
Water** 0.0067 0.00017 0.0015 0.00094 0.00066 0.00044 0.00028 0.00021 0.00020 0.00019 0.00021
*the HR from the grapes trials was 0.05, applying a processing factor of 0.5 gives a residue of 0.03 mg/kg in wine
**Water consumption taken to be 2 litres for each consumer group
L/C = Low Consumption
The NESTIs for grape, wine, potato, cabbage, wheat, barley, rye and oats are all below
(less than 2%) the ARfD of 0.3 mg/kg bw/day. IESTIs of BAM – EFSA Model Crop HR
(mg/kg) IESTI children (% of ARfD)
IESTI adults (% of ARfD)
Potato 0.01 0.5 (UK infant) 0.1 (UK) Grape-table 0.05 1.1 (DE child) 0.5 (NL)
Grape-wine 0.05 0.1 (UK infant) 0.4 (UK)
Cabbage 0.04 0.7 (NL child) 0.4 (NL) Wheat 0.01 <0.1 (UK 4-6 year old) <0.1 (UK) Barley 0.01 <0.1 (UK 4-6 year old) <0.1 (NL) Oats 0.01 <0.1 (DE child) <0.1 (LT) Rye 0.01 <0.1 (UK Infant) <0.1 (LT) Water** 0.0067 0.9 0.3 **Water consumption taken to be 2 litres for each consumer group
The IESTIs for grape (table and wine), potato, cabbage, wheat, barley, rye and oats are
all below (less than 2%) the ARfD of 0.3 mg/kg bw/day.
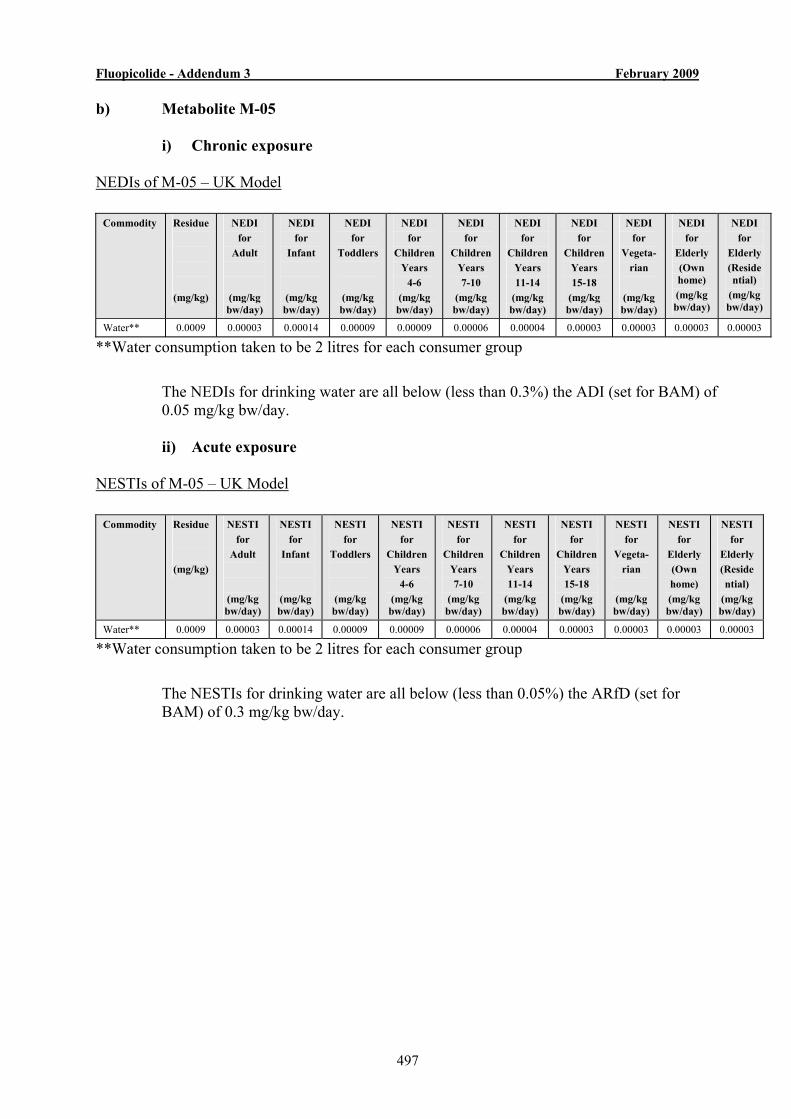
Fluopicolide - Addendum 3 February 2009
497
b) Metabolite M-05
i) Chronic exposure NEDIs of M-05 – UK Model
Commodity Residue
(mg/kg)
NEDI for
Adult
(mg/kg bw/day)
NEDI for
Infant
(mg/kg bw/day)
NEDI for
Toddlers
(mg/kg bw/day)
NEDI for
Children Years
4-6 (mg/kg bw/day)
NEDI for
Children Years 7-10
(mg/kg bw/day)
NEDI for
Children Years 11-14
(mg/kg bw/day)
NEDI for
Children Years 15-18
(mg/kg bw/day)
NEDI for
Vegeta- rian
(mg/kg bw/day)
NEDI for
Elderly (Own home) (mg/kg bw/day)
NEDI for
Elderly (Residential)
(mg/kg bw/day)
Water** 0.0009 0.00003 0.00014 0.00009 0.00009 0.00006 0.00004 0.00003 0.00003 0.00003 0.00003
**Water consumption taken to be 2 litres for each consumer group
The NEDIs for drinking water are all below (less than 0.3%) the ADI (set for BAM) of
0.05 mg/kg bw/day.
ii) Acute exposure NESTIs of M-05 – UK Model
Commodity Residue
(mg/kg)
NESTI for
Adult
(mg/kg bw/day)
NESTI for
Infant
(mg/kg bw/day)
NESTI for
Toddlers
(mg/kg bw/day)
NESTI for
Children Years
4-6 (mg/kg bw/day)
NESTI for
Children Years 7-10
(mg/kg bw/day)
NESTI for
Children Years 11-14
(mg/kg bw/day)
NESTI for
Children Years 15-18
(mg/kg bw/day)
NESTI for
Vegeta- rian
(mg/kg bw/day)
NESTI for
Elderly (Own home) (mg/kg bw/day)
NESTI for
Elderly (Reside ntial)
(mg/kg bw/day)
Water** 0.0009 0.00003 0.00014 0.00009 0.00009 0.00006 0.00004 0.00003 0.00003 0.00003 0.00003
**Water consumption taken to be 2 litres for each consumer group
The NESTIs for drinking water are all below (less than 0.05%) the ARfD (set for
BAM) of 0.3 mg/kg bw/day.

Fluopicolide - Addendum 3 February 2009
498
c) Metabolite M-10
i) Chronic exposure NEDIs of M-10 – UK Model
Commodity Residue
(mg/kg)
NEDI for
Adult
(mg/kg bw/day)
NEDI for
Infant
(mg/kg bw/day)
NEDI for
Toddlers
(mg/kg bw/day)
NEDI for
Children Years
4-6 (mg/kg bw/day)
NEDI for
Children Years 7-10
(mg/kg bw/day)
NEDI for
Children Years 11-14
(mg/kg bw/day)
NEDI for
Children Years 15-18
(mg/kg bw/day)
NEDI for
Vegeta- rian
(mg/kg bw/day)
NEDI for
Elderly (Own home) (mg/kg bw/day)
NEDI for
Elderly (Residential)
(mg/kg bw/day)
Water** 0.00083 0.00003 0.00014 0.00009 0.00009 0.00006 0.00004 0.00003 0.00003 0.00003 0.00003
**Water consumption taken to be 2 litres for each consumer group
The NEDIs for drinking water are all below (less than 0.3%) the ADI (set for BAM) of
0.05 mg/kg bw/day.
ii) Acute exposure NESTIs of M-10 – UK Model
Commodity
Residue
(mg/kg)
NESTI for
Adult
(mg/kg bw/day)
NESTI for
Infant
(mg/kg bw/day)
NESTI for
Toddlers
(mg/kg bw/day)
NESTI for
Children Years
4-6 (mg/kg bw/day)
NESTI for
Children Years 7-10
(mg/kg bw/day)
NESTI for
Children Years 11-14
(mg/kg bw/day)
NESTI for
Children Years 15-18
(mg/kg bw/day)
NESTI for
Vegeta- rian
(mg/kg bw/day)
NESTI for
Elderly (Own home) (mg/kg bw/day)
NESTI for
Elderly (Reside ntial)
(mg/kg bw/day)
Water** 0.00083 0.00003 0.00014 0.00009 0.00009 0.00006 0.00004 0.00003 0.00003 0.00003 0.00003
**Water consumption taken to be 2 litres for each consumer group
The NESTIs for drinking water are all below (less than 0.05%) the ARfD (set for
BAM) of 0.3 mg/kg bw/day.

Fluopicolide - Addendum 3 February 2009
499
d) Metabolite M-11
i) Chronic exposure NEDIs of M-11 – UK Model
Commodity Residue
(mg/kg)
NEDI for
Adult
(mg/kg bw/day)
NEDI for
Infant
(mg/kg bw/day)
NEDI for
Toddlers
(mg/kg bw/day)
NEDI for
Children Years
4-6 (mg/kg bw/day)
NEDI for
Children Years 7-10
(mg/kg bw/day)
NEDI for
Children Years 11-14
(mg/kg bw/day)
NEDI for
Children Years 15-18
(mg/kg bw/day)
NEDI for
Vegeta- rian
(mg/kg bw/day)
NEDI for
Elderly (Own home) (mg/kg bw/day)
NEDI for
Elderly (Residential)
(mg/kg bw/day)
Water** 0.00081 0.00003 0.00014 0.00009 0.00009 0.00006 0.00004 0.00003 0.00003 0.00003 0.00003
**Water consumption taken to be 2 litres for each consumer group
The NEDIs for drinking water are all below (less than 0.3%) the ADI (set for BAM) of
0.05 mg/kg bw/day.
ii) Acute exposure NESTIs of M-11 – UK Model
Commodity
Residue
(mg/kg)
NESTI for
Adult
(mg/kg bw/day)
NESTI for
Infant
(mg/kg bw/day)
NESTI for
Toddlers
(mg/kg bw/day)
NESTI for
Children Years
4-6 (mg/kg bw/day)
NESTI for
Children Years 7-10
(mg/kg bw/day)
NESTI for
Children Years 11-14
(mg/kg bw/day)
NESTI for
Children Years 15-18
(mg/kg bw/day)
NESTI for
Vegeta- rian
(mg/kg bw/day)
NESTI for
Elderly (Own home) (mg/kg bw/day)
NESTI for
Elderly (Reside ntial)
(mg/kg bw/day)
Water** 0.00081 0.00003 0.00014 0.00009 0.00009 0.00006 0.00004 0.00003 0.00003 0.00003 0.00003
**Water consumption taken to be 2 litres for each consumer group
The NESTIs for drinking water are all below (less than 0.05%) the ARfD (set for
BAM) of 0.3 mg/kg bw/day.
Fluopicolide - Addendum 3 February 2009
500
e) Conclusion Acute and chronic exposure has been modelled for all the metabolites that exceed 0.75
µg/L.
For M-01, the NEDIs for grape, wine, potato, cabbage, wheat, barley, rye and oats (and drinking water) are less than 4% the ADI of 0.05 mg/kg bw/day. The total NEDIs for adults, children, toddlers, infants, vegetarians and the elderly are also less than 4% of the ADI. The TMDIs for adults and children are less than 1% of the ADI. The NESTIs for grape, wine, potato, cabbage, wheat, barley, rye and oats are all below (less than 2%) the ARfD of 0.3 mg/kg bw/day. The IESTIs for grape (table and wine), potato, cabbage, wheat, barley, rye and oats are also less than 2% of the ARfD. For the Metabolites M-05, M-10 and M-11 the acute and chronic exposure are all less than 1% of the ADI and ARfD.
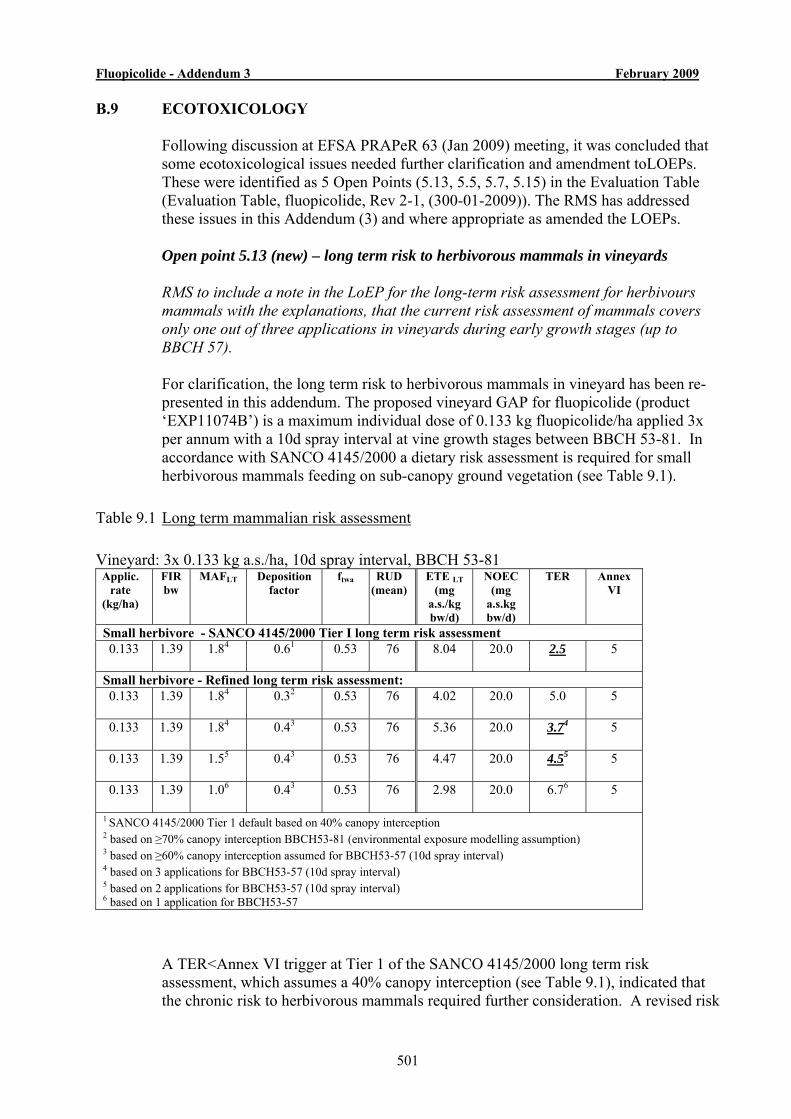
Fluopicolide - Addendum 3 February 2009
501
B.9 ECOTOXICOLOGY Following discussion at EFSA PRAPeR 63 (Jan 2009) meeting, it was concluded that
some ecotoxicological issues needed further clarification and amendment toLOEPs. These were identified as 5 Open Points (5.13, 5.5, 5.7, 5.15) in the Evaluation Table (Evaluation Table, fluopicolide, Rev 2-1, (300-01-2009)). The RMS has addressed these issues in this Addendum (3) and where appropriate as amended the LOEPs.
Open point 5.13 (new) – long term risk to herbivorous mammals in vineyards
RMS to include a note in the LoEP for the long-term risk assessment for herbivours
mammals with the explanations, that the current risk assessment of mammals covers only one out of three applications in vineyards during early growth stages (up to BBCH 57). For clarification, the long term risk to herbivorous mammals in vineyard has been re-presented in this addendum. The proposed vineyard GAP for fluopicolide (product ‘EXP11074B’) is a maximum individual dose of 0.133 kg fluopicolide/ha applied 3x per annum with a 10d spray interval at vine growth stages between BBCH 53-81. In accordance with SANCO 4145/2000 a dietary risk assessment is required for small herbivorous mammals feeding on sub-canopy ground vegetation (see Table 9.1).
Table 9.1 Long term mammalian risk assessment Vineyard: 3x 0.133 kg a.s./ha, 10d spray interval, BBCH 53-81
Applic. rate
(kg/ha)
FIR bw
MAFLT Deposition factor
ftwa RUD (mean)
ETE LT (mg
a.s./kg bw/d)
NOEC (mg
a.s.kg bw/d)
TER Annex VI
Small herbivore - SANCO 4145/2000 Tier I long term risk assessment 0.133
1.39 1.84 0.61 0.53 76 8.04 20.0 2.5 5
Small herbivore - Refined long term risk assessment: 0.133
1.39 1.84 0.32 0.53 76 4.02 20.0 5.0 5
0.133
1.39 1.84 0.43 0.53 76 5.36 20.0 3.74 5
0.133
1.39 1.55 0.43 0.53 76 4.47 20.0 4.55 5
0.133
1.39 1.06 0.43 0.53 76 2.98 20.0 6.76 5
1 SANCO 4145/2000 Tier 1 default based on 40% canopy interception 2 based on ≥70% canopy interception BBCH53-81 (environmental exposure modelling assumption) 3 based on ≥60% canopy interception assumed for BBCH53-57 (10d spray interval) 4 based on 3 applications for BBCH53-57 (10d spray interval) 5 based on 2 applications for BBCH53-57 (10d spray interval) 6 based on 1 application for BBCH53-57
A TER<Annex VI trigger at Tier 1 of the SANCO 4145/2000 long term risk assessment, which assumes a 40% canopy interception (see Table 9.1), indicated that the chronic risk to herbivorous mammals required further consideration. A revised risk
Fluopicolide - Addendum 3 February 2009
502
assessment refining canopy spray interception and its effect on deposition on ground vegetation was undertaken. Initially a 70% canopy spray interception was assessed (in line with all environmental exposure modelling assumptions). This derived a TER of 4.98 for the long term risk to herbivorous, i.e. close to the Annex VI trigger of 5. The RMS concluded that this was sufficient to demonstrate a low long term risk to herbivorous mammals in vineyards. However, at PRAPeR 38 (Dec 2007) it was concluded that the canopy at early growth stages (BBCH53- 57) may not be fully developed, consequently, an interception of 60% was regarded as more appropriate at these growth stages. A revised refined long term risk assessment for herbivorous mammals was prepared which indicated that TER was now less that Annex VI trigger (see Table 9.1). However, a reduction in the number of applications during BBCH53-57 generated TERs approaching, or above, the Annex VI trigger value (Table 9.1). Conclusion For GAP applications at all growth stages (BBCH53-81), assuming ≥70% canopy interception, a low chronic risk to small herbivorous mammals consuming sub-canopy ground vegetation in vineyards is indicated. However, for early applications (BBCH53-57), assuming lower canopy interception (≥60%), the TERs indicate that for this period further risk refinement or mitigation (e.g. reduced number of applications) may need to be considered if the canopy is not fully developed.
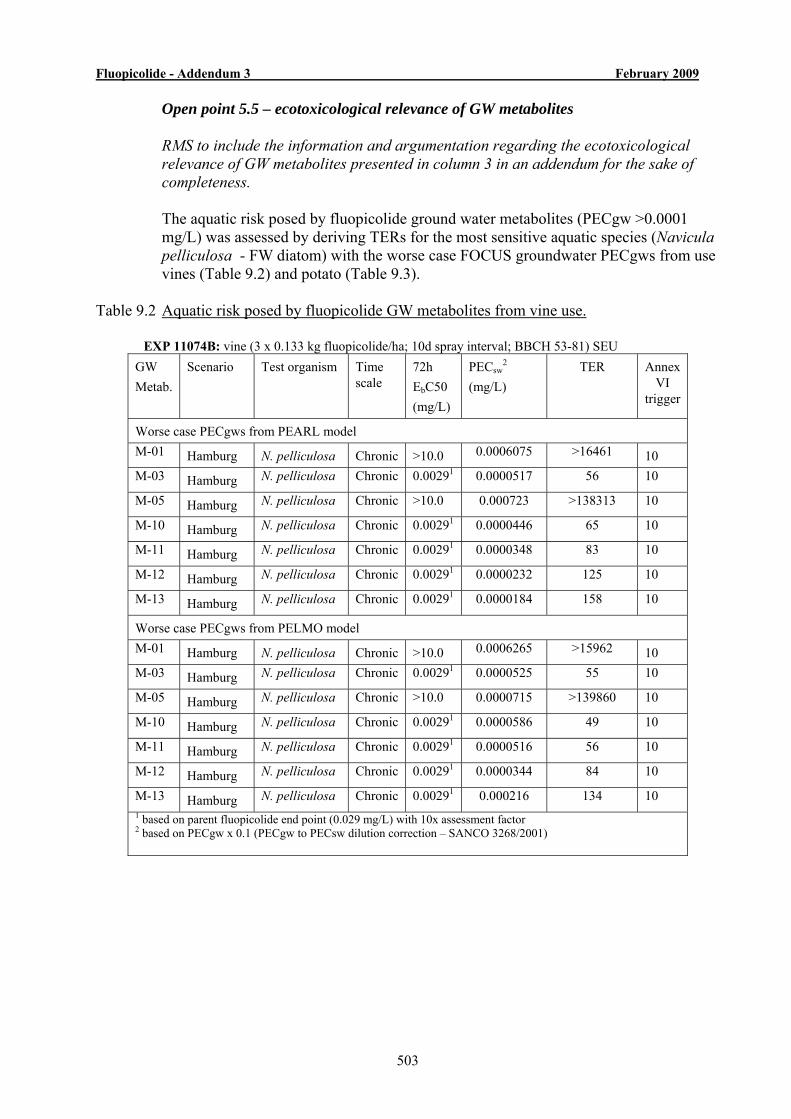
Fluopicolide - Addendum 3 February 2009
503
Open point 5.5 – ecotoxicological relevance of GW metabolites
RMS to include the information and argumentation regarding the ecotoxicological relevance of GW metabolites presented in column 3 in an addendum for the sake of completeness. The aquatic risk posed by fluopicolide ground water metabolites (PECgw >0.0001 mg/L) was assessed by deriving TERs for the most sensitive aquatic species (Navicula pelliculosa - FW diatom) with the worse case FOCUS groundwater PECgws from use vines (Table 9.2) and potato (Table 9.3).
Table 9.2 Aquatic risk posed by fluopicolide GW metabolites from vine use.
EXP 11074B: vine (3 x 0.133 kg fluopicolide/ha; 10d spray interval; BBCH 53-81) SEU GW Metab.
Scenario Test organism Time scale
72h EbC50 (mg/L)
PECsw2
(mg/L)
TER Annex VI
trigger
Worse case PECgws from PEARL model M-01
Hamburg N. pelliculosa Chronic >10.0 0.0006075 >16461 10
M-03 Hamburg N. pelliculosa Chronic 0.00291 0.0000517 56 10
M-05 Hamburg N. pelliculosa Chronic >10.0 0.000723 >138313 10
M-10 Hamburg N. pelliculosa Chronic 0.00291 0.0000446 65 10
M-11 Hamburg N. pelliculosa Chronic 0.00291 0.0000348 83 10
M-12 Hamburg N. pelliculosa Chronic 0.00291 0.0000232 125 10
M-13 Hamburg N. pelliculosa Chronic 0.00291 0.0000184 158 10
Worse case PECgws from PELMO model M-01
Hamburg N. pelliculosa Chronic >10.0 0.0006265 >15962 10
M-03 Hamburg N. pelliculosa Chronic 0.00291 0.0000525 55 10
M-05 Hamburg N. pelliculosa Chronic >10.0 0.0000715 >139860 10
M-10 Hamburg N. pelliculosa Chronic 0.00291 0.0000586 49 10
M-11 Hamburg N. pelliculosa Chronic 0.00291 0.0000516 56 10
M-12 Hamburg N. pelliculosa Chronic 0.00291 0.0000344 84 10
M-13 Hamburg N. pelliculosa Chronic 0.00291 0.000216 134 10
1 based on parent fluopicolide end point (0.029 mg/L) with 10x assessment factor 2 based on PECgw x 0.1 (PECgw to PECsw dilution correction – SANCO 3268/2001)
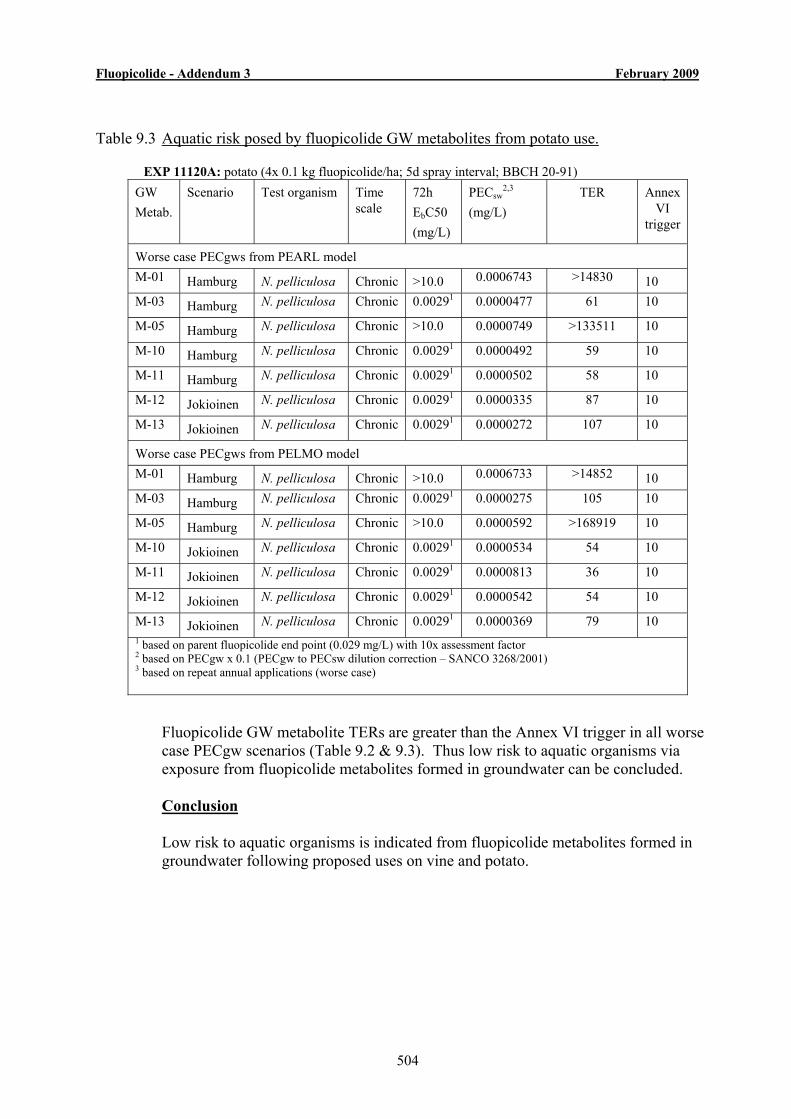
Fluopicolide - Addendum 3 February 2009
504
Table 9.3 Aquatic risk posed by fluopicolide GW metabolites from potato use.
EXP 11120A: potato (4x 0.1 kg fluopicolide/ha; 5d spray interval; BBCH 20-91) GW Metab.
Scenario Test organism Time scale
72h EbC50 (mg/L)
PECsw2,3
(mg/L)
TER Annex VI
trigger
Worse case PECgws from PEARL model M-01
Hamburg N. pelliculosa Chronic >10.0 0.0006743 >14830 10
M-03 Hamburg N. pelliculosa Chronic 0.00291 0.0000477 61 10
M-05 Hamburg N. pelliculosa Chronic >10.0 0.0000749 >133511 10
M-10 Hamburg N. pelliculosa Chronic 0.00291 0.0000492 59 10
M-11 Hamburg N. pelliculosa Chronic 0.00291 0.0000502 58 10
M-12 Jokioinen N. pelliculosa Chronic 0.00291 0.0000335 87 10
M-13 Jokioinen N. pelliculosa Chronic 0.00291 0.0000272 107 10
Worse case PECgws from PELMO model M-01
Hamburg N. pelliculosa Chronic >10.0 0.0006733 >14852 10
M-03 Hamburg N. pelliculosa Chronic 0.00291 0.0000275 105 10
M-05 Hamburg N. pelliculosa Chronic >10.0 0.0000592 >168919 10
M-10 Jokioinen N. pelliculosa Chronic 0.00291 0.0000534 54 10
M-11 Jokioinen N. pelliculosa Chronic 0.00291 0.0000813 36 10
M-12 Jokioinen N. pelliculosa Chronic 0.00291 0.0000542 54 10
M-13 Jokioinen N. pelliculosa Chronic 0.00291 0.0000369 79 10
1 based on parent fluopicolide end point (0.029 mg/L) with 10x assessment factor 2 based on PECgw x 0.1 (PECgw to PECsw dilution correction – SANCO 3268/2001) 3 based on repeat annual applications (worse case)
Fluopicolide GW metabolite TERs are greater than the Annex VI trigger in all worse case PECgw scenarios (Table 9.2 & 9.3). Thus low risk to aquatic organisms via exposure from fluopicolide metabolites formed in groundwater can be concluded.
Conclusion
Low risk to aquatic organisms is indicated from fluopicolide metabolites formed in groundwater following proposed uses on vine and potato.
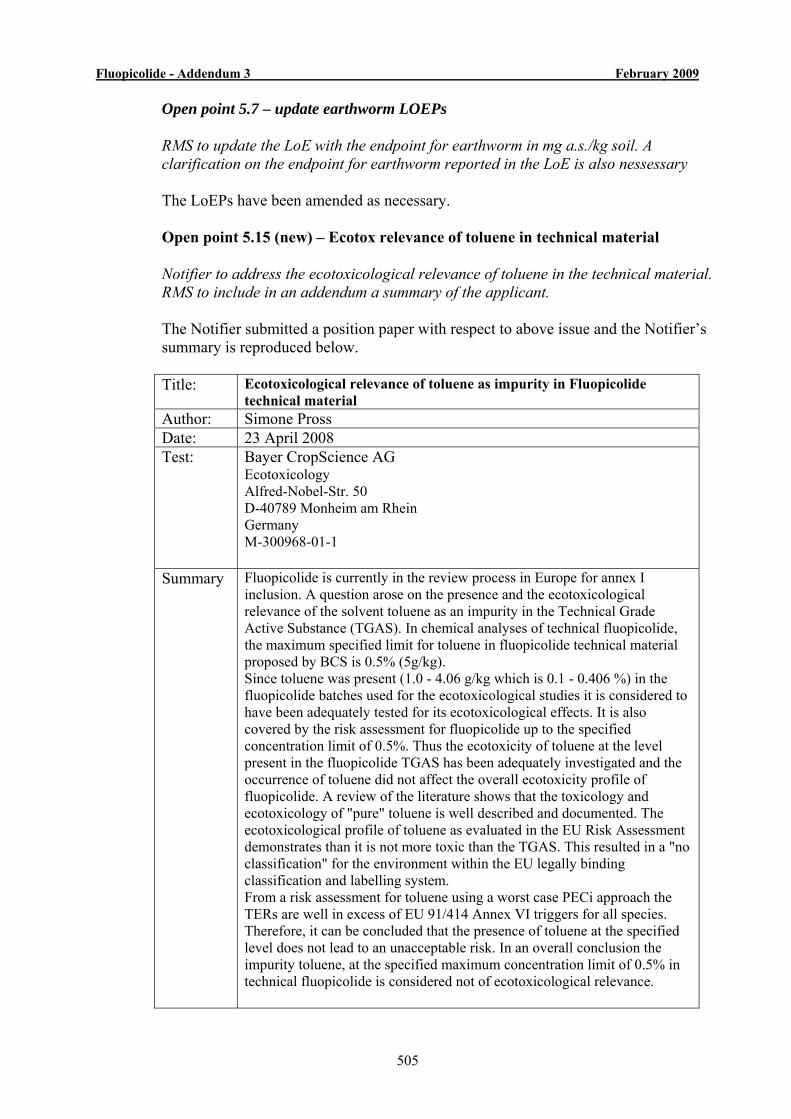
Fluopicolide - Addendum 3 February 2009
505
Open point 5.7 – update earthworm LOEPs
RMS to update the LoE with the endpoint for earthworm in mg a.s./kg soil. A clarification on the endpoint for earthworm reported in the LoE is also nessessary The LoEPs have been amended as necessary. Open point 5.15 (new) – Ecotox relevance of toluene in technical material
Notifier to address the ecotoxicological relevance of toluene in the technical material. RMS to include in an addendum a summary of the applicant. The Notifier submitted a position paper with respect to above issue and the Notifier’s summary is reproduced below. Title: Ecotoxicological relevance of toluene as impurity in Fluopicolide
technical material Author: Simone Pross Date: 23 April 2008 Test: Bayer CropScience AG
Ecotoxicology Alfred-Nobel-Str. 50 D-40789 Monheim am Rhein Germany M-300968-01-1
Summary Fluopicolide is currently in the review process in Europe for annex I inclusion. A question arose on the presence and the ecotoxicological relevance of the solvent toluene as an impurity in the Technical Grade Active Substance (TGAS). In chemical analyses of technical fluopicolide, the maximum specified limit for toluene in fluopicolide technical material proposed by BCS is 0.5% (5g/kg). Since toluene was present (1.0 - 4.06 g/kg which is 0.1 - 0.406 %) in the fluopicolide batches used for the ecotoxicological studies it is considered to have been adequately tested for its ecotoxicological effects. It is also covered by the risk assessment for fluopicolide up to the specified concentration limit of 0.5%. Thus the ecotoxicity of toluene at the level present in the fluopicolide TGAS has been adequately investigated and the occurrence of toluene did not affect the overall ecotoxicity profile of fluopicolide. A review of the literature shows that the toxicology and ecotoxicology of "pure" toluene is well described and documented. The ecotoxicological profile of toluene as evaluated in the EU Risk Assessment demonstrates than it is not more toxic than the TGAS. This resulted in a "no classification" for the environment within the EU legally binding classification and labelling system. From a risk assessment for toluene using a worst case PECi approach the TERs are well in excess of EU 91/414 Annex VI triggers for all species. Therefore, it can be concluded that the presence of toluene at the specified level does not lead to an unacceptable risk. In an overall conclusion the impurity toluene, at the specified maximum concentration limit of 0.5% in technical fluopicolide is considered not of ecotoxicological relevance.
Fluopicolide - Addendum 3 February 2009
506
The RMS has considered the case with respect to the ecotoxicological relevance of toluene as impurity in fluopicolide technical material as proposed by the Notifier (Pross, 2008). Ecotoxicological testing was undertaken using fluopicolide technical material (batches OP2050046, OP2050190, OP2350005, R001737, OP20500045) containing 0.1-0.4% w/w toluene (AEF125577) (see DAR Vol 4,Table C.1). Therefore the ecotoxicological risk assessment for technical fluopicolide essentially encompasses the risk from toluene in technical material (max. <0.5%w/w pilot plant; <0.3%w/w manufacturing plant – Volume 4, Addendum 2, C 2.2). Furthermore, the ecotoxicological profile of “pure” toluene shows it not to be more toxic than fluopicolide technical. A risk assessment using worse case toluene PECsoil (0.0009 mg/kg) and PECsw (0.000046 mg/L) initial values based on theoretical toluene content in fluopicolide PECs generate respective TERs of 16667, 16087 and 76087 with worse toxic toluene endpoints for worm(28dNOEC=15 mg/kg d.wt soil), Daphnia (96hEC50=3.5 mg/L) and Ceriodaphnia (7dNOEC=0.74 mg/L). The TERs clearly exceed relevant Annex VI EU 91/414 thresholds indicating low risk. Toluene also has low bioaccumulation potential (BCF=90). Thus all evidence indicates that environmental toluene derived from fluopicolide technical use in PPPs will not cause concern from an ecotoxicological perspective. Conclusion Environmental toluene derived from fluopicolide technical material used in PPPs for treatment of vine and potato is not relevant from an ecotoxicological perspective.
507
Council Directive 91/414/EEC
Fluopicolide (AE C638206)
Volume 4 ADDENDUM 3
Annex C to the Report and Proposed Decision of the United Kingdom
made to the European Commission under Article 8(1) of 91/414/EEC
Confidential Information
February 2009

Fluopicolide - Volume 4, Annex C : Confidential Information – Addendum 3 February 2009
508
CONFIDENTIAL INFORMATION AVAILABLE WITH RMS