Embed Size (px)
DESCRIPTION
assignment
Citation preview
Homework, Tests & Quiz SolutionsHW 1:
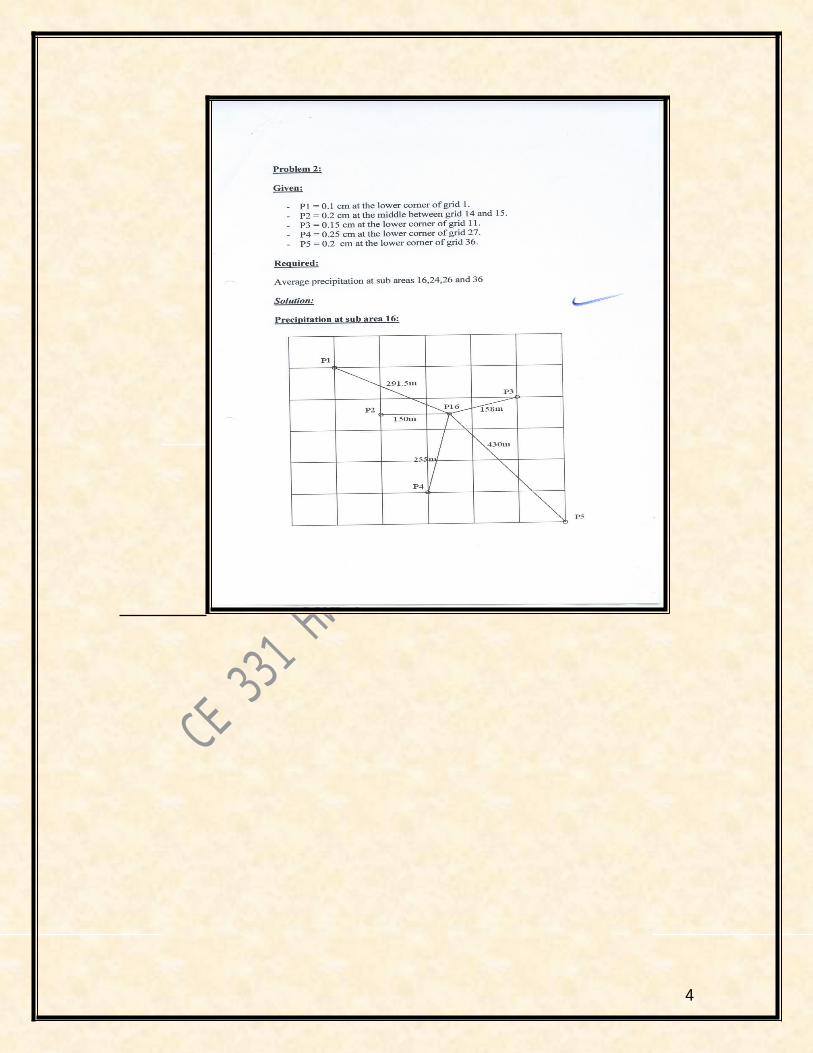
Problem 1:
The chart from a gauge shown represents the record between 6 AM Sunday and Noon Monday. Find the average rainfall intensity during this period. Also find the total precipitation between the same period.
0.350.300.25”0.20”0.150.1”0.05”0 6 AM 9 AM Noon 3 PM 6 PM 9 PM 12 PM 3 AM 6 AM 9 AM 12 Noon Solution:
Average rain= The area under the curve / Total time= {[(0.05+0.20)/2](6hrs)+[0.2](3hrs)+[{0.2 +0.3)/2](6hrs)+[(0.3 + 0.35)/2](12hrs) + [0.35](3hrs)} (1/30hrs)
= (0.75+0.6+1.5+3.9+1.05)/30 = 0.26 “Average intensity = 0.26/30 hrs = 0.09 inches/hrTotal rain = (Intensity) (duration) = 0.26”
Problem 2:
In a given year, a 1000 mi2 watershed received 12 inches of precipitation. The annual rate of outflow measured in the river draining the area is 600 ft3/sec. Estimate the Evapotranspiration. Assume negligible change of storage and no net groundwater flow.
Solution:
ET = P – OET = 12 – (600 ft3/s) (31,536,000 s/yr) (1/1000 mi2 x 52802 ft2/mi2) = 12 – 0.679 = 11.321 “
Problem 3:
Consider a reservoir with one inlet stream, one outlet at a dam and a surface area of .5 km 2. The reservoir level after weeks of drought is falling at a rate of 3 mm/day. The average
1
evaporation rate from the reservoir surface is 1.2 mm/day, the inlet discharge is 10,000 m3/day, and the outlet discharge is 16,000 m3/day. Assuming the only variables in the budget equation are: I,G,O,E (inflow, Groundwater, outflow, evaporation and rate change of storage dV/dt where I + G – O –E = dV/dt. Find the total net rate of groundwater discharge into the reservoir
Solution:
dQ / dt = -3 mm/d x 10-3 m/mm = - 0.003 m/dE = 1.2 x 10⁻³ m/mm = 0.0012 m/dI - O = 10,000 - 16,000- = - 6000 m3/dI – O in m = (- 6000 m3/d) / (0.5 x 1000,000 m2) = - 0.012 m/dI – O – E + G = dV/dt- 0.012 – 0.0012 + G = - 0.003G = + 0.012 + 0.0012 – 0.003 = 0.01 m
Problem 4:
Consider the following data:
Gage Annual ppt Storm EventA 42 2.6B 41 3.139 39 2.3X 41 ?
Find the missing data for station X
Solution:
Px = (Ax / n AA) PA + (Ax / n AB) PB + (Ax / n AC) PC + (Ax / n AD) PD
AX = 41N = 3
Px = [41/(3x42)] (2.6) + [41/(3x41)] (3.1) + [41/(3x39)] (2.3) = 0.846 + 1.033 + 0.806 = 2.685
HW 2:
2
3
4
5
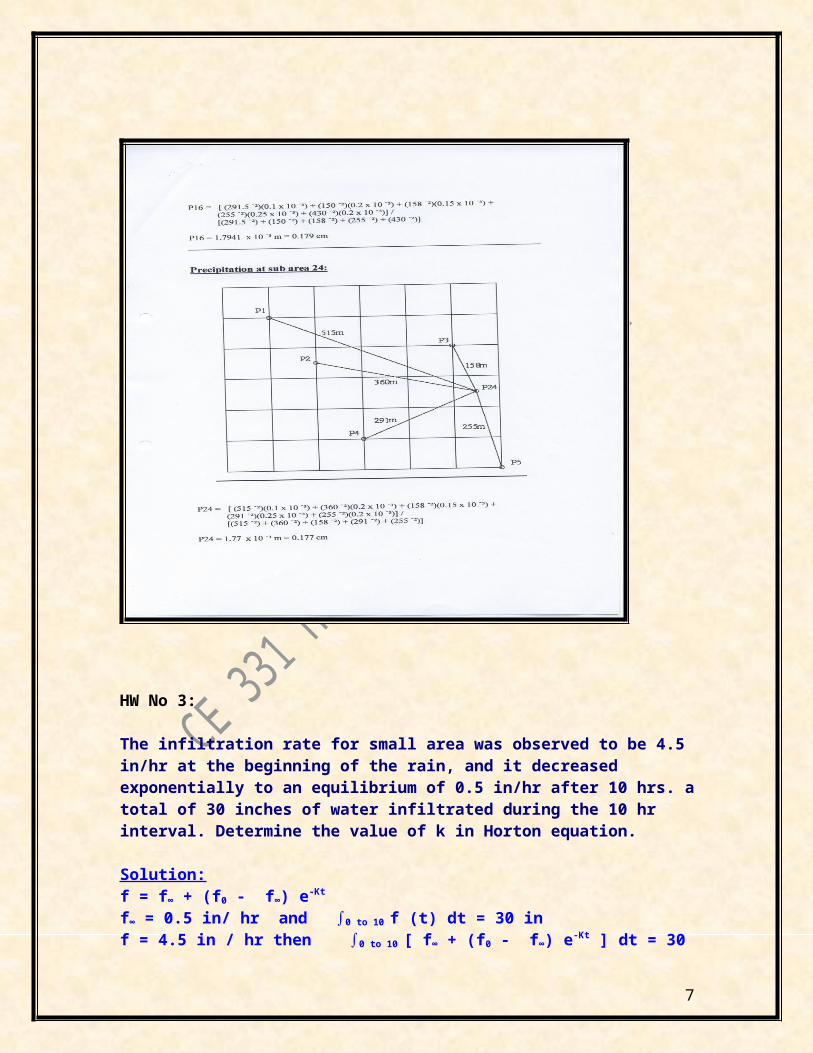
HW No 3:
The infiltration rate for small area was observed to be 4.5 in/hr at the beginning of the rain, and it decreased exponentially to an equilibrium of 0.5 in/hr after 10 hrs. a total of 30 inches of water infiltrated during the 10 hr interval. Determine the value of k in Horton equation.
Solution:f = f∞ + (f0 - f∞) e-Kt
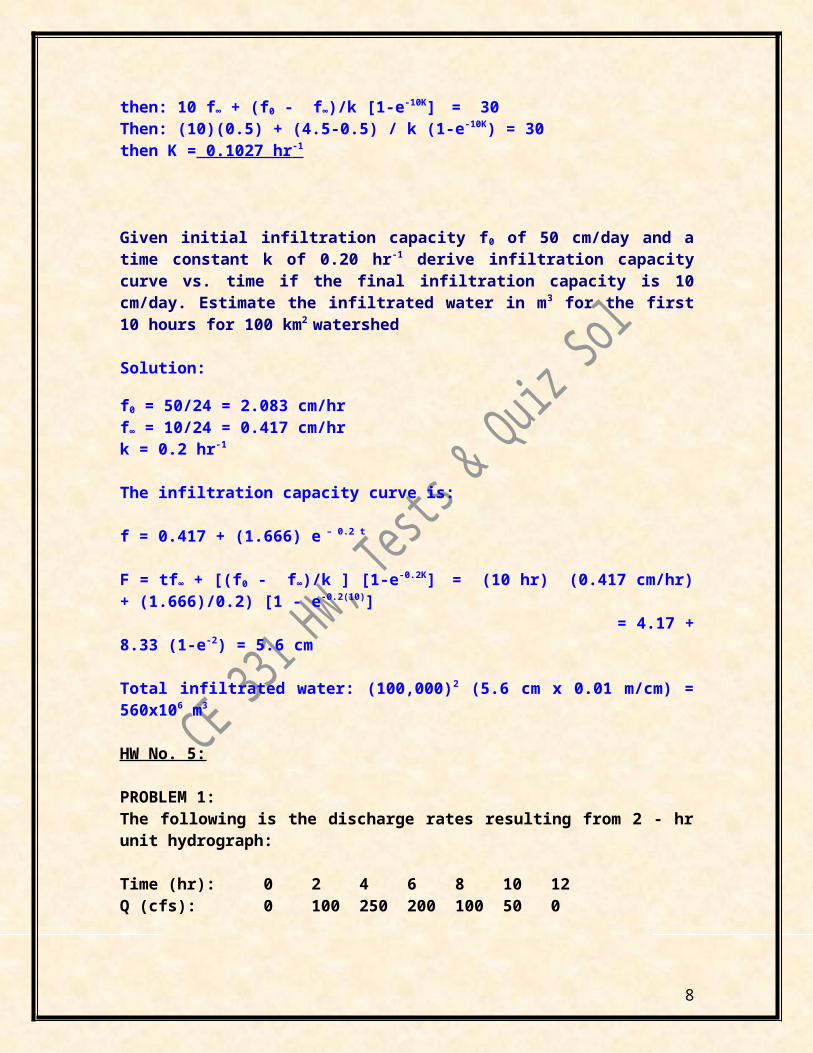
f∞ = 0.5 in/ hr and ∫0 to 10 f (t) dt = 30 inf = 4.5 in / hr then ∫0 to 10 [ f∞ + (f0 - f∞) e-Kt ] dt = 30 then: 10 f∞ + (f0 - f∞)/k [1-e-10K] = 30 Then: (10)(0.5) + (4.5-0.5) / k (1-e-10K) = 30then K = 0.1027 hr -1
Given initial infiltration capacity f0 of 50 cm/day and a time constant k of 0.20 hr -1 derive infiltration capacity curve vs. time if the final infiltration capacity is 10 cm/day. Estimate the infiltrated water in m3 for the first 10 hours for 100 km2 watershed
6
Solution:
f0 = 50/24 = 2.083 cm/hrf∞ = 10/24 = 0.417 cm/hrk = 0.2 hr-1
The infiltration capacity curve is:
f = 0.417 + (1.666) e – 0.2 t
F = tf∞ + [(f0 - f∞)/k ] [1-e-0.2K] = (10 hr) (0.417 cm/hr) + (1.666)/0.2) [1 - e-0.2(10)] = 4.17 + 8.33 (1-e-2) = 5.6 cm
Total infiltrated water: (100,000)2 (5.6 cm x 0.01 m/cm) = 560x106 m3
HW No. 5:
PROBLEM 1:The following is the discharge rates resulting from 2 - hr unit hydrograph:
Time (hr): 0 2 4 6 8 10 12Q (cfs): 0 100 250 200 100 50 0
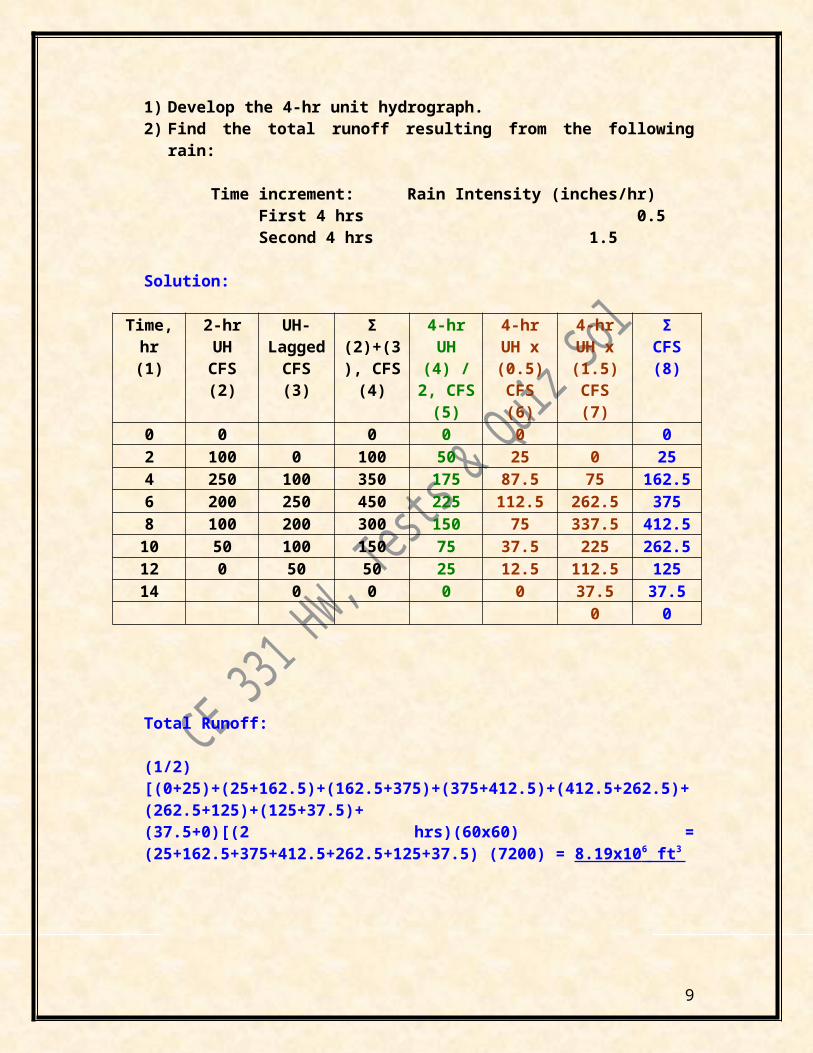
1) Develop the 4-hr unit hydrograph.2) Find the total runoff resulting from the following rain: Time increment: Rain Intensity (inches/hr) First 4 hrs 0.5 Second 4 hrs 1.5
Solution:
Time, hr(1)
2-hr UHCFS(2)
UH-Lagged
CFS(3)
Σ(2)+(3),
CFS(4)
4-hr UH (4) / 2, CFS(5)
4-hr UH x (0.5)CFS(6)
4-hr UH x (1.5)CFS(7)
ΣCFS(8)
0 0 0 0 0 02 100 0 100 50 25 0 254 250 100 350 175 87.5 75 162.56 200 250 450 225 112.5 262.5 3758 100 200 300 150 75 337.5 412.5
10 50 100 150 75 37.5 225 262.512 0 50 50 25 12.5 112.5 12514 0 0 0 0 37.5 37.5
0 0
7
Total Runoff: (1/2) [(0+25)+(25+162.5)+(162.5+375)+(375+412.5)+(412.5+262.5)+(262.5+125)+(125+37.5)+(37.5+0)[(2 hrs)(60x60) = (25+162.5+375+412.5+262.5+125+37.5) (7200) = 8.19x10 6 ft 3
Total Runoff: (1/2) [(0+25)+(25+162.5)+(162.5+375)+(375+412.5)+(412.5+262.5)+(262.5+125)+(125+37.5)+(37.5+0)[(2 hrs)(60x60) = (25+162.5+375+412.5+262.5+125+37.5) (7200) = 8.19x10 6 ft 3
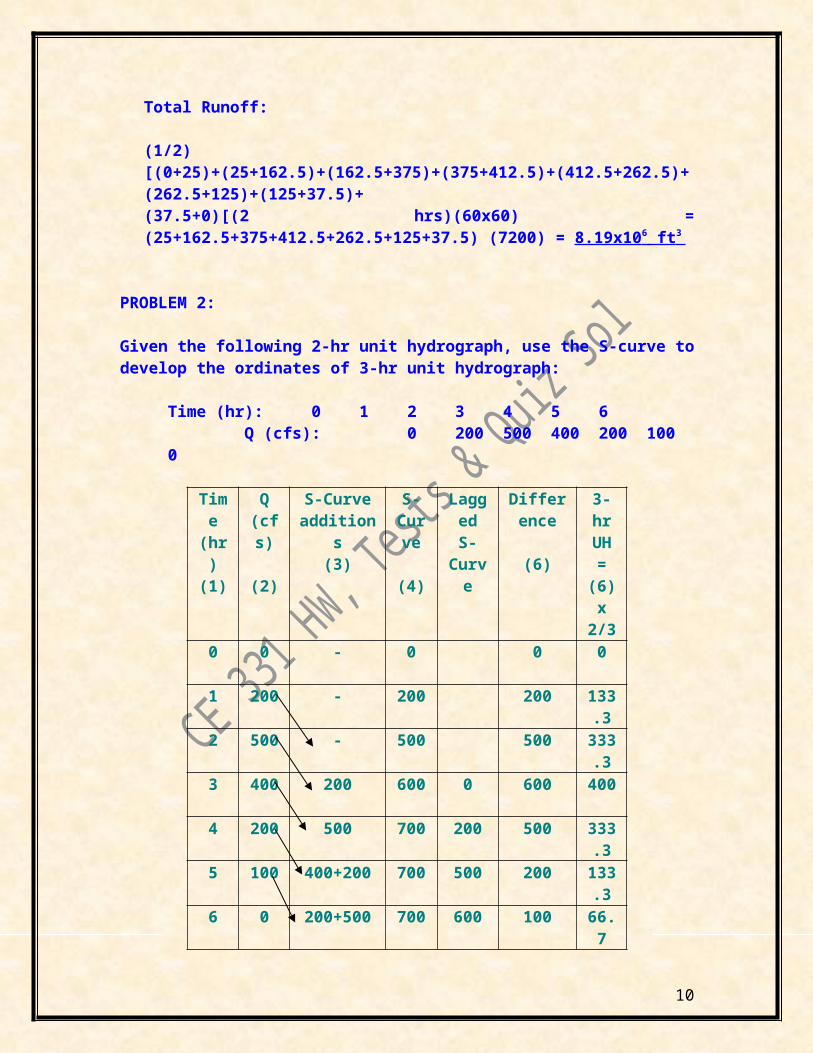
PROBLEM 2:
Given the following 2-hr unit hydrograph, use the S-curve to develop the ordinates of 3-hr unit hydrograph:
Time (hr): 0 1 2 3 4 5 6 Q (cfs): 0 200 500 400 200 100 0
Time (hr)(1)
Q (cfs)
(2)
S-Curve additions
(3)
S-Curve
(4)
Lagged S-
Curve
Difference
(6)
3-hr UH =(6) x 2/3
0 0 - 0 0 0
1 200 - 200 200 133.3
2 500 - 500 500 333.3
3 400 200 600 0 600 400
4 200 500 700 200 500 333.3
5 100 400+200 700 500 200 133.3
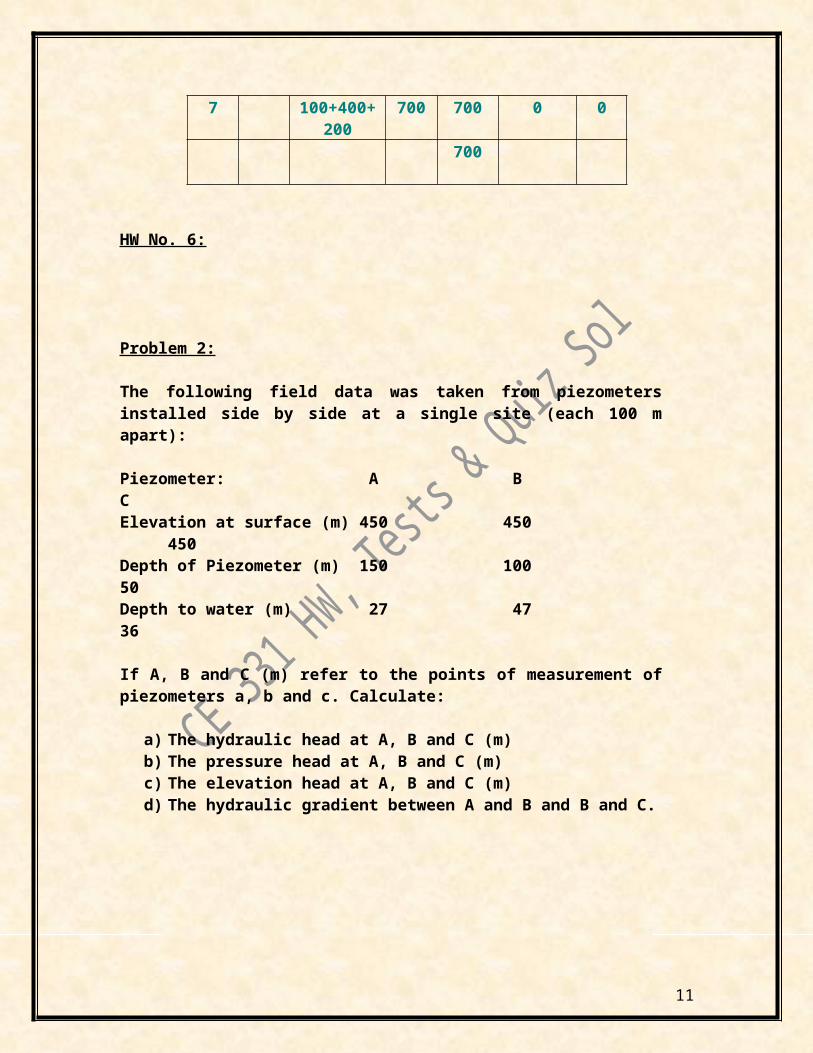
6 0 200+500 700 600 100 66.7
7 100+400+200
700 700 0 0
700
HW No. 6:
8
Problem 2:
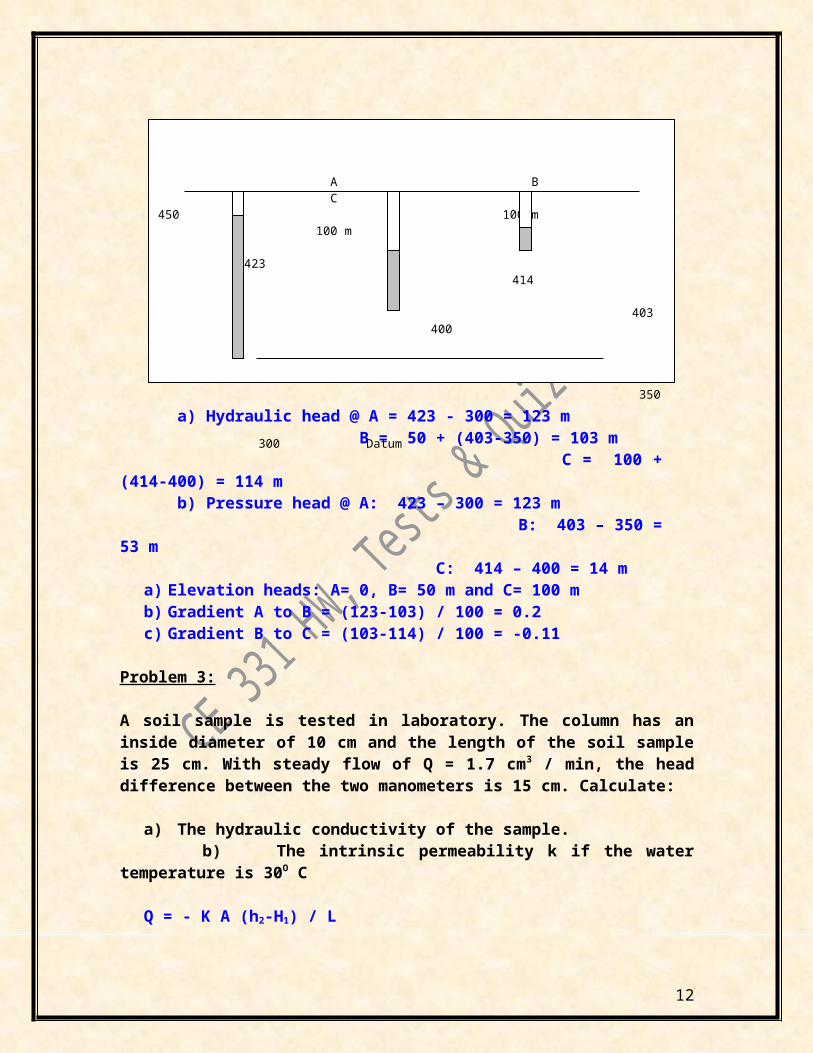
The following field data was taken from piezometers installed side by side at a single site (each 100 m apart):
Piezometer: A B CElevation at surface (m) 450 450 450 Depth of Piezometer (m) 150 100 50Depth to water (m) 27 47 36
If A, B and C (m) refer to the points of measurement of piezometers a, b and c. Calculate:
a) The hydraulic head at A, B and C (m)b) The pressure head at A, B and C (m)c) The elevation head at A, B and C (m)d) The hydraulic gradient between A and B and B and C.
a) Hydraulic head @ A = 423 - 300 = 123 m B = 50 + (403-350) = 103 m
C = 100 + (414-400) = 114 m b) Pressure head @ A: 423 – 300 = 123 m B: 403 – 350 = 53 m
C: 414 – 400 = 14 ma) Elevation heads: A= 0, B= 50 m and C= 100 mb) Gradient A to B = (123-103) / 100 = 0.2c) Gradient B to C = (103-114) / 100 = -0.11
Problem 3:
A B C450 100 m 100 m
423 414
403 400
350
300 Datum
9
A soil sample is tested in laboratory. The column has an inside diameter of 10 cm and the length of the soil sample is 25 cm. With steady flow of Q = 1.7 cm3 / min, the head difference between the two manometers is 15 cm. Calculate:
a) The hydraulic conductivity of the sample. b) The intrinsic permeability k if the water temperature is 30O C
Q = - K A (h2-H1) / L
K = - Q L / A ∆H = - (1.7) (25) / [(π)(52) (-15) = 0.036 cm/min
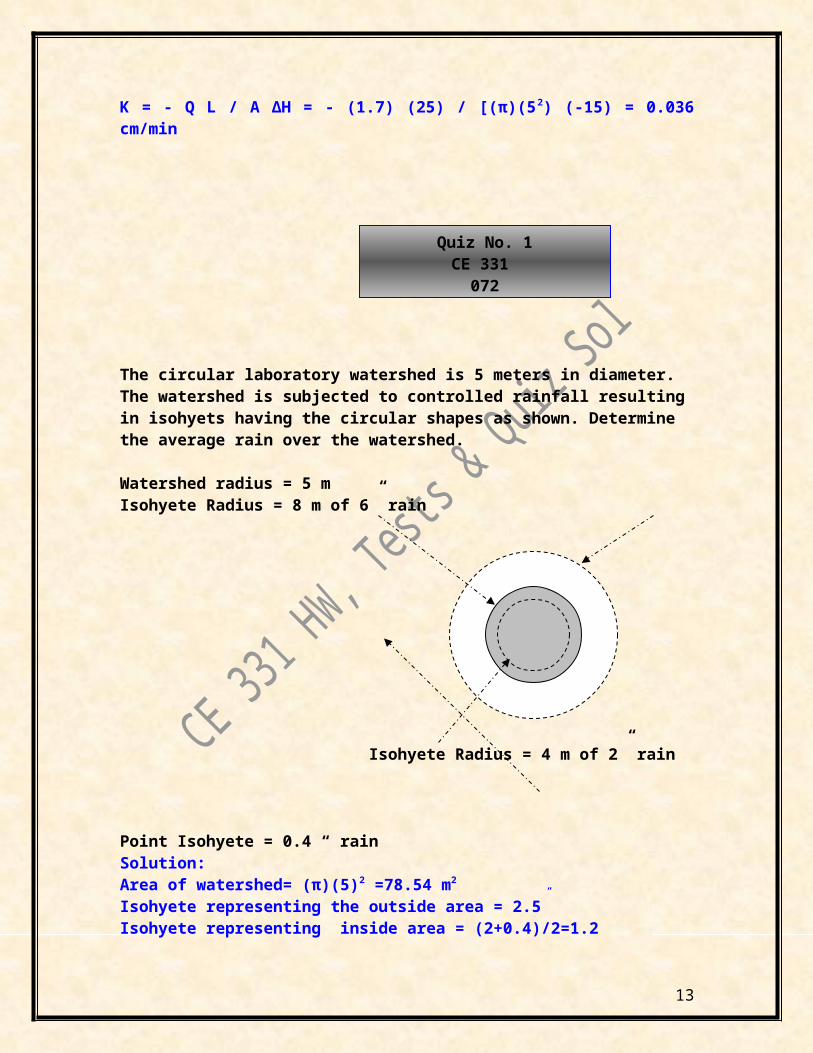
The circular laboratory watershed is 5 meters in diameter. The watershed is subjected to controlled rainfall resulting in isohyets having the circular shapes as shown. Determine the average rain over the watershed.
Watershed radius = 5 m Isohyete Radius = 8 m of 6” rain
Isohyete Radius = 4 m of 2” rain
Point Isohyete = 0.4 “ rainSolution:Area of watershed= (π)(5)2 =78.54 m2
Isohyete representing the outside area = 2.5”
Isohyete representing inside area = (2+0.4)/2=1.2Inside area = (π)(4)2 = 50.265 m2
Outside area = 78.54-50.265=28.275 m2
Quiz No. 1CE 331
072
10
Precipitation Area PPT x AreaOutside area 2.5 28.275 70.686Inside area 1.2 50.265 60.318
Σ78.54 Σ131.004
Average PPt = 131.004/78.54
A lake received 0.2 inches of rainfall after 24 hours of the storm. Estimate the evaporation from the lake in inches if the amount of water required to refill a nearby class A pan after the same period is 0.9 inches.
Solution:
Total Evaporation = (0.2+0.9) (0.7) = 0.77 in
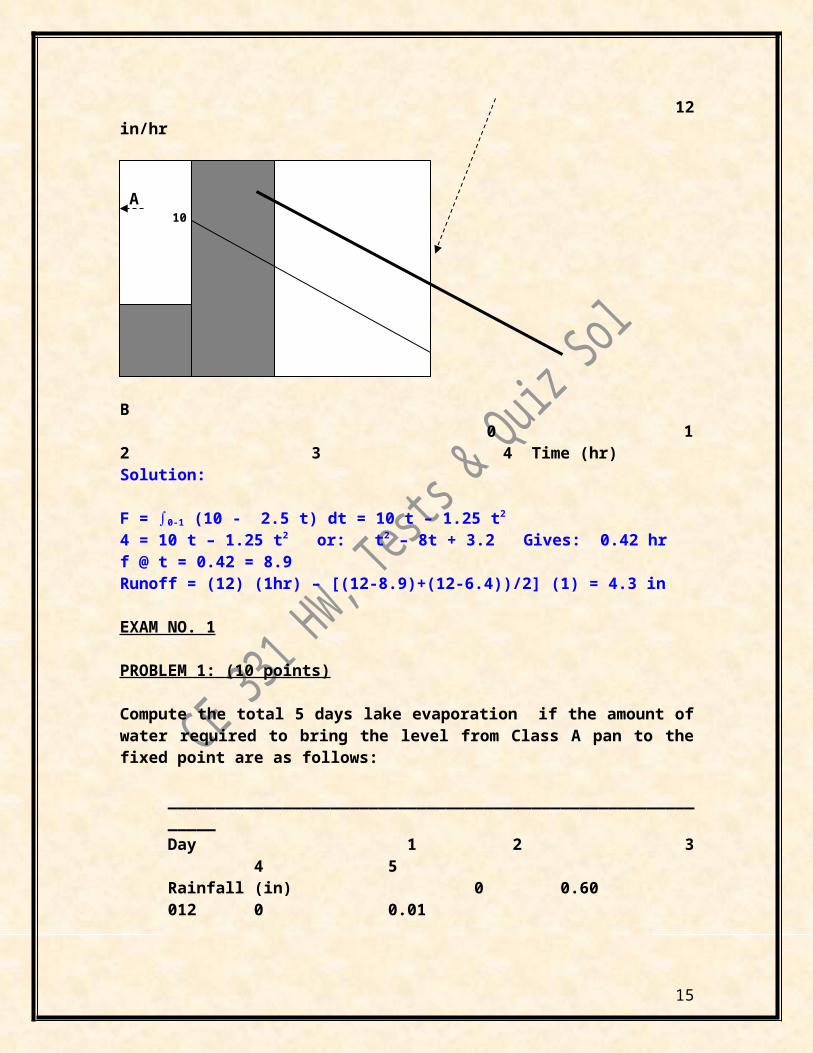
Assume line AB to represent the potential infiltration capacity curve for a given watershed. Determine the excess rain at the end the second hour of the storm period shown.
Simplified Horton Curve f = 10 - 2.5 t 12 in/hr
B 0 1 2 3 4 Time (hr)Solution:
Quiz No. 2CE 331
072
Quiz No. 3CE 331
072
A 10 in/hr 8.9 7.5 6.4 4 in/hr 5
11
F = ∫0-1 (10 - 2.5 t) dt = 10 t – 1.25 t2
4 = 10 t – 1.25 t2 or: t2 – 8t + 3.2 Gives: 0.42 hrf @ t = 0.42 = 8.9Runoff = (12) (1hr) – [(12-8.9)+(12-6.4))/2] (1) = 4.3 in
EXAM NO. 1
PROBLEM 1: (10 points)
Compute the total 5 days lake evaporation if the amount of water required to bring the level from Class A pan to the fixed point are as follows:
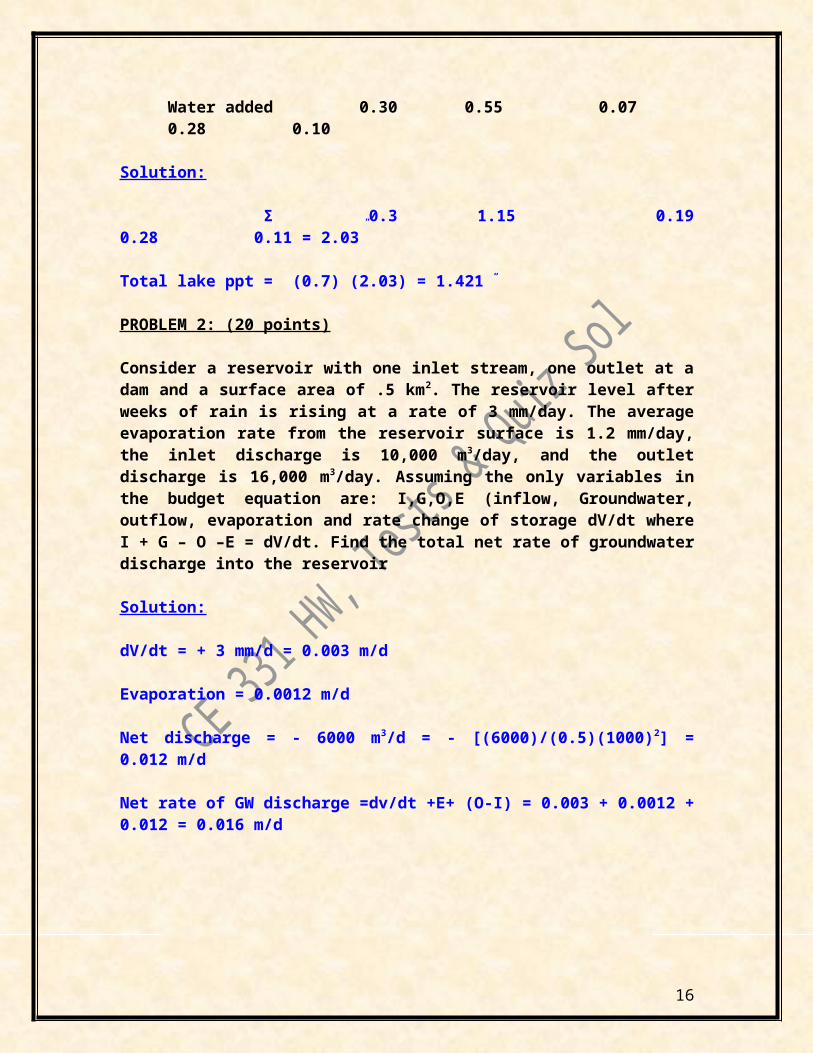
____________________________________________________________Day 1 2 3 4 5 Rainfall (in) 0 0.60 012 0 0.01Water added 0.30 0.55 0.07 0.28 0.10
Solution:
Σ 0.3 1.15 0.19 0.28 0.11 = 2.03”
Total lake ppt = (0.7) (2.03) = 1.421 “
PROBLEM 2: (20 points)
Consider a reservoir with one inlet stream, one outlet at a dam and a surface area of .5 km 2. The reservoir level after weeks of rain is rising at a rate of 3 mm/day. The average evaporation rate from the reservoir surface is 1.2 mm/day, the inlet discharge is 10,000 m3/day, and the outlet discharge is 16,000 m3/day. Assuming the only variables in the budget equation are: I,G,O,E (inflow, Groundwater, outflow, evaporation and rate change of storage dV/dt where I + G – O –E = dV/dt. Find the total net rate of groundwater discharge into the reservoir
Solution:
dV/dt = + 3 mm/d = 0.003 m/d
Evaporation = 0.0012 m/d
Net discharge = - 6000 m3/d = - [(6000)/(0.5)(1000)2] = 0.012 m/d
Net rate of GW discharge =dv/dt +E+ (O-I) = 0.003 + 0.0012 + 0.012 = 0.016 m/d
12
PROBLEM 3: (30 points)
Assume line AB to represent the potential infiltration capacity curve for a given watershed. Determine the excess rain at the end the third hour of the storm period shown.
Simplified Horton Curve f = 10 - 2.5 t 12 in/hr
B 0 1 2 3 4 Time (hr)
Solution:
F = ∫0-1 (10 - 2.5 t) dt = 10 t – 1.25 t2
4 = 10 t – 1.25 t2 or: t2 – 8t + 3.2 Gives: 0.42 hrf @ t = 0.42 = 8.95
Point C = 6.45
Point D = 3.95
Total Runoff = { [(18-8.95) + (18-6.45)]/2} (1 hr) – {[(6.45-2.5)+(3.95-2.5)/2} (1 hr) = 7.6 in
A 10 in/hr 8.95 7.5 C 6.45 4 ( in/hr)
D 3.95 2 .5 (In/hr) 2.5
13
PROBLEM 4: (30 points)
Given the following straight line approximation of infiltration capacity curve and a rain pattern lasting 4 hours. Determine:
a) The total runoff in cmb) If the total volume of runoff produced by the storm is 110,000 m3 what is the area of
the watershed in km2?
0 1 2 3 (time hr)
Solution:
Total Runoff = A – B + C + D = 0.05 – 0.025 + 0.125 + 0.075 = 0.225 cm or 0.00225 m
Area = 110000/0.00225 = 49,000,000 m2 = 49 km2
EXAM No.2
0.2 cm/hr
0.175 cm/hr
A C
B 0.1 cm/hr D
0.05 cm/hr
14
Problem 1: (60 Points)
Figure below shows a hydrograph from 2 – hr storm. The area of the watershed is 1.0 mi2.
a) Construct a unit hydrograph using straight line separation technique.b) Find the ordinates of 4-hr unit hydrograph.c) Find the ordinates of a 4-hr hydrograph representing the rain pattern shown in the right.
1 mile = 5280 ft
D.R.O = 1.3”
tQ BF Q-BF 2-hr
UHLAG Σ 4-hr
UHX1/2
4-hr hydr=X0.8
0 50 50 0 0 0 0 01 170 50 120 92.3 92.3 46.15 36.922 300 50 250 192.3 0 192.3 96.15 76.923 250 50 200 153.8 92.3 246.1 123.1 98.44 200 50 150 115.4 192.3 307.7 153.8 1235 150 50 100 76.9 153.8 230.7 115.35 92.286 100 50 50 38.5 115.4 153.9 76.95 61.567 50 50 0 0 76.9 76.9 38.45 30.768 0 38.5 38.5 19.25 15.49 0 0 0 010
Prob. 2: (30 Points)
The actual discharge rates for a flood hydrograph is shown below. The area of the drainage basin is 3.10 mi2. The rainstorm started at 9 A.M. and ended at 11 A.M.. The base flow is constant at 100 cfs. The volume of direct runoff is 3,600,000 ft3.
Time: 8 AM 9 10 11 12 1 PM 2 3
0 1 2 3 4 5 6 7 8 9
Intensity: 0.8”/ hr
t ( hr)
2 hr effective rain
NO SCALE!
NO SCALE!
400
300Qcfs200
100
4 time (hr)
15
Q: 100 100 300 600 400 200 100 100
a) At what time did the direct surface runoff begin?b) Determine the net rain in inches.c) What is the time of concentration of the basin?d) What is the time base of hydrograph?
6005004003002001000 8 9 10 11 12 1 PM 2 3
8 AM 100 09 100 0 RO Started 9 AM
10 100 20011 100 500 Peak12 100 300
1 PM 100 1002 0 RO Ends34
a) DRO Began = 9 AMb) Net Rain= ½ [ 200+500+300+100] (3600)/(3.1 mi2 x 52802)[12)=0.275 inchesc) Time of concentration = 3 hrsd) Time base = 2+3=5
16