Embed Size (px)
Citation preview

32
Supporting Information
Figure 1. COMSOL fluid dynamic simulation result comparison of microfluidic chambers with and without internal structures. Velocity profile of microfluidic chamber with no internal structures (a) and microfluidic chamber with internal structures (c). Streamline and particle tracking inside microfluidic chamber with no internal structures (b) show particle remaining in the center of the chamber and microfluidic chamber with internal structures (d) particle dispersing.
Electronic Supplementary Material (ESI) for Lab on a ChipThis journal is © The Royal Society of Chemistry 2012
33
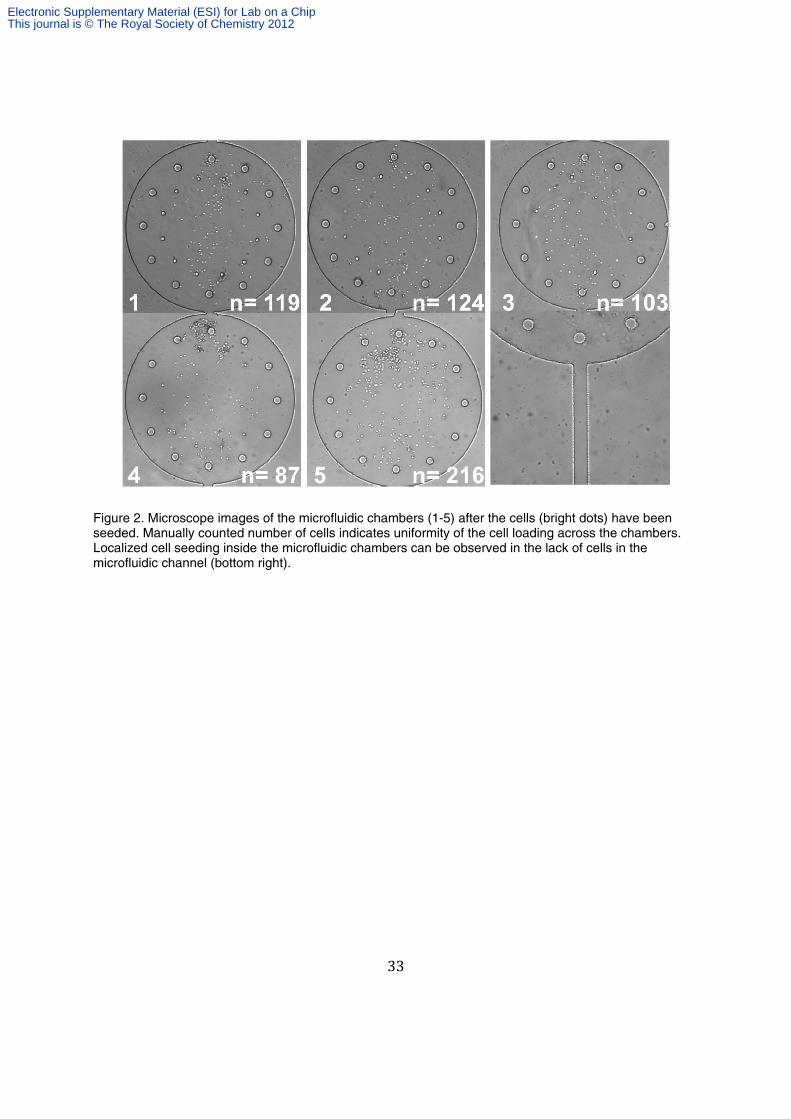
Figure 2. Microscope images of the microfluidic chambers (1-5) after the cells (bright dots) have been seeded. Manually counted number of cells indicates uniformity of the cell loading across the chambers. Localized cell seeding inside the microfluidic chambers can be observed in the lack of cells in the microfluidic channel (bottom right).
Electronic Supplementary Material (ESI) for Lab on a ChipThis journal is © The Royal Society of Chemistry 2012

34
Figure 3. Visualization of the microfluidic channels connecting two microfluidic chambers. Localization of cells inside the microfluidic chambers can be observed with minimal or no cells in the microfluidic channels (a, b).
Figure 4. Time-elapsed images of passive flow of fluorescent solution into the microfluidic chambers. Chamber 1 is the chamber closest to the source of the fluorescent solution (top) and chamber 5 is the chamber farthest from the source of the fluorescent solution (bottom).
Figure 5. Comparison of the mean intensity levels ± S.D. between chamber 1 (red triangles), the chamber closest to the source of fluorescent solution, and chamber 5 (black circles), the chamber farthest from the source of fluorescent solution.
Electronic Supplementary Material (ESI) for Lab on a ChipThis journal is © The Royal Society of Chemistry 2012