Embed Size (px)
Citation preview

Session 3: Impact of the Great Recession on the Well-Being of Households I
Time: Tuesday, August 7, 2012 AM
Paper Prepared for the 32nd General Conference of
The International Association for Research in Income and Wealth
Boston, USA, August 5-11, 2012
Welfare Compensation for Unemployment in the Great Recession
Marina Fernandez Salgado, Francesco Figari, Holly Sutherland and Alberto Tumino
For additional information please contact:
Name: Francesco Figari
Affiliation: University of Insubria and ISER University of Essex
Email Address: [email protected]
This paper is posted on the following website: http://www.iariw.org
2
Welfare compensation for unemployment in the Great Recession1
Marina Fernandez Salgado
University of Essex
Francesco Figari
University of Insubria and ISER University of Essex
Holly Sutherland, Alberto Tumino
ISER University of Essex
March 2012
Abstract: This paper analyses the extent to which tax-benefit systems provide an automatic
stabilisation of income for those who became unemployed at the onset of the Great
Recession. The focus of the analysis is on the compensation for earnings lost due to
unemployment which is channelled through the welfare systems to this group of people who
are clearly vulnerable to the recession’s adverse effects. In order to assess the impact of
unemployment on household income, counterfactual scenarios are simulated by using
EUROMOD, the EU-wide microsimulation model, integrated with information from the EU-
LFS data. This paper provides evidence on the differing degrees of relative and absolute
resilience of the household incomes of the new unemployed. These arise from the variations
in the protection offered by the national tax-benefit systems, depending on entitlement or not
to Unemployment Benefits, and from the personal and household circumstances of those
most recently at risk of unemployment in the countries considered.
Keywords: unemployment, European Union, household income, microsimulation.
JEL Codes: C81, H55, I3
1 We would like to thank Lars Osberg, Canal Smith and participants at the IARIW-OECD Conference on
Economic Insecurity: Measurement, Causes, and Policy Implications (Paris, November 2011) for their
suggestions and comments on a previous version of the paper. We are also indebted to all past and current
members of the EUROMOD consortium. The version of EUROMOD used here (F4.23) is in the process of
being extended, and updated, financed by the Directorate General for Employment, Social Affairs and Equal
Opportunities of the European Commission [Progress grant no. VS/2008/0318]. We make use of microdata from
the EU Labour Force Survey (EU-LFS) made available by Eurostat under contract LFS/2011/24, the EU
Statistics on Incomes and Living Conditions (EU-SILC) made available by Eurostat under contract EU-
SILC/2009/17, the Italian version of the EU-SILC (IT-SILC XUDB 2007 – version April 2009) made available
by ISTAT, the Estonian version of the EU-SILC 2007, the Belgian version of the EU-SILC 2007 and the Family
Resources Survey (FRS), made available by the UK Department of Work and Pensions (DWP) through the UK
Data Archive. Material from the FRS is Crown Copyright and is used with permission. Neither the DWP nor the
Data Archive bears any responsibility for the analysis or interpretation of the data reported here. An equivalent
disclaimer applies to all other data sources and their respective providers cited in this acknowledgement.

3
1. Introduction
The financial crisis of 2008 has lead to the most serious economic downturn since the Second
World War. The European economies shrank by 5.2% between the second quarter of 2008
and the same quarter of 2009. Because of the size of such an economic slowdown, originated
in the United States and then propagated to the rest of the world, many refer to this period as
the Great Recession (Arpaia and Curci, 2010).
Although the EU unemployment rate increased only to a limited extent (from 6.9% in the
second quarter of 2008 to 8.9% in the same quarter of 2009) when compared to the
contraction in GDP, the impact of the Great Recession on labour markets has, since then,
been intense and its effects seem likely to last longer than the time taken for GDP to recover.
Despite recent signs of economic recovery, projections suggest that the unemployment rate in
the European Union will stay above 7% until the end of 2012, a level considerably higher
than the pre-crisis rate (OECD, 2011b). Moreover, the number of long term unemployed,
defined as those in unemployment longer than one year, increased by nearly 10% between the
second quarter of 2008 and the same quarter of 2009, reaching 6.7 million people. Over the
following year long-term unemployment increased by an extra third, reaching 9 million in the
second quarter of 2010. Even if the long term unemployment rate seems to stabilise later on,
the proportion of those who lost their job at the onset of the Great Recession who stay long in
unemployment has continued to rise. Therefore, long term unemployment and its
consequences on individual well being will be a challenge for the near future (European
Commission, 2010).
The picture described above, as well as the lessons of previous recessions, suggest that the
Great Recession will overshadow European economies for years to come, through legacies
such as unemployment and public debt (Keeley and Love, 2010), and with long-lasting
impacts on household incomes (Jenkins et al., 2011).
The effects of the Great Recession have varied across EU countries with a decrease in GDP
ranging from around 2% in Continental Europe, to 5% in Southern Europe and the UK and
more than 15% in Estonia and the other Baltic states (European Commission, 2010).
Moreover, there has been a high degree of heterogeneity in the response of labour markets to
the negative shocks in GDP (OECD, 2010). Some countries (i.e. the Baltic States, Ireland,
and above all Spain) experienced a large increase in unemployment relative to the fall in
GDP. For others (i.e. Belgium, Italy, the UK, and above all Germany) the opposite has been
the case. It is clear that the elasticity of employment to GDP decline is hugely differentiated
across countries due to i) specific employment policies which mitigated the effects of the
crisis on the overall employment (e.g. internal flexibility through short-time working
arrangements, temporary partial unemployment and temporary closures) as opposed to the
relatively high share of workers in temporary contracts who have been relatively easily
dismissed, ii) a different timing effect due to the productive structure of the country (with
national economies depending to a larger extent on the construction sector affected more
immediately) and iii) other symptoms of the recession such as a decline in overall labour
productivity, a reduction in earnings or increased rates of early retirement (European
Commission, 2010).
Nevertheless, unemployment is one of the most important consequences of the Great
Recession (Keeley and Love, 2010), at least in terms of direct impact on the economic well-
being of individuals who lose their job, as well as that of their families.

4
The aim of this paper is to understand, in a cross-country perspective, the extent to which tax-
benefit systems provide an automatic income stabilisation for those who became unemployed
at the onset of the Great Recession. In doing so we restrict our attention to one of the primary
channels of propagation of adverse effects of recession onto the living standards of the most
vulnerable: the loss of a job. We refrain from considering other aspects such as a reduction in
hours worked for those with a job or a contraction in the hourly wage for those with flexible
contracts. The consequences of the crisis on the most vulnerable individuals depend on their
individual characteristics and the interaction between their labour market participation, their
living arrangements and the capacity of the tax and benefit systems to absorb macro-
economic shocks.
Dolls et al. (2012) show that the automatic stabilizers differ greatly across countries in
particular in the case of asymmetric unemployment shocks, assuming that those already in
unemployment (who may have already exhausted their Unemployment Benefits) can be
representative of the individuals who lose their job. We attempt to characterise in a more
precise way those who became unemployed at the onset of the Great Recession (Jenkins et
al., 2011) and analyse the effectiveness of the tax-benefit systems in cushioning the income
loss in the short and long term.
Lack of longitudinal up-to-date information on household income and labour market
circumstances, usually available only few years after the beginning of the unemployment
spell and in a restricted number of countries, constrains the possibilities for empirical
analysis. To address this limitation, we assess the impact of the unemployment on household
income by means of simulating counterfactual scenarios by using a fiscal microsimulation
approach (Bourguignon and Spadaro, 2006) which allows us to estimate the household
incomes of individuals who lose their job, considering the direct cushioning effect of the tax-
benefit systems and the way they depend on the remaining household market income and
personal/household characteristics. The use of tax-benefit microsimulation models to
consider how the welfare systems protect people from an extreme shock has become known
as “stress test” of the tax-benefit system (Atkinson, 2009) and increasingly applied to analyse
the consequences of the Great Recession (Figari et al., 2011; Jenkins et al., 2011).
We highlight the main motivations to exploit such an approach in section 2. In section 3 we
introduce EUROMOD, the EU-wide tax-benefit model, used in the analysis to derive
disposable income in the counterfactual scenarios. Moreover, we present the statistical
matching procedure used to identify those who became unemployed using information from
the EU Labour Force Survey, which covers the transitions to unemployment between 2008
and 2009. Finally, we describe the indicators we apply to capture the resilience of the welfare
system in both relative and absolute terms.
The paper focuses on a set of six countries of the European Union which allow us to consider
a large variety of circumstances: Belgium, Estonia, Spain, Italy, the Netherlands, and the UK.
These countries experienced different macroeconomic changes during the first phase of Great
Recession, with large unemployment increases in Estonia, Spain and the UK (the latter two
countries accounting for most of the increase in unemployment at EU level between 2008 and
2009) and relatively moderate increases in Belgium, Italy and the Netherlands. Moreover,
these countries have different unemployment protection schemes (and, generally, welfare
systems), ranging from a flat scheme in the UK to generous earnings related schemes in
Belgium, Spain, and the Netherlands. The most relevant features of the unemployment
protection systems of the countries included in the analysis are described in section 4.
Cross country evidence of the different aspects of the automatic income stabilisation offered
by the tax-benefit systems is presented in section 5, showing the differing degrees to which
5
unemployment has the potential to reduce household incomes, and the extent of resilience of
those incomes due to the protection offered by the tax-benefit systems, the household
situation of the unemployed person, and across countries. Section 6 concludes, summarising
the main findings and suggesting some research developments for the future.
2. “Stress testing” the tax-benefit systems: motivations and approach
Why do we need to stress test the tax-benefit systems? And what do we mean exactly by a
stress test?
In a period of economic downturn, with direct consequences for the labour market
participation of individuals, coupled with necessary fiscal consolidation in most European
countries, it is necessary to understand how contemporary tax-benefit systems react to
changes in individual circumstances. And, more importantly, it is necessary to assess the
extent to which household incomes are protected by the tax-benefit systems.
The stress test approach is common in financial institutions to test the sensitivity of a
portfolio to a set of extreme but plausible shocks and to assess the significance of the
system’s vulnerabilities (Jones et al., 2004). Atkinson (2009) has suggested to extend the
same approach to the tax-benefit systems in order to predict the cushioning effects of the
social protection schemes in the event of a loss of market incomes and to assess the overall
income stabilisation after a macroeconomic shock.
By using a fiscal microsimulation approach which combines detailed survey data on market
incomes and household characteristics and tax-benefit rules (Bourguignon and Spadaro,
2006), we can determine the different components of household disposable income under
different counterfactual scenarios in which, as a consequence of a macro-economic shock, we
assume that a given number of individuals lose their job. Microsimulation models are
valuable tools to determine the distributional effects of changing household characteristics
and labour market participation. A more systematic use in disentangling the consequences of
the Great Recession is particularly appropriate (Jenkins et al., 2011).
The simulated household disposable income of the individuals depends on the cushioning
effect of contributory and means-tested benefits for the unemployed (if entitled), the effects
of other means-tested benefits and tax credits designed to protect families on low income, and
on other household incomes, in the form of earnings of those still in work as well as pensions
and benefits, received by other household members. The outcomes depend on whether the
unemployed person is entitled to Unemployment Benefit or not, and will vary in the short
term and in the longer term when entitlement to Unemployment Benefit is typically
exhausted. In order to assess the robustness of our measures of the resilience of the welfare
systems we consider different scenarios in these respects.
By using a tax-benefit model which is based on micro data representative of the national
population, the stress test exercise uses as a benchmark the real income distribution observed
at a given time. Moreover, the pattern of income changes depends on the presence of other
incomes, the household characteristics, and the interaction between the different tax-benefits
instruments. In doing so our work enriches the perspective offered by model family
calculations (OECD, 2007; 2011b), by characterizing in an informed and detailed way who
became unemployed, considering their household circumstances and their position in the
income distribution.
A stress test exercise can provide evidence of the effects of either a hypothetical macro-
economic shock or a contemporary shock for which survey data covering the period of

6
interest are not yet available. The latter option is the one we follow to assess the variation in
social impact of an increase in unemployment during the Great Recession across countries
and social protection systems. In due course, survey data collected over the period of the
Great Recession will provide evidence of the evolution of the income distribution and
analysis of longitudinal data will show us how incomes changed for those directly affected
due to unemployment (Jenkins et al., 2011). However it is important to assess the social
impact of specific aspects of the crisis and to inform the policy debate in a timely fashion
(OECD, 2011a). Although the EU economy has started to recover there are risks of recession
returning, the labour market has not yet recovered (European Commission, 2010) and it is
necessary to monitor the social impact of the current situation.
Moreover, the stress test approach allows us to focus on a specific aspect of a macroeconomic
shock, highlighting the direct compensation provided by tax-benefit systems rather than that
arising from other adaptive changes in individual behaviours. In this paper we focus
exclusively on the increase in unemployment as one of the channels through which the Great
Recession affects directly individuals’ well-being. As stressed by Jenkins et al. (2011) the
short term consequences of the Great Recession on the inequality of the income distribution
might be negligible, and there could be differential and potentially offsetting effects for
different groups in the population. The social indicators usually used, such as the indicator of
relative poverty, might have serious difficulties in capturing these effects on social exclusion
(Nolan, 2009). The overall effect of the Great Recession on the income distribution is likely
to be affected by general equilibrium consequences and other behavioural responses.
Previous recessions suggest that the evolution in the overall income distribution can hide the
changes in income of particular groups at risk who suffered the direct consequences of the
crisis (Aaberge et al., 2000). However, individuals and households directly affected by
unemployment suffer to a large extent and it is important to assess the extent to which the
welfare system helps to stabilise their income and whether there are specific weaknesses in
the policy instruments in operation.
Even if the living standards lower only for a fraction of the population this is detrimental for
the society in different ways. Not being able to maintain the living standards of the
unemployed reduces consumption and this exacerbates the overall effects of the crisis.
Moreover, when unemployment affects lower income individuals it could be argued that
guaranteeing a reasonable minimum level of resources is necessary.
3. Empirical methodology
3.1. Counterfactual scenarios derived using EUROMOD
We exploit the potential of the microsimulation techniques to define two different
counterfactual scenarios, based on survey data representative of the national population
before the onset of the economic downturn, in which we simulate the transition from
employment to unemployment as observed between 2008 and 2009.
In the first scenario, representing the short term, we analyze the situation of the new
unemployed distinguishing between those entitled and not entitled to receive contributory
Unemployment Benefits. In the second scenario, characterising the effects in the long term,
we assume that eligibility for contributory Unemployment Benefits is exhausted for all new
unemployed. In both scenarios, we compute household disposable income, taking account of
the operation of the whole tax-benefit system, allowing individuals and their households to
receive additional income-tested benefits (e.g. housing benefits, social assistance, in-work

7
benefits and other means-tested support) and to pay reduced income tax and social
contributions given the low level of earnings.
To allow a cross-country perspective, we use EUROMOD, the EU-wide tax-benefit
microsimulation model. EUROMOD simulates tax liabilities (direct tax and social insurance
contributions) and benefit entitlements for the household populations of EU Member States in
a comparable way across countries on the basis of the tax-benefit rules in place and
information available in the underlying datasets. The components of the tax-benefit systems
which are not simulated (e.g. old age pensions) are taken from the data, along with
information on original incomes. See Sutherland (2007) for further information.
Underlying micro data come from the 2007 EU Statistics on Income and Living Conditions
(EU-SILC)2 with the exception of the UK component which is based on the national 2008/09
Family Resources Survey. The analysis in this paper is based on the tax-benefit rules in place
in 2009 (as of June 30th
). Monetary values of non-simulated income components referring to
2006 have been updated to 2009 according to actual changes in prices and incomes over the
relevant period.3 No adjustment is made for changes in population composition between 2007
and 2009.
This analysis does not take account of any non take-up of benefits or tax evasion. However,
given the incidence of the shadow economy in Italy, gross self-employed income has been
calibrated in order to obtain an aggregate amount corresponding to that reported in fiscal data
(Fiorio and D’Amuri, 2006). It is generally assumed, however, that the legal rules are
universally respected and that the costs of compliance are zero. Our results can be interpreted
as measuring the intended effects of the tax-benefit systems.
Household disposable income, after becoming unemployed, is calculated as a monthly
average over a 12 months period assuming the person is unemployed for the number of
months spent in work in the year before the unemployment shock, rather than taking into
account the variation in durations of individual unemployment spells. In this way we can
isolate the overall effectiveness of the tax-benefit systems without needing to consider what
earnings would be on re-entry into work.
The simulation of the Unemployment Benefits is based on reported earnings, where relevant,
and under assumptions about contributions made in the past derived from the limited
information available in the data.
3.2. Matching the new unemployed from Labour Force Surveys
The analysis focuses on employed and self-employed individuals who lost their job at the
onset of the Great Recession. We identify the individuals who are unemployed in the year
2009 but employed in the previous year (thereafter we refer to them as “new unemployed”)
using the retrospective information included in the EU Labour Force Survey (EU-LFS). The
EU-LFS is a continuous household survey conducted on a representative sample of
individuals (between 0.2% and 3.3% of the population) aged 15 and over from all countries
of the European Union, 3 countries of the European Free Trade Association and 3 Candidate
countries. National statistical institutes collect comparable information on current
2 In case of Belgium, Estonia, and Italy the national version of the EU-SILC has been used because it includes
more variables at the necessary level of detail. 3 This process is documented in EUROMOD Country Reports.

8
employment status and characteristics, employment history, and individual and household
characteristics that Eurostat releases on quarterly and annual basis.4
Due to labour market specificities and the channels through which the Great Recession has
impacted on each national economy, the risk of unemployment does not affect all workers
equally. In order to assess correctly the income stabilisation offered by the welfare systems to
the new unemployed it is necessary to identify them precisely, taking into account the most
important characteristics associated with the transition into unemployment.
The individuals currently employed in the EUROMOD underlying microdata are those
potentially at risk of becoming unemployed. In order match the observations in the EU-LFS
data and EUROMOD data, we perform a Coarsened Exact Matching procedure (Iacus et al.,
2011) based on individual characteristics (gender, age, education level), previous job
characteristics (self employment, sector of activity) and household characteristics (number of
adults, presence of children, number of earners, presence of other new unemployed in the
same household).
The basic idea of the Coarsened Exact Matching is to i) coarsen each observed characteristic
into meaningful groups, ii) apply exact matching to the coarsened data which involves sorting
the observations into strata and then iii) retain the original value of the observed
characteristic.5 Such a matching method resembles the exact matching without restricting the
match only to units with exactly the same observed values. The Coarsened Exact Matching
procedure weights the matched observations of the control group in the EUROMOD input
data according to the size of their strata and the survey weights from the EU-LFS data. The
matching is also performed when the number of treated and control observations are different
within strata, exploiting to the maximum extent the observations available in the EUROMOD
input data. The use of the Coarsened Exact Matching procedure allows us to reduce the
multidimensional imbalance in the observed characteristics between treated and control units.
It guarantees the same multivariate empirical distribution of the individual coarsened
characteristics which is essential for the subsequent analysis of the resilience of the welfare
state given that eligibility for Unemployment Benefits depends on most of these
characteristics (e.g. age, self employment status, and household characteristics) jointly
considered.6
We apply the Coarsened Exact Matching procedure in a sequential way. In the first step, we
only consider one new unemployed individual per household and we match the observations
in the treated and control data. In the second step, we match the second unemployed
individual per household (if there is one) on the sub-sample of households in the control data
which contains one unit already matched in the first step. Such a procedure allows us to
identify the same proportion of households with more than one new unemployed member in
the final EUROMOD dataset as observed in the EU-LFS data.
4For more information refer to the EU-LFS webpage
http://epp.eurostat.ec.europa.eu/portal/page/portal/microdata/lfs 5
In order to narrow the matching to the treated observations (in EU-LFS data) for which control units (in
EUROMOD data) have been properly identified, we discard strata with only treated units. Given the choice of
the characteristics on which the matching is based, their number is small, ranging across countries between 1%
and 7% of the original observations, at the cost of higher overall imbalance. 6 Iacus et al. (2011) proposed a comprehensive measure of global imbalance (L1) which must be used as a point
of comparison between the matching solution and the baseline unmatched data, showing that a good matching
reduces the overall L1. In our case, the statistic L1 reduces by around 7% in BE, IT, NL, and the UK, 10% in ES
and 19% in EE which is satisfactory given the quite restrictive choice of characteristics on which the matching
is based and the relatively small numbers of treated observation discarded.

9
The marginal distributions of the characteristics of the new unemployed identified in
EUROMOD data as a result of the statistical matching procedure are reported in Table 1. A t-
test for equality of means in the control and in the treated group is carried out and it fails to
reject the null hypothesis for most of the observed characteristics included in the matching.
The new unemployed are predominantly male (in particular in the UK where 68% of the new
unemployed are men). On the one hand, in Belgium, Spain, the Netherland, and the UK they
are younger than in other countries; on the other hand in Belgium, Spain and Italy those
closer to the retirement age are less affected by unemployment. Among the new unemployed,
the majority has a low level of education in Spain and the UK, while more than one quarter
has received tertiary education in Belgium, Estonia and the Netherlands. Across countries,
the large majority of new unemployed are employees (with a notable share of self-employed
in Italy) and working in the service sector (with the exception of Estonia).
The remainder of Table 1 reports some household characteristics of the new unemployed:
most of them come from non-single households (in particular in Estonia, Spain and Italy) and
about 40% of them have at least one child in their household. The new unemployed come
from households where there are two or more earners in 70% of the cases in Estonia and
Spain, 60% in Italy, the Netherlands and the UK and only 50% in Belgium. Moreover
approximately 15% of the new unemployed in Estonia and Spain come from households with
more than one such person, with lower shares in the other countries.
<TABLE 1 AROUND HERE>
Table 2 reports additional income information on the new unemployed derived from
EUROMOD data given that such information is not available in the EU-LFS database. The
distribution of the new unemployed by household income quintile groups (assessed before the
unemployment) shows an inverted U-shape in Belgium, Estonia, Spain and Italy while in the
Netherlands and the UK the new unemployed come predominantly from the middle and the
upper part of the income distribution.
<TABLE 2 AROUND HERE>
3.3. Income stabilisation indicators
Our analysis of the automatic income stabilisation effect across European countries focuses
on both relative and absolute resilience provided by the welfare state, taking into account the
interactions of the tax-benefit policies with other existing household income and household
composition.
First, in order to assess the level of stabilisation of incomes relative to the pre-shock baseline,
we employ the Net Replacement Rate (Immervoll and O’Donoghue, 2004) which is the ratio
between household disposable income after and before the unemployment shock. It gives an
indication of the extent of the remaining disposable income for those affected by the
unemployment shock:
where Y is Household Disposable income made up of Original Income (which includes any
form of market and private income, and even in the unemployment scenarios may be positive
due to capital incomes, private pensions, inter-household transfers or the earnings of other
household members) plus Benefits, minus Taxes. Income from savings could be seen as

10
another channel of self-insurance but given the poor quality of the underlying data we treat
them as one of the components of Original Income without highlighting their specific role.
In order to analyse the channels through which relative resilience is transmitted, we
decompose the Net Replacement Rate by income source:
where O is the Original Income, B is the sum of Benefits and T includes Income Taxes and
Social Insurance Contributions paid by employees and the self employed.
Benefits are made of i) Unemployment Benefits (both Insurance and Assistance schemes), ii)
Social Assistance Benefits (including minimum income schemes, housing benefits and
residual social assistance benefits), iii) Family Benefits (including allowances due to the
presence of children in the household and different types of means-tested benefits such as the
Working Tax Credit in the UK) and iv) Pension & Disability Benefits, including contributory
old-age and survivors pensions, early retirement benefits, disability and invalidity benefits.
Moreover, in order to measure the extent of protection offered by public support, we
introduce a new indicator, namely the Compensation Rate which measures the proportion of
net earnings lost due to unemployment, compensated by public transfers net of taxes:
where the difference in the net earnings before and after the shock represents the income lost
due to the unemployment, which is compensated by more generous net benefits. To derive
net measures, taxes are allocated proportionally to each income source.7
This new indicator allows us to isolate the net public support from the effect of other earnings
present in the household of a new unemployed individual, which usually play an important
role in determining the income after the unemployment shock. The compensation rate gives
us a direct indication of the net public contribution as proportion of the net market income
lost due to the unemployment shock. Furthermore, we decompose the compensation rate in
the same way as the Net Replacement Rate to highlight the contribution of each group of
benefits.
In order to test whether the income stabilisation offered by the tax-benefit systems prevents
the new unemployed from falling below an absolute income threshold, we compare the
equivalised disposable income before and after the unemployment shock to the poverty
threshold at 60% of the median in the pre-shock baseline. In this way we distinguish the new
unemployed who are poor already before the unemployment shock (“Poor in work”), those
falling below the threshold as a result of the shock (“At risk”) and those remaining above it in
spite of the shock (“Protected”).
Our approach is equivalent to calculating absolute poverty rates with a fixed poverty line and
resembles the suggested practice in the measurement of poverty during a recession of using a
threshold fixed in real terms (Jenkins et al., 2011). Such an indicator can be considered as an
appropriate proxy for the experience of impoverishment that a newly unemployed person
7 stands for taxes on income other than earnings. Original incomes other than earnings do not change before
and after the unemployment shock and the difference is, hence, zero. This is the reason why they are not
included in the formula.

11
faces, comparing his/her current condition with his/her own status before the unemployment
shock (Matsaganis and Leventi, 2011).
A discussion of the issues related to effects of Unemployment Benefits and their generosity
on employment and a normative judgment of the proper level of protection provided by the
welfare systems is beyond the scope of this paper. In the labour economics literature, there is
a lot of evidence about the disincentive effects of Unemployment Benefits with high
replacement rates (Atkinson and Micklewright, 1991) but also about the positive effects of
Unemployment Benefits on subsequent employment stability (Tatsiramos, 2009).
Furthermore, the trade off between the adequacy and the disincentive effect of
Unemployment Benefits needs to be evaluated considering the minimum levels of living
standards guaranteed by the welfare system as a whole (Boadway and Keen, 2000).
Nevertheless, in an economically efficient system low firing costs, flexible contracts, and
training opportunities are coupled with generous unemployment subsidies (Alesina and
Giavazzi, 2006). Given the policy goal of reducing the numbers of individuals at risk of
poverty, it is implicit that household income of the new unemployed should not fall below the
poverty threshold. Although we do not provide a normative judgement on the level of
protection, our indicators allow us to disentangle the consequences of the Great Recession
faced by those who are suffering from unemployment and are potentially among the
individuals most vulnerable to the effects of the recession.
4. Unemployment protection schemes around Europe
The existence in all European countries of a developed welfare state (Schubert et al., 2009),
that is intended, among other things, to protect people and their families against economic
shocks, is one of the main differences between the crisis faced today and that which occurred
in the 1930s. However, the European countries included in our study have welfare systems
that differ considerably and as a consequence the degree of protection offered to the
unemployed differs (Bertola et al., 2001).
Anglo-Saxon systems, as in the UK, are targeted at low-income individuals and have social
assistance schemes with benefit levels that are generous relative to those for similar benefits
in other countries, but offer low levels of Unemployment Insurance benefits. Conversely,
Scandinavian and Continental systems (Belgium and the Netherlands) have a Bismarkian
tradition of contribution-financed Unemployment Benefits, with social assistance schemes
that operate as a final safety net. In addition, the more recently developed Southern systems
(Italy and Spain) offer generally lower levels of expenditure in social protection and higher
reliance on family support. Spain, however, provides high unemployment and regional social
assistance benefits resembling Continental countries (Bonoli, 1997). Finally, Eastern
European welfare systems differ considerably from one another: Soviet-Union heritage, the
later implementation of a liberal ideology together with Scandinavian influences shape the
Estonian welfare system, where Unemployment Insurance was introduced only in 2003
(Trumm and Ainsaar, 2009).
Generally, individuals that become unemployed might be eligible for Unemployment
Insurance and Unemployment Assistance schemes. In addition, general Social Assistance
schemes might be targeted at low-income individuals or households, guaranteeing a
minimum level of income.
Unemployment insurance is generally an earnings related benefit (except in the UK where it
is a flat rate benefit) based on contribution history. Unemployment assistance complements
the unemployment insurance once it is exhausted or gives economic support to the

12
unemployed that do not meet the requirements of the insurance benefit. Whilst every country
provides Unemployment insurance, Unemployment assistance is not always available.
A description of the singularities of the unemployment protection schemes and Social
Assistance of the countries included in our paper is presented in Table 3. Belgium, Spain and
the Netherlands offer the most generous unemployment insurance and for the longest period
of time (with an initial replacement rate of 60% with no time limit in Belgium and a
replacement rate of 70% in the Netherlands and Spain for a maximum of 24 and 38 months,
respectively). Estonia and Italy8 provide lower replacement rates (between 60% and 40%)
with a time limit of 9 and 8 months, respectively. The UK provides the least generous
Unemployment Insurance scheme (with a flat payment between € 60 and € 76 per week for a
maximum of 6 months). Unemployment insurance schemes are subject to income tax and
social contributions (with the exception of Belgium and the UK) paid mostly by the social
security agency and only a residual part by the unemployed.
Unemployment assistance is an income-based benefit, means tested in the UK and the
Netherlands and provided at a flat rate in Estonia and Spain. Italy and Belgium do not
provide Unemployment assistance. In the Netherlands, it merely acts as a top up to the
Unemployment insurance, providing that the later is lower than the Social Assistance.
Eligibility in Estonia and Spain is dependent on contributions while in the UK no
contributions are required. It is unlimited in the UK (providing the unemployed person is job
seeking) while it has a maximum duration of 18 months in Spain and 9 (or 14 if close to
retirement) in Estonia.
While Unemployment insurance and Unemployment assistance are targeted at the
unemployed, Social Assistance benefits in principle provide a guaranteed minimum level of
income which is independent of employment status (although able bodied working age
people are usually expected to be available for work). Every country except Italy offers
means-tested time-unlimited payments and the amount of the benefit varies considerably
between countries. Social Assistance schemes can act as efficient social shock absorbers so
long as the minimum income guarantee is sufficiently generous. However, a significant
number of individuals are ineligible for Social Assistance and, anyway, a large fraction of
those entitled to it remain at very low levels of income even including Social Assistance
(Figari et al., 2011).
<TABLE 3 AROUND HERE>
The disparities in the unemployment protection systems are also reflected in the different
coverage rate of the Unemployment Benefits, measured as the proportion of new unemployed
entitled to receive Unemployment Benefits. Unfortunately, information on the number of new
benefit recipients is rarely available and not comparable across countries, and further
difficulties in obtaining yearly estimates arise from the duration of both entitlements to
benefits and unemployment spells.9 The only information available in a cross country
perspective is provided by the OECD (2011b) which reports the change in benefit recipients
as a percentage of the change in unemployed individuals between the first year after and the
8
In Italy, wage supplementation schemes (i.e. Cassa Integrazione Guadagni) provide an additional
compensation for reduced hours of work. However, people brought onto wage supplementation schemes do not
count as unemployed in the official statistics and it is not possible to identify them in our data. In the
simulations, we consider only those losing their jobs and not those retaining any wages and reducing hours of
work. 9
The EU-LFS collects information on unemployment office registration but not necessarily on benefit
recipients.

13
year prior the onset of the crisis.10
Belgium, Estonia, the Netherlands and the United
Kingdom show a considerably high proportion of new unemployed receiving Unemployment
Benefits (73%, 76%, 87% and 84%, respectively) while the proportion of new unemployed
receiving Unemployment Benefits is around 52% in Spain and 42% in Italy.11
These figures
highlight the importance of considering the different level of welfare resilience faced by
those entitled and not entitled to Unemployment Benefits, revealing that the lack of coverage
is a gap in the protection system notwithstanding the average degree of protection offered to
those entitled to Unemployment Benefits.
5. Empirical evidence
5.1. Relative resilience
The average Net Replacement Rates, shown in Table 4, are illustrative of the cross country
variation in the relative resilience due to differences in tax-benefit systems, characteristics of
the new unemployed and household composition.
In the short term, the household income of those entitled to Unemployment Benefits on
average falls to as much as 81% of its pre-unemployment level in Belgium and the
corresponding figures are also relatively high in Spain (77%) and the Netherlands (72%). The
average Net Replacement Rate is lower, around 65%, in Estonia and Italy, while in the UK it
is just 57%.
<TABLE 4 AROUND HERE>
However, these averages can obscure differences in the distribution of Net Replacement
Rates which reveal the extent of variation in income replacement across the countries
considered. The kernel density functions presented in Figure 1 illustrate these differences.
Countries with higher Net Replacement Rates (Belgium, Spain and the Netherlands) show
higher concentrations of new unemployed around the mode, in part due to the minimum
payments and upper ceilings of the earnings related Unemployment Benefits. The minimum
payments result in Net Replacement Rates which do not fall below a lower limit (around 30-
40%) but also being larger than 100% in some cases (in particular in Belgium). The
dispersion of the Net Replacement Rates is much larger in Estonia, Italy and in particular in
the UK, with substantial shares of new unemployed facing a very low Net Replacement Rate.
The clear bimodal pattern observed in Estonia, Spain and Italy is due to the concentration of
new unemployed around those modal values depending on whether they live in sole earner
households or not.
<FIGURE 1 AROUND HERE>
In Estonia, Spain, Netherlands and the UK those not entitled to Unemployment Benefits on
average have a higher Net Replacement Rate than those entitled to the benefits (Table 4).
There are two explanations for a higher relative resilience in spite of the lack of receipt of
Unemployment Benefits. First, there is a compositional effect. Those not entitled to the
10
The onset of the crises varies from one country to another. The main drawback of this measure is that it might
not accurately represent the proportion of new unemployed entitled to receive Unemployment Benefits. On the
one hand, the reported change in benefit recipients is lower than the actual number of new benefit recipients if
those who became unemployed before the onset of the crisis exhausted their entitlement to unemployment
benefits. On the other hand, the reported change in the number of unemployed is lower than the actual number
of new unemployed if those unemployed before the onset of the crisis found a job (OECD, 2011b). 11
For comparability reasons and to avoid disparities due to differences in the period covered, Estonian figures
are from the EUROMOD Country Report: Estonia 2006-2009.

14
benefits are less attached to the labour market (being mainly youths and women in couples
with a greater likelihood of short contribution histories) and hence contribute less to the
household income before the unemployment shock. This is confirmed by the greater
importance of original incomes and pensions as a proportion of pre-shock disposable income
(Figure 2). Secondly there is, a compensation effect due to other benefits (as shown by the
greater relevance of Social Assistance and Family Benefits in Figure 2) received by those not
entitled to Unemployment Benefits which compensate at least in part for the loss of earnings.
As expected, this compensation effect is not apparent in Italy due to the lack of income based
safety nets and only partially in Belgium due to the relatively generous level and duration of
Unemployment Benefits.
As expected, in the long term when the entitlement to Unemployment Benefits is exhausted
for all new unemployed, household income falls much more consistently within a range
between 40% (Italy) and 57% (UK) of its pre-unemployment level. Interestingly, in this
scenario the country with the highest Net Replacement Rate is the UK with an average value
equal to that for those entitled to Unemployment Benefits in the short term. The UK Net
Replacement Rate is also highest in the long term for the sub-group of new unemployed who
live in households with no other people with earnings (“Sole earner households” in Table 4).
These are the likely to be among the new unemployed to experience large reductions in
income and low incomes in the long term. In all countries considered the Net Replacement
Rate is lower for this sub-group than for the new unemployed as a whole, strikingly so for
Italy.
In the long term, the Net Replacement Rates show higher dispersion in the countries where a
relevant share of new unemployed are left with very low or null incomes. The kernel density
functions presented in Figure 2 show that this is particularly true in Italy due to the absence
of Social Assistance Benefits and in the Netherlands where the homeowners generally are not
entitled to the Social Assistance.
< FIGURE 2 AROUND HERE>
The protective role played by Original Income (including earnings of other household
members) is illustrated in Figure 3 which shows the Net Replacement Rates by its
components (with Taxes and Contributions reducing the Replacement Rates and hence
appearing with the negative sign). Income from other non work related Benefits (i.e. mainly
pensions and disability benefits) received plays a similar but smaller role. In the short term,
the sum of these two components for those entitled to Unemployment Benefits, before the
deduction of taxes and contributions, makes up around 70% of post-shock household income
in Italy and the UK, 60% in Estonia and the Netherlands, 53% in Spain and around 44% in
Belgium. (figures given by the ratio between each component of the bars in Figure 3 and the
Net Replacement Rate.) These figures are even larger for those not entitled to Unemployment
Benefits and considering the situation of all new unemployed in the long term. From Figure
3, it is clear that a substantial part of the cushioning effect on household income is
attributable to the market incomes of other household members (white bar) and to public
transfers (i.e. mainly pensions, grey bar, in all countries but the UK) which are not primarily
designed as automatic stabilisers or as protective safety nets in case of an unemployment
shock. Moreover, given that earnings of other household members are progressively more
important as household income increases, the average Net Replacement Rates are likely to be
pushed up by the presence of these incomes at the top of the income distribution and this is
only partly compensated by progressive income tax.
When we consider those entitled to Unemployment Benefits, it emerges that these play a
large role in Belgium (63% of post-unemployment household income), the Netherlands

15
(67%) and Spain (55%). In Italy and Estonia they make up around 40% of post-
unemployment household income. In the UK the contributory Unemployment Benefit
contributes to only 11% of the post-unemployment income while Social Assistance makes up
24% of it.
In each of the scenarios Family Benefits play an important role in those countries where they
are relatively generous and, at least partly, income based and hence responsive to the income
shock due to the loss of a job in the household: in Belgium, Estonia, Netherlands and, above
all the UK. In the latter case the Working Tax Credit (included in the “Family Benefits”) has
an important cushioning effect on household income when only one earner is left in the
family who is then entitled to the Credit.
Across countries, with the only exception of Italy where there is no general income support
scheme, Social Assistance on average is a significant top up to incomes for those not entitled
to Unemployment Benefits and for the new unemployed in the long term scenario.
The general lesson of this analysis is that it is necessary to look at the social protection
system as a whole and how it interacts with household composition and incomes received by
other household members. Focusing exclusively on Unemployment Benefits is not sufficient.
<FIGURE 3 AROUND HERE>
In the short term the average net public contribution to the disposable income as proportion
of the net earning lost due to unemployment (Table 5) ranges from 40% in Estonia to 74% in
Belgium for those entitled to Unemployment Benefits and from 2% in Italy to 26% in the UK
for those not entitled. As expected, the average Compensation Rate is usually much lower for
those not entitled to Unemployment Benefits than for those entitled, with two extreme
situations that are of interest. First, the lowest value is achieved in Italy where the
Compensation Rate is close to zero given the absence of general Social Assistance schemes
and the only source of income support being channelled through limited family based tax
concessions, which are inversely related to the income of the main earner. Secondly, the
highest value is observed in the UK where the Compensation Rate for those not entitled to
Unemployment Benefits is very similar to that faced by those entitled to Unemployment
Benefits. This illustrates how the British contributory Unemployment Benefit does not offer
protection that is as generous as in other countries and at the same time, the level of
protection offered by the Social Assistance benefits is on average greater than in other
countries. Such evidence raises the issue whether the tax-benefit system should guarantee a
reasonable minimum level of protection for all potentially unemployed people or
alternatively should ensure the relative income maintenance for a smaller (and generally
higher income) group.12
In the long term, when the new unemployed have exhausted their entitlement to
Unemployment Benefits, the average Compensation Rate is usually very similar to that faced
by those not entitled to Unemployment Benefits in the short term. The main exceptions are
Belgium and Estonia where there are effects due to the composition of the group not entitled
to Unemployment Benefits which act in opposite directions. In Estonia, those not entitled to
Unemployment Benefits are less attached to the labour market and have low household
incomes (confirmed by their high poverty risk when in work as shown in Table 6) and hence
are more likely to be entitled to Social Assistance Benefits than the new unemployed as a
12
It should be noted that the UK system does not guarantee the average level of protection shown by our
results. These assume complete take-up of means-tested benefits (included in Social Assistance and Family
Benefits) and hence show all systems in their most optimistic light.

16
whole. In Belgium the opposite is true: those not covered by the generous Unemployment
Benefit protection system are usually young and temporary workers and the level of their
family income (e.g. from the earnings and pensions of their parents) prevents them from
being entitled to Social Assistance.
In the long term, the comparison of the Compensation Rate between the new unemployed as
a whole and those living in sole earner households reveals that the average net public support
is higher for sole earner households in all countries with the exception of Italy, highlighting
the extent to which public support is targeted at those without other resources. This seems to
be particularly true where the bulk of public support comes from means-tested Social
Assistance. This is the case of Belgium and the UK where the net public transfer is 13
percentage points higher for sole earner households than for the new unemployed as a whole.
<TABLE 5 AROUND HERE>
Figure 4 reports the average Compensation Rate by its components showing that in the short
term most public support is channelled through Unemployment Benefits (blue bar) for those
entitled to them. It is important to note that in the Netherlands and, to lesser extent in Spain,
the income tax (red bar) payable on these benefits reduces their effect in a non-negligible
way. In other countries specific tax credits for replacement income (Belgium) or general tax
allowances make the taxes on Unemployment Benefits tiny. In the UK, Social Assistance
(yellow bar) makes up the largest share of public support even when the contributory
Unemployment Benefit is payable while in all countries, except Italy, it is a much smaller but
important source of compensation for those not entitled to Unemployment Benefits and for
the new unemployed in the long term.
<FIGURE 4 AROUND HERE>
The role of Social Assistance and the extent to which public support is targeted at the bottom
of the distribution is made explicit by looking at the average Compensation Rate by
household income quintile group for those entitled to Unemployment Benefits in the short
term (Figure 5). The most striking pattern is observed in the UK: due to Social Assistance
(yellow bar), and the decreasing effect of the contributory Unemployment Benefit (blue bar)
the Compensation Rate shows a decreasing pattern from a 57% for the new unemployed from
the first quintile group to 14% for those at the top of the income distribution. It is also clear
that the cushioning role played by Family Benefits (green bar, mainly the means-tested Child
Tax Credit and the in-work benefit Working Tax Credit). On the one hand, from the second
quintile on, increases in these benefits contribute to a higher Compensation Rate (and in
particular the presence of someone still working in the household may trigger entitlement to
Working Tax Credit). On the other hand, at the very bottom of the distribution, households
where the only earner becomes unemployed lose their entitlement to the Working Tax Credit
contributing to a lower Compensation Rate.
In the other countries, the average Compensation Rate decreases with income quintile but to a
lesser extent than in the UK. Social Assistance emerges as a component of public support for
those at the bottom of the income distribution in Belgium, Estonia and, above all, the
Netherlands. Moreover, the role of income tax paid on Unemployment Benefits in reducing
the overall Compensation Rate is not negligible in the Netherlands and in Belgium, Estonia
and Spain for those at the top of the income distribution.
<FIGURE 5 AROUND HERE>
5.2. Absolute resilience

17
The extent to which the tax-benefit instruments allow the new unemployed to avoid falling
below a given level of income depends on the generosity of the system, entitlement to receive
Unemployment Benefits, the income position of the new unemployed before becoming
unemployed and their household circumstances.
Table 6 shows the proportion of new unemployed individuals with household equivalised
incomes below the poverty threshold before unemployment (“Poor in work”), those falling
below the threshold as a result of becoming unemployed (“At risk”) and those remaining
above in spite of unemployment (“Protected”). It shows the situation for all the new
unemployed in the short term (by their Unemployment Benefits entitlement status) and in the
long term, distinguishing between all households and sole earner households.
Among those entitled to Unemployment Benefits, the share of those at risk of poverty before
unemployment ranges from around 2-4% in the Netherlands, the UK, and in Belgium to
much higher levels in Spain, Italy and Estonia (around 9-12%). Among the new unemployed
entitled to Unemployed Benefits, in the UK 44% are at risk of falling below the poverty
threshold on becoming unemployed. The percentages for the other countries are 30% in Italy,
27% in Estonia, 18% in the Netherlands, 17% in Spain and 11% in Belgium.
<TABLE 6 AROUND HERE>
The new unemployed not entitled to the Unemployment Benefits are, on average, from a
poorer background: as already mentioned, these individuals are less attached to the labour
market, with a shorter contributory history and lower salaries which result in a relatively low
household income. They face a poverty risk, when still at work, at least double that for the
new unemployed entitled to Unemployment Benefits, with a risk of poverty particularly high
in Estonia (36%). When they become unemployed the share of those who remain protected
(around 45% in Estonia, and Italy; around 60% in the other countries) is lower than the
corresponding share of those entitled to Unemployment Benefits, except in the UK where it is
higher. This is explained on the one hand by the fact that, as we have seen Unemployment
Benefits make little difference to the average level of protection in the UK. On the other
hand, again, the composition of the non-entitled group is such that other household incomes
(earnings of partners of women, or parents of young people, with low labour market
attachment) have a protective effect.
As expected, the situation is even worse in the long term scenario when Unemployment
Benefits are exhausted. Less than half new unemployed are protected from poverty, with
larger shares of people at risk of poverty than in the short term in all countries (except in the
UK). However, it is when looking at the sole earners that the dramatic share of those
inadequately protected by the welfare system becomes clear: in Estonia only 4% of the new
unemployed receive enough public support to stay above the poverty threshold, and around
12%-14% in Belgium, Spain and Italy. In the Netherlands and the UK, the Social Assistance
schemes allow up to 21% and 26%, respectively, of the new unemployed to stay above the
poverty threshold.
Looking at poverty risk faced by the unemployed as a whole in the long term, the share of
new unemployed already poor when they were still in work resembles the overall pattern of
in-work poverty (Ponthieux, 2010). The main exceptions are Estonia where the new
unemployed face a risk of poverty before unemployment higher than the risk faced by the in
work population as a whole and the UK where the opposite is true. Overall, it seems that in
Europe the poor do not bear a disproportionate share of the losses – at least in terms of
unemployment shock at the onset of the Great Recession – as it was the case in the 1990-1
recession in the USA (Cutler and Katz, 1991).

18
However, the share of the new unemployed not protected from poverty by the welfare
systems, in particular when Unemployment Benefits are exhausted, supports Cantillon’s view
(2011) that social protection for working age individuals in Europe has become less adequate
and social redistribution less pro-poor. Social Assistance schemes are not adequate to stop
those losing their job from descending into poverty (Figari et al., 2011).
6. Conclusions
We have analysed the extent to which tax-benefit systems provide an automatic stabilisation
of income for those who became unemployed at the onset of the Great Recession. The focus
of the analysis is on the compensation for earnings lost due to unemployment which is
channelled through the welfare systems to this group of people who are clearly vulnerable to
the recession’s adverse effects. In order to assess the impact of unemployment on household
income, counterfactual scenarios are simulated by using EUROMOD, the EU-wide
microsimulation model, integrated with information from the EU-LFS data.
The consequences of the economic downturn for the household income of unemployed
individuals depend on the interaction between their contribution history, their living
arrangements and the capacity of the tax-benefit systems to absorb macro-economic shocks.
The European countries included in our paper have systems of social protection for the
unemployed that differ considerably, ranging from generous earnings related benefits to flat
rate low level amounts. As a consequence the degree of protection offered to the unemployed
differs.
Our analysis reveals that one needs to look at the social protection system as a whole
highlighting the role for adequate minimum income schemes alongside Unemployment
Benefits.
In the short term, individuals entitled to Unemployment Benefits face the highest average
level of protection in countries characterised by generous and long lasting earnings-related
Unemployment Benefits like Belgium, Spain, and the Netherlands. At the other extreme, in
the UK the flat rate Unemployment Benefit payable for at most 6 months offers the lowest
level of replacement rate. Individuals not entitled to Unemployment Benefits and all new
unemployed in the long term face a much higher risk of falling below the poverty threshold,
in particular in countries with less developed Social Assistance. The evidence presented here
suggests that the current crisis will put minimum income schemes in several EU countries to
a severe test. To meet the challenge, social safety nets must become stronger and tighter
(Figari et al., 2011).
In a cross country perspective, such evidence raises the issue whether the tax-benefit system
should ensure a minimum level of living standards for all individuals potentially at risk of
unemployed or alternatively should ensure a higher stabilization of income for those more
attached to the labour market with a longer contributory history and permanent employment
contracts.
Even if we abstain from analysing any macroeconomic effect of the Great Recession, our
results give an indication of the extent to which Unemployment Benefits and public transfers
in general stabilise household income and hence highlight the role they can play in boosting
internal demand and consumption (Dolls et al., 2012). Unemployment Benefits can act as
efficient social shock absorbers and play a counter-cyclical role. The same applies to

19
minimum income schemes, so long as extending their coverage and/or improving adequacy
are part of the policy agenda.
Some methodological assumptions need to be borne in mind in the interpretation of the
results. First, assuming that over a 12 months period the person is unemployed for the
number of months spent in work in the year before the unemployment shock, rather than
taking into account the variation in durations of individual unemployment spells, can impact
on the measured importance of Unemployment Benefits, given the different maximum
duration of payment of Unemployment Benefits across countries. However, the assumption
seems to be realistic and it is justified by the evidence of the long lasting unemployment
spells faced by individuals who lost their job at the onset of the Great Recession. Second, it
should be noted that the welfare systems do not necessarily guarantee the average level of
protection shown by our results. These assume complete take-up of means-tested benefits
which can be argued is realistic for new unemployed individuals left without any other
financial resources but it is not so realistic for those with other family resources for whom
stigma and other factors may inhibit claims.
Third, as is usual in distributive analysis, we have assumed complete income pooling within
the household. However, this is an important assumption when the concern is about the
young unemployed who represent almost half of the new unemployed across countries and
just slightly less in Estonia and Italy. Depending on their family circumstances, educational
attainments and career prospects the young unemployed can be the most vulnerable and
deserve particular attention. The extent to which their incomes are cushioned can influence
their living decisions in terms of leaving the parental home (Iacovou, 2010) or sharing
housing (Mykyta and Macartney, 2010) and have an impact on future household formation
(Painter, 2010). On the one hand, if they live in the parental home their earnings, lost due to
unemployment, represent a secondary income source (because of other earnings or pensions
received by their parents). In that case the household acts as an effective income stabilizer
only if income is shared. On the other hand, if they do not live in the parental home, the
generally lower absolute level of their incomes implies greater compensation by means-tested
benefits and also a lower share of young new unemployed that are protected from the risk of
poverty, making them particularly vulnerable.
Furthermore, we believe that the stress test approach applied to the tax-benefit schemes
highlights some interesting features to be pursued in future research.
First, the need for fiscal consolidation in European countries makes urgent the analysis of the
impact of different potential reforms to the tax-benefit systems. Second, an overall
assessment of the economic crisis on income inequality should try to distinguish between the
effects of the austerity measures taken to reduce fiscal deficits and the direct consequences of
the wider recession (Callan et al., 2011; Matsaganis and Leventi, 2011).
Finally, in a broader context, the stress test approach applied in a cross country perspective
could contribute to the growing literature on the measurement of the economic aspects of
well-being (Stiglitz et al., 2009). The approach presented in this paper could be applied to
calculate the “risk of unemployment” component of the Economic Security domain of the
Index of Economic Well-Being (Osberg and Sharpe, 2005). The stress test approach based on
EUROMOD would allow one to derive the component of the index considering the
individual heterogeneity in a large number of countries, by capturing and weighting
appropriately the individual risk of a job loss, the personal entitlement to Unemployment
Benefits and the individual level of replacement income that could be expected from the
welfare system (Osberg and Sharpe, 2009).

20

21
References
Aaberge R., Bjorklund A., and Jantti M. (2000), Unemployment shocks and income
distribution: how did the Nordic countries fare during their crisis? Scandinavian
Journal of Economics 102(1): 77-90.
Alesina A., and Giavazzi F. (2006), The future of Europe. Cambridge: MIT.
Arpaia A., and Curci N. (2010), EU labour market behaviour during the Great Recession.
European Economy no. 405. Brussels: European Commission.
Atkinson A. B. (2009), Stress-Testing the Welfare State, in Ofstad, B., Bjerkholt O., Skrede
K. and Hylland A. (Eds), Rettferd og politik Festskrift til Hilde Bojer, Emiliar Forlag,
Oslo, pp 31-39.
Atkinson A. B. and Micklewright J. (1991), Unemployment compensation and labor market
transitions: a critical review, Journal of Economic Literature 29: 1679-1727.
Bertola G., Jimeno J. F., Marimon R. and Pissarides C. (2001), Welfare Systems and Labour
Markets in Europe: What convergence before and after EMU? in Bertola G., Boeri T.,
Nicoletti G. (eds.), Welfare and Employment in a United Europe, Cambridge (Mass.):
MIT Press.
Boadway R. and Keen M. (2000), Redistribution, in Atkinson A.B. and Bourguignon F.
(Eds.) Handbook of Income Distribution, Elsevier Vol. 1, chapter 12, 677-789.
Bonoli G. (1997), Classifying Welfare States: A Two-Dimension Approach, Journal of
Social Policy, 26(3): 351-372.
Bourguignon F. and Spadaro A. (2006), Microsimulation as a tool for evaluating
redistribution policies, Journal of Economic Inequality 4(1): 77-106.
Callan T., Leventi C., Levy H., Matsaganis M., Paulus A. and Sutherland H. (2011), The
distributional effects of austerity measures: a comparison of six EU countries,
EUROMOD Working Paper Series: EM6/11.
Cantillon B. (2011), The paradox of the social investment state. Growth, employment and
poverty in the Lisbon era, Journal of European Social Policy 21(5): 432-449..
Cutler N. and Katz L. (1991), Macroeconomic performance and the disadvantaged,
Brookings Papers on Economic Activity 2: 1-74.
Dolls M., Fuest C., and Peichl A. (2012), Automatic stabilizers and economic crisis: US vs.
Europe, Journal of Public Economics 96: 279-294.
European Commission (2010), Employment in Europe 2010. Brussels: European
Commission.
Figari F., Matsaganis M. and Sutherland H. (2011), Are European social safety nets tight
enough? Coverage and adequacy of minimum income schemes in 14 EU countries.
Amsterdam, AIAS, GINI Discussion Paper 2.
Figari F., Salvatori A. and Sutherland H. (2011), Economic down turn and stress testing
European welfare systems, Research in Labour Economics 32: 257-286.
Fiorio C.V. and D'Amuri F. (2006), Tax Evasion in Italy: An Analysis Using a Tax-benefit
Microsimulation Model, The ICFAI Journal of Public Finance IV(2): 19-37.
Iacovou M. (2010), Leaving home: independence, togetherness and income, Advances in Life
Course Research 15: 147-160.

22
Iacus S., King G. and Porro G. (2011), Multivariate Matching Methods that are Monotonic
Imbalance Bounding, Journal of the American Statistical Association 106 (493): 345-
361.
Immervoll H. and O’Donoghue C. (2004), What Difference does a Job Make? The Income
Consequences of Joblessness in Europe in D Gallie (ed.) Resisting Marginalisation:
Unemployment Experience and Social Policy in the European Union, Oxford
University Press, Oxford, pp. 105-139.
Jenkins S. P., Brandolini A., Micklewright J. and Nolan B. (2011), The Great Recession and
the Distribution of Household Income. Fondazione Rodolfo De Benedetti.
Jones M.T, Hilbers P. and Slack G. (2004), Stress testing financial systems: What to do when
the Governor calls, IMF Working Paper WP/04/127.
Keeley B. and Love P. (2010), From Crisis to Recovery. The Causes, Course and
Consequences of the Great Recession. Paris: OECD.
Matsaganis M. and Leventi C. (2011), The Distributional Impact of the Crisis in Greece.
EUROMOD Working Paper Series: EM3/11.
MISSOC (2009), Social Protection in the Member States of the European Union. Brussels:
European Commission.
Mykyta L. and Macartney, S. (2011), The effects of recession on household composition:
‘doubling-up’ and economic well-being. U.S. Census Bureau, SEHSD Working Paper
Number 2011-4.
Nolan B. (2009), Background note for roundtable discussion on monitoring the effects of the
financial crisis on vulnerable groups. Paris: OECD.
OECD (2007), Benefits and Wages: OECD Indicators. Paris: OECD.
OECD (2010), Economic Outlook. Paris: OECD.
OECD (2011a), Economic crisis and beyond: social policies for the recovery. Background
document for the OECD Ministerial Meeting on Social Policy 2-3 May 2011. Paris:
OECD.
OECD (2011b), Employment outlook. Paris: OECD.
Osberg L. and Sharpe A. (2005), How should we measure the “economic” aspects of well-
being? Review of Income and Wealth 51(2): 311-336.
Osberg L. and Sharpe A. (2009), New estimates of the index of economic well-being for
Canada and the provinces, 1981-2008. CLSC Research Report 2009-10.
Painter G. (2010), What happens to household formation in recession? Research Institute for
Housing America, Mortgage Bankers Association.
Ponthieux S. (2010), In-work poverty in the EU. Eurostat Methodologies and working papers.
Luxembourg: Publications Office of the European Union.
Schubert K., Hegelich S. and Bazant U. (2009), The Handbook of European Welfare
Systems. New York: Routledge.
Stiglitz J. E., Sen A. and Fitoussi J.-P. (2009), Report by the Commission on the
Measurement of Economic Performance and Social progress. http://www.stiglitz-sen-
fitoussi.fr/en/index.htm.

23
Sutherland H. (2007), EUROMOD: the tax-benefit microsimulation model for the European
Union, in Gupta A. and A. Harding (Eds), Modelling Our Future: population ageing,
health and aged care. International Symposia in Economic Theory and Econometrics
Vol 16, Elsevier 483-488.
Tatsiramos K. (2009), Unemployment Insurance in Europe: Unemployment Duration and
Subsequent Employment Stability, Journal of the European Economic Association,
2009, 7(6), 1225-1260.
Trumm A. and Ainsaar, M. (2009), The Welfare System of Estonia: past, present and future,
in Schubert K., Hegelich S. and Bazant U. (Eds.), The Handbook of European Welfare
Systems. New York: Routledge.

24
Tables
Table 1. Characteristics of the new unemployed
Belgium Estonia Spain Italy Netherlands UK
Sample size (unweighted) 2,647 2,410 7,260 8,182 6,172 11,934
Sample size (weighted) 110,194 49,389 1,670,376 469,277 143,851 1,050,124
Individual characteristics
Male % 0.60 0.64 0.65 0.62 0.62 0.68
Age groups %
< 35 0.49 0.38 0.46 0.41 0.47 0.47
35-44 0.29 0.27** 0.32 0.35 0.25 0.25
45-54 0.17 0.25 0.17 0.19 0.16 0.16
55+ 0.05 0.10 0.06 0.05 0.12 0.12
Education level %
Lower secondary 0.33 0.13** 0.57 0.45 0.37 0.60
Upper secondary 0.41 0.60 0.23 0.44 0.36 0.19
Tertiary 0.25 0.27 0.20* 0.11 0.27 0.21
Previous job
Self-employed % 0.04** 0.02*** 0.05 0.13 0.03 0.09
Sector of activity %
Agriculture 0.00*** 0.02*** 0.04* 0.02** 0.01** 0.01
Industry 0.22 0.36 0.16 0.27 0.13 0.47
Construction 0.12 0.22 0.30** 0.17 0.05**
Services 0.66 0.40 0.51** 0.55 0.81** 0.52
Household characteristics
Number of adults %
1 0.33 0.17*** 0.07** 0.15 0.30 0.24
2+ 0.67 0.83*** 0.93** 0.85 0.70 0.76
Presence of children % 0.42 0.47 0.49 0.41 0.40 0.43
Number of earners %
1 0.50 0.33* 0.30 0.40 0.42 0.40
2+ 0.50 0.67* 0.70 0.60 0.58 0.60
With other new unemployed
in the household %
0.05 0.14 0.16 0.05 0.02 0.07
Notes: Summary statistics for the new unemployed identified in EUROMOD data, by means of Coarsened Exact
Matching. New unemployed are individuals who became unemployed between 2008 and 2009.
* indicates mean value of the observed characteristics in EUROMOD data statistically different from the mean
value in EU-LFS data at 10% level; ** 5%, *** 1%. Source: EUROMOD version F4.23.
Table 2. New unemployed by household income quintile group
Belgium Estonia Spain Italy Netherlands UK
Bottom 15.02 15.30 12.63 12.98 8.62 9.34 2
nd 19.02 15.87 19.98 17.37 16.46 17.40
3rd
23.49 22.70 23.99 22.07 23.35 22.58
4th 21.78 26.03 23.49 25.26 26.27 24.64
Top 20.69 20.10 19.90 22.32 25.30 26.04
Notes: Summary statistics for the new unemployed identified in EUROMOD data. Quintile groups based
on household equivalised disposable income in the baseline (before the unemployment shock). Source:
EUROMOD version F4.23.

25
Table 3. Unemployment Benefits (UBs) and Social Assistance schemes at June 30th
, 2009
Schemes Typology / name Contributions conditions Payment rate Duration
(months)
Subject to
Tax and SICs?
BE UB Insurance Earnings-related benefit (flat
rate for youths); amount
depends on family situation
Between 45 weeks in 18
months and 89 weeks in 3
years
Single persons: 60% (from 2nd
year
53%). Cohabitants without dependants:
58% (from 2nd
year 40%).
Lower and upper ceilings
Unlimited Tax
Social Assistance Minimex Based on means test Unlimited
EE UB Insurance Earnings-related benefit 12 months in 3 years 50% for 1st 100 days; afterwards 40%.
Lower and upper ceilings
9 Tax and
Credited SICs
UB Assistance Flat rate (formally income-
based)
6 months in 1 year € 64 per month 9 (+ 5 until
retirement)
Social Assistance Toimetulekutoetus Based on means test Unlimited
ES UB Insurance Earnings-related benefit; amount
depends on family situation
12 months in 6 years 70% for 1st 6 months; afterwards 60%.
Lower and upper ceilings
4 -24 Tax, SICs and
Credited SICs
UB Assistance Flat-rate benefit (Subsidio por
desempleo), income-based
3 months (1+ dependants) or
6 months (No dependants)
From 80% of the “Public Income Rate
of Multiple Effects” (No dependants)
to 133% (3+ dependants)
6 - 18 Tax
Social Assistance Ingreso mínimo de inserción Based on means test 6 - unlimited
IT UB Insurance Earnings-related benefit* 52 weeks in 2 years 60% (for 1st 6 months, 50% for month
7 and 8 and 40% for the rest).
Upper ceiling
8 (12 if aged
50+)
Tax and
Credited SICs
NL UB Insurance Earnings-related benefits
(General and Extended benefits)
General: 26 weeks in last 36
weeks.
Extended: 26 weeks in last
36 weeks and at least 52 days
in 4 of last 5 years
General: 70%.
Lower and upper ceilings
Extended: 70% (75% for 1st 2 months).
Upper ceiling
Gen.: 3
Ext.: 6-38
Tax and SICs
UB Assistance Toeslagenwet, income-based Based on means test Same as UB
insurance
Tax and SICs
Social Assistance Bijstand Based on means test Unlimited Tax and SICs
UK UB Insurance Flat rate benefit (Contributory
Jobseekers’ Allowance - JSA)
1 of last 2 years, with
minimum level
From € 60 to € 76 per week 6 Tax
UB Assistance Jobseekers' Allowance (JSA) Based on means test Unlimited
Social Assistance Income support Based on means test Unlimited Notes: SICs: Social Insurance contributions paid by the unemployed. Credited contributions are paid by the social security agency on the Unemployment Benefit. * Special schemes
in the Construction sector and the wage supplementation scheme (CIGs) are not simulated in EUROMOD. Source: MISSOC (2009) and EUROMOD country reports

26
Table 4. Average Net Replacement Rates in the short and long term, by Unemployment
Benefits (UBs) entitlement status
Belgium Estonia Spain Italy Netherlands UK
Short term Entitled to UBs 0.81 0.64 0.77 0.65 0.72 0.57
Not entitled to UBs 0.78 0.84 0.81 0.47 0.78 0.64
Long term All new unemployed 0.56 0.50 0.51 0.40 0.48 0.57
Sole earner households 0.48 0.39 0.45 0.16 0.32 0.52
Notes: Net Replacement Rate is the ratio of household disposable income after and before the unemployment
shock. Source: EUROMOD version F4.23.
Table 5. Average Compensation Rates in the short and long term, by Unemployment Benefits
(UBs) entitlement status
Belgium Estonia Spain Italy Netherlands UK
Short term Entitled to UBs 0.74 0.40 0.62 0.45 0.62 0.30
Not entitled to UBs 0.11 0.20 0.10 0.02 0.22 0.26
Long term All new unemployed 0.22 0.10 0.13 0.01 0.20 0.26
Sole earner households 0.35 0.23 0.25 0.00 0.26 0.39
Notes: Compensation Rate is the proportion of household disposable income lost due to unemployment that is
compensated by public transfers. Source: EUROMOD version F4.23.
Table 6. Poverty status of the new unemployed in the short and long term, by Unemployment
Benefits (UBs) entitlement status
Belgium Estonia Spain Italy Netherlands UK
Short term
Entitled to UB Poor in work 0.04 0.12 0.09 0.10 0.02 0.03
At risk 0.11 0.27 0.17 0.30 0.18 0.44
Protected 0.85 0.61 0.74 0.61 0.80 0.52
Not Entitled Poor in work 0.15 0.36 0.21 0.19 0.13 0.08
At risk 0.22 0.19 0.16 0.36 0.22 0.34
Protected 0.63 0.45 0.62 0.46 0.65 0.58
Long term
All households Poor in work 0.05 0.13 0.10 0.11 0.03 0.04
At risk 0.51 0.53 0.51 0.45 0.50 0.46
Protected 0.44 0.34 0.39 0.44 0.46 0.50
Sole earner
households Poor in work 0.09 0.28 0.22 0.22 0.05 0.09
At risk 0.78 0.69 0.66 0.65 0.74 0.66
Protected 0.13 0.04 0.13 0.12 0.21 0.26
Notes: The poverty threshold is fixed at 60% of baseline median household disposable equivalised income.
Source: EUROMOD version F4.23.

27
Figures
Figure 1. Distribution of Net Replacement Rates in the short term, new unemployed entitled
to Unemployment Benefits
Notes: The continuous vertical line is the Average Net Replacement Rate. The dashed vertical lines represent
respectively the 25th
and 75th
percentile of the Net Replacement Rate distribution. See Table 4. Source:
EUROMOD version F4.23.
Figure 2. Distribution of Net Replacement Rates in the long term, all new unemployed
Notes: See Figure 1. Source: EUROMOD version F4.23.
01
23
4
0 .2 .4 .6 .8 1
Belgium
01
23
4
0 .2 .4 .6 .8 1
Estonia
01
23
4
0 .2 .4 .6 .8 1
Spain
01
23
4
0 .2 .4 .6 .8 1
Italy
01
23
4
0 .2 .4 .6 .8 1
Netherlands
01
23
4
0 .2 .4 .6 .8 1
United Kingdom
0.5
11.5
2
0 .2 .4 .6 .8 1
Belgium
0.5
11.5
2
0 .2 .4 .6 .8 1
Estonia
0.5
11.5
2
0 .2 .4 .6 .8 1
Spain
0.5
11.5
2
0 .2 .4 .6 .8 1
Italy
0.5
11.5
2
0 .2 .4 .6 .8 1
Netherlands
0.5
11.5
2
0 .2 .4 .6 .8 1
United Kingdom

28
Figure 3. Decomposition (by income source) of average Net Replacement Rates in the short
and long term, by Unemployment Benefits entitlement status.
Notes: Net Replacement Rate is the ratio of household disposable income after and before the unemployment
shock. “Taxes and Contributions” include personal income tax, employee social insurance contributions and
other direct taxes such as the UK Council Tax and Property Tax in Italy; “Social Assistance Benefits” includes
minimum income payments, housing benefits and other residual Social Assistance benefits; “Family Benefits”
include allowances related to the presence of children, other means-tested benefits and refundable Tax Credits
as in Spain, and the UK. Where income from Unemployment Benefits is shown for the “Not entitled” group this
is due to other household members receiving these benefits. Source: EUROMOD version F4.23.
-0.4
-0.2
0
0.2
0.4
0.6
0.8
1
1.2 E
nti
tled
No
t en
titl
ed
All
Enti
tled
No
t en
titl
ed
All
Enti
tled
No
t en
titl
ed
All
Enti
tled
No
t en
titl
ed
All
Enti
tled
No
t en
titl
ed
All
Enti
tled
No
t en
titl
ed
All
Short term Long
term
Short term Long
term
Short term Long
term
Short term Long
term
Short term Long
term
Short term Long
term
Belgium Estonia Spain Italy Netherlands UK
Original income Taxes and Contributions Pension & Disability Benefits
Unemployment Benefits Family Benefits Social Assistance Benefits
Net Replacement Rate

29
Figure 4. Decomposition (by income source) of average Compensation Rates in the short and
long term, by Unemployment Benefits entitlement status
Notes: Compensation Rate is the proportion of net household market income lost due to unemployment that is
compensated by public transfers. See Figure 3. Source: EUROMOD version F4.23.
-0.2
-0.1
0
0.1
0.2
0.3
0.4
0.5
0.6
0.7
0.8 E
nti
tled
No
t E
nti
tled
All
Enti
tled
No
t E
nti
tled
All
Enti
tled
No
t E
nti
tled
All
Enti
tled
No
t E
nti
tled
All
Enti
tled
No
t E
nti
tled
All
Enti
tled
No
t E
nti
tled
All
Short term Long
term
Short term Long
term
Short term Long
term
Short term Long
term
Short term Long
term
Short term Long
term
Belgium Estonia Spain Italy Netherlands UK
Pension & Disability Benefits Unemployment Benefits Family Benefits
Social Assistance Benefits Taxes and Contributions Compensation Rate
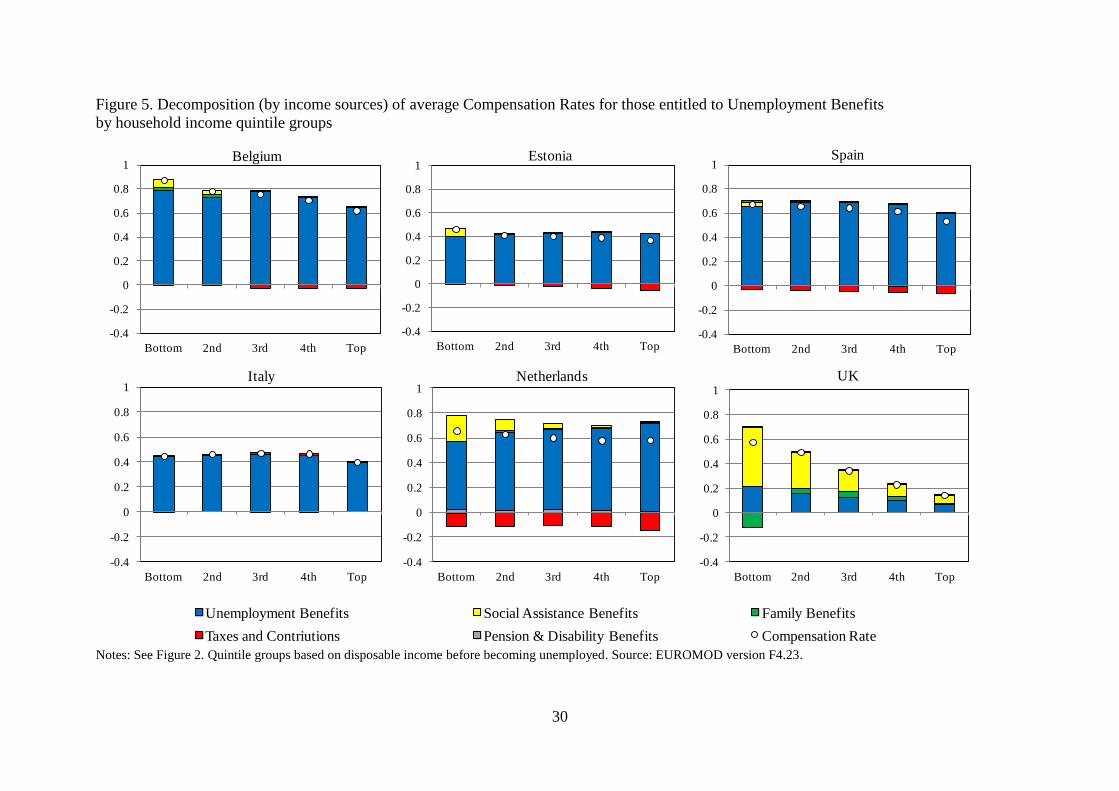
30
Figure 5. Decomposition (by income sources) of average Compensation Rates for those entitled to Unemployment Benefits
by household income quintile groups
Notes: See Figure 2. Quintile groups based on disposable income before becoming unemployed. Source: EUROMOD version F4.23.
Unemployment Benefits Social Assistance Benefits Family Benefits
Taxes and Contriutions Pension & Disability Benefits Compensation Rate
-0.4
-0.2
0
0.2
0.4
0.6
0.8
1
Bottom 2nd 3rd 4th Top
Belgium
-0.4
-0.2
0
0.2
0.4
0.6
0.8
1
Bottom 2nd 3rd 4th Top
Estonia
-0.4
-0.2
0
0.2
0.4
0.6
0.8
1
Bottom 2nd 3rd 4th Top
Italy
-0.4
-0.2
0
0.2
0.4
0.6
0.8
1
Bottom 2nd 3rd 4th Top
Spain
-0.4
-0.2
0
0.2
0.4
0.6
0.8
1
Bottom 2nd 3rd 4th Top
Netherlands
-0.4
-0.2
0
0.2
0.4
0.6
0.8
1
Bottom 2nd 3rd 4th Top
UK