Embed Size (px)
Citation preview
Fifth Street Finance Corp.
Investor Presentation
February 2010
www.fifthstreetfinance.com
2
Forward- Looking Statements
This presentation may contain certain forward-looking statements, including statements with regard to the future performance of Fifth Street Finance Corp. Words such as “believes,” “expects,” “projects,” “anticipates,” and “future” or similar expressions are intended to identify forward-looking statements. These forward-looking statements are subject to the inherent uncertainties in predicting future results and conditions. Certain factors could cause actual results to differ materially from those projected in these forward-looking statements, and these factors are identified from time to time in our filings with the Securities and Exchange Commission. Fifth Street Finance Corp. undertakes no obligation to publicly update or revise any forward-looking statements, whether as a result of new information, future events or otherwise.
3
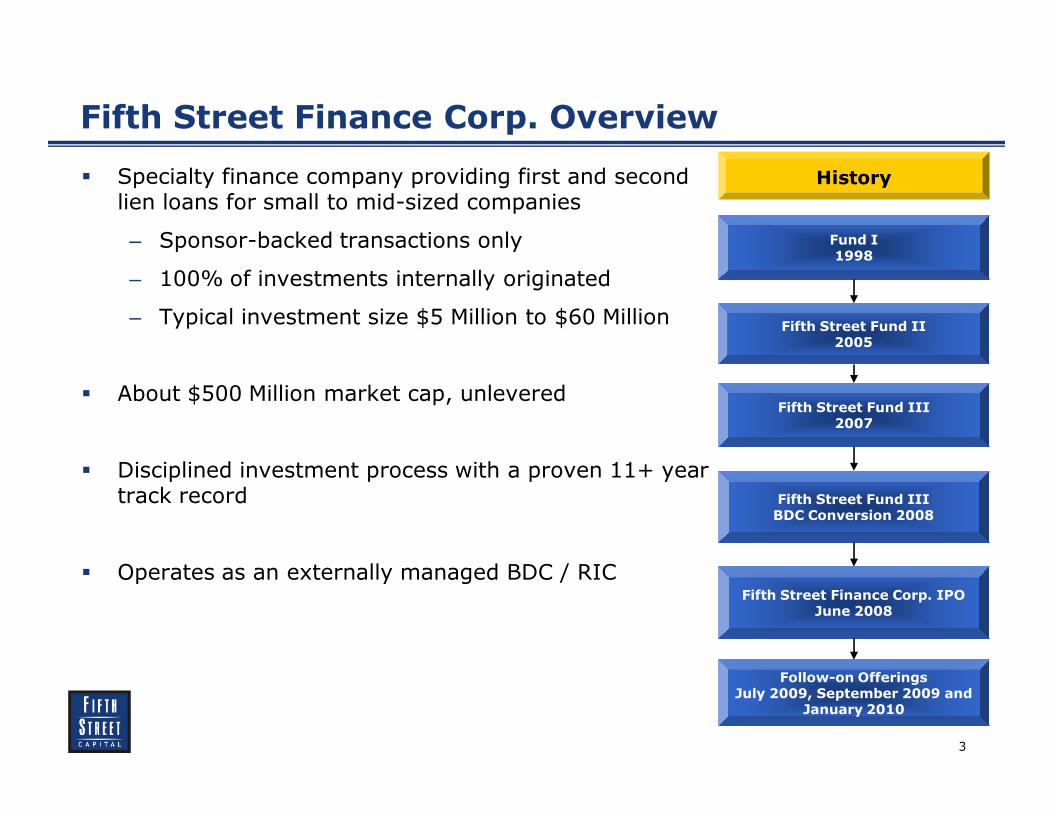
Fifth Street Finance Corp. Overview
History
Fund I1998
Fifth Street Fund II2005
Fifth Street Fund III2007
Fifth Street Fund III BDC Conversion 2008
Fifth Street Finance Corp. IPOJune 2008
Follow-on OfferingsJuly 2009, September 2009 and
January 2010
� Specialty finance company providing first and second lien loans for small to mid-sized companies
– Sponsor-backed transactions only
– 100% of investments internally originated
– Typical investment size $5 Million to $60 Million
� About $500 Million market cap, unlevered
� Disciplined investment process with a proven 11+ year track record
� Operates as an externally managed BDC / RIC
4
Strong Value Proposition
Transparency &
Shareholder Alignment
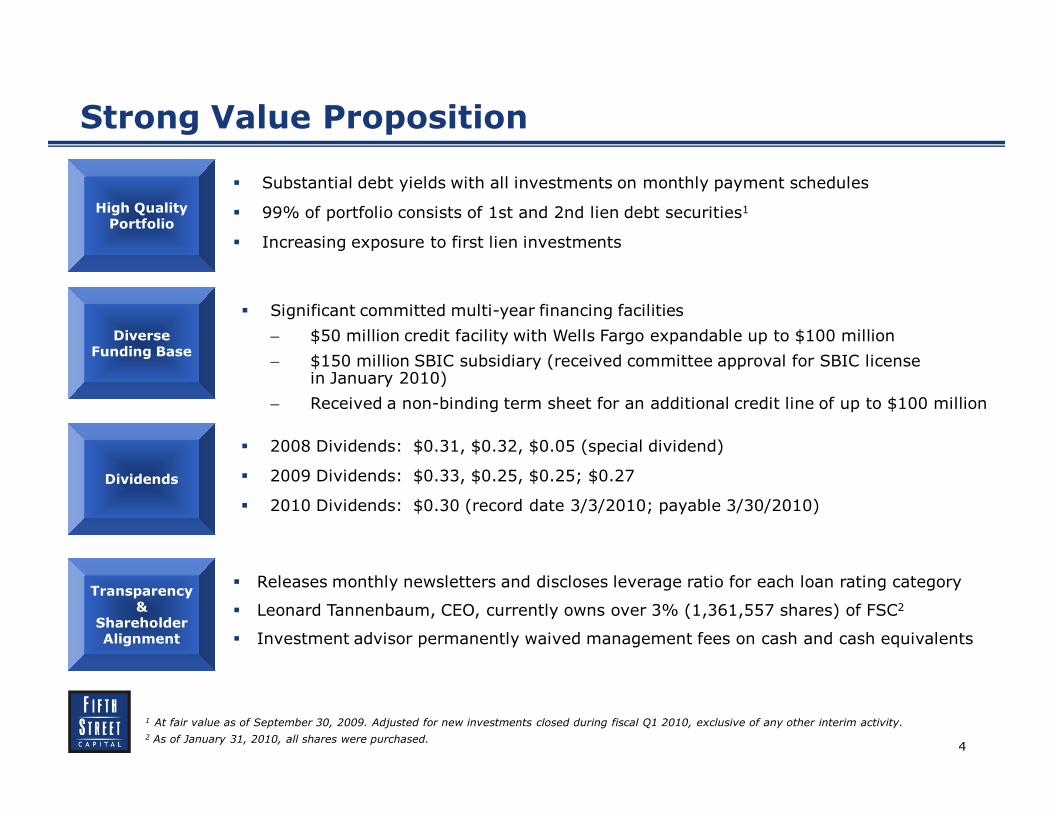
� Substantial debt yields with all investments on monthly payment schedules
� 99% of portfolio consists of 1st and 2nd lien debt securities1
� Increasing exposure to first lien investments
� Significant committed multi-year financing facilities
– $50 million credit facility with Wells Fargo expandable up to $100 million
– $150 million SBIC subsidiary (received committee approval for SBIC license in January 2010)
– Received a non-binding term sheet for an additional credit line of up to $100 million
� 2008 Dividends: $0.31, $0.32, $0.05 (special dividend)
� 2009 Dividends: $0.33, $0.25, $0.25; $0.27
� 2010 Dividends: $0.30 (record date 3/3/2010; payable 3/30/2010)
1 At fair value as of September 30, 2009. Adjusted for new investments closed during fiscal Q1 2010, exclusive of any other interim activity.
2 As of January 31, 2010, all shares were purchased.
� Releases monthly newsletters and discloses leverage ratio for each loan rating category
� Leonard Tannenbaum, CEO, currently owns over 3% (1,361,557 shares) of FSC2
� Investment advisor permanently waived management fees on cash and cash equivalents
High Quality Portfolio
Diverse Funding Base
Dividends
5
Why Fifth Street Today
� Strong unlevered asset yields will be enhanced by Fifth Street’s access to credit
� Fiscal 2010 second quarter dividend increased 11% to $0.30 per share
– Expect quarterly dividend to continue to increase during fiscal 2010
– Dividend policy is to distribute between 90–100% of distributable income
� Will NOT seek approval of shareholders at 2010 annual meeting to sell shares of its common stock below NAV
� Recurring revenue stream-weighted average portfolio debt yield is 15.7% vs. industry average of approximately 12.8%1
� 81% of debt portfolio consists of fixed rate debt securities; 100% of floating rate debt securities have interest rate floors of at least 9%2
� High quality pipeline comprised primarily of first lien investments provides attractive growth opportunities
1 As of September 30, 2009.
2 At fair value as of September 30, 2009. Adjusted for new investments closed during fiscal Q1 2010, exclusive of any other interim activity.
6
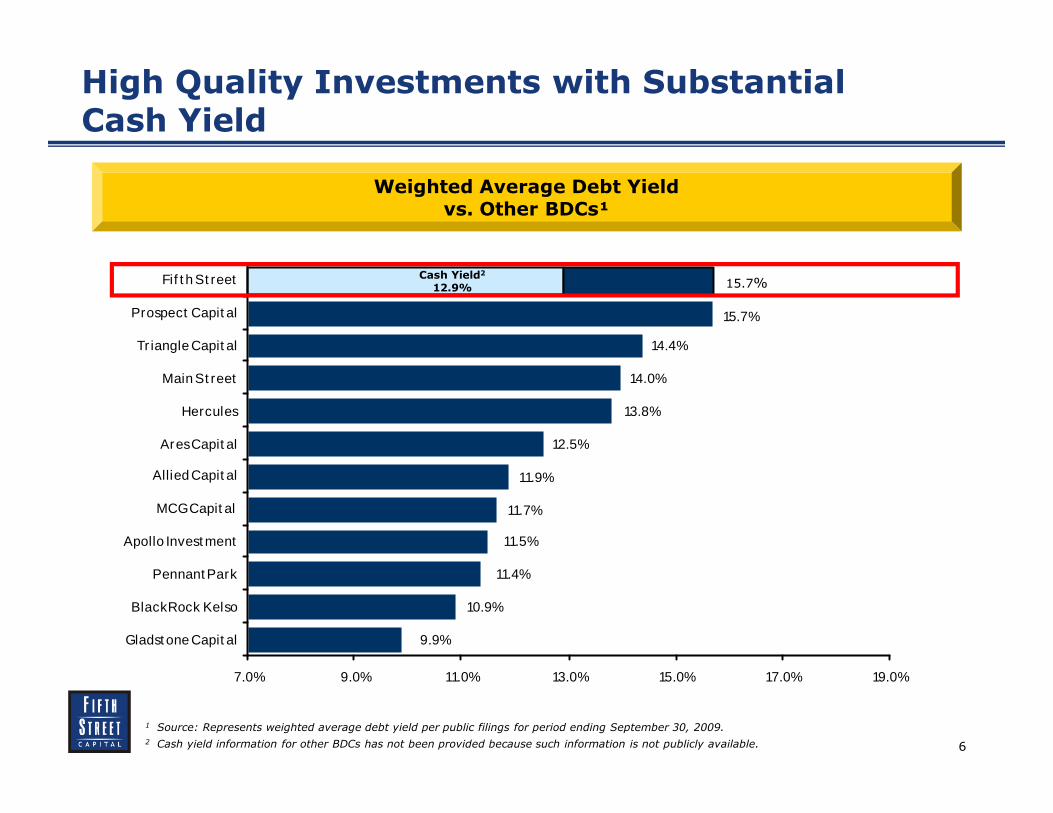
High Quality Investments with Substantial Cash Yield
1 Source: Represents weighted average debt yield per public filings for period ending September 30, 2009.
2 Cash yield information for other BDCs has not been provided because such information is not publicly available.
15.7%
14.4%
9.9%
10.9%
11.4%
11.5%
11.7%
11.9%
12.5%
13.8%
14.0%
7.0% 9.0% 11.0% 13.0% 15.0% 17.0% 19.0%
Gladst one Capit al
BlackRock Kelso
Pennant Park
Apollo Invest ment
MCG Capit al
Allied Capit al
Ares Capit al
Hercules
Main St reet
Tr iangle Capit al
Prospect Capit al
Fif t h St reet
Weighted Average Debt Yieldvs. Other BDCs¹
Cash Yield2
12.9% 15.7%
7
BDC Structure and Regulation
� Business Development Companies (“BDCs”) are uniquely positioned financing vehicles that provide debt and equity capital to private and small publicly-owned enterprises
� BDCs were created by Congress in 1980 with the stated mission of facilitating the flow of capital to companies lacking access to public capital markets
� BDC regulations allow a maximum debt-to-equity ratio of 1:1 which allow BDCs to modestly enhance their return
� BDCs are required to distribute at least 90% of their income to shareholders annually
� SEC regulations require BDCs to report the fair value of assets quarterly
8
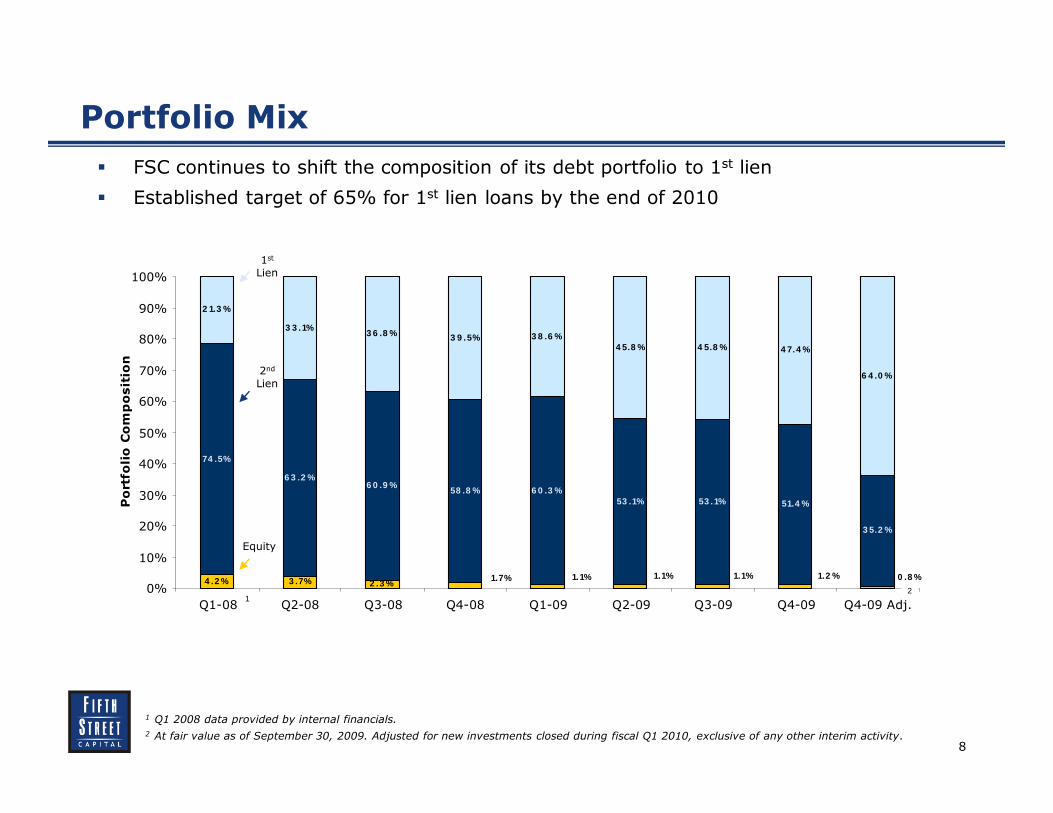
3 .7%
74 .5%
6 3 .2 %6 0 .9 %
58 .8 % 6 0 .3 %53 .1% 53 .1% 51.4 %
3 5.2 %
4 7.4 %
6 4 .0 %
2 .3 %4 .2 %1.2 %1.1%1.1%1.1%1.7% 0 .8 %
4 5.8 %4 5.8 %3 8 .6 %3 9 .5%3 6 .8 %
3 3 .1%
2 1.3 %
0%
10%
20%
30%
40%
50%
60%
70%
80%
90%
100%
Q1-08 Q2-08 Q3-08 Q4-08 Q1-09 Q2-09 Q3-09 Q4-09 Q4-09 Adj.
Portfolio Composition
Portfolio Mix
1 Q1 2008 data provided by internal financials.
2 At fair value as of September 30, 2009. Adjusted for new investments closed during fiscal Q1 2010, exclusive of any other interim activity.
� FSC continues to shift the composition of its debt portfolio to 1st lien
� Established target of 65% for 1st lien loans by the end of 2010
2
2nd
Lien
1st
Lien
Equity
1
9
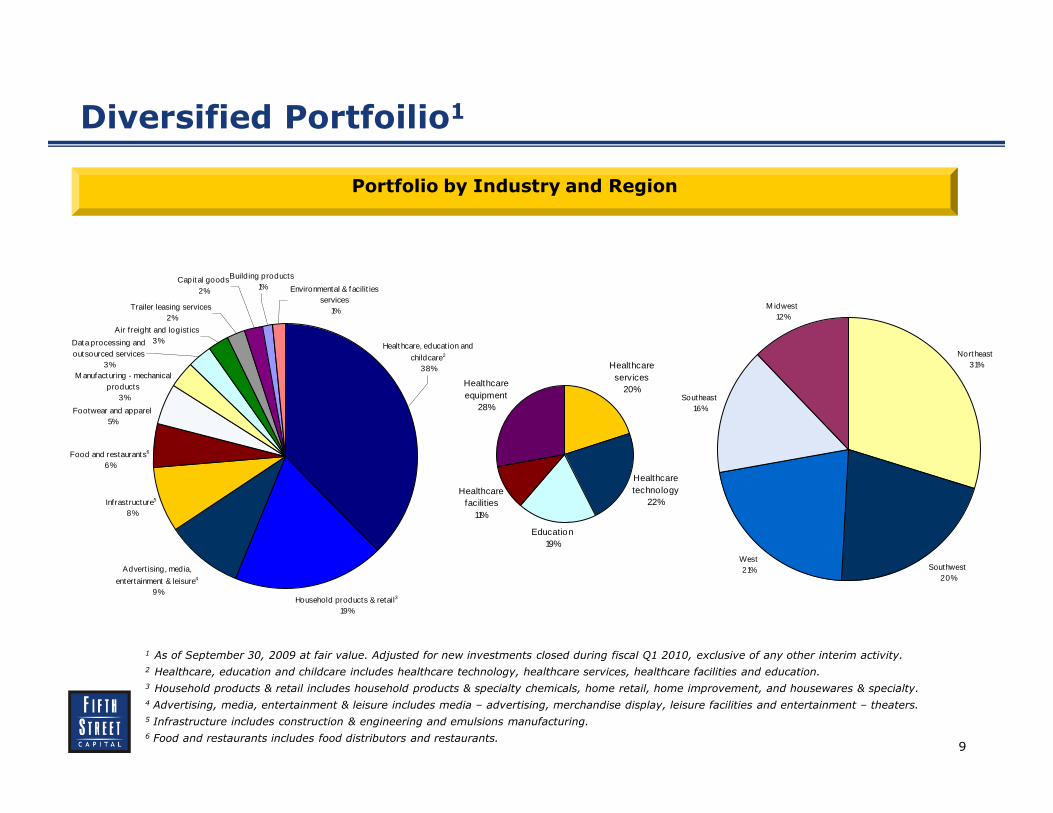
Diversified Portfoilio1
Portfolio by Industry and Region
1 As of September 30, 2009 at fair value. Adjusted for new investments closed during fiscal Q1 2010, exclusive of any other interim activity.
2 Healthcare, education and childcare includes healthcare technology, healthcare services, healthcare facilities and education.
3 Household products & retail includes household products & specialty chemicals, home retail, home improvement, and housewares & specialty.
4 Advertising, media, entertainment & leisure includes media – advertising, merchandise display, leisure facilities and entertainment – theaters.
5 Infrastructure includes construction & engineering and emulsions manufacturing.
6 Food and restaurants includes food distributors and restaurants.
Healthcare services
20%
Healthcare technology
22%
Education19%
Healthcare facilities
11%
Healthcare equipment
28%
West21%
M idwest12%
Southeast16%
Southwest20%
Northeast31%
Footwear and apparel5%
Trailer leasing services2%
Air freight and logist ics3%
Infrastructure5
8%
Food and restaurants6
6%
Advertising, media,
entertainment & leisure4
9%
Healthcare, education and
childcare2
38%
Household products & retail3
19%
M anufacturing - mechanical products
3%
Data processing and outsourced services
3%
Capital goods2%
Building products1% Environmental & facilit ies
services1%
10
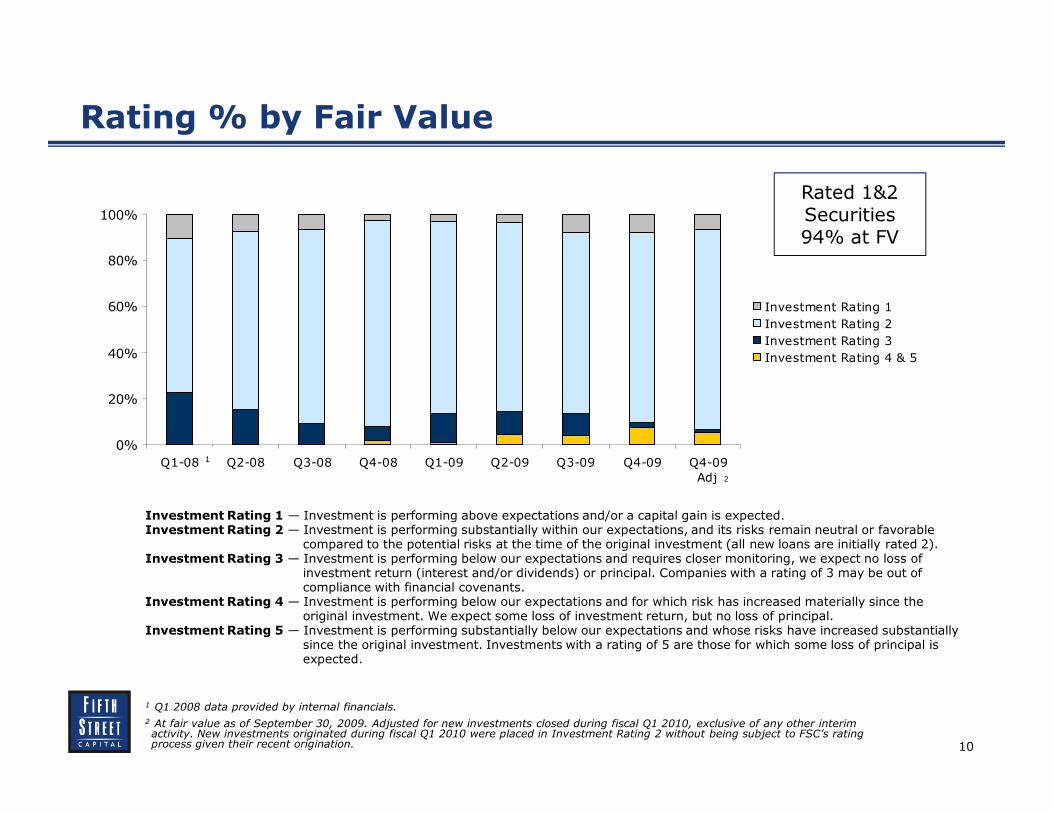
Rating % by Fair Value
0%
20%
40%
60%
80%
100%
Q1-08 Q2-08 Q3-08 Q4-08 Q1-09 Q2-09 Q3-09 Q4-09 Q4-09
Adj.
Investment Rating 1
Investment Rating 2
Investment Rating 3
Investment Rating 4 & 5
Investment Rating 1 — Investment is performing above expectations and/or a capital gain is expected.Investment Rating 2 — Investment is performing substantially within our expectations, and its risks remain neutral or favorable
compared to the potential risks at the time of the original investment (all new loans are initially rated 2).Investment Rating 3 — Investment is performing below our expectations and requires closer monitoring, we expect no loss of
investment return (interest and/or dividends) or principal. Companies with a rating of 3 may be out of compliance with financial covenants.
Investment Rating 4 — Investment is performing below our expectations and for which risk has increased materially since the original investment. We expect some loss of investment return, but no loss of principal.
Investment Rating 5 — Investment is performing substantially below our expectations and whose risks have increased substantially since the original investment. Investments with a rating of 5 are those for which some loss of principal is expected.
Rated 1&2Securities94% at FV
1 Q1 2008 data provided by internal financials.
2 At fair value as of September 30, 2009. Adjusted for new investments closed during fiscal Q1 2010, exclusive of any other interim activity. New investments originated during fiscal Q1 2010 were placed in Investment Rating 2 without being subject to FSC’s rating process given their recent origination.
1
2
11
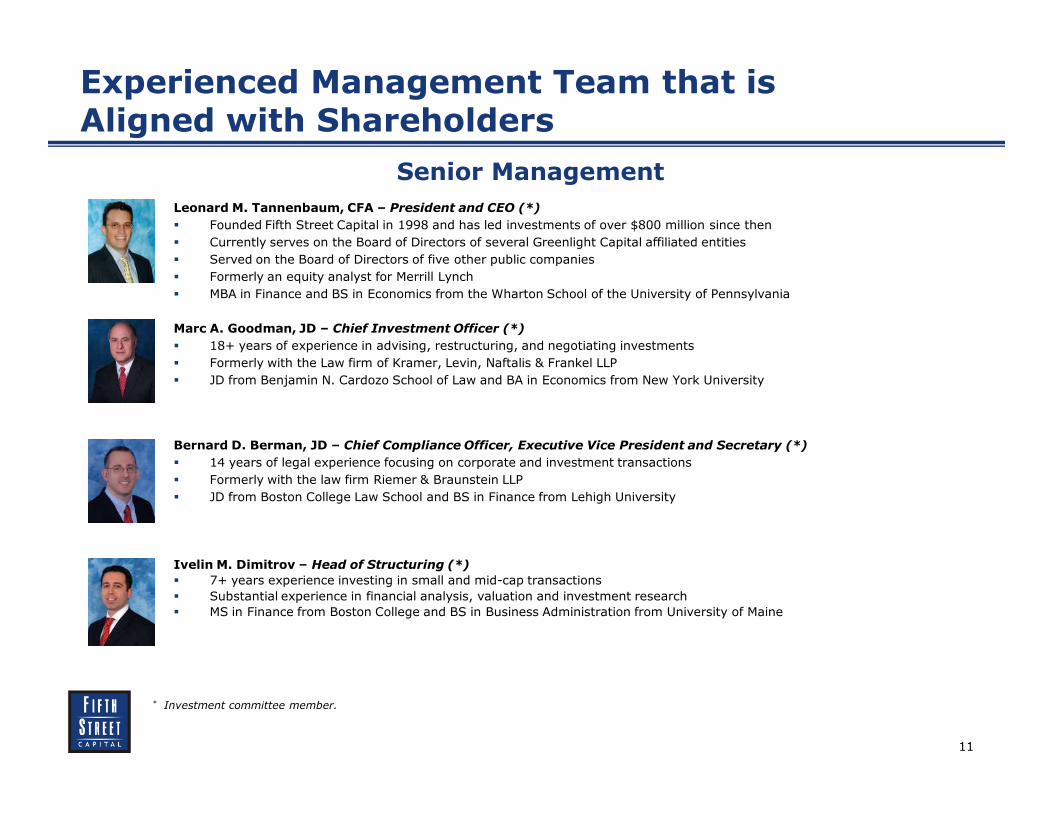
Experienced Management Team that is Aligned with Shareholders
Senior Management
Leonard M. Tannenbaum, CFA – President and CEO (*)
� Founded Fifth Street Capital in 1998 and has led investments of over $800 million since then
� Currently serves on the Board of Directors of several Greenlight Capital affiliated entities
� Served on the Board of Directors of five other public companies
� Formerly an equity analyst for Merrill Lynch
� MBA in Finance and BS in Economics from the Wharton School of the University of Pennsylvania
Marc A. Goodman, JD – Chief Investment Officer (*)
� 18+ years of experience in advising, restructuring, and negotiating investments
� Formerly with the Law firm of Kramer, Levin, Naftalis & Frankel LLP
� JD from Benjamin N. Cardozo School of Law and BA in Economics from New York University
Bernard D. Berman, JD – Chief Compliance Officer, Executive Vice President and Secretary (*)
� 14 years of legal experience focusing on corporate and investment transactions
� Formerly with the law firm Riemer & Braunstein LLP
� JD from Boston College Law School and BS in Finance from Lehigh University
Ivelin M. Dimitrov – Head of Structuring (*)
� 7+ years experience investing in small and mid-cap transactions
� Substantial experience in financial analysis, valuation and investment research
� MS in Finance from Boston College and BS in Business Administration from University of Maine
* Investment committee member.
12
Experienced Management Team that is Aligned with Shareholders
Other Senior Professionals
Casey J. Zmijeski, Managing Director, Origination
� Joined Fifth Street in 2009
� 17+ years experience in originating and structuring debt investments
� Formerly with Churchill Financial, CapitalSource, Heller Financial and GE Capital, and ING
� MBA from Goizueta Business School at Emory University and AB from Duke University
Juan E. Alva – Partner
� 16+ years of experience in M&A and corporate finance, specializing in small and mid-cap transactions
� Formerly a senior investment banker at Trinity Capital and investment banker at Goldman Sachs
� BS in Economics from the Wharton School at the University of Pennsylvania
William H. Craig, CPA – Chief Financial Officer
� Joined Fifth Street in 2007
� Significant experience in financial reporting
� Former CFO of Vital-Signs, Inc. (NASDAQ listed)
� MBA from Texas A&M University and BA from Wake Forest University
Stacey L. Thorne – Director, Investor Relations
� Joined Fifth Street in 2007
� Previous experience with Intrepid Capital Management
� MSW from Adelphi University
13
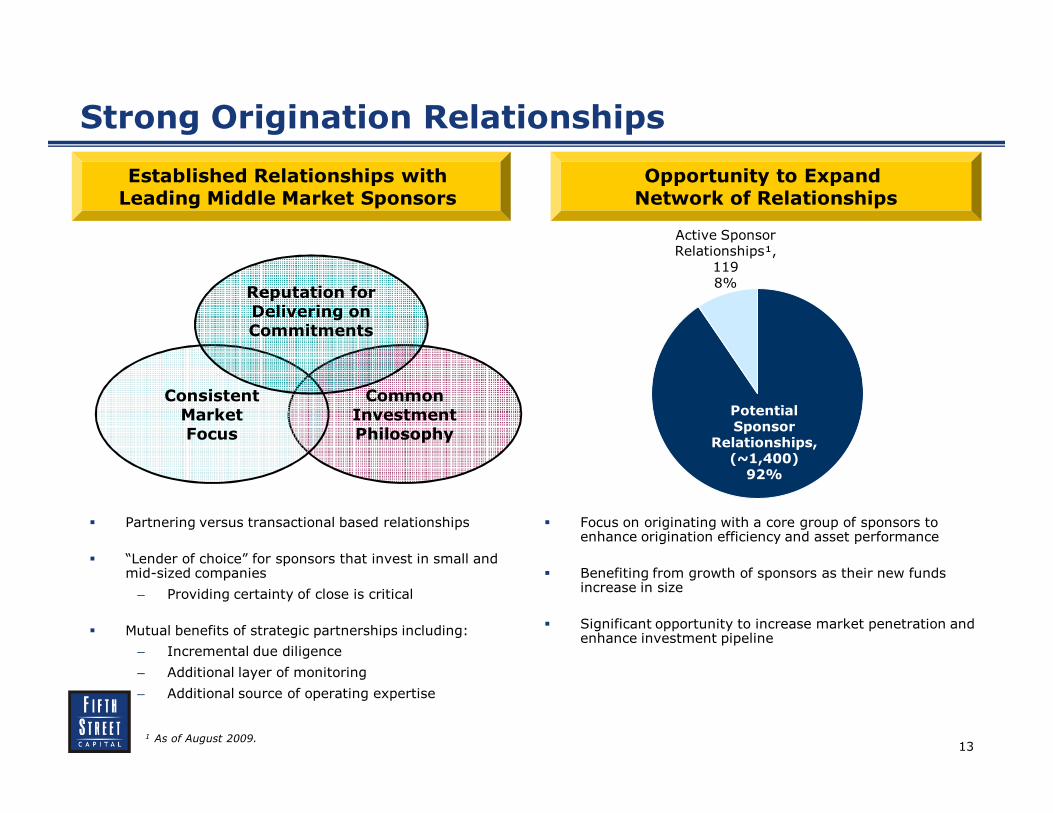
Strong Origination Relationships
� Partnering versus transactional based relationships
� “Lender of choice” for sponsors that invest in small and mid-sized companies
– Providing certainty of close is critical
� Mutual benefits of strategic partnerships including:
– Incremental due diligence
– Additional layer of monitoring
– Additional source of operating expertise
� Focus on originating with a core group of sponsors to enhance origination efficiency and asset performance
� Benefiting from growth of sponsors as their new funds increase in size
� Significant opportunity to increase market penetration and enhance investment pipeline
Opportunity to Expand Network of Relationships
Established Relationships with Leading Middle Market Sponsors
Common Investment Philosophy
Consistent Market Focus
Reputation for Delivering on Commitments
Potential Sponsor
Relationships, (~1,400) 92%
Active Sponsor Relationships¹,
1198%
1 As of August 2009.
14
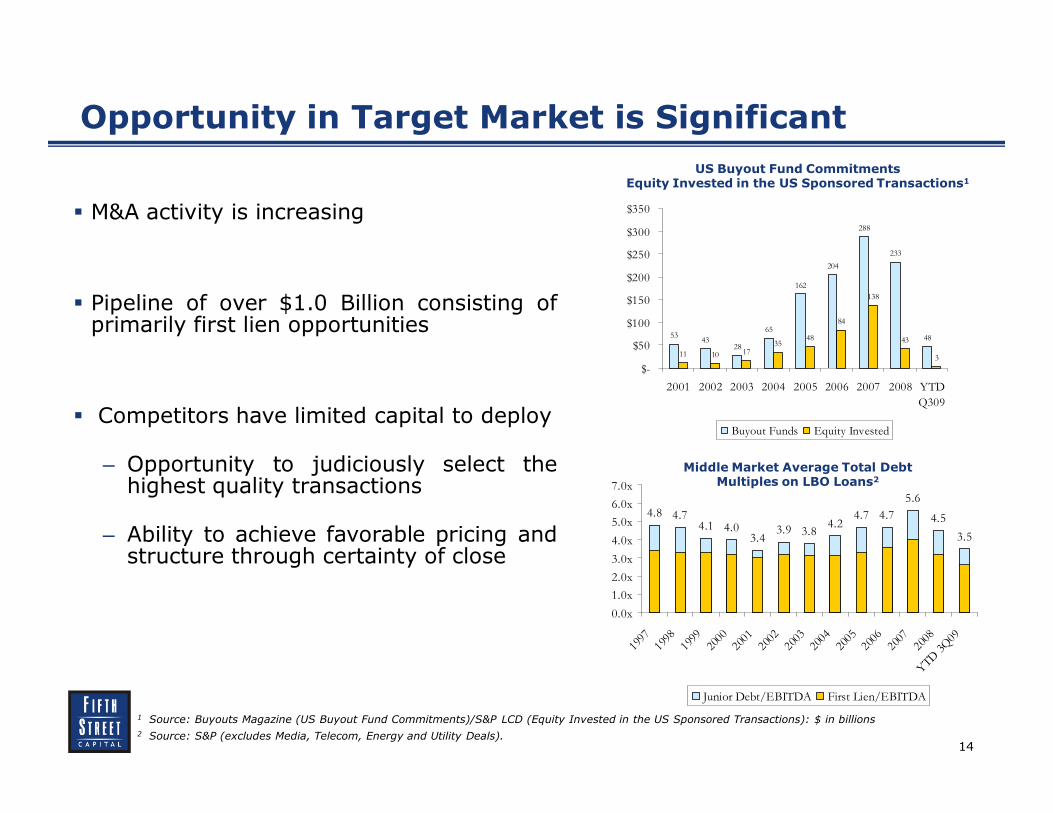
3.43.9 3.8
4.24.7 4.7
5.6
4.5
3.54.04.1
4.74.8
0.0x
1.0x
2.0x
3.0x
4.0x
5.0x
6.0x
7.0x
199719
9819
9920
0020
0120
0220
0320
0420
0520
0620
0720
08YTD
3Q09
Junior Debt/EBITDA First Lien/EBITDA
5343
28
65
162
204
288
233
48
11 10 1735
48
84
138
43
3
$-
$50
$100
$150
$200
$250
$300
$350
2001 2002 2003 2004 2005 2006 2007 2008 YTD
Q309
Buyout Funds Equity Invested
Opportunity in Target Market is Significant
� M&A activity is increasing
� Pipeline of over $1.0 Billion consisting ofprimarily first lien opportunities
� Competitors have limited capital to deploy
– Opportunity to judiciously select thehighest quality transactions
– Ability to achieve favorable pricing andstructure through certainty of close
1 Source: Buyouts Magazine (US Buyout Fund Commitments)/S&P LCD (Equity Invested in the US Sponsored Transactions): $ in billions
2 Source: S&P (excludes Media, Telecom, Energy and Utility Deals).
US Buyout Fund CommitmentsEquity Invested in the US Sponsored Transactions1
Middle Market Average Total Debt Multiples on LBO Loans2
15
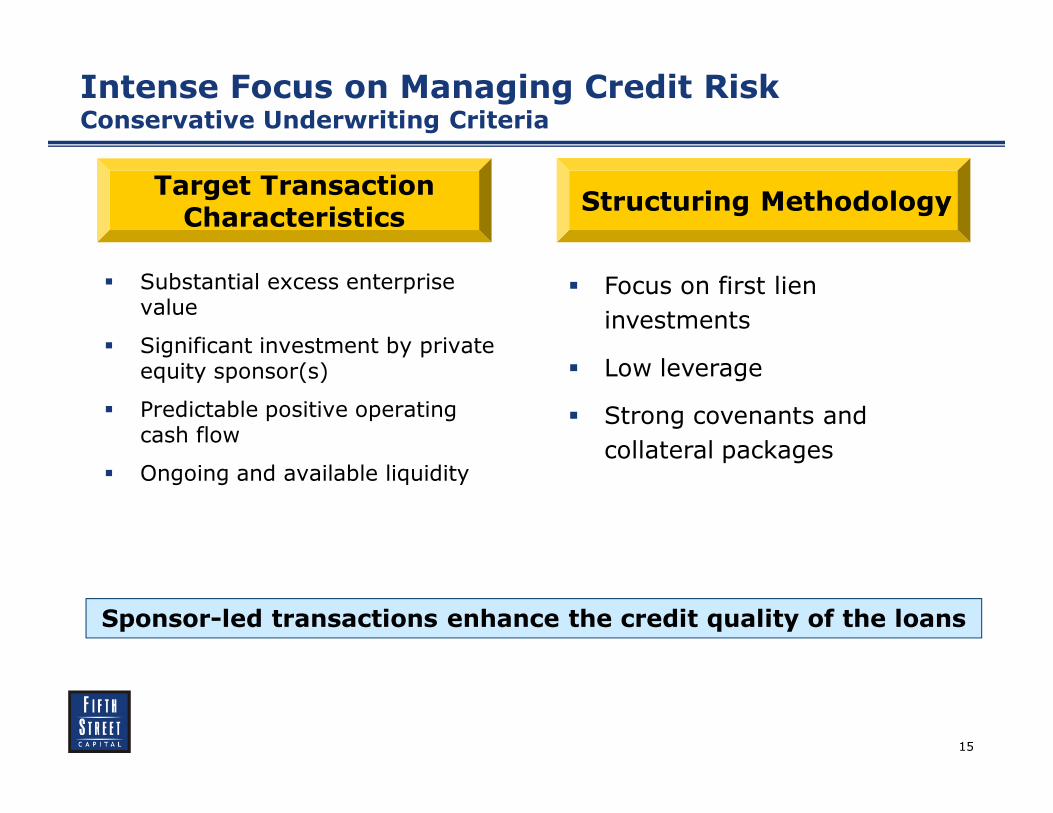
Intense Focus on Managing Credit Risk Conservative Underwriting Criteria
Structuring MethodologyTarget Transaction Characteristics
� Substantial excess enterprise value
� Significant investment by private equity sponsor(s)
� Predictable positive operating cash flow
� Ongoing and available liquidity
� Focus on first lien
investments
� Low leverage
� Strong covenants and
collateral packages
Sponsor-led transactions enhance the credit quality of the loans
16
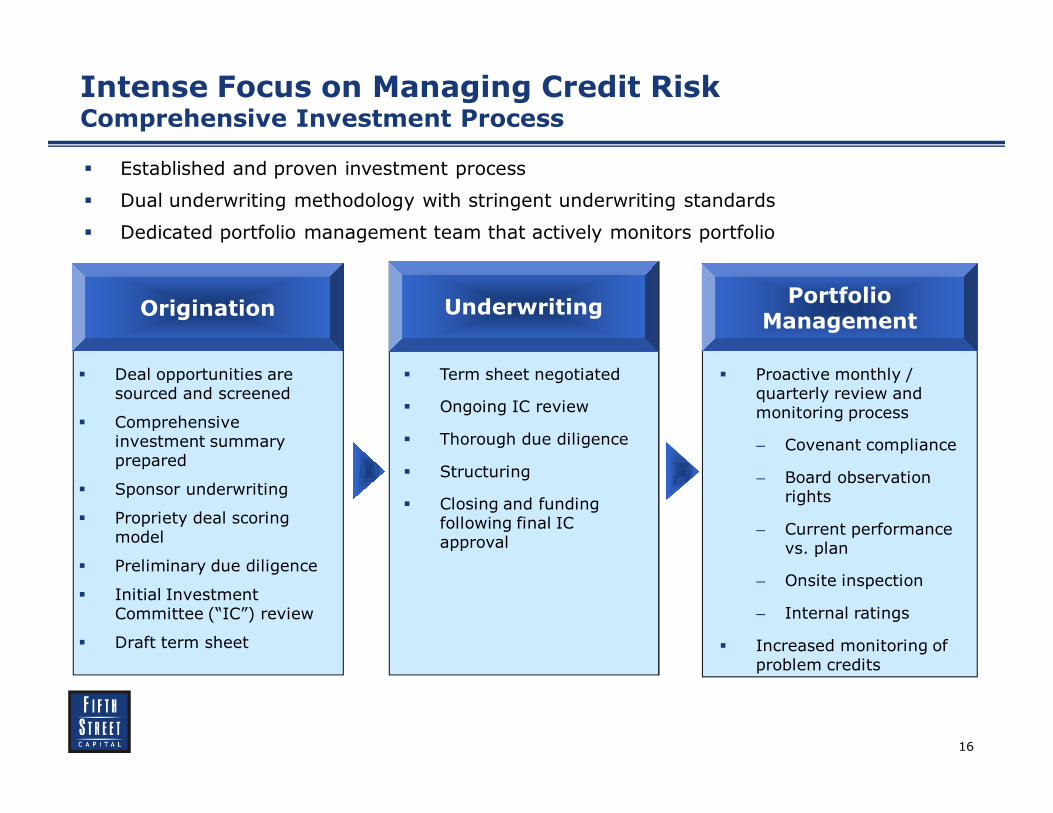
Intense Focus on Managing Credit Risk Comprehensive Investment Process
Portfolio Management
Origination Underwriting
� Deal opportunities are sourced and screened
� Comprehensive investment summary prepared
� Sponsor underwriting
� Propriety deal scoring model
� Preliminary due diligence
� Initial Investment Committee (“IC”) review
� Draft term sheet
� Term sheet negotiated
� Ongoing IC review
� Thorough due diligence
� Structuring
� Closing and funding following final IC approval
� Proactive monthly / quarterly review and monitoring process
– Covenant compliance
– Board observation rights
– Current performance vs. plan
– Onsite inspection
– Internal ratings
� Increased monitoring of problem credits
� Established and proven investment process
� Dual underwriting methodology with stringent underwriting standards
� Dedicated portfolio management team that actively monitors portfolio
17
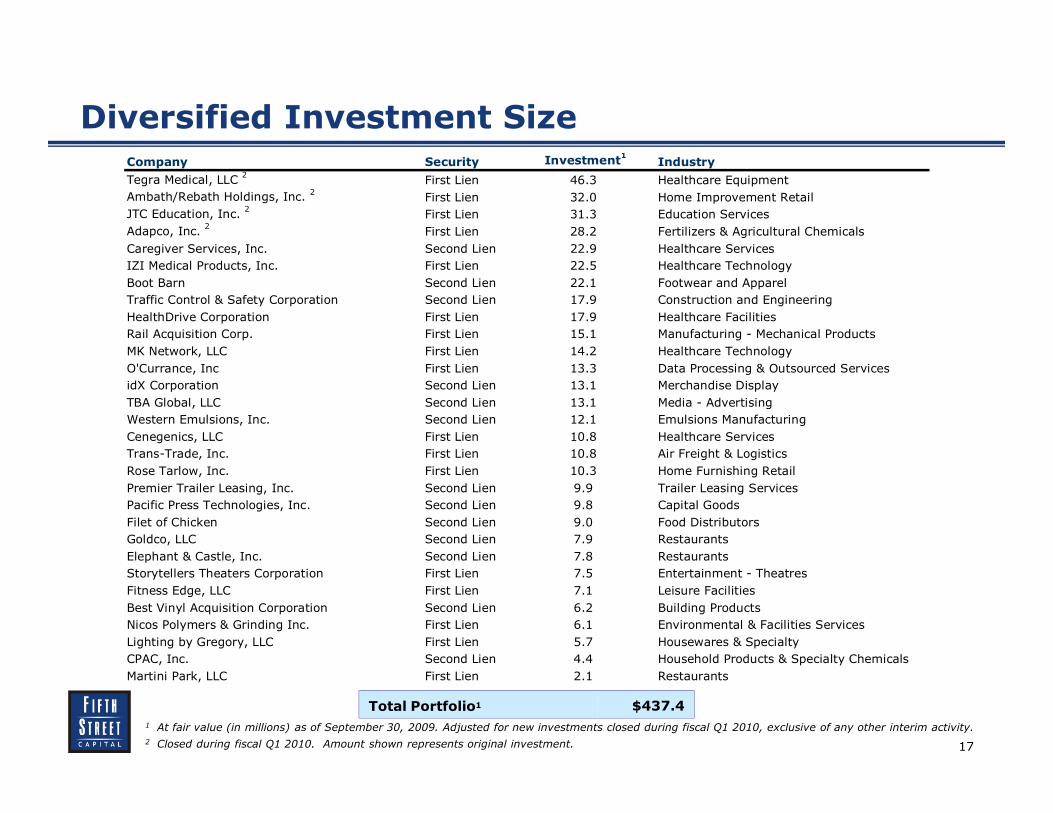
Diversified Investment Size
1 At fair value (in millions) as of September 30, 2009. Adjusted for new investments closed during fiscal Q1 2010, exclusive of any other interim activity.
2 Closed during fiscal Q1 2010. Amount shown represents original investment.
Total Portfolio1 $437.4
Company Security Investment1
Industry
Tegra Medical, LLC 2
First Lien 46.3 Healthcare Equipment
Ambath/Rebath Holdings, Inc. 2
First Lien 32.0 Home Improvement Retail
JTC Education, Inc. 2
First Lien 31.3 Education Services
Adapco, Inc. 2
First Lien 28.2 Fertilizers & Agricultural Chemicals
Caregiver Services, Inc. Second Lien 22.9 Healthcare Services
IZI Medical Products, Inc. First Lien 22.5 Healthcare Technology
Boot Barn Second Lien 22.1 Footwear and Apparel
Traffic Control & Safety Corporation Second Lien 17.9 Construction and Engineering
HealthDrive Corporation First Lien 17.9 Healthcare Facilities
Rail Acquisition Corp. First Lien 15.1 Manufacturing - Mechanical Products
MK Network, LLC First Lien 14.2 Healthcare Technology
O'Currance, Inc First Lien 13.3 Data Processing & Outsourced Services
idX Corporation Second Lien 13.1 Merchandise Display
TBA Global, LLC Second Lien 13.1 Media - Advertising
Western Emulsions, Inc. Second Lien 12.1 Emulsions Manufacturing
Cenegenics, LLC First Lien 10.8 Healthcare Services
Trans-Trade, Inc. First Lien 10.8 Air Freight & Logistics
Rose Tarlow, Inc. First Lien 10.3 Home Furnishing Retail
Premier Trailer Leasing, Inc. Second Lien 9.9 Trailer Leasing Services
Pacific Press Technologies, Inc. Second Lien 9.8 Capital Goods
Filet of Chicken Second Lien 9.0 Food Distributors
Goldco, LLC Second Lien 7.9 Restaurants
Elephant & Castle, Inc. Second Lien 7.8 Restaurants
Storytellers Theaters Corporation First Lien 7.5 Entertainment - Theatres
Fitness Edge, LLC First Lien 7.1 Leisure Facilities
Best Vinyl Acquisition Corporation Second Lien 6.2 Building Products
Nicos Polymers & Grinding Inc. First Lien 6.1 Environmental & Facilities Services
Lighting by Gregory, LLC First Lien 5.7 Housewares & Specialty
CPAC, Inc. Second Lien 4.4 Household Products & Specialty Chemicals
Martini Park, LLC First Lien 2.1 Restaurants
18
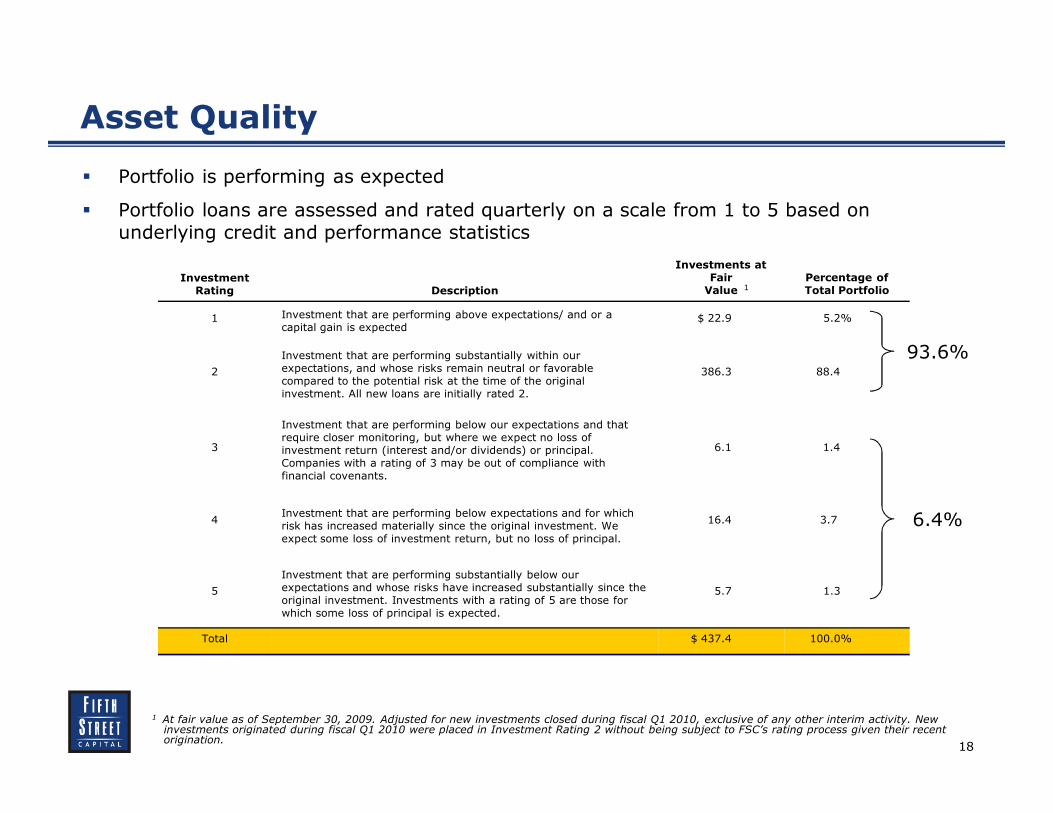
Asset Quality
� Portfolio is performing as expected
� Portfolio loans are assessed and rated quarterly on a scale from 1 to 5 based on underlying credit and performance statistics
Investment Rating Description
Investments at FairValue
Percentage of Total Portfolio
1 Investment that are performing above expectations/ and or a capital gain is expected
$ 22.9 5.2%
2
Investment that are performing substantially within our expectations, and whose risks remain neutral or favorable compared to the potential risk at the time of the original investment. All new loans are initially rated 2.
386.3 88.4
3
Investment that are performing below our expectations and that require closer monitoring, but where we expect no loss of investment return (interest and/or dividends) or principal. Companies with a rating of 3 may be out of compliance with financial covenants.
6.1 1.4%
4Investment that are performing below expectations and for which risk has increased materially since the original investment. We expect some loss of investment return, but no loss of principal.
16.4 3.7
5
Investment that are performing substantially below our expectations and whose risks have increased substantially since the original investment. Investments with a rating of 5 are those for which some loss of principal is expected.
5.7 1.3%
Total $ 437.4 100.0%
1 At fair value as of September 30, 2009. Adjusted for new investments closed during fiscal Q1 2010, exclusive of any other interim activity. New investments originated during fiscal Q1 2010 were placed in Investment Rating 2 without being subject to FSC’s rating process given their recent origination.
93.6%
6.4%
1
19
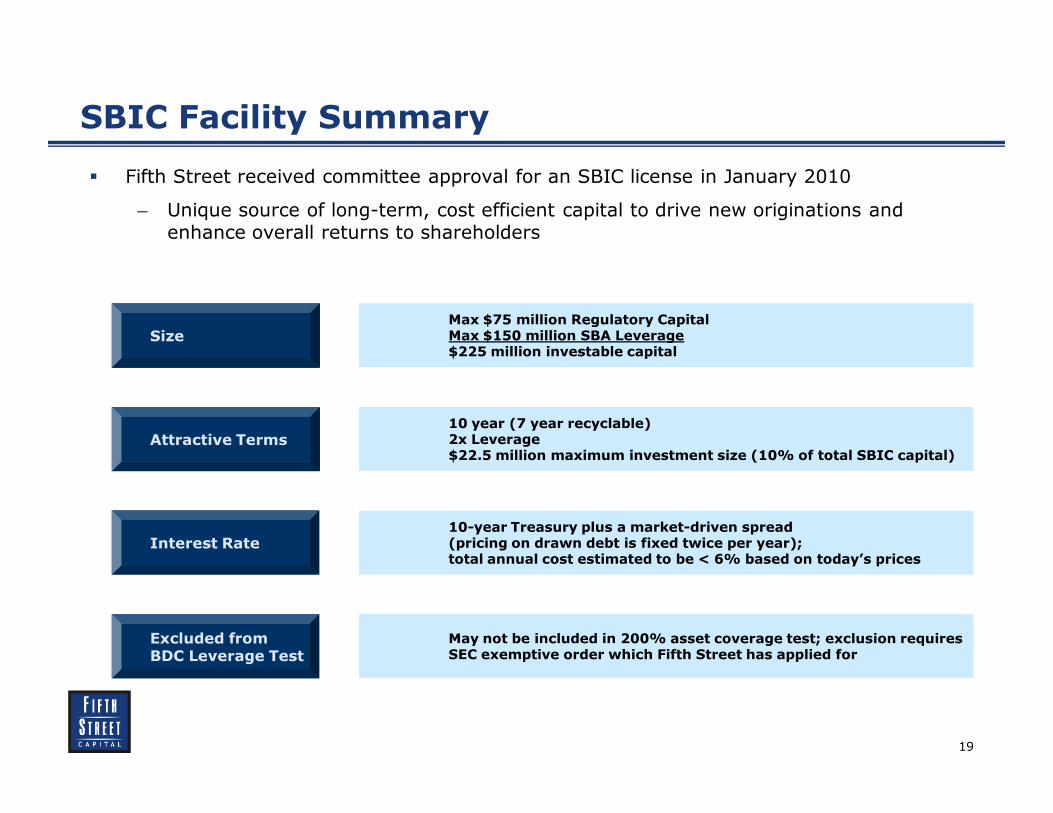
SBIC Facility Summary
Max $75 million Regulatory CapitalMax $150 million SBA Leverage$225 million investable capital
10 year (7 year recyclable)2x Leverage$22.5 million maximum investment size (10% of total SBIC capital)
10-year Treasury plus a market-driven spread(pricing on drawn debt is fixed twice per year);total annual cost estimated to be < 6% based on today’s prices
May not be included in 200% asset coverage test; exclusion requires SEC exemptive order which Fifth Street has applied for
� Fifth Street received committee approval for an SBIC license in January 2010
– Unique source of long-term, cost efficient capital to drive new originations and enhance overall returns to shareholders
Attractive Terms
Size
Interest Rate
Excluded from BDC Leverage Test
20
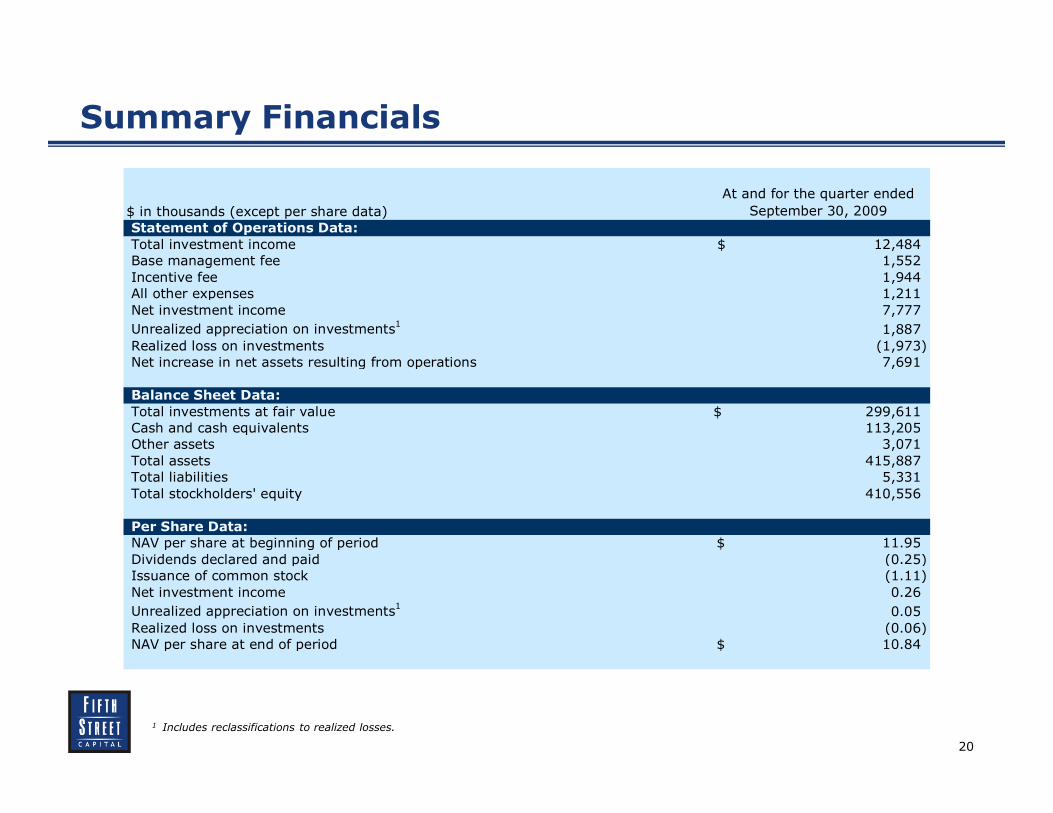
Summary Financials
1 Includes reclassifications to realized losses.
$ in thousands (except per share data)
At and for the quarter ended
September 30, 2009
Statement of Operations Data:
Total investment income 12,484$
Base management fee 1,552
Incentive fee 1,944
All other expenses 1,211
Net investment income 7,777
Unrealized appreciation on investments1
1,887
Realized loss on investments (1,973)
Net increase in net assets resulting from operations 7,691
Balance Sheet Data:
Total investments at fair value 299,611$
Cash and cash equivalents 113,205
Other assets 3,071
Total assets 415,887
Total liabilities 5,331
Total stockholders' equity 410,556
Per Share Data:
NAV per share at beginning of period 11.95$
Dividends declared and paid (0.25)
Issuance of common stock (1.11)
Net investment income 0.26
Unrealized appreciation on investments1
0.05
Realized loss on investments (0.06)
NAV per share at end of period 10.84$
21
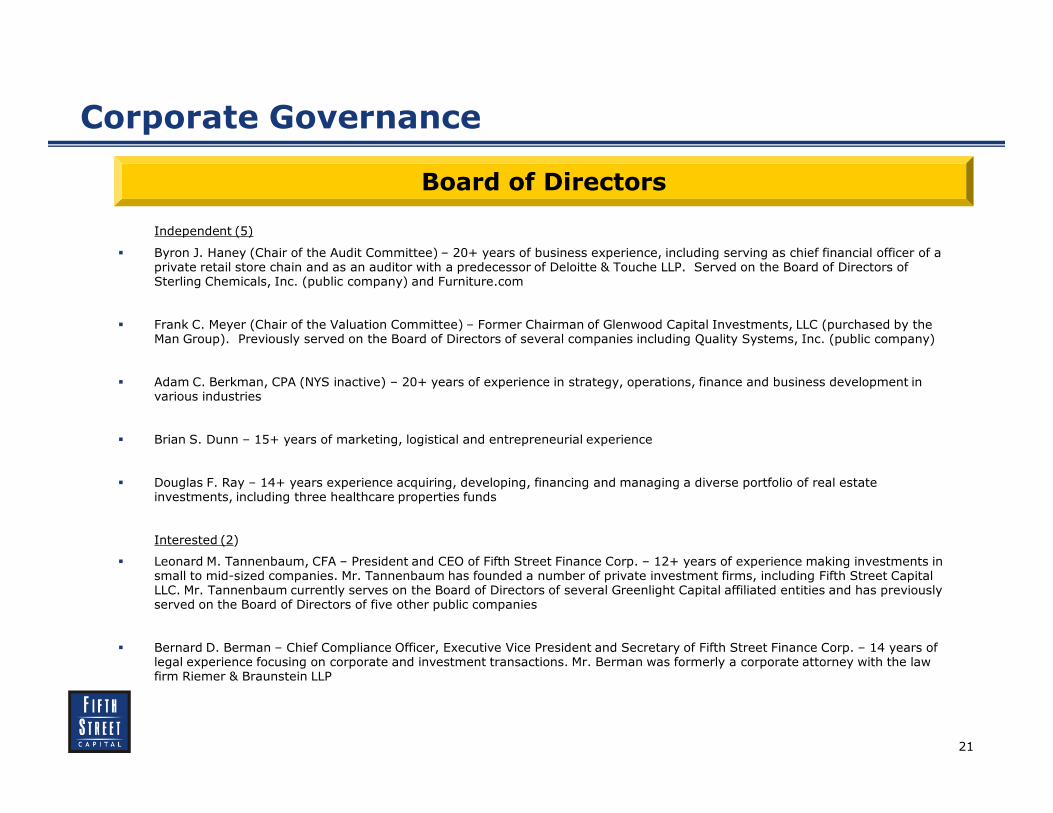
Corporate Governance
Independent (5)
� Byron J. Haney (Chair of the Audit Committee) – 20+ years of business experience, including serving as chief financial officer of a private retail store chain and as an auditor with a predecessor of Deloitte & Touche LLP. Served on the Board of Directors of Sterling Chemicals, Inc. (public company) and Furniture.com
� Frank C. Meyer (Chair of the Valuation Committee) – Former Chairman of Glenwood Capital Investments, LLC (purchased by the Man Group). Previously served on the Board of Directors of several companies including Quality Systems, Inc. (public company)
� Adam C. Berkman, CPA (NYS inactive) – 20+ years of experience in strategy, operations, finance and business development in various industries
� Brian S. Dunn – 15+ years of marketing, logistical and entrepreneurial experience
� Douglas F. Ray – 14+ years experience acquiring, developing, financing and managing a diverse portfolio of real estate investments, including three healthcare properties funds
Interested (2)
� Leonard M. Tannenbaum, CFA – President and CEO of Fifth Street Finance Corp. – 12+ years of experience making investments in small to mid-sized companies. Mr. Tannenbaum has founded a number of private investment firms, including Fifth Street Capital LLC. Mr. Tannenbaum currently serves on the Board of Directors of several Greenlight Capital affiliated entities and has previously served on the Board of Directors of five other public companies
� Bernard D. Berman – Chief Compliance Officer, Executive Vice President and Secretary of Fifth Street Finance Corp. – 14 years oflegal experience focusing on corporate and investment transactions. Mr. Berman was formerly a corporate attorney with the lawfirm Riemer & Braunstein LLP
Board of Directors
22
Summary Investment Highlights
� Yield
– High-quality investments with substantial cash yields
� Safety
– Intense focus on managing credit risk
� Transparency
– Releases monthly newsletters
� Relationships
– Strong relationships with private equity sponsors focused on small and mid-sized companies that drive new deal flow
� Experienced, cohesive management team that is aligned with investors
� Strong portfolio management expertise
23
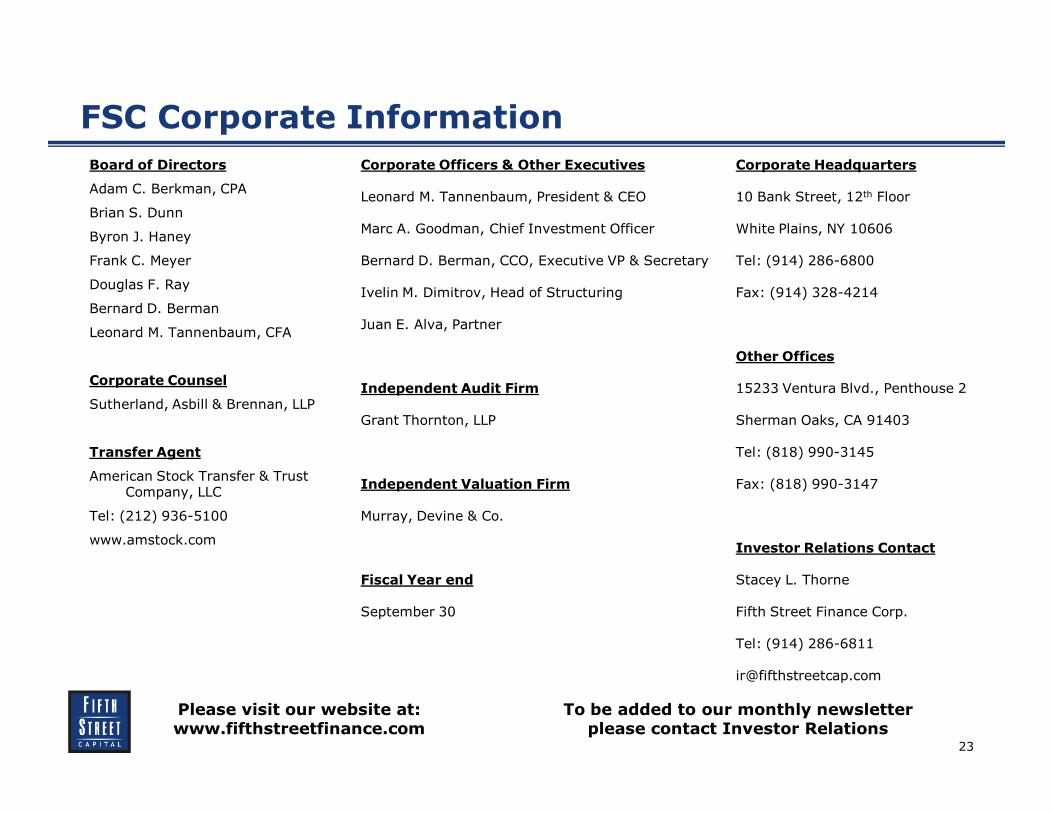
FSC Corporate Information
Board of Directors
Adam C. Berkman, CPA
Brian S. Dunn
Byron J. Haney
Frank C. Meyer
Douglas F. Ray
Bernard D. Berman
Leonard M. Tannenbaum, CFA
Corporate Counsel
Sutherland, Asbill & Brennan, LLP
Transfer Agent
American Stock Transfer & Trust Company, LLC
Tel: (212) 936-5100
www.amstock.com
Corporate Officers & Other Executives
Leonard M. Tannenbaum, President & CEO
Marc A. Goodman, Chief Investment Officer
Bernard D. Berman, CCO, Executive VP & Secretary
Ivelin M. Dimitrov, Head of Structuring
Juan E. Alva, Partner
Independent Audit Firm
Grant Thornton, LLP
Independent Valuation Firm
Murray, Devine & Co.
Fiscal Year end
September 30
Corporate Headquarters
10 Bank Street, 12th Floor
White Plains, NY 10606
Tel: (914) 286-6800
Fax: (914) 328-4214
Other Offices
15233 Ventura Blvd., Penthouse 2
Sherman Oaks, CA 91403
Tel: (818) 990-3145
Fax: (818) 990-3147
Investor Relations Contact
Stacey L. Thorne
Fifth Street Finance Corp.
Tel: (914) 286-6811
Please visit our website at: www.fifthstreetfinance.com
To be added to our monthly newsletter please contact Investor Relations
24
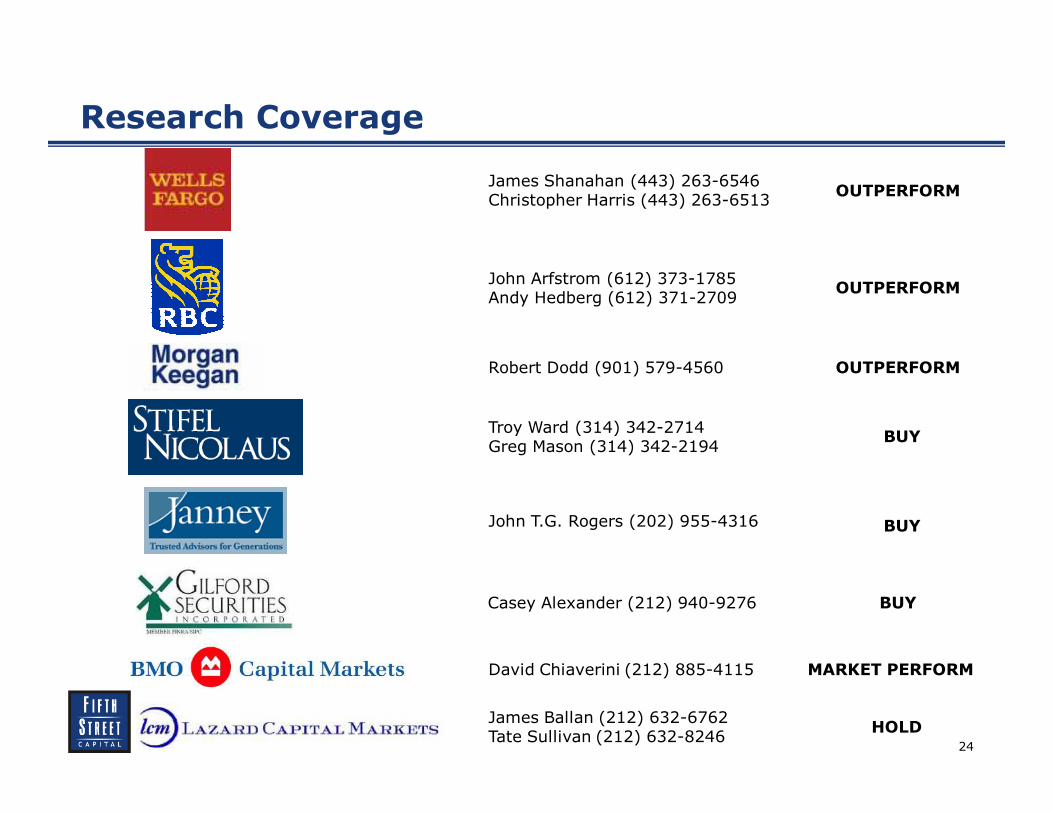
Research Coverage
James Shanahan (443) 263-6546 Christopher Harris (443) 263-6513
Troy Ward (314) 342-2714Greg Mason (314) 342-2194
David Chiaverini (212) 885-4115
Casey Alexander (212) 940-9276
John T.G. Rogers (202) 955-4316
James Ballan (212) 632-6762Tate Sullivan (212) 632-8246
John Arfstrom (612) 373-1785Andy Hedberg (612) 371-2709
BUY
BUY
OUTPERFORM
MARKET PERFORM
HOLD
BUY
OUTPERFORM
Robert Dodd (901) 579-4560 OUTPERFORM
25
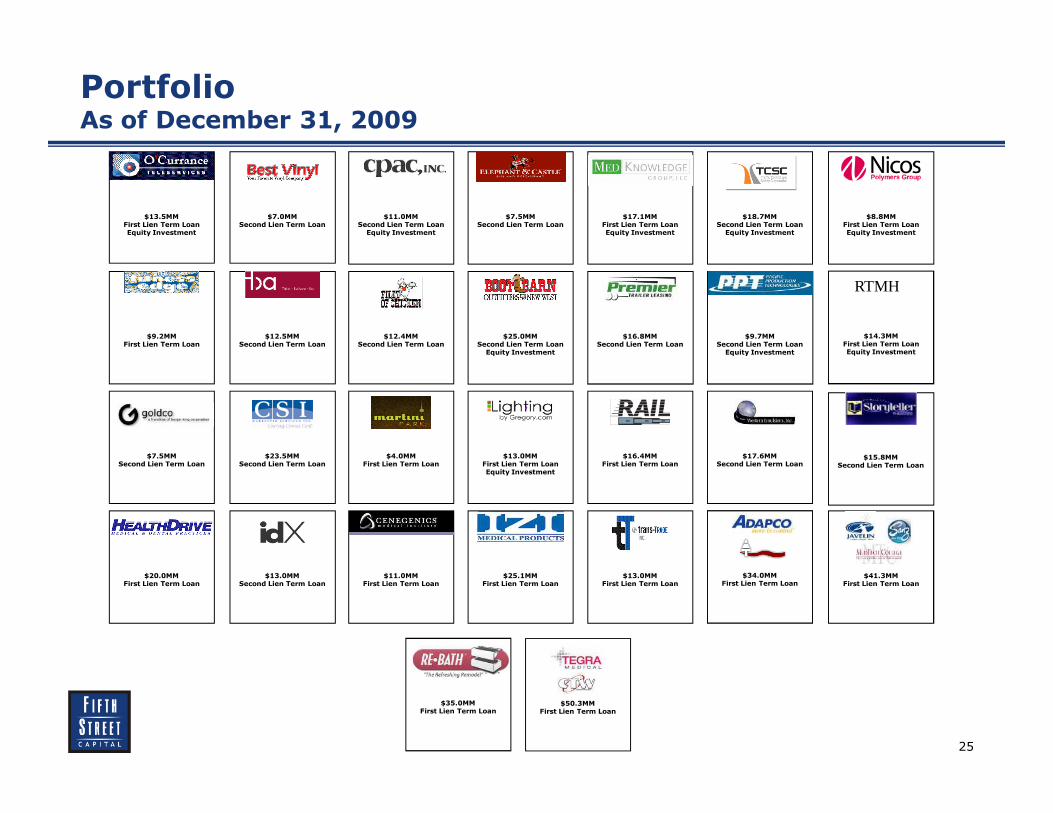
Portfolio As of December 31, 2009
$13.5MMFirst Lien Term LoanEquity Investment
$7.0MMSecond Lien Term Loan
$11.0MMSecond Lien Term LoanEquity Investment
$7.5MMSecond Lien Term Loan
$17.1MMFirst Lien Term LoanEquity Investment
$9.2MMFirst Lien Term Loan
$12.5MMSecond Lien Term Loan
$12.4MMSecond Lien Term Loan
$25.0MMSecond Lien Term LoanEquity Investment
$9.7MMSecond Lien Term LoanEquity Investment
$7.5MMSecond Lien Term Loan
$23.5MMSecond Lien Term Loan
$4.0MMFirst Lien Term Loan
$13.0MMFirst Lien Term LoanEquity Investment
$16.4MMFirst Lien Term Loan
$17.6MMSecond Lien Term Loan
$20.0MMFirst Lien Term Loan
$13.0MMSecond Lien Term Loan
$11.0MMFirst Lien Term Loan
$14.3MMFirst Lien Term LoanEquity Investment
RTMH
$15.8MMSecond Lien Term Loan
$18.7MMSecond Lien Term LoanEquity Investment
$16.8MMSecond Lien Term Loan
$8.8MMFirst Lien Term LoanEquity Investment
$25.1MMFirst Lien Term Loan
$13.0MMFirst Lien Term Loan
$34.0MMFirst Lien Term Loan
$41.3MMFirst Lien Term Loan
$35.0MMFirst Lien Term Loan
$50.3MMFirst Lien Term Loan