Embed Size (px)
Citation preview

REPUBLIC OF BULGARIA
FIFTH NATIONAL COMMUNICATION
ON CLIMATE CHANGE (Second Submission)
UNITED NATIONS
FRAMEWORK CONVENTION ON CLIMATE CHANGE
SOFIA, 2011
1
TABLE OF CONTENTS LIST OF ABBREVIATIONS............................................................................................................... 4 LIST OF FIGURES .............................................................................................................................. 5 LIST OF TABLES ................................................................................................................................ 7 INTRODUCTION ............................................................................................................................... 10 1. EXECUTIVE SUMMARY ........................................................................................................ 13
1.1. Introduction ............................................................................................................... 13 1.2. National Circumstances............................................................................................. 14 1.3. Inventories of Greenhouse Gas Emissions by Sources and Removals by Sinks ...... 15 1.4. Policies and Measures ............................................................................................... 19 1.5. Projections and Total Effect of Policies and Measures, and Supplementary Relating
to Kyoto Protocol Mechanisms ................................................................................. 21 1.6. Vulnerability Assessment, Climate Change Influence and Adaptation Measures.... 23 1.7. Financial resources and transfer of technology, including information under Articles
10 and 11, of the Kyoto Protocol .............................................................................. 25 1.8. Education, Training and Public Awareness .............................................................. 25 1.9. Research projects and systematic observation .......................................................... 26
2. NATIONAL CIRCUMSTANCES RELEVANT TO GREENHOUSE GAS EMISSIONS AND REMOVALS .............................................................................................................................. 29
2.1. Government Structure ............................................................................................... 29 2.2. Geographic Profile .................................................................................................... 29 2.3. Climate Profile .......................................................................................................... 29 2.4. Population Profile...................................................................................................... 31 2.5. Economic Profile....................................................................................................... 32 2.6. Privatization .............................................................................................................. 33 2.7. Sectors ....................................................................................................................... 33
2.7.1. Land Use and National Resources ................................................................... 34 2.7.2. Agriculture ....................................................................................................... 34 2.7.3. Forestry............................................................................................................. 35
2.8. Biodiversity ............................................................................................................... 36 2.9. Taxes and Tax Policy ................................................................................................ 37 2.10. Energy and Industrial Profile .................................................................................... 37
2.10.1. Energy Profile .................................................................................................. 37 2.10.2. Industrial Profile............................................................................................... 39
2.11. Transport ................................................................................................................... 39 2.12. Waste......................................................................................................................... 40 2.13. Flexibility in accordance with Article 4.6 and 4.10 .................................................. 41
3. GREENHOUSE GAS INVENTORY INFORMATION......................................................... 42 3.1. Introduction ............................................................................................................... 42 3.2. Summary Tables........................................................................................................ 42 3.3. Descriptive Summary................................................................................................ 47
3.3.1. Energy .............................................................................................................. 52 3.3.2. Industrial Processes .......................................................................................... 54 3.3.3. Agriculture ....................................................................................................... 59 3.3.4. Waste................................................................................................................ 60 3.3.5. Land use, land use change and forestry............................................................ 64 3.3.6. Summary of Methodology and Data Sources .................................................. 72 3.3.7. Recalculations .................................................................................................. 74
3.4. National systems in accordance with Article 5, paragraph 1, of the Kyoto protocol.... .................................................................................................................................. 75

2
3.4.8. Description of the Institutional Arrangement for Inventory Preparation......... 77 3.4.9. Institutional Arrangements............................................................................... 81 3.4.10. Collection of activity data by ExEA: ............................................................... 81 3.4.11. Quality management system ............................................................................ 82 3.4.12. Brief Description of the Inventory Preparation Process................................... 85 3.4.13. Brief General Description of Methodologies and Data Sources Used............. 86 3.4.14. Quality assurance and quality control (QA/QC) .............................................. 88 3.4.15. QA/QC activities of data provider ................................................................... 88 3.4.16. Inventory preparation ....................................................................................... 90 3.4.17. Documentation and data archiving................................................................... 91
3.5. Information on the National Registry System........................................................... 92 4. POLICIES AND MEASURES .................................................................................................. 96
4.1. Policy - making process ............................................................................................ 96 4.2. Domestic and regional programmes and/or legislative arrangements and
enforcement and administrative procedures.............................................................. 98 4.3. Policies and measures and their effects................................................................... 100
4.3.1. Real and expected interaction with other relevant policies and measures and with the relevant policies and legislation of the European Community. ....................... 101 4.3.2. Energy sector.................................................................................................. 102 4.3.3. Industry........................................................................................................... 106 4.3.4. Residential Sector and Commercial/Institutional Buildings .......................... 109 4.3.5. Transport ........................................................................................................ 111 4.3.6. Agriculture ..................................................................................................... 114 4.3.7. Waste Management ........................................................................................ 116 4.3.8. The status of implementation and Quantitative evaluation of the sectoral policies 117 4.3.9. Policies and measures pursuant to Article 2 of the Kyoto Protocol............... 118 4.3.10. Information on minimization of adverse effects (including adverse effects of climate change) on developing countries in the implementation of policies and measures ........................................................................................................................ 119
4.4. Policies and measures no longer in place................................................................ 120 5. PROJECTIONS AND TOTAL EFFECT OF POLICIES AND MEASURES ................... 125
5.1. PROJECTIONS....................................................................................................... 125 5.1.1. Background and scenarios.............................................................................. 125
5.2. Sectoral forecasts..................................................................................................... 126 5.2.1. Energy ............................................................................................................ 126 5.2.2. Industry........................................................................................................... 130 5.2.3. Renewable energy sources ............................................................................. 131 5.2.4. Transport ........................................................................................................ 131 5.2.5. Services .......................................................................................................... 132 5.2.6. Financial sector .............................................................................................. 133 5.2.7. Agriculture ..................................................................................................... 134 5.2.8. Waste.............................................................................................................. 136 5.2.9. Projections of total GHG emissions and total effect of policies and measures.... ........................................................................................................................ 137
5.3. Supplementary relating to mechanisms under Article 6, 12 and 17, of the Kyoto Protocol ................................................................................................................... 141
5.4. Methodology used for the presented GHG emission projections ........................... 141 5.4.1. Energy ............................................................................................................ 143 5.4.2. Industry........................................................................................................... 144

3
5.4.3. Renewable energy sources ............................................................................. 145 5.4.4. Transport ........................................................................................................ 145 5.4.5. Services .......................................................................................................... 146 5.4.6. Financial sector .............................................................................................. 146 5.4.7. Agriculture ..................................................................................................... 147 5.4.8. Waste.............................................................................................................. 148
5.5. Projections sensitivity analysis, focused on the key input variables....................... 149 5.5.1. Specific assumptions related to the with measures scenario for GHG emissions ........................................................................................................................ 149 5.5.2. Sensitivity and Energy intensity..................................................................... 150
6. VULNERABILITY ASSESSMENT, CLIMATE CHANGE IMPACTS AND ADAPTATION MEASURES ........................................................................................................... 151
6.1. Background ............................................................................................................. 151 6.2. Expected Impacts of Climate Change for Eastern Europe including Bulgaria ....... 156
6.2.1. Climate Scenarios for 2050 ............................................................................ 156 6.2.2. Climate Scenarios for the 2080s and end of 21 Century................................ 159 6.2.3. Agriculture ..................................................................................................... 163 6.2.4. Forestry........................................................................................................... 165
6.3. Vulnerability Assessment........................................................................................ 167 6.4. Adaptation measures ............................................................................................... 169
6.4.1. Agriculture ..................................................................................................... 169 6.4.2. Forestry........................................................................................................... 175 6.4.3. Soils................................................................................................................ 182
7. FINANCIAL RESOURCES AND TRANSFER OF TECHNOLOGY................................ 183 7.1. Provision of .new and additional. financial resources............................................. 183 7.2. Assistance to developing country Parties that are particularly vulnerable to climate
change...................................................................................................................... 183 7.3. Provision of financial resources, including financial resources under Article 11 of
the Kyoto Protocol .................................................................................................. 183 7.4. Activities related to transfer of technology ............................................................. 183 7.5. Information under Article 10 of the Kyoto Protocol............................................... 187
8. RESEARCH PROJECTS AND SYSTEMATIC OBSERVATION..................................... 189 8.1. General policy on research and systematic observation.......................................... 189 8.2. Research .................................................................................................................. 189 8.3. Systematic Observation........................................................................................... 195
9. EDUCATION, TRAINING AND PUBLIC AWARENESS ................................................. 202 9.1. Introduction ............................................................................................................. 202 9.2. Education................................................................................................................. 202
9.2.1. Environmental Education in Schools ............................................................. 204 9.2.2. Development of Specific Syllabuses for Training of Teachers and Lecturers..... ........................................................................................................................ 205
9.3. Ecotourism .............................................................................................................. 205 ANNEXES.......................................................................................................................................... 206
A.I Summary tables on emission trends............................................................................. 207 A.II Summary of reporting of the Supplementary information under Article 7, paragraph 2,
of the Kyoto Protocol .............................................................................................. 223

4
LIST OF ABBREVIATIONS a.s.l. above see level BAS Bulgarian Academy of Sciences DSSAT Decision Support System for Agrotechnology Transfer EC European Commission EE Energy Efficiency EEA Energy Efficiency Agency EPER European Pollutant Emission Register EU European Union EU ETS European Union Emission Trading Scheme ExEA Executive Environmental Agency FCCC Framework Convention on Climate Change FEC Final Energy Consumption FEC Final Energy Consumption GDP Gross Domestic Product GEF Global Environmental Facility GHG Green House Gases GVA Gross Value Added HPP Hydro Power Plant IMCCC Inter-Ministerial Committee on Climate Change IPPC Integrated Pollution Prevention and Control ISPA, PHARE, SAPHARD
European Union funds and programmes
IWG Interministerial Working Group JI Joint Implementation JISC Joint Implementation Steering Committee KP Kyoto Protocol LUCF Land use Change and Forestry MAF Ministry of Agriculture and Food. MEE Ministry of Economy and Energy MEYS Ministry of Education, Youth and Science MF Ministry of Finance MFA The Ministry of Foreign Affairs MOEW Ministry of Environment and Water MRDPW Ministry of Regional Development and Public Works NCCAP (NAPCC) National Climate Change Action Plan NFD National Forestry Directorate NGO Nongovernmental Organization NIMH National Institute of Meteorology and Hydrology NPP Nuclear Power Plant NSI National Statistical Institute PEC Primary Energy Consumption PRTR Pollutant Release and Transfer Register R&D Research and Development RES Renewable Energy Sources SAF State Agricultural Fund SC Steering Committee SME small and medium-sized enterprises TPP Thermal Power Plant UN United Nations UNFCCC United Nations Framework Convention on Climate Change

5
LIST OF FIGURES Figure 1.1Total greenhouse gas emissions in CO2 eqv. Gg ..................................................... 17 Figure 1.2 Aggregated total GHG Emissions, Gg CO2 eqv. .................................................... 22 Figure 1.3 Anomalies of annual temperature in Bulgaria during the period 1901-2010, relative
to 1961-1990. ................................................................................................................... 23 Figure 1.4 Anomalies of annual precipitation in Bulgaria during the 20th century................. 24 Figure 3.1 The GHG distribution for 1988 (F-gases 1995)...................................................... 49 Figure 3.2 The GHG distribution for 2008 .............................................................................. 49 Figure 3.3 Total greenhouse gas emissions in CO2 eqv. Gg .................................................... 50 Figure 3.4 Fuel mix in fuel sales to road transport in 1988 ..................................................... 53 Figure 3.5 Fuel mix in fuel sales to road transport in 2008 ..................................................... 54 Figure 3.6 CO2 emission trends from Industrial processes, Gg ............................................... 56 Figure 3.7 CH4 emissions from Agriculture, Gg...................................................................... 60 Figure 3.8 CH4 emissions from Waste sector, Gg.................................................................... 61 Figure 3.9 CH4 emissions from Solid Waste Disposal on Land, Gg ....................................... 62 Figure 3.10 CH4 emissions from Industrial wastewater for 1988 – 2008, Gg ......................... 63 Figure 3.11 CH4 emissions from Domestic/Commercial wastewater for 1988 – 2008, Gg .... 63 Figure 3.12 Organizational Chart of the Bulgarian National Inventory System...................... 78 Figure 3.13: Bulgarian National Inventory System – Responsibilities.................................... 80 Figure 3.14: National quality assurance and quality control program ..................................... 83 Figure 3.15 Documentation and data archiving in ExEA ........................................................ 92 Figure 5.1 Emission projections for sector Energy, СО2 eqv., Gg ........................................ 127 Figure 5.2 Projection emissions for General Energy sector, СО2 eqv., Gg ........................... 129 Figure 5.3 Projections of process GHG emissions in Industry, СО2 eqv., Gg....................... 130 Figure 5.4 Projected GHG emissions from sector Transport, Gg CO2 eqv. .......................... 132 Figure 5.5 Projection of total GHG emissions from sector Services, Gg CO2 еqv................ 133 Figure 5.6 Projection GHG emission from sector Financial, Gg CO2 еqv. ........................... 134 Figure 5.7 Projection GHG emission from sector Agriculture, Gg CO2 еqv......................... 135 Figure 5.8 Projection of total GHG emissions from sector Wastes, Gg CO2 еqv.................. 136 Figure 5.9 Aggregated total GHG Emissions, Gg CO2 eqv. .................................................. 138 Figure 5.10 Total CO2 emissions without LULUCF, Gg....................................................... 138 Figure 5.11 Total CH4 emissions without LULUCF, Gg....................................................... 139 Figure 5.12 Total N2O emissions without LULUCF, Gg ...................................................... 140 Figure 6.1 Air temperature in winter (left) and summer (right) during the current climate .. 152 Figure 6.2 Annual precipitation (in mm) during the current climate ..................................... 153 Figure 6.3 Anomalies of annual temperature in Bulgaria during the period 1901-2010, relative
to 1961-1990. ................................................................................................................. 153 Figure 6.4 Deviations of annual average air temperature (in °C) and annual precipitation (in
%) in 2007, relative to the climate normals for the period 1961-1990. ......................... 154 Figure 6.5 Anomalies of annual precipitation in Bulgaria during the 20th century............... 154 Figure 6.6 Annual precipitation in 2005 and monthly precipitation in August 2007 (as % from
the norm) ........................................................................................................................ 155 Figure 6.7 Weather and climate extremes. ............................................................................. 155 Figure 6.8 Annual-mean air temperature at 2m (upper, °C) and precipitation rate (lower,
mm/day) in function of time from 1951 to 2050. The spatial average was performed for the CLAVIER region (Hungary, Romania and Bulgaria).............................................. 156
Figure 6.9 Changes of surface air temperature (left, °C) and precipitation rate (right, mm/day) as predicted by LMDZ-regional (2001/2050 - 1951/2000). The upper panels are from LMDZ-regional forced by the MPI global climate model ............................................. 157

6
Figure 6.10 Trend analysis for tropical nights ....................................................................... 160 Figure 6.11 Trend analyses for the greatest 5-day rainfall..................................................... 161 Figure 6.12 Monthly HaDCM3 climate change scenarios values of air temperature (a) and
precipitation (b) in Novachene (north Bulgaria) for the 2020, 2050 and 2080.............. 162 Figure 6.13 Climate change scenarios in Bulgaria for the end of the 21st century ............... 162 Figure 6.14 Summer days (Tmax>25ºC), 1961-1990 (left). 2021-2050 (right)..................... 163 Figure 6.15 Seasonal and yearly time series .......................................................................... 164 Figure 6.16 HadCM3 B2 changes (in days) in sunflower growing duration in the Balkan
Peninsula for 2071- 2080, relative to current climate; RoIMPEL model ...................... 165 Figure 6.17 HadCM3 A2 changes (in %) in sunflower yield in the Balkan Peninsula for 2071-
2080, relative to current climate; RоIMPEL model....................................................... 165 Figure 8.1 NIMH weather network ........................................................................................ 196

7
LIST OF TABLES Table 1.1 Aggregated GHG emissions by sector, Gg, CO2 eqv............................................... 18 Table 2.1 Demographic data for the country............................................................................ 31 Table 2.2 GDP, 2000 prices ..................................................................................................... 32 Table 2.3 Main economic indicators ........................................................................................ 32 Table 2.4 Trade balance ........................................................................................................... 33 Table 2.5 Relative share of the private sector in GDP (%) ...................................................... 33 Table 2.6 Land use in Bulgaria – general information, 2007................................................... 34 Table 2.7 Total and wooded forest area, 1000 ha .................................................................... 35 Table 2.8 Biodiversity .............................................................................................................. 36 Table 2.9 Structure of final energy consumption (Per cent) .................................................... 37 Table 2.10 Final energy consumption (PJ)............................................................................... 38 Table 2.11 Output of the industrial enterprises by kind of ownership (Per cent) .................... 39 Table 2.12 Passengers carried – thousands .............................................................................. 39 Table 2.13 Transport of goods - thousand tons........................................................................ 40 Table 2.14 Waste, thousand tons.............................................................................................. 41 Table 3.1 Summary of emission trend per source category and gas, Gg CO2 eqv. ................. 44 Table 3.2 Summary emissions from GHG-precursors and SOx .............................................. 47 Table 3.3 The summary emission trends of main GHG (without reporting LUCF), Gg,
CO2 eqv. ........................................................................................................................... 48 Table 3.4 Aggregated GHG emissions by sector, Gg, CO2 eqv............................................... 50 Table 3.5 Sector contribution in aggregated emissions, % ...................................................... 51 Table 3.6 Summary overview for Key categories, 2008.......................................................... 52 Table 3.7 Trend in greenhouse gas emissions from Industrial Processes, Gg ......................... 55 Table 3.8 CO2 emissions from Mineral products 1988-2008, Gg............................................ 57 Table 3.9 GHG emissions from Chemical industry processes, Gg.......................................... 58 Table 3.10 GHG emissions from Metal industry processes, Gg.............................................. 59 Table 3.11 CO2 emission/removals from changes in forest and other woody biomass stocks,
[Gg] .................................................................................................................................. 64 Table 3.12 Areas by Type of Land use and land use changes for the base year and the last year
of inventory. ..................................................................................................................... 65 Table 3.13 Categories assessed for emissions/removals - Cropland........................................ 68 Table 3.14 Categories assessed for emissions/removals - Grassland....................................... 70 Table 3.15 Differences between Submission 2009 and Submission 2010 for 1988-2007 due to
recalculation ..................................................................................................................... 74 Table 3.16 Differences between Submission 2009 and Submission 2010 by sectors for 2007
due to recalculation .......................................................................................................... 75 Table 3.17: Sources of activity data for preparation of national GHGs emission inventory ... 82 Table 3.18 QC experts within the BGNIS................................................................................ 84 Table 3.19 Methods and the emission factors applied ............................................................. 87 Table 3.20 Responsibilities in the exchange of check lists between QC experts for 2010
submission........................................................................................................................ 89 Table 3.21 Responsibilities in exchange of the check lists between QA experts and sector
experts for 2010 submission............................................................................................. 90 Table 3.22 Responsibilities for preparation of the Sector emission inventories for 2010
submission........................................................................................................................ 91 Table 3.23 Responsibilities for preparation of the national GHG inventory for 2010
submission........................................................................................................................ 91 Table 4.1. The applicable instruments for mitigation measures in the energy sector ............ 102

8
Table 4.2 The applicable instruments for the manufacturing industry sector ........................ 106 Table 4.3. Policy instruments applicable in the residential sector and commercial/institutional
buildings ......................................................................................................................... 110 Table 4.4 Applicable instruments for the transportation sector ............................................. 112 Table 4.5 Applicable policy instruments for the agricultural sector ...................................... 115 Table 4.6 The applicable policy instruments for the waste sector ......................................... 117 Table 4.7 Summary of policies and measures for energy sector............................................ 121 Table 4.8 Summary of policies and measures for the industrial sector.................................. 122 Table 4.9 Summary of policies and measures for the residential sector and
commercial/institutional buildings................................................................................. 123 Table 4.10 Summary of policies and measures for the sector agriculture ............................. 123 Table 4.11 Summary of policies and measures for the transport sector ................................ 124 Table 4.12 Summary of policies and measures for the waste sector...................................... 124 Table 5.1 Emission projections for sector Energy, СО2 eqv., Gg.......................................... 126 Table 5.2 CO2 emission projections for sector Energy, Gg ................................................... 127 Table 5.3 CH4 emission projections for sector Energy, Gg ................................................... 127 Table 5.4 N2O emission projections for sector Energy, Gg ................................................... 127 Table 5.5 Projection of emissions for General Energy sector, СО2 eqv., Gg ....................... 128 Table 5.6 Total emission projections for sector Industrial Process,СО2 eqv., Gg ................. 130 Table 5.7 CO2 emission projections for sector Industrial Process, Gg .................................. 130 Table 5.8 CH4 emission projections for sector Industrial Process, Gg .................................. 131 Table 5.9 N2O emission projections for sector Industrial Process, Gg .................................. 131 Table 5.10 Projected GHG emissions from sector Transport, Gg CO2 eqv........................... 132 Table 5.11 Projection GHG emission from sector Services, Gg CO2 еqv. ............................ 133 Table 5.12 Projection of total GHG emissions from sector Financial, Gg CO2 еqv.............. 134 Table 5.13 Total emission projections for sector Agriculture, СО2 eqv., Gg. ....................... 135 Table 5.14 CH4 emission projections for sector Agriculture, Gg. ......................................... 135 Table 5.15 N2O emission projections for sector Agriculture, Gg. ......................................... 135 Table 5.16 Total emission projections for sector Wastes, СО2 eqv., Gg. .............................. 137 Table 5.17 CH4 emission projections for sector Waste, Gg................................................... 137 Table 5.18 N2O emission projections for sector Waste, Gg................................................... 137 Table 5.19 Aggregated total GHG Emissions, Gg CO2 eqv. ................................................. 138 Table 5.20 Total CO2 emissions without LULUCF, Gg. ....................................................... 139 Table 5.21 Total CH4 emissions without LULUCF, Gg. ....................................................... 139 Table 5.22 Total N2O emissions without LULUCF, Gg........................................................ 140 Table 5.23 GDP projection, mln lv., 2001, ............................................................................ 142 Table 5.24 Forecast for gross electricity demand, GWh........................................................ 144 Table 5.25 GVA projection in sector Industry, mln leva 2001 .............................................. 145 Table 5.26 Forecast of capacity and electricity production by RES ...................................... 145 Table 5.27 GVA projection in sector Transport, mln leva 2001............................................ 146 Table 5.28 GVA projection in sector Services, mln leva 2001.............................................. 146 Table 5.29 GVA projection in sector Financial, mln leva 2001 ............................................ 147 Table 5.30 Projection for the GVA in sector Agriculture, mln leva 2001 ............................. 147 Table 5.31 Reported quantities of residential solid wastes and a rate for accumulation ....... 148 Table 5.32 Projections for amounts of solid waste in sector Waste, kt.................................. 149 Table 5.33 Final energy consumption – PJ ............................................................................ 150 Table 5.34 Forecast of structure energy demand by sector, % .............................................. 150 Table 5.35 Energy intensity of GDP ...................................................................................... 150

9
Table 6.1 Spatial average of surface air temperature in Bulgaria for the two A1B scenarios (from respectively MPI and IPSL) and the B1 scenario from MPI global climate model:........................................................................................................................................ 157
Table 6.2 Spatial average of precipitation rate (mm/day) for the two A1B scenarios (from respectively MPI and IPSL) and the B1 scenario from MPI global climate model:...... 158
Table 6.3 Parameters for extremes......................................................................................... 158 Table 6.4 Classification.......................................................................................................... 163 Table 6.5 Economic impacts of climate caused crop yield changes on gross agricultural output
and total regional output in the North East Region........................................................ 168 Table 6.6 Potential of the forestry areas for establishing new forests and plantations. ......... 176 Table 6.7 Economic impacts of distribution of the forest area (by forest types) for the period
1988-2008....................................................................................................................... 177 Table 6.8 Forest cover and non-forestry areas ....................................................................... 180 Table 8.1 RBSN stations in Bulgaria ..................................................................................... 195 Table 8.2 RBCN stations in Bulgaria..................................................................................... 195 Table 8.3 Participation in the global atmospheric observing systems ................................... 195 Table 9.1 Reasons, specific objectives and assets.................................................................. 202

Introduction 10
INTRODUCTION The United Nations Framework Convention on Climate Change (UNFCCC), thereon referred to as the Convention, is the first and major international legal instrument to address climate change issues at a global scale. It was signed in June 1992 at the Rio de Janeiro Earth Summit by more than 150 countries; and entered into force on 21st March 1994. The ultimate goal of the Convention is to achieve stabilization of greenhouse gas concentrations in the atmosphere at a level that would prevent dangerous anthropogenic interference with the climate system. Such a level has to be achieved within a time frame sufficient to allow ecosystems to adapt naturally to climate change; to ensure sufficient food production and to enable sustainable economic development.
Acknowledging the importance of the climate change issue and the need for international cooperation to address this problem, Bulgaria signed the UNFCCC in Rio de Janeiro in June 1992 and the Parliament ratified it in March 1995. In compliance with Article 4.6 and 4.2(b) of the UNFCCC, Bulgaria as a country in transition has adopted 1988 as a base year for the implementation of the Convention instead of 1990. As an Annex I Party of the UNFCCC the Republic of Bulgaria adopted the target to stabilize emissions of greenhouse gases by 2000 at a level not exceeded that in 1988. The same year was used when comparing, evaluating and projecting greenhouse gas emissions. The 2000 target was successfully achieved.
The First and Second National Communications of Bulgaria were elaborated by the Interministerial Committee supported by independent organizations and experts. The work was coordinated by the Ministry of Environment and Water.
The Third National Communication was a further step in elaborating and implementing the national climate change policy. It was delivered after the Kyoto Conference of the Parties and after the new commitments agreed by the Parties to the Convention. According to Annex B of the Kyoto Protocol† the quantified emission reduction commitment of Bulgaria for the first commitment period (2008-2012) is 8 % of the base year (1988) emissions. The Third National Communication of Bulgaria was elaborated by the Ministry of Environment and Water by assignment to the Energy Institute and under coordination of Interministerial Committee on Climate Change supported by independent organizations and experts.
The Kyoto Protocol (KP) after its ratification by the Russian Federation in November 2004, entered into force on February 16th 2005. The Fourth National Communication has been prepared by the Ministry of Environment and Water by assignment to the Energy Institute in cooperation with the, Ministry of Agriculture and Forestry, Ministry of Industry and Energy, Ministry of Economy and Energy, National Institute of Meteorology and Hydrology and Energy Efficiency Agency.
The nature of the GHG mitigation policies and measures in the country is reported there as set forth by the Second National Climate Change Action Plan 2005 – 2008 (NCCAP) adopted by the Bulgarian Government (decision No. 1012/December 21, 2004). The three scenarios presented in the Fourth Communication for GHG emission projections take into account the implemented and planned policies and measures and the real GHG emission changes as registered in the annual inventories. As the Kyoto Protocol entered into force since the beginning of 2005, the Forth Communication has reported information in compliance with the article 7.2 of the Protocol.
† The Kyoto Protocol was ratified by the Bulgarian Parliament on July 17, 2002.

Introduction 11
The Fifth National Communication was prepared by the Ministry of Environment and Water by assignment to the Energy Institute in cooperation with the, Ministry of Agriculture and Food, Ministry of Industry, Energy and Tourism and National Institute of Meteorology and Hydrology.
The main principles of the national policy on climate change are presented in it. The structure and organization of this report follow the UNFCCC Guidelines (FCCC/CP/1999/7) and the “Annotated Outline for Fifth National Communications of Annex I Parties under the UNFCCC, including Reporting Elements under the Kyoto Protocol”.
The nature of the GHG mitigation policies and measures in the country is as set forth by the Second National Climate Change Action Plan 2005 – 2008 and modified following the Bulgaria obligations in the climate change that evolve from multilateral and bilateral international agreements, from the EU legislation in the field of climate change.
The two scenarios presented in the Fifth Communication for GHG emission projections take into account the real status implemented and planned policies and measures from the Second Climate Change Action Plan and the real GHG emission changes as in the annual inventory report.
The developed projections differ significantly from those in the Forth Communication due to the dynamics of the characteristics of the problems on climate change in Bulgaria and the current world financial crisis.
The institutional setup for implementation of the country’s climate change policy is represented by the Ministry of Environment and Water (MOEW) under the coordination of Inter-ministerial Climate Committee on Climate Change (IMCCC) established with the NCCAP. It monitors the overall implementation of the Climate Change Action Plan; assesses the progress of the GHG emission reduction; adjusts the plan to the changing conditions in the country; tracks violations; and to develops compensatory measures to accomplish the objectives. The overall implementation of the plan is controlled by the MOEW.
The Fifth National Communication presents the overall situation in the country for the period since the Forth National Communication untill the end of 2007. The Fifth National Communication is resubmitted due to the fact that on June 28, 2010 Bulgaria was announced by the Enforcement branch of the Compliance Committee to the Kyoto Protocol to be in non-compliance.
In 2009, 28 september – 3 october 2009 UNFCCC Expert Review Team (ERT) conducted an in-country review of Bulgaria’s 2009 annual inventory submission in accordance with the Guidelines for review under Article 8 of the Kyoto Protocol (Annex to decision 22/CMP.1). The ERT found that Bulgaria’s 2009 annual inventory submission was not sufficiently transparent, consistent, comparable, complete and accurate, as required by the UNFCCC reporting guidelines, the IPCC good practice guidance and the IPCC good practice guidance for LULUCF. In particular, the ERT found that the institutional arrangements and arrangements for the technical competence of its staff within the national system involved in the inventory development process were insufficient to enable the adequate planning, preparation and management of Bulgaria’s annual submission in accordance with the aforementioned guidelines.
The decision of the Enforcement branch declared Bulgaria to be in non-compliance and applied the consequence that Bulgaria’s eligibility to participate in the mechanisms under Articles 6, 12 and 17 of the Kyoto Protocol was suspended and Bulgaria was to develop an improvement plan and report on the progress of its implementation.

Introduction 12
The Enforcement branch confirmed that there were unresolved problems with respect to implementation of the general and specific functions set out in the guidelines for national systems and indicated that a subsequent in-country review will be required to assess Bulgaria’s national system in accordance with the guidelines for national systems.
During the period of the in-country review of 2009 and the notification of question of implementation Bulgaria undertook significant efforts to improve its National System.
In 2010, 4-9 October NFCCC Expert Review Team (ERT) conducted an in-country review of Bulgaria’s 2010 annual inventory submission in accordance with decision 22/CMP.1. The conclusions and recommendations of the ERT set out in the Report of the individual review of the 2010 annual submission of Bulgaria indicated that all activities for improvement of the institutional, legal and procedural arrangements within the National inventory system as well as for improvement of the quality of the inventory were adequately planned and implemented by the Bulgarian government in 2010. As a result of the in-country review of 2010 and based on the implemented improvements, the ERT report stated that No questions of implementation were identified by the ERT during the review.
On 3 and 4th February 2011 the Enforcement branch adopted a decision CC-2010-1-17/Bulgaria/EB to reinstate the eligilibity of Bulgaria.
The here resubmitted Fifth National Communication reflects the national actions undertaken to reinstall the eligibility of the country and the status of the National System as of June 2011.

Executive summary 13
1. EXECUTIVE SUMMARY
1.1. Introduction
The United Nations Framework Convention on Climate Change (UNFCCC), thereon referred to as the Convention, is the first and major international legal instrument to address climate change issues at a global scale. Acknowledging the importance of the climate change issue and the need for international cooperation to address this problem, Bulgaria signed the UNFCCC in Rio de Janeiro in June 1992 and the Parliament ratified it in March 1995. In compliance with Article 4.6 and 4.2(b) of the FCCC, Bulgaria as a country in transition has adopted 1988 as a base year for the implementation of the Convention instead of 1990. As an Annex I Party of the UN FCCC the Republic of Bulgaria adopted the target to stabilize emissions of greenhouse gases by 2000 at a level not exceeded that in 1988. The 2000 target was successfully achieved.
The First and Second National Communications of Bulgaria were elaborated by the Interministerial Committee supported by independent organizations and experts. The work was coordinated by the Ministry of Environment and Water. The Third National Communication was a further step in elaborating and implementing the national climate change policy. It was delivered after the Kyoto Conference of the Parties and after the new commitments agreed by the Parties to the Convention. According to Annex B of the Kyoto Protocol† the quantified emission reduction commitment of Bulgaria for the first commitment period (2008-2012) is 8 % of the base year (1988) emissions. The Third National Communication of Bulgaria was elaborated by the Ministry of Environment and Water by assignment to the Energy Institute and under coordination of the Inter-ministerial Committee on Climate Change supported by independent organizations and experts.
The Fourth National Communication has been prepared by the Ministry of Environment and Water by assignment to the Energy Institute in cooperation with the, Ministry of Agriculture and Forestry, Ministry of Industry and Energy, Ministry of Economy and Energy, National Institute of Meteorology and Hydrology and Energy Efficiency Agency. The nature of the GHG mitigation policies and measures in the country is reported there as set forth by the Second National Climate Change Action Plan 2005 – 2008. The three scenarios presented in the Fourth Communication for GHG emission projections take into account the implemented and planned policies and measures and the real GHG emission changes as registered in the annual inventories and confirm that the country will meet its commitments to reduce GHG emissions on at least 8 %. The Fifth National Communication was prepared by the Ministry of Environment and Water by assignment to the Energy Institute in cooperation with the, Ministry of Agriculture and Food, Ministry of Industry and Energy, National Institute of Meteorology and Hydrology and other Academic Institutes.
The nature of the GHG mitigation policies and measures in the country is as set forth by the Second National Climate Change Action Plan 2005 – 2008 and modified following the Bulgaria obligations in the climate change that evolve from multilateral and bilateral international agreements, from the EU legislation in the field of climate change.
The two scenarios presented in the Fifth Communication for GHG emission projections take into account the real status implemented and planned policies and measures from the Second Climate Change Action Plan and the real GHG emission changes as in the annual inventories report.
† The Kyoto Protocol was ratified by the Bulgarian Parliament on July 17, 2002.

Executive summary 14
The resubmitted Fifth National Communication reflects the national actions undertaken to reinstall the eligibility of the country and the status of the National System in June 2011.
1.2. National Circumstances
The government type in Bulgaria is parliamentary democracy. Chief of state is President Georgi Parvanov and Vice President Angel Marin since 22 January 2002. They are elected on the same ticket by popular vote for five-year period. The chairman of the Council of Ministers is the head of government – Mr. Boiko Borisov since July 2009. The chairman of the Council of Ministers (the Prime minister) is nominated by the president and elected by the National Assembly. The Bulgarian National Assembly (the Parliament) has 240 seats; members are elected by the popular vote for four-year terms.
Bulgaria is situated in the Southeast part of the Balkan Peninsula. The country has a territory of 110,993.6 sq. km., bordering Greece and Turkey to the South, FY Republic of Macedonia and Yugoslavia to the West. The River Danube separates it from Romania to the North. Its natural eastern border is the Black Sea. Bulgaria ranks fifteenth in size among the European countries. Bulgaria is dominated by rugged mountains, except for the Danube lowland in the north that it shares with Romania. The lay of Bulgaria is highly varied
The climate in Bulgaria is temperate Continental-Mediterranean. Due to the geographical situation and the varied landscape, the contrasts in the climate are distinct among regions. The climate is with four distinctive seasons and varies with altitude and location. The Black Sea coast features a milder winter as opposed to the harsher winter conditions in the central north plains. The air humidity is between 66 and 85 % in the different regions of the country. There is a stable snow cover during the winter of about 20-200 cm. The average wind speed is 1.2 m/s (1.3 m/s in winter time), while prevailing winds are west or northeast.
In the last few years the tendency is towards warmer and drier climate. 1998 had warm and dry winter, hot dry summer, cool dry spring, and cold and very rainy fall. Average precipitation in Bulgaria is about 630 millimetres per year.
The demographic picture in Bulgaria is unfavourable at the beginning of the XXI century. It ranks the country amongst those in Europe with negative rate of natural increase, low birth rate, high adult mortality and child death rate, decreasing average age of population.
Population density is 68.9 per sq km at the end of 2007. According to calculated data, Bulgaria’s population is 7640.2 thousand people at the end of 2007. Due to more deaths than births, the population has decreased by 39 100 (or with 0.5 %) for one year. The average age of the population for the country is 41.5 for 2007.
Average life expectancy in Bulgaria is 69.24 for male and 76.3 for female for the period 2005-2007. 5 403.2 thousand people live in cities in 2007, that is 70.7 % of the population of the country, while 2 237.52 thousand (or 29.30 %) live in villages.
Economic profile: The country has successfully achieved and continues to deliver macroeconomic stability after 1998. The introduced Currency Board, sound fiscal policy, limited pay raise, etc. have been rules, administrative in their nature, which are in the basis of the macroeconomic and financial stability. The Gross Domestic Product, 2007 has reach 123 % of the one in 1990 and the average economic growth for the last five years was 6.02 % and the inflation was decreasing.
Agriculture is one of the important sectors of the Bulgarian economy. The sector forms a relatively small share of the GDP. Various European funds are not enough efficiently used.

Executive summary 15
The state must intervene to get out quickly of the crisis in this important structural sector of the Bulgarian economy
The Forestry is a traditional important economic sector for Bulgaria, where significant state investments for the last 40 years have created a potential for significant and sustainable logging in the future, when young plantations will grow and become suitable for felling.
The forests cover some 34 % of the total area of the country, support valuable ecosystems and control erosion. A big share of these forests (39.8 %) has special function – protective and rehabilitation. A potential problem in the sector is the slow pace of reforms and restructuring.
The objective of the tax policy is to reach macroeconomic stability, a sustainable economic growth and increase of social responsibility. The objectives above cause reduction of the social security burden, increase of indirect taxes, decrease of the threshold of the personal income amount not subject to taxation down to zero, profit tax reduction and raising the property tax assessment values.
Energy - Bulgaria imports 100 % of the needed nuclear fuel, 99 % of the oil, 99 % of the natural gas and 44 % of the coal. The structure of the Final Energy Consumption (FEC) for the Bulgarian economy predetermines a big share of secondary energies and necessity of transformation of a significant quantity of energy resources, i.e. about 40 % of the energy resources included in the Primary Energy Consumption (PEC) are lost in the transformation processes. The primary energy intensity of the GDP drops down continuously for the period 1997-2003 but the pace of reduction has decreased after 2003.
The Bulgarian industry has gone its difficult way from centralized planned economy to the open gates of EU. As an ex member country of Comecon, in a short period of time, Bulgaria was industrialized with low efficiency heavy industry, which was also great resource consumer. The private sector and the main manufacturing sectors in the Bulgarian industry have a significant share in the growth during the last few years.
Transport - The transport network is characterized by a poorly developed infrastructure in all transport sectors. Bulgaria is drafting a concept for the development of transport infrastructure during the period 2005-2015. The vehicle park in Bulgaria is changing its structure not only in quantity but also in quality for the last few years. The increased number of passenger cars comes from the big import of second hand cars mainly from Germany, Austria and the Netherlands. This determines their relative high average age. The vehicles are 2 461843 on 31.12.2007 and the unfavourable proportion in regard to their age related to the year of their initial registration is being kept. More than 1/3rd of the total number of vehicles is older than 20 years, which causes increased emissions in the atmosphere on one hand and increased number of car incidents on the other.
Waste - Landfilled solid waste is one of the key contributors for GHG emissions in Bulgaria.
1.3. Inventories of Greenhouse Gas Emissions by Sources and Removals by Sinks
Information for the annual GHG Inventory in Bulgaria for 2008 is presented. This Inventory is prepared according to the UNFCCC Guideline approved by the Subsidiary Body for Scientific and Technological Appliance on The 21st session on 06-14.12.2004 in Buenos Aires. The rules and the structure of the National GHG Inventory Report are formed by these Guidelines. The report is elaborated in compliance with the Revised IPCC Guidelines, 1996, IPCC Guidelines, 2006, and Good Practice Guidance for National GHG Inventories, 2000
The Single Entity responsible for the preparation of National GHG inventories is ExEA.

Executive summary 16
Since 2008 the National System for GHG inventories is modified in accordance with the requirements of Article 5, paragraph 1 from the KP and the Marrakech Accord (respectively, Decision 20/CP.7). The legal basis for the Bulgarian National System for GHG inventories is provided in the Environmental Protection Act and in particular by the provisions of its Chapter 8, which establishes the National Environmental Monitoring System and lists all of its tasks.
To ensure the effective and timely functioning of the National System for GHG inventories, as well as complete reporting under the UNFCCC and the Convention of Long-Range Transboundary Air Pollution (CLRTAP), the Minister of Environment and Water has issued the Order № RD-54/25.01.2007, based on the EPA, which regulate in detail the institutional, legal and procedural arrangements and responsibilities for inventory preparation under the Secretariats of UNFCCC and CLRTAP. In additional, on the basis of Article 4 from the Council of Ministers Regulation on the organization of activities with regard to preparation and presentation of reports to the European Commission on the implementation of the legislative acts, which are part from the European Community legislation in the field of environmental protection, as well in accordance with Chapter III.2 of the above mentioned Order, is established an Order № RD-377/08.06.2007 by the Minister of Environment and Water.
Nevertheless on June 28 2010 Bulgaria was announced by the Enforcement branch of the Compliance Committee to the Kyoto Protocol to be in non-compliance.
UNFCCC Expert Review Team (ERT) conducted an in-country review of Bulgaria’s 2009 annual inventory submission in accordance with the Guidelines for review under Article 8 of the Kyoto Protocol (Annex to decision 22/CMP.1) from 28 September to 3 October 2009. The ERT found that Bulgaria’s institutional arrangements and arrangements for the technical competence of its staff within the national system involved in the inventory development process were insufficient to enable the adequate planning, preparation and management of Bulgaria’s annual submission in accordance with the aforementioned guidelines.
The Enforcement branch applied the following consequences:
a) Bulgaria was declared to be in non-compliance.
b) Bulgaria was requested to develop a plan and report on the progress of its implementation.
c) Bulgaria’s eligibility to participate in the mechanisms under Articles 6, 12 and 17 of the Kyoto Protocol was suspended in accordance with the relevant provisions under those Articles pending the resolution of the question of implementation.
The Enforcement branch had confirmed that there were unresolved problems with respect to implementation of the general and specific functions set out in the guidelines for national systems. A further subsequent in-country review had been required to assess Bulgaria’s national system in accordance with the guidelines for national systems.
During the period after the in-country review and after the notification of the country on the subject of the question of implementation the country has undertaken significant effort to improve the status of the National System. The recent resubmission of the National Communication reflects the national actions undertaken to reinstall the eligibility of the country.
The conclusions and recommendations of ERT set out in the Report of the individual review of the 2010 annual submission of Bulgaria (FCCC/ARR/2010/BGR) indicate that all activities

Executive summary 17
for improvements of institutional, legal and procedural arrangements within the National Inventory System as well as for improvement of quality of inventory were adequately planned and implemented by the Bulgarian government in 2010. “The ERT concludes that the National system of Bulgaria is performing its required general and specific functions, as set out in the annex to decision 19/CMP.1 with respect to the institutional, legal and procedural arrangements to perform these functions; that the institutional, legal and procedural arrangements established and formalized by the “Ordinance on the way and order of organization of the national inventories of hazardous substances from greenhouse gases in the ambient air” (Ordinance No. 215) that entered into force on 21 September 2010 are fully operational; and that Bulgaria has in place the institutional arrangements and the capacity, including the arrangements for the technical competence of staff involved in the National system, to plan, prepare and manage inventories on an annual basis”. As a result from implemented activities for improvements “No questions of implementation were identified by the ERT during the review”.
In accordance with Decision of Enforcement branch CC-2010-1-17/Bulgaria/EB from 4 February 2011 Bulgaria is now fully eligible to participate in the mechanisms under Articles 6, 12, and 17 of the Kyoto Protocol.
The main greenhouse gases reported are as follows: Carbon dioxide - CO2, Methane - CH4, Nitrous oxide - N2O, Hydrofluorocarbons – HFCs, Perfluorocarbons – PFCs and Sulphur hexafluoride - SF6.
The change in the overall emissions for the period 1988–2008 is shown in Figure 1.1.
Figure 1.1Total greenhouse gas emissions in CO2 eqv. Gg
0
10 000
20 000
30 000
40 000
50 000
60 000
70 000
80 000
90 000
100 000
110 000
120 000
130 000
140 000
1988
1989
1990
1991
1992
1993
1994
1995
1996
1997
1998
1999
2000
2001
2002
2003
2004
2005
2006
2007
2008
year
Gg
CO2 emissions excluding LULUCF CH4 N2O HFCs PFCs SF6
The aggregated GHG emissions trend for the period 1988 – 2008 by sectors in Bulgaria is shown in Table 1.1.

Executive summary 18
Table 1.1 Aggregated GHG emissions by sector, Gg, CO2 eqv.
Total greenhouse gas emissions in CO2 eqv. Gg
010 00020 00030 00040 00050 00060 00070 00080 00090 000
100 000110 000120 000130 000
1988
1989
1990
1991
1992
1993
1994
1995
1996
1997
1998
1999
2000
2001
2002
2003
2004
2005
2006
2007
2008
year
Gg
Energy Industrial Processes Solvent and Other Product Use Agriculture Waste

Executive summary 19
Analysis o shows that sector “Energy”, where GHG emissions come from fuel combustion, headed the list in 2008 with the biggest share – 70.03 %. Sector “Waste” ranked the second place - 13.88 %, and sector “Agriculture” ranked the third place - 8.02 %.
1.4. Policies and Measures
The Ministry of Environment and Water is responsible for the overall national environmental policy in Bulgaria including the climate change problems. It is responsible for the applying the adopted legislation on national scale and conceiving new legislation in the future. The problem for environmental protection is a global one and for this reason MOEW works together with almost all other ministries. The following organizations support the climate change activities of MOEW: The Ministry of Economy, Energy and Tourism (MEET), The Energy Efficiency Agency (EEA), The Ministry of Agriculture and Food (MAF), The Ministry of Finance (MF), The Ministry of Regional Development and Public Works (MRDPW), The Ministry of Education, Youth and Science (MES), The Ministry of Foreign Affairs, as well as The National Statistical Institute, The Bulgarian Academy of Sciences etc, which participate in the process of application, development and perfection of GHG mitigation measures, procedures and mechanisms. The coordination of climate change activities within interministerial working groups was accepted as a Good Practice and now the following are functioning: Interministerial Committee on Climate Change (IMCCC), Joint Implementation Steering Committee (JISC) and Interministerial Working Group for Development of the National Allocation Plan (IWGNAP). In this way the efforts of all concerned Governmental Agencies, business and NGOs are united. Representatives of NGOs: Bulgarian Chamber of Commerce and branch organizations of the industrial branches that are covered by the Scheme – Bulgarian Association of the Cement Industry, Bulgarian Branch Chamber of the Energetic, Branch Chamber of the Pulp and Paper Industry, Branch Chamber of the Glass Industry, Branch Chamber of the Iron and Steel Industry, Branch Chamber of the Chemical Industry, Bulgarian Union of the Ceramics.
Executive Environment Agency (ExEA) is an administration under the Minister of Environment and Water jurisdiction and is appointed to carry out management, coordination and information functions as regards the control and environmental protection in Bulgaria. It designs and manages the National Environmental Monitoring System for Environmental Monitoring and information on the state of environmental components and factors at national level. The Agency coordinates and performs the overall activities on the preparation of the GHG inventories and the National Inventory Report. The ExEA administrates the National GHG Registry.
Energy Efficiency Agency within MEET – organizes the implementation of projects and measures in accordance with the national long- and short-term energy efficiency programs; approves projects for energy efficiency and controls their implementation; participates in the preparation of legal regulations in the field of energy efficiency: proposes development and improvement of energy efficiency standards in order to achieve approximation to the EU norms and to encourage energy efficiency at the demand side.
The major responsibility of municipal energy management is imposed upon local authorities. The rational use of energy as well as its production and supply at local level, became responsibility of municipal authorities. The basic instrument for energy management in municipalities is the local (municipal) energy planning.
The main framework of the environmental policy in the country is the National Environmental Strategy, which serves as a base for the activities in the environmental policy

Executive summary 20
areas, including climate change. After the accession of Bulgaria to the European Union the country is harmonizing all the aspects of the environmental legislation with the EU legislation.
The following policy instruments are applied in the Climate Change Policy:
Legal instruments and regulations comprise of multilateral and bilateral international agreements, the EU legislation in the field of climate change and the national legislation, which relate to the climate change:
Fiscal policy contains instruments to stimulate measures that reduce emissions of greenhouse gases and/or save energy. When introducing such policies in Bulgaria it is necessary to remember that they have to be in harmony with EU legislation (especially in relation to competitiveness) and to be implemented in such a way that minimizes or eliminates the “free riders”
Financing - Energy efficiency funds - State Agricultural Fund (SAF), - Kyoto Protocol Mechanisms - Joint Implementation, International Emissions Trading (Green Investment Scheme) - EU structural funds
Education, research and development and awareness raising and public information
National strategy for the Environment and Second National Action Plan 2005-2014
The Strategy was developed for the period 2005-2014 together with an Action Plan 2005-2009. The National Strategy for the Environment is consistent with the principles of the prevention and reduction of the human health risk, integration of the environmental protection policy in the sectoral policies on the development of the economy and awareness of the citizens on the state of the environment.
Second National Climate Change Action Plan (2005-2008)
The need for Bulgaria to undertake mitigation measures is limited given the current GHG emission level and the expected emission trend. Implementing climate change measures are, however, also driven by other factors. The economic and political development Bulgaria after the year 2005 along with changes in the international and domestic policy and regulatory framework required an update of the Second Action Plan. A study for assessment of the Plan fulfilment will be used in 2010 for development of the Third Action Plan to be implemented in the period 2010 – 2012, although the effects of the measures in terms of greenhouse gas (GHG) emission reduction of the Second Action Plan are assessed up to year 2012, when the First Commitment Period under the Kyoto Protocol ends.
Two groups of measures are reported based on the status of implementation of measures: “with measures” and “with additional measures. “With measures” encompass adopted after 2005 policies and measures and currently implemented. Measures implemented before 2005 are not listed here. “With additional measures” encompass planned policies and measures which were not implemented up to 2009.
Because of the untimely decommissioning of nuclear power units in the end of 2002 and the prognosis for economical and demographic development, increase of the emissions in the next years took place in 2007, due to the early termination of the operation of two nuclear units. The rate of increase of the emissions in the years to come will depend on policies and measures, which will be undertaken by the Government.
Although the country has much lower emissions from the admissible, according the Kyoto Protocol, it has potential for additional decrease of GHG emissions. This potential might be realized, in case of extension of implementation of purposive politic for emissions reduction,

Executive summary 21
expressed as implementation of additional measures. The implementation of political decisions and measures set in the Second National Action Plan on Climate Change and the development and implementation of the Third National Action Alan on Climate Change would allow avoiding of part of the projected growth of GHG emissions.
1.5. Projections and Total Effect of Policies and Measures, and Supplementary Relating to Kyoto Protocol Mechanisms
The most recent GHG projections were elaborated taking in consideration the trends of key macro-economic, technological, demographic and other indicators that determine the economic development of the country.
The “with measures” projection encompasses currently implemented and adopted policies and measures. It envisages a growth rate of electricity demand by 55 % for the period 2005-2020. This scenario projects relevant measures in industry sector and residential and commercial/service sectors, while the rest of the sectors rely on already applied before 2007 measures.
The key macroeconomic and energy characteristics of this scenario are provided in methodology section
This projection integrates the assumption for increase in annual electricity export from 4,200 up to 7,000 GWh for the period after 2006.
The “with additional measures” scenario comprises planned for period after 2007 policies and measures for GHG mitigation. While in the “with measures” scenario the measures are more generally referring to environmentally friendly development, this scenario is more concentrated on the specific GHG mitigation measures and policies in the power sector and renewables.
The emission analysis address mainly the period 2005-2020, for the “with measures” and “with additional measures” scenarios.
The total GHG emissions are calculated as a sum of all emissions. LULUCF sinks are not included in the totals.
Comparison of the “with additional measures” scenario with the “with measures” one reflects the mainly the total effect of measures in the energy sector. As a result, the total emission reduction is in the range 6-12 %, with the reduction peak expected in the end of period.
The forecasted aggregated emissions for the two scenarios reflect the sectoral measures for abatement of emissions and GHG reduction. They are shown in terms of CO2 equivalent given in Figure 1.2.
Comparison of “with addition measures” and “with measures” scenarios reveals too certain tendency for increase of emissions in the period 2007-2020 up to 25 - 40 %.

Executive summary 22
Figure 1.2 Aggregated total GHG Emissions, Gg CO2 eqv.
010,00020,00030,00040,00050,00060,00070,00080,00090,000
100,000110,000120,000
2005
2006
2007
2008
2009
2010
2011
2012
2013
2014
2015
2016
2017
2018
2019
2020
With measures With Additional Measures
The results from the GHG emissions projections for the both scenarios show growth of the absolute values of the emissions for the period 2005-2020 the total growth of the GDP is motive power for this growth. The applied measures however considerably reduce the GHG emissions growth especially in the scenario with additional measures. In spite of all the tendency does not turn, i.e. the trend remains positive in contrast to other countries in EU, where it is negative.
Both the "with measures" and the "with additional measures" scenarios show that country will meet its obligation for the first Kyoto period. The AAU of the country, according to the IRR of the UN FCCC Secretariat is well below the total emissions for the period 2008 – 2012 will have available for International Emissions Trading more than 220 million AAU, that could be sold in the frame of the Green Investment Scheme.
The total effect of the additional policies and measures that would be implemented within 2009 – 2020 is about 12 % emission reduction. Nevertheless there is no significant incentives to implement the additional measures as the country will meet its possible 20 % reduction target for 2020.
Only in case if a legally binding international agreement is approved in the near future, and Bulgaria, as EU member state, will have to accept 30 % reduction target for 2020, the country will need to implement additional measures.
Nevertheless the EU membership require from the country to implement significant number of additional mitigation measures in the frame of the Burden sharing, and Bulgaria will achieve additional emission reduction, that may result in a level of 40 %. Unfortunately that high emission reduction will result in significant decrease of the GDP growth and population incomes, compared to the with measures scenario.
Bulgaria as an Annex I Party of the UN FCCC and as country with economy in transition status under the Convention, it receives financial and technological support, mainly within the framework of the Joint Implementation (JI) mechanism. Bulgaria has approved 26 projects, some of them are in development and others implementation phase . The execution of those projects may lead to greenhouse gases’ emission reduction up to 8 mln. tons carbon dioxide equivalent for the period 2008-2012 and it is about 1 % of the Bulgaria assigned amount.

Executive summary 23
The contribution of the JI mechanisms to the emission reductions in the country is negligible.
1.6. Vulnerability Assessment, Climate Change Influence and Adaptation Measures
The observed warming in Bulgaria continued at the beginning of the 21st century. Climate in Bulgaria became not only warmer but also drier at the end of the 20th century (Figure 1.4). During the last decade however, precipitation totals has increased. Heavy rains caused severe floods damaging various socioeconomic sectors. Weather and climate extremes have increased during the last decades.
Climate change scenarios are developed for 2015, for the 2020s, 2050s and 2080s and climate scenario for the end of the 21st century.
In the CLAVIER project, LMDZ-regional climate model was forced by the outputs of three global climate change scenarios from the models ECHAM-A1B, ECHAM-B1 and IPSL-A1B.
Significant summer warming in the western Balkan countries, were projected by the HadCM3 model for 2080. Air temperatures during this time of the year are expected to increase between 5º and 8ºC over most of the countries in the peninsula. Summer precipitation is projected to decrease in the region of interest. HadCM3 climate change scenarios were also created for every used weather stations from selected areas in Bulgaria.
Figure 1.3 Anomalies of annual temperature in Bulgaria during the period 1901-2010, relative to 1961-1990.

Executive summary 24
Figure 1.4 Anomalies of annual precipitation in Bulgaria during the 20th century
Climatic scenarios reveal that an increased risk and vulnerability to soil droughts are expected – an increase in the occurrence, intensity and level of impact of the soil droughts in Bulgaria for the 21st century. The soils with low capacity of moisture preservation and the regions in south-east Bulgaria are most vulnerable to those changes, in which areas precipitations during the warm half-year are low, even at present climatic conditions.
During the climate change in Bulgaria in the 21st century, most vulnerable will be: a) spring agricultural crops, due to the expected precipitation deficit during the warm half-year; b) crops cultivated on infertile soils; c) crops on non-irrigated areas; d) arable lands in south-east Bulgaria where even during the present climate, precipitation quantities are insufficient for normal growth, vegetation and productivity of agricultural crops.
The climate change scenarios derived for Bulgaria were used to evaluate potential changes in forest vegetation.
Soil diversity in Bulgaria is enormous. Soils have different characteristics, fertility and vulnerability to climate change. The temperature rise will increase the water deficit in soils with low precipitation rates that are prone to droughts. The most serious impacts will be observed for soils with light mechanical content and bad water characteristics and partly for heavy clay soils. About 30 % of the soils in Bulgaria are prone to wind erosion.
The objectives of adaptation measures in agriculture are to support and sustain the agricultural production and to bring to minimum the impact of climate change by reducing the vulnerability of the agricultural crops. The adaptation to climate change will be carried out in various forms, including technological innovations, changes in arable land, changes in irrigation, etc. Technological innovations include the creation of new cultivars and hybrids, which have higher productivity during changes in the climate. Farmers can start growing other cultures or cultures, prone to drought and diseases. The sowing dates of spring crops in Bulgaria could shift under the GCM climate change scenarios in order to reduce the yield loss caused by temperature increase. Another option for adaptation is to use different hybrids and cultivars. There is an opportunity for cultivation of more productive, later or earlier-maturing, disease and pest tolerant hybrids and cultivars. Switching from maize hybrids with a long to a short or very short growing season projected an additional decrease of final yield under a potential warming in Bulgaria. However, using hybrids with a medium growing season would be beneficial for maize productivity. Technological innovations, including the development of new crop hybrids and cultivars that may be bred to better match the changing climate, are

Executive summary 25
considered as a promising adaptation strategy. However, the cost of these innovations is still unclear.
For the forests in the low parts of the country (under 800 m a.s.l.), where the most significant impact from climate change is expected, the strategic objective of the management must be adaptation towards drought and improving forest sustainability.
For the forests in the higher parts of the country, i.e. those above 800 m a.s.l., where expected changes are not likely to be drastic, the objectives are preservation of biodiversity, eco system sustainability, multifunctional management, system of protected nature territories.
The natural and introduced forest wood and shrub species in Bulgaria have great potential for a good adaptation towards possible climate change in the present century.
1.7. Financial resources and transfer of technology, including information under Articles 10 and 11, of the Kyoto Protocol
Despite the fact that Bulgaria is an Annex I Party of the UN FCCC, as a country with economy in transition, it has no commitments to provide financial resources and technology transfer to developing countries. The country rather accepts financial and technological help, mainly within the framework of the Joint Implementation (JI) mechanism.
The JI mechanism is a convenient and profitable way for Bulgaria to receive economic, technical and expert help with GHG mitigation efforts.
In terms of technologies transfer, as a country in transition, Bulgaria has no obligations to support technology transfer, under Article 11 of the Kyoto Protocol, for countries out of Annex I of the Convention.
Article 10 of the Protocol
Until the in-country review in 2009 the country has not formulated programs to improve the quality of local emission factors, activity data and models which reflect national conditions. The country is more active in the field of development and implementation of national programs containing measures to mitigate climate change. In relation to the decision of the Enforcement branch of the Compliance Committee to cease the eligibility of the country, specific inventory improvement programmes were developed and communicated to the Enforcement branch.
1.8. Education, Training and Public Awareness
Public interest in climate change has been significant. Various governmental, non-governmental and social non-economic organizations have raised the issue on various occasions. However, vast amount of the population does not realize the increasing environmental, social and security threat from climate change. In this respect, education and channels of public awareness have to provide for increasing the awareness and understanding of the problem and its consequences. By 2007 several new academic programmes in the field of Environmental protection in universities and institutions of higher education (Bachelor and Master level degree) were opened.
Bulgaria carried out a project for self assessment of the capacity of the country in the field of sustainable development in 2004. The results from the project in the section Environmental education and public awareness in climate change problems allow to define the priority topic, the explanation of which will improve not only the level of the educational system but also public awareness.

Executive summary 26
Three complexes and a number of specific reasons have been formulated as a reason for the unsatisfactory level of capacity. Specific objectives and tasks have been elaborated to improve the situation and direct and indirect assets have been recognized that allow the tasks to be solved in a short period of time.
The effective use of human potential, especially in hard time as the present transitional period, is one of the greatest challenges, undertaken by people in the last decade. Environmental protection – soil, air, water, plants and animals, natural heritage must develop into personal conviction. One of the fundaments of the present education is to familiarize the pupils with the natural environment and form a positive attitude towards everything, surrounding them.
The topics of environmental protection and climate change are included in school syllabuses in the educational and cultural field “Natural science and environment”. They are studied in most details in the “Geography” subject but also, even in lesser scale in “Environmental chemistry” and “Biology”.
In this context, one should add the necessity of introduction of compulsory environmental lessons in primary schools and outdoor activities.
A “Specialized course on vocational training of chemistry teachers on environmental protection” was carried out in 2005. It was on 3 stages during the school year. All 50 participants – chemistry teachers have obtained a certificate. The participants in the course have been selected from all over the country. The successful completion of the education can be used as a model for future training and elaboration of similar courses for training of teachers.
There is growing consolidation of the movement for environmental protection and an organized body of environmental non-governmental organizations. There is a growing tendency for development of ecotourism and for preservation of the cultural heritage. Often environmental preservation is mentioned together with the preservation of cultural traditions. These, closely with also with ecotourism need each other to achieve successfully their goals.
1.9. Research projects and systematic observation
Green Paper on European Research Area except the emphasis on regional cooperation recommends "the creation of joint programs for research driven society”. Therefore, the overall objective of a general policy on research and systematic observations is: strengthening and development of the national scientific potential, and providing public information on: monitoring, evaluation and forecasting of the situation and global changes in the system: atmosphere-biosphere-hydrosphere and analysis of the impact on socio-economic sectors of society and natural ecosystems in the region of Balkans and Black Sea basin. Specific objectives include: 1.) Conduct interdisciplinary research aimed at scientific and application service of socio-economic sectors of society in the country and region 2.) Maintenance and upgrading of existing and new components of the monitoring networks, assessment and analysis of state and changes in the atmosphere, biosphere, hydrosphere 3.) development and improvement of methods, models and systems for forecasting the short, medium and long-term changes in atmosphere and related hazardous weather phenomena and changes in the biosphere and hydrosphere, 4) development and improvement of methods and models for quantitative assessment and analysis of the impact of state and changes in the atmosphere, biosphere, hydrosphere on socioeconomic sectors of society and natural ecosystems; 5.) developing proposals for making management decisions to adapt to the adverse global changes; 7.) Interaction with the institutions in the preparation of strategies related to these tasks.

Executive summary 27
Over the past 10 years there has been a trend of increased scientific interest in climate change: global, regional and national scale. The topic of climate change includes a number of scientific aspects. The Bulgarian Academy of Sciences BAS works in different directions: fluctuations and climate change, vulnerability assessment and adaptation of individual sectors (e.g. water resources, agriculture, forests, etc.) under climate change, solar-terrestrial influences and more. On the topic of climate change in more than 10 units of the Bulgarian Academy of Sciences, work but the major one is the National Institute of Meteorology and Hydrology.
The Bulgarian Academy of Sciences (BAS) carries out research and other activities on climate change. Work is going on not only on planned tasks with national financing but also in cooperation with research organizations from EU member countries within the Sixth and Seventh Framework Programme.
Comprehending the significance of this problem, BAS established a National Coordination Centre for Global Change. The Scientific Coordination Centre for Global Change of the Bulgarian Academy of Sciences (SCCGC-BAS) is a voluntary association of representatives of academic research and development institutes and units, universities and higher educational establishments, institutions, agencies, organizations, companies and other entities in Bulgaria which organizes and conducts activities related to global change in environment, as well as to the economic, political, social and spiritual aspects of global change on society
The SCCGC-BAS is a consultative/advisory body of the Steering Committee of the Bulgarian Academy of Sciences on global change in Bulgaria. The SCCGC-BAS is a centre for coordination of research and scientific-methodological activities under the implementation of national and international projects and contracts in the field of global change.
The section on systematic observations activities in the country follows the detailed guidance for required information as provided in the UNFCCC reporting guidelines on global climate observing systems. It includes summary information on the current status of national plans, programs and support for ground and space-based climate observing systems.
It should be pointed out that up to now activities in this field have been undertaken separately from the climate change policies and measures. They were more closely linked to the general commitments of the country in the field of meteorology.
There are no GSN (Global Surface Network) and GUAN (Global Upper Air Network) stations located in Bulgaria. There is only one GAW (Global Atmosphere Watch) station in the country (Rojen).
The National Institute of Meteorology and Hydrology in Sofia, Bulgaria has several weather stations included within the Regional Basic Synoptic Network (RBSN) and Regional Basic Climatological Network (RBCN) in RA VI (Europe):
An important and irrevocable part of the activities of The Geophysical Institute (GPhI) “Acad. L. Krastanov” is the unique for our country scientific and operative activity, concerning registration, processing, analysis and interpretation of the seismicity, geomagnetic field, the status of the ionosphere and UV radiation level above the country and surrounding lands. The unique for the country international geomagnetic standard with absolute and comparative geomagnetic measurements is maintained in Geomagnetic Observatory “Panagyurishte”. The parameters of the Earth’s Magnetic Field are registered daily and maps of variations of the elements are drawn. Main users of the collected information are Military Geographic service of the MA, Cadaster Agency at the Ministry of Regional Development of Bulgaria and all organizations working in the area of underground resources research with geomagnetic

Executive summary 28
methods. Geomagnetic field data are used for navigation and radio-connections services as well.
The Institute of Oceanology, very year carries out complex seasonal expeditions studying physical, chemical and biological parameters of sea water and bed at the western part of Black Sea. Weather observations are done at every location of interest: air temperature, sea level pressure, wind speed and direction. The institute is currently trying to recover and improve some oceanographic systems for observations such as VOS (Volunteer Observing Ship) and TIDE GAUGES as well as to include them within international programmers.
The Bulgaria Institute for Space Research is participating in space-based observing programmes by development and execution of national and international space programmes as well as development of complex research tools.
An important way related to participation in space-based observing programmes is development, analyses and interpretation of space satellite images.
Bulgaria utilizes observations from satellites: satellite images with very high (IKONOS, QuickBird, EROS) high (IRS, SPOT) and moderate (Landsat, ASTER) space resolution are used. The satellite images are used for research and scientific experiments as well as a basic source of information under development of geoinformation systems.
National circumstances relevant to greenhouse gas emissions and removals 29
2. NATIONAL CIRCUMSTANCES RELEVANT TO GREENHOUSE GAS EMISSIONS AND REMOVALS
2.1. Government Structure
The government type in Bulgaria is parliamentary democracy. Chief of state is President Georgi Parvanov and Vice President Angel Marin since 22 January 2002. They are elected on the same ticket by popular vote for five-year period.
The chairman of the Council of Ministers is the head of government – Mr. Boiko Borisov since July 2009. The chairman of the Council of Ministers (the Prime minister) is nominated by the president and elected by the National Assembly.
The Bulgarian National Assembly (the Parliament) has 240 seats; members are elected by the popular vote for four-year terms.
The government activities are divided among 15 ministries. The Ministry of Environment and Water carries out all activities and responsibilities on the environmental protection and climate change problems.
2.2. Geographic Profile
Bulgaria is situated in the Southeast part of the Balkan Peninsula. The country has a territory of 110,993.6 sq. km., bordering Greece and Turkey to the South, FY Republic of Macedonia and Serbia to the West. The River Danube separates it from Romania to the North. Its natural eastern border is the Black Sea. Bulgaria ranks fifteenth in size among the European countries. Bulgaria is dominated by rugged mountains, except for the Danube lowland in the north that it shares with Romania. The lay of Bulgaria is highly varied. To the north there is rich farmland the Danube plane, 130 kilometres of sandy beaches on the Black Sea, and mountainous terrain characterizing some of the least densely populated parts of the country. To the south is the Balkan Mountain which slopes gently to the north and drop more abruptly to the south. Further to the south are the Rhodopes and to the west lies the highest mountain on the Balkan Peninsula – the Rila Mountain with the highest Bulgarian peak Mousala – 2,925 m. Bulgaria is scarce in water resources, despite that over 60 rivers flow trough the country. The Danube is the biggest one with total length of 470 km on Bulgarian territory. There are also 6 lakes with total area of 87 km² and water volume of 211 mln cubic meters, and 23 dams with total area of 376 km² and water volume of 4,571 mln cubic meters. Bulgaria has three National Parks – Pirin, Rila and Central Balkan. They have a total area of 193,049 hectares and comprise more than one-third of all protected areas in Bulgaria. The National Parks belong to the state. They are managed and administered by Directorates, operating under the Ministry of Environment and Waters. The Bulgarian National Parks offer excellent opportunities for tourism, scientific research and education.
2.3. Climate Profile
The climate in Bulgaria is temperate Continental-Mediterranean. Due to the geographical situation and the varied landscape, the contrasts in the climate are distinct among regions. The climate is with four distinctive seasons and varies with altitude and location. The Black Sea coast features a milder winter as opposed to the harsher winter conditions in the central north plains.

National circumstances relevant to greenhouse gas emissions and removals 30
Bulgaria has five climatic zones - Moderate Continental, Intermediate, Continental-Mediterranean, Maritime and Mountainous. The main factor distinguishing the first three zones is the latitude, the terrain for the mountainous and the Black Sea for the maritime.
The heating season varies between 160 and 220 days for different locations. An important indicator describing the duration of the heating season and roughly the energy requirements for heating is the number of degree days. The heating degree days for indoor temperatures of 20C vary between 2,100 and 3,500 for different regions in Bulgaria. For Sofia these are 2,500 on average annual basis.
The air humidity is between 66 and 85 % in the different regions of the country. There is a stable snow cover during the winter of about 20-200 cm. The Thracian Plain and the north-eastern coastal area suffer from low rainfalls. The total annual quantity of precipitation measured at the 40 monitoring meteorological stations vary from 455 to 93 mm, which is 60 % to 137 % of the norm. The mean values in 1999 was 619 mm, which is 98.84 % of the annual norm, by about 4.3 % lower than the value for 1998, and by 6.4 % lower than the value for 1997. The tendencies over the last years are: almost ubiquitous reduction of precipitation, especially in the mountain areas of the country; total annual quantities of precipitation in northeast Bulgaria, Black Sea coast, Upper Thrace Low-down, southwest Bulgaria, Vratza-Pleven and Sofia regions are lower; no change in the established annual rate of non-precipitation days.
The average wind speed is 1.2 m/s (1.3 m/s in winter time), while prevailing winds are west or northeast.
In the last few years the tendency is towards warmer and drier climate. 1998 had warm and dry winter, hot dry summer, cool dry spring, and cold and very rainy fall. These abrupt deviations from the normal climatic conditions reflect increased climate instability. Thus, the temperature amplitude recorded a maximum for the last decade. Significant are the amplitudes of the other climatic characteristics as well. 2000 was the warmest year in 30-year period, while the rainfalls were 60 % less compared to standard values.
Considering its small area, Bulgaria has an unusually variable and complex climate. The country lies between the strongly contrasting continental and Mediterranean climatic zones. Bulgarian mountains and valleys act as barriers or channels for air masses, causing sharp contrasts in weather over relatively short distances. The continental zone is slightly larger, because continental air masses flow easily into the unobstructed Danubian Plain. The continental influence, stronger during the winter, produces abundant snowfall; the Mediterranean influence increases during the summer and produces hot, dry weather. The barrier effect of the Balkan Mountains is felt throughout the country: on the average, northern Bulgaria is about one degree cooler and receives about 192 more millimetres of rain than southern Bulgaria. Because the Black Sea is too small to be a primary influence over much of the country's weather, it only affects the immediate area along its coastline.
The Balkan Mountains are the southern boundary of the area in which continental air masses circulate freely. The Rhodope Mountains mark the northern limits of domination by Mediterranean weather systems. The area between, which includes the Thracian Plain, is influenced by a combination of the two systems, with the continental predominating.
Average precipitation in Bulgaria is about 630 millimetres per year. Dobrudja in the northeast, the Black Sea coastal area, and parts of the Thracian Plain usually receive less than 500 millimetres. The remainder of the Thracian Plain and the Danubian Plateau get less than the country average; the Thracian Plain is often subject to summer droughts. Higher

National circumstances relevant to greenhouse gas emissions and removals 31
elevations, which receive the most rainfall in the country, may average over 2,540 millimetres per year.
The many valley basins scattered through the uplands have temperature inversions resulting in stagnant air. Sofia is located in such a basin, but its elevation (about 530 meters) tends to moderate summer temperature and relieve oppressive high humidity. Sofia also is sheltered from the northern European winds by the mountains that surround its trough like basin. Temperatures in Sofia average -2°C in January and about 21°C in August. The city's rainfall is near the country average, and the overall climate is pleasant. The coastal climate is moderated by the Black Sea, but strong winds and violent local storms are frequent during the winter. Winters along the Danube River are bitterly cold, while sheltered valleys opening to the south along the Greek and Turkish borders may be as mild as areas along the Mediterranean or Aegean coasts.
2.4. Population Profile
The demographic picture in Bulgaria is unfavourable at the beginning of the XXI century. It ranks the country amongst those in Europe with negative rate of natural increase, low birth rate, high adult mortality and child death rate, decreasing average age of population, Table 2.1.
Table 2.1 Demographic data for the country 1960 1970 1980 1990 1995 2000 2001 2002 2003 2004 2005 2006 2007 Birth rate ‰ 17.8 16.3 14.5 12.1 8.6 9.0 9.0 8.5 8.6 9.00 9.20 9.60 9.80 Natural increase ‰
9.7 6.0 3.4 -0.4 -5.0 -5.1 -5.6 -5.8 -5.7 -5.2 -5.4 -5.1 -5.0
Marriage rate‰
8.8 8.6 7.9 6.9 4.4 4.3 4.0 3.7 3.9 4.00 4.30 4.30 3.90
Average age of population
32.4 34.4 35.8 37.5 38.9 39.9 40.4 40.6 40.8 41.0 41.2 41.4 41.5
Population annual average (mil)
7.87 8.49 8.86 8.72 8.41 8.15 7.89 7.84 7.80 7.77 7.72 7.68 7.64
Most of the population is concentrated in the urban areas. Sofia – the largest city and the capital of the country – has a population of over a million inhabitants. The next largest cities – Plovdiv and Varna – have population of about 300,000 people. Despite the positive natural rate for the urban population the emigration process led to its decrease. The relative share of the population in working age decreases. Currently every forth person in Bulgaria is a pensioner.
Population density is 68.9 per sq km at the end of 2007. According to calculated data, Bulgaria’s population is 7640.2 thousand people at the end of 2007. Due to more deaths than births, the population has decreased with 39 100 (or with 0.5 %) for one year.
The average age of the population for the country is 41.5 for 2007. The aging process is observed not only in the villages but also in the cities, while the average age for the villages is higher than in the cities.
Average life expectancy in Bulgaria is 69.24 for male and 76.3 for female for the period 2005-2007. In comparison, the average life expectancy for 1935-1939 was respectively 50.98 and 52.56, and for the period 1984-1986 it was 68.17 for male and 74.44 for female.

National circumstances relevant to greenhouse gas emissions and removals 32
In total, women continue to be more (51.57 %).
5 403.2 thousand people live in cities in 2007, that is 70.7 % of the population of the country, while 2 237.52 thousand (or 29.30 %) live in villages.
2.5. Economic Profile
The country has successfully achieved and continues to deliver macroeconomic stability after 1998. The introduced Currency Board, sound fiscal policy, limited pay raise, etc. have been rules, administrative in their nature, which are in the basis of the macroeconomic and financial stability. The functioning of the companies of the real economy, despite some positive trends, mainly in the sales growth, is still not leading to overcome the crisis in the real economy. The Gross Domestic Product, 2007 has reach 123 % of the one in 1990. The level of pay rise in the country is 40 % bellow the one in 1990.
As a result the average economic growth for the last five years was 6.02 % and the inflation was decreasing.
After the introduction of the currency board and the denomination of the lev in 1999, a slow increase in GDP is witnessed in the country. The economic growth is stable and within a moderate range. Still, GDP levels are far bellow the desired levels. The trends of GDP change in mln. lev is given in Table 2.2.
Table 2.2 GDP, 2000 prices 1990 1995 2000 2001 2002 2003 2004 2005 2006 2007 Gross Domestic Product (mil. Lv) 45390 880332 26748 27845 29098 30553 32570 34589 36768 39048 GDP (annual real growth rate, %) -9.1 -12.39 -4.09 4.10 4.50 5.00 6.60 6.20 6.30 6.20 GDP per capita USD) 1348 49 1541 1610 1763 2253 2658 2883 3101 3332 Source: NSI
GDP growth is at moderate, balanced pace with no sudden fluctuations, typical for past periods. During the last few years of the analysis, the pace of GDP growth is bigger due to favourable economic climate in the country. The main economic indicators are given in Table 2.3.
Table 2.3 Main economic indicators 2000 2001 2002 2003 2004 2005 2006 2007 Interest rate 4.7 4.8 3.8 5.6 4.2 3.87 4.18 4.54 Current account balance (% of GDP) -2.4 -5.5 -5.8 -11.3 -17.7 -27.2 Gross currency reserves (billion USD) 3.46 5.2 4.6 5.3 6.8 7.4 8.9 11.9 Gross debt (% of GDP) 83.4 78.6 65.0 60.1 63.8 70.9 82 100.3 Direct foreign investments (% of GDP) 6.6 8.1 5.9 10.5 13.8 14.4 24.7 29.7 Source: NSI
The registered average annual real rate of growth (6.06 %) in last 5 year is far beyond the rate of the European economies, which facilitates Bulgaria becoming closer to the EU.
The introduction of the Currency Board lowered the inflation and became an important prerequisite for the revival of the economic activities. The inflation was reduced significantly and has come nearer the level of the industrial states.
The main problems for the country come from the relatively high unemployment, high current account deficit, uneven level of economical development and living standard in different regions.

National circumstances relevant to greenhouse gas emissions and removals 33
Foreign investments rise significantly due to the increased confidence in the Bulgarian institutions and stable business situation.
The external trade of the country shows the level of economic development, currency stability, technological development, etc. Data on external trade and trade balance is given in Table 2.4.
Import significantly surpasses export and this negative trend increases.
Table 2.4 Trade balance 1990 1995 2000 2001 2002 Export mil. $ 3874.5 5111.6 4837.1 11176.1 11857.9 Import mil. $ 3750.5 5053.0 6523.9 15896.6 16450.9 Trade balance 124.0 58.6 -1686.8 -3478.1 -3309.0 2003 2004 2005 2006 2007 Export mil. $ 13041.9 7575.8 7302.6 10274.1 11176.1 Import mil. $ 18796.6 8 827.5 10052.8 13856.8 15896.6 Trade balance -4302.0 -474.7 -2058.2 -2503.3 -3478.1 Source: NSI
2.6. Privatization
The denationalization became a priority only at the beginning of 1993 and was put into practice only at the beginning of 1996 with the appropriate privatization forms and mechanisms, etc. It was not embedded in a clear enough vision on the structural reforms in the national economy and for the development of the real economy in the new market environment. Contradictory views and because of this – programs for denationalization of ruling governments lead to failure to achieve the necessary swift and favourable effects.
The prevailing private property in industry, agriculture and tourism and at the same time significant share of the state in areas like gas supply, railway transport, road infrastructure, partial power supply lead to worsening business environment and reducing the possibilities for fast economic growth.
2.7. Sectors
The importance of the private sector in Bulgaria’s GDP increases in the last few years. In relative structural terms, in regard to the private sector, the sector Services has the biggest importance. Just after it is rank the Industry sector, Table 2.5.
Table 2.5 Relative share of the private sector in GDP (%) 1990 1995 2000 2001 2002 Private sector (total) 9.1 44.7 61.6 63.4 64.3 Agriculture and forestry 6.0 10.4 12.1 11.7 10.6 Industry 1.9 9.2 18.0 18.7 18.9 Services 1.2 25.1 31.5 33.0 34.8 2003 2004 2005 2006 2007 Private sector (total) 64.5 66.9 68.2 64.3 64.5 Agriculture and forestry 9.9 9.2 7.8 12.1 11.4 Industry 20.2 20.9 22.2 29.1 29.7 Services 34.4 36.8 38.2 58.8 58.6 Source: NSI

National circumstances relevant to greenhouse gas emissions and removals 34
The indicator “GVA, private sector” is the Gross Value Added from producers, classified according to the type of property in the private sector: private, non-finance finance enterprises, households, non-trade organizations, service households.
It is necessary to take into account the increased importance of the private sector in the Bulgarian economy for the analyzed period. The Services sector remains the biggest with largest relative share in the travelled way toward market economy.
One disturbing fact is the drop in the agricultural sector. This is an important sector for the Bulgarian economy together with Tourism, taking into consideration the geographic location of the country and its climate profile. This negative trend is since the year 2000. To overcome this trend, the country must adequately use the EC agricultural structural funds, to introduce preferential state policy in the sector and initiate entrepreneur training of the Bulgarian farmers regarding their entrepreneurial spirit.
2.7.1. Land Use and National Resources
Bulgaria territory is endowed with a variety of both metallic and non-metallic minerals. Geologic exploration has identified about 40 coal basins, which together contain an estimated 4.1 billion tons of proven recoverable reserves. Of the reserves, virtually all is lignite. The main mining areas are in the Pernik basin south-west of Sofia, the Maritsa basin south of Stara Zagora, the Maritsa basin at Dimitrovgrad in the south, and Lom on the Danube. Lignite and brown coal fuel the country's thermal power stations and are used as fuel and as raw material for many of its industries. Although deposits of bituminous and anthracite coal have been almost exhausted in Bulgaria, other promising deposits of black coking coal have been found in the northeast, in the Dobruja region Deposits of iron ore are estimated at 317 million tons; one of the largest reserves is at Kremikovtsi near Sofia, the site of the country's largest metallurgical plant. Smaller quantities of iron ore are mined in the northwest (Montana [formerly Mikhaylovgrad]), in the central region (Troyan), and in the southeast (Yambol). There are significant deposits of nonferrous ores (copper, lead, and zinc) in the Rhodope Mountains, the Balkan Mountains, and the Sredna Gora Mountains. Bulgaria is also rich in less valuable minerals, including rock salt, gypsum, limestone, dolomite, kaolin (china clay), asbestos, perlite, feldspar, fluorite, and barite. Bulgaria has only small deposits of oil and natural gas; mineralogists have begun offshore exploration of the Black Sea, which is believed to be rich in coal, oil, natural gas, and other minerals. Common information on the Land Use in Bulgaria is shown on Table 2.6.
Table 2.6 Land use in Bulgaria – general information, 2007 Arable land 32 % Perennials 2 % Forest land 34 % Permanent pastures 18 % Other 14 %
wetlands 2 % settlements 7 % other land 5 %
Source: GHG Inventory (statistics used: MAF, EFA, NSI)
2.7.2. Agriculture
Agriculture is one of the most important sectors of the Bulgarian economy. Much of the Bulgarian population is occupied in it. The sector forms a relatively small share of the GDP.

National circumstances relevant to greenhouse gas emissions and removals 35
Bulgaria has excellent natural conditions for the development of agriculture. Cultivated agricultural land covers 48 % of the total territory of the country. The favourable climate for various cultures, the fertile soil and long standing traditions in the sector, low labour cost, the presence of colleges and high schools on modern farming training can support a promising development of this sector.
Agriculture is in a crisis at present. Most of the farms are small and do not have at their disposal significant financial means. Various European funds are not enough efficiently used. The state must intervene to get out quickly of the crisis in this important structural sector of the Bulgarian economy.
2.7.3. Forestry
Forestry is a traditional important economic sector for Bulgaria, where significant state investments for the last 40 years have created a potential for significant and sustainable logging in the future, when young plantations will grow and become suitable for felling.
The forests cover some 34 % of the total area of the country, support valuable ecosystems and control erosion. A big share of these forests (39.8 %) has special function – protective and rehabilitation. A potential problem in the sector is the slow pace of reforms and restructuring.
In the Table 2.7, data for the forest areas in Bulgaria is given.
Table 2.7 Total and wooded forest area, 1000 ha Type of forest 1990 1995 2000 2001 2002 Total 3871 3876 3914 3980 4003 Coniferous 1330 1304 1282 1295 1291 Non-coniferous 2541 High-stemmed 1579 1535 1541 1525 Low-stemmed 993 1097 1144 1187 of which: Wooded forest area 3348 3334 3375 3443 3489 Coniferous 1213 1154 1115 1123 1122 Non-coniferous 2135 High-stemmed 1251 1237 1253 1256 Low-stemmed 929 1023 1067 1111 Type of forest 2003 2004 2005 2006 2007 Total 4015 4064 4077 4090 4108 Coniferous 1289 1288 1279 1271 1277 Non-coniferous High-stemmed 1501 1478 1460 1452 1436 Low-stemmed 1225 1298 1338 1367 1395 of which: Wooded forest area 3548 3648 3674 3347 3704 Coniferous 1148 1151 1147 1143 1139 Non-coniferous High-stemmed 1252 1278 1268 1264 1254 Low-stemmed 1148 1219 1259 1285 1311 Source: NSI
The data reported in Table 2.7 relate to the land of the forest fund, which includes aereas different from forests.
The Bulgarian Government Program 2001 – 2005, has identified the following main priorities in the areas of agriculture and forestry:

National circumstances relevant to greenhouse gas emissions and removals 36
1. Efficient management of agriculture and forestry resources and development of market structures.
2. Increasing the competitiveness of primary and secondary agricultural sector and creating conditions for development of export oriented agriculture.
3. Preparation for the implementation of the requirements of EU common market and cap mechanisms, as well as adherence to international agreements.
4. Sustainable rural development.
5. Eco-friendly and sustainable management of forestry resources, game and protected natural areas.
2.8. Biodiversity
The big variety of habitats and biogeographic conditions has lead to a diversity of the flora and fauna in the country, ranking Bulgaria amongst the first in Europe- Table 2.8.
Table 2.8 Biodiversity Groups of organisms
Europe Bulgaria Endemic taxons/ Rare taxons/ Protected species
Protozoa n.a. 1 800 n.a. 422 0 Fungal/mushrooms n.a. 3 500 n.a. n.a. 0 Seaweeds and pubescence
n.a. 3 666 n.a. 41 0
Mosses n.a. 709 14 25 0 Higher plants 12 500* 3 750 170 728 389 Invertebrates 200 000* 23 180* 1 131 2 125 All cave habitats and 11 insect speciesFresh water fish 227 122 10 17 0 Amphibians 71 16 1** 0 14 Reptiles 199 36 4** 2 21 Birds 520 383 0 78 327 Mammals 250 94 6** 10 45 * - approximately ** - subspecies n.a. – not available
One of the main ways for the protection of this biodiversity and landscape diversity is the protection of territories. According to the Forest Act, the National Forestry Directorate (NFD) at MAF creates a special purpose system of forests, the objective of which is the protection and increase of the non-wood producing functions of the forest eco systems. These areas, reaching 34 % of the total area of the state forest fund, have a management regime categories I to VIII as in the protected area territories classification of IUCN.
A system of recreational forests has been established around the national tourist and balneo centres, vacation villages and big cities. Its objective is to create optimal conditions for relaxation, tourism and treatment of the citizens. Their area is 237 903 ha.
The protection of the genetic fund of forest wood species is carried out with the creation of seed-funds, plantations, dendrary botanical gardens and botanical gardens with an total are of 44 622 at present.
The hunting grounds encompass 140 127 ha area and are located in territories, where the genetic fund of the game and its population is being preserved and increased.

National circumstances relevant to greenhouse gas emissions and removals 37
Having 3 567 higher plants on its territory, Bulgaria ranks 5th in Europe on number of species. Bulgaria also has 750 medical plants.
2.9. Taxes and Tax Policy
The objective of the tax policy is to reach macroeconomic stability, a sustainable economic growth and increase of social responsibility.
The objectives above cause reduction of the social security burden, increase of indirect taxes, decrease of the threshold of the personal income amount not subject to taxation down to zero, profit tax reduction and raising the property tax assessment values.
Changes in tax legislation shift the tax burden from direct to indirect taxes, but without a reduction of the total burden itself they will be only of redistributive nature.
The Bulgarian government has declared its intention for lowering the corporate tax rates. In 2009 started the implementation of corporate tax 10 %.
2.10. Energy and Industrial Profile
2.10.1. Energy Profile
The big and swift industrialization of Bulgaria during the 60-ies of the last century determined the energy profile of the country. Industry is the biggest energy consumer with the energy intensity of the consumption of the sector decreasing during the last few years. The development of the Service sector is the logical reason for an increase of the energy consumption in the transport sector. Data on the structure of energy consumption in Bulgaria are given in Table 2.9 and Table 2.10.
Table 2.9 Structure of final energy consumption (Per cent) 1990 1995 2000 2001 2002 Industry 51.9 52.2 40.9 40.3 38.2 Transport 15.2 6.1 21.8 23.2 24.1 Households 22.0 29.1 26.0 24.2 25.7 Others 10.9 12.6 11.3 12.4 11.9 Total 100 100 100 100 100 2003 2004 2005 2006 2007 Industry 38.4 38.4 36.9 36.3 37.9 Transport 25.3 26.9 28.4 28.8 28.1 Households 25.1 24.1 22.2 22.5 21.8 Others 11.3 10.6 12. 5 12.4 12.2 Total 100 100 100 100 100 Source: NSI
Industry is the biggest energy consumer in Bulgaria’s economy.

National circumstances relevant to greenhouse gas emissions and removals 38
Table 2.10 Final energy consumption (PJ) 1990 1995 2000 2001 2002 Industry 250.3 146.02 144.5 142.0 136.3 Transport 27.9 85.0 77.0 81.6 86.1 Households 145.0 94.2 91.7 85.1 91.8 Others 51.5 41.1 40.0 43.6 42.6 Total 519.7 478.97 353.26 352.3 356.78 2003 2004 2005 2006 2007 Industry 147.5 143.23 143.60 147.78 150.84 Transport 97.1 100.33 110.52 117.24 111.84 Households 96.5 89.89 86.39 91.60 86.76 Others 43.4 39.54 48.64 50.48 48.56 Total 384.73 372.99 389.15 407.1 398 Source: NSI
Public administration, in control and responsible for energy and industry includes:
Ministry of Economy, Energy and Tourism Energy Efficiency Agency (EEA)
State Energy and Water Regulatory Commission
Agency for Nuclear Regulation
Ministry of Environment and Water
Bellow is given organizations, part of which non-governmental, engaged with the problems of the economy and the energy sector.
Local and Regional Energy Agencies and Energy Bodies;
Sofia Energy Agency SOFENA;
Foundation Regional Energy Centre;
The Foundation Regional Energy Centre located in Lovech acquires and transfers information, technology and know-how to the region and Bulgaria;
Union of Bulgarian Black Sea Local Authorities;
Black Sea Regional Energy Centre;
Bulgaria imports 100 % of the needed nuclear fuel, 99 % of the oil, 99 % of the natural gas and 44 % of the coal. The structure of the Final Energy Consumption (FEC) for the Bulgarian economy predetermines a big share of secondary energies and necessity of transformation of a significant quantity of energy resources, i.e. about 40 % of the energy resources included in the Primary Energy Consumption (PEC) are lost in the transformation processes.
Solid and liquid fuels, which are on market prices and also secondary energies (electricity and heat energy), whose prices are being regulated, decrease their share in FEC. The share of natural gas started to grow fast after 2002, following a long period of decrease. The biggest consumer of electricity and heat energy, as well as biomass (wood burning) is the household.
After a long period of decrease FEC started to increase extensively faster than GDP in 2003. The Industry sector is the decisive one for the high value of FEC.
The primary energy intensity of the GDP drops down continuously for the period 1997-2003 but the pace of reduction has decreased after 2003.

National circumstances relevant to greenhouse gas emissions and removals 39
2.10.2. Industrial Profile
The Bulgarian industry has gone its difficult way from centralized planned economy to the open gates of EU. As an ex Comecon member country, in a short period of time, Bulgaria was industrialized with low efficiency heavy industry, which was also great resource consumer.
The private sector and the main manufacturing sectors in the Bulgarian industry have a significant share in the growth during the last few years, which can be seen in data in Table 2.11 bellow.
Table 2.11 Output of the industrial enterprises by kind of ownership (Per cent) 1990 1995 2000 2001 2002 Total 100 100 100 100 100 Public sector 99.2 88.8 25.4 22.3 21.4 Private sector 0.8 11.2 74.6 77.7 78.6 2003 2004 2005 2006 2007 Total 100 100 100 100 100 Public sector 16.6 15.6 10.8 8.30 8.7 Private sector 81.4 84.4 89.2 9197 91.3 Source: NSI
2.11. Transport
Bulgaria had 19425 km roads on 31.12.2007. 18826 of them are asphalt paved. In structural terms the majority are category 3 roads with a 61.8 % share, followed by category 2 – 20.7 %. Highways are 418 km with the lowest relative share – 2.15 %.
The transport network is characterized by a poorly developed infrastructure in all transport sectors.
Bulgaria has a concept for the development of transport infrastructure during the period 2005-2015.
Data on carried passengers and transport of goods is given in Table 2.12 and Table 2.13, respectively.
Table 2.12 Passengers carried – thousands Year 1990 1995 2000 2001 2002 Total 2757815 1301152 1506645 1478151 1123950 Land transport 2269489 967343 1158551 1130505 810872 Waterway transport 266 28 76 67 60 Air transport 2564 1297 1261 861 856 Urban electrical transport 485496 273544 346757 346718 312162 Year 2003 2004 2005 2006 2007 Total 1161266 1021098 988581 946101 924436 Land transport 830272 719382 698014 657362 628162 Waterway transport 79 84 86 80 243 Air transport 1471 1782 2071 2320 2237 Urban electrical transport 329444 299850 288410 286339 293794

National circumstances relevant to greenhouse gas emissions and removals 40
Table 2.13 Transport of goods - thousand tons Year 1990 1995 2000 2001 2002 Total 392580 109978 96001 95000 110745 Land transport 359120 81309 75514 76959 93560 Waterway transport 22979 19210 20465 18037 17178 Air transport 23 14 22 4 7 Pipe line transport 10458 9445 - - - Year 2003 2004 2005 2006 2007 Total 107011 107759 118436 124271 132834 Land transport 92826 91952 102100 109131 117978 Waterway transport 14172 15783 16315 15127 16854 Air transport 13 2418 14 13 2 Source: NSI
The most stable growth is for passenger cars and lorries, while there is almost no change for motorcycles and mopeds.
The vehicle park in Bulgaria is changing its structure not only in quantity but also in quality for the last few years. The increased number of passenger cars comes from the big import of second hand cars mainly from Germany, Austria and the Netherlands. This determines their relative high average age.
The number of vehicles is 2 461843 on 31.12.2007 and the unfavourable age related to the year of their initial registration. More than 1/3rd of the total number of vehicles is older than 20 years, which causes increased emissions in the atmosphere on one hand and increased number of car incidents on the other.
Current transport project with necessity for accelerated implementation:
Danube bridge ІІ – in the “Vidin-Kalafat” area;
Rail road “Plovid-Svilengrad”;
Rail road “Karnobat-Sindel”;
Motorway “Lyulin”;
Construction of a terminal for combined transport in the area of the city of Sofia (Kazichane);
Construction of the south arc of the Sofia ring road motorway
Motorway "Maritca"
Those entire projects are at a different stage of realization. The common feature is the delay as to the planned schedule in the official investment programs of several governments. A trend of a constant increase of the planned resources is observed.
2.12. Waste
Landfilled solid waste is one of the key contributors for GHG emissions in Bulgaria. Some typical parameters for the collected waste are given in Table 2.14.

National circumstances relevant to greenhouse gas emissions and removals 41
Table 2.14 Waste, thousand tons Year 1990 1995 2000 2001 2002 Industrial non-hazardous waste 254625 92335 86397 79632 of which: Landfilled 251247 91306 85142 78812 Collected municipal waste 7127 4494 3318 3211 3199 Final landfilled municipal waste 6770 4449. 3271 3198 3188 Year 2003 2004 2005 2006 2007 Industrial non-hazardous waste 84313 - - - of which: Landfilled 83375 - - - Collected municipal waste 3209 3092. 3237. 3103 3324 Final landfilled municipal waste 3194 3092. 3144. 2751 2980 Source: IE and NSI
A number of attempts for capturing of methane at landfills have been made and using it as an energy source. So far the practice in Bulgaria is to only burn small quantities hazardous waste from the pharmaceutical industry.
2.13. Flexibility in accordance with Article 4.6 and 4.10
In compliance with Article 4.6 and 4.2(b) of the UNFCCC, Bulgaria as a country in transition has adopted 1988 as a base year for the implementation of the Convention instead of 1990. Party has chosen 1995 as base year for HFCs, PFCs and SF6. Bulgaria’s quantified emission limitation is 0.92 as included in Annex B to the Kyoto Protocol. The base year emissions are set at 132,618,658 tonnes and the assigned amount are 610,045,827 tonnes CO2 eq.
As an Annex I Party of the UNFCCC the Republic of Bulgaria adopted the target to stabilize emissions of greenhouse gases by 2000 at a level not exceeded that in 1988. The same year was used when comparing, evaluating and projecting greenhouse gas emissions. The 2000 target was successfully achieved by the country.
Bulgaria has also identified information on parameters and elections for LULUCF under Article 3, paragraph 3, of the Kyoto Protocol in accordance with decision 16/CMP.1. This includes a minimum tree crown cover of 10 per cent, minimum land area of 0.1 hectares and a minimum tree height of 5 metres.
Bulgaria has chosen to account for Article 3, paragraph 3, activities for the entire commitment period and has not elected any activities for Article 3, paragraph 4.

Greenhouse gas inventory information 42
3. GREENHOUSE GAS INVENTORY INFORMATION
3.1. Introduction
This chapter represents information about the annual GHG emissions in Bulgaria for 2008 (Bulgaria’s 2010 annual inventory submission). This Inventory is prepared by the Executive Environmental Agency according to the UNFCCC Guideline approved by the Subsidiary Body for Scientific and Technological Appliance on the 21st session on 06-14.12.2004 in Buenos Aires. The rules and the structure of the National GHG Inventory Report are formed by this Guideline. The report is elaborated in compliance with the Revised IPCC Guidelines, 1996, IPCC Guidelines, 2006 and Good Practice Guidance for National GHG Inventories, 2000 and following the Updated UNFCCC reporting guidelines on annual inventories, incorporating the provisions of decision 14/CP.11. The annotated outline of the NIR, and the guidance contained therein, developed by the UNFCCC secretariat in 2009, has been followed only partly.
According to the IPCC Good Practice Guidance, 2000 and UNFCCC Guidance, the Inventory should be prepared in a way that ensures Transparency, Consistency, Comparativeness, Completeness and Accuracy.
The current report also presents the GHG emissions trends for the period 1988-2008. There are described as well:
- Methods and indices for uncertainty assessment of the annual GHG emissions and trends;
- Key GHG emission category according to method of the type Tier 1, specified in the Good Practice Guidance;
- Assessment of the quality assurance and control system.
Key sources
In defining the key sources of GHG emissions, the IPCC methodology, proposed in the Good Practice Guidance for GHG Inventories, is used. Key source analysis is not reported in the NIR. It was presented to the ERT later before the review. The list of the key sources for 2008 is changed compared with the one in 2007.
The determination of the key sources according to the method type Tier 1 treats the national total annual emissions as well as the total trend for annual emissions.
According to the presented to the ERT key source analysis the key category with the highest contribution to national total emissions is 1A1a Public Electricity and Heat Production - Solid fuels (CO2). It ranked 1 in all level assessments and number 1 in trend assessment in 2008.
The second most important source for greenhouse gas emissions in Bulgaria is 6A Solid Waste Disposal on Land (CH4) and the third most important source in terms of its contribution to national total emissions is 1A3 Road transportation, Diesel (CO2).
3.2. Summary Tables
The main greenhouse gases to be reported pursuant to UNFCCC are as follows:
Carbon dioxide - CO2

Greenhouse gas inventory information 43
Methane - CH4
Nitrous oxide - N2O
Hydrofluorocarbons – HFCs
Perfluorocarbons - PFCs
Sulphur hexafluoride - SF6.
Each of these gases has a warming effect which can be distinguished by its amount. As an example, the gases HFCs, PFCs and SF6 (so called F-gases) have much greater warming effect compared to methane, nitrous oxide and carbon dioxide.
Table 3.1 represents the emission trends of the basic GHG, the overall emissions (not taking into account the LULUCF).
There can be seen that in the year 2008 the overall of the GHG emissions expressed in CO2 eqv. registered an decrease. The emissions for the year 2008 are on 42.83 % below the base year 1988 emissions and they registered an decrease by 4.36 % in comparison to the previous year 2007.

Greenhouse gas inventory information 44
Table 3.1 Summary of emission trend per source category and gas, Gg CO2 eqv. Source category 1988 1989 1990 1991 1992 1993 1994 1995 1996 1997
1. All energy 89 762 88 585 79 446 61 744 59 325 59 612 58 297 59 551 59 433 57 920 1A. Energy: fuel combustion
86 867 85 663 77 027 59 793 57 309 57 591 56 325 57 443 57 366 55 880
CO2: 1. Energy industries 40 552 40 231 37 850 29 594 28 055 28 693 26 214 26 669 26 392 28 496 CO2: 2. Industry 23 640 22 404 24 027 20 505 19 304 17 849 19 939 21 658 21 460 19 414 CO2: 3. Transport 7 154 7 585 6 646 3 838 4 032 4 552 4 176 4 442 4 362 4 381 CO2: 4. Other sectors 6 201 5 976 7 474 5 140 5 108 5 610 5 210 3 875 4 337 2 938 CO2: 5. Other 8 273 8 390 30 48 58 77 46 54 75 29 CH4 380 375 323 261 303 311 261 244 281 234 N2O 667 701 676 407 449 500 479 502 459 388 1B. Fugitive fuel emissions
2 895 2 922 2 419 1 951 2 016 2 020 1 972 2 109 2 066 2 040
CO2 6 6 5 5 7 8 7 7 6 5 CH4 2 889 2 916 2 413 1 946 2 009 2 012 1 965 2 102 2 061 2 036 N2O NA,NO NA,NO NA,NO NA,NO NA,NO NA,NO NA,NO NA,NO NA,NO NA,NO 2. Industrial Processes (ISIC)
12 286 11 915 10 739 8 385 6 683 6 659 8 245 10 100 9 974 8 938
CO2 10 414 10 259 9 172 7 326 5 803 5 893 7 369 8 796 8 638 7 903 CH4 82 81 63 47 44 52 68 74 69 74 N2O 1 791 1 576 1 503 1 011 836 715 808 1 213 1 248 938 HFCs IE,NA,NO IE,NA,NO IE,NA,NO IE,NA,NO IE,NA,NO IE,NA,NO IE,NA,NO 11 13 17 PFCs IE,NA,NE,NO IE,NA,NE,NO IE,NA,NE,NO IE,NA,NE,NO IE,NA,NE,NO IE,NA,NE,NO IE,NA,NE,NO IE,NA,NE,NO IE,NA,NE,NO IE,NA,NE,NO SF6 NA,NE,NO NA,NE,NO NA,NE,NO NA,NE,NO NA,NE,NO NA,NE,NO NA,NE,NO 5 6 6 3. Solvent and Other Product Use
76 76 73 73 72 72 71 71 71 70
CO2 23 23 22 22 22 22 22 22 21 21 N2O 53 53 51 51 50 50 50 49 49 49 4. Agriculture 17 984 16 967 15 684 12 872 10 290 8 809 8 304 7 426 7 007 7 052 CH4 Enteric fermentation 3 934 3 832 3 691 3 423 2 881 2 287 1 932 1 823 1 780 1 725 CH4 Manure management 1 589 1 597 1 558 1 383 1 139 936 797 768 712 642 CH4 Rice cultivation 114 115 89 69 38 26 7 12 22 32 CH4 Field Burning of Agricultural Residues
114 144 112 126 86 64 67 73 42 64
N2O Manure Management
1 459 1 441 1 395 1 262 1 059 897 791 762 726 672
N2O Agricultural soils 10 725 9 779 8 791 6 555 5 051 4 572 4 681 3 956 3 706 3 890 N2O Field Burning of Agricultural Residue
49 61 47 54 38 27 28 33 20 27
5. LULUCF -13 734 -13 580 -13 387 -13 260 -12 917 -12 199 -11 976 -12 460 -11 278 -11 343

Greenhouse gas inventory information 45
Source category 1988 1989 1990 1991 1992 1993 1994 1995 1996 1997 CO2 -13 898 -13 744 -13 554 -13 425 -13 099 -12 427 -12 204 -12 625 -11 449 -11 508 CH4 1 1 3 2 15 54 53 2 6 2 N2O 163 163 163 163 166 175 175 163 164 163 6. Waste 11 431 11 500 11 490 11 443 11 560 11 569 11 601 11 895 11 834 11 696 CO2 18 18 19 19 18 20 20 20 20 20 CH4 11 098 11 166 11 167 11 122 11 244 11 240 11 273 11 567 11 508 11 373 N2O 315 315 304 301 298 310 309 307 306 303 7. Other NA NA NA NA NA NA NA NA NA NA NATIONAL TOTAL EMISSIONS
131 540 129 044 117 432 94 516 87 929 86 721 86 519 89 043 88 318 85 676
International bunker 1 688 1 709 1 757 1 195 1 411 1 550 1 450 1 369 1 179 1 470
Source category 1998 1999 2000 2001 2002 2003 2004 2005 2006 2007 2008
1. All energy 54 763 48 193 47 000 50 126 47 247 52 138 49 964 50 660 52 177 55 378 52 658 1A. Energy: fuel combustion 53 251 46 920 45 559 48 836 46 001 50 806 48 840 49 393 51 008 54 106 51 400 CO2: 1. Energy industries 27 320 23 720 23 655 27 610 24 988 26 832 26 575 26 548 26 917 30 615 31 683 CO2: 2. Industry 16 534 14 099 13 515 12 859 11 966 14 116 12 484 12 361 12 692 12 570 8 582 CO2: 3. Transport 5 547 5 782 5 577 5 751 5 997 6 584 6 980 7 674 8 301 8 128 8 508 CO2: 4. Other sectors 3 107 2 607 2 163 2 001 2 370 2 555 2 103 2 115 2 349 2 061 1 887 CO2: 5. Other 14 45 12 14 9 NO NO NO NO NO NO CH4 282 241 250 220 282 309 290 286 307 289 292 N2O 447 427 387 381 389 411 407 409 442 444 447 B. Fugitive fuel emissions 1 512 1 272 1 441 1 290 1 247 1 332 1 124 1 267 1 169 1 272 1 259 CO2 5 5 4 4 4 3 26 40 39 23 17 CH4 1 507 1 268 1 437 1 286 1 243 1 328 1 098 1 226 1 130 1 249 1 241 N2O NA,NO NA,NO NA,NO NA,NO NA,NO NA,NO NA,NO NA,NO NA,NO NA,NO NA,NO 2. Industrial Processes (ISIC) 6 341 5 418 6 486 6 282 5 552 6 136 6 358 6 657 6 416 6 862 6 018 CO2 5 727 4 911 5 806 5 586 4 948 5 455 5 590 5 782 5 646 6 001 5 100 CH4 63 60 54 53 46 59 48 47 45 40 22 N2O 522 413 588 598 503 551 625 705 539 604 580 HFCs 22 27 30 37 47 63 86 113 177 206 306 PFCs IE,NA,NE,NO IE,NA,NE,NO IE,NA,NE,NO IE,NA,NE,NO IE,NA,NE,NO IE,NA,NE,NO IE,NA,NO IE,NA,NO IE,NA,NO IE,NA,NO 0 SF6 6 7 7 8 8 9 9 9 9 10 10 3. Solvent and Other Product Use
70 54 67 53 55 50 52 53 55 54 54
CO2 21 5 19 6 8 4 7 8 10 9 10 N2O 48 48 48 47 46 46 46 45 45 45 45 4. Agriculture 7 198 7 210 6 558 6 943 7 021 6 364 6 706 6 383 6 198 5 825 6 030 CH4 Enteric fermentation 1 821 1 731 1 609 1 593 1 661 1 677 1 548 1 531 1 499 1 387 1 327 CH4 Manure management 684 627 528 538 589 591 554 557 551 502 468

Greenhouse gas inventory information 46
Source category 1998 1999 2000 2001 2002 2003 2004 2005 2006 2007 2008 CH4 Rice cultivation 34 12 30 33 44 47 45 39 43 54 65 CH4 Field Burning of Agricultural Residues
57 58 47 59 72 48 81 63 63 34 75
N2O Manure Management 690 613 497 505 529 524 509 502 488 455 415 N2O Agricultural soils 3 889 4 143 3 825 4 191 4 096 3 452 3 931 3 661 3 524 3 377 3 645 N2O Field Burning of Agricultural Residue
25 26 21 24 30 24 37 29 30 16 35
5. LULUCF -11 336 -11 347 -9 678 -10 126 -10 619 -10 620 -10 929 -10 814 -10 873 -9 711 -11 013 CO2 -11 524 -11 540 -10 051 -10 362 -10 806 -10 801 -11 096 -10 982 -11 049 -10 031 -11 195 CH4 21 24 171 60 19 15 3 4 11 128 16 N2O 167 168 202 176 167 166 163 164 165 192 166 6. Waste 11 443 11 130 10 961 10 645 10 660 11 449 11 460 10 666 10 591 10 505 10 435 CO2 34 28 62 39 39 44 70 56 53 35 43 CH4 11 107 10 802 10 600 10 315 10 334 11 119 11 106 10 327 10 257 10 189 10 113 N2O 302 300 299 290 287 286 284 283 281 281 279 7. Other NA NA NA NA NA NA NA NA NA NA NA NATIONAL TOTAL EMISSIONS
79 814 72 005 71 072 74 049 70 535 76 136 74 541 74 419 75 438 78 624 75 196
International bunker 1 472 344 470 692 727 910 763 814 752 691 913

Greenhouse gas inventory information 47
The summary emissions of GHG-precursors and SOx are shown in Table 3.2.
Table 3.2 Summary emissions from GHG-precursors and SOx
NOx Index total
NOx (1988=100)
CO Index total
CO (1988=100)
NMVOCIndex total NMVOC
(1988=100)SO2
Index total SO2
(1988=100)1988 284.89 100 713.67 100 173.51 100 1 795.82 100 1989 283.92 99.7 773.76 108.4 176.32 101.6 1 792.07 99.8 1990 252.32 88.6 690.12 96.7 156.90 90.4 1 584.17 88.2 1991 190.76 67.0 407.47 57.1 96.93 55.9 1 227.78 68.4 1992 181.89 63.8 462.16 64.8 104.54 60.2 1 265.81 70.5 1993 183.33 64.4 508.86 71.3 115.82 66.8 1 241.54 69.1 1994 177.04 62.1 501.00 70.2 115.65 66.7 1 230.23 68.5 1995 186.71 65.5 540.65 75.8 125.64 72.4 1 235.45 68.8 1996 186.35 65.4 485.88 68.1 117.49 67.7 1 254.37 69.8 1997 183.54 64.4 365.70 51.2 93.99 54.2 1 339.05 74.6 1998 181.17 63.6 462.73 64.8 111.38 64.2 1 287.20 71.7 1999 165.13 58.0 442.75 62.0 106.36 61.3 1 061.21 59.1 2000 164.27 57.7 415.82 58.3 105.45 60.8 1 057.15 58.9 2001 178.29 62.6 376.49 52.8 100.26 57.8 1 170.69 65.2 2002 171.51 60.2 426.69 59.8 106.16 61.2 1 083.46 60.3 2003 191.12 67.1 420.71 59.0 113.23 65.3 1 191.50 66.3 2004 191.49 67.2 423.92 59.4 113.21 65.2 1 160.40 64.6 2005 197.92 69.5 407.90 57.2 115.54 66.6 1 112.50 61.9 2006 205.32 72.1 440.20 61.7 123.26 71.0 1 120.69 62.4 2007 211.73 74.3 414.29 58.1 121.98 70.3 1 244.36 69.3 2008 210.76 74.0 436.28 61.1 119.88 69.1 1 224.76 68.2
The GHG Inventory for the year 2008 revealed that the overall GHG emissions expressed in CO2 eqv. are 75 195.90 Gg not taking into account the sequestration in sector Land use Change and Forestry. The net emissions (including the sequestration from LUCF) are 64 183.14 Gg.
3.3. Descriptive Summary
In Table 3.3 are given emission trends of the main GHG, the summary emissions (without reporting of LUCF) and the overall emissions share of the emissions from the base year, 1988, assumed as 100 %.
The distribution of emissions by gasses has undergone some changes compared to the base 1988, as it is shown in Figure 3.1.

Greenhouse gas inventory information 48
Table 3.3 The summary emission trends of main GHG (without reporting LUCF), Gg, CO2 eqv.
GHGs CO2 with
LUCF
CO2 without LUCF
CH4 N2O HFCs PFC SF6 Total
Index CO2
without LUCF
Index CH4
Index N2O
Index [group of six]
Index HFCs
Index PFC Index SF6
Index 1988 = 100 Index 1995 = 100 1988 82 383 96 281 20 200 15 059 IE,NA,NO IE,NA,NE,NO NA,NE,NO 131 540 100 100 100 100 1989 81 149 94 893 20 225 13 926 IE,NA,NO IE,NA,NE,NO NA,NE,NO 129 044 98.6 100.1 92.5 98.1 1990 71 693 85 246 19 418 12 768 IE,NA,NO IE,NA,NE,NO NA,NE,NO 117 432 88.5 96.1 84.8 89.3 1991 53 072 66 497 18 377 9 642 IE,NA,NO IE,NA,NE,NO NA,NE,NO 94 516 69.1 91.0 64.0 71.9 1992 49 307 62 406 17 743 7 780 IE,NA,NO IE,NA,NE,NO NA,NE,NO 87 929 64.8 87.8 51.7 66.8 1993 50 295 62 723 16 929 7 070 IE,NA,NO IE,NA,NE,NO NA,NE,NO 86 721 65.1 83.8 46.9 65.9 1994 50 797 63 002 16 371 7 146 IE,NA,NO IE,NA,NE,NO NA,NE,NO 86 519 65.4 81.0 47.5 65.8 1995 52 917 65 542 16 663 6 822 10.93 IE,NA,NE,NO 5.44 89 043 68.1 82.5 45.3 67.7 100 NA 100.0 1996 53 862 65 311 16 474 6 514 13.33 IE,NA,NE,NO 5.75 88 318 67.8 81.6 43.3 67.1 122.0 NA 105.8 1997 51 699 63 207 16 179 6 267 16.83 IE,NA,NE,NO 6.09 85 676 65.6 80.1 41.6 65.1 154.1 NA 111.9 1998 46 784 58 308 15 554 5 923 21.77 IE,NA,NE,NO 6.44 79 814 60.6 77.0 39.3 60.7 199.3 NA 118.4 1999 39 662 51 202 14 799 5 971 26.68 IE,NA,NE,NO 6.81 72 005 53.2 73.3 39.6 54.7 244.2 NA 125.3 2000 40 763 50 814 14 557 5 664 30.12 IE,NA,NE,NO 7.21 71 072 52.8 72.1 37.6 54.0 275.6 NA 132.6 2001 43 509 53 870 14 097 6 036 37.22 IE,NA,NE,NO 7.63 74 049 56.0 69.8 40.1 56.3 340.6 NA 140.3 2002 39 523 50 329 14 271 5 880 47.11 IE,NA,NE,NO 8.07 70 535 52.3 70.6 39.0 53.6 431.1 NA 148.4 2003 44 792 55 593 15 178 5 293 62.74 IE,NA,NE,NO 8.54 76 136 57.7 75.1 35.1 57.9 574.2 NA 157.0 2004 42 739 53 835 14 772 5 838 86.44 IE,NA,NO 9.03 74 541 55.9 73.1 38.8 56.7 791.1 NA 166.1 2005 43 602 54 584 14 077 5 635 113.29 IE,NA,NO 8.94 74 419 56.7 69.7 37.4 56.6 1 036.8 NA 164.5 2006 44 958 56 007 13 896 5 349 176.66 IE,NA,NO 9.29 75 438 58.2 68.8 35.5 57.4 1 616.8 NA 170.9 2007 49 411 59 442 13 745 5 221 205.98 IE,NA,NO 9.66 78 624 61.7 68.0 34.7 59.8 1 885.1 NA 177.6 2008 44 636 55 831 13 604 5 445 305.97 0.00 10.03 75 196 58.0 67.3 36.2 57.2 2 800.2 100.0 184.5

Greenhouse gas inventory information 49
Figure 3.1 The GHG distribution for 1988 (F-gases 1995).
SF6
0.00%
HFCs0.01%
CO2 without LUCF74%
CH4
15%
N2O11%
Figure 3.2 The GHG distribution for 2008
HFCs0.4%
CH4
18%
CO2 without LUCF
75%
SF6
0.01%
PFC0.00%
N2O
7%
The change in the overall emissions for the period 1988–2008 is shown in Figure 3.3.
The aggregated GHG emissions by sector in Bulgaria are shown in Table 3.4.

Greenhouse gas inventory information 50
Data in Table 3.4 shows the leading position of the aggregated emission of the energy sector. The sectors Waste and Industrial processes recently have got the second and the third position by contribution.
Figure 3.3 Total greenhouse gas emissions in CO2 eqv. Gg
0
10 000
20 000
30 000
40 000
50 000
60 000
70 000
80 000
90 000
100 000
110 000
120 000
130 000
140 000
1988
1989
1990
1991
1992
1993
1994
1995
1996
1997
1998
1999
2000
2001
2002
2003
2004
2005
2006
2007
2008
year
Gg
CO2 emissions excluding LULUCF CH4 N2O HFCs PFCs SF6
Table 3.4 Aggregated GHG emissions by sector, Gg, CO2 eqv.
Sector/year Energy Industrial Processes
Solvent and
Other Product
Use
Agriculture LULUCF Waste Total
(excluding LULUCF)
1988 89 762 12 286 76 17 984 -13 734 11 431 131 540 1989 88 585 11 915 76 16 967 -13 580 11 500 129 044 1990 79 446 10 739 73 15 684 -13 387 11 490 117 432 1991 61 744 8 385 73 12 872 -13 260 11 443 94 516 1992 59 325 6 683 72 10 290 -12 917 11 560 87 929 1993 59 612 6 659 72 8 809 -12 199 11 569 86 721 1994 58 297 8 245 71 8 304 -11 976 11 601 86 519 1995 59 551 10 100 71 7 426 -12 460 11 895 89 043 1996 59 433 9 974 71 7 007 -11 278 11 834 88 318 1997 57 920 8 938 70 7 052 -11 343 11 696 85 676 1998 54 763 6 341 70 7 198 -11 336 11 443 79 814 1999 48 193 5 418 54 7 210 -11 347 11 130 72 005 2000 47 000 6 486 67 6 558 -9 678 10 961 71 072 2001 50 126 6 282 53 6 943 -10 126 10 645 74 049 2002 47 247 5 552 55 7 021 -10 619 10 660 70 535 2003 52 138 6 136 50 6 364 -10 620 11 449 76 136 2004 49 964 6 358 52 6 706 -10 929 11 460 74 541 2005 50 660 6 657 53 6 383 -10 814 10 666 74 419 2006 52 177 6 416 55 6 198 -10 873 10 591 75 438

Greenhouse gas inventory information 51
Sector/year Energy Industrial Processes
Solvent and
Other Product
Use
Agriculture LULUCF Waste Total
(excluding LULUCF)
2007 55 378 6 862 54 5 825 -9 711 10 505 78 624 2008 52 658 6 018 54 6 030 -11 013 10 435 75 196
In Table 3.5 is given the sector contribution in aggregated emissions.
Table 3.5 Sector contribution in aggregated emissions, %
Sector/year Energy Industrial Processes
Solvent and Other
Product Use Agriculture Waste
1988 68.24 9.34 0.06 13.67 8.69 1989 68.65 9.23 0.06 13.15 8.91 1990 67.65 9.14 0.06 13.36 9.78 1991 65.33 8.87 0.08 13.62 12.11 1992 67.47 7.60 0.08 11.70 13.15 1993 68.74 7.68 0.08 10.16 13.34 1994 67.38 9.53 0.08 9.60 13.41 1995 66.88 11.34 0.08 8.34 13.36 1996 67.29 11.29 0.08 7.93 13.40 1997 67.60 10.43 0.08 8.23 13.65 1998 68.61 7.94 0.09 9.02 14.34 1999 66.93 7.52 0.07 10.01 15.46 2000 66.13 9.13 0.09 9.23 15.42 2001 67.69 8.48 0.07 9.38 14.38 2002 66.98 7.87 0.08 9.95 15.11 2003 68.48 8.06 0.07 8.36 15.04 2004 67.03 8.53 0.07 9.00 15.37 2005 68.07 8.94 0.07 8.58 14.33 2006 69.17 8.51 0.07 8.22 14.04 2007 70.43 8.73 0.07 7.41 13.36 2008 70.03 8.00 0.07 8.02 13.88
Analysis of Table 3.5 shows that sector “Energy”, where GHG emissions come from fuel combustion, headed the list in 2008 with the biggest share – 70.03 %. Sector “Waste” ranked the second place - 13.88 %, and sector “Agriculture” ranked the third place - 8.02 %.
Summary of the Key Sources of GHG Emissions
The presented here key source analysis was performed with data for greenhouse gas emissions of the submission 2010 to the UNFCCC after the recalculations introduced during the in-country review if the inventory. The identified key source categories are presented in Table 3.6.

Greenhouse gas inventory information 52
Table 3.6 Summary overview for Key categories, 2008
KEY CATEGORIES OF EMISSIONS AND REMOVALS
Gas Criteria used for key source identification
L T Q
Key category excluding LULUCF
Key category including LULUCF
Specify key categories according to the national level of disaggregation used:
1 A 3 b. Road Transportation - Diseal Oil CO2 x x x x 1 A 3 b. Road Transportation - Gasoline CO2 x x x x 1 A 3 b. Road Transportation - LPG CO2 x x 1 A 4 b. Residential - Soild Fuels CO2 x x x x 1A2a Solid fuels CO2 x x x x 1A2c Liquid fuels CO2 x x x x 1A2d Liquid Fuels CO2 x x x x 1A2e Liquid Fuels CO2 x x x x 1A2f Gaseous Fuels CO2 x x x x 1A2f Liquid Fuels CO2 x x x x 1A2f Solid Fuels CO2 x x 1A4b Liquid Fuels CO2 x x x 1A4c Liquid fuels CO2 x x x 1A5a Gaseous Fuels CO2 x x 1A5a Liquid Fuels CO2 x x x Ammonia production CO2 x x x x Cement production CO2 x x Cropland remaining Cropland CO2 x Direct N2O emissions from Agricultural soils N2O x x x x Enteric Fermentation - cattle CO2 x x x x Enteric Fermentation - sheep CO2 x x x Forest Land remaining Forest Land CO2 x Fugitive emissions: oil&gas operations CH4 x x x x Indirect N2O from Nitrogen used in Agriculture N2O x x x x Iron and Steel Production CO2 x x Lime production CO2 x x x Manure Management - swine CO2 x x x x N2O from Nitric Acid production N2O x x x x Pasture, Range and Paddock Manure N2O x x x x Public Electricity and Heat Production - Gaseous Fuels CO2 x x x x Public Electricity and Heat Production - Liquid Fuels CO2 x x x x Public Electricity and Heat Production -Solid Fuels CO2 x x x x Solid Waste Disposal CH4 x x x x
3.3.1. Energy
The Energy sector in Bulgaria holds a key position in the national economy. It was the source of over 70.03 % of the aggregated GHG emissions for the last inventory 2008.
Energy industries kept the largest share - 60.42 % of the overall emissions in this sector. An increase of the relative share compared to the base 1988, can be observed for Energy industries – from 45.34 % up to 60.42 % and for Transport – from 8.49% up to 16.72 % in 2008. For all other sub-sectors this share decreases – for Manufacturing Industries and

Greenhouse gas inventory information 53
Construction – from 26.45 % down to 16.37 % and the public sector and households – from 7.26 % down to 4.10%. The last figure can be assumed as a positive result from the reduced direct fuel combustion in the households, which has led to an overall GHG emission and air pollutants’ reduction.
The emissions growth in the energy industries, in 2003 compared to the preceding year, was due to the early decommissioning of units 1, 2, 3 and 4 (1760 MW) in NPP Kozloduy, and the increased power consumption in the country, despite the decreased export of electricity by 46 %.
The trend of Transport sub-sector shows slight fluctuations, as in 2008 the emissions increased and were 16.72% of the overall CO2 emissions in the sector. The fluctuations resulted from variations of liquid fuel prices, and from restructuring of the vehicle fleet and renovation of the vehicles as well.
The overall trend in sub-sector “Other sectors” (Services, Households, Agriculture and Forestry) displayed fluctuations as well.
The road transport was the largest emission source of main GHG in sub-sector “Transport” – 91.28 % of the CO2 emissions, 96.52 % of methane emissions, and 94.87 % of N2O emissions.
The change in the fuel sales to road transport in 2008, compared to the base 1988 is shown in Figure 3.4. The fuel mix in fuel sales to road transport in 2008 is shown in Figure 3.5. A clear trend towards increase of fuel sales can be seen, concerning the fuels that emit less air pollutants, including GHG
Figure 3.4 Fuel mix in fuel sales to road transport in 1988
Gasoline63%
Diesel Oil37%
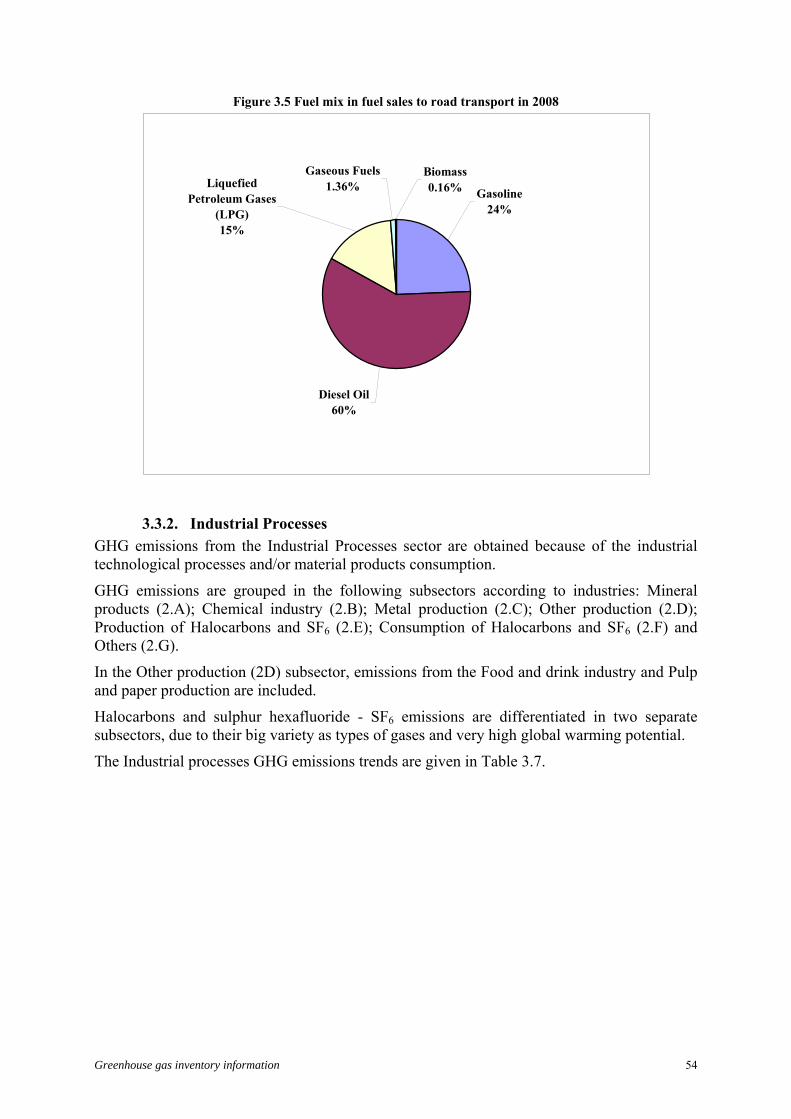
Greenhouse gas inventory information 54
Figure 3.5 Fuel mix in fuel sales to road transport in 2008
Diesel Oil60%
Liquefied Petroleum Gases
(LPG)15%
Gaseous Fuels1.36%
Biomass0.16% Gasoline
24%
3.3.2. Industrial Processes
GHG emissions from the Industrial Processes sector are obtained because of the industrial technological processes and/or material products consumption.
GHG emissions are grouped in the following subsectors according to industries: Mineral products (2.A); Chemical industry (2.B); Metal production (2.C); Other production (2.D); Production of Halocarbons and SF6 (2.E); Consumption of Halocarbons and SF6 (2.F) and Others (2.G).
In the Other production (2D) subsector, emissions from the Food and drink industry and Pulp and paper production are included.
Halocarbons and sulphur hexafluoride - SF6 emissions are differentiated in two separate subsectors, due to their big variety as types of gases and very high global warming potential.
The Industrial processes GHG emissions trends are given in Table 3.7.
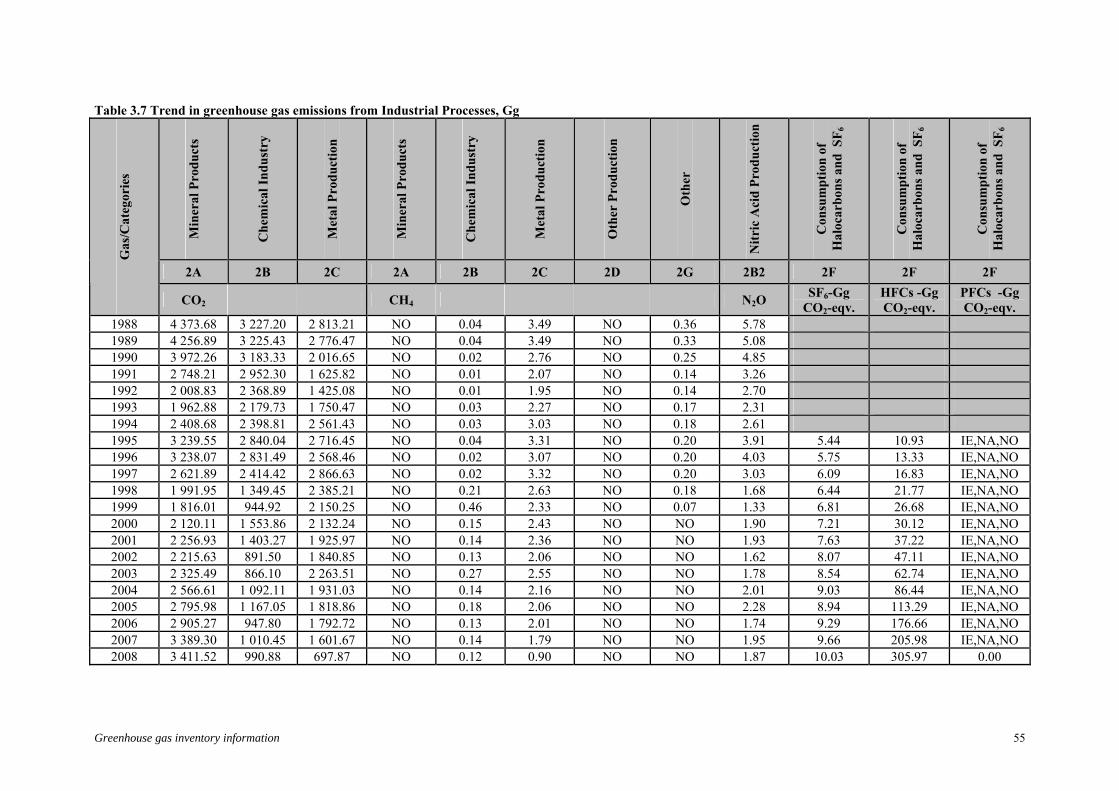
Greenhouse gas inventory information 55
Table 3.7 Trend in greenhouse gas emissions from Industrial Processes, Gg
Min
eral
Pro
duct
s
Ch
emic
al I
ndu
stry
Met
al P
rod
uct
ion
Min
eral
Pro
duct
s
Ch
emic
al I
ndu
stry
Met
al P
rod
uct
ion
Oth
er P
rod
uct
ion
Oth
er
Nit
ric
Aci
d P
rod
uct
ion
Con
sum
pti
on o
f H
aloc
arbo
ns a
nd
SF
6
Con
sum
pti
on o
f H
aloc
arbo
ns a
nd
SF
6
Con
sum
pti
on o
f H
aloc
arbo
ns a
nd
SF
6
2A 2B 2C 2A 2B 2C 2D 2G 2B2 2F 2F 2F
Gas
/Cat
egor
ies
CO2 CH4 N2O SF6-Gg
CO2-eqv. HFCs -Gg CO2-eqv.
PFCs -Gg CO2-eqv.
1988 4 373.68 3 227.20 2 813.21 NO 0.04 3.49 NO 0.36 5.78 1989 4 256.89 3 225.43 2 776.47 NO 0.04 3.49 NO 0.33 5.08 1990 3 972.26 3 183.33 2 016.65 NO 0.02 2.76 NO 0.25 4.85 1991 2 748.21 2 952.30 1 625.82 NO 0.01 2.07 NO 0.14 3.26 1992 2 008.83 2 368.89 1 425.08 NO 0.01 1.95 NO 0.14 2.70 1993 1 962.88 2 179.73 1 750.47 NO 0.03 2.27 NO 0.17 2.31 1994 2 408.68 2 398.81 2 561.43 NO 0.03 3.03 NO 0.18 2.61 1995 3 239.55 2 840.04 2 716.45 NO 0.04 3.31 NO 0.20 3.91 5.44 10.93 IE,NA,NO 1996 3 238.07 2 831.49 2 568.46 NO 0.02 3.07 NO 0.20 4.03 5.75 13.33 IE,NA,NO 1997 2 621.89 2 414.42 2 866.63 NO 0.02 3.32 NO 0.20 3.03 6.09 16.83 IE,NA,NO 1998 1 991.95 1 349.45 2 385.21 NO 0.21 2.63 NO 0.18 1.68 6.44 21.77 IE,NA,NO 1999 1 816.01 944.92 2 150.25 NO 0.46 2.33 NO 0.07 1.33 6.81 26.68 IE,NA,NO 2000 2 120.11 1 553.86 2 132.24 NO 0.15 2.43 NO NO 1.90 7.21 30.12 IE,NA,NO 2001 2 256.93 1 403.27 1 925.97 NO 0.14 2.36 NO NO 1.93 7.63 37.22 IE,NA,NO 2002 2 215.63 891.50 1 840.85 NO 0.13 2.06 NO NO 1.62 8.07 47.11 IE,NA,NO 2003 2 325.49 866.10 2 263.51 NO 0.27 2.55 NO NO 1.78 8.54 62.74 IE,NA,NO 2004 2 566.61 1 092.11 1 931.03 NO 0.14 2.16 NO NO 2.01 9.03 86.44 IE,NA,NO 2005 2 795.98 1 167.05 1 818.86 NO 0.18 2.06 NO NO 2.28 8.94 113.29 IE,NA,NO 2006 2 905.27 947.80 1 792.72 NO 0.13 2.01 NO NO 1.74 9.29 176.66 IE,NA,NO 2007 3 389.30 1 010.45 1 601.67 NO 0.14 1.79 NO NO 1.95 9.66 205.98 IE,NA,NO 2008 3 411.52 990.88 697.87 NO 0.12 0.90 NO NO 1.87 10.03 305.97 0.00

Greenhouse gas inventory information 56
The biggest share of the aggregated GHG emissions from sector Industrial Processes for 2008 has CO2 – 84.75 %, followed by N2O with 9.64 % and HFCs with 5.08 % in CO2–eq.
CO2 emission trends for the main categories are given in Figure 3.6.
Figure 3.6 CO2 emission trends from Industrial processes, Gg
0
500
1 000
1 500
2 000
2 500
3 000
3 500
4 000
4 500
5 000
1988
1989
1990
1991
1992
1993
1994
1995
1996
1997
1998
1999
2000
2001
2002
2003
2004
2005
2006
2007
2008
year
Gg
Mineral Products Chemical Industry Metal Production
The analysis of Figure 3.6 reveals that the emission fluctuations follow the changes of economic activity. Key factors on macroeconomic level were:
Changes in international markets; Privatization of state property.
Two key GHG sources contribute to the emissions in Mineral Products (CRF sector 2A) subsector, which are traditional in the economy of the country. These are the production of cement and lime.
CO2 emissions from cement production are 1 862.44 Gg in the year 2008, which is 2..48% of the aggregated total GHG emissions. During the last five years, there has been a stabilization of the production. The decrease of GHG emissions in 2008 is 4.03 %, compared to 2007.
CO2 emissions from quick lime production are 1 006.89 Gg in the year 2008, which is 1.34 % of the aggregated total GHG emissions. The decrease of the CO2 emissions in 2008 compared to 2007 is 1.01 %.
CO2 emissions from soda ash use are 96.63 Gg in 2008. The CO2 emissions from glass production are included in the Other emission source of the sector.
The CO2 emission trend for Mineral products production is given in Table 3.8.
This source Other includes CO2 emissions from glass, bricks production and from desulphurization. The emissions for the year 2008 are 445.56 Gg. They increase by 30.14 % compared to 2007 due to the increased emissions from the desulphurization process in the MARITZA IZTOK power stations.

Greenhouse gas inventory information 57
Table 3.8 CO2 emissions from Mineral products 1988-2008, Gg Years/
Sources Cement
Production Lime Production Soda Ash1 Other2
2A1 2A2 2A4 2A7 Total
1988 2 406 1 103 127 737 4 374 1989 2 246 1 136 156 718 4 257 1990 2 100 1 035 131 705 3 972 1991 1 240 785 124 599 2 748 1992 1 076 449 71 413 2 009 1993 1 131 352 55 425 1 963 1994 1 412 468 63 465 2 409 1995 1 954 681 93 512 3 240 1996 1 922 733 97 485 3 238 1997 1 542 658 83 339 2 622 1998 1 097 589 78 229 1 992 1999 1 085 538 34 160 1 816 2000 1 188 765 55 112 2 120 2001 1 204 880 63 110 2 257 2002 1 191 820 59 146 2 216 2003 1 248 883 49 146 2 325 2004 1 416 916 65 170 2 567 2005 1 586 955 74 181 2 796 2006 1 519 995 128 263 2 905 2007 1 941 1 017 89 342 3 389 2008 1 862 1 007 97 446 3 412
1 - Soda ash includes 2A4.1 Soda Ash Production and 2A4.2 Soda Ash Use 2 - Other includes Glass, Bricks Production and Desulphurized Emissions
The analysis of Table 3.8 shows a stable trend of the GHG emissions increase after 2002 and stabilization of emissions in 2008 from the two main sources – cement and lime production.
Chemical Industry (CRF sector 2B)
N2O emissions from nitric acid production expressed in CO2-eq. were 579.97 Gg for the year 2008. The emission decrease in 2008 is some 4.00% compared to 2007.
CO2 emissions from ammonia production were 970.16 Gg for the year 2008. The decrease of emissions in 2008 is some 2.07 % compared to 2007.
The analysis of the trends of GHG emissions for this subsector that are given in Table 3.9, shows a trend of significant reduction of GHG emissions in the year 2008 compared to 1988 – about three times for the ammonia.

Greenhouse gas inventory information 58
Table 3.9 GHG emissions from Chemical industry processes, Gg Ammonia Production Calcium Carbide Other Nitric Acid Production Sources
CO2 CH4 N2O 1988 3 138 89.32 0.04 5.78 1989 3 117 108.66 0.04 5.08 1990 3 087 96.52 0.02 4.85 1991 2 891 61.80 0.01 3.26 1992 2 326 43.20 0.01 2.70 1993 2 149 30.35 0.03 2.31 1994 2 368 30.62 0.03 2.61 1995 2 805 34.61 0.04 3.91 1996 2 798 33.35 0.02 4.03 1997 2 383 31.43 0.02 3.03 1998 1 329 20.15 0.21 1.68 1999 933 12.29 0.46 1.33 2000 1 542 11.90 0.15 1.90 2001 1 396 6.80 0.14 1.93 2002 884 7.55 0.13 1.62 2003 858 8.27 0.27 1.78 2004 1 068 24.44 0.14 2.01 2005 1 141 26.34 0.18 2.28 2006 925 23.05 0.13 1.74 2007 991 19.81 0.14 1.95 2008 970 20.72 0.12 1.87
Metal Production (CRF sector 2C)
CO2 process emissions from the steel production are a key source contributing 0.91 % of the total GHG emissions in the year 2008 – 682.83 Gg. This is one of the biggest sources of GHG emissions in the Industrial Processes sector. These are mainly emissions from production of pig iron, sinter and coke.
The trends of GHG emissions in this subsector are given in Table 3.10.
The analysis of Table 3.10 reveals significant decrease of GHG emissions in the year 2008 compared to 1988 – 74.71 % for steel production, 86.67 % for ferroalloys production, 76.99 % for coke production, 69.47 % for pig iron production and 76.97 % for sinter production. Very significant decrease of emissions is observed in 2008 compared to 2007 due to started closure of production factory.

Greenhouse gas inventory information 59
Table 3.10 GHG emissions from Metal industry processes, Gg Steel Ferroalloys Production Pig Iron Sinter Coke Sources
CO2 CH4 1988 2 700 112.80 1.30 1.46 0.73 1989 2 683 93.60 1.34 1.37 0.78 1990 1 973 43.20 1.03 1.04 0.69 1991 1 559 67.20 0.86 0.84 0.37 1992 1 387 38.40 0.76 0.77 0.42 1993 1 705 45.60 0.91 0.90 0.46 1994 2 480 81.60 1.32 1.15 0.56 1995 2 637 79.20 1.45 1.25 0.62 1996 2 492 76.80 1.35 1.13 0.58 1997 2 771 96.00 1.48 1.22 0.62 1998 2 356 28.81 1.25 0.97 0.41 1999 2 115 35.68 1.04 0.93 0.37 2000 2 112 20.28 1.09 0.90 0.44 2001 1 898 27.97 1.09 0.88 0.40 2002 1 822 18.44 0.96 0.71 0.38 2003 2 245 18.18 1.25 0.88 0.42 2004 1 914 17.42 1.04 0.71 0.42 2005 1 797 21.54 1.00 0.68 0.37 2006 1 749 44.03 1.03 0.65 0.33 2007 1 557 44.38 0.96 0.56 0.26 2008 683 15.04 0.40 0.34 0.17
3.3.3. Agriculture
GHG emissions from sector “Agriculture“, result from production activities during processing of agricultural products, soil fertilization and animal manure management.
GHG process emissions in sector “Agriculture” are grouped in the following sub sectors:
Enteric fermentation from domestic livestock;
Manure management;
Rice cultivation;
Agricultural soils;
Field burning of agricultural residues.
The biggest CH4 emission source in the sector is the enteric fermentation from domestic livestock.
The biggest N2O emission source is the Agricultural Soils sub sector.
Methane emission trends are given in Figure 3.7. They form 32.10 % of the total emissions in the sector in CO2 eqv. Despite that, the drop compared to the base 1988 year remains rather big – more than -66.34 %.

Greenhouse gas inventory information 60
Figure 3.7 CH4 emissions from Agriculture, Gg
0
20
40
60
80
100
120
140
160
180
20019
88
1989
1990
1991
1992
1993
1994
1995
1996
1997
1998
1999
2000
2001
2002
2003
2004
2005
2006
2007
2008
A. Enteric Fermentation B. Manure Management
C. Rice Cultivation F. Field Burning of Agricultural Residues
N2O emissions from the sector are also significant. The biggest share belongs to the agricultural soils emissions. It is about 89.02 % in the year 2008 and for the entire period 1988-2008, the share is in the range 82-89 %. N2O emissions from manure management and field burning of agricultural residues are of an order of magnitude smaller and in total are about 11-18 % from the aggregated N2O emissions of the sector.
In total, the N2O emissions, expressed in CO2 eqv. for 2008, are 2 time bigger than the CH4 emissions in CO2 eqv.
3.3.4. Waste
GHG emissions in the “Waste“ sector result from the processes of collection, storage and management of solid waste from household and the public sector and waste water treatment from household and industry.
According to the IPCC nomenclature, the following categories in this sector are considered:
Solid waste disposal;
Wastewater handling;
Waste incineration;
Other.
Only the first three categories from those mentioned above are included in the 2008 inventory.
The change of the methane emission trend for the period 1988-2008 is given in Figure 3.8.

Greenhouse gas inventory information 61
Figure 3.8 CH4 emissions from Waste sector, Gg
0
50
100
150
200
250
300
350
400
450
500
550
60019
88
1989
1990
1991
1992
1993
1994
1995
1996
1997
1998
1999
2000
2001
2002
2003
2004
2005
2006
2007
2008
This series are consistent and does not show sudden changes in some years. This is due to the influence of main sources of CH4- solid waste disposal and waste water treatment.
The trend analysis shows that CH4 emissions from solid waste disposal decrease from 488.55 to 446.90 Gg for the period 1997-2008 and keep a relatively steady level for the last three years. Solid wastes disposal emit CH4 because of the processes of anaerobic and aerobic decomposition of their organic content. The current inventory, as the previous inventories assumes that the emitted methane is 50 % of the total emitted biogas from the landfills.

Greenhouse gas inventory information 62
Figure 3.9 CH4 emissions from Solid Waste Disposal on Land, Gg
390.00
400.00
410.00
420.00
430.00
440.00
450.00
460.00
470.00
480.00
490.00
500.00
19
88
19
89
19
90
19
91
19
92
19
93
19
94
19
95
19
96
19
97
19
98
19
99
20
00
20
01
20
02
20
03
20
04
20
05
20
06
20
07
20
08
CH4 emissions from waste water are significantly smaller and have a trend, which does not change to the same degree as for solid waste. Treatment of industrial wastewater handling and domestic and public buildings wastewater handling is considered in separate groups.
Wastewater handling is a CH4 source of emissions in anaerobic conditions. The conditions for anaerobic and aerobic processing are usually combined, which is reflected by the introduction of a correction factor.
The trend analysis of the industrial wastewater shows a steady tendency for a decrease, reaching its minimum in 2002. However, there is a rapid rise in 2003 compared to the preceding year. The reason for this is the decision of the Ministry of Environment and Water for the discharge of several big tailing ponds in the country. This high level of the emissions of wastewater is kept in 2004 due to the same reason. In the present inventory this reason is omitted and the level of that kind of emissions is almost 2 times less.

Greenhouse gas inventory information 63
Figure 3.10 CH4 emissions from Industrial wastewater for 1988 – 2008, Gg
0
10
20
30
40
50
60
70
80
9019
88
1989
1990
1991
1992
1993
1994
1995
1996
1997
1998
1999
2000
2001
2002
2003
2004
2005
2006
2007
2008
Figure 3.11 CH4 emissions from Domestic/Commercial wastewater for 1988 – 2008, Gg
18
19
20
21
22
23
24
25
1988
1989
1990
1991
1992
1993
1994
1995
1996
1997
1998
1999
2000
2001
2002
2003
2004
2005
2006
2007
2008
Wastewater with nitrogen content, which is released as N2O in the atmosphere, results from food consumption by the population.
N2O emissions, expressed in CO2 eqv., amount to 278.7 Gg in 2008. The decrease is 0.69 % compared to 2007. It reflects the decrease of population, which is 0.69 %.

Greenhouse gas inventory information 64
3.3.5. Land use, land use change and forestry
General
This category includes emissions and greenhouse gas removals from different land-use types, changes in the land-use and forestry. The inventory in this sector is based on representative land-use types under IPCC GPG – Forest land, Cropland, Grassland, Wetland, Settlements, Other land, as well as land-use changes. The first three categories are of biggest importance for Bulgaria as they cover around 87% of the territory of the country.
The emissions and the removals in the different categories are presented in Table 3.11.
Table 3.11 CO2 emission/removals from changes in forest and other woody biomass stocks, [Gg] Emissions and removals of greenhouse gases (Gg CO2)
(-) removals, (+) emissions Years Total Forest land Crop land Grassland Wetlands Settlements Other land1988 -13 898 -14 982 1 192 -787 594 84 NO
1989 -13 744 -14 989 1 354 -787 594 84 NO
1990 -13 554 -14 964 1 511 -787 603 84 NO
1991 -13 425 -14 981 1 664 -787 594 84 NO
1992 -13 099 -14 837 1 838 -787 603 84 NO
1993 -12 427 -14 445 2 118 -787 603 84 NO
1994 -12 204 -14 447 2 343 -787 603 84 NO
1995 -12 625 -14 979 2 455 -787 603 84 NO
1996 -11 449 -13 907 2 558 -787 603 84 NO
1997 -11 508 -13 948 2 540 -787 603 84 NO
1998 -11 524 -13 761 2 337 -787 603 84 NO
1999 -11 540 -13 721 2 281 -787 603 84 NO
2000 -10 051 -12 216 2 265 -787 603 84 NO
2001 -10 362 -12 443 2 078 -787 696 94 NO
2002 -10 806 -12 969 2 117 -787 709 125 NO
2003 -10 801 -13 124 2 260 -787 721 129 NO
2004 -11 096 -13 357 2 176 -787 734 137 NO
2005 -10 982 -13 460 2 285 -787 747 232 NO
2006 -11 049 -13 503 2 211 -787 759 271 NO
2007 -10 031 -12 411 2 035 -787 772 360 NO
2008 -11 195 -13 675 1 993 -787 785 489 NO
Trend (%) -19.44 % -8.72 % 67.14 % 0.00 % 32.03 % 481.90 % NO
An increase in the emissions in settlements and wetlands is observed. The emissions of cropland are stabilized on the level 2000-2400Gg after 1995.
The removals in the subcategory Forest land are decreasing and for that reason total removals are also decreasing. This is because the wood stock change in the 2000- ies was smaller than in the 90-ies.
The results from the table show that the land- use, land- use changes and forestry are serving as sinks of greenhouse gases for Bulgaria. An important category is “Forest land” and especially “Forests remaining Forests”. The two categories – “Forest land” and “Grassland” are removals of СО2. All other categories are sources of emissions of СО2 and the total quantity of emissions from these categories is between 7.7 – 17.7 % from the removals of the СО2 in the forests and grasslands.
In the category of forests the removals of СО2 is 24.5 % of the total emissions for Bulgaria.
The net changes of the carbon stocks in the biomass cause biggest effect on the final results, obtained for the whole sector. Over the period 1990-2005 a permanent trend is observed for

Greenhouse gas inventory information 65
increasing the tree biomass stock (by 62% for the coniferous species and by 73% for the deciduous).
Database
To achieve the full time series of 1988-2008 for the areas staying in a certain category land-use and the converted lands, data form different statistical sources are used.
The data or the total area of the forest territories for the separate years, as well as the relative share of the coniferous and deciduous and the forests out of yield are obtained from the Forestry fund reports (Executive Forestry Agency).
Statistical data for the area are used for the annual crops and perennials from 1988 until 2008 - until 1999 from National Statistical Yearbook,, from year 2000 - Agrostatistics and Strategies Department at MAF. Agrostatistics provides information for the changes between croplands with annual crops to croplands with perennials as well as between croplands and grasslands over the period 2000-2008.
Concerning the total area of the grasslands for the single years for the period 1988-2008 statistical information is used (National Statistical Yearbook- up to 1999), Agrostatistics and Strategies Department at MAF from year 2000 on and data from the Executive Forestry Agency).
Agrostatistics provides information also on the changes in the land-use, between lands, separately with annual crops and perennials and grasslands in the period 2000-2008.
Information on the areas from the category wetlands for single years (1994, 1996, 1999 and 2000) were obtained form the cadastral maps of the agricultural fund of Bulgaria (Balance by Type of Territories as per their Designation, Cadastre Agency) and from Corine Land Cover that provides data for the years 1990, 2000 and 2006 (Executive Environmental Agency).
The information for the areas of the settlements for the single years (1996, 1998, 1999, 2000) was obtained from the cadastral maps of the agricultural fund of Bulgaria (Balance by Type of Territories as per their Designation, Cadastre Agency) and from Corine Land Cover for the years 1990, 2000 and 2006.
Rocks and landslides from Forest lands are referred to under category other lands from the statistics in the forest territory (Forestry fund reports, the Executive Forestry Agency).
Major problem is the limited information on the changes and the conversion between the separate categories. When data for completing the information are missing, information from available statistics were used as well as probability assumptions on land- use changes and estimates to level off the occurring land area changes were carried out.
In accordance with the IPCC GPG, Bulgaria reports the LUC areas in the LUC categories for a transition period of 20 years. Therefore, activity data back to 1968 are needed to report the LUC areas adequately. Due to the lack of data it is assumed that the trends of LUCs in the first years after 1988 were the same as in the years before. Consequently, the trends of the first years of the reporting period were extrapolated back to 1968.
Table 3.12 presents the database for the areas by types of land-use and land-use changes for the basic and the last year of the inventory.
Table 3.12 Areas by Type of Land use and land use changes for the base year and the last year of inventory. Area in - kha 1988 2008 2008-1989
5.A Forest Land - Total 3 598 3 846 248 5A1. Forest land remaining forest land 3 490 3 595 105

Greenhouse gas inventory information 66
Area in - kha 1988 2008 2008-1989 5A1. Forest land remaining forest land - coniferous 1 194 1 094 -100 5A1. Forest land remaining forest land - deciduous 2 275 2 479 204 5A1. Forest land remaining forest land – out of yield 21 22 1 5A2. LUC in forest land 108 251 143 5A2.1.a Annual Cropland in forest land 49 138 89 5A2.1.b Perennial Cropland in forest land 4 11 7 5A2.2 Grassland in forest land 27 74 47 5A2.3 Wetland in forest land NO NO NO 5A2.4 Settlement in forest land NO NO NO 5A2.5 Other land in forest land 28 28 0 5.B Cropland - Total 3 922 3 824 -98 Cropland annual - Total 3 547 3 550 3 Cropland perennial - Total 375 275 -100 5B1. Cropland remaining cropland - total 3 610 3 512 -98 5B1a annual cropland remaining annual cropland 3 210 3 212 2 5B1b perennial cropland remaining perennial cropland 298 198 -100 5B1c LUC perennial cropland in annual cropland 63 63 0 5B1d LUC annual cropland in perennial cropland 39 39 0 5B2. LUC in cropland 312 312 0 5B2.1a Forest land in annual cropland NO NO NO 5B2.1b Forest land in perennial cropland NO NO NO 5B2.2a Grassland in annual cropland 274 274 0 5B2.2b Grassland in perennial cropland 38 38 0 5B2.3a Wetlands in annual cropland NO NO NO 5B2.3b Wetlands in perennial cropland NO NO NO 5B2.4a Settlements in annual cropland NO NO NO 5B2.4b Settlements in perennial cropland NO NO NO 5B2.5a Other land in annual cropland NO NO NO 5B2.5b Other land in perennial cropland NO NO NO 5.C. Grassland -Total 2 008 1 946 -62 5C1. Grassland remaining grassland 1 759 1 697 -62 5C2. LUC in grassland 249 249 0 5C2.1 Forest land in grassland NO NO NO 5C2.2.a Annual cropland in grassland 230 230 0 5C2.2.b Perennial cropland in grassland 20 20 0 5C2.3 Wetlands in grassland NO NO NO 5C2.4 Settlements in grassland NO NO NO 5C2.5 Other land in grassland NO NO NO 5 D Wetlands - Total 202 210 8 5D1. Wetlands remaining wetlands 202 202 0 5D2. LUC in wetlands 0 8 8 5D2.1 Forest land in wetlands 0 3 3 5D2.2.a Annual Cropland in wetlands 0 3 3 5D2.2.b Perennial Cropland in wetlands 0 0 0 5D2.3 Grassland in wetlands 0 2 2 5D2.4 Settlement in wetlands NO NO NO 5D2.5 Other land in wetlands NO NO NO 5. E Settlements - Total 807 828 21 5E1. Settlements remaining settlements 801 803 2 5E2. LUC in settlements 6 24 18 5E2.1 Forest land in settlements 1 2 1 5E2.2.a Annual Cropland in settlements 4 14 10 5E2.2.b Perennial Cropland in settlements 0 1 1 5E2.3 Grassland in settlements 2 7 5 5E2.4 Wetlands in settlements NO NO NO 5E2.5 Other land in settlements NO NO NO 5 F Other land - Total (as to be reported) 562 446 -116

Greenhouse gas inventory information 67
Area in - kha 1988 2008 2008-1989 5 F Other land- Total (area statistics) 167 147 -20 5F1. Other land remaining other land 562 446 -116 5F2. LUC in other land NO NO NO 5F2.1 Forest land in other land NO NO NO 5F2.2.a Annual Cropland in other land NO NO NO 5F2.2.b Perennial Cropland in other land NO NO NO 5F2.3 Grassland in other land NO NO NO 5F2.4 Wetlands in other land NO NO NO 5F2.5 Settlements in other land NO NO NO Total area Bulgaria 11 100 11 100 0
Forest Land (5.А.)
Description of the category
Forests in Bulgaria cover an area of 3 846 804 ha which represents 34.6% of the country’s territory.
In the base year (1988) Bulgaria has carbon stock of 131.47 Mt in the living biomass and 198.8 Mt in the soils (0-30 cm).
More than 75.45% of the forests are state property, 11.5% are municipal and 9.6% are private property. The forest areas for timbering and site formation are 68.1%, the protective and recreational forests – 19.8% and protected forest and territories – 12%.
The wood stock is more than 590.78 millions m3 with an average annual growth of 14 100 100.0 m3.
Essential characteristics of the Bulgarian forests are:
- Average volume per 1 ha – 164 m3;
- Average increment per 1 ha – 4.0 m3;
- Average age – 51 years;
- Average density – 0.72;
- Average yield class- III.
The quantities of CO2 removals from forests are given in Table 3.11 for the entire GHGs inventory period (1988-2008).
The inventory of the greenhouse gases for the Forest category in compliance with the IPCC GPG includes an assessment of the changes in the carbon stock in 5 pools – aboveground biomass, belowground biomass, deadwood, litter and soil organic matter.
The available data base in Bulgaria allows the changes in the carbon stocks to be determined in the living biomass and the soil pool (0-30 cm). The litter and the soil organic matter in the mineral soil are regarded as a general pool. The net change in the stock of the soil carbon pool and dead wood are evaluated as per Tier 1 and is considered 0.
The data for the total forest area for the single years, as well as the relative share of the coniferous and deciduous and forests out of yield are obtained from the reports of the forestry fund (Executive Forestry Agency). The country is divided territorially into forestry management units and for each of them a forestry management plan is being developed (FMP). The plans contain reporting forms for the forestry fund (FF) including information for the: forest areas (1FF), afforestated area (2FF), tree biomass stock (3TR), stock by groups of forests and forest

Greenhouse gas inventory information 68
cover (4FF), wood harvest (5FF), age and density (6FF) and types of forest stands (7FF). The reporting forms 1FF and 5FF are updated annually and the remaining forms every other 5th year (e.g. 1985, 1990, 1995, 2000, 2005) and are submitted to the Regional Forestry Offices and in the Executive Forestry Agency. When developing the FMP a complete forest-inventory is used for all forests- state and non state (Bogdanov, K. 1991, Mihov, I. 2000) All research and assessment system is laid down in the Ordinance on the Forestry Planning and the Lands from the Forest Fund and of the Game Management Regions of Republic of Bulgaria. The assessment of the whole territory of the country has been carried out within10 years. For the future, large scale inventories are planned that cover Bulgaria within one year.
The data for the forest area are presented by the National Statistical Institute, as well as by the Statistical Office of the European Union, Eurostat.
Every five years data are submitted to the FRA / Forest Recourses Assessment(s), under the Forestry Department of the UN Food and Agriculture Organization, FAO.
Cropland (5В)
Description of the category
The information used was obtained form the National Statistical Institute (until 1999) and from Agrostatistics and Strategies Directorate of MAF (since 2000).
The category “Cropland” is divided into two subcategories – annual crops (arable lands and kitchen garden) and perennials (vineyards, fruit and berry plantation and nurseries).
Statistical data till 2000 includes arable lands and artificial and complex grasslands. Due to the different statistical methodology there is a difference between the data gathered till 1988 and after 2000.
There is no peat extraction and draining of soils and other anthropogenic activities that affect the water regime, the temperature on their surface and the species. Due to this reasons Histosols are not subject to evaluation.
Over the last 20 years no liming was applied on mineral soils, which also are not subject to evaluation.
Emissions/removals are estimated for the categories in Table 3.11.
Table 3.13 Categories assessed for emissions/removals - Cropland Categories 5 В. Cropland- total 5.В.1 Cropland remaining cropland - carbon stock change in living biomass of perennial cropland and LUC between annual and perennial cropland - carbon stock change due to changes in organic matter input (harvest residues) to cropland soils 5 B 2 Land converted to cropland 5 B 2 1 Forest land converted to cropland 5 B 2 2 Grassland converted to cropland - carbon stock change in living biomass of annual/perennial cropland - carbon stock change due to changes in organic matter input to cropland soils
The total area of the croplands in 2008 was 3824 kha, of which 3550 kha were annual crops and 275 kha – perennials. Conversion of lands to cropland is total of 312 kha.
The annual emissions from 1988 until 2008 ranges from 1192 Gg СО2 to 1993 Gg СО2. Major source of the emissions is the carbon stock change in the soils when converting grassland to cropland.

Greenhouse gas inventory information 69
For the total, annual and perennial cropland areas in the single years of 1988 – 2008 agricultural statistics are available (National Statistical Yearbooks, Structure of Agricultural holdings in Bulgaria published every crop years since 2000).
These statistics give also information for the LUCs between annual and perennial cropland and between annual as well as perennial cropland and grassland between the years 2000 and 2008. Due to methodological changes there is a consistency break in the areas from 1999 to 2000 that would result in an unrealistic decrease of the cropland area for more than 700 kha between these two years. The periods before and after 2000 show rather smooth trends. Also the results of Corine Land Cover that are available for the years 1990, 2000 and 2006 don’t give evidence for such a dramatic decrease in the cropland area. Therefore, it was assumed that this change is merely the result of the methodological change in the statistics. To level out this break the cropland area of 1999 was assumed to be the same as in 2000. The years after 2000 (which are based on a better assessment system) were kept as they are. For the years before 1999 the annual changes of the cropland areas of the time series 1988 to 1999 were taken exactly and adjusted to the new area figure for 1999 to give a new time series of annual cropland areas.
LUC areas between cropland and grassland and from cropland to settlement are available for the years 2000 to 2008 and 2001 to 2008, respectively. The LUC area form cropland to forest land was estimated as described under forest land.
For the same reasons as described for the LUCs from wetland and settlement to forest land it was assumed that there is no LUCs from wetland and settlement to cropland. In the forest land chapter there is also an explanation why a LUC from other land to cropland is considered as unlikely. An extrapolation of the available LUC areas from grassland to cropland (and cropland to grassland) for the years 2000 to 2008 to the years before 2000 results in a rather good fit of all LUC areas from and to cropland with the overall cropland area change across the time series (the change area not covered by adequate LUCs is on average 0.1 kha/year). For single periods of this time series the fit is less good than for the whole period 1988 – 2000.
Grassland (5.С.)
Description of the category
The category “Grassland” includes pastures and meadows (agricultural funds) and meadows in the forest fund.
In this category emissions/removals grassland remaining grassland and lands converted to grassland are evaluated. In 2008 the total area of the grassland was 1946 kha. This includes grassland of intensive and extensive use
The annual removals of CO2 from grassland in the country is 786.64 Gg in 2008. The emissions from subcategory “Grassland Remaining Grassland” is assumed to be 0. CO2 emissions/removals occur only when converting lands to grassland.
Some management practices, like burning of stubble-fields are forbidden in Bulgaria. There is no peat extraction, draining of peat soils or other anthropogenic activity which affects their water regime, the temperature on their surface and the species. Due to these reasons the carbon stock change in Histosols is not subject to evaluation.
The pool of deadwood and litter are not reported for grassland as they do not exist in grassland.

Greenhouse gas inventory information 70
Table 3.14 Categories assessed for emissions/removals - Grassland 5.С. Grassland-total 5.С.1. Grassland remaining grassland 5.С.2. Land converted to grassland 5.С.2.1. Forest land converted to grassland 5.С.2.2. - carbon stock change in living biomass of grassland 5.С.2.3. - carbon stock change due to changes in organic matter input (harvest residues) to grassland soils 5.С.2.4. Settlements converted to grassland 5.С.2.5. Other land converted to grassland
LUC areas between cropland and grassland and from grassland to settlement are available for the years 2000 to 2008 and 2001 to 2008, respectively. The LUC area form grassland to forest land was estimated as described under forest land. For the same reasons as described for the LUCs from wetland and settlement to forest land it was assumed that there is no LUCs from wetland and settlement to grassland.
An extrapolation of the available LUC areas from cropland to grassland (and grassland to cropland) for the years 2000 to 2008 to the years before 2000 results in a deviation between the sum of all LUC areas from/to grassland and the overall grassland area change across the time series that is on average 4.7 kha/year (the decrease in grassland according to the total grassland areas is 4.7 kha/year lower than the LUC areas from/to grassland suggest). An improvement of the fit is for the moment not possible since all other land use and land use change categories fit well. The problem is that the totals of the available land area statistics (and their adaptations) show this difference in the LUC area across the time series (the sum of the LUC areas across the whole time series does not give zero). So, some category has to cover this difference. Only cropland and grassland areas have the problem of a consistency break and needed an adaptation in time series. Therefore, only these two categories offer possibilities for covering the difference. The approach to use the grassland category only for the needed levelling out tends to overestimate the emissions since grassland has a high C stock (particularly in soil). So, estimates on basis of too high LUC areas from grassland to other uses represent the more conservative approach of the two possible ones.
Wetlands (5.D)
Due to the lack of information it s assumed that the carbon stocks in the biomass, the dead organic matter and the soils of the surface waters is equal to 0.
The areas of the wetlands range between 202 kha to 210 kha for the period 1988-2008.
For wetlands the cadastral map of Bulgaria (the Cadastre Agency – Balance by type of territories according to their purpose) provides areas only for single years (1994, 1996, 1998, 1999, 2000). Corine Land Cover offers wetland areas for the years 1990, 2000 and 2006 and represents a better coverage of the relevant reporting period. However, due to its coarse resolution Corine Land Cover is not able to assess small rivers adequately and underestimates the total wetland area. A comparison between the cadastral information and the Corine data gives evidence for this problem. To get a more realistic wetland area for the whole time series the Corine Land Cover wetland areas were used, but adjusted with a correction factor to meet the total wetland area according to the cadastral map.
The changes in the wetland area across the time period were taken out of the Corine information. This results in a rather stable wetland area for Bulgaria with slight increases in the years after 2000 (in total 8 kha for the whole time series). According to the trends, it was assumed that the wetland area increases by approximately 1 kha per year in the years 2001 to 2008, while the

Greenhouse gas inventory information 71
minor change before (0.02 kha per year) was neglected in the estimates. The LUC to wetlands was assumed to stem from forests, cropland and grassland and that the shares of these individual land use categories to the LUCs to wetland behave like the ratios of the total areas of these land use categories in Bulgaria. It is considered as unlikely settlements or other land change to wetlands and wetlands change to any other land uses. The rationale in behind has been given in other chapters and is best expressed by the stable wetland area across time.
Conversion of forests to wetlands has been occurring since 2001.
The annual change of the carbon stock in the living biomass of forests converted to wetlands is determined using equation 3.5.6 of IPCC GPG.
Settlements (5.Е.)
In this category only the emissions and the removals from the subcategories “Lands Converted to Settlements” were calculated. It is assumed that dead wood and litter do not exist in the settlements. By 2008 the areas for this category were 828 kha. The area converted to settlements over the period (1988-2008) is 24 kha.
The land- use change to settlements origins from the categories Forests (data provided by the Executive Forestry Agency), Cropland and Grassland (data provided by the Ministry of Agriculture and Food).
For settlements the cadastral map of Bulgaria (the Cadastre Agency – Balance by type of territories according to their purpose) provides areas only for single years (1996, 1998, 1999, 2000). Corine Land Cover (ExEA-1990,2000,2006) offers settlement areas for the years 1990, 2000 and 2006 and represents a better coverage of the relevant reporting period. However, due to its coarse resolution Corine Land Cover is not able to assess traffic lines in landscape adequately and underestimates the total settlement area. A comparison between the cadastral information and the Corine data gives evidence for this problem. To get a more realistic settlement area for the whole time series the Corine Land Cover settlement areas were used, but adjusted with a correction factor to meet the total settlement area according to the cadastral map. The changes in the settlement area across the time period were taken out of the Corine information. This results in a steady increase of the settlement area across time.
For the years 2001 to 2008 the LUC areas from forest land and agricultural land to settlements are available (Forestry Agency and MAF). These reported LUC changes to settlement fit very well to the increases in settlement area in these years as assessed by Corine Land Cover. Due to this fit and probability reasons (LUCs from settlement to other land- uses and LUCs from wetland and other land to settlement are considered unlikely) no more adaptations in the areas statistics were needed for these years.
For the years before 2001 the mean increase in settlement area was estimated. With 0.3 kha per year it was clearly lower in this period than in the most recent years (around 4 kha per year) reflecting the risen infrastructural activities since Bulgaria’s joining the EU. It was assumed that the shares of forest land, cropland and grassland contributing to this 0.3 kha increase in settlement area per year were the same as in the period 2001 to 2008.
An estimate of the biomass in the settlements was made by using national data for the relative share of the green areas in the city of Sofia (Kovachev, A, 2005) which is 2.63%.
The annual increase of the carbon stock in the biomass is calculated on the basis of the share of the green areas in the settlements and the following growth rates: for perennials (trees, bushes) it is 0.03 t C/ha.y, and for the annual plants – 0.09 t C/ha.y. These growth rates were derived from a detailed biomass study for Vienna (and is also used for the related estimates in Austria)

Greenhouse gas inventory information 72
together with the share of green area in the settlement area as derived from the data for Sofia (NIR of Austria, 2009).
The calculation of the emissions from soils as a result of the conversion of forests to settlements was made by using national data for the carbon stocks in the soils in forests (57.3 t C/ha) and the carbon stocks in the soils of the settlements (2.1 t C/ha). The carbon stock in the soils of settlements is determined on the basis of data for the carbon stock in the soils of the green areas in Sofia for 30 cm depth (79 t C/ha), corrected as per the relative share of the green areas in Sofia (2.63 %).
Other lands (5.F.)
For the total areas of other land in the single years of the reporting period information from the cadastral map of Bulgaria (the Cadastre Agency – Balance by type of territories according to their purpose) are available.
They show a slight decrease in the area of other land by 20 kha (in total) across this period. According to the rationale described in the forest land chapter it is assumed that this other land was lost completely to forest land. Due to the same considerations and the steady decrease in area of this category a LUC from any other land-use to other land is considered as unlikely.
However, the total area of other land is reported according to the IPCC GPG that suggest to report under other land the difference between the area of all other land use categories and the total area of Bulgaria. If the other land area was reported according to the available statistics the sum of all land categories would be approximately 3 % lower than the real area of Bulgaria. From that low difference it is assumed that the used statistics provide a good picture on the land- use and land- use change in Bulgaria.
Due to the assumed lack of a LUC to other land no emissions/removals were estimated for this subcategory.
3.3.6. Summary of Methodology and Data Sources
Carbon dioxide emissions
The CO2 emissions are derived by combustion of fuels in the energy sector, transport and households. The default emission factor and emission factor reported with the ETS for CO2 are applied.
The activity data are based on the Eurostat Energy Balance. For the year 1988 and 1989 the IEA Energy balance is used. Both balances are harmonized:
1988 – 1989: IEA energy balance prepared and reported by NSI; 1990 – 2008: Eurostat energy balance prepared und reported by NSI.
Parameters, specified in the Revised IPCC Guidelines, are used for estimation of the carbon stocks in the products, which is not CO2 emission source. The reason for that is the lack of concrete measured values of the non-oxidized carbon portion in the petrol products and in the natural gas, utilized in Bulgaria.
Carbon dioxide sequestration
The inventory methodology for the greenhouse gases is based on the principles envisaged in the IPCC GPG. All the land use changes were traced down and reported for a transition period of 20 years after which they are reported in the respective categories.

Greenhouse gas inventory information 73
To achieve the full time series of 1988-2008 for the areas staying in a certain category land-use and the converted lands, data form different statistical sources are used - the Forestry fund reports (Executive Forestry Agency), National Statistical Yearbook, Agrostatistics and Strategies Department at MAF, Balance by Type of Territories as per their Designation, Cadastre Agency, Corine Land Cover - Executive Environmental Agency.
For the time being, Bulgaria reports on CO2 sequestration from forestry only (category 5.A from sector “Land-Use Change and Forestry”). Data for C sequestration from forestry is on the basis of:
Area of forestry used;
Average annual forest growth by species (in m3/ha/year)
Annual felling (in m3/year).
Methane
CH4 emissions from fuel combustion were estimated by data from the Eurostat Energy Balance and the default emission factor (IPCC 1996 Reference Manual, Ch.1, Table 1-7, p. 1.35).
CH4 emissions from road transport are estimated with the 2006 IPCC Guidelines default GHG EFs for liquid and gaseous fuels (2006 IPCC, Volume 2: Energy, table 3.2.1, page 3.16).
Fugitive CH4 emissions from coal mining and the systems for extraction and distribution of oil and natural gas are estimated by method of the type IPCC Tier 1, as emission factors, given in IPCC GPG, were used.
The IPCC Tier 1 method has been used to estimate the emissions from all farm animal categories with the exception of cattle (IPCC Sub-category 4A1) for which a Tier 2 method is used with option B. CH4 emissions are calculated using standard emission factors from the IPCC Guidelines in the framework of the Tier 1 method.
Methane emissions from solid waste disposal sites are estimated by the method of type Tier 2, specified in IPCC Guidance. The main source of activity data is NSI. Data on Municipal Solid Waste generation rate and on the quantity of MSW disposed to SWDSs and etc. are available and country specific data, IPCC Guidelines (Revised 1996 Guidelines, and 2006 IPCC Guidelines) were used.
Nitrous oxide
N2O emissions from fuel combustion are estimated by data from the general energy balance of the country and default emission factors, referenced in IPCC 1996 Reference Manual, Ch.1, Table 1-8, p. 1.36.
The emissions from road transport are estimated by the 2006 IPCC Guidelines default GHG EFs for liquid and gaseous fuels (2006 IPCC, Volume 2: Energy, table 3.2.1, page 3.16).
N2O emissions from chemicals include the nitric acid production only. Method (referred as Tier 3 in 2006 IPCC Guidelines, Chapter 3, p. 3.21) is applied. For the 2000 to 2008 emission data from plant operators were available; for the entire time series the production data were available. Following the recommendations of 2006 IPCC GL as a good practice in order to reduce uncertainty all activity data obtained were for 100 % HNO3. For the years 2000 to 2008 a plant specific emission factor was calculated on the basis measured data from plants operators. For the period 1988 – 2000 the IEF was applied, assuming that technology and abatement types are similar. A default emission factor was applied for the third plant where no information is available and which stopped working in period 1999/2000.

Greenhouse gas inventory information 74
N2O emissions from agriculture soils are estimated in accordance with the IPCC methodology. The emission factors are selected from the IPCC Guidelines. The manure quantity is calculated using the prototype parameters for different types of animals in the Eastern Europe region, given in the IPCC Guidelines. The synthetic fertilizers quantities are provided by the National Service for Plant Protection at the Ministry of Agriculture and Food Supplies.
The IPCC default methodology is used for calculating N2O emissions from human sewage based on annual per capita protein intake. Activity data come from NSI and from Waste Management Directorate of the MOEW.
F- gases
In 2010, the assessment of F-gas consumption in Bulgaria based on results from a Denkstatt project was made. Within the project all sectors of possible F-gas consumption as described in the 2006 IPCC Guidelines were investigated. By this activity data, emission factors and emissions are determined methodologically as far as possible in a country specific way (Tier 2a according to IPCC guidelines 2006).
3.3.7. Recalculations
The GHG emission recalculations for the period 1988-2008 (emission data 1988-2007) were made because of update and revision of activity data, EF and other parameters used for all sectors in the 2010 inventory submission. Differences between Submission 2009 and Submission 2010 are given below Table 3.15.
Table 3.15 Differences between Submission 2009 and Submission 2010 for 1988-2007 due to recalculation NIR 2009 NIR 2010 Difference Year
Gg CO2 eqv. Gg CO2 eqv. %
1988 133 747 131 540 -1.65 1989 132 899 129 044 -2.90 1990 117 672 117 432 -0.20 1991 96 051 94 516 -1.60 1992 86 495 87 929 1.66 1993 87 188 86 721 -0.54 1994 84 540 86 519 2.34 1995 88 561 89 043 0.54 1996 86 699 88 318 1.87 1997 83 817 85 676 2.22 1998 74 765 79 814 6.75 1999 69 536 72 005 3.55 2000 69 223 71 072 2.67 2001 69 547 74 049 6.47 2002 66 510 70 535 6.05 2003 71 741 76 136 6.13 2004 71 100 74 541 4.84 2005 71 027 74 419 4.78 2006 71 936 75 438 4.87 2007 75 793 78 624 3.74

Greenhouse gas inventory information 75
Table 3.16 Differences between Submission 2009 and Submission 2010 by sectors for 2007 due to recalculation
CO2 CH4 N2O GREENHOUSE GAS SOURCE AND SINK CATEGORIES
Difference (%) Total National Emissions and Removals -5.14 19.56 7.21 1. Energy 0.01 -27.95 5.61 1.A. Fuel Combustion Activities -0.03 50.43 5.61 1.A.1. Energy Industries -6.65 -37.49 -58.29 1.A.2. Manufacturing Industries and Construction 16.58 328.55 75.84 1.A.3. Transport -0.85 15.20 293.02 1.A.4. Other Sectors 27.65 92.09 -7.20 1.A.5. Other -100.00 -100.00 1.B. Fugitive Emissions from Fuels 100.00 -35.70 1.B.1. Solid fuel -50.27 1.B.2. Oil and Natural Gas 100.00 -5.80 2. Industrial Processes 9.28 0.79 -54.37 2.A. Mineral Products -1.92 2.B. Chemical Industry 83.08 -54.37 2.C. Metal Production 7.90 0.85 2.D. Other Production 2.G. Other 3. Solvent and Other Product Use 0.07 -0.26 4. Agriculture 3.25 23.50 4.A. Enteric Fermentation 1.17 4.B. Manure Management 6.15 27.25 4.C. Rice Cultivation -0.68 4.D. Agricultural Soils (4) 22.60 4.E. Prescribed Burning of Savannas 4.F. Field Burning of Agricultural Residues 107.79 306.12 4.G. Other 5. Land Use, Land-Use Change and Forestry (net) 47.48 100.00 100.00 5.A. Forest Land 77.48 100.00 100.00 5.B. Cropland -594.32 100.00 5.C. Grassland 100.00 5.D. Wetlands 28.11 5.E. Settlements 100.00 5.F. Other Land 5.G. Other 6. Waste 100.00 35.61 94.27 6.A. Solid Waste Disposal on Land 40.88 6.B. Waste-water Handling -6.30 94.27 6.C. Waste Incineration 100.00 6.D. Other 7. Other (as specified in Summary 1.A) Memo Items: International Bunkers -0.57 0.01 0.02 Multilateral Operations CO2 Emissions from Biomass 94.03
3.4. National systems in accordance with Article 5, paragraph 1, of the Kyoto protocol.
From 28 September to 3 October 2009 UNFCCC Expert Review Team (ERT) conducted an in-country review of Bulgaria’s 2009 annual submission in accordance with the Guidelines for review under Article 8 of the Kyoto Protocol (Annex to decision 22/CMP.1). The ERT found

Greenhouse gas inventory information 76
that Bulgaria’s 2009 annual submission was not sufficiently transparent, consistent, comparable, complete and accurate, as required by the UNFCCC reporting guidelines, the IPCC good practice guidance and the IPCC good practice guidance for LULUCF. In particular, the ERT found that the institutional arrangements and arrangements for the technical competence of its staff within the national system involved in the inventory development process were insufficient to enable the adequate planning, preparation and management of Bulgaria’s annual submission in accordance with the aforementioned guidelines.
On 9 March 2010, the UNFCCC Secretariat received a question of implementation from the ERT, indicated in the report of the review of the annual submission of Bulgaria submitted in 2009 and contained in document FCCC/ARR/2009/BGR. In accordance with paragraph 1 of section VI and paragraph 2 of rule 10 of the rules of procedure, the question of implementation was received by the Compliance Committee on 10 March 2010.
In accordance with the Procedures and mechanisms relating to compliance contained in the annex to decision 27/CMP.1 and adopted under Article 18 of the Kyoto Protocol and the Rules of procedure of the Compliance Committee of the Kyoto Protocol, the Enforcement branch adopted final decision on 28 June 2010. The Enforcement branch determined that Bulgaria was not in compliance with the Guidelines for national systems for the estimation of anthropogenic GHG by sources and removals by sinks under Article 5, paragraph 1, of the Kyoto Protocol. Hence, Bulgaria did not meet the eligibility requirements under Articles 6, 12 and 17 of the Kyoto Protocol to have in place a National system in accordance with Article 5, paragraph 1, of the Kyoto Protocol and the requirements and guidelines decided thereunder.
The Enforcement branch applied the following consequences:
(a) Bulgaria was declared to be in non-compliance.
(b) Bulgaria was requested to develop a plan and report on the progress of its implementation.
(c) Bulgaria’s eligibility to participate in the mechanisms under Articles 6, 12 and 17 of the Kyoto Protocol was suspended in accordance with the relevant provisions under those Articles pending the resolution of the question of implementation.
The Enforcement branch has confirmed that there were unresolved problems pertaining to language of a mandatory nature with respect to implementation of the general and specific functions set out in the guidelines for national systems that resulted in Bulgaria’s 2009 annual submission not being transparent, consistent, comparable, complete and accurate. It was noted that the implementation of Bulgaria’s work plan, which outlined measures, including actions and activities to be undertaken to address mentioned issues could not be completed before the due date of the 2010 annual submission. A further subsequent in-country review will be required to assess Bulgaria’s national system in accordance with the guidelines for national systems.
During the period after the in-country review of 2009 and after the notification of the country on the Question of implementation the Ministry of environment and water has undertaken significant effort to improve the status and functioning of the Bulgarian National Inventory System. A Compliance Action Plan for ensuring the effective and timely functioning of the National system in accordance with the requirements of Article 5.1 of the Kyoto Protocol and Decision 19/CMP.1 was developed and implemented in 2010.
In 2010, 4-9 October NFCCC Expert Review Team (ERT) conducted an in-country review of Bulgaria’s 2010 annual inventory submission in accordance with decision 22/CMP.1. The conclusions and recommendations of ERT set out in the Report of the individual review of the 2010 annual submission of Bulgaria indicated that all activities for improvements of institutional,

Greenhouse gas inventory information 77
legal and procedural arrangements within the National Inventory System as well as for improvement of quality of inventory were adequately planned and implemented by the Bulgarian government in 2010: “The ERT concludes that the national system of Bulgaria is performing its required general and specific functions, as set out in the annex to decision 19/CMP.1 with respect to the institutional, legal and procedural arrangements to perform these functions; that the institutional, legal and procedural arrangements established and formalized by the “Ordinance on the way and order of organization of the national inventories of hazardous substances from greenhouse gases in the ambient air” (Ordinance No. 215) that entered into force on 21 September 2010 are fully operational; and that Bulgaria has in place the institutional arrangements and the capacity, including the arrangements for the technical competence of staff involved in the national system, to plan, prepare and manage inventories on an annual basis”. As a result from implemented activities for improvements “No questions of implementation were identified by the ERT during the review” (FCCC/ARR/2010/BGR § 207).
In accordance with Decision of Enforcement branch CC-2010-1-17/Bulgaria/EB from 4 February 2011 Bulgaria is now fully eligible to participate in the mechanisms under Articles 6, 12, and 17 of the Kyoto Protocol.
3.4.8. Description of the Institutional Arrangement for Inventory Preparation
The Bulgarian National Inventory System (BGNIS) changed over time two times because of decisions of the particular government. In the following table the national circumstances are outlined:
BGNIS until 2007
(submission 2007)
Present BGNIS
(submission 2008 -2011)
Prospected BGNIS
Centralized inventory Centralized inventory Centralized inventory
Single institute Single agency Single agency
Out-sourced inventory In-sourced inventory In-sourced inventory
Consultant Public/Governmental
(submission with cooperation of consultants)
Public/Governmental
(submission with cooperation of consultants)
National Inventory Focal Point: ExEA
National Inventory Focal Point: ExEA
National Inventory Focal Point: ExEA
National Focal Point:
MoEW
National Focal Point:
MoEW
National Focal Point:
MoEW
Until 2007 the national emissions inventory as well as the relevant NIR under UNFCCC was prepared by an external company (Energy Institute) through an open tender procedure under the rules of the Public Procurement Law. The submissions 2003 – 2007 have been prepared on annual contractual basis by the Energy Institute. The annual inventory and the NIR were presented by the Energy Institute to the ExEA Expert Council for approval. The Council finally approved the Inventory and allowed its submission to the UNFCCC Secretariat.
Since 2008 the Executive Environment Agency (ExEA) is responsible for the whole process of inventory planning, preparation and management.
The national system defines the “road map” in which Bulgaria prepares its inventory. This is outlined in the national inventory preparation cycle.

Greenhouse gas inventory information 78
As it is illustrated in Figure 3.12 and outlined in the following chapters the preparation of the inventory has an institutional “home” that is ultimately responsible for managing the process and has a legal authority to collect data and submit it on behalf of the Bulgaria.
Bulgaria’s reporting obligations to the UNFCCC, UNECE and EC are being administered by the MoEW. All activities on preparation of GHG inventory in Bulgaria are coordinated and managed on the state level by MoEW. The National Climate Change Focal Point is Ms. Milya Dimitrova, Director of Climate Change Policy Directorate.
Figure 3.12 Organizational Chart of the Bulgarian National Inventory System
The Bulgarian Government by MoEW (Climate Change Policy Directorate) has the political responsibility for compliance with commitments under the UNFCCC and the Kyoto Protocol, including for functioning of BGNIS in accordance with the requirements of Decision 19/CMP.1 under Article 5, paragraph 1, of the Kyoto Protocol. In order to meet all challenges in this sphere, the Climate Change Policy has been transformed in a separate directorate and its staff has been increased with 6 experts. Now, it consists of 10 persons in total.
The national reporting obligations to the UNFCCC, UNECE and EC are administered by the MoEW.
The ExEA has been identified as the responsible organization for preparation of Bulgaria’s National GHG Inventory under the UNFCCC and the Kyoto Protocol and designated as single national entity.
The ExEA is represented and managed by an Executive Director. The Emission Inventory Unit (“Emission Inventory Sector”) is allocated in the Environmental Monitoring Directorate. The ExEA’s directorates and departments, which are directly involved in operation of the BGNIS are:

Greenhouse gas inventory information 79
Environmental Monitoring Directorate with the Air Monitoring Department (AMD), Emission Inventory Unit (EIU), Land Monitoring Biodiversity and Protected Areas (LMBPAD), Waste Department (WD) and
Permit Regime Directorate with the Integrated Pollution Prevention and Control Department (IPPCD) and Emission Trading Permit Department (ETPD).
The overall objective of the BGNIS is annually to produce a high quality inventory (National CRF, Kyoto and SEF tables and NIR) for compliance with its Kyoto commitment and to submit it by the required deadline.
Bulgaria’s reporting obligations to the UNFCCC, UNECE and EC are being administered by the MoEW. All activities on preparation of GHG inventories in Bulgaria are coordinated and managed on the state level by MoEW. The Bulgarian Government by MoEW has the political responsibility for compliance with commitments under the Kyoto Protocol, including for functioning of BGNIS in accordance with the requirements of Decision 19/CMP.1 under Article 5, paragraph 1, of the Kyoto Protocol.
The ExEA has been identified as the responsible organization for preparation of Bulgaria’s National GHG Inventory under the UNFCCC and the Kyoto Protocol and designated as single national entity. ExEA has the technical responsibility for the national inventory:
acts as National Inventory Compiler (supervises inventory preparation process);
compiles CRF tables and NIR;
manages BGNIS;
implements QA/QC procedures.
acts as National Inventory Focal Point
The legal basis for BGNIS is formulated by the following documents:
1. Environmental Protection Act (EPA, State Gazette No. 91/25.09.2002; corrected, SG No. 96/2002; last amendment June 2010);
2. Statute on the organization and structure of ExEA (Decision of Council of ministers 162/03.08.2010);
3. Order № 110/30.04.2010 by the Executive Director of ExEA, replaced by new Order N 202/29.09.2010 (Sector experts/QC experts);
4. Order № RD-218/05.03.2010 by the Minister of Environment and Water (QA experts).
5. Regulation of the Council of Ministers 215/21.09.2010 SG 76/2010 on the way and order of organization of the National Inventories of hazardous substances from greenhouse gases in the ambient air
EPA establishes the National Environmental Monitoring System, The Act sets that the Minister of Environment and Water shall direct the National Environmental Monitoring System through the Executive Environment Agency (article 11 (2));
Article 144: (1) of the EPA sets that the National Environmental Monitoring System shall comprehend the national networks for the system for information on, and control of, air emissions and the state of waste waters.
EPA establishes the national Executive Environment Agency (ExEA) according to Regulation on the organization and structure of ExEA (Decision of Council of Ministers 162/03.08.2010),
which regulate it’s responsibilities for monitoring of environment as well as the responsibility for

Greenhouse gas inventory information 80
preparation of emission inventories. The Air Monitoring Department of ExEA prepares and annually updates the air emissions inventories (according to article 14 (12) of the above Regulation).
To increase the capacity in ExEA for adequate planning, preparation and management of emissions inventory an Order № 110/30.04.2010 by the Executive Director of ExEA, replaced by new Order N 202/29.09.2010 has been issued. The order regulates the names and responsibilities of experts from different departments within the ExEA, which are engaged in preparation of National GHGs emission inventory (Sector experts/QC experts). The responsibilities of different departments are presented below in Figure 3.13: Bulgarian National Inventory System – Responsibilities).
To assure the quality of information reported to UNFCCC and UNECE and to support the single national entity, the Minister of Environment and Water has issued an order № RD-218/05.03.2010. The order regulates the names and responsibilities of the MoEW and ExEA QA experts for implementation of the requirements of National QA/QC Plan in emission inventory of sectors Energy, Industry, Solvents, Agriculture, LULUCF and Waste.
The BGNIS has been enshrined in law through a special Regulation of the Council of Ministers 215/21.09.2010 SG 76/2010. The new regulation establishes and maintains the institutional, legal and procedural arrangements necessary to perform the general and specific functions of BGNIS, defined in Decision 19/CMP.1 for national systems. The new regulation reinforces the existing institutional agreements by specifying the roles of all data providers.
Figure 3.13: Bulgarian National Inventory System – Responsibilities
Greenhouse gas inventory information 81
3.4.9. Institutional Arrangements
In order to strengthen the institutional arrangements and to fulfil the required general and specific functions of BGNIS official agreements between MoEW and the main data providers were signed in 2010:
National Statistical Institute (RD21-35/12.02.2010);
Ministry of Agriculture and Food and its body Executive Forest Agency (04-00-517/26.02.2010 and RD 50-47/15.03.2010);
Ministry of Economy, Energy and Tourism (14/06/2010 );
Ministry of Interior (MI) (08/06/2010 ).
The new agreements ensure the support from these organisations regarding the choice of the activity data and EFs and methods, in the compilation of emission estimates and QA/QC of these estimates.
The ExEA as Single National Entity coordinates all activities, related to collecting inventory data of GHG emissions by the following entities:
1. National Statistics Institute (NSI);
2. Ministry of Agriculture and Food (MAF) and their relevant services (Agrostatistic Directorate and Executive Forestry Agency);
3. Ministry of Economy, Energy and Tourism (MEET);
4. Ministry of Interior (MI);
5. Ministry of Environment and Water (MoEW);
6. Ministry of Transport, Information Technologies and Communications (МТIТС).
7. Large industrial plants;
8. Branch Business Associations.
3.4.10. Collection of activity data by ExEA:
The information is collected on the annual basis.
The ExEA sends every year letters with request for provision of the necessary activity data to every one of the information sources, including the deadline for response.
For NSI, MAF, SFA the type of the necessary data, as well as the deadlines for submissions to ExEA are regulated by the official agreements mentioned above as well as by the Regulation of the Council of Ministers 215/21.09.2010 SG 76/2010.
The annual national energy and material balances as well as the data related to the solid waste generation and the waste water treatment are prepared by NSI. NSI uses up-to-date statistical methods and procedures for data collection, summarizing and structuring that are harmonized with EUROSTAT.
The GHG inventory uses data, received directly from large point sources in the energy sector and the industry and this data is summarized by ExEA.

Greenhouse gas inventory information 82
Table 3.17: Sources of activity data for preparation of national GHGs emission inventory
Sectors Data Source of Activity Data Data supplier
1. Energy
1.A Fuel Combustion
Energy balance (IEA - EUROSTAT - UNECE Energy Questionnaire
NSI National Statistical Institute
Energy balance (IEA - EUROSTAT - UNECE Energy Questionnaire
NSI National Statistical Institute
Statistics vehicle fleet MIA/RCD Ministry of Internal Affairs/ Road Control Department
1.A.3 Transport
Country specific parameters used in the COPERT IV related to car fleet and vehicle split.
NSI National Statistical Institute
Energy balance (IEA - EUROSTAT - UNECE Energy Questionnaire
NSI National Statistical Institute 1.B Fugitive emissions
National statistics MEE Ministry of Economy and Energy
National production statistics NSI National Statistical Institute
National registers (EPRTR and ETS)
ExEA Executive Environment Agency
2. Industrial processes
National studies MoEW/ ExEA
Ministry of Environment and Water Executive Environment Agency
3. Solvents and Other product use
National production statistics National VOC register
NSI ExEA
National Statistical Institute Executive Environment Agency
4. Agriculture National agriculture statistics MAF Ministry of Agriculture and Food Supply /Statistics Department
5. LULUCF National Forest Inventory SFA State Forestry Agency
National statistics NSI National Statistical Institute 6. Waste
National studies ExEA Executive Environment Agency/ Waste Department
3.4.11. Quality management system
As already mentioned, the Executive Environment Agency is responsible for the preparation of the National Emissions Inventories and the relevant National Inventory Reports under UNFCCC and UNECE/CLRTAP.
The ExEA is also responsible for coordinating QA/QC activities for the national inventory. A quality manger is in place.
The Bulgarian Quality Management System was established in the frame of project with Bulgarian Academy of Science, Geophysical Institute. The project was carried out and finished in 2008.

Greenhouse gas inventory information 83
The QA/QC plan is an internal document to organise, plan and implement QA/QC activities. Once developed for the next submission, it is referenced and used in subsequent inventory preparation, or modified as appropriate.
The official QA/QC Plan for National emissions inventories was approved by the Ministry of Environment and Water in 2009.
The QA/QC plan was updated in August 2010 in order to implement the new established legal, institutional and procedural arrangements within the BGNIS. National QA/QC Plan includes following elements:
- Responsible institutions;
- Data collection;
- Preparation of inventory;
- QC Procedures;
- QA Procedures;
- Uncertainty evaluation;
- Organisation of the activities in quality management system;
- Documentation and archiving.
Figure 3.14: National quality assurance and quality control program
does NOT require knowledge of the emission source category
requires knowledge of the emission source category
general source specificQC procedures
sector experts (1st party)performed throughout preparation of inventory
TIER 1 TIER 2data validation, calculationsheet
(check of formal aspects)preparation of NIR, comparison with Guidelines
(check of applicability, comparisons)
QA proceduresquality manager (2nd or 3rd party; staff not directly involved, preferably independent)
performed after inventory work has finishedTIER 1
basic, before submissionMOEW experts
Internal audit / EU ‘Initial check’(Expert Peer Review)
evaluate if TIER2 QC is effectively performed (check if methodologies are applicable)
TIER 2extensive
System audit (Audit) ICR by UNFCCC (Expert Peer Review)evaluate if TIER 2 QC is effectively performed evaluate if TIER 2 QC is effectively performed
(Check if methodologies are applicable)
must
The legal and institutional arrangements within the BGNIS regulate the responsibilities of all engaged institutions for implementation of the requirements of the National QA/QC Plan.
The QC procedures are performed by the sectors and experts, who are directly involved in the process of preparation of inventory with their specific responsibilities.

Greenhouse gas inventory information 84
The QC procedures are implemented by all activity data providers and ExEA’s sector experts (Order №110/30.04.2010 by the Executive Director of ExEA) and/or external consultants.
Table 3.18 QC experts within the BGNIS Responsibility QC experts Activity data MAF, MI, MTITC, MEET, NSI, EAF, ExEA, MOEW Methodology and selection of emission factors
ExEA, MAF, MI, MTITC, MEET, NSI, EAF, MOEW
Sector inventories preparation Sector experts ExEA and/or external consultants
The QC experts are: experts, responsible for activity data provision; experts, involved in the choice of method and selection of emission factors; sector experts and/or consultants, who prepare the sector inventories, including
preparation of reporting tables and respective chapters from the national reports.
All institutions, engaged in the functioning of BGNIS are responsible for quality of information, provided by their competence to the ExEA for preparation of national emission inventories. The institutions are obligated to implement all requirements of the international and national standards for collection, processing and provision of activity data.
Quality Assurance (QA) is a planned system of review procedures conducted by personnel not directly involved in the inventory compilation/development process. The quality assurance process includes expert review conducted in two stages: a review of the initial set of emission estimates and, a review of the estimates and text of the Inventory Report.
QA experts could be: Sector experts from the MoEW, which are engaged through internal administrative
order by the minister of environment and water; Experts from research institutes in accordance with them competence; Other external reviewer (national and/or international).
The QA procedures include checks in accordance with FCCC/SBSTA/2006/9. QA procedures are implemented by sector experts within the MoEW and experts from the ExEA, who are not directly involved in the preparation of inventory (Order № RD-218/05.03.2010 by the minister) or external reviewers.
The expert peer review presents opportunity to uncover technical issues related to the application of methodologies, selection of activity data, or the development and choice of emission factors. The comments received during these processes are reviewed and, as appropriate, incorporated into the Inventory Report or reflected in the inventory estimates.
QA/QC activities of data provider
The QA/QC Plan is provided for implementation to all institutions, which are engaged in the process of preparation of emissions inventories under UNFCCC as provision of the relevant activity data.
Based on the National QA/QC Plan each of the institutions has nominated experts, responsible for preparation of the required information as well as for implementation of QA/QC procedures.
The QC experts are all experts from the institutions, who are engaged to participate in the activity of BGNIS and to implement the requirements of National QA/QC Plan

Greenhouse gas inventory information 85
All institutions, engaged in the functioning of BGNIS are responsible for quality of information, which they are providing to the ExEA for preparation of national emission inventories. The institutions are obligated to implement all requirements of the international and national standards for collection, processing and provision of activity data.
The QC experts fill in check-list, which form is given in an annex to the National QA/QC plan. The QC experts fill the check-list for the sector they are responsible for and in the parts “Review of input data for calculation of emissions”, “Activity data” and/or “Method and EF”.
The check list contains all general and specific procedures for QC. It consist information for carried out review by the QC experts, including findings and corrections made.
The check lists are filled in by QC experts in accordance with their responsibilities and for each CRF category.
The check lists are exchanged between QC experts for correction of the findings within input data for calculation of emissions in the respective sectors.
Quality Management of the Sources of Initial Data
Each organization – data source, solves the quality management issues in accordance with its internal rules and provisions. With some of the sources as NSI, MAF, etc., those rules follow strictly the international practices. For example, quality assessment/quality control procedures with NSI have been harmonized with the relevant instructions and provisions of EUROSTAT. Strict rules on data processing and storage are harmonized with international organizations. Some of the large enterprises – GHG emission sources, have well arranged and effective quality management systems. Most of them have introduced quality management systems on the basis of ISO 9001:2000 standard.
Official consideration and approval of the inventory
Bulgaria’s reporting obligations to the UNFCCC, UNECE and EC are being administered by the MoEW. All activities on preparation of GHG inventory in Bulgaria are coordinated and managed on the state level by MoEW. The ExEA is the responsible organization for preparation of Bulgaria’s National GHG Inventory under the UNFCCC and the Kyoto Protocol and designated as single national entity (see Figure 3.12 Organizational Chart of the Bulgarian National Inventory System).
Quality improvement
Bulgaria has prepared a plan for improvement of the quality of GHGs emission inventory for the period 2010 – 2012. The plan is divided in two parts - General Improvements and Source categories improvements. The activities are planned in order to fulfil the recommendations of Expert Review Team as set out in the annual review report FCCC/ARR/2009/BGR.
3.4.12. Brief Description of the Inventory Preparation Process
The GHG inventory represents a process, covering the following main activities:
Collecting, processing and assessment of input data on used fuels, produced output, materials and other GHG emission sources;
Selection and application of emission factors for estimating the emissions;
Determination of the basic (key) GHG emission sources and assessment of the results uncertainty.

Greenhouse gas inventory information 86
Each year during inventory, some changes occur that affect directly the above listed activities. Important inventory stage is the process of data transformation into a form, suitable for CRF Tables format. During this process, aggregation of the fuels by type is made (solid, liquid and gaseous), and further data is added, regarding parameters and indices, specifying the systems for transportation and distribution of oil and natural gas, the systems for fertilizer processing, etc. These activities are just part of additional data, filled in the CRF Tables.
3.4.13. Brief General Description of Methodologies and Data Sources Used
According to Clean Air Act, article 25 (6) The Minister of Environment and Water in co-ordination with the interested ministers issues an order for the approval of a Methodology for the calculation, with balance methods, of the emissions of harmful substances (pollutants), emitted in the ambient air. The national Methodology (approved with Order RD 77 from 03.02.2006 of MEW) is harmonized with CORINAIR methodology for calculation of the emissions according to the UNECE/LRTAP Convention.
During 2007, MEW/ExEA had a project for development of Common methodology for emissions inventory under UNECE/LRTAP Convention and UNFCCC, i.e. to update the present Methodology under article 25 (6) CAA. (Approved with Order RD 40 from 22.01.2008 of MEW).
The aim of the project was harmonization of the national Methodology with IPCC, including the three main greenhouse gases – CO2, CH4 and N2O (plus relevant ODS and SF6).
The Bulgarian national GHGs inventory and NIR are compiled according to requirements of the following documents:
IPCC 1996 Revised Guidelines for National Greenhouse Gas Inventories, which specify the reporting obligations according to Articles 4 and 12 of the UNFCCC (IPCC Guidelines, 1996)
IPCC Good Practice Guidance and Uncertainty Management in National Greenhouse Gas Inventories (IPCC GPG, 2000)
IPCC Good Practice Guidance for Land-Use, Land-Use Change and Forestry (IPCC GPG-LULUCF, 2003)
2006 IPCC Guidelines for National Greenhouse Gas Inventories (2006 IPCC GL)
The emission factors are mainly from: IPCC Revised Guidelines IPCC Good Practice Guidelines CORINAIR methodology Country-specific
Table 3.19 shows the methods and the emission factors applied, according to the adopted designations in the IPCC methodology, as follows:
Methods applied D – IPCC standard method; T 1, 2, 3 – methods of the type Tier 1, 2, 3; NO – such method/emission factor not available; RA – reference method; NE – no estimation available. Emission factors applied D – standard IPCC emission factor; C – by CORINAIR; CS – specific for the country.

Greenhouse gas inventory information 87
Table 3.19 Methods and the emission factors applied CO2 CH4 N2O GREENHOUSE GAS SOURCE AND SINK
CATEGORIES Methodapplied
Emissionfactor
Methodapplied
Emission factor
Method applied
Emissionfactor
1. Energy T1,T2 CS,D T1,T2 CS,D T1,T2 CS,D A. Fuel Combustion T1,T2 CS,D T1,T2 CS,D T1,T2 CS,D 1. Energy Industries T2 CS T2 CS T2 D 2. Manufacturing Industries and Construction T2 CS T2 CS T2 D 3. Transport T1,T2 CS,D T1,T2 CS,D T1,T2 CS,D 4. Other Sectors T2 CS T2 CS T2 D 5. Other NA NA T1 D T1 D B. Fugitive Emissions from Fuels NA NA T1 D NA NA 1. Solid Fuels NA NA T1 D NA NA 2. Oil and Natural Gas NA NA T1 D NA NA 2. Industrial Processes D,T1,T2 CS,D D CR,D D D A. Mineral Products D,T1,T2 CS,D NA NA NA NA B. Chemical Industry D,T2 CS,D D CR D D C. Metal Production D CS D D NA NA D. Other Production NA NA E. Production of Halocarbons and SF6 F. Consumption of Halocarbons and SF6 G. Other NA NA NA NA NA NA 3. Solvent and Other Product Use D CS D CS 4. Agriculture D,T1,T2 CS,D D CS,D A. Enteric Fermentation T1 D B. Manure Management T1,T2 CS,D D D C. Rice Cultivation D D D. Agricultural Soils NA NA D D E. Prescribed Burning of Savannas NA NA NA NA F. Field Burning of Agricultural Residues D CS,D D CS,D G. Other NA NA NA NA 5. Land Use, Land-Use Change and Forestry
T1,T2 CS,D T1 D T1,T2 CS,D
A. Forest Land T1,T2 CS,D T1 D T1 D B. Cropland T1,T2 CS,D NA NA T2 CS C. Grassland T2 CS NA NA NA NA D. Wetlands T1 CS NA NA NA NA E. Settlements T1 CS NA NA NA NA F. Other Land NA NA NA NA NA NA G. Other NA NA NA NA NA NA 6. Waste NA NA D,T2 CS,D D D A. Solid Waste Disposal on Land NA NA T2 CS,D B. Waste-water Handling D CS,D D D C. Waste Incineration NA NA NA NA NA NA D. Other NA NA NA NA NA NA 7. Other (as specified in Summary 1.A) NA NA NA NA NA NA

Greenhouse gas inventory information 88
3.4.14. Quality assurance and quality control (QA/QC)
The cycle of QA/QC activity for inventory consists of the following steps:
1. The QA/QC Manager prepares a Plan for implementation of QA/QC activities for the current submission. The check list with all specific QA/QC procedures are part of the plan;
2. The plan for QA/QC is sent to all engaged QC and QA experts for implementation;
3. In the process of preparation of inventory the QC experts (activity data provider and ExEA’s sector experts) apply each of the specific procedures set in the check list for each of the sources categories they are responsible for.
4. The QA/QC Manager coordinates the exchange of the check lists between the QC experts for correction of the findings with input data for calculation of emissions (activity data and EF).
5. The QA/QC Manager send to the QA experts the prepared by ExEA’s sector expert and/or external consultants CRF tables and respective chapters from NIR;
6. The QA/QC Manager coordinate the exchange of the check lists between the QA experts and ExEA’s sector expert and/or external consultants for correction of the findings with quality of the inventory (CRF and NIR );
7. The QA/QC Manager prepares a summary of the results from implemented QA/QC checks.
8. The QA/QC Manager prepares an attendant file for implemented procedures;
9. The QA/QC Manager prepares a report to the executive director of the ExEA for results of the performed QA/QC procedures and improvement plan for the next reporting round;
10. The QA/QC Manager is responsible for documentation and archiving of all documents, related to the performed QA/QC procedures in the national System for documentation and archiving of inventory in ExEA.
3.4.15. QA/QC activities of data provider
The check lists were exchanged between QC experts for correction of the findings with input data for calculation of emissions in the respective sectors.

Greenhouse gas inventory information 89
Table 3.20 Responsibilities in the exchange of check lists between QC experts for 2010 submission
Sector CRF
Activity data Methodology/ emission factors Emission calculations
Check Correction Check Correction Check Correction
Energy CRF1
ExEA NSI MEET external consultant
NSI MEET
ExEA NSI MEET
ExEA external consultant
ExEA NSI MEET
external consultant
Transport CRF1A3
ExEA NSI MI MTITC external consultant
MTITC MI NSI
ExEA NSI MI MTITC
ExEA external consultant
ExEA NSI MI MTITC
Sector expert ExEA and external consultant
Industry processes CRF2
NSI ExEA
NSI ExEA
NSI ExEA
ExEA
NSI ExEA
Sector expert ExEA and external consultant
Solvents use CRF3
NSI ExEA external consultant
NSI ExEA
NSI ExEA
external consultant
NSI ExEA
external consultant
Agriculture CRF4
ExEA MAF
MAF ExEA MAF
ExEA
ExEA MAF
Sector expert ExEA
LULUCF CRF5
ExEA EAF
EAF ExEA EAF
ExEA
ExEA EAF
Sector expert ExEA and external consultant
Waste CRF6
NSI ExEA
NSI ExEA
NSI ExEA
ExEA
NSI ExEA
Sector expert ExEA
As it is written above for 2010 submission the QA procedures are implemented by sector experts within the MoEW and experts from the ExEA, who are not directly involved in the preparation of inventory (Order № RD-218/05.03.2010 by the minister) or external reviewers.
The QA experts fill a check list, which contains all general and specific procedures for QA. It consist information for carried out review by the QA experts, including findings and corrections made.
The check lists are exchanged between QA experts and sector expert in ExEA and/or external consultant for correction of the findings with reporting tables and respective chapters from national reports.

Greenhouse gas inventory information 90
Table 3.21 Responsibilities in exchange of the check lists between QA experts and sector experts for 2010 submission
Sector - CRF Reporting Tables - CRF National Report - NIR
Check Correction Check Correction
Energy
CRF1
MOEW external consultant
MOEW external consultant
Industry processes
CRF2
MOEW Sector expert ExEA and external consultant
MOEW Sector expert ExEA and external consultant
Solvents use
CRF3
MOEW external consultant
MOEW external consultant
Agriculture
CRF4
ExEA and/or external auditor
Sector expert ExEA
ExEA and/or external consultant
Sector expert ExEA
LULUCF
CRF5
External auditor
Sector expert ExEA
External auditor
Sector expert ExEA
Waste
CRF6
MOEW Sector expert ExEA
MOEW Sector expert ExEA
3.4.16. Inventory preparation
The ExEA coordinates all activities on preparation of inventory under UNFCCC.
The Executive director of the ExEA through internal administrative order and based on the Regulation on the organization and structure of ExEA appoints sector experts for preparation of emission inventory in Energy, Industrial process, Solvents and other products use, Agriculture, LULUCF and Waste.
The ExEA, agreed with the MoEW engages external consultants for preparation of tasks, which are out of competence of the Agency and are related with improvement of the inventory.

Greenhouse gas inventory information 91
Table 3.22 Responsibilities for preparation of the Sector emission inventories for 2010 submission
Sector
CRF
Activity data
Methodology and selection of
emission factors
Preparation of Sector inventories
Energy
CRF1A1
CRF1A2
CRF1A4
CRF1A5
NSI
МEЕТ
ExEA
NSI
МEЕТ
external consultant
Energy/Transport
CRF1A3
NSI
MI
МТIТС
ExEA, NSI
MI, MTITC
Sector expert ExEA and external consultant
Energy
CRF1B
NSI
МEЕТ
ExEA, NSI, MEET external consultant
Industry processes
CRF2
NSI
ExEA
МОEW
ExEA, NSI, Branch chambers,
Installations operators
Sector expert ExEA and external consultant
Solvents use
CRF3
NSI
ExEA
ExEA, NSI
external consultant
Agriculture
CRF4
МAF ExEA, МAF Sector expert ExEA
LULUCF
CRF5
EAF ExEA, EAF Sector expert ExEA and external consultant
Waste
CRF6
NSI
ExEA
ExEA, NSI
Sector expert ExEA
Table 3.23 Responsibilities for preparation of the national GHG inventory for 2010 submission Responsibility
under Reporting tables National report Preparation Approval
UNFCCC CRF format NIR ExEA MOEW
3.4.17. Documentation and data archiving
In August 2010 a new System for sector expert workflow organisation, inventory documentation and data archiving has been implemented in the ExEA.

Greenhouse gas inventory information 92
Figure 3.15 Documentation and data archiving in ExEA
3.5. Information on the National Registry System
The Bulgarian Registry of GHG emissions is using Version 5.1.24 (CITL-ITL-BG Registry) in production environment of Greta software and digital certificates have been installed
The GRETA registry system used in Bulgaria has been developed for the EU Emissions Trading Scheme. This scheme requires its Member States registries to be compliant with the UN Data Exchange Standards specified for the Kyoto Protocol.
National Registry has successfully connected the ITL (Independent Transaction Log) during the go-live test from 07 October to 16 October 2008. Registry has been lived and connected to the ITL-CITL since 16 October 2008 - both systems (CITL and ITL) are already online.
Bulgarian Registry successfully performed the following steps:
1. Passed the test by connecting links at European level. 2. European Commission has sent report confirming successful connection to the
European record. 3. National Registry successfully passed connectivity testing - VPN and SSL tests. 4. National Allocation Plan 2008-2012 (NAP) has been approved in April 2010 by the
EC. 5. Has opened 152 separate operator accounts for each of the installations with dedicated
allocation of emission quotas under the National Allocation Plan for 2008-2012 and laid down in Regulation 2216/2004 of the European Commission
6. Verified emissions of all installations has been proposed and approved. 7. The operators successfully surrendered their allowances. 8. 34 private accounts have been opened in the National Registry pursuant to Regulation
2216/2004 of the European Commission.

Greenhouse gas inventory information 93
9. Joint Implementation (JI) - Bulgaria approved 26 JI projects in total and 15 of them have already achieved and verified emission reductions. National Registry has successfully transferred reduction units to those 15 projects.
Procedures to minimize discrepancies
A description of the procedures has been employed in the National Registry to minimize discrepancies in the issuance, transfer, acquisition, cancellation and retirement of ERUs, CERs, tCERs, lCERs, AAUs and/or RMUs, and replacement of tCERs and lCERs, and of the steps taken to terminate transactions where a discrepancy is notified and to correct problems in the event of a failure in terminating the transactions. The operation of the registry is permanently monitored by the registry service team.
All transactions performed through the Bulgarian Registry are currently verified by ITL and CITL.
The reconciliations are performed with these ITL and CITL.
Security measures
An overview of security measures has been employed in the National Registry to prevent unauthorized manipulations and to prevent an operator error and of how these measures are kept up to date.
Bulgarian Registry was closed for operation on 29 June 2010 after the final Decision of the Enforcement branch of the Compliance Committee to suspend the eligibility of Bulgaria to participate in the mechanisms under Articles 6, 12 and 17 of the Kyoto Protocol. (CC-2010-1-13/Bulgaria/EB).
The Enforcement branch of the Compliance Committee concludes that the available information is sufficient in order to consider that the question of implementation has been resolved. Bulgaria is fully eligible to participate in the mechanisms under Articles 6, 12 and 17 of the Kyoto Protocol since 04 February 2011. (CC-2010-1-17/Bulgaria/EB).
On 30 December 2010 the Council of Ministers of Bulgaria has adopted a revised Ordinance on the functioning of the National Registry for accounting of the issuance, holding, transfer, transfer and cancellation of quotas for greenhouse gases.
Additional requirements have been included in the new Ordinance, for the package of documents submitted for user registration and when carrying out a transaction. These requirements are as follows:
For carrying-out a transaction the following is necessary:
To transfer allowances from one account to another designated representative should send a request by submitting an application in a form approved by the Executive Director of the ExEA and posted on the website of the ExEA. The application is sent to the registry administrator by email and by poste service in printed version.
The application should contain:
1. name of the holder of the account, where the allowances shell be transferred from; 2. designation and number of the account, where the allowances shell be transferred
from; 3. type and number of allowances to be transferred; 4. name of the holder of the account, where allowances to be transferred to; 5. designation and account number where allowances to be transferred to; 6. name of the receiving register;

Greenhouse gas inventory information 94
7. information for the person making the transfer (or authorized agent registry administrator).
The application has to be signed and sealed by the account holder and the authorized representatives of the account in case the transfer has to be made by the registry administrator.
The Executive Environment Agency (ExEA), in its capacity of Administrator of the National Registry, has undertaken the measures, described below:
The option for voluntary suspension of access to the accounts, i.e. the user is not able to log into the registered users, is offered to all registered users. In those cases the registry administrator sends by e-mail daily reports for the account balance and transaction history.
The requirement to choose additional authorized representative for each account has to be included in the General Conditions for registry use.
An additional software module has been developed and implemented. The module monitors and records the unauthorized attempts to penetrate the system in order to increase the security level of the registry. These data is submitted to the Security authorities.
The registry administrators undertake active measures to determine such trials by duly blocking the addresses, suspected for malicious access
A short password sent by sms has been used by the registry since April 2011. Registry administrator
The designated Bulgarian administrator for maintaining the National Registry is:
Executive Environment Agency
Address: 136 Tzar Boris III Blvd., P.O. Box 251, 1618 Sofia, Bulgaria
Tel.:+359 2 9559011, Fax: +359 2 9559015, E-mail: registry@ eaa.government.bg
Registry Support KONTRAX LTD (IT Support of BG registry)
ExEA has contracted Kontrax LTD to maintain the registry operation as well as to provide support to its users
Role and responsibility: Adapting interface, keep the registry running, Internet/server security, Incident solving, back- up/ disaster Recovery.
Organization: Kontrax LTD.
Contact persons: Mr. Ivan Dilov
Email: [email protected], Tel.: +359 2 9609562
Information publicly acessible
A list of publicly accessible information is available by means of the National Registry user interface.
According to paragraph 45 to decision 13/CMP, the necessary information is available at the:
http://bg-server1.etr.moew.government.bg/iaos/contacts.php
According to decision 13/CMP, the following information is available at the registry website:
http://bg-server1.etr.moew.government.bg/
According to paragraph 46 under decision 13/CMP the following information:

Greenhouse gas inventory information 95
Project name a unique name for the project Project location: The party, town or region where the project is located Years of issuance All publicly information relating to the project is available at the address: http://bg-server1.etr.moew.government.bg/iaos/projects.php
The registry terms and conditions, operator’s guide, forms and guidance for opening the holding accounts are available at the Executive Environment Agency website:
http://nfp-bg.eionet.eu.int/bul/About/RR/R_TE/registry/index.html
Registry’s web site:
http://bg-server1.etr.moew.government.bg/

Policies and measures 96
4. POLICIES AND MEASURES
4.1. Policy - making process
The Ministry of Environment and Water is responsible for the overall national environmental policy in Bulgaria including the climate change problems.
It is responsible for the applying the adopted legislation on national scale and conceiving new legislation in the future. The problem for environmental protection is a global one and for this reason MOEW works together with almost all other ministries. The MOEW has the following subsidiary bodies: The Executive Environmental Agency, fifteen Regional Inspectorates for Environment and Water, three National Parks and four Basin Directorates.
The following organizations support the activities of MOEW: The Ministry of Economy, Energy and Tourism (MEET), The Energy Efficiency Agency (EEA), The Ministry of Agriculture and Food (MAF), The Ministry of Finance (MF), The Ministry of Regional Development and Public Works (MRDPW), The Ministry of Education, Youth and Science (MES), The Ministry of Foreign Affairs, as well as The National Statistical Institute, The Bulgarian Academy of Sciences etc, which participate in the process of application, development and perfection of GHG mitigation measures, procedures and mechanisms. The coordination of climate change activities within interministerial working groups was accepted as a Good Practice and now the following are functioning: Interministerial Committee on Climate Change (IMCCC), Joint Implementation Steering Committee (JISC) and Interministerial Working Group for Development of the National Allocation Plan (IWGNAP). In this way the efforts of all concerned Governmental Agencies, business and NGOs are united.
Responsibility of the Ministry of Environment and Water
The Ministry of Environment and Water (MOEW) is the governmental institution authorized to develop and carry out the state policy related to protection of the environment. MOEW is responsible for the preparation and reporting of the annual inventories of GHG emissions, as well as for the formulation and implementation of the policies and measures to mitigate climate change.
Role of the Inter-Ministerial Committee on Climate Change (IMCCC)
The IMCCC was set up under the Governmental decision to coordinate the implementation of the First Action Plan on Climate Change in July 2000. It was intended to facilitate the communications among institutions and to ensure the control and coordination of their activities in relation to the climate change process in the country. The Committee consists of representatives from a majority of the ministries, the Energy Efficiency Agency and an observer from Sofia Municipality, and is chaired by Deputy Minister of MOEW.
The Steering Committee (SC) for Joint Implementation Projects
Steering Committee is an evaluation body for Joint Implementation projects under the Kyoto Protocol. It consists of representatives from the Ministry of Environment and Water, the Ministry of Economy, Energy and Tourism, the Ministry of Finance, the Ministry of Regional Development and Public Works, the Ministry of Agriculture and Food, the Ministry of Transport, Information Technology and Communications, the Ministry of Foreign Affairs, the Executive Environment Agency, the Energy Efficiency Agency and the Executive Forestry Agency. The Committee is chaired by Deputy Minister of MOEW. The SC evaluates proposed projects according to the existing internal environmental criteria and the JI national

Policies and measures 97
guidelines on Track 1 and Track 2. If necessary, additional expert opinions and statements from the relevant ministries and organizations are requested. The SC advises the Minister of Environment and Water in issuing/not issuing a Letter of Approval for each particular project proposal.
The Interministerial Working Group for Development of the National Allocation Plan (IWGNAP) for EU ETS
The introduction of the EU Emissions Trading Scheme requires the country to possess National Plan for allocation of emission allowances. The Plan development is coordinated by an interministerial working group set by the ordinance of the Minister of MOEW No. RD-186/06.04.2005. Representatives of the MOEW, the MEET, the MRDPW, the MF, the NSI and representatives of NGOs: Bulgarian Chamber of Commerce and branch organizations of the industrial branches that are covered by the Scheme – Bulgarian Association of the Cement Industry, Bulgarian Branch Chamber of the Energetic, Branch Chamber of the Pulp and Paper Industry, Branch Chamber of the Glass Industry, Branch Chamber of the Iron and Steel Industry, Branch Chamber of the Chemical Industry, Bulgarian Union of the Ceramics. The Plan has been approved by the European Commission.
Role of implementing agencies and other institutions
Executive Environment Agency (ExEA) is an administration under the Minister of Environment and Water jurisdiction and is appointed to carry out management, coordination and information functions as regards the control and environmental protection in Bulgaria. It designs and manages the National Environmental Monitoring System for Environmental Monitoring and information on the state of environmental components and factors at national level. The Agency coordinates and performs the overall activities on the preparation of the GHG inventories and the National Inventory Report. The ExEA administrates the National GHG Registry.
Energy Efficiency Agency within MEET – organizes the implementation of projects and measures in accordance with the national long- and short-term energy efficiency programs; approves projects for energy efficiency and controls their implementation; participates in the preparation of legal regulations in the field of energy efficiency: proposes development and improvement of energy efficiency standards in order to achieve approximation to the EU norms and to encourage energy efficiency at the demand side; cooperates with central and regional governmental institutions, employers’ associations, branch organizations, consumer associations and NGOs on implementation of energy efficiency policies and measures; maintains the national information system on energy efficiency, develops guidelines for establishments and maintenance of EE information systems for central and regional governmental institutions; develops programs for implementation and control of EE measures and programs for EE awareness rising; develops programs for implementation of EE on local (municipal) level; cooperates in implementing EE training.
Municipalities
The major responsibility of municipal energy management is imposed upon local authorities. The rational use of energy as well as its production and supply at local level, became responsibility of municipal authorities. The basic instrument for energy management in municipalities is the local (municipal) energy planning.
Municipal energy efficiency planning is obligatory according to the new Energy Efficiency Law. Therefore, the municipal administration has to adopt the following programmes:

Policies and measures 98
Refurbishment of the housings, administrative and utility buildings throughout the municipal territory aiming to carry out measures for energy efficiency;
Introduction of energy-saving appliances for street lighting in settlements and in public buildings;
Other measures for improvement of energy efficiency.
4.2. Domestic and regional programmes and/or legislative arrangements and enforcement and administrative procedures
This section presents set of political instruments which could be applied in the Climate Change Policy. In functional plan, these instruments have an intersectoral impact and influence the economy and household in general.
Legal instruments and regulation
In most countries laws and regulations are important instruments in climate change policy. The Bulgaria obligations in the climate change policy follow from multilateral and bilateral international agreements, from the EU legislation in the field of climate change as well as from the national legislation. The most important are:
- The Environmental Protection Act and Clean Air Act and related secondary legislation, including a permit system for meeting minimum standards in accordance with EU regulation on Large Combustion Plants, the introduction of the EU ETS and technical inspection (e.g. for cars) etc;
- The Energy Law in its part on combined heat and power generation introduces the requirements of the related EU directives and the use of instruments such as green certificates and preferential feed in tariffs and mandates the state regulations to the licensed activities in the power sector and purchase obligations for the Transmission and Distribution Companies to by all electricity produced from high efficient cogeneration, and for district heating companies to buy all utilized waste thermal energy.
- The Renewable Energy Law introduces the requirements of the related EU directives and the use of instruments such as green certificates and preferential feed in tariffs, mandates the state regulations to the licensed activities in the power sector and purchase obligations for the Transmission and Distribution Companies to by all electricity produced from renewable sources. It regulates the acceptance and realization of national indicative targets for consumption of bio fuels and other renewable fuels in the transport sector as a part of the total consumption of transport fuels
- The Energy Efficiency Law and related secondary legislation, including obligation to adopt municipal energy efficiency programs, requirements for energy efficiency labelling, the use of minimum standards resulting from the EU directive on energy efficient appliances, regulations for energy efficiency labelling of various types of products (appliances, cars), obligatory audits and amendments of the Energy Performance Standards for existing buildings;
- The Waste Management Law and the related secondary legislation including the obligation for collecting, management and usage (or combustion) of the omitted gases from the new waste deposits;
Fiscal policy

Policies and measures 99
In many EU countries fiscal policies are important instruments to stimulate measures that reduce emissions of greenhouse gases and/or save energy. The advantage of the fiscal incentives is that they are equally available to all investors and make better use of the market mechanisms. When introducing such policies in Bulgaria it is necessary to remember that they have to be in harmony with EU legislation (especially in relation to competitiveness) and to be implemented in such a way that minimizes or eliminates the “free riders”.
A number of stimulating measures for the subjects of taxation were introduced in the Law on amendment and supplement of the Law on the Corporate Income Tax Act and also in the Law on amendment and supplement of the Personal Income Tax Law, regarding the activities of the newly established fund “Energy efficiency”.
Education, Research and Development (R&D)
Education and R&D are important for the future development of climate change activities and environmentally-friendly behaviour of future generations. Due to a lack of finance only limited actions have been undertaken:
- Introduction of climate change problems into the curriculum of schools and universities;
- Implementation of local R&D programs;
- Participation in EU Research programs (6th Framework program).
Awareness Raising and Public Information
Different stakeholders such as the national Government, the business community, environmental NGOs and the media play an important role in the raising the public awareness about the climate change, international and national actions to mitigate climate change. Activities, which are undertaken in Bulgaria, are:
- Designation of National Focal Point under Art. 6 o the UN FCCC;
- Regular actualization of the information about the current climate change policy at the MOEW web site;
- Issuing and distribution of brochures and other materials;
- Inclusion of climate change days in the national environmental campaigns;
- Publications in the media presenting information on various aspects of the climate change;
- Information support and organization of workshops for business stakeholders on the opportunities to participate in the Joint Implementation mechanism according to the requirements of the Kyoto Protocol and participation in the EU ETS;
- Dissemination of adapted scientific findings and information on climate change; popularized through integrating them in various specialized information flows.
National strategy for the Environment and Second National Action Plan 2005-2014
The Strategy was developed for the period 2005-2014 together with an Action Plan 2005-2009. It is a continuation of the National Strategy for the Environment 2000-2006 and in this aspect keeps the long-term environmental policy objective. The National Strategy for the Environment is consistent with the principles of the prevention and reduction of the human health risk, integration of the environmental protection policy in the sectoral policies on the development of the economy and awareness of the citizens on the state of the environment.

Policies and measures 100
The objectives and actions of this National strategy have been developed, taking into account the opinion of a wide variety of representatives – state institutions, business, municipalities, NGO, the general public.
For the first time, during the development of a strategic national document in the area of environmental protection, a national survey was carried out in order to take into consideration the opinion of the population in determining the priorities and measures in the National Strategy for the Environment and also the public awareness on the environmental protection issues.
The project of the National Strategy for the Environment 2005-2014 was approved by the Council of Ministers on April 7th, 2005 and was passed to the National Assembly for discussion and adoption.
Second National Climate Change Action Plan (2005-2008)
During the analysis of the results of the actions undertaken to fulfil the First National Action Plan in 2002 a decision was undertaken to develop a Second National Action Plan for the period 2005 – 2008. The plan is approved by the Government and published in Bulgarian and English languages.
The First National Action Plan on Climate Change (NAPCC) for Bulgaria was developed in the period 1996 – 1997, and approved by the Government in 2000. It contained a coherent set of actions for the period in line with Bulgaria’s international obligations in the context of UNFCCC as well as the Climate Change Program of the European Union.
The economic and political development Bulgaria after the year 2005 along with changes in the international and domestic policy and regulatory framework required an update of the Second Action Plan. A study for assessment of the Plan implementation will be used in 2010 for development of the Third Action Plan to be implemented in the period 2013 – 2020, although the effects of the measures in terms of greenhouse gas (GHG) emission reduction of the Second Action Plan are assessed up to year 2012, when the First Commitment Period under the Kyoto Protocol ends.
4.3. Policies and measures and their effects
The information and the analysis of the provided national measures for the period 2007-2009 are provided on the basis of the following preconditions:
- two groups of measures are reported based on the status of implementation of measures: “with measures” (WM) and “with additional measures” (WAM);
- “with measures” encompass adopted after 2005 policies and measures and currently implemented. Measures implemented before 2005 are not listed here
- “with additional measures” encompass planned policies and measures which were not implemented up to 2009.
According to the official definition of the UN FCCC documents Implemented policies and measures are those for which one or more of the following applies: (a) national legislation is in force; (b) one or more voluntary agreements have been established; (c) financial resources have been allocated; (d) human resources have been mobilized. Here we do not consider measures that are supported by the national legislation as implemented. These measures are listed under additional measures. Those policies and measures for which an official government decision has been made are not considered under the “with measures” as well, because it is common practice in the country to cancel or postpone the implementation of

Policies and measures 101
legal or governmental decisions so there is no a clear commitment to proceed with implementation.
Planned policies and measures are options already adopted, but not implemented yet, or are under discussion and having a realistic chance of being implemented in future.
4.3.1. Real and expected interaction with other relevant policies and measures and with the relevant policies and legislation of the European Community.
The legislative measures in the climate change area, introduced in 2007 are connected mainly with intoduction of the European legislation, as well as other activities on implementation of acquis communautaire, connected with the climate change policies.
Regulation on the conditions, order and way for preparing of the reports and for verification of reports of the installation operators, participating in the National Allocation Plan 2008 – 2012 was approved by DCM № 8/19.01.2007.
Regulation on the order and methods of working of the National registry for accounting of issuing, possession, delivery, transferring and cancelling of GHG emission allowances was approved by DCM №7/19.01.2007.
New regulations in 2010 have been introduced to further clarify the EU ETS process:
DCM 297/13.12.2010 for Regulation on the order and way of issuing and reconsideration of allowances for GHG emissions from installations and for performance of the monitoring by the installation operators and aircraft operators – participants in the emission allowances trading scheme
DCM 298/13.12.2010 for Regulation on the conditions, order and way of preparation of reports and for verification of the reports of the installation and aircraft operators;
DCM № 313/12.2010 for Regulation on the order and way of functioning of the National Registry for accounting, issuing, possession, delivery, transferring and canceling of GHG emission allowances.
On 12.04.2007 by Decision of the Council of Ministers was adopted the National Allocation Plan for the period 2008 – 2012, which was submitted for consideration and approval to the European Commission. The adoption of the plan for distribution of allowances for trade with GHG emissions and its approval by the European Commission was a necessary precondition for Bulgaria’s participation in the EU Emissions Trading Scheme.
The requirements of Directive 2003/30/EC were introduced to the national legislation with the Renewable Energy Law (published in State Gazette, issue 49 from 2007), which regulates the acceptance and realization of national indicative targets for consumption of bio fuels and other renewable fuels in the transport sector as a part of the total consumption of transport fuels.
National long-term program for reassurance of the bio fuels consumption in the transport sector 2008-2020 was developed. It was adopted by the Council of Ministers on 15.11.2007.
In connection with efficient realization of the politics and measures on climate changes and on purpose increase of the institutional capacity of the national level, the work on coordination of different aspects from these activities through interdepartmental working groups was approved as a good practice. With Orders from the Minister of Environment and Water are established: Interdepartmental committee on climate change, Interdepartmental working group for development of National Allocation Plan 2008-2012 and Steering Committee for evaluation of JI projects under the Kyoto Protocol.
Policies and measures 102
4.3.2. Energy sector.
Introduction
The Energy strategy for Bulgaria represents the national energy policy and the main reforms envisaged for this sector. The Bulgarian energy sector will pursue two major pillars in the future: nuclear energy and local extraction of lignite coal as a leading priority for the development of a competitive energy market. All other priorities are directly related to:
- Security of supply;
- Competition at the energy market;
- Environmental protection.
In the process of its development the Bulgarian energy sector is implementing numerous measures that led to stabilization and reduction of the GHG emissions. After the early decommissioning of units 3 and 4 from NPP Kozloduy the emissions from the energy sector actually have increased. This is because the development plans envisage deployment of electricity production units utilizing imported and local coal with high GHG emissions potential (the production of local coal alone is expected to exceed 25-30 Mtons per annum).
Policies and measures for energy sector
The applicable instruments for mitigation measures in the energy sector in Bulgaria are presented in the table below:
Table 4.1. The applicable instruments for mitigation measures in the energy sector Legal Implementation of the Directive on Large Combustion Plants Implementation of the IPPC Directive Regulations of the State Energy Regulatory Commission (SERC) Purchase obligations for waste heat Market based instruments EU Emissions Trading Scheme International Finance Funds or sources for investments in emission reduction projects (energy efficiency funds, JI, GIS, structural EU funds such as ISPA) State guarantees for loans
“With measures”
Improvement of the operation of nuclear power plant Kozloduy (NPP-K)
One of the most important branches of Bulgarian energy sector is nuclear energy, which does not release any GHG emissions during the production of electricity. Kozloduy units 1-4 were gradually put out of operation (units 1 and 2 in 2002, and units 3 and 4 in 2006). Decommissioning of units 1 to 4 was in accordance with the EU accession requirements.
The introduction of new methods for control and planned repairs leads to reduction of the planned demurrage and fuel recharge. In this way, an effective load up to 7,200 hours per year can be achieved as well as an increase of electricity production of 1.28 TWh per year. The forecasted electricity production at NPP-K for 2010 is 12.4 TWh. The successful
Policies and measures 103
implementation of the measure has resulted in an increase of the electricity production up to 15.8 TWh in 2008. Measure code E1 Objective Improvement of the operation of nuclear power plant
Kozloduy (NPP-K) Approx. annual reduction 946 kt Costs per ton CO2 Low Investment requirements High Year of implementation 2007-2013 Instruments State guarantees for loans
Accelerated development of hydro energy
New capacities of 400 MW could be built for an annual operation of 2,000 to 3,000 hours. Measure code E2 Objective Construction of hydro cascade Gorna Arda and Sredna
Vucha (expected start up 2012) Approx. annual reduction after 2012
408 kt from substitution of electricity generated in power system after year 2012
Costs per ton CO2 High Investment requirements Substantial Year of implementation 2007-2012 Instruments Joint implementation mechanism
At that moment there is not clarity about construction of hydro cascade Gorna Arda and it is expected to start be put in operation after 2017, i.e. remains as a part of projections and Sredna Vucha with expected accelerated term of commissioning in 2010.
Construction of small and micro HPP
Hydropower stations with capacity up to 10 MW are classified as small or micro HPPs. The potential for electricity production from MHPPs is thoroughly studied and is assessed at 0.7 TWh per year.1 High investments costs and the low annual utilization of the installed capacity (app. 2,400 hours per year) impede the installation of new capacities.
Problems with environment protection in many protected areas, in which is situated the main micro hydro potential delay the realization of the measure and reduce its potential for emissions reduction. EU ETS and the rules for avoiding the double accounting of emission reductions excluded the possibility for use of JI projects for projects co financing. Practically the preferential feeds in tariffs are the only instrument for the support of these projects.
1 Bulgarian country study to address climate change, US country study programme, 1996.

Policies and measures 104
Measure code E3 Objective Construction of small and micro HPP in different country
regions Approx. annual reduction 0.2 Mton from substitution of electricity generated from
fossil fuels in power system Costs per ton CO2 High Investment requirements Substantial Year of implementation 2007-2013 Instruments Joint implementation mechanism
Electricity transmission and distribution losses
A reduction of the electricity losses will lead to fewer GHG emissions as a result of lower electricity production in coal-fired plants. According to experts assessment these are about 20-30 % of the losses in transmission networks and 30-40 % of the losses in distribution networks. Measure code E5 Objective Decreasing of losses in the distribution and transmission
networks Approx. annual reduction 1,100 kt from decreasing of electricity losses in power
system Costs per ton CO2 Low Investment requirements Limited Year of implementation 2007-2013 Instruments Regulation by SERC
Privatization of distribution networks
Heat transmission and distribution losses
Losses of heat can be reduced through rehabilitation, modernisation and improving the exploitation of the transmission and distribution networks. A reduction of the heat losses will lead to fewer GHG emissions as a result of lower heat production in heat boilers. Measure code E6 Objective Decreasing of losses in the heat transmission networks Approx. annual reduction 900 kt from decreasing of heat losses in distribution network
and sub-stations Costs per ton CO2 Low Investment requirements Limited Year of implementation 2007-2013 Instruments Regulation by SERC
“With additional measures”
Upgrading of cogeneration plants and district heating boilers
The introduction of new natural-gas combined cycle for replacing capacities at some of the existing thermal power plants and district heating plants forms part of the Implementation Programme for the Directive on Large combustion plants for the period after 2007.

Policies and measures 105
Measure code E4 Objective Upgrading of cogeneration plants and district heating boilers
by natural gas turbines. Approx. annual reduction 867.5 kt from substitution of electricity generated from coal
and liquid fuels in power system Costs per ton CO2 Medium Investment requirements Substantial Year of implementation 2007-2013 Instruments EU ETS
Joint implementation mechanism
The considerable rise of the natural gas and delaying of the restructuring of the centralized district heating delayed the application of this measure in big district heating plants and the measure is applicable only in three small district heating plants with limited effect.
Biomass for electricity and heat production
Biomass includes firewood, waste wood, agricultural solid waste (vegetal residues), agricultural liquid waste (liquid manure and others), combustible industrial waste (paper, chips) and municipal solid and liquid waste.
Fire wood and agricultural waste (vegetal residues) are traditionally used as energy source in Bulgaria. The potential for biomass utilization is high. Measure code E7 Objective Biomass for electricity and heat production Approx. annual reduction 0.05 Mton from:
Introduction of heating installations on wood-fired boilers 40 MW installation on biomass for production of electricity and thermal energy Combined production of electricity and heat with biogas from the waste disposal sites
Costs per ton CO2 Medium Investment requirements Substantial Year of implementation 2007-2013 Instruments Joint implementation mechanism
The assessment of the theoretical potential resulted in the following figures: firewood – 7.7 PJ per year; waste paper - 0.3 PJ per year; agricultural solid waste - 77.1 PJ per year; waste from live-stock breeding -11.3 PJ per year; municipal solid waste - 12.5 PJ per year and industrial waste wood - 0.4 PJ per year.
There are several ways for biomass conversion (e.g. combustion, pyrolysis and gasification), but combustion of biomass for production of electricity and thermal energy seem to be the most promising for Bulgaria.
Policies and measures 106
4.3.3. Industry
Introduction
The policy towards fast privatization resulted in almost complete privatization of the industrial plants. As a consequence, the most inefficient industries were closed. New owners immediately implemented a number of energy saving measures.
Sector policy instruments
The applicable instruments for the manufacturing industry sector in Bulgaria are presented in the table.
Table 4.2 The applicable instruments for the manufacturing industry sector Legal Implementation of IPPC Directive Obligatory energy audits for consumers with load over 10 MW Obligatory implementation of recommendations resulting from the energy audits, related to measures with less than 2-year pay-back period Annual technical inspections Fiscal EU Emission Trading Scheme Finance Funds or sources for investments in emission reduction projects (energy efficiency funds, JI, GIS, structural EU funds such as ISPA) Support for energy audits at SME Awareness / information Providing pubic access to the statement of the operator and the project for IPPC permits Voluntary agreements Voluntary agreements to improve energy efficiency
“With Measures”
Reduction of thermal losses in industry
The use of heat in the form of steam and hot water is an important part of the industrial energy consumption. Heat losses are associated with transmission and distribution of heat, especially at high pressure and high temperatures. Reduction of heat losses can be realized through thermal insulation, redesign and replacement or updating of heat exchangers leading to reduction of fuel consumption for its production.

Policies and measures 107
Measure code I1 Objective Reduction of thermal losses in industry Approx. annual reduction 0.12 Mton from:
Improvement of heat insulation of pipelines, taps, user stations and water heaters Chemical industry heat exchanges and losses Installation of utilizations for outlet gases of industrial boilers operating on natural gas Revision and replacement of steam-condense pots in the steam-condense systems at enterprises
Costs per ton CO2 Medium Investment requirements Limited Year of implementation 2009-2013 Instruments Obligatory audits for consumer with capacity over 10 MW
Voluntary agreements Support for energy audits in SMEs
Scenario “With Additional Measures”
Renovation of construction machines
Construction is an industrial branch of which emissions from residual oil consumed in road-transportation machines represents a considerable share in the overall GHG emissions of the country. Defining standards for efficiency of those machines and strengthening inspections would lead to the gradual phase out of these machines, increasing the average efficiency of the remaining machine park. Measure code I5 Name Introduction of highly-efficient construction machines using
diesel fuel (25 % replacement) Approx. annual reduction 0.07 Mton from diesel fuel savings after 25 % replacement Costs per ton CO2 High Investment requirements High Year of implementation 2007-2013 Instruments Energy and environmental standards
Reduction of fuel consumption in production of building materials
Cement industry is a key GHG emissions source. Production of structural ceramics and quicklime consume large amounts of fuels (both liquid and solid) as well. The energy use in this sector can be reduced by replacing part of the fuel by combustible waste such as car tyres.

Policies and measures 108
Measure code I6 Objective Replacement of part of the fuel by motor-car tyres and other
combustible waste Approx. annual reduction 0.34 Mton from:
Replacement of imported coal by combustible waste saving in cement industry Combustible waste utilization in ceramics and quicklime production (substitutes 20 % of the main fuel)
Costs per ton CO2 Medium Investment requirements Limited Year of implementation 2007-2013 Instruments Voluntary agreements
EU ETS
Natural gas supply to the industry by development of gas infrastructure
Substituting liquid fuels with natural gas is profitable for industry when infrastructure is available. Fuel switch contributes to lower emissions of GHG emission and higher efficiency. One of the main obstacles to the fuel switch, however, is the high investment costs for developing distribution networks. Measure code I2 Objective Increased use of natural gas in industry by new gas
infrastructure Approx. annual reduction 0.05 Mton from heavy fuel oil and other liquid fuels switch
to natural gas (10 % replacement of liquid fuels in 2010) Costs per ton CO2 Medium Investment requirements High Year of implementation 2007-2013 Instruments Funding from structural and cohesion funds EU
Introduction of monitoring systems for energy consumption
The management of industrial companies in the private sector is strongly interested in improvement of the efficiency of production processes. One way to achieve this is the establishment of systems for monitoring and control of energy consumption at different technological stages. This enables companies to have more insight in their energy consumption in various parts of the process, showing where measures could be taken for increase of efficiency. This would lead to a lower amount of energy used per unit product. Savings can be made both in electricity and heat use, as well as natural gas, residual and gas oil consumption.

Policies and measures 109
Measure code I3 Objective Monitoring systems for energy use in industry Approx. annual reduction 0.11 Mton from:
Establishment of up to 60 monitoring systems Establishment of up to 200 energy consumption information systems
Costs per ton CO2 Low Investment requirements Limited Year of implementation 2007-2013 Instruments Voluntary agreements
Upgrading of steam and heat generation and compressed-air plants
In the light industry, food processing industry, machine building and metalworking, electrical and electronic industry can all reduce about 20 % of the energy consumption. This can be done through modernization of steam and compressed-air installations, regulation of the heat energy systems, energy management and control and introduction of small-scale co-generation at the relevant enterprises. Measure code I4 Objective Updating of the steam generation and compressed air plants
and reduction of energy consumption Approx. annual reduction 0.02 Mton from:
Upgrading of steam generation technology Introduction of infrared ceiling heater Reduction of losses in compressed-air systems Introduction of small scale cogeneration
Costs per ton CO2 Medium Investment requirements Substantial Year of implementation 2007-2013 Instruments Implementation of Directive 96/61/EC
Voluntary agreements Support for energy audits in SMEs (from energy efficiency funds) and obligatory implementation of the recommendations coinciding from the audits
4.3.4. Residential Sector and Commercial/Institutional Buildings
Introduction
Considerable progress in energy saving was achieved by national programmes on the improvement of thermal insulation of the existing buildings, on the replacement of incandescent lamps with compact luminescent lamps, and on the introduction of automated control of street lighting.
One of the priorities for the Government, which at the same time forms an important factor for the EU accession process, is to provide conditions for wider introduction of RES and energy-saving technologies and practices.
The analysis of options for RES utilization in households and services revealed a practicable potential for GHG emissions reduction through implementation of:

Policies and measures 110
- Solar panels at public buildings;
- Introduction of hybrid installations for hot water at nurseries, schools and hospitals.
Sector policy instruments
The table below presents instruments which are applicable to the residential sector and commercial/institutional buildings in Bulgaria.
Table 4.3. Policy instruments applicable in the residential sector and commercial/institutional buildings Legal Amended energy performance standards for existing buildings Finance Funds or sources for investments in emission reduction projects (energy efficiency funds, JI, GIS, EU Funds) Awareness / information Public information campaigns to be financed by the relevant ministries
“With Measures”
Gas supply to Households
The Residential Gasification has the following advantages in comparison with the central heating:
- there is no necessity for construction of huge thermal plants;
- investments in gas distribution networks are much lower;
- heat losses during distribution of heat are eliminated;
- it is favourable for the work of the energy system.
The Gas Supply Program for Residential and Servicing sector of MEE plans for additional households to be connected towards 2020, which should lead to a reduction of 6.9 Mton CO2 eqv. Assuming annual new connections about 290 thousand additional households will be supplied towards 2010, leading to an emission reduction of 2.3 Mtone. Measure code H1 Objective Gas supply to households Approx. annual reduction 2.3 Mton from gas supply to 290 000 households
(replacement of electricity) Costs per ton CO2 High Investment requirements Substantial for development of distribution network
Substantial for households to purchase boiler equipment (€ 1,500)
Year of implementation 2007-2013 Instruments EU Funds
“With Additional Measures”
Solar collector systems

Policies and measures 111
The geographical situation of the country provides for a substantial solar energy potential. The solar collectors are with relatively low single capacities. These panels are suitable for installation at institutional buildings and private homes. Measure code H2 Objective Installation of solar collectors Approx. annual reduction 0.02 Mton from substitution of light industrial fuel (gas oil)
for heating Costs per ton CO2 High Investment requirements Substantial per building Year of implementation 2007-2013 Instruments EU funds or new EBRD Funds
Hybrid and other hot water installations Measure code H3 Name Hybrid and other RES hot water installations Annual reduction in 2010 0.04 Mton from:
72 hot water installations in hospitals, schools and other public buildings Hybrid solar installations and pyrolysis boilers in nurseries
Costs per ton CO2 High Investment requirements High Expected year of implementation
Dependent on available resources for financing of projects
Instruments GIS EBRD Fund, if it is establish
Government contribution None Actions Municipalities cooperate for more effective utilization of the
potential for introduction of hybrid solar installation and boilers at nurseries of their property MRDPW informs the municipalities on the possibilities for participation in GIS projects and collaborates in securing funding
4.3.5. Transport
Introduction
The governmental investment policy in transportation is based on development of the country’s transport infrastructure as an integrated part of the overall European transport network.
In period 2007-2009 the transport infrastructure is under reconstruction and update in accordance with the international requirements and standards. The most important objectives of the national government are the liberalization of the transport market, finalization of the legislative and institutional restructuring of the transportation sector and the provision of beneficial conditions for development of private transport companies and renewing of the transport/mobile park.
It should be noted that the share of railway transportation in Bulgaria used to be relatively high. A further shift to road transport could result into a significant increase in transportation flows and GHG emissions.
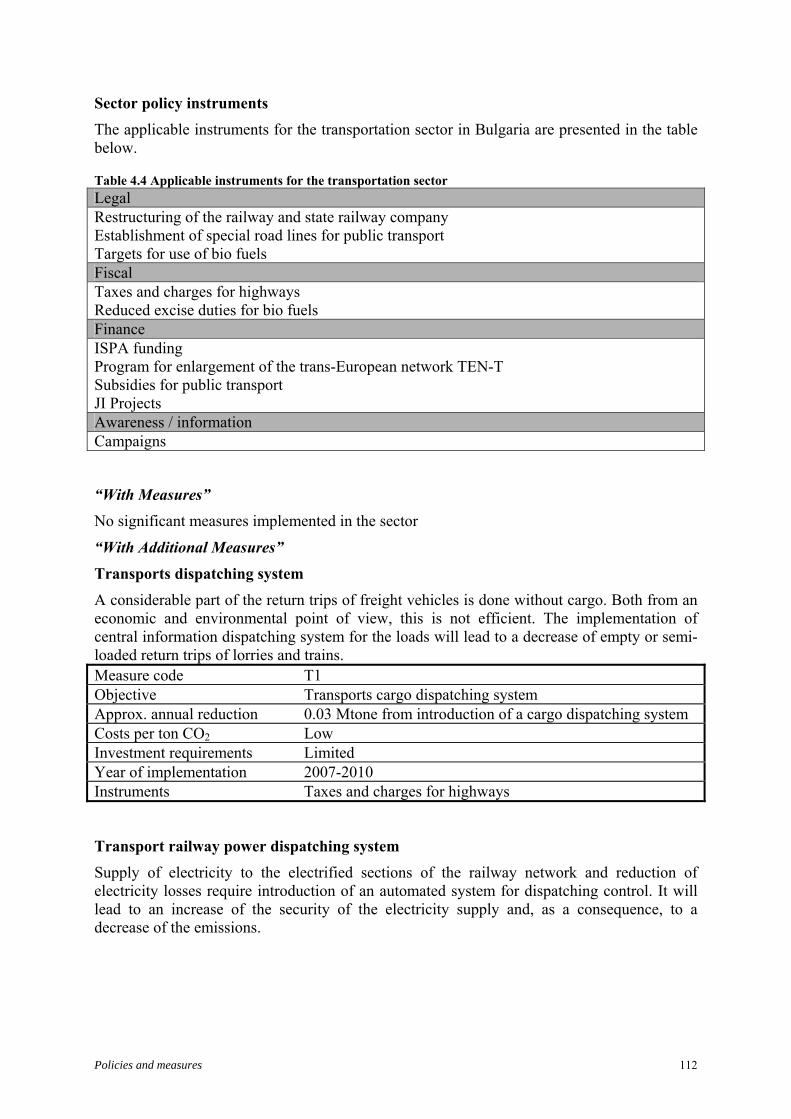
Policies and measures 112
Sector policy instruments
The applicable instruments for the transportation sector in Bulgaria are presented in the table below.
Table 4.4 Applicable instruments for the transportation sector Legal Restructuring of the railway and state railway company Establishment of special road lines for public transport Targets for use of bio fuels Fiscal Taxes and charges for highways Reduced excise duties for bio fuels Finance ISPA funding Program for enlargement of the trans-European network TEN-T Subsidies for public transport JI Projects Awareness / information Campaigns
“With Measures”
No significant measures implemented in the sector
“With Additional Measures”
Transports dispatching system
A considerable part of the return trips of freight vehicles is done without cargo. Both from an economic and environmental point of view, this is not efficient. The implementation of central information dispatching system for the loads will lead to a decrease of empty or semi-loaded return trips of lorries and trains. Measure code T1 Objective Transports cargo dispatching system Approx. annual reduction 0.03 Mtone from introduction of a cargo dispatching system Costs per ton CO2 Low Investment requirements Limited Year of implementation 2007-2010 Instruments Taxes and charges for highways
Transport railway power dispatching system
Supply of electricity to the electrified sections of the railway network and reduction of electricity losses require introduction of an automated system for dispatching control. It will lead to an increase of the security of the electricity supply and, as a consequence, to a decrease of the emissions.

Policies and measures 113
Measure code T2 Objective Transport railway power dispatching system Approx. annual reduction 0.09 Mton from automated dispatching system for Bulgarian
Railways power facilities Costs per ton CO2 Low Investment requirements Limited Year of implementation 2007-2013 Instruments ISPA funding
Program for enlargement of the trans-European network
Modernization of Railways
The consumption of residual oil and electricity for transportation of one cargo unit or passenger at a given distance is much lower that that in the road transportation. There are technical solutions that can lead, to additional reduction of the consumption of oil and electricity. The proposed measures have direct and indirect effects on the increase of the passengers and load flows in the railway transport as well as on GHG emissions reduction. Measure code T3 Objective Modernization of Railway Approx. annual reduction 0.04 Mton from:
Avoiding unnecessary speed changes in railway by improving railway conditions Developing new electrified sections of the railway Recuperation of new electricity trains Implementation of new diesel oil trains
Costs per ton CO2 High Investment requirements Substantial Year of implementation 2007-2013 Instruments Restructuring of the state railway company BDZ Plc
Improving the public transportation, reducing transportation flows in cities and renewing the transport park
The improvement of public transportation and the reduction of transportation flows in cities might contribute to lower GHG emissions from transportation. An increasing share of public transport in total transportation activities can however only is reached when policies are accompanied with instruments which make the use of cars less attractive (e.g. increased fuel or road taxes, introduction of parking taxes, introduction of car-free zones in city centres).

Policies and measures 114
Measure code T4 Objective Improving public transportation, reducing transportation
flows in cities and renewing the transportation park. Approx. annual reduction Not estimated Costs per ton CO2 Low Investment requirements Limited Year of implementation 2007-2013 Instruments Subsidies for public transport
Establishment of special road lines for public transport Campaigns Introduction of parking taxes and car-free zones Improvement of the quality of the accomplishment of the technical examinations
Introduction of bio fuels
The implementation of this measure will lead to reduction of GHG emissions. Bulgaria has the possibility to produce a substantial amount of biomass. Production of bio fuels has a complicated effect on efficiency of the agricultural sector. Process of producing the cereals has two sides according to main goals- foods for people and fuel for vehicles. Measure code T5 Objective Introduction bio fuels Approx. annual reduction Not estimated Costs per ton CO2 Medium Investment requirements Limited Year of implementation 2007-2013 Instruments Lower excise for bio fuels
Indicative targets for use of bio fuels Campaign
4.3.6. Agriculture
Introduction
The technological restructuring and new investment policy of the Ministry of Agriculture and Food will guarantee the food supplies and the positive agricultural trade balance. This will also ensure the competitiveness of the Bulgarian agricultural production. Agricultural organizations will be supported and their role - strengthened in order to achieve market protection at buying up of agricultural production.
Special attention should be paid to retaining of soil fertility through introduction of anti-erosion activities, new methods for soil cultivation, ceased practice of field burning.
Sector policy instruments
The applicable climate policy instruments for the agricultural sector in Bulgaria are presented in the table below.

Policies and measures 115
Table 4.5 Applicable policy instruments for the agricultural sector Legal Setting new standards on nitrogen contents in agricultural products Finance State Agricultural Fund (SAF): subsidies for the introduction of new methods for retaining of soil fertility SAF: low interest loans for construction and rehabilitation of irrigation systems SAPARD R&D Education and training to be financed by SAPARD
“With Measures”
No significant measures implemented in the sector
“With Additional Measures”
Manure management
Manure is one of the most considerable methane sources in agriculture. Therefore all the activities related to manure storage and treatment should take into account the manure type – liquid or solid as well as the technologies for collection and treatment.
The modern manure management practices, not applied in Bulgaria, include: engineering of standardized construction elements for manure disposal facilities, introduction of bulldozer cleaning and transportation of the dry manure in containers and others.
In liquid manure management are used transportation tanks, underground disposal at cattle-breeding farms and poultry-farming sites, separation of manure into liquid and solid fraction at pig-breeding farms, etc. Measure code A1 Objective Manure management Approx. annual reduction 0.07 Mton from composting, alternation of practices and
technologies for collection and storage of liquid and solid manure
Costs per ton CO2 Medium Investment requirements Low Year of implementation 2007-2013 Instruments Investment subsides from the SAF and SAPARD
Education and training of agricultural producers on correct composting of manure (SAPARD)
Fertilization and irrigation
During the last years fertilization was conducted in an uncontrolled manner. The amounts of nitrous fertilizers applied to soils often exceeded the recommended ones. The requirements for quality of production and lower prime costs grew strict due to expanded import of agricultural goods from the neighbouring countries. These products compete successfully with some local productions both for their quality and price. The appropriate fertilization and irrigation are preconditions for competitiveness of local agricultural production and reduction of N2O emissions. Measure code A2

Policies and measures 116
Objective Improved fertilization and irrigation practices Approx. annual reduction 0.17 Mton CО2 eqv. from optimization of the fertilization; Costs per ton CO2 Medium Investment requirements Medium Year of implementation 2007-2013 Instruments Setting standards on nitrogen contents in agricultural
production; Low interest loans for construction and rehabilitation of irrigation systems by SAF Education and training of experts on optimization of fertilization (SAPARD)
Increasing of Carbon sink of arable lands by additional input of the straw residuals
This is a new measure, which will be implemented after EU Directive. The main goal is to increase the content of carbon in soils and raise the quality of shallow layer of arable land. This measure will be in contradiction with the use of cereal straw as a fuel for CHP on biomass.
4.3.7. Waste Management
Introduction
The measures for reduction of GHG emissions to be implemented in this sector are related to management of municipal solid waste.
The typical amount of waste to be disposed at regional landfill sites varies between 50,000 and 100,000 ton per year2. The Governmental policy in this field is directed towards building up a system of 54 regional landfill sites and closing down this landfills which do not meet the legal requirements. With the setting up of these regional landfill sites the environmental friendly waste treatment of all waste generated in the country will be secured.
The analysis of GHG inventory for the last few years shows that the municipal solid waste landfills are the biggest source of methane among all sources of CH4 that are covered by the inventory. As extraction and utilization of landfill gas is not practiced in Bulgaria, all the generated landfill gas is being released in atmosphere.
The baseline emission projection envisages implementation of programs for methane capture and methane flaring. The best practices implementation will allow capture and flaring of 50 % of the methane generated. The energy generated during flaring is not utilized.
The generated electricity from landfill site is received only when the methane is captured. This is an additional measure to the basic scenario.
Sector policy instruments
The applicable policy instruments for Bulgaria waste sector are presented in the table below.
2 Statistical Year Books of NSI

Policies and measures 117
Table 4.6 The applicable policy instruments for the waste sector Legal Purchase obligation for electricity generated from captured methane (SERC) Finance Funds or sources for investments in emission reduction projects (JI, GIS, ISPA)
Scenario “With Measures”
There are not provided technical measures for reduction of landfill methane emissions. In the period 2007-2009 the main activities are harmonizing of the legislation with the European and solving the current tacks about big cities’ waste management.
Scenario “With Additional Measures”
Utilization of the captured methane for production of electricity
The electricity generation from landfill methane is subject to special treatment by the National Electricity Grid. According the Energy Law the Grid operator should purchase all the renewable electricity at preferential prices. As far as methane from the landfills is considered as renewable energy source the selling of electricity is ensured.
The captured methane can be utilized in piston gas motors where electricity is generated. The received electrical energy from the burning of one ton captured methane is expected to be about 4.2 MWh under the assumption that the diesel-generators operate 6 000 hours per year. This utilization of equipment for electricity production means an installed capacity of 19.517 kW. Measure code W1 Objective Utilization of the captured methane for production of
electricity Approx. annual reduction 0.09 Mton from substitution of the electricity production in
power system Costs per ton CO2 Low Investment requirements Limited Year of implementation 2007-2013 Instruments Purchase obligation (SERC)
Joint implementation mechanism ISPA Green Investment Scheme
4.3.8. The status of implementation and Quantitative evaluation of the sectoral policies
In the period 1988 – 2005 Bulgaria has reached significant reduction of the GHG emissions equal to 69.995 Mt, which is about 53 % of the emissions in the basic 1988. Main reasons for the GHG emissions level are:
- intensive application of the legislation in the field of activities, connected with the climate changes;
- successful application of government policies and measures for transition to market economy, industry structure change, privatisation and liberalisation;

Policies and measures 118
- applied policies and measures, particularly directed to GHG emissions limitation;
- energy policy to liberalisation of the energy markets and subsidies removal;
- replacement of the fossil solid and heavy liquid fuels with natural gas and other gaseous fuels;
- energy efficiency increase and increase of the share of produced energy from RES
- increased institutional capacity, engaged with coordination of climate change activities;
- population decrease;
Due to the early termination of the operation of four nuclear units in the end of 2002 and in the end of 2006, and due to the economical and demographic development, increase of the emissions took place in 2003 and 2007,. The rate of increase of the emissions in the years to come will depend on policies and measures, which will be undertaken by the Government.
Although the country has much lower emissions from the admissible, according the Kyoto Protocol, it has potential for additional decrease of GHG emissions. This potential might be realized, in case of extension of implementation of purposive politic for emissions reduction, expressed as implementation of additional measures. The implementation of political decisions and measures set in the Second National Action Plan on Climate Change and the development and implementation of the Third National Action Alan on Climate Change would allow avoiding of part of the projected growth of GHG emissions.
The analysis of the statute in the implementation of the policies and measures for the review period 2006-2008 gives reason for formation of expectations for GHG emissions reduction level for 2010, 2015 and 2020 by sector. The estimates by sector are given in the next tables.
4.3.9. Policies and measures pursuant to Article 2 of the Kyoto Protocol
Activities aimed at promoting decisions by the ICAO and IMO in favour of emissions reduction
The Parties to the Kyoto Protocol have committed themselves to continuing their efforts to limit or reduce emissions from air and sea transports in the framework of the International Civil Aviation Organisation (ICAO) and the International Maritime Organisation (IMO) (to date, quantitative reduction obligations only for Annex 1). To date, neither of the two bodies has approved regulations / procedures for limiting greenhouse-gas emissions.
IMO
The IMO deals with GHG-emissions issues via its Maritime Environmental Protection Committee (MEPC).
The EU Commission has announced that it will propose relevant measures of its own if the IMO fails, by the end of 2011, to make a concrete proposal for ways of including maritime transports in reduction measures. Currently, the EU is having various relevant possibilities studied, including emissions-differentiated port fees, emissions standards, levies and emission trading.
ICAO
Policies and measures 119
The International Civil Aviation Organisation (ICAO) considers environmental aspects within the framework of its Committee on Aviation Environmental Protection (CAEP), which comprises a range of different working groups. To deal with greenhouse-gas issues, the ICAO has also established a Group on International Aviation and Climate Change (GIACC), alongside the CAEP. That group has been in existence since early 2008. A politically high-ranking group, the GIACC turns to the CAEP for advice on technical matters whenever the GIACC's members deem such reliance to be necessary. The group is working toward the aim of developing a strategy, by mid-2009, for limiting aviation-related CO2 emissions.
While the ICAO is working on a CO2-based certification standard, such a standard would not address air-transport growth and would require decades to make an impact, via the composition of aircraft fleets. Along with such technical measures, the CAEP is also considering market-economic instruments. A central focus of such efforts is on linking existing emission trading schemes with mechanisms for offsetting emissions.
4.3.10. Information on minimization of adverse effects (including adverse effects of climate change) on developing countries in the implementation of policies and measures
The implemented and planned for implementation policies and measures have no adverse impact on developing countries.
Republic of Bulgaria’s Roadmap for participation in the international development assistance delineates the country’s geographic priorities for projects sponsorship. States that are geographically closely situated are identified as the most appropriate beneficiaries - Armenia, Former Yugoslav Republic of Macedonia, Moldova, Kosovo, Serbia and Georgia.
Moreover, since the Bulgarian contribution is not large enough to allow the execution of an independent project, the Ministry of Environment and Water has decided to sponsor an “off-the-shelf” project which allows a certain degree of customization.
Taking into consideration Bulgarian foreign policy priorities and a proposal by the Ministry of Finance, the Ministry of Environment and Water contacted United Nations Development program with the goal of identifying a project which fulfils the aims of EU Fast Start Financing initiative.
After a period of prolonged negotiations the project “Bulgarian Fast Start Finance Contribution 2011-2012: Utilizing Bulgarian Experience in the Development of Administrative Capacity for the Conduct of Monitoring, Reporting and Verification of Greenhouse Gas Emissions” was acknowledged as the best available mean of delivering Bulgaria’s FSF contribution.
The main aim of the project is to support the implementation process of the EU Directives 2003/87/EC and 2009/29/EC in Former Yugoslav Republic of Macedonia by utilizing Bulgarian expertise and capitalizing on best practices and lessons learned of Republic of Bulgaria in the field of monitoring, reporting and verification of greenhouse gas emissions as well as emission trading. This will be achieved through direct interaction between the Ministries of Environment in the two countries and information exchange between the national and Bulgarian institutions and experts.
It is expected that the project will contribute to achieving national consensus on the actions and measures that need to be undertaken to address the climate change related issues relevant for the country in regards to the EU ETS on a short and long term. This should also open dialogues on the need for allocation of adequate financial means for realization of the agreed actions and measures.

Policies and measures 120
4.4. Policies and measures no longer in place
All the policies and measures reported in the previous National Communication are still in place. The implementation of the measures reported there continue to contribute to the emissionreductions in the country.
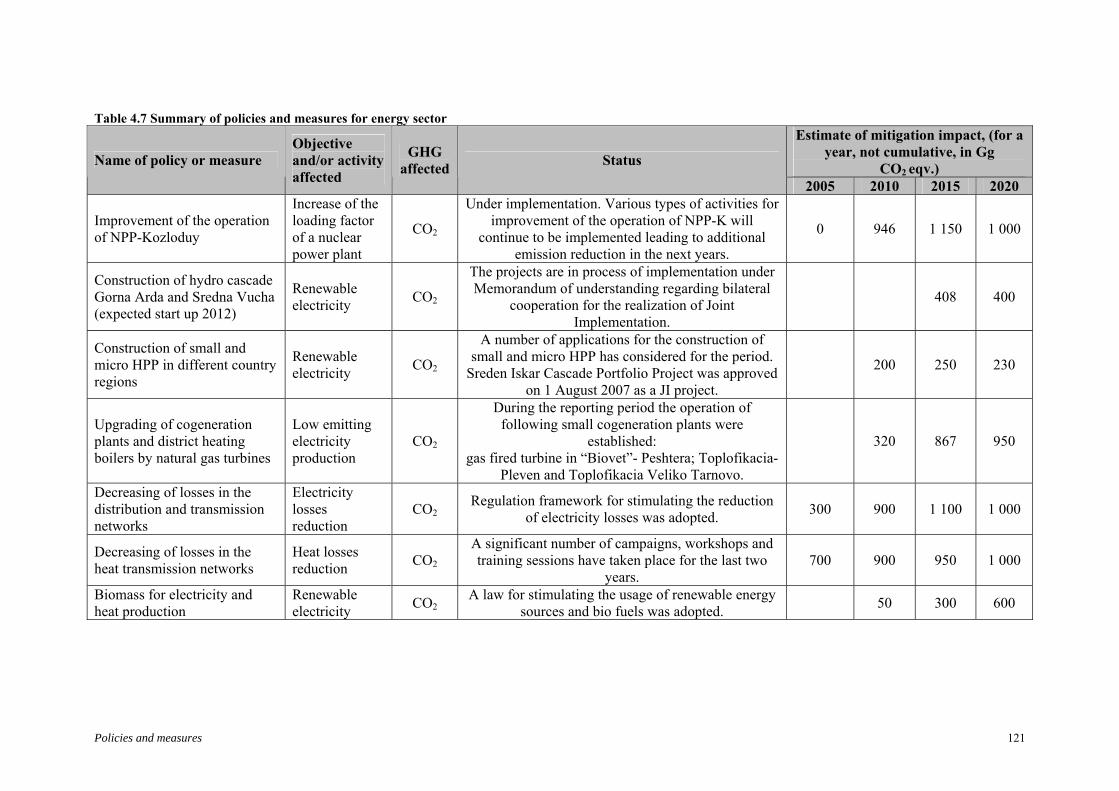
Policies and measures 121
Table 4.7 Summary of policies and measures for energy sector Estimate of mitigation impact, (for a
year, not cumulative, in Gg CO2 eqv.)
Name of policy or measure Objective and/or activity affected
GHG affected
Status
2005 2010 2015 2020
Improvement of the operation of NPP-Kozloduy
Increase of the loading factor of a nuclear power plant
CO2
Under implementation. Various types of activities for improvement of the operation of NPP-K will
continue to be implemented leading to additional emission reduction in the next years.
0 946 1 150 1 000
Construction of hydro cascade Gorna Arda and Sredna Vucha (expected start up 2012)
Renewable electricity
CO2
The projects are in process of implementation under Memorandum of understanding regarding bilateral
cooperation for the realization of Joint Implementation.
408 400
Construction of small and micro HPP in different country regions
Renewable electricity
CO2
A number of applications for the construction of small and micro HPP has considered for the period.
Sreden Iskar Cascade Portfolio Project was approved on 1 August 2007 as a JI project.
200 250 230
Upgrading of cogeneration plants and district heating boilers by natural gas turbines
Low emitting electricity production
CO2
During the reporting period the operation of following small cogeneration plants were
established: gas fired turbine in “Biovet”- Peshtera; Toplofikacia-
Pleven and Toplofikacia Veliko Tarnovo.
320 867 950
Decreasing of losses in the distribution and transmission networks
Electricity losses reduction
CO2 Regulation framework for stimulating the reduction
of electricity losses was adopted. 300 900 1 100 1 000
Decreasing of losses in the heat transmission networks
Heat losses reduction
CO2 A significant number of campaigns, workshops and training sessions have taken place for the last two
years. 700 900 950 1 000
Biomass for electricity and heat production
Renewable electricity
CO2 A law for stimulating the usage of renewable energy
sources and bio fuels was adopted. 50 300 600

Policies and measures 122
Table 4.8 Summary of policies and measures for the industrial sector Estimate of mitigation impact, (for a
year, not cumulative, in Gg CO2 eqv.)
Name of policy or measure Objective and/or activity affected
GHG affected
Status
2005 2010 2015 2020 Reduction of thermal losses in industry
Industrial enterprises
CO2 Discussions with the industry in order to stimulate
voluntary agreement. 80 120 140
Increased use of natural gas in industry by new gas infrastructure
Gas distribution networks
CO2 Gas supply networks are under construction. 50 70 90
Monitoring systems for energy use in industry
Industrial enterprises
CO2
Regulation framework for inquiring industrial energy use is under implementation.
A large number of information campaigns have taken place.
50 70 120
Updating of the steam generation and compressed air plants and reduction of energy consumption
Industrial enterprises
CO2 Not implemented yet 20 25
Introduction of highly-efficient construction machines using diesel fuel (25 % replacement)
Construction machinery
CO2 Not implemented yet 10 30 40
Replacement of part of the fuel by motor-car tires and other combustible waste
Cement production
CO2 Not implemented yet 5 340 400

Policies and measures 123
Table 4.9 Summary of policies and measures for the residential sector and commercial/institutional buildings Estimate of mitigation impact,
(for a year, not cumulative, in Gg CO2 eqv.)
Name of policy or measure
Objective and/or activity affected
GHG affected
Status
2005 2010 2015 2020
Gas supply to households Households and public buildings
CO2
Several gas supply networks are under construction. A number of schools are under gasification. Due to
the high price of gas the residential sector is with low rates.
10 500 2 000 2 500
Installation of solar collectors Households and public building
CO2 Due to substantial need of investment it is still
difficult for implementation. 1 5 15 20
Hybrid and other RES hot water installations
Public building CO2 Due to substantial need of investment it is still
difficult for implementation. 1 20 40
Table 4.10 Summary of policies and measures for the sector agriculture Estimate of mitigation impact,
(for a year, not cumulative, in Gg CO2 eqv.)
Name of policy or measure
Objective and/or activity affected
GHG affected
Status
2005 2010 2015 2020
Manure management Animal farms
CH4 Early stage. SAPARD projects are under implementation. Campaigns, workshops and
training sessions for good practices have taken place
5 30 70
Improved fertilization and irrigation practices
Farms
CH4, N2O
Early stage. Measures 121 and 125 from the Operational programme “Human resources development” for the period 2007-2013 are
under implementation.
20 120 170

Policies and measures 124
Table 4.11 Summary of policies and measures for the transport sector Estimate of mitigation impact, (for a year, not cumulative, in Gg CO2 eqv.)
Name of policy or measure Objective and/or activity affected
GHG affected
Status
2005 2010 2015 2020 Transports cargo dispatching system
Idol traffic reduction
CO2 Cargo dispatching system and intramodal cargo traffic are in process of establishment.
2 20 30
Transport railway power dispatching system
Electricity losses reduction
CO2 The optimization of railway transportation is in early stage of implementation.
5 50 90
Modernization of Railway Electricity and diesel consumption
CO2 The train park was renovated with purchase new trains-. The train speed was optimized by reducing the need for trains to break and accelerate.
2 30 60
Improving public transportation, reducing transportation flows in cities and renewing the transportation park
Traffic in the cities
CO2 Operational programme “Regional development” for the period 2007-2013 and operation 1.5 “Systems for sustainable public transport” is under implementation.
NE NE NE
Introduction bio fuels Trucks and cars
CO2 Not implemented yet. NE NE
Table 4.12 Summary of policies and measures for the waste sector Estimate of mitigation impact, (for a year, not cumulative, in Gg CO2 eqv.)
Name of policy or measure Objective and/or activity affected
GHG affected
Status
2005 2010 2015 2020 Utilization of the captured methane for production of electricity
Waste disposal methane and electricity production
CH4, CO2
29 regional landfills are fully equipped during the period- 2006-2007 with methane capture and utilization systems under the requirements of the landfill Directive 1999/31/EC
2 50 90
Projections and total effect of policies and measures 125
5. PROJECTIONS AND TOTAL EFFECT OF POLICIES AND MEASURES
5.1. PROJECTIONS
5.1.1. Background and scenarios
The most recent GHG projections were elaborated taking in consideration the trends of key macro-economic, technological, demographic and other indicators that determine the economic development of the country.
Projections are based on the following procedures and assumptions:
Analysis of the emissions projections reported in the previous National Communications the Second National Action Plan on Climate Change and the National Allocation plan for participation in European GHG emission allowances trading scheme.
Accounting for the actual GHG emissions and the underlying reasons for the trends (national and external factors).
Sectoral plans for energy, agriculture, forestry, industry and waste
New rules and Directives after accession of Bulgaria to the EU
Accounting for the influence of the world economic crisis 2008-2009 on the GHG emission forecasts.
As a result, three scenarios for GHG emission projections until 2020 were developed, analyzed and compared:
“without measures” scenario (basic)
“with measures” scenario
“with additional measures” scenario
The “without measures” scenario is based on the assumption for intensive economic development with emphasis on energy intensive technologies and limited application of energy efficiency improvement measures in industry and agriculture. This scenario was originally developed in 1994 (before Bulgaria ratified the UNFCCC) for the preparation of the First National Communication. It was considered “business-as-usual” scenario, nonetheless it is not a “frozen efficiency” such. It incorporates all policies and measures that have been adopted before 1994, thus making it more “likely-to-be” scenario. GHG projections for the scenario have been based on a limited number of emission sources, reflecting the actual IPCC Inventory Guidelines for that period.
This scenario had essential meaning during development of the IV National Communication on Climate Change. As whole considerably higher GHG emissions levels were reached in it. Actually the implemented policies and measures before 1995 lead to significant change in GHG emissions growth rates. The main drivers of the projections were changed and the influence of energy-saving measures in industries, modernization and restrictive measures in the function of large combustion plants increased in the next period.
To assure comparability between the three scenarios, based on the forecasted in 1994 macroeconomic indicators, production volumes, activity data and emission factors the emissions forecast in “without measures” scenario have been thoroughly revised. Essentially it remained

Projections and total effect of policies and measures 126
outside the parameters for comparison of effects on implemented policies and measures. In other words, the economy of the country and the society started along a new way in its development.
The “with measures” projection encompasses currently implemented and adopted policies and measures,. It envisages a growth rate of electricity demand by 55 % for the period 2005-2020. This scenario projects relevant measures in industry sector and residential and commercial/service sectors, while the rest of the sectors rely on already applied before 2007 measures.
The key macroeconomic and energy characteristics of this scenario are provided in methodology section
This projection integrates the assumption for increase in annual electricity export from 4,200 up to 7,000 GWh for the period after 2006.
The “with additional measures” scenario comprises planned for period after 2007 policies and measures for GHG mitigation. While in the “with measures” scenario the measures are more generally referring to environmentally friendly development, this scenario is more concentrated on the specific GHG mitigation measures and policies in the power sector and renewables.
The emission analysis address mainly the period 2005-2020, for the “with measures” and “with additional measures” scenarios.
These projections were compiled on the basis of 2007 data (Inventory submission 2009) as long as the work was carried out in 2009 when only 2007 data were available.
5.2. Sectoral forecasts
5.2.1. Energy
GHG emissions projections in the energy sector have some particularities, connected with the different structures, which are used during GDP composition and definitions for energy sector in GHG inventories. Especially duplicating of part of the sub-sectors in the two types of structures is observed. For example in the GDP sector Industry is included in Energy sector in the inventory. Usually macro economical projections are made for the sub-sectors, transport, utilities, services while all they are part of the energy sector in the inventory. That is why in some EU countries additional classification is introduced to differentiate the two parts of industrial activities – activities with fossil fuel combustion and activities connected with technological processes in the industrial production.
On Figure 5.1 and Table 5.1 is given projection for total GHG emissions expressed in Gg CO2 eqv. for Energy sector until 2020. The applied until 2008 measures are accounted. All the emissions from fuels combustion and fugitive emissions are summed there.
Table 5.1 Emission projections for sector Energy, СО2 eqv., Gg 2005 2006 2007 2008 2009 2010 2015 2020 With measures 51,228 52,287 55,944 57,472 51,977 51,094 58,709 75,655 With additional measures 51,228 52,287 55,944 57,472 50,622 48,803 54,864 69,114
The GHG emissions of the sector by gas expressed in Gg are given in the Table 5.2 (CO2), Table 5.3 (CH4) and Table 5.4 (N2O).

Projections and total effect of policies and measures 127
Table 5.2 CO2 emission projections for sector Energy, Gg
2005 2006 2007 2008 2009 2010 2015 2020
With measures
48,921 49,900 53,389 54,846 49,603 48,760.4 56,027 72,199
With additional measures
48,921 49,900 53,389 54,846 48,310 46,573 52,358 65,956
Table 5.3 CH4 emission projections for sector Energy, Gg
2005 2006 2007 2008 2009 2010 2015 2020
With measures
92 95 102 104 94 93 107 137
With additional measures
92 95 102 104 92 89 100 126
Table 5.4 N2O emission projections for sector Energy, Gg
2005 2006 2007 2008 2009 2010 2015 2020
With measures
1.23 1.25 1.36 1.39 1.26 1.24 1.42 1.83
With additional measures
1.23 1.25 1.36 1.39 1.23 1.18 1.33 1.68
Figure 5.1 Emission projections for sector Energy, СО2 eqv., Gg
0
10,000
20,000
30,000
40,000
50,000
60,000
70,000
80,0002005
2006
2007
2008
2009
2010
2011
2012
2013
2014
2015
2016
2017
2018
2019
2020
With additional measures With measures
The combined effect of the measures in power sector, industry, transport, agriculture, residential sector and services is given in the above GHG emission projections.

Projections and total effect of policies and measures 128
On Figure 5.2 and Table 5.5 is given projection for total GHG emissions expressed in Gg CO2 eqv. for a general energy sector including Energy industries, Manufacturing industries and construction, Agriculture, Residential and Fugitive emissions. The plans for developments of the power generation for this scenario are accounted.
Table 5.5 Projection of emissions for General Energy sector, СО2 eqv., Gg 2005 2006 2007 2008 2009 2010 2015 2020 With measures 42,789 43,177 47,322 48,469 45,561 44,650 51,880 67,604 With additional measures 42,789 43,177 47,322 48,469 44,591 43,254 48,968 61,494
“With measures” scenario
Herein only the schedule for decommissioning of old and commissioning of new power units is given as follows:
Units 3 and 4 of NPP Kozloduy were decommissioned in 2006.
New lignite fired units 300 MW each are to be commissioned in TPP Maritsa East 1 as follows: 2010 – 1x300 MW; 2011 – 1x300 MW.
Upgrading of the heat production capacities in Sofia with gas turbines as follows: 2013 – 1x150 MW, 2014-150 MW.
Commissioning of renovated 100 MW unit fuelled by imported coal in 2009 in TPP Ruse.
Commissioning of new HPP Tzenkov kamak 80 MW – 2011.
New NPP in Belene – 1,000 MW in 2015 and 1,000 MW in 2017.
New HPP cascade Gorna Arda – 160 MW in 2020.
This scenario encompasses measures for entire rehabilitation of old units and improved environmental performance. GHG emissions mitigation could be expected due to the introduction of renewable energy sources (including Hydro Power), safe operation of NPP units after rehabilitation, and expansion of heat generation units in Sofia.

Projections and total effect of policies and measures 129
Figure 5.2 Projection emissions for General Energy sector, СО2 eqv., Gg
0
10,000
20,000
30,000
40,000
50,000
60,000
70,000
80,000
2005
2006
2007
2008
2009
2010
2011
2012
2013
2014
2015
2016
2017
2018
2019
2020
With additional measures With measures
The analysis of Figure 5.2 shows, that these sectors maintains share of up to 90 % of the energy fossils fuel emissions, i.e. only 10 % refer to sub-sectors outside the general energy sector (the activities in transportation, services and finance sub-sectors.
Scenario “with additional measures”
The scenario “with additional measures” covers the planned measures, decrease of electricity export and increased use of renewable.
The main differences between the “with measures” and “with additional measures” scenarios are in the demand growth and construction schedule:
Electricity demand increases by 10.8 % for the period 2005 – 2020.
New NPP Belene – 1,000 MW in 2017 and 1,000 MW in 2019.
New HPP Cascade Gorna Arda – 160 MW in 2020.
Upgrading of heating installations in Sofia with gas turbines as follows: 2015 – 1x150 MW, 2016-150 MW.
In the period after 2020 is projected introduction of 1 300 MW lignite fired powers. Obviously they will be problematic for GHG emissions reduction.
In this scenario the share of general energy subsector is of the order of 90 % of the total emissions of Energy sector (Figure 5.1 and Figure 5.2). This shows the influence of the additional measures in the general energy subsector, which are determinative for GHG emissions reduction.
Comparison between scenario “With measures” and scenario “With additional measures”
Both the “with additional measures” and “with measures” scenarios use different projection for final energy demand. As a result the final GHG emissions for the “with additional measures” scenario are on about 8 % lower.

Projections and total effect of policies and measures 130
5.2.2. Industry
The emissions from industrial processes include mainly ferrous industry, chemistry, building materials, food and beverage industry. Figure 5.3 and Table 5.6 provide emission trends for the period from 2005 until 2020 for total GHG emissions expressed in Gg CO2 eqv. , including only for so called process emissions.
Figure 5.3 Projections of process GHG emissions in Industry, СО2 eqv., Gg
0.00
1,000.00
2,000.00
3,000.00
4,000.00
5,000.00
6,000.00
7,000.00
8,000.00
9,000.00
10,000.00
2005
2006
2007
2008
2009
2010
2011
2012
2013
2014
2015
2016
2017
2018
2019
2020
With additional measures With measures
The growth of process emissions in this scenario is not high and at the end of period at 2020 they reach the level of 2008. The picture for total Industrial Process emissions (Figure 5.3) is almost the same.
Table 5.6 Total emission projections for sector Industrial Process,СО2 eqv., Gg
2005 2006 2007 2008 2009 2010 2015 2020
With measures
6,529 6,794 7,106 7,278 6,268 6,056 6,630 8,639
With additional measures
6,529 6,794 7,106 7,278 5,572 5,168 5,823 7,312
The GHG emissions by gas expressed in Gg are given in the Table 5.7 (CO2), Table 5.8 (CH4) and Table 5.9 (N2O).
Table 5.7 CO2 emission projections for sector Industrial Process, Gg
2005 2006 2007 2008 2009 2010 2015 2020
With measures
5,099 5,234 5,492 5,625 4,845 4,681 5,124 6,677
With additional measures
5,099 5,234 5,492 5,625 4,306 3,994 4,500 5,651
Comparison of scenarios “with measures” and “with additional measures”

Projections and total effect of policies and measures 131
The increase in the scenario “with measures” continues in period 2012-2020 and the difference with the “with additional measures” scenario becomes 10-15 %. After 2015 the emissions are expected to increase sharply for the both scenarios.
Non-energy emissions of CH4 and N2O are much lower compared to CO2 emissions.
Table 5.8 CH4 emission projections for sector Industrial Process, Gg
2005 2006 2007 2008 2009 2010 2015 2020
With measures
2.21 2.12 1.91 1.96 1.69 1.63 1.78 2.32
With additional measures
2.21 2.12 1.91 1.96 1.50 1.39 1.57 1.97
Table 5.9 N2O emission projections for sector Industrial Process, Gg
2005 2006 2007 2008 2009 2010 2015 2020
With measures
3.20 2.90 4.27 4.37 3.77 3.64 3.98 5.19
With additional measures
3.20 2.90 4.27 4.37 3.35 3.11 3.50 4.39
5.2.3. Renewable energy sources
RES usage does not bring GHG emissions. Scenarios for their development are part of the scenarios for GHG emissions projections of the energy sector as follows:
“with measures” – minimum scenario with RES;
“with additional measures” – maximum scenario with RES
RES participation is shown in the projections for GHG emissions from the Energy sector. The RES electricity production share in the projections ranges between 10.1 % after 2010 and 14.2 % in 2020.
5.2.4. Transport
On Figure 5.4 and Table 5.10 are shown GHG emissions projections for the two scenarios for GHG emissions reduction.
“With measures” scenario
In the accounted period are implemented part of the measures, mostly for the railway transport. The report shows some delay, due to organization failings and lack of resource security.
In this scenario is abandoned the conception for quick and sharp growth of the transport, which was actual for the period 2002-2004. The measures and objects in the transport are on a large scale and it leads to deeper planning and projecting. The GHG emissions growth for the period 2010-2020 is 24 %.

Projections and total effect of policies and measures 132
Figure 5.4 Projected GHG emissions from sector Transport, Gg CO2 eqv.
0
1,000
2,000
3,000
4,000
5,000
6,000
7,000
8,000
9,000
10,000
2005
2006
2007
2008
2009
2010
2011
2012
2013
2014
2015
2016
2017
2018
2019
2020
With additional measures With measures
Table 5.10 Projected GHG emissions from sector Transport, Gg CO2 eqv. 2005 2008 2009 2010 2015 2020 With additional measures 8,208 8,652 5,796 5,320 5,605 7,229 With measures 8,208 8,652 6,127 6,156 6,491 7,635
“With additional measures” scenario
The projections for this scenario include the planned measures, which are not started yet in the accounted period 2007-2009. In the period 2010-2020 the growth of the emissions on this scenario is 35.9 %.
5.2.5. Services
On Figure 5.5 and Table 5.11 are shown projections for GHG emissions for the two scenarios for GHG emissions reduction.
“With measures” scenario
In the accounted period are implemented measures for the main parts of the sector: tourism, trade, public utilities, health services and education, the bank sector is shown as a separate position.

Projections and total effect of policies and measures 133
Figure 5.5 Projection of total GHG emissions from sector Services, Gg CO2 еqv.
0
50
100
150
200
250
2005
2006
2007
2008
2009
2010
2011
2012
2013
2014
2015
2016
2017
2018
2019
2020
With additional measures With measures
Table 5.11 Projection GHG emission from sector Services, Gg CO2 еqv. 2005 2008 2009 2010 2015 2020 With additional measures 133 192 129 126 160 214 With measures 133 192 138 137 160 198
“With additional measures” scenario
Projections in this scenario include planned measures, which are not started completely in the accounted period 2007-2008. At the end of the period – 2020, the growth of the emissions on this scenario is 11.4 %.
5.2.6. Financial sector
On Figure 5.6 and Table 5.12 are shown projections for GHG emissions for the two scenarios for GHG emissions reduction.
“With measures” scenario
In this scenario is observed stable growth for the whole projected period. The projection shows, that in the beginning of 2012 the crisis will be overcame completely.

Projections and total effect of policies and measures 134
Figure 5.6 Projection GHG emission from sector Financial, Gg CO2 еqv.
0
50
100
150
200
250
2005
2006
2007
2008
2009
2010
2011
2012
2013
2014
2015
2016
2017
2018
2019
2020
With additional measures With measures
Table 5.12 Projection of total GHG emissions from sector Financial, Gg CO2 еqv. 2005 2008 2009 2010 2015 2020 With additional measures 97 159 106 104 132 177 With measures 97 159 152 151 177 218
”With additional measures” scenario
The analysis of the emissions on this scenario shows reduction of the order of 18.8 %, which is constant for each year of the projected period.
In the both scenarios the GHG emissions are very small, which is typical for such type of activity. From the other side here is potential for emissions reduction, especially in combination with energy efficiency measures.
5.2.7. Agriculture
The main methane sources are enteric fermentation and manure management, which account for more than 95 % of the emissions in this sector.
On Figure 5.7 and Table 5.13 are shown the projections of total GHG emissions for the two scenarios for GHG emissions reduction.

Projections and total effect of policies and measures 135
Figure 5.7 Projection GHG emission from sector Agriculture, Gg CO2 еqv.
0
1,000
2,000
3,000
4,000
5,000
6,000
7,000
8,000
9,000
10,000
2005
2006
2007
2008
2009
2010
2011
2012
2013
2014
2015
2016
2017
2018
2019
2020
With additional measures With measures
Table 5.13 Total emission projections for sector Agriculture, СО2 eqv., Gg.
2005 2006 2007 2008 2009 2010 2015 2020
With measures
5,075 4,973 5,030 6,266 6,116 6,146 7,124 8,864
With additional measures
5,075 4,973 5,030 6,266 5,697 5,504 6,144 7,434
The GHG emissions by gas expressed in Gg are given in the Table 5.14 (CH4) and Table 5.15 (N2O).
Table 5.14 CH4 emission projections for sector Agriculture, Gg.
2005 2006 2007 2008 2009 2010 2015 2020
With measures
93.3 93.7 91.2 113.6 110.9 111.4 129.1 160.7
With additional measures
93.3 93.7 91.2 113.6 103.3 99.8 111.4 134.8
Table 5.15 N2O emission projections for sector Agriculture, Gg.
2005 2006 2007 2008 2009 2010 2015 2020
With measures
10.05 9.69 10.05 12.52 12.22 12.28 14.23 17.71
With additional measures
10.05 9.69 10.05 12.52 11.38 11.00 12.27 14.85

Projections and total effect of policies and measures 136
Comparison of “With measures” scenario with “With additional measures” scenario
The comparison between the two scenarios shows the close level of the GHG emissions at the end of the projecting period – 16 % difference.
It must be noticed, that the actions in this sector are significantly more realistic than the picture presented in the 4-th National Communication on climate changes. This results in almost double reduction of the projected emissions level in this sector.
5.2.8. Waste
It is expected that the quantity of generated municipal waste will increase because of the economical growth, incomes rising and household’s consumption. Nevertheless might be projected stabilization of the quantity of the municipal waste as a result of the range expansion of the separate collecting system, stimulation of recycling and utilization and more exact accounting and measurement at the disposal sites.
“With measures” scenario
“With measures” scenario does not exhaust the whole potential for GHG emissions reduction in the sector.
Figure 5.8 Projection of total GHG emissions from sector Wastes, Gg CO2 еqv.
0
2,000
4,000
6,000
8,000
10,000
12,000
14,000
2005
2006
2007
2008
2009
2010
2011
2012
2013
2014
2015
2016
2017
2018
2019
2020
Year
Gg
With measures With Additional Measures

Projections and total effect of policies and measures 137
Table 5.16 Total emission projections for sector Wastes, СО2 eqv., Gg.
2005 2006 2007 2008 2009 2010 2015 2020
With measures
8,141 7,827 7,658 8,271 8,601 8,773 10,776 12,673
With additional measures
8,141 7,827 7,658 8,041 8,121 8,121 8,534 9,655
The GHG emissions by gas expressed in Gg are given in the Table 5.17 (CH4) and Table 5.18 (N2O).
Table 5.17 CH4 emission projections for sector Waste, Gg
2005 2006 2007 2008 2009 2010 2015 2020
With measures
381 366 358 386 402 410 503 592
With additional measures
381 366 358 376 379 379 399 451
Table 5.18 N2O emission projections for sector Waste, Gg
2005 2006 2007 2008 2009 2010 2015 2020
With measures
0.47 0.47 0.47 0.50 0.52 0.53 0.66 0.77
With additional measures
0.47 0.47 0.47 0.49 0.49 0.49 0.52 0.59
“With additional measures” scenario
Obviously this scenario allows to be made an additional reduction of the GHG emissions in the range 4-32 % for the projected period.
5.2.9. Projections of total GHG emissions and total effect of policies and measures
The total GHG emissions are calculated as a sum of all emissions Solvent and other product use, and LULUCF sinks are not included in the totals.
Comparison of the “with additional measures” scenario with the “with measures” one reflects the mainly the total effect of measures in the energy sector described above. As a result, the total emission reduction is in the range 6-12 %, with the reduction peak expected in the end of period.
The forecasted aggregated emissions for the two scenarios reflect the described sectoral measures for abatement of emissions and GHG reduction. They are shown in terms of CO2 equivalent given in Table 5.19 and Figure 5.9.
Comparison of “with addition measures” and “with measures” scenarios reveals too certain tendency for increase of emissions in the period 2007-2020 up to 25 - 40 %.

Projections and total effect of policies and measures 138
Figure 5.9 Aggregated total GHG Emissions, Gg CO2 eqv.
010,00020,00030,00040,00050,00060,00070,00080,00090,000
100,000110,000120,000
2005
2006
2007
2008
2009
2010
2011
2012
2013
2014
2015
2016
2017
2018
2019
2020
With measures With Additional Measures
Table 5.19 Aggregated total GHG Emissions, Gg CO2 eqv.
2005 2006 2007 2008 2009 2010 2015 2020
With measures
70,973 71,881 75,739 79,287 72,963 72,070 83,238 105,831
With additional measures
70,973 71,881 75,739 79,057 70,012 67,596 75,364 93,514
Figure 5.10 Total CO2 emissions without LULUCF, Gg
0
10,000
20,000
30,000
40,000
50,000
60,000
70,000
80,000
90,000
2005
2006
2007
2008
2009
2010
2011
2012
2013
2014
2015
2016
2017
2018
2019
2020
Gg
With measures With additional measures

Projections and total effect of policies and measures 139
Table 5.20 Total CO2 emissions without LULUCF, Gg.
2005 2006 2007 2008 2009 2010 2015 2020
With measures
54,020 55,134 58,881 60,472 54,448 53,441 61,151 78,876
With additional measures
54,020 55,134 58,881 60,472 52,616 50,568 56,858 71,607
Figure 5.11 Total CH4 emissions without LULUCF, Gg
0
100
200
300
400
500
600
700
800
900
1,000
2005
2006
2007
2008
2009
2010
2011
2012
2013
2014
2015
2016
2017
2018
2019
2020
Gg
With measures With additional measures
Table 5.21 Total CH4 emissions without LULUCF, Gg.
2005 2006 2007 2008 2009 2010 2015 2020
With measures
568 557 553 606 609 616 741 893
With additional measures
568 557 553 596 576 569 611 713

Projections and total effect of policies and measures 140
Figure 5.12 Total N2O emissions without LULUCF, Gg
0.00
5.00
10.00
15.00
20.00
25.00
30.00
2005
2006
2007
2008
2009
2010
2011
2012
2013
2014
2015
2016
2017
2018
2019
2020
Gg
With measures With additional measures
Table 5.22 Total N2O emissions without LULUCF, Gg.
2005 2006 2007 2008 2009 2010 2015 2020
With measures 14.96 14.31 16.14 18.79 17.77 17.69 20.30 25.51
With additional measures
14.96 14.31 16.14 18.78 16.45 15.78 17.62 21.51
The results from the GHG emissions projections for the both scenarios show growth of the absolute values of the emissions for the period 2005-2020. The total growth of the GDP is the driver for this growth. The applied measures however considerably reduce the GHG emissions growth especially in the scenario with additional measures. In spite of all the tendency does not turn, i.e. the trend remains positive in contrast to other countries in EU, where it is negative.
Both the with measures and the with additional measures scenarios show that country will meet its obligation for the first Kyoto period. The AAU of the country, according to the IRR of the UN FCCC Secretariat is well below the total emissions for the period 2008 – 2012 will have available for International Emissions Trading more than 220 million AAU, that could be sold in the frame of the Green Investment Scheme.
The total effect of the additional policies and measures that would be implemented within 2009 – 2020 is about 12 % emission reduction. Nevertheless there is no significant incentives to implement the additional measures as the country will meet its possible 20 % reduction target for 2020.
Only in case if a legally binding international agreement is approved in the near future, and Bulgaria, as EU member state, will have to accept 30 % reduction target for 2020, the country will need to implement additional measures.
Nevertheless the EU membership require from the country to implement significant number of additional mitigation measures in the frame of the Burden sharing, and Bulgaria will achieve additional emission reduction, that may result in a level of 40 %. Unfortunately that high emission reduction will result in significant decrease of the GDP and population incomes, compared to the with measures scenario.

Projections and total effect of policies and measures 141
5.3. Supplementary relating to mechanisms under Article 6, 12 and 17, of the Kyoto Protocol
According to the Kyoto Protocol reporting guidelines, each Annex I Party shall provide information on how its use of the Kyoto Protocol mechanisms is supplemental to domestic action, and how its domestic action thus constitutes a significant element of the effort made to meet its quantified limitation and reduction commitments under Article 3, paragraph 1.
Bulgaria as an Annex I Party of the UN FCCC and a country with economy in transition, receives financial and technological support, mainly within the framework of the Joint Implementation (JI) mechanism.
The Joint Implementation mechanism is an instrument, based on projects aimed to encourage technology transfer for profitable GHG emission reductions for Annex I countries.
Bulgaria is amongst the countries, which host JI projects, according to Article 6 of the Kyoto Protocol at UNFCCC. As a result, the country has already gained experience in various aspects of the JI mechanism, amongst which: Memorandums of understanding/Cooperation Agreements were concluded with other Annex I countries, consultancy on the possibilities for realization of JI projects was implemented, procedures for support and approval of JI projects on both Track 1 and Track 2 were adopted, 26 JI projects were approved (25 on Track 1 and 1 on Track 2), transactions of verified emission reductions were made to 15 of the projects.
The International Emission Trading Mechanisms Department at the Climate Change Policy Directorate within MOEW is responsible for the application of the flexible mechanisms of the Kyoto Protocol and for the execution of the procedures for assessment, approval and administration of JI projects in Bulgaria.
The use of the JI mechanism in Bulgaria started in 2000 with the establishment of a JI mechanism unit as an independent structure in the State Agency for Energy Efficiency under the direct supervision of the Ministry of Environment and Waters.
The legislation on JI projects in Bulgaria includes the Laws on ratification of the UNFCCC and the Kyoto Protocol, the Environmental Protection Act and the national guidelines for approval of JI projects under Track 1 and Track 2 of the mechanism. Since the adoption of the national guideline for approval of JI projects under Track 1 in April 2010, Memorandums of understanding/ Cooperation Agreements, with particular countries, are no longer a necessary condition for approval of new projects. The Track 1 national guideline allows every Annex I country to be a buyer of projects’ emission reductions.
26 projects were approved and most of them have already started. The execution of those projects may lead to greenhouse gases’ emission reduction up to 8 mln. tons carbon dioxide equivalent for the period 2008-2012. This quantity of emission reductions is about 1.2 % of the Bulgaria assigned amount.
5.4. Methodology used for the presented GHG emission projections
The development of projections for GHG emissions is a process that is accomplished in two main stages:
STAGE 1 – preparation of macroeconomic projection for the main economic indicators – GDP and population; preparation of branch projections for the above economic indicators
In this stage the projection includes formal, historical, topical and expert evaluations, which form series of decisions. After their summary occur different versions, which are base for choice of certain projection.

Projections and total effect of policies and measures 142
The process of preparing of branch macroeconomic projections goes in parallel with forming of general projection for the national economy.
A stable real GDP growth of 5-6 % per year was observed in the period 2002-2008. Basic driver of this growth was the development of the export, which was motivated by the increase of the integration in the frames of EU.
The established macroeconomic stability and Bulgaria’s participation in the EU sharply improved the business climate in the country and led to unrecorded increase of the investments in the country. They were expected to reach 30 % of GDP at the end of 2008.
The increased credit activity led to considerable growth of the consumption, as the actual household consumption growth is higher than the GDP growth. This gives reason for projection of triple growth of the population’s nominal incomes until 2020.
The export of goods and services was expected to develop favourably and to reach 90 % of GDP at the end of the period compared to 58 % in 2004.
Despite all, improvement of the trade balance, which shortage is not expected to be fewer than 18 % of GDP, is not expected until 2010.
The accounted high inflation in 2007 contributes to increase of the inflation in 2008 too. The higher international oil and foodstuff prices in the beginning of 2008 are added too.
This comparatively favourable situation began to worsen at the end of 2008 with the beginning of the world financial and economical crisis. It leads to radical changes in analyses and evaluations of the world organizations. The development of the crisis affected very much some of the new members of the EU and the former members were affected too. In 2008 the main economics of the world entered into recession, which didn’t pass over Bulgaria. The progress of the crisis in Bulgaria showed some characteristics that make it different from countries with similar economics-Hungary, Romania, Slovakia and others. They are:
stability of the financial system
clearly expressed economical character of the crisis
about 20-30 % decrease of the production, services and consumption
slower rates in negative effects progress - unemployment, getting into debts, credit, activities reduction and others.
In these conditions the projection on this stage accounts the influence of the crisis.
In Table 5.23 are given GDP projections for the scenarios denominated to prices of 2001. The scenarios were developed just in the beginning of 2009. The “with measures scenario” reflects the official forecast of the Government for GDP growth of about 2.5 % in 2009. Another macroeconomic forecast predicts an GDP decrease within two years on total about 7 %. The reality turn to be close to the “with measures scenario”.
Table 5.23 GDP projection, mln lv., 2001, 2005 2007 2008 2009 2010 2015 2020 “with additional measures scenario” 37,322 42,129 44,663 42,740 41,507 55,530 76,429 “with measures scenario” 37,322 42,129 44,663 45,731 46,611 67,015 99,179

Projections and total effect of policies and measures 143
Above average rates are quite different from all forecasts developed before end of 2008 (before the beginning of the world crisis).
The sectoral structure of GDP assumes the restructuring tendencies to match the development of the sectors in the western countries, which means a slight decrease of the shares of industry, agriculture and forestry and increased share of services and transportation.
The second set of key inputs was the population in 2005 (7.67 million) and its growth rate. In line with the official projections of the Bulgarian Academy of Sciences, the population growth rate was assumed to decline by 3.9 % between 2005 and 2010 and 6.8 % between 2010 and 2020. Consequently, total population drops to about 6.9 million by 2020. By implication, per capita GDP more than doubles over the entire planning horizon.
The analysis of the above scenarios shows, that the implementation of the with measures and with additional measures scenarios is realistic. In the with measures scenario, the GDP growth is not much affected by the implemented measures for GHG emissions reduction, which do not influence essentially on the grounded high rates of crisis overcoming and recovery of the economy to the levels before it. In this sense there is certain diversion from the climate change policy. But in the with additional measures scenario GDP growths are projected, which account all provided and planned measures.
STAGE 2
In this stage the projections are made by sectors. The main attention is directed to projections of the produced output and the GHG emissions while the macroeconomic projections are put aside.
5.4.1. Energy
As the inventory results indicate, the most significant contributors to GHG emissions in Bulgaria are the energy production sector and the energy-intensive sectors of the national economy. Therefore, the main efforts in the GHG emission forecasting are directed towards these sectors, while the studies that address non-energy sectors are more limited.
A methodology that allows scrutinizing the interrelationships between macroeconomic development, sectoral development (including the energy sector), and GHG emissions is used. The main software used is the ENPEP package that has been used in the all National Communications of Bulgaria for the purposes of projecting GHG emissions. The following program modules of ENPEP were used: MACRO, DEMAND, BALANCE, WASP and IMPACTS.
The macroeconomic data are key inputs to the MACRO module. The DEMAND module estimates the useful and final energy demand by sector, including households, industry, services and transport.
The BALANCE module is a non-linear equilibrium model that matches the demand for energy with available resources and technologies. The purpose of the BALANCE module is to determine the equilibrium of the supply/demand balance for the study period. Its basic part is the energy network.
The general assumptions used are that the energy network is presented as a combination of sectoral and level presentation of data. The network is simplified as to represent only some of the sectors and some of the levels in a detailed way..
The WASP model (Vienna Automatic System Planning Package) is used to determine the least-cost generating system expansion, which adequately meets the demand for electrical power, subject to a number of user-defined constraints. The present value of total system costs, including the capital cost of new generating units, fixed and variable operation and maintenance

Projections and total effect of policies and measures 144
(O&M) costs, fuel costs, and costs of undelivered energy, is used to measure the economic performance of alternative expansion plans.
The IMPACTS module of ENPEP calculates the residuals (air pollutants, water pollutants, solid waste, and land use) of the energy system. It takes the energy system design from BALANCE and WASP, and calculates the residuals based on fuel consumption and any environmental control technologies in use.
The methodology for GHG emissions projection in the energy sector is based on the following basic projections:
final energy consumption projection;
projection for auxiliaries consumption change and losses for transportation and distribution;
projection for the energy import and export
The abovementioned projections compose the projection for the power production of the country.
For the energy final consumption projection are used three approaches:
1. With energy efficiency model. It proceeds from the projection for energy intensity of consumption and reaches to energy consumption projection.
2. With searching model. This model is a system of econometrical models of the consumption as GDP functions, investments, price, population and others. The present report is developed mainly according to this approach.
In the period 2004-2008 the National electricity company has worked out 3 least cost plans for development of the power system. In this report the last plan – from 2008 is accepted. The gross electricity consumption is projected there without accounting the current crisis. Because of that some corrections of the final electricity consumption in the period 2009-2011 had to be made.
In Table 5.24 are shown two versions of updated projection for gross electricity consumption.
Table 5.24 Forecast for gross electricity demand, GWh 2005 2006 2007 2008 2009 2010 2015 2020 With measures 36,589 37,88 39,12 48,469 45,561 44,650 51,880 67,604 With additional measures 36,589 37,88 39,12 48,469 44,591 43,254 48,968 61,494
5.4.2. Industry
The analysis of the industry GHG emissions has some methodological features, relevant to the aggregation of the included processes. This means that on macroeconomic level in the industry are included energy and industrial process emissions. These two parts of the industrial emissions have different nature – while the energy emissions are result of fuel combustion, the industrial process emissions are technological emissions inherent to a certain process.
It is methodically correct the emissions from the sector to be projected as a total of the above two parts. The rates of these two parts are different in principle, because they are based on different macro economical projections. While for the industrial process emissions is used the growth of the GVA of the industry, for the fuel combustion emissions the projects for the energy demand are leading.

Projections and total effect of policies and measures 145
In Table 5.25 are shown industry GVA projections reduced to prices from 2001.
Table 5.25 GVA projection in sector Industry, mln leva 2001 2005 2008 2009 2010 2015 2020 With additional measures 9,160 11,499 8,803 8,165 9,199 11,552 With measures 9,160 11,499 9,903 9,569 10,474 13,649
5.4.3. Renewable energy sources
Relevant attention is allocated to the projection for development of the Renewing energy sources (RES) in the least cost development plan of the power sector of Bulgaria for the period 2008-2030.
The projection is consistent with the directive documents of the European Union. The indicative figures for the country envisage that the RES percentage will reach 16 % from the final energy demand until 2020.
The projection for RES development was made in one variant. This variant is associated within the both GHG emission scenarios - respectively “with measures” and ‘with additional measures”.
In Table 5.26 are given the projection values of the RES power capacities and projected energy production for the period until 2020.
Table 5.26 Forecast of capacity and electricity production by RES
Capacity, MW Energy, GWh
2005 2,053 4,401 2008 1,912 2,892 2010 2,827 4,286 2015 3,516 5,680
2020 4,733 7,290
It is accepted that RES are divided into two groups: big water-power plants with capacity above 5 MW, small water-power plants and wind, photovoltaic and biomass power plants. Building of small and micro water-power plants go popular during the last 15 years while more essential projects for building of wind and photovoltaic parks began to appear in the beginning of the 21 century. Also at the preliminary stage is project for a power plant with bio fuel waste straw from grain crops.
5.4.4. Transport
A projection for GVA produced by sector Transport is also integrated during the work on macroeconomic projection for GDP. The last one is made with accounting of the measures for branch development until 2020. Original methodology is used, which is built on the following principles:
Use of elements from the COPERT model;
Analysis of the statistics data for car number and their division according to producers, engine capacity and fuel type;

Projections and total effect of policies and measures 146
Projection of the travelled mileage based on the average fuel consumption rates;
Usage of econometric dependences between loads and passengers and the travelled mileage.
As a result of implementation of the measures for transport GHG emissions reduction in Table 5.27 are shown the projections for the two development scenarios.
Table 5.27 GVA projection in sector Transport, mln leva 2001 2005 2008 2009 2010 2015 2020 With additional measures 2,707 3,026 2,027 1,861 1,960 2,528 With measures 2,707 3,026 2,143 2,153 2,271 2,670
The analysis of the two scenarios – “with measures” and “with additional measures” shows that the planned measures lead to significant reduction of the activity in transport as it doesn’t reach the level from 2008 at the end of the period at the second scenario. The difference between the two scenarios is almost constant for the period 2010 -2020 i.e. 15.6 %.
5.4.5. Services
The projections for the sector Services are usually more dynamic and sensitive to the situation. The projection, made with account of the world financial crisis is an example for this.
The projection for the population in the country plays important part.
In Table 5.28 are shown projections for two development scenarios of the sector Services.
Table 5.28 GVA projection in sector Services, mln leva 2001 2005 2008 2009 2010 2015 2020 With additional measures 9,327 10,192 6,827 6,662 8,472 11,345 With measures 9,327 10,192 7,315 7,279 8,518 10,500
The growth of the added value in this sector provides exceeding of the levels from 2008.
5.4.6. Financial sector
This sector is taken out as a separate position because of its importance in the circumstances of the adopted financial system of money-stocks relations. The projections for its development are one of the most unsure. That’s why the relevant results are as a rule more dynamic and sensible to the situation. An example for this is the projection here, made with accounting of high degree of insecurity. Its overcoming assumes the implementation of the following methodological principles:
Conformity with the actual currency board in the country;
Accounting the development of the loan system;
Level of development of the market of the financial services;
Management of the external debt and fiscal reserve;
Status of the real estates market.

Projections and total effect of policies and measures 147
In the middle of 2008 were established very favourable perspectives for development of this branch, which created conditions for its overrating. The main mistake was the incorrect evaluation of the rates of banking and financial services infrastructure building.
The practice shows that until the middle of 2009 the internal financial crisis affected relatively weakly this sector in comparison with other countries in the EU.
In Table 5.29 are shown projections for two scenarios for development of the sector Financial services.
Table 5.29 GVA projection in sector Financial, mln leva 2001 2005 2008 2009 2010 2015 2020 With additional measures 6,905 10,130 6,786 6,622 8,421 11,276 With measures 6,905 10,130 9,694 9,647 11,288 13,914
5.4.7. Agriculture
The agriculture continuously decreases its share in the GDP structure. The slower growth of the branch led to decrease of its percentage. This trend comes up in the projected period too, despite the financial support that the branch receives from the EU funds. At the end of the period – about 2020 its share is expected to come up to 4 % of the total GDP of the country.
In the projecting of the agriculture the following methodical features exist:
Significant total uncertainty due to the unpredictability of the climate conditions.
Total production drop which will be overcome slowly in the next five years.
Very positive influence of the subsidies from the European funds;
Necessity of accounting of new EU directive about bio fuels and energy crops utilization.
Because of the change of the land property and because of the expected changes in the agricultural practice and structures it is very difficult to project GHG emissions.
So GHG emissions are projected according to two scenarios: with energy saving measures and with limited implementation of such measures.
The main GHG in this sector are CH4 and N2O. Methane sources are the enteric fermentation of the animals and the manure management. Their treatment is a part of manure process. N2O emissions sources are the synthetic fertilizers, animal manure and nitrogen-containing plants. In the balance of the nitrogen oxides soils take important place. They are sources of direct and indirect emissions of nitrogen oxides.
In Table 5.30 are given the projections for the value added in two development scenarios of the sector Agriculture.
Table 5.30 Projection for the GVA in sector Agriculture, mln leva 2001 2005 2008 2009 2010 2015 2020 With additional measures 3,330 2,885 2,623 2,534 2,829 3,422 With measures 3,330 2,885 2,816 2,830 3,280 4,081
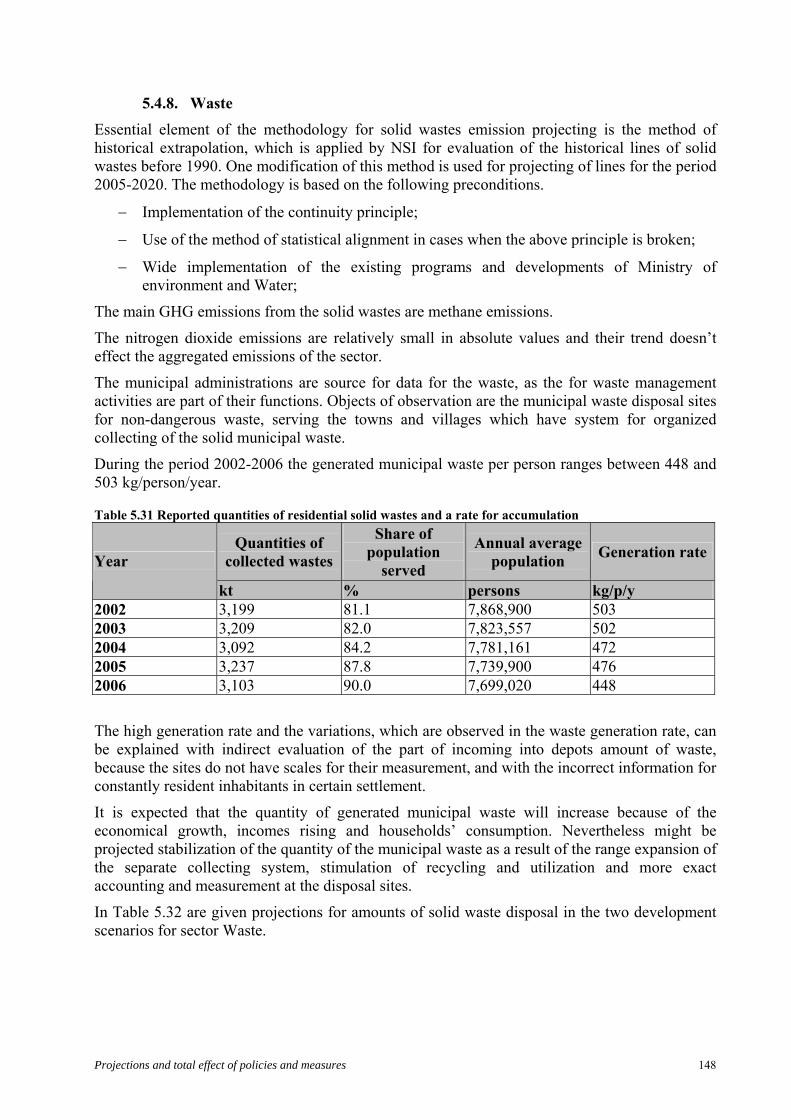
Projections and total effect of policies and measures 148
5.4.8. Waste
Essential element of the methodology for solid wastes emission projecting is the method of historical extrapolation, which is applied by NSI for evaluation of the historical lines of solid wastes before 1990. One modification of this method is used for projecting of lines for the period 2005-2020. The methodology is based on the following preconditions.
Implementation of the continuity principle;
Use of the method of statistical alignment in cases when the above principle is broken;
Wide implementation of the existing programs and developments of Ministry of environment and Water;
The main GHG emissions from the solid wastes are methane emissions.
The nitrogen dioxide emissions are relatively small in absolute values and their trend doesn’t effect the aggregated emissions of the sector.
The municipal administrations are source for data for the waste, as the for waste management activities are part of their functions. Objects of observation are the municipal waste disposal sites for non-dangerous waste, serving the towns and villages which have system for organized collecting of the solid municipal waste.
During the period 2002-2006 the generated municipal waste per person ranges between 448 and 503 kg/person/year.
Table 5.31 Reported quantities of residential solid wastes and a rate for accumulation
Quantities of collected wastes
Share of population
served
Annual average population
Generation rateYear
kt % persons kg/p/y 2002 3,199 81.1 7,868,900 503 2003 3,209 82.0 7,823,557 502 2004 3,092 84.2 7,781,161 472 2005 3,237 87.8 7,739,900 476 2006 3,103 90.0 7,699,020 448
The high generation rate and the variations, which are observed in the waste generation rate, can be explained with indirect evaluation of the part of incoming into depots amount of waste, because the sites do not have scales for their measurement, and with the incorrect information for constantly resident inhabitants in certain settlement.
It is expected that the quantity of generated municipal waste will increase because of the economical growth, incomes rising and households’ consumption. Nevertheless might be projected stabilization of the quantity of the municipal waste as a result of the range expansion of the separate collecting system, stimulation of recycling and utilization and more exact accounting and measurement at the disposal sites.
In Table 5.32 are given projections for amounts of solid waste disposal in the two development scenarios for sector Waste.

Projections and total effect of policies and measures 149
Table 5.32 Projections for amounts of solid waste in sector Waste, kt 2005 2008 2009 2010 2015 2020 With additional measures 3,144 3,129 3,192 3,223 3,404 3,631 With measures 3,144 3,129 3,285 3,384 4,237 4,983
5.5. Projections sensitivity analysis, focused on the key input variables.
There are three sets of key inputs to produce the energy demand forecasts: the level and structure of GDP; total population; and the level and structure of final energy consumption.
A methodology that allows scrutinizing the interrelationships between macroeconomic development, sectoral development (including the energy sector), and GHG emissions is used.
The macroeconomic forecasts, including GDP and population growth, were provided by the Bulgarian Agency for Economic Analysis and Forecasts within the Ministry of Finance.
The macroeconomic data are key inputs to the MACRO module in ENPEP complex. The DEMAND module estimates the useful and final energy demand by sector, including households, industry, services and transport.
The general assumptions used are that the energy network is presented as a combination of sectoral and level presentation of data. The network is simplified as to represent only some of the sectors and some of the levels in a detailed way. Other information is generalized in a way to keep the total energy flows in the energy system and related emissions.
5.5.1. Specific assumptions related to the with measures scenario for GHG emissions
Generally macroeconomic indicators determine the share of energy demand, which serves as driving force of economy development. For the current study a moderate projections are applied. The major economic factors influencing the development of the energy sector are:
Restructuring of economy and increased share of private sector.
Access to the markets of EU and Balkan countries.
Decreasing share of heavy industry in the national economy.
Increased share of production and services with low energy intensity.
Technological progress and high technological development.
Improved management of energy prices.
Energy efficiency policy at supply and demand side.
The final energy demand forecast envisages two models of development: max and min, matching optimistic and pessimistic expectations for the energy intensity in the country. The expected energy demand according to the max scenario (that has become the basis for “with measures” scenario) is shown on Table 5.33.
The forecast final energy structure is shown in Table 5.34.

Projections and total effect of policies and measures 150
Table 5.33 Final energy consumption – PJ Sectors 2005 2010 2015 2020 Industry 147.4 147.2 151.9 157.3 Transportation 98.9 139.5 159.6 169.5 Residential 94.1 95.0 102.3 127.5 Others 45.2 55.7 64.1 72.2 Total 385.6 437.4 477.8 526.5
Table 5.34 Forecast of structure energy demand by sector, % Sectors 2005 2010 2015 2020 Industry 38.2 33.7 31.8 29.9 Transportation 25.6 31.9 33.4 32.2 Residential 24.4 21.7 21.4 24.2 Others 11.7 12.7 13.4 13.7 Total 100.0 100.0 100.0 100.0
5.5.2. Sensitivity and Energy intensity
The ENPEP modelling suite uses three sets of key inputs to produce the energy demand forecasts: the level and structure of GDP; total population; and the level and structure of final energy consumption. Sensitivity calculations are one of the approach for defining the area of forecasts. This area is the real space of variation of all parameters of the forecast. The limits are the energy intensity of GDP.
The energy intensity of the GDP in Bulgaria is higher compared to the developed countries.
Increasing energy efficiency is one of the basic objectives for the future development of the energy sector; expected to be achieved mainly by implementing the following structural changes in the national economy:
Decrease in the share of the heavy industry in the GDP.
Faster development of the service sector (including transport).
Moderate development of the agricultural sector.
Decrease of the energy intensity of the GDP is almost two time less at the end of prognosis period as is shown on Table 5.35.
Table 5.35 Energy intensity of GDP Year Gross electricity demand/GDP, kWh/€ 2001 Gross energy demand/GDP, MJ/€ 2001 2005 1.917 20.20 2010 1.775 18.35 2015 1.388 13.94 2020 1.119 10.38
Vulnerability assessment, climate change impacts and adaptation measures 151
6. VULNERABILITY ASSESSMENT, CLIMATE CHANGE IMPACTS AND ADAPTATION MEASURES
6.1. Background
Bulgaria is located on the Balkan Peninsula in south-eastern Europe. The country includes 31 % low-lands (0–200 m), 41 % hills (200–600 m), 25 % high-lands (600–1,600 m), and 3 % mountains (>1,600 m).
Considering its small area, Bulgaria has an unusually variable and complex climate. The country lies between the strongly contrasting continental and Mediterranean climatic zones. Due to the geographical situation and the varied landscape, the contrasts in the climate are distinct among regions. The climate is with four distinctive seasons and varies with altitude and location. The Black Sea coast features a milder winter as opposed to the harsher winter conditions in the central north plains.
Bulgarian mountains and valleys act as barriers or channels for air masses, causing sharp contrasts in weather over relatively short distances. The continental zone is slightly larger, because continental air masses flow easily into the unobstructed Danubian Plain. The continental influence, stronger during the winter, produces abundant snowfall; the Mediterranean influence increases during the summer and produces hot, dry weather. The barrier effect of the Balkan Mountains is felt throughout the country: on the average, northern Bulgaria is about one degree cooler and receives about 192 more millimetres of rain than southern Bulgaria. Because the Black Sea is too small to be a primary influence over much of the country's weather, it only affects the immediate area along its coastline. The Balkan Mountains are the southern boundary of the area in which continental air masses circulate freely. The Rhodope Mountains mark the northern limits of domination by Mediterranean weather systems. The area between, which includes the Thracian Plain, is influenced by a combination of the two systems, with the continental predominating.
Bulgaria has five climatic zones - Moderate Continental, Intermediate, Continental-Mediterranean, Maritime and Mountainous. The main factor distinguishing the first three zones is the latitude, the terrain for the mountainous and the Black Sea for the maritime. The coastal climate is moderated by the Black Sea, but strong winds and violent local storms are frequent during the winter. Winters along the Danube River are bitterly cold, while sheltered valleys opening to the south along the Greek and Turkish borders may be as mild as areas along the Mediterranean or Aegean coasts. The many valley basins scattered through the uplands have temperature inversions resulting in stagnant air.
There are some interesting areas from a climatic point of view, such as the Sofia Plain, the regions of Sliven and Varna, where strong winds blow almost throughout the year. In the first two cases they are due to the proximity with the Balkan Mountains and its passes, which let all winds blow constantly through them. In the case with Varna this phenomenon is due to the specific microclimate of the Bay of Varna and the sea air-currents coming from the north.
The annual mean air temperatures in Bulgaria vary from -3.0 to 14.0 C, depending on the location and elevation. Air temperature normally reaches minimum in January and maximum in July. The monthly mean temperature varies from -10.9 to 3.2 C in January and from 5.0 to 25.0 C in July. Winter temperatures vary between 0° and 7°C below zero (Figure 6.1). Very rarely temperatures may drop below 20°C below zero. Typical continental and changeable is the climate in spring. It is exceptionally favourable for the growth of fruit-bearing trees, for whose fruit Bulgaria has been renowned in Europe for centuries. Summer is hot and sweltering in

Vulnerability assessment, climate change impacts and adaptation measures 152
Northern Bulgaria, especially along the Danube River. The climate in Southern Bulgaria is determined by the air-currents from the Mediterranean. Summer temperatures do not reach the extremes as in Dobroudzha and along the Danube and are usually moderate: about 28°-30°C. The highest readings are usually taken in the towns of Rousse and Silistra, sometimes reaching above 35°C. Autumns are mild and pleasant in Bulgaria.
Figure 6.1 Air temperature in winter (left) and summer (right) during the current climate
The heating season varies between 160 and 220 days for different locations. An important indicator describing the duration of the heating season and roughly the energy requirements for heating is the number of degree days. The heating degree days for indoor temperatures of 20C vary between 2,100 and 3,500 for different regions in Bulgaria. For Sofia these are 2,500 on average annual basis.
The average wind speed is 1.2 m/s (1.3 m/s in winter time), while prevailing winds are west or northeast. The air humidity is between 66 and 85 % in the different regions of the country. There is a stable snow cover during the winter of about 20-200 cm.
The Thracian Plain and the north-eastern coastal area suffer from low rainfalls. Total precipitation depends on the circulation patterns, site elevation, and the specificity of local orographic features. Annual mean total precipitation is approximately 500–650 mm, with variation ranging from 440 to 1,020 mm (Figure 6.2). Dobrudja in the northeast, the Black Sea coastal area, and parts of the Thracian Plain usually receive less than 500 millimetres. The remainder of the Thracian Plain and the Danubian Plateau get less than the country average; the Thracian Plain is often subject to summer droughts. Higher elevations, which receive the most rainfall in the country, may average over 2,540 millimetres per year. The highest monthly values are measured in June, and at some places in May, with the mean total varying between 55 and 85 mm. February, and sometimes March and September, are the driest months, with mean totals varying between 30 and 45 mm. Mean precipitation during the warm months, e.g. April through September, is 333 mm, with a standard deviation of 72 mm. Mean precipitation varies from a maximum of 573 mm in the Balkan Mountain to a minimum of 211 mm in south-eastern Bulgaria
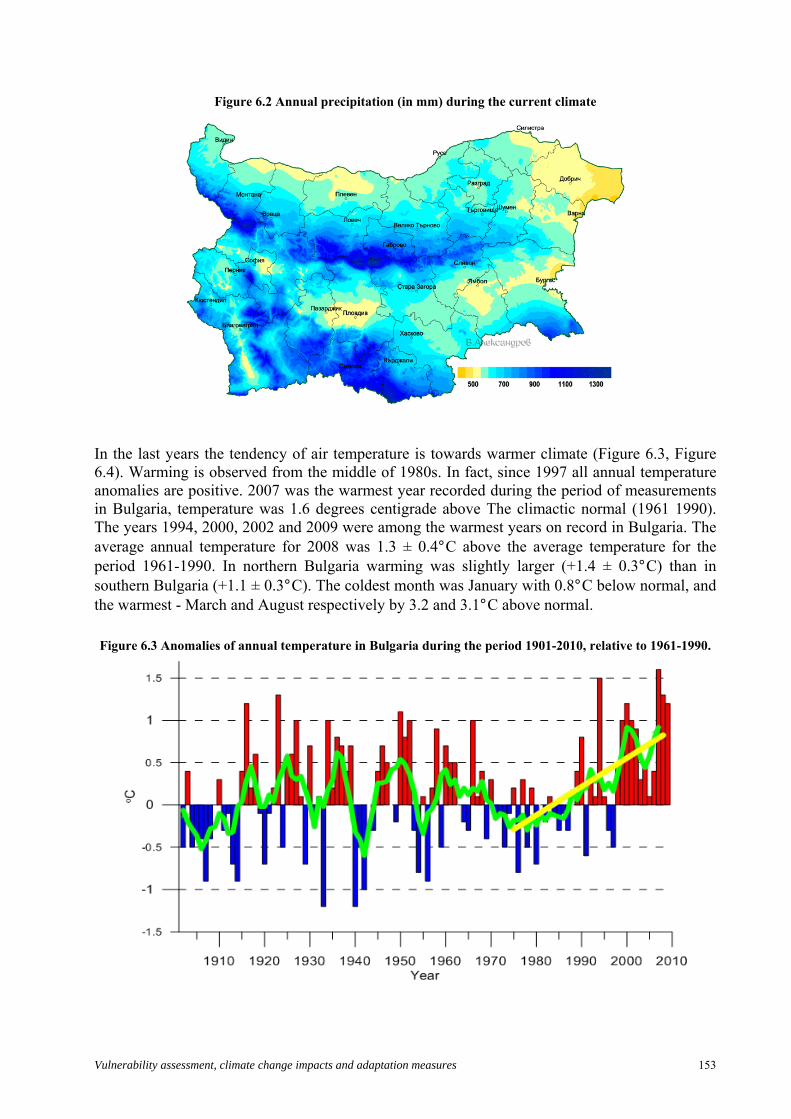
Vulnerability assessment, climate change impacts and adaptation measures 153
Figure 6.2 Annual precipitation (in mm) during the current climate
In the last years the tendency of air temperature is towards warmer climate (Figure 6.3, Figure 6.4). Warming is observed from the middle of 1980s. In fact, since 1997 all annual temperature anomalies are positive. 2007 was the warmest year recorded during the period of measurements in Bulgaria, temperature was 1.6 degrees centigrade above The climactic normal (1961 1990). The years 1994, 2000, 2002 and 2009 were among the warmest years on record in Bulgaria. The average annual temperature for 2008 was 1.3 ± 0.4°C above the average temperature for the period 1961-1990. In northern Bulgaria warming was slightly larger (+1.4 ± 0.3°C) than in southern Bulgaria (+1.1 ± 0.3°C). The coldest month was January with 0.8°C below normal, and the warmest - March and August respectively by 3.2 and 3.1°C above normal.
Figure 6.3 Anomalies of annual temperature in Bulgaria during the period 1901-2010, relative to 1961-1990.

Vulnerability assessment, climate change impacts and adaptation measures 154
Figure 6.4 Deviations of annual average air temperature (in °C) and annual precipitation (in %) in 2007, relative to the climate normals for the period 1961-1990.
Climate in Bulgaria became not only warmer but also drier at the end of the 20th century (Figure 6.5). During the last decade however, precipitation totals has increased (Figure 6.5, Figure 6.6). Heavy rains caused severe floods damaging various socioeconomic sectors
Figure 6.5 Anomalies of annual precipitation in Bulgaria during the 20th century

Vulnerability assessment, climate change impacts and adaptation measures 155
Figure 6.6 Annual precipitation in 2005 and monthly precipitation in August 2007 (as % from the norm)
Weather and climate extremes have increased during the last decades. As is shown on Figure 6.7.
Figure 6.7 Weather and climate extremes.
0
5
10
15
20
25
30
35
40
1930 1950 1970 1990 2010
year
num
ber
of d
ays
Samok Borov Musala
0.0
0.2
0.4
0.6
0.8
1.0
1.2
1.4
I DE
C
II D
EC
III D
EC
I DE
C
II D
EC
III D
EC
I DE
C
II D
EC
III D
EC
I DE
C
II D
EC
III D
EC
I DE
C
II D
EC
III D
EC
I DE
C
II D
EC
III D
EC
APRIL MAY JUNE JULY AUGUST SEPT
M onth / 10 days
Mea
n h
eavy
rai
n d
ays
1961-1990
1991-2005
Fig. 6.7a. Number of warm days (Tmin> 0ºC) during the winter
Fig. 6.7b. Intra-monthly distribution of heavy precipitation days during the warm half of the year
0
2
4
6
8
10
12
14
1961 1966 1971 1976 1981 1986 1991 1996 2001 2006
Year
Nu
mb
er
of
SC
S
Fig. 6.7c. Tendency of seasonal (April-September) number of severe convective storms
Fig. 6.7d. Distribution of dry winds and t – f drought spells by years

Vulnerability assessment, climate change impacts and adaptation measures 156
6.2. Expected Impacts of Climate Change for Eastern Europe including Bulgaria
6.2.1. Climate Scenarios for 2050
In the CLAVIER project, LMDZ-regional climate model was forced by the outputs of three global climate change scenarios from the models ECHAM-A1B, ECHAM-B1 and IPSL-A1B. All the three simulations cover the period from 2000 to 2050 and follow the IPCC-defined emission scenarios. Two additional simulations were performed for the period from 1951 to 2000 following the 20th-century simulations with the global climate models ECHAM and IPSL.
Figure 6.8 plots the temporal evolution of annual-mean surface air temperature, averaged for the CLAVIER domain (Hungary + Romania + Bulgaria). The black curve indicates the 20th century ECHAM simulation for the period 1951-2000. The counterpart from IPSL is represented in orange curve. We can observe a general warming trend for the last two decades of the 20th century for the two curves, but the IPSL result is about 2°C cooler than the ECHAM result. The green and yellow curves (from 2001 to 2050) are the A1B and B1 scenarios from ECHAM, respectively. The A1B scenario is generally warmer than the B1 scenario, but the difference is small for our considered time scale, around 2050. The red curve is the A1B scenario from IPSL for the period 2001-2050. Despite the general cool feature of IPSL in the 20th century, the future warming is more important, the surface air temperature reaches a very similar level as in ECHAM. This indicates that the temperature increase is about 2°C larger in IPSL than in ECHAM, which is directly related to a different behaviour of simulated climate sensitivity in the two IPCC-AR4 models developed and used in Hamburg (ECHAM) and Paris (IPSL) respectively.
Figure 6.8 Annual-mean air temperature at 2m (upper, °C) and precipitation rate (lower, mm/day) in function of time from 1951 to 2050. The spatial average was performed for the CLAVIER region (Hungary,
Romania and Bulgaria).

Vulnerability assessment, climate change impacts and adaptation measures 157
Figure 6.9 gives the geographic distribution of annual-mean changes in surface air temperature and precipitation for the A1B scenario. ECHAM and IPSL can be compared against each other. For surface air temperature, the warming in IPSL is much more important in IPSL with maxima in the Northeast of the domain. The warming in ECHAM is modest and with a more uniform spatial distribution. Concerning the precipitation, a general tendency of decrease is depicted in the South part of the domain and an increase in the North. The variation in the CLAVIER domain is small. Again we can observe that IPSL shows larger changes than ECHAM does.
Table 6.1 shows the averaged surface air temperature for Bulgaria s and for the two emission scenarios respectively. Table 6.2 gives the results on precipitation.
Figure 6.9 Changes of surface air temperature (left, °C) and precipitation rate (right, mm/day) as predicted by LMDZ-regional (2001/2050 - 1951/2000). The upper panels are from LMDZ-regional forced by the MPI
global climate model
Table 6.1 Spatial average of surface air temperature in Bulgaria for the two A1B scenarios (from respectively MPI and IPSL) and the B1 scenario from MPI global climate model:
1961/1990 2021/2050 B1 2021/2050 A1B
LMDZ forced by ECHAM 10.63 11.87(+1.25) 12.41 (+1.78)
LMDZ forced by IPSL 8.5 11.31 (+2.81)

Vulnerability assessment, climate change impacts and adaptation measures 158
Table 6.2 Spatial average of precipitation rate (mm/day) for the two A1B scenarios (from respectively MPI and IPSL) and the B1 scenario from MPI global climate model:
1961/1990 2021/2050 B1 2021/2050 A1B
LMDZ forced by ECHAM Bulgaria 1.50 1.41 (-0.09) 1.52 (+0.02)
LMDZ forced by IPSL Bulgaria 2.05 1.91 (-0.14)
The eventual increase of weather and climate extremes due to a shift in mean climate (global warming) is a heavily discussed issue, as extremes present first-order menaces for the general public, the economy and the natural environment. According to IPCC an extreme weather event is an event that is rare within its statistical reference distribution at a particular place. Definitions of “rare” vary, but an extreme weather event would normally be as rare as or rarer than the 10th or 90th percentile. Extreme parameters, which are listed in the table below, and their trends were investigated for the CLAVIER study region between 1951 and 2050 (Figure 6.10, Figure 6.11). The analysis is based on the empirical-statistical error corrected data from the STAT-CLIMATE-ECA-REMO57_a1b scenario.
Table 6.3 Parameters for extremes
Name Unit Description
mean temperature K mean surface(2m) air temperature 90th percentile of maximum temperature
°C 90th percentile of daily maximum temperature(tas_dx)
10th percentile of minimum temperature
°C 10th percentile of daily minimum temperature(tas_dn)
The number of frost days days number of days with minimum temperature (tas_dn)
summer days days number of days where the maximum temperature (tas_dx) exceeds 25°C
tropical nights days number of days where the minimum temperature (tas_dn) exceeds 20°C
90th percentile heat wave duration days
maximum number of days per year (at least 6) where the maximum temperature (tas_dx) exceeds its long term (30 years) 90th percentile calculated in 5-day windows
precipitation amount mm/day mean surface precipitation amount
precipitation intensity mm/daymean daily precipitation sum on rainy days (days where pr_24h exceeds 1mm/day)
90th percentile of wet day precipitation
mm 90th percentile of daily precipitation sums (pr_24h)
90th percentile of wet day precipitation
mm 90th percentile of daily precipitation sums (pr_24h) on wet days (pr_24hc >= 1mm)
greatest 1-day rainfall mm maximum precipitation sum in one day greatest 5-day rainfall mm maximum precipitation sum in 5 consecutive days
intense precipitation days number of days where the daily precipitation sum (pr_24hc) exceeds 10 mm/day
consecutive dry days days maximum number of consecutive dry days

Vulnerability assessment, climate change impacts and adaptation measures 159
Regarding the temperature-related indices for extremes, a throughout significant warming signal can be found in the entire CLAVIER domain with warming maxima in winter and autumn. Most drastically this can be seen in the summer months for tropical nights (tnn20, minimum temperature > 20°C) in Bulgaria. The duration of heat waves notably increases till the mid century. A comparison of the CLAVIER countries shows comparable trends in all three countries in most parameters, but on a higher level in Bulgaria. Regarding precipitation-related indices for extremes, only few significant trends are found. In all three countries all parameters (mean precipitation and parameters for extremes) have the tendency to decline in summer and to increase in winter. Bulgaria again stands out with a strong increase in consecutive dry days.
6.2.2. Climate Scenarios for the 2080s and end of 21 Century
Significant summer warming in the western Balkan countries, were projected by the HadCM3 model for 2080. Air temperatures during this time of the year are expected to increase between 5° and 8°C over most of the countries in the peninsula. Summer precipitation is projected to decrease in the region of interest. HadCM3 climate change scenarios were also created for every used weather stations from selected areas in Bulgaria. Figure 6.12 shows the monthly climate values of air temperature and precipitation in Novachene (north Bulgaria) under the HaDCM3 climate change scenarios for the years 2020, 2050 and 2080. It could be seen that the newer HadCM3 model simulates higher increases for monthly air temperature in comparison to the previous HadCM2 ones. Even air temperatures in July and August are projected to be in 2080 near 8°C higher than air temperatures, relative to the period 1961-1990 (Figure 6.11). Simulated HadCM3 precipitation has a similar direction for the 21st century as for the HadCM2 and ECHAM4 models – a decreasing one. Monthly precipitation in Novachene from May to September is projected to be about 50 % reduced in 2080. Only precipitation in February and March as well as December is expected to increase during the 21st century.
Additional findings from the CECILIA project are listed below:
- Obviously winters will be milder in the next decades reaching up to 10°C and even more in some areas
- Recent summers will gradually disappear as it will be hotter with average maximum air temperatures often above 30°C in most lowland areas in the country.
- Ice days will decrease, higher min temperature will affect the period of vernalisation in winter and crop growth in summer
- It is clear that by increasing maximum and minimum air temperatures will caused respective increase of mean air temperature both in winter and summer
- The number of summer days increases up to 90 days in the period 2021-2050. Percentage of summer days is projected to rise from 18-20 % nowadays to more than 40 % in most flat locations in south Bulgaria
- The hot days would increase as well, up to 30 % till the end of the 21st century.

Vulnerability assessment, climate change impacts and adaptation measures 160
Figure 6.10 Trend analysis for tropical nights
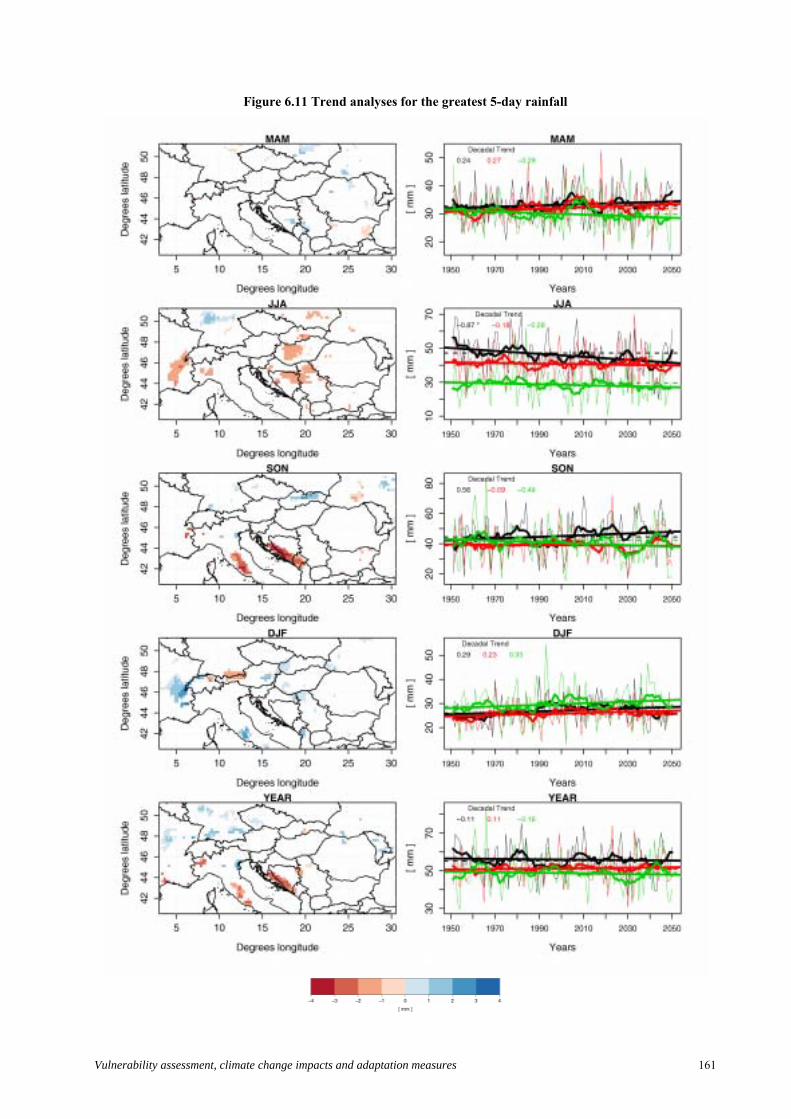
Vulnerability assessment, climate change impacts and adaptation measures 161
Figure 6.11 Trend analyses for the greatest 5-day rainfall

Vulnerability assessment, climate change impacts and adaptation measures 162
Figure 6.12 Monthly HaDCM3 climate change scenarios values of air temperature (a) and precipitation (b) in Novachene (north Bulgaria) for the 2020, 2050 and 2080.
1 2 3 4 5 6 7 8 9 10 11 12
Month
0.0
1.0
2.0
3.0
4.0
5.0
6.0
7.0
8.0
9.0
T (
o C)
a) 2020
2050
2080
1 2 3 4 5 6 7 8 9 10 11 12
Month
-60
-50
-40
-30
-20
-10
0
10
20
30
P (
%)
b)
Under the umbrella of the CECILIA project climate change scenarios for Bulgaria were also simulated by applying the ALADIN regional model (Figure 6.13)
Figure 6.13 Climate change scenarios in Bulgaria for the end of the 21st century
Annual temperature changes (in ºC) at the end of the 21st century, relative to 1961-1990
Annual precipitation changes (in %) at the end of the 21st century, relative to 1961-1990

Vulnerability assessment, climate change impacts and adaptation measures 163
Figure 6.14 Summer days (Tmax>25ºC), 1961-1990 (left). 2021-2050 (right)
6.2.3. Agriculture
The Palmer Drought Severity Index (PDSI) was invented in 1965 by Wayne Palmer and belongs to the group of the agro-meteorological drought indices. The index is based on the calculation of a climatic soil water balance and requires long term temperature, precipitation data on a monthly time scale and the available water holding capacity (AWC) as a soil parameter, whereas the AWC is the amount of water which can be held in the root-zone between the wilting point of the plants and the field capacity. The PDSI is arranged into 12 classes (from extremely wet to extremely dry). The Classification is mentioned in the table below.
Table 6.4 Classification
PDSI CLASS
≥4 extremely wet 3.00 to 3.99 very wet 2.00 to 2.99 1.00 to 1.99 slightly wet 0.50 to 0.99 incipient wet spell 0.49 to -0.49 near normal -0.50 to -0.99 incipient drought -1.00 to -1.99 mild drought -2.00 to -2.99 moderate drought -3.00 to -3.99 severe drought ≤-4 extreme drought
Within the CLAVIER project the PDSI declines in Bulgaria and all seasons by about 0.35 classes per decade. This would, e.g., shift present day mild droughts (class -1 to -1.99) to future severe droughts (class -3 to -3.99) within less than 60 years. The annual cycle of the climate change signal for Bulgaria seems to be at higher drought risk in future than Romania (shift of more that 3 classes towards drier conditions are expected) - future extreme droughts (class -4 and lower).

Vulnerability assessment, climate change impacts and adaptation measures 164
Figure 6.15 Seasonal and yearly time series
Figure 6.15 Seasonal as well as yearly time series and the respective trends are calculated and evaluated for the PDSI between 1951 and 2050. The respective left panel shows seasonal and yearly maps of decadal trends of only significant grid cells in the entire domain. The trend direction and magnitude is colour-coded. The right panel of each plot shows seasonal and annual regional averages for the three CLAVIER countries Hungary, Romania and Bulgaria (thin line), the 1961-1990 mean value (dashed line), 10 year moving averages of the regional mean (bold line) and the linear trend of the unsmoothed regional mean represented by the thin line (bold straight line). The magnitude of the respective trend is indicated in the top left corner of each plot with significant trends being marked by an asterisk (*).
A survey in the frame of the ADAGIO project shows that during the climate change in Bulgaria in the 21st century, most vulnerable will be: a) spring agricultural crops, due to the expected precipitation deficit during the warm half-year; b) crops cultivated on infertile soils; c) crops on non-irrigated areas; d) arable lands in south-east Bulgaria where even during the present climate, precipitation quantities are insufficient for normal growth, vegetation and productivity of agricultural crops.
For example, in a result of expected warming crop-growing duration of sunflower over the Balkan Peninsula is projected to decrease, especially at the end of the 21st century (Figure 6.16). The yield changes in the selected region show different trends depending on the latitude, altitude, soil properties as well as the time slices during the current century (Figure 6.17).

Vulnerability assessment, climate change impacts and adaptation measures 165
Figure 6.16 HadCM3 B2 changes (in days) in sunflower growing duration in the Balkan Peninsula for 2071- 2080, relative to current climate; RoIMPEL model
Figure 6.17 HadCM3 A2 changes (in %) in sunflower yield in the Balkan Peninsula for 2071-2080, relative to current climate; RоIMPEL model
6.2.4. Forestry
In order to define the forest ecosystem vulnerability under the possible climate changes, as well as to find measures for their adaptation to the new conditions, an information is necessary for the Bulgarian forests calibrated to a basic period. 1990 has been chosen as a base year in the study.

Vulnerability assessment, climate change impacts and adaptation measures 166
The meaning “status of Bulgarian forests” includes information about the areas, tree species, growth rates, volumes, etc. The status of the Bulgarian forest was thoroughly described in the First National Communication. In general, the total area of the forests in the country, the percentage of woodiness, the protected territories and the total area of the coniferous forests has increased within the last few decades.
The areas of annual afforestation have varied from 28,040 ha up to 89,660 ha, and this allowed over 1 million ha of new forests be established in the past 35 years, hence, over 1/3 of the country’s forests were re-established. The creative policy in the field of forestry resulted in a quick increase of the total volume of above-ground mass of wood in the forests of Bulgaria. The total volume of wood in the Bulgarian forests has increased from 244.68 mil. m3 (in 1955) up to 396.02 mil. m3 (in 1990), i.e. the amount of standing wood has increased by 61.8 % in 35 years.
The consequences of this favourable effect on the forests in Bulgaria are obvious: the erosion in all the large water-catchment basins in the country was liquidated; the living conditions in many territories in the country improved, as well as the forests’ microclimatic, hydrological, ameliorative, etc., i.e. all the peerless favourable functions of the forests in Bulgaria have been improved.
Analysis on the condition of the forest vegetation from the last decade in Bulgaria shows that the coniferous forest vegetation which was widely introduced during the last decades below 800 m a.s.l., i.e. out of its natural habitats, forms very unstable forest ecosystems. The main reason is the discrepancy between the ecological conditions (mainly rainfalls) and the requirements of the coniferous tree species. Due to this reason these forests are physiologically in a chronic water deficit and in drought periods like this one in 1983-1994 they begin to disintegrate. The above tendency subsequently encompasses the high fields of West Bulgaria, North Bulgaria, South Bulgaria, Black Sea Coast, and Southern parts of the country. In this sequence the vulnerability of the forest vegetation to the adverse dry climate increases.
The problem with the discrepancy of the ecological conditions of the forest vegetation is not a new one in Bulgaria forestry. Decay of the conifer plantations (Pinus sylvestris, P. nigra, more rarely Picea abies and Pseudotsuga menziesii) has been observed recently due to the improper introduction of these species in the low part of the country. The main reason for this dangerous phenomenon was the discrepancy between the climatic conditions in this part of the country and the ecological requirements of newly afforested coniferous species. If the projections about the carbon dioxide doubling during the next century come true the ecological conditions in Bulgaria will drastically deteriorate.
The climate change scenarios derived for Bulgaria were used to evaluate potential changes in forest vegetation. The altered temperature and precipitation databases corresponding to each of the climate change scenarios were used to run the Holdridge life zone (1967) classification model.
The changes are from “cool temperate moist forest” to “warm temperate dry forest” for North Bulgaria, and for South Bulgaria the “warm temperate dry forest” will remain typical. In the warmest country regions (station Sandansky) “subtropical dry forest” could be expected, which means drastic warming and droughts. Since 60.6 % of forests are in the zone below 800 m, it is clear, that most of the Bulgarian forests would be vulnerable to the drastic climate change under the eventual doubling of carbon dioxide in the near future. The changes in the mountain regions of the country (station Smoljan, 1180 m a.s.l.) would pass from “cool temperate wet forest” to “warm temperate moist forest”. At an eventual climate warming a moving of the species composition from South to North could be expected, which means shifting of tree and shrub vegetation from the South-Bulgarian into the North-Bulgarian and from the South-Bulgarian border region into the South-Bulgarian forest vegetation area, respectively. That means that it

Vulnerability assessment, climate change impacts and adaptation measures 167
could be expected that the South-Bulgarian border region area will be settled by typical Mediterranean vegetation, a part of which is to be seen there even at present.
In addition to the First National Communication, hereafter the forest vulnerability was evaluated following the GAP models. The prediction of the forest ecosystem responses to long-term climate changes requires hierarchical constructed dynamic models, capable to cover and describe in a mechanistic manner the combination of the basic ecosystem processes and their interrelationships in space and time. The forest gap models are individually based programs which simulate the vegetation response functions to the environmental conditions. The model could evaluate the possible changes in the species composition, forest structure and productivity of specific forest sites. The model requires detailed information on specific forest species and environmental factors. The model could evaluate the dynamics of particular forest site in response to the climate change.
The GAP model results show that in case of climate warming over the next 90 years, the following consequences could be expected:
A. In the lowlands – Tree species diversity reduction. In spite of that, the biodiversity would be greater compared with the biodiversity in the mountain regions. The selected tree species guarantee increased bio-productivity. It could be considered that if proper selection is made, optimal bio-production could be released under changed climate conditions.
B. In mountains – Increased tree biodiversity could be expected. It could be realized by means of the natural shifting of tree vegetation from lower to higher sites in the mountains. This process would be combined with biomass production increase.
C. Both in lowlands and mountains – Increased biomass productivity would be accompanied by increased CO2 absorption.
Either using Holdridge Life Zones Classification Model or JABOWA-II Gap Model, two climate zones of climate change influence have been established: from 0 to 600-800 m a.s.l. and over 800 (1,000) m a.s.l. Working with Holdridge model, critical situation for the future of the forests in the lowlands and low-hill regions on the whole was outlined, while developing gap models it could be seen that the status of the forests (in all altitudes) wouldn’t be critical at all. As Holdridge model provides a regional mapping system for interpreting spatial changes throughout the country or regions, while the forest gap model evaluates the temporal dynamics of a given site in response to climate change, it could be considered that the GAP model results are more objective.
6.3. Vulnerability Assessment
Climatic scenarios reveal that an increased risk and vulnerability to soil droughts are expected – an increase in the occurrence, intensity and level of impact of the soil droughts in Bulgaria for the 21st century. The soils with low capacity of moisture preservation and the regions in south-east Bulgaria are most vulnerable to those changes, in which areas precipitations during the warm half-year are low, even at present climatic conditions.
A Case Study (North East Region)
Meteorological conditions have an impact on crop yields. A CLAVIER case study assesses the importance of the impacts in the past, and provides future scenarios of various crop yields using a statistical climate-crop model. For this purpose, multiple linear regressions (MLR) are used with selected meteorological parameters as independent predictors and regional crop yields as dependent variable (Bulgaria – NUTS 3 regions Varna, Razgrad, Ruse, Silistra, Dobrich, Turgovishte and Shumen). The most important crop yields for each region, chosen from the crop
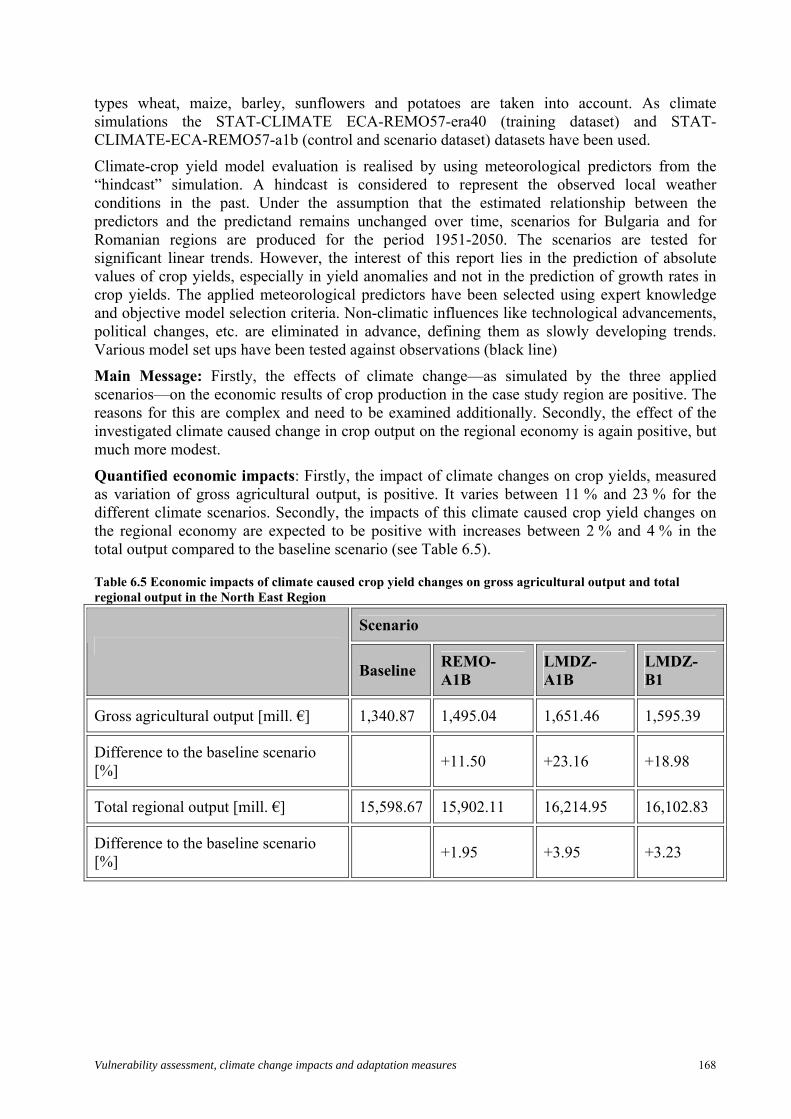
Vulnerability assessment, climate change impacts and adaptation measures 168
types wheat, maize, barley, sunflowers and potatoes are taken into account. As climate simulations the STAT-CLIMATE ECA-REMO57-era40 (training dataset) and STAT-CLIMATE-ECA-REMO57-a1b (control and scenario dataset) datasets have been used.
Climate-crop yield model evaluation is realised by using meteorological predictors from the “hindcast” simulation. A hindcast is considered to represent the observed local weather conditions in the past. Under the assumption that the estimated relationship between the predictors and the predictand remains unchanged over time, scenarios for Bulgaria and for Romanian regions are produced for the period 1951-2050. The scenarios are tested for significant linear trends. However, the interest of this report lies in the prediction of absolute values of crop yields, especially in yield anomalies and not in the prediction of growth rates in crop yields. The applied meteorological predictors have been selected using expert knowledge and objective model selection criteria. Non-climatic influences like technological advancements, political changes, etc. are eliminated in advance, defining them as slowly developing trends. Various model set ups have been tested against observations (black line)
Main Message: Firstly, the effects of climate change—as simulated by the three applied scenarios—on the economic results of crop production in the case study region are positive. The reasons for this are complex and need to be examined additionally. Secondly, the effect of the investigated climate caused change in crop output on the regional economy is again positive, but much more modest.
Quantified economic impacts: Firstly, the impact of climate changes on crop yields, measured as variation of gross agricultural output, is positive. It varies between 11 % and 23 % for the different climate scenarios. Secondly, the impacts of this climate caused crop yield changes on the regional economy are expected to be positive with increases between 2 % and 4 % in the total output compared to the baseline scenario (see Table 6.5).
Table 6.5 Economic impacts of climate caused crop yield changes on gross agricultural output and total regional output in the North East Region
Scenario
Baseline REMO-A1B
LMDZ-A1B
LMDZ-B1
Gross agricultural output [mill. €] 1,340.87 1,495.04 1,651.46 1,595.39
Difference to the baseline scenario [%]
+11.50 +23.16 +18.98
Total regional output [mill. €] 15,598.67 15,902.11 16,214.95 16,102.83
Difference to the baseline scenario [%]
+1.95 +3.95 +3.23

Vulnerability assessment, climate change impacts and adaptation measures 169
6.4. Adaptation measures
6.4.1. Agriculture
Two main types of adaptation are autonomous and planned adaptation. Autonomous adaptation is the reaction of, for example, a farmer to changing precipitation patterns, in that s/he changes crops or uses different harvest and planting/sowing dates.
Planned adaptation measures are conscious policy options or response strategies, often multisectoral in nature, aimed at altering the adaptive capacity of the agricultural system or facilitating specific adaptations. For example, deliberate crops selection and distribution strategies across different agriclimatic zones, substitution of new crops for old ones and resource substitution induced by scarcity.
Farm level analyses have shown that large reductions in adverse impacts from climate change are possible when adaptation is fully implemented. Short-term adjustments are seen as autonomous in the sense that no other sectors (e.g. policy, research etc.) are needed in their development and implementation.
Long-term adaptations are major structural changes to overcome adversity such as changes in land-use to maximize yield under new conditions; application of new technologies; new land management techniques; and water-use efficiency related techniques. FAO defines the following “major classes of adaptation”:
- seasonal changes and sowing dates;
- different variety or species;
- water supply and irrigation system;
- other inputs (fertilizer, tillage methods, grain drying, other field operations);
- new crop varieties;
- forest fire management, promotion of agroforestry, adaptive management with suitable species and silvicultural practices (FAO, 2005).
Accordingly, types of responses include”
- reduction of food security risk;
- identifying present vulnerabilities;
- adjusting agricultural research priorities;
- protecting genetic resources and intellectual property rights;
- strengthening agricultural extension and communication systems;
- adjustment in commodity and trade policy;
- increased training and education;
- identification and promotion of (micro-) climatic benefits and environmental services of trees and forests (FAO, 2005).
The sowing dates of spring crops in Bulgaria could shift under the GCM climate change scenarios in order to reduce the yield loss caused by temperature increase. The selection of an earlier sowing date for maize will probably be the appropriate response to offset the negative effect of a potential increase in temperature. This change in planting date will allow for the crop to develop during a period of the year with lower temperatures, thereby decreasing developmental rates and increasing the growth duration, especially the grain filling period. The

Vulnerability assessment, climate change impacts and adaptation measures 170
results show that the sowing date of maize for the experimental station Carev Brod (northeast Bulgaria) should occur at least 2 weeks earlier in the 2080s under the ECHAM4 scenario, relative to the current climate conditions. It should be noted, however, that although changes in sowing date are a no-cost decision that can be taken at the farm-level, a large shift in sowing dates probably would interfere with the agro-technological management of other crops, grown during the remainder of the year.
Another option for adaptation is to use different hybrids and cultivars. There is an opportunity for cultivation of more productive, later or earlier-maturing, disease and pest tolerant hybrids and cultivars. Switching from maize hybrids with a long to a short or very short growing season projected an additional decrease of final yield under a potential warming in Bulgaria. However, using hybrids with a medium growing season would be beneficial for maize productivity. Technological innovations, including the development of new crop hybrids and cultivars that may be bred to better match the changing climate, are considered as a promising adaptation strategy. However, the cost of these innovations is still unclear.
Results from the adaptation assessments suggest that possible changes in sowing date and hybrid selection can reduce the negative impact of potential warming on maize yield during the next century. Changes in cropping mixtures, irrigation, and agricultural land use can be additional alternative options for adaptation in agriculture.
The adaptation measures presented bellow in relation to irrigation in the conditions of the present and future climate in Bulgaria are based on various expert assessment (for example, Vurlev, etc. 2004, Alexandrow and Slavov, 2003), documents, action plans (for example, Slavov and Ivanova 1998A, 1998b, 1999) and programs (for example, Republic of Bulgaria, 2001).
Measures for increasing irrigation and irrigated agriculture adaptation of the country towards climate changes.
The urgent necessity to undertake appropriate measures for increasing adaptation towards climate changes with warming and drought tendency is evident – not only in regard to agricultural production but also in to irrigation, which is the main factor in the fight with those tendencies, and also an element of the agricultural sector as a whole.
The objectives of the adaptation measures should be to decrease or avoid the damages from drought and from climatic changes in general, and be directed to support and maintain agricultural production at relatively high and sustainable productivity level, and also for effective and sparingly use of water resources, having full use of the built irrigation facilities. It is necessary to include activities on information dissemination about the nature of droughts, as knowing the phenomenon will diminish the sensitiveness and vulnerability o the population from their impact.
The main adaptation measures cover organizational and managerial, financial and economic, and legislative aspects of irrigation and irrigated agriculture and should aim at:
- improvement of management, use and protection of water resources in irrigated agriculture;
- improving the efficiency of the management and use of the existing irrigation facilities and elaboration of the technological and technical facilities for irrigation;
- use of rational and economically sound irrigation regimes for the irrigated crops and elaboration of the technologies for cultivation of crops in the conditions of droughts and water deficit.

Vulnerability assessment, climate change impacts and adaptation measures 171
Adaptation measures to improve management, use and protection of water resources in irrigated agriculture during climate change:
- establishing the impact of climate changes and drought on the quantity and quality of water resources used in irrigated agriculture;
- assessing the needs of water for irrigation of agricultural crops under climate changes and preparing long term projections for the required water resources to be used in agriculture.
Work is going on in various institutions like the Institute of melioration and mechanization, Institute of Water Problems, University of Architecture, Civil Engineering and Geodesy (UACEG), Institute of Soil Science and Agroecology "N. Pushkarov", Higher Institute of Agriculture, National Institute of Meteorology and Hydrology (NIMH), etc. Numerical experiments to determine the optimal dates and water quantity for irrigation of the maize for various climate scenarios are carried out in NIMH, using computer system for agrotechnological decision taking DSSAT (Alexandrov, 1998, 1999). The calculations are taken in regard to biophysical and economic analysis of the final yield and the received profit from the maize.
The ROIMPEL model of crop was also used for evaluation of vulnerability. It is a module simulation model for crops, limited by available soil – water and nitrogen, using limited data that is easy to book in. Various practices for the nitrogen and water management can be considered easily, as outside files parameters that are easy for explanation are asked. ROIMPEL gives the work day statistical data (optimally, very humid soil or very dry), that can be used for optimizing of the use of technique and the labour in the farm. The nitrogen concentrations that are possibly dangerous for underground waters pollution are possible to be received. The minimal requirements of data for soil are the constitution of the soil and class of organic substances. The minimum data for the weather, necessary for the model are the monthly values of the average daily air temperatures and the total quantity of monthly rainfall. Therefore, ROIMPEL is a very suitable model for research of climate change projects, where the disturbances, concerning the climate parameters are decreased proportionally from the GCMs on monthly base.
A Case Study on Irrigation Measures
Agroecosystems in southern Europe would be threatened mainly by reduced precipitation and subsequent increases in water scarcity. Although measures are being taken to reduce greenhouse gas emissions, and these measures will probably reduce the rate and magnitude of climate change, it is unlikely that greenhouse gas emissions can be reduced enough to stabilize climate; therefore, adaptation will be necessary. The goals of agricultural adaptation measures are the promotion to sustainable development and to minimize the impact of climate change by reducing vulnerability to its effects.
The altered temperature and precipitation databases corresponding to each of the respective climate change scenarios were used to run the CERES GENERIC 3.0 simulation model of maize. Crop management, technology, and distribution of cultivated land were assumed to be constant. Agricultural production is very sensitive to change and variation in weather conditions during the regular growing season. All the developmental processes, starting as early as the germination process immediately after planting, and as late as the ripening process during physiological maturity, are affected and controlled by temperature. All scenarios projected a shorter vegetative (sowing-silking) and reproductive (silking-full maturity) growing season of maize. These changes were driven by the temperature increases of the scenarios. Simulated grain maize yield decreases in Bulgaria were caused primarily by warming and precipitation deficit during the growing season of this crop.

Vulnerability assessment, climate change impacts and adaptation measures 172
The DSSAT Seasonal Analysis program was run in order to determine the most appropriate timing and water amount of irrigation applications under the expected climate change during the growing season of maize. Both biophysical and economic analyses were done. The strategic analysis, was done in respect to the simulated value of harvest maize yield and net return. The tested treatments of the irrigated numerical experiment assumed maize growth and development under rainfed conditions, different date(s) and water amount of irrigation. The economic analysis of the Seasonal Analysis computer program calculates means, standard deviations, maxima and minima of the economic returns, and plots these as box plots, cumulative function plots, or mean-variance diagrams. Formal strategy evaluation of all treatments is carried out using mean-Gini stochastic dominance. In contrast to the biophysical analysis returns per hectare of the 6th treatment are lower than returns of the 4th and 5th treatments due to more water being applied.
During limited precipitation in summer, irrigation facilities must be used, oriented towards design and operation of irrigation facilities, which use water resources in an economical way and have very low water transportation losses during irrigation.
Gravitee feed irrigation and flooding of beds and rice fields should be used as a last resort, only when proven to be effective.
Main and distribution canals of old irrigation systems must be coated to bring to minimum losses from filtration. Permanent canals in irrigation systems must be afforested on sufferance strips to utilize filtered water and to cover them aiming at the reduction of the physical evaporation from water surface in the canals.
Adaptation measures to improve management efficiency and use of existing irrigation systems and elaboration of technological and technical means for irrigation under climate changes:
- To prepare up-to-date strategy and new program for the rehabilitation and restructuring of irrigation management and improving the efficiency of use of the existing irrigation infrastructure;
- To change legislation and regulation in the irrigation sector taking into consideration the altered agricultural conditions, the experience from the reforms carried out so far and to ask for free use of the technologically established hydromeliorative infrastructure and service facilities on the territory of the associations;
- Preparation of information materials for water users on the benefits and good practices of agricultural crop irrigation.
Adaptation measures for use of rational and economically viable irrigation regimes for irrigated crops and elaboration of the technologies for cultivation under climate change:
- Determining the vulnerability of agricultural crops under climate changes, long term droughts and water deficit in the major agroclimatic regions in the country, respectively their impact on the quantity and quality of the yield from them;
- Reassessment of the water and irrigation norms and legislative provisions of irrigation, new zoning for the irrigated crops in the country;
- Development and application of optimized irrigation regimes for the major agricultural crops for various agroclimatic regions in the country;
- Research on the effect from irrigation and sustainability of yields under various water saving methods and irrigation technologies;

Vulnerability assessment, climate change impacts and adaptation measures 173
- Creation and application of mineral fertilization systems and integrated weed fight during cultivation of agricultural crops under irrigation conditions;
- Application of proper moisture preserving technologies and techniques for soil treatment in irrigated lands;
- Adaptation and introduction in practice of information and advisory system for irrigation necessity forecast and defining the parameters of the irrigation regime for the irrigated crops;
- Technology changes for irrigated crop cultivation in various agroclimatic regions under water shortage conditions;
- Use of new cultivars and hybrids that adapt better to water deficit.
The presented above allows the following conclusions to be drawn:
- Irrigation will be the main factor for the sustainable development of Bulgarian agriculture, giving guarantee for stable and quality plant production in years, varying in terms of the climate and accepting the challenges due to the expected periods of drought and water deficit in the years to come;
- Fast restoration and development of the irrigation sector and irrigation agriculture should become a main priority of the state policy in the agricultural sector supported by real, active and sound investment program, based on the use of national and international financial resources;
- Completion of the economic efficiency assessment of the existing irrigation facilities and taking a decision for the restoration and reconstruction of economically effective, suitable and unsuitable facilities at the present moment;
- Development and application of proper irrigation investment program for the next few years, with state subsidies aimed at the most efficient regions and such with active or to be established soon irrigation associations;
- Implementing the measure on irrigation from the SAPHARD programme;
- Reconstruction and reorganization of the existing irrigation systems, aimed at their use in the condition of water deficit, implementing proper models in representative regions in the country;
- Elaboration of the present irrigation technologies and equipment, aimed at compliance with the new needs of the irrigated cultivars and increasing their efficiency, development and use of new water saving and energy saving technologies and equipment;
- Assessment of the energy demand of the irrigation systems and developing measures to increase their energy efficiency;
- Development and application of technologies and systems for regulation and control of technological processes for distribution and use of water for irrigation;
Some economic adaptation measures, such as substitution possibilities for other crops, availability, and costs of alternative production techniques, are recommended for evaluation in the future. As in the Second National Communication the other major adaptation measures under consideration in Bulgaria are:

Vulnerability assessment, climate change impacts and adaptation measures 174
New zoning of the agroclimatic resources and agricultural crops
- Expanding areas of the most important agricultural crops over new regions characterized by improved thermal and moisture conditions.
- Utilization of a variety of cultivars and hybrids, especially long-maturing, high-productive cultivars and hybrids with better industrial qualities.
- Cultivation of new agricultural crops grown with Mediterranean origin.
New cultivars and hybrids to be adapted to climate change
- The new cultivars of winter agricultural crops to pass through the winter season organogenesis under higher temperatures without deviations from the normal crop growth and development.
- The new cultivars and hybrids to be with higher dry-resistance, especially at the end of the vegetative period and at the beginning of the reproductive period.
- Higher maximal air temperatures not to provoke thermal stress effects, especially during crop flowering and formation of the reproductive organs.
- The new cultivars and hybrids to grow and photosynthesis under an increased concentration of carbon dioxide.
Optimization of soil treatment
- Optimal dates and terms of sowing of main crops.
- Soil monitoring.
- Measures for improvement of the water content in soils.
- Measures to improve the soil structure and performance.
- Actions against erosion and for better nutrition mode.
- Up-to-date technologies in soil treatment that keep soil water and structure.
- Effective use of mineral fertilizers relevant to the soils diversity.
- Overcoming of the misbalance of the main nutrients and normalization of the mineral/organic fertilizers ratio.
Adaptation phytosanitary measures
- Development of special sub-models incorporated into models of agro-ecosystems which simulate plant-protection situations, related to climate change.
- Assessment of already used pesticides and the way of their utilization and potential effectiveness of the chemical method against crop diseases and pests.
- Improving technologies for plant protection and priority development of non-chemical methods against crop diseases and pests.
- Improving the monitoring for the phytosanitary situation in the country.

Vulnerability assessment, climate change impacts and adaptation measures 175
6.4.2. Forestry
6.4.2.1.Summary
For the forests in the low parts of the country (under 800 m a.s.l.), where the most significant impact from climate change is expected, the strategic objective of the management must be adaptation towards drought and improving forest sustainability.
For the forests in the higher parts of the country, i.e. those above 800 m a.s.l., where expected changes are not likely to be drastic, the objectives are preservation of biodiversity, eco system sustainability, multifunctional management, system of protected nature territories.
The natural and introduced forest wood and shrub species in Bulgaria have great potential for a good adaptation towards possible climate change in the present century.
Through planned felling of young plantations, the vital space of the remaining woods is improved and so is their light and water regime. This is also an approach to improve the possibilities for adaptation of wood plantations, resulting in increased biomass. Forest management projects forecast an annual growth of 120 000 ha with an average use of 2 801 800 m3.
The forest fund covers 4.1 million ha, which is 37 % of the Bulgarian territory. Broadleaved forests account for 68 percent of the forest area, and conifers account for 32 percent of the area. The Bulgarian forests are relatively young forests with an average age of about 51 years. Its total growing stock is 591 million m3 with an annual increment of 14 million m3. In 2008, 50 % of the annual increment was harvested, exactly 7.31 million m3, of which ¾ have been used by the Bulgarian forest products industry and ¼ was used as fuel wood. ¾ of the Bulgarian forests are state owned, while the rest is owned by private individuals, companies, municipalities and institutions. The GDP contribution of the sector is 2.5 %. There app. 150,000 people are directly employed in the sector, primarily in rural areas and there are thousands of local timber based manufacturers and small scaled industries. On the territory of the country a few big and international oriented pulp, paper and board producers, which exports 90 % of its production.
The forests give wide range of essential public products and services; such as water production, protection functions, erosion control, fire prevention, social timber supply, etc.
One of the most important ecological function of the forests at the moment is the prevention/reduction of climate changes through carbon absorption. Forests are also natural obstacle against degradation and soil erosion and its desertification and influence very much the water balance.
Table 6.7 shows the data of the distribution of the forest area (by forest types) for the period 1988-2008.
During the last 50 years about 1.5 million ha forests are forested. The main aims of these forestations were increase of forest area, their productivity and soil erosion control. Bulgarian forests provide about 85 % of the water flow in the country or nearly 3.6 billion m3 of clear drinkable water. They play a significant role for decreasing the emissions of greenhouse gases in the atmosphere accumulating carbon in the biomass through CO2 absorption.
As a country signatory to the Pan-European process for the protection of forests, to the UN Convention on Climate change (the Kyoto Protocol respectively), Bulgaria defined its support for the effective production and usage of bio-energy from renewable forest resources, managed in a sustainable way, as a main priority in its national forest policy.
Along with this the Executive Forest Agency directs its efforts towards ensuring additional energy resources by means of establishing new forests and plantations. A great potential in that

Vulnerability assessment, climate change impacts and adaptation measures 176
respect is available, considering the large areas of burnt forests and abandoned agricultural lands. (Table 6.6)
Table 6.6 Potential of the forestry areas for establishing new forests and plantations.
Incl.
year
Total non-forested
area, subject for forestation
Burned areas
Bare areas
Harvested areas
ha 1988 132 693 1 233 98 350 33 110 1989 132 245 1 060 98 357 32 828 1990 132 553 1 496 97 399 33 658 1991 132 413 1 670 95 857 34 886 1992 131 373 2 456 96 264 32 653 1993 139 305 7 194 95 053 37 058 1994 121 610 6 437 91 252 29 321 1995 121 391 7 028 92 588 21 775 1996 121 478 4 530 90 595 26 353 1997 121 066 3 802 90 337 26 927 1998 120 190 3 619 87 138 29 433 1999 123 647 9 637 84 212 29 798 2000 138 671 22 049 83 961 32 661 2001 138 472 21 882 86 036 30 554 2002 126 418 15 377 82 180 28 861 2003 117 419 10 233 78 280 28 906 2004 108 549 5 943 77 829 24 777 2005 96 121 2 746 74 369 19 006 2006 95 230 3 200 74 365 17 665 2007 93 081 5 364 71 612 16 105 2008 78 898 5 189 61 562 12 147

Vulnerability assessment, climate change impacts and adaptation measures 177
Table 6.7 Economic impacts of distribution of the forest area (by forest types) for the period 1988-2008.
Coniferous Broadleaved year
Total forest area
Total forested area with
Pinus mugo
Pinus mugo Total Forested Total Forested
Total forested
area without Pinus mugo
Unforested area subject
to forestation
Non-wood production designated forest area
Forest pastures
1988 3 868 330 3 363 768 21 646 1 331 974 1 214 567 2 536 356 2 149 201 3 342 122 132 693 285 834 106 801 1989 3 870 819 3 366 629 20 939 1 328 635 1 212 127 2 542 184 2 154 502 3 345 690 132 245 283 182 108 813 1990 3 871 447 3 334 140 7 048 1 330 126 1 212 952 2 541 321 2 114 140 3 327 092 132 553 281 714 109 148 1991 3 873 543 3 351 538 20 940 1 327 665 1 210 554 2 023 873 2 120 044 3 330 598 132 413 281 118 108 474 1992 3 872 938 3 350 747 21 269 1 323 072 1 205 504 2 027 675 2 123 974 3 329 478 131 373 280 735 110 083 1993 3 897 384 3 366 707 21 541 1 317 841 1 196 968 2 048 866 2 148 198 3 345 166 139 305 282 627 108 745 1994 3 675 786 3 176 092 21 982 1 244 738 1 127 780 1 931 354 2 026 330 3 154 110 121 610 269 097 108 987 1995 3 876 272 3 356 876 22 620 1 304 293 1 176 919 2 052 583 2 157 337 3 334 256 121 391 291 157 106 848 1996 3 878 405 3 354 933 22 555 1 293 269 1 166 773 2 061 664 2 165 605 3 332 378 121 478 295 057 106 937 1997 3 878 794 3 353 101 22 627 1 280 960 1 154 646 2 072 141 2 175 828 3 330 474 121 066 297 485 107 142 1998 3 899 655 3 371 269 22 654 1 280 162 1 149 474 2 091 107 2 199 141 3 348 615 120 190 301 068 107 128 1999 3 794 797 3 296 984 709 1 188 794 1 073 354 2 108 190 2 222 921 3 296 275 123 647 275 952 98 214 2000 3 914 355 3 398 307 23 190 1 282 319 1 137 837 2 115 988 2 237 280 3 375 117 138 671 295 832 81 545 2001 3 980 032 3 464 572 23 770 1 296 790 1 147 552 2 167 782 2 293 250 3 440 802 138 472 298 233 78 755 2002 4 003 755 3 512 623 23 760 1 291 264 1 145 711 2 221 359 2 343 152 3 488 863 126 418 302 027 62 687 2003 4 015 236 3 547 456 21 172 1 288 758 1 147 712 2 258 698 2 378 572 3 526 284 117 419 298 846 51 515 2004 4 063 555 3 648 005 23 313 1 288 331 1 150 649 2 359 674 2 474 043 3 624 692 108 549 303 056 3 945 2005 4 076 464 3 674 320 23 077 1 278 514 1 147 348 2 395 806 2 503 895 3 651 243 96 121 302 792 3 231 2006 4 089 762 3 691 868 23 073 1 271 344 1 142 599 2 420 524 2 526 196 3 668 795 95 230 301 429 1 235 2007 4 108 494 3 704 015 23 631 1 277 494 1 138 444 2 426 521 2 541 940 3 680 384 93 081 310 889 509 2008 4 114 552 3 721 451 23 640 1 279 809 1 142 306 2 441 642 2 555 505 3 697 811 78 898 314 205 0

Vulnerability assessment, climate change impacts and adaptation measures 178
6.4.2.2.Policies and measures and their effect
Very important for forest restoration, resp. for CO2 absorption has Art. 42 (2) of Forestry act:
“Art. 42. (amend. SG 16/03) (1) (amend. – SG 64/07; amend. – SG 80/09) The afforestation in the forest fund shall be carried out according to the forest development projects, technical projects for fighting with the erosion and landslides, plans and programmes under the conditions and by the order, determined with ordinance by the Minister of Agriculture and Food.
(2) (amend. – SG 43/08) Not renewed felling grounds and fire plots from the forest fund shall be afforested by their owner up to two years after felling or fire. If there are objective reasons the term can be extended by the director of the regional directorate of forestry with one year.”
The Bulgarian Government Programme 2009-2013 has identified the following main priorities in the area of forestry:
“Improvement of the protection and support of adaptation of Bulgarian forests to climate changes
Measures
- Improvement of the forest database through implementation of remote sensing technology. Adoption of National forest inventory as Pan-European method for control of forest management plans.
- Statutory prohibition for forest land exchange and the change of the purpose of forest land for the period of 20 years, except for important public services
- Formation of inter-institutional scientific board, participation in realization and implementation of European and world projects and initiatives, regarding prevention and adaptation of forest to climate change
- Adoption of measures for forest protection and forest safeguarding together with police services, NGO’s, municipalities, etc.
- Updating the National plan for forest fire prevention and protection and improvement of the control of the activities against forest fires.
- Development and adoption of updated close to nature regimes for forest management in the protected areas and NATURA 2000 sites.
- Public awareness campaigns for forest benefits and the ways of their protection
- Implementation of the common European methods for evaluation of non-wood forest functions and services and their future financial and functional support. Coordination of the implementation of the principle “The user pays” for forest resources, together with all stakeholders.
- Stimulating the biological production of products and extension of ecological services in the forests. “
In addition to the above stated the contribution of the Rural Development Programme to climate change combat is realized through acceleration of the CO2 absorption in the atmosphere – strengthening the CO2 absorption through forestation of different territories. The total measured quantity, equivalent to CO2, fixed through afforestated or reforested areas within the Rural development Programme is about 1.4 million tones. This is an expert estimation, based on the study of the annual forest growth during their whole life cycle and prognosis for the CO2 absorption rate.

Vulnerability assessment, climate change impacts and adaptation measures 179
This will be realized through two so called “Forest measures” closely related to forestation and climate change impact:
Afforestation of non-agricultural lands - Measure 223
Main aims of the measure:
- Increasing the forest cover with the aim contribution to the climate change mitigation and increasing the biodiversity
- Reducing soil erosion and protection of the lands from marginalization
- Improvement of the water balance in the strengthen territories
Restoration of forest capacity and implementation of preventive activities - Measure 226
Main aims of the measure:
- Restoration of the forests, damaged by forest fires or other natural disasters – Reforestation of the affected forests, using native tree species; Increasing the tree species diversity through transformation of the coniferous ecosystems in mixed forest or broadleaved ecosystems
- Improving the prevention activities for combat against forest fires.
6.4.2.3.Vulnerability assessment, climate change influence and adaptation measures
The main natural disasters in Bulgaria are forest fires, floods, wind throws and disturbances by insects. Recently these seriously damage the Bulgarian forests. During the last 5 years more than 500 thousands ha forests were damaged by forest fires. Most of them (about 80 %) are not restored until now. These forest territories are with high capacity to be damaged further by insects and diseases and they contribute to soil erosion and floods. In addition private forest owners do not have enough financial resources to restore these forest areas. Without financial support these forest areas will be transformed in abandoned.
Other natural disasters important for forests are wind throws. During the last 5 years more than 120 thousands m3 (250 thousands ha) are damaged. Only 50 % from these forests are restored and mainly In state forest fund. As a result huge damaged territory I still not restored like the areas damaged by forest fires, especially in small private and communal forest lands.
These serious threats for Bulgarian forests lead to loss of capacity for CO2 absorption and production of forest products.
Without financial funding from the rural Development Programme, forest areas will be further damaged and the damaged areas will not be restored.
37 % of the territory of Bulgaria are forests, which are distributed mainly in mountain areas. The main regions with intensive agriculture are in northern Bulgaria and around Maritsa river and are with forest cover less than 10 %. A big part of the former agriculture lands in mountain and semi-mountain regions is still not used, which leads to big ecological, social and economic problems.
In the plains, because of the low forest cover, the forests and other forest lands are divided in pieces. For protection of biodiversity at least natural bridges are needed.
In addition the extension of forest resources contributes to the climate change combat and increases CO2 absorption. For this purpose the abandoned agricultural lands have huge capacity, because of the appropriate conditions for fast growth of the young forests.

Vulnerability assessment, climate change impacts and adaptation measures 180
In the mountain areas there is high level of land degradation and regressive succession. These areas lose soil as a result from wind and water erosion. Their opportunities to combat with natural disasters like floods, soil erosion and to improve the water quality are very small.
Through increasing the forest cover (with native tree species) the water balance in the adjacent territories will be improved, which is important problem for the southeast countries. (Table 6.8)
Table 6.8 Forest cover and non-forestry areas
including.
year
Total forest area
not designated for wood
production Arable
land meado
ws lawns nurseries Roads,
openings
rocks, rivers, screes
hectares 1988 285 834 3 301 1 881 85 241 2 654 25 630 167 1271989 283 182 4 125 1 804 86 434 2 637 30 215 157 9671990 281 714 4 077 1 848 87 762 2 634 31 706 153 6671991 281 118 4 082 1 885 87 420 2 703 32 554 152 4741992 280 735 3 948 1 881 88 449 2 667 33 172 150 6171993 282 627 4 416 1 942 89 479 2 555 33 803 150 4321994 269 097 4 821 1 902 86 158 2 298 32 011 141 9071995 291 157 4 991 1 957 97 418 2 406 36 186 148 1991996 295 057 5 518 2 086 101 325 4 096 36 954 145 0781997 297 485 4 916 1 993 103 437 2 263 37 557 147 3191998 301 068 4 820 2 119 106 120 2 300 39 091 146 6181999 275 952 5 800 2 004 98 300 2 494 35 420 131 9342000 295 832 4 659 4 001 104 203 2 344 37 610 143 0152001 298 233 6 041 2 809 105 682 2 499 38 215 142 9872002 302 027 4 515 4 105 108 649 2 898 39 564 142 2962003 298 846 4 589 3 236 109 518 2 551 338 812 140 1402004 303 056 4 294 4 620 110 883 2 292 40 273 140 6942005 302 792 4 178 4 389 109 328 2 146 42 201 140 5502006 301 429 4 155 4 645 108 803 2 037 42 657 139 1322007 310 889 4 239 3 934 110 508 2 027 43 442 146 7392008 314 205 4 782 4 138 112 961 2 034 43 426 146 863
Some 1.5 million hectares have been afforested during the last 50 years. By 1989 the rate of afforestation had decreased significantly (5,000 - 7, 000 ha per year) while some 15,000 ha was envisaged in the Forest Management Plans (FMPs). The decline in afforestation was due to a decrease in the level of investment and increased priority for natural regeneration.
Sustainability of forest plantations is achieved by an increase in the proportion of native broadleaved tree species, a decrease in the initial stocking rate of plantations, the establishment of mixed plantations and afforestation using forest tree and shrub species in their natural areas. Establishment operations are undertaken principally on state forest fund territories and particularly on areas destroyed by fire, stands and plantations damaged by drought, clearings and bare areas.
The reserve for the future expansion of the forests is estimated as nearly 300 000 ha. According to expert evaluation there are about 100 000 ha of bare lands, suitable for afforestation.

Vulnerability assessment, climate change impacts and adaptation measures 181
There are some regulatory preconditions - internal (amendments to the Law on Forest) and external (mechanisms for mutual implementation of the Kyoto Protocol) - for ensuring sustainable contribution of our country towards decreasing CO2 emissions and increasing renewable energy sources through the establishment of new forests, including plantations for biomass.
An especially important task for the management of forest resources, particularly in that part of the country – with an altitude of up to 800 m, is the implementation of the activities concerning the adapting of forest vegetation to the climate changes.
The average growing stock per hectare in 2008 was 159 m3. During the last 35 years the total growing stock more than doubled from 252.2 million m3 in 1965 to 591 million m3 in 2008. Total annual increment of the forests is estimated as 14 million m3.
The large-scale afforestation activities from the middle of the last century resulted in a sudden increase in the area covered by coniferous forest. After 1990 the area of conifer forests started to decline and at the end of 2008 represented only 30.2 % of the forest area. This trend is expected to continue into the future.
The forest area managed mainly for the purpose of harvesting and environmental functions during 2008 was 68.1 %; protective forests and forests for recreation represented 19.8 % and the forests and lands in protected areas covered 8.2 % of the forest fund of the country. Some 13.4 % of Bulgarian forests have as a primary function the protection of the soil against erosion and water balance maintenance.
In the context of the regulated carbon markets, forestry and land-use projects have played a very small role in producing emission reductions so far, even though it is estimated that around 20 percent of greenhouse gases emissions globally are linked to the forestry and land-use sector. On the voluntary market the picture is quite different, with forestry projects representing as much as 15 percent of all projects in 2007.
At this point, there is not much time left to establish JI (Joint Implementation) afforestation projects before the end of the first commitment period in 2012. A requirement under the Kyoto Protocol and JI is that for the first commitment period, reforestation activities are limited to reforestation occurring on lands that did not contain forest on 31 December, 1989. In Bulgaria this means that eligible areas to a great extent are limited to abandoned agricultural lands.
Developing both reforestation and forest management projects under a GIS (Green Investment Schemes) would, to a large extent, tackle some of the limitations related to JI forestry projects mentioned above. Under a GIS the period of implementation and generation of the emission reduction can go beyond 2012. A GIS would also not be limited to afforestation activities, and potentially simplified methodologies for measuring emission reductions could be applied. However, the development of a GIS in Bulgaria is uncertain at this point.
Developing carbon forestry projects for the voluntary market is another possibility that should be explored. Again some of the limitations associated with JI projects could be mitigated. Since buyers on the voluntary market are not necessarily time bound by a dated emissions reduction target, the project implementation period can be longer.
Another opportunity that needs to be considered in the forestry sector is the use of biomass in energy production. The use of local fuel-wood and wood waste (bark, shavings, etc.), industrial waste wood, or agricultural residues for heating, energy production, or combined heat and power plants could have a large potential in rural areas in Bulgaria. Improved forest management and thinning operations could increase the access to fuel-wood and wood waste. The benefits would potentially include lower fuel costs, reduced local air pollution, and access to locally-produced

Vulnerability assessment, climate change impacts and adaptation measures 182
energy sources. The greenhouse gases emission reductions depend on the fuel that is replaced. In addition methane emissions from the decay of wood waste would be reduced, which could also have large emission reduction and carbon revenue potential. Carbon revenues could be generated from the emission reductions associated with switching fuels (from a carbon intensive fuel like mazut to a relatively less carbon intensive fuel source like wood).
6.4.3. Soils
Soil diversity in Bulgaria is enormous. Soils have different characteristics, fertility and vulnerability to climate change. The temperature rise will increase the water deficit in soils with low precipitation rates that are prone to droughts. The most serious impacts will be observed for soils with light mechanical content and bad water characteristics and partly for heavy clay soils. About 30 % of the soils in Bulgaria are prone to wind erosion.
Optimization of soil treatment includes:
- Choice of optimal dates and terms for the collection of major crops;
- Soil monitoring;
- Measures for improvement water content in soils;
- Measures to improve soil structure and characteristics;
- Actions against erosion and for better nutrition mode;
- Up-to-date technologies for soil treatment, preserving the moisture and soil texture;
- Melioration of poor soils;
- Effective use of mineral fertilizers, relevant to various soils.

Financial resources and transfer of technology 183
7. FINANCIAL RESOURCES AND TRANSFER OF TECHNOLOGY
7.1. Provision of .new and additional. financial resources
This is not applicable for Bulgaria.
7.2. Assistance to developing country Parties that are particularly vulnerable to climate change
This is not applicable for Bulgaria.
7.3. Provision of financial resources, including financial resources under Article 11 of the Kyoto Protocol
This is not applicable for Bulgaria.
7.4. Activities related to transfer of technology
This is not applicable for Bulgaria.
Despite the fact that Bulgaria is an Annex I Party of the UNFCCC, as a country with economy in transition status under the Convention, it has no commitments to provide financial resources and technology transfer to developing countries. The country rather accepts financial and technological help, mainly within the framework of the Joint Implementation (JI) mechanism.
The Republic of Bulgaria being a country in Currency Board and its restrictions imposed does not have significant own financial resources for the management of its environmental policy and relies mainly of different forms of international cooperation.
At present, as a new EU member, Bulgaria is a recipient of technology transfer support and uses various EU funds that facilitate the country’s ability to reach compliance with certain environmental standards, as well as to carry on an improved environmental policy. For the continuation of this tendency contributes the growth of foreign investments and international cooperation. The foreign developmental cooperation of the Republic of Bulgaria has exhibited a constant increase in recent years that is as result of the country membership in the EU.
In terms of technology transfer, as a country in transition, Bulgaria has no obligations to support technology transfer, under Article 11 of the Kyoto Protocol, for countries out of Annex I of the Convention.
National and international sources for financing of environmental policy, including climate change mitigation measures in Bulgaria
The main national and international sources for financing of environmental policy, including climate change mitigation measures to be put into practice are:
- National: State budget; National Trust Eco Fund
- EU Environmental Funds: “Operational Programme Environment 2007-2013”, ISPA, “The PHARE-Programme” and “Programme SAPARD”

Financial resources and transfer of technology 184
- Other EU Funds, Programs and Initiatives
- International: Within the framework of the Joint Implementation (JI) mechanism under the Kyoto Protocol, Green investment scheme, Bilateral cooperation agreements, International organizations and Financial institutions
State budget: Each year, in addition to the Annex to the Law on the State Budget of the Republic of Bulgaria, the financing of environmental installations and sites at the municipalities is approved such as: municipal waste water treatment plants, collectors to them, sewage pumping stations, municipal solid waste landfills for household waste, etc.
Also, in the draft of the Law on the State Budget, in addition to the List of environmental installations and sites, envisaged for construction are included not completed projects from the previous year, which are transitional; some of them are co-financing from foreign donor programs; listed in the National waste management program and the National program for priority construction of urban waste water treatment plants and collectors for settlements of over 10 000 population equivalent, adopted by the Council of Ministers.
National Trust Eco Fund: The fund has been established as independent legal entity by the Law for Environmental protection to manage the funds, given to Bulgaria as a grant by the government of the Swiss Confederation during the swap deal “Debt for Environment” between Bulgaria, Switzerland and other donors. Priority areas of the fund are: elimination of past damages to the environment, reduction of air pollution, protection of water purity and protection of biodiversity.
“Operational Programme Environment 2007-2013” (OPE) sets the country strategic objectives and priorities in environment sector. It is directed to implementation of the commitments taken in the negotiation process in the sector and achievement of compliance with EU requirements in the field of environment.
OPE sets the objectives, priorities and types of activities to be financed, following the national policy in environmental protection as well as EU policy and legislation.
The two funds providing financing in the field of environment:
- European Regional Development Fund (ЕRDF) - aimed at strengthening the economic and social cohesion in the EU, recovering the disturbed balance between the regions. ERDF finances direct aid to research and innovation, telecommunications, environment, energy and transport, financial instruments (capital risk funds, local development funds, etc.) to support regional and local development.
- Cohesion Fund (CF) - aimed at helping less developed member states to overcome the economic and social situation and stabilize their economy.
Until end of year 2009 more of 260 projects are approved to be financed by Operational Programme Environment up to year 2013. The projects are in sectors: Waste water treatment, Drinking water, Waste management and Landfills construction and Biodiversity.
As a member of European Union the Republic of Bulgaria for some measures in its environmental policy has opportunity to use finance means by follow funds and programs:
European Regional Development Fund 2007 – 2013:
- The Urban Development Network (Programme URBACT II - An Exchange and learning programme for cities contributing to the European Commission Initiative “Regions For Economic Change”);
Financial resources and transfer of technology 185
- Interregional Cooperation Programme “INTERREG IVC” (Contributing to the European Commission Initiative “Regions for Economic Change”;
South East Europe (SEE) - Transnational Co-operation Programme for a moving European area in transition on the way to integration;
ESPON 2013 Programme - European observation network on territorial development and cohesion, adopted by European Commission Decision C(2007) 5313 of 7 November 2007;
Good Governance of Territorial Cooperation Programmes INTERACT 2007-2013 under the “European Territorial Cooperation” Objective based on Article 6 pt. 3 lit. b of Regulation 1080/06
IPA Cross-Border Programs:
BULGARIA – SERBIA (CCI Number: 2007CB16IPO006);
BULGARIA - THE FORMER YUGOSLAV RЕPUBLIC OF MACEDONIA (CCI Number: 2007CB16IPO007);
BULGARIA – TURKEY (CCI Number: 2007CB16IPO008;
Cross-Border Cooperation Programme ROMANIA – BULGARIA 2007-2013;
European Territorial Cooperation Programme GREECE-BULGARIA 2007-2013;
Joint Operational Programme Black Sea Basin 2007-2013;
The Joint Implementation Mechanism in Bulgaria.
The position of the Republic of Bulgaria on Joint Implementation Mechanism (JI) according to Article 6 of the Kyoto Protocol under the UNFCCC is as follows: JI is economically effective and it allows GHG emission reductions under minimal expenses. The JI mechanism contributes to more easy and rapid introduction of the new and “state of art” technologies in the country.
Bulgaria is amongst the first Annex I countries in the world which hosted JI projects. As a result, the country has already gained experience in various aspects of the JI mechanism, amongst which: A number of memorandums of understanding/Cooperation agreements were concluded with other Annex I countries, consultancy on the possibilities for realization of JI projects was implemented, procedures for support and approval of JI projects on both Track 1 and Track 2 were adopted, 26 JI projects were approved (25 on Track 1 and 1 on Track 2), transactions of verified emission reductions were made to 15 of the projects.
The Climate Change Policy Directorate within MOEW is responsible for the application of the flexible mechanisms of the Kyoto Protocol and for the execution of the procedures for assessment, approval and administration of JI projects in Bulgaria. The Directorate is also responsible for the application of the EU Climate Change Policy in Bulgaria.
The legislation on JI projects in Bulgaria includes the Laws on ratification of the UNFCCC and the Kyoto Protocol, the Environmental Protection Act and the national guidelines for approval of JI projects under Track 1 and Track 2.
A procedure for approval of JI projects has been set and is in place, and it requires the assessment of each project by a Steering Committee for JI projects (SC JI). The committee is formed by Order of the Minister of Environment and Water and consists of members – experts from different institutions concerned – the Ministry of Environment and Water, the Ministry of Economy, Energy and Tourism, the Ministry of Finance, the Ministry of Regional Development and Public Works, the Ministry of Agriculture and Food, the Ministry of Transport, Information

Financial resources and transfer of technology 186
Technology and Communications, the Ministry of Foreign Affairs, the Executive Environment Agency, the Energy Efficiency Agency and the Executive Forestry Agency. The Committee is chaired by Deputy Minister of MOEW. The SC evaluates proposed projects according to the existing internal environmental criteria and the JI national guidelines on Track 1 and Track 2. The SC advises the Minister of Environment and Water in issuing/not issuing a Letter of Approval for each particular project proposal.
Several Memorandums of Understanding/Cooperation Agreements have been signed aimed at JI cooperation with: The Kingdom of Netherlands, The Swiss Confederation, The Kingdom of Denmark, Republic of Austria, the Kingdom of Belgium, Prototype carbon Fund at World Bank, Japan and the Kingdom of Sweden. Since the adoption of the national guideline for approval of JI projects under Track 1 in April 2010, Memorandums of understanding/ Cooperation Agreements are no longer a necessary condition for approval of new projects. The Track 1 national guideline allows every Annex I country to be a buyer of projects’ emission reductions.
As it is mentioned above, Bulgaria considers that the Joint Implementation mechanism is important initiative for attraction of investments in energy efficiency, renewable energy sources, cogeneration and new low carbon or carbon-less technologies.
The JI projects for which Letter of Support and JI projects for which Letter of Approval have been issued by MOEW are listed bellow:
Letter of Support:
Biomass steam boiler in Vinprom Peshtera.
Letter of Approval
Portfolio of new co-generation power stations for combined production of heat and electricity in District heating system Pleven and District heating system Veliko Turnovo, Bulgaria;
New co-generation power station for combined production of heat and electricity in District heating Bourgas, Bulgaria;
Cogeneration gas power station AKB Fores PLC Financial Industrial Group;
Cogeneration power station Biovet;
TPP Plovdiv South co-generation project;
Industrial Energy Efficiency and cogeneration, Nikopol;
Energy efficiency investment program at Svilocell Pulp Mill, Bulgaria;
Bulgarian Energy Efficiency and Renewable Energy Portfolio Project;
Biomass and Energy Efficiency Project, Paper Factory Stambolijski;
Biomass Utilization in Svilosa Inc;
Rehabilitation of District heating system in Sofia;
Rehabilitation of District heating system in Pernik;
Reduction of greenhouse gas by gasification in Varna Municipality;
Reduction of GHG by gasification of Sofia municipality;
Reduction of GHG by gasification of the towns of Veliko Turnovo, Gorna Oryahovitsa and Lyaskovets;

Financial resources and transfer of technology 187
Reduction of greenhouse gases by gasification of Burgas Municipality;
Vacha Cascade JI Project;
Rehabilitation of Dolna Arda hydropower cascade;
Sreden Iskar cascade HPP portfolio project in Bulgaria;
Small Hydropower Station SHPS Potochnitsa;
Bulgarian Small Hydro Power Plants (SHPP) portfolio;
Kaliakra Wind Power Plant;
Methane capture and electricity production at Kubratovo WwTW, Sofia, Bulgaria;
Reduction of N2O at Agropolychim Devnya;
Sunflower and rape seed - bio diesel fuel production and use for transportation in Bulgaria;
Emission Reduction of Nitrous Oxide in Nitric Acid Production at Neochim PLC.
There were no any emission reductions’ transfers from the Bulgaria National Registry to the registries of other countries up to the end of 2009 but in 2010, 3 329 743 emission reductions generated by 13 approved Joint Implementation projects were transferred towards Nederland, Japan, Denmark ect. This process continues in 2011 as 1 954 312 emission reductions were transferred to 15 projects by August.
At present, the approval of new projects, leading to direct or indirect reduction of emissions of installations under EU ETS, is impossible in practice because of the necessity EU allowances to be cancelled when ERUs are transferred to the buyer. These are allowances from the set aside of allowances for avoiding the so called double counting of greenhouse gas emission reductions for JI projects, on the account of allowances for the installations covered by the EU ETS. For that reason the Bulgarian government refrains from approval of new projects of installations under the EU ETS sector to the end of 2012. Eligible for approval are projects that do not lead to direct or indirect double counting.
During the second trading period (2008-2012) the maximum share of ERU and CER, which can be used to fulfil the operators’ obligations, is limited to 12,5 % of their allocated allowances for the entire period. The Bulgarian EU ETS installations will appear as buyers to the secondary ERU and CER market.
7.5. Information under Article 10 of the Kyoto Protocol
The country has not formulated programs to improve the quality of local emission factors, activity data and models which reflect national conditions. The country is more active in the field of development and implementation of national programs containing measures to mitigate climate change. The First National Climate Change Action Plan was developed in 1999 and approved by the Government in 2000. The Second National Action Plan on Climate Change (SNAPCC) was developed in the period 2003-2004 and approved by the Government in 2004. The Plan envisions a set of coordinated actions in line with Bulgaria’s international obligations in the context of UNFCCC as well as the Climate Change Program of the European Union (EU). The Plan covers the period 2005-2008. The cumulative effects from the applied measures in respect of GHG emission reductions are annually evaluated.

Financial resources and transfer of technology 188
The Second SNAPCC defines mainly the legislative framework and the institutional structure, requirable for implementing the climate change-related policies executing Bulgaria’s obligations to the UNFCCC and the Kyoto Protocol.
The evaluation of the plan fulfilment was performed in 2009. Essentially the plan assessment was a procedure of evaluation of the policies and measures in it. The implemented extensive analysis gives possibility for synonymous answers to questions like:
Is the purpose of the plan set correctly?
Is it correctly estimated what measures are necessary and are they precisely formulated and addressed to the relevant institutions?
The analysis shows that the purpose is set correctly and the measures are addressed precisely. The measures, provided in the plan were conformed with actions for their implementation on national and European level. The post analysis showed that despite the declarations of some branches, the conditions for measure implementation are changed and for some of them the provided potential is not realized. Some of the provided actions dropped out and the measures were not realized in optimum degree.
The negative moments are reported in the assessment. The key question for every plan is – are the emissions reduced in absolute rate and as a trend and what is the proportion between the economy growth and the growth/reduction of the emissions.
As far as the correct introduction of specific European Directives and Decisions is necessary condition for the successful implementation of some measures, the necessary legislation acts and documents are described in detail in the development. It is shown how their non-introduction discredits the implementation of specific measures.
The implementation of the provided in the Second Plan policies and measures is analysed in detail It was concluded that they are mostly realized and they led to GHG emissions for unit GDP reduction of the order of 15 % from the annual emissions of the country for the accounted period.
On the basis of new programs, initiatives and decisions of EU new policies and measures are formulated, which shall be an object of the new Third Climate Change Action Plan that is scheduled to be developed in 2012.
Research projects and systematic observation 189
8. RESEARCH PROJECTS AND SYSTEMATIC OBSERVATION
8.1. General policy on research and systematic observation
Green Paper on European Research Area except the emphasis on regional cooperation recommends "the creation of joint programs for research driven society”. Therefore, the overall objective of a general policy on research and systematic observations is: strengthening and development of the national scientific potential, and providing public information on: monitoring, evaluation and forecasting of the situation and global changes in the system: atmosphere-biosphere-hydrosphere and analysis of the impact on socio-economic sectors of society and natural ecosystems in the region of Balkans and Black Sea basin. Specific objectives include: 1.) Conduct interdisciplinary research aimed at scientific and application service of socio-economic sectors of society in the country and region 2.) Maintenance and upgrading of existing and new components of the monitoring networks, assessment and analysis of state and changes in the atmosphere, biosphere, hydrosphere 3.) Development and improvement of methods, models and systems for forecasting the short, medium and long-term changes in atmosphere and related hazardous weather phenomena and changes in the biosphere and hydrosphere, 4) Development and improvement of methods and models for quantitative assessment and analysis of the impact of state and changes in the atmosphere, biosphere, hydrosphere on socioeconomic sectors of society and natural ecosystems; 5.) Developing proposals for making management decisions to adapt to the adverse global changes; 7.) Interaction with the institutions in the preparation of strategies related to these tasks.
The section on systematic observations activities in the country follows the detailed guidance for required information as provided in the UNFCCC reporting guidelines on global climate observing systems. It includes summary information on the current status of national plans, programs and support for ground and space-based climate observing systems. It should be pointed out that up to now activities in this field have been undertaken separately from the climate change policies and measures. They were more closely linked to the general commitments of the country in the field of meteorology.
8.2. Research
Over the past 10 years there has been a trend of increased scientific interest in climate change: global, regional and national scale. The topic of climate change includes a number of scientific aspects. The Bulgarian Academy of Sciences BAS works in different directions: fluctuations and climate change, vulnerability assessment and adaptation of individual sectors (e.g. water resources, agriculture, forests, etc.) under climate change, solar-terrestrial influences and more. On the topic of climate change in more than 10 units of the Bulgarian Academy of Sciences, work but the major one is the National Institute of Meteorology and Hydrology.
The Bulgarian Academy of Sciences (BAS) carries out research and other activities on climate change. The information for this research is so big that can not be summarized and analyzed within this document. Work is going on not only on planned tasks with national financing but also in cooperation with research organizations from EU member countries within the Sixth and Seventh Framework Programme.
Comprehending the significance of this problem, BAS established a National Coordination Centre for Global Change. The Scientific Coordination Center for Global Change of the Bulgarian Academy of Sciences (SCCGC-BAS) is a voluntary association of representatives of academic research and development institutes and units, universities and higher educational

Research projects and systematic observation 190
establishments, institutions, agencies, organizations, companies and other entities in Bulgaria which organizes and conducts activities related to global change in environment, as well as to the economic, political, social and spiritual aspects of global change on society
The SCCGC-BAS is a consultative/advisory body of the Steering Committee of the Bulgarian Academy of Sciences on global change in Bulgaria. The SCCGC-BAS is a center for coordination of research and scientific-methodological activities under the implementation of national and international projects and contracts in the field of global change.
The SCCGC-BAS Tasks:
- To coordinate and support research on aspects of global change in Bulgaria;
- To coordinate and support the scientific, methodological and informational needs related to implementation of the national programs on global change;
- To coordinate and support scientific, methodological and informational needs related to implementation of the country's commitments under international conventions, contracts and agreements on the subject of global change;
- To assist contacts among scientists and their participation in national, regional and international global change programs;
- To coordinate and assist the information exchange among scientists and stakeholders in the country and abroad through establishment and maintenance of a scientific network on global change in Bulgaria;
- To organize and perform assessments and evaluations, to provide expertise, and to develop reviews and position papers as required by governmental institutions, international organizations, business entities, NGOs and other organizations or individuals on aspects of global change;
- To organize and support scientific conferences, courses for training and skill enhancement for specialists, as well as the publication of research, information, applied science and materials for the public in the field of global change;
- To play the role of a focal point, information center and representative of the Bulgarian Academy of Sciences before national and international bodies, organizations, programs and projects within the scope of the major objectives and goats of the Center.
On national level the centre puts efforts to strengthen the cooperation amongst Bulgarian institutions and organizations. In regard to this, it organizes discussions about the Second National Action Plan on Climate Change and the policy of MOEW on climate change; on climate change and global change project implementation, etc.
On international level, the centre supports participation in projects, publications and reports on climate change and global change. The SCCGC-BAS organized an international conference, held in Sofia, 19-21 May 2008: "Global environmental change: challenges to science and society in south-eastern Europe".
Major projects
- Climate change and variability: Impact on Central and Eastern Europe, 2007-2009
- Adaptation of agriculture in European regions at environmental risk under climate change, 2007-2009

Research projects and systematic observation 191
- Central and Eastern Europe climate change impact and vulnerability assessment, 2006-2009
- Impacts of climate change and variability on European agriculture, 2006-2010
- Establishing a European phenological data platform for climatological applications, 2005-2009
- Application of European experience on utilization of climate change results, 2005-2007
- Introducing models under climate change conditions by establishment of contacts between users and model developers, 2005-2007
- Snow variability and change in Bulgaria, 2005-2007
- Long-term variations of soil moisture and climate change in Bulgaria, 2005-2007
- Monitoring social, economic and environmental differences of municipalities in Bulgaria in 2003-2005
- Climate change impact on water balance in Balkan Peninsula, 2002-2005
National institute of meteorology and hydrology at Bulgarian academy of science, NIMH at BAS is the major Bulgaria research institute in meteorology, agrometeorology, and hydrology, performing research-related practical application.
NIMH carries out an efficient exchange of knowledge both with the industry and with the general public by means of all kinds of national media.
The programs of the World Meteorological Organization (WMO) and the best achievements of related hydrometeorological services lead us in our daily work, which is being performed in compliance with the Articles of Association of BAS, the Rules and Regulations of NIMH, the requirements of the Ministry of Education and Science, and the updated documents of the Commission of the European Communities.
NIMH is the official representative of Bulgaria in WMO, EUMETSAT, EUMETNET (OPERA), UNESCO’s International Hydrological Program, and the International Association for Danube Research, etc.
Among the Scopes of Activity of NIMH is: Provision of expert opinions, information, analyses, various forecasts of the hydrometeorological processes, climate change and water resources on the territory of Bulgaria, including the western part of the Black Sea.
Through its activities NIMH implements at a national level our international commitments such as the United Nations Framework Convention on Climate Change and the Kyoto Protocol, the Convention to Combat Desertification, the EU Water Initiative, the Contribution of the Intergovernmental Panel on Climate Change, and the Earth Monitoring Initiative.
The Institute takes an active part in EC Framework Programs V, VI, and VII and is open for research workers from Europe and other countries through joint projects and a modern Training Centre. The main NIMH research is consistent also with the EU research policies, defined in the priority areas of the 7th Framework Program., for example: “Environment, including Climate Change”.
Major publications:
- Aksoy, H, N.E. Unal, V. Alexandrov, S. Dakova and J.Y. Yoon, 2008. Hydrometeorological analysis of north-western Turkey with links to climate change. International Journal of Climatology 28(8): 1047 – 1060

Research projects and systematic observation 192
- Alexandrov, V. and J. Eitzinger, 2005. The Potential Effect of Climate Change and Elevated Air Carbon Dioxide on Agricultural Crop Production in Central and South-eastern Europe. Journal of Crop Improvement 13(1-2): 291-331.
- Alexandrov, V., 2006. The climate change impact on ecosystems in the Balkan Peninsula and Central Europe. Meteorology and Hydrology 9: 88-98 (in Russian)
- Alexandrov, V., M.Genev and H.Aksoy, 2005. Climate variability and change effects on water resources in the western Black Sea coastal zone. Proceedings of the European Water Resources Association (EWRA’2005) Conference: “Sharing a common vision for our water resources”, 7-10 September 2005, Menton, France, (CD) 12 pp.
- Alexandrov, V., M.Genev and H.Aksoy, 2005. The impact of climate variability and change on water resources in the western coastal zone of Black Sea. Regional Hydrological Impacts of Climatic Change - Impact Assessment and Decision Making (Proceedings of symposium S6 held during the Seventh IAHS Scientific Assembly at Foz do Iguaçu, Brazil, April 2005). IAHS Publ. 295, pp.62-71.
- Bocheva L., Ch. Georgiev and P. Simeonov. A climatic study of severe storms over Bulgaria produced by Mediterranean cyclones in 1990-2001 period. Atmos. Research, 83, Nos.2-4, 2007, 284-293.
- Brown R. and N. Petkova, 2006, Snow Cover Variability in Bulgarian Mountainous Regions, 1931-2000, International Journal of Climatology
- Eitzinger, J., Thaler, S., Kubu, G., Trnka, M., Alexandrov, V. 2009 Der Klimawandel, seine absehbaren Folgen für die Landwirtschaft in Oberösterreich und Anpassungsstrategien. Amt der OÖ Landesregierung, 60
- Eitzinger, J., V. Alexandrov and M. Trnka, 2006. Climate Change Impacts on Yield and Crop Water Use in Austria using Crop Models. Proceedings of the International conference on Soil Physics and Rural Water Management, 28–29 September 2006, Vienna, Austria, pp. 199-202.
- Eitzinger, J.,H. Formayer, S. Thaler, M. Trnka, Z. Zdenek, V. Alexandrov, 2008. Results and uncertainties of climate change impact research in agricultural crop production in Central Europe. Journal for Land Management, Food and Environment 59: 1-4.
- Gocheva, A., L. Trifonova, T. Matrinova, L. Bocheva (2006) Complex approach for assessment of dry wind and droughty spells in Bulgaria, International Conference BALWOIS, 23 – 26 May 2006, Ohrid, Republic of Macedonia, 12 pages (www.balwois.org)
- Gocheva, A., L. Trifonova, T. Matrinova, L. Bocheva (2006) Extreme hot spells and heat waves on the territory of Bulgaria, International Conference BALWOIS, 23 – 26 May 2006, Ohrid, Republic of Macedonia, 11 pages (www.balwois.org)
- Eitzinger, J, G. Kubu, V. Alexandrov, A. Utset, D. T. Mihailovic, B. Lalic, M. Trnka, Z. Zalud D. Semeradova, D. Ventrella, D. P. Anastasiou, M. Medany, S. Altaher, J. Olejnik, J. Lesny, N. Nemeshko, M. Nikolaev, C. Simota and G. Cojocaru, 2009. Adaptation of vulnerable regional agricultural systems in Europe to climate change – results from the ADAGIO project. Adv. Sci. Res., 3, 133–135

Research projects and systematic observation 193
- Kazandjiev V., N. Shopova 2006. Agrometeorological observations and data Base Management for Farmers Support in Bulgaria, 8-th Conference on Meteorology – Climatology and Atmospheric Physics COMECAP 24-26 May 2006, Athens
- Kazandjiev V., N. Slavov 2006. Phenological development as indicator of meteorological conditions, BALWOIS Conference, Ohrid, Macedonia.
- Koleva Ek., V.Alexandrov, 2008. Drought in the Bulgarian low regions during the 20th century. Theoretical and Applied Climatology 92(1-2): 113-120.
- Marinova, T., L. Bocheva, V. Sharov, 2005. On some climatic changes in the circulation over the Mediterranean area. IDŐJÁRÁS, Vol.109, No 1, 55–67.
- Neytchev, P., Zucchini,W., Hristov, H. and Neykov, N.M. (2006) Development of a multisite daily precipitation model for Bulgaria using hidden Markov models. In: Proc. of the XXIIIrd conference of Danubian countries on the hydrological forecasting and hydrological bases of water management. Belgrade, Serbia, 28- 31 August.
- Orlandini S, Nejedlik P, Eitzinger J, Alexandrov V, Toulios L, Calanca P, Trnka M, Olesen JE. 2008 Impacts of climate change and variability on European agriculture: results of inventory analysis in COST 734 countries.Ann N Y Acad Sci. 1146: 338-353.
- Petkova N., 2007, Snow cover variability in Bulgarian Mountainous Regions, International conference on „Climate change and problems”, 20-22 April, Sofia, Bulgaria
- Petkova N., R. Brown, E. Koleva and V. Alexandrov, 2005. Snow Cover Changes in Bulgarian Mountainous Regions, 1931-2000, Croatian Meteorological Journal 40: 662-665.
- Simeonov P., R. Petrov, L. Bocheva and T. Marinova Pre-project Study on Meteorological Conditions for Hail Suppression and Rain Enhancement aim in South- East Bulgaria, Paper submitted at 9th WMO World Weather Modification Conference, 22-25 Oct. 2007, Antalya, Turkey, (Ext. abstract, pp. 4).
The topic of climate change is reflected in other research units of the Academy and Universities:
Geophysical Institute
Central Laboratory of Solar-Terrestrial Influences
Geographical Institute
Institute of Oceanology
Institute of Botany
Institute of Water Problems
Forest Research Institute
Space Research Institute
Institute of Nuclear Research and Nuclear Energy
Institute of Astronomy

Research projects and systematic observation 194
Sofia University
New Bulgarian University
South-western University, Blagoevgrad
University of Veliko Turnovo
University of Plovdiv
Agricultural University, Plovdiv
Forestry University
Financial Sources for Environmental Projects in Bulgaria
The main sources for financing of environmental projects in Bulgaria are:
- State budget;
- An enterprise for managing activities on environmental protection;
- National trust ecofund;
- National Research fund;
- European Union pre-accession funds for candidate member countries – ISPA, PHARE, SAPHARD;
- “Joint Implementation” mechanism within the framework of the Kyoto Protocol to the United Nations Framework Convention on Climate Change;
- Agreements for bilateral cooperation with:
The Kingdom of the Netherlands;
The Federal Republic of Germany;
Denmark;
Austria;
The Kingdom of Belgium;
The United Kingdom;
The Principality of Monaco.
- International organizations and financial institutions:
EC/EU programmes
United Nations Development Program;
Nordic-funds;
CIM-projects;
Central European Initiative;
United States Agency for International Development;
European Bank for Reconstruction and Development;
The World Bank.

Research projects and systematic observation 195
8.3. Systematic Observation
There are no GSN (Global Surface Network) and GUAN (Global Upper Air Network) stations located in Bulgaria. There is only one GAW (Global Atmosphere Watch) station in the country (Rojen).
The National Institute of Meteorology and Hydrology in Sofia, Bulgaria has several weather stations included within the Regional Basic Synoptic Network (RBSN) and Regional Basic Climatological Network (RBCN) in RA VI (Europe):
Table 8.1 RBSN stations in Bulgaria INDEX LATITUDE LONGITUDE ALTITUDE
OF BAROMETER (m)
NAME OBSERVATIONS
15502 43 59’ 22 51’ 595 VIDIN S 15525 43 09’ 24 42’ 220 LOVETCH S 15549 43 34’ 26 30’ 346 RAZGRAD S 15552 43 12’ 27 57’ 40 VARNA S 15614 42 39’ 23 23’ 595 SOFIA OBS S 15614 42 39’ 23 23’ 588 SOFIA OBS WR UTC 1200 15640 42 40’ 26 20’ 257 SLIVEN S 15655 42 30’ 27 29’ 27 BURGAS S 15712 41 33’ 23 16’ 203 SANDANSKI S 15730 41 39’ 25 23’ 330 KURDJALI S
Table 8.2 RBCN stations in Bulgaria INDEX NAME CLIMAT CLIMAT TEMP 15502 VIDIN X 15552 VARNA X 15614 SOFIA OBS X 15614 SOFIA OBS X 15730 KURDJALI X
The UNFCCC Guidelines Table 1 can be presented as follows:
Table 8.3 Participation in the global atmospheric observing systems GSN GUAN GAW Other*How many stations are the responsibility of the Party? 0 0 1 9+4 How many of those are operating now? 0 0 1 9+4 How many of those are operating to GCOS standards now? 0 0 1 9+4 How many are expected to be operating in 2005? 0 0 1 9+4 How many are providing data to international data centres now?
0 0 1 9+4
*- the weather stations included within the Regional Basic Synoptic Network (RBSN) “plus” Regional Basic Climatological Network (RBCN) in RA VI

Research projects and systematic observation 196
In addition to the above information, the National Institute of Meteorology and Hydrology in Sofia, Bulgaria has about 40 synoptic and more than 90 climatic stations across the country, Figure 8.1.
Figure 8.1 NIMH weather network
Bulgarian hydro-meteorological observation stations are of two types, with respect to the data transmission:
Operational stations transmitting data at real or near real time. The most important 12 river level gauging stations are transmitting daily data to the NIMH regional branches and headquarters. The rest 32 the operational stations are transmitting daily data at weekly intervals. On Wednesday each week NIMH receives daily data for the previous 7 days. Similarly the groundwater observation stations transmit daily or weekly data at weekly or monthly intervals from 160 wells and 25 springs. 200 operational rain gauges are transmitting daily precipitation totals every day, when it is raining. The location of the stations is given on the schemes below.
Regime stations are not transmitting data. Different paper forms are prepared by the observers and posted to the NIMH branches at monthly intervals.
Some of the hydrometeorological parameters regularly observed over the Bulgarian territory are relevant for the analysis of the variability of the groundwater recharge. Those are: precipitation, thickness of the snow pack, river and spring discharge, and groundwater tables. General information on the monitoring practices and data pre-processing for those parameters is given below
Discharges are received via rating curve through the observations of the water levels. The levels are generally observed manually with foot gauge by observer at 8 o'clock a.m. local time.

Research projects and systematic observation 197
Because of the high variability of the levels in the small basins, mechanical level recorders are working at approximately half of the stations, using weekly paper tapes. Observers of small amount of stations at larger basins are transmitting daily levels via telegram/telephone, while their reporting tables are collected monthly by post. Discharges are measured 8-12 times per year by current meters, or floats in case of dangerous floods. Small springs are measured via volume method. Most of the stations are equipped with measurement bridges. Cross-section profiles are measured one or twice per year, which generally do not include the floodplains. The frequency of those observations depends on the stability of river bed at the measuring section. Provisional rating curves are maintained for the cross-sections with daily data transmission, while for all stations rating curves and daily mean discharges are validated annually. Certain amount of small river basins having an area of 50-100 km2 are observed above the hydrotechnical structures (dams, derivation channels), while the others with measuring sections located at the lowlands have an area of 200-400 to 1000-5000 km2. Reservoir cascades regulate more than 50 % of the surface waters.
National Institute of Meteorology and Hydrology: it has Black Sea coastal stations – 10 stations measure sea temperature; 10 stations measure sea level; 3 stations measure sea water salinity.
In 1995 Bulgaria was involved in the European space-based observing programmes on meteorology after signing an Agreement on Use of Images from the EUMETSAT Meteosat Satellites between the National Institute of Meteorology and Hydrology (NIMH) and EUMETSAT, the European Organisation for the Exploitation of Meteorological Satellites. High Resolution Image (HRI) data from Meteosat-7 in three channels (0,5-0,9 µm, 5,7-7,1 µm and 10,5-12,5 µm) are processed and utilized for operational and research purposes. Daily imagery analysis is made subjectively for the purposes of short-range weather forecasting. The observations from the three channels of Meteosat-7 are received every 30 minutes at NIMH by operating a Primary Data User Station (PDUS).
The Geophysical Institute “Acad. L. Krastanov” is a leading scientific institution in the country, which carries out fundamental and applied research in the fields of:
Physics of the solid Earth
Department “Seismology”;
Department “Geomagnetism and Gravimetry”;
Palaeomagnetic laboratory
Physics of the Earth’s environment
Department “Physics of the Atmosphere”;
Department “Physics of the Ionosphere”;
The main research activity of the Institute is entirely subordinated to the national priorities:
Protection of the population and risk mitigation of unfavourable natural phenomena and disasters;
Facilitating sustainable development and use of the natural and raw-material resources in Bulgaria;
Providing national authorities with expert geophysical information
An important and irrevocable part of the Institute’s activities is the unique for our country scientific and operative activity, concerning registration, processing, analysis and interpretation

Research projects and systematic observation 198
of the seismicity, geomagnetic field, the status of the ionosphere and UV radiation level above the country and surrounding lands.
The unique for the country international geomagnetic standard with absolute and comparative geomagnetic measurements is maintained in Geomagnetic Observatory
State budget;
An enterprise for managing activities on environmental protection;
National trust ecofund;
National Research fund;
European Union pre-accession funds for candidate member countries – ISPA, PHARE, SAPHARD;
“Joint Implementation” mechanism within the framework of the Kyoto Protocol to the United Nations Framework Convention on Climate Change;
Agreements for bilateral cooperation with:
The Kingdom of the Netherlands;
The Federal Republic of Germany;
Denmark;
Austria;
The Kingdom of Belgium;
The United Kingdom;
The Principality of Monaco.
International organizations and financial institutions:
EC/EU programmes
United Nations Development Program;
Nordic-funds;
CIM-projects;
Central European Initiative;
United States Agency for International Development;
European Bank for Reconstruction and Development;
The World Bank.
The unique for the country international geomagnetic standard with absolute and comparative geomagnetic measurements is maintained in Geomagnetic Observatory “Panagyurishte”. The parameters of the Earth’s Magnetic Field are registered daily and maps of variations of the elements are drawn. Main users of the collected information are Military Geographic service of the MA, Cadaster Agency at the Ministry of Regional Development of Bulgaria and all organizations working in the area of underground resources research with geomagnetic methods. Geomagnetic field data are used for navigation and radio-connections services as well.
The Ionospheric station “Plana” performs daily registration, processing and analysis of the condition of the ionosphere above the country and surrounding areas. On the basis of these observations, forecasts for ionospheric radio wave propagation, and short-wave radio-circuits on

Research projects and systematic observation 199
the territory of Bulgaria is provided. Based on the contract with the Defence Ministry, these forecasts are forwarded for exploitation to all interested authorities.
The Network for the ground measurements of the bioactive UV radiation and the ozone thickness consists of three stationary stations, which will be installed in Sofia (GPhI), v. Shkorpilovci in the base of the Oceanology Institute and in Geophysical observatory “Vitosha”. From these three permanent stations information for the bioactive UV radiation level in the capital, on the coast and in the Bulgarian mountain resorts will be collected. Two portable stations for measurement of erythemal UV exposure will be used in a planed field works and for relative calibration as well.
The Departments of the Institute of oceanography related to observations are;
Marine Physics:
Measurements and analysis of the main hydrophysical parameters of sea water and meteorological components of the adjacent atmosphere;
Marine Chemistry:
Monitoring on the main chemical parameters as main ions, dissolved gases, biogenic elements in the western part of the Black Sea and coastal lakes;
Marine Biology and Ecology:
Study the taxonomic and functional biodiversity of the Black Sea and the food chain interactions
Investigate the response of biota to external forcing - anthropogenic pressure and global climatic impact
Coastal Zone Dynamics:
Studies wind-wave climate and wave transformation in shallow water; wind-wave structure and non-linear relations; sea level fluctuations; coastal morpho- and lythodynamic processes; sediment balance; geodynamic coastal processes.
Marine Geology and Archaeology:
Studies on structure and composition of the Black Sea sediment complex and stages in its development; recent geological processes; geocatastrophic phenomena;
Investigations on alternative energy resources; geophysical fields;
Ocean Technologies
Collects, processes, quality controls, archives and keeps various oceanographic data.
Institute of Oceanology: Every year it carries out complex seasonal expeditions studying physical, chemical and biological parameters of sea water and bed at the western part of Black Sea. The research ship “Academic” executes up to 4 seasonal expeditions applying a constant scheme for monitoring (at about 50 points at the western part of Black Sea). The profiles of sea temperature and salinity, oxygen, phosphates, nitrates, nitrites, zooplanktons and fauna are measured. Weather observations are done at every location of interest: air temperature, sea level pressure, wind speed and direction. The institute is currently trying to recover and improve some oceanographic systems for observations such as VOS (Volunteer Observing Ship) and TIDE GAUGES as well as to include them within international programmers.
In 2004 National Centre for Oceanographic Data was established in the Institute. It is included in the international system for data exchange IODE of IOC.

Research projects and systematic observation 200
Bulgarian National Oceanographic Data Centre (BGODC) serves as a local portal for the national and international exchange of oceanographic data.
The main objectives of BGODC are:
To acquire the marine data sampled by Bulgarian institutes and agencies, archive it and maximise its utilization by promoting data exchange on national and international level
To meet Bulgarian's international data exchange obligations to intergovernmental Oceanographic Commission (IOC), SEADATANET, ASCABOS and ARENA projects regarding monitoring of the Black Sea.
Institute of Oceanology: the 4 stations measuring the Black Sea level are equipped with seagraphes and data are stored on paper. It does not allow operative data exchange.
Institute for Space Research: Bulgaria is participating in space-based observing programmes by development and execution of national and international space programmes as well as development of complex research tools for:
international crews of orbital space stations including those with the first and second Bulgarian astronauts
space satellites
geophysical rockets
sub-space experiments
An important way related to participation in space-based observing programmes is development, analyses and interpretation of space satellite images.
The Institute has participated in the creation of the scientific base and the development of the instrumentation of the following satellites and rockets: satellites "intercosmos"- 8, 12, 14, 19; "intercosmos-bulgaria-1300" and "meteor-priroda"; satellites (with 24 original scientific instruments) "vertical" - 3,4, 6, 7, 9 and 10 rockets as well as in scientific programs of the first and second Bulgarian cosmonauts on board of "salyut-6" and "mir", space stations "vega", "activen", "granat", "interball" and other projects, "apex" satellite, and "phobos" missions.
By a model, developed by Bulgarian scientists, important results related to the impact of inhomogeneous Earth surface on the cloud distribution were obtained. The theory and results were published in a book written by Bulgarian, Hungarian, German, Romanian and Russian researchers.
Studies on the statistical structure of meteorological fields in the stratosphere and mesosphere were carried out by applying rocket data. The obtained results were involved within the methods for analyses of meteorological fields, hydrodynamic and statistical forecasts.
In Bulgaria a method was developed for measurement of the wind velocity vector in the upper layers of the atmosphere by applying dipole reflectors cluttered from a container located in meteorological rockets. The obtained data for the wind profile at a level of 75-100 km together with the data of temperature, pressure and density allow investigating the global atmosphere circulation in the stratosphere and mesosphere.
Bulgaria utilizes observations from satellites: satellite images with very high (IKONOS, QuickBird, EROS) high (IRS, SPOT) and moderate (Landsat, ASTER) space resolution are used. The satellite images are used for research and scientific experiments as well as a basic source of information under development of geoinformation systems.

Research projects and systematic observation 201
Bulgaria is an active participant at the investigation of the Earth surface by aero-space tools. The country has its own contribution (project teams from the Institute for Space Research and some other space laboratories in the country) to utilization of spectral-reflector characteristics of various natural forms. Bulgarian specialists created a catalogue of the major soil types in the country. Since 1989 Bulgarian scientists have participated during two stages of an international project “Earth cover” by using satellite data. The satellite images are received by: participation of various national and international projects and programmes (e.g. CD, DVD); Internet (e.g. FTP servers); purchase (e.g. CD, DVD).

Education, training and public awareness 202
9. EDUCATION, TRAINING AND PUBLIC AWARENESS
9.1. Introduction
At the beginning of the 21st century the issue of global change in nature and impact on society and natural ecosystems is a major priority in the work plans of the scientists and unfailing interest to politicians and the media. Society shows an increasing concern to climate change, related environmental issues and potential measures to adapt to the negative impacts of these changes. Development of adequate policies can be done only with joint efforts, and when based on accurate scientific assessments and projections, taking into account the causal relationships of different nature.
9.2. Education
Bulgaria carried out a project for self assessment of the capacity of the country in the field of sustainable development in 2004. The results from the project in the section Environmental education and public awareness in climate change problems allow to define the priority topic, the explanation of which will improve not only the level of the educational system but also public awareness.
Three complex and a number of specific reasons have been formulated as a reason for the unsatisfactory level of capacity. Specific objectives and tasks have been elaborated to improve the situation and direct and indirect assets have been recognized that allow the tasks to be solved in a short period of time.
The main results from the work in the area of climate change are given in Table 9.1
Table 9.1 Reasons, specific objectives and assets Priority problem: Insufficient participation of the interested parties and general public in the national and international climate change activities
STRATEGIC OBJECTIVE: Active participation of the interested parties and general public in the formulation, development, execution and assessment of the climate change policies and measures
Complex reason: Lack of sufficient information on the subject or the information is hard to obtain
Specific objective: To create conditions the information on climate change, the international and national policy on this problem to be available and with easy accessed for everybody interested
Main reasons: Lack of national program or plan for education, training and information on public awareness on climate change Lack of journalists competent in this area Media information are of sensational or campaign character, there are no fundamental and in-
Tasks: Development and adoption of national program or plan for education, training and information on public Creation of informal group of journalists and experts to prepare and present information on climate change
Direct assets: A huge amount of information exists in Internet on climate change A company on environmental protection management activities exists There are environmental NGOs with experience in

Education, training and public awareness 203
depth analysis Lack of coordination amongst the administration in regard to presenting information to various customers Lack of effective information system for the ongoing work, results and achievements in various climate change areas Lack of purpose financing for the activities defined in the New Delhi Program on Article 6 of the UNFCCC Media do not contact experts on the topic
Journalists trained on the subject Create mechanism for Information Exchange (CHM) on climate change causes, its effect and prevention activities in various areas and sectors Improved inter administration coordination for detailed and in-time presentation of information Adapted scientific publications and information on climate change and popularizing through integration in various special information flows
education and public awareness MOEW has an information centre and Internet site on climate change Ministries and Agencies have public awareness units Indirect assets: There is a mechanism for Information Exchange (CHM) on biodiversity Specialized radio and TV broadcasts exist (for ex. “Brazdi”, “Ecocambana”, etc.)
Complex reason: There is no general education on the subject
Specific objective: Climate change subject integrated at all educational levels
Main reasons: Lack of enough teaching materials and books in Bulgarian Lack of specialized information materials for teachers on climate change Training aids on natural science and humanitarian subjects do not include climate change and its impact in the respective area
Tasks: Development of educational and information materials in Bulgarian Development of specialized educational programs on climate change for teachers and lecturers Purpose financing is ensured on activities on the national program and for science and research in High schools Training aids on natural science and humanitarian subjects that include climate change and its impact on the respective area
Direct assets: MOEW have an expert on Education and Environment The Ministry of Education carries out reforms in the system for improvement of teachers’ training Indirect assets: There are some educational materials in small circulation State educational requirements are under way
Complex reason: Lack of sufficient expert potential for business, local authorities, NGOs and academics
Specific objective: Established expert potential in regard to climate change for business, local authorities, NGOs and academics
Main reasons: Insufficient targeting of scientific and research activities toward compliance and meeting the requirement of UNFCCC
Tasks: To ensure financing on this subject from the National Science Fund Special educational
Direct assets: There are highly qualified experts and scientists with interest on climate change subject

Education, training and public awareness 204
Lack of sufficient financing for research on this subject Ignoring the gravity of the problem by the parties concerned Lack of good opportunities for employment and professional growth
practices (seminars, courses, information campaigns) Improved interconnection of business and science for popularizing and financing the research on the subject
There are experienced teams in climate change projects There is a limited number of experts with good knowledge on climate change Indirect assets: There are chamber organizations that support information dissemination and protection of member interests EPA requires the development and application of national and municipal environmental protection programs There is experience in the development of municipal programs on EE There are regional centres and local units on energy efficiency
There is already planning of the tasks from Table 9.1 and some positive results are in place.
9.2.1. Environmental Education in Schools
The effective use of human potential, especially in hard time as the present transitional period, is one of the greatest challenges, undertaken by people in the last decade. Environmental protection – soil, air, water, plants and animals, natural heritage must develop into personal conviction. One of the fundaments of the present education is to familiarize the pupils with the natural environment and form a positive attitude towards everything, surrounding them.
The topics of environmental protection and climate change are included in school syllabuses in the educational and cultural field “Natural science and environment”. They are studied in most details in the “Geography” subject but also, even in lesser scale in “Environmental chemistry” and “Biology”.
The children have contacts with nature even in primary school, they get used to watch it, get acquainted with various natural sites and objects, and follow different natural phenomenon. To enhance their knowledge on the environment it is of great benefit to have various games – didactic, of cognitive nature. When introducing Bulgarian mountains to them, a special attention should be drawn to the variety of mountains in the country.
For an efficient environmental education and training, trips and games at the open are very beneficial. The game “How old is the tree” will help the children understand how long does it take for a tree to grow.
Through a series of research, experiments are made on the state of the river, running through settlements. The water in the mountain is investigated and so is the water in the city. Even only

Education, training and public awareness 205
primitive tools are used – magnifying glass, what is seen is enough for drawing some valuable conclusions. Visits of the Black Sea, numerous water dams, parks and reserves can also positively contribute on children’s knowledge on environmental problems.
Pupils can see for themselves how much cleaner the water in the mountains is, where human presence is limited.
In this context, one should add the necessity of introduction of compulsory environmental lessons in primary schools and outdoor activities.
9.2.2. Development of Specific Syllabuses for Training of Teachers and Lecturers
A “Specialized course on vocational training of chemistry teachers on environmental protection” was carried out in 2005. It was on 3 stages during the school year. All 50 participants – chemistry teachers have obtained a certificate. The participants in the course have been selected from all over the country. The successful completion of the education can be used as a model for future training and elaboration of similar courses for training of teachers.
9.3. Ecotourism
The consolidation of the movement for environmental protection and development of ecotourism is typical for the period of transition to market economy. Both tendencies are expression of the concern for environmental protection and protection of the natural and cultural heritage. The protection of the environment, heritage and ecotourism are closely linked amongst them and need each other to achieve successfully their goals.
During the first national forum “Ecotourism, mountains and protected territories – partners for prosperity”, the Ministry of Economy, Ministry of Environment and Waters and Ministry of Agriculture and Forestry signed a Protocol for cooperation in the ecotourism.
The strong orientation of ecotourism to the principles, guiding directions and certification, based on the standards of sustainability, assigns it a special part in the sector Tourism. During the years, since the term was defined for the first time, Bulgaria reached consensus on the main elements of ecotourism, which characterize it as follows:
- contributes for the biodiversity protection;
- supports the prosperity of the local population;
- includes a responsible behaviour from tourists and the tourist sector;
- requires the lowest possible use of non-renewable resource;
- services for small tourist groups are provided mainly by small business
- the emphasis is on local participation, private property and business opportunities, specially for people from rural areas;
includes imperative/cognitive element.

206
ANNEXES

207
A.I Summary tables on emission trends

208

209

210

211

212

213

214

215
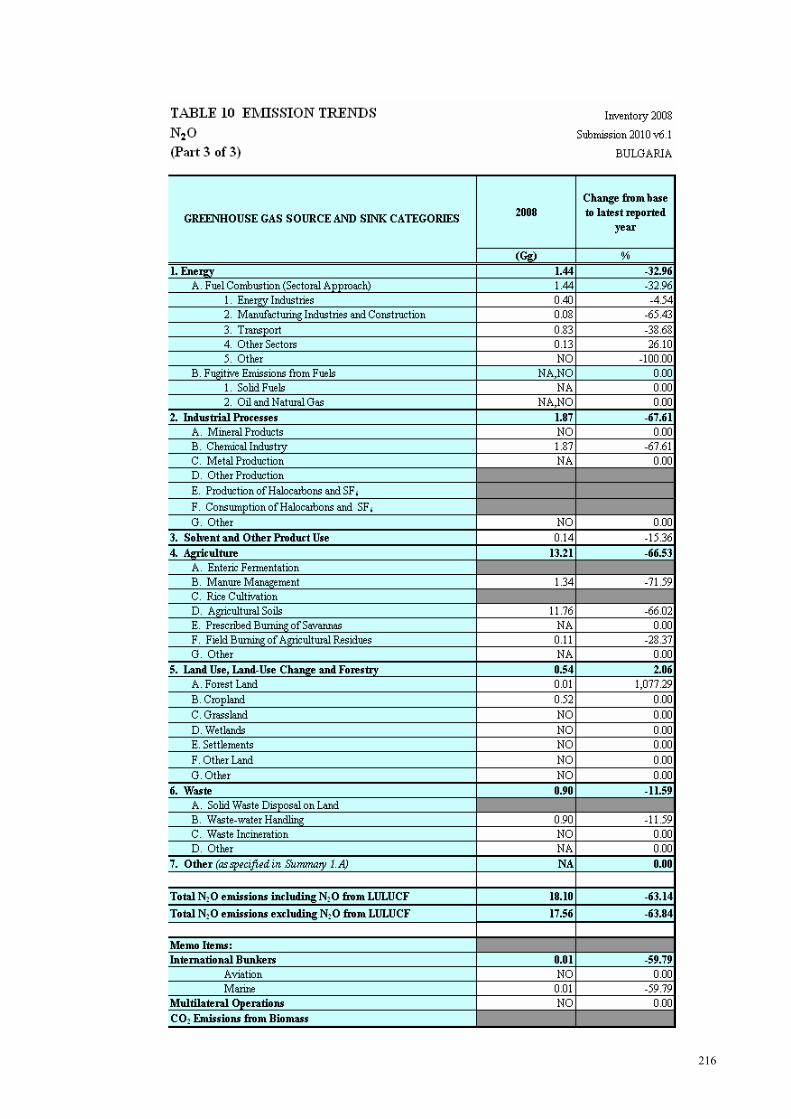
216

217

218

219

220

221

222

223
A.II Summary of reporting of the Supplementary information under Article 7, paragraph 2, of the Kyoto Protocol
Information reported under Article 7, paragraph 2
NC5 section
National systems in accordance with Article 5, paragraph 1
3.4
National registries 3.5 Supplementarity relating to the mechanisms pursuant to Articles 6, 12 and 17
5.3
Policies and measures in accordance with Article 2
4.3
Domestic and regional programmes and/or legislative arrangements and enforcement and administrative procedures
4.2
Information under Article 10 7.5 Financial resources (Annex II only) Not Applicable for the country

224
FOR FURTHER INFORMATION PLEASE CONTACT:
Ministry of Environment and Water
22 Maria Louisa Blvd. 1000 Sofia Bulgaria http://www.moew.government.bg/ REPUBLIC OF BULGARIA FIFTH NATIONAL COMMUNICATION ON CLIMATE CHANGE


![Communication%20 climate[1]](https://img.pdfslide.us/doc/110x75/547a4d1cb4af9f206f8b4699/communication20-climate1.jpg)