Embed Size (px)
Citation preview
lable at ScienceDirect
Chemosphere 145 (2016) 163e173
Contents lists avai
Chemosphere
journal homepage: www.elsevier .com/locate/chemosphere
Field scale boscalid residues and dissipation half-life estimation in asandy soil
Anneli Sofia Karlsson a, b, Lutz Weihermüller a, *, Wolfgang Tappe a, Santanu Mukherjee a,Sandra Spielvogel b
a Institute Agrosphere IBG-3, Forschungszentrum Jülich GmbH, 52425 Jülich, Germanyb Department of Geography, University Koblenz Landau, Germany
h i g h l i g h t s
� Boscalid residues found in a sandy soil three years after last application.� Boscalid concentrations were lower as expected from literature DT50 values.� Field derived boscalid DT50 values are smaller as laboratory DT50 values.
a r t i c l e i n f o
Article history:Received 23 July 2015Received in revised form5 November 2015Accepted 7 November 2015Available online xxx
Handling Editor: Klaus Kümmerer
Keywords:PesticideDissipationField experimentBatch experimentBoscalid
* Corresponding author.E-mail address: [email protected] (L.
http://dx.doi.org/10.1016/j.chemosphere.2015.11.0260045-6535/© 2015 Elsevier Ltd. All rights reserved.
a b s t r a c t
The aim of this study was to analyze the environmental fate of the fungicide boscalid in a sandy soil.Boscalid was applied in spring 2010/11 to a cropland site in western Germany. Three years after secondapplication 65 undisturbed soil samples were taken. Boscalid was extracted using accelerated solventextraction (ASE). Boscalid contents in the plough horizon ranged between 0.12 and 0.53 with a fieldmean of 0.20 ± 0.09 mg kg�1. These contents were considerably lower compared to calculation usingliterature DT50 values, whereby a concentration of 16.89 mg kg�1 was expected assuming a literature DT50value of 345 days. Therefore, the measured field boscalid concentration only yields 1.2% of the expectedvalue. To test whether the unknown extraction efficiency, losses from spray drift and interception canexplain the mismatch between calculated and measured concentrations all these uncertainties weretaken into account into calculations, but field concentrations and DT50 were still lower as expected.Leaching to deeper horizons was also studied but could not explain the discrepancy either. Moreover, ashort-term incubation experiment using 14C labelled boscalid revealed also shorter DT50 values of 297e337 compared to the 345 days taken from literature. However, this DT50 value is still considerably largercompared to the 104e224 days that were calculated based on the field experiment. Our results indicatethat boscalid dissipation under field conditions is much faster at agricultural sites with sandy soil type asexpected from laboratory incubation experiments.
© 2015 Elsevier Ltd. All rights reserved.
1. Introduction
During the last decades several studies showed that over theglobe various water bodies are contaminated with pesticides (e.g.,Leistra and Boesten, 1989; Kolpin et al., 1998; Tappe et al., 2002;Kuster et al., 2010; Vonberg et al., 2013) and that pesticide resi-dues can be still found in soils several years or even decades afterthe last application (e.g., Jablonowski et al., 2009; Farlin et al., 2013;
Weihermüller).
Vonberg et al., 2014). Despite of the ecological relevance of thesefindings, most pesticide dissipation / degradation and sorptionstudies were based on short-term laboratory and/or field experi-ments. Long-term field studies over several drainage periods areonly mandatory for the estimation of the risk of potentialgroundwater contamination in the second tier of the Europeanpesticide registration procedure (Verschoor et al., 2002). The dataobtained from these field experiments are then used to model thelong-term environmental behavior of the substances by pesticidefate assessment models (Sarmah and Close, 2009). As stated byJablonowski et al. (2009) and Farlin et al. (2013) these short-termtrials only have limited predictive power for the long-term
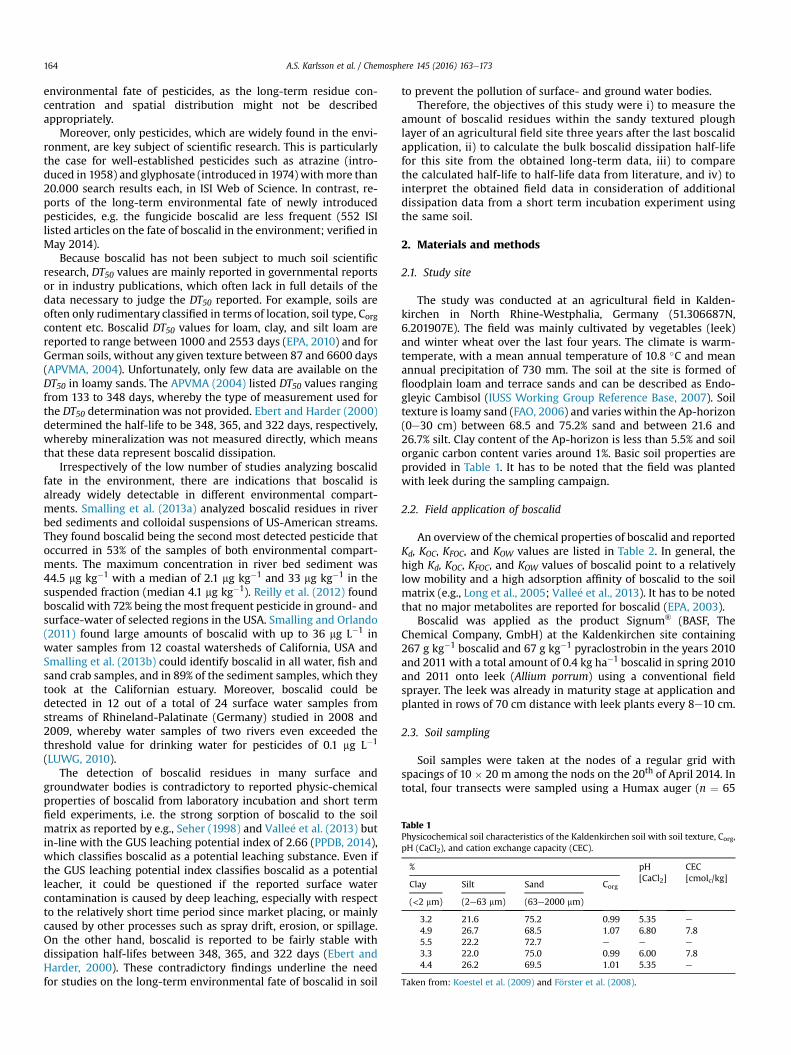
Table 1Physicochemical soil characteristics of the Kaldenkirchen soil with soil texture, Corg,pH (CaCl2), and cation exchange capacity (CEC).
% pH[CaCl2]
CEC[cmolc/kg]Clay Silt Sand Corg
(<2 mm) (2e63 mm) (63e2000 mm)
3.2 21.6 75.2 0.99 5.35 e
4.9 26.7 68.5 1.07 6.80 7.85.5 22.2 72.7 e e e
3.3 22.0 75.0 0.99 6.00 7.84.4 26.2 69.5 1.01 5.35 e
Taken from: Koestel et al. (2009) and F€orster et al. (2008).
A.S. Karlsson et al. / Chemosphere 145 (2016) 163e173164
environmental fate of pesticides, as the long-term residue con-centration and spatial distribution might not be describedappropriately.
Moreover, only pesticides, which are widely found in the envi-ronment, are key subject of scientific research. This is particularlythe case for well-established pesticides such as atrazine (intro-duced in 1958) and glyphosate (introduced in 1974) withmore than20.000 search results each, in ISI Web of Science. In contrast, re-ports of the long-term environmental fate of newly introducedpesticides, e.g. the fungicide boscalid are less frequent (552 ISIlisted articles on the fate of boscalid in the environment; verified inMay 2014).
Because boscalid has not been subject to much soil scientificresearch, DT50 values are mainly reported in governmental reportsor in industry publications, which often lack in full details of thedata necessary to judge the DT50 reported. For example, soils areoften only rudimentary classified in terms of location, soil type, Corgcontent etc. Boscalid DT50 values for loam, clay, and silt loam arereported to range between 1000 and 2553 days (EPA, 2010) and forGerman soils, without any given texture between 87 and 6600 days(APVMA, 2004). Unfortunately, only few data are available on theDT50 in loamy sands. The APVMA (2004) listed DT50 values rangingfrom 133 to 348 days, whereby the type of measurement used forthe DT50 determination was not provided. Ebert and Harder (2000)determined the half-life to be 348, 365, and 322 days, respectively,whereby mineralization was not measured directly, which meansthat these data represent boscalid dissipation.
Irrespectively of the low number of studies analyzing boscalidfate in the environment, there are indications that boscalid isalready widely detectable in different environmental compart-ments. Smalling et al. (2013a) analyzed boscalid residues in riverbed sediments and colloidal suspensions of US-American streams.They found boscalid being the second most detected pesticide thatoccurred in 53% of the samples of both environmental compart-ments. The maximum concentration in river bed sediment was44.5 mg kg�1 with a median of 2.1 mg kg�1 and 33 mg kg�1 in thesuspended fraction (median 4.1 mg kg�1). Reilly et al. (2012) foundboscalid with 72% being themost frequent pesticide in ground- andsurface-water of selected regions in the USA. Smalling and Orlando(2011) found large amounts of boscalid with up to 36 mg L�1 inwater samples from 12 coastal watersheds of California, USA andSmalling et al. (2013b) could identify boscalid in all water, fish andsand crab samples, and in 89% of the sediment samples, which theytook at the Californian estuary. Moreover, boscalid could bedetected in 12 out of a total of 24 surface water samples fromstreams of Rhineland-Palatinate (Germany) studied in 2008 and2009, whereby water samples of two rivers even exceeded thethreshold value for drinking water for pesticides of 0.1 mg L�1
(LUWG, 2010).The detection of boscalid residues in many surface and
groundwater bodies is contradictory to reported physic-chemicalproperties of boscalid from laboratory incubation and short termfield experiments, i.e. the strong sorption of boscalid to the soilmatrix as reported by e.g., Seher (1998) and Valle�e et al. (2013) butin-line with the GUS leaching potential index of 2.66 (PPDB, 2014),which classifies boscalid as a potential leaching substance. Even ifthe GUS leaching potential index classifies boscalid as a potentialleacher, it could be questioned if the reported surface watercontamination is caused by deep leaching, especially with respectto the relatively short time period since market placing, or mainlycaused by other processes such as spray drift, erosion, or spillage.On the other hand, boscalid is reported to be fairly stable withdissipation half-lifes between 348, 365, and 322 days (Ebert andHarder, 2000). These contradictory findings underline the needfor studies on the long-term environmental fate of boscalid in soil
to prevent the pollution of surface- and ground water bodies.Therefore, the objectives of this study were i) to measure the
amount of boscalid residues within the sandy textured ploughlayer of an agricultural field site three years after the last boscalidapplication, ii) to calculate the bulk boscalid dissipation half-lifefor this site from the obtained long-term data, iii) to comparethe calculated half-life to half-life data from literature, and iv) tointerpret the obtained field data in consideration of additionaldissipation data from a short term incubation experiment usingthe same soil.
2. Materials and methods
2.1. Study site
The study was conducted at an agricultural field in Kalden-kirchen in North Rhine-Westphalia, Germany (51.306687N,6.201907E). The field was mainly cultivated by vegetables (leek)and winter wheat over the last four years. The climate is warm-temperate, with a mean annual temperature of 10.8 �C and meanannual precipitation of 730 mm. The soil at the site is formed offloodplain loam and terrace sands and can be described as Endo-gleyic Cambisol (IUSS Working Group Reference Base, 2007). Soiltexture is loamy sand (FAO, 2006) and varies within the Ap-horizon(0e30 cm) between 68.5 and 75.2% sand and between 21.6 and26.7% silt. Clay content of the Ap-horizon is less than 5.5% and soilorganic carbon content varies around 1%. Basic soil properties areprovided in Table 1. It has to be noted that the field was plantedwith leek during the sampling campaign.
2.2. Field application of boscalid
An overview of the chemical properties of boscalid and reportedKd, KOC, KFOC, and KOW values are listed in Table 2. In general, thehigh Kd, KOC, KFOC, and KOW values of boscalid point to a relativelylow mobility and a high adsorption affinity of boscalid to the soilmatrix (e.g., Long et al., 2005; Valle�e et al., 2013). It has to be notedthat no major metabolites are reported for boscalid (EPA, 2003).
Boscalid was applied as the product Signum® (BASF, TheChemical Company, GmbH) at the Kaldenkirchen site containing267 g kg�1 boscalid and 67 g kg�1 pyraclostrobin in the years 2010and 2011 with a total amount of 0.4 kg ha�1 boscalid in spring 2010and 2011 onto leek (Allium porrum) using a conventional fieldsprayer. The leek was already in maturity stage at application andplanted in rows of 70 cm distance with leek plants every 8e10 cm.
2.3. Soil sampling
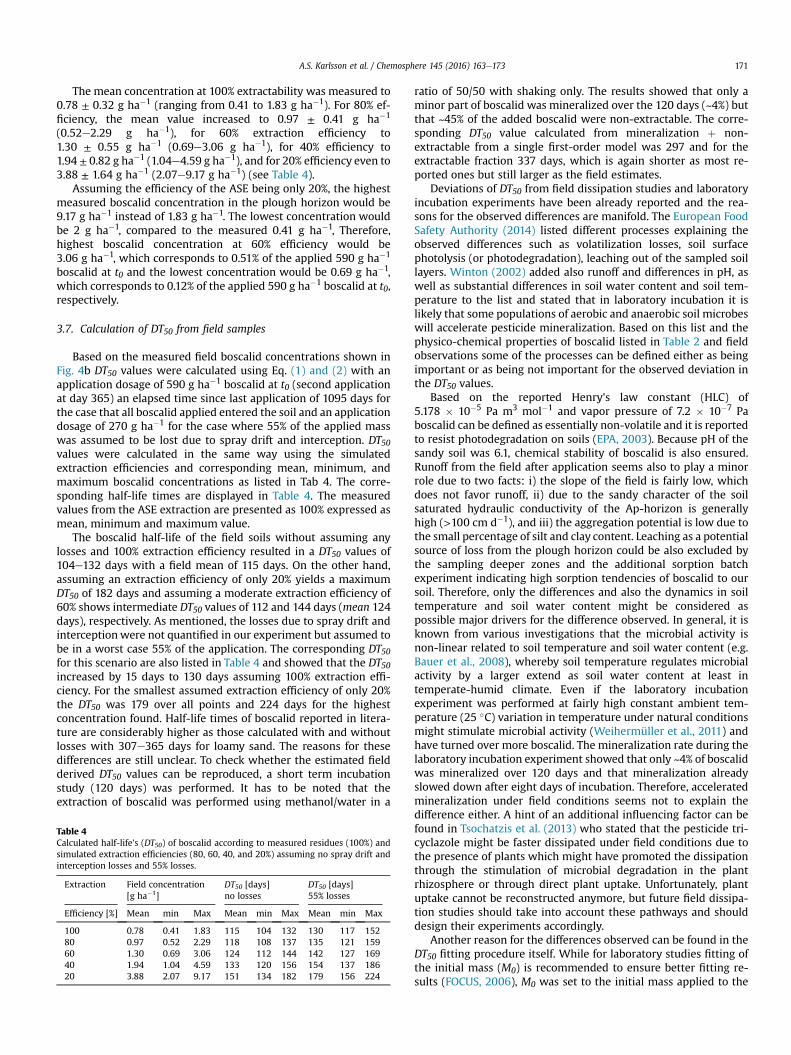
Soil samples were taken at the nodes of a regular grid withspacings of 10 � 20 m among the nods on the 20th of April 2014. Intotal, four transects were sampled using a Humax auger (n ¼ 65
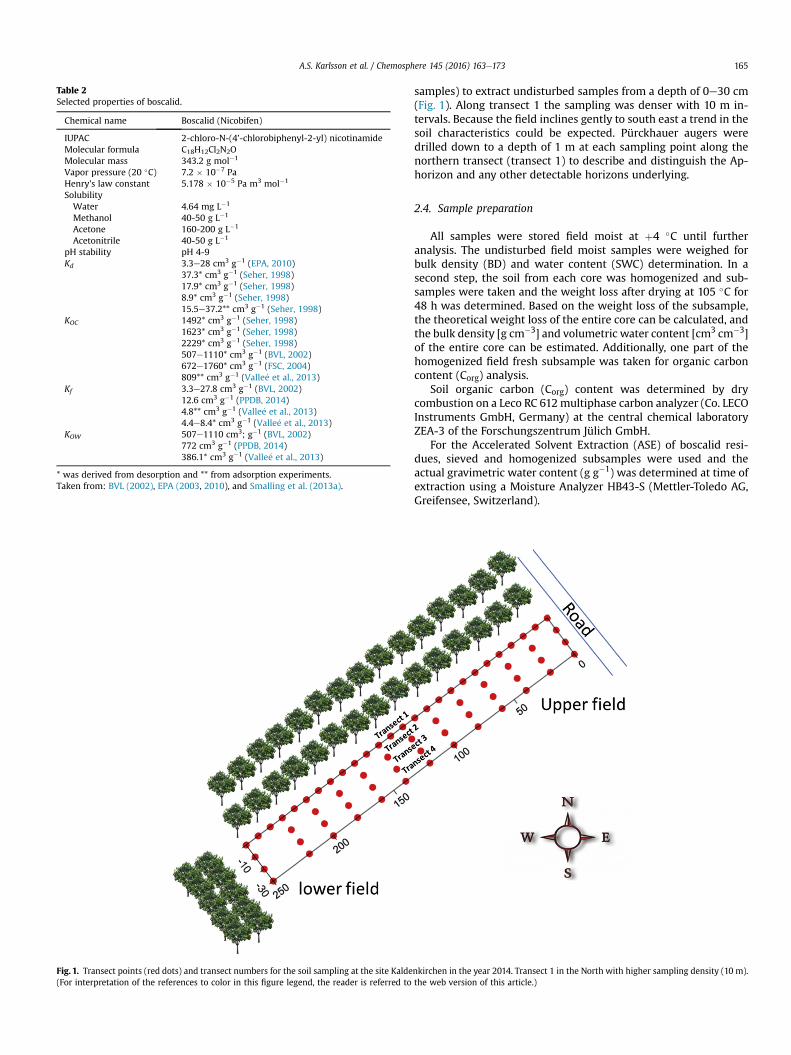
Table 2Selected properties of boscalid.
Chemical name Boscalid (Nicobifen)
IUPAC 2-chloro-N-(4'-chlorobiphenyl-2-yl) nicotinamideMolecular formula C18H12Cl2N2OMolecular mass 343.2 g mol�1
Vapor pressure (20 �C) 7.2 � 10�7 PaHenry's law constant 5.178 � 10�5 Pa m3 mol�1
SolubilityWater 4.64 mg L�1
Methanol 40-50 g L�1
Acetone 160-200 g L�1
Acetonitrile 40-50 g L�1
pH stability pH 4-9Kd 3.3e28 cm3 g�1 (EPA, 2010)
37.3* cm3 g�1 (Seher, 1998)17.9* cm3 g�1 (Seher, 1998)8.9* cm3 g�1 (Seher, 1998)15.5e37.2** cm3 g�1 (Seher, 1998)
KOC 1492* cm3 g�1 (Seher, 1998)1623* cm3 g�1 (Seher, 1998)2229* cm3 g�1 (Seher, 1998)507e1110* cm3 g�1 (BVL, 2002)672e1760* cm3 g�1 (FSC, 2004)809** cm3 g�1 (Valle�e et al., 2013)
Kf 3.3e27.8 cm3 g�1 (BVL, 2002)12.6 cm3 g�1 (PPDB, 2014)4.8** cm3 g�1 (Valle�e et al., 2013)4.4e8.4* cm3 g�1 (Valle�e et al., 2013)
KOW 507e1110 cm3; g�1 (BVL, 2002)772 cm3 g�1 (PPDB, 2014)386.1* cm3 g�1 (Valle�e et al., 2013)
* was derived from desorption and ** from adsorption experiments.Taken from: BVL (2002), EPA (2003, 2010), and Smalling et al. (2013a).
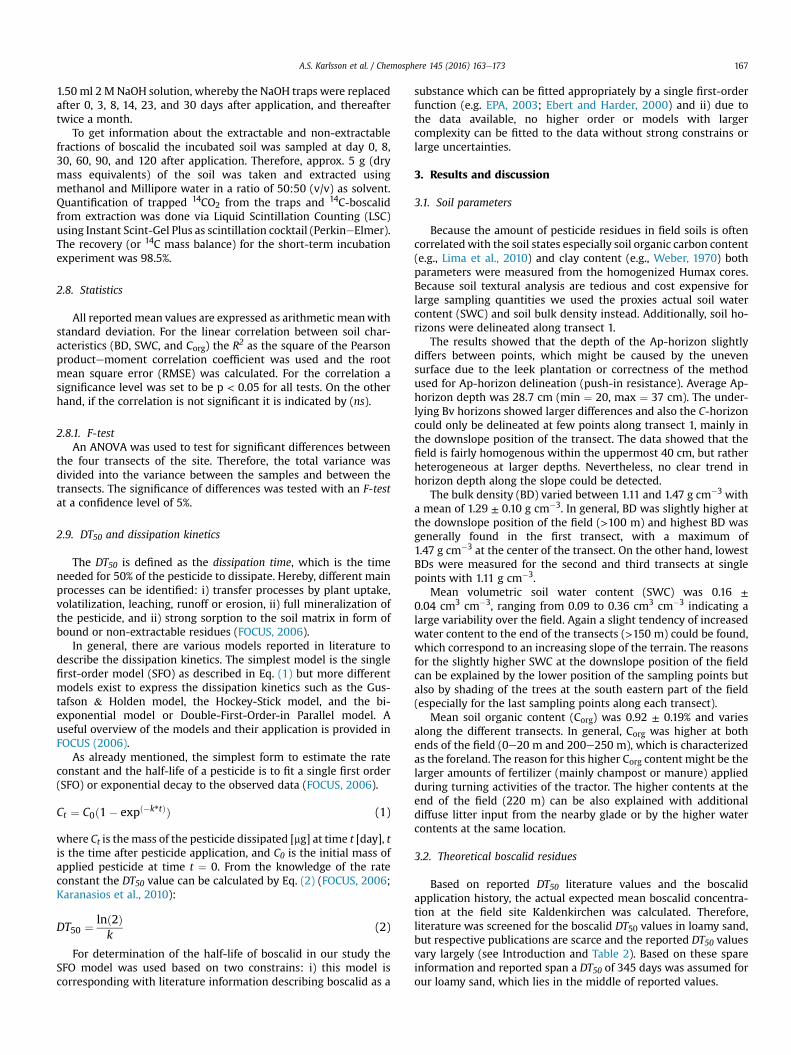
Fig. 1. Transect points (red dots) and transect numbers for the soil sampling at the site Kalde(For interpretation of the references to color in this figure legend, the reader is referred to
A.S. Karlsson et al. / Chemosphere 145 (2016) 163e173 165
samples) to extract undisturbed samples from a depth of 0e30 cm(Fig. 1). Along transect 1 the sampling was denser with 10 m in-tervals. Because the field inclines gently to south east a trend in thesoil characteristics could be expected. Pürckhauer augers weredrilled down to a depth of 1 m at each sampling point along thenorthern transect (transect 1) to describe and distinguish the Ap-horizon and any other detectable horizons underlying.
2.4. Sample preparation
All samples were stored field moist at þ4 �C until furtheranalysis. The undisturbed field moist samples were weighed forbulk density (BD) and water content (SWC) determination. In asecond step, the soil from each core was homogenized and sub-samples were taken and the weight loss after drying at 105 �C for48 h was determined. Based on the weight loss of the subsample,the theoretical weight loss of the entire core can be calculated, andthe bulk density [g cm�3] and volumetric water content [cm3 cm�3]of the entire core can be estimated. Additionally, one part of thehomogenized field fresh subsample was taken for organic carboncontent (Corg) analysis.
Soil organic carbon (Corg) content was determined by drycombustion on a Leco RC 612multiphase carbon analyzer (Co. LECOInstruments GmbH, Germany) at the central chemical laboratoryZEA-3 of the Forschungszentrum Jülich GmbH.
For the Accelerated Solvent Extraction (ASE) of boscalid resi-dues, sieved and homogenized subsamples were used and theactual gravimetric water content (g g�1) was determined at time ofextraction using a Moisture Analyzer HB43-S (Mettler-Toledo AG,Greifensee, Switzerland).
nkirchen in the year 2014. Transect 1 in the North with higher sampling density (10 m).the web version of this article.)
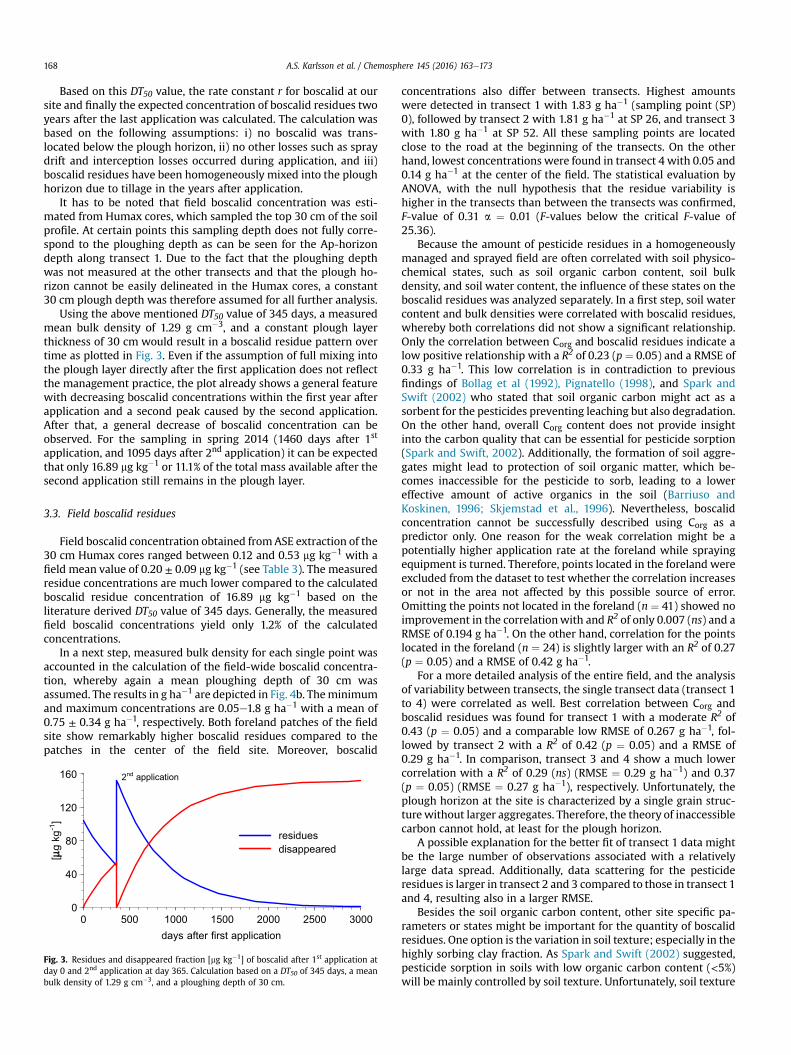
Fig. 2. Plough horizon a) volumetric soil water content [cm3 cm�3], b) soil bulk density [g cm�3], and c) soil organic carbon [%] derived from 30 cm Humax augers.
A.S. Karlsson et al. / Chemosphere 145 (2016) 163e173166
2.5. Extraction of boscalid from soil samples
Extraction of boscalid from soil samples was performed using aDionex™ ASE™ 350 Accelerated Solvent Extractor (Co. ThermoFisher Scientific Inc., Germany). Briefly, 4 g of moist, sieved soil wasmixed with 1 g of infusorial earth (Co. Thermo Fisher Scientific Inc.,Germany), and filled into 10 ml stainless steel cells. The cells werethen filled up to the brim with infusorial earth to allow constantpressure and solvent flow. Extraction was carried out at a pressureof 100 bar and a temperature of 120 �C using 50% water and 50%methanol as solvent. All reported boscalid concentrations are re-ported on soil dry weight basis.
2.6. Ultra performance liquid chromatography and detection
Boscalid in the extracts was identified and quantified with anAcquity Xevo TQ-S an UPLC-MS/MS (Ultra Performance LiquidChromatography, Tandem Quadrupole Mass Spectometry) (Co.Waters, USA), equipped with a SecurityGuard Guard-Column,Kinetex PFP CoreShell (Main-Column, reversed phase) of 2.6 mmparticle size and 100A pore size (Co. Phenomenex, Germany)running the following program:
The initial settings were a linear gradient using 66% Water, 34%MeOH, and 0.1% formic acid (for 1.7 min), thereafter 100% MeOH
(for 2.9 min) returning to the initial gradient (flow rate 0.6 mL, 10 mlcolumn,10L injection volume). A calibration curvewas createdwithconcentrations of pyrimethanil. An internal standard of pyr-imethanil (D5) was used for quantification. Pyrimethanil was foundaccurate to quantify boscalid, by comparison of measurement be-tween internal standard use and standard addition.
The limit of quantification (LOQ) of the UPLC-MS/MS was10 mg L�1 or based on the amount of soil used for the extraction0.006 mg kg�1.
2.7. Short term incubation study
To check whether the estimated field derived DT50 values can bereproduced, a short term incubation study (120 days) according tothe OECD guidelines (OECD, 2000) was performed. For this study14C labelled boscalid (BASF the Chemical Company, SE LimburgerHof, Germany) with 99% radiochemical purity was blended withnon-labelled boscalid (SigmaeAldrich Chemie GmbH, Steinheim,Germany). 150 g of the Kaldenkirchen soil taken from a ploughhorizon bulk sample close to the road (see Fig. 1) was filled into aScott Duran flask and the pesticide was added in a concentration of1.33 mg kg�1 soil. The soil water content was set to 50% maximumwater holding capacity (WHCmax). Boscalid mineralization from theincubation flasks was measured by trapping evolved 14CO2 in
A.S. Karlsson et al. / Chemosphere 145 (2016) 163e173 167
1.50 ml 2 M NaOH solution, whereby the NaOH traps were replacedafter 0, 3, 8, 14, 23, and 30 days after application, and thereaftertwice a month.
To get information about the extractable and non-extractablefractions of boscalid the incubated soil was sampled at day 0, 8,30, 60, 90, and 120 after application. Therefore, approx. 5 g (drymass equivalents) of the soil was taken and extracted usingmethanol and Millipore water in a ratio of 50:50 (v/v) as solvent.Quantification of trapped 14CO2 from the traps and 14C-boscalidfrom extraction was done via Liquid Scintillation Counting (LSC)using Instant Scint-Gel Plus as scintillation cocktail (PerkineElmer).The recovery (or 14C mass balance) for the short-term incubationexperiment was 98.5%.
2.8. Statistics
All reported mean values are expressed as arithmetic meanwithstandard deviation. For the linear correlation between soil char-acteristics (BD, SWC, and Corg) the R2 as the square of the Pearsonproductemoment correlation coefficient was used and the rootmean square error (RMSE) was calculated. For the correlation asignificance level was set to be p < 0.05 for all tests. On the otherhand, if the correlation is not significant it is indicated by (ns).
2.8.1. F-testAn ANOVA was used to test for significant differences between
the four transects of the site. Therefore, the total variance wasdivided into the variance between the samples and between thetransects. The significance of differences was tested with an F-testat a confidence level of 5%.
2.9. DT50 and dissipation kinetics
The DT50 is defined as the dissipation time, which is the timeneeded for 50% of the pesticide to dissipate. Hereby, different mainprocesses can be identified: i) transfer processes by plant uptake,volatilization, leaching, runoff or erosion, ii) full mineralization ofthe pesticide, and ii) strong sorption to the soil matrix in form ofbound or non-extractable residues (FOCUS, 2006).
In general, there are various models reported in literature todescribe the dissipation kinetics. The simplest model is the singlefirst-order model (SFO) as described in Eq. (1) but more differentmodels exist to express the dissipation kinetics such as the Gus-tafson & Holden model, the Hockey-Stick model, and the bi-exponential model or Double-First-Order-in Parallel model. Auseful overview of the models and their application is provided inFOCUS (2006).
As already mentioned, the simplest form to estimate the rateconstant and the half-life of a pesticide is to fit a single first order(SFO) or exponential decay to the observed data (FOCUS, 2006).
Ct ¼ C0ð1� expð�k*tÞÞ (1)
where Ct is themass of the pesticide dissipated [mg] at time t [day], tis the time after pesticide application, and C0 is the initial mass ofapplied pesticide at time t ¼ 0. From the knowledge of the rateconstant the DT50 value can be calculated by Eq. (2) (FOCUS, 2006;Karanasios et al., 2010):
DT50 ¼ lnð2Þk
(2)
For determination of the half-life of boscalid in our study theSFO model was used based on two constrains: i) this model iscorresponding with literature information describing boscalid as a
substance which can be fitted appropriately by a single first-orderfunction (e.g. EPA, 2003; Ebert and Harder, 2000) and ii) due tothe data available, no higher order or models with largercomplexity can be fitted to the data without strong constrains orlarge uncertainties.
3. Results and discussion
3.1. Soil parameters
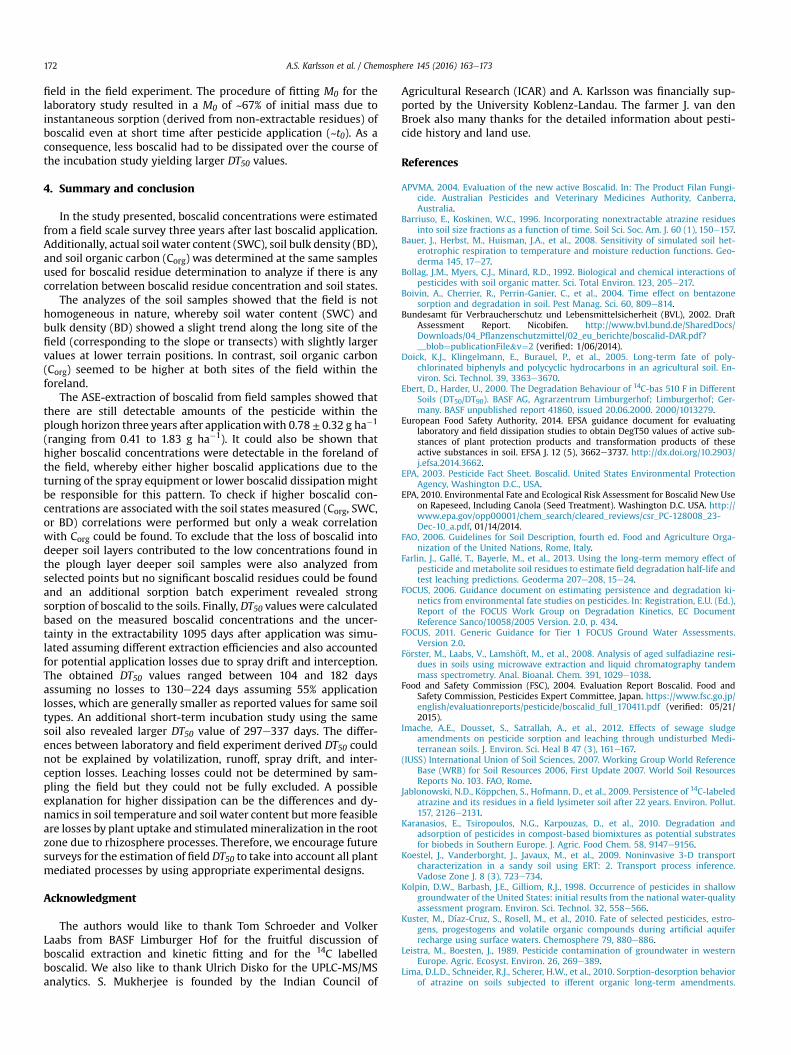
Because the amount of pesticide residues in field soils is oftencorrelatedwith the soil states especially soil organic carbon content(e.g., Lima et al., 2010) and clay content (e.g., Weber, 1970) bothparameters were measured from the homogenized Humax cores.Because soil textural analysis are tedious and cost expensive forlarge sampling quantities we used the proxies actual soil watercontent (SWC) and soil bulk density instead. Additionally, soil ho-rizons were delineated along transect 1.
The results showed that the depth of the Ap-horizon slightlydiffers between points, which might be caused by the unevensurface due to the leek plantation or correctness of the methodused for Ap-horizon delineation (push-in resistance). Average Ap-horizon depth was 28.7 cm (min ¼ 20, max ¼ 37 cm). The under-lying Bv horizons showed larger differences and also the C-horizoncould only be delineated at few points along transect 1, mainly inthe downslope position of the transect. The data showed that thefield is fairly homogenous within the uppermost 40 cm, but ratherheterogeneous at larger depths. Nevertheless, no clear trend inhorizon depth along the slope could be detected.
The bulk density (BD) varied between 1.11 and 1.47 g cm�3 witha mean of 1.29 ± 0.10 g cm�3. In general, BD was slightly higher atthe downslope position of the field (>100 m) and highest BD wasgenerally found in the first transect, with a maximum of1.47 g cm�3 at the center of the transect. On the other hand, lowestBDs were measured for the second and third transects at singlepoints with 1.11 g cm�3.
Mean volumetric soil water content (SWC) was 0.16 ±0.04 cm3 cm�3, ranging from 0.09 to 0.36 cm3 cm�3 indicating alarge variability over the field. Again a slight tendency of increasedwater content to the end of the transects (>150 m) could be found,which correspond to an increasing slope of the terrain. The reasonsfor the slightly higher SWC at the downslope position of the fieldcan be explained by the lower position of the sampling points butalso by shading of the trees at the south eastern part of the field(especially for the last sampling points along each transect).
Mean soil organic content (Corg) was 0.92 ± 0.19% and variesalong the different transects. In general, Corg was higher at bothends of the field (0e20 m and 200e250 m), which is characterizedas the foreland. The reason for this higher Corg content might be thelarger amounts of fertilizer (mainly champost or manure) appliedduring turning activities of the tractor. The higher contents at theend of the field (220 m) can be also explained with additionaldiffuse litter input from the nearby glade or by the higher watercontents at the same location.
3.2. Theoretical boscalid residues
Based on reported DT50 literature values and the boscalidapplication history, the actual expected mean boscalid concentra-tion at the field site Kaldenkirchen was calculated. Therefore,literature was screened for the boscalid DT50 values in loamy sand,but respective publications are scarce and the reported DT50 valuesvary largely (see Introduction and Table 2). Based on these spareinformation and reported span a DT50 of 345 days was assumed forour loamy sand, which lies in the middle of reported values.
A.S. Karlsson et al. / Chemosphere 145 (2016) 163e173168
Based on this DT50 value, the rate constant r for boscalid at oursite and finally the expected concentration of boscalid residues twoyears after the last application was calculated. The calculation wasbased on the following assumptions: i) no boscalid was trans-located below the plough horizon, ii) no other losses such as spraydrift and interception losses occurred during application, and iii)boscalid residues have been homogeneously mixed into the ploughhorizon due to tillage in the years after application.
It has to be noted that field boscalid concentration was esti-mated from Humax cores, which sampled the top 30 cm of the soilprofile. At certain points this sampling depth does not fully corre-spond to the ploughing depth as can be seen for the Ap-horizondepth along transect 1. Due to the fact that the ploughing depthwas not measured at the other transects and that the plough ho-rizon cannot be easily delineated in the Humax cores, a constant30 cm plough depth was therefore assumed for all further analysis.
Using the above mentioned DT50 value of 345 days, a measuredmean bulk density of 1.29 g cm�3, and a constant plough layerthickness of 30 cm would result in a boscalid residue pattern overtime as plotted in Fig. 3. Even if the assumption of full mixing intothe plough layer directly after the first application does not reflectthe management practice, the plot already shows a general featurewith decreasing boscalid concentrations within the first year afterapplication and a second peak caused by the second application.After that, a general decrease of boscalid concentration can beobserved. For the sampling in spring 2014 (1460 days after 1st
application, and 1095 days after 2nd application) it can be expectedthat only 16.89 mg kg�1 or 11.1% of the total mass available after thesecond application still remains in the plough layer.
3.3. Field boscalid residues
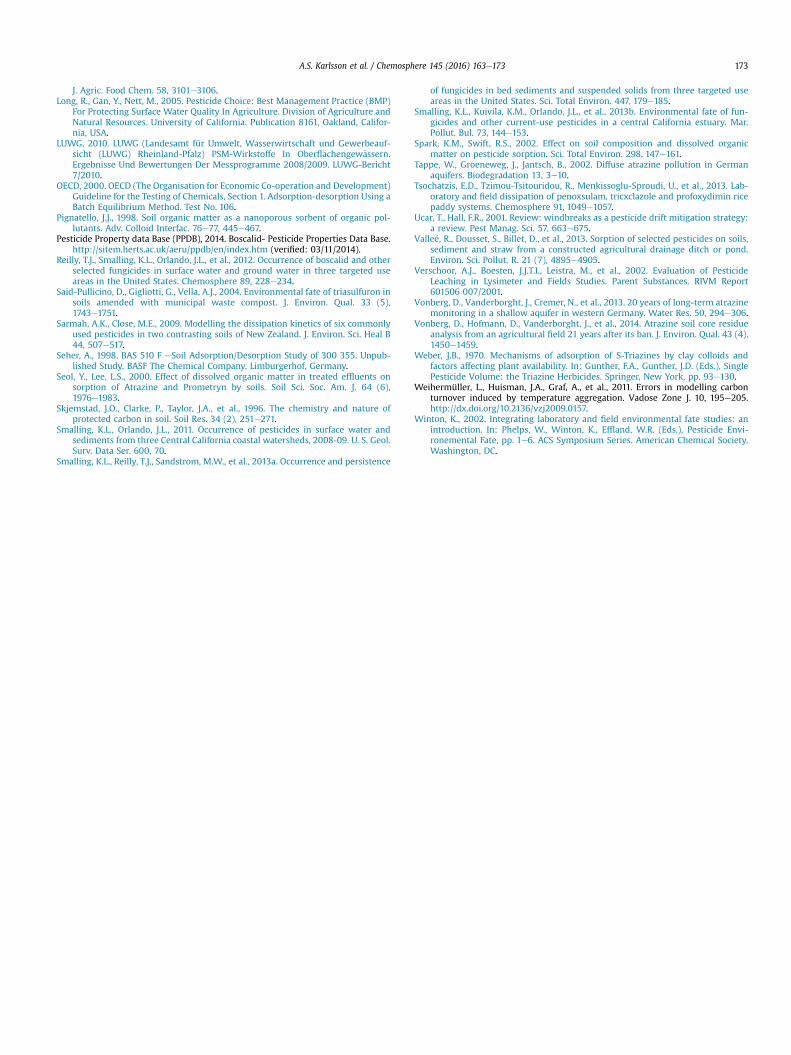
Field boscalid concentration obtained fromASE extraction of the30 cm Humax cores ranged between 0.12 and 0.53 mg kg�1 with afield mean value of 0.20 ± 0.09 mg kg�1 (see Table 3). The measuredresidue concentrations are much lower compared to the calculatedboscalid residue concentration of 16.89 mg kg�1 based on theliterature derived DT50 value of 345 days. Generally, the measuredfield boscalid concentrations yield only 1.2% of the calculatedconcentrations.
In a next step, measured bulk density for each single point wasaccounted in the calculation of the field-wide boscalid concentra-tion, whereby again a mean ploughing depth of 30 cm wasassumed. The results in g ha�1 are depicted in Fig. 4b. Theminimumand maximum concentrations are 0.05e1.8 g ha�1 with a mean of0.75 ± 0.34 g ha�1, respectively. Both foreland patches of the fieldsite show remarkably higher boscalid residues compared to thepatches in the center of the field site. Moreover, boscalid
0 500 1000 1500 2000 2500 30000
40
80
120
160
days after first application
[gkg
-1]
residuesdisappeared
2nd application
Fig. 3. Residues and disappeared fraction [mg kg�1] of boscalid after 1st application atday 0 and 2nd application at day 365. Calculation based on a DT50 of 345 days, a meanbulk density of 1.29 g cm�3, and a ploughing depth of 30 cm.
concentrations also differ between transects. Highest amountswere detected in transect 1 with 1.83 g ha�1 (sampling point (SP)0), followed by transect 2 with 1.81 g ha�1 at SP 26, and transect 3with 1.80 g ha�1 at SP 52. All these sampling points are locatedclose to the road at the beginning of the transects. On the otherhand, lowest concentrations were found in transect 4 with 0.05 and0.14 g ha�1 at the center of the field. The statistical evaluation byANOVA, with the null hypothesis that the residue variability ishigher in the transects than between the transects was confirmed,F-value of 0.31 a ¼ 0.01 (F-values below the critical F-value of25.36).
Because the amount of pesticide residues in a homogeneouslymanaged and sprayed field are often correlated with soil physico-chemical states, such as soil organic carbon content, soil bulkdensity, and soil water content, the influence of these states on theboscalid residues was analyzed separately. In a first step, soil watercontent and bulk densities were correlated with boscalid residues,whereby both correlations did not show a significant relationship.Only the correlation between Corg and boscalid residues indicate alow positive relationship with a R2 of 0.23 (p ¼ 0.05) and a RMSE of0.33 g ha�1. This low correlation is in contradiction to previousfindings of Bollag et al (1992), Pignatello (1998), and Spark andSwift (2002) who stated that soil organic carbon might act as asorbent for the pesticides preventing leaching but also degradation.On the other hand, overall Corg content does not provide insightinto the carbon quality that can be essential for pesticide sorption(Spark and Swift, 2002). Additionally, the formation of soil aggre-gates might lead to protection of soil organic matter, which be-comes inaccessible for the pesticide to sorb, leading to a lowereffective amount of active organics in the soil (Barriuso andKoskinen, 1996; Skjemstad et al., 1996). Nevertheless, boscalidconcentration cannot be successfully described using Corg as apredictor only. One reason for the weak correlation might be apotentially higher application rate at the foreland while sprayingequipment is turned. Therefore, points located in the foreland wereexcluded from the dataset to test whether the correlation increasesor not in the area not affected by this possible source of error.Omitting the points not located in the foreland (n ¼ 41) showed noimprovement in the correlationwith and R2 of only 0.007 (ns) and aRMSE of 0.194 g ha�1. On the other hand, correlation for the pointslocated in the foreland (n ¼ 24) is slightly larger with an R2 of 0.27(p ¼ 0.05) and a RMSE of 0.42 g ha�1.
For a more detailed analysis of the entire field, and the analysisof variability between transects, the single transect data (transect 1to 4) were correlated as well. Best correlation between Corg andboscalid residues was found for transect 1 with a moderate R2 of0.43 (p ¼ 0.05) and a comparable low RMSE of 0.267 g ha�1, fol-lowed by transect 2 with a R2 of 0.42 (p ¼ 0.05) and a RMSE of0.29 g ha�1. In comparison, transect 3 and 4 show a much lowercorrelation with a R2 of 0.29 (ns) (RMSE ¼ 0.29 g ha�1) and 0.37(p ¼ 0.05) (RMSE ¼ 0.27 g ha�1), respectively. Unfortunately, theplough horizon at the site is characterized by a single grain struc-turewithout larger aggregates. Therefore, the theory of inaccessiblecarbon cannot hold, at least for the plough horizon.
A possible explanation for the better fit of transect 1 data mightbe the large number of observations associated with a relativelylarge data spread. Additionally, data scattering for the pesticideresidues is larger in transect 2 and 3 compared to those in transect 1and 4, resulting also in a larger RMSE.
Besides the soil organic carbon content, other site specific pa-rameters or states might be important for the quantity of boscalidresidues. One option is the variation in soil texture; especially in thehighly sorbing clay fraction. As Spark and Swift (2002) suggested,pesticide sorption in soils with low organic carbon content (<5%)will be mainly controlled by soil texture. Unfortunately, soil texture
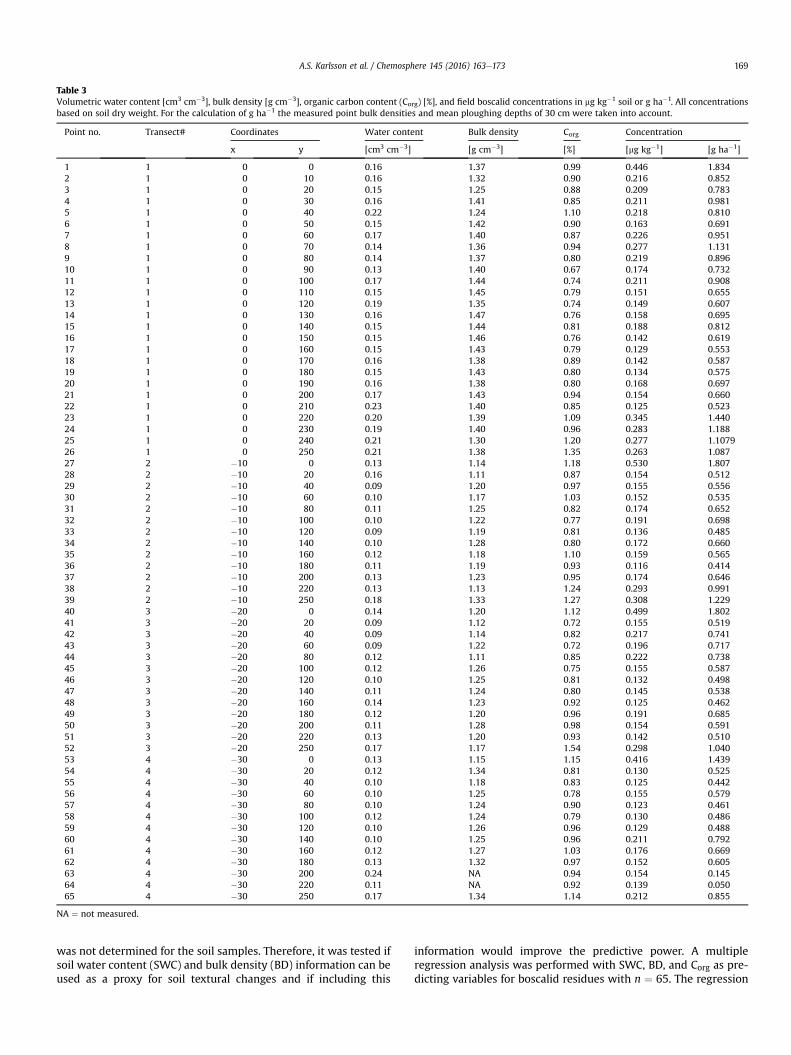
Table 3Volumetric water content [cm3 cm�3], bulk density [g cm�3], organic carbon content (Corg) [%], and field boscalid concentrations in mg kg�1 soil or g ha�1. All concentrationsbased on soil dry weight. For the calculation of g ha�1 the measured point bulk densities and mean ploughing depths of 30 cm were taken into account.
Point no. Transect# Coordinates Water content Bulk density Corg Concentration
x y [cm3 cm�3] [g cm�3] [%] [mg kg�1] [g ha�1]
1 1 0 0 0.16 1.37 0.99 0.446 1.8342 1 0 10 0.16 1.32 0.90 0.216 0.8523 1 0 20 0.15 1.25 0.88 0.209 0.7834 1 0 30 0.16 1.41 0.85 0.211 0.9815 1 0 40 0.22 1.24 1.10 0.218 0.8106 1 0 50 0.15 1.42 0.90 0.163 0.6917 1 0 60 0.17 1.40 0.87 0.226 0.9518 1 0 70 0.14 1.36 0.94 0.277 1.1319 1 0 80 0.14 1.37 0.80 0.219 0.89610 1 0 90 0.13 1.40 0.67 0.174 0.73211 1 0 100 0.17 1.44 0.74 0.211 0.90812 1 0 110 0.15 1.45 0.79 0.151 0.65513 1 0 120 0.19 1.35 0.74 0.149 0.60714 1 0 130 0.16 1.47 0.76 0.158 0.69515 1 0 140 0.15 1.44 0.81 0.188 0.81216 1 0 150 0.15 1.46 0.76 0.142 0.61917 1 0 160 0.15 1.43 0.79 0.129 0.55318 1 0 170 0.16 1.38 0.89 0.142 0.58719 1 0 180 0.15 1.43 0.80 0.134 0.57520 1 0 190 0.16 1.38 0.80 0.168 0.69721 1 0 200 0.17 1.43 0.94 0.154 0.66022 1 0 210 0.23 1.40 0.85 0.125 0.52323 1 0 220 0.20 1.39 1.09 0.345 1.44024 1 0 230 0.19 1.40 0.96 0.283 1.18825 1 0 240 0.21 1.30 1.20 0.277 1.107926 1 0 250 0.21 1.38 1.35 0.263 1.08727 2 �10 0 0.13 1.14 1.18 0.530 1.80728 2 �10 20 0.16 1.11 0.87 0.154 0.51229 2 �10 40 0.09 1.20 0.97 0.155 0.55630 2 �10 60 0.10 1.17 1.03 0.152 0.53531 2 �10 80 0.11 1.25 0.82 0.174 0.65232 2 �10 100 0.10 1.22 0.77 0.191 0.69833 2 �10 120 0.09 1.19 0.81 0.136 0.48534 2 �10 140 0.10 1.28 0.80 0.172 0.66035 2 �10 160 0.12 1.18 1.10 0.159 0.56536 2 �10 180 0.11 1.19 0.93 0.116 0.41437 2 �10 200 0.13 1.23 0.95 0.174 0.64638 2 �10 220 0.13 1.13 1.24 0.293 0.99139 2 �10 250 0.18 1.33 1.27 0.308 1.22940 3 �20 0 0.14 1.20 1.12 0.499 1.80241 3 �20 20 0.09 1.12 0.72 0.155 0.51942 3 �20 40 0.09 1.14 0.82 0.217 0.74143 3 �20 60 0.09 1.22 0.72 0.196 0.71744 3 �20 80 0.12 1.11 0.85 0.222 0.73845 3 �20 100 0.12 1.26 0.75 0.155 0.58746 3 �20 120 0.10 1.25 0.81 0.132 0.49847 3 �20 140 0.11 1.24 0.80 0.145 0.53848 3 �20 160 0.14 1.23 0.92 0.125 0.46249 3 �20 180 0.12 1.20 0.96 0.191 0.68550 3 �20 200 0.11 1.28 0.98 0.154 0.59151 3 �20 220 0.13 1.20 0.93 0.142 0.51052 3 �20 250 0.17 1.17 1.54 0.298 1.04053 4 �30 0 0.13 1.15 1.15 0.416 1.43954 4 �30 20 0.12 1.34 0.81 0.130 0.52555 4 �30 40 0.10 1.18 0.83 0.125 0.44256 4 �30 60 0.10 1.25 0.78 0.155 0.57957 4 �30 80 0.10 1.24 0.90 0.123 0.46158 4 �30 100 0.12 1.24 0.79 0.130 0.48659 4 �30 120 0.10 1.26 0.96 0.129 0.48860 4 �30 140 0.10 1.25 0.96 0.211 0.79261 4 �30 160 0.12 1.27 1.03 0.176 0.66962 4 �30 180 0.13 1.32 0.97 0.152 0.60563 4 �30 200 0.24 NA 0.94 0.154 0.14564 4 �30 220 0.11 NA 0.92 0.139 0.05065 4 �30 250 0.17 1.34 1.14 0.212 0.855
NA ¼ not measured.
A.S. Karlsson et al. / Chemosphere 145 (2016) 163e173 169
was not determined for the soil samples. Therefore, it was tested ifsoil water content (SWC) and bulk density (BD) information can beused as a proxy for soil textural changes and if including this
information would improve the predictive power. A multipleregression analysis was performed with SWC, BD, and Corg as pre-dicting variables for boscalid residues with n ¼ 65. The regression
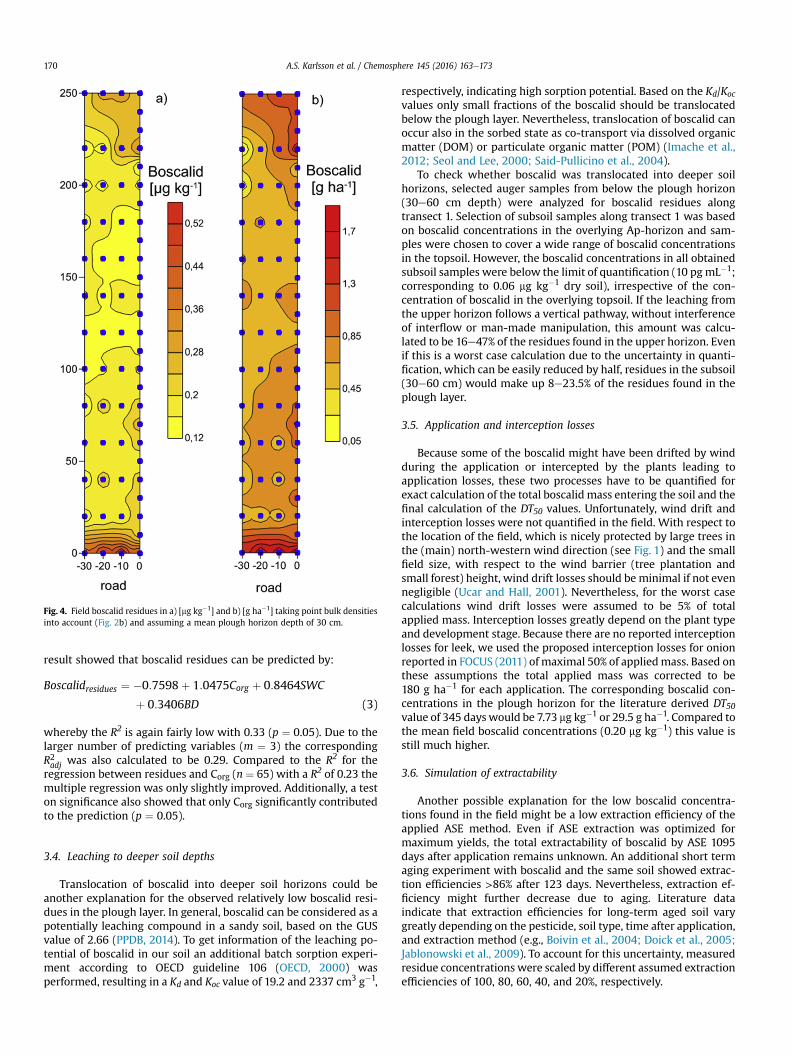
Fig. 4. Field boscalid residues in a) [mg kg�1] and b) [g ha�1] taking point bulk densitiesinto account (Fig. 2b) and assuming a mean plough horizon depth of 30 cm.
A.S. Karlsson et al. / Chemosphere 145 (2016) 163e173170
result showed that boscalid residues can be predicted by:
Boscalidresidues ¼ �0:7598þ 1:0475Corg þ 0:8464SWC
þ 0:3406BD (3)
whereby the R2 is again fairly low with 0.33 (p ¼ 0.05). Due to thelarger number of predicting variables (m ¼ 3) the correspondingR2adj was also calculated to be 0.29. Compared to the R2 for theregression between residues and Corg (n ¼ 65) with a R2 of 0.23 themultiple regression was only slightly improved. Additionally, a teston significance also showed that only Corg significantly contributedto the prediction (p ¼ 0.05).
3.4. Leaching to deeper soil depths
Translocation of boscalid into deeper soil horizons could beanother explanation for the observed relatively low boscalid resi-dues in the plough layer. In general, boscalid can be considered as apotentially leaching compound in a sandy soil, based on the GUSvalue of 2.66 (PPDB, 2014). To get information of the leaching po-tential of boscalid in our soil an additional batch sorption experi-ment according to OECD guideline 106 (OECD, 2000) wasperformed, resulting in a Kd and Koc value of 19.2 and 2337 cm3 g�1,
respectively, indicating high sorption potential. Based on the Kd/Koc
values only small fractions of the boscalid should be translocatedbelow the plough layer. Nevertheless, translocation of boscalid canoccur also in the sorbed state as co-transport via dissolved organicmatter (DOM) or particulate organic matter (POM) (Imache et al.,2012; Seol and Lee, 2000; Said-Pullicino et al., 2004).
To check whether boscalid was translocated into deeper soilhorizons, selected auger samples from below the plough horizon(30e60 cm depth) were analyzed for boscalid residues alongtransect 1. Selection of subsoil samples along transect 1 was basedon boscalid concentrations in the overlying Ap-horizon and sam-ples were chosen to cover a wide range of boscalid concentrationsin the topsoil. However, the boscalid concentrations in all obtainedsubsoil samples were below the limit of quantification (10 pgmL�1;corresponding to 0.06 mg kg�1 dry soil), irrespective of the con-centration of boscalid in the overlying topsoil. If the leaching fromthe upper horizon follows a vertical pathway, without interferenceof interflow or man-made manipulation, this amount was calcu-lated to be 16e47% of the residues found in the upper horizon. Evenif this is a worst case calculation due to the uncertainty in quanti-fication, which can be easily reduced by half, residues in the subsoil(30e60 cm) would make up 8e23.5% of the residues found in theplough layer.
3.5. Application and interception losses
Because some of the boscalid might have been drifted by windduring the application or intercepted by the plants leading toapplication losses, these two processes have to be quantified forexact calculation of the total boscalid mass entering the soil and thefinal calculation of the DT50 values. Unfortunately, wind drift andinterception losses were not quantified in the field. With respect tothe location of the field, which is nicely protected by large trees inthe (main) north-western wind direction (see Fig. 1) and the smallfield size, with respect to the wind barrier (tree plantation andsmall forest) height, wind drift losses should be minimal if not evennegligible (Ucar and Hall, 2001). Nevertheless, for the worst casecalculations wind drift losses were assumed to be 5% of totalapplied mass. Interception losses greatly depend on the plant typeand development stage. Because there are no reported interceptionlosses for leek, we used the proposed interception losses for onionreported in FOCUS (2011) of maximal 50% of appliedmass. Based onthese assumptions the total applied mass was corrected to be180 g ha�1 for each application. The corresponding boscalid con-centrations in the plough horizon for the literature derived DT50value of 345 dayswould be 7.73 mg kg�1 or 29.5 g ha�1. Compared tothe mean field boscalid concentrations (0.20 mg kg�1) this value isstill much higher.
3.6. Simulation of extractability
Another possible explanation for the low boscalid concentra-tions found in the field might be a low extraction efficiency of theapplied ASE method. Even if ASE extraction was optimized formaximum yields, the total extractability of boscalid by ASE 1095days after application remains unknown. An additional short termaging experiment with boscalid and the same soil showed extrac-tion efficiencies >86% after 123 days. Nevertheless, extraction ef-ficiency might further decrease due to aging. Literature dataindicate that extraction efficiencies for long-term aged soil varygreatly depending on the pesticide, soil type, time after application,and extraction method (e.g., Boivin et al., 2004; Doick et al., 2005;Jablonowski et al., 2009). To account for this uncertainty, measuredresidue concentrations were scaled by different assumed extractionefficiencies of 100, 80, 60, 40, and 20%, respectively.
A.S. Karlsson et al. / Chemosphere 145 (2016) 163e173 171
The mean concentration at 100% extractability was measured to0.78 ± 0.32 g ha�1 (ranging from 0.41 to 1.83 g ha�1). For 80% ef-ficiency, the mean value increased to 0.97 ± 0.41 g ha�1
(0.52e2.29 g ha�1), for 60% extraction efficiency to1.30 ± 0.55 g ha�1 (0.69e3.06 g ha�1), for 40% efficiency to1.94 ± 0.82 g ha�1 (1.04e4.59 g ha�1), and for 20% efficiency even to3.88 ± 1.64 g ha�1 (2.07e9.17 g ha�1) (see Table 4).
Assuming the efficiency of the ASE being only 20%, the highestmeasured boscalid concentration in the plough horizon would be9.17 g ha�1 instead of 1.83 g ha�1. The lowest concentration wouldbe 2 g ha�1, compared to the measured 0.41 g ha�1, Therefore,highest boscalid concentration at 60% efficiency would be3.06 g ha�1, which corresponds to 0.51% of the applied 590 g ha�1
boscalid at t0 and the lowest concentration would be 0.69 g ha�1,which corresponds to 0.12% of the applied 590 g ha�1 boscalid at t0,respectively.
3.7. Calculation of DT50 from field samples
Based on the measured field boscalid concentrations shown inFig. 4b DT50 values were calculated using Eq. (1) and (2) with anapplication dosage of 590 g ha�1 boscalid at t0 (second applicationat day 365) an elapsed time since last application of 1095 days forthe case that all boscalid applied entered the soil and an applicationdosage of 270 g ha�1 for the case where 55% of the applied masswas assumed to be lost due to spray drift and interception. DT50values were calculated in the same way using the simulatedextraction efficiencies and corresponding mean, minimum, andmaximum boscalid concentrations as listed in Tab 4. The corre-sponding half-life times are displayed in Table 4. The measuredvalues from the ASE extraction are presented as 100% expressed asmean, minimum and maximum value.
The boscalid half-life of the field soils without assuming anylosses and 100% extraction efficiency resulted in a DT50 values of104e132 days with a field mean of 115 days. On the other hand,assuming an extraction efficiency of only 20% yields a maximumDT50 of 182 days and assuming a moderate extraction efficiency of60% shows intermediate DT50 values of 112 and 144 days (mean 124days), respectively. As mentioned, the losses due to spray drift andinterceptionwere not quantified in our experiment but assumed tobe in a worst case 55% of the application. The corresponding DT50for this scenario are also listed in Table 4 and showed that the DT50increased by 15 days to 130 days assuming 100% extraction effi-ciency. For the smallest assumed extraction efficiency of only 20%the DT50 was 179 over all points and 224 days for the highestconcentration found. Half-life times of boscalid reported in litera-ture are considerably higher as those calculated with and withoutlosses with 307e365 days for loamy sand. The reasons for thesedifferences are still unclear. To check whether the estimated fieldderived DT50 values can be reproduced, a short term incubationstudy (120 days) was performed. It has to be noted that theextraction of boscalid was performed using methanol/water in a
Table 4Calculated half-life's (DT50) of boscalid according to measured residues (100%) andsimulated extraction efficiencies (80, 60, 40, and 20%) assuming no spray drift andinterception losses and 55% losses.
Extraction Field concentration[g ha�1]
DT50 [days]no losses
DT50 [days]55% losses
Efficiency [%] Mean min Max Mean min Max Mean min Max
100 0.78 0.41 1.83 115 104 132 130 117 15280 0.97 0.52 2.29 118 108 137 135 121 15960 1.30 0.69 3.06 124 112 144 142 127 16940 1.94 1.04 4.59 133 120 156 154 137 18620 3.88 2.07 9.17 151 134 182 179 156 224
ratio of 50/50 with shaking only. The results showed that only aminor part of boscalid was mineralized over the 120 days (~4%) butthat ~45% of the added boscalid were non-extractable. The corre-sponding DT50 value calculated from mineralization þ non-extractable from a single first-order model was 297 and for theextractable fraction 337 days, which is again shorter as most re-ported ones but still larger as the field estimates.
Deviations of DT50 from field dissipation studies and laboratoryincubation experiments have been already reported and the rea-sons for the observed differences are manifold. The European FoodSafety Authority (2014) listed different processes explaining theobserved differences such as volatilization losses, soil surfacephotolysis (or photodegradation), leaching out of the sampled soillayers. Winton (2002) added also runoff and differences in pH, aswell as substantial differences in soil water content and soil tem-perature to the list and stated that in laboratory incubation it islikely that some populations of aerobic and anaerobic soil microbeswill accelerate pesticide mineralization. Based on this list and thephysico-chemical properties of boscalid listed in Table 2 and fieldobservations some of the processes can be defined either as beingimportant or as being not important for the observed deviation inthe DT50 values.
Based on the reported Henry's law constant (HLC) of5.178 � 10�5 Pa m3 mol�1 and vapor pressure of 7.2 � 10�7 Paboscalid can be defined as essentially non-volatile and it is reportedto resist photodegradation on soils (EPA, 2003). Because pH of thesandy soil was 6.1, chemical stability of boscalid is also ensured.Runoff from the field after application seems also to play a minorrole due to two facts: i) the slope of the field is fairly low, whichdoes not favor runoff, ii) due to the sandy character of the soilsaturated hydraulic conductivity of the Ap-horizon is generallyhigh (>100 cm d�1), and iii) the aggregation potential is low due tothe small percentage of silt and clay content. Leaching as a potentialsource of loss from the plough horizon could be also excluded bythe sampling deeper zones and the additional sorption batchexperiment indicating high sorption tendencies of boscalid to oursoil. Therefore, only the differences and also the dynamics in soiltemperature and soil water content might be considered aspossible major drivers for the difference observed. In general, it isknown from various investigations that the microbial activity isnon-linear related to soil temperature and soil water content (e.g.Bauer et al., 2008), whereby soil temperature regulates microbialactivity by a larger extend as soil water content at least intemperate-humid climate. Even if the laboratory incubationexperiment was performed at fairly high constant ambient tem-perature (25 �C) variation in temperature under natural conditionsmight stimulate microbial activity (Weihermüller et al., 2011) andhave turned over more boscalid. The mineralization rate during thelaboratory incubation experiment showed that only ~4% of boscalidwas mineralized over 120 days and that mineralization alreadyslowed down after eight days of incubation. Therefore, acceleratedmineralization under field conditions seems not to explain thedifference either. A hint of an additional influencing factor can befound in Tsochatzis et al. (2013) who stated that the pesticide tri-cyclazole might be faster dissipated under field conditions due tothe presence of plants which might have promoted the dissipationthrough the stimulation of microbial degradation in the plantrhizosphere or through direct plant uptake. Unfortunately, plantuptake cannot be reconstructed anymore, but future field dissipa-tion studies should take into account these pathways and shoulddesign their experiments accordingly.
Another reason for the differences observed can be found in theDT50 fitting procedure itself. While for laboratory studies fitting ofthe initial mass (M0) is recommended to ensure better fitting re-sults (FOCUS, 2006), M0 was set to the initial mass applied to the
A.S. Karlsson et al. / Chemosphere 145 (2016) 163e173172
field in the field experiment. The procedure of fitting M0 for thelaboratory study resulted in a M0 of ~67% of initial mass due toinstantaneous sorption (derived from non-extractable residues) ofboscalid even at short time after pesticide application (~t0). As aconsequence, less boscalid had to be dissipated over the course ofthe incubation study yielding larger DT50 values.
4. Summary and conclusion
In the study presented, boscalid concentrations were estimatedfrom a field scale survey three years after last boscalid application.Additionally, actual soil water content (SWC), soil bulk density (BD),and soil organic carbon (Corg) was determined at the same samplesused for boscalid residue determination to analyze if there is anycorrelation between boscalid residue concentration and soil states.
The analyzes of the soil samples showed that the field is nothomogeneous in nature, whereby soil water content (SWC) andbulk density (BD) showed a slight trend along the long site of thefield (corresponding to the slope or transects) with slightly largervalues at lower terrain positions. In contrast, soil organic carbon(Corg) seemed to be higher at both sites of the field within theforeland.
The ASE-extraction of boscalid from field samples showed thatthere are still detectable amounts of the pesticide within theplough horizon three years after applicationwith 0.78 ± 0.32 g ha�1
(ranging from 0.41 to 1.83 g ha�1). It could also be shown thathigher boscalid concentrations were detectable in the foreland ofthe field, whereby either higher boscalid applications due to theturning of the spray equipment or lower boscalid dissipation mightbe responsible for this pattern. To check if higher boscalid con-centrations are associated with the soil states measured (Corg, SWC,or BD) correlations were performed but only a weak correlationwith Corg could be found. To exclude that the loss of boscalid intodeeper soil layers contributed to the low concentrations found inthe plough layer deeper soil samples were also analyzed fromselected points but no significant boscalid residues could be foundand an additional sorption batch experiment revealed strongsorption of boscalid to the soils. Finally, DT50 values were calculatedbased on the measured boscalid concentrations and the uncer-tainty in the extractability 1095 days after application was simu-lated assuming different extraction efficiencies and also accountedfor potential application losses due to spray drift and interception.The obtained DT50 values ranged between 104 and 182 daysassuming no losses to 130e224 days assuming 55% applicationlosses, which are generally smaller as reported values for same soiltypes. An additional short-term incubation study using the samesoil also revealed larger DT50 value of 297e337 days. The differ-ences between laboratory and field experiment derived DT50 couldnot be explained by volatilization, runoff, spray drift, and inter-ception losses. Leaching losses could not be determined by sam-pling the field but they could not be fully excluded. A possibleexplanation for higher dissipation can be the differences and dy-namics in soil temperature and soil water content but more feasibleare losses by plant uptake and stimulatedmineralization in the rootzone due to rhizosphere processes. Therefore, we encourage futuresurveys for the estimation of field DT50 to take into account all plantmediated processes by using appropriate experimental designs.
Acknowledgment
The authors would like to thank Tom Schroeder and VolkerLaabs from BASF Limburger Hof for the fruitful discussion ofboscalid extraction and kinetic fitting and for the 14C labelledboscalid. We also like to thank Ulrich Disko for the UPLC-MS/MSanalytics. S. Mukherjee is founded by the Indian Council of
Agricultural Research (ICAR) and A. Karlsson was financially sup-ported by the University Koblenz-Landau. The farmer J. van denBroek also many thanks for the detailed information about pesti-cide history and land use.
References
APVMA, 2004. Evaluation of the new active Boscalid. In: The Product Filan Fungi-cide. Australian Pesticides and Veterinary Medicines Authority, Canberra,Australia.
Barriuso, E., Koskinen, W.C., 1996. Incorporating nonextractable atrazine residuesinto soil size fractions as a function of time. Soil Sci. Soc. Am. J. 60 (1), 150e157.
Bauer, J., Herbst, M., Huisman, J.A., et al., 2008. Sensitivity of simulated soil het-erotrophic respiration to temperature and moisture reduction functions. Geo-derma 145, 17e27.
Bollag, J.M., Myers, C.J., Minard, R.D., 1992. Biological and chemical interactions ofpesticides with soil organic matter. Sci. Total Environ. 123, 205e217.
Boivin, A., Cherrier, R., Perrin-Ganier, C., et al., 2004. Time effect on bentazonesorption and degradation in soil. Pest Manag. Sci. 60, 809e814.
Bundesamt für Verbraucherschutz und Lebensmittelsicherheit (BVL), 2002. DraftAssessment Report. Nicobifen. http://www.bvl.bund.de/SharedDocs/Downloads/04_Pflanzenschutzmittel/02_eu_berichte/boscalid-DAR.pdf?__blob¼publicationFile&v¼2 (verified: 1/06/2014).
Doick, K.J., Klingelmann, E., Burauel, P., et al., 2005. Long-term fate of poly-chlorinated biphenyls and polycyclic hydrocarbons in an agricultural soil. En-viron. Sci. Technol. 39, 3363e3670.
Ebert, D., Harder, U., 2000. The Degradation Behaviour of 14C-bas 510 F in DifferentSoils (DT50/DT90). BASF AG, Agrarzentrum Limburgerhof; Limburgerhof; Ger-many. BASF unpublished report 41860, issued 20.06.2000. 2000/1013279.
European Food Safety Authority, 2014. EFSA guidance document for evaluatinglaboratory and field dissipation studies to obtain DegT50 values of active sub-stances of plant protection products and transformation products of theseactive substances in soil. EFSA J. 12 (5), 3662e3737. http://dx.doi.org/10.2903/j.efsa.2014.3662.
EPA, 2003. Pesticide Fact Sheet. Boscalid. United States Environmental ProtectionAgency, Washington D.C., USA.
EPA, 2010. Environmental Fate and Ecological Risk Assessment for Boscalid New Useon Rapeseed, Including Canola (Seed Treatment). Washington D.C. USA. http://www.epa.gov/opp00001/chem_search/cleared_reviews/csr_PC-128008_23-Dec-10_a.pdf, 01/14/2014.
FAO, 2006. Guidelines for Soil Description, fourth ed. Food and Agriculture Orga-nization of the United Nations, Rome, Italy.
Farlin, J., Gall�e, T., Bayerle, M., et al., 2013. Using the long-term memory effect ofpesticide and metabolite soil residues to estimate field degradation half-life andtest leaching predictions. Geoderma 207e208, 15e24.
FOCUS, 2006. Guidance document on estimating persistence and degradation ki-netics from environmental fate studies on pesticides. In: Registration, E.U. (Ed.),Report of the FOCUS Work Group on Degradation Kinetics, EC DocumentReference Sanco/10058/2005 Version. 2.0, p. 434.
FOCUS, 2011. Generic Guidance for Tier 1 FOCUS Ground Water Assessments.Version 2.0.
F€orster, M., Laabs, V., Lamsh€oft, M., et al., 2008. Analysis of aged sulfadiazine resi-dues in soils using microwave extraction and liquid chromatography tandemmass spectrometry. Anal. Bioanal. Chem. 391, 1029e1038.
Food and Safety Commission (FSC), 2004. Evaluation Report Boscalid. Food andSafety Commission, Pesticides Expert Committee, Japan. https://www.fsc.go.jp/english/evaluationreports/pesticide/boscalid_full_170411.pdf (verified: 05/21/2015).
Imache, A.E., Dousset, S., Satrallah, A., et al., 2012. Effects of sewage sludgeamendments on pesticide sorption and leaching through undisturbed Medi-terranean soils. J. Environ. Sci. Heal B 47 (3), 161e167.
(IUSS) International Union of Soil Sciences, 2007. Working Group World ReferenceBase (WRB) for Soil Resources 2006, First Update 2007. World Soil ResourcesReports No. 103. FAO, Rome.
Jablonowski, N.D., K€oppchen, S., Hofmann, D., et al., 2009. Persistence of 14C-labeledatrazine and its residues in a field lysimeter soil after 22 years. Environ. Pollut.157, 2126e2131.
Karanasios, E., Tsiropoulos, N.G., Karpouzas, D., et al., 2010. Degradation andadsorption of pesticides in compost-based biomixtures as potential substratesfor biobeds in Southern Europe. J. Agric. Food Chem. 58, 9147e9156.
Koestel, J., Vanderborght, J., Javaux, M., et al., 2009. Noninvasive 3-D transportcharacterization in a sandy soil using ERT: 2. Transport process inference.Vadose Zone J. 8 (3), 723e734.
Kolpin, D.W., Barbash, J.E., Gilliom, R.J., 1998. Occurrence of pesticides in shallowgroundwater of the United States: initial results from the national water-qualityassessment program. Environ. Sci. Technol. 32, 558e566.
Kuster, M., Díaz-Cruz, S., Rosell, M., et al., 2010. Fate of selected pesticides, estro-gens, progestogens and volatile organic compounds during artificial aquiferrecharge using surface waters. Chemosphere 79, 880e886.
Leistra, M., Boesten, J., 1989. Pesticide contamination of groundwater in westernEurope. Agric. Ecosyst. Environ. 26, 269e389.
Lima, D.L.D., Schneider, R.J., Scherer, H.W., et al., 2010. Sorption-desorption behaviorof atrazine on soils subjected to ifferent organic long-term amendments.
A.S. Karlsson et al. / Chemosphere 145 (2016) 163e173 173
J. Agric. Food Chem. 58, 3101e3106.Long, R., Gan, Y., Nett, M., 2005. Pesticide Choice: Best Management Practice (BMP)
For Protecting Surface Water Quality In Agriculture. Division of Agriculture andNatural Resources. University of California. Publication 8161, Oakland, Califor-nia, USA.
LUWG, 2010. LUWG (Landesamt für Umwelt, Wasserwirtschaft und Gewerbeauf-sicht (LUWG) Rheinland-Pfalz) PSM-Wirkstoffe In Oberfl€achengew€assern.Ergebnisse Und Bewertungen Der Messprogramme 2008/2009. LUWG-Bericht7/2010.
OECD, 2000. OECD (The Organisation for Economic Co-operation and Development)Guideline for the Testing of Chemicals, Section 1. Adsorption-desorption Using aBatch Equilibrium Method. Test No. 106.
Pignatello, J.J., 1998. Soil organic matter as a nanoporous sorbent of organic pol-lutants. Adv. Colloid Interfac. 76e77, 445e467.
Pesticide Property data Base (PPDB), 2014. Boscalid- Pesticide Properties Data Base.http://sitem.herts.ac.uk/aeru/ppdb/en/index.htm (verified: 03/11/2014).
Reilly, T.J., Smalling, K.L., Orlando, J.L., et al., 2012. Occurrence of boscalid and otherselected fungicides in surface water and ground water in three targeted useareas in the United States. Chemosphere 89, 228e234.
Said-Pullicino, D., Gigliotti, G., Vella, A.J., 2004. Environmental fate of triasulfuron insoils amended with municipal waste compost. J. Environ. Qual. 33 (5),1743e1751.
Sarmah, A.K., Close, M.E., 2009. Modelling the dissipation kinetics of six commonlyused pesticides in two contrasting soils of New Zealand. J. Environ. Sci. Heal B44, 507e517.
Seher, A., 1998. BAS 510 F eSoil Adsorption/Desorption Study of 300 355. Unpub-lished Study. BASF The Chemical Company, Limburgerhof, Germany.
Seol, Y., Lee, L.S., 2000. Effect of dissolved organic matter in treated effluents onsorption of Atrazine and Prometryn by soils. Soil Sci. Soc. Am. J. 64 (6),1976e1983.
Skjemstad, J.O., Clarke, P., Taylor, J.A., et al., 1996. The chemistry and nature ofprotected carbon in soil. Soil Res. 34 (2), 251e271.
Smalling, K.L., Orlando, J.L., 2011. Occurrence of pesticides in surface water andsediments from three Central California coastal watersheds, 2008-09. U. S. Geol.Surv. Data Ser. 600, 70.
Smalling, K.L., Reilly, T.J., Sandstrom, M.W., et al., 2013a. Occurrence and persistence
of fungicides in bed sediments and suspended solids from three targeted useareas in the United States. Sci. Total Environ. 447, 179e185.
Smalling, K.L., Kuivila, K.M., Orlando, J.L., et al., 2013b. Environmental fate of fun-gicides and other current-use pesticides in a central California estuary. Mar.Pollut. Bul. 73, 144e153.
Spark, K.M., Swift, R.S., 2002. Effect on soil composition and dissolved organicmatter on pesticide sorption. Sci. Total Environ. 298, 147e161.
Tappe, W., Groeneweg, J., Jantsch, B., 2002. Diffuse atrazine pollution in Germanaquifers. Biodegradation 13, 3e10.
Tsochatzis, E.D., Tzimou-Tsitouridou, R., Menkissoglu-Sproudi, U., et al., 2013. Lab-oratory and field dissipation of penoxsulam, tricxclazole and profoxydimin ricepaddy systems. Chemosphere 91, 1049e1057.
Ucar, T., Hall, F.R., 2001. Review: windbreaks as a pesticide drift mitigation strategy:a review. Pest Manag. Sci. 57, 663e675.
Valle�e, R., Dousset, S., Billet, D., et al., 2013. Sorption of selected pesticides on soils,sediment and straw from a constructed agricultural drainage ditch or pond.Environ. Sci. Pollut. R. 21 (7), 4895e4905.
Verschoor, A.J., Boesten, J.J.T.I., Leistra, M., et al., 2002. Evaluation of PesticideLeaching in Lysimeter and Fields Studies. Parent Substances. RIVM Report601506 007/2001.
Vonberg, D., Vanderborght, J., Cremer, N., et al., 2013. 20 years of long-term atrazinemonitoring in a shallow aquifer in western Germany. Water Res. 50, 294e306.
Vonberg, D., Hofmann, D., Vanderborght, J., et al., 2014. Atrazine soil core residueanalysis from an agricultural field 21 years after its ban. J. Environ. Qual. 43 (4),1450e1459.
Weber, J.B., 1970. Mechanisms of adsorption of S-Triazines by clay colloids andfactors affecting plant availability. In: Gunther, F.A., Gunther, J.D. (Eds.), SinglePesticide Volume: the Triazine Herbicides. Springer, New York, pp. 93e130.
Weihermüller, L., Huisman, J.A., Graf, A., et al., 2011. Errors in modelling carbonturnover induced by temperature aggregation. Vadose Zone J. 10, 195e205.http://dx.doi.org/10.2136/vzj2009.0157.
Winton, K., 2002. Integrating laboratory and field environmental fate studies: anintroduction. In: Phelps, W., Winton, K., Effland, W.R. (Eds.), Pesticide Envi-ronemental Fate, pp. 1e6. ACS Symposium Series. American Chemical Society.Washington, DC.