Embed Size (px)
Citation preview

Field observations of
pipeline as-laid embedment in soft clay
Zhao Liang, Geotechnical specialistINTECSEA Singapore

Outline
� Pipeline as-laid embedment introduction
� The estimation of the embedment in the current designing (SAFEBUCK III)
� Field observations
� Numerical simulation
� Soil resistance degradation back-analysis
� Conclusions

Pipeline as-laid embedment
Original Seabed
Lay barge
Stinger
As-laid embedment
Pipeline laying shape
TDZ
Scheme of pipeline installation

Pipeline as-laid embedmentWhy is it important?
Pipeline designings
Stability
Lateral buckling
Axial friction
Heat transfer
…
Pipeline as-laid embedment
Underestimated
Overestimated
More than US$50 million savingRefinement of the design parameters for pipe-soil interaction

Resistance of intact soil
Pipeline as-laid embedment
The pipeline as-laid embedment is usually significant larger than that predicted by its submerged self-weight alone.
→ The prediction of pipeline as-laid embedment is much complicated by its laying process.
Stress concentration
TDZ
Self-weight
Dynamic effects
As-laid embedment
Soil softening

The estimation of the embedment in the designing
SAFEBUCK III
Static pipe-soil resistance expression (fine-grained soil)
���������,��� ��
= � ∙ ��� + ����(��)
�2
�′�
�,��� ��
Touchdown factor, n(1~3), (1.3~2.0)--DNV
wstatic
���� =��������
�������,���� �� �
�������
wdynamic
fdyn, 1.0~2.5 1.0~8.0 (reported)
1. Estimate the stress concentration in the TDZ and the pipeline static as-laid embedment (wstatic) accurately using numerical simulation.
2. Back-analyze the dynamic factor (fdyn) from the field observations, provide more supports to select empirical factor in the designing.
Objectives of the study:

Field observations
Laying conditions:
• The pipeline was directly S-laid on the seabed in the shallow waters of Bengal Bay, Asia.
• The water depth in the studied region is from 50m to 100m.
• During the pipeline installation, the laying rate is relatively fast and Regular sea states with small variations in wave heading were reported.
Field investigations:
• The investigation was performed shortly after installation using sonar scanning and ROVs visual recordings.
• The embedment was collected at an interval of 10 meters along the pipeline route, and the pipeline is nearly 45km long in the investigated region.
Soil properties:
Sections 1 2 3 4soil
descriptionsvery soft to
firm clayvery soft to
firm claysoft clay
soft clay
moisture contant
(%)52 65 66 57
Submerged unit weight γ΄
(kN/m 3)6.37 5.42 5.43 6.09
Gradient of soil strength ρ
(kPa/m)0.947 0.725 0.425 0.525

Field observations
Pipeline properties and laying situations:
Properties/Parameters Section 1 Section 2 Section 3 Sec tion 4
Steel pipe diameter Ds (m)
0.813
Concrete coating thickness dc (mm)
70 95
Submerged pipe weight W p (kN/m) 2.823 4.029
Bearing pressure Wp/D (kPa)
3.197 4.437
Bending stiffness EI (MN·m2)
1.761×10³ 2.094×10³
Investigated route length (km)
16 8.5 7 13
Average water depthzw (m)
98.8 81.5 65.88 53.3
Top tensionT0 (kN)
1800
Lay ratev (km/day)
3.5
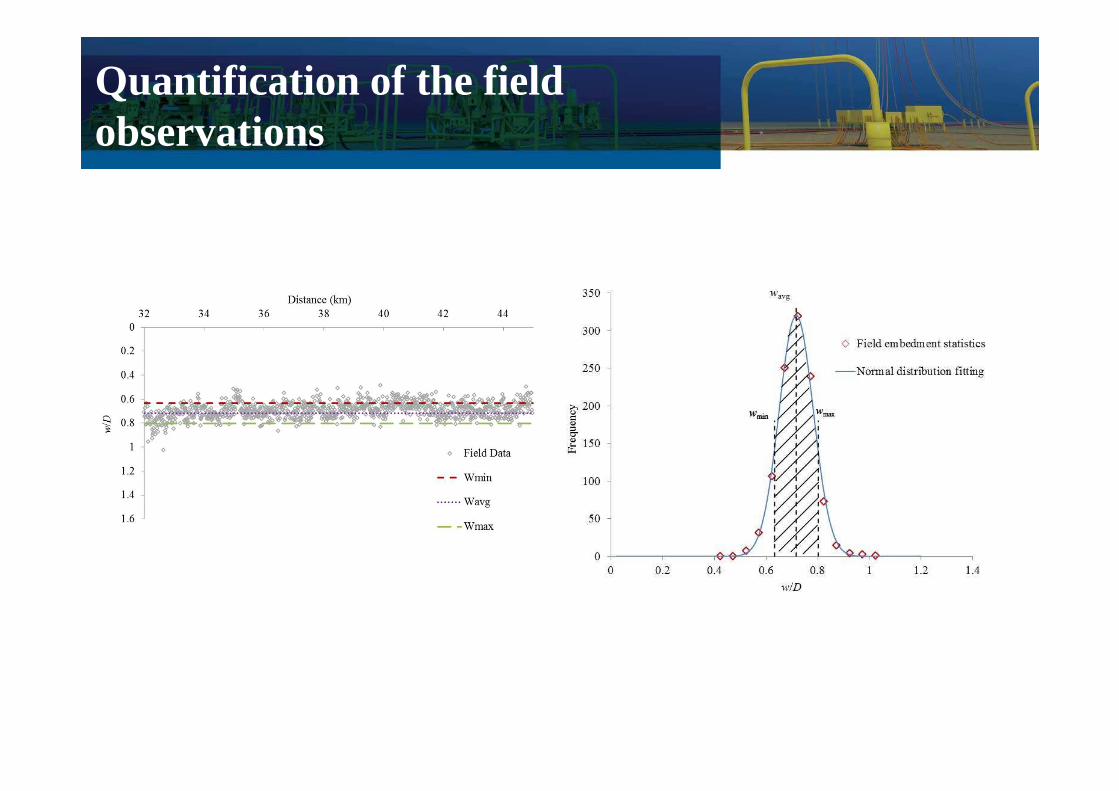
Quantification of the field observations

Quantification of the field observations
sectionsField observations
wmin/D wavg/D wmax/D
1 0.475 0.579 0.683
2 0.605 0.715 0.830
3 0.600 0.695 0.789
4 0.633 0.717 0.802

Numerical simulation
Stress concentration in the TDZdepends on the pipeline laying shape, decided by lay tension, water depth, seabed stiffness and pipeline bending stiffness.
Step2: Lift up freelyTDP
z
x
Step3: Tension
Beam element node
Macroelement footing
Stinger
Step1: Gravity
Seabed
h
Step4: move
Step5: pipe-lay
Inflexion pointStinger
Tension
Abaqus simulation steps:

Numerical simulation
Pipe-soil interactions
Macroelement�������
��,��� ��= � ∙ ��� + ��
��(��)
�2
�′�
�,��� ��
First loading:
Unloading:
Reloading:

Numerical simulation
� Simulation-1
� Simulation-2

Numerical simulation results
TDZ

Summaries of pipeline as-laid embedment results
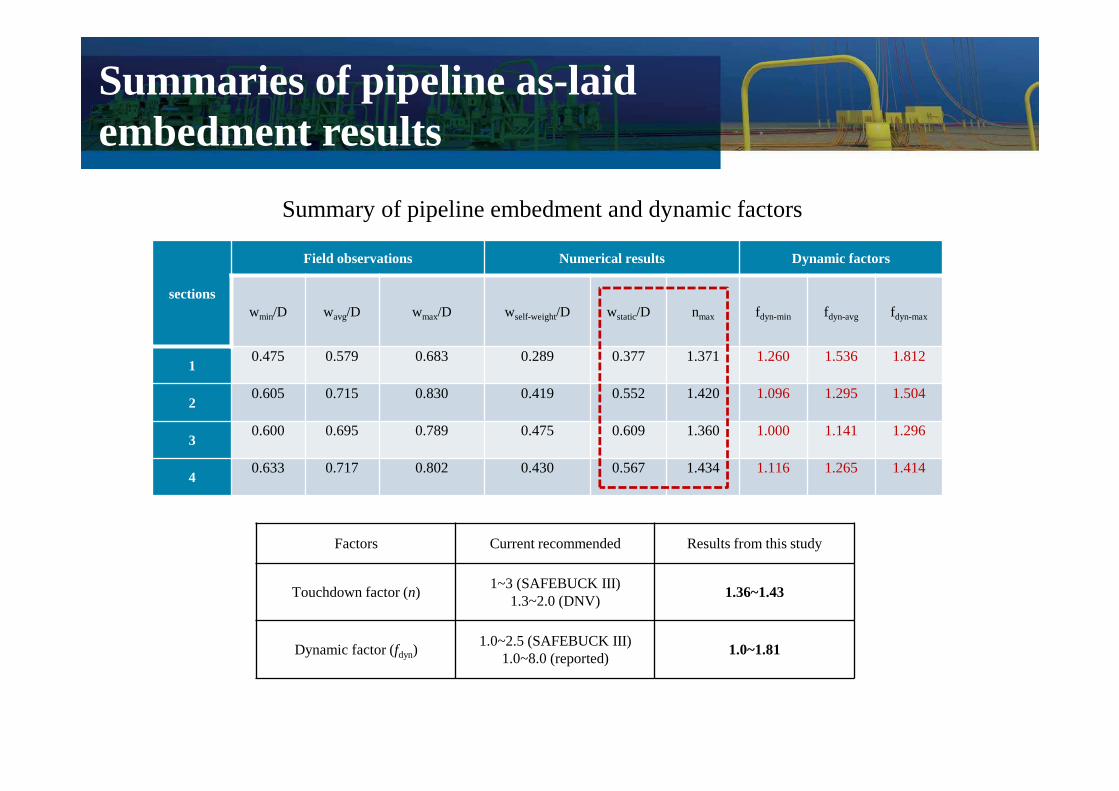
Summaries of pipeline as-laid embedment results
sections
Field observations Numerical results Dynamic factors
wmin/D wavg/D wmax/D wself-weight/D wstatic/D nmax fdyn-min fdyn-avg fdyn-max
10.475 0.579 0.683 0.289 0.377 1.371 1.260 1.536 1.812
20.605 0.715 0.830 0.419 0.552 1.420 1.096 1.295 1.504
30.600 0.695 0.789 0.475 0.609 1.360 1.000 1.141 1.296
40.633 0.717 0.802 0.430 0.567 1.434 1.116 1.265 1.414
Summary of pipeline embedment and dynamic factors
Factors Current recommended Results from this study
Touchdown factor (n)1~3 (SAFEBUCK III)
1.3~2.0 (DNV)1.36~1.43
Dynamic factor (fdyn)1.0~2.5 (SAFEBUCK III)
1.0~8.0 (reported)1.0~1.81

The back-analysis of soil resistance degradation
Intact soil resistanceRemolded soil resistance
• Soil resistance degradation factor, Sremolded
• Sremoldedcan be derived by finding the remolded soil resistance at which the pipeline embedment equals to the field observations.
• The stress concentration (n) in the TDZ decreases as soil become softening.
� ��!� � =�� ��!� �
�������

Soil resistance degradation
sections
Static results Results with remolded soil
wstatic/D nmax wremolded/D nmax Sremolded
1 0.377 1.371 0.579 1.261 0.531
2 0.552 1.420 0.714 1.342 0.694
3 0.609 1.360 0.695 1.321 0.831
4 0.567 1.434 0.715 1.310 0.699

Soil resistance degradation
• Larger pipeline embedment would lead to higher soil lateral resistance, and the dynamic motions of the pipeline in the TDZ would be limited more due to higher resistance. So the soil resistance degradation becomes smaller.
• Conversely, it can be concluded that the lateral dynamic motions is the major causes of soil resistance degradation in the dynamic laying process.
When the pipeline static as-laid embedment (wstatic/D) becomes larger, the soil resistance degradation caused by the pipeline dynamic motions becomes smaller, and vice versa.

Conclusions
� wstatic, the pipeline static as-laid embedment on the intact soil can be well established using numerical simulation.
� The touchdown factor, n, is estimated to be in the range of 1.36~1.43 from this study.
� The dynamic factor, fdyn, is back-analyzed in the range of 1.0~1.81 from this study.
� The degree of soil resistance degradation is found to be smaller when the pipeline static embedment is larger..

Thank you!