Embed Size (px)
Citation preview

FIELD & LABORATORYVolume XXV 1957 Number 1
Correlation by Spectrographic Analysis of Bentonitein the Gulf Series of Dallas Area, Texas
Eugene H er1"in
ABSTRACTSpectl'ographic determination of Si:Al and Ca:Mg ratios in bentonite from the Upper
Cretaceous Eagle Ford shale of the Dallas area, Texas, indicate that variations inthese ratios among different bentonite beds are significantly greater than variationswithin a single bed. The correlation of one bed over a distance of about 9 miles issupported by both spectrographic and stratigraphic evidence.
Correlation of bentonite in the Dallas area with similar beds near Waco, Texas. 120miles to the south, now seems possible. If so, the Eagle Ford shale might be dividedinto time-rock units that would be independent of paleontology.
Bedded bentonite is thought to originate as layers of volcanic ash deposited on the floor of the ocean. It is prob~bly
laid down quickly, with little chance for the introduction ofdetrital impurities (Alexander, 1925, pp. 100-105; Davis,1941, p. 13; Ross, 1945, p. 65). Bentonite beds which arelaterally extensive should serve to define excellent time-rockunits, and should in addition reflect the contours of contemporary sea bottoms. For this reason it becomes importantto correlate bentonite deposits over relatively broad areas.
The bentonite here described is in the Upper CretaceousEagle Ford shale of Dallas County, Texas. Sets of seams aredifficult to correlate between adjacent croppings because allseams are similar in thickness and lithology. Bentonite alsooccurs in the Eagle Ford 120 miles to the south near Waco,Texas (Adkins & Lozo 1951, pp. 119-151). If the bentonitein the Dallas and Waco areas could be correlated it wouldbe possible to subdivide the shale into time-rock units thatwould be independent of paleontologic consideration. It isthe purpose of this paper to investigate the possibility ofemploying spectrographic analysis as an aid in this type ofcorrelation.
A spectrographic study was made to determine vvhethel'the Si :Al and Ca :Mg ratios were unique characteristics ofindividual bentonite seams. First, it was necessary to learnwhether these ratios along a single bentonite seam are fairlyconstant. Second, it was necessary to determine whether theindividual bentonite seams have ratios which are signifi-

(; FIELD AND LABORATORY [Vc>l. %
cantly different from horizon to horizon. Obviously, if thebentonite is to be used for purposes of correlation the variation in Si :AI and Ca :lVlg ratios must be considerably greaterfrom seam to seam than along a single seam. 1
Definition of BentoniteBentonite is " ... a rock composed essentially of a crystal
line claylike mineral formed by the devitrification and theaccompanying chemical alteration of a glassy igneous material, usually a tuff or volcanic ash." (Ross, 1945, p. 65).Bentonites are composed mainly of montmorillonite, biedellite, or the two mixed in varying amounts. The formula forlTIontmorillonite is given by Ross (1945, p. 45) as approximately 5ALO;;2lVlg0.24Si02.6H:20 (Na:;O ;CaO) and for bied·elite as 13Al:20;;.5AI:;O;;.38SiO:;.12H:;O.2Na:20.
The type locality for bentonite is the outcrop area of theFort Benton formation of Upper Cretaceous Age in southern \Vyoming. Analysis of this rock sho\vs it to have aSi :Al ratio of 2.06 and a Ca :Mg ratio of 0.278 (Davis,1940, p. 14).
It has been suggested that bentonites are formed fromlatites and not from highly siliceous volcanic glasses (Ross,1945, p. 65). The widespread occurrence of bentonites inTexas Cretaceous rocks indicates that volcanoes producingmoderately acidic ejectamenta were active in the vicinity ofcentral Texas throughout Cretaceous time. It is importantto note that field studies in central Texas have revealed novolcanic rocks, other than tuffs and bentonites, which couldbe called acidic.
Bentonites in the Dallas AreaNumerous bentonite seams are found in the Eagle Ford
shale around Dallas, Texas. This material is usually mediumbluish grey to bluish white "vhen fresh and weathers greyishyellow to dark yellowish orange. 2 The rock is so fine-grainedthat constituents in the matrix cannot be resolved in thinsections. Ho\vever, euhedral biotite flakes are common andminute fragluents of quartz and feldspar are also present invery small quantities. Thin layers of calcite crystals com1110nly occur above and below the seams.
n"vith hearty thanks to Wilson Bryan and Herbert Robertson, fOl' help in the field;to Dr. Frank C. McDonald and Forrest West. Jr., for advice and a3'sistance in thelabol'atory; and to Drs. Claude C. Albritton, Arthur Richards. and ,Tohn W. Harrington fOl' aid. counse:. and guidance in the -prosecution of this work.
2Co]or-namps from National Research Council Rock Co'or Chart.

/
RE~TO~ITE I~ 1'HE DALLAS AREA, TEXAS
COPPELL
7
~o
GRAND
TRINITY
RIVER
I
==-'-WI L E S
MAP of the area north of Grand Prairie, Dallas County,Texas, showing localities at which samples of bentonite\yere collected. (After Taggart, 1953)

8 FIELD AND LABORATORY (Vol. 25
Samples of ash from the lower Austin chalk, which overlies the Eagle Ford shale, were tested for solubility in diluteHel. Although the four-inch bentonite seam tested is beddedwith limestone that is 70 % soluble in acid, samples frOlTI theseam 'were found to be only 0.05% soluble. These data attestthe purity of the bentonite and suggest that there was littleor no mixing of ash with bottom sediment during deposition.
X-ray diffraction analysis::! of bentonite from the EagleFord shale (Sample S-1) shows the material to be approximately 90 % montmorillonite. Biotite, calcite, and quartzare present in amounts less than 2%.
The Si :Al ratios for the samples examined fall in a rangefron1 6 :00 to 15 :00. These are relative values and do notrepresent true chemical ratios, as the accuracy of the spectrographic working curve was not determined. Only theprecision of the spectrographic method was investigated,since only relative values are needed in correlation.
Here follows a series of field descriptions and locations ofoutcrops of bentonite beds sampled and analyzed by theauthor:
LOCATIONS AND DESCRIPTIONS OF OrTCROPS
OUtC1·0p CDN'
Location: 200 vards west of Beltline Road five miles north of GrandPrairie in small stream bank 50 yards south of bridge.
FOl'mation: Eagle Ford shale.Description: A bentonite bed 8" to 10" thick. Bentonite white weather
ing dark yellowish orange. Some ground water contamination, Le., limonite staining evident. The bed is near thec;;:urface and traceable over a short distance. Textureextremely fine grained.
Samples: C-l, C-2, C-3, C-4, D-l, D-2, D-3, D-4, N-l, 1\-2, andN-3. Multiple samples were taken from the same generalsampling position in order to test the precision ofsampling.
Ontc1'Op ELocation: In bank of a small creek 2 miles southeast of Coppell and
west of Coppell school, a few hundred yards south ofbridge.
Formation: Eagle Ford shale.Description: A bentonite bed 8/1 to 10/1 thick. Pale blue when fresh and
weathering to pale yellowish orange with some moderateyel1O\vish brown staining. Extremely fine grained, soapytexture on fresh sample.
Samples: E-l and E-2. These samples were taken from the samesampling position.
3Analysi!' done by Herbert C. Robertson, Jr.. with Research. Inc" in Dallas. Texas,May 8, 1!l53.
<For the relative locations of this and the following ()UfCfOP"_ see the location map.

1967] B8NTONIT8 IN TH8 DALLAS AREA, TEX.·IS 9
Ou!:crop LLocation: On south bank of the West Fork of the Trinity River 1;;0
yards east of Belt Line Road bridge over the river and 30'west of a U .S.G.S. Water Gauging Station.
Formation: Eagle Ford Shale.Descl'iption: Numerous small bentonite seams are interbedded with the
shale and are exposed in the 40' bluff. Only the thickerseams which an' present in the lower 12' of the bluff weresampled and d(·,~cribed.
Seam (d): 9'9" above ]'iver cut shelf. Dark yellowishorange bentonite 2" thick. Not sampled.
Seam (c): 8'5" above shelf. White to pale yellowishorange bentonite weathering to dark yellowish at the top. 3" thick.
Seam (b): 5'4" above shelf. White with pale yellowishorange staining at top. The shale below iscase hardened. 4" thick.
Seam I a): 3'5" above shelf. Pale blue bentonite with adefinite greasy feel, weathering to dark yel.lowish orange. 3" thick.
Samples: J~l. L-2, and L-3: Seam (a).L-4, L-5, and L-6: Seam (b).L-7, L-8, and L-9: Seam (c).Samples taken at 4' intervals along each seam.
Outcrop MLocation: In south bank of drainage ditch parallel to and 70' south
of State Highway 114. Outcrop is located 120' east ofbridge just south of intersection Esters Road and StateHighway 114.
FOl r:12.:ion: Eagle Ford shale.
FIGURE 1. A close-up of the reverse fault shown inFigure 2.

10 FIELD AND LABORATORY [Vol. 26
Description:
Samples:
FOUl' seams al'e exposed in a 12' bank,Seam (d): 7'4" above stl'eam bed, White bentonite
weathering pale yellowish orang-e, Shale bebelow sandy and case hardened, >1" thick.
Seam (c): 4'10" above stn'um bee\. Dal'!c yellowishorange bentonite with concentl'ic ring'S ofdarker staining, 1 ¥2" thick. Not sampled.
Seam (b): 1'7" above stream bed. Pale yellowish orangebentonite. Calcareous layers were pl'l'sent inshale at top of seam, 2¥2" thick.
Seam (a): 7" above stl'eam bed. Very pale blue to paleblue weathering dark yellowish orange,Samples obtained were badly weathered.Seam was wet when sampled. 2" thick.
M-1, M-2, and M-3: Seam (a).1\1-3, M-5, and M-6: Seam (b)M-7, M-8, a11d M-9: Seam (d)Samples \\'ere takcn ,,~ 2' intervals along each seam.
FIGURE 2. A lO-inch bentonite bed has been cut by asmall reverse fault. The holes in the bed were made duringsampling.
Location:
F01:mation:Description:
Samples:
Location:
OUtC1'Op SOutcrop is %. mile south and l;{ mile west of intersectionof State High, 'ay 114 and Esters Road in the bank ofsmall stream just south of fence line.Eagle Ford shale.A bentonite bed 9" thick. White to greyish yellow whenhesh; weatheri11g dark yellowish orange. The bed istraceable for 100 yards and becomes thinner and predominantly dark yellowish OJ'ange to the north. The bedis cut by a reverse fault causing it to be repeated in onepart of the outcrop.
-1 and S-2: 4' NE of faul t,8-3 and 8-4: 7' NE of fault.8-5 and 8-6: 25' NE of fault.8-7 and 8-8: 40' NE of fault.8-9 and S-10: 70' NE of fault.
(In dark yellowish orange bentonite.)S-l1 and 8-12: at fault.
Outcrop Q200 yards west of the intersection of spur raih'oad andBelt Line Road in the south bank of rail,'oad cut, Spurl'aill'oad is about 4 miles north of Grand Prairie, Texas.

Hl57] BENTONITE IN THE DALLAS AREA, TEXAS 11
Formation: Eagle Ford shale.Description: A 3" seam of bentonite located near the top of the rail
road cut. It is pale yellowish orange when fresh, butweathers dark yellowish orange. There are two very thinbentonite seams about 4' and 8' below the 3" bed. Thesewere not sampled.
Samples: Q-l and Q-2: Taken in 3" bed about 60' apart.
Procedure in Spectrographic Analysis
The following instruments are located in the Karcherspectrographic laboratory in the Physics Department ofSouthern Methodist University.
The spectrograph used was a 2.5 lueter stigmatic instrument manufactured by Jarrell-Ash Inc. of Cambridge,Mass., Serial number J A-76-15a. The radius of curvature ofthe grating ,vas 480 em. giving a disperson of 7.0 A*Imm.
Samples were excited in a Jarrell-Ash arc stand, No. 66.A water cooled electrode jacket had been added and thestand had been adapted for arcing under controlled atmospheres.
The source unit used was a Baird Associated Inc. multisource, No. AK 1-58, which was equipped with an airdamped high frequency spark. The primary current was12.5 amperes and the secondary voltage was 25,000 volts,with 40.0 microhenries inductance and 0.010 microfaradscapacitance in the spark circuit.
For recording the spectra, we used 35 mm. EastmanKodak Spectrum Analysis No.1 film in 21-inch strips. Filmwas developed in a vertical tray automatic developing unitbuilt by National Spectrographic Company of Cleveland,Ohio. This developer maintains a constant temperature of20 C C. and is designed to assure uniform agitation of thefilm. The developer used was Eastman-Kodak D-19 with adevelopment time of five minutes.
A Film Projector Comparator Sensitometer, No. 5400,manufactured by Applied Research Laboratories of Glendale, California, was used to determine line densities. Theinstrument was equipped with a scanning slit having awidth of 13 microns, and with a Karcher-Siedel modifiedscale. This scale is based on a reciprocal density functionand is designed to give reliable film calibration for lowdensity values.
"'As our font lacks the Swedish open-a, "aw," I have indicateJ it, not by duplicatedaa, but by a post-posited asterisk.
12 FIELD AND LARORATORY [Vol. 25
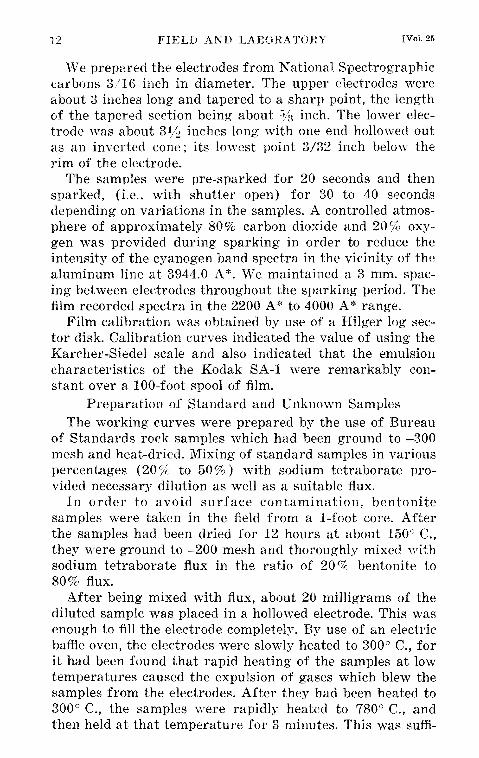
vVe prepared the electrodes from National Spectrographiccarbons 3/16 inch in diameter. The upper electrodes wereabout 3 inches long and tapered to a sharp point, the lengthof the tapered section being about inch. The lower electrode was about 31j;! inches long with one end hollowed outas an inverted cone; its lowest point 3/32 inch below therim of the electrode.
The samples were pre-sparked for 20 seconds and thensparked, (i.e .. with shutter open) for 30 to 40 secondsdepending on variations in the samples. A controlled atmosphere of approximately 80% carbon dioxide and 20 oxygen was provided during sparking in order to reduce theintensity of the cyanogen band spectra in the vicinity of thealuminum line at 3944.0 A*. \Ve maintained a 3 mm. spacing between electrodes throughout the sparking period. Thefilm recorded spectra in the 2200 A* to 4000 A* range.
Film calibration was obtained by use of a Hilger log sector disk. Calibration curves indicated the value of using theKarcher-Siedel scale and also indicated that the emulsioncharacteristics of the Kodak SA-1 were ren1arkably constant over a 100-foot spool of film.
Preparation of Standard and Unknown SamplesThe working curves were prepared by the use of Bureau
of Standards rock samples which had been ground to -300mesh and heat-dried. Mixing of standard samples in variouspercentages (20% to 50%) with sodium tetraborate provided necessary dilution as well as a suitable flux.
In order to avoid surface contamination, bentonitesamples were taken in the field from a 1-foot core. Afterthe samples had been dried for 12 hours at about 150 0 C.,they were ground to -200 Inesh and thoroughly mixed withsodium tetraborate flux in the ratio of 20 bentonite to80% flux.
After being mixed with flux, about 20 milligrams of thediluted sample was placed in a hollo\ved electrode. This wasenough to fill the electrode completely. By use of an electricbaffle oven, the electrodes were slowly heated to 300 0 C., forit had been found that rapid heating of the samples at lowtemperatures caused the expulsion of gases which blew thesamples from the electrodes. After they had been heated to300 0 C., the samples ,vere rapidly heated to 780 0 C., andthen held at that temperature for 3 minutes. This was suffi-
1957J BENTONITE IN TH~: DALLAS AREA, TEXAS 13
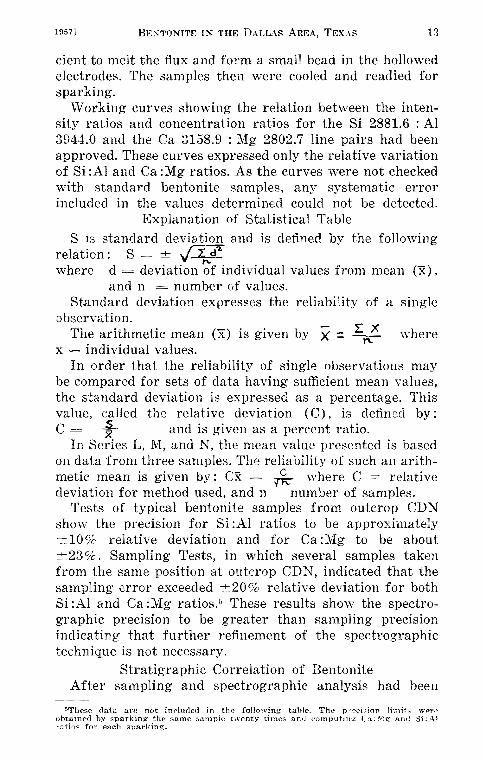
cient to melt the flux and form a small bead in the hollowedelectrodes. The samples then were cooled and readied forsparking.
\Vorking curves showing the relation between the intensity ratios and concentration ratios for the Si 2881.6 : Al3944.0 and the Ca 3158.9 : Mg 2802.7 line pairs had beenapproved. These curves expressed only the relative variationof Si :AI and Ca :l\'Ig ratios. As the curves were not checkedwith standard bentonite samples, any systematic errorincluded in the values determined could not be detected.
Explanation of Statistical TableS is standard deviation and is defined by the following
relation: S ± V'J..,...d'l.where d deviation of individual values from mean (x),
and n number of values.Standard deviation expresses the reliability of a single
observation.The arithmetic mean ('X) is given by X= l-": ··\I/here
x individual values.In order that the reliability of single observations may
be compared for sets of data having sufficient mean values,the standard deviation is expressed as a percentage. Thisvalue, called the relative deviation (C), is defined by:C + and is given as a percent ratio.
In Series L, 1\1, and N, the mean value presented is basedon data from three samples. The reliability of such an arithmetic lnean is given by: Cx /ic- where C = relativedeviation for method used, and n = number of samples.
Tests of typical bentonite samples from outcrop CDNshow the precision for Si :AI ratios to be approximately
10% relative deviation and for Ca :Mg to be about±23%. Sampling Tests, in which several samples takenfrom the same position at outcrop CDN, indicated that thesampling error exceeded +20% relative deviation for bothSi :Al and Ca :Mg ratios.'> These results show the spectrographic precision to be greater than sampling precisionindicating that further refinement of the spectrographictechnique is not necessary.
Stratigraphic Correlation of BentoniteAfter sampling and spectrographic analysis had been
5These data are not included in the following table. Theobtained by sparking the same sample twenty times and COrflpul:1!lj{
ratios for each sparking.
wet'i- l
Si:A!

14 FIELD AND LABORATORY [Vol. 25
STATISTICAL TABLE
Precision Sample Ca:Mg S1:A1Test
T-8 X :a 0.65 X :& 6.9s = 0.. 141 s ::I 0.45n • 11 n ;.: 12c • 22% c :;0 6.5%
Seties SanplesS S-( 1-12) Ca:Mg 51:A1
x • 0.89 i • 14.9s • 0.24 s a 3.00n ". 12 n ... 12c • 27.Qt C :Ill 20.1%
Series San pIes'),T N-(1,2,3) Ca:Mg 51:Al...
x • 0 .. 94 x • 8.13s lI.'I 0.30 s = 1.73n ::I 9 n=- 9c • C ". 21.3%
Series Samples 51:!1T T-·( 1-8) x· 7.17
S ,., 0 .. 904n = 8C lC 12.6%
Serles Samples S1:!lL L-(i,2,3) x III 4.31
1-(4,5,6) x· 7.761-(7,8,9) X :r 4.89
Series Samples Ca:Mg 5i:Al:M M-(1,2,3) x • 0.40 x • 5.12
M-(4,5,6) x • 0.32 x g 6.51M-(7, 8, 9) x • 0.63 x ,. 8.00
Series Samples Ca:Mg 51:A1E E-(1,2,3) x sa 0.68 x· 8.07

BESTONITE IN THE D\LL\S AREA, Tr:x\s 1:)
eompleted, an attempt was made to correlate the bentonitesean1S on field evidence alone. Stratigraphic control is difficult to establish in the Eagle Ford shale, because of a scar-
of outcrops. For this reason, it was necessary to assumea uniform dip of 60 feet per mile to the east for the EagleFord. 6 The various eomposite sections (Chart I) are based
CHARTSECTION
M --------1 b) 2~" Co """0 A J~2 51 A1 i
Co Mox 628 $IAlx1;800
"1:---10· c" Wt 11 ~ ..51 A.i' I c$ i 3-
s
E~"""~---9" Ctl Me) I ...
$1..'\1 i 10 0'1
~--(4) J" Co "'0 $1 AI x
9" Ctt M~ l 89 Al i 149
HORIZONTAL POSITION r~OT TO SCAlf
on plane-table surveys as to ele\'ation and horizontal position. The horizontal relations betvveen the three compositesections \vere taken from correlated aerial photographs ofthe area; however, a rather inaccurate topographic mapwas used to obtain elevations.
The results of the projection of these beds into one strikesection is shown graphically in Chart 1. Obviously, evenallowing for 25 % error in stratigraphic location of the beds,it is improbable that correlation can be correctly made between any beds except Nand E. The correlation of Nand Eis supported by similarity in thickness as well as by stratigraphic location.
CONCLUSIONS
The relative deviations of samples taken from individualbentonite beds are shown to be only slightly greater thansampling deviation (See Statistical Table). It may beassumed that other bentonite beds in the area have similarcharacteristics; that is, the variations of Si :AI and Ca :Mg
CThis dip is based on subsurface information obtained from deep water-wells in the"icinity of Dallas.

16 FIELD AND LABORATORY [Vol. 25
ratios along anyone of them is approximate to the value ofsampling deviation.
Chart I shows that mean values computed for individualbentonite beds differ significantly among themselves. Onlyin the case of bed Nand E are the mean Si :Al ratios similarand it is important to note thickness and stratigraphic position. Beds S, N, and E are all similar in thickness, but bedS differs from the other two in vertical position in thesection. Spectrographic data support the stratigraphic positioning of these bads.
The results of this investigation indicate that spectrographic analysis of bentonite beds provides data which, inaddition to the usual field measurements, aid substantiallyin their correlation. By the methods described in this paperit might be possible to correlate bentonites in the EagleFord shale between Dallas and Waco and thus establishtime-rock divisions within this formation.
REFERENCESADKINS, W. s. & Lozo, F, E. (1951) "Stratigraphy of the Woodbine and Eagle Ford,
Waco Area, Texas," The lVoodbine and Adjacent Strata of the Waco Area ofCentral Texas: A SJJ1npoSl~urn, Fondren Science Series, No.4, Southern MethodistUniversity Press, Dallas. [PP. 105-64, pis. 1-6]
ALEXANDER, J. (1925) "Bentonite," Colloid Symposium Monogr.; Vol. 2, Pp. 99-105.DAVIS, C. W. & VARCHER, H. C. (1940) Bentonite: its Properties, Mining, Preparation,
and Utilization, Bur. of Mines Technical Paper 609.Ross, CI,ARENCE R. & HENDRICKS, STERLING n., (1945) Minerals of the Montnwrillon
itc Grot/,1) , USGS. Prof. Paper 205-B.TAGGART. J. N. (1953) Problems in Correlation of Terraces along the Trinity Rive?' in
Dallas Coum.ty, Texas. Master's Thesis in Geology, Southern Methodist University,Dallas, Texas (Unpubl.).
SELECTED SPECTROGRAPHIC BIBLIOGRAPHYAURENS, L. H. (1950) Spectrochemical Analysis, Addison-Wesley Press, Cambridge,
Massachusetts.BHoD~;, \VALLACE R. (1919) Chemical Spect?'08C(1)!J, John Wiley New York.GERLACH, \V. and SCHWEITZICIl, E. (1929) Ji'oundu,tions and of Chemical
A na!!I:iis by thc Emission Spectrum, A. Hilger, Ltd., London.HARRISON, G. R., LORD, R. C. and LooFBouRow, J. R. (1948) Practical Spectroscopy,
P)'entice-Hall, Inc., New York.HARVEY, CHARLES E. (1950) SlJcctroche'llr.ical Procednrex, Published by Applied
Research Lab., Glendale, California.HARVEY, C. E. (1947) "Cunent Spectl'ographie Methods of Non-Metallic Sample
Analysis." Paper given before Pacific Chern. Soc., Sept. 28, 1947. Available inmimcog'raphed form from Applied Research Lab., Glendale, California.
HASLEH, M.F. (I949) "Calculations for Spectrochemical Analysis of High PercentageConstituents," in mimeographed form from Applied Research Lab., Glendale,California.
HASLER, M. F., HARVEY, C, E., and BARLEY. F. W. "The SpectrochemicalAnalysif< of Cement and other Mineral Products," of the AmcJ'icanSOc1etl/ f01' Tc.~ting Materials, Vol. 48, pp. I-HI.
NOCT:lIEB, NORiYIAN H. (191)0) pJ'indples and Practi"e of Spectrochem.ical .4nalysis,McGt'aw-Hill Co., New York.
\V, G. (19.')0) "Application of Emission Spectl·oscOpy to Agricultural" Transactions of the Kansas Academy of Science, June, 1950.and COOKE. S. R. B. (1947) "Spectrochemical Sample Logging of LimeThe Petroleum Engineer, Aug-ust, 1947.
'WHlTE, H, E. (1934) IntrodlU:tion to .4t'm/)·(' Spectra, McGraw·Hill Book Company.New Yo,'k.

![FIELD LABORATORY - SMU · PDF fileFIELD & LABORATORY Volume XXI January, ... Shuler does not recall him, ... Texas. Science [n.s.] 57, 333-34, 1923. Undergraduate preparation for the](https://img.pdfslide.us/doc/110x75/5aa40f1f7f8b9ac8748b6462/field-laboratory-smu-laboratory-volume-xxi-january-shuler-does-not-recall.jpg)