Embed Size (px)
Citation preview
CIVIL ENGINEERING STUDIES STRUCTURAL RESEARCH SERIES NO. 360
PRIVATE COMMUNICATION NOT FOR PUBLICATION
FIELD INVESTIGATION OF A CONTINUOUS COMPOSITE PRESTRESSED I·BEAM HIGHWAY BRIDGE
LOCATED IN JEFFERSON COUNTY, ILLINOIS
by
W. L. GAMBLE
Issued as a Part of Progress Report No.5 of The Field Investigation of Prestressed Reinforced Concrete Highway Bridges
Project I H R-93 Illinois Cooperative Highway Research Program
Conducted by THE STRUCTURAL RESEARCH LABORATORY
DEPARTMENT OF CIVIL ENGINEERING ENGINEERING EXPERIMENT STATION
UNIVERSITY OF ILLINOIS
in cooperation with
THE STATE OF ILLINOIS DIVISION OF HIGHWAYS
and
THE U.S. DEPARTMENT OF TRANSPORTATION FEDERAL H!GHWAY ADMINISTRATION
BUREAU OF PUBLIC ROADS
UNIVERSITY OF ILLINOIS URBANA, ILLINOIS
JUNE 1970

PRIVATE COMMUNICATION NOT FOR PUBLICATION
FIELD INVESTIGATION OF A CONTINUOUS COMPOSITE
PRESTRESSED I-BEAM HIGHWAY BRIDGE
LOCATED IN JEFFERSON COUNTY, ILLINOIS
By
w. L. Gamble
Issued as a Part of Progress Report No.5 of The Field Investigation of Prestressed
Reinforced Concrete Htghway Bridges Project IHR-93
111 inois Cooperative Highway Research Program
Conducted by
THE STRUCTURAL RESEARCH LABORATORY DEPARTMENT OF CIVIL ENGINEERING
ENGINEERING EXPERIMENT STATION UNIVERSITY OF ILLINOIS
in cooperation with
THE STATE OF ILLINOIS DIVISION OF HIGHWAYS
and
THE U. S. DEPARTMENT OF TRANSPORTATION FEDE RAL HIGHWAY ADM ,- N' STRAT ION
BUREAU OF PUBLIC ROADS
UNIVERSITY OF ILLINOIS URBANA, ILLINOIS
JUNE 1970

SUMMARY
Measurements of camber and strain in a prestressed concrete highway
bridge were made over a period of 3.3 years. The bridge was made u~ing pre
cast, pretensioned I-beams which were made continuous for live-loads by
reinforcement in the cast-in-place deck.
The initial camber of about one in. in 72-ft span girders increased
by about 75 percent within the first few weeks after release, and then
changed only slowly. Only minor movements have occurred since the deck was
cast. The same general trends have been observed in the strain measurements,
with only small changes occurring after about two years. The shortening
of the girders has amounted to slightly over one in., in addition to tempera
ture effects.
Strain measurements on the bridge and on creep and shrinkage specimens
indicate that the concrete undergoes expansion and contraction on an annual
cycle, apparently in response to the increased average relative humidity
during the winter months and the lower humidity during the summer.
Shrinkage of concrete specimens stored in the laboratory was much higher
than that of companion specimens stored at the bridge site. This would lead
one to expect that creep in the field would be considerably less than in the
laboratory, but the values obtained are comparable. The explanation apparently
lies in the fact that the field specimens are almost never in moisture equili
brium with the environment, and any movement of moisture always increases
the creep strains. A re-evaluation of the methods currently used to estimate
camber changes, loss of prestress, and changes in length of members should be
made in the 1 ight of the results of the creep tests and the measurements on
the girders.

TABLE OF CONTENTS
1 . I NTRODUCT ION
1 . 1 In t roductory Rema rks
1.2 Object and Scope
2. DESCRIPTION OF TEST STRUCTURE
2.1 Description of Test Structure
2.2 Construction of Bridge
2.3 Materials Used in Bridge
3. INSTRUMENTATION AND CONTROL SPECIMENS
3.1 Introduction
3.2 Strand Force Measurements
3.3 Strain Measuring Instrumentation for Girder BX-l
3.4 Deflection Measurements
3.5 Temperature Measurements
3.6 Cracking Observation
3.7 Concrete Test Specimens
4. RESULTS OF OBSERVATION ON BRIDGE STRUCTURE
4.1 General Remarks
4.2 Measured Camber
4.3 Measured Strains in Concrete
4.4 Strand Forces
4.5 Cracking
5. CREEP AND SHRINKAGE
5.1 Introduction
5.2 Storage Conditions and Times of Loading
5.3 Creep and Shrinkage Strains
5
5
7
11
15
15
15
16
20
22
22
22
26
26
26
27
34
37
40
40
1,1"1 ""TV
43

6.
7.
8.
TABLE OF CONTENTS (Can't.)
DISCUSSION OF RESULTS OF OBSERVATIONS.
6.1 Introduction.. . ...
6.2 Camber and Deflection
6.3 Loss of Prestress
6.4 Measured Strains in Girder BX-l
6.5 Anchorage Zone Cracking
6.6 Strength of the Bridge
SUMMARY AND CONCLUSIONS.
REFERENCES
TABLES
FI GURES
Page
50
50
50
53
56
60
61
63
66

1. INTRODUCTION
1.1 Introductoty Re~arks
The introduction of prestressed concrete as a construction material in
the past two decades prompted many laboratory investigations into the strength
and behavior, in both short and long term tests, of prestressed members and
structures. However, there have been relatively few long-term investigations
under field conditions where the varying environment is a factor affecting
behavior.
The Department of Civil Engineering and the Engineering Experiment Station
of the University of Illinois, in cooperation with the Illinois Division of
Highways and the Bureau of Public Roads, undertook, in 1965, a field study
of the long-term behavior of prestressed concrete bridges in order to produce
some relevant information.
This report describes the results of measurements made on the first
bridge studied in the project. The initial measurements were made at the time
the girders were manufactured in August, 1966, and the results of the measure
ments for the first three years of the life of the bridge are presented in this
report.
The work reported herein covers parts of Phases 1 (b), (c), and (d),
Field Instrumentation, Field Measurements, and Data Evaluation, of the project's
work schedule.
1.2 Object and Scope
This report describes the investigation into the long-term behavior of a
four-span prestressed reinforced concrete highway bridge. Each span consists
of five I-section precast gi rders, and the structure was made continuous for
live loads by means of non-prestressed reinforcement i.n the composite deck.
-1-

-2-
The results of strand-force, concrete strain, and gi rder deflection
measurements are given for a single girder in the structure, and measured
deflections are given for two additional girders. The strain and deflection
measurement records extend for more than three years at the time of prepara
tion of this report.
Anchorage zone cracking was observed in the girders, and these cracks
are described.
The strain and deflection measurements are discussed and compared with
theoretical values. The implications of the measurements, in terms of loss of
prestress, flexural cracking, and changes in camber with time are discussed.
The test structure is described in Chapter 2, as are the methods of con
struction and the properties of the materials used in the structure. The
instrumentation used in the test structure is described in Chapter 3, as are
the various test specimens used to determine the long term behavior of the
concrete used in the girders and deck. The results of the measurements made
on the bridge are presented in Chapter 4, and the results of shrinkage and
creep measurements on concrete specimens are presented in Chapter 5. The test
results are discussed in Chapter 6, and Chapter 7 is a summary.
1.3 Acknowledgements
This study was carried out as a part of the research under the 11 linois
Cooperative Highway Research Program Project IHR-93, "Field Investigation of
Prestressed Reinfroced Concrete Highway Bridges. 11 The work on the project was
conducted by the Department of Civil Engineering, University of Illinois, in
cooperation with Division of Highways, State of iiiinois, and the Bureau of
Publ ic Roads, U.S. Department of Transportation. At the University, the work
covered by this report was carried out under the general administrative super-
--3-
vision of W. L. Everftt, Dean Emeritus of the College of Engineering, D. C.
Drucker, Dean of the College of Engineering, Ross J. Martin, Director of the
Engineering Experiment Station, N. M. Newmark, Head of the Department of Civi 1
Engineering 1 and Ellis Danner, Director of the Illinois Cooperative Highway
Research Program and Professor of Highway Engineering.
At the Division of Highways of the State of Illinois, the work was under
the administrative direction of Richard H. Golterman, Chief Highway Engineer,
and J. E. Burke, Engineer of Research and Development.
The program of investigation has been guided by a Project Advisory Commit
tee consisting of th.e following members:
Representing the Illinois Division of Highways:
J. E. Burke, Engineer of Research and Development
F. K. Jacobsen, Bureau of Research and Development
C. E. Thunman, Jr., Engineer of Bridge and Traffic Structures,
Bureau of Design.
Representing the Bureau of Public Roads:
Robert J. Dietrich, Assistant Bridge Engineer
Representing the University of Illinois:
Narbey Khachaturian, Professor of Civil Engineering
C. P. Siess, Professor of Civil Engineering.
Acknowledgement is due to Mr. W. J. Mackay and t-1r. R. C. Mulvey, III inois
Division of Highways, who contributed materially to the guidance and progress
of the program. Mr. Benjamin Hawfckhorst, Illinois Division of Highways, was
Resident Engineer, and his help is appreciated.
Thanks are also due to Mr. Jacob Whitlock and Mr. Eugene L. Peck of
Midwest Prestressed Concrete Co., Springfield and Rochelle, Illinois, and to

~4-·
nr. Frank Bunnage of Shaw Contractors and Builders, Mt. Carmel, Illinois, for
aid and cooperation during the construction phases of the bridge.
This investigation is directed by Dr. M. A. Sozen, Professor of Civil
Engineering, as Project Supervisor. Immediate supervision of the investiga
tion is provided by Dr. W. L. Gamble, Associate Professor of Civil Engineering,
as Project Investigator.
The following Research Assistants in Civil Engineering have participated
in the design and installation of the instrumentation, and the collection and
analysis of the data: V. C. Corsetti, D. M. Houdeshell, L. F. Kahn, T. L. t·1artin,
V. Mossiossi.an, R. J. Reynolds, S. Sithichaikasem, and J. B. Wojakowski.
This report has been prepared in cooperation with the U. S. Department
of Transportation, Federal Highway Administration, Bureau of Public Roads.
The opinions, findings and conclusions expressed in this publication are
those of the author and not necessarily those of the State of Illinois,
Division of Highways, or of the Bureau of Pub1 ic Roads.
2. DESCRIPTION OF TEST STRUCTURE
2.1 Description of Test Structure
The test structure is a four-span bridge carrying a local road over an
interstate highway and is shown in Fig. 2.1. Each span contains five precast
I-section girders, and the bridge was made continuous for live loads by means
of the reinforcement in the composite deck. The design live load was HS-15.
The plan of the bridge is as shown in Fig. 2.2. The bridge is skewed 13 0
38 1 45", right-hand side advanced. The interior span girders were 72 ft 3 in.
in length, and the end span girders were 43 ft 8 in. long. All girders were
48 in. deep. Cast-in-p1ace diaphragms were placed as shown in Fig. 2.2. The
diaphragms were connected to the girders by means of threaded rods screwed
into inserts cast into the girders.
The elevation of a typical interior span girder is shown in Fig. 2.3
and an end span girder in Fig. 2.4. Locations of the 7/l6-in. diam. pre
stressing strands are shown in these two figures, and the girder cross
sections showing the strand spacings are shown in Fig. 2.5. There were no
end-blocks.
Non-prestressed longitudinal reinforcement and stirrups were spaced in
the beams as shown in the above referenced figures .
. A cross-section of the bridge is shown in Fig. 2.7. The girders were
spaced at 6 ft. 6 in. centers, and the deck was 7 in. thick. A small fi llet
was provided at the girder-deck interface to facilitate corrections for cam
ber of the girders when setting the deck forms. The form of this fillet is
shown in Fig. 2.6. The deck was reinforced continuously both top and bottom
and in both directions. The reinforcement in the areas near the piers is
shown in Fig. 2.7, and that near mid-span in Fig. 2.8. The curb and side
walk reinforcement is not shown.
-5-

Three different types of bearing devfces were used in the structure.
At the center pier, all beams were supported on rubber-impregnated fabric
bearing pads which were 6 by 18 in. by 1/2 in. thick. The pads were centered
6 in. from the beam ends as shown in Fig. 2.3. The bridge consequently was
not free to move relative to the center pier.
At the other interior piers, the girders were supported on elastomeric
bearing pads. The pads were 9 by i8 in. by 2 7/8 in. thick, and were made of
Grade 70 (Shore A Durometer) neoprene and tontained 5 bonded metallic shims.
The pads were centered 7 in. from the ends of the beams as indicated in Figs.
2.3 and 2.4.
At the abutments? metal bearing devices were used to accommodate the lon
gitudinal motions and the rotations. The sliding elements were self-lubricating
bronze plates set between two steel plates. Rocker plates machined to a
24 in. radius were attached to the girders, and bear on flat steel plates.
The bearings were centered 8 in. from the ends of the girders.
The interior piers were solid reinforced concrete, and were 3 ft thick.
The abutments were also reinforced concrete, and all piers and abutments were
supported on 8 BP 36 steel bearing piles driven into a formation of very
stiff gray shale. The interior pier piles were about 20 ft in length and
the abutment piles were about 40 ft in length.
The test structure is located in Jefferson County, 111 inois, northwest
of the village of Dix. It carries Township Road No. 39, a local east-west
road, over Interstate Highway No. 57. The bridge was constructed as Project.
1-57-3(38)104, Section 41-4HB~3.
The girders of the test structure were manufactured during July and
August of 1966. The piers and abutments were constructed during September,
-7-
October, and November of 1966, and the girders placed on the piers during
October and November. The deck and diaphragms were cast 2 June 1967, and the
structure was finished in July of 1967. The roadway below the bridge was
opened to traffic 9 December 1969, and the last complete set of strain measure
ments were made 6 December 1969, 1212 days after release of the prestressing
for the test girders.
2.2 Construction of Bridge
2.2. 1 Manufactu ri~ng of G i rde rs
The girders were manufactured in the Rochelle, Illinois, plant of Mid
west Prestressed Concrete Co. All girders were cast in steel forms on a
single 200-ft long prestressing bed. The prestressing bed, one of 11 in the
plant, was set up to make three end~span or two interior-span girders during
one cycle. The bed was completely under a roof, but one anchorage was out
side. The following description applies specifically to the manufacturing
of the 72 ft 3 in. long interior-span beams, and the sequence for the end
span beams varied from this in minor details. The times indicated apply to
the construction of the two girders, designated BX-l and BX-2, in which in
strumentation was installed as described in Chapter 3.
At the particular time these. beams were made, there were forms for only
one 72 ft beam at a time, so the prestressing bed was operated on a 48 hour
cycle instead of a 24 hour cycle.
The times at which various operations were started and completed are
1 isted in Table 2.1, for a 48 hour period from 10 August to 12 August 1966.
The starting point for the cycle is taken as the time when the prestressing
bed is empty and ready for final cleaning.

-8-
Starting with a clean, empty prestressing bed with the side foems removed,
the hardware for holding strands down at the drape points and up at a point
between the two beams was instal led, as were the end bulkheads for the beam
forms. The 40 strands were strung through the end anchorages, bulkheads,
lower loops of non-prestressed reinforcement, and hold-downs. The bottom
straight strands were placed first and the draped top strands later.
Tensioning of the 7/16 in. diam. strands started immediately after the
last strand was in place. A hydraul ic ram and pressure gage which had been
cal ibrated against a load cell by Illinois Division of Highways personnel
were used to control the pretensioning force.
The remaining non-prestressed reinforcement for the first beam on the
beG had been tack welded into cages, and the cages were placed on the bed and
worked into the proper positions after all strands had been stressed. The
side forms were then placed.
The first concrete was placed soon after the forms were finished. The
concrete was placed in the form in three lifts. The first lift approximately
fil led the lower flange of the beam, the second filled most of the web, and
the thi rd finished the beam. All lifts of concrete were compacted with in
ternal electrical vibrators. A great deal of vibration was used, as the con
crete was quite stiff.
The concrete was placed in about an hour, and the beam had been struck
off and finished with a wooden float within an additional 20 minutes. The
top of the beam was covered with burlap.
The side forms were removed from the beam 8 hours after the last of the
concrete was placed, and the beam was covered with burlap.
The side forms were then positioned for the second beam, and it was cast.
The second beam was steam cured~ with steam lines under the prestressing bed
being turned on 8 hours after the concrete was cast.

-9-
The prestressing force was released about 19 hours after the second beam
had been cast. The strands were flame cut, starting with the draped strands.
After the draped strands were cut the hold-downs were released and the straight
strands cut. The sequence was to cut 2 or 3 strands at one end of the bed,
then move to the space between the two beams, cut 2 or 3 strands, and then cut
a few strands at the second end, and move back toward the starting point. The
strands were heated over several inches to cause some of the wires to fracture
before the oxygen was turned on in the torch to finish burning the strands.
The beams were then moved from the stressing bed to a storage area inside
the plant. They were later moved to an outdoor storage area, where they re
mained until being shipped to the bridge site.
The interior span girders were shipped to the construction site at the
end of October 1966. The east interior span members were set on the piers,
but it was found that the west interior pier had been built in the wrong
place so the other beams were set on blocks on the ground. The pier had been
mislocated so that the west interior span of the bridge was 12 in. too short.
The pier was removed and rebuilt, and the remaining interior-span girders
and the end-span girders were set in place at the end of November 1966.
The locations of the girders at various times during construction of
the bridge are listed in Table 2.2. The girders were placed on temporary
supports, and the locations of these supports when the beams were in their
various locations are shown in Fig. 2.9.
2.2.2 Construction of Deck
Construction was stopped for the winter of 1966-1967 after the girders
were set on the piers. Construction of the deck and diaphragm forms started
in Apri 1 1967. The formwork was entirely supported from the girders, except

-11-
6. Hand float problem areas,
7. Belt the surface with a canvas belt drawn back and forth
transversely, and
8. Broom the surface transversely to obtain the desired roughness.
The plowing operation was abandoned after about half the deck had been
finished because of the severe drying conditions. Additional water was
sprinkled quite freely on the deck when the problem areas were being worked
down smooth. It appeared that the upper layer of concrete in the deck was
often badly over-worked by the time the finishing operation was completed.
The deck was covered with burlap and plastic sheeting and kept wet for
a week following casting of the concrete.
The curb sections were cast after the deck had cured for a week.
2.3 Materials Used in Bridge
2.3.1 Concrete
The concrete used in the girders had a specified cylinder strength of
f' = 5,000 psi at 28 days, and a required minimum strength of 4,000 psi at c
the time of the release of the pretensioning force.
The mix used in the girders was made with 7 sacks of Type I I I cement
per cubic yard. The proportions were 1:1.52:3.14, cement:sand:gravel, by
weight. The coarse aggregate was crushed limestone with a 1 in. maximum
particle size. Darex air entraining agent was added at the rate of 2 oz.
per sack of cement. The ratio of added water to cement was 0.24, but this was
not representative of the mix since the aggregates were used wet. The
actual water cement ratio is not known, but probably was about 0.4. The con-
crete was mixed i~ a horizontal pan mixer of 1 cu yd capacity.

-12-
The air content of the concrete placed in beam BX-l varied from 4.3 to
5.5 percent, and the specifications called for 4 to 7 percent. The measured
slump varied from·2 to 2-3/4 in.
The compressive strengths at various ages of test cylinders stored in
the field with the bridge girders and in the University of 111 inois Structural
Research Laboratory are listed in Table 2.3. The concrete in beam BX-2 had a
value of f' = 4100 psi at 18 hours after casting, and this was used to control c
the release of the pretensioning. Spl it cylinder strengths and initial values
of Young's modulus are also 1 isted. A representative stress-strain curve is
shown in Fig. 2.12a.
The deck concrete was specified as Class X, and under the specifications
in effect at the time the compressive strength was to be a minimum of f' = c
3,500 psi and the modulus of rupture of at least f = 650 psi, both at 14 days. r
The comp~essive strengths and initial values of Young's modulus at various
ages are shown in Table 2.4 for concrete specimens stored at the bridge site
and in the laboratory. The air content, by volume, was to be in the range of
4 to 7 percent.
The concrete mix used contained 7 sacks of Type I cement per cubic yard,
and the mix proportions were 1:1.80:3.05 for cement:sand:gravel, by weight.
The ratio of added water to cement was 0.33, but wet aggregates were used. The
coarse aggregate was crushed 1 imestone, and the maximum size was between
and 1.5 in. Darex air entraining agent was used at the rate of 1.08 oz. per
sack of cement and Daratard retarding admixture was used at the rate of 7 oz.
per sack of cement. The concrete was mixed in truck-mounted transit mixers.
Air content tests were made by Illinois Division of Highways personnel
on the concrete required for the deck. The air content varied from 4.1 to
7.0 percent, with an average value of 5.4 percent. The measured slump varied

-13-
from 2 1/4 to 4 in., with an average value of 3 1/2 in. A representative
stress-strain curve is shown in Fig. 2.12b.
Samples of the concrete used in both the girders and deck were taken
and specimens for strength, shrinkage, and creep tests were made. These speci-
ments and the results of the creep and shrinkage meas"urements are discussed
later in this report.
2.3.2 Reinforcement
The prestressed reinforcement was 7/l6-in. diam. 7-wire strand meeting
the requirements of ASTM A-4l6. The specified minimum ultimate stress is
248 ksi, and the minimum elongation is 3.5 percent in a 24 in. gage length.
Three strand samples were tested, and the average failure stress was
268 ksi. The average elongation, in a 2 in. gage length, was 6.2 percent.
A t Y pic a 1" s t re s s - s t raj n cur ve iss h own i n Fig. 2. 1 3, and You n g I S ma d u 1 us was
27 x 106 psi.
Special precautions were taken during testing of the strands to insure
that the failures did not occur within the grips. Grips which transferred
part of the force out of the strand by bond were used so that the stress con-
centrations caused by the teeth in the ordinary strand grip would not be
critical. A cross-section of one of the grips is shown in Fig. 2.14. All
failures occurred outside of the grips, and the plaster had the additional
advantage of controlling the movements of the broken parts of the strands.
The non-prestressed reinforcement was specified as ASTM A-l5, inter-
mediate grade, reinforcing bars. A sample of each size of bars used in the
deck and girders was obtained and tested. All reinforcement exceeded the re-
qui red yield stress of 40 ksi. The yield and ultimate stresses for each size
of bar used are 1 isted in Table 2.5. It was discovered, after the bridge

-14-
deck was cast, that the No.4 bar sample from the deck was grade-marked as
A - 4 32 s tee 1, and the y i e 1 d s t res s was 71 k s i. I tis not known wh e the r t his
bar was representative of the No.4 reinforcing bars used in the deck or
whether it was accidently included. Typical stress-strain curves are shown
in Fig. 2.15.

· .':
3. INSTRUMENTATION AND CONTROL SPECIMENS
3.1 Introduction
The instrumentation used in determining the strand forces, deflections,.
strain distributions, temperatures, and cracking are described ~n: this chapter.
The locations of the various components are described, and essential details
given. In addition, the specimens providing auxiliary information on the strength,
creep, and shrinkage properties of the Concrete are described.
*. Many of the detai Is of the instrumentation are desc·ribed in Ref. 1 ..
3.2 Strand Force Measurements
Forces were measured in 12 of the 40 strands at the anchorage end· of the
prestressing bed during the prestressing operation and at intervals until the
strands were released. The locations of the 12 strands are shown in Fig. 3.1.
The force in the top draped strand was also measured at the jacking end of
the prestressing bed.
The force measurements were made with aTuminum sleeve dynamometers which
were instrumented with bonded 'wire electrical resistance strain gages, with
the four gages on each sleeve arranged as a· four~arm bridge. Tne sleeves were
of 6061-T6 aluminum, were 1-5/16 in. 00, 5/8 in. 10, and were 6 in. 10ng. 'The'
sensitivity of the dynamometers was about 44 Ib per dial division deviation
on a portable strain indicator.
Forces were measured in each strand Just after it was tensioned, in all
strands after the lower 30 strands had been tensioned. and immediately after
* References, which are also listed as numbers enclosed in parentheses, are 1 isted in Chapter 8 of this report.
-15-

-·16-::-·
all 40 strands had been tensioned. The readings were repeated when the steam
curing cycle was started for beam BX-2 and just before and after release of
the prestressing strands.
3.3 Strain Measuring Instrumentation for Girder BX-l
3.3.1 Electrical Strain Gages
Six Carlson Elastic Wire Strain Meters were installed in the forms for
beam BX-l before the concrete was cast, and were located as shown in Fig. 3.2.
A seventh gage installed in the deck above the same girder, and its location
is also shown in Fig. 3.2.
The lead wires for the gages embedded in the girder were led along the
inside of the upper reinforcement cage to the west end of the beam, and then
brought out through the top surface of the girder. Two gages, G-2 and G-6,
were damaged while the concrete was being placed. After the deck formwork
was completed, the lead wires were strung along the top of the gi rders to a
point near mid-span of the west end-span of the bridge. The wires were then
led through a hole in the formwork to an instrumentation platform on the
back-slope below the end span. A hole was drilled in the formwork, and a
2 1/2 in. pipe elbow and short nipple were inserted into the hole. The wires
were led through the pipe and then the pipe was stuffed full of rags to seal
the pipe against concrete.
The Carlson Strain Meters, as described in Refs. 1 and 2, are unbonded
wire resistance gages. Each gage contains two arms of a Wheatstone bridge
circuit, and the remaining tow arms are in .., "",... ... +..,hl"" o I-'VI L.<;IUI~ "",0. -.~. I'" I 1""'\#"'1 111'- <;I.:> U I I I I ~ set.
There were some difficulties with the particular version of the gages used, as
is discussed in Sec. 4.3, and the strain readings obtained were apparently
substantially higher than the true strains.
-17-
3.3.2 Mechanical Strain Gages
Ninety-eight mechanical strain gage lines were instal led in beam BX-l
before the prestressing force was released. Near the ends of the beams, a
10-in. gage length Whittemore gage was used to make the readings, and at midspan
and the quarter points of the span, a 50 em gage length Munich gage was used.
Both gages are direct-reading mechanical gages with no mechanical multiplication
of movement. The Munich gage will not be used on future field investigations
because in its 50 em gage-lengths configuration the body of the gage is too
flexible. Satisfactory operation of the gage is possible, but it is more of
an art than a science. In addition, the gage must be used with both hands,
which is difficult when working from a ladder.
The locations and designations of the strain gage 1 ine at mid-span and at
the quarter points of the span are shown in Fig. 3.3. Identical patterns were
used on the two sides of the beam, with only the designations changed to
indicate North or South.
The locations and designations of the gage lines near the west end of
the beam are shown in Fig. 3.4. Gage 1 ine designations enclosed in parentheses
indicate that although the gage points were installed, no readings were obtained
because the points were inadvertantly beyond the 0.10 in. range of travel of
the Whittemore strain gage. Considerable difficulty was encountered in trying
to set up a complete square grid of gage lines, and a number of planned gage
lines were not successful ly installed. Gage lines were also lost when center
drill bits were broken off in holes.
The locations and designations of the four gage lines installed near the
east end of the girder are shown in Fig. 3.5. Only these gage lines were
installed because the remainder of the east end of the girder was covered by
the forms on beam BX-2 until shortly before the prestressing strands were cut.

-18-
Both mechanical strain gages were equipped with spherical tips which fit
into conical holes drilled into the points which were attached to the structure.
The spheres were 2 mm (0.079 in.) in diameter on the ~1unich gage, and about
0.089 in. in diameter on the Whittemore gage.
Several steps were involved in the installation of the gage points in
the hardened concrete of the beam. The sequence was as follows for each gage
point:
1. A 7/16 in. diam. hole was dri 1led·about 1-1/4 in. deep with an
electric hammer-dril I and then cleaned out.
2. Hydrocal plaster to half-fill the hole was inserted.
3. A Phillips IIRed Head l' ,,; flush non-drill anchor, 1/4 in. size, was
inserted and set mechanically with a hammer and setting tool.
4. A 1/4 in. diam. by 1/2 in. stainless-steel hex-head cap-screw was
put into the insert and tightened.
5. The head of the cap-screw was lightly marked with a marking punch
made to fit the desired gage length, and then re-marked with a
center-punch.
6. A conical hole was dri 11ed with a No. 1 Center-dri 11 in a high-speed
electric dri 11.
At this point the gage point installation was complete, except for
cleaning the cuttings and cutting oil from the area. The cleaning was done with
a pressure can of television-tuner lubricant and cleaner which is fitted with
a thi n, flexible plastic tube at the spout to direct the spray into the
drilled hole .
. '. "Regi stered Trade Mark of the Phi 11 ips Dri 11 Company.

-19-
A cross-section of the complete anchor and gage point are shown in Fig. 3.6a.
The conical hole had a 60 degree included angle and a 1/8 in. maximum diameter,
as can be seen in Fig. 3.6.
A simpler system will be used in the future, as the multiple steps were
relatively time-consuming. The next installation will use the same stainless
stell cap-screws, but the screw shanks will be inserted into epoxy-filled
1/4-in. diam. holes dri lled into the concrete, and the gage holes will be
dril led after the epoxy sets, as shown in Fig. 3.6b. The heads of the cap-screws
will protrude by their thickness from the flat face of the concrete, but this
should not be a problem as no serious difficulties with physical damage to
the gage points has been experienced to date.
The epoxy which will be used is IIConcresive" No. 1201, manufactured by
the Adhesive Engineering Co. The material sets in about 20 minutes at room
temperature.
It should be noted that the stainless steel bolts have been quite success
ful, and there have been no corrosion difficulties after more than three years
of field exposure. A few cadmium-plated cap-screws were installed in a concrete
control specimen, and under the same exposure conditions the corrosion has
been quite severe even though the holes were oiled.
All strain gage 1 ines were read immediately before the prestressing
strands were cut and again immediately afterward. The readings have been re
peated at appropriate intervals since that time.
Temperature compensation has been provided by the use of steel standard
bars with the mechanical strain gages. Relatively heavy steel bars, about
2 in. square, have been used so that they would respond to temperature

-20-
changes relatively slowly and in addition would be so stiff that perfectly
uniform bearing conditions would not have to be provided under the bars before
repeatable readings could be obtained.
It must be recognized that completely adequate temperature compensation
is probably not possible in the case of a structure where some parts are in
shade and others in direct sun. The technique that was adopted as standard
was to place the the
shade, and allow it to come to temperature equil ibrium before taking strain
readings. An additional problem is that the coefficients of expansion of the
concrete and the steel standard bar are not quite the same, and the dif-
ference may become significant if a 50 0 F or greater temperature range occurs.
Temperature equilibrium occurs within a structure only occasionally, and
the most 1 ikely time for the structure to be at a uniform temperature through-
out is just before dawn, or under heavy overcast conditions which have pre-
vailed for several hours.
3.4 Deflection ~1easurements
Deflections were measured, by means of a precise surveyor's level and
level rod, in the three beams designated BX-l, BX-2, and AX-3 in Fig. 2.2. In
each beam, deflection plates were cast into both the top and bottom surfaces
of the beam near each end and at mid-span, as shown in Fig. 3.7. The plates
were set away from the ends of the beams in order to clear the faces of the
piers when readings were taken from below the bridge. Elevation readings
were made at each of three points on one surface of a beam, and the camber
computed as the difference between the mid-span elevation and the average of
the two readings at the end of the girder, with a correction made for the ini-

-21-
tial irregularities in the surface profi le. This eliminated the necessity
of providing bench marks.
The deflection plates used were 1 by 1 by 1/4 in. steel plates welded to
a 2-in. length of No.4 reinforcing bar. Plates were installed in the lower
surface of the girders by gluing the plates to the bottom of the prestressing
bed before the concrete was cast. Plates were inserted into the top surface
of the beam after the concrete finishers had completed striking off the con
crete. Plates were also inserted into the deck concrete while it was sti 11
wet, except that a plate was missed in one location. This plate was installed
later by drilling into the deck with a masonry bit, chiseling a flat, de
pressed area for the plate, and grouting the plate into final position with
a quick-hardening epoxy compound. This method will be used on all of the
deck plates in the next installation as it allows much greater precision in
placement of the plates.
Level readings were taken on the upper surface of the girders immediately
before and after release of the prestressing force, and at appropriate time
intervals later. After the gi rders were erected in the piers, readings were
taken fron both above and below the girders, and then readings were taken
from below the bridge during the period when the deck was being cast and
cured. D~ring this time, only one end of beam AX-3 could be read, as the back
slope preve~ted one from getting a level rod near the abutment.
Readings since that time have been taken from the bridge roadway sur-
face.
A Wi ld N-3 precise level and an especially prepared level rod, as
described in Ref. 1, were used to make the readings. The minimum reading with
this instrument is 0.0005 ft, with readings repeatable to 0.001 ft.

-22-
3.5 Temperature Measurements
Temperatures were measured at three points in the interior of beam BX-l
and at one point in AX-3. Cooper-Constantan thermocouples encased in copper
tubing were used, and were located as shown in Fig. 3.7.
The initially installed thermocouples extended only to the top surface
of the girders and additional lengths of copper or constantan wi re were
spl iced on after the deck forms were in place. The wires were led through
1/4-in. ID polyethylene tubing along the top surface of the beams and then
down through the deck form to the area under the west end span where the con
crete specimens were stored.
The thermocouples were used in order to obtain information about the
differences between the temperature of the structure and that of the surrounding
air, and to check the temperature readings th~ were obtained from the
Carlson Strain Meters.
3.6 Cracking Observation
The end zones of the girders were examined for cracking immediately after
release of the prestressing and again about a month later. Hand magnifying
lenses were used to aid in tracing the ends of the cracks, and the widths of
selected cracks were measured by the use of a comparison scale which had lines
of various widths ruled on it.
The cracks in the end zones of beam BX-l were marked with a felt-tip pen
and photographed to obtain a complete record.
3.7 Concrete Test Specimens
Concrete test specimens were made of concrete used in girder BX-l
and from concrete used in the deck. These samples were used for strength and
Youngls Modulus determinations, for shrinkage measurements, and for creep tests.

-23-
About sixty 6 by 12 in. cylinders were made of beam concrete with the
concrete being taken from buckets which were being taken to the casting bed.
The cyl inders were cast in disposable sheet-metal molds. In addition, six
2-ft long sections of girder were cast and used as shrinkage specimens.
The short beam specimens contain all 40 prestressing strands. The
strands were heavily greased before the concrete was cast, and in many cases
it was obvious that the bond was effectively broken, as the strands went
slack on one side of the specimen when cut on the other side of the specimen.
Unfortunately, however, some of the strands apparently were at least partially
bonded, and the measured strains have proved to be hard to interpret, as will
be discussed later.
Thirty cylinders of girder concrete were tested in compression at the various
intervals shown in Table 2.3. The remaining cylinders were used as shrinkage
or creep specimens, and half were stored with the bridge girders and half in
the laboratory.
In each cyl inder in which strains were to be measured, three 10-in.
gage 1 ines w~re established for'the Whittemore gage, with 'the lines spaced around
the cyl inders at 120 degree intervals. The six gage points in each cylinder
were installed as described in Sec. 3.3.2, using the mechanical anchors. Nine
cylinders were instrumented for shrinkage measurements and six for creep tests
for both the field and the laboratory storage conditions. The ends of the
shrinkage specimens were sealed by the application of a layer of epoxy resin
and aluminum foil.
The creep specimens were loaded to a unit stress of 1,000 psi, and the
load was maintained by means of a heavy coil spring. Each creep rack held
three cylinders, and was arranged as shown in Fig. 3.8. The load was applied
by means of a 30-ton hydraulic jack, and then was held by tightening the nuts

-24-
just above the plate over the spring by 1/6-th turn from finger finger tight.
The load was re-adjusted at every reading interval during the first year of
the test, and at approximately alternate reading intervals after that.
Two creep racks were loaded about 10 days after beam BX-l was cast, and
two were loaded at the time the deck was cast, approximately 300 days after
casting of girder BX-l.
The six 2-ft long beam sections were instrumented with strain gage lines,
as shown in Fig. 3.9, for the 50 em gage length Munich gage. The ends of the
specimens were sealed with epoxy and aluminum foil, so that the drying con
ditions would be similar to those in a long beam.
Approximately fifty 6 by 12 in. cylinders of deck concrete were made.
In addition, six concrete prisms, each 7 by 14 by 28 in., were cast for use
as shrinkage specimens.
The 12 cyl inders used for strain measurements (six for shrinkage and six
for creep measurements) were prepared for gage points by casting inserts into
the disposable sheet metal molds. A hole was drilled in the mold at the de
sired point, and an insert made of a l-in. length of No.4 reinforcing bar
which had been dril led and tapped for a 1/4-in. bolt was bolted to the side
of the mold by a cap-screw going through the mold. After the concrete had
set, the cap-screws were removed, the mold stripped off, and stainless steel
cap-screws which had a stud-locking solution appl ied to the threads were
screwed into the inserts and tightened. The tapered gage holes were then
drilled.
The prismatic shrinkage specimens were cast in wooden forms, and strain
gage 1 ines were installed as shown in Fig. 3.10. Inserts as described above
were cast into the lower surfaces of the blocks, and points in the top surface
were installed after the concrete had hardened. The top strain gage points

-25-
were installed by drill ing 1/4-in. holes with a masonry bit and then grouting
1/4-in. stainless steel cap-screws into the holes with the quick-setting
epoxy. After the epoxy had hardened, the tapered holes were drilled in the
heads of the cap-screws.
Cylinders of deck concrete were tested at the intervals indicated in
Table 2.4. Shrinkage measurements were made on three cylinders stored at the
bridge site and three stored in the laboratory, and two creep racks were loaded
approximately 28 days after the deck was cast, with a set of specimens under
each storage condition. Half of the prismatic specimens were left at the
bridge site and half were taken to the laboratory.

4. RESULTS OF OBSERVATION ON BRIDGE STRUCTURE
4.1 General Remarks
The results of the first three and one-quarter years of observations on
the bridge structure are presented in this chapter and will be discussed in
Chapter 6. The measured deflections are presented in Sec. 4.2, and the
measured strains are presented in Sec. 4.3 along with a discussion about the
probable correctness of various of the observations. The strand force measure
ments, both as measured directly while beams BX-l and BX-2 were being fabricated
and the changes as derived from the strain measurements on Beam BX-l, are pre
sented in Sec. 4.4.
The observed end zone cracks are described in Sec. 4.5, along with support
ing data which indicate that nearly every girder eventually cracks in the
anchorage zone.
4.2 Measured Camber
The measured camber-time curves for the three beams, BX-l, BX-2, and
AX-3, are shown in Fig. 4.1, and the early portions of the curves for the same
three girders are shown to an enlarged time scale in Fig. 4.2.
All three curves show an initial camber, of about one in. for the longer
beams, which occurred when the prestressing strands were cut. This initial
camber was then followed by a rapid growth of camber with time. After slightly
over a month, the camber in the beams changed at a much slower rate than
previously.
The girders were moved from inside to outside the prestressing plant
at various ages, with the approximate dates of the movements being indicated
in Table 2.2. With each move, the positions of the wooden blocks supporting
the beams were changed, and the various positions are shown schematically in
-26-

-27-
Fig. 2.9. The two interior span girders, BX-l and BX-2, were moved to the
bridge site from the plant when they were about 75 days old. The combination
of the transportation and the changes in span length resulted in substantial ly
reduced camber when readings were taken after the move. Beam AX-3 was moved
to the bridge site and placed on the piers when it was about 130 days old.
The camber in beams BX-l and BX-2 remained approximately constant from
the time the girders were placed on the piers unti 1 the deck construction was
started. The readings at about 280 days were after the form work was completed,
but before the reinforcement was placed. The weight of the reinforcement
caused a deflection of 0.10 in., and the casting of the concrete deck caused
an additional deflection of 0.31 in. in both beams, for a total deflection of
0.41 in. from the weight of the deck. There have been only small variations
in the camber since the deck was cast, but there is a trend of small increases
in camber after the first two years.
The camber of beam AX-3 was much smaller than for the longer span beams.
The movements were small, and the trends clearly were not the same as in the
longer beams. After about 60 days the camber started to decrease, and after
two years was about 0.05 in. The beam was so stiff that the deflection caused
by the addition of the deck was not measureable with the instrumentation used.
4.3 Measured Strains in Concrete
4.3.1 Mid-Span Strains
The longitudinal strains measured at mid-span in BX-l are plotted versus
time in Fig. 4.3. The strains near the top of the girder, near the bottom, and
at the centroid of the section, as determined with the 50-em gage length
Munich gage, are shown.
There were very large increases in the concrete compressive strain in
the fir~t three weeks after relea~e, wi.th the strain near the bottom of the

beam more than daub 1 i ng. Afte r the f i rs·t three weeks, the s t ra ins changed at
much lower rates.
The girder was inside the prestressing plant for about three weeks. After
the beam was moved outdoors the storage conditions were much different, since
the girder was frequently wet by rains. The decrease in strain in the upper
portions of the girder is largely a reversal of shrinkage caused by re-wetting
of the concrete. Shrinkage strains in unstressed six by twelve in. cylinders,
as described in Chapter 5, show the same reversals: of strain after the specimens
were moved outdoors.
All of the strains decreased during the time interval from 40 to about
110 days after release, and the general trend has been a slow increase in
compressive strain since that time. The strains at the three levels in the
girder ~ave changed by nearly equal amounts, indicating that the beam is
shortening with time but that the curvature.s are not changing appreciably.
After about 800 days, there were no si~nificant strain changes at mid-span
or at the quarter points (Fig. 4.10)~
All three strain traces show small decreases in compressive strain during
the win te r man ths for the firs t two yea rs . These reve·rsa 1 s may be due to
increased average relative humidity during the winter, and it was fotind that
the sar:le reversals occurred in both the creep and shrinkage specimens stored
in the field, as will be discussed in Chapter 5.
The strain distributions over the depth of the girder are plotted in
Fig. 4.4 for a few selected time intervals. The strain distributions are
approximately 1 inear. Since the section is at mid-span of a long girder, this
must support the general consistency of the strain readings rather than being
viewed as a confirmation of the linear strain distribution. Metz Reference Hacm Civil Engineering DGDa~tment Bl06 C E E':1': -: ,.:!:. ',"",' .L: ~- ••
• III...J I.J:"'~ •• _"_ ..... _1- .'.-"5
Uni vers i ty C.t' ::~~~" i. ::,!,:.o j., s U r b ana 9 II J..J.l:, ' .. J :i. ::. . ~~ J. c: :)l

The inclination of the strain di'stribution from the vertical axis is the
curvature, and it can be seen that although the distributions indicate continued
increases in strafn, the changes in curvature have been small when compared with
the curvature occurring within the first three weeks of the life of the girder.
The measured mid-·span curvature is plotted against time in Fig. 4.5. The
curvature was determined from the strains measured near the top and bottom of
the cross-section. The strains measured at the centroid of the precast section
were not considered except in determining the changes in curvature accompanying
casting of the deck slab. The expression used in computing curvatures was
¢ =
E ..... b
h
where ¢ curvature, radians per inch,
strain at bottom gage line,
strain at top gage line, and
h - 42 in., the distance between the upper and lov-fer gage lines.
The longitudinal strains were also measured by means of Carlson meters
placed near the upper and lower surfaces of the girder. The measured strains
are plotted against time in Fig. 4.6. A simple comparison with the mechanically-
measured strains plotted in Fig. 4.3 shows that the strains measured with the
Carlson meters were appreciably higher than those indicated by the Munich gage
read i ngs.
The plots of strain versus time obtained from both the mechanical and
Carlson strain gages appear to be relatively smooth curves and all of the data
points from either type gage are consistent with each other. There is no
reasonable basis for determining whether either is correct simply from the
strain data.
-30-
In order to help determine which of the two gages was giving the correct
strain readings, the strains were reduced to curvatures, and the curvatures
were plotted against mid-span camber in Fig. 4.7. It can be seen that all of
the points from the Carlson meter fall relatively close to a straight line, and
all of the points from the Munich gage fall close to a second straight line.
The theoretical relationship between mid-span curvature and deflection is also
plotted in the figure, and it can be seen that the curvature values from the
Munich gage are very close to the theoretically correct values. The line shown
is the relationship for the condition of the beam being supported on a 65 ft
span, as was the case fo r mos t of the ea rl y life of the beam.
From this it was concluded that the mechanical strain gage readings were
correct, and that the readings from the Carlson meters were in all cases too
high.
In order to obtain a better estimate of the magnitude of the difference, a
Carlson meter was cast into a large beam which was being tested in the labora
tory in another investigation. The beam was thoroughly instrumented for strain
measure~ents, and the strains measured with a lO-in. gage length Whittemore
strain gage are plotted against the strains indicated by the Carlson meter in
Fig. 4.8.
Again, the strains indicated by the Carlson meter were appreciably greater
than those indicated by the mechanical gage.
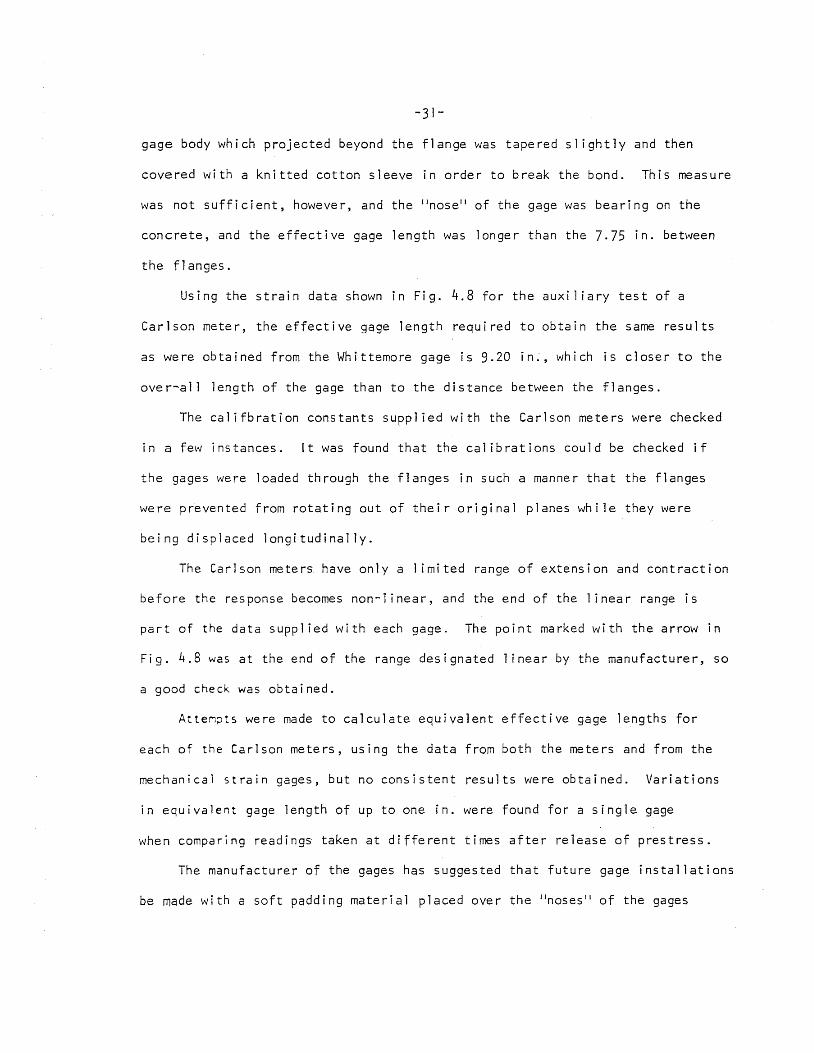
The difficulties with the Carlson meters apparently stemmed from the fact
that a modified version of the meter was obtained in order to increase the
available strain range. To illustrate, the profile of a standard gage, which
has a 10 in. gage length, and of the modified gage, with a 7.75 in. gage length,
are shown in Fig. 4.9. The gage length was shortened by moving the flange at
one end of the gage 2.25 in. from its original position. The remainder of the

-31-
gage body which projected beyond the flange was tapered slightly and then
covered with a knitted cotton sleeve in order to break the bond. This measure
was not sufficient, ho\tJever, and the "nos e" of the gage was bearing on the
concrete, and the effective gage length was longer than the 7.75 in. between
the flanges.
Using the strain data shown in Fig. 4.8 for the auxil iary test of a
Carlson meter, the effective gage length required to obtain the same results
as were obtained from the Whittemore gage is 9.20 in., which is closer to the
over-all length of the gage than to the distance between the flanges.
The califbration constants supplied with the Carlson meters were checked
in a few instances. It was found that the calibrations could be checked if
the gages were loaded through the flanges in such a manner that the flanges
were prevented from rotating out of their original planes while they were
being displaced longitudinally.
The Carlson meters have only a I imited range of extension and contraction
before the response becomes non-linear, and the end of the I inear range is
part of the data supplied with each gage. The point marked with the arrOVJ in
Fig. 4.8 was at the end of the range designated linear by the manufacturer, so
a good check was obtained.
Attempts were made to calculate equivalent effective gage lengths for
each of the Carlson meters, using the data from both the meters and from the
mechanical strain gages, but no consistent results were obtained. Variations
in equivalent gage length of up to one in. were found for a single gage
when comparing readings taken at different times after release of prestress.
The manufacturer of the gages has suggested that future gage installations
be made with a soft padding material placed over the Ilnoses l1 of the gages

-32-
so that there can be no bearing on the concrete beyond the flange. The
suggested material was sheet urethane foam, a material simi lar to sponge rubber.
All quantative discussions in this report are based on the strains ob
tained by use of the mechanical strain gages.
4.3.2 Quarter-Point Strains
The time-strain curves for strain gage lines located at the quarter
points of girder BX-1 are given in Fig. 4~10, and the strain distributions over
the depth of the girder for selected time intervals are plotted in Fig~ 4.11.
The strains were measured with the 50-em gage-length Munich gage.
The strains were approximately the same as at the mid-span section, and
exhibited generally the same trends. The final curvatures at the quarter
points were sl ightly smaller than those at mid-span, as can be seen by com
paring Figs. 4.11 and 4.4.
4.3.3 Strains Near End of Beam
Strains were measured on a relatively large number of gage lines located
near the west end of beam BX~l, and the data from the readings are summarized
in Fig. 4.12 to 4.18. The IO-in. Whittemore gage was used on all gage lines
near the ends of the beam~
Time-strain curves are given only for the two Carlson meters, Fig. 4.12,
to illustrate that the general form of the curves was simi lar to those at
other sections of the span. These curves suffer the same defect as those
from the other Carlson meters in that they indicate strains substantially
higher than found with the mechanical strain gages.
Strain distributions over the depth of the girder at four sections lo
cated near the end of the girder are shown in Figs. 4.13 to 4.16. The indi
cated distances from the end of the beam are the distances to the centers of
the lO-in. $age length considered.

ihere appears to be a definite distortion of the cross-section/ especially
very near the end of the beam. This should be expected, however, since the
prestressing forces are anchored only near the top and bottom of the section and
are not uniformly distributed over the section depth. The strains at the
section located 37.5 in. from the end of the beam are much nearer to a linear
distribution than are those 7.5 or 17.5 in. from the end of the section, as would
be expected.
The very low strains indicated at gage line \461, Fig. 4.13, were undoubtedly
greatly influenced by cracking which occurred in the anchorage zone. A crack
crossed the end of the beam at the junction of the web and lower flange·, less
than an inch below the gage points nearest the end of the beam. The cracking
can be seen in Figs. 4.20 and 4.21.
There were very large increases in strain at the lowest gage line, with
the strains at line W82, for example, increasing from about 0.000,66 at release
to about 0.00180 at 834 days. These strains were the largest measured in the
test structure.
The changes in strain along the length of the member near the ends are
of interest since this gives an indication of the distance required to de
velop the prestressing force, by bond, after the strands have been cut. The
strains occurring at release at three different levels in the beam are plotted
versus distance from the end of the beam in Fig. 4.17. The transfer length
was evidently 20 in. or slightly less. The strand was slightly rusty when
used, which accounts for the slightly lower transfer length than reported by
other investigators (3,4).
The strain distributions along 1 ine W8x at various times are plotted
versus distance from the end of the beam in Fig. 4.18. While there were
-30-
In order to help determine which of the two gages was giving the correct
strain readings, the strains were reduced to curvatures, and the curvatures
were plotted against mid-span camber in Fig. 4.7. It can be seen that all of
the points from the Carlson meter fall relatively close to a straight line, and
all of the points from the Munich gage fall close to a second straight line.
The theoretical relationship between mid-span curvature and deflection is also
plotted in the figure, and it can be seen that the curvature values from the
Munich gage are very close to the theoretically correct values. The line shown
is the relationship for the condition of the beam being supported on a 65 ft
span, as was the case for most of the early life of the beam.
From this it was concluded that the mechanical strain gage readings were
correct, and that the readings from the Carlson meters were in all cases too
. high.
In order to obtain a better estimate of the magnitude of the difference, a
Carlson meter was cast into a large beam which was being tested in the labora
tory in another investigation. The beam was thoroughly instrumented for strain
measurements, and the strains measured with a lO-in. gage length Whittemore
strain gage are plotted against the strains indicated by the Carlson meter in
Fi g. 4.8.
Again~ the strains indicated by the Carlson meter were appreciably greater
than those indicated by the mechanical gage.
The difficulties with the Carlson meters apparently stemmed from the fact
that a modified version of the meter was obtained in order to increase the
available strain range. To illustrate, the profile of a standard gage, which
has a 10 in. gage length~ and of the modified gage, with a 7.75 in. gage length,
are shown in Fig. 4.9. The gage length was shortened by moving the flange at
one end of the gage 2.25 in. from its original position. The remainder of the
-31-
gage body which projected beyond the flange was tapered slightly and then
covered with a knitted cotton sleeve in order to break the bond. This measure
was not sufficient, ho\tJever, and the "nose" of the gage was bearing on the
concrete, and the effective gage length was longer than the 7.75 in. between
the fl anges.
Using the strain data shown in Fig. 4.8 for the auxi liary test of a
Carlson meter, the effective gage length required to obtain the same results
as were obtained from the Whittemore gage is 9.20 in~, which is closer to the
over-all length of the gage than to the distance between the flanges.
The califbration constants supplied with the Carlson meters were checked
in a few instances. It was found that the calibrations could be checked if
the gages were loaded through the flanges in such a manner that the flanges
were prevented from rotating out of their original planes while they were
being displaced longitudinally.
The Carlson meters have only a 1 imited range of extension and contraction
before the response becomes non-linear, and the end of the linear range is
part of the data supplied with each gage. The point marked with the arrow in
Fig. 4.8 was at the end of the range designated linear by the manufacturer, so
a good check was obtained.
Atte~~ts were made to calculate equivalent effective gage lengths for
each of the Carlson meters, using the data from both the meters and from the
mechanical strain gages, but no consistent results were obtained. Variations
in equivalent gage length of up to one in. were found for a single gage
when comparing readings taken at different times after release of prestress.
The manufacturer of the gages has suggested that future gage installations
be made with a soft padding material placed over the "noses" of the gages
-32-
so that there can be no bearing on the concrete beyond the flange. The
suggested material was sheet urethane foam, a material similar to sponge rubber.
All quantative discussions in this report are based on the strains ob
tained by use of the mechanical strain gages.
4.3.2 Quarter-Point Strains
The time-strain curves for strain gage lines located at the quarter
points of girder BX-l are given in Fig. 4~lO, and the strain distributions over
the depth of the gi rder for selected time intervals are plotted in Fig. 4.11.
The strains were measured with the 50-em gage-length Munich gage.
The strains were approximately the same as at the mid-span section, and
exhibited generally the same trends. The final curvatures at the quarter
points were sl ightly smaller than those at mid-span, as can be seen by com
paring Figs. 4.11 and 4.4.
4.3.3 Strains Near End of Beam
Strains were measured on a relatively large number of gage lines located
near the west end of beam BX-l, and the data from the readings are summarized
in Fig. 4.12 to 4.18. The lO-in. Whittemore gage was used on all gage lines
near the ends of the beam.
Time-strain curves are given only for the two Carlson meters, Fig. 4.12,
to illustrate that the general form of the curves was similar to those at
other sections of the span. These curves suffer the same defect as those
from the other Carlson meters in that they indicate strains substantially
higher than found with the mechanical strain gages.
Strain d~stributions over the depth of the gtrder at four sections lo
cated near the end of the girder are shown in Figs. 4.13 to 4.16. The indi
cated distances from the end of the beam are the distances to the centers of
the lO-in. gage length considered.

-33-
There appears to be a definite distortion of the cross-section, especially
very near the end of the beam. This should be expected, "however, since the
prestressing forces are anchored only near the top and bottom of the section and
are not uniformly distributed over the section depth. The strains at the
section located 37.5 in. from the end of the beam are much nearer to a linear
distribution than are those 7.5 or 17.5 in. from the end of the section, as would
be expected.
The very low strains indicated at gage line w6l, Fig. 4.13, were undoubtedly
greatly influenced by cracking which occurred in the anchorage zone. A crack
crossed the end of the beam at the junction of the web and lower flange, less
than an inch below the gage points nearest the end of the beam. The cracking
can be seen in Figs. 4.20 and 4.21.
There were very large increases in strain at the lowest gage line, with
the strains at 1 ine W82, for example, increasing from about 0.000,66 at release
to about 0.00180 at 834 days. These strains were the largest measured in the
test structure.
The changes in strain along the length of the member near the ends are
of interest since this gives an indication of the distance required to de
velop the prestressing force, by bond, after the strands have been cut. The
strains occurring at release at three different levels in the beam are plotted
versus distance from the end of the beam in Fig. 4.17. The transfer length
was evidently 20 in. or slightly less. The strand was slightly rusty when
used, which accounts for the slightly lower transfer length than reported by
other investigators (3,4).
The strain distributions along line W8X at various times are plotted
versus distance from the end of the beam in Fig. 4.18. While there were

-34-
marked increases in strain, there was no change in shape of the distributions.
This leads to the conclusfon that the transfer length could not have changed
appreciably with time and that the bond strength did not decay significantly
with time.
Not enough vertical strain measurements were obtained to define any
deformation patterns near the end of ,the beam. However, two things were
apparent from the measurements. First, the deformations at release were very
small except where cracking occurred. Gage line WS51 increased in length by
0.0064 in., giving a nominal strain of 0.000,64 tension. An anchorage zone
crack occurred at release and crossed the gage line about four in. above the
lower gage point. This crack measured about 0.006 in. in width, so the
"s train" was just the measurement of the opening of the crack.
The initial strains at all other gage lines where readings were obtained
were small l with maximum values of +0.000,06 and -0.000,05. Except for gage
1 i ne WS51, the time-dependent s t ra ins we re a 11 compress i ve, wi th the va 1 ues
at 834 days being in the range of 0.000,30 to 0.000,45. Gage line WS51 indi
cated an approximately constant value of elongation.
4.4 Strand Forces
Forces in 12 of the 40 strands were measured during the construction of
girders BX-1 and BX-1, as was described earlier. The results of these measure
ments are tabulated in Table 4.11 and may be summarized as follows.
The design prestressing force was 18.9 kips per strand, so the total
force was to be 756 kips. The forces achieved in the 12 strands immediately
after the strands had been anchored are listed, and the average force in the
straight strands was 18.7 kips while the average force in the draped strands
was appreciably lower at 17.4 kips. Slip i.n the strand grips was responsible
"'7-35"'"
for part of th.e lower-:·than-:--deslred force~ b.ut th.is loss. should not have been
large sfnce a 1(4 in. slip in a 210 ft strand causes a change in force of
about 0.3 kips. A few measurements of anchorage loss were obtained and the
average for six straight strands was about 0~20 kips, with scatter up to
0.07 kips, plus or minus. Adding this loss to the post-anchorage force brings
the straight strands to the desfgn level but leaves the draped strands quite
low.
The draped strands were tens.ioned in the draped position and apparently
considerable force was lost in .friction as the strands went through the seven
sets of guide rollers required for two beams.
Immediately after all of the strands were stressed the force measurements
indicated that the remaining prestressing force was about 722 kips, 34 kips
lower than the desired value. Part of this deficiency was caused by deflection
of the prestressing abutments as successive strands were stressed, part by
sl ip at anchorage, and part by not havi.ng enough force in the draped strands
to start with.
Immediately after the last strand was tensioned, it was found that the
forces at the two ends of the top draped strand were nearly equal. The
friction losses in the rollers were apparently equal ized along the length of
the strand when it was anchored.
By the time the strands: were cut, about 39 hours after the strands were
stressed, the total prestresstng force had dropped from 722 kips to about 677
kips. The reduction in prestressing force of 45 kips or 1.1 kips per strand,
was about the same in the draped and straight strands'. Thi's loss must have
been caused by a combination of heating of the strands during the curing of
the beam concrete and by relaxati'on in the steel. The maximum temperature in

-36-
the beams was about 120 degrees F. and the temperature at the time of stressing
was less than 80 degrees. A uniform temperature increase of 40 degrees F.
would account for a stress loss of 7 ksi, or a force loss of about 30 kips.
The relaxation loss in 40 hours was estimated to be 4.5 ksi, or about 20 kips,
using the method presented by Magura, Sozen, and Siess (5). The estimated
loss of 50 kips agrees well with the measured 45 kip loss.
The changes in strand force after the release of the prestressing were
obtained from the measured strain data. The concrete strain at the level
of the centroid of the steel was assumed to be the same as the change in strain
of the reinforcement. The stress change was determined by using the measured
value of Young1s modulus of 27,000,000 psi. The estimated total force re-
maining in the strand is plotted against time in Fig. 4.19, and it can be
seen that the force remaining after two years is sl ight1y lower than the
residual force assumed when the member was designed. The assumed loss was
25 percent of the initial force~ and the measured loss was about 25 percent.
The time-dependent losses in prestressing force after release do not
include relaxation in the strand, and there is no direct way of evaluating
this loss in a structure with bonded prestressed reinforcement. However~ the
relaxation losses after release would not be expected to be very large since
the stress level in the strand dropped to values where relaxation losses are
small soon after release.
According to the analysis reported in Ref. 5, the relaxation losses
should be negligible once the steel stress drops to 0.55 f , where f is the y y
stress at an offset strain of 0.001. The yield stress for the strand used was
238 ksi, and the force of 570 kipsJ corresponding to 0.55 f , was reached in y
about 14 days after release. The total relaxation after release is consequently
considered to be negl.igible.

-37-
4.5 Cracking
Each of the girders in the bridge was examined for cracks at least twice,
and in every case anchorage zone cracks were eventually found. The first cracks
in the interior span beams~ which contained 40 strands, occurred when the
prestressing force was released. The cracks in the end span beams, which con
tained 18 strands, sometimes did not occur until a week or more after release.
The cracks in the west end of test beam BX-l were marked with a felt-tip
pen, and are shown in Figs. 4.20 and 4.21. These cracks are also typical of
those seen in the other beams. Of the cracks crossing the end of the beam
as shown in Fig. 4.20, only the crack located about six in. above the junction
of the lower flange and web occurred when the prestress was released. At that
time, the crack wi dth. was about 0.006 in. at the end ve rt i ca 1 s t ra in gage
line, 2-1/2 in. from the end of the beam.
The two photographs were taken nearly two months after the prestress was
released. No additional cracks were found at later inspections.
The anchorage zone cracks were all "spall ing" cracks and no "bursting"
cracks were found in any beam. The occurrence of the horizontal cracks as
seen in Fig. 4.21 was anticipated in the design and vertical reinforcement
had been provided.
The horizontal crack at the junction of the web and the top flange,
which can be seen in the photographs, was apparently the result of the settle
ment and shrinkage of the concrete during setting being restrained by the
steel forms. This particular beam was not steam cured, so differential
expansi.on of the beam and the forms during heating could not have contributed
to this crack.

-38-
At the time the initial observations on the bridge were being made, it was
not recognized by the project staff that anchorage zone cracking occurred
in nearly all of the prestressed I-beams. Consequently, in order to establish
some statistical base of information, a large number of similar beams were
examined in February, 1967. At that time, 50 identical 48-in. deep I-beams,
75 ft 1 in. in length, containing 28 straight and 10 draped 7/16 in. strands,
were in storage in the Springfield, Illinois yard of Midwest Prestressed Con
crete Company. The beam cross-section and the strand pattern are shown in
Fig. 4.22. There were no end-blocks. All beams were manufactured for use in
a bridge carrying a secondary road over Shelbyville Reservoir, on the Kas
kaskia River, in Shelby County, Illinois.
Of the 50 beams, 96 ends were accessible and were examined. One or more
cracks were found in 94 of the 96 ends, so it must be concluded that the an
chorage zone cracks usually occur in such beams, which were quite similar
to those in the test structure.
There were from one to four cracks in the end zones where cracking
occurred. The average number of cracks in the 94 ends was 1.5. Four cracks
were found in two ends, three cracks in eight ends, two cracks in 25 ends,
and one at each of the remaining 59 ends.
There was a tendency for a single crack to be located a few inches,
us ua 11 y no More than six, above the j unct i on of the web and lowe r fl ange. In
cases of multi~le cracks, the lowest crack was usually very close to the
junction.
Some crack widths were measured, but insufficient data were obtained to
al low computation of average widths. The largest single crack, measured at the

-39-
end of the side of a beam, was 0.016 in. About ten cracks which were 0.010 in.
or greater in width were found. The majority of the cracks were substantially
smaller. The average crack width was estimated to be 0.006 in., but it must
be emphasized that not many measurements were made, and most of the ones that
were taken were on the widest cracks, not the average cracks.
The beams were from 10 days to ov~r three months old when examined. With
in this time range, there was no correlation between age of beam and number of
cracks.
5. CREEP AND SHRINKAGE
5.1 Introduction
The data obtained from the creep and shrinkage measurements on the
various test specimens are presented in this chapter. Creep and shrinkage
strains were measured in 6 by 12 in. cylindrical specimens, and shrinkage
strains were also measured in short sections of full sized girders and in
prisms representing the deck, as explained in Sec. 3.7.
The storage conditions of the specimens are described in Sec. 5.2.
The ages of the concrete at the time of the initial readings and at the times
of loading of the creep specimens also are given.
The shrinkage and creep data are presented in Sec. 5.3.
5.2 Storage Conditions and Times of Loading
The dates of casting of the various test specimens, the dates and
ages at initial shrinkage readings, and the dates and ages when the various
creep specimens were loaded are tabulated in Table 5.1.
The 6 by 12 in. cyl inders of beam concrete were cast using concrete
from beam BX-l. The two~ft beam sections were cast on other days, as noted,
using the same nominal mix, and consequently are not completely representative
of the concrete in beam BX-l. Specimens F2 and L2 were of the concrete in
beam BX-2.
All deck specime.ns were obtained from a single load of ready-mix con
crete which was used near the ce.nter of the west interior span of the bridge.
The beam concrete specimens were initially inside the prestressing
plant at Rochelle. On 17 August 1966 the laboratory specimens, including
cylinders for strength. determinations, creep tests and shrinkage measure-
-·40-
-41-
ments and the 2-ft long beam specimens, were moved to Urbana. They were
then placed in the northwest corner of the main crane bay of Talbot Laboratory.
The cylinders for the first creep rack to be stored in the field were
also returned to Talbot Lab, as attempts to load the creep rack while in
Rochelle had been unsuccessful. The creep specimens were loaded after some
changes in the procedure were adopted.
The fi rs t
November 1966, when it was taken to the bridge site in Jefferson County.
The creep cyl inders remained in the laboratory during this long period be-
cause of what eventually became a comedy of postponements of shipment of
the beams from the prestressing plant to the job site. When the specimens
were originally taken to the laboratory, it was anticipated that the beams
would be shipped within a short time, and they were not returned to the
plant immediately because of this.
The remainder of the field specimens remained inside the prestressing
plant until 14 September 1966, at which time they were moved outdoors at the
plant. They were moved from Rochelle 31 October 1966 and delivered to the
job site in Jefferson County 1 November.
At the job site, the specimens were placed on wooden blocking to keep
the concrete about four in. above the ground. The specimens were moved to
the wooden steps under the end-span of the bridge in early May, 1967.
The specimens of deck concrete were cast 2 June 1967, and 13 cylinders,
still in their molds, were transported to the Civil Engineering Building in
Urbana on 3 June. These cylinders were prepared for creep and shrinkage
measurements to be made in the laboratory. Additional cyl inders and three
7 by 14 by 28 in. prism specimens were moved to the Civil Engineering
Building on 7 June 1967. All were stored under the main test floor, in the
basement level of the building.

-42-
The specimens stored at the bridge site are obviously subjected to a
highly variable environment, with the temperature range during a year being
from about lOOoF to about -lOoF, with attendant variations in relative humidity
from 100 percent down to perhaps 30 percent.
The specimens in Talbot Laboratory were also in a rather variable en
vironment, as the crane bay is not air conditioned. A wet-and-dry bulb re
corder was instal led near the specimens, and the temperature range during the
first year of storage was from 65 0 to 87°F. Relative humidity extremes
during the same period were 39 and 81 percent. Typical fall and winter humi
dities were between 45 and 55 percent, and spring and summer humidities were
generally in the range of 70 to 75 percent. The winter humidities in the area
near the specimens were higher than in other heated areas because a fog-room
used for storage of concrete specimens was located just north of the specimens,
and the wall between leaked sl ightly.
The deck concrete specimens were stored in the Civil Engineering
Bui lding, which is air conditioned, and therefore were subjected to much less
environmental variation than were the beam concrete specimens.
The deck specimens were not placed in the portion of the building
designed to give the best temperature and humidity control as the mechanical
work in that area was not completed when the specimens were made. However,
the temperature control is such that the average temperature is about 720,
with variations of only ± 40 F. The average relative humidity is 50 per
cent, with a variation of only 2 to 4 percent, except for a period when the
air conditioning equipment was out of service because of a mechanical failure.
Interestingly enough, this environment is more stable than in the areas
planned to have the best temperature and humidity control.

-43-
5.3 Creep and Shrinkage Strains
The creep and shrinkage data from all the cylindrical test specimens
are given in Figs. 5.1 to 5.4. Figures 5.1 and 5.2 contain information on
gi rder concrete stored in the field and in the laboratory, respectively.
Each figure contains a shrinkage-time curve and total strain-time curves for
specimens loaded soon after release of the prestressing, and at the time the
deck was cast, about 294 days after release of prestressing.
The creep curves represent total strain from the time of loading, in
cluding elastic strain due to application of the load, and no attempt to
separate creep and shrinkage strains was made in preparation of these figures.
Shrinkage-time curves and creep-time curves for the deck concrete
specimens stored in the field and in the lab are shown in Figs. 5.3 and 5.4,
respectively. In these graphs, shrinkage strains measured in both the
cylindrical and prismatic test specimens are plotted.
There are two aspects of the measured strains from the field-stored
specimens, Figs. 5.1 and 5.3, which are quite different from the behavior
ordinarily observed under laboratory conditions. First, there are appreciable
annual variations in strain which can be attributed to seasonal climatic
changes. These changes, which are expansions in the fall and winter and
contractions in the spring and summer, occur in both creep and shrinkage
specimens. Second, the Ilfinal" shrinkage strains for the field-stored
specimens are quite small, especially when compared with the laboratory
specimens of the same concrete.
The I'final l' shrinkage strain for the field-stored beam concrete cyl in
ders is somewhere between 0.000,100 and 0.000,200, as can be seen in
Fig. 5.1, and the corresponding value for the deck concrete sl ightly smaller.
After about 3 years, the shrinkage strain for the laboratory-stored beam

.,.·44-
concrete was about 0.000,500, and that of the deck concrete about 0.000,300.
Whi le comparisons between the shrinkage values for the two storage conditions
must be made very carefully, and t~e condttions that are being compared must
be explicitly defined, it is clear that the shrinkage strains in the field-
stored specimens were considerably less than half those in similar specimens
stored in the laboratory.
These small values of shrinkage imply high values of average relative
humidity in the field, and on the basis of a report by ACI Committee 435 (6)
the shrinkage may be estimated as
-6 Esh = 12.5 x 10 (90 - H) (5.1)
where H = average relative humidity, in percent.
If the measured "final" shrinkage is ahout 0.000,125, the implied
relative humidity is 80 percent. Such a value of relative humidity is not
inconsistent with records which are now being obtained in connection with
measurements now being made on a test structure located in Douglas County,
III inois, and on which reports will be issued later.
The shrinkage of the prismatic specimens of deck concrete was essentially
the same as tha t of the cy 1 inde rs, wi th the except i on that in the laboratory,
the shrinkage rate of the prisms was slower than for the cylinders. The
final values were comparable.
As was mentioned in Sec. 3.7, it did not appear that the bond between
the prestressing strands and the concrete used in the two-ft beam specimens
had been completely broken in all cases. In order to help determine which
readings are valid ·and which are probably not, the distributions of the
horizontal strains in the field and laboratory stored specimens are plotted
-45-
in Figs. 5.5 and 5.6, respectively, for readings taken 1 to 2 weeks after the
specimens were cast and also for readings made after about 2 1/2 months.
From the strain distributions in Fig. 5.5, it is obvious that there was
residual prestressing force in specimen Fl, because of the fact that the
strains near the top and bottom of the section were much larger than those in
the bridge web. If there were to be a non-uniform strain distribution in a
plain concrete specimen, the shrinkage in the top and bottom flanges would be
expected to be smaller than that in the web because of the thicker concrete
sections in the flanges.
The strain distributions measured in specimen F2 were more nearly linear,
although the strains measured 24 August 1966 were relatively large. On 24
August the specimens were still inside the prestressing plant, and when the
readings were taken 21 October the specimens had been outdoors for about 5
weeks. The decrease in strain represents a partial recovery of shrinkage
which occurred when the specimens were re-wetted after being moved outdoors.
Specimen F3 apparently had some prestressing force remaining near both
the top and bottom flanges, although there does not seem to be a reasonable
explanation for the large reversals in strain near the top and bottom of
the section.
Of the three specimens, only F2 appears to be useful. This is also
born out by the fact that the vertical strains in specimen F2 were comparable
to the horizontal strains. In the other two specimens, the horizontal strains
were apprecja~ly larger than the vertical strains.
Essentially the same conclusions can be drawn from an examination of
the strain distributions for the laboratory specimens which are shown in
Fig. 5.6. Only specimen L2 appears to be relatively free of horizontal
stress.

-46-
The average horizontal and vertical strains are plotted versus time in
Fig. 5.7 for specimens F2 and L2. The horizontal strain plotted is the
numberical average of the strains measured in the 12 horizontal gage lines on
both sides of the specimens, and the vertical strain is the average of the
six vertical strain gage lines.
In specimen F2, the two strain traces are very close together whi Ie in
specimen L2 the horizontal strain is sl ightly larger than the vertical. The
trends of the measured strains compare well with those in the 6 by 12 in.
cyl inders, and the final magnitudes of shrinkage are comparable. A comparison
of the strains in specimen F2 with cylinder shrinkage strains, Fig. 5.1,
indicates that both types of specimen respond quickly to changes in the environ
ment, but that the shrinkage recovery in the beam specimen is less than in
the cylinders when both are re-wetted.
The total time-dependent strains measured in the specimens subjected to
a sustained load of 1,000 psi are plotted in Figs. 5.1 through 5.4. The
creep components of these strains were separated from the total strains and
are plotted versus time in Figs. 5.8 and 5.9 for the beam concrete and deck
concrete, respectively.
The creep strain at any given time was defined as the total strain
less the initial elastic strain and the shrinkage strain measured in the
companion shrinkage specimens at the same time.
The curves plotted in Figs. 5.8 and 5.9 appear reasonable except for
the curve for field-stored beam concrete which was loaded soon after release
of the prestressing force. In this particular case, the creep rack was kept
in the laboratory until 80 days age, and then moved to the field, but there
were no shrinkage specimens subjected to the same changes in environment so

-47-
a reasonable correction for the shrinkage strain could not be made. The
curve plotted is the total strain measured in the loaded 'cyl inders less the
initial elastic strain and the shrinkage strains in the cylinders which were
always with the beam. This correction obviously is not correct, and no
meaningful comparisons of creep in laboratory and field specimens which were
loaded soon after release of the prestress can be made. It is apparent,
however, that the total deformation of the field-stored concrete was consider
ably greater than that of the laboratory-stored concrete.
It may be reasonable to question whether the creep data from the field
specimens which were loaded early having any meaning at all. The main check
which can be made is to compare the total deformation in the creep specimens
with the total deformation at the centroidal fiber at midspan of beam BX-l,
as ploited in Fig. 4.3. The beam itself represents a very large creep test,
though not at constant stress, and this section was subjected to a stress
which was about 1,100 psi compression immediately after release and which
decayed to about 950 psi after three years.
Whi le such a comparison must be made cautiously, the strain in the
gi rder after three years is less than 2/3 of the strain in the creep speci
mens, which must lead to the conclusion that the creep measurements for
this one set of specimens are completely meaningless.
The creep deformations of the beam concrete which was loaded about
300 days after the prestressing was released were about half those in cylinder
loaded at 10 days. This is consistent with the generally accepted principle
that the age of loading has a significant influence on the creep behavior of
concrete.

-48-
It is interesting to note that the creep strains in the field-stored
specimens of deck concrete and of beam concrete which was loaded when the
deck was cast were initially larger than the strains in the laboratory
stored companion specimens, but that after a few months the laboratory
stored specimens had slightly higher strains. On the whole, however, the
strains in the two sets of specimens are comparable.
This observation is not consistent with the generally accepted principle
that a specimen stored in a high-humidity environment will undergo less
creep than a similar specimen stored in a much dryer environment. In this
case there is ample evidence, from the shrinkage strains if from no other
source, that the field environment is much wetter than the laboratory en
vironment, on the average. Under such conditions all design guides, such as
Ref. 6,· would lead one to expect creep strains in the laboratory to be up
to twice those in the field while the observed difference is generally less
than 20 percent.
The explanation for this anomaly apparently lies in the origins of the
numbers generally used in and referred to in the various design guides and
specifications. The creep data which was used in deriving these numbers
were from tests at constant environmental conditions. However, there is a
growing body of data (7, 8) which indicates that while the average humidity
is important in determining the final value of creep, any movement of moisture
into or out of a specimen increases the creep strain.
Since a highway bridge structure is completely open to every change in
the weather, on both daily and annual cycles, it is probably never in moisture
equi librium with the surrounding air. This will lead to larger values of

-49-
creep strain than were anticipated by the designer, and it would appear that
major changes in the methods used to estimate the long time strains in a
bridge structure are necessary.

6. DISCUSSION OF RESULTS OF OBSERVATIONS
6. 1 I n t ro d u c t ion
Various aspects of the observed behavior of the test structures are
discussed in this chapter, with comparisons of observed, design, and theoretical
values being made in the following sections. The changes in camber and de-
fleet ions are discussed in Sec. 6.2, and the loss of prestress with time in
Sec. 6.3. The strains measured in the girder BX-l are discussed in Sec. 6.4,
and the cracking observed is discussed briefly in Sec. 6.5. The calculated
strength of the test structure is discussed in Sec. 6.6.
6.2 Camber and Deflection
The observed changes in camber in the beams are plotted against time
. in Figs~ 4.1 and 4.2. The initial camber values accompanying release of
prestress are 1.01 and 0.77 in. for beams BX-1 and BX-2, respectively. The
calculated value of initial camber was 0.87 in., using a Young's modulus of 6 .
3.7 x 10 psi for the concrete at the time of release and using the 65 ft 2
in. span between the temporary supports. The computed value is 0.79 in. if
the supports are assumed to be in their final positions.
Since both beams were cast on the same prestressing bed and contained
exactly the same prestressed reinforcement, it is obvious that there were
appreciable differences in Young's modulus values for the two beams, and
probably also in concrete compression strengths.
After release of the prestress, the camber in the two beams increased
the same rates until reaching approximately stable camber values of about
1.7 and 1.6 in. for beams BX-l and BX-2, respectively, about 120 days after
release. Only small movements occurred after about 40 days.
-50-

-51-
It was not expected that the deflections would stabilize in so short a
period as four months, as work reported by Corley, Sozen and Siess (9) indicated
that camber could be expected to continue increasing for a much longer period of
time, as did measurements reported by Branson and Ozell (10). In both cases most
of the measurements were made on small beams stored under laboratory conditions.
Recently Sinno and Furr (11) have reported field measurements of camber which
show near-stabil ity ~eing reached after three months or less, but this is the
only other case known to the writer where the camber
The construction of the deck formworkoand placement of the deck reinforce-
ment caused a deflection of about 0.1 in., and the weight of the deck concrete
caused a deflection of about 0.31 in. in each beam, for a total deflection of
O. 41 in. due to the weight of the deck.
The camber allowance for dead load indicated on the bridge plans was
5/8 in., while the computed deflection, using the measured value of Young1s
modulus of 5.6 x 10⁶ psi (Table 2.3) at 303 Clays, was 0.41 in. The computed
and measured values are in excellent agreement, but both are much lower than
the design value.
The design va1~e apparently was larger than the computed value because of
three factors. First, the Young1s modulus for the concrete was assumed as
4.3 x 10⁶
psi, corresponding to fl = 5000 psi, instead of the measured c
5.6 x 10 6 psi. Second, the full beam length of 72 ft 3 in. was apparently
used instead of the span of 71 ft 2 in. center-to-center of bearings. The
second factor may appear to be small, but it acquires improtance since the
computed deflection varies as the span to the fourth power. Finally, the
calculated value was probably rounded to the nearest 1/8 in.
After the deck was cast the changes in deflection were very small,
as would be expected. Under the full dead load, the stress distribution in
-52-
the girder was approximately uniform over the depth of the girder and under
such stress condit1ons the tendency to deflect either up or down is very small.
An unexpected facet of the long-term deflections is the small increase
in camber which has continued to take place during the time interval of 2 to
3 1/4 years. After the deck was cast there were small movements corresponding
to about the measuring precision, but after about 2 years the camber started
to increase again. No reasonable explana~ion for this has been found, since
any movement following such a long term of very minor movements would be ex
pected to be in the direction of decreasing camber as the prestressing force
continues to decrease very slowly.
Any attempts to predict the time-dependent deflections for the beams
BX-l and BX-2 are complicated by the fact that the beams were subjected to
. several different support conditions during their early life.
A general method of analysis of camber changes, such as is outlined in
Ref. 9, could be used. However, the amount of computation required is large
and would require a computer solution, simi lar to those described in Ref. 9
and 11, but with capabil ity to take the changing span conditions into
account.
The approximat~ method of calculating camber changes which is given in
Ref. 6 is not satisfactory for use in this case, because of the mUltiple
changes in span length early in the life of the girders when the changes
in camber were occurring most rapidly.
In both types of calculations, better information than is available
on the creep characteristics of the beam concrete which was loaded soon
after release would be needed in order to make meaningful predictions of
camber.

-53-
Temperature gradients within beams can have a significant influence on
the deflection measured at a particular time. In this investigation there
was one instance in which the camber measurements on beams BX-l and BX-2
appeared incompatible. The readings taken 85 days after release show a
much larger increase in camber for BX-I than for BX-2, and the circumstances
deserve explanation. On that day BX-2 had been set in its final position of
the piers, but all the beams for the west interior span, including BX-I, were
setting very close together on blocking on the ground nearby. The weather
was warm and sunny after several cold, sunless days, and BX-2 was fully ex
posed to the sun and could not have been subjected to appreciable temperature
gradients over the depth of the member. Beam BX-l was between other beams
which shaded al I except the top flange from the sun, and the temperature
readings from the Carlson meters indicated the top of the beam was about
100 F warmer than the bottom. This temperature differential is sufficient
to explain the differences in the two readings. There were no other occasions
on which it could be demonstrated that temperature differences had affected
the deflections, although no thorough study of this has been completed.
The deflections measurements were nearly always taken about the same
time of the day, between 10 and 11 a.m., after the deck was finished, and
this has probably minimized errors due to different temperature distributions.
In addition, the completed structure is continuous over,four spans and any
tendency to deflect due to temperature di,fferentials is at least partially
counteracted by restraint forces set up by the initial movements.
6.3 Loss of Prestress
The initial value of the prestressing force was considerably lower than
the design value, as was discussed in Sec. 4.4, and this in turn must lead

-54-
lower losses of prestress with time than would otherwise be expected. The
design calculations were made on the basis of an assumed loss of prestress,
including both elastic losses at release and also long term losses due to
creep, shrinkage, and relaxation, of 25 percent of the force before release.
There was no direct calculation of the stress calculation of the stress con-
ditions immediately after release of the prestressing although the possible
importance of this stage was recognized in that minimum span limits were
placed on each strand configuration used with the 48-in. deep beams.
The force immediately before release was 677 kips, or 155 ksi, as
shown in Table 4.1. The calculated force at midspan immediately after release
was 624 kips, including the effects of the dead load of the girder, and 611
kips ignoring the dead load. This calculation was made on the basis of
E 3.7 x 10⁶
psi, and assuming the beam to be supported on a 65 ft 2 in. c
span. The measured force immedi.ately after release was 624 kips, which is the
same as the theoretical value.
The variation of the prestressing force with time in beam BX-l is shown
in Fig. 4.19, and it can be seen that there were large losses during the
first few weeks of the life of the structure, and that there have been
continued losses since that time, but at very low rates.
The prestressing force remaining after more than three years is about
540 kips, or 124 ksi, less any sma1 1 relaxation losses which may have
occurred, and is about 22 kips below the design value. This is not a sig-
nificant difference, and it is bel ieved that the final value would have been
greater than the design value had the prestressing force before release been
at the design value.

-55-
It is not possible to make a completely reasonable estimate of the
losses on any reasonable theoretical basis because of the lack of reliable creep
data for the concrete under field conditions. However, there are relatively
standard methods of estimating the losses which are used in design. The 1954
Bureau of Publ ic Roads Criteria for Prestressed Concrete Bridges (12) con-
tained the following equation for loss of prestress:
Loss (in psi) = 6,000 + 16 f + 0.04 fl. cgs Sl
where f cgs compressive stress in concrete at center of gravity of
prestressed reinforcement due to the dead load moment and
the prestressing force before release, and
fl. initial stress is prestressed reinforcement (before release). Sl
The 6,000 psi loss corresponds toa shrinkage strain of about 0.0002,
the second term is the elastic shortening plus creep loss of about the same
magnitude as the elastic shortening at release, and the third term is stress
relaxation of the reinforcement.
Application of this equation to the experimental bridge structure gives
a calculated loss of 41.4 kis, or 181 kips, which is considerably higher
than the measured loss of 137 kips. However, the computed loss includes
about 6 ksi due to relaxation and if this is ignored as was discussed in
Sec. 4.4, the computed loss becomes 153 kips, about 12 percent larger than
the measured loss. In any event, the equation predicts a loss which is
somewhat too large.
The 1965 AASHO Specifications (13) state simply that the loss in pre-
stress from all sources in a pretensioned member shall be taken as 35 ksi
unless better information is available. Although this is commonly used as
the time-dependent loss after release of prestress, the original source of
this value, ACI-ASCE Joint Committee 323 (14), makes it quite clear that

-56-
this loss includes the elastic loss accompanying release of the prestressing
force.
Since the measured loss of prestress from before release to 1212 days
was 137 kips, or 31 ksi, the agreement between the current nominal AASHO
design value and the measured value is quite acceptable.
Both of the methods of obtaining design values have a common drawback,
although it must be noted that both are to be used only if nothing better
is available. The problem is that the loss value suggested is in no way
tied to the environmental conditions, and while the values are not unreason
able for conditions in the central portions of the United States, they are
likely to substantially underestimate the losses occurring in a very dry
region, such as the desert regions of the southwest. A dry environment leads
to higher shrinkage and creep values than were anticipated in the derivation
of the design recommendations, and blind application of these values could
lead to much greater losses than anticipated. This will not affect the
strength of the structures to any appreciable amount, but will reduce the
cracking load and may cause deflection problems. On the other hand, an
overestimation of the prestressing losses may lead to excessive camber and
the attendant problems.
6.4 Measured Strains in Girder BX-l
The results of the strain measurements, which were presented in Sec.
4.3, are useful in defining the behavior of the bridge structure in a
number of ways. The strain measurements were used in obtaining the pre
stressing loss data which were discussed in the prece~ing section.

-57-
The strain-time curves plotted in Figs. 4.3 and 4.]0 show that there
were initially very large increases in strain with time, and that the
general trend from 100 to 830 days is for the strain to increase at a low but
continual rate, with seasonal cyel ic variations superimposed on the trend.
After about 830 days, however, the strains at the bottom of the section
remained about constant and there were small reversals in the strain trends.
The reversals at the top fiber of the beam show up in the curvature-time
curve, Fig. 4.5, indicating increased curvature during the last year of
readings. This is consistent with the small increases in camber which
were measured, Fig. 4.1.
During the first two winters after the beams were manufactured, there
were significant reductions in the measured strains, but these reductions
,were not observed during the last two winters. The lack of large seasonal
movements may partly be a function of the reading intervals since the last
three sets of readings were made at intervals of about 6 months while the
earl ier readings were at much shorter intervals and the maximum and minimum
values were very likely missed during the last year and a half.
There were significant cyclical movements during 'the last reading
periods for the creep and shrinkage specimens, Figs. 5.1 and 5.3, and it is
obvious that the bridge structure itself did not undergo such large strains.
Even though the shrinkage and creep specimens were stored under the
end span of the bridge, the exposure conditions for the girders and for
the specimens were not quite the same. The girder in which the strains
were measured is the center girder in a five-girder bridge and consequently
never is rained directly on. The test specimens can be rained directly upon

-58-
whenever a NE or SE wind accompanies the rain and measurements have been
made when the specimens were dripping wet but the bridge girder was dry to
touch.
The shortening of the bottom fiber of a beam is of interest since
this movement should be taken into account when designing the bearing de
vices. The final average value of compressive strain at the bottom of
the beam is about 0.0012, as can be seen by examination of the various
strain-time curves and strain distributions, and this corresponds to a
beam shortening of slightly over one in. About half of this strain
occurred at release, which leaves about one-half in. of movement to be taken
care of by the bearing devices, in addition to the movements caused by
temperature variations, if the beam is placed on its fInal bearing devices
~oon after release of the prestressing. In this bridge this was no problem
since most of the girders were over two and one-half months old when they
were moved to the bridge site, and by that time more than 80 percent of the
time-dependent shortening had already taken place.
The most difficult factor in making meaningful strain measurements in
a field investigation is providing adequate temperature compensation for the
mechanical strain gages. The procedure followed, as explained in Sec. 3.3.2,
was to use a steel bar which was placed on the concrete, but not in the
sunshine, and allowed to reach temperature equilibrium before readings were
made. Records of the standard bar temperature, relative to air and concrete
temperatures, were not kept, but it now appears that the standard bar tem
perature was probably closer to the air temperature than to the concrete
temperature. If the readings are taken early enough in the day, and before
noon may be early enough, the readings seem to be consistent. However, on

-59-
the day the deck was cast readings were taken quite early in the day and again
in late afternoon. That the temperature compensation was not able to properly
handle the change in temperature is evident in that a strain ch~nge was
measured at the centroid of the section during the day the deck was cast, as
can be seen in Figs. 4.3 and 4.10.
A second problem with temperature compensation is that steel has a
coefficient of thermal expansion that is 1 to 1.5 x 10⁻⁶ in./in./Fo larger
than that of the concrete. Such a difference is hardly significant if the
temperature range is 10oF, but readings over a temperature range of about
70 0 F (concrete temperatures from 86 0 to l8°F) were made, ,with the initial
zero readings taken at the high end of the temperature range.
The use of the steel standard bar over-compensates for the temperature
movements, and when the strain is compressive, a temperature decrease re-
su1ts in an indicated strain that is too low. For a temperature reduction
o -6 of 50 F and a differential in coefficients of expansion of 1.5 x 10 ,the
strain will be 0.000,075 too low. This could be cited to explain the re-
ductions in strain observed during the first two winters, but the argument
cannot be valid since the reductions did not occur during the third and
fourth winters in the beams but were observed in the creep and shrinkage
specimens.
The error introduced by the temperature compensation problem is not as
serious as might be implied from the last paragraph. The most important
reason for this is that only one set of readings was made in which the
o concrete temperature was below 20 F, at 113 days. Most of the wintertime
o readings were made when the concrete temperatures were 35 F or higher,
and most of the summer readings were made at temperatures within 10 to l5 0 F
-60-
of the maximum recorded. In addition, the differential between temperature
coefficients of the concrete and steel was probably not quite as large as
was used in the example.
The principle lesson to be learned from the discussion is that the
temperature effects must be carefully considered, and that information
needed for adequate compensation includes the temperature of the concrete,
of the standard bart and of the surrounding air.
An error in temperature compensation does not lead to an error in
curvatures calculated from the strains. All strains are affected by the
same numerical quantity and the differences which are used in determining
curvatures are not changed from their correct values.
6.5 Anchorage Zone Cracking
The anchorage zone cracking found in the girders was described and
discussed in Sec. 4.5. Since the possibil ity of this cracking had been
taken into account during the design process sufficient vertical reinforce
ment was provided at the ends of the girders to limit the cracks to acceptable
widths. This reinforcement apparently was proportioned on the basis of a
report by Gergely, et al, (15), and three short double-legged stirrups of
No.5 reinforcing bar were provided near each end of each beam, as can be
seen in Figs. 2.3 and 2.4. An analysis of beam BX-l, using Gergely·s
analysis, indicates that about 1.5 in. 2 of reinforcement working at 20 ksi
is required. This analysis is conservative in that it ignores the contri
bution of the tensile strength of the concrete.
The work by Welsh and Sozen (16) indicates that the tensile strength
of the concrete makes an important contribution in limiting the crack size
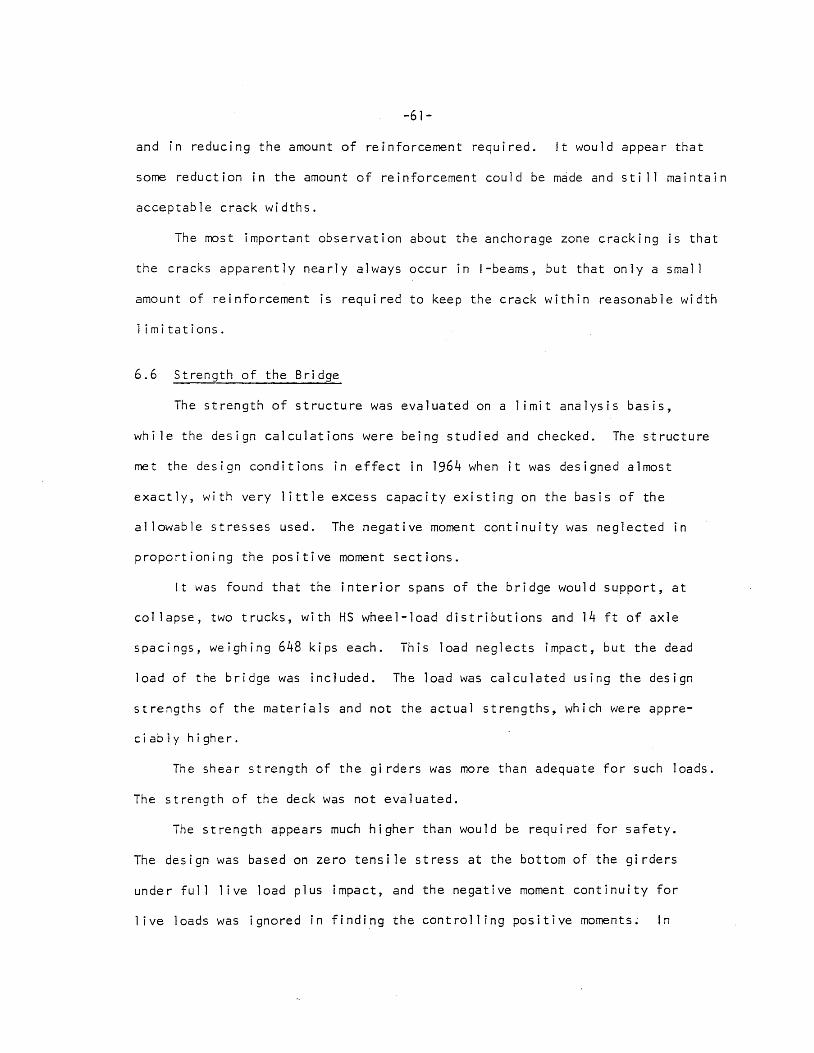
-61-
and in reducing the amount of reinforcement required. It would appear that
some reduction in the amount of reinforcement could be made and sti 11 maintain
acceptable crack widths.
The most important observation about the anchorage zone cracking is that
the cracks apparently nearly always occur in I-beams, but that only a small
amount of reinforcement is required to keep the crack within reasonable width
1 imitations.
6.6 Strength of the Bridge
The strength of structure was evaluated on a limit analysis basis,
whi le the design calculations were being studied and checked. The structure
met the design conditions in effect in 1964 when it was designed almost
exactly, with very little excess capacity existing on the basis of the
allowable stresses used. The negative moment continuity was neglected in
proportioning the positive moment sections.
It was found that the interior spans of the bridge would support, at
col lapse, two trucks, with HS wheel-load distributions and 14 ft of axle
spacings, weighing 648 kips each. This load neglects impact, but the dead
load of the bridge was included. The load was calculated using the design
strengths of the materials and not the actual strengths, which were appre
ciably higher.
The shear strength of the gi rders was more than adequate for such loads.
The strength of the deck was not evaluated.
The strength appears much higher than would be required for safety.
The design was based on zero tensile stress at the bottom of the girders
under full live load plus impact, and the negative moment continuity for
1 ive loads was ignored in finding the controlling positive moments~ In

-62-
addition, the ratio of ultimate moment to the limiting working load moment
was considerably higher than necessary, but this cannot be changed as it is
essentially a cross-sectional property. The ultimate positive moment require
ment, based on 1.5 x Dead Load Moment plus 2.5 x Live Load Moment (including
impact) was 2,880 kip-ft, while the available ultimate positive moment was
about 4,040 kip-ft.
A more sophisticated stress analysis taking into account the continuity
of the structure would help reduce the excessive load factor,as would the
use of an allowable tensile stress of 6~at the bottom of the girder as
al lowed in the 1965 AASHO specifications, but some redesign of the cross
sectional shape would be requi red to reduce the apparent confl icts between
the requirements of the working load analysis of stresses and the strength
analysis requirements.

7. SUMMARY AND CONCLUSIONS
This report describes the results of measurements of strain, camber,
and material properties of a four-span highway bridge, constructed using
prestressed, precast girders and a cast-in-place deck, which were made over
a period of 3 1/4 years.
The construction of the bridge is discussed in detail in Chapter 2,
as are the strengths of the concretes at various times and the properties
of the reinforcement. The detai ls of the bridge super-structure are given.
The instrumentation used in making the measurements of strain, camber,
and temperature are described in Chapter 3. The locations of the deflection
reference points, the 98 mechanical strain gage lines and the seven Carlson
strain meters are given in detai 1. The installation of the mechanical strain
gage points is discussed in detai 1, and recommendations for changes to make
the process easier and faster are given.
The concrete test specimens used for strength determinations, and creep
and shrinkage measurements are also described in Chapter 3.
The results of the observations on the bridge structure are presented
in Chapter 4, and the results of the creep and shrinkage measurements in
Chapter 5. Discussion of the results, in terms of comparisons of measured
values of camber, deflection, strain in the girders, and curvatures, is
contained in Chapter 6, while most of the discussion of the results of the
creep and shrinkage measurements is in Chapter 5.
The initial camber values in the 72-ft span interior beams were about
one in., and these values increased by about 75 percent within a few weeks
and then increased only slowly until the deck was cast. The deflection due to
-63- Metz Referenoe Room Cl' vl'l 1"'1,"" 0''; -r'1p.P-f'~ -r.,Q' Den,,-artmen.1J
J:!.J.J..!.O.J...l. ... ·~',/_J_·-·'-' -
BI06 C. E, I>.: "-" ;: '>~.?; Uni VC,;Y ;:~:~ ',"i'
Dr b ar·'.e" :

-64-
the weight of the deck was somewhat lower than the design value, largely because
the concrete strength and Young's modulus values were substantial 1y above
the design values.
The strain data obtained from the mechanical strain gages, whether con
sidered directly or converted to curvatures, were consistent with the camber
measurements. Additional information on the shortening of the beam and move
ments with seasonal changes in l~ngth which did not affect the camber readings
was also obtained. It was found that the electrical strain gages did not give
satisfactory results, and a probable reason for this error was found.
The strain data obtained near the end of one beam indicated that the
anchorage length for the prestressing strand was probably on the order of
18 in., and did not appear to increase appreciably with time. The strain
. distrib~tions indicated that the strains near the end of the beam were not
linearly distributed over the depth of the beam until a section approximately
the beam depth from the end of the beam was reached.
It was observed that anchorage zone cracks occurred in all the girders
in the bridge, and an additional survey found cracks in 94 ends out of 96
which were examined. The reinforcement provided was adequate to restrain
the widths of the cracks to acceptable values.
The prestressing force eventually decayed to a value slightly less
than that anticipated in the design process, but this was largely due to
the fact that the initial force reached during construction was too low.
The actual losses were less than those considered in the design.
The shrinkage strain values measured in the field were much lower than
those measured in the laboratory, but the creep values were comparable.
-65-
This impl ies that a major revision in the methods of predicting creep strains
is necessary, so that the fluctuations in environmental conditions can be
taken into account as well as the average value of relative humidity. This
change will affect the calculation of the camber and losses of prestress,
both of which affect the serviceabil ity but not the strength of the struc
ture.

8. RE FE REN CES
1. Reynolds, R. J. and W. L. Gamble, "Field Investigation of Prestressed
Concrete Highway Bridges--Instrumentation for Long-Term Field
Investigation," Civi 1 Engineering Studies, Structural Research Series
No. 327, Department of Civi 1 Engineering 1 University of Illinois, Urbana,
1967.
2. Carlson, R. W., "Five Yearsl Improvement of the Elastic Wire Strain
Meter," Engineering News Record, V. 114, May 16, 1935, p. 696.
3. Kaar, P. H., R. W. LaFraugh, and M. A. Mass, "Inf1uence of Concrete
Strength on Strand Transfer Length," Journal Prestressed Concrete
Institute, Vol. 8, No.5, Oct. 1963, pp. 47-67.
4. Stocker, M. F. and t1. A. Sozen, "Investigation of Prestressed Reinforced
Concrete for Highway Bridges--Part VI: Bond Characteristics of Prestress
ing Strand," Civil Engineering Studies, Structural Research Series No.
344, Department of Civi 1 Engineering, University of Illinois, Urbana
1969.
5. Magura, D. D., M. A. Sozen, and C. P. Siess, "A Study of Stress
Relaxation in Prestressing Reinforcement," Journal Prestressed Concrete
Institute, Vol. 9, No.2, April 1964, pp. 13-57.
6. ACI Con..,ittee 435, "Deflections of Prestressed Concrete Members,"
Journal I-.merican Concrete Institute, Proc. Vol. 60, Dec. 1963, pp. 1697-
1728.
7. Hansen, Torben C., "Creep and Stress Relaxation of Concrete 7 " Proc. Nr.
31, Swedish Cement and Concrete Research Institute, Royal Institute of
Technology, Stockholm, 1960.
-66-
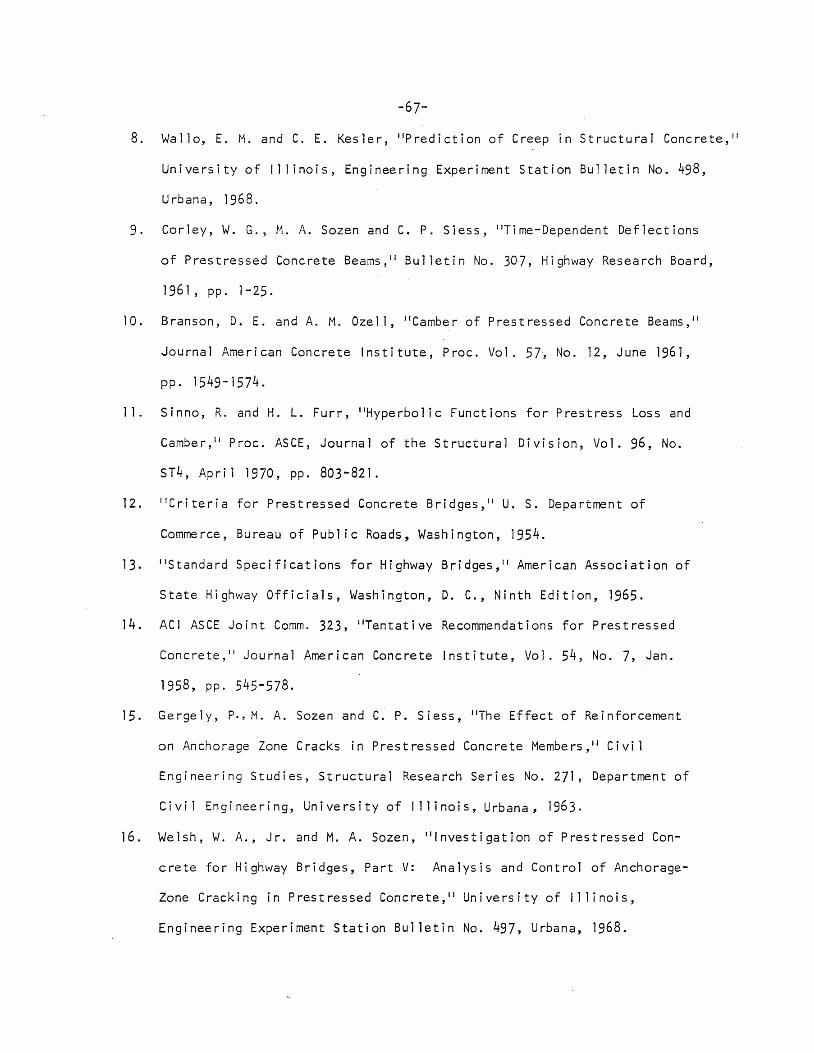
-67-
8. Wallo, E. M. and C. E. Kesler, "Prediction of Creep in Structural Concrete,11
University of Illinois, Engineering Experiment Station Bulletin No. 498,
Urbana, 1968.
9. Corley, W. G., t1. A. Sozen and C. P. Siess, IITime-Dependent Deflections
of Prestressed Concrete Beams,11 Bulletin No. 307, Highway Research Board,
1961, pp. 1-25.
10. Branson, D. E. and A. t1. Ozell, I'Camber of Prestressed Concrete Beams,"
Journal American Concrete Institute, Proc. Vol. 57~ No. 12, June 1961,
pp. 1549-1574.
11. Sinno, R. and H. L. Furr, 'IHyperbol ic Functions for Prestress Loss and
Camber,11 Proc. ASCE, Journal of the Structural Division, Vol. 96, No.
ST4, Apri 1 1970, pp. 803-821.
12. IICr·iteria for Prestressed Concrete Bridges,'1 U. S. Department of
Commerce, Bureau of Public Roads, Washington, 1954.
13. "Standard Specifications for Highway Bridges,11 American Association of
State Highway Officials, Washington, D. C., Ninth Edition, 1965.
14. ACI ASCE Joint Comm. 323, 'ITentative Recommendations for Prestressed
Concrete," Journal American Concrete Institute, Vol. 54, No.7, Jan.
1958, pp. 545-578.
15. Gergely, p., M. A. Sozen and C. P. Siess, liThe Effect of Reinforcement
on Anchorage Zone Cracks in Prestressed Concrete Members,11 Civil
Engineering Studies, Structural Research Series No. 271, Department of
Civil Engineering, University of Illinois, Urbana, 1963.
16. Welsh, W. A., Jr. and M. A. Sozen, Illnvestigation of Prestressed Con-
crete for Highway Bridges, Part V: Analysis and Control of Anchorage-
Zone Cracking in Prestressed Concrete,l! University of Illinois,
Engineering Experiment Station Bulletin No. 497, Urbana, 1968.

Time
10 Aug. 1966
6:00 a. m.
8:40 a.m.
10: 10
2:40 p.m.
3:30 p.m.
3:50 p.m.
11: 25 p.m.
11 Aug. 1966
7:00 a.m.
8:00 a.m.
3:00 a.m.
11 :00 p.m.
12 Aug. 1966
1: 45 a.m.
3:00 a.m.
6:00 a.m.
-68-
TABLE 2.1 CHRONOLOGY OF GIRDER CONSTRUCTION
Elapsed Time hr:mi n.
o
2:40 I. _,~ .,.. IV
8:40
9: 30
9:50
17:25
25:00
26:00
33:00
41 :00
43:45
45:00
48:00
Tasks
Clean Stressing Bed, Set Hardware, String Strands
Start Stressing Strands
Finish Stressing·Strands Place'Stirrup Cages Place Sides of Forms
Start Placing Concrete, Beam BX-l
Finish Placing Concrete, Beam BX-l
End Finishing Concrete
Remove Forms from Beam BX-1
Finish Casting Beam BX-2
Start Mechanical Gage Installation, BX-l
Steam Turned on for Beam BX-2
Remove For~s from BX-2
Cut 1st Strands
Finish Cutting Strands
Finish Initial Readings, BX-l & BX-2

22 July 1966
12 Aug. 1966
17 Aug. 1966
14 Sept. 1966
27 Oct. 1966
25 Nov. 1966
2 June 1967
-69-
TABLE 2.2 CONSTRUCTION OF BRIDGE AND LOCATIONS OF GIRDERS AT VARIOUS TIMES
BX-l
Release Prestress
Inside Plant
Move Outside Plant
Bridge Site, On Ground
On Piers
Deck Cast
BX-2
Release Prestress
Move Outside Plant
Outside Plant
Bridge Site, On Piers
On Pie rs
AX-3
Released Prestress Move Outside Plant
Outside Plant
Outside Plant
Outside Plant
Bridge Site, On Piers

-70-'
TABLE 2.3 GIRDER CONCRETE PROPERTIES, BEAM BX-l
Values Are Averages Of Three Cylinders
Field Stored Concrete Laboratory Stored Conc rete Age fl f E. fl f E.
After After c sp I C sp I
Casting Release psi ps i ps i x 106 psi psi psi x 106
2.25 0.6 4190
7. 5 5530
14. 12 6220 430
15. 13 5620 415 4.0
28. 26 5500 472 4.5 5080 429 4.3
303. 301 7500 581 5.6 6270 473 4.6
667. 665 7730 5.4 ;"7110 5.6
*One cylinder only.

-71-
TABLE 2.4 DECK CONCRETE PROPERTIES
Values Are Averages of Three Cylinders
Age Field Stored Concrete Laborato ry Stored Concrete
Days Days fl E. fl E. Afte r After c x1106
c x
l
l06 Casting Release ~ psi ~ psi
33 327 4820 5.6 4920 4.8
371 665 4900 4.9 4900 4.8

TABLE 4.1 PRESTRESSING FORCE DATA FORCES IN KI PS
Design T Immediately 30 Strands All Strands Dyn. No. kips Aft e r S t re s sin g Stressed Stressed Start Steam At Release
18.9 18.35 18.20 17.95 16.85 16.95
2 19.20 18.60 18.50 17.25 17.25
3 18.70 18.15 18.00 16.45 16.70
4 18.55 18.20 18.10 17.00 17.00
5 18.60 18.20 18.05 16.65 17.00
6 18.80 18.35 18.25 16.70 16.95
7 18.75 18.40 18.30 17.45 17.40
8 18.65 18.50 18.50 18.45 I
17.10 -....,J w
18.80 18.55 18.40 17.65 I
9 17.50
10 17.70 18.00 16.65 16.70
11 17.25 17.40 16.35 16.35 12 17.35 17.25 16.25 16.35 14 18.9 17.15 16.95 16.85
Avg. Bottom 18.9 18.71 18.35 18.23 17.16 17.09
Avg. Top 18.9 17.43 17.55 16.42 16.47
Projected Total Force 756 736 722.4 679 677
Notes: Dyns. 12 and 14 on same strand. No. 14 not averaged Locations of Load Cells are shown in Fig. 4.1
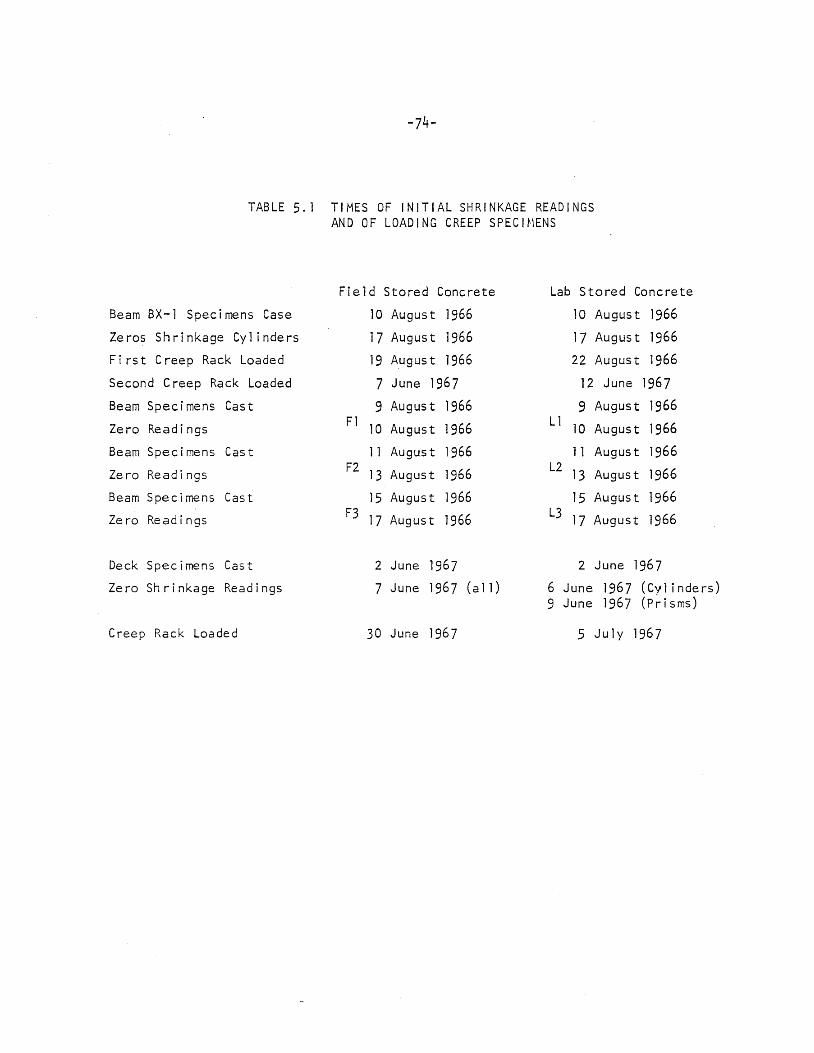
-74·,
TABLE 5.1 TIMES OF INITIAL SHRINKAGE READINGS AND OF LOAD I NG CREEP SPEC I ~lENS
Field Stored Concrete Lab Stored Concrete
Beam BX-1 Specimens Case 10 August 1966 10 August 1966
Zeros Shrinkage Cyl inders 17 August 1966 17 August 1966
First Creep Rack Loaded 19 August 1966 22 August 1966
Second Creep Rack Loaded 7 June 1967 12 June 1967
Beam Spec i mens Cas t 9 August 1966 9 August 1966
Zero Read i ngs F1 10 August 1966 L1 10 August 1966
Beam Spec i mens Cas t 11 August 1966 1 1 August 1966
Zero Read i ngs F2 13 August 1966 L2 13 August 1966
Beam Spec i mens Cast 15 August 1966 15 August 1966
Zero Read i ngs F3 17 August 1966 L3 17 August 1966
Deck Spec i mens Cast 2 June 1967 2 June 1967
Zero Sh r i nkage Readings 7 June 1967 (a 11) 6 June 1967 (Cylinders) 9 June 1967 (Prisms)
Creep Rack Loaded 30 June 1967 5 July 1967

lJ.J c::: ::::::> Iu ::::::> c::: IU')
l(/)
l.LJ l-
ll... o ::r:: 0.. c:::( c::: c...!J o Io ::r:: 0..
N

AX-3
ill N II
ill , ill
<::t
N t 13°-38'-45"
46'-0" 72'-7" 721-7" 46' -0"
FRAMING PLAN
8" Brg.
Pier 2
211_10 11 24'-1'1 24'-1 " 24'-1'1 f30381 45"
----- ------ ------------ -------8" Typ. '~
\
-- -------- ---- -- .......... ~ - - -- --:::--:-------'- ----
43 1 -8 '1 721 -3' r
HALF FRAMING PLAN FIG. 2.2 PLAN OF GIRDER LOCATIONS

\Cenl '0' P ie, End
1 4'! . ____ ~w~----------------------------------------. +-i l- 6" _ . _. __ (--
72'- 3" 7",..t t-. -- -~- .. ,-",-,,~
,,,i IWl--_ 19"CI.,+ I I, .. , 8 No.5 Bars 0 11-1-. ,
-.
! I I
73 No.3 Bors at 12" cIs
9 No, 5 Bars at "-0" efs 10 No.5 B 0 rs all ,'- 9" e t s --------- ---- - -------t----.- A
J I l J [I
-t I i
,~I 2
i
; I J I I I J I I I I I I J J I
/ i
leI. ~ • ~Il I I l I
I
b. '
!
1-+
L ill IIIIII.-L L L-~ .. /L- L-II L L L I~ ~ L L L III L l.- L L L L L
q ~15"~ 4,9 No.3 Bars of 10" cts~ A
locations of Non-prestressed Reinforcement
J J I J ! I I
i '- '-- L- L- _I
5 ymm. ~~~-~J
1_- 3 No.5 Bars
c rB .. _ symm._~OUI_~~_~-l
I H I ~~_~n Points ! ==-= i \'" .-- ·-----·1
c I .. 28'-7L_
I 4-8-" ~ 7' -6" ... _------+--._._-_. -_._--":- . I
~-------.-
Profile of 7/16-in. Prestressing Strands
FIG. 2.3 DETAILS OF 72-FT GIRDERS
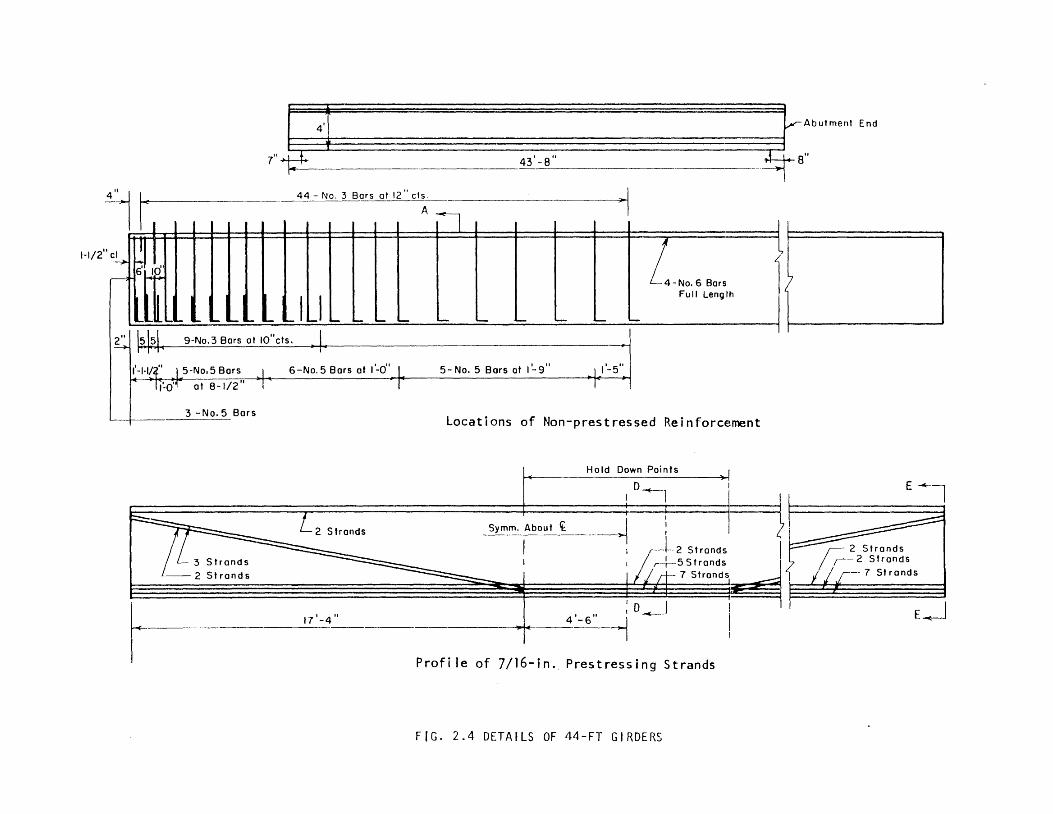
"i-~I::::YAbulmenl End 7 43'-8" ~8"
I t~ I I I I 44 - N~ 3 ~ms 0112" CI~ iI I 1 =={ t:1 ===============~ .. 1 1
1-1/2 c.!..,.. f-.- 4-No.6 8ars ,
f! Id' Full Length I r-' """, ----i
J ~I
II ~ 'L II- ~ UL- L ....I J L.. L.. _ L- L- L- L L- ~ :-J 1~lpl. 9-No.3 80rs a I 10" cis. ~ ( 5- No.5 Bars at 1~9" J 1'-5" 6-No.5 Bars at 1'-0" 1 I'-I.I~ ~L5-No,5 Bars J
I I -17·()" at 8-1/2" -,
3 -No.5 Bars Locations of Non-prestressed ReinforcE~ment
Hold Down Points JI
Ei o I -+-1 II
I~ [2 Strands Symm. About ~ I . -l i~!
~ ~' r 2 Sironds 1rJ7' , ( r+
5 Sironds 2 Sironds
17'-4" ~ I il4; 7 SlrondS~ (;-2 StrandS ( I J , ~-- 7 St , rands
Strand s 2 Strands
4'" I 0 J . · ~--1 ---- I I
Profl Ie of 7/16-in I E-,J .. Pres t res s . Ing Strands
FIG. 2.4 DETAILS OF 44-FT GIRDERS

4'-0" II -38
~ -111. TTV yars at 12/1 cts.
Section A-A
2~' 8
7i'l 7~ i'
I • 1'- 1 a" .1
ba rs
4T1 t
-, 3'-011
2/1 sp
~I 2~'
Section S-B
3/1 L
3'-3"
· .) E21' • ••• • sp
•••••••••
3~~~ Section D-D
FIG. 2.5 GIRDER CROSS-SECTIONS
3 ilL II
2'-5/1
• : :-. ___ ,r------l--
••• • •• ••••••••• .... ••••••• ,2== . 'I 2"
3'~H~,'T
Section C-C
3"
2 ' -1 J"
• ··E~---' : ••••• ; • 21
' sp
31~ ~~" Section E-E
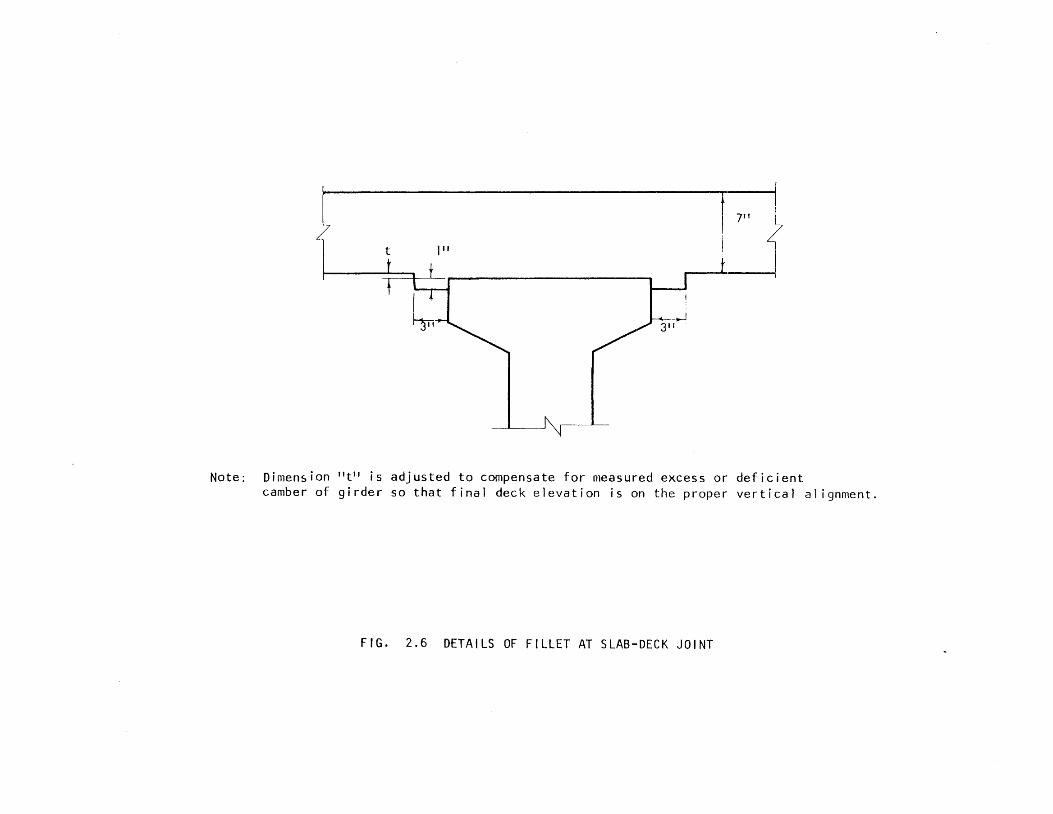
t f 7" < Z 111 , I I I
t , ~
-~ 3"
Note: Dimension "til is adjusted to compensate for measured excess or deficient camber of girder so that final deck elevation is on the proper vertical al ignment.
FIG. 2.6 DETAILS OF FILLET AT SLAB-DECK JOINT

to"1 :"-0", I - ... L ... --
i i I I I I I
12'- 0"
. 3'-0" ; II I , 24'-0 Roadway -.----- -- .. -.-.---.----r---~-l
, ~---
12'-0 11
. Symm. About It. Roadway 1-_--------.--"- -- ---
I !
--~ I I
I I
20 -.lr5 Bars at 18" Cts. j
~16-#4 T7_r ____
Bars
/ / // / ;: / /.
/ /'/ // /)'
I
i , I !
: !
." - -- 7-----,.---, / / .I , ./ / 1/ ,
. I / / /
:# 5 Bars at 15" Cts,
" C
// ,/ ,.. 38-#6 Bars at 6"Cts.
/jJ/~7/:I;{
#: 5 ~a!~ __ ~~ .. _'~ ____ !~ ~'-'
5 Bars at 15" Cts,
1'-1-1/2"
12'-0" i r----~-... -----.. ____________ 4 Spaces at 6'-6" Cts. 26'-0" I I ..
I f--.- 30'-0
11 0 to 0
2'-0 11
.~ .... "t-. _. -----I--".
--~
./...--- Construction
#- 5 Bar
FIG. 2.7 BRIDGE CROSS-SECTION SHOWING SLAB REINFORCEMENT NEAR INTERIOR SUPPORTS
Joint
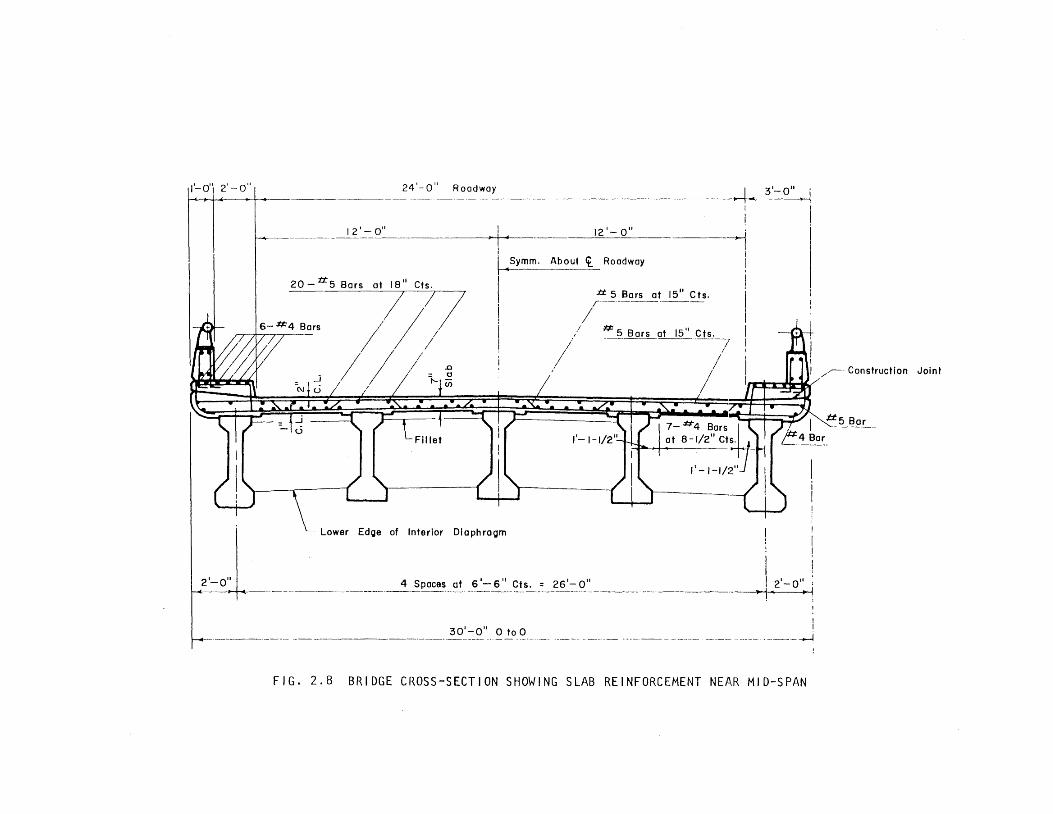
1'-0"1 2'- 0" 24'-0" Roadway --+--3'-0"
I ~
12'-0" 121- a .. ----~
I I ~Symm,
I I
I I
~-,';4 Bars 0:/1/8" 77 / /
II I
- /1 ~/I I j' =~ , t--IUi
Lower Edoe of Interior Diophroom
/
About ct. Roadway
I
,/
,'/
/
:I::t 5 Bars at 15 11 Cts, r------------
_/ #= 5 Bors ot 15" Cts. ----------7'
/ /
/
/
I I II I 4 I.. I .. c2 -0 ~ ~ Spaces at _~_=~_~~_:: 26 - ~ __________________ _
I
!
!
I I I
I ! 21-0"
~ I '
I 30 1-0" 0 toO --------------J
FIG. 2.8 BRIDGE CROSS-SECTION SHOWING SLAB REINFORCEMENT NEAR MID-SPAN
/,,--- Construction Joint

Ins ide Plant 0-19 days
Outside Plant 20-76 days
Bridge Site 78- I 12 day s
On Pie rs
Inside Plant 0-4 days
Outside Plant 5-76 days
On Pie r s
BEAM BX-l E_a_s_t~ __________________________________________________________________ ~ __ W~est
A 4 ~--.- ._- 65' -211
A I
h-. ..,...L----3' -6\ I
J +
am I
i I ~911
I
I I I. 2'-6"
I !. I. 2 '-6 "
Outside Plant 0-J33 days
63 I -3 11 5'-6"
68 1 -0" ...... _--l-
21-6 11
.-o~----- ... _. -.... _ .... -.-.' .--.. -. -'-' 711-2"
BEAM BX-2
65 I _2,1
I I
~'I_~'I 66! - J II
71 '_21'
BEAM AX-3
39 ' -51'
I t
On Pie rs
----++-.Ii.--------L 7'1 42 '-5 11
F/G.2.9 LOCATIONS OF BEAM SUPPORTS AT VARIOUS TIMES
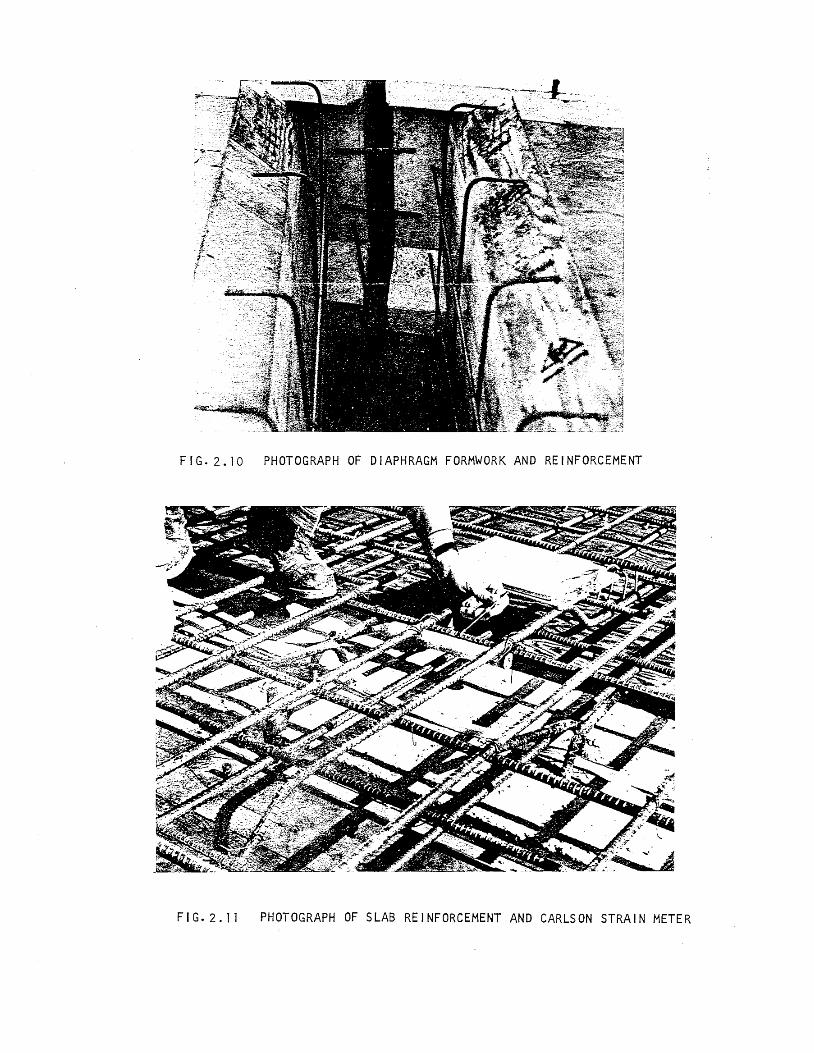
FIG. 2.10 PHOTOGRAPH OF DIAPHRAGM FORMWORK AND REINFORCEMENT
FIG. 2.11 PHOTOGRAPH OF SLAB REINFORCEMENT AND CARLSON STRAIN METER

6.5 ksi 6
N
4
Q)
~ 2 L
U C o
U I
U 4-
N
C
......... U')
a.. .::£
l/l l/l Q) L
.j...J
V>
(l) ......, (l) L
U C 0
U I
U 4-
E. I
4.3 x 10⁶ psi Lab Stored Concrete at 301 days
o ~------------------~.O~O~1------------------~.~O~02~------.~O~0~2~5------~
6
4
2
E. I
0
0
Concrete Strain (a) Girder Concrete
4.9 ksi
4.8 x 10⁶ psi
.001 Concrete Strain
(b) Deck Concrete
Field Stored Concrete at 28 days
.002
FIG. 2.12 TYPICAL STRESS-STRAIN CURVES FOR CONCRETE

N
a
0
0
1Il c...
co a a a a a c a co a L-a 40J
(J') ,....... N
«.> 1..0 G.I 040J
LU aU')
o:::t" 0 a
N a a
L-____________ L-____________ ~ ____________ ~ ________ ~~~~~~~~.wO
a L()
N
a a N
a L()
a a
• u , /5 d :', '>I - 1331 S Z • ,'1
Z·U!/S~!~ - ssaJ~S la~~s
a L()
a
c z < 0:::: f-U')
c
lD
"-,.......
0:::: 0 ~
LU :> 0:::: ~ u
:z: ~ 0:::: f-U')
I U') tf)
LU 0:::: f-U')
....J ~ u
c.. >-f-
C"')
N
~
~

Strand Grip
Steel Washer S tee I B 1 oc k - 8 X 8"
2 5/8" Diam
Hydroc~J Plaster
1/2 11 Diam Conical Hole
7/16 " Strand
p
FIG. 2.14 CENTERLINE CROSS-SECTION OF STRAND TESTING GRIP

130~,------~--------~------~------~------~--------~------~------~--------r-------~-------r---,
120
No. 4 Bar - Deck
N 100 c
........ VI 0..
.::L I VI til Q) 1-+-I Vl No. 7 Bar - Deck +-I C Q)
E Q)
U 1-a
4-c Q) 40 0::
20
O,~ ________ ~ __________________ ~ ________ ~ ________ ~ ________ ~ ________ ~ ________ ~ ________ ~ ________ ~~ ________ ~ __ -J
o .06 .08 . ] 0 . J 2 .14 .16 .18 .20 .22 Reinforcement Strain
FIG. 2.15 TYPICAL STRESS-STRAIN CURVES FOR STEEL

_9
o 0
0 7 - 0 o 0 4' 0
• 0 0 f
12, 14
o o o
0
8_ 0
o 0
l' 0 0
0
-6
0 3 - 0 0
Note: All dynamometers except Noo 14 were at anchorage end of prestressing bed.
FIG .• 3.1 LOCATIONS AND DESIGNATIONS OF STRAND-FORCE DYNAMOMETERS

L
$2,(>',', ~':;( .:. I~<--.'~ :'I.~.~ ',.' .:~ b/:.,·
. ,.. '. " - I I D· , 1"" .... '. ~. .
:.' ~; :, P', ' < ..... ~~. :.:.. .... ' ~ .'tJ· ~ : ~~. ~ .~. ",: I ->: ... ~.~:,_ _G-6. __ •
25 3/811
45 1/8 11
East
Ir- Dec k L . !J!' , :'.: A ._J; •..• p' "t' . . •.. ' •• ' /J' ~fj '\. ,{J . ~' J •
'.'.' G-5 '.' '.',: :,' n~ .<1 I"! .. __ ...... [' .• ~.,. ~ :',", Q:-. ",:.'. ~~'J • . ,_,_ ' •• ' -', .'
G-3 ----...,..--
45 l/~II
Midspan
::~. ''''~:', : .. >: .... :;.'::\)<:~>:"~.~:.'~,:;:\' G-l __ _
25 3/8"
45 3/411
d ~-2T
West
FIG. 3.2 LOCATIONS AND DESIGNATIONS OF CARLSON STRAIN METERS IN BEAM BX-l
I
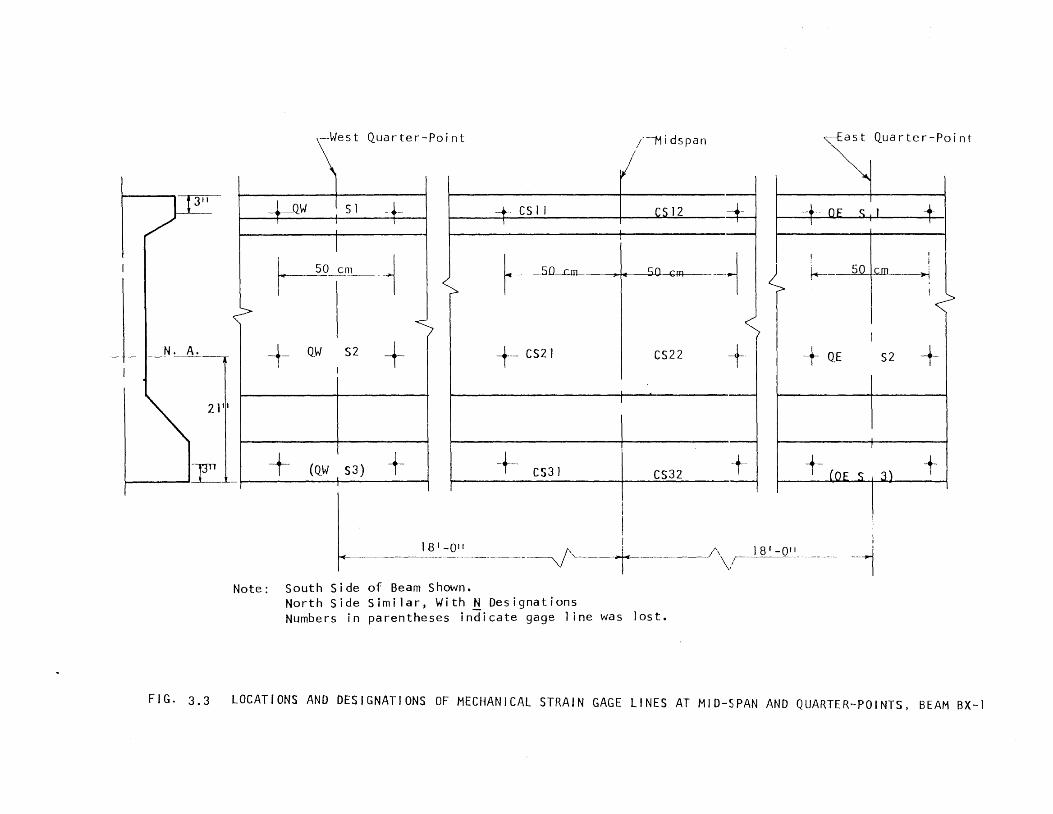
N. A.
21'11
I-------,r
West Quarter-Point
CS 1 J
l--~- em 1 I
~_so
..:::::::
-t- QW 52 + -t-- CS2 J
1
+ (QW S3) + + CS3}
! I 8
1
~.I.I __ . ___ -.----V''- ia'l~ ~I~L-___________ __
Note: South Side of Beam Shown. North Side Similar, With N Designations
/~ i dspan ~ast Quarter-Point
12 =t-~
--.~ 1---- Sv I\"'''I-~ I
< CS22 -t + Q,E S2 +
CS32 + -f-- + I
i 1\ 18'-0'1 ~ -./ \/-_. __ . __ .... __ .--.- - I
Numbers in parentheses indicate gage 1 ine was lost.
FIG. 3.3 LOCATIONS AND DESIGNATIONS OF MECHANICAL STRAIN GAGE LINES AT MID-SPAN AND QUARTER-POINTS, BEAM BX-J

~
1011
10"
+(WS21 ) + (WS22) -+ (WS23) -+- (WS24)+ ("t')
("t') N ("t') V) ("t') en :3: en :3:
:3:
... (WS4 1 ) -+ (WS42) + WS43 --. -
Lf) ("t') (/')
lJ') lJ') Lf) Lf) Lf) (/') (/') V) en Lf)
:3: ~'411
~ IIF'I + WS7I + wsn ~S73 -+ (WS74)+
. ~ I + WS81 -+- WS82 -+- WS83 +WS84 +-
tt211 1Ot"~ IOd· 10+ 10'~ West End, South Side
Numbers in parentheses indicate gage line was lost.
+
+WN24
Lf)
M Z :3:
+WN44
Lf) Lf)
+ WN84
West End
±WN23 + WN22 t- WN21 -+ ..q - --. M M N Z M M M ~ Z z :z '---' ~ ~ ::c
"-'" ...........
+WN43 ~ WN42 ~ N4 1 ) + --. ..q M N ......... LJ) LJ) Vl z: z z 11)
~~ z '-" ~
'-" ...
+ WN83 + WN82 + WN81 +
~ lo,d- 10'+ 10'+ 10'*2~/211 West End, North Side
FIG. 3 .. 4 LOCATIONS AND DESIGNATIONS OF MECHANICAL STRAIN GAGE LINES AT WEST E~D OF BEAM BX-l

East End East End
+ EN 14t-- I~' .... (ES 14)+
I + EN B4t- [J;', I. 32 1/2" -I- I 0" ~l
+ ES 84 +
1. 10" .1. 32 1/2" ~ East End, North Side East End, South Side
Numbers in parentheses indicate gage 1 ine was lost.
FIG. 3.5 LOCATIONS AND DESIGNATIONS OF MECHANICAL STRAIN GAGE LINES AT EAST END OF BEAM BX-l

· '>'~~ ~\~: ~~t~~~/~·~:~~:j . ... ~ " ... ~
Mechanical Anchor
Cone to Sp read Anchor
:.
Plaster
(a) Mechanically Anchored Gage Points
1/4 X 1/2 11 Cap Screw
Epoxy
(b) Epoxy-Fixed Gage Point
FIG. 3.6 CROSS-SECTIONS OF STRAIN GAGE POINT

~Typrcal Ther~ocouple Location, Beams BX-J and AX-3
I ;/ -----=- U_ .:-} West
-t' l =#1' -6" 1 I -6"i--- 36' -1 I /2" ~ 36' -I 1/211
(a) BEAMS BX-J and BX-2
Typ i ca 1 Def 1 ec t i on Po i nt..7 I rAbutment End
I ~ : (West)
1 ' -6' _I L I -+t 2 I -6" ~ 2 1 ' - 1 0" .1 2 1 I - 1 0" ~ r ~r -- - -,
(b) BEAM AX-3
FIG·3.7 LOCATIONS OF DEFLECTION MEASURING POINTS AND THERMOCOUPLES

I" PI ate
I" Plate
I" Plate
2" Plate
6 X 6,r Cylinder
6 X 12'1 CyJ inder:
J'I Sa J J
J I r P J at
Nuts
- 30-T Jack
Load Ce 11
Spring
1" Diam Threaded Rod
1011
A
S t ra in Gage Points
L
I~ SEC. A-A
tlG~ 3.8 C~EEP RACK AND INSTRUMENTATION
~
-I

Ends Sealed with Epoxy and Aluminum Foi 1
3" t + 511
+ S + 21
-50 cm C"')
+. 541
N ("")
V') V')
+ S + 51
+
+ 571
±
+ ("") ("")
t-Vl
+ .+ -t
Note: All Gage lines 50 cm.
South Side of specimen shown, north side similar.
FIG. 3.9 INSTRUMENTATION FOR TWO-FT LONG BEAM SPECIMENS
7-in. wide faces sealed with epoxy 1411
Top fac + + 3 + (as cast) B:J t tom fa c e 5" s i mil a r + + + 4 1/ II 2 4
\. lQII 1 ·1 Gil J 28"
FIG. 3.10 INSTRUMENTATION FOR DECK PRISM" SPECIMENS

2.0
VI
~ 1.5 u c
H
c
1... CIJ
...0
~ 1.0 u
o
o.
Years Since Release of Prestress
BX-l
AX-3
2 3
BX-2
4
Hundreds 5
of Days
Fig. 4.1 MID - SPAN CAMBER - TIME CURVES
2
7
Since Release of 9
Prestress
3
~

2.0
I rnside at _0
~ Outside at Plant
1.5 ~
Vl 4)
..c u c:
1.0
L.. t)
~ " u ~tOd Sl e at Plant
0.5 ins ide on Piers
I.~ Outside at Plant
I~ \ AX-3 ,. o
o 10 20 30 40 50 60 70 80 90
Time - Days Since Release of Prestress
FIG.4.2 CAMBER-TIME tURVES FOR GIRDERS FOR FIRST THREE MONTHS

~ o
)(
c
f.I)
ClI > I/)
I/)
ClI La. 0 100 u
o Years SInce Release of Prestress
2
Note: Each Data Point .is Average of 4 gage 1 i nes.
bottom
centroid
,..~ ,. 'b1 ~ ~polnts Inaccessl e
2 3 4 5 6 7 8
Hundreds of days since Release of Prestress
top
9
Fi 9 4.3 MID - SPAN STRAIN - TIME CURVES, BEAM, BX - 1, MUNICH GAGE
3
•
..
10 11 12
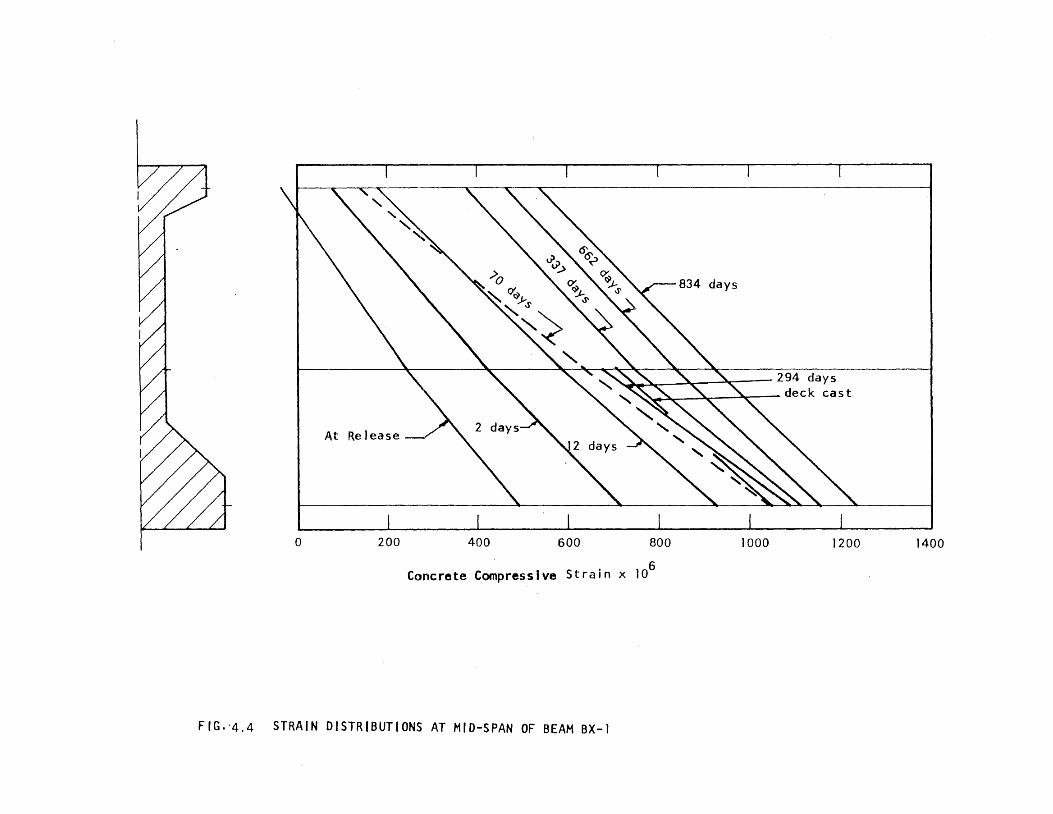
834 days
"~ ,,'- 294 days :5 S .. :so< deck cast
At ReJease-, 2 days
o 200 400 600 800 1000 J200 1400
Concrete Compressive Strain x 106
FIG·'4.4 STRAIN DISTRIBUTIONS AT MID-SPAN OF BEAM BX-l

o Years Since Release of Prestress
1 2 3
'\.0 o
x
25
20
15
c 10 .......... -0 !tl 0::
Q) L :J 4J ro > L :J
U
5
.. ~-..., I I I ~-
01 I I * I ~ . ~ I d I I I o ? 'l < - In i lPi
Hundreds of Days Since Release of Prestress
Fi g. 4.5 MID- SPAN CURVATIJRE VS TIME FOR BEAM BX-l
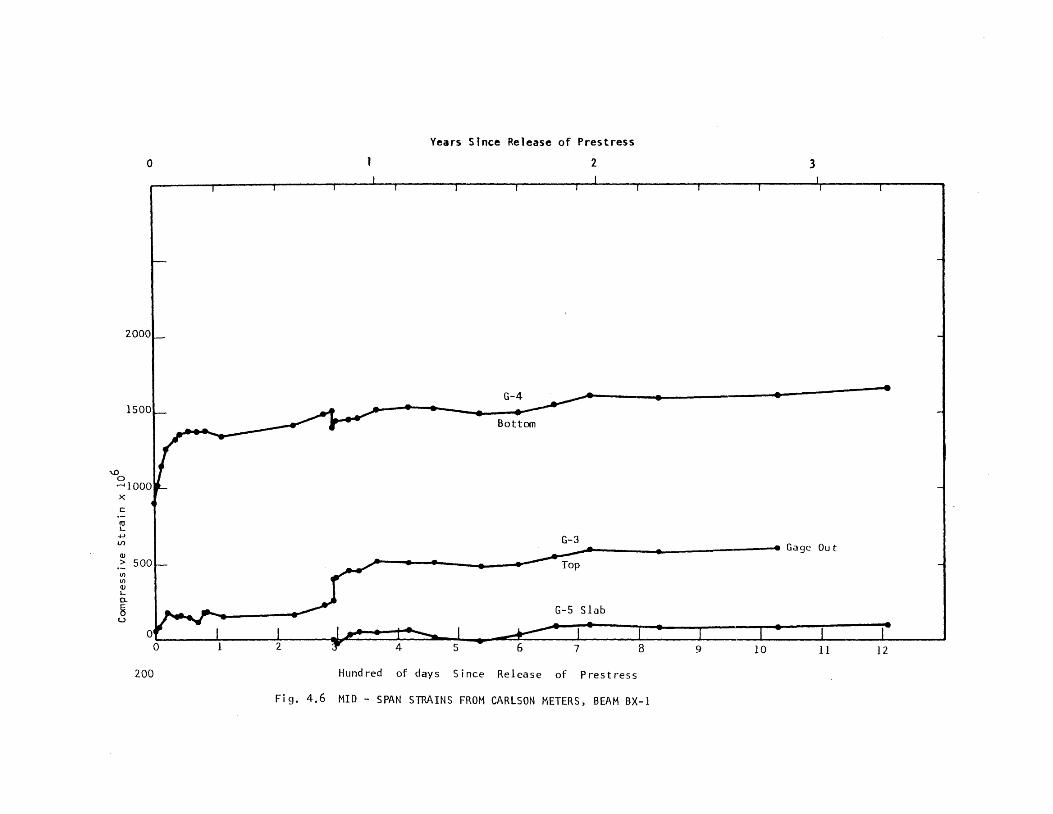
Years Stnce Release of Prestress
o 2 3
2000
G-4 1500
Bottom
x c
ro L +J tf)
QJ
G-3 • Gage Out ~ .
.> 500 III III QJ L 0-
~ G-5 Slab U
4 5 7 9
200 Hundred of days Since Release of Prestress
Fig. 4.6 MID - SPAN STRAINS FROM CARLSON METERS, BEAM BX-l

---. I • w 0 30
><
I VI C1.I
.r:::. u c 20 c
......., ~ ~ .- "'- Hun i ch
C1.I L. :::J
~
----------- • +J
"' > J 0 L.
:::J U ~ ---~ Theore t i ca 1
I 0...,........ 0.16 o 0.02 0.04 0.06 0.08 0.10 0.12 0.14
Upward Deflection - Feet
FIG.4.7 MEASURED CURVATURES vs. DEFLECTION FOR BEAM BX-l

Q)
01 co ~
Q) Lo E C1) ~
+J
..r:. :3t
~ L-4-
\0 o
x c: ~ L+J
2000
1600
1200
80
V) 400
• / Perfect Agreement
•
Limit of Linearity
easurements
800 1200 1600 2000
Strain x ]06 from Carlson Meter
FIG. 4 .8 STRA INS F ROM CARLS ON AND WH I TTEMORE GAGE S DUR (NG AUX I L I ARY TE~)T

Brass Bellows
I I . I ... . 10 in. ~
(a) Standard Gage
1. d" 8' In. lam 11 . 2" In. diam flange
Closure Nut
Leadwi re
I ~ 7. 75 in. ~ I ~Brazed Joint in Body
(b) Modified Gage
FIG. 4.9 PROFILES OF STANDARD AND MODIFIED CARLSON STRAIN METERS

200
'-D o
1500
x lOO c
ro L +.J VI
(l)
> IJl IJl (l) L a. E o u
50
o
o
Years Since Release of Prestress
Note: Each Data Point Average of two or four gage lines
2 3
~"- Points Top --------------~ .•• ----------------~ ~ . Inaccessible
2 3 4 5 7 9 10 11 12
Hundreds of Days Since Release of Prestress
Fig. 4.10 QUARTER- POINT STRAIN TIME CURVES, BEAM BX-1, MUNICH GAGE

At Release
o 200
, <"l " ~<9 " ~ " :.t---r. ",>
" ~& " v "
5 days
,
400 600
"
Concrete Compressive Strain x 106
FIG.4.11 STRAIN DISTRIBUTIONS AT QUARTER POINT OF BEAM BX-l
834 days
800 1000 1200

Years Since Release of Prestress
o
2000
G-7 - ~ 1500 B at tom
x C
fU 1-+.J VI
Q) 500 > G-l
Vl Vl aJ 1- Top Q.
8 u
0
0 2 3 4 5 6 7 8 9 10 11 12
Hundred of days since Release of Prestress
FIG. 4.12 STRAIN-TIME CURVES NEAR ENDS OF BEAM, CARLSON METERS

W 11
W 21
W 61
W 71
W 81
a
At Release
1 da
200
43 days
h ff 228 days
", , , " , ,
400 600
~~
800
Average of 2 gage 1 i nes 10 in. Gage length
NOTE: Points inaccessible afte deck cast.
1 5 '2 days
1000 1200 1400
Compressive Concrete Strain x 106
FIG·4.13 STRAIN DISTRIBUTIONS AT SECTION 7.5 IN. FROM END OF BEAM BX-J

W 12
W 22
W 42
W 62
W 72
W 82
o
At Release
days~ \ \ \ \ \
1 day
200 400
36 days - 612 days
600 800
Average of 2 gage 1 ines 10 in. Gage length
834 days
~
fooo 1200
. . 106 CompresSive Concrete Strain x
FIG.4.14 STRAIN DISTRIBUTIONS AT SECTIONS 17.5 IN. FROM END OF BEAM BX-l
1400

W 13
W 23
W 43
W 63
W 73
W 83
o
At Release
200
834 days
113 days
5.5 days
400 600 800
Compressive Concrete Strain x 106
Average of 2 gage 1 ines 10 in. Gage length
1000 1200
FIG. 4.15 STRAIN DISTRIBUTIONS AT SECTION 27.5 IN. FROM END OF BEAM BX-1
1400

W 14
W 24
W 44
W74
,1W 84
o
At Release
200 400
834 days
336 days
5.5 days
600 800
Average of 2 gage 1 ines 10 in. Gage length
--~<L13 days
1000 1200
Compressive Concrete Strain x 106
FIG.4.16 STRAIN DISTRIBUTIONS AT SECTION 37.5 IN. FROM END OF BEAM BX-1
1400

..00
x c
ro L ~
Vi
Q.)
> r.n r.n Q.) L 0... E 0 u
800~---------r--------~----------~--------~--------~
Line W8X
600 --Line W7X
r-I
400
Note: Strains plotted at center of gage 1 i ne.
200
Line W1X
O~ ______ ~~ ________ ~~ ______ ~ __ ~ ______ ~ __ ~ ________ ~
o 10 20 30 40
Inches from end of beam
FIG. 4.17 DISTRIBUTIONS OF LONGITUDINAL STRAIN ALONG BEAM NEAR WEST END AT RELEASE
50

t..O 0
X
c .-cu 1-+-J U")
Q) +-J Q) 1-U c 0 u
1400
1200
1000
800
600
400
200
W81 'w'82
228 days
70 days
5.5 days
1 day
At Release
Note: Strains plotted at center of Gage Line
'w'83 W84 o ________ ~~ ________ ~~ ______ ~ __ ~ ______ ~~~ ________ ~
o 10 20 30 40
Inches from end of beam
FIG. 4.18 STRAINS ALONG GAGE LINE W8X AT VARIOUS TIMES
50
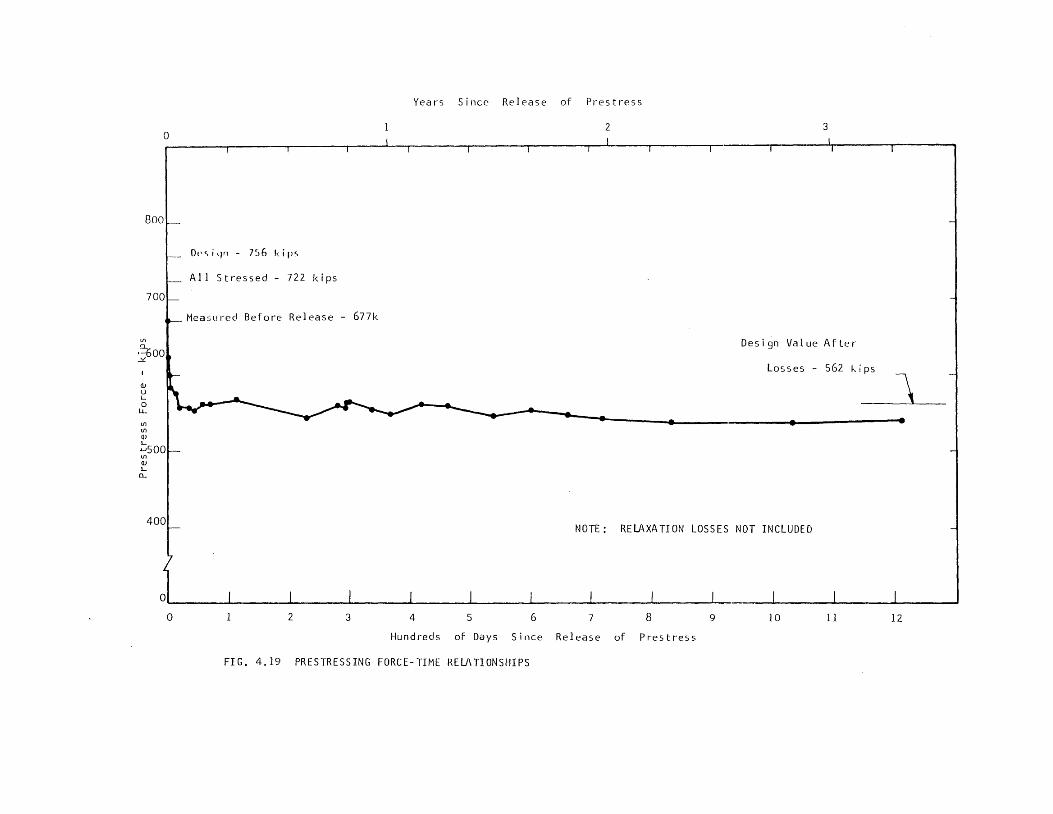
o
800
700
Vl
·~OO ..Y..
\l)
U L o
lL.
Vl til \l)
~500 1Il \l) L n..
400
o
Years Since Release of Prestress
2 3
O('siqn - E16 kip'>
All Stressed - 722 kips
Mea:;u I-cd Befo re Re 1 ea se - 677 k
Design Value After
Losses - 562 kips
'\ •
NOTE: RELAXATION LOSSES NOT INCLUDED
2 3 4 5 6 7 8 9 10 11 12
Hundreds of Days Since Release of Prestress
FIG. 4.19 PRESTRESSING FORCE-TIME RELATIONSHIPS

FIG. 4.20 PHOTOGRAPH OF END OF BEAM BX-l SHOWING ANCHORAGE ZONE CRACKING
FIG. 4.21 ANCHORAGE ZONE CRACK DISTRIBUTION IN BEAM BX-1

48"
71. 11
4
711
1 811
o 0
o 0
o 0
o 0
o
o 0
• • 0 0 •
• • • .00 • • • •
• • • • 0 0 • • • •
• • • • 0 0 • • • '.
~I
t, .. Sp. I
i Draped Strand at End of Girder
Straight Strand
211 Sp.
311
FIG. 4.22 GIRDER CROSS-SECTION, SHELBY CO. BRIDGE

o
2000
1500 '-D
o x c
ro '-
~100 QJ > til til QJ 'D..
3 50
o
Years Since Release of Prestress
2 3
Shrinkage
2 3 4 5 6 7 8 9 10 11 12
Hundreds of Days Since Release of Prestress
FIG. 5.1 CREEP AND SHRINKAGE OF FIELD-STORED BEAM CONCRETE

2000
1500
x c
ro L oW
I.fI
~500 III III QJ L 0... E o u
o
o
Years Since Release of Prestress
2 3
Creep
Sh r i nkage ~_. ___ ~_L-~~~~p- -e------ -_ .. -- ----.--- ----- -- --- .. .... . -----.
2 3 4 5 6 7 8 9 10 11 12
Hundreds of Days Since Release of Prestress
FIG. 5.2 CREEP AND SHRINKAGE OF LABORATORY STORED BEAM CONCRETE
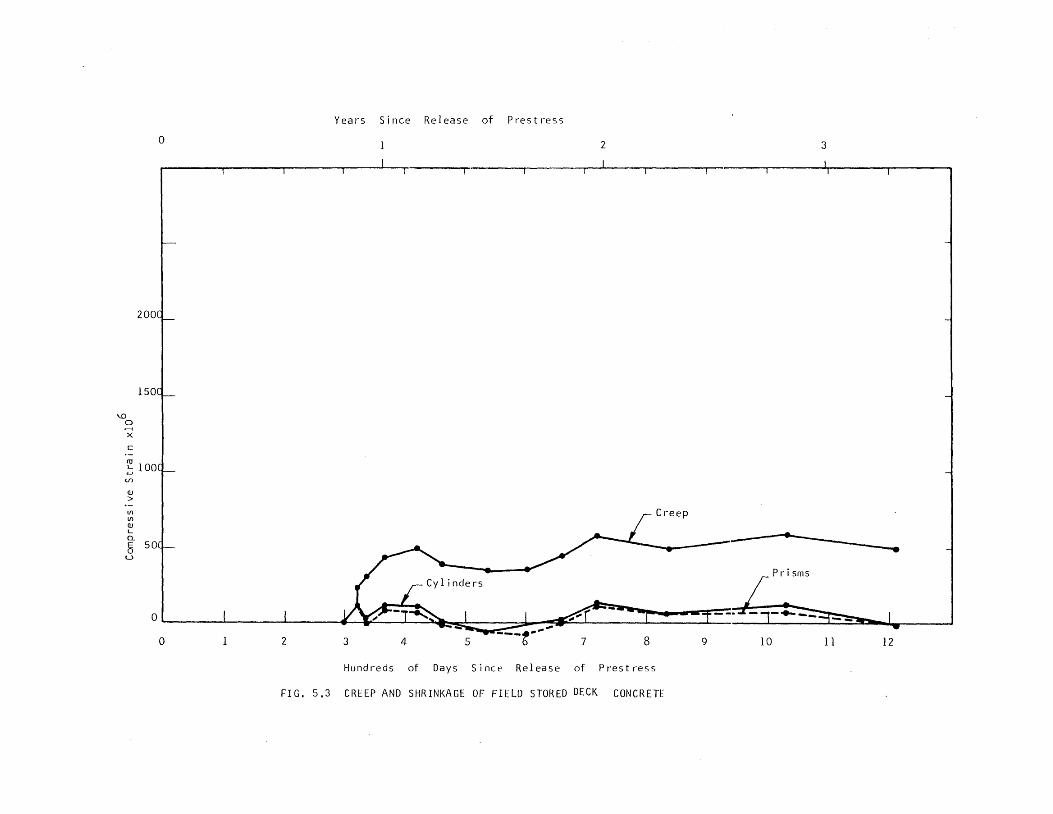
\.0 o r-< X
c
200
150
~ 100 (f)
(JJ
> 1Il 1Il (JJ L 0.
5 50 u
Years Since Release of Prestress
a 2
,- --I
Creep
Cyl inders
'--=~ .". ..... -O. • .- - ---t" a 2 8 9 3 4 7 5
Hundreds of Days Since Release of Prestress
FIG. 5.3 CREEP AND SHRINKAGE OF FIELD STORED DECK CONCRETE
3
P r isms
-- ....... lw
10 11 12

~ o
200
150
x 100 c
ro L
(/)
OJ >
~ 50 OJ L 0.. E o u
o
Not e : C y 1 i n de r s 1 oa d e d 33 day s aft e rca s tin 9
Creep
Cy1 inders
Deck cast ----.-y-pr=i~:_---------- - -.e_- - - -- ----- ..
2 3 4 5 6 7 8 9 10 11 12
Hurdreds of days since Release of Prestress
FIG. 5.4 CREEP AND SHRINKAGE OF LABORATORY- STORED DECK CONCRETE

FI F2 F3
10/2 8/24/1966 10/2 8/24 10/21 8/24
C.G.
400 o 200 o 200 400 o 200 400
Horizontal Compressive Strain xl06
FIG. 5.5 HORIZONTAL COMPRESSIVE STRAINS IN FIELD-STORED Th'O-FT BEAM SPECIMENS

Ll L2 L3
8/23/1966 10/31 10/31
G.G.
•
o 200 400 o 200 400 o 200 400
Horizontal Compressive Strainxl06
FIG. 5.6 HORIZONTAL COMPRESSIVE STRAINS IN LABORATORY-STORED TWO-FT BEAM SPECIMENS

Years Since Release of Prestress
o 2 3
L2
Horizontal
~~~ ..... ~ \ /r - ...... --,,_ .I -- -------
.... _[_ .... _ _ __ ------e Vertical
400
'-'>0 ..... x
0 c
ru L +J l/)
Q)
> 40 Vl Vl Q) L 0-
g U
9 10 11 12
Hundreds of Days Since Release of Prestress
FIG. 5.7 SHRINKAGE-TIME CURVES FOR TWO-FT BEAM SPECIMENS F2 AND L2

Years Since Release of Prestress
o 2 3 1500 ,
, i
125
100 ~
0 r-I
X
1fI C
ru L +-J 75 l/)
0. C1J C1J L
U
C1J > 1fI 1fI C1J L 0.
6 u
25
0, ,
o
" I
"U r-I
QJ
4-
o +-J
"U C1J > o ~
r
Field
Lab
........ _ .................... ____ .... ~ ... L-.... -----/ ,~..... - ----,/ ....... --------. Field
2 3 4 5 6 7 8
Hundreds of Days Since Release of Prestress
FIG. 5.8 CREEP STRAIN VERSUS TIME CURVES FOR BEAM CONCRETE
-----.,..
9
_ ..... _-----. --
10 11 12

Years Since Release of Prestress
o 2 3
~ 0
x c
co L 50 .w Lao Vl
Q.. l1J QJ L
U
QJ >
Ul 25
Ul QJ L Q.. Deck Cast 0
U
0
0 2 3 4 5 6 7 8 9 10 11 12
Hundreds of Days Si:1CL' Release of Prestress
FIG. 5.9 CREEP STRAIN VERSUS TIME FOR DECK CONCRETE

ABSTRACT
Gamble, W. L., "Field Investigation of a Continuous Composite Prestressed I-Beam Highway Bridge Located in Jefferson County, 111inois," Civil Engineering Studies, Structural Research Series No. 360, Department of eivi 1 Engineering, University of 11 linois, Urbana, June 1970.
Key Words: Prestressed, concrete, bridges, structures, creep, shrinkage, strain, camber, construction, research, reinforcement
Camber, strain, creep, and shrinkage measurements were made over a period
of three years on a four-span prestressed concrete highway bridge and concrete
specimens. The precast I-section girders were made continuous for live-load
forces by reinforcement cast in the deck. The construction of the bridge is
described, as is the instrumentation used.
Although the most important changes in camber of the beams occurred within
the first few weeks after release of prestress, measurable movements were still
occurring after 3.3 years. The strain measurements on the annual cyclical ex-
pansio8s and contractions, probably due to changes in average relative humidity
different times of the year. Measurable shortening of the bottom fiber of the
girders occurred for more than two years after release of the prestressing force.
The major portion of the loss of prestress occurred during the first few
weeks after release, but the losses continued at a slow rate throughout the
three-year period.
The creep and shrinkage measurements show that the shrinkage in the field
was much less than in the laboratory, but that the creep values were comparable
in the two environments. Further work is required to define the magnitude of
creep of concrete subjected to variable environmental conditions, as most
accepted present concepts are not adequate.