Embed Size (px)
Citation preview

TECHNICAL R EPOR1 S1 ANDARD TIT L E PAC E
~1.--Re-p-or-tN-o-.------~------~~2~.~G-ov-.-rnm-e-nt-A~c-ce-s--sion-N-o.--~----~3.-R~e-ci-pi-en~t'-s~Ca-ta~lo-g~N~o.------------
FHWA/TX-86/+414-1F (slJnnlpmpnt.)
~--=-~--:-~~~~-foL+L..L..J..Lw..;.a..u.-r...4----------------+-::-:::--~:-----:---.... ,-.............. - ...... _ ... . 4. Title and Sub'i'le • 5. Report Date
Field Evaluation of Geotextiles Under Base Courses January 1986 (Supplement) 6:- Per~forming Organi lotion Cod;- ---.--~
~.-----... -------.---.----.- ... ---.. - _._ .. _-----_. . .------7. Avthor/5) 8. PerformingOrgani lotion Repdt\ N()
Tom Scullion and Eddie Chou Research Report 414-1F (SUDDl ement)
~-----------------~---------------------------~~----____ -4~~~~~ __ ~ 9. Performing Organi zation Name and Address 10. Work Unit No. Texas Transportation Institute The Texas A&MUniversity.System College Station, Texas 77843
11. Contract or Grant No.
. Study No. 2-8-83-414 13. Type o·f Report ond Period Covered
------------------------~ 12. Sponsoring Agency Name and Address
Texas State Department of Highways and Public Transportation; Transportation Planning Division
Final - September 1982 January 1986
14. Sponsoring Agency Code P. O. Box 5051 . Austi n .. Texas 1876~3~_~ ____________ ----L ___________ --I
15. Supplementary Notes Research performed in cooperation with DOT, FHWA. Research Study Title: Fabrics Under Base Courses.
17. Key Words
Geotextiles, Falling Weight Deflectometer 'Dynaflect, Dynamic Cone Penetrometer, Penetrometer, FWD data.
18. Distribution Statement
No restrictions. This document is available to the public through the National Technical Information Service 5285 Port Royal Road Springfield, Virginia 22161
19. Security Ciassif. (of this report) 20. Security Classil. {of thi os page! 21. No. of Pages 22. P ri ce
Unclassified Unclassified 56
Form DOT F 1700.1 (8-69)
--------------~~----~-------.--~------- .

FIELD EVALUATION OF GEOTEXTILES UNDER BASE COURSES
A SUPPLEMENT
by
Tom Scullion
and
Eddie Chou
Research Report 414-1F (Supplement)
R.esea"nch Stl,tdy, Number" 2-1 O~88l:414 Fabrics Under Base Courses
Sponsored by
Texas State Department of Highways and Public Transportation in cooperation with
U. S. Department of Highways, Federal Highway Administration
January 1986
TEXAS TRANSPORTATION INSTITUTE The Texas A&M University System
College Station, Texas

METRIC CONVERSION FACTORS
Symbol
in ft yd mi
01 Ib
up TbsP 'Ioz c pt qt ,II ft' yd'
Approximate Conversions to Motric Measures
When You Know
inches 'Ht V8rds miles
sqUire inch .. square feot Iquare yard, sqUire miles Icr ..
ounces pounds short ton.
(2000Ib)
t ... poons lIblnpoons fluid ounc .. cups pintl quarts pllons cubic 'Ht cubic vards
MUltiply by
LENGTH
-2.5 30
0.9 1.6
AREA
6.5 0.09 0.8 2.6 0.4
MASS (weight)
28 0.45 0.9
VOLUME
5 15 30 0.24 0.47 0.95 3.8 0.03 0.76
To Find
centimeter, centimeter, meters kilometers
Iquare centimeters sqUlr. m,ters square meters squar. kilometers hectlres
grlms kilogrlm. tonnes
milliliters milliliter. milliliters liters liters liter, liters cubic met.rs cubic meters
TEMPERATURE (exect)
Fahrenheit temperltur.
519 (Iftlr subtrlcti", 321
Celsius temperllur.
Symbol
cm cm m km
cm' m' m' km' hi
II kg
ml ml ml I I I I m' m'
co
CD
'"
..
w
• 1 in • 2.54 (nactly). For other ex.ct conversions and more detliled tables, see NBS Misc. Publ. 286, Unitl of Weight. and Me.sures, Price $2.25, SO <:'talog No. C13.10:286.
-
-
-
--
-
-
~.
=-== -
o N
CIt .-
co .-,.. .-co .-
M ... N ...
Symbol
mm cm m m km
cm' rn' km' ha
I kg t
ml I I I m' m'
Approximate Conversions from Metric Measur.s
When You Know
millimeter, centimeters fn8ters m.t .... kilometers
square centimeters square meters square kilometer, hecta'" (10,000 m')
Multiply by
LENGTH
0.04 0.4 3.3 1.1 0.6
AREA
0.16 1.2 0.4 2.5
MASS (weight)
,rims kilograms tonn .. (1000 kg)
millilite" liters lit.rs liters cubic meters cubic meters
0.035 2.2 1.1
VOLUME
0.03 2.1 1.06 0.26
35 1.3
To Find
inch .. inch .. feet yard. mil ..
Iquare inch .. squar. yard. square miles acres
ounc .. pounds short tons
fluid ounces pints quarts ~"on. cubic f .. t cubic yards
TEMPERATURE (exact)
Celsius temperature
9/5 (then add 321
Flhrenh.it 'emper.tur.
OF OF 32 98.6 212
-40LI~'TI'~.~~~,~.~·~4~~+~.~.~8~Prl~f~.1~~~.~,~,1~~~I~,~!,~~O~J r-' If iii i . i i . ,
-40 -20 0 20 40 60 80 100 ~ ~ ~
Symbol
in In ft yd mi
in' yd' mi'
or Ib
fI or pt qt g.1 ft' yd'

ABSTRACT
This report describes a structural evaluation of two thin pavements which had a woven geotextile as a separator between base and subgrade. On both pavements Falling Weight Deflectometer and Dynamic Cone Penetration measurements were made. The FWD test was used to generate a load versus deflection plot for each pavement. The penetrometer indicated the layer strengths and effective base thickness.
The pavement at the District 1 site consisted of a surface treatment and six inches of flexible base course over a poor clay subgrade. Analysis of the FWD deflection data indicated that the section containing the geotextile was statistically stronger than the control section. The cone penetrometer readings indicated that the effective base thickness of the experimental section was almost 1.5 inches thicker than the control section. This implies that, even under this very light traffic loadings, the geotextile has prevented soil intrusion into the base course.
The pavement at the District 21 site consisted of 1.5 inches of Hot Mix, 12 inches of flexible base over a lime stabilized subgrade. In analysing the data from the experimental and control sections no significant differences in performance were found.
It is concluded from this study that geotextiles are cost-effective in stabilizing lightly trafficked thin pavements over difficult subgrade. Further studies are required to determine where and when geotextiles can replace traditional soil stabilization procedures.
( i )

IMPLEMENTATION STATEMENT
The results in this report indicate that geotextiles can be cost effective as separators in thin pavements over difficult subgrades. Under the action of construction equipment and normal traffic, soil from the subgrade can intrude into the base course markedly reducing its strength. The placement of a permeable fabric between the base and subgrade can help maintain design thicknesses. In 1984 prices these geotextiles cost between $0.60 and $0.80 per square yard.
DISCLAIMER
This report is not intended to constitute a standard, specification, or regulation, and does not necessarily represent the views or policy of the FHWA or Texas Department of Highways and Public Transportation.
( i i )

TABLE OF CONTENTS
1. INTRODUCTION................................................ 1 2. EVALUATION PROCEDURE........................................ 2
2.1 Introduction.......................................... 2 2.2 Falling Weight Deflectometer.......................... 2 2.3 Dynaflect............................................. 3 2.4 Cone Penetrometer..................................... 3 2.5 Analysis Procedure.................................... 10
3. RESULTS FROM SH186 IN DISTRICT 21........................... 12 3.1 Site Description...................................... 12 3.2 Summary of Results.................................... 12
4. RESULTS FROM RR3 IN DISTRICT 1.............................. 17 4.1 Site Description...................................... 17 4.2 Summary of Results.................................... 17 4.3 Conclusions........................................... 22
5. CONCLUSIONS AND RECOMMENDATIONS............................. 22
APPENDICES ••••••••••••••••••••••••••••••••••••••••••••••••••••• A. Detailed Field Results From SH186 in District 21 •••••••••• B. Detailed Field Results From RR3 in District 1 •••••••••••••
( iii)

1. INTRODUCTION
As described in Research Report 414-1, "Testing Procedures, Specifications, and Applications for Geofabrics in Highway Pavements" (1), the Texas Department of Highways and Public Transportation, as of August 1984, had nine projects in which geofabrics had been used on an experimental basis. Several of these projects used geomembranes (impermeable geofabrics) as vertical moisture barriers at the pavements edge to minimize moisture movements into expansive clay subgrades. These moisture barriers have reportedly (2) reduced pavement roughness and increased life between overlays.
In other applications, a geotextile (permeable geofabric) had been placed between base and subgrade to act as a separator and possible reinforcing member. The mechanisms of separation and reinforcement are discussed in (1). In this project, investigations were made on two experimental sections which had a geotextile between subgrade and base course. Both projects were built and initially monitored by SDHPT personnel. The goal of this investigation was to use the Department's Falling Weight Deflectometer and Cone Penetrometer to determine what effect, if any, the geotextile is having on the pavement structure. The testing procedures are described in Section 2 of this report.
The two projects are located on SH186 in District 21 near Port Mansfield and on Recreational Road 3 in District 1 near Bonham. Site descriptions and a summary of results are presented in Sections 3 and 4. Detailed test results are given in the Appendices.
Neither project exhibited any significant visual distress at the time of testing.
1

2 EVALUATION PROCEDURE
2.1 Introduction
In this chapter, the equipment used to structurally evaluate the experimental sites will be described. These are the Falling Weight Deflectometer (FWD), the Dynaflect, and the Cone Penetrometer. The testing procedure used at the Bonham site was as follows:
1) Twenty test locations were marked in the experimental and control sections. These being at 100 ft intervals in the outer wheel path.
2) Dynaflect readings were taken at all 20 test locations.
3) At each location Falling Weight Deflectometer reading were taken using four different drop weights, corresponding to loadings of 4500, 9000, 12000 and 15000 lbs.
4) From the FWD deflection results a strong, intermediate and weak location was selected in both the experimental and control section.
5. At these six locations the Dynamic Cone Penetrometer was driven through the pavement layers to a total depth of approximately 24 inches. The penetrometer was used to obtain an indication of the effective base thickness and relative layer strengths.
Note, the Dynaflect was not available at the SH186 site and only the Falling Weight Deflectometer and Dynamic Cone Penetrometer were used.
The Falling Weight Deflectometer, Dynaflect and Dynamic Cone Penetrometer are described in the following sections.
2.2 Falling Weight Deflectometer
The Deflectometer used in this project was the Department~s Dynatest 8002 FWD (3) and its microcomputer which recorded and interpreted the measured loads and deflections. The FWD itself is a light-weight trailer mounted unit, as can be seen in Figure 1.
The FWD can deliver an impulse load of 1500 lbs to 24,000 lbs to a pavement. The impulse is essentially a half sine curve with a duration of 25 to 30 milliseconds. The load is transmitted to the pavement through a 12 in. diameter loading plate which rests on a thick rubber pad which is in contact with the pavement surface. In principle, the force applied to the pavement is dependent on the mass of the drop-weights used, the height of the drop, and the spring constants of the rubber pad as well as that of the overall pavement. In practice, however, only the mass of the drop-weights and/or the height of drop is varied. The actual load relayed to the pavement is measured by the load cell located just above the loading plate.
2

The deflection basin is obtained by monitoring the deflections at seven locations on the pavement surface using velocity transducers. One of these is located in an opening in the center of the loading plate.
In the tests, the height of drop and weight were adjusted to produce four different load levels - 4500 lbs, 9000 lbs, 12,000 lbs, and 15,000 lbs with the exact magnitude being registered by the load cell.
The deflections sensors were commonly spaced at one foot intervals. A typical set of deflection basins observed at the four different load levels is shown in Figure 2.
2.3 Dynaflect
The Dynaflect (4) is currently the most commonly used NOT device in the United-States for the purpose of pavement evaluation and design (5). This equipment is a dynamic force generator mounted on a covered trailer, as can be seen in Figure 3. The cyclic force is produced by a pair of counter-rotating unbalanced flywheels and this force oscillates in a sine-wave fashion with an amplitude of 500 lbs at a cycle frequency of 8 cycles per second. This force, together with the dead weight of the trailer which is about 1600 lbs, is transmitted to the ground via two steel wheels placed 20 in. apart. The peak-to-peak deflections are measured by five geophones placed at 1 ft intervals with the first directly between the wheels. A typical deflection basin obtained is shown in Figure 4.
2.4 Dynamic Cone Penetrometer
The Dynamic Cone Penetrometer (DCP) (6) consists of a steel rod with a 60 0 cone of tempered steel at one end. A sliding hammer of about 17.6 lbs falling over a height of 22.6 in. provided the consistent impact load required to penetrate the pavement. The penetration given as inches per blow gives an indication of the stiffnesses of the pavement layers. This instrument was found to be useful in comparing the stiffnesses of the base courses and subgrades encountered in this study. Figure 5 shows the DCP.
Figure 6 shows the typical results obtained from a DCP test. When passing through a base course, the penetration per blow is fairly constant. Once the subgrade is entered, the penetration per blow increases considerably. As shown in Figure 6, in this study the OCP was used to determine the effective base thickness on both the geotextile and control section. The aim being to determine if the geotextile was acting as a separator between base and subgrade. On weak subgrades clays often penetrate into the base course, reducing base thickness and overall pavement strength.
3
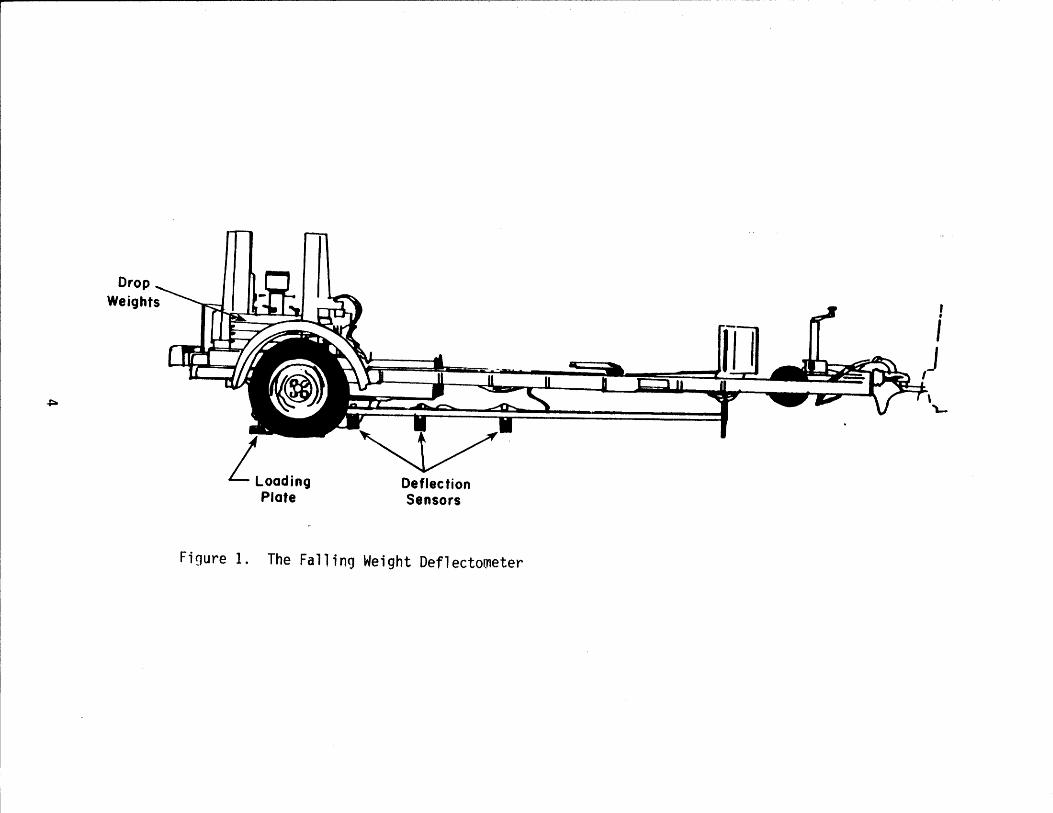
Drop Weights
fLOOding Plate
Deflection Sensors
Figure 1. The Falling Weight Deflectometer
I
i ,J \ "\....

12 in. Diameter Load
#1 ~ #2 ftt+ #3 #4 #5 #6 #7 o
10
en 20
i 30
~40 -~50 ;:
~60 70
80
. -----:-.'-== ~.: .=..:":" ~. -:-:-...:.. .--. _.-~--- - - -- - - ---~. ~.~
",.-- ~ ;.;-"
~.~ :::....-V .0:
L"" ~ .' '/ /. /
/' L /
/
o 12 24 36 48 60 72
Distance From Center of Load (ins.)
_.- 4.5 kips _ .. - 9.0kips ------12.0kips ---- 15.0 kips • Deflection Sensor
Figure 2. Typical deflectlQn basin from the Falling Weil9ht Deflectometer.
5

Figure 3. The Dynaflect
6

V)
-oJ -2:
z 0 -~ u UJ -oJ I.&-UJ Q
1 kip load aDeflection Sensor ~1 #2 #3 #4 #5
o l
1.0
2.0 o
Figure 4.
.411~ ..... <III •
~ /'
/ /' -
..
FMSO 12.2
1.0 2.0 3.0 4.0
DISTANCE FROM CENTER OF LOAD (FEET)
Typical Deflection Basin - Dynaflect
7

E E
It) rt)
at
tl
I---HANDLE
--HAMMER (8kg)
THE CONE
O-Iflno--RODS SCREW TOGETHER
'-fff---- UPPER SPRING CL IP
111--- 16 mm , STEE L ROO
EI---+H--- MEASURING ROO WITH ADJUSTABLE SCALE
llI--lIUo-_ LOWER SPRING CLIP
'---CONE
Figure 5. The Dynamic Cone Penetrometer (6)
8

Number of Blows
o 20 40 60 80 100 Surface Course
5
Effective Bose --- -Thickness
- 10 en c:
~ -Co CD 0
c: 15 0 - SubQrade 0 ~
+-CD C CD fl. 20
25
30 ~----~~----~~----~~----~------~
Figure 6. Determining Effective Base Thickness with the Core Penetrometer.
9

The advantage of the DCP is that it is an inexpensive method of determining effective layer thickness and relative layer stiffness. Its disadvantage is that it is labor-intensive and slow.
2.5 Analysis Procedure
One aim of this testing is to determine if the Falling Weight Deflectometer, by applying gradually increasing loads, can determine if the geotextile is having any significant effect on the pavement structure. To accomplish this, the following steps were performed.
Step 1. The FWD data was plotted on a load versus deflection graph as shown in Figure 7.
80 CI)
e 60 c: 0 -u 40 CD ....
CD 0
20
FWD Load (kips)
Figure 7. Typical FWD Load Versus Deflection
[For simplicity, a straight line was fitted through the available data pOints. In some cases the load versus deflection plot appears to be curved. Whether this is a true material response or a measurement problem is unclear. The curved load versus deflection plots are associated with pavements exhibiting high deflections, i.e., where the 15,000 lbs load caused a deflection of over 100 mils. However, the maximum range of the geophones used with the FWD was 80 mils. In general, when pavements had deflections less than 80 mils, a straight-line best represented the load versus deflection data.]
Step 2. Using the least squares line through the available data for each section calculate the following parameters: 1. The deflection at an FWD load of 4500 lbs 2. The deflection at an FWD load of 9000 lbs 3. The deflection at an FWD load of 12,000 lbs 4. The deflection at an FWD load of 14,000 lbs 5. The slope of the load versus deflection line in lbs/mil.
10
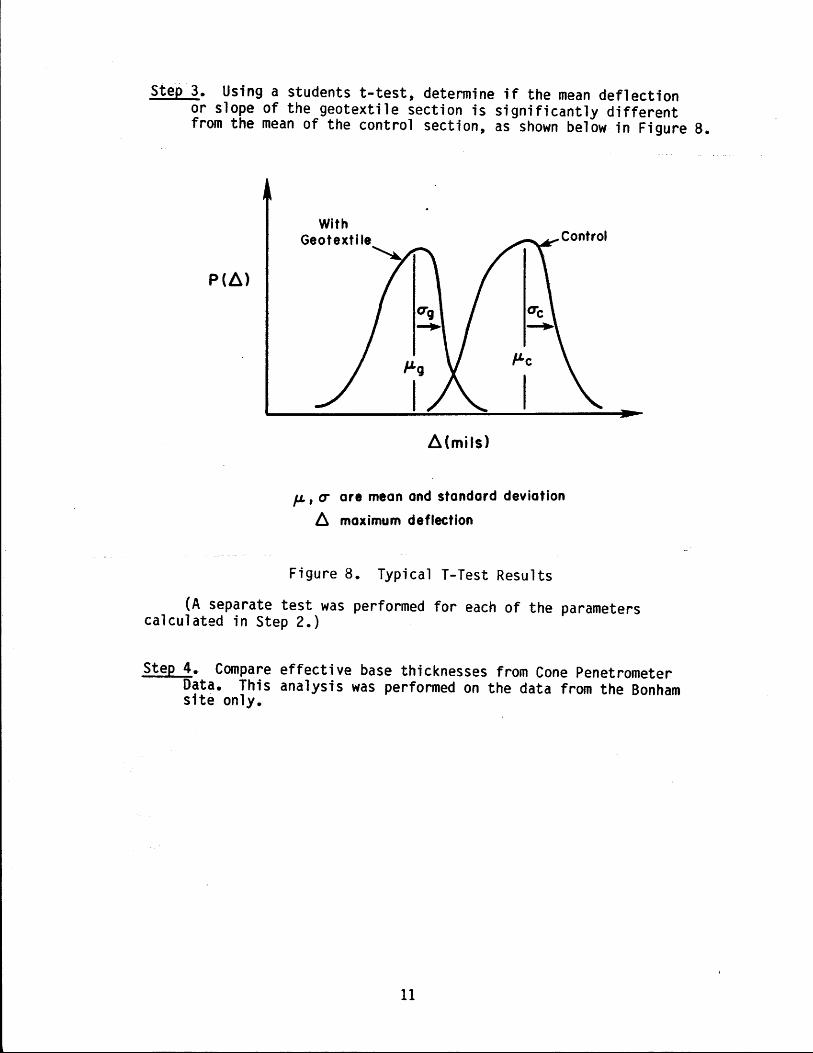
Step 3. Using a students t-test, determine if the mean deflection or slope of the geotextile section is significantly different from the mean of the control section, as shown below in Figure 8.
p(6)
With Geotextile
6(mils)
}L, (j are mean and standard deviation
l:l maximum deflection
Figure 8. Typical T-Test Results
(A separate test was performed for each of the parameters calculated in Step 2.)
Step 4. Compare effective base thicknesses from Cone Penetrometer Data. This analysis was performed on the data from the Bonham site only.
11

3 RESULTS FROM SH186 IN DISTRICT 21
3.1 Site Description
A section of SH186 near Port Mansfield, Texas, was reconstructed shortly after Hurricane Allan hit South Texas in early 1981. The section of highway was built on very poor subgrade soil, had a high water table, and was prone to flooding at high tide.
In rebuilding, the subgrade was stabilized with lime, a Mirafi geotextile (500X) was placed over the subgrade in the west bound lane, and 12 inches of granular base was added. In the eastbound lane no geotextile was used and the base thickness was reduced to 8 inches. Approximately one and a half inches of hot mix asphaltic concrete was placed as a surfacing. The as built section is shown in Figure 9.
At several locations, the geotextile was placed under the shoulder and two feet of the west bound travel lane. At other locations, the geotextile extended over the entire westbound lane. The purpose of the narrow geotextile sections was to determine if the geotextile could be used to prevent edge failures. These sections were not evaluated in this structural survey. Instead, a section was chosen in which the geotextile covered the entire travel lane.
The test procedure was as follows:
a) A Falling Weight Deflectograph survey was made at 24 test points in the outer wheel path of the geotextile section. The test locations were marked with paint, they were 100 feet apart. Four drop heights corresponding to approximately 4500 lbs, 9000 lbs, 13,000 lbs, and 15,000 lbs, were used.
b) The FWD testing was repeated at the 24 test locations in the adjacent east bound direction (no geotextile).
c) Based on the FWD data, weak, strong, and intermediate test points were selected in the experimental and control sections. At these six locations, a Dynamic Cone Penetrometer test was made.
At the time of conducting this survey, no visual distress was apparent in either the experimental or control section. The detailed field results from this survey are shown in Appendix A.
3.2 Summary of Results
The analysis of the data collected on this section is complicated by the fact that the geotextile section had twelve inches of base course whereas the control only had eight inches.
The statistical analysis procedure described in a previous
12

Geotextile
a' Shoulder
Approx. 12" Flexible Base
Prop. Approx. a" Lime Treat. Subgr. (Comp. Thick.)
241 Pavement
121
I t
121
81
Shoulder
Approx. 1.5 II A.C. P.
Approx. a" FI~xible 8ase
Figure 9. Experimental Geotextile Section on SH186 in District 21

section was performed on the FWD data. For each test point the deflections corresponding to exactly 4000, 9000, 13,000, and 15,000 lbs and the slope of the load versus deflection graph were computed. A IIT-test ll was performed to determine if the distribution of deflection data was different between the experimental and control sections. The results of this analysis are shown in Table 1.
Table 1. T-Test Results From SH186 Test Site
Mean FWD Sensor 1 Deflection (mils)
FWD Load Statistical (lbs) Geotextile Control P-value Significance
4500 22.3 28.3 0.001 Yes 9000 41.5 49.3 0.006 Yes
13,000 53.7 62.5 0.002 Yes 15,000 58.1 66.6 0.006 Yes
Slope (lbs/mil) 295.0 272.0 0.20 No
[Note: The P-value is a statistical parameter used to evaluate if two mean values U1 and U2 belong to the same distribution, at the 95% significance level, if p < 0.05 conclude that the means are different; if p > 0.05 conclude no difference in means.]
At each of the 4 load levels, the geotextile section had significantly lower deflections than the control section. This is to be expected as it also had four inches of additional base course, and both had identical subgrade stabilization. The slopes of the load versus deflection curves were similar, the experimental requiring 295 lbs to cause one mil of deflection as opposed to 272 lbs in the control. These results indicate that the geotextile is having little effect on strengthening the pavement structure.
To assist with the analysis of the deflection data the Corp. of Engineers CHEVOEF (7) moduli back calculation program was used. This program calls a standard linear elastic program as a subroutine, iterations are performed to minimize the percentage error between the measured and computed deflection bowls. The bowls measured under the 9,000 lbs loading and the as built layer thicknesses were input into CHEVDEF. The measured versus computed deflection bowls and the corresponding layer moduli are shown below in Tables 2 and 3 respectively.
14

Table 2. Measured vs. Predicted Deflections
Distance Geotextile Section Cont ro 1 Section from
Center of Load Deflections (Mils) Deflection (Mils
(i ns) Measured Computed Measured Comp
0 41.5 42.4 49.3 41 12 16.4 15.9 17.0 15 24 8.1 8.5 7.0 7 48 4.0 4.2 3.5 3 72 2.4 2.7 2.1 2
Table 3 Computed Elastic Moduli (psi)
Base Subgrade
Geotextile
20,200 12,100
I.
Control
21,100 13,300
) uted
.9
.4
.7
.7
.4
For the purpose of the analysis the modulus of the 1.5 asphalt layer was fixed at 200,000 psi. The decision to fix the asphalt stiffness is because a) both sections have identical surfacings b) both are in good condition and c) the deflections were measured on the same day at the same temperature. As can be seen from the back calculated moduli values there is little difference between the layer moduli in the experimental and control section.
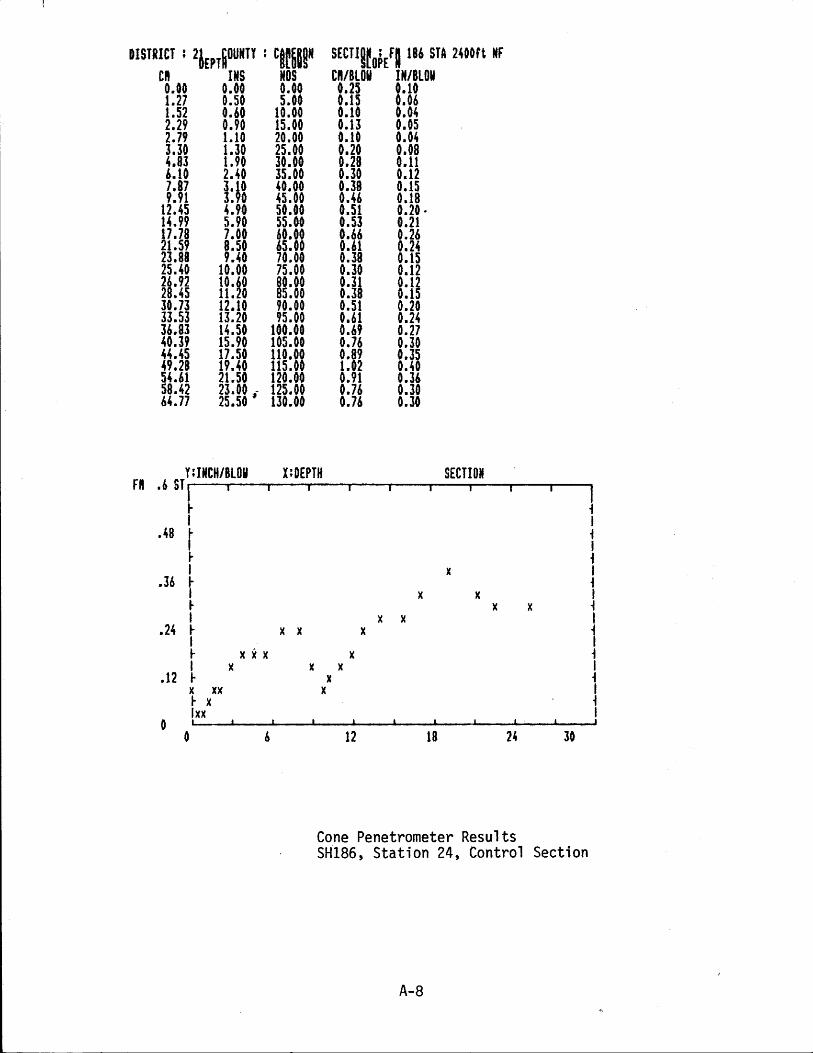
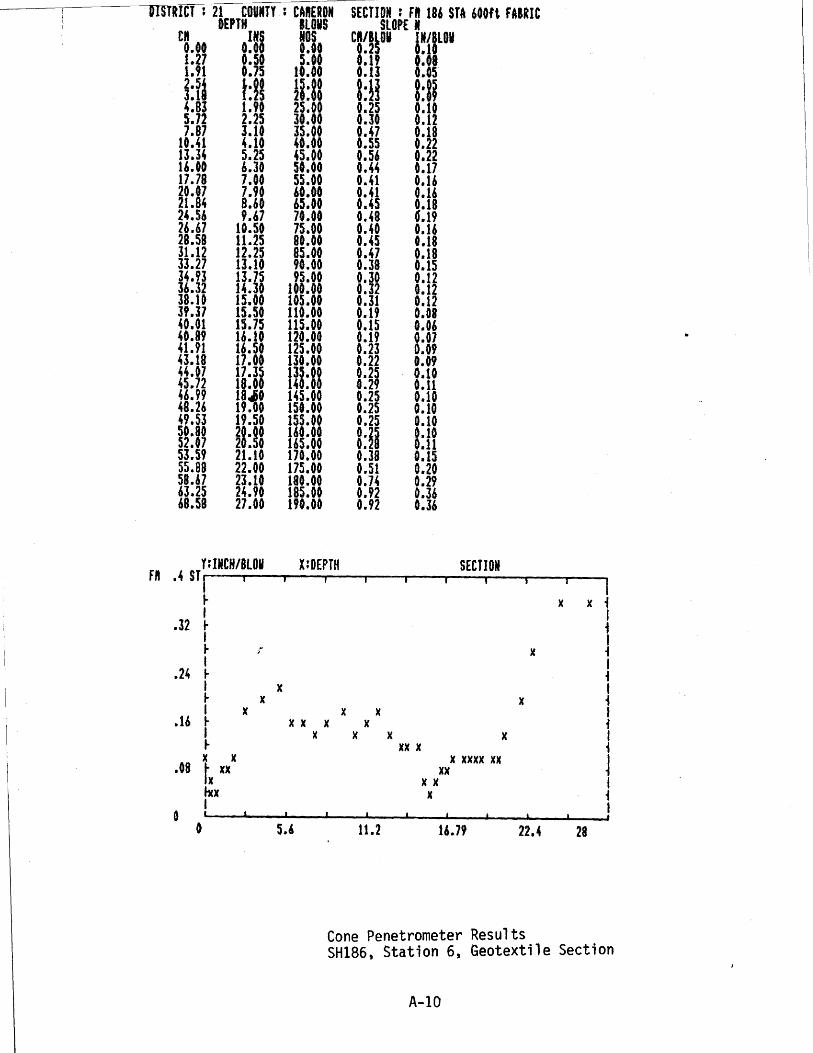
The cone penetrometer data taken on this section is shown graphically in Appendix A. The results of this testing are difficult to interpret. For instance, consider the results obtained at Station 1 in the Geotextile and Control Section, pages A6 and A9 At this location the geotextile is in the westbound lane and the control is in the eastbound. The control section penetrometer results, page A-6, show clear design thicknesses, a stabilized layer starting at approximately 8 inches below the surface and extending to approximately 14 inches, after which the untreated subgrade is entered. The penetrometer results on the section containing the geotextile (page A-9) do not show any distinct layer thicknesses.
15

It appears on this section that a weak layer is entered at approximately 6 inches below the surface, no lime stabilized layer was found. However, at station 6 (geotextile section on page A-10) very distinct layer thicknesses were observed, the stabilized layer appears to occur between 13 and 19 inches from surface (under a 12 inch base and thin surface). Because of the variability of layer thicknesses and layer strengths, little can be inferred from the cone results about the effect the geotextile is having on the pavement structure.
16

4 RESULTS FROM RR3 IN DISTRICT 1
4.1 Site Description
Recreational Road 3 is a lightly trafficked two-lane highway near Bonham in District 1. It had become excessively rough primarily due to movements of the expansive subgrade. Several sections of the road had PSI values of less than 1.0. The original pavement structure corsisted of a surface treatment, six inches of flexible base on top of an untreated subgrade.
In September 1983, the base course was bladed off, and the subgrade leveled and recompacted. A geotextile (Mirafi 500X) was placed on the subgrade and the base course was replaced followed by a surface treatment. As shown in Figure 10 the experimental site was 1250 ft long, and a similar length control section was built with a 250 ft transition zone between them. The pavement structure is shown in Figure 11.
In July 1985, this experimental site was evaluated with a Dynaflect, Falling Weight Deflectometer, and Cone Penetrometer survey. The location of the test points are shown in Figure 10, all were in the outer wheel path. The test procedure was as follows.
a. A Dynaf1ect survey was made at all 40 test points. b. A FWD survey was made immediately after the Dynaf1ect
testing was complete. Four drop heights corresponding to approximately 4500 lbs, 9000 lbs, 12,000 lbs, and 14,000 lbs were used.
c. Based on FWD data, select a weak, strong, and intermediate test point in both the geotextile and control section. At these six test locations conduct a Cone Penetrometer Test.
At the time of testing, no significant visual distress was apparent in either the experimental or control section.
The detailed field results from this survey are shown in Appendix B.
4.2 Summary of Results
The statistical analysis procedure described in an earlier section, was performed on the FWD data. For each test point the deflections corresponding to exactly 4500, 9000, 12,000, and 14,000 lbs and the slope of the load versus deflection graph were computed. A "T-Test" was performed to determine if the distributions were different between the experimental and control sections. The results of this analysis are shown in Table 4 below.
At each of the four load levels the geotextile section had a statistically lower deflection than the control section. This indicates that the section with the geotexti1e is stronger than the control section. Furthermore, the slope of the load versus deflection curve was larger in the experimental section (129 lbs load for each
17

...... eo
RECREATIONAL ROAD 3
J • • • •
Geotextile Section
• • •
Control Section
Left Lane
_J_--~.~:.~.~.~~~.~.~.~®=.:~=.==.:::J~::~~==.===.==.==·~.~~.~.~_. __ . __ . __ -t __ RightLane - .~_-1250' ., 250' 1 ...... 1------1250· --___ ~
t-l"-+ N ¢
d ~
• ®
Transition r- Zone N r-+ r-10 + 10 r-<i. 10
..... <t 00 t-oo
indicates location of FWD and Dynaflect test point indicate cone penetrometer data taken at these test points
Not to Scal,
Figure 10. Testing locations at Bonham Test Site
I() C\I
o "e:::[ ICI)

3' 20· Pav.m.nt 3'
~ ...... -.....- Surface Treatment
Untreated Subgrade
6 tI Flexible Bose
Figure 11. Experimental Geotextile Section on Recreational Road 3 in District 1.
19

Table 4. T-Test Results From Bonham Test Site
! I
Mean FWD Sensor 1 I Deflection (mils)
FWD Load Statistical (1 bs) Geotextile Control P-value Significance
4500 26.6 34.3 0.0137 Yes 9000 63.2 85.3 0.0021 Yes
12,000 87.3 110.2 0.0018 Yes 14,000 97.7 113.9 0.0086 Yes
Slope (lbs/mm) 129.7 102.0 0.0017 Yes
mil of deflection) than in the control (102 lbs load for each mil of deflection).
Layer moduli were back calculated for the Bonham pavement using the CHEVDEF program discussed earlier. In this analysis a) the deflections at 9000 lbs were used, b) the pavement was modelled as a two layer system of base and subgrade and c) the effective base thickness as measured by the cone penetrometer was used. The measured versus computed deflection bowls and the corresponding layer moduli are shown below in Tables 5 and 6 respectively.
Table 5 Measured vs. Predicted Deflections for Bonham Test Site
Distance Geotextile Section Control Section from
center of Load Deflection (mils) Deflection (mils)
(ins) Measured Computed Measured Computed
0 63.2 64.3 85.3 89.1 7.5 39.6 37.0 54.4 54.0 12 26.1 24.2 35.5 35.0 24 10.6 11.5 12.7 16.2 48 4.3 5.6 7.1 7.9
20

Table 6 Computed Elastic Moduli (psi)
Geotextile Control
Base 22,900 25,900 Subgrade 8,970 6,200
The base courses have similar moduli values, however the moduli of the subgrade in the section containing the geotextile is noticeably stiffer than the subgrade in the control section.
The Cone Penetrometer data taken on this section is shown graphically in Appendix B. The effective base thickness was defined as the depth at which a significant increase in cone penetration was recorded, the interpolated effective thicknesses are tabulated below.
Table 7. Effective Base Thickness Values From Bonham Test Site
Geotextile Control Section Section
6.5 ins. 4.5 ins. 5.8 ins. 4.3 ins. 5.2 ins. 4.3 ins.
The average effective base thickness in the geotextile section was 5.8 ins., whereas the thickness of the control section was only 4.4 ins. As both sections were rebuilt with a nominal 6 in. base thickness, this would indicate that in the two years of trafficking, soil intrusion into the base course has reduced its effective thickness by 1.4 ins. When the reduction in base thickness occurred is not clear. It may have been a result of the construction process or it may have been a gradual reduction under traffic, or a combination of both. It is significant that this is a very lightly trafficked highway with very little truck traffic.
To determine the rate of base loss with time it will be necessary to repeat the Cone Penetrometer test after another performance period (i.e., 2 years). If after that period the thickness of the control section remains constant at 4.3 ins., then it could be assumed that the construction process was the cause of the loss in base thickness. If further base losses are recorded after the additional performance period it should at that point be possible to estimate the effects of traffic and construction procedures on the design base thickness.
21

4.3 Conclusion
The analysis of the FWD readings indicated that the section with the geotextile separator was stronger than the control section. This strength is primarily attributed to the fact that in the experimental section the base design thickness had been maintained at approximately 6 ins. However, in the control section the effective base thickness was almost 1.5 ins. less than in the experimental section. It has been assumed that both sections started with the same base thickness at reconstruction in September 1983 and that either the construction procedure or traffic loads have caused soil intrusion into the base course of the unprotected section. Further work is recommended to validate these conclusions.
5. Conclusions and Recommendations
The following are concluded from this study.
1. The geotextile is having little observable affect on the performance of the section on SH186.
2. The geotexti1e at the Bonham test site does appear to be significantly improving pavement performance. It was found that the pavement containing the geotexti1e had maintained its effective base thickness of almost 6 inches, whereas the control section had lost almost 1.5 inches presumably to soil intrusion.
3. At the Bonham site the section with the geotextile also had significantly lower deflection than the control section. However this conclusion is based on the results of one deflection survey taken two years after reconstruction. No other deflection data is available at this site. There is a need to continue to monitor this site.
4. It appears from these observations that the most cost effective use of geotextiles would be in strengthening surface treated pavements with "wet" spots. The geotextile could be used to bridge short sections of difficult subgrade.
5. Further studies should be undertaken to determine if geotextiles are more cost effective than the traditional soil stabilization methods.
22

REFERENCES
1. Scullion, T., Lux, S. M., and Holland, C. N., IITesting Procedures, Specifications, and Applications for Geofabrics in Highway Pavements,1I TTl Research Report 414-1, September 1984.
2. Steinberg, M. L., IIDeep Vertical Fabric Moisture Barriers in Swelling Soi1s,1I Transportation Research Record 790, Transportation Research Board, Washington, D.C., 1981, pp. 87-94.
3. Dynatest 8000 FWD Test System, Dynatest Consulting, Inc., P.O. Box 71, Ojai, California 93023.
4. Scrivner, F. H. and Moore, W. M., IIAn Electro-Mechanical System for Measuring the Dynamic Deflection of a Road Surface Caused by an Oscillating Load,1I TTl Research Report 32-4, December 1964.
5. Scrivner, F. H., Moore, W. M., McFarland, W. F., and Carey, G. H., IIA Systems Approach to the Flexible Pavement Design Problem," TTl Research Report 32-11, October 1968.
6. K1ien, E. G., Maree, J. H., and Savage, P. F., liThe Application of a Portable Pavement Dynamic Cone Penetrometer to Determine In Situ Bearing Properties of Road Pavement Layers and Subgrades in South Africa," Proceedings, 2nd European Symposium on Penetration Testing, Amsterdam, 24-27, May 1982, pp. 277-283.
7. Bush, A. J., IINondestructive Testing for Light Aircraft Pavements, Phase II, Development of the Nondestructive Evaluation Methodologyll U.S. Army Engineer Waterways Experiment Station, Report No. FAA-RD-80-9-II, August 1980.
23

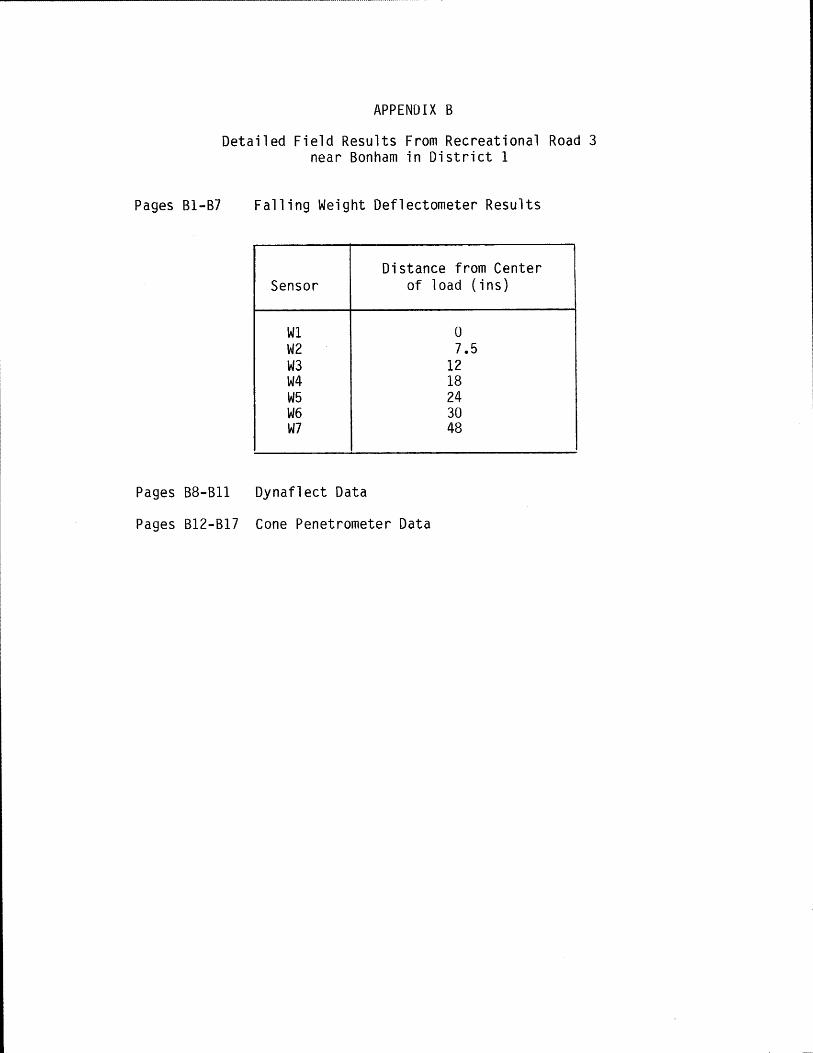
APPENDIX A
Detailed Field Results From SH186 Near Port Mansfield in District 21
Pages AI-A5 Falling Weight Deflectometer Results
Distance from Center Sensor of load (ins)
WI 0 W2 12 W3 24 W4 36 W5 48 W6 60 W7 72
Westbound lane - With Geotextile Eastbound lane - No Geotextile
Pages A6-All Cone Penetrometer Results
24

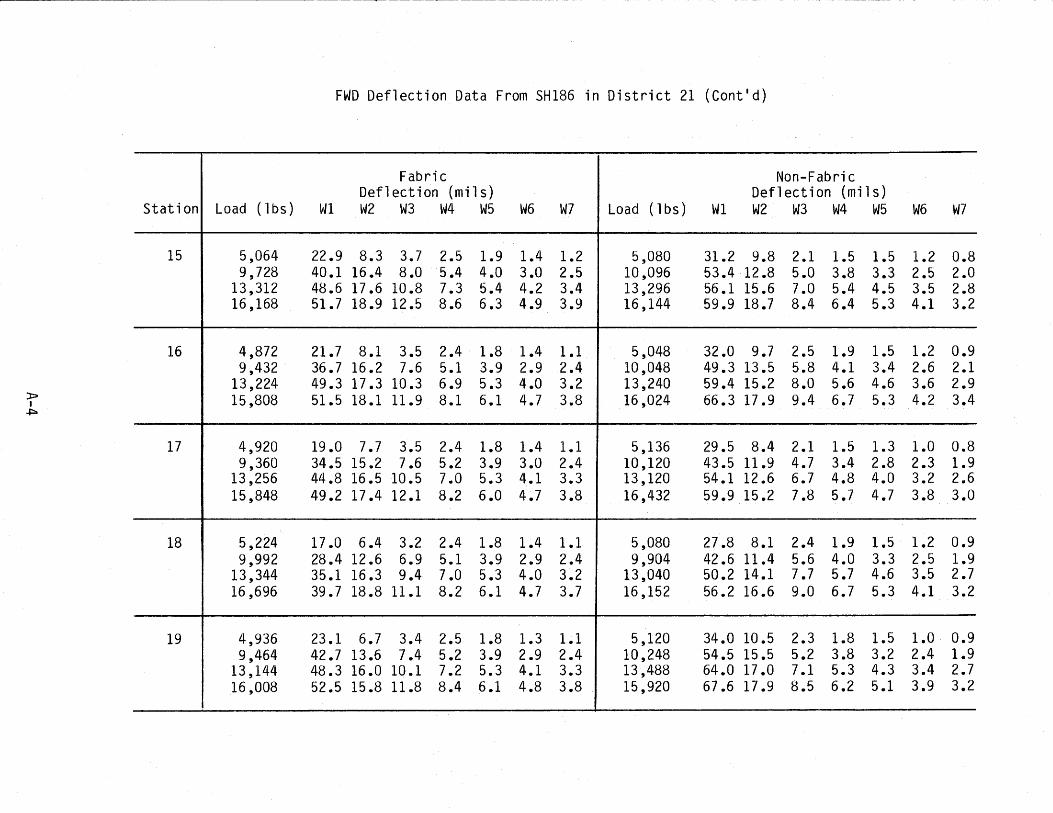
FWD Deflection Data From SH186 in District 21
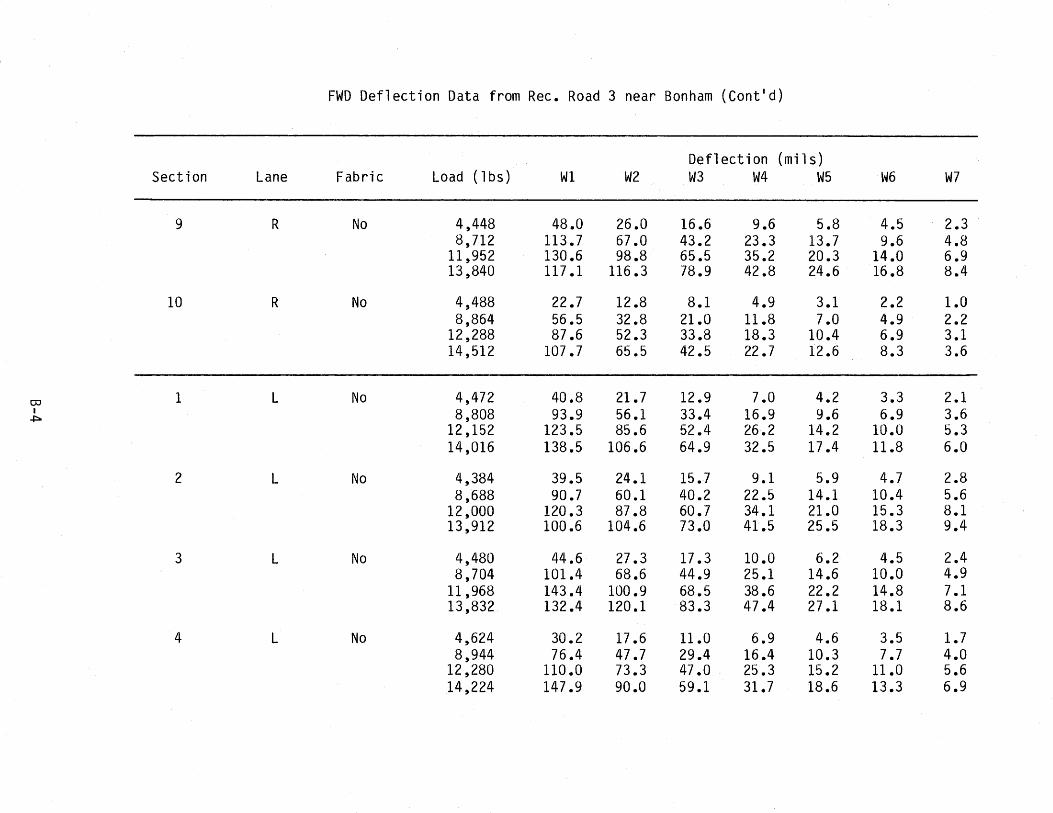
F abri c Non-Fabric Deflection (mils) Deflection (mils)
Station Load (lbs) W1 W2 W3 W4 W5 W6 W7 Load (lbs) W1 W2 W3 W4 W5 W6 W7
0 5,056 29.8 12.6 5.0 3.4 2.4 1.6 1.4 4,560 38.1 12.3 3.8 2.3 1.7 1.3 1.0 9,912 54.6 23.9 11.0 6.8 4.9 3.6 2.9 9,312 67.8 24.0 7.8 4.9 3.7 3.0 2.4
13,704 66.1 31.1 14.8 9.2 6.6 5.0 3.8 13,064 78.5 27.7 10.6 6.5 5.1 4.1 3.4 15,768 75.9 33.1 17.1 10.7 7.7 5.7 4.5 14,968 88.7 31.3 12.4 7.6 5.9 4.7 4.0
1 5,032 30.3 11.0 4.3 2.6 1.9 1.4 1.2 4,552 38.3 14.0 4.4 2.4 1.7 1.2 1.0 9,880 53.8 21.7 9.4 5.8 4.2 3.2 2.5 9,376 65.6 28.1 9.0 5.0 3.7 2.8 2.4
13,600 72.2 28.4 12.6 7.8 5.7 4.3 3.4 13,160 81.6 36.0 12.0 6.7 5.1 4.1 3.3 15,784 68.4 28.9 14.7 9.1 6.6 5.0 4.0 15,136 98.3 36.1 13.9 7.8 6.0 4.7 3.9
2 4,752 30.6 12.2 4.3 2.6 1.7 1.2 1.0 4,600 23.6 9.7 3.0 1.9 1.5 1.2 1.0 9,544 56.7 24.3 9.7 5.6 3.8 3.0 2.4 9,224 41.8 18.4 6.7 4.4 3.4 2.6 2.2
13,464 74.0 33.3 13.4 7.8 5.3 4.1 3.4 13,128 53.8 23.7 9.3 6.1 4.7 3.8 3.1 15,472 82.5 34.1 15.7 9.1 6.3 4.9 4.0 15,376 62.3 22.6 11.0 7.1 5.5 4.3 3.5
3 4,896 22.8 8.2 3.6 2.4 1.8 1.4 1.1 4,568 29.4 12.8 3.8 2.1 1.7 1.4 1.0 9,488 56.2 17.4 8.2 5.2 3.7 2.8 2.3 9,352 56.5 24.3 8.3 4.8 3.8 3.0 2.4
13,552 52.1 22.6 11.3 7.2 5.2 3.9 3.2 13,176 62.5 29.5 11.4 6.7 5.2 4.0 3.2 15,712 63.4 22.6 13.1 8.4 6.1 4.6 3.7 . . . . . . .
4 4,976 18.9 6.9 3.5 2.4 1.9 1.4 1.1 4,520 34.1 12.9 3.5 2.0 1.6 1.0 1.0 9,464 36.3 15.5 8.0 5.3 3.9 3.0 2.4 9,312 58.5 24.7 7.7 4.6 3.7 2.8 2.4
13,544 42.2 20.9 11.2 7.4 5.5 4.1 3.4 13,160 85.1 32.6 10.8 6.5 5.1 4.0 3.4 15,984 52.7 19.0 13.2 8.7 6.4 4.8 3.8 15,120 88.5 31.2 12.8 7.7 6.0 4.7 4.0

» I
N
Station
5
6
7
8
9
Load (lbs)
4,984 9,472
13,400 15,960
4,904 9,640
13,472 15,480
4,984 9,640
13,536 15,616
5,072 9,848
13,440 15,728
4,832 9,592
13,520 15,512
FWD Deflection Data From SH186 in District 21 (Cont'd)
Fabric Non-Fabric Deflection (mils) Deflection (mils)
WI W2 W3 W4 W5 W6 W7 Load (lbs) WI W2 W3 W4 W5
24.2 8.6 4.3 3.1 2.2 1.5 1.1 4,544 26.6 11.6 4.4 2.6 1.9 43.3 17.3 9.9 7.0 4.9 3.4 2.4 9,240 49.9 24.0 9.9 5.9 4.2 55.4 23.2 13.8 9.5 6.8 4.7 3.4 13,040 58.7 32.2 13.8 8.2 5.9 57.7 26.7 16.1 11.2 7.9 5.4 4.0 15,312 67.8 34.9 16.4 9.6 6.9
32.4 12.7 4.7 3.0 2.0 1.6 1.2 4,576 30.8 11.4 4.0 2.4 1.6 59.0 24.2 10.1 6.3 4.5 3.4 2.7 9,304 57.9 23.2 9.0 5.2 3.7 66.2 28.8 13.7 8.6 6.3 4.7 3.8 13,104 76.4 27.9 12.2 7.1 5.1 77.7 29.4 15.9 10.0 7.1 5.5 4.4 15,048 79.7 29.4 14.5 8.4 5.9
21.9 8.9 4.2 2.7 1.9 1.6 1.2 4,760 27.4 11.9 3.7 2.2 1.7 40.7 17.6 9.0 5.7 4.2 3.2 2.6 9,392 49.5 18.3 7.5 4.6 3.7 51.0 22.8 12.1 7.8 5.7 4.4 3.5 13,096 65.2 21.1 10.1 6.4 5.1 58.9 23.2 14.0 9.0 6.6 5.1 4.1 15,520 68.4 23.5 11.7 7.3 6.0
29.4 10.8 4.6 3.0 2.1 1.6 1.3 4,728 28.3 12.1 3.7 2.2 1.7 52.1 20.5 9.8 6.3 4.6 3.5 2.8 9,288 50.4 22.2 8.0 4.4 3.5 88.2 20.2 12.8 8.7 6.2 4.8 3.8 13,152 58.1 22.4 10.6 6.1 4.8 65.3 23.0 14.8 10.0 7.2 5.5 4.3 15,288 64.7 24.5 12.4 7.2 5.6
27.2 10.9 4.8 3.0 2.1 1.5 1.3 4,608 35.4 14.0 4.4 2.3 1.8 48.2 19.4 10.3 6.6 4.4 3.4 2.8 9,376 59.2 26.3 8.9 4.9 3.7 64.0 23.1 13.9 8.9 6.2 4.6 3.8 13,192 70.2 32.7 12.4 6.9 5.1 73.7 24.9 16.0 10.2 7.1 5.3 4.3 15,168 79.9 34.1 14.6 9.1 6.0
W6 W7
1.4 1.1 3.3 2.6 4.7 3.6 5.4 4.1
1.2 1.0 2.8 2.2 3.9 3.1 4.5 3.6
1.2 1.0 2.8 2.2 4.0 3.2 4.7 3.7
1.3 1.0 2.7 2.2 3.8 3.0 4.4 3.5
1.3 1.1 2.9 2.3 4.0 3.2 4.8 3.8

)::0 I
W
Station
10
11
12
13
14
Load (lbs)
4,896 9,432
13,464 15,912
4,872 9,440
13,304 15,664
4,960 9,752
13,368 15,872
5,136 10,208 13,368 16,088
5,024 9,624
13,328 16,176
FWD Deflection Data From SH186 in District 21 (Cont'd)
F abri c Non-Fabric Deflection (mils) Deflection (mils)
WI W2 W3 W4 W5 W6 W7 Load (lbs) WI W2 W3 W4 W5
20.4 9.3 4.5 2.9 2.1 1.6 1.3 4,736 33.1 12.4 4.4 3.0 2.2 35.8 18.8 9.7 6.4 4.6 3.4 2.7 9,408 56.3 21.1 9.9 6.4 4.7 44.1 21.2 13.4 8.9 6.3 4.7 3.7 13,072 69.4 26.0 13.8 8.9 6.4 48.7 23.1 15.5 10.2 7.3 5.5 4.3 15,104 78.6 27.6 16.1 10.4 7.5
28.1 11.6 4.6 2.8 2.2 1.5 1.3 4,792 26.1 10.8 4.1 3.0 2.2 48.4 23.2 10.1 6.4 4.6 3.5 2.7 9,552 46.0 21.4 8.9 6.3 4.8 60.2 28.6 13.9 9.0 6.4 4.9 3.8 13,176 56.5 23.5 12.6 8.9 6.6 71.8 28.3 16.2 10.4 7.5 5.6 4.4 15,440 62.8 23.6 14.8 10.4 7.7
27.4 10.2 4.4 2.9 2.2 1.6 1.2 4,832 25.7 11.2 3.8 2.5 1.9 47.0 17.1 9.6 6.5 4.7 3.5 2.6 9,528 45.2 17.1 8.3 5.4 4.1 61.7 20.6 13.0 8.8 6.5 4.7 3.6 13,240 54.5 20.0 11.5 7.6 5.7 68.5 22.1 15.2 10.3 7.5 5.4 4.3 15,432 60.3 23.0 13.3 8.9 6.6
23.4 8.9 3.9 2.7 2.0 1.5 1.2 4,912 25.2 6.8 2.9 2.1 1.6 39.9 13.7 8.5 5.6 4.2 3.1 2.5 9,584 39.7 13.7 6.2 4.6 3.5 45.8 16.4 11.2 7.7 5.7 4.3 3.4 13,040 47.7 15.6 8.5 6.3 4.9 54.3 17.8 13.0 8.9 6.6 5.0 4.0 15,976 55.6 15.0 10.0 7.3 5.6
22.1 8.2 3.7 2.7 2.0 1.5 1.2 4,912 23.8 8.9 3.1 2.1 1.6 37.1 12.7 7.8 5.8 4.4 3.2 2.5 9,664 40.6 17.2 6.7 4.4 3.3 48.3 15.0 10.7 7.9 6.0 4.5 3.4 13,104 56.1 16.3 9.1 6.0 4.6 58.3 16.8 12.5 9.2 7.0 5.1 4.0 15,920 60.5 17.8 10.8 7.0 5.4
W6 W7
1.6 1.2 3.6 2.8 4.9 3.9 5.7 4.5
1.6 1.2 3.6 2.8 5.0 3.9 5.8 4.5
1.4 1.1 3.1 2.5 4.3 3.5 5.1 4.1
1.2 1.0 2.7 2.2 3.8 3.1 4.4 3.6
1.2 1.0 2.6 2.1 3.6 2.9 4.1 3.6
FWD Deflection Data From SH186 in District 21 (Cont'd)
Fabric Non-Fabric Deflection (mils) Deflection (mils)
Station Load (lbs) WI W2 W3 W4 W5 W6 W7 Load (lbs) WI W2 W3 W4 W5 W6 W7
15 5,064 22.9 8.3 3.7 2.5 1.9 1.4 1.2 5,080 31.2 9.8 2.1 1.5 1.5 1.2 0.8 9,728 40.1 16.4 8.0 5.4 4.0 3.0 2.5 10,096 53.4 12.8 5.0 3.8 3.3 2.5 2.0
13,312 48.6 17.6 10.8 7.3 5.4 4.2 3.4 13,296 56.1 15.6 7.0 5.4 4.5 3.5 2.8 16,168 51.7 18.9 12.5 8.6 6.3 4.9 3.9 16,144 59.9 18.7 8.4 6.4 5.3 4.1 3.2
16 4,872 21.7 8.1 3.5 2.4 1.8 1.4 1.1 5,048 32.0 9.7 2.5 1.9 1.5 1.2 0.9 9,432 36.7 16.2 7.6 5.1 3.9 2.9 2.4 10,048 49.3 13.5 5.8 4.1 3.4 2.6 2.1
13,224 49.3 17.3 10.3 6.9 5.3 4.0 3.2 13,240 59.4 15.2 8.0 5.6 4.6 3.6 2.9 15,808 51.5 18.1 11.9 8.1 6.1 4.7 3.8 16,024 66.3 17.9 9.4 6.7 5.3 4.2 3.4
17 4,920 19.0 7.7 3.5 2.4 1.8 1.4 1.1 5,136 29.5 8.4 2.1 1.5 1.3 1.0 0.8 9,360 34.5 15.2 7.6 5.2 3.9 3.0 2.4 10,120 43.5 11.9 4.7 3.4 2.8 2.3 1.9
13,256 44.8 16.5 10.5 7.0 5.3 4.1 3.3 13,120 54.1 12.6 6.7 4.8 4.0 3.2 2.6 15,848 49.2 17.4 12.1 8.2 6.0 4.7 3.8 16,432 59.9 15.2 7.8 5.7 4.7 3.8 3.0
18 5,224 17.0 6.4 3.2 2.4 1.8 1.4 1.1 5,080 27.8 8.1 2.4 1.9 1.5 1.2 0.9 9,992 28.4 12.6 6.9 5.1 3.9 2.9 2.4 9,904 42.6 11.4 5.6 4.0 3.3 2.5 1.9
13,344 35.1 16.3 9.4 7.0 5.3 4.0 3.2 13,040 50.2 14.1 7.7 5.7 4.6 3.5 2.7 16,696 39.7 18.8 11.1 8.2 6.1 4.7 3.7 16,152 56.2 16.6 9.0 6.7 5.3 4.1 3.2
19 4,936 23.1 6.7 3.4 2.5 1.8 1.3 1.1 5,120 34.0 10.5 2.3 1.8 1.5 1.0 0.9 9,464 42.7 13.6 7.4 5.2 3.9 2.9 2.4 10,248 54.5 15.5 5.2 3.8 3.2 2.4 1.9
13,144 48.3 16.0 10.1 7.2 5.3 4.1 3.3 13,488 64.0 17.0 7.1 5.3 4.3 3.4 2.7 16,008 52.5 15.8 11.8 8.4 6.1 4.8 3.8 15,920 67.6 17.9 8.5 6.2 5.1 3.9 3.2

DISTRICT : 21 COUITY: CAIERON DEPTH BLOYS
eft INS NOS 0.00 0.00 0.00 1.27 o.so 5.00 1.52 0.'0 10.00 2.79 1.10 15.00 3.94 1.55 20.00 6.35 2.50 2S.00 9.14 3.60 30.00
1&.51 6.50 35.00 19.81 7.80 40.00 21.84 8.60 45.00 23.88 9.40 50.00 26.67 10.50 55.00 29.21 11.50 60.00 31.75 12.50 65.00 34.04 ll.40 70.00 36.20 14.25 75.00 38.74 15.25 80.00 42.67 16.80 85.00 47.50 18.70 90.00 52.71 20.75 95.00 60.96 24.00 100.00 73.03 28.75 105.00
Y:I1CH/BLOU X:DEPTH .7 I i
~ I
.56 ~ I ~ I
.42 ~ x t x ~ f
.27 ~ I ~
SECTION : FIIS6 STA 100 IF SLOPE •
Cft/BlDU IN/BlOU 0.25 0.10 0.15 0.06 0.15 0.06 0.24 0.10 0.l6 0.14 0.52 0.20 1.02 0.40 1.07 0.42. 0.53 0.21 0.41 0.1& 0.48 0.19 0.53 0.21 0.51 0.20 0.48 0.19 0.45 0.18 0.47 0.19 0.65 0.25 O.BB 0.34 1.35 o. 1.00 O.il 1.65 o. 1.65 0.65
SECTION Fftl86 STA 100 IF i i i i
x x ~
~ x I
i I i
x I of
x J i
x I i I x x x x x x x x I .13 t x x i I x x i Ix I 0 I , , , ,
0 6 12 18 24 30
Cone Penetrometer Results SH186, Station 1, Control Section
A-6
):::a I
c..n
,
Station
20
21
22
23
24
Load (lbs)
4,760 9,344
13,232 15,536
4,736 9,368
13,216 15,336
4,672 9,408
13,160 15,616
4,872 9,408
13,248 15,992
4,808 9,560
13,192 15,296
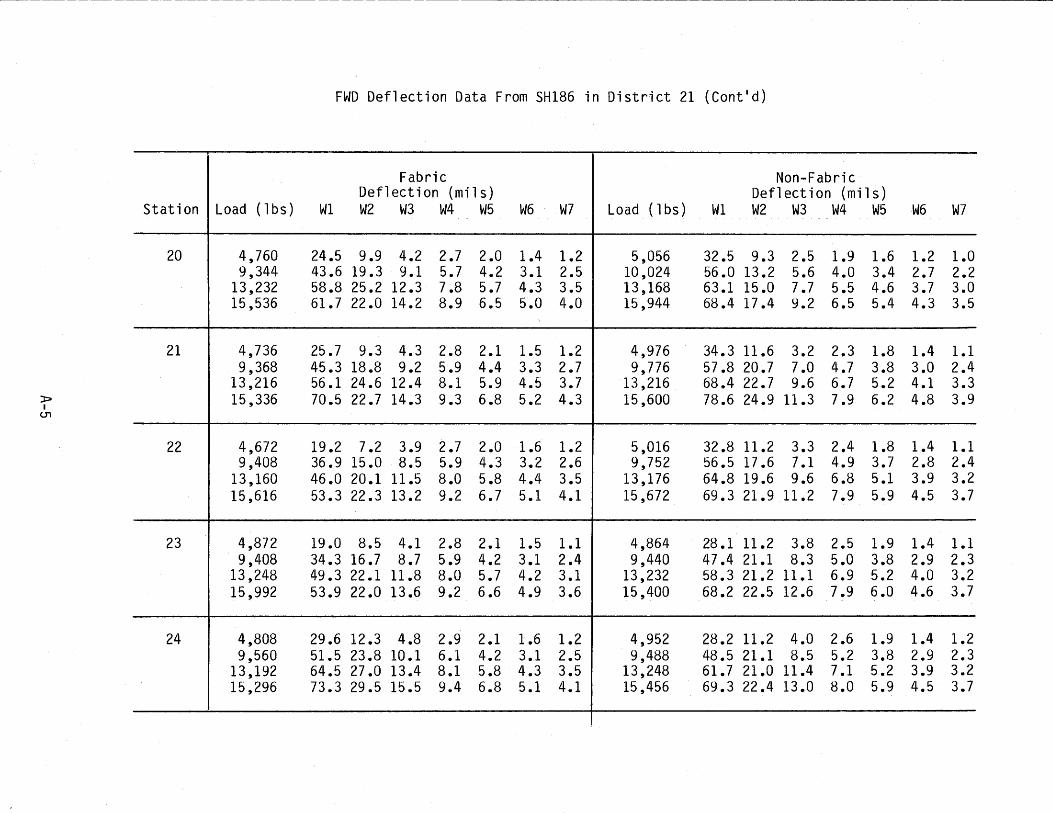
FWD Deflection Data From SH186 in District 21 (Cont'd)
Fabric Non-Fabric Deflection (mils) Deflection (mils)
WI W2 W3 W4 W5 W6 W7 Load (lbs) WI W2 W3 W4 W5 W6 W7
24.5 9.9 4.2 2.7 2.0 1.4 1.2 5,056 32.5 9.3 2.5 1.9 1.6 1.2 1.0 43.6 19.3 9.1 5.7 4.2 3.1 2.5 10,024 56.0 13.2 5.6 4.0 3.4 2.7 2.2 58.8 25.2 12.3 7.8 5.7 4.3 3.5 13,168 63.1 15.0 7.7 5.5 4.6 3.7 3.0 61.7 22.0 14.2 8.9 6.5 5.0 4.0 15,944 68.4 17.4 9.2 6.5 5.4 4.3 3.5
25.7 9.3 4.3 2.8 2.1 1.5 1.2 4,976 34.3 11.6 3.2 2.3 1.8 1.4 1.1 45.3 18.8 9.2 5.9 4.4 3.3 2.7 9,776 57.8 20.7 7.0 4.7 3.8 3.0 2.4 56.1 24.6 12.4 8.1 5.9 4.5 3.7 13,216 68.4 22.7 9.6 6.7 5.2 4.1 3.3 70.5 22.7 14.3 9.3 6.8 5.2 4.3 15,600 78.6 24.9 11.3 7.9 6.2 4.8 3.9
19.2 7.2 3.9 2.7 2.0 1.6 1.2 5,016 32.8 11.2 3.3 2.4 1.8 1.4 1.1 36.9 15.0 8.5 5.9 4.3 3.2 2.6 9,752 56.5 17.6 7.1 4.9 3.7 2.8 2.4 46.0 20.1 11.5 8.0 5.8 4.4 3.5 13,176 64.8 19.6 9.6 6.8 5.1 3.9 3.2 53.3 22.3 13.2 9.2 6.7 5.1 4.1 15,672 69.3 21.9 11.2 7.9 5.9 4.5 3.7
19.0 8.5 4.1 2.8 2.1 1.5 1.1 4,864 28.1 11.2 3.8 2.5 1.9 1.4 1.1 34.3 16.7 8.7 5.9 4.2 3.1 2.4 9,440 47.4 21.1 8.3 5.0 3.8 2.9 2.3 49.3 22.1 11.8 8.0 5.7 4.2 3.1 13,232 58.3 21.2 11.1 6.9 5.2 4.0 3.2 53.9 22.0 13.6 9.2 6.6 4.9 3.6 15,400 68.2 22.5 12.6 7.9 6.0 4.6 3.7
29.6 12.3 4.8 2.9 2.1 1.6 1.2 4,952 28.2 11.2 4.0 2.6 1.9 1.4 1.2 51.5 23.8 10.1 6.1 4.2 3.1 2.5 9,488 48.5 21.1 8.5 5.2 3.8 2.9 2.3 64.5 27.0 13.4 8.1 5.8 4.3 3.5 13,248 61.7 21.0 11.4 7.1 5.2 3.9 3.2 73.3 29.5 15.5 9.4 6.8 5.1 4.1 15,456 69.3 22.4 13.0 8.0 5.9 4.5 3.7
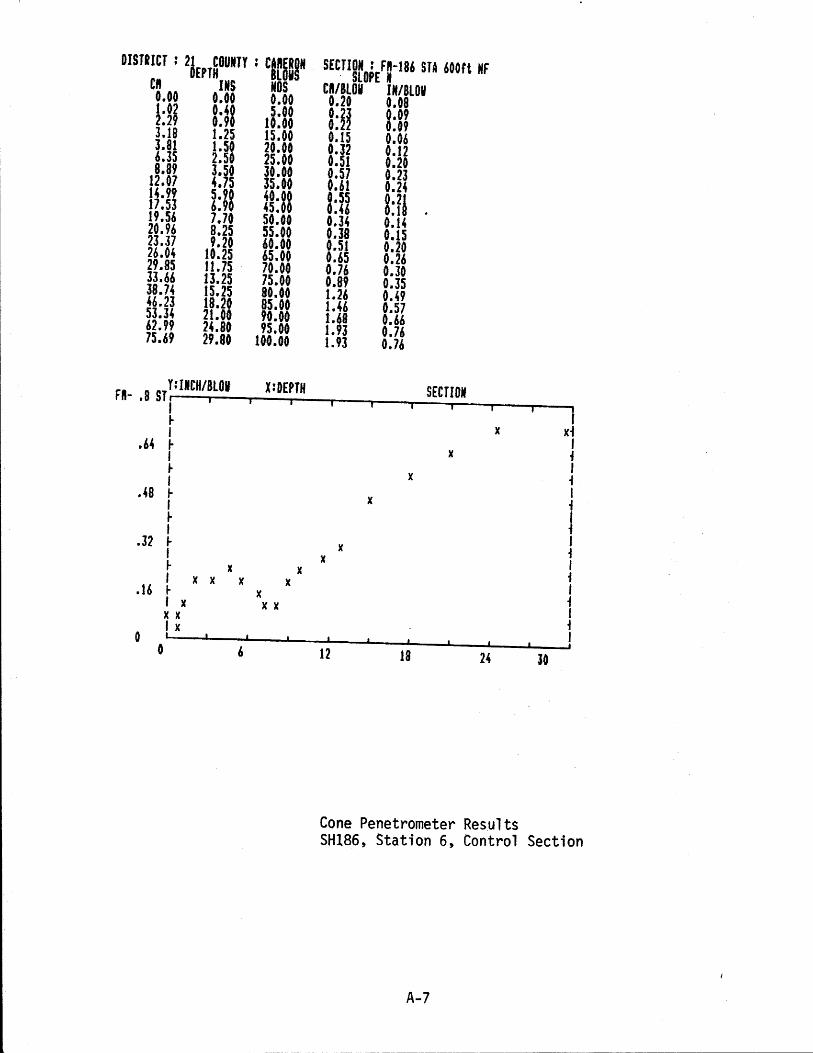
DISTRICT : 21 COUNTY: Ctft~R~N SECTION : Fft-1B& STA 600ft NF DEPTH L U . SLOPE. CII INS NOS CI/BLOU IN/BLOW 0.00 0.00 0.00 0.20 0.08 ~.02 O.4~ 5.00 0.23 0.09 .29 0.9 10.00 0.22 0.09 3.18 1.25 15.00 O.lS 0.06 3.81 1.50 20.00 0.32 0.12 6.35 2.50 25.00 0.51 0.20 8.89 3.50 30.00 0.57 0.23 12.07 4.75 35.00 0.61 0.24 14.99 5.9~ 40.~0 ~:~i ~:U 17.53 &.9 45. 0
19.5& 7.70 50.00 0.34 0.14 20.9& 8.25 55.00 0.38 O.lS 23.17 9.20 60.00 0.51 0.20 26.04 10.25 65.00 0.65 0.2& 29.85 11.75 . 70.00 0.76 0.30 33.66 13.25 75.00 0.89 0.35 38.74 15.25 80.00 1.26 0.49 46.23 IB.20 85.00 1.46 0.57 53.14 21.00 90.00 1.68 0.66 62.99 24.80 95.00 1.93 0.76 75.69 29.80 100.00 1.93 0.7&
Y: IICH/BLOt X:DEPTH SECTION Fft- .8 STi t i
I I ~ I x xi
I .&4 l- x ., I I ~ x ., I I .;8 ~ x ., r
~ , I i
J .32 t x i I x I t x x i , x l( x x , .1& t x i , x x x J x x i I x I 0 I , I 0 6 12 18 24 30
Cone Penetrometer Results SH186, Station 6, Control Section
A-7
DISTRICT : 2'EPT~OUNTT : Ctr'IIN eft INS NOS 0.00 0.00 0.00 1.27 0.50 5.00 1.52 0.60 10.00 2.29 0.90 15.00 2.79 1.10 20.00 3.30 1.30 25.00 4.83 1.90 30.00 6.10 2.40 35.00 7.87 3.10 40.00 9.91 3.90 45.00
12.45 4.90 50.00 14.99 5.90 55.00 17.18 7.00 60.00 21.59 8.S0 65.00 23.88 9.40 70.00 25.40 10.00 75.00 26.92 10.60 80.00 28.45 11.20 85.00 JO.73 12.10 90.00 33.53 13.20 95.00 36.83 14.50 100.00 40.39 15.90 105.00 44.45 17.50 110.00 49.28 19.40 115.00 54.61 21.50 120.00 58.42 23.00, 125.00 64.77 25.50 130.00
SECTI~rO~EFD 186 STA 2400ft NF Cft/BlOW IN/BLOW 0.25 0.10 0.15 0.06 0.10 0.04 0.13 0.05 0.10 0.04 0.20 0.08 0.28 0.11 0.30 0.12 0.38 0.15 0.46 0.18 0.51 0.20· 0.53 0.21 0.66 0.26 0.61 0.24 0.38 0.15 0.30 0.12 0.31 0.12 0.38 0.15 0.51 0.20 0.61 0.24 0.6' 0.27 0.76 0.30 0.89 0.35 1.02 0.40 0.91 0.3& 0.76 0.30 0.76 O.lO
nINCH/BlOW X:DEPTH SECTION fft .6 STI i i
~ I
.48 t ~ I x
.36 ~ I x x ~ x x I x x
.24 ~ x x x I ~ x x x x I x x x
.12 ~ x x xx x ~ x Ixx
0 , , '
0 & 12 18 24 lO
Cone Penetrometer Results SHIs6, Station 24, Control Section
A-a
1 I i I i I ~ I ~ I i I i I i I i I ,

, OIST,ltT 121 COUlry: CAlERO. SECTIOI : Fit 186 STA 100ft FABRIC t' . DEPTI 8~OUS SLOPE • It, liS.., N S CR/llOY II/BlOY 0.00 0.00 '" 0.00 0.20 0.08 l:~~ 0.40 i·OO 0.13 ,.05 0.50 1 .00 0.06 .02 1.&5 0.65 15.00 0.06 ~:~l 1.91 0.15 lOO 0.09 i:~' l:'~ i :8' ~:11 ~:il 1.56 1.40 35.00 O.ll o.os 4.45 1.15 40.00 0.20 o.oa 5.59 2.20 45.00 0.22 0.0' 6.65 2.62 50.00 O.ll 0.12 . 8.&4 3.40 5i·00 0.40 0.16 10.67 4.20 6 .00 0.41 0.1& 12.70 5.00 6i· OO 0.41 ~:!8 14.73 5.80 7 .00 0.51 17.78 7.00 75.00 0.94 0.37 24.tl 9.50 80.00 1.59 0.63 33.6& 13.25 85.00 2.41 0.95 48.26 19.00 90.00 2.92 1.15 55.88 22.00 95.00 2.92 1.15
f:IMeH/llOI I:OE'TH SEeTIO. fit 1.2 T , i
i i i
1 ~ ~ x x I
I .96 ~ of t
x I l-i I , .72 ~
of I , ,.
x 1
, .;8 l-
f ,
I fa x ., , , .24 l-i I x , ~ )( )( )( x ., )( xx I 0 "'xxx I
, , 0 4.8 9.600001 14.4 19.2 24 ;
Cone Penetrometer Results. . SH186, Station ~, Geotextlle Sectlon
A-9
fft
STRICT : 21 COUNTY' CARERON DEPTH IlOIS
eft 0.00 1.27 1.91 2.54 l.18 4.B3 5.72 7.87
10.41 13.34 U.OO 17.78 20.07 21.B4 24.56 26.61 28.58 31.12 33.27 34.93 36.32 38.10 39.37 40.01 40.89 41.91 43.18 44.07 45.72 46.99 48.2& 49.53 50.80 52.07 53.59 55.88 58.67 '1.25 68.58
INS NOS 0.00 0.00 0.50 5.00 0.75 10.00
t:~! }i:~~ 1. 90 25.00 2.25 30.00 3.10 35.00 4.10 40.00 5.25 45.00 6.30 50.00 7.00 55.00 7.90 60.00 8.60 65.00 9.'7 10.00
10.50 75.00 11.25 80.00 12.25 85.00 13.10 90.00 13.75 95.00 14.30 100.00 15.00 105.00 15.50 110.00 15.75 115.00 16.10 120.00 16.50 125.00 17.00 130.00 17.35 135.00 18.00 140.00 IS .. 0 145.00 19.10 150.00 19.50 155.00 20.00 140.00 20.50 1&5.00 21.10 170.00 22.00 175.00 23.10 180.00 24.90 185.00 21.00 190.00
Y:INCH/BlOU X:DEPTH .4 STI
~ , .32 ~ ,
l- t I
.24 l-t x ~ x I x
.16 ~ x x x I x f-x x
.08 tx xx bx I
0 «
0 S.,
x
SECTION : Fft 186 Sf A 600ft FABRIC SLOPE •
CR/8LOU IN/BLOY 0.25 0.10 0.19 0.08 O.ll 0.05
I:~i ~:Ii 0.25 0.10 0.30 0.12 0.47 0.18 0.55 0.22 0.56 0.22 0.44 0.17 0.41 0.1' 0.41 0.1& 0.45 0.18 0.48 6.19 0.40 0.16 0.45 0.18 0.47 0.18 0.38 0.15 0.30 0.12 0.12 0.12 0.31 0.12 0.19 0.08 0.15 0.06 0.19 0.01 0.23 0.09 0.22 0.09 0.25 0.10 0.29 0.11 0.25 0.10 0.25 0.10 0.25 0.10 0.25 0.10 0.28 0.11 0.38 0.15 0.51 0.20 0.74 0.29 0.92 0.16 0.92 0.36
SECTION
X
x x
x x x x
xx x x xxxx xx
xx x x x
11.2 U.79 22.4
Cone Penetrometer Results
I x x i ,
i I ~ I i t i I ~ I i t i I i I I
28
SH186, Station 6, Geotextile Section
A-IO

DISTRICT : 21 COUNTY: CAIEROIt
Fit
Cit t:~, 1.52 2.54 2.79 3.81 5.08 6.35 7.87
10.16 12.70 14.48 16.76 19.05 21.59 24.38
~i:~l 31.75 34.29 37.34 40.64 42.67 45.72 50.29 55.88 63.75
DEPTW BLOIS INS NOS
I:~I !:I' 0.60 10.00 1.00 15.00 1.10 20.00 1.50 25.00 2.00 30.00 2.50 35.00 3.10 40.00 4.00 45.00 5.00 50.00 5.70 55.00 6.60 60.00 7.50 65.00 8.50 70.00 9.60 75.00
10.40 80.00 11.40 85.00 12.50 90.00 13.50 95.00 14.70 100.00 16.00 105.00 16.80 110.00 18.J0 115.00 19"'0 120.00 22.00 125.00 25.10 1l0.00
Y:INCH/BLOW X:DEPTH .5 ST,
~ I
.4 ~ I l-I
.3 ~ I
t r .19 l- x , x )( )( x x
l- x x x I
9.000x01Exx2 J x hex Ixx
0 I
0 &
SECTION ; Fit 186 STA 2400tt FABRIC SLOPE It
Cft/B~OW IN/BLOY 0.2 0.10 0.1 0.06 0.13 0.05 0.13 0.05 0.13 0.05 0.23 0.09 0.25 0.10 0.28 0.11 0.38 t.15 0.48 0.19 0.43 0.17 0.41 0.16 0.46 0 .. 18 0.48 0.19 0.53 0.21 0.48 0.19 I:~~ ~:U 0.53 0.21 0.56 0.22 0.64 0.25 0.53 0.21 0.51 0.20 0.76 O.lO 1.02 0.40 1.12 0.44 1.12 0.44
SECTION
x x x
)(
)(
)( x x x x
12 18 24
Cone Penetrometer Results
I r i I i I i , ~ I
1 f i I i I ~ I ,
30
SH186, Station 24, Geotextile Section
A-II
APPENDIX B
Detailed Field Results From Recreational Road 3 near Bonham in District 1
Pages BI-B7 Falling Weight Deflectometer Results
Distance from Center Sensor of load (ins)
WI 0 W2 7.5 W3 12 W4 18 W5 24 W6 30 W7 48
Pages B8-B11 Dynaflect Data
Pages B12-B17 Cone Penetrometer Data

FWD Deflection Data from Rec. Road 3 near Bonham
Deflection (mils) Section Lane F abri c Load (lbs) WI W2 W3 W4 W5 W6 W7
1 R Yes 4,560 20.5 12.1 8.5 5.3 3.7 2.9 1.7 8,952 42.5 26.3 19.0 12.5 8.3 6.5 4.1
12,440 58.3 36.8 26.9 18.0 12.1 9.4 5.6 14,656 74.2 44.0 32.1 21.5 14.4 11.3 6.7
2 R Yes 4,552 23.9 15.4 11.6 8.3 5.4 4.5 2.2 9,120 50.3 34.4 26.4 18.6 12.6 9.8 4.8
12,488 66.6 49.8 38.9 27.4 18.8 14.4 7.1 14,920 75.4 60.1 46.3 32.6 22.3 17.1 8.2
3 R Yes 4,672 26.5 15.5 11.2 7.5 4.9 4.3 2.4 OJ 9,192 58.8 37.4 27.3 18.2 12.2 9.4 5.1 I ~ 12,640 83.3 55.3 41.1 27.4 18.3 14.1 7.5
14,776 98.3 66.0 49.4 32.9 22.1 16.9 8.8
4 R Yes 4,624 23.4 14.1 10.1 6.3 3.6 2.9 1.6 9,256 57.6 35.7 25.2 15.0 8.9 6.1 2.8
12,664 82.1 54.1 38.6 22.8 13.1 8.9 4.2 14,816 97.6 65.9 47.6 27.9 16.1 10.6 4.7
5 R Yes 4,792 16.4 9.6 6.7 4.3 2.6 2.1 1.2 9,152 35.7 21.2 14.8 9.5 5.8 4.3 2.2
12,648 51.7 30.7 21.5 13.8 8.4 6.2 3.0 14,968 73.1 38.8 26.0 16.5 9.9 7.3 3.6
-
6 R Yes 4,528 25.5 17.7 12.5 8.0 4.6 3.5 1.9 9,064 59.7 42.5 30.2 18.9 11.1 7.8 4.0
12,344 85.7 62.7 45.0 28.2 16.6 11.5 5.7 14,720 100.8 74.9 54.4 34.1 20.1 14.0 6.9

FWD Deflection Data from Rec. Road 3 near Bonham (Cont'd)
Deflection (mi 1 s) Section Lane Fabric Load (lbs) WI W2 W3 W4 W5 W6 W7
7 R Yes 4,536 25.6 16.0 11.1 7.2 4.7 3.7 2.5 9,048 62.3 39.5 27.2 16.9 10.8 8.3 4.6
12,488 91.4 59.6 41.4 25.5 16.2 12.1 6.6 14,568 108.7 71.8 50.3 31.0 19.6 14.7 8.0
8 R Yes 4,536 35.9 21.1 14.5 9.1 5.7 4.3 2.1 8,880 81.2 51.2 35.8 21.9 13.6 9.6 4.1
12,224 114.1 76.1 54.2 33.2 20.6 14.3 6.1 14,224 116.7 91.5 66.0 40.5 25.1 17.2 7.2
9 R Yes 4,480 33.3 19.2 13.1 8.0 5.1 4.0 2.0 OJ I 8,832 80.2 49.1 33.6 19.9 12.3 8.7 3.9
N 12,144 114.8 73.7 51.5 30.5 18.5 12.9 5.7 14,160 130.5 88.6 62.7 37.3 22.6 15.5 6.7
10 R Yes 4,576 22.4 14.5 10.4 6.7 4.3 3.3 1.8 8,864 51.2 32.9 24.0 15.3 9.8 7.3 3.6
12,304 78.4 49.1 35.7 22.7 14.5 10.7 5.2 14,568 96.3 60.7 43.6 27.9 17.6 13.0 6.2
1 R No 4,832 20.9 12.7 8.3 5.4 3.9 3.1 1.8 8,864 51.2 30.7 20.0 12.7 8.7 7.2 3.9
12,408 76.3 46.4 30.6 19.1 13.0 10.4 5.6 14,392 93.6 56.6 37.8 23.2 15.7 12.7 6.8
2 R No 4,440 24.2 12.3 8.3 5.3 3.3 2.7 1.5 8,896 61.2 ~2.4 20.8 12.0 7.4 5.9 3.2
12,312 94.8 51.1 33.1 17.6 10.6 8.0 4.5 14,464 112.8 64.0 41.8 21.6 12.7 9.5 5.4

FWD Deflection Data from Rec. Road 3 near Bonham (Cont1d)
Deflection (mils) Section Lane Fabric Load (lbs) WI W2 W3 W4 W5 W6 W7
3 R No 4,464 28.1 15.1 9.4 5.5 3.2 2.4 1.4 8,984 71.3 38.4 23.1 12.4 6.8 4.9 3.0
12,440 128.4 59.6 35.8 18.7 9.8 6.9 4.1 14,544 140.8 76.3 44.3 22.8 11.7 8.2 4.9
4 R No 4,560 20.2 12.2 8.6 5.7 3.8 3.0 1.8 9,136 48.6 30.7 21.5 13.5 8.8 6.7 3.7
12,512 71.9 46.8 33.2 20.4 12.9 9.6 5.3 14,808 85.3 57.0 41.5 24.9 15.6 11.5 6.1
5 R No 4,536 32.0 18.3 12.4 7.8 5.1 4.1 2.4 co 8,832 89.2 51.7 33.5 18.9 11.5 8.7 4.8 I
12,120 126.1 81.1 53.7 29.2 17.1 12.6 7.0 w
14,144 136.5 99.4 66.6 36.1 20.7 15.0 8.3
6 R No 4,424 52.4 30.2 18.7 9.9 5.4 4.1 2.4 8,648 117.3 75.6 49.3 25.1 12.9 8.5 4.7
11,936 100.4 107.8 73.5 38.3 19.5 12.4 6.7 13,792 104.3 122.3 87.0 46.6 23.6 15.1 7.9
7 R No 4,520 27.3 13.8 8.4 5.2 3.5 2."1 1.5 8,712 68.2 35.6 20.9 12.0 7.8 5.7 3.1
12,224 102.3 57.6 33.0 18.2 11.5 8.3 4.5 14,232 131.4 "12.0 40.9 22.2 13.7 9.8 5.3
8 R No 4,504 46.2 26.3 16.6 9.5 5.4 4.0 2.1 8,736 103.9 67.4 44.1 24.2 13.1 8.6 4.2
12,048 144.4 99.5 66.8 37.0 19.9 12.8 6.3 13,984 100.8 117.1 80.3 44.9 24.1 15.5 7.5
FWD Deflection Data from Rec. Road 3 near Bonham (Cont'd)
Deflection (mils) Section Lane Fabric Load (lbs) WI W2 W3 W4 W5 W6 W7
9 R No 4,448 48.0 26.0 16.6 9.6 5.8 4.5 2.3 8,712 113.7 67.0 43.2 23.3 13.7 9.6 4.8
11,952 130.6 98.8 65.5 35.2 20.3 14.0 6.9 13,840 117.1 116.3 78.9 42.8 24.6 16.8 8.4
10 R No 4,488 22.7 12.8 8.1 4.9 3.1 2.2 1.0 8,864 56.5 32.8 21.0 11.8 7.0 4.9 2.2
12,288 87.6 52.3 33.8 18.3 10.4 6.9 3.1 14,512 107.7 65.5 42.5 22.7 12.6 8.3 3.6
co 1 L No 4,472 40.8 21.7 12.9 7.0 4.2 3.3 2.1 I 8,808 93.9 56.1 33.4 16.9 9.6 6.9 3.6 ~
12,152 123.5 85.6 52.4 26.2 14.2 10.0 5.3 14,016 138.5 106.6 64.9 32.5 17.4 11.8 6.0
2 L No 4,384 39.5 24.1 15.7 9.1 5.9 4.7 2.8 8,688 90.7 60.1 40.2 22.5 14.1 10.4 5.6
12,000 120.3 87.8 60.7 34.1 21.0 15.3 8.1 13,912 100.6 104.6 73.0 41.5 25.5 18.3 9.4
3 L No 4,480 44.6 27.3 17.3 10.0 6.2 4.5 2.4 8,704 101.4 68.6 44.9 25.1 14.6 10.0 4.9
11,968 143.4 100.9 68.5 38.6 22.2 14.8 7.1 13,832 132.4 120.1 83.3 47.4 27.1 18.1 8.6
4 L No 4,624 30.2 17.6 11.0 6.9 4.6 3.5 1.7 8,944 76.4 47.7 29.4 16.4 10.3 7.7 4.0
12,280 110.0 73.3 47.0 25.3 15.2 11.0 5.6 14,224 147.9 90.0 59.1 31.7 18.6 13.3 6.9

FWD Deflection Data from Rec. Road 3 near Bonham (Cont'd)
Deflection (mils) Section Lane Fabric Load (lbs) WI W2 W3 W4 W5 W6 W7
1 L Yes 4,520 21.3 13.8 10.5 7.8 5.4 4.5 2.4 8,928 54.9 35.4 26.4 18.5 12.9 10.3 5.3
12,328 84.3 55.8 40.9 28.1 19.3 15.2 7.6 14,360 104.2 68.8 50.5 34.3 23.4 18.3 9.2
2 L Yes 4,536 25.1 14.3 10.6 7.3 5.0 3.7 1.8 9,000 65.1 39.2 28.6 18.7 12.0 8.6 3.6
12,384 97.6 61.5 45.1 28.9 18.3 13.0 5.4 14,368 116.3 75.1 55.4 35.6 22.4 15.8 6.5
3 L Yes 4,584 23.0 15.3 12.0 8.6 6.0 4.7 2.3 CD 9,064 60.5 40.3 31.4 21.5 14.6 10.8 4.9 I U"1 12,400 93.5 62.8 49.0 33.3 22.3 16.1 7.0
14,352 113.6 76.9 60.0 40.0 27.2 19.6 8.8
4 L Yes 4,496 29.8 18.0 13.2 8.9 6.3 4.8 2.6 8,832 72.6 44.9 32.5 21.7 14.7 11.3 5.8
12,216 105.7 68.2 49.5 32.8 22.0 16.8 8.4 14,216 122.2 83.5 60.7 40.0 26.7 20.4 10.2
5 L Yes 4,528 17.3 12.0 9.2 6.5 4.5 3.5 1.7 9,064 43.9 30.2 22.7 15.7 10.6 8.0 3.5
12,360 67.9 46.6 35.1 23.7 15.8 11.7 5.2 14,736 83.5 57.8 43.3 29.0 19.2 14.0 6.2
6 L Yes 4,696 34.4 20.2 11.6 5.8 3.7 3.0 1.7 9,016 64.0 37 .1 22.0 11.6 7.2 5.8 3.3
12,304 89.2 50.3 29.4 15.4 9.6 7.8 4.5 14,344 104.5 58.1 33.9 17.3 10.5 8.7 5.1

FWD Deflection Data from Rec. Road 3 near Bonham (Cont1d)
Deflection (mils) Section Lane Fabric Load (lbs) WI W2 W3 W4 W5 W6 W7
5 L No 4,448 51.0 31.6 20.6 10.8 6.4 4.4 2.5 8,592 115.8 76.8 52.1 27.5 14.4 10.0 5.4
11,880 123.9 111.1 77.9 42.0 22.0 14.8 7.9 13,688 104.9 136.4 93.7 50.8 26.9 17.8 9.5
6 L No 4,328 34.1 20.4 13.7 8.6 5.5 4.4 2.6 8,704 82.7 54.4 36.3 21.3 13.3 10.0 5.3
11,880 139.6 82.7 56.0 32.4 19.8 14.7 7.5 13,752 136.2 100.7 69.3 39.7 24.0 17.5 8.8
7 L No 4,544 30.4 19.3 12.9 7.8 4.9 3.7 1.8 OJ 8,896 80.9 52.6 34.4 19.3 11.1 7.8 3.8 I 0) 12,160 119.4 81.9 54.5 29.8 16.7 11.5 5.3
14,096 120.3 101.5 68.2 37.1 20.5 14.0 6.3
8 L No 4,512 23.6 13.5 8.6 5.2 3.2 2.6 1.6 9,008 64.6 36.0 22.1 11.7 7.2 5.6 3.2
12,440 97.9 56.6 35.0 17.6 10.6 8.1 4.8 14,504 115.1 69.9 44.0 21.8 12.8 9.8 5.7
9 L No 4,408 45.2 27.5 16.9 9.0 5.1 4.0 2.2 8,608 115.6 74.3 46.1 22.2 10.9 8.0 4.3
11,840 112.4 113.0 72.6 35.4 16.1 10.7 6.3 13,680 114.8 133.9 90.7 44.9 19.9 12.4 7.5
10 L No 4,504 21.3 13.8 10.5 7.8 5.4 4.5 2.4 9,024 54.9 35.4 26.4 18.5 12.9 10.3 5.3
12,288 84.3 55.8 40.9 28.1 19.3 15.2 7.6 14,432 104.2 68.8 50.5 34.3 23.4 18.3 9.2

FWD Deflection Data from Rec. Road 3 near Bonham (Cont1d)
Deflection (mils) Section Lane F abri c Load (lbs) WI W2 W3 W4 W5 W6 W7
7 L Yes 4,520 34.4 21.5 14.5 9.0 5.8 4.3 2.3 8,776 85.8 56.6 38.4 22.2 13.3 9.3 4.7
12,088 120.9 86.5 59.9 34.5 20.0 13.8 6.8 13,952 126.2 105.9 73.8 42.6 24.5 16.6 8.2
8 L Yes 4,504 40.2 23.1 15.5 9.4 5.9 4.5 2.5 8,816 91.2 55.9 37.7 22.5 13.8 10.2 5.4
12,160 114.7 84.5 57.2 33.9 20.8 15.1 7.9 14,032 132.3 103.0 70.0 41.5 25.3 18.3 9.5
OJ 9 L Yes 4,368 33.6 18.6 12.5 8.2 5.7 4.4 2.5 I
8,744 75.4 45.5 30.8 19.3 12.8 9.7 5.1 '-J
12,112 107.9 68.4 47.0 29.2 19.1 14.4 7.4 14,216 132.5 82.7 57.7 35.6 23.1 17 .3 8.9
10 L Yes 4,496 23.5 13.1 9.4 6.3 4.6 3.7 2.2 8,928 55.1 31.5 22.2 14.5 10.4 8.2 4.6
12,336 81.4 48.4 34.2 22.1 15.6 12.2 6.9 14,448 99.6 59.6 42.4 27.2 19.0 14.8 8.3
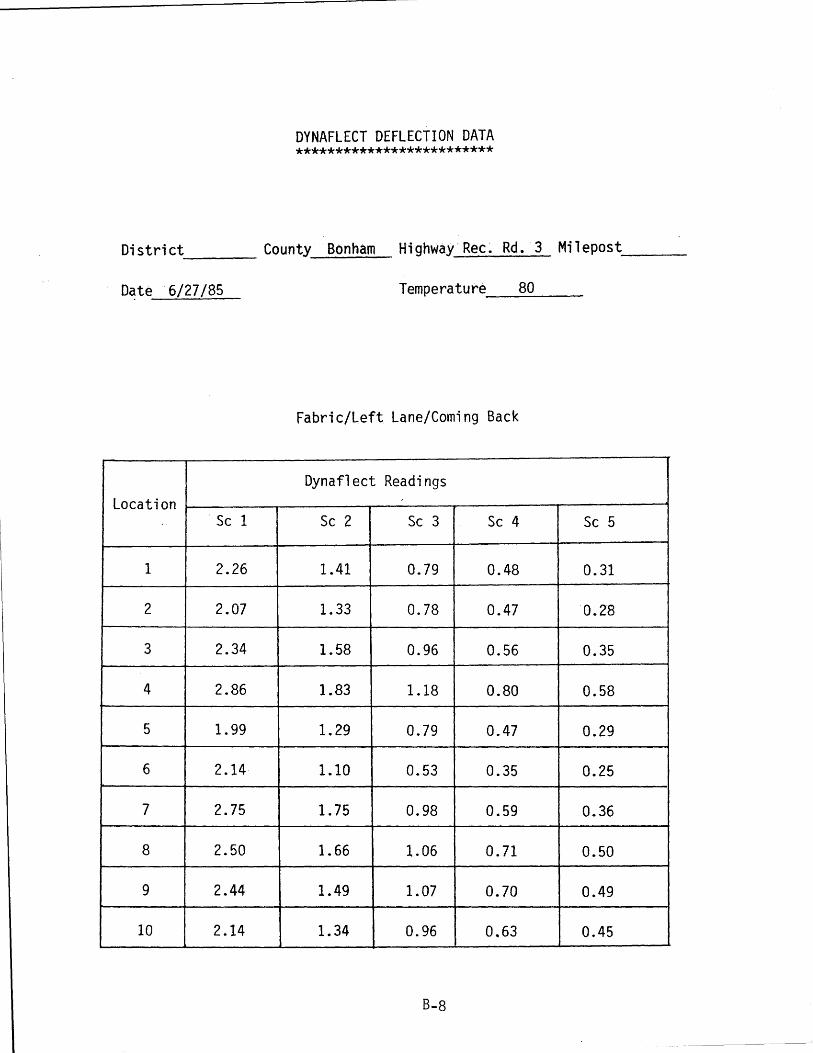
DYNAFLECT DEFLECTION DATA *************************
Di stri ct County 'BOnham Hi ghway' Rec ~ Rd.' 3 Mi 1 epost __ _ ----
Date '6/27/85 Tempe ratu r e __ 8 0 __ _
Fabric/Left Lane/Coming Back
Dynaflect Readings Location
Sc 1 Sc 2 Sc 3 Sc 4 Sc 5
1 2.26 1.41 0.79 0.48 0.31
2 2.07 1.33 0.78 0.47 0.28
3 2.34 1.58 0.96 0.56 0.35
4 2.86 1.83 1.18 0.80 0.58
5 1.99 1.29 0.79 0.47 0.29
6 2.14 1.10 0.53 0.35 0.25
7 2.75 1.75 0.98 0.59 0.36
8 2.50 1.66 1.06 0.71 0.50
9 2.44 1.49 1.07 0.70 0.49
10 2.14 1.34 0.96 0.63 0.45
B-8

DYNAFLECT DEFLECTION DATA *************************
District County Bonham --- Highway Rec. Rd 3 Milepost ----.1
Date 6/27/85 Temperature 78
Non-Fabric/Left Lane/Coming Back
Dynaflect Readings Location
Sc 1 Sc 2 Sc 3 Sc 4 Sc 5
1 3.00 1.62 0.84 0.48 0.30
2 3.02 1.88 1.16 0.77 0.53 I
3 3.07 1.83 1.02 0.61 0.39
4 2.41 1.40 0.83 0.52 0.33
5 3.31 1.86 1.04 0.65 0.43
6 2.40 1.50 1.02 0.70 0.50
7 2.11 1.22 0.72 0.45 0.29
8 1.49 0.90 0.55 0.37 0.26
9 2.86 1.69 0.87 0.50 0.29
10 2 .. 11 1.38 0.94 0 .. 64 0.44
8-9

DYNAFLECT DEFLECTION DATA *************************
District County Bonham --- Highway'Recreation Rd. 3 Milepost --
Date 6/27/85 Temperature ___ 7-.:..,8 __ ___
Non-Fabric/Right Lane/Going
Dyneflect Readings Location
Sc 1 Sc 2 Sc 3 Sc 4 Sc 5
1 1.99 1.27 0.83 0.57 0.41
2 2.27 1.38 0.80 0.49 0.31
3 1.98 1.07 0.58 0.36 0.25
4 1.94 1.21 0.73 0.47 0.31
5 3.02 1.78 1.06 0.67 0.45
6 3.16 1.88 1.04 0.64 0.42
7 2.05 1.20 0.70 0.44 0.30
8 2.65 1.60 0.92 0.54 0.33
9 3.13 1.94 1.12 0.71 0.47
10 1.73 1.01 0.58 0.34 0.22
8-10
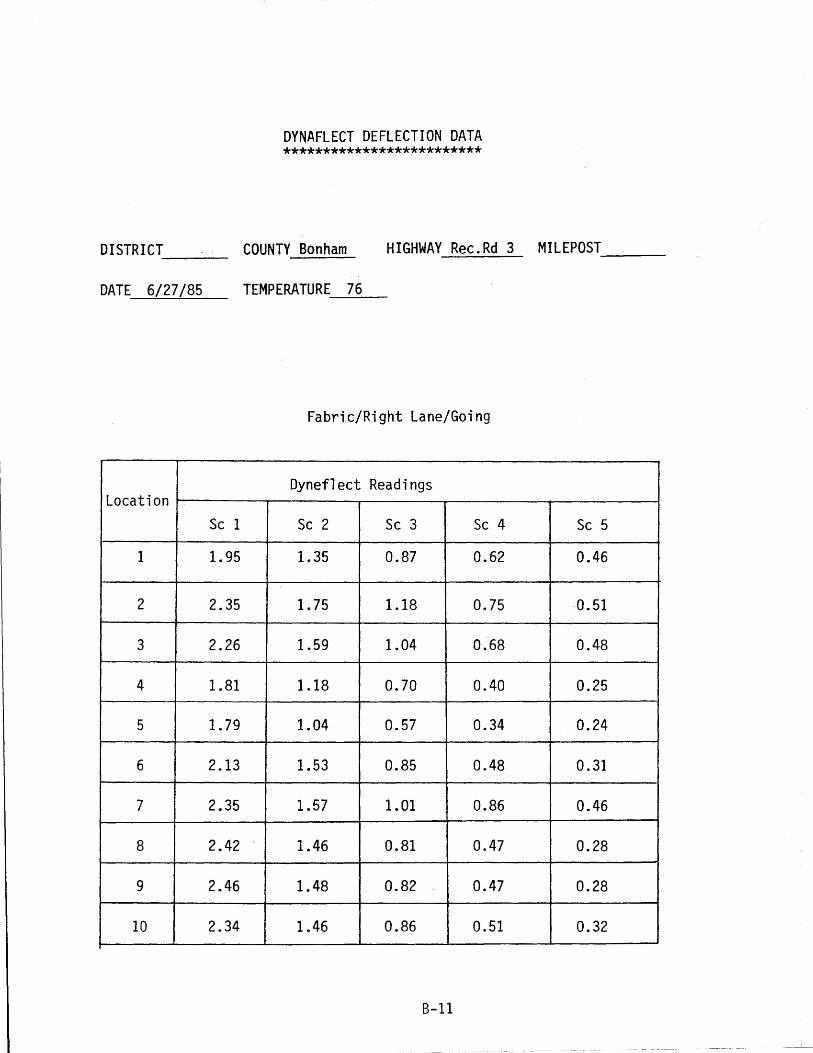
DYNAFLECT DEFLECTION DATA *************************
DISTRICT COUNTY Bonham HIGHWAY Rec.Rd 3 MILEPOST ------
DATE 6/27/85 TEMPERATURE 76
Fabric/Right Lane/Going
Dyneflect Readings Location
Sc 1 Sc 2 Sc 3 Sc 4 Sc 5
1 1.95 1.35 0.87 0.62 0.46
2 2.35 1.75 1.18 0.75 0.51
3 2.26 1.59 1.04 0.68 0.48
4 1.81 1.18 0.70 0.40 0.25
5 1.79 1.04 0.57 0.34 0.24
6 2.13 1.53 0.85 0.48 0.31
7 2.35 1.57 1.01 0.86 0.46
8 2.42 1.46 0.81 0.47 0.28
9 2.46 1.48 0.82 0.47 0.28
10 2.34 1.46 0.86 0.51 0.32
B-11

8-12

DISTRICT ;,O~EPT~OUNTY : Blrl~1 SECTIOll6,15.lF NFAB Cft INS NOS ell/BlOY IN/BlOY
~ UI fJl ll~~ IJ~ 1:ll o. I 6.30 2.48 20.00 0.35 0.14 S.40 3.11 25.00 0.47 0.19 1~.~0 1 • 0 ~:Jf J~:~~ ~:t~ ~:it 31.50 12.40 40.00 3.30 1.30 62.50 24.61 45.00 3.l0 1.30
Y:NO. OF BLOUS X:DEPTH SECTION 15 LF NFAB 60 t i
48 I I x
x 36
x x
24 x ~'
x x
12
f x x 1 0 X
!
0 6 12 18 24 lO PrtSc?
Y:INCH/BlOU X:DEPTH SECTION 15 lF NFAB 3
f 1 2.4
~ tIS
1.19 X x
.59 x
x x x 0 o ~xxx ' I I I
6 12 18 24 30
PrtSc?
Cone Penetrometer Results RR3, Station 5, Control Section
B-13

DISTRICT ; 00 COUNTY: BONHAft eft DEPTHINS I~IUS
~:~~ ~:~j ~:~~ 3.60 1.42 10.00
I:!I ~:I~ 11:11 11.00 4.33 30.00 15.50 6.10 35.00 ~l:~~ lA:~t ~~:~~
Y:HO. OF BLOWS X:DEPTH &0 f 1
48 t r
3&., t 24 ~ x
x x
SECTION : IB Lf NFAB C"/BL~~OPE 'N/BlOY ~:ii ~:lt 0.32 0.13
I:U I:U 0.69 0.27 2.13 0.84 J:U I:J~
SECTION 18 IF MFAB I i
x
x
1
1
12 t / I o Ox----L--6~-L....--l...&..2 ---'---1""-~ --'---24"-' --'---30--'
PrtSc? Y:INCH/BLOW X:DEPTH SECTION IB IF MFAB
I I
1.19 x x
x .59
~
o x -x x ~-xxx ..... , _""'"""-_""'---.1.'_---'--_ ..... ' ---..... ' --'----
o 6 -12 18 24 30
PrtSc?
Cone Penetrometer Results RR3, Station 8, Control Section
8-14

DISTRICT : O~EPT~OUMTY : 8Ir~~1 SEellOI : r5 RT Y/FAB LOP N eft Iii N0i C~~~~OY IN/!lOY
~ 0 • 00 0 • 0 o. 0 0.2 . 2.60 1.02 5.00 0.53 0.21
~:j~ ~:~J l~:~~ ~:~~ ~:~f 10.60 ~.17 20.00 0.56 0.22 13.40 5.28 25.00 0.60 0.24 16.60 6.54 30.00 0.72 0.28 ~~:t~ 1~:U ~i:~~ ~:,~ ~:81 47.60 18.74 45.00 3.00 1.18 61.60 24.25 50.00 3.00 1.18
Y:NO. OF BLOUS X:DEPTH SECTION 15 RT W/FAB 60 I I
48 t x I x
x 36
x x
f4 x x
x 12 f/ 1 0 x I
0 6 12 18 24 30 PrtSc?
Y:INCH/BlDW X:DEPTH SECTION 15 RT W/FAB 3
2.4
r
1.8
1.19 1 x x
.59 x I x x x x x x x 0 I I I I I I I
0 6 12 18 24 30 PrtSc?
Cone Penetrometer Results RR3, Station 5, Geotextile Section
B-15

DISTRICT : O! COUNTY; BOIHAI . EPTN BLOY
SECTION : 18 RT Y/FAB SLOPE N
~ Cft INS NOS Cft/BLOY IN/BLOY 0.00 0.00 0.00 0.80 O.ll
t:11 Hl II:J~ til !:U 1 • 0 1 :0 4.72 20.00 0.49 0.19 14.70 5.79 25.00 0.60 0.24
U:II li:II 11:11 l:~l 1.7 ~:i' 0.69
Y:MO. OF BLOUS X:DEPTN SECTION 18 RT V/FAB 60' I i i i i
48 I x. 36
1 x
x
x x
x 12
x
0 t x 1 x
0 6 12 18 24 30
PrtSc1 Y:IHCH/BLOU X:DEPTH SECTION 18 RT Y/FAB
3 I I 2.4 f 1
~ i :-
I 1.B
1.19
.59 x x x
x 0
0 6 12 18 24 30
PrtSc1
Cone Penetrometer Results RR3, Station 8, Geotextile Section
B-16

DISTRICT : 00 COUNTY : aOMHAft SECTION ; .9 RT U/FAB DEPTH I~IUS ~LOPE N -Cft IN~ Cft/BL U IN/BLOW
0.00 0.0 O. 0 0.84 0.l3 4.20 1.65 5.00 0.80 O.ll 8.00 3.15 10.00 0.78 0.31
lUI tf:i~ U:II I:;i f:IJ 44.00 17.32 30.00 3.20 1.26 66.00 25.98 35.00 3.20 1.26
Y:NO. OF BLOVS X:DEPTH SECTION 19 RT W/FAB 60 i I
48 t j I I
36
f I x x
24 x j ~ x
x
! 12
x
x 0 x
0 6 12 18 24 lO PrtSc?
Y:INCH/BLOU X:DEPTH SECTION 19 RT W/FAB 3
f j 2.4
HB
1.19 x x x
.59 ~ x
I x x x x
0 I I
0 6 12 18 24 30 PrtSc?
Cone Penetrometer Results RR3, Station 9, Geotextile Section
B-17