Embed Size (px)
Citation preview

Field Effectiveness of Ultraviolet Disinfection Units in On-site Sewage Treatment Report to the US Environmental Protection Agency and the Washington State Department of Ecology Contract Numbers C17128 and C17129
Washington State Department of Health Office of Environmental Health and Safety On-site Wastewater Management Section
March 2018

Ultraviolet Disinfection in On-site Sewage Systems
1
Authors: Meagan Jackson John Eliasson Randy Freeby Jeremy Simmons Leslie Turner Reviewed by: Liz Coleman, Washington State Department of Health Communications Thomas Gries, Washington State Department of Ecology Gary Porter, Tacoma-Pierce County Health Department Steve Petersen, Thurston County Public Health and Social Services Department Erik Iverson, Thurston County Environmental Health Laboratory Tania Busch Isaksen, University of Washington Published by: Washington State Department of Health, Office of Environmental Health and Safety, On-site Wastewater Management Section P.O Box 47824, Olympia, Washington 98504-7824 Phone: 360-236-3330 Email: [email protected]
DOH 337-155 June 2018 For people with disabilities, this document is available on request in other formats. To submit a request, please call 1-800-525-0127 (TDD/TTY call 711). This project has been funded wholly or in part by the United States Environmental Protection Agency under assistance agreement PC-00J88801 to the Washington State Department of Health. Contents of this document do not necessarily reflect the views and policies of the Environmental Protection Agency, nor does mention of trade names or commercial products constitute endorsement or recommendation for use.
Ultraviolet Disinfection in On-site Sewage Systems
2
Executive Summary Introduction
Reliable on-site wastewater treatment protects public health by reducing the harmful bacteria and viruses present in domestic sewage. These pathogens can cause disease when people consume contaminated groundwater or shellfish from polluted coasts. Advanced sewage treatment systems are necessary when conventional on-site sewage systems (OSSs) do not provide adequate treatment for site conditions. Sites with highly-permeable or shallow soils often need advanced treatment to inactivate harmful microorganisms.
Ultraviolet disinfection (UVD) successfully reduces microbial concentrations at drinking water and wastewater treatment plants. It is increasingly used for advanced on-site sewage treatment as well. Currently, over 6,000 on-site UVD units are installed in Washington State. UVD units have performed well under test conditions. However, OSS service providers and local health jurisdictions report that many installed UVD units lose their functionality, are not maintained well, and can cause public health and safety risks. The field effectiveness and reasons for unit malfunctions are poorly understood and undocumented.
Methods The Washington State Department of Health (WADOH) conducted a study to determine
how UV disinfection units in Western Washington perform. We examined 97 UVD units in Thurston and Pierce counties for indicators of proper installation, maintenance, and electrical and physical status. We also collected effluent samples from 22 UVD units in Thurston County. Effluent samples were tested for microbial and physical sewage quality by measuring fecal coliform concentrations, temperature, pH, dissolved oxygen, conductivity, turbidity, and UV transmittance. We also reviewed recent service reports for the studied OSSs. The data was analyzed to determine how many issues with UVD units we could expect to see and possible reasons why the UV bulb malfunctions.
Results & Discussion Thurston County Public Health and Social Services has established Action Levels to
determine when follow-up action is required after sampling effluent from UVD units with corresponding Treatment Levels A and B. Of the 22 UVD unit effluent samples collected in Thurston County, one (4%) exceeded the fecal coliform Action Level A (400 CFU/100 mL). We expect that 0-14% of the UVD units in Thurston County could have effluent with fecal coliforms exceeding 400 CFU/100 mL at any time. Only 46% of Thurston County UVD units are classified as Treatment Level A, so samples will most likely exceed Action Level A in OSSs with higher Treatment Levels.
Although the sample size of sewage quality measurements was too small to make strong conclusions, the results indicate that disinfection depends on the current functioning of the pretreatment unit. These results suggest that when aerobic treatment units and UVD units are properly functioning and flow rates are slow, UVD units provide high-quality effluent that meets regulatory standards.
Of the studied UVD units, 25% could not provide disinfection because the UV bulb was not glowing. Additionally, 8% of the UVD units had thick biofilm deposits on the protective sleeve that likely inhibited disinfection. The study results showed that UV bulb malfunction and biofilm buildup often occurred in the same units. UV bulb malfunction was also common in systems that had electrical damage. This shows that thorough maintenance and repair of electrical damage are important to ensure proper functioning.

Ultraviolet Disinfection in On-site Sewage Systems
3
Review of service records showed that some UVD units had not been adequately maintained. 51% of the UV bulbs were more than 2 years old, and 44% of the protective sleeves had not been cleaned within the last year. Even though certified maintenance providers had inspected most systems when required by local regulations, the maintenance was not adequate.
Significant differences were observed between health jurisdictions. A higher proportion of Pierce County OSSs had malfunctioning bulbs, high biofilm deposits, electrical damage, and installation deficiencies compared to those in Thurston County. These discrepancies may be due to differences in inspection frequency, performed maintenance, follow-up and repair of deficient UVD units, or enforcement under different management plans.
The study design was limited by the small number of effluent samples and the inability to collect effluent samples from OSSs with high flow rates or UV bulbs that were not glowing. The primary reason for this limitation was the small number of OSSs with access to collect freefall effluent samples. The study also identified the lack of evidence-based field compliance fecal coliform standards to which OSS effluent samples could be compared.
Conclusions The results of this study indicate that UVD units in the field can effectively reduce fecal
coliform concentrations when installed and maintained correctly. However, a high proportion of UVD units are malfunctioning and unable to provide disinfection. Based on these results, we recommend that WADOH and local health jurisdictions ensure more frequent maintenance through an intensive local management plan. Certified maintenance providers should also make sure that they perform service inspections as frequently as required. Service inspections should include thorough maintenance of protective sleeves, replacement of UV bulbs, and inspection of electrical components based on manufacturer’s recommendations. OSS designs should specify a freefall port to collect samples. Manufacturers should improve unit designs to minimize biofilm buildup and electrical malfunction. These interventions will help increase field effectiveness of UVD units by preventing further malfunctions and improving reliability of sewage treatment.

Ultraviolet Disinfection in On-site Sewage Systems
4
Table of Contents Executive Summary ...................................................................................................................... 2
List of Tables .................................................................................................................................. 6 List of Figures ................................................................................................................................. 6 List of Appendices .......................................................................................................................... 6 Abbreviations and Acronyms ......................................................................................................... 7
1. Introduction ............................................................................................................................... 8 1.1. Use of Ultraviolet Disinfection for On-site Sewage Treatment ........................................... 8 1.2. Description of Ultraviolet Disinfection Units ...................................................................... 9 1.3. Components of Treatment Sequences .................................................................................. 9 1.4. Maintenance Requirements for UVD Units ....................................................................... 10 1.5. Management of UVD Units in Washington State.............................................................. 10 1.6. Current Experiences with UV Disinfection Units in Washington State ............................ 11 1.7. Implications for Public Health ........................................................................................... 11
2. Previous Studies ...................................................................................................................... 12 2.1. National Sanitation Foundation (NSF) Testing ................................................................. 12 2.2. Studies under Field Conditions or Simulated Field Conditions ........................................ 12
3. Project Goals and Objectives ................................................................................................. 14 4. Methods .................................................................................................................................... 15
4.1. Selection of Study Sites ..................................................................................................... 15 4.2. Site Evaluations with Characterization of OSS Conditions ............................................... 16
4.2.1. UVD Unit Effluent Sampling ...................................................................................... 17 4.2.2. In Situ Testing for Wastewater Quality Parameters ................................................... 17
4.3. Laboratory Analysis ........................................................................................................... 17 4.4. Review of Service Records ................................................................................................ 17 4.5. Quality Control Procedures................................................................................................ 17 4.6. Statistical Analysis ............................................................................................................. 18
5. Results ...................................................................................................................................... 19 5.1. Microbial Load of UVD Unit Effluent .............................................................................. 19 5.2. Current Status of UVD Units in the Field .......................................................................... 20 5.3. Maintenance Patterns of Observed UVD Units ................................................................. 22 5.4. Physical Sewage Quality of UVD Unit Effluent ............................................................... 23 5.5. Relationships between Installation, Maintenance, Current Functioning, and Microbial Load .......................................................................................................................................... 23 5.6. Relationships between Proper Installation, Maintenance, and Current Functioning of UVD Units .......................................................................................................................................... 24 5.7. Relationships between Wastewater Quality Parameters and Fecal Coliform Concentrations .......................................................................................................................... 25
6. Discussion of Study Results .................................................................................................... 26 6.1. Field Status of Ultraviolet Disinfection Units ................................................................... 26
6.1.1. Effluent Quality ........................................................................................................... 26

Ultraviolet Disinfection in On-site Sewage Systems
5
6.1.2. Condition of UVD Units in the Field .......................................................................... 26 6.2. Inadequate Maintenance of UVD Units ............................................................................. 27 6.3. Local Management Plan Important in Ensuring Proper UVD Unit Performance ............. 27 6.4. Lack of Access for Maintenance ........................................................................................ 27
6.4.1. Access to UV Disinfection Units ................................................................................. 27 6.4.2. Freefall Sampling Port Access.................................................................................... 28
6.5. Wastewater Quality Parameters Indicate Importance of ATU Performance ..................... 28 7. Homeowner Questionnaire Results ....................................................................................... 29 8. Limitations and Suggestions for Further Research ............................................................. 31
8.1. Limitations of Study Design .............................................................................................. 31 8.2. Limitations of Observed Conditions .................................................................................. 31 8.3. Limitations in Current On-site Wastewater Standards of Practice .................................... 31 8.4. Suggestions for Follow-up Research ................................................................................. 32
9. Conclusions .............................................................................................................................. 33 10. Recommendations ................................................................................................................. 34 11. Acknowledgments ................................................................................................................. 36 12. References .............................................................................................................................. 37

Ultraviolet Disinfection in On-site Sewage Systems
6
List of Tables Table 1. Typical Wastewater Quality of ATU Effluent ............................................................... 10 Table 2. Thurston County Fecal Coliform Treatment Thresholds and Action Levels for OSS
Effluent Sampling ................................................................................................................. 11 Table 3. Treatment Component Performance Testing Standards ................................................. 12 Table 4. NSF Product Evaluation Results for ATU Effluent (UVD Influent) and UVD Effluent
Quality................................................................................................................................... 12 Table 5. Fecal Coliform Results from Evaluation of Disinfection Units ..................................... 13 Table 6. Descriptive Statistics for FC Measurements in 22 UVD Units in Thurston County ...... 19 Table 7. Biofilm Deposit Levels on UVD Units Where Protective Sleeve Was Accessible ........ 20 Table 8. Prevalence of Installation, Maintenance, and Key Component Issues in Pierce and
Thurston County ................................................................................................................... 21 Table 9. LED Indicator Light Malfunction ................................................................................... 22 Table 10. Time, in Months, since Most Recent Maintenance Performed on UVD Units ............ 22 Table 11. Descriptive Statistics of Wastewater Quality Parameters for Sampled OSSs Grouped
by Post-UVD Fecal Coliform Levels .................................................................................... 23 Table 12. Odds Ratios for UV Bulb Malfunction (UV Bulb Not Glowing)................................. 24 Table 13. Spearman’s Rank Correlations between Wastewater Quality Parameters and log-
Transformed Fecal Coliform Concentrations ....................................................................... 25 Table 14. Homeowners’ Acces to Contact Information for Key Players in OSS Maintenance and
Management .......................................................................................................................... 29 Table 15. Proportion of Homeowners Interested in Different OSS Topics .................................. 30
List of Figures Figure 1. Schematic of UVD Unit (Source: Anua, 2014.) .............................................................. 9 Figure 2. On-site Sewage System Components with UV Disinfection Unit .................................. 9 Figure 3. Data Inputs for UVD Study ........................................................................................... 16 Figure 4. Rankings of Biofilm Deposit on UVD Unit Protective Sleeves ................................... 16 Figure 5. Sampling of Freefall UVD Unit Effluent ...................................................................... 17 Figure 6. Treatment Level Standards of Thurston County UVD Units ........................................ 19 Figure 7. Examples of Common UVD Unit Issues. From left to right: electrical corrosion, torn
Teflon sleeve, and water intrusion. ....................................................................................... 20 Figure 8. UV Bulb Malfunction and Biofilm Deposit Levels in UVD Units ............................... 24 Figure 9. Homeowners’ Access to OSS Records and Manuals .................................................... 29 Figure 10. Frequency of Homeowner Inspections of UVD Units ................................................ 30
List of Appendices Appendix A. Additional Data Analysis Appendix B. Explanation of Less-Frequent Statistical Methods Used for Data Analysis Appendix C. Standards of Procedure Appendix D. Field Data Appendix E. Laboratory Data Appendix F. Service Records Data Appendix G. Quality Analysis and Quality Control Appendix H. Quality Assurance Project Plan

Ultraviolet Disinfection in On-site Sewage Systems
7
Abbreviations and Acronyms ATU: aerobic treatment unit CBOD5: 5-day carbonaceous biochemical oxygen demand CFU: colony forming units CI: confidence interval DO: dissolved oxygen FC: fecal coliform GM: geometric mean GPM: gallons per minute GSD: geometric standard deviation LHJ: local health jurisdiction MRA: marine recovery area NTU: nephelometric turbidity unit OR: odds ratio OSS: on-site sewage system QAPP: quality assurance project plan TCPHSS: Thurston County Public Health and Social Services TPCHD: Tacoma-Pierce County Health Department TSS: total suspended solids UV: ultraviolet UVD: ultraviolet disinfection UVT: ultraviolet transmittance WAC: Washington Administrative Code WADOH: Washington State Department of Health US EPA: United States Environmental Protection Agency

Ultraviolet Disinfection in On-site Sewage Systems
8
1. Introduction
1.1. Use of Ultraviolet Disinfection for On-site Sewage Treatment More than 6,000 ultraviolet disinfection (UVD) units are currently in use in Washington.
While UVDs are located in areas across the state, approximately 90% are installed in the Puget Sound region, with more than 75% in the south Puget Sound counties (Kitsap, Mason, Pierce, and Thurston counties).
1.1.1. Conditions Requiring Additional Sewage Treatment On-site sewage systems (OSSs) provide important sewage treatment in rural and
suburban regions of the US. Advanced on-site sewage treatment is often necessary where the soil infiltration area is either too shallow or too porous (US EPA, 2002). In these cases, soil is unable to consistently reduce microorganism concentrations to levels that do not pose a public health risk when effluent reaches shallow groundwater tables or surface water.
Advanced treatment is also common in environmentally sensitive areas. Additional requirements for OSSs are needed because of the site’s proximity to ecosystems and public services that are highly susceptible to sewage contamination. Examples of sensitive areas include shellfish harvesting beds, recreational beaches, groundwater recharge areas, and marine recovery areas (MRAs). The region of study includes three MRAs: Key Peninsula, Henderson Inlet, and Nisqually Reach.
1.1.2. Ultraviolet Disinfection for Wastewater Treatment Ultraviolet (UV) disinfection is a common treatment for pathogen removal. Many small-
scale drinking water and wastewater treatment systems use UV disinfection (Tchobanoglous et al., 2014; US EPA, 2003). Ultraviolet irradiation inactivates pathogens by damaging nucleic acids (DNA and RNA), which are essential for cellular life (Hijnen, Beerendonk, & Medema, 2006). When disinfection units achieve required doses, they inactivate most viruses, bacteria, spores, and some protozoan cysts (Hijnen et al., 2006). UV dosage depends on the intensity of UV radiation, contact time, and the wastewater’s UV transmittance (Tchobanoglous et al., 2014). OSS specifications that ensure adequate UV dosage include hydraulic loading limits and appropriate design of UV disinfection units.
There are many benefits to using UV disinfection. It does not produce harmful byproducts and is very effective against pathogens that are not removed by other forms of disinfection (Hijnen et al.; Tchobanoglous et al., 2014). However, drawbacks to UV disinfection include its sensitivity to wastewater characteristics, costs of installation, and extensive maintenance requirements (Tchobanoglous et al., 2014). Particles, dissolved salts, and organic compounds in wastewater can absorb or reflect ultraviolet light, which decreases the amount of UV radiation that contacts target organisms (Hijnen et al., 2006; Leverenz, Darby, & Tchobanoglous, 2006; US EPA, 2003). Pretreatment of wastewater is often required to reduce the level of these compounds and allow for adequate disinfection.

Ultraviolet Disinfection in On-site Sewage Systems
9
1.2. Description of Ultraviolet Disinfection Units Ultraviolet bulbs emit germicidal irradiation that
reduces pathogen load. The optimum germicidal wavelengths are between 250 and 270 nm (US EPA, 2002). The intensity of the bulb, which determines the level of disinfection, wanes over time. After one year, the output of a UV bulb is usually 75% the initial intensity (Leverenz, Darby, & Tchobanoglous, 2006).
A quartz sheath usually encases the UV bulb to protect the bulb from breakage, especially during installation and maintenance (Salcor Inc., 2016). In some UVD unit models, a Teflon sleeve covers the quartz. The Teflon sleeve is designed to minimize scaling and provide an additional layer of protection (Salcor Inc., 2016).
Sewage flows through a chamber built from ABS or PVC pipe that surrounds the bulb and protective sleeves. A four-inch diameter contact chamber minimizes the influent flow rate, which maximizes the sewage’s contact time for disinfection.
The electrical components of the unit include a power cable connection, a UV bulb ballast, and alarm and sensor circuitry. Visual and/or audible alarms alert the user of low UV bulb intensity or UV bulb failure. Ideally, a waterproof case protects the electrical components of the unit (see Figure 1).
In Western Washington, installation of a UVD unit costs about $1,500, and maintenance costs including the replacements of UV bulbs about $130-$600 per year (Thomas, 2018). Additional costs include fees for inspections and permits as well as repairs if the unit malfunctions. The estimated total cost for a UVD unit throughout its 60-year lifecycle is $7,600-$11,000 (WERF, 2010).
1.3. Components of Treatment Sequences Ultraviolet disinfection units are registered for use with a variety of different treatment
sequences. Most include a primary tank, an aerobic treatment unit (ATU), a UVD unit, and a soil dispersal component (see Figure 2).
Figure 2. On-site Sewage System Components with UV Disinfection Unit
Figure 1. Schematic of UVD Unit (Source: Salcor, 2016)

Ultraviolet Disinfection in On-site Sewage Systems
10
Before sewage is disinfected, it must be treated in a pretreatment phase. Treatment usually begins in a septic tank, where solids, grease, oil, and some microorganisms are removed from the sewage. Most often, the septic tank is followed by an aerobic treatment unit (ATU), where aerobic bacteria break down organic matter and reduce pathogen levels. If properly managed, ATUs are able to reduce organic matter, solids, and bacterial load, as shown in Table 1 (US EPA, 2002). However, they often do not reduce fecal coliform levels below a 30-day geometric mean of 50,000 CFU/100 mL. Additional problems occur if ATUs are not properly maintained (US EPA, 2000). The ultraviolet disinfection unit, which is buried or placed within a chamber, receives the pretreated sewage and provides final disinfection of pathogens before the sewage is distributed.
1.4. Maintenance Requirements for UVD Units Maintenance requirements include periodic replacement of UV bulbs and checks for
electrical or mechanical damage, scaling, and biofilm buildup (US EPA, 2002). Without regular inspection and maintenance, problems with UVD units can inhibit or prevent disinfection of sewage, resulting in greater risk of pathogen release.
Because UV intensity decreases with use, bulbs must be periodically replaced. Bulb lives can differ depending on use and manufacturer, but most manufacturers recommend replacing the bulb at least every 2 years (CIDWT, 2006).
Manufacturers also require periodic cleaning of the protective sleeve because fouling must be removed to provide adequate UV dosage. Fouling is a buildup of inorganic, organic, and/or biological material, also called a biofilm (Brenner, 2000). Fouling acts as a barrier between the UV bulb and the sewage, which decreases UV dose and inhibits disinfection (Tchobanoglous et al., 2014). In some cases, fouling can completely prevent UV disinfection (Nessim & Gehr, 2006). The flow rate, influent sewage quality, and upstream treatment performance can impact the rate of buildup and composition of the fouling (Donlan, 2002; Nessim & Gehr, 2006; Tchobanoglous et al., 2014). UVD unit manufacturers require at least annual cleaning of the protective sleeve to remove mineral buildup and biofilms (Norweco, 2014 Salcor, 2016).
1.5. Management of UVD Units in Washington State Because proper maintenance reduces the risk of UVD unit malfunction, Washington State
rule includes OSS maintenance requirements. Onsite sewage systems with UVD units must be inspected at least annually or more frequently, if required by the local health officer (WAC 246-272A-0270 (1)(d)(ii)). At the time of inspection, certified maintenance providers should maintain and repair the unit to ensure proper operation (WAC 246-272A-0270 (1)(f)). Installation of OSSs should also ensure access to system components for proper maintenance and cleaning (WAC 246-272A-0238(1)(b)(v)). If these rules are enforced, they should minimize UVD unit malfunctions.
Requirements for inspection frequencies differ between local health jurisdictions. Tacoma-Pierce County Health Department (TPCHD) requires annual inspections (TPCHD, 2014). Thurston County Public Health and Social Services (TCPHSS) has more stringent maintenance standards and requires semiannual inspections and quarterly sampling for fecal coliform (TCPHSS, 2014).
Table 1. Expected Wastewater Quality of ATU Effluent CBOD5 < 25 mg/L TSS < 30 mg/L Fecal Coliform 3-4 log CFU/
100 mL Source: US EPA, 2002.

Ultraviolet Disinfection in On-site Sewage Systems
11
The TCPHSS Environmental Health Division has also developed compliance Action Levels for fecal coliform samples (see Table 2). Troubleshooting and evaluation of OSS performance must be undertaken if two or more of the past four sample results exceed the Action Level that corresponds to the site’s Treatment Level (TCPHSS-EH, 2008).
Table 2. Thurston County Fecal Coliform Treatment Thresholds and Action Levels for OSS Effluent Sampling Treatment Level Treatment Testing
Threshold (CFU/100 mL)* Action Level
(CFU/100 mL)** A or 1 200 400
B 1,000 2,000 2 800 1,600
*Treatment testing thresholds are 30-day geometric means. **Action levels are single sample values. Source: TCPHSS-EH, 2008.
1.6. Current Experiences with UV Disinfection Units in Washington State Certified OSS maintenance providers (CMPs) have given anecdotal evidence of UVD
unit malfunctions, noting problems with alarms, quartz sheaths breaking, bulb burnouts, and unit flooding (Kiess, 2014). Similar problems, especially electrical issues and fouling on protective sleeves, have occurred elsewhere (Leverenz et al., 2006; Loomis et al., 2004). These malfunctions have led to concerns about the reliability and safety of UVD units in the field.
1.7. Implications for Public Health Reliable on-site sewage treatment is very important to protect public health because some
microorganisms present in domestic sewage are pathogenic. Consumption of contaminated groundwater, recreational contact, and shellfish contamination are all potential sources of exposure to pathogens when OSSs are not operating properly (Bremer & Harter, 2012; Carroll, Goonetilleke, & Hargreaves, 2004; Washington State Department of Health, 2016). Contamination of marine waters is of special concern in the Puget Sound region because of the shellfish beds that provide an important industry for the Washington State economy and are an important traditional resource for members of local tribal communities (Washington State Department of Health, 2016). Additional risks to public health are introduced because of UVD unit malfunctions. Homeowners may be at risk of electrical shocks, and certified maintenance providers face occupational risks of exposure to ultraviolet light. To minimize these risks to public health, it is important to ensure reliable and safe treatment of sewage by ultraviolet disinfection units.

Ultraviolet Disinfection in On-site Sewage Systems
12
2. Previous Studies
2.1. National Sanitation Foundation (NSF) Testing According to the Washington State on-site wastewater bacteriological reduction rule, all
proprietary product treatment sequences registered for use in Washington State must be tested according to NSF/ANSI Standard 40 (WAC 246-272A-0130). When products are tested for meeting Treatment Level A or B, bacteriological reduction performance must be verified by sampling for fecal coliform (FC). Table 3 shows the maximum performance testing results to meet Treatment Level A or B.
Table 3. Treatment Component Performance Testing Standards Treatment Level CBOD5 (mg/L)* TSS (mg/L)* FC (CFU/100 mL)**
A 10 10 200 B 15 15 1,000
*30-day averages. **30-day geometric means Source: WAC, Chapter 246-272A, Table III. NSF product evaluation reports provide expected values for ATU and UVD effluent
quality (see Table 4). Table 4. NSF Product Evaluation Results for ATU Effluent (UVD Influent) and UVD Effluent Quality Range 30-day GM ATU Effluent (UVD Influent) Fecal coliform (CFU/100 mL) 2,250–800,000 > 20,000 UVD Effluent Fecal coliform (CFU/100 mL) < 10–24,000 < 100 Turbidity (NTU) 0.25–40.8 pH 6.8–8.1 Dissolved oxygen (mg/L) 0.5–10.2 Flow rate (gpm) 0.69–1.7
These data indicate that most ATUs are not capable of meeting the FC threshold values
of Treatment Levels A and B. In order to meet the FC threshold values during product testing, treatment product manufacturers typically use a UV disinfection unit after their ATU.
The UVD units used in Washington State have achieved high levels of pathogen reduction under testing conditions. However, because product evaluations at testing facilities cannot completely capture the variability in household sewage production, field tests provide valuable information performance under field conditions.
2.2. Studies under Field Conditions or Simulated Field Conditions Previous studies on UVD unit performance under field conditions demonstrate that UVD
units can effectively reduce fecal coliform concentrations. However, the studies also highlight reduced effectiveness during periods of stress, organic overloading, or inadequate maintenance.

Ultraviolet Disinfection in On-site Sewage Systems
13
2.2.1. Leverenz, H., Darby, J., & Tchobanoglous, G. Evaluation of Disinfection Units for On-site Wastewater Treatment Systems, 2006.
This study operated a wastewater treatment system with a UV disinfection unit for 9 months to determine its performance, reliability, and maintenance requirements. The systems diverted raw sewage from a municipal treatment plant into an OSS that contained a septic tank, an ATU, and a UV disinfection unit. Physical and biological wastewater quality were measured weekly.
The results (shown in Table 5) indicate that if UVD units are not properly maintained, issues with protective sleeves can lead to decreased FC reduction. Biofilms grew within a period of two months, which is much less than the manufacturer-recommended period of six months between inspections. However, even with this barrier to sewage irradiation, the unit provided a 3-log fecal coliform reduction.
2.2.2. Loomis, G. et al., Long-term Treatment Performance of Innovative Systems, 2004. In this study, two OSSs with UV disinfection units were installed to replace failing OSSs
and monitored for two years. Under field conditions, the UVD units provided a 2.5-5.7 log FC reduction, with effluent FC levels between 0.5 and 420 counts per 100 mL. During maintenance inspections, the UVD unit protective sleeves were cleaned twice to four times per year, and the bulbs were replaced every 12 months. Both systems experienced minor electrical shortages, likely due to moisture in the electrical connections. However, these issues were corrected, and the OSSs discharged effluent with very low fecal coliform concentrations.
2.2.3. Weaver, R.W. & Richter, A.Y. Disinfection Devices: Field Experiences, 2003 Weaver and Richter assessed the applicability of UV disinfection units to disinfect
subsurface flow constructed wetland effluent before surface application of treated sewage. They found that three of four UVD units did not provide consistent treatment. The systems were ineffective due to the high turbidity of wetland effluent and dark biofilms that developed on the bulbs after 1-2 weeks of use.
Table 5. Fecal Coliform Results from Evaluation of Disinfection Units
Period 1 After 23-day
vacation stress* Period 2 Influent BOD5 < 30 mg/L < 30 mg/L < 5 mg/L
Influent TSS < 30 mg/L < 30 mg/L < 5 mg/L ATU effluent
mean FC concentration 1.9*106 CFU/
100 mL - 1.7*105 CFU/ 100 mL
UVD unit effluent mean FC concentration 9 CFU/100 mL 757 CFU/100 mL 1 CFU/100 mL
mean log-reduction for FC concentration 4.3 3.1 < 4.4
Comments - biofilm deposit, water intrusion
UVD unit replaced
Flow rates during study were between 0.25 and 1 gpm. *To evaluate the unit’s response to vacation stresses, the sewage flow to the OSS was stopped for a 23-day period. Source: Leverenz et al. 2006.

Ultraviolet Disinfection in On-site Sewage Systems
14
3. Project Goals and Objectives The Washington State Department of Health (WADOH) recognizes the need to better
understand the trends in installation, maintenance, and current field status of UVD units. This study aimed to determine the effectiveness of UVD units in the field. This study results will inform future WADOH regulations for UVD units and recommendations about management requirements for currently installed UVD systems.
The study objectives were to: • Examine the effectiveness of ultraviolet disinfection (UVD) units in the field,
including: o Microbial load in effluent, o Correct installation, o Correct maintenance, and o General condition of critical components;
• Use results to predict UVD unit performance in Pierce and Thurston counties; • Assess relationships between proper installation, maintenance, functioning, and
microbial load; • Measure wastewater quality parameters in UVD unit effluent; and • Assess correlations between wastewater quality parameters and microbial load.

Ultraviolet Disinfection in On-site Sewage Systems
15
4. Methods
4.1. Selection of Study Sites WADOH identified Pierce County and Thurston County as appropriate locations to
implement the study. Pierce County provided a large population with various types of systems, and the Thurston County systems provided access to freefall UVD unit effluent samples. In May 2017, WADOH sent recruitment letters to all owners of UVD units in these counties, 2,034 and 140, respectively (see letter in Appendix C). Because the initial letter did not mention the property address of interest, a second letter was sent to homeowners whose mailing address was different than the property address.
The target sample size was 65 units in Pierce County, and 27 units in Thurston County. These sizes were calculated using Formulas (1) and (2):
𝑆𝑆𝑆𝑆 = 𝑍𝑍
2∗(𝑝𝑝)∗(1−𝑝𝑝)𝐶𝐶2
(1) 𝑆𝑆𝑆𝑆𝑆𝑆𝑆𝑆𝑆𝑆𝑆𝑆 𝑆𝑆𝑆𝑆𝑆𝑆𝑆𝑆 = 𝑆𝑆𝑆𝑆
�𝑆𝑆𝑆𝑆−1𝑃𝑃𝑃𝑃𝑃𝑃 �+1 (2)
where: Z = Z-score for the confidence level of interest, in this case 1.65 for 90% confidence level p = predicted proportion of UVD units with UV bulb malfunction (bulb not glowing) C = desired confidence interval, in this case 0.1 for a confidence interval of ± 10% Pop = total number of units in the target population
The predicted proportion of interest for this calculation was 0.56, which gave a conservative estimate of the necessary sample size.
By the beginning of June, 229 participants had volunteered for the study, 210 from Pierce County and 19 from Thurston County. At that time, the volunteers from Pierce County were randomly sorted into a list, and the first 65 units were selected for participation. Because the Thurston County target sample size had not yet been reached, we recruited additional participants by phone. After additional recruitment by phone, a total of 34 participants from Thurston County had volunteered. We were not able to inspect all volunteered OSSs because in some cases, we could not access properties, contact volunteers, or schedule site inspections when homeowners were available. In total, we visited 65 systems in Pierce County and 32 in Thurston County.
To protect the privacy of study participants, the research assistant assigned a random identification number (random ID) to each OSS in the study. The research assistant maintained a list of sites connecting site addresses to their random ID, but all other logs used the random ID only and did not identify the site address or owner in any way.

Ultraviolet Disinfection in On-site Sewage Systems
16
Figure 3. Data Inputs for UVD Study
4.2. Site Evaluations with Characterization of OSS Conditions For this study, information about UVD units was collected by inspecting OSSs and UVD
units, by sampling UVD effluent, and by reviewing service records. This information was then compiled to analyze the data (see Figure 3).
The project field lead and research assistant evaluated 97 OSSs with UVD units. They used a checklist to examine indicators of the installation, regular maintenance, and current electrical and physical status of the UVD unit (see Appendix C). A UV bulb that was not glowing was an indicator of UV bulb malfunction and inability to disinfect sewage. On the checklist, the level of biofilm deposit on the protective sleeve of the UV bulb was ranked into four categories: None, Low, Medium, and High (see Figure 4). Field staff collected data in field logs and transferred them to an electronic database within seven days of data collection.
Figure 4. Rankings of Biofilm Deposit on UVD Unit Protective Sleeves

Ultraviolet Disinfection in On-site Sewage Systems
17
4.2.1. UVD Unit Effluent Sampling Freefall UVD unit effluent samples were collected when they were accessible. Samples
were collected according to the WADOH standard of procedures and consistent sampling, storage, transportation, and labelling methods were used to prevent contamination (see Appendix C). When the flow rate was too slow for sample collection, flow was induced by turning on a sink faucet in the house or by directing a hose into the OSS’s septic tank. Figure 5 shows an example of freefall effluent sampling from a UVD unit.
4.2.2. In Situ Testing for Wastewater Quality Parameters An additional freefall grab sample of the
UVD unit effluent was collected to measure physical wastewater quality parameters. These included:
• Temperature (℃), • pH (standard units), • Dissolved oxygen (DO) (mg/L), • Conductivity (µS/cm2), • Turbidity (NTU), and • UV transmittance (UVT) (%).
Temperature, pH, and conductivity were measured using a ProPlus Handheld Multiparameter Instrument, dissolved oxygen was measured using an LDO probe (ProODO Handheld Optical Dissolved Oxygen Meter), turbidity was measured with a Global Water WQ770-B turbidity meter, and UV transmittance was measured using a Real UV254 P200 meter.
The flow rate was characterized by measuring the length of time needed to fill a 100 mL bottle with the free-flowing UVD unit effluent.
4.3. Laboratory Analysis The Thurston County Environmental Health Laboratory performed the Thermotolerant
(Fecal) Coliform Membrane Filter Procedure according to the Standard Method 9222 D. Samples were analyzed within 8 hours of collection time.
4.4. Review of Service Records LHJs provided information from their regulatory databases about all OSSs with UVD
units in their jurisdictions. Tacoma-Pierce County Health Department (TPCHD) created a report for their systems on April 3, 2017, and Thurston County Public Health and Social Services Department (TCPHSS) provided a report on June 11, 2017 (see Appendix F). Service records in OnlineRME were reviewed to update service inspection dates and confirm the data for the OSSs included in this study.
4.5. Quality Control Procedures Quality control procedures were performed to ensure the precision and accuracy of data,
minimize bias, and achieve maximal comparability and completeness. Field staff followed standards of procedure for sewage sampling and analysis and collected duplicate samples.
Figure 5. Sampling of Freefall UVD Unit Effluent

Ultraviolet Disinfection in On-site Sewage Systems
18
Additionally, the lead staff for quality control periodically evaluated the field measurements and electronic data transfer. See Appendix G for a detailed explanation of quality control procedures.
4.6. Statistical Analysis Once data was collected, the research assistant synthesized field, lab, and report data into
a single database. All variables for 10% of the observed OSSs were reviewed to ensure accurate data compilation. The database was then imported into the statistical analysis program R.
Descriptive statistics for the study parameters were calculated and displayed graphically. For data analysis purposes, any non-detect fecal coliform results were assigned a FC value of one whole unit less than the detection limit. Using bootstrapping, the expected proportion of UVD units in Thurston County with effluent over 400 CFU/100 mL was determined. See Appendix B for a more detailed explanation of the bootstrapping method.
We examined the effectiveness of UVD units in the field by calculating the proportion of observed OSSs with installation, maintenance, and current electrical or physical issues. 90% confidence intervals were determined using a chi-squared test of equal proportions. The generalizability of these proportions was evaluated by comparing the characteristics of the observed OSSs to the characteristics of the target population (see Appendix G).
The relationships between the observed UVD unit issues and post-UV fecal coliform concentrations were evaluated from scatterplots and beeswarm plots. Additional analysis could not be performed because of the small number of fecal coliform measurements.
To examine relationships between the observed issues and the UV bulb not glowing, we calculated odds ratios for UV bulb malfunction. The odds ratio was determined with Fisher’s exact tests for binary predictors and logistic regression for categorical and continuous predictors. An L1 regularized logistic regression model was used to determine which observed indicators were most strongly associated with UV bulb malfunction. For a more detailed explanation of the L1 regularized model used for analysis, see Appendix B.
Finally, we examined the relationships between physical wastewater quality parameters and post-UV fecal coliform concentrations. Spearman’s rank correlation coefficients were calculated to assess the associations between physical wastewater quality parameters and log-transformed post-UV fecal coliform concentrations.

Ultraviolet Disinfection in On-site Sewage Systems
19
5. Results Data from this study includes information from 97 OSSs with UVD units, 32 in Thurston
County and 65 in Pierce County. The Sample Representativeness Table in Appendix G shows the proportions of the UVD and ATU models among the observed OSSs. Among the units observed, 25% had malfunctioning UV bulbs that were not glowing, resulting in no disinfection being provided. Fecal coliform measurements from 22 properly-functioning UVD units indicate that 95% of the units in Thurston County were reducing fecal coliforms below 400 CFU/100 mL, and all were providing adequate disinfection according to each site’s designated Treatment Level.
5.1. Microbial Load of UVD Unit Effluent Fecal coliform concentrations were measured in 22 systems in Thurston County. At the
time of sampling, 91% of these units reduced fecal coliform levels below Treatment Level A and 95% provided adequate disinfection for Action Level A (see Table 6). The geometric mean (GM) effluent fecal coliform concentration was 18.1 CFU/100 mL, with a geometric standard deviation (GSD) of 3.6 CFU/100 mL.
Table 6. Descriptive Statistics for FC Measurements in 22 UVD Units in Thurston County
GM ± GSD 18.1 ± 3.6 CFU/100 mL Mean ± SD 61.1 ± 149.1 CFU/100 mL Minimum < 10 CFU/100 mL
Median < 10 CFU/100 mL Maximum 690 CFU/100 mL
Below detection limit 16 (73%) Below Action Level A
(400 CFU/100 mL) 21 (95%)
Below Action Level 2 (1,600 CFU/100 mL) 22 (100%)
One (5%) of the measured FC concentrations exceeded the Treatment Level A Action
Level (400 CFU/100 mL). Using the bootstrap technique, we estimated with 95% confidence that at any given time, the proportion of OSSs in Thurston County with effluent exceeding 400 CFU/100 mL is between 0% and 14%.
In Thurston County, 53% of the OSSs with UVD units are designed to meet either Treatment Level B or Treatment Level 2 (see Figure 6). In the study sample, the OSS with effluent that exceeded 400 CFU/100 mL was designed for Treatment Level B. The 0-14% of UVD units with effluent that may exceed 400 CFU/100 mL at any given time are likely to be OSSs where Treatment Level designations allow for higher effluent FC levels.
Figure 6. Treatment Level Standards of Thurston County UVD Units
Ultraviolet Disinfection in On-site Sewage Systems
20
5.2. Current Status of UVD Units in the Field The studied OSSs exhibited a wide range of issues that can impact their performance (see
Table 8, page 21). UV bulb malfunction is an especially important indicator of the current functioning of UVD units. 25% of the UV bulbs were malfunctioning and not providing disinfection. These were all located in Pierce County. Other common issues were a non-dedicated circuit for the UVD unit, biofilm deposits on the protective sleeve, overdue UV bulb replacement, overdue protective sleeve cleaning, and damage or leakage in the protective sleeve.
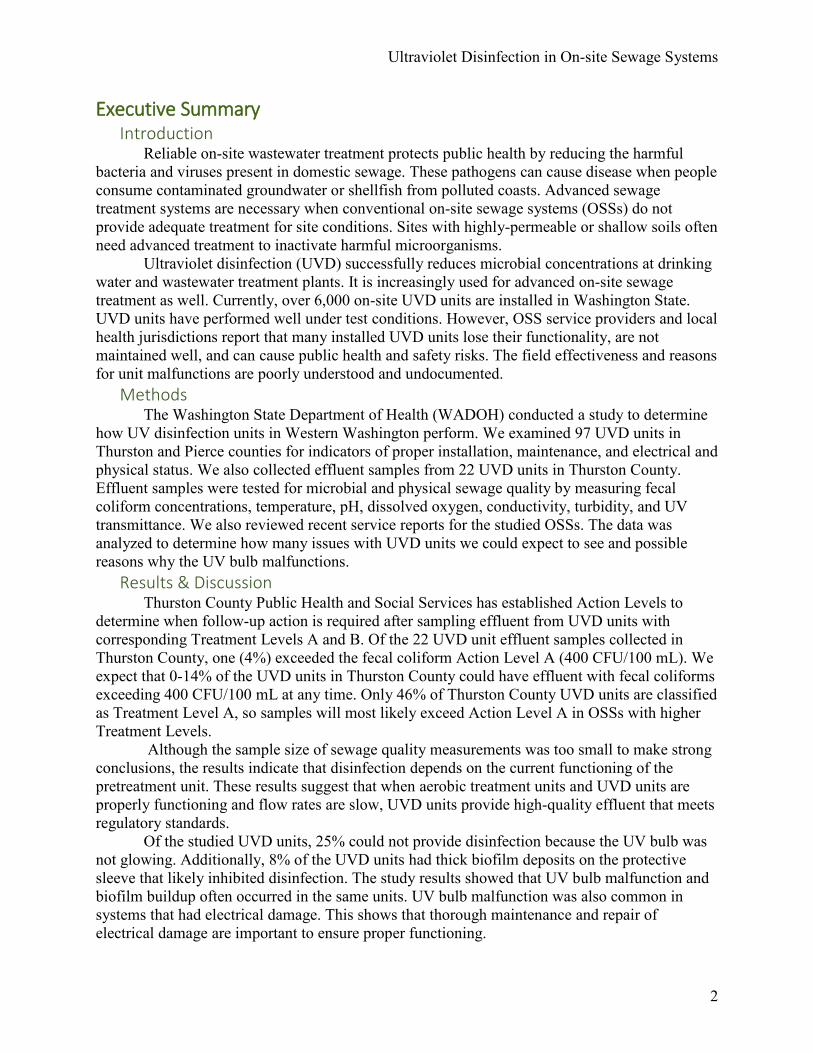
Biofilm buildup was present on 66% of the observed protective sleeves. Table 7 displays the proportion of UVD units with different biofilm levels. Five of the eight UVD units with a high biofilm deposit also had a UV bulb that was not glowing. In addition to biofilms, mineral deposits were present on many of the observed UVD units. However, these were generally thin, small, and located above the water level, so staff did not note when they were present.
Table 7. Biofilm Deposit Levels on UVD Units Where Protective Sleeve Was Accessible
Biofilm Level Pierce County (n=50)
Thurston County (n=29)
All* (n=79)
None 13 (26%) 14 (48%) 27 (34%) Low 17 (34%) 12 (41%) 29 (37%)
Medium 12 (24%) 3 (10%) 15 (19%) High 8 (16%) 0 8 (10%)
*Reported statistics are counts and percentages of all units where the protective sleeve was observed. The protective sleeves of 18 units could not be observed.
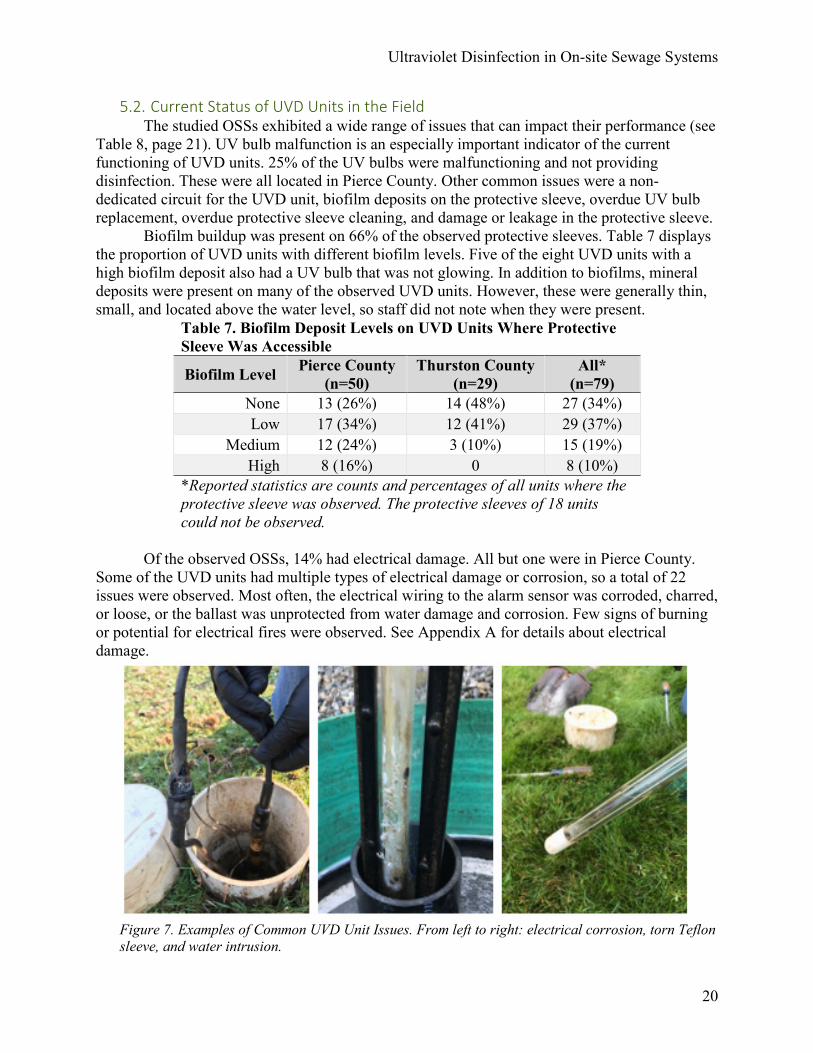
Of the observed OSSs, 14% had electrical damage. All but one were in Pierce County.
Some of the UVD units had multiple types of electrical damage or corrosion, so a total of 22 issues were observed. Most often, the electrical wiring to the alarm sensor was corroded, charred, or loose, or the ballast was unprotected from water damage and corrosion. Few signs of burning or potential for electrical fires were observed. See Appendix A for details about electrical damage.
Figure 7. Examples of Common UVD Unit Issues. From left to right: electrical corrosion, torn Teflon sleeve, and water intrusion.

Ultraviolet Disinfection in On-site Sewage Systems
21
Table 8. Prevalence of Installation, Maintenance, and Key Component Issues in Pierce and Thurston Counties % OSSs in
Pierce Co. (n=65)*
% OSSs in Thurston Co.
(n=32)* Total % (n=97)*
90% CI for Total %
Installation Issues UVD unit on non-dedicated circuit 84.4 75 81.2 80 ± 7
Inadequate cable slack 28.6 0 18.4 19 ± 7 Power switch inaccessible 14.1 6.2 11.5 13 ± 6
UVD housing unit unprotected from flooding or debris 13.8 6.5 11.2 13 ± 6
UV bulb with protective sleeve inaccessible 9.8 6.2 8.6 10 ± 5
UVD unit not protected from power disconnection 8.3 3.1 6.5 8 ± 5
UVD unit inaccessible 9.2 0 6.2 8 ± 5 Cord length between ballast and UV
bulb > 50 feet 1.8 0 1.1 3 ± 3
Control panel not watertight 0 0 0 2 ± 2 Maintenance Issues >2 years since UV bulb replacement 58.1 35.0 50.8 51 ± 10
>1 year since protective sleeve cleaned 57.8 13.3 43.6 44 ± 9
OSS Inspection Overdue** 9.2 22.6 13.5 15 ± 6 Issues with Current Functioning of Key Components
UV bulb off 39.3 0 25.3 26 ± 8 LED indicator incorrect*** 37.5 11.1 30.3 32 ± 14
Damage or leakage in protective sleeve 28 16.7 23.8 25 ± 8
Electrical corrosion or damage 21.1 3.2 14.8 16 ± 7 High biofilm deposit on
protective sleeve 16 0 10.1 11 ± 7
Leaks/cracks in UVD housing unit 5.2 6.5 5.6 7 ± 5 Protective sleeve incomplete 4 0 2.5 4 ± 4
Splice box lid or cord grips loose 1.7 0 1.1 3 ± 3 *Reported statistics are percentages of total systems where the indicator of interest was observed. **OSS inspections did not take place in the last year, for Pierce Co., or in the last six months, for Thurston Co. ***Not all UVD units have an LED indicator light. This is the percent of malfunctioning LED indictors in all units with an LED indicator (n=24 in Pierce Co., n=9 in Thurston Co.).

Ultraviolet Disinfection in On-site Sewage Systems
22
Another important component of the UVD units that commonly malfunctioned was the
LED indicator light. Of the observed UVD units, 33 had LED indicator lights, and 30% of those lights were not functioning properly. Table 9 shows that that the indicator lights were not merely burnt out, but some were erroneously showing that the UV bulb was glowing when it was not. UV bulb status could not be determined in three of the units with LED lights.
On average, the OSSs included in the sample have been maintained slightly more
recently than the average maintenance time for all OSSs with UVD units (See Appendix G, Sample Representativeness). Because the study sample likely excludes some of the units that are not being maintained, the results from the study may underestimate the proportion of UVD units that are currently malfunctioning.
5.3. Maintenance Patterns of Observed UVD Units Review of service inspection reports revealed that many UVD units were not adequately
maintained. Table 10 gives descriptive statistics for the timing of maintenance activities for observed UVD units. Table 10. Time, in Months, since Most Recent Maintenance Performed on UVD Units Pierce Co. (n=65) Thurston Co. (n=32) All (n=97)
OSS Inspection* 6.8 ± 3.7 (0-12.8), 6.9
4.2 ± 4.8 (0.1-20.9), 2.9
6.0 ± 4.3 (0-20.9), 5.4
% Out of Compliance** 9.2 22.6 13.5
UV Bulb Replacement*** 35.8 ± 22.7 (6.0-83.3), 34.6
28.8 ± 16.9 (2.0-67.6), 20.1
33.5 ± 21.1 (2.0-83.3), 29.6
% Longer than Two Years 58.1 35.0 50.8 UV Protective Sleeve Cleaning****
20.1 ± 18.9 (3.7-81.1), 13.5
5.4 ± 6.3 (0.1-20.9), 3.1
15.4 ± 17.3 (0.1-81.1), 13.5
% Longer than One Year 57.8 13.3 43.6 Reported statistics are mean ± SD (min-max), median. *Data missing for one unit in Thurston Co. **For Pierce Co., OSS inspection timing was out of compliance if there was no inspection in the past year. For Thurston Co., OSS inspection timing was out of compliance if there was no inspection in the past six months. ***Data missing for 22 units in Pierce Co., 12 units in Thurston Co. ****Data missing for one unit in Pierce Co., two units in Thurston Co.
Maintenance activities had a few very high measurements that inflated the mean values.
Thus, median values are more appropriate for comparisons across counties. In both counties, maintenance did not meet manufacturer requirements for many UVD units. However, the median times since the most recent performance of maintenance are lower in Thurston County than in Pierce County.
Table 9. LED Indicator Light Malfunction UV Bulb OFF UV Bulb ON
LED Light OFF (or not easily visible) 7 7
LED Light ON 3 13 UV bulb status could not be determined in three of the units with LED lights.

Ultraviolet Disinfection in On-site Sewage Systems
23
Among the observed UVD units, 14% had not been inspected within the time frame necessary in their local health jurisdiction. Additionally, about half of the observed UV bulbs had not been replaced in the past 2 years, and 44% of the protective sleeves had not been cleaned in the past year. In many cases, especially in Pierce County, UVD unit inspections did not include all necessary maintenance.
5.4. Physical Wastewater Quality of UVD Unit Effluent Table 11 shows descriptive statistics for the physical wastewater quality parameters.
Most measurements were within the expected ranges for these parameters. Adequate disinfection was achieved by the UVD units despite a low UVT mean value of 44.5%, which is significantly below the expected 60-74% range for secondary treatment effluent (US EPA, 1986). This could be a result of greater contact time with UV exposure given the low flow rates through the observed UVD units compared to flow rates during product testing (see page 12). The low pH, high turbidity, and low UVT of some samples indicate that these ATUs had performance problems, which could contribute to the higher FC concentrations measured in two samples.
5.5. Relationships between Installation, Maintenance, Current Functioning, and Microbial Load This study lacks sufficient data on effluent bacterial load to examine its relationship with
installation, maintenance, and current status of the UVD unit. Plots of fecal coliform concentrations in OSSs with different UVD unit characteristics indicate that several of these characteristics may be associated with post-UV fecal coliform concentrations (see Appendix A). These include the location of the UVD unit in the OSS, the components of the protective sleeve, the level of biofilm deposit, the age of the OSS, and the make of the UVD unit. Additional research should examine these relationships in greater detail.
Table 11. Descriptive Statistics of Wastewater Quality Parameters for Sampled OSSs Grouped by Post-UVD Fecal Coliform Levels
FC < 200 CFU/100 mL (n=20)
FC ≥ 200 CFU/100 mL (n=2) All (n=22)
Wastewater Quality Measurements Temperature (℃) 21.2 ± 2.3 (16.7-24.5) 21.2 ± 6.3 (16.7-25.6) 21.1 ± 2.5 (16.7-25.6)
pH 6.8 (5.4-8.3) 5.2 (4.8-5.8) 6.8 (4.8-8.3)
Conductivity (µS/cm) 577 ± 293 (227-1,308) 964 ±82 (906-1,022) 612 ±302 (227-1,308)
Dissolved Oxygen (mg/L) 6.0 ± 2.0 (0.57-7.93) 6.8 ± 2.0 (5.4-8.3) 6.1 ± 1.9 (0.6-8.3)
Turbidity (NTU) 16.7 ± 16.24 (0-55.2) 41.33 ± 27.2 (22.1-60.6) 20.4 ± 19.6 (0-60.6)
UV Transmittance (%) 45.8 ± 17.4 (13.3-74.0) 31.1 ± 21.9 (15.6-46.6) 44.5 ± 17.7 (13.3-74.0)
Flow rate (gpm) 0.16 ± 0.16 (0.007-0.60) 0.19 ± 0.02 (0.17-0.20) 0.16 ± 0.16 (0.007-0.60) Descriptive statistics are mean ± SD, (min-max) for all variables except pH, for which the median is reported.
Ultraviolet Disinfection in On-site Sewage Systems
24
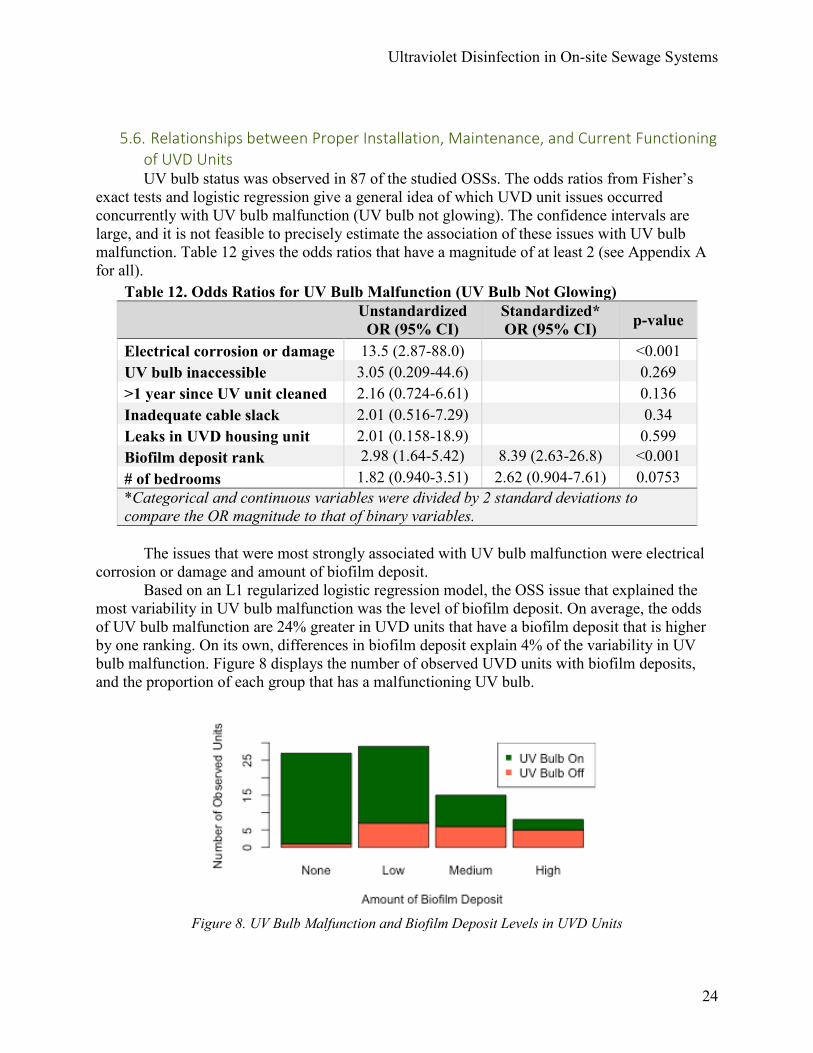
5.6. Relationships between Proper Installation, Maintenance, and Current Functioning of UVD Units UV bulb status was observed in 87 of the studied OSSs. The odds ratios from Fisher’s
exact tests and logistic regression give a general idea of which UVD unit issues occurred concurrently with UV bulb malfunction (UV bulb not glowing). The confidence intervals are large, and it is not feasible to precisely estimate the association of these issues with UV bulb malfunction. Table 12 gives the odds ratios that have a magnitude of at least 2 (see Appendix A for all).
Table 12. Odds Ratios for UV Bulb Malfunction (UV Bulb Not Glowing)
Unstandardized
OR (95% CI) Standardized* OR (95% CI) p-value
Electrical corrosion or damage 13.5 (2.87-88.0) <0.001 UV bulb inaccessible 3.05 (0.209-44.6) 0.269 >1 year since UV unit cleaned 2.16 (0.724-6.61) 0.136 Inadequate cable slack 2.01 (0.516-7.29) 0.34 Leaks in UVD housing unit 2.01 (0.158-18.9) 0.599 Biofilm deposit rank 2.98 (1.64-5.42) 8.39 (2.63-26.8) <0.001 # of bedrooms 1.82 (0.940-3.51) 2.62 (0.904-7.61) 0.0753 *Categorical and continuous variables were divided by 2 standard deviations to compare the OR magnitude to that of binary variables.
The issues that were most strongly associated with UV bulb malfunction were electrical
corrosion or damage and amount of biofilm deposit. Based on an L1 regularized logistic regression model, the OSS issue that explained the
most variability in UV bulb malfunction was the level of biofilm deposit. On average, the odds of UV bulb malfunction are 24% greater in UVD units that have a biofilm deposit that is higher by one ranking. On its own, differences in biofilm deposit explain 4% of the variability in UV bulb malfunction. Figure 8 displays the number of observed UVD units with biofilm deposits, and the proportion of each group that has a malfunctioning UV bulb.
Figure 8. UV Bulb Malfunction and Biofilm Deposit Levels in UVD Units

Ultraviolet Disinfection in On-site Sewage Systems
25
5.7. Relationships between Wastewater Quality Parameters and Fecal Coliform Concentrations The relationships of wastewater quality parameters with fecal coliform concentrations
were first evaluated through scatterplots, which showed that conductivity, turbidity, UV transmittance, flow rate, and DO were possibly correlated with log-transformed fecal coliform concentrations (see Appendix A). Spearman’s rank correlations indicate which parameters increase most strongly as log-transformed fecal coliform concentrations increase (see Table 13).
Table 13. Spearman’s Rank Correlations between Wastewater Quality Parameters and log-Transformed Fecal Coliform Concentrations (n=22)
Spearman’s rho p-value
Conductivity [µS/cm2] 0.67 <0.001 Turbidity [NTU] 0.49 0.032 Flow rate [gpm] 0.41 0.063 UV Transmittance [%] -0.40 0.063 Dissolved Oxygen [mg/L] -0.01 0.964
Log-transformed effluent fecal coliform concentrations had a strong positive correlation
with conductivity (correlation coefficient =0.67). Flow rate and turbidity were also positively correlated with log-FC concentrations, and ultraviolet transmittance was negatively correlated with log-FC concentrations. The data did not indicate that there was any correlation between dissolved oxygen and log-FC concentrations. Because of the small sample size, these correlations should be confirmed with additional research.

Ultraviolet Disinfection in On-site Sewage Systems
26
6. Discussion of Study Results
6.1. Field Status of Ultraviolet Disinfection Units 6.1.1. Effluent Quality The sewage quality results obtained in this study indicate that when UVD units are
properly installed, maintained, and functioning well, and OSS flow rates are minimal, fecal coliform concentrations are low in UVD unit effluent. However, these results should be interpreted with caution.
On-site sewage organic and microbial loads are highly variable, as sewage generation is influenced by the OSS owner’s habits and activities, and sewage treatment can vary based on the functioning of the pretreatment units and environmental conditions (Hutzler, Fancy, & Waldorf, 1977). Without multiple samples from a single OSS, it is impossible to capture this variability in the measured fecal coliform concentrations. The flow rates of the study’s effluent samples were also low (0.007-0.60 gpm, compared to NSF testing results, which report flow rates of 0.69–1.7 gpm), so the samples received a high UV exposure time. At faster flow rates, the time of UV exposure would be shorter, which may result in a smaller UV dose leading to higher effluent fecal coliform concentrations. Another limitation is that some of the samples were collected when flow was induced. Therefore, grab sample results should only be interpreted as a general indicator of the effectiveness of the UVD unit at a single point in time. The grab sample measurements of post-UV fecal coliform concentrations suggest a higher quality of UVD unit effluent compared to ATU effluent. If properly maintained, ATUs can reduce fecal coliform concentrations to levels between 1,000 and 10,000 CFU/100 mL (US EPA, 2002). However, based on treatment product testing reports, very few ATUs are capable of achieving a 30-day geometric mean less than 50,000 CFU/100 mL. Compared to these levels, the properly-functioning UVD units observed in the study are likely reducing fecal coliform concentrations by a minimum of 1- to 4-logs.
6.1.2. Condition of UVD Units in the Field Of the 97 UVD units observed, 22 (25%) were incapable of properly disinfecting sewage
due to UV bulb malfunction. In five of the OSSs, the UV bulb was not glowing and was also covered with a high biofilm deposit. Another three (4%) had high biofilm deposits, which can inhibit disinfection by reducing UV dose (Tchobanoglous et al., 2014). Because the OSSs included in the study have, on average, been maintained more recently than all OSSs with UVD units, it is likely that more than 29% of UVD units in Washington State are not properly functioning.
Biofilm buildup and UV bulb malfunction were strongly associated. It is likely that both UV bulb malfunction and high biofilm buildup are the results of inadequate maintenance. This is shown in the proportion of units that have not been cleaned in the past year. In Pierce County, 64% of UVD units with UV bulb malfunction and medium/high biofilm that has not been cleaned in the past year. This is greater than the proportion of UVD units with glowing UV bulbs and no/low biofilm that has not been cleaned in the past year (43%). This indicates that inadequate maintenance is a possible reason for both biofilm buildup and UV bulb malfunction. Electrical damage was also strongly associated with UV bulb malfunction, indicating that prevention and correction of electrical issues is important in maintaining UVD units.
The types of issues observed in this study have been reported in other cases. Electrical shortages and biofilm buildup have been observed in Kitsap County, where 44% of the systems observed during regular maintenance inspections were reported as non-operational (Kiess, 2014).

Ultraviolet Disinfection in On-site Sewage Systems
27
Other local health jurisdictions have not conducted extensive reviews of the frequency of UVD unit malfunctions, but some studies have observed biofilm buildup and electrical problems that led to bulb malfunction (Leverenz et al., 2006; Loomis et al., 2004). Due to the high prevalence of these issues, it is important to consider how to optimize the performance of UVD units and prevent future malfunctions.
While 14% of the observed UVD units had electrical damage, few presented a direct risk to the safety of OSS owners or maintenance providers. Contact with some of the systems could lead to a risk of electrical shock, but few introduced a risk of fires or other significant damage. The larger concern is the proportion of units that are not disinfecting sewage effluent, as these may discharge sewage with high pathogen loads.
6.2. Inadequate Maintenance of UVD Units Review of service reports showed that maintenance of many observed UVD units was in
violation of WAC rules. Of the UVD units, 14% had not been inspected within the time frame that LHJs require. The prevalence of systems out of compliance for inspection timing was greater in Thurston County than in Pierce County. Additionally, 51% of the observed UV bulbs had not been replaced in the past two years, and 44% of the protective sleeves had not been cleaned in the past year. This was more common in Pierce County than in Thurston County. This indicates that in many cases, UVD unit inspections did not include all necessary maintenance. Manufacturers indicate that maintenance is important to ensure long-term performance of the UVD unit. The lack of adequate maintenance could contribute to the high levels of UV bulb malfunction and biofilm buildup observed in the study.
6.3. Local Management Plan Important in Ensuring Proper UVD Unit Performance Significant differences were observed in the proportion of malfunctioning UVD units in
different health jurisdictions. In Thurston County, no units were observed where UV bulbs were not glowing, and three units had a medium-level biofilm deposit. However, in Pierce County, almost 40% of the observed units had a malfunctioning UV bulb, and 40% had a medium or high biofilm deposit. The discrepancies observed between the counties may be due to differences in inspection frequency, performed maintenance, follow-up and repair of deficient UVD units, or enforcement under different management plans. Service records indicate that on average, certified maintenance providers in Thurston County cleaned and replaced UV bulbs more recently than in Pierce County (see Sample Representativeness table in Appendix G).
A recent study by the Washington On-site Sewage Association (WOSSA) and TPCHD found similar patterns in the maintenance of proprietary OSSs in the Pierce County marine recovery area (MRA). Maintenance reports were often incorrect or incomplete, and interim maintenance, including UV bulb replacement, was not performed (TPCHD & WOSSA, 2014). Another issue was that proprietary products, including UV bulbs, were not replaced regularly, and UVD units were serviced by maintenance providers without expertise in specialized systems (TPCHD & WOSSA, 2014). Both these observations and the results of our study indicate that some UVD units are not receiving the maintenance necessary to prevent malfunctions.
6.4. Lack of Access for Maintenance 6.4.1. Access to UV Disinfection Units Several of the OSSs observed in Pierce County were built in such a way that the UV bulb
was inaccessible. There were 6% of the UVD units buried without access points or placed in a tank that could not be easily opened due to installation or lack of maintenance. In these cases, no

Ultraviolet Disinfection in On-site Sewage Systems
28
access point was indicated on the record drawing. These OSSs were installed before the 2007 effective date of WAC 246-272A requiring UVD units to have service access and be installed to facilitate complete maintenance and cleaning (or the installation date was unknown).
In 9% of the remaining observed OSSs, the installation provided access to the UVD unit, but the UV bulb and protective sleeve were inaccessible, usually because they were stuck within the PVC or ABS pipe of the housing unit. In addition to these OSSs, 18% of the observed units had a short cable between the UV bulb and its housing that hindered proper cleaning. Installation of units that allows for proper maintenance and official documentation of access points are necessary to enable ongoing maintenance.
6.4.2. Freefall Sampling Port Access The local management plan in Thurston County requires quarterly sampling of UVD unit
effluent. However, 31% of the observed OSSs in Thurston County did not provide access to a freefall effluent sample. Access to a freefall sample was lacking when the system was built before the sampling requirement was initiated, the sampling port was not designed with enough vertical separation for easy access, or the sampling port was flooded. TPCHD does not require sampling, so OSSs in Pierce County did not provide access to freefall effluent samples. Without a freefall sampling port, service providers cannot collect a representative effluent sample. Therefore, any UVD units installed in the future should ensure easy access to a sampling port. Local health jurisdictions should also ensure that a well-designed sampling port is included and labeled in the design submittal and record drawing.
The Recommended Standards and Guidance for Proprietary On-site Wastewater Treatment Products includes examples of in-line sampling ports that can be used for freefall effluent sampling from UVD units (WADOH, 2012). Installation options that provide access to freefall samples include:
• Installing UVD unit in pump chamber with an additional access lid above the UVD unit outfall,
• Extending UVD unit outfall pipe so that it is accessible through the access lid above the effluent pump (this option is especially applicable for retrofitting OSSs for freefall effluent sampling), and
• Installing UVD units in a separate basin with an access lid above the UVD unit outfall.
We encourage manufacturers to include these options in their installation and maintenance literature.
6.5. Wastewater Quality Parameters Indicate Importance of ATU Performance Although the sample size of sewage quality measurements was too small to make strong
conclusions, the measurements show an overall trend. The effluent conductivity of our samples was highly correlated with fecal coliform levels (correlation coefficient=0.51). Dissolved inorganic ions (measured by conductivity) and other particles in sewage absorb or refract UV light, which reduces the UV dose that reaches the microorganisms in sewage (Hijnen et al., 2006; US EPA, 2015). Therefore, the level of disinfection depends on the influent quality to the UVD units. The current functioning of the ATU is an important determinant of fecal coliform discharge, even when it is followed by UV disinfection.

Ultraviolet Disinfection in On-site Sewage Systems
29
7. Homeowner Questionnaire Results The study’s letter of invitation included six questions for owners of UVD units. Answers
to the questionnaire were returned by 237 homeowners. All participating homeowners knew where their OSS was located. Of those, 53% had a
record drawing for their system, and 23% had a manual from the manufacturers of their UVD unit (see Figure 9).
Figure 9. Homeowners’ Access to OSS Records and Manuals
Most homeowners had the contact information of their certified maintenance provider to use if they were concerned about the functioning of their OSS (see Table 14). Certified maintenance providers can play an important role in communicating with homeowners and ensuring the problems are corrected in cases of OSS malfunction.
Table 14. Homeowners’ Access to Contact Information for Key Players in OSS Maintenance and Management
Contact Person % Homeowners Have
Information Designer 9 Installer 19 O&M Provider 82 County Health Department 17 Department of Health 8 None 4
Record Drawing UVD Unit Manual

Ultraviolet Disinfection in On-site Sewage Systems
30
The OSS topics of greatest interest to homeowners were how to prevent a future failure in their OSS and why they have a UVD unit (see Table 15). Between one half and one third of homeowners were interested in the topics presented, indicating that residents of Thurston and Pierce County who have UVD units and volunteered for the study want to learn more about their OSS. Homeowners also suggested additional topics of education, especially why annual inspections are required for their OSSs.
Table 15. Proportion of Homeowners Interested in Different OSS Topics
OSS Topic % Homeowners Interested
OSS Components 33 How to inspect OSS 38 What to put down drain 35 How to prevent failure 50 Why have UVD unit 46
Most homeowners (56%) do not personally inspect their UVD units, which is another
indicator of the importance of certified maintenance providers in inspecting and maintaining UVD units. However, some homeowners regularly check to make sure that their UVD unit is working, for example by checking the indicator LED light or listening for the alarm (see Figure 10 for frequency of inspections).
Figure 10. Frequency of Homeowner Inspections of UVD Units

Ultraviolet Disinfection in On-site Sewage Systems
31
8. Limitations and Suggestions for Further Research
8.1. Limitations of Study Design The study design and conditions under which the study was performed imposed several
limitations on the quantity and quality of collected data. The study was limited by time constraints. The start time was delayed because of issues with mailing recruitment letters and delivery of supplies. This delay limited the number of OSS observed and resulted in an extension of the report-writing timeline. In addition, the study’s sample size depended on the number of homeowners who volunteered to participate. This was not a limiting factor in Pierce County due to the abundance of volunteers. However, even after extensive recruitment, only 32 Thurston County homeowners volunteered to participate. The unexpected lack of freefall sampling ports further limited number of freefall UVD effluent samples.
Because we collected only one sample from each OSS that was sampled, the study did not capture the long-term variability at individual OSSs. A possible follow-up study could collect multiple sewage samples at individual sites to characterize differences due to household sewage generation patterns, OSS design and performance, and long-term maintenance.
8.2. Limitations of Observed Conditions This study did not capture important determinants of UVD unit effectiveness due to the
characteristics of the observed OSSs. Although UVD unit effluent samples were collected during different times of the day, most OSSs had slow flow rates. Additionally, the highest flow rates in the study were achieved by inducing flow through the system, which may have caused dilution of sewage. Thus, the study could not determine the effectiveness of UVD units during periods of naturally-high flow.
Because the study was conducted during summer months, we observed OSSs during dry conditions. Precipitation and water accumulation could impact the performance of UVD units, but the study did not capture these characteristics. Additionally, freefall sampling ports were not accessible in OSSs with a malfunctioning UV bulb, so the study was not able to determine fecal coliform concentrations in effluent from these units. We can assume that the sewage quality will not change significantly as it flows through a non-functioning system and that in these cases, the UVD unit effluent was similar to pretreatment unit effluent. However, to better understand UVD unit field performance, OSSs with malfunctioning UVD units and freefall sampling ports could be identified and examined in greater detail.
8.3. Limitations in Current On-site Wastewater Standards of Practice The usefulness of the collected data is also limited by the lack of single-sample standards
for fecal coliform. The treatment level thresholds used as test standards for approval of OSS treatment sequences are not intended to be used as field compliance standards (WAC 246-272A-0110 (5)). The testing standards for fecal coliform are 30-day geometric means, which represent the average performance over a sampling period. Because grab samples from the same OSS can be highly variable, it is not appropriate to compare single results to 30-day geometric means. However, Washington State has not established a single-sample threshold for compliance. Thus, results from single grab samples cannot be compared with a compliance standard.
Another limitation is the current dependence on freefall samples to characterize UVD effluent quality. Because of bacterial regrowth in pump chambers, it is difficult to relate pump

Ultraviolet Disinfection in On-site Sewage Systems
32
chamber fecal coliform concentrations to those in UVD unit effluent. However, pump chamber samples are often the only accessible sample. Future research should examine alternative samples that could be used to characterize post-UV disinfection microbial load in a larger and more variable sample of OSSs.
8.4. Suggestions for Follow-up Research This study has identified several important aspects of UVD unit malfunction. To better
understand how these factors impact sewage disinfection, additional research should examine them in greater detail. The study identified a high prevalence of UVD units with biofilm deposit, but was not able to define what sewage characteristics and OSS conditions contribute to biofilm buildup or to what degree biofilms minimize disinfection. The study also suggested that conductivity could be an important predictor of effluent microbial load, even when the UVD unit is properly functioning. This relationship should be considered in greater detail by considering household sewage generation and ATU treatment.
The results of this study indicate that under most conditions, properly functioning UVD units reduce effluent fecal coliform concentrations to very low levels. However, the study was not able to quantify how properly functioning UVD units reduce risks to public health. A risk assessment that considers the risk reduction due to ultraviolet unit disinfection of on-site sewage would help determine the importance of UV disinfection under different conditions.

Ultraviolet Disinfection in On-site Sewage Systems
33
9. Conclusions The results of this study indicate that UVD units in the field are capable of reducing fecal
coliform concentrations to very low levels, but that a high proportion of UVD units installed in Western Washington are not adequately maintained or working correctly and unable to provide disinfection. The issues observed most commonly were:
• UVD units on non-dedicated circuits, • infrequent replacement of UV bulbs, • infrequent cleaning of UV bulb protective sleeves, • biofilm buildup on protective sleeves, and • UV bulbs not glowing.
Biofilm buildup and electrical damage were most strongly correlated with UV bulbs not glowing, which indicates that maintenance is important in preventing malfunctions. Although a small sample size limits the conclusions that can be made, the data suggest that the current functioning of ATUs is an important determinant of UVD unit effectiveness.
Many observed UVD units were not receiving adequate maintenance during service inspections and their installation did not provide sufficient access for maintenance and repairs. The study also discovered that issues with UVD units are more common in Pierce County than in Thurston County, indicating the importance of a local management plan that enforces proper installation, maintenance, and operation.

Ultraviolet Disinfection in On-site Sewage Systems
34
10. Recommendations
10.1. Recommendations for WADOH and Washington State Board of Health • Consider requirements for local management plans to ensure adequate operation and
maintenance of UVD units and associated proprietary products. Possible requirements include regular sampling of UVD effluent with comparison to newly-determined, consistent field compliance standards and increased limitations on where UVD units can be installed. All stakeholders should be included in management plan design.
• Revise rule to require the installation of freefall sampling port for UVD unit effluent sampling and show example installations (such as those in the Proprietary Treatment Products Recommended Standards & Guidance document).
• Address service compliance issues during rule development. • Clarify minimum service requirements for registered treatment products using UV
disinfection, including frequency of bulb replacement and unit cleaning. • Determine consistent reporting requirements for UVD unit inspection and repair.
10.2. Recommendations for Local Health Jurisdictions (LHJs) • Improve operation and maintenance management plan to ensure detailed inspections and
consistent maintenance and repairs of UVD units. • Do not permit UVD units if they cannot be adequately maintained. • Enforce bulb replacement and cleaning, which could include incentivizing proper
maintenance. • Ensure that UVD units have been inspected for proper installation of electrical
components. • Require UVD unit manufacturers to certify that maintenance providers are trained and
competent to install, maintain, and repair UVD units, including the electrical components • Ensure that record drawings include specific references to UVD unit access points. • Ensure the manufacturer’s product literature, including performance specifications and
maintenance recommendations needed for operation, monitoring, maintenance or repair of the UVD unit is submitted to the OSS owner with the record drawing upon completion of the OSS construction.
10.3. Recommendations for Designers, Installers & Certified Maintenance Providers (CMPs)
• Design and install OSSs with adequate access to UVD unit and sampling port. • Ensure that UVD units have a dedicated circuit and meet all other manufacturer
requirements. • Understand that UVD units are an integral component of the approved OSS treatment
system and therefore certify that UVD units are clean at each inspection, replace UV bulbs at least every 2 years, and correct electrical problems and other UVD unit problems as needed.

Ultraviolet Disinfection in On-site Sewage Systems
35
10.4. Recommendations for Manufacturers of UVD Units • Improve design to protect against sleeve damage. • Improve design to make UVD units more watertight and prevent electrical issues. • Ensure that electrical cables are long enough to allow for bulb maintenance. • Determine whether LED indicator lights are beneficial and improve design to ensure
proper long-term functioning. • Consider the option of a separate basin as a suggested installation configuration in
manufacturer literature.
10.5. Recommendations for Homeowners and Residents • Learn more about how UVD units function, including the water quality and generation
patterns that impact performance. • Discuss current functioning and operation and maintenance expectations with certified
maintenance providers. • Maintain a current operation and maintenance service contract. • Learn about the LHJ requirements for maintenance and corrections and follow through
accordingly based on CMP’s inspection findings.
Ultraviolet Disinfection in On-site Sewage Systems
36
11. Acknowledgments This study would not have been completed without the consistent help of many
contributors. Thomas Gries at Department of Ecology helped throughout the study by advising about quality assurance and reviewing documentation. We are thankful for the important contributions of Tacoma-Pierce County Health Department (TPCHD) staff, including Gary Porter, Brad Costello, and Emma McDaniel, and Thurston County Public Health and Social Services (TCPHSS) staff, including Steve Petersen, Erik Iversen, Dawn Peebles, Stephanie Kenny, Joel Plewa, Amy Crass, and Jenna White. Local health jurisdiction staff ensured a successful study by communicating with study participants, providing extensive information and advising about study design. The staff at the Thurston County Environmental Health Laboratory helped by advising on sampling design, accommodating the study schedule, and providing quick sample analysis.
University of Washington (UW) faculty members Tania Busch Isaksen and John Scott Meschke played a vital role in advising about study design and implementation and giving extensive feedback throughout the study. The UW Statistics Consultants gave invaluable assistance in determining how to best analyze study results.
The certified maintenance providers in Pierce and Thurston counties were also very helpful during the study. They responded to homeowner questions and conducted follow-up visits when necessary, ensuring that the study ran smoothly. Randy Jackson and Evan Cusack also helped by explaining site inspections and encouraging study participation in Thurston County. Finally, the study would not have been possible without the many homeowners and residents of Pierce and Thurston counties who volunteered for the study. They contributed time to complete study surveys, prepared on-site sewage systems for inspection, and understandingly welcomed WADOH staff onto their properties, making it possible to gather information about ultraviolet disinfection unit performance.
Ultraviolet Disinfection in On-site Sewage Systems
37
12. References Bremer, J. E., & Harter, T. (2012). Domestic wells have high probability of pumping septic tank
leachate. Hydrology and Earth System Sciences, 16, 2453–2467. https://doi.org/10.5194/hess-16-2453-2012
Brenner, B. (2000). Fouling of UV Lamps with Varying Influent Water Quality. In Proceedings of the Water Environment Federation (pp. 74–96).
Carroll, S. P., Goonetilleke, A., & Hargreaves, M. (2004). Assessment of environmental and public health risk of on-site wastewater treatment systems. In K. Mankin (Ed.), On-Site Wastewater Treatment X, Conference Proceedings (pp. 368–276). Sacramento, CA: American Society of Agricultural Engineers. https://doi.org/701P0104
Consortium of Institutes for Decentralized Wastewater Treatment (CIDWT). (2006, January). Residential Onsite Wastewater Treatment Systems: An Operation and Maintenance Service Provider Program. Ames, IA: Consortium of Institutes for Decentralized Wastewater Treatment (CIDWT). Midwest Plan Service. Iowa State University. Retrieved from http://www.onsiteconsortium.org/nationalomsp.html
Donlan, R. M. (2002). Biofilms: Microbial Life on Surfaces. Emerging Infectious Diseases, 8(9), 881–890. Retrieved from https://www.ncbi.nlm.nih.gov/pmc/articles/PMC2732559/pdf/02-0063_FinalP.pdf
Hastie, T., & Qian, J. (2016). Glmnet Vignette. Stanford, CA. Retrieved from https://web.stanford.edu/~hastie/Papers/Glmnet_Vignette.pdf
Hijnen, W. A. M., Beerendonk, E. F., & Medema, G. J. (2006). Inactivation credit of UV radiation for viruses, bacteria and protozoan (oo)cysts in water: A review. Water Research, 40(1), 3–22. https://doi.org/10.1016/j.watres.2005.10.030
Hutzler, N., Fancy, J., & Waldorf, L. (1977). Performance of Aerobic Treatment Units. In Proceedings of the Second National Home Sewage Treatment Symposium (pp. 149–163). Chicago, IL.
Kiess, J. (2014). Performance Status of Ultraviolet Light Disinfection Units for Septic Systems. In Kitsap Public Health Board Meeting Minutes March 4, 2014. Kitsap Public Health District.
Krstajic, D., Buturovic, L. J., Leahy, D. E., & Thomas, S. (2014). Cross-validation pitfalls when selecting and assessing regression and classification models. Journal of Cheminformatics, 6, 1–15. https://doi.org/10.1186/1758-2946-6-10
Leverenz, H., Darby, J., & Tchobanoglous, G. (2006). Evaluation of Disinfection Units for Onsite Wastewater Treatment Systems. Davis, CA: Center for Environmental and Water Resources Engineering, University of California, Davis. Retrieved from http://www.waterboards.ca.gov/water_issues/programs/owts/docs/disinfection.pdf
Loomis, G., Dow, D., Jobin, J., Green, L., Herron, E., Gold, A., … Blazejewski, G. (2004). Long-term treatment performance of innovative systems. In K. Mankin (Ed.), On-Site Wastewater Treatment X, Conference Proceedings (pp. 408–418). Sacramento, CA: American Society of Agricultural Engineers.
Nessim, Y., & Gehr, R. (2006). Fouling Mechanisms in a Laboratory-Scale UV Disinfection System. Water Environment Research, 78(12), 2311–2323. https://doi.org/10.2175/106143006X95474
Norweco. (2014). Model AT 1500 UV Disinfection System Installation and Operation Manual. Norwalk, OH: Norweco, Inc. Retrieved from

Ultraviolet Disinfection in On-site Sewage Systems
38
https://www.norweco.com/pdf/AT1500_iando.pdf Salcor Inc. (2016, June). UV Disinfection Unit Model 3G, Installation, Operation &
Maintenance Manual. Fallbrook, CA: Salcor, Inc. Tacoma-Pierce County Health Department (TPCHD). (2014). On-Site Sewage Regulation,
Environmental Health Code. Tacoma, WA: Tacoma-Pierce County Health Department. Tacoma-Pierce County Health Department (TPCHD), & Washington On-site Sewage
Association (WOSSA). (2014). Evaluation of O&M Inspection Practices: Summary of Program Recommendations. In Pierce County Pollution Identification and Correction (PIC) Project Final Report for Washington State Department of Health. Olympia, Washington: Washington State Department of Health.
Tchobanoglous, G., Stensel, H. D., Tsuchihashi, R., Burton, F., Abu-Orf, M., Bowden, G., & Pfrang, W. (2014). Wastewater Engineering: Treatment and Resource Recovery (Fifth). New York, NY: McGraw-Hill Education.
Thomas, J. (2018). Costs of UV Units, Email. Thurston County Public Health and Social Services - Environmental Health. (2008). Effluent
Sampling Requirements as a Condition of Operational Certificates. Olympia, WA. Thurston County Public Health and Social Services (TCPHSS). (2014). Thurston County On-
Site Sewage Management Plan 2014 Update. Thurston County Public Health and Social Services Department, Environmental Health Division. Retrieved from http://www.co.thurston.wa.us/health/ehomp/
US EPA. (1986). Design Manual: Municipal Wastewater Disinfection. Cincinnati, OH: U.S. Environmental Protection Agency.
US EPA. (2000). Decentralized Systems Technology Fact Sheet: Aerobic Treatment. Washington, D.C.: US Environmental Protection Agency, Office of Water.
US EPA. (2002). Onsite Wastewater Treatment Systems Manual. Washington, D.C.: US Environmental Protection Agency. Retrieved from https://www.epa.gov/septic/onsite-wastewater-treatment-and-disposal-systems
US EPA. (2003). Ultraviolet Disinfection Guidance Manual. Washington, D.C.: US Environmental Protection Agency, Office of Water.
US EPA. (2015). Wastewater Technology Fact Sheet - Disinfection for Small Systems EPA 832-F-03-024. US Environmental Protection Agency.
Washington Administrative Code 246-272A: On-site Sewage Systems (2010). Retrieved from http://apps.leg.wa.gov/WAC/default.aspx?cite=246-272A&full=true
Washington State Department of Health. (2016). Puget Sound Septic System Management Programs - Best Management Practices Reference Manual. Tumwater, WA. Retrieved from https://www.doh.wa.gov/Portals/1/Documents/Pubs/332-166.pdf
Washington State Department of Health (WADOH). (2012, July). Proprietary On-site Wastewater Treatment Products, Recommended Standards and Guidance for Performance, Application, Design, and Operation and Maintenance. Olympia, WA: Washington State Department of Health.
Water Environment Research Foundation (WERF). (2010). Performance & Cost for Decentralized Unit Processes, Disinfection. Retrieved from http://www.werf.org/c/decentralizedcost/t4_constructed_wetla.aspx
Weaver, R. W., & Richter, A. Y. (2003). Disinfection Devices: Field Experiences. College Station, TX. Retrieved from http://twri.tamu.edu/reports/2003/2003-013/sr2003-013.pdf
(Weaver & Richter, 2003)(Hastie & Qian, 2016)(Krstajic, Buturovic, Leahy, & Thomas, 2014) (Washington Administrative Code 246-272A: On-site Sewage Systems, 2010)