Embed Size (px)
Citation preview

Portugaliae Electrochimica Acta 2013, 31(2), 79-93
DOI: 10.4152/pea.201302079
PORTUGALIAE
ELECTROCHIMICA
ACTA ISSN 1647-1571
Physicochemical Study and Corrosion Inhibition Potential of
Ficus tricopoda for Aluminium in Acidic Medium
N.O. Eddy,a,b,*
P.O. Ameh,a M.Y. Gwarzo,
a I.J. Okop
b and S.N. Dodo
a
a Department of Chemistry, Ahmadu Bello University, Zaria, Kaduna State, Nigeria
bDepartment of Chemistry, Akwa Ibom State University, Ikot Akpaeden. Mkpat Enin, Akwa Ibom
State, Nigeria
Received 24 November 2012; accepted 23 April 2013
Abstract
Gas chromatography mass spectrophotometer (GCMS) analysis of Ficus tricopoda gum
indicated the presence of 4.75, 56.15, 32.10 and 7.00 % of camphene, sucrose, 2-
methylene cholestan-3-ol and 7-hexadecenal, respectively. Several stretching and
bending vibrations were observed in the Fourier transformed infra-red (FTIR) spectrum
of the gum. Physicochemical examinations of the gum revealed that it is pale yellow in
colour, mildly acidic, ionic and display characteristics of sour taste. The solubility of the
gum in water was found to increase with increase in temperature. Knowledge of the
chemical constitution of the gum (hence chemical structures of its constituents) was
useful in predicting the corrosion inhibition potential of Ficus tricopoda (FT) gum.
Consequently, the gum was found to be a good adsorption inhibitor for the corrosion of
aluminum in solution of H2SO4. The adsorption of the gum (which, followed first order
kinetic) was found to be endothermic at FT gum critical concentration of 0.3 g/L and
exothermic at concentrations above the critical limit. The short coming of the Langmuir
adsorption model in describing the existent of interaction between the molecules of the
gum was complimented by the Frumkin and Dubinin-Radushkevich adsorption models.
Calculated values of activation and free energies of activation indicated that the
adsorption of Ficus tricopoda gum on Al surface exhibited both physical and chemical
adsorption mechanism.
Keywords: corrosion, aluminum, inhibition, Ficus tricopoda gum.
Introduction
Corrosion inhibition is essential in combating the negative environmental and
industrial impact of corrosion; being one of the most effective methods of
* Corresponding author. E-mail [email protected]

N.O. Eddy et al. / Port. Electrochim. Acta 31 (2013) 79-93
80
preventing metal in petroleum, fertilizers, metallurgical and other industries,
corrosion inhibition is concern with the use of chemical substances that can
retard the rate of corrosion of a metal in contact with an aggressive medium [1-
2].
Several researches have been successful in the discovery of broad ranges of
inhibitors for the control of corrosion [3-5]. However, current challenges are
based on utilization of inhibitors that are environmentally friendly, easy
available, cost effective and biodegradable [6]. These conditions are hardly
fulfilled by most inorganic inhibitors such as chromate and heavy metal rich
compounds, hence current researches are directed towards the use of green
inhibitors for the inhibition of the corrosion of metals [7-9]. On the list there are
extracts of plant and animal and some gum exudates [10-17].
Available literature revealed that most corrosion inhibitors are chosen through
knowledge of their chemical structures [18]. Generally, organic compounds that
contain either hetero atoms, aromatic ring, π-electron, or long carbon chain are
found to be effective corrosion inhibitors [19]. Therefore, the present study is
aimed at investigating the physicochemical parameters of FT gum and its
potential as a green inhibitor for the corrosion of aluminum in HCl medium.
Materials and methods
Samples of Ficus tricopoda (FT) gum were obtained as dried exudates from their
parent trees grown at Samaru, Zaria in Sabon Gari LGA of Kaduna State of
Nigeria. The outer bark of the tree was broken using a small axe. The cut was
widened upward and downward and the gum formed was collected. The crude
gum was purified through dissolution in cold distilled water. The solution was
strained through muslin and centrifuged to obtain a small quantity of a dense gel.
The straw coloured supernatant liquor obtained was separated and acidified to a
pH of 2 with dilute hydrochloric acid. Ethyl alcohol was added until the liquor
was 80 percent alcohol. The gum precipitated out was removed by centrifugation
at a rate of 2000 revolution per minutes, washed with alcohol, ether and dried in
a desiccator [20].
Determination of physicochemical properties of the gum The pH of the gum was determined using a pre calibrated Oklon pH meter. The
solubility of the gum was determined in cooled and hot distilled water, acetone
and chloroform using the method reported by Carter [21].
Corrosion studies Aluminum alloy sheet of composition (wt. %, as determined by quantiometric
method) Mn (1.28), Pb (0.064), Zn (0.006), Ti (0.029), Cu (0.81), Si (0.381), Fe
(0.57) and Al (96.65%) was used. The sheets were mechanically pressed and cut
into different coupons, each of dimensions, 5 x 4 x 0.11cm. Each coupon was
degreased by washing with ethanol, cleaned with acetone and allowed to dry in
the air before preservation in a desiccator. All reagents used for the study were
analar grade and double distilled water was used for their preparation.

N.O. Eddy et al. / Port. Electrochim. Acta 31 (2013) 79-93
81
Weight loss and hydrogen evolution experiments were carried out as reported
elsewhere [18]. From weight loss measurements, inhibition efficiency, corrosion
rate and degree of surface coverage were calculated using the following
equations
where W1 and W2 are the weight losses (g) for aluminum in the presence and
absence of the inhibitor, θ is the degree of surface coverage of the inhibitor, ∆W
= W2 – W1, A is the area of the aluminum coupon (in cm2), t is the period of
immersion (in hours) and ∆W is the weight loss of aluminum after time, t. In
gasometric experiment, the test solution was poured into the reaction vessel.
Upon the introduction of mild steel, the flask was quickly corked and the rise in
volume of the paraffin due to hydrogen evolution was noted after every minute
until a steady volume was observed. Inhibition efficiency was calculated as the
quotient of the difference between the volume of hydrogen evolved by the blank
and that of the test solution to the volume of hydrogen evolved by the blank.
FTIR analysis FTIR analysis of the gum was carried out and that of the corrosion products (in
the absence and presence of the gum) were carried out using a Scimadzu FTIR-
8400S Fourier transform infra-red spectrophotometer. The sample was prepared
in KBr and the analysis was carried out by scanning the sample through a wave
number range of 400 to 4000 cm-1
.
GC-MS analysis GC-MS analysis was carried out on a GC Clarus 500 Perkin Elmer system
comprising of an AOC-20i auto-sampler and gas chromatograph interfaced to a
mass spectrometer (GC-MS) instrument employing the following conditions:
column Elite-1 fused silica capillary column (30 x 0.25 mm ID x 1 µM df,
composed of 100 % dimethylpoly diloxane), operating in electron impact mode
at 70 eV; helium (99.999 %) was used as carrier gas at a constant flow of 1
mL/min and an injection volume of 0.5 µL was employed (split ratio of 10:1) at
an injector temperature of 250 ºC; ion-source temperature of 280 ºC. The oven
temperature was programmed from 110 ºC (isothermal for 2 min), with an
increase of 10 ºC/min, to 200 ºC, then 5 °C/min to 280 ºC, ending with a 9 min
isothermal at 280 ºC. Mass spectra were taken at 70 eV; a scan interval of 0.5
seconds and fragments from 40 to 450 Da. Total GC running time was 36 min.
Interpretation on mass spectrum GC-MS was conducted using the database of the
National Institute Standard and Technology (NIST) Abuja, having more than

N.O. Eddy et al. / Port. Electrochim. Acta 31 (2013) 79-93
82
62,000 patterns. The spectrum of the unknown component was compared with
the spectra of the known components stored in the NIST library. The name,
molecular weight and structure of the components of the test materials were
ascertained. The concentrations of the identified compounds were determined
through area and height normalization.
Table 1. Physicochemical properties of FT gum.
Parameters Property
Color Pale- yellow
Odour Sweet
Taste Sour taste
pH 4.10
Percentage yield (% w/w) 72.00
Solubility (% w/v)
(i) Cold water
(ii) Hot water
(iii) Acetone
(iv) Chloroform
(v) Ethanol
14.20
15.10
0.00
0.00
0.40
Results and discussions
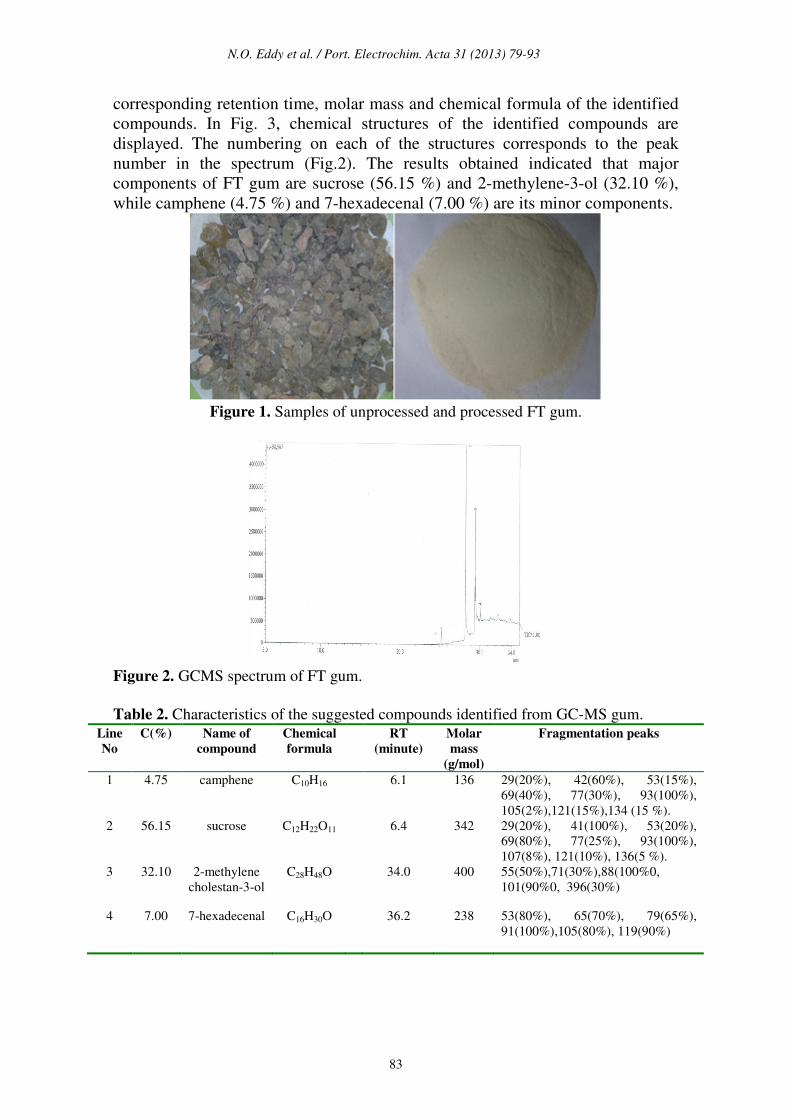
Physiochemical parameters of FT gum Table 1 presents the physiochemical parameters of FT gum including colour, pH,
percentage yield and solubility in various solvents. The gum is pale yellow in
colour (Fig.1), it has a sour taste and a sweeten odor. The measured pH of the
gum (4.10) revealed that the gum is acidic and is characterized with a sour taste.
The solubility of the FT gum in water tends to increase with increase in
temperature, indicating that the heat given off in dissolving the gum is less than
the heat required to break the gum apart. The net dissolution reaction is
endothermic (energy required). Therefore, addition of more heat facilitates the
dissolution of the gum by providing energy to break bonds within the gums. The
gum was also found to be slightly soluble in ethanol but insoluble in acetone and
chloroform. The solubility of the gum in ethanol may be due to the presence of
polar and non-polar ends in ethanol, which made it to dissolve some polar and
non-polar compounds. On the other hand, chloroform and acetone are non-polar
solvents and as expected, non-polar compounds are soluble in non-polar solvent
and vice versa. Hence FT gum is ionic and it is expected to be insoluble in
chloroform and acetone.
GCMS study of FT gum Fig. 2 shows the GCMS spectrum of FT gum. From the figure it can be seen that
the spectrum of FT gum is characterized with four peaks. Since the area under
the GCMS peak is proportional to the concentration, results obtained from area
normalization were used to estimate the percentage concentrations of identified
constituents of the gum, as presented in Table 2. The table also presents the
various fragmentation peaks associated with each of the fraction, the
N.O. Eddy et al. / Port. Electrochim. Acta 31 (2013) 79-93
83
corresponding retention time, molar mass and chemical formula of the identified
compounds. In Fig. 3, chemical structures of the identified compounds are
displayed. The numbering on each of the structures corresponds to the peak
number in the spectrum (Fig.2). The results obtained indicated that major
components of FT gum are sucrose (56.15 %) and 2-methylene-3-ol (32.10 %),
while camphene (4.75 %) and 7-hexadecenal (7.00 %) are its minor components.
Figure 1. Samples of unprocessed and processed FT gum.
Figure 2. GCMS spectrum of FT gum.
Table 2. Characteristics of the suggested compounds identified from GC-MS gum.
Line
No
C(%) Name of
compound
Chemical
formula
RT
(minute)
Molar
mass
(g/mol)
Fragmentation peaks
1 4.75 camphene
C10H16 6.1 136 29(20%), 42(60%), 53(15%),
69(40%), 77(30%), 93(100%),
105(2%),121(15%),134 (15 %).
2 56.15 sucrose C12H22O11 6.4 342 29(20%), 41(100%), 53(20%),
69(80%), 77(25%), 93(100%),
107(8%), 121(10%), 136(5 %).
3 32.10 2-methylene
cholestan-3-ol
C28H48O 34.0 400 55(50%),71(30%),88(100%0,
101(90%0, 396(30%)
4 7.00 7-hexadecenal C16H30O 36.2 238 53(80%), 65(70%), 79(65%),
91(100%),105(80%), 119(90%)

N.O. Eddy et al. / Port. Electrochim. Acta 31 (2013) 79-93
84
Figure 3. Chemical structures of the constituents of FT gum.
Figure 4. FTIR spectrum of FT gum.
FTIR Fig. 4 presents the FTIR spectrum of FT gum, while frequencies and peaks of IR
adsorption by FT gum are presented in Table 3. A close examination of the
spectra shows that there are various peaks to the right of 300 cm-1
indicating the
presence of alkyl groups (in most organic compounds). A peak was also found to
the left of 300 cm-1
. This may be attributed to C=C bond due to camphene or 7-
hexadecenal. The presence of sucrose in FT gum is correlated with the presence
of cyclopentanone at 1745 cm-1
and several OH vibrations. OH stretch due to
alcohol was also found at 3509.60 cm-1
. This may be due to the presence of 2-
methylen cholestan-3-ol in the gum. C-H stretches due to alkanes were also
found at 2856 and 2923 cm-1
. Also at 1589 cm-1
, C-C stretch due to ring was also
significant in the spectrum. At peak frequencies of 1454.38 and 1377.22 cm-1
,
C-H bend and C-H rock due to alkanes were observed. Several C-O vibrations
were also found between the wave number range of 1071 to 1281 cm-1
. Finally,

N.O. Eddy et al. / Port. Electrochim. Acta 31 (2013) 79-93
85
between the wave number range of 647 and 985 cm-1
, C-H bend, C-H rock and
C-H out of plane vibrations were eminent.
Table 3. Peaks and intensity of adsorption of FTIR by Ficus tricopoda gum.
Peak (cm-1
) Intensity Area (cm2) Assignment (functional group)
647.14 21.016 31.693 C-H bend due to alkene 705.97 14.986 37.928 C-H rock due to alkanes 742.62 13.273 42.598 C-H rock due to alkanes 858.35 22.36 34.492 C-H oop due to aromatics 984.69 17.41 51.014 C-H bend due to alkene 1070.53 11.776 71.187 C-O stretch due to alcohol 1127.43 11.544 96.06 C-O stretch due to alcohol 1280.78 11.332 138.509 C-O stretch due to alcohol 1377.22 14.179 36.366 C-H rock due to alkanes 1454.38 12.191 70.73 C-H bend due to alkanes 1589.4 17.016 42.841 C-C stretch in ring 1745.64 10.911 83.487 C=O stretch due to cyclopentanone 2663.78 34.27 112.163 OH stretch due to carboxylic acid 2855.71 10.923 108.588 C-H stretch due to alkanes 2923.22 9.463 102.024 C-H stretch due to alkanes 3509.6 18.049 109.697 OH stretch due to alcohol or phenol
Corrosion study Effect of FT gum on the corrosion of aluminum
Fig. 5 shows plots for the variation of weight loss with time for the corrosion of
Al in 0.1 M of HCl containing various concentrations of FT gum at 303 and 333
K. From the plots, it was deduced that weight loss of Al increases with increase
in the period of contact but decreases with increasing concentration of FT gum.
These imply that FT gum retarded the corrosion of Al in solution of HCl and that
FT gum is an adsorption inhibitor for the corrosion of Al.
Figure 5. Variation of weight loss with time for the corrosion of Al in HCl containing
various concentrations of FT gum at 303 K.
Weight loss of Al was also found to decrease with increase in temperature which
also suggests that the corrosion rate of Al in solutions of HCl containing FT gum
decreases with increase in temperature. In view of the observed trend, values of
corrosion rate of Al and inhibition efficiency of various concentrations of FT
gum at 303 and 333 K were calculated and are recorded in Table 4. The results

N.O. Eddy et al. / Port. Electrochim. Acta 31 (2013) 79-93
86
obtained revealed that the inhibition efficiency of FT gum increases with
increasing concentration and with increase in temperature at FT gum
concentrations above 0.3 g/L. Based on literature, it can be inferred from the
pattern of variation of inhibition efficiency with temperature, that two
mechanisms of adsorption are possible. A physical adsorption mechanism
applied when the inhibition efficiency decreases with increase in temperature,
while a chemical adsorption mechanism applied when the inhibition efficiency
decreases with increase in temperature [8]. From the calculated values of
inhibition efficiency, it can be seen that the mechanisms of physical and chemical
adsorption are clearly indicative at lower and higher concentrations of the
inhibitors. Hence the mechanism of adsorption of FT gum on Al surface is
concentration and temperature dependent.
Table 4. Corrosion rates for Al, and inhibition efficiency and degree of surface
coverage of FT gum in 0.1 M H2SO4.
C (g/L) CR (g/cm
2/h) at
303 K %I (303 K) θθθθ (303 K)
CR (g/cm2/h)
at 333 K %I (333 K) θθθθ (333 K)
Blank 1.63 x 10⁻⁴
1.09 x 10⁻⁴
0.1 3.99 x 10⁻⁵
75.53 0.7553 3.54 x 10⁻⁵
67.51 0.6751
0.2 3.66 x 10⁻⁵
77.54 0.7754 2.74 x 10⁻⁵
74.88 0.7488
0.3 3.24 x10⁻⁵
80.10 0.8010 2.29 x 10⁻⁵
78.98 0.7898
0.4 2.74 x 10⁻⁵
83.20 0.8320 1.67 x 10⁻⁵
84.71 0.8471
0.5 2.41 x 10⁻⁵
85.21 0.8521 1.55 x 10⁻⁵
85.80 0.8580
Kinetic study
Corrosion of most metals including aluminum has been confirmed to be a first
order reaction [22]. Hence the rate of corrosion can be represented as follows
[23],
where [Al] is the concentration of Al, k1 is the first order rate constant and t is the
time or period of contact. Assuming the concentration of Al at time, t = 0 is
denoted as [Al]0 at time , t = 0 and at some other time, ‘t’ as [Al] . Also, if x g of
Al have reacted after time, t, then the concentration of Al at this time will be
given as ([Al] – x). Integration of equation 4 within the limit, [Al]0 and ([Al] – x)
yields equation 5 and upon simplification, equations 6 and 7 were obtained
-log ([Al]0 – x) = k1t/2.303 - log[Al]0 (6)
-log (weight loss) = k1t/2.303 - log[Al]0 (7)

N.O. Eddy et al. / Port. Electrochim. Acta 31 (2013) 79-93
87
Figure 6. Variation of –log(weight loss) with time for the corrosion of Al in 0.1 M HCl
containing various concentrations of FT gum at 303 K.
Table 5. Kinetic parameters for the corrosion of Al in 0.1 M HCl containing various
concentrations of FT gum. T (K) C (g/L) slope intercept k1 R
2 t1/2 (hour)
30
3 K
Blank 0.0036 0.9860 0.0083 1 0.9634
0.1 0.0035 1.5086 0.0081 2 0.9883
0.2 0.0042 1.6854 0.0097 2 0.9612
0.3 0.0039 1.7691 0.0090 2 0.9752
0.4 0.0029 1.7444 0.0067 2 0.9231
0.5 0.0026 1.7751 0.0060 2 0.8451
33
3 K
Blank 0.0028 0.6843 0.0064 1 0.9377
0.1 0.0031 1.3790 0.0071 2 0.9718
0.2 0.0030 1.3945 0.0069 2 0.9534
0.3 0.0028 1.3919 0.0064 2 0.9080
0.4 0.0021 1.4304 0.0048 2 0.9069
0.5 0.0020 1.4659 0.0046 3 0.9403
From equation 7, a plot of –log(weight loss) versus time should be a straight line
with slope and intercept equal to k1/2.303 and log[Al]0, respectively. Fig. 6
presents plots for the variation of –log(weight loss) versus time for the corrosion
of Al in solutions of HCl (plots obtained at 333 K are not shown). Values of R2,
slopes and k1 deduced from the plots are presented in Table 5. The half-life of a
first order reaction (t1/2) is related to the rate constant according to the following
equation [22],
From the results obtained (Table 5), it is evident that the half-life for the inhibited
reactions of Al in solutions of HCl is higher than those obtained for the blank indicating
that FT gum has the tendency to increase the half-life of aluminum in solutions of HCl.

N.O. Eddy et al. / Port. Electrochim. Acta 31 (2013) 79-93
88
Effect of temperature
Effect of temperature on the adsorption of FT gum on mild steel was studied
using the logarithm form of the Arrhenius equation (Equation 8) [24]
−=
211
2 11
303.2log
TTR
E
CR
CR a (9)
where CR1 and CR2 are the corrosion rates of aluminum in solution of HCl at the
temperatures, T1(303 K) and T2 (333 K), respectively, Ea is the activation energy
for the adsorption of FT gum on Al gum and R is the gas constant. Calculated
values of the Ea are shown in Table 6. The activation energies are within the
range of values expected for the mechanism of physical adsorption and tend to
increase with increase in the concentration of FT gum. This implies that the
mechanism of inhibition of Al corrosion by FT gum is concentration dependent.
It is also significant to note that the activation energy calculated for the blank is
higher than those calculated at FT gum concentrations of 0.1 to 0.3 g/L and vice
versa. This implies that less energy is needed for the adsorption of the inhibitor
compared to the corrosion of the metal. On the other hand, above FT gum
concentration of 0.3 g/L, calculated values of the activation energy were higher
than the corresponding value for the blank but lower than the threshold value
required for chemisorption. This suggests that at this concentration, the diffusion
of the inhibitor’s molecules (and not the energy of activation) may be the rate
limiting process.
Table 6. Activation energy and heat of adsorption of various concentrations of FT gum
on Al surface. C (g/L) Ea (kJ/mol) Qads (kJ/mol)
Blank 11.22
0.1 3.32 8.31
0.2 8.13 3.08
0.3 9.73 1.45
0.4 13.90 -2.35
0.5 12.41 -1.00
Thermodynamics and adsorption considerations
Adsorption of FT gum on Al surface can be exothermic or endothermic
depending on the reaction condition, the nature of FT gum’s molecules and the
mechanism of reaction. In order to calculate the heat of adsorption of FT gum on
Al surface, an established thermodynamic equation was used [25]:
) x ( (10)
where Qads is the heat of adsorption of FT gum on Al surface, θ1 and θ2 are the
degrees of surface coverage of the inhibitor at the temperatures, T1 and T2 (where
T2 >T1) and R is the gas constant. Calculated values of Qads (Table 6) reflected
endothermic reaction at FT gum concentrations of 0.1 to 0.3 g/L, but an
exothermic one at concentrations above 0.3 g/L. This suggests that, above a

N.O. Eddy et al. / Port. Electrochim. Acta 31 (2013) 79-93
89
critical concentration of 0.3 g/L, the mechanism of inhibition of Al corrosion by
FT gum is altered between physisorption to chemisorption.
The adsorption characteristics of an organic corrosion inhibitor can be studied
using the adsorption isotherm, whose general form can be written as follows
[26],
f (θ, x) exp(−2aθ ) = bC (11)
where f(θ, x) is the configurational factor which depends upon the physical
model and the assumptions underlying the derivation of the isotherm, θ, the
surface coverage, C, the inhibitor concentration in the electrolyte, ‘x’ is the size
factor ratio, ‘a’ is the molecular interaction parameter and ‘b’ is the equilibrium
constant of the adsorption process. In this study, calculated values of θ at various
concentrations of the inhibitor were fitted into various adsorption isotherms
including Langmuir, Temkin, Freundlich, Flory-Huggins, Bockris-Swinkels and
Frumkin isotherms. The test indicated that the adsorption of FT gum best fitted
the Langmuir and Frumkin adsorption isotherms.
The Langmuir adsorption isotherm relates the degree of surface coverage to the
concentration of the inhibitor according to the following equation [27],
where θ is the degree of surface coverage of the inhibitor, C is the concentration
of the inhibitor in the bulk electrolyte and b is the adsorption equilibrium
constant. Simplification of equation 11 yields equation 12 and from the logarithm
of both sides of equation 12, equation 13 was obtained
Plots of versus logb gave straight lines and values of logb were estimated
from intercepts of the plots (Fig.7). Also values of R2 were very close to unity
but slope values were not equal to unity as expected in the Langmuir model
indicating the existence of interaction between the inhibitor’s molecules.
In order to account for the existence of molecular interaction, the Frumkin
adsorption model was found to be applicable to the adsorption of FT gum on Al
surface. The Frumkin adsorption isotherm can be expressed as follows [28],
(15)

N.O. Eddy et al. / Port. Electrochim. Acta 31 (2013) 79-93
90
Figure 7. Langmuir isotherm for the adsorption of FT gum on Al surface.
From equation 14, a plot of versus θ should be linear if Frumkin
isotherm is obeyed. Fig. 8 shows the Frumkin isotherm for the adsorption of FT
gum on Al surface. Frumkin adsorption parameters were also deduced from the
plots and are presented in Table 7. The results indicated that the interaction
parameters are positive and tend to increase with increase in temperature,
signifying the attractive behavior of the inhibitor and the possibility of
chemisorption mechanism. The adsorption of FT gum on Al surface was also
found to be consistent with the Dubinin-Radushkevich (D-RIM) adsorption
isotherm, which can be expressed according to equation 12 [29],
ln(θ) = ln(θmax) - aσ2 (16)
where θmax is the maximum surface coverage and σ is the polany potential and
can be estimated from the following equation,
Straight lines were obtained from plots of ln(θ) versus σ2 indicating the
application of the D-RIM isotherm to the adsorption of FT gum on Al surface.
Figure 8. Frumkin isotherm for the adsorption of FT gum on Al surface.

N.O. Eddy et al. / Port. Electrochim. Acta 31 (2013) 79-93
91
The constant ‘a’ and θmax were estimated from the slope and intercept of the plot,
respectively. The results obtained revealed that the value of ‘a’ at 303 K (i.e., 4 x
10-9
) is higher than the value at 333 K (7 x 10⁻⁹
). Similar trend was observed for
values of θmax at 303 K (66.64) and 333 K (63.38), respectively. It has been
found that the constant, ‘a’ is related to the mean adsorption energy (E)
according to equation 17 [29]
Table 7. Langmuir and Frumkin parameters for the adsorption of FT gum on Al
surface.
Isotherm T (K) slope Intercept a R2
Langmuir 303 0.8462 0.0176 0.9997 -10.20
333 0.9249 0.0517 0.9995 -11.42
Frumkin 303 6.1905 4.8577 3.0953 0.9968 -18.09
333 9.4993 7.5962 4.7497 0.9672 -37.34
Also, several studies have shown that E value less than 8 kJ/mol supports the
mechanism of physical adsorption but E values greater than 8 kJ/mol are
consistent with the mechanism of chemisorption. Fig. 9 shows D-RIM isotherm
for the adsorption of FT gum on Al surface. R2 values for the plots were 0.8450
and 0.9636, while E values were 11.18 and 8.55 kJ/mol. From the calculated
results, chemisorption mechanism is significant in the inhibition of the corrosion
of Al by FT gum.
Figure 9. D-RIM isotherm for the adsorption of FT gum on Al surface.
The free energy of adsorption of FT gum on Al surface was estimated using the
Gibb-Helmoltz equation, which relates the adsorption equilibrium constant with
the free energy of adsorption as follows [30 – 31],
(19)

N.O. Eddy et al. / Port. Electrochim. Acta 31 (2013) 79-93
92
where is the standard free energy of adsorption of FT gum on Al surface.
Calculated values of and ‘b’ deduced from Langmuir and Frumkin
isotherms are presented in Table 7. From the results obtained, the free energies
are negative, indicating that the adsorption of FT gum on mild steel surface is
spontaneous. However, while free energy values obtained from the Langmuir
isotherm point towards a physisorption mechanism, those from the Frumkin
isotherm reflect chemisorption mechanism. Hence the adsorption of FT gum is
characterized by the initial mechanism of physical adsorption and is succeeded
by chemical adsorption mechanism. Generally, values of below – 20
kJ/mol are consistent with the mechanism of charge transfer from the charged
inhibitor to the charged metal surface, which supports physisorption, but
values close to or above – 20 kJ/mol are consistent with the mechanism of
chemical adsorption, which involves the transfer of electrons from the inhibitor’s
molecules to vacant d-orbital of the metal. From the present data, it is evident
that the adsorption of FT gum on Al surface incorporated both mechanisms.
Conclusions
The results and findings of this study revealed that FT gum is a good inhibitor for
the corrosion of Al in solution of HCl. The inhibition potential of the gum is
concentration and temperature dependent.
The adsorption of the gum is first order and is characterized by interchanging
mechanism. Langmuir, Frumkin and Dubinin-Radushkevich adsorption
isotherms are significant in describing the adsorption characteristics of the
inhibitors.
In view of the above, the use of FT gum as an inhibitor for the corrosion of Al in
acidic medium is hereby recommended.
References
1. El-Etre AY. Corros Sci. 2003;45:2485.
2. Bouklah M, Hammouti B. Port Electrochim Acta. 2006;24:457.
3. Singh DDN, Singh MM, Chaudhary RS, Agarwal CV. Electrochim Acta
1981;26:1051–1056.
4. Mears RB, Eldredge GG. Ind Eng Chem. 1945;37:736.
5. Singh DDN, Chaudhary RS, Prakash B, Agrawal CV. Br Corros J.
1979;14:235.
6. Metikos-Hukovic M, Babic R, Grubac Z. J Appl Electrochem. 1998;28:433.
7. Amin M, Khaled KF, Mohsen Q, Arida A. Corros Sci. 2010;52:1684.
8. Ramananda SM, Sharma V, Singh G. Port Electrochim Acta. 2011;29:405.
9. Oguzie EE, Onuchukwu AI, Okafor PC, Ebenso EE. Pigment Resin Tech.
2006;35:63.
10. A.M. Abdel-Gaber, B.A. Abd-El-Nabey, I.M. Sidahmed, et al. Corros Sci.
2006;48:2765.
11. Loto CA. Corros. Prev Control. 2001;48:38.
12. El-Etre AY. J Colloid Interf Sci. 2007;314:578.
N.O. Eddy et al. / Port. Electrochim. Acta 31 (2013) 79-93
93
13. Loto CA. Corros. Prev Control. 2003;50:43.
14. El-Etre AY. Appl Surf Sci. 2006;252:8521.
15. Umoren SA, Obot IB, Ebenso EE, Egbedi NO. Port Electrochim Acta
2008;26:199.
16.. Eddy NO, Odiongenyi AO, Ameh PO, Ebenso EE. Int J Electrochem Sci.
2012;7:7425.
17. Eddy NO, Ameh PO, Gimba CE, Ebenso EE. Int J Electrochem Sci.
2011;6:5677.
18. Eddy NO, Ameh PO, Gimba CE, Ebenso EE. Int J Electrochem Sci.
2011;6:5815.
19. Dehri I, Ozcan M. Mater Chem Phys. 2006;98:316.
20. Ameh PO, Eddy NO, Gimba CE. Physiochemical and rheological studies
on some natural polymers and their potentials as corrosion inhibitors. UK:
Lambert Academic Publishing; 2012.
21. Carter SJ. Tutorial pharmacy: solution. Great Britain: Pitman Press; 2005.
22. Awe FE, Eddy NO. Amino acids as corrosion inhibitors: quantum and
experimental studies. London, UK: Lambert Academic publishing; 2012.
23. Khaled KF. Corros Sci. 2010;52:2905.
24. Okafor PC, Ekpe UJ, Ebenso EE, et al. Bull Electrochem. 2005;21:347.
25. Elayyachy M, Hammouti B, El Idrissi A. Appl Surf Sci. 2005;249:176.
26. Morad MS, Kamal AM, El-Dean. Corros Sci. 2006;48:3398.
27. Behpour M, Ghoreishi SM, Khayatkashani M, Soltani N. Corros Sci.
2001;53:2489.
28. Gojic M. Corros Sci. 2002;43:919.
29. Noor EA. J Appl Electrochem. 2009;39:1465.
30. Dehri I, Ozcan M. Mater Chem Phys. 2006;98:316.
31. Popova A, Sokolova E, Raicheva S, Christov M. Corros Sci. 2003;45:33.


![[eBook - Ita - Bonsai] Ficus](https://img.pdfslide.us/doc/110x75/577cc1ec1a28aba711940644/ebook-ita-bonsai-ficus.jpg)