Embed Size (px)
Citation preview

0
Fiber Connector End-Face Inspection Project, Phase II
March 23, 2009
1
Project participantsProject participants
• Tatiana Berdinskikh, Celestica• Brian J. Roche, Cisco Systems• Steve Lytle, Westover Scientific• Randy Manning, Tyco Electronics• David Fisher, Tyco Electronics• Christine Chen, Avago Technologies
• Tom Mitcheltree, Cisco Systems• Mike Hughes, USConec
• Heather Tkalec, Alcatel-Lucent •
• Doug Wilson, PVI Systems
• Dr. Sun-Yuan Huang, Intel• Ed Forrest, Chemtronics• Harvey Stone, Microcare• John Culbert, Megladon Mfg• Yutaka Sadohara, Sumitomo Electric
2
Presentation Outline Presentation Outline
• Introduction• Project Objectives• Accumulation of Particles Near the Core during Repetitive
Fiber Connector Matings and De-matings• Development of Cleanliness Specifications for Single-Mode,
Angled Physical Contact MT Connectors• The Influence of Contamination on Optical
Performance of APC connectors•
Modeling and Experimental Analysis of Contamination Effects on Lens-Based Optic Modules
• Next Steps• Conclusions
33
IntroductionIntroduction
• Contaminated optical connectors result in degradation of optical
performance, functional failures, and increased deployment costs.
• Continuing iNEMI research on development of a cleanliness specification for single mode connectors.
• Angled Physical Contact (APC) single fiber and multi-
fiber MT connectors are widely used in optical communications
– Card edge connectivity– High density optical backplanes– Passive Optical Networks (PONs).
• Impact of contamination on optical performance of MT connector systems has not been thoroughly investigated.
• No data reported on particle redistribution phenomenon for APC single fiber and multi-fiber MT connectors during repetitive mating cycles.
4
IntroductionIntroduction
• Continuing iNEMI research on development of a cleanliness specification for single mode connectors.
• Quantitative experiments evaluated contamination impact on performance of 1.25 & 2.5 mm ferrules.
• Research supported development of IPC-8497-1 “Cleaning Methods and Contamination Assessment of Optical Assembly”
standard.• In 60 % of LC and MU connectors examined, five mating
cycles increased IL 0.5 to 1.1 dB due to particle movement from the ferrule and cladding areas towards the core, which suggests a risk of signal performance degradation during the service life.
• Based on our research, the cleaning process using a standard cleaning cassette may result in an electrostatic charge of the connector end face

5
Introduction/ ReceptaclesIntroduction/ Receptacles
• Previous research and cleanliness criteria presented to IEC86B for optic connectors (starting in 2003)– 2.5mm ferrule, 1.25mm ferrule, APC & MT connectors
• Research started on receptacle fiber-stub devices– Receptacle (stub devices) cleanliness paper published (Sep 2005)– Initial work started on lens devices (2006)
• Additional research needed to propose standard criteria for multiple receptacle types (fiber stub, lens)
• Benefits of receptacle research and criteria– Clarify receptacle design categories, common language– Development of standard inspection criteria – Increased awareness of impact of contamination– Less down time due to contaminated transceivers
6
ProjectsProjects
• The Fiber Connector End-Face Inspection Specifications is a follow-on initiative to the NEMI Fiber Optics Signal Performance Project – Optical Signal Performance Project ( Dec, 02-
Oct, 04)– The Fiber Connector End-Face Inspection ( Oct, 04-
Jan, 07)– The Fiber Connector End-Face Inspection, Phase II( Jan , 07-
Mar, 09)
7
ObjectivesObjectives
• Develop cleanliness criteria for SMF APC connectors and for Single-Mode, Angled Physical Contact MT Connectors based on quantitative data
• Investigate the mechanism of particle accumulation near the core during a series of repeated mating cycles.
• Develop potential solutions to prevent this phenomenon. • Perform a series of experiments to determine aggregate
dust location.• Development cleanliness specification for Lens-
based optic modules
• Update the criteria in IEC doc “61300-3-35: Basic test and measurement procedures”
• Develop a recommendation for singlemode connector pass/fail criteria for consideration by the members ofWG6 and WG4 for possible inclusion into an IEC SC86B standards document on fiber optic connector end face requirements.
8
Fiber Connector Endface Specification, Phase IFiber Connector Endface Specification, Phase I
• The iNEMI team conducted experiments to compare the effects of specific contamination on the optical performance of fiber optic connectors
• The similarities and some differences in optical performance of contaminated 2.5 mm ferrule (SC, FC) and 1.25mm ferrule (LC, MU) connectors were found.
• The zone of 25 μm diameter was identified as critical zone in terms of the contamination influence on optical signal performance for all types of investigated connectors
• In 60 % of all examined LC and MU connectors, a series of five repeated matings/demating operations resulted in an increase of IL of 0.5 to 1.1 dB due to particle movement from the ferrule and cladding areas towards the core
9
Fiber Connector Endface Specification, Phase IFiber Connector Endface Specification, Phase I
• Developed empirical model between IL and the Gaussian Weighted % Occluded Area.
• The cleanliness specification for SMF Pigtail and Patchcord Connectors has been developed
• The acceptance of industry standard for SM connectors will result in significant cost savings by:– elimination of insufficient cleaning and over cleaning– reduction of contaminated non-conforming material.
• The standard IPC -8497-1”
Cleaning Methods and Contamination Assessment’
for Optical Assembly”
was been published in Feb 2006

10
Accumulation of Particles Accumulation of Particles Near the Core during Near the Core during
Repetitive Fiber Connector Repetitive Fiber Connector Matings and DeMatings and De--matings matings
NFOEC 2007 Anaheim, CA
March 29, 2007
11
Design of the ExperimentDesign of the Experiment
• Two types of connector end face polishing conditions and one with a non-standard polishing treatment.
– SC connector with a standard polishing treatment – SC connector with a non-standard polishing treatment
• An extensive polishing process, creating an extremely smooth fiber/ferrule surface.
• Two grades of Arizona Dust particles:– 1-5 um and 6-25 um
• Different types of cleaning process:– Dry cleaning– Cleaning solvent
12
Experimental Block DiagramExperimental Block Diagram
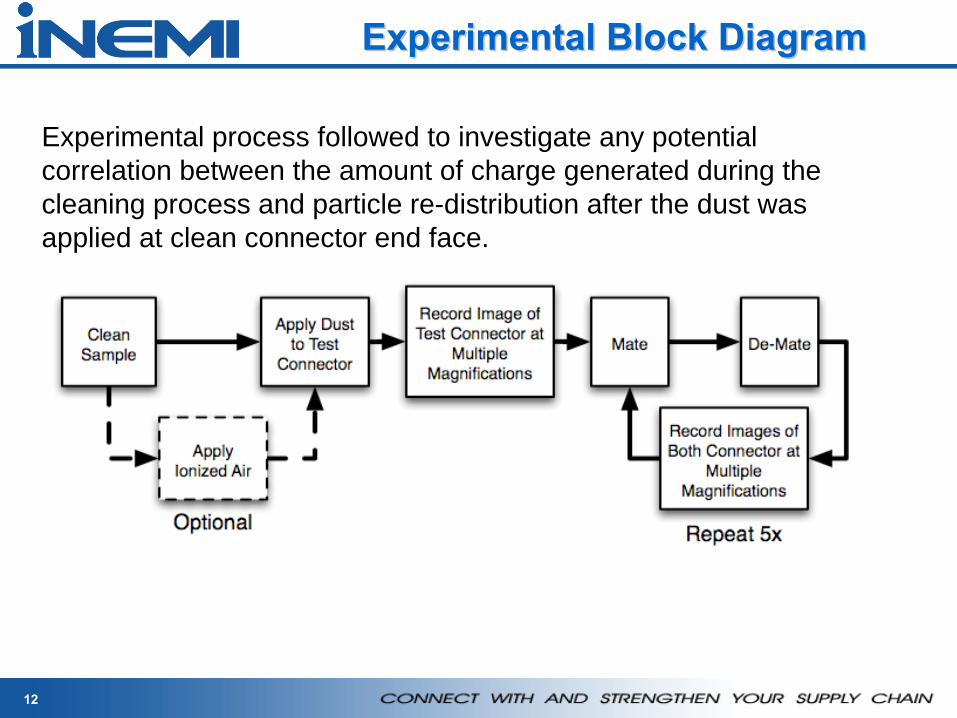
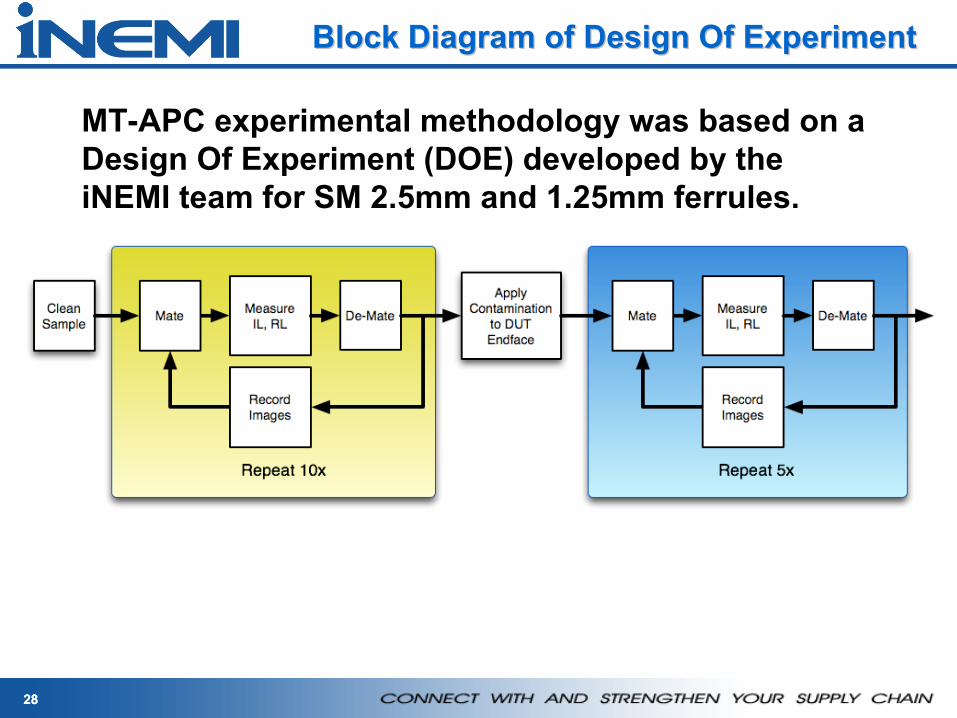
Experimental process followed to investigate any potential correlation between the amount of charge generated during the cleaning process and particle re-distribution after the dust was applied at clean connector end face.
13
Cleaning and Measurement MethodsCleaning and Measurement Methods
• All DUTs and reference connectors cleaned– Cleaning cassettes (type 1 or type 2) – Fiber wipes with a cleaning solvent– Two cleaning fluids in the Hydrofluorocarbon (HFC) and Alcohol Blend
families were evaluated.
• End-face inspected and images were saved• Measured the number of particles, size, and locations and
measured Occluded Area (OA)FiberQA™-EFI software from PVI Systems
• A Faraday cup was used to measure the charge on a fiber tip (both standard SC and non-standard SC) after the cleaning process.
14
ESD Effects From CleaningESD Effects From Cleaning
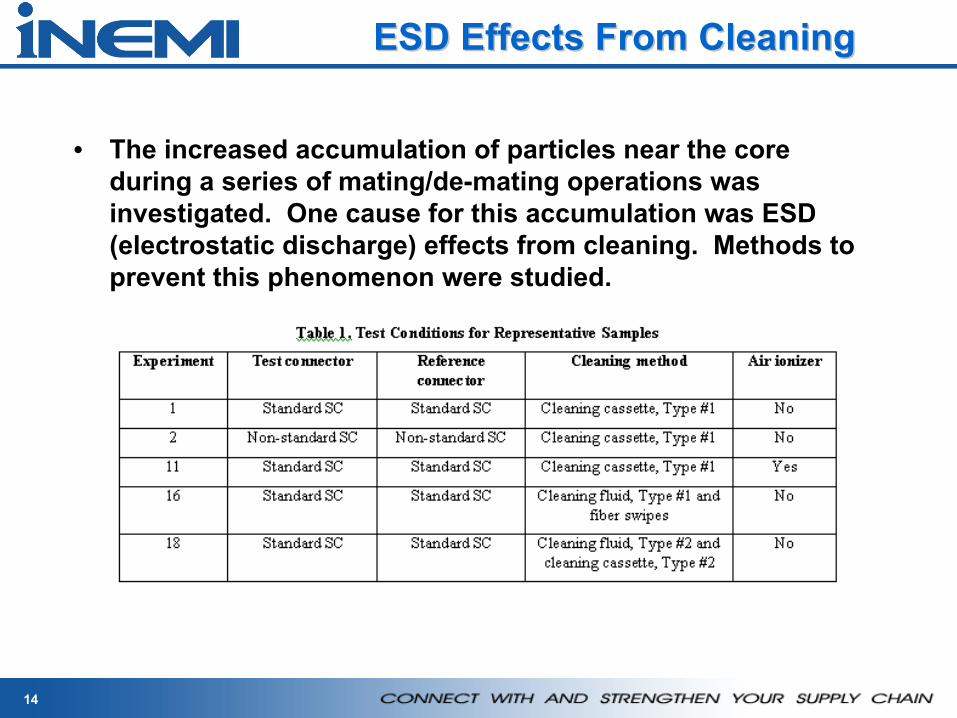
• The increased accumulation of particles near the core during a series of mating/de-mating operations was investigated. One cause for this accumulation was ESD (electrostatic discharge) effects from cleaning. Methods to prevent this phenomenon were studied.
15
Image AnalysisImage Analysis
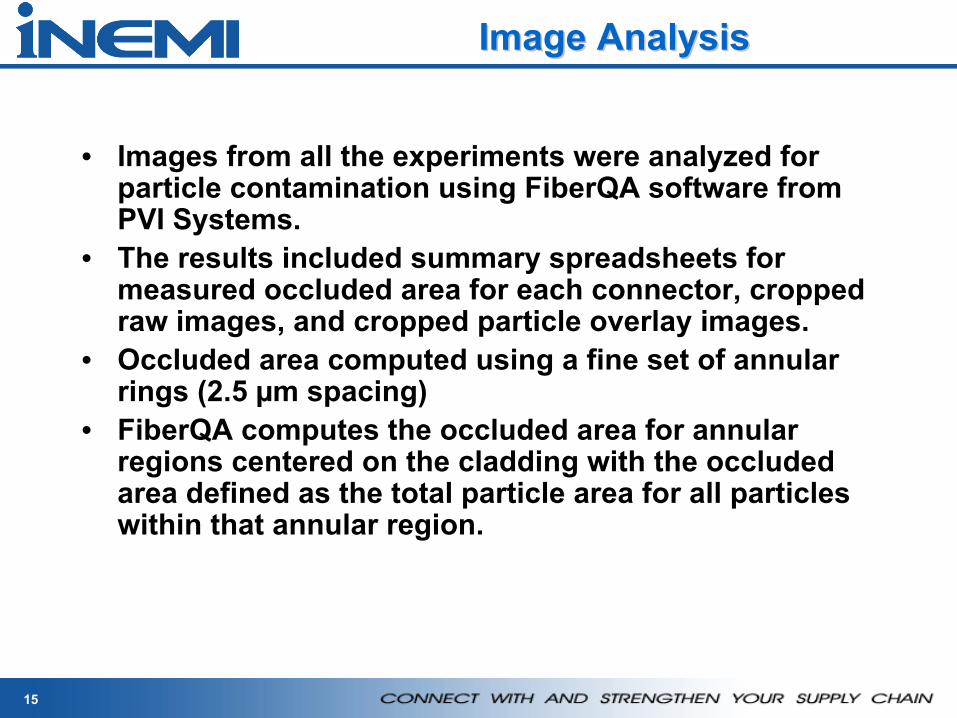
• Images from all the experiments were analyzed for particle contamination using FiberQA software from PVI Systems.
• The results included summary spreadsheets for measured occluded area for each connector, cropped raw images, and cropped particle overlay images.
• Occluded area computed using a fine set of annular rings (2.5 µm spacing)
• FiberQA computes the occluded area for annular regions centered on the cladding with the occluded area defined as the total particle area for all particles within that annular region.
16
Particle Detection OverlaysParticle Detection Overlays
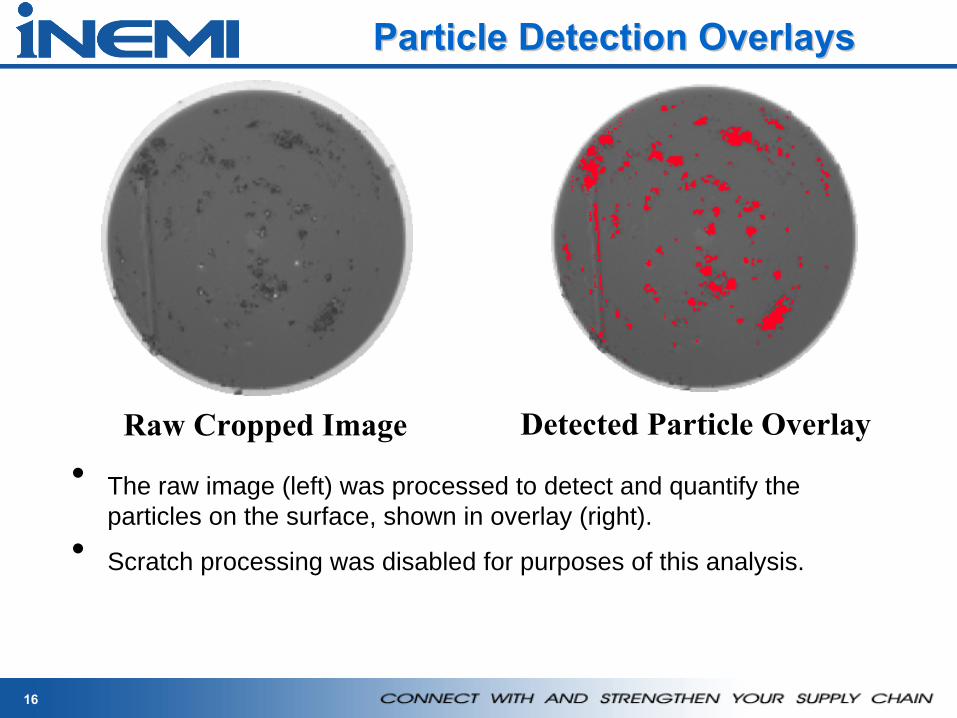
Raw Cropped Image Detected Particle Overlay• The raw image (left) was processed to detect and quantify the
particles on the surface, shown in overlay (right).• Scratch processing was disabled for purposes of this analysis.
17
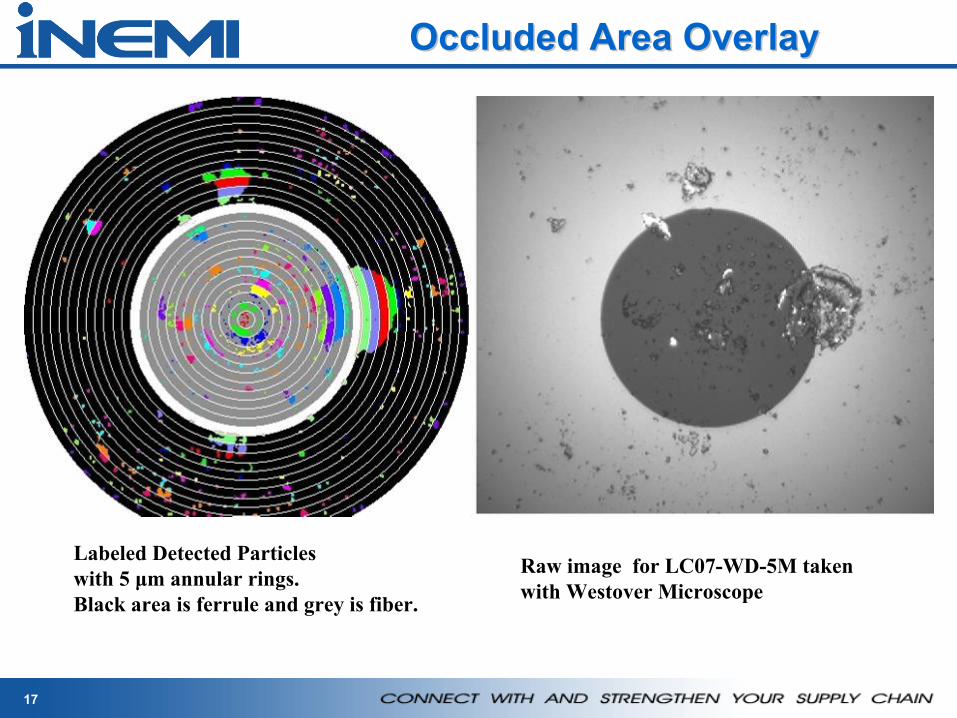
Labeled Detected Particles with 5 μm annular rings.Black area is ferrule and grey is fiber.
Raw image for LC07-WD-5M
taken with Westover Microscope
Occluded Area OverlayOccluded Area Overlay
18
Image AnalysisImage Analysis
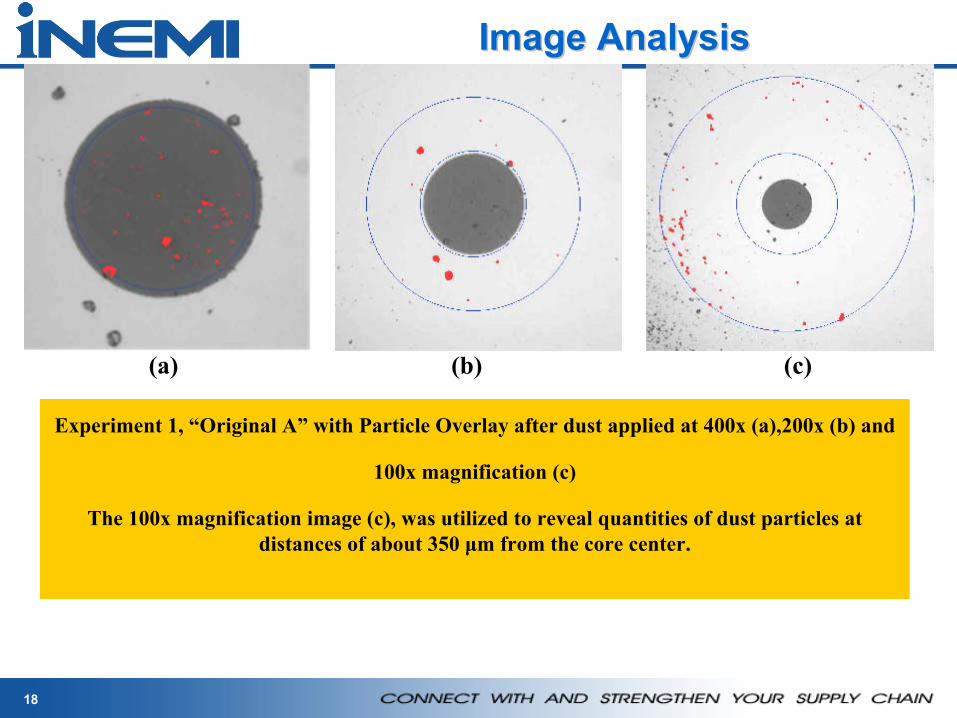
Experiment 1, “Original A”
with Particle Overlay after dust applied at 400x (a),200x (b) and
100x magnification (c)
The 100x magnification image (c), was utilized to reveal quantities of dust particles at distances of about 350 μm from the core center.
(a) (b) (c)
19
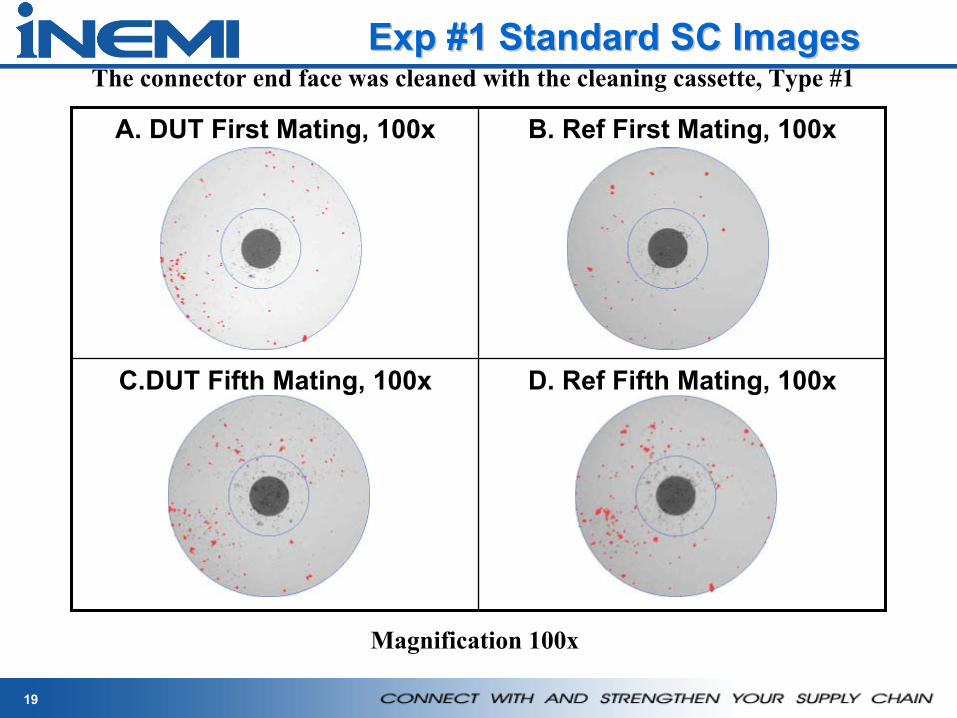
Exp #1 Standard SC ImagesExp #1 Standard SC Images
A. DUT First Mating, 100x B. Ref First Mating, 100x
C.DUT Fifth Mating, 100x D. Ref Fifth Mating, 100x
Magnification 100x
The connector end face was cleaned with the cleaning cassette, Type #1
20
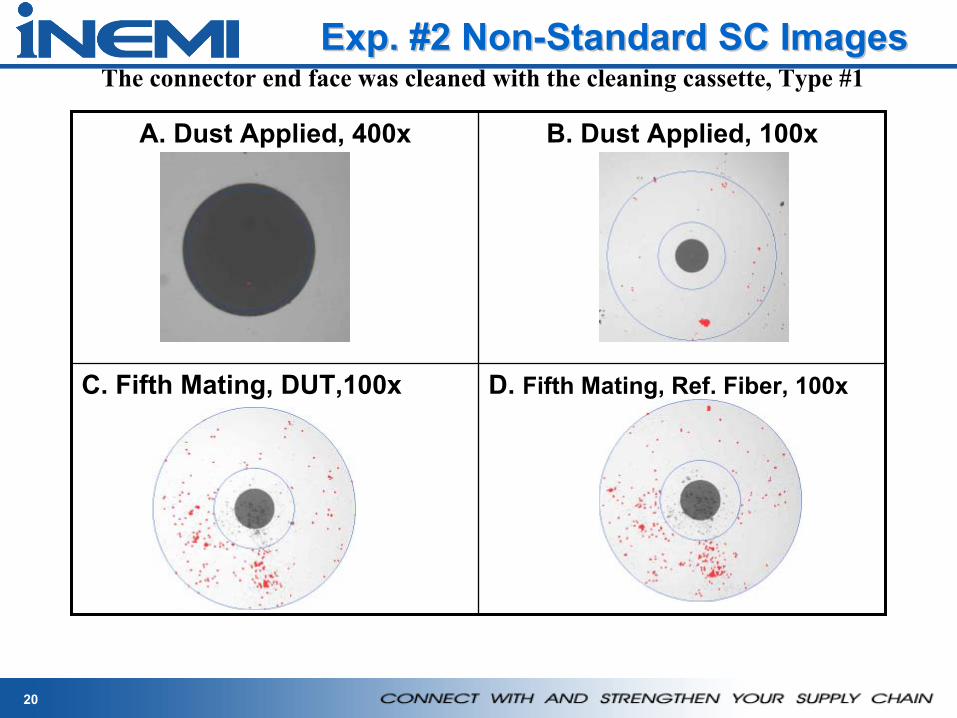
Exp. #2 NonExp. #2 Non--Standard SC ImagesStandard SC Images
A. Dust Applied, 400x B. Dust Applied, 100x
C. Fifth Mating, DUT,100x D. Fifth Mating, Ref. Fiber, 100x
The connector end face was cleaned with the cleaning cassette, Type #1
21
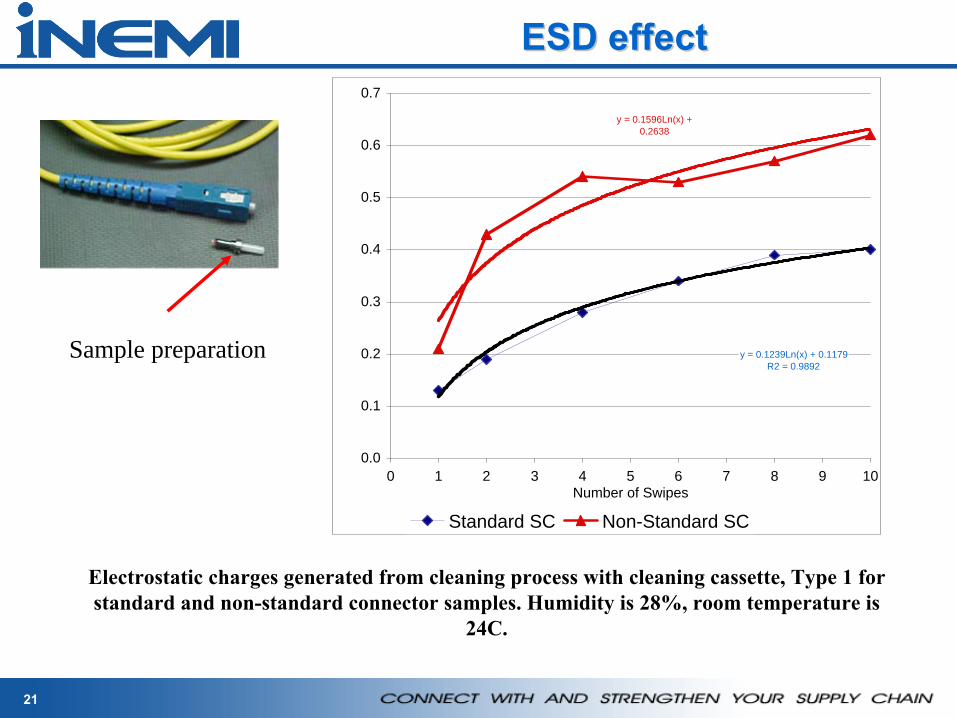
ESD effectESD effect
Electrostatic charges generated from cleaning process with cleaning cassette, Type 1 for standard and non-standard connector samples. Humidity is 28%, room temperature is
24C.
Sample preparation
y = 0.1596Ln(x) + 0.2638
y = 0.1239Ln(x) + 0.1179R2 = 0.9892
0.0
0.1
0.2
0.3
0.4
0.5
0.6
0.7
0 1 2 3 4 5 6 7 8 9 10Number of Swipes
Standard SC Non-Standard SC
22
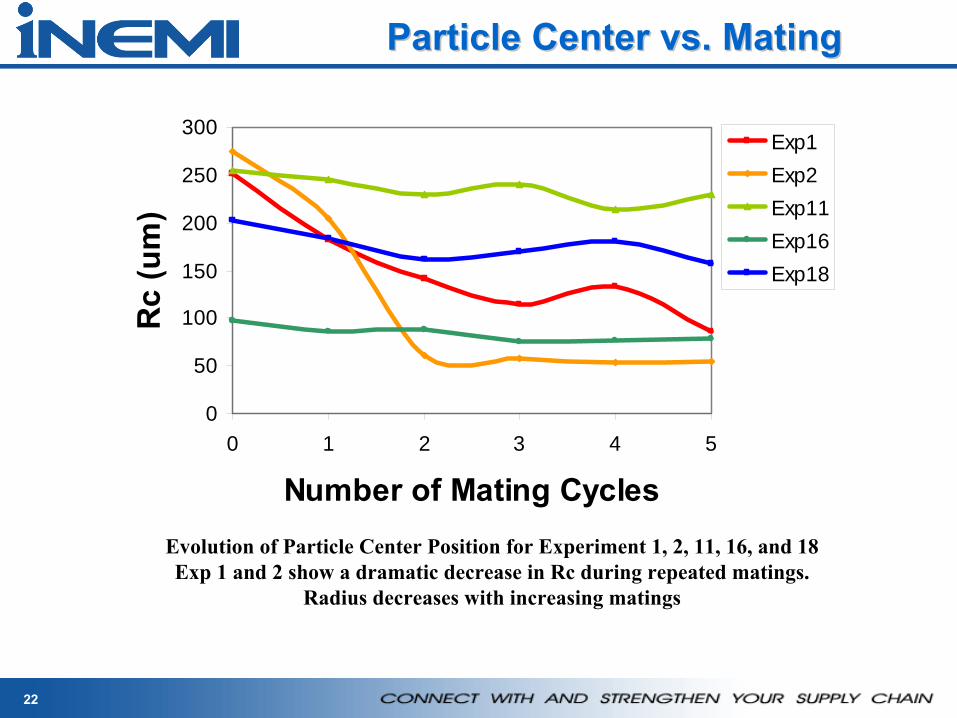
Particle Center vs. MatingParticle Center vs. Mating
Evolution of Particle Center Position for Experiment 1, 2, 11, 16, and 18Exp 1 and 2 show a dramatic decrease in Rc during repeated matings.
Radius decreases with increasing matings
0
50
100
150
200
250
300
0 1 2 3 4 5
Number of Mating Cycles
Rc
(um
) Exp1Exp2Exp11Exp16Exp18
23
ESD Effects from CleaningESD Effects from Cleaning
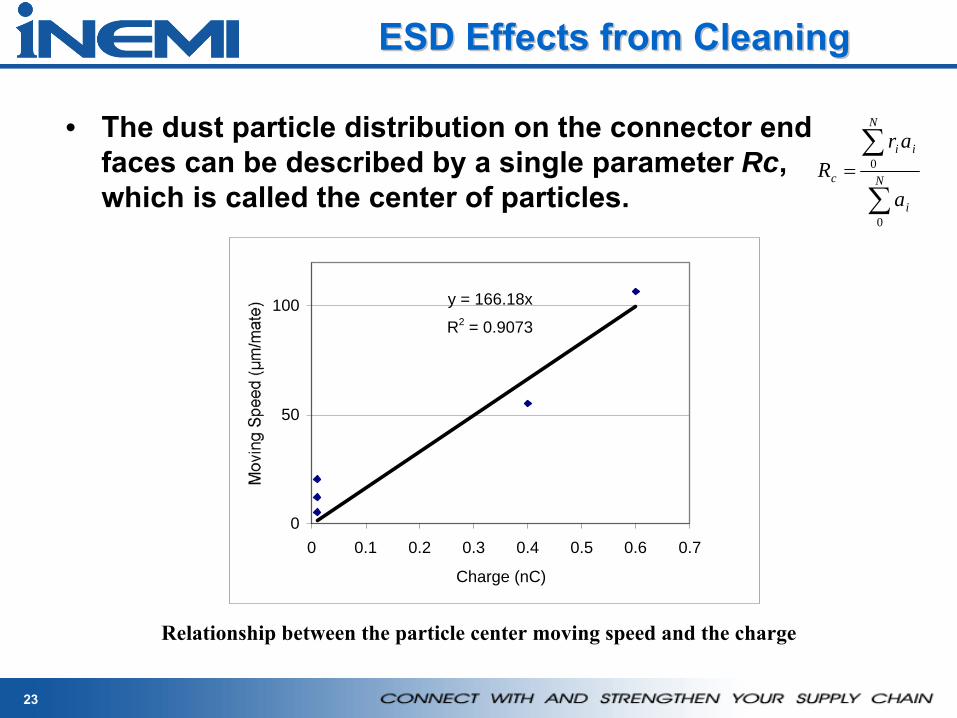
• The dust particle distribution on the connector end faces can be described by a single parameter Rc, which is called the center of particles. ∑
∑= N
i
N
ii
c
a
arR
0
0
y = 166.18x
R2 = 0.9073
0
50
100
0 0.1 0.2 0.3 0.4 0.5 0.6 0.7
Charge (nC)
Relationship between the particle center moving speed and the charge
24
ConclusionsConclusions
• During repetitive connector mating and de-mating cycles, dust particles can accumulate and re-
distribute at the connector end face.• Electrostatic charge force was
one of the mechanisms
responsible for the particle accumulation, re- distribution and their movement in the core area.
• A new metric, Center of Particles, Rc was developed to characterize the distribution of particles at the connector end face.
• Rc decreased during the series of mating/demating cycles, demonstrating movement of particles toward the core, based on our data.
25
25
Development of Cleanliness Development of Cleanliness Specifications for SingleSpecifications for Single--
Mode, Angled Physical Mode, Angled Physical Contact MT Connectors Contact MT Connectors
NFOEC 2008 San Diego, CAFeb 28, 2008
2626
ObjectivesObjectives
• Investigate the influence of contamination and scratches on optical performance (IL, RL) of
MT APC ferrules.• Analyze data on dust particle re-distribution
phenomenon during repetitive mating cycles. • Develop cleanliness inspection criteria for MT
APC connectors.

2727
Design of the ExperimentDesign of the Experiment
• The group of experimental samples included eight SM, MPO jumpers with low-loss MT Angled Physical Contact ferrules.
– Each MPO connector contained one row of 12 fibers
• Two grades of Arizona Dust particles:– 1-5 um and 6-25 um
• Scratches manually introduced to the MPO connectors’
end-faces.
28
MT-APC experimental methodology was based on a Design Of Experiment (DOE) developed by the
iNEMI team for SM 2.5mm and 1.25mm ferrules.
More than 250 fiber pairs tested using this DOE.
28
Block Diagram of Design Of ExperimentBlock Diagram of Design Of Experiment
2929
Cleaning and Measurement MethodsCleaning and Measurement Methods
• DUTs and reference connectors were cleaned using reel style cleaning cassette and inspected using fiber scope.
• End-face images captured:– FiberChek 2 software and digital scope from Westover Scientific.
• Particle count, size, and locations, measured Occluded Area (OA) and Gaussian Weighted OA (GWpOA) calculated:
– FiberQA™-EFI software from PVI Systems
• Insertion Loss (IL) and Return Loss (RL) measured:– RX 3000 Multi Channel Back Reflection meter from JDS Uniphase.
Source wavelength was 1550 nm.
3030
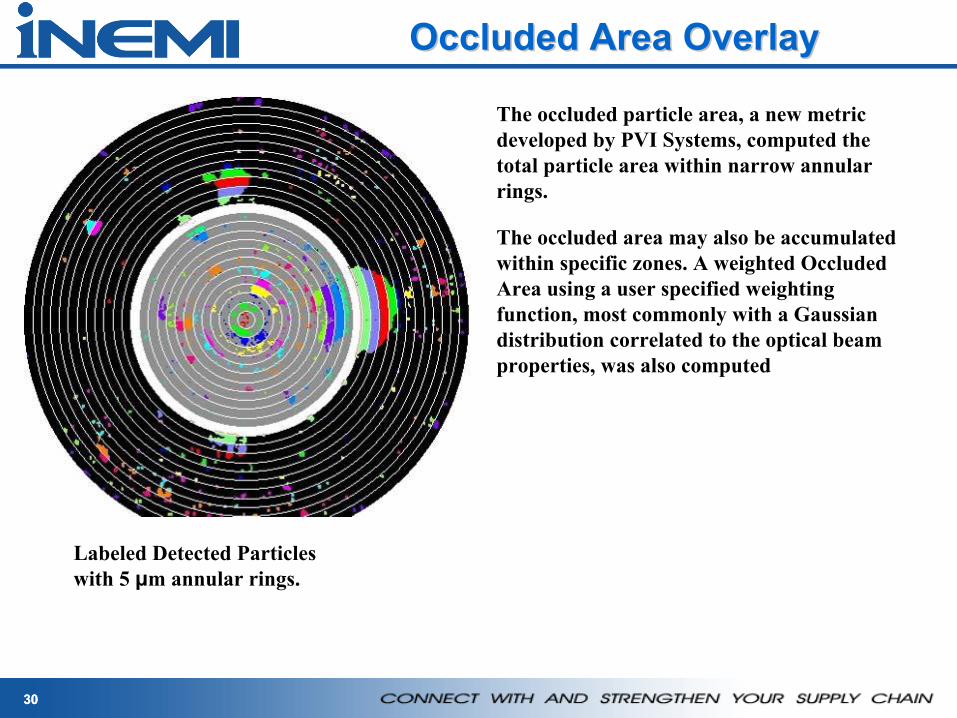
Labeled Detected Particles with 5 μm annular rings.
Occluded Area OverlayOccluded Area Overlay
The occluded particle area, a new metric developed by PVI Systems, computed the total particle area within narrow annular rings.
The occluded area may also be accumulated within specific zones. A weighted Occluded Area using a user specified weighting function, most commonly with a Gaussian distribution correlated to the optical beam properties, was also computed
3131
Gaussian Weighting Occluded AreaGaussian Weighting Occluded Area
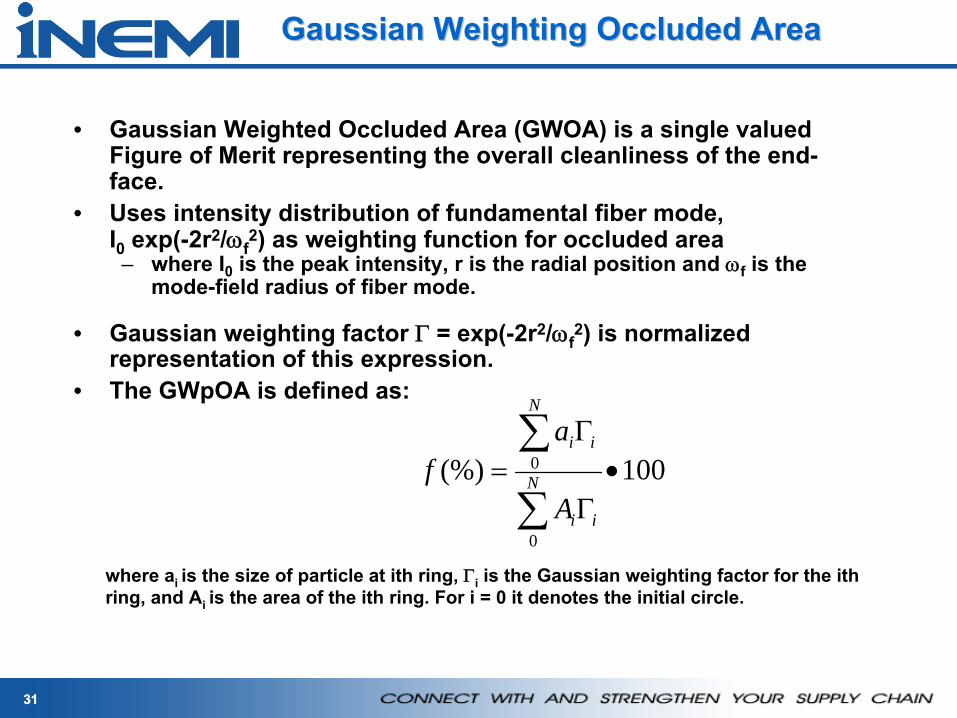
• Gaussian Weighted Occluded Area (GWOA) is a single valued Figure of Merit representing the overall cleanliness of the end-
face.
• Uses intensity distribution of fundamental fiber mode,
I0
exp(-2r2/ωf2) as weighting function for occluded area
– where I0
is the peak intensity, r is the radial position and ωf
is the mode-field radius of fiber mode.
• Gaussian weighting factor Γ
= exp(-2r2/ωf2) is normalized
representation of this expression.• The GWpOA is defined as:
where ai is the size of particle at ith ring, Γi
is the Gaussian weighting factor for the ith ring, and Ai is the area of the ith ring. For i = 0 it denotes the initial circle.
100(%)
0
0 •Γ
Γ=
∑
∑N
ii
N
ii
A
af
32
Contaminated Core Zone ResultsContaminated Core Zone Results
32
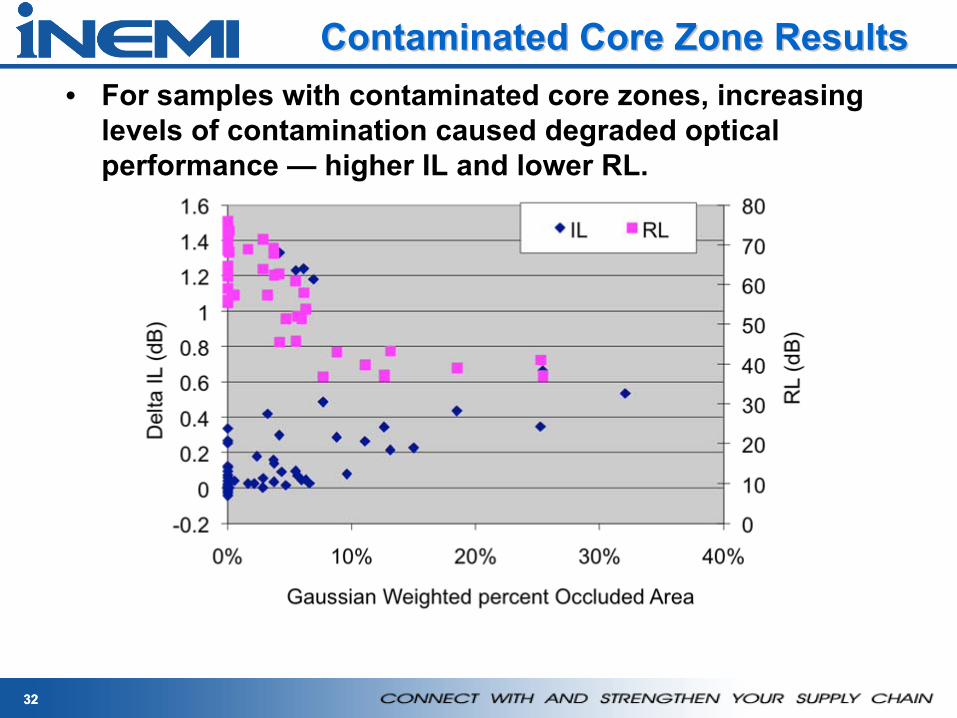
• For samples with contaminated core zones, increasing levels of contamination caused degraded optical performance —
higher IL and lower RL.
3333
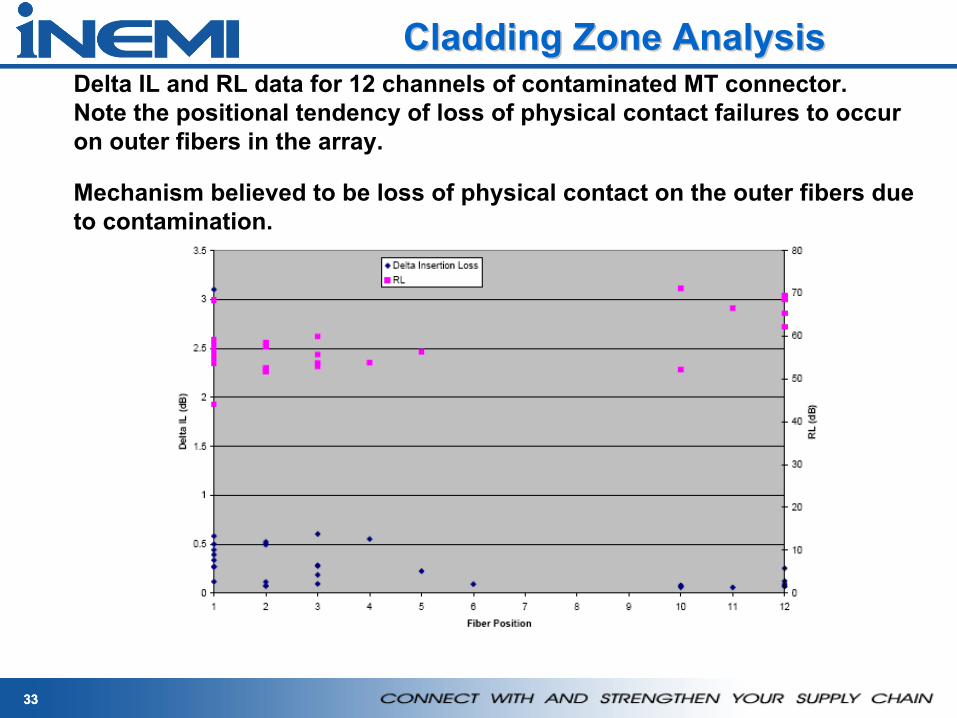
Cladding Zone AnalysisCladding Zone AnalysisDelta IL and RL data for 12 channels of contaminated MT connector.
Note the positional tendency of loss of physical contact failures to occur on outer fibers in the array.
Mechanism believed to be loss of physical contact on the outer fibers due to contamination.
3434
Cladding Zone AnalysisCladding Zone Analysis
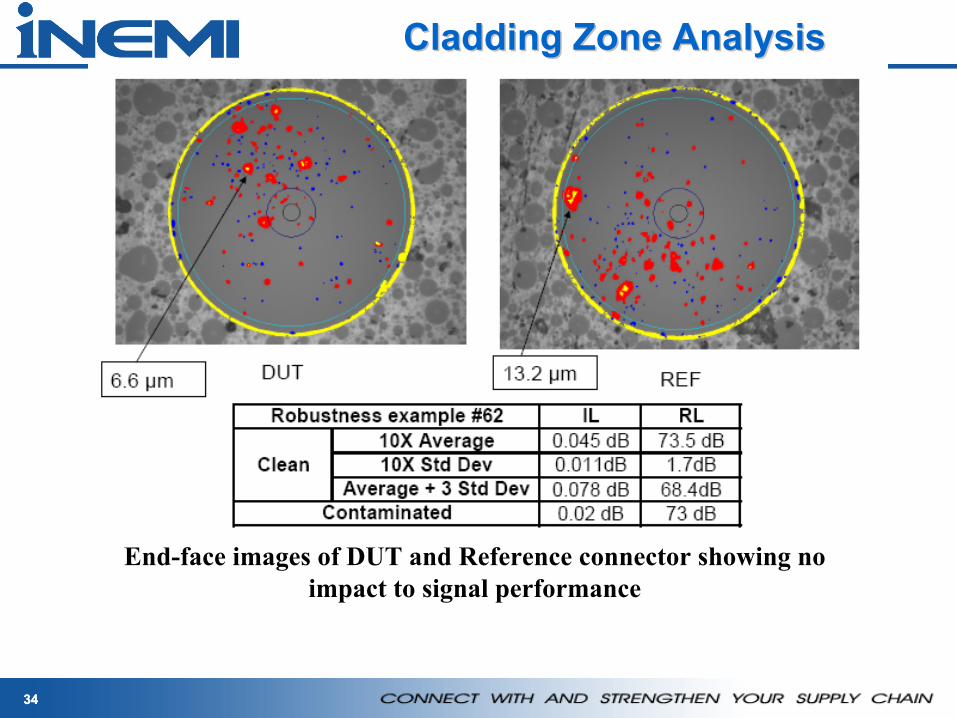
End-face images of DUT and Reference connector showing no impact to signal performance
3535
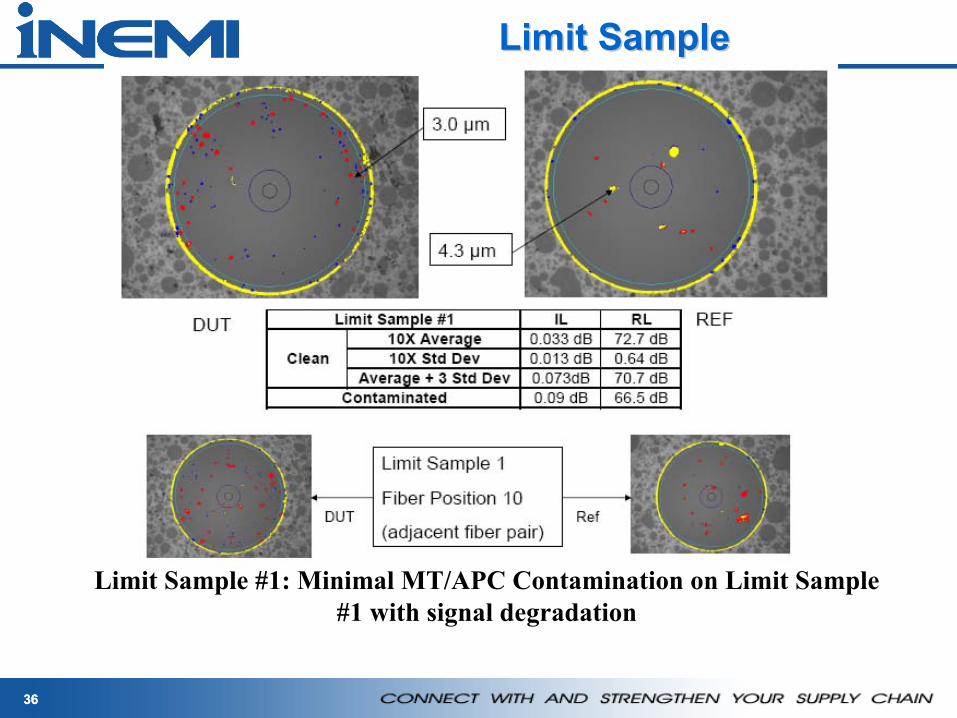
Cladding Layer AnalysisCladding Layer Analysis
• 65 fiber pair samples had significant cladding OA but NO IMPACT on signal performance.
• Some fiber pairs had up to 30% occluded area on cladding with no signal degradation. However, there were some fiber pairs in the cladding contamination study that did exhibit signal degradation.
• There are nine data points which had minimal cladding contamination (<5% OA from 12.5 -
115μm)
with some impact to signal performance. These samples are considered to be specification limit samples as the concluded acceptance criteria must ultimately fail these data points to be effective.
3636
Limit SampleLimit Sample
Limit Sample #1: Minimal MT/APC Contamination on Limit Sample #1 with signal degradation
3737
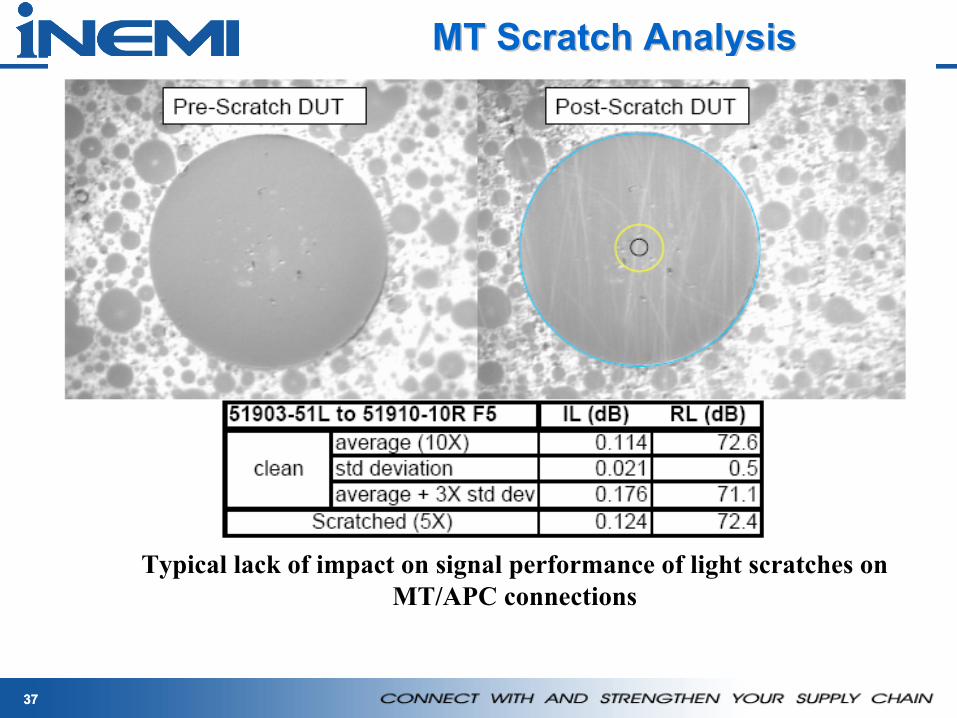
MT Scratch AnalysisMT Scratch Analysis
Typical lack of impact on signal performance of light scratches on MT/APC connections
38
Redistribution of ParticlesRedistribution of Particles--
Multiple MatingMultiple Mating
38
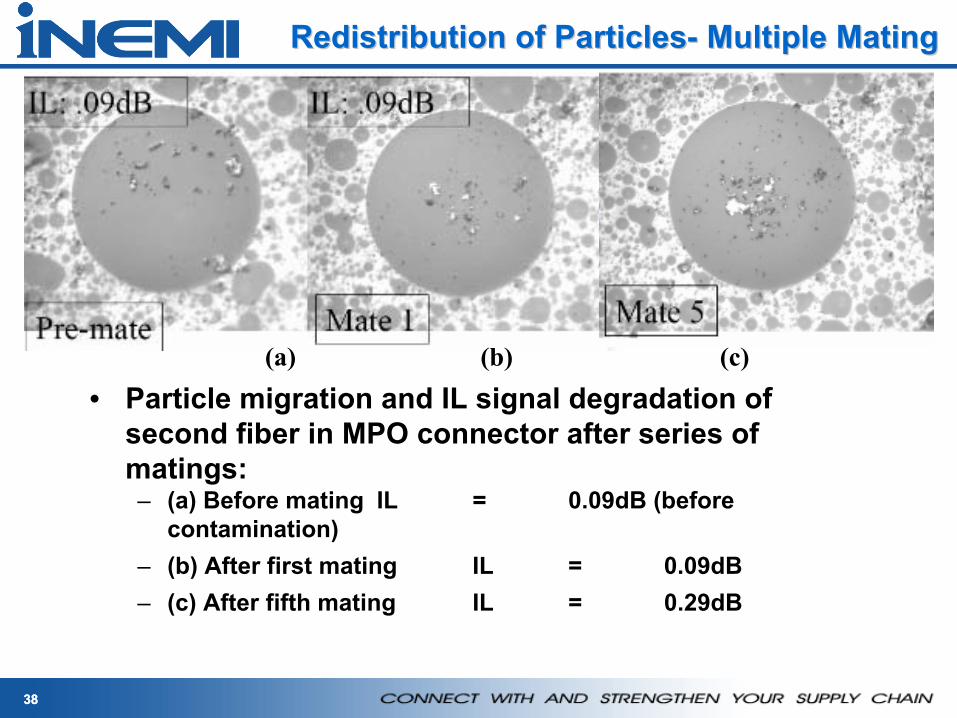
(a) (b) (c)• Particle migration and IL signal degradation of
second fiber in MPO connector after series of matings:– (a) Before mating
IL
=
0.09dB (before contamination)
– (b) After first mating
IL
=
0.09dB– (c) After fifth mating
IL
=
0.29dB
39
Evolution of Particle Center PositionEvolution of Particle Center Position
39
0
5
10
15
20
25
30
35
40
45
50
0 1 2 3 4 5 6
Number of mating s
Rc, um
F 1
F 2
F 3
F 4
F 5
F 6
F 7
F 8
F 9
F 11F 1
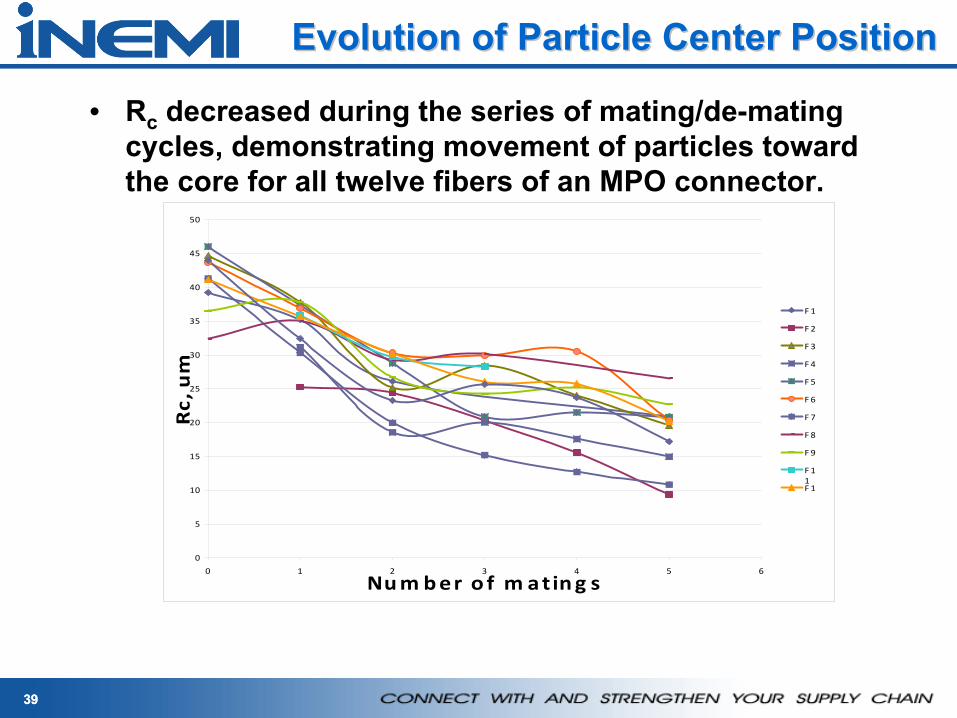
• Rc
decreased during the series of mating/de-mating cycles, demonstrating movement of particles toward the core for all twelve fibers of an MPO connector.
40
MPO IL and OA CorrelationMPO IL and OA Correlation
• MPO data initially had lower correlation between OA and IL than previous experiments.
• Hypothesized that cause was not including contamination on reference in OA.
• Developed new separation factor to estimate combined effect of DUT and Ref OA, since combined OA could not be calculated.
40
4141
Separation factorSeparation factor
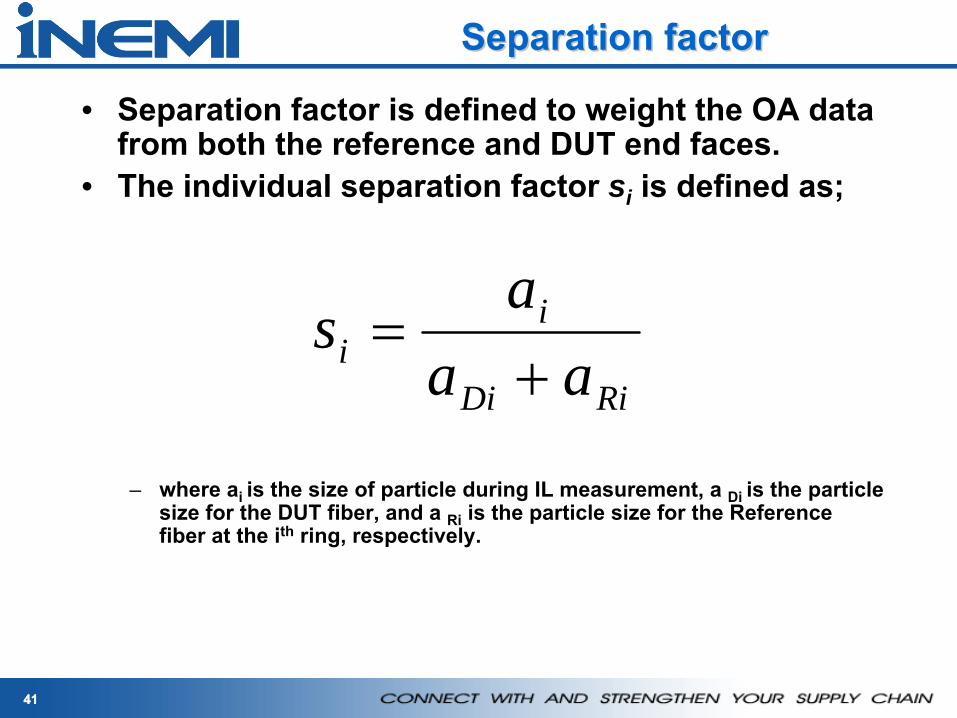
• Separation factor is defined to weight the OA data from both the reference and DUT end faces.
• The individual separation factor si is defined as;
– where ai is the size of particle during IL measurement, a Di is the particle size for the DUT fiber, and a Ri
is the particle size for the Reference fiber at the ith
ring, respectively.
RiDi
ii aa
as
+=

4242
4
0
123
4
0
123
DUT
Reference
)()(
,
0
0
0
0
0
0
RDN
ii
N
iRiDii
N
ii
N
iRi
R
N
ii
N
iDi
D
ffsfA
aasf
Therefore
A
af
A
af
+=→Γ
Γ+=
Γ
Γ=
Γ
Γ=
∑
∑
∑
∑
∑
∑
Case 1: Vertical split (red particle)sv = ai
/(aDi
+ aRi
) = 1where aDi
=aRi
=0.5ai
Case 2: Horizontal split (green particles)sh
= ai
/(aDi
+aRi
) = 0.5where ai = aDi
= aRi
IL Test
Separation FactorSeparation Factor
4
0
123
4343
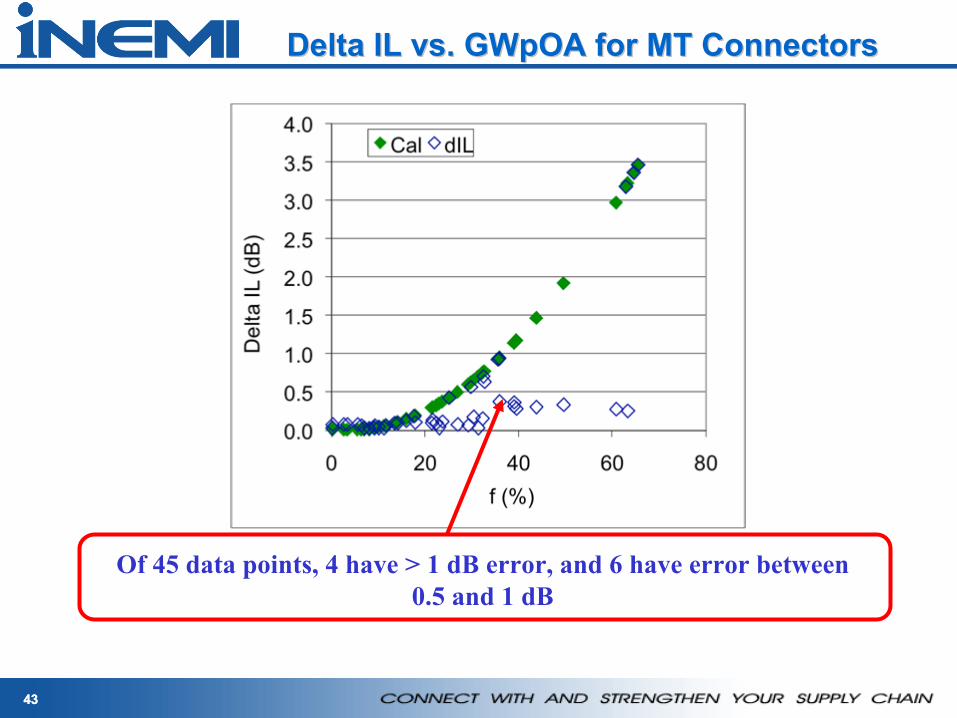
Delta IL vs. GWpOA for MT ConnectorsDelta IL vs. GWpOA for MT Connectors
Of 45 data points, 4 have > 1 dB error, and 6 have error between
0.5 and 1 dB
4444
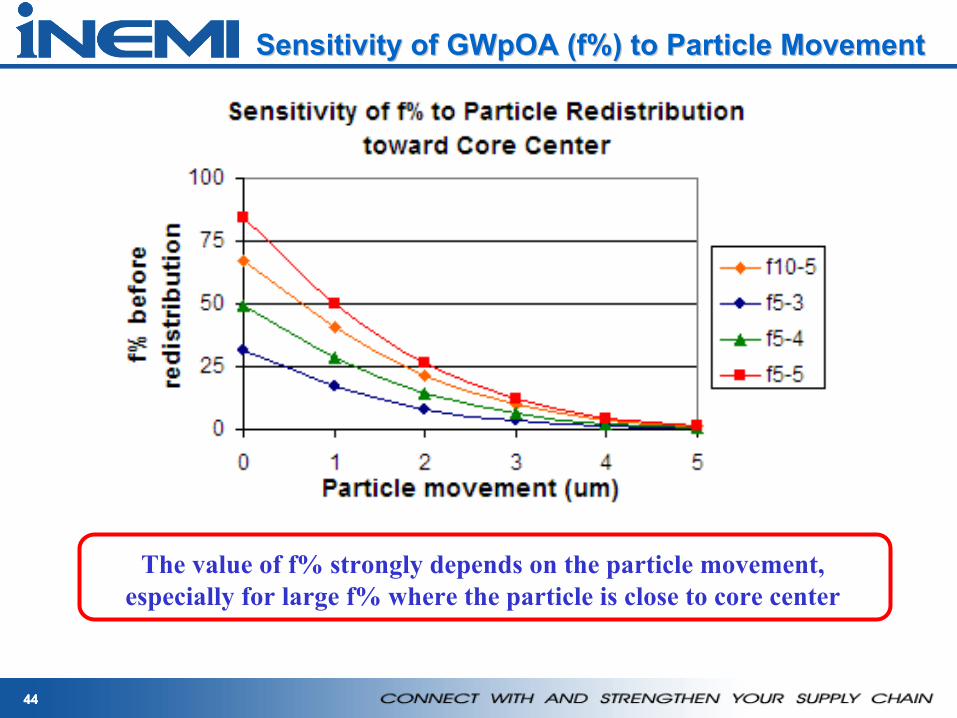
Sensitivity of GWpOA (f%) to Particle MovementSensitivity of GWpOA (f%) to Particle Movement
The value of f% strongly depends on the particle movement, especially for large f% where the particle is close to core center

4545
Inspection CriteriaInspection Criteria

4646
ConclusionsConclusions
• iNEMI team conducted experiments to investigate the effects of contamination on the optical performance of SM Angled Physical Contact MT fiber optic connectors.
• Contamination of the 25μm zone results in increase of IL for MT connectors (IL delta maximum ~1.5dB) and decrease of RL (RL delta maximum ~21dB).
• For more than 65 mated fiber pairs, no signal degradation was observed with significant contamination of up to 30% Occluded Area in the cladding zone.
4747
ConclusionsConclusions
• Particle accumulation toward the core was observed for repetitive connector mating cycles.
• Improved correlation between signal performance and GWpOA for MT connectors was observed when the Reference image was accounted for using the separation factor.
• Sensitivity to fiber center estimation and/or particle migration during the measurement process was estimated. Some discrepancies between calculated and measured data were removed by taking into consideration particle movement during a series of repetitive mating cycles.
4848
ConclusionsConclusions
• The iNEMI team continues to work with the International Electrotechnical Committee (IEC), Telecommunications Industry Association (TIA) and IPC (Optoelectronic Assembly and Packaging Technology) to develop endface quality standards.
• Based on results of this study, iNEMI has proposed acceptance criteria for SM Angled Physical Contact MT connectors.
49
49
IEC,86B MeetingsKyoto
Japan 2008
Receptacle and Lens Device Criteria
Development Project
50
Presentation OutlinePresentation Outline
• Introduction and Background• Common MSA Package Types• Lens Type Definitions & Table Development (Survey) • Examples of TOSA/ROSA design
– (Physical Contact and Non-Contact)
• Technology Matrix • Next Steps (Modeling and Experiments)• Details of Previous Work• Summary
5151
IntroductionIntroduction
• iNEMI Research started on receptacle fiber-stub devices– Receptacle (stub devices) cleanliness paper published (Sep 2005)– Initial work started on lens devices (2006)
• Development of Cleanliness Criteria for receptacle fiber stub and lens devices was presented at IEC meeting, Prague, Apr, 08 and Kyoto meeting, Nov, 09
• Additional research needed to propose standard criteria for multiple receptacle types (fiber stub, lens)
• Benefits of receptacle research and criteria– Clarify receptacle design categories, common language– Development of standard inspection criteria – Increased awareness of impact of contamination– Less down time due to contaminated transceivers
5252
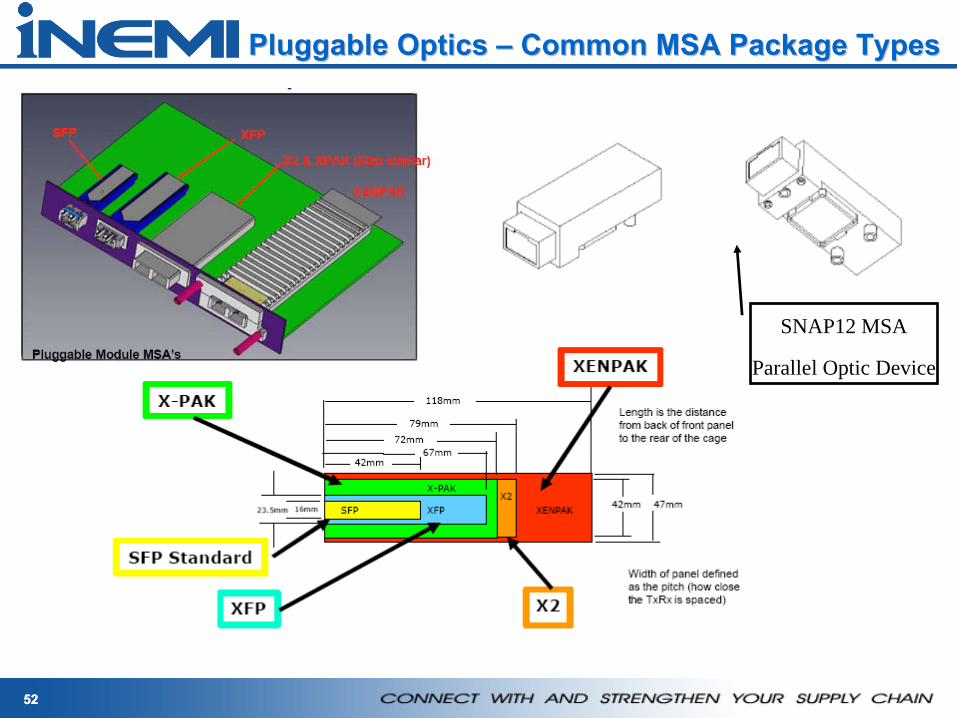
Pluggable Optics Pluggable Optics ––
Common MSA Package TypesCommon MSA Package Types
SNAP12 MSA
Parallel Optic Device
5353
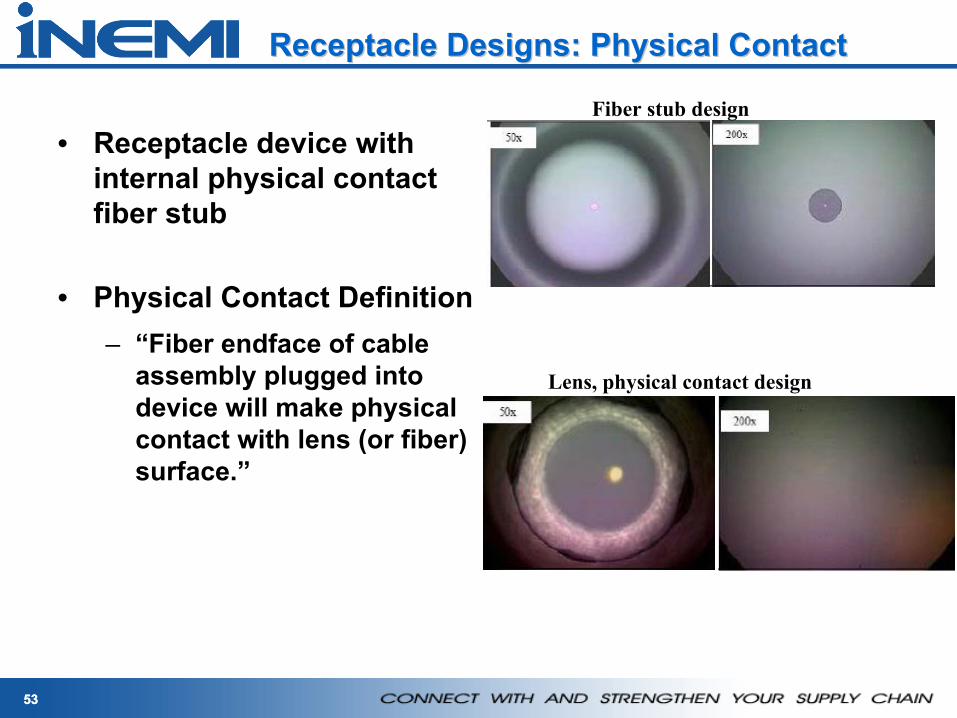
Receptacle Designs: Physical ContactReceptacle Designs: Physical Contact
• Receptacle device with internal physical contact fiber stub
• Physical Contact Definition – “Fiber endface of cable
assembly plugged into device will make physical contact with lens (or fiber) surface.”
Fiber stub design
Lens, physical contact design
5454
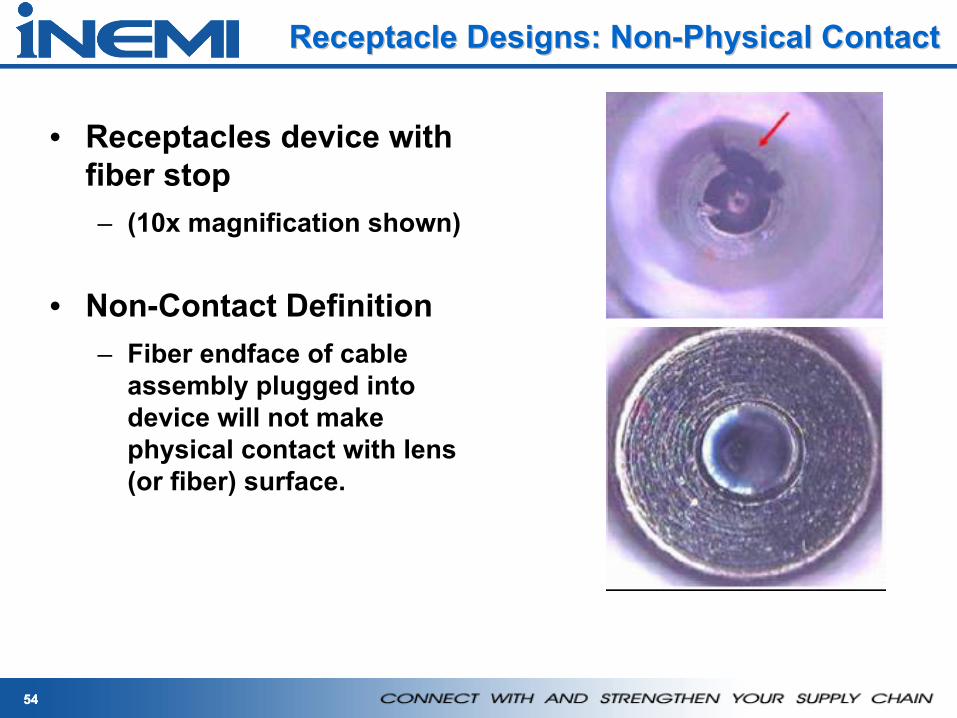
Receptacle Designs: NonReceptacle Designs: Non--Physical ContactPhysical Contact
• Receptacles device with fiber stop – (10x magnification shown)
• Non-Contact Definition– Fiber endface of cable
assembly plugged into device will not make physical contact with lens (or fiber) surface.
55
Receptacle Technology Matrix DevelopmentReceptacle Technology Matrix Development
Matrix Development• Small survey conducted with feedback from eight companies• Objectives of survey:
– Determine technologies available in industry– Set categories for receptacle technologies
56
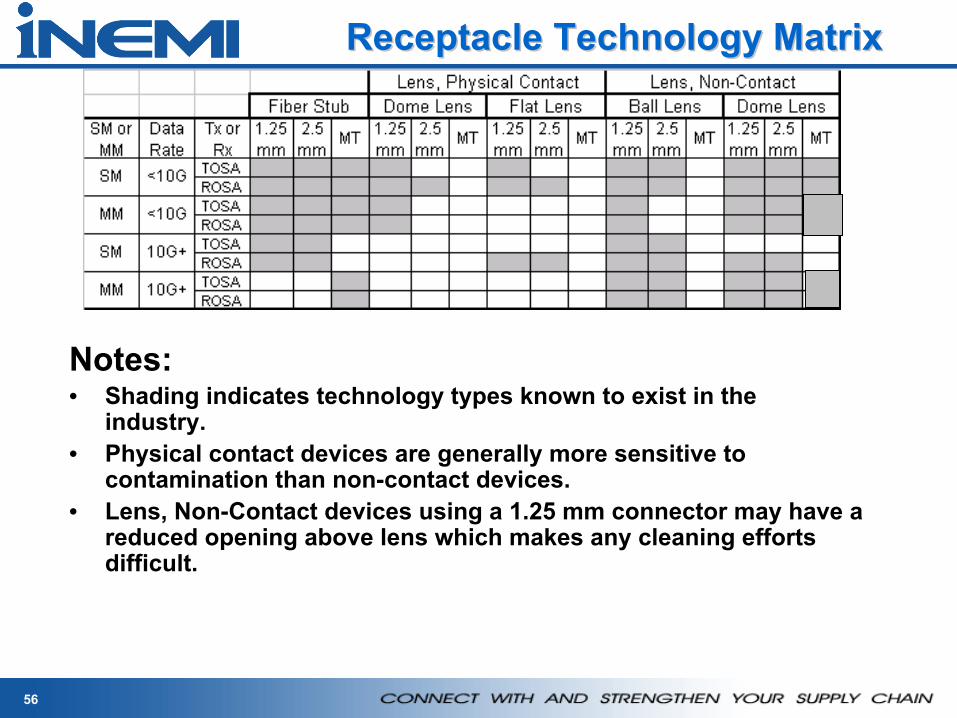
Receptacle Technology MatrixReceptacle Technology Matrix
Notes:• Shading indicates technology types known to exist in the
industry.• Physical contact devices are generally more sensitive to
contamination than non-contact devices.• Lens, Non-Contact devices using a 1.25 mm connector may have a
reduced opening above lens which makes any cleaning efforts difficult.
57
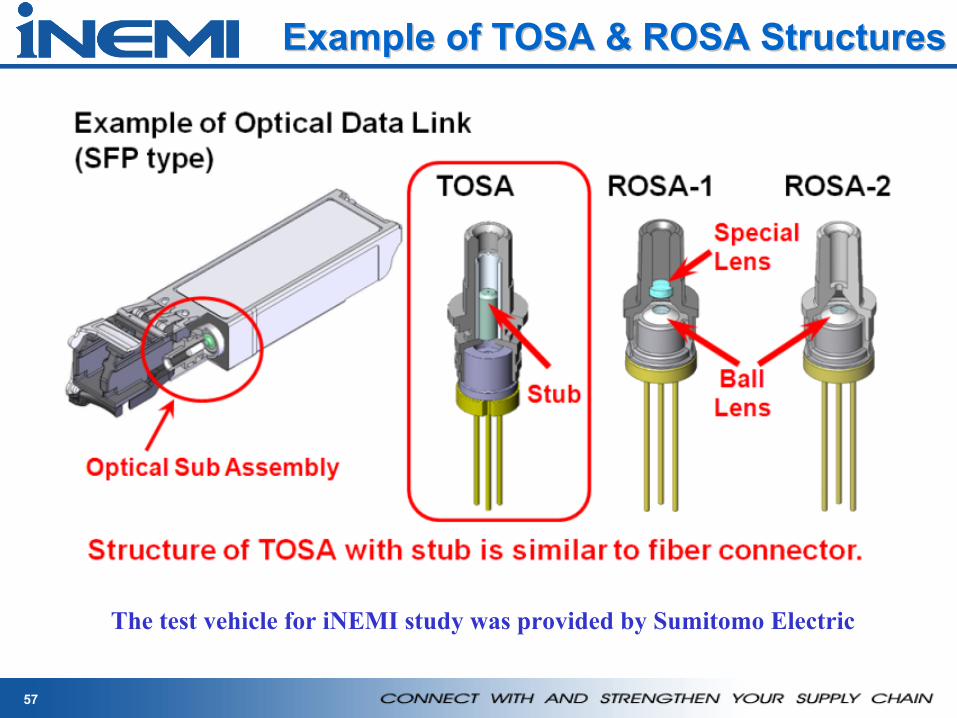
Example of TOSA & ROSA StructuresExample of TOSA & ROSA Structures
The test vehicle for iNEMI study was provided by Sumitomo Electric
5858
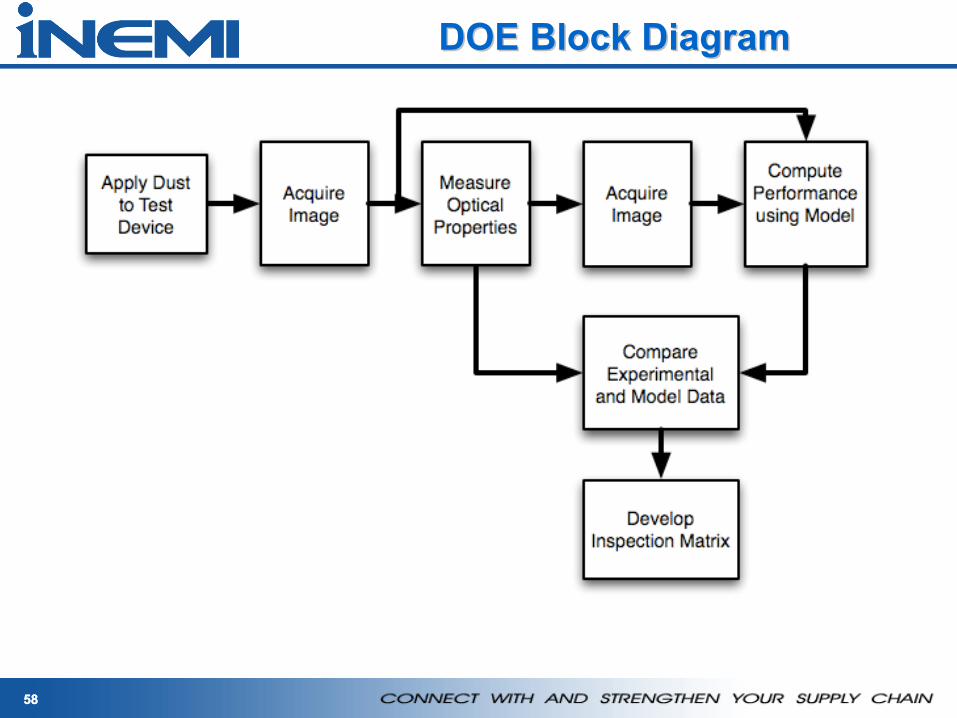
DOE Block DiagramDOE Block Diagram
5959
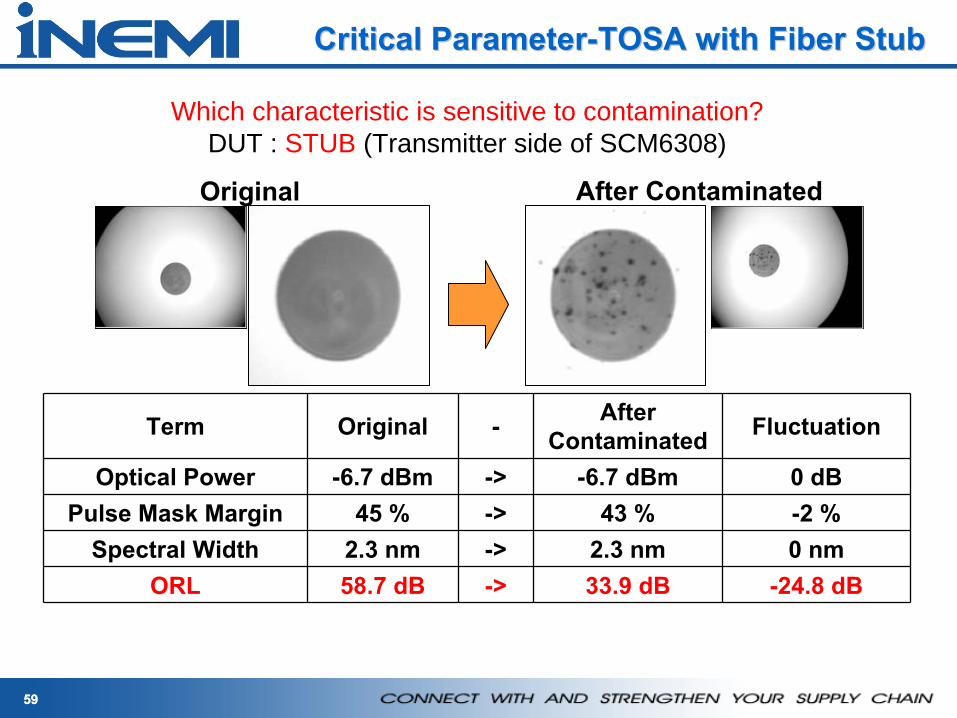
Critical ParameterCritical Parameter--TOSA with Fiber StubTOSA with Fiber Stub
Which characteristic is sensitive to contamination?DUT : STUB (Transmitter side of SCM6308)
After ContaminatedOriginal
Term Original - After Contaminated Fluctuation
Optical Power -6.7 dBm -> -6.7 dBm 0 dBPulse Mask Margin 45 % -> 43 % -2 %
Spectral Width 2.3 nm -> 2.3 nm 0 nmORL 58.7 dB -> 33.9 dB -24.8 dB
6060
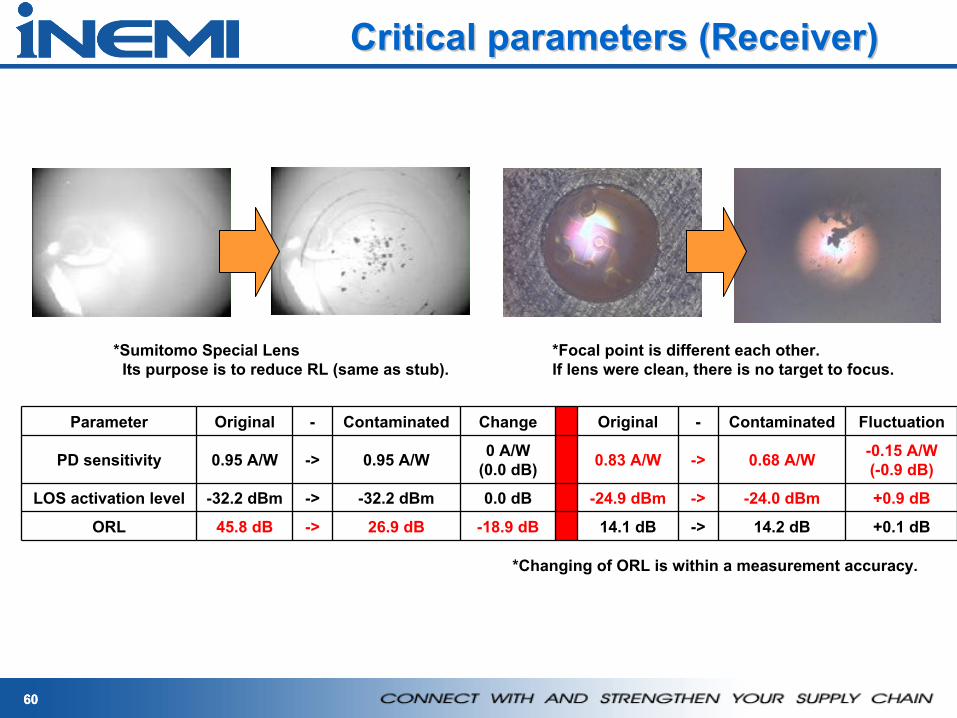
Critical parameters (Receiver)Critical parameters (Receiver)
Parameter Original - Contaminated Change Original - Contaminated Fluctuation
PD sensitivity 0.95 A/W -> 0.95 A/W 0 A/W(0.0 dB) 0.83 A/W -> 0.68 A/W -0.15 A/W
(-0.9 dB)
LOS activation level -32.2 dBm -> -32.2 dBm 0.0 dB -24.9 dBm -> -24.0 dBm +0.9 dB
ORL 45.8 dB -> 26.9 dB -18.9 dB 14.1 dB -> 14.2 dB +0.1 dB
*Focal point is different each other.If lens were clean, there is no target to focus.
*Changing of ORL is within a measurement accuracy.
*Sumitomo Special LensIts purpose is to reduce RL (same as stub).
6161
Processing collected data Processing collected data
• Sumitomo collected a lot of the experimental data on the influence of the contamination on the optical performance of TOSA ( 2005) and ROSA ( 2006-2007)
• Process the lens images using PVI Systems software, calculate Occluded Area and bitmap of contamination
• Based on the details of the ROSA design and GW%OA, model the ROSA data (receiver sensitivity)
• Compare experimental and modeling data
62
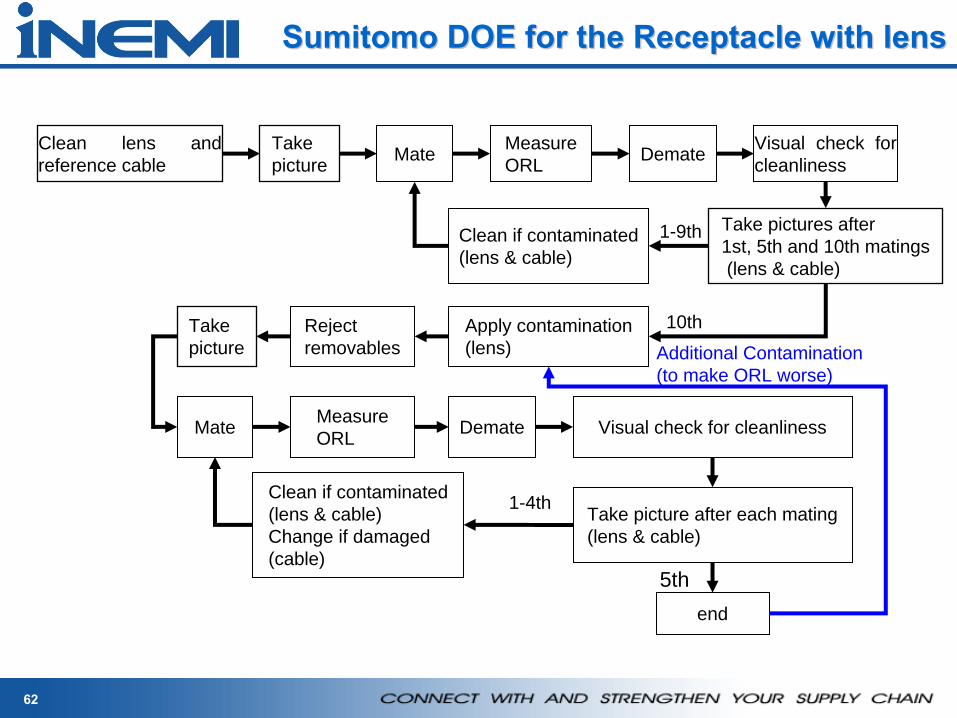
Sumitomo DOE for the Receptacle with lensSumitomo DOE for the Receptacle with lens
Take picture Mate Measure
ORLVisual check for cleanliness
Apply contamination(lens)
1-9th
Take picture after each mating(lens & cable)
1-4th
DemateClean lens and reference cable
Take pictures after1st, 5th and 10th matings(lens & cable)
Clean if contaminated(lens & cable)
10th
Mate MeasureORL Visual check for cleanlinessDemate
end
5th
Clean if contaminated (lens & cable)Change if damaged(cable)
Reject removables
Take picture Additional Contamination
(to make ORL worse)
63
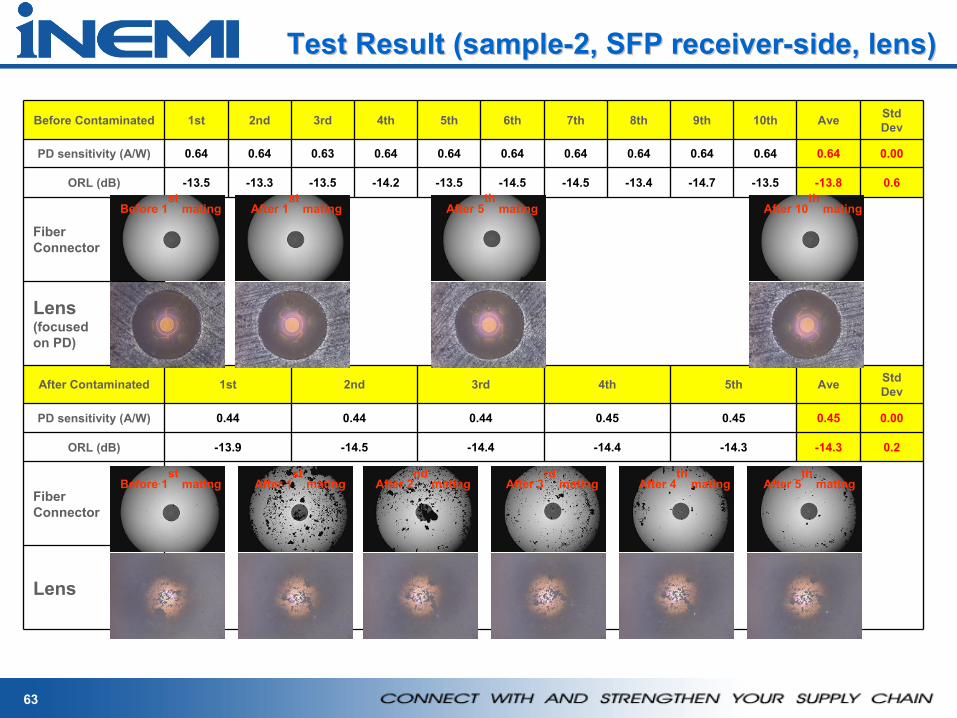
Test Result (sampleTest Result (sample--2, SFP receiver2, SFP receiver--side, lens)side, lens)
Before Contaminated 1st 2nd 3rd 4th 5th 6th 7th 8th 9th 10th Ave Std Dev
PD sensitivity (A/W) 0.64 0.64 0.63 0.64 0.64 0.64 0.64 0.64 0.64 0.64 0.64 0.00
ORL (dB) -13.5 -13.3 -13.5 -14.2 -13.5 -14.5 -14.5 -13.4 -14.7 -13.5 -13.8 0.6
FiberConnector
Lens(focused on PD)
After Contaminated 1st 2nd 3rd 4th 5th Ave Std Dev
PD sensitivity (A/W) 0.44 0.44 0.44 0.45 0.45 0.45 0.00
ORL (dB) -13.9 -14.5 -14.4 -14.4 -14.3 -14.3 0.2
FiberConnector
Lens
After 1st
mating After 5th
mating After 10th
mating
After 1st
mating After 2nd
mating After 3rd
mating After 4th
mating After 5th
matingBefore 1st
mating
Before 1st
mating
64
Modeling InputsModeling Inputs
• Modeling tool: ZEMAX• Bitmap files of contaminated receptacle lens processed to
represent the light transmission pattern of the lens.• Lens illumination area size and fiber location relative to lens.• Fiber types (single mode or multimode).• Wavelength.• Coupling efficiency (power measured through fiber/power
measured without fiber) before and after contamination for transmitters.
• Light output measurement data before and after contamination of dust for transmitters.
• Receiver sensitivity measurement data before and after the application of dust for receivers.
65
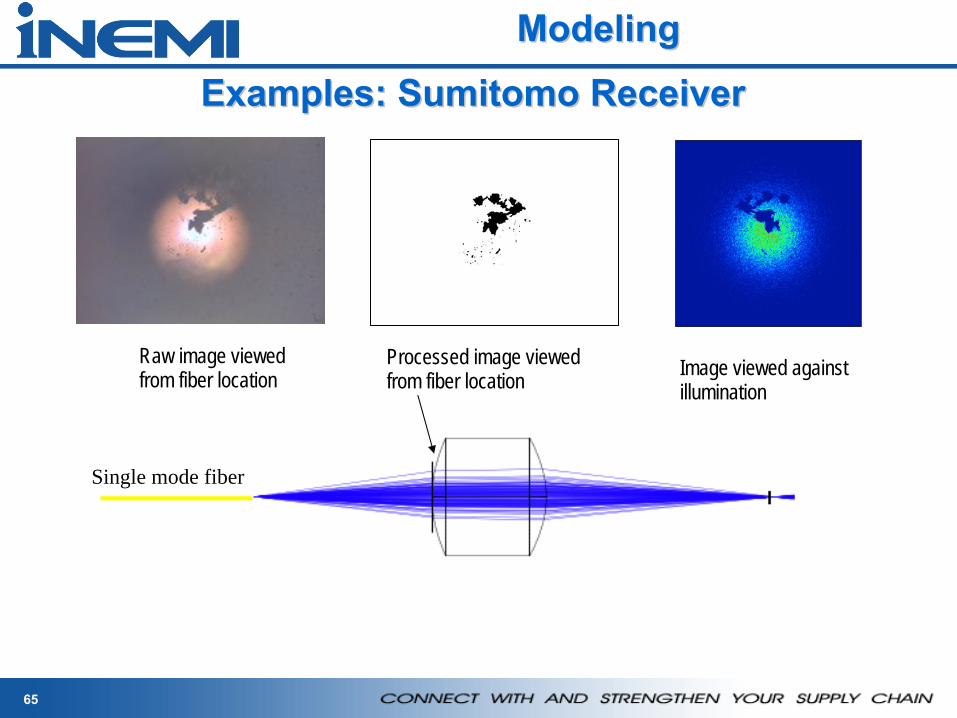
Examples: Sumitomo ReceiverExamples: Sumitomo Receiver
Processed image viewed from fiber location
Raw image viewed from fiber location Image viewed against
illumination
Single mode fiber
ModelingModeling
66
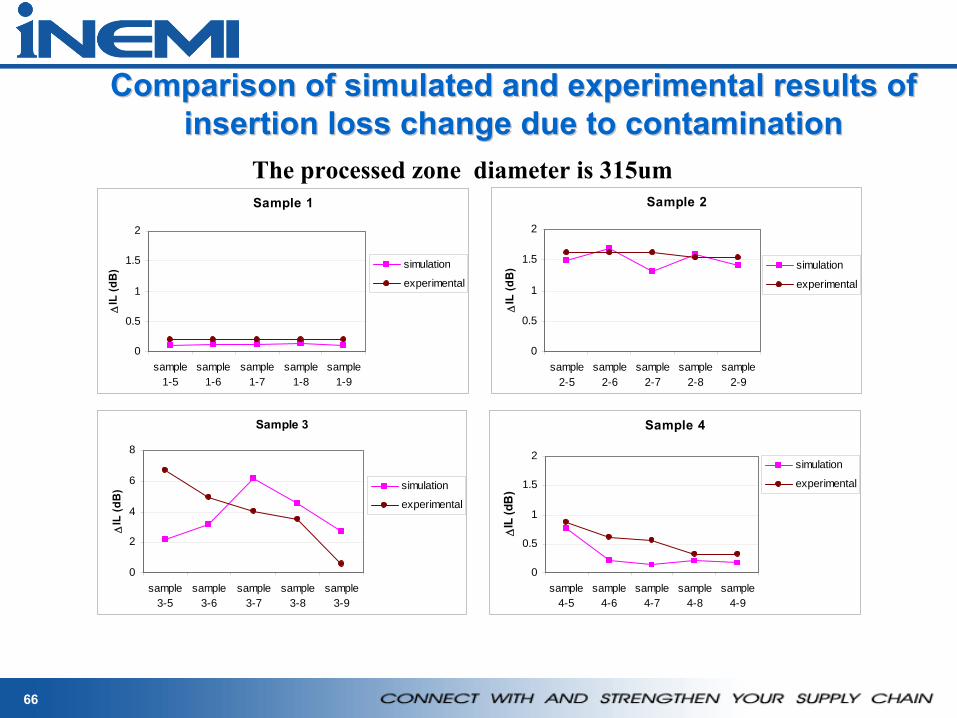
Comparison Comparison of simulated and experimental results of of simulated and experimental results of insertion loss change due to contaminationinsertion loss change due to contamination
Sample 1
0
0.5
1
1.5
2
sample1-5
sample1-6
sample1-7
sample1-8
sample1-9
ΔIL
(dB
) simulation
experimental
Sample 2
0
0.5
1
1.5
2
sample2-5
sample2-6
sample2-7
sample2-8
sample2-9
ΔIL
(dB
) simulation
experimental
Sample 3
0
2
4
6
8
sample3-5
sample3-6
sample3-7
sample3-8
sample3-9
ΔIL
(dB
) simulation
experimental
Sample 4
0
0.5
1
1.5
2
sample4-5
sample4-6
sample4-7
sample4-8
sample4-9
ΔIL
(dB
)
simulation
experimental
The processed zone diameter is 315um
67
Modeling SummaryModeling Summary
• Simulated IL is typically lower than the measured IL.• Good correlation between experimental data and modeling data
has been achieved
considering contamination in the central 315 um diameter zone of the lens (
Samples 1, 2 and 4)• The discrepancy on Sample 3 may be attributed to the
contamination effect
from the fiber end-face which was ignored in simulation.
• Particle migration, obvious by examining before and after mating
images, may also cause discrepancy between simulation and experiment.
• In the future, clean fiber and non-removable particles is preferred to be used for validation experiment, which is more representative of
reality
68
SummarySummary
• iNEMI plans for gathering data and experiments– Use DOE proposed– Select the test vehicle for the experiment based on receptacle
technologies matrix– Use Modeling to Analyze Data– Compare Modeling and Experimental Data
• Strategy for Development of Criteria– Use data to develop criteria and propose to IEC for potential
inclusion in future standard (IEC 86B and 86C)– Collaborate with JIS on standards development– Recommend updates to IPC-8497-1 for receptacle devices

69
ConclusionsConclusions
70
Next StepsNext Steps

71
Questions?
72
Leading the IndustryLeading the Industry
Collaboration with TIA, IEC and IPC• The Project is collaborating with International Electrotechnical
Committee (IEC), Telecommunications Industry Association (TIA) and IPC to develop a cleanliness standard.
iNEMI presentations:• OMI conference, Ottawa, Apr-29-May 1, 2003• IEC meeting, Montreal, Quebec, Canada, Oct 6-13, 2003 (presented by T.
Berdinskikh, Celestica)• APEX2004, Anaheim, California, Feb 19-Feb 26, 2004• IEC meeting, Locarno, Switzerland, Apr, 04 (presented by T. Mitcheltree,
Cisco)• IEC meeting, Warsaw, Poland, Sep, 04 (presented by R. Manning, Tyco)• APEX2005, Anaheim, California, Feb, 05 • IEC meeting, Charlotte, NC, Apr, 05 (presented by R. Manning, Tyco)• A draft of IPC-8497-01 “
Cleaning Methods and Contamination Assessment for Optical Assembly”
has been submitted to IPC (June, 04)
• OFC2006, Anaheim, California, Feb, 06 • IEC meeting, Quebec City, Canada, Oct, 06 ( presented by T. Berdinskikh and
Heather Tkalec)
73
PublicationsPublications“Optical Connector Contamination/ Scratches and its Influence on Optical Signal Performance’, Journal of SMTA, V. 16, issue 3, 2003, pp.40-49“ At the Core:How Scratches, Dust, and Fingerprints Affect Optical Signal Performance’, Connector Specifier, January 2004, pp.10-11“ Degradation of Optical Performance of Fiber Optics Connectors in a Manufacturing Environment’, Proceedings of APEX2004, Anaheim, California, Feb 19-Feb 26, 2004, pp.PS-08-1-PS-08-4“Cleaning Standard for Fiber Optics Connectors Promises to Save Time and Money”, Photonics Spectra, June 2004, pp.66-68“Development of Cleanliness Specification for Single- Mode Connectors”, Proceedings of APEX2005, Anaheim, California, Feb 21-26, 2005, pp. S04-3-1- S04-3-16.“Keeping it clean: A cleanliness specification for single-mode connectors”, Connector Specifier, Aug, 05, pp.8-10.“Contamination Influence on Receptacle Type Optical Data Links”, Photonics North, 2005, Toronto, Canada, Sep, 05.“Development of Cleanliness Specifications for 2.5 mm and 1.25 mmferrules Single- Mode Connectors” – Proceedings of OFC/NFOEC, Anaheim, California, Mar 5-10, 06“ Standardizing cleanliness for fiber optic connectors cuts costs, improves quality” Global SMT & Packaging, June/July 2006, pp10-12.
9 Papers published by the Project Team