Embed Size (px)
Citation preview
s Technical Bulletin No. 931 December 1946
Fiber and Spinning Properties of Cotton, With Special Reference to Varietal and Environmental Effects^
By H D BARKER, principal pathologist, and E. E. BERKLEY, cotton technologist, Division of Cotton and Other Fiber Crops and Diseases, Bureau of Plant Industry, Soils, and Agricultural Engineering, Agricultural Research Administration
CONTENTS
Page Summary 2
Irrigated and nonirrigated cot- tons 2
1943 crop 3 Studies on cotton grown in irri-
gated and nonirrigated regions, 1935-43 4
Experimental procedure 5 Results 6 Interpretation of results aûd
discussion—_ 10 Classer's staple 10 Equivalent staple and equiv-
alent staple minus class- eras staple. __ 11
Yarn-appearance grade 12 Neps in card web - - 13 Picker and card waste 13
Page Cotton fiber and spinning tests
of the 1943 crop 13 Skein strength in relation to
fiber length and strength. 14 Fiber-length estimates 26 Fiber-strength estimates 29 Fiber fineness and cell-wall
development 29 Yarn-appearance grade and
related fiber and spinning properties 32
Fiber fineness as related to skein strength of higher counts 32
Conclusions 35
EXPERIMENTAL studies were inaugurated with the regional va- rietal studies in 1935 on fiber properties and spinning performance
of leading varieties and strains of cotton produced under varying con- ditions throughout the Cotton Belt. Through the cooperative eiforts of the various State agricultural experiment stations of the cotton area, the Bureau of Plant Industry, Sous, and Agricultural Engineer- ing and the Cotton Branch of the Production and Marketing Admin- istration, valuable data have been gathered and published m various processed reports. In order that these data may be viewed as a whole and in proper perspective, certain of them through 1943 are sum- marized here, together with data in the Bureau, to emphasize varietal and environmental effects on the various fiber and spinning properties. These summaries are divided into two sections, one dealing with irri-
1 Submitted for publication January 14, 1946.
717599—46 ^

2 TECHNICAL BULLETIN 931, U. S. DEPT. OF AGRICULTURE
gated and iionirrigated cottons and the other with the data reported from the ñber and spinning laboratories for the 1943 crop. The renort may be summarized as follows. leiepori
SUMMARY
IRRIGATED AND NONIRRIGATED COTTONS
A persistent prejudice against cotton grown on irrigated lands oi the Southwest has existed for many years. Since irrigated and nonirrigated regions are usually characterized by distinct commercial varieties, it has been difficult to determine whether prejudice against irrigated cottons was caused by environmental or varietal factors Cooperative agronomic fiber, and spinning studies during the past few years have provided data for evaluating these influences These data mdicate that classer's designation of staple length of varieties that were common to irrigated and nonirrigated regions averaged about one thirty-second of an inch longer for the imgated region Ihere was considerable variation within each of the regions wfthiii SL"^^f ? ^""^Qi-^^f staple from Sacaton, Ariz., tended to be shorter than that from Shafter, Calif., and State College, N Mex
Environmentally mduced fiber strength, as evaluated by equivalent staple minus classer's staple length, reverses the trend noted for classer s stap e. Fiber strength tends to be greater in the so-called "hard cotton ' regions of Texas and OHahoma, where staple length IS frequently less than average. ^
Usually, when better-than-average length occtos within a variety. It IS ofliset by reduced fiber strength, so that performance as measured by equivalent staple length is low. These data confirm previous studies m showing that environmentaUy mduced length is an unre- liable basis for evaluating cottons if fiber strength, fineness, and other fiber properties are ignored.
Locations in the nonirrigated areas, where both length and strength tend to be above average, are characterized by a good ground-water supply dunng the early fruiting stage, followed by a gradual lowering of this supply during the later frmting season. A sugfestion indicate! by these data is that irrigation practices may be modified to produce liber that is both longer and stronger than is usuaUy obtained from ram-grown cotton. •' """^
These data seem to confirm previous studies in indicating that under existing conditions yam-appearance grade is somewhat lower, neps in card web more numerous, and percentage of picker and card waste sligùtly ñigfier for varieties grown under irrigation
The most significant fact revealed by these data is that hereditary or vanetal factors overshadow environmental factors with respect to valuable fiber properties and spinning performance relationships Cotton breeders are meetmg the challenge by developing varieties with superior fiber qualities adapted to irrigated regions. Hence it seems reasonable to expect that buyers eventually must recognize that m both the irrigated and nonh-rigated regions varieties hiving superior fiber properties wdl give better spinning performance than the classer's grade and staple indicate.

FIBER AND SPINNING PROPERTIES OF COTTON 3
1943 CROP
Fiber and spinning measurements for the 1943 cooperative agro- nomic, fiber, and spinning studies are summarized in tables 4 to 11. These summaries list by varietal types and strains the effects of environmental influences and effects of varietal influences under certain environments, insofar as these data permit. The tabular summary makes evident several interrelationships among various fiber properties and in their apparent association with spinning performance. The principal objective of this report is to enable agronomists, cotton breeders, and others interested in the cotton- improvement program, in the performance of varieties, or in the study of location al effects to view these data as a whole in proper perspective. These data indicate that skein strength of singles 22s yarn is largely determined by fiber length and strength. By using the upper half mean from the Fibrograph and the converted Chandler tensile strength from the Pressley strength index, an approximate formula is presented for estimating skein strength of singles 22s yarn.
A comparison of fiber-length estimates shows that the mean of classer's staple for all varieties exceeded the upper half mean by 0.02 inch, as did the mean equivalent staple estimate. Certain varietal types were rather consistently over or under stapled on the basis of actual fiber-length measurements. This tendency seemed to be associated with yarn-appearance grade that resulted from spin- ning. Although a close agreement is apparent for upper half mean and mean length, there is little obvious relation between their ratio to each other, that is, uniformity ratio, and to skein strength of diff'erent varieties. Nor does it seem evident in these limited data that mean- length measurements would be preferable to, or in fact would be appreciably different from, upper half mean for predicting skein strength.
The percentage of deviations from the mean for equivalent staple minus upper half mean coincides more closely with plus or minus deviations for Pressley index than with those for X-ray determinations. Some interesting exceptions indicate that both measurements are valuable.
In general, good agreement is shown for fiber fineness as measured by weight per inch and by surface area. Usually, low weight per inch and correspondingly high Arealometer measurements characterize varieties or locations that give a low percentage of thick-walled fibers.
A close relationship exists between fineness and yarn-appearance grade. Neps in card web also are related to yarn-appearance grade and fiber fineness. The relation of picker and card waste to fiber fineness is less evident.
Fiber fineness is a desirable property for varieties that are likely to be spun into fine counts, although excessive fiber fineness appears to be an undesirable property where appearance of carded yarns is important, and it contributes little or nothing to skein strength of coarse count singles yarns. For 60s singles yarns an approximate formula is given for estimating skein strength from fiber length plus fiber strength plus fiber weight-per-inch measurements.

4 TECHNICAL BULLETIN 931, U. S. DEPT. OF AGRICULTURE
When the formulas derived from the 1943 crop were tested on the fiber data from the 1944 crop, it was possible to account for 83 to 84 percent of the varietal variability in the yarn strengths. The formulas were less effective for evaluating environmental effects.
STUDIES ON COTTON GROWN IN IRRIGATED AND NONIRRIGATED REGIONS, 1935-43
Regardless of its origin or cause, a definite prejudice in the spinning trade here and abroad has existed from many years against cotton grown on irrigated lands. When sea-island production almost ceased, following the advent of the cotton boll weevil on our eastern coast, long-staple spinners were forced to use Egyptian cottons. The writers understand that serious complaint from the spinners resulted, but information is meager as to whether slower operation, increased neppiness, and other difficulties were attributable largely to the fact that Egyptian varieties were markedly inferior in spinning properties to sea-island cotton or whether the difficulties found were partly attributable to production under irrigation conditions.
In recent years, this prejudice appears to have disappeared, but again it is not clear whether this has been due primarily to the develop- ment of superior Egyptian varieties or whether the growers, ginners, and manufacturers have adopted practices that tend to overcome the difficulties.
One practice has developed that may merit examination. Ginners of Egyptian cotton carefully clean and thoroughly mix the cotton before ginning, and prior to baling add a moderate quantity of moisture.
In the American cotton market, complaints about irrigated cotton have received considerable attention during the past 25 years. A rather exhaustive survey was conducted in 1928 by J. S. Townsend and others, and was summarized in an unpublished report.^ From the many interviews, it was apparent that the spinners were in fairly general agreement that irrigated cotton was much coarser and more wasty than similar staple lengths from the Mississippi Delta region, and it had a distinct tendency to stick to the steel roUers of the roving frames, to slow up combing operations, and to form neppy yarns. There was some evidence that this difficulty was caused partly by faulty ginning or by lack of patience or experience in m^-king suitable modifications in spinning practices when handling irrigated cottons.
Many subsequent reports on manufacturing experiences with irrigated cottons stress difficulty in dyeing, especially if mixed with nonirrigated growths, the occurrence of neps, more waste, a higher percentage of short fibers, and dryness that makes more '^fly'' in the mill than occurs in using rain-grown cotton. As a result of these difficulties, whatever their cause, corresponding staples have fre-
2 TOWNSEND, J. S., CAMP, W. B., WILLIS, H. H., and WIGINGTON, J. T. NOTES GATHERED IN INTERVIEWS WITH COTTON BROKERS, COTTON MILL PRESIDENTS, SUPERINTENDENTS, AND OTHERS RELATIVE TO THEIR EXPERIENCE WITH IRRIGATED COTTON OF THE SOUTHWEST. Cooperative report of Bureau of Plant Industry and the Bureau of Agricultural Economics. 27 pp. 1928. [Unpublished. Copy in files of Division of Cotton and Other Fiber Crops and Diseases, Bureau of Plant Industry, Soils, and Agricultural Engineering.]

FIBER AND SPINNING PROPERTIES OF COTTON 5
quently sold from a fraction of 1 cent to 2 cents a pound cheaper for irrigated cottons than for corresponding rain-grown staples. This may partly account for the fact that prior to the loss of our export trade in 1941, much of the irrigated cotton was exported to mills that did not share this prejudice. Increased demands for longer staple cottons since 1941 have resulted in a greater demand for irrigated cotton in American mills. _
Since 1920 the several cooperative agencies of the Department ol Agriculture have conducted spinning tests of fibers from different varieties grown under varying conditions to determine more precisely the influence of hereditary and environmental factors in contributing to spinning performance.
In a report by M. E. Campbell, issued in 1941,^ based on spinning tests from composite commercial samples, it was concluded that Delta cottons were more uniform in fiber length but were slightly coarser or heavier in fiber weight per inch than were the irrigated growths. There were no differences between percentage of thin- walled fibers. In total manufactured waste, the irrigated and non- irrigated growths differed, depending upon staple lengths. In the two shorter lengths, the Delta cottons were less wasty, whereas the irrigated cottons showed less waste for the longer staple lengths. In yarn appearance, the Delta cottons were on the average about two- thirds of a grade better than yarns from California cottons and nearly a full grade better than Arizona, New Mexico, Texas, and Oklahoma cottons. The irrigated cottons produced fabrics with a greater average number of neps than the nonirrigated growths. No outstand- ing differences were noted in the ease or speed of manufacturing operations.
These studies, made on commercial samples, reflect ditterences that may be attributable partly or whoUy to differences in varieties grown in irrigated and nonirrigated regions. Consequently, in the present summarization an attempt has been made to emphasize varietal differences that have resulted from the cooperative agronomic, fiber, and spinning studies conducted during the past several years on varieties grown in irrigated and in nonirrigated regions, as well as to make such evaluations as the data seem to warrant between localities representing these regions.
EXPERIMENTAL PROCEDURE
The data in the tables and charts presented in this section are drawn largely from six varieties of southeastern, mid-South, or Texas and Oklahoma origin that were grown for 1 to 7 years at many locations throughout the Cotton Belt, and from various strains of Acala cottons grown in the irrigated regions and in the Texas-Oklahoma rain-grown section. In several cases, duplicate samples, representing different blocks or different picking dates from the same blocks, were spun. The extensiveness of these data is iUustrated by the number of fiber and spinning tests recorded for each variety in table 1—from 6 to 135 tests for each of the 10 varieties listed. These data, it will be realized, are representative of the agricultural experiment stations in the
^ CAMPBELL M. E. TESTS OF IRRIGATED AND RAIN-GROWN AMERICAN UPLAND COTTON, CROP OF 1939. U. S. Agr. Market. Serv., 38 pp., illus. 1941. [Processed.]

6 TECHNICAL BULLETIN 931, U. S. DEPT. OF AGRICULTURE
locations where the cotton was grown rather than of the general ^u^^^i^ ^^ *^® farming practices in that region. Hence, the results should bß interpreted as not necessarily representing any locahty Mate, or region. Since many more tests were conducted throughout the ram belt, however, the results are perhaps more nearly those that may be expected for the commercial growth in the nonirrigated than m the irrigated areas.
TABLE 1.- -Number of observations at locations and for varieties from which data given in tables 2 and 3 were derived
Stations in the irrigated region Areas in the nonirrigated region
Variety or strain Shaf- ter,
Calif.
Saca- ton, Ariz.
State Col- lege, N.
Mex.
Re- gional total for
varie- ties
Texas- Okla- homa
Mid- South
South- east
Re- gional total for
varie- ties
Total for
varie- ties, both
regions
Rain-grown type: Stone ville 2B 3
9 8 2 2 2
4 10 8 1 2 2
3 10 8 2 2 2
10 29 24
5 6 6
16 38 18 12
5 6
20 45 26 17 8 8
22 23 14 8 2 2
58 106 58 37 15 16
Stoneville5 t)8
Delfos 4 (Missdel) . Deltapine 14
135 82
Mebane (Qualla) Lone Star (Startex)
42 21 22
Total for locations for rain-grown t ypes 26 27 27 80 95 124 71 290 370
Irrigated type: Acala, Shafter strains__. 18
9 2 2
13 5 2 2
6 8 2 2
37 22 6 6
9 5
46 Acala 1517 27 6 6
Acala N28 Acala Q6
Total for locations for irrigated types 31 22 18 71 14 14 85
Total for all locations . 57 49 45 151 109 124 71 304 455
RESULTS
It is not believed that the data here presented will serve fully to define the fiber and spinning properties of the irrigated and the rain- grown cottons. It is hoped, however, that they may serve to empha- size the relative importance of heritable or varietal factors and of environmental factors, and to develop leads that may be followed in obtaining maximum quality and market value for American irrigated and nonirrigated cottons.
These data are summarized in three tables. Table 1 is of interest m showing that considerable confidence may be placed in the trends shown by the data presented in tables 2 and 3. Table 1 shows the number of observations that form the basis for environmentally induced differences exhibited by varieties at different locations. Like- wise it shows the number of observations for each of the fisted locaHties as a basis for judging as to significance of differences in fiber quafity or spinning performance for the several varieties under given environ- mental conditions. Some of the varieties were grown from 1 to 10 years at each of the many locations. The average performance for varieties or locaHties summarized in tables 2 and 3, therefore, should be considered in relation to number of observations from which such averages are drawn, as shown in table 1.

FIBER AND SPINNING PROPERTIES OF COTTON
^ t-i 0^ ^ cc Ci is
o r« -3
^ 03
Ci.
<
¡1 si If r
1 eouajapiQ •^ t^ ce rHOï
•«OO'-îrHrH l" O)
f -.5
+
4.4
+
1.0
+
2.3
00
+ C<l
+
S,I9SSB10
_S <N Tfl CO CO i-t 00
v^ CO M CO CO CO CO
05
CO CO CO CO CO
ta
9ldB:js IN ci I-i rH r-î Ö aj
vfOCC CO CO CO CO Ci
o CO
CO CO »o 00
CO CO CO CO
CO
§
! 03
S § Xi
tí
Ö 03
.2
^ 90U8I85ia ci t^ »o l> CO QO »o
o COQO 1 j
++ ; I CÍ
+ o
+ 8ld«:^s
S,I9SSB10
_g CO 05 kO 05 t^ QO
N;O CO CO CO CO CO c<i CO ci CO
00
CO
^uei^Ainba ,g o ■* CO o OS CO
N CO ^'C^ r-î 05 C3 ^CO CO CO CO <N CO CO
00O5 1 1
COCO 1 Í
Oi
É 00 ci CO
1 9ldB;s _g CO 05 CO lO o o
N^ CO CO CO CO CO CO ?á 1
ú 8ldB:^s
i^uaiBAinba
¿OCOTHrHXCO
(M CO 1-H CO ^ i-H o v^OCO CO CO CO CO CO co
¡ CO
1 eidB^ls
S,JOSSBIO
e rH 00 o «O QO ■>*< CO
CO ! > CO
CO
dld'B%S ¿ OS rt< o 05 (M 00
^ío CO CO CO CO es CO CO ' CO
C3
il es
o
aidB^s S.J9SSB10
^g CO o <N «5 CO «O
^ CO CO CO CO CS <N
00 CïrH i !
ci CO ! 1 COCO 1 1
CO
CO
9id^^s :^u9iBAmba
ÇS o i-H 00 t~-o <N
CO
OOOS ¡ 1
ÚÉ i i OS 00
S3
1 s
I S 1 .a tí .2 S CQ
1 1 .2
>
l 90U9I9Sia ¿i>io iO"^ ^ CO
:gl ' 1111 7 c<t>.oco r^eó^-^ci I+++ + f
9ldB^S S,J9SSBI0
_g o 00 T-n>. »o 00 N (N r-î CO ci r-î ,-i
spO CO CO CO CO CO CO
CÍ 00 ci CO
9ldB!^S !^U9IBAinI)a
^g CO CO "0 CO o >o
^ CO CO CO CO CO d É CÏT-ltOOO
CO CO CO CO
CÍ
É »^ u
• ><
^¿ II
9ldß!;S S,I9SSBIC)
_e CO TH 0> lO lO lO
M ci CÍ CO CÍ T-î »-Î vp5 CO CO CO CO CO CO
CO
ci CO
00U50
CO CO CO CO
OS OS
9ld'BÎ^S ;^u9iBAinI)a
_g CO CO TH o »O iO t^CiiOO CO
si CO
É
9ldB:^s S,J9SSB10
_g o CÍ r-< o o >0 « Ö1-Î ci e4 r-î T4
vfO CO CO CO CO CO CO
CO
CO
lOCOOiO
cicôi-îci CO CO CO CO
CI o ci CO
9td«:^s :^u9ieAini)a
SoOMCÏOOiO CO
É oooo^oio
CO CO CO CO
OS CO
'S'c3
9idB;s S,J9SSBI0
ÇÎ t-1-t Tt< »o o o
^ la
9ldB!^S :^n9iBAint)a
g 1> Ci CI o lO-iO
víO CO CO CO CO CO CO n CÍTÍ^iOO
«^eoeo
o CO
00
.S ê o
Rai
n-gr
own
type
: st
onev
ille
2B
-
ston
evil
le 5
-.
D
elfo
s 4
(Mis
sdel
).
D
elta
pine
14
...
M
eban
e (Q
uall
a)
L
one
star
(S
tart
ex)
a
1 /3 1 1 1 a
'S tí .s
é B Xi
1
a 'S
ftC«

8 TECHNICAL BULLETIN 9 31, U. S. DEPT. OF AGRICULTURE
TAB-LB S.—Comparison of yarn-appearance grade, neps, and percentage of waste of cotton representing ratn-grown types of Acala cotton developed in the irriaated region ^
[The number of observations from which means listed were obtained are given in table 1, and the data on staple length are presented in table 2]
YARN-APPEARANCE GRADE i IN 22s
Stations in the irrigated region
Areas in the nonirrigated region
.a o
X2
Variety or strain 13 Ü
1 1 Oí .
o o os
CQ
ß "a •S 03
>
C3
M
CD
o CO
1 1 "S o CO
1 'S •S
>
fi-S
%
> Rain-grown type: *
Stoneville2B.. 8.7 8.3 7.4 8.0 9.0 8.5
8.0 7.6 7.1 9.0 8.0 6.5
7.7 8.9 6.5 7.5 7.5 8.0
8.1 8.3 7.0 8.2 8.2 7.7
8.2 8.3 7.7 8.2 7.4 8.3
8.5 8.7 8.1 8.5 8.5 9.2
8.7 9.1 7.9 8.5
10.0 10.0
8.5 8.7 7.9 8.4 8.6 9.1
Stoneville5 8.3
Delfos4(Missdel)..._ 8.5 Deltapine 14 7.4
Mebane (Qualla) 8.3 Lone Star (Startex) _ _ 8.4
8.4
Locational means 8.3 7.7 7.7
7.8 7.5 7.5 6.5
7.9
7.9 7.6 7.3 6.7
8.0
8.1 7.4
8.6 9.0 8.5
8.1 7.4
8.2
8.3 8.4 7.0 6.4
7.5 7.0 7.5 7.5
Irrigated type: Acala, Shafter strains... 8.0
7.5 7.3 6.7
Acala 1517 Acala N28 Acala Q6._
Locational means 7.5
7.9
7.5
7.9
7.3
7.6
7.4
7.6
7.8
7.9
7.8 7.6
8.6 Locational means, both types.. 9.0 8.2 7.« NKFti 3 IN 100 SQUARE INCHES OF CARD WEB
Rain-grown type: Stone ville 2B 12.3 35.2
76.0 28.3 17.0
25.3 46.5
17.9 14.2
19.9 22.5
15.2 10.0
17.7 15.6 StoneviUe5 21.5
Delfos 4 (Missdel) 31.0 Deltapine 14 18.5 16.0 20.5 18.3 21.2 19.1 24.4 18.5
Mebane (Qualla) 18.4 Lone Star (Startex)
Locational means 15.4 42.4 21.9 30.0 17.8 20.5 16.5 18.3 24.2 Irrigated type:
Acala, Shafter strains 21.8 21.2
35.7 45.5
31.0 37.2
29.5 34.6
20.5 30.2
20.5 30.2
25.0 32.4 Acala 1517
Acala N28 Acala Q6-
Locational means 21.5
18.4
40.6 34.1 32.1 25.4 25.4 28.8 Locational means, both types. 41.5 23.0 31.0 21.6 20.5 16.5 21.8 26. .
Rain-grown type: Stoneville2B 7.5
9.1 10.0 7.3 8.6 9.6
9.0 8.9 8.7 7.3 9.8
11.0
7.7 - 6.8
7.6 6.9 7.7 8.1
8.1 8.3 8.8 7.2 8.7 9.6
6.6 8.9
12.1 6.7
12.6 14.0
7.4 8.9
10.1 7.3 7.7 8.2
6.6 8.3
10.7 6.1 8.7 7.1
6.9 8.7
11.0 6.7 9.6 9.8
Stone ville 5 7.6
Delfos 4 (Missdel) 8.5
Deltapine 14. 9.9
Mebane (Qualla) 7.0 Lone Star (Startex) 9.2
9.7
Locational means 8.7 9.1 7.5 8.4 10.2 8.3 7.9 8.8 8. 6 Irrigated type:
Acala, Shafter strains . 7.1 7.4 8.5 9.4
7.8 7.5 9.3 8.9
7.0 6.5 6.8 7.6
7.3 7.1 8.2 8.6
7.9 6.5
7.9 6.5
7.6 6.8 8.2 8.6
Acala 1517 Acala N28-5 Acala Q6
Locational means 8.1 8.4 7.0 7.¿ 7.2 7.2 7.5
Locational means, both types.. 8.4 8.8 7.2 8.1 8.7 8.3 7.9 8.0 8.0
BsÄi'i^mlric^^^^^^^^^^^ ^7w^."í^"^Vf^]ySP°^^^®^®^^^^* ^(8.0) is average fW 22s singles carded yar¿s. » ^f o, ^^-o,
« 1 to 15=low, 16 to 25=average, 26 to 40=high, above 40=very high.

FIBER AND SPINNING PROPERTIES OF COTTON 9
Table 2 presents the classeras staple length averaged for each variety by locations in the irrigated region and by three rather distinct areas in the nonirrigated region. Staple length as determined by customary classing methods has been defined (see footnote 8, p. 13) as a designa- tion which ''indicates the length of a 'typical portion' of the fibers in a sample. Uniformity of fiber length, as well as other fiber properties, probably influences to some extent the classeras selection of the 'typical portion' upon which staple length designation is based." In making the summarization given in table 2 consideration was given to including the actual length measurements. Such measurements, however, were not included in view of the fact that conversions would be required. In the earlier studies length was obtained from arrays, whereas in the later test it was determined by the Fibrograph.
Table 2 also shows spinning performance as measured by "equivalent staple length,'' a term that was adopted to indicate whether the skein strength of the resultant yarn was greater or less than would be expected in spinning fiber of the staple length assigned by the classers. If the skein strength is greater than is expected from a given staple length, the equivalent staple exceeds the classer's staple. Thus the comparison of staple length and equivalent staple length gives a measure of the contribution to yarn strength that is made by fiber properties other than staple length. In other words, it becomes primarily a measure of the influence of fiber strength. The equivalent
staple ^ IS derived from the formula L= 2145 is ' where
L=equivalent staple, S=skein strength, and (7=yarn count. The estimates summarized represent the average strength index of the three counts of yarns that were spun.
For the purpose of this study, it is believed that the comparison of classer's staple and equivalent staple may be used to determine whether the buyer who is interested primarily in yarn strength is getting less or more than he pays for from the cotton of a particular variety or from a given locality of growth. The values given in table 2 merit detailed ex- amination, especially as to the consistency of trends exhibited and as to the number of observations (table 1) from which the means were obtained.
Table 3 gives a summary of varietal and environmental effects influencing yarn-appearance grade, neps in card web, and total percentage of waste. The yarn-appearance grades are means for 22s only, the neps are the means found per 100 square inches of card web, and percentages of waste are means for the total waste from picker and card. The arrangement of the varieties and stations is similar to tables 1 and 2, and the number of observations also are the same except for neps. No nep data were obtained prior to 1941. There appears to be a slight tendency within variety for yarn-appearance grade to follow equivalent-staple length. A distinct inverse relation is evident be- tween the percentage of waste and yarn-appearance grade, as the coding for grade is here used; in other words, the lower the percentage of waste the higher the yarn-appearance grade.
In considering the data in tables 2 and 3, it should be noted that Acala N28-5 and Acala Q6 were not grown in the rain belt. Santan
* UNITED STATES WAR FOOD ADMINISTRATION, COTTON FIBER AND SPINNING TESTING SERVICE. U. S. War Food Admin. 16 pp. 1944. [Processed.]
717509—46 2

10 TECHNICAL BULLETIN 931, U. S. DEPT. OF AGRICULTURE
Acala was included with Shafter at Sacaton. Several selections from Acala 1517 were included under Acala 1517. The data show that Acala (Shafter) and the six varieties of the nonirrigated type gave an equivalent staple that was inferior to classeras staple in the irrigated region, whereas in the nonirrigated region the equivalent staple length equaled or exceeded the classeras staple. Certain varieties, particu- larly Acala 1517, showed an equivalent staple that was greater at all locations than was the classeras staple. The records show an occasional sample from this variety to have a lower equivalent staple than class- eras staple, but such examples are rare.
In considering the detailed varietal or environmental effects, 1 variety of cotton was examined at the individual locations throughout the Cotton Belt. Stoneville 5 was grown at 23 locations from Shafter, Calif., to Florence, S. C. This Delta-bred variety showed an equivalent staple that exceeded the classeras staple at three of the four irrigated locations. Certain stations in the irrigated region, as well as in the rain belt, show marked differences between the equiva- lent staple and classeras staple. At State College, N. Mex., the equivalent staple was about one-sixteenth of an inch less than the classeras staple. In the rain belt, it was equal to or greater than the classeras staple at all but five locations. Particular attention is called to the low equivalent staple at Baton Kouge, La., and Poplar- ville. Miss. ; the 2-years' results at Poplarville gave a staple one-eighth of an inch less than the classeras staple, the greatest contrast between equivalent and classeras staple. This presumably is the result of biological deterioration in the field.
INTERPRETATION OF RESULTS AND DISCUSSION
CLASSER'S STAPLE
As pointed out by Bonner and others,^ ''It seems clear that the long-accepted standard of grade and staple length as the measures of quality needs to be supplemented by information on variety.'' (P. 19.)
Table 2 shows that, with two exceptions (Delfos 4 and Stoneville 2B), a longer staple was produced under irrigation than under natural rainfall. The average for the six varieties that extended across the two areas was stapled about one thirty-second of an inch longer for the irrigated region. Within the irrigated area, the cotton from Shafter, Calif., and State College, N. Mex., was rather consistently classed longer than from Sacaton for all 10 varieties. In general, the Southeast produced slightly longer staple than did the mid-South and Texas-Oklahoma regions.
Some of the stations in the are¡as of low annual rainfall showed a staple one-sixteenth of an inch shorter than many of the stations in the more humid mid-South and Southeast regions. Kain-grown staple, however, may not be definitely classified on a meteorological or geographical basis. Despite low annual rainfall, ample soil mois- ture—evidently subterranean—resulted in a good fiber length at ChilHcothe and Brazos bottoms in the vicinity of College Station, Tex. At Chillicothe the optimum conditions that favor fiber elonga-
* TEXAS AGRICULTURAL EXPERIMENT STATION, GEARING TEXAS COTTON TO WAR NEEDS. Tex. Agr. Expt. Sta. Bui. 624, 24 pp., illus. 1942.

FIBER AND SPINNING PROPERTIES OF COTTON 11
tion evidently persisted through secondary thickening and resulted in rather poor strength. The high equivalent staple for Brazos bot- toms indicates that excellent initial soil moisture may have become somewhat lower as the season progressed, resulting in good environ- mentally induced length and strength. Even in the more humid mid-South, the influence of a good ground-water supply is evident at Marianna delta (Ark.), at Stoneville (Miss.), and elsewhere.
EQUIVALENT STAPLE AND EQUIVALENT STAPLE MINUS CLASSER'S STAPLE
As suggested in a preceding paragraph, the relation of equivalent staple to classeras staple gives an index of fiber strength, or rather of skein strength that is derived from fiber properties other than fiber length. A spinner who is particularly interested in yarn strength, especially one who may not be very familiar with recently developed rapid devices for determining fiber strength, may prefer to think of yarn strength in terms of staple length of average strength that would be required to give the desired yarn strength. It is, moreover, a con- venient way of measuring spinning performance to estimate whether a variety or a locality is producing a cotton that will spin into a yarn that is stronger or weaker than the average for a given staple length. Since the buyer is required to pay a premium for extra staple, it also may be considered as one type of index as to whether a buyer is getting more or less than he pays for, or, conversely, whether the grower is receiving more or less than he is really entitled to. The equivalent staple in general reverses the trend noted for classeras staple; equiva- lent staple for rain-grown cotton equals or exceeds the average for the longer irrigated lengths (see table 2).
Shafter, Calif., produces a high equivalent staple that is about equal to the classer's staple. Sacaton appears to give a somewhat shorter equivalent staple that is about equal to classer's length for the ma- jority of the varieties. State College, N. Mex., while producing a good classer's staple, shows a sharp drop for equivalent staple. This is partly attributable to a poorer fiber structure, as indicated by the comparatively large X-ray angles and the somewhat lower fiber- strength measurements. The equivalent staple, however, appears to be lower than would be expected on the basis of anticipated poor structure. At high altitudes (for example, at Lubbock, Tex.) or near the northern border of cotton production (as Knoxville, Tenn., and Statesville, N. C), poor structure frequently results.
Is it possible that there is some biological deterioration as a result of heavy dews, possibly aggravated by maintaining a high late- season soil moisture at State College? In the rain regions, the equivalent staple is slightly higher for the Southeast, as also was the classer's staple. The average mid-South equivalent values were lowered by the poor results from three locations until they equaled the shorter Texas-Oklahoma averages and were slightly inferior to the Southeast. The equivalent staples for Baton Rouge and St. Joseph, La., and particularly Poplarville, Miss., were as low as the values for the poorest irrigated location. State College, N. Mex., or lower. The comparatively low values for equivalent staple that are general along the Gulf coast area apparently result from biological decay in the field and seem to account for the failure of the average equivalent staple in the cotton rain belt to exceed that of the classer's staple.
12 TECHNICAL BULLETIN 9 31, U. S. DEPT. OF AGRICULTURE
From the results shown in these studies the buyer gets more extra value from the Texas-Oklahoma and upper delta region, where skein- strength performance is medium or better and where the staple may be average or below. This may account for the preference buyers are said to exhibit for the so-called ''hard cottons'' that are reputed to characterize these regions. It should be pointed out, however, that several locations in tjie Southeast also show an approximately equal superiority of equivalent staple over classeras staple. One noteworthy feature of these data is several instances of failure for the usual tendency for environmentally induced fiber length and strength to be compensatory. Frequently, when better-than-average length occurs within a variety, it is offset by reduced fiber strength, so that the per- formance or equivalent staple is low. As shown in these studies, this does not invariably occur.
The most significant fact revealed by these studies, however, is that hereditary (varietal) factors overshadow environmental factors in the equivalent staple as related to classeras staple. Varieties with unusually strong fibers, as Acala 1517, perform much better than varieties of average strength at all locations, and weak-fiber varieties, as Delfos 4, give relatively poor performance. Poor environmental * conditions make a weak variety give poorer performance, but they rarely prevent a strong variety from performing better than an average cotton; whereas good environmental conditions greatly increase the gap between equivalent staple and classeras staple for strong varieties, but rarely result in weak varieties performing appre- ciably better than expected on the basis of the classeras staple.
Although varieties grown under irrigation appear to average about one thirty-second of an inch longer than the mean for the cotton rain belt^ the added length is not reflected in spinning performance. The latter, in fact, reaches its maximum at certain of the rain-belt stations. These data confirm previous studies in showing that environmentally induced length is an unreliable basis for evaluating cottons if fiber strength is ignored.
Despite the fact that a considerable number of tests are represented in these data for the irrigated region, they may not accurately repre- sent the commercial plantings of the area. The infiuence of irriga- tion practice upon spinning performance is now being tested and needs extending. Cooperative studies in Arizona indicate the im- portance of abundant soil moisture, a deep water table at planting time and during vegetative development of the plant, and a gradual lowering of soil moisture during the late fruiting season as a desirable agronomic practice. The data presented here suggest that maximum fiber quahty in the rain belt is obtained under somewhat similar con- ditions and that irrigation practices in relation to fiber properties merit careful study.
YARN-APPEARANCE GRADE
Data on yarn-appearance grade would seem to confirm previous studies in indicating that higher grade, i. e., smoother yarn, is more likely for rain-grown cotton. A distinct tendency is apparent JFor some varieties, as Delfos 4 and Acala N28 and Acala Q6, to give low yarn-appearance grades. Incidentally these three varieties are char- acterized by longer than average staple. They are no longer, how-

FIBER AND SPINNING PROPERTIES OF COTTON 13
ever, than Acala 1517, which in these tests gave as good average yarn grade as the shorter staple varieties. These data indicate a slight positive relationship within variety between good yarn appearance and long equivalent staple.
NEPS IN CARD WEB
The data on neps in card web were not sufficiently complete in these studies to warrant definite conclusions. There was a strong indication that neps were less frequent in rain-grown cotton. Sacaton was especially high in the number of neps. At Shafter and State College the Acalas appeared to be more neppy than were the six varieties of the rain-grown type. As the number of neps in the card web increased, yarn grade apparently was lower.
PICKER AND CARD WASTE
Total waste reported in these studies shows no appreciable differ- ence for irrigated and rainfall growths. One complication arises, however, in making this comparison: Classeras grade has been shown to influence waste ^ and it has also been shown that classeras grade is higher for irrigated cotton.^ The writers wish to suggest that these tendencies might then tend to counteract each other. In fact, the data here summarized show a marked inverse relationship, within variety, between the yarn-appearance grade as here coded and the percentage of waste. Incidentally, there is an indication of an inverse relationship, within variety, between percentage of waste and equivalent staple.
Thus, measures of spinning properties—equivalent staple, yarn appearance, and waste—are interrelated, and a favorable combination of the desired fiber properties to give a smooth strong yarn with little manufacturing waste appears more likely to result in certain localities of the rain belt where growers may get by with varieties that would be unacceptable in other regions. It is equally evident, however, that the development of varieties with superior fiber qualities adapted to the irrigated region can produce cottons that should sell for more than the classeras grade and staple would indicate.
COTTON FIBER AND SPINNING TESTS OF THE 1943 CROP
This report summarizes the cooperative fiber and spinning test results that have been reported previously by areas for the 1943 crop.^
^ COOK, J. M., and WILLIS, A. Y., JR. EFFECT OF CARD SPEEDS AND PRODUC-
TION RATES ON THE QUALITY OF YARN MANUFACTURED FROM VARIOUS GRADES OF COTTON. I). S. Food Distrib. Admin, in coop, with Clemson Agr. Col. 16 pp., illus. 1943. [Processed.]
^ See footnote 3, p. 5. 8 The agencies that cooperated in these studies, suggestions for interpretation
of test results, together with detailed data were given in processed reports pre- pared in the Research and Testing Division, Cotton and Fiber Branch, Office of Distribution, War Food Administration, RESULTS OF FIBER AND SPINNING TESTS OF SOME COTTONS GROWN IN THE MIDSOUTH AREA, CROP OF 1943. 9 pp. 1944. [Processed.]; RESULTS OF FIBER AND SPINNING TESTS OF SOME COTTONS GROWN IN TEXAS AND OKLAHOMA, CROP OF 1943. 9 pp. 1944. [PrOCeSSed.]; RESULTS OF FIBER AND SPINNING TESTS OF SOME COTTONS GROWN IN THE SOUTH-

14 TECHNICAL BULLETIN 931, U. S. DEPT. OF AGRICULTURE
In addition, the fiber-spinning relationships of the 1943 crop were tested as to appHcabihty to the 1944 crop. Those connected with the cooperative Federal-State cotton breeding and improvement programs are interested in the comparative contribution of varieties and of locations to observed spinning properties and in the consistency of behavior for valuable fiber properties.
Since few of the 34 varieties that had at least two stations in common were grown at many of the 22 locations, an average of the ^■within variety'' or ^Vithin station'' effects appeared to be the most valid estimate of locational and varietal effects. It should be empha- sized that this is a rough approximation and is of value for indicating trends, rather than for establishing definitive relations for varieties listed or for localities where such varieties were grown. It is also important to realize that the objective of these fiber and spinning studies was to determine comparative performance of the leading varieties or of new strains under different seasonal, soil, and climatic conditions. Consequently, the specific designation of a location does not indicate that the conditions under which these spinning samples were grown are characteristic of the locality or region in which the plantings were made.
SKEIN STRENGTH IN RELATION TO FIBER LENGTH AND STRENGTH
Since fiber length and fiber strength are the most obvious contribu- tors to skein strength, varietal and locational deviations for skein strength, fiber length, and fiber strength are presented in tables 4, 5, 6, and 7.
Table 4 shows how locational effects for skein strength of weighted 22s are estimated as deviations from the unadjusted varietal means. Thus for Shafter, Calif., the mean of deviations for the six varieties that were grown there is — 1 pound. Since the mean skein strength for weighted 22s for all 34 varieties gives an average of 96 pounds, these data are interpreted as indicating that the adjusted mean for Shafter should be 96 minus 1, or 95 pounds, to free Shafter from differential varietal effects or to permit approximate environmental or locational comparisons. The work sheet with the values for weighted 22s for each variety and location is not shown here, but it may be reconstructed from table 4 by adding to or subtracting from the observed varietal mean the deviations recorded for each station where the variety was grown. For example, the value for weighted 22s for Acala 1517 at Shafter is 119 minus 3, or 116.
EAST, CROP OF 1943. 9 pp. 1944. [Processed.]; RESULTS OF FIBER AND SPINNING TESTS OF SOME COTTONS GROWN IN ARIZONA, CALIFORNIA, AND NEW MEXICO, CROP OF 1943. U. S. War Food Admin. 10 pp. 1944. [Processed.]
The only detailed data that are not available in these reports are the Areal- ometer measurements obtained through the cooperation of K. L. Hertel and D. M. Simpson at the Tennessee Agricultural Experiment Station. Measure- ments of the surface area or "Arealometer measurements,'* were made on the experimental model described by SULLIVAN, R. R., and HERTEL, K. L. SURFACE PER GRAM OF COTTON FIBRES AS A MEASURE OF FIBRE FINENESS. Textile ReS. 11: 30-38, illus. 1940.
FIBER AND SPINNING PROPERTIES OF COTTON 15
Weighted 22s—the average strength for yarns of the two coarser counts (22s and 36s)—were used to obtain a better sampUng of spin- ning performance than might have been obtained from the 22s only. The values for weighted 22s were obtained by adding the reported values for 22s to the converted values for 36s and dividing by 2. The regression formula for obtaining equivalent staple, given in the processed report,^ was used for constructing regression lines for 22s and 36s. From these the corresponding values of 36s and 22s were obtained.
The general effect of weighting the 22s with the higher counts was to lower the average skein strength of all varieties by about 2 percent. Some varieties were lowered more than others. There appeared to be a tendency for the converted values from 36s to be the same as actual 22s, or about 1 percent lower for the varieties having a low weight- per-unit length, whereas the converted values from 36s for varieties with greater-than-average weight per inch were usually lowered by 2 percent or more. The relation of fineness to skein strength, especially in the higher counts, is discussed more fully on page 32.
The figures in table 5 were obtained in such a way as to insure that they would not reflect the effect on varieties of environmental or locational effects on skein strength of weighted 22s. Thus varietal responses at Shaft er are estimated as deviations from the adjusted station mean (95). An average of the deviations within the 22 stations, where more than 1 variety occurs, gives the mean varietal deviations recorded under ^^Varietal means.'' Since the breeder may be especially interested in the consistency of varietal behavior at different locations, the detailed divergences shown in this table for varietal effects are based on the deviations from the adjusted instead of the unadjusted station means.
Table 6 shows detailed varietal deviations for fiber length of the upper half mean at each location. It corresponds to table 5 in that it represents detailed varietal deviations from adjusted station means. The detailed deviations from varietal means as a basis for estimating locational effects, as derived from table 4, are not shown; however, table 6 shows the adjusted means for stations at the foot of each column.
Table 7, though similar to table 6, deals with fiber strength reported as estimated fiber tensile strength. This estimate is derived from the Pressley index, ^^ devised by E. H. Pressley for rapidly and accurately determining the relative strength of cotton fibers. This index is converted to the .more familiar tensile strength by the regres- sion formula:" Estimated tensile strength=(10.8116XPressley index) -0.12.
« See footnote 4, p. 9. 10 PRESSLEY, E. H. A COTTON FIBER STRENGTH TESTER. Amer. Soc. for Testing
Materials Bui. 118: 13-17, illus. 1942. " See pp. 5 and 6 of reference given in footnote 4, p. 9.

16 TECHNICAL BULLETIN 931, U. S. DEPT. OF AGRICULTURE
^ ^
I
<
snoiSoj qi^oq S s 1 >| S^g Sc g| S||S § S s §
i ta
'S
1 .a
1
1 OQ
•O'N'eilîASomS 1^ T Ci
+ + o
•nnex 'aniAxon^ :3 1 Tfi
1 + o CO
1 o o
•0 'S *8on8JOi¿ ;§ i 'T 1 IN
1 CO
1
•BO 'no^JÎX ■o COkO
1 1 00
1 05
1
'BO '^^uQtnijadxa 3 + + + ° + T
•B[v 'njnqnv 3 o o T+T i
1 05 to
'oâaipo 8;B;S + CO T-HCM ^r-<
+ 1 1 + + +Tt
•BT: *qd8S0f 'ïg (N
1 ¥+°
•ssiH 'aiiTA9no;s (NO t>. rH(N lOrti
+ ++ ++ ?ï+ a> +
•nnax *nos:5iOBf + 1 CO
1 1+ ;
'i[iy 'BnuBUBjv: o ^ + <N + «ooo t>.eo»o CO
++ +++ + o
1 CO
O
9
1
•X8X 'airiAueaio ;§ + 1 1 +1 1 1 »o
1
"xejL 'aidraaj, s CO
1 OS
1 T (sino:^:^oq) 'XQJ,
'^OI:^B;s 9281100 CO
1 (N OiCO
+ 1
(pnBidn) -xdj, 'UOT;B:^S 8S0IIOO 3 +
<N 1
*«nO *BqsB2iOiqo + + CO
1 + + CO
+
•X8X 'aq^ooTinqo O ¥ +
•X8X *3iOoqqnT: CO
1
0) tí
CO 1 OS
•X8J, 'O0BIS8AV (M
+ ? o
•X8IV -N '8281100 nms
. o iO o !>. gf11 1 , OP 1
Oi 1
•ZTJV 'UO^BOBg . O CO (M 00
■O I—1 1 i-t 1 1 CO
1 1
•JUBO *Jaw«qS • cc 00 w t^
5 1 ++ 1 ; 1 1
1 1 s 1
as
<
à
Co
1
a
< II 1 1 Ü
u
Ü
8 œ
..Ü as CO
R Is O S
1- < (M
< II to
ff a
1 f 1
Q
V
œ
C
i 1
'S O
'o. a i 1
1

FIBER AND SPINNING PROPERTIES OF COTTON 17 »-H CD o 0<N O »O COCO OCCO OSOOS W 05 O CXD 05 00 C» C»
rH W (N
+ + +
+ 1
+1
++
717599-
iOCO ++
+ 1
I I
^^%
CD (M
+ S
+ s
(M GO
(M 00 + ^
CD (N + S
o I 05
3 >'^
o'-2 g Pi CD
¿2
fe CO
11^
'öS
bc© *© W
^5

18 TECHNICAL BULLETIN 931, U. S. DEPT. OF AGRICULTURE
I püisufpv oggg g§ s- 11 s;s;^ gSB| ê;gS883;g§S
saOI:^BIA^a .lOOSCC COO (Ni-l THTíí ,-H ,-( (N OOOM rH lO <N 00 <N Tfi Tt*-*
;§!j!f^l 1 1+ ++ 4-+I 7 iql +++I 1 1 1 1
1 1 ä g a fl
u
i to
1
•0'N'9inAS9:^B;g R ;
, , CO
i i ' : " CO
+ il + i i i
•naex 'eniAxon^ ^ I I ^ (M
+ 111 (N 1 I ^^
i i i ' i i ' ICO 1 1
11 1 1
'0 'S *8on8JOtj ^ i ; ; i 1 I o 1 + III (Mill
ill +111
•^O 'nowîJL ^ I 7° 1 7 III CO 1 1 1
III 1 1 1 1
"B{) '(^ÜGÜIUGdxa ^'
1 CO
1 1 + III + i i il CO iCO
1 11
"BiY 'üjnqny ^ + III O 1 1 i<MC0»O 1
i i ; '!;''';
.2
1 'è
'eSatioo 9;B;S ^ 1 1
4- 1 + ++ ++ 1 1 , COiOi-l 1
! i : +++ i
•B^ 'qdosof -[^s ^ 1 1 1 ¡ n ++ 1 1 1 Th»í5(M 1
i ; ; +++ i
■ssiH '8iiiA8no:^g ^ 1 1 T-l (N
i ++ i + ¥¥ r ; i i î¥î i 1 ,<N
i i"^
•nuax 'nos2toBf ^ 1
1 (M
1 + o II (Nil
II 1 1 1 1 b-(M 1
1 1 1
•lijy *BunBij^j\[ « : 1 T-t
! 1 \ ^ coco t^ OOCO rH 1 1 1 ++ 1 i:¡i 1 1 1 1
1 ,CO
1 11
1 1 9
•X8X 'aiiiAnaajo i? + I Il 1 iqi + ¡ 1 : 1 I'*
i i '
•X9X *9iclra9x ;? i + 7 ! i + : ; ! (sino:^;oq) -XöX
'UOT^B^g 8S9I[00 3? 1 CV|
1 4- + i i ++ i i (puBidn) -xax
'nopB^g 9391100 ^ : 1 ; 1 1 lOO
i i '
•BRO 'BqsB2ioiqo ;g¥i + i O 7 : i ++ iT ;
CO 1 1 1 1 1
•X9X '9q:^ooTilTqo Sli O 11 1-1 1 lOO 1
II + 1 11 1
1
i o
1
•X9X 'iíooqqni: 3?| i i 7 i i i i
•X9X 'O0BIS9AV ^ 1 1 iC 1 1 ¥ M +; M1
9S9nOO 9!JB;g 45T =? 1 o 1 i í i i Î
•zuy 'uo:^BOtig ^f?î t i + i i +1111
•JIIBO 'J9W«qg S??' 7 1 1 11 C^í 1 1 1 1
; 1 1 1 1 1 1
1 1 1 1 >
«¡•got
0 1
fi
1^ il
Row
den4
1B
B
4 (A
rkan
sas)
S
tone
vill
e ty
pe:
Sto
nevi
lle
2B
st
onev
ille
2B (
8275
)
Sto
nevi
lle
20
St
onev
iUe
62-1
-10
W
hite
Gol
d
$ wpqw
s o

FIBER AND SPINNING PROPERTIES OF COTTON 19
g^S 5S8S§gSgSsg8 1 COO-* i-no Til CO <N CO a> 00 1
i i i ^
1 1''' : M 1 1 1 g
CO 1
1 I CO liOO 1 .
1 1 1 : ; i i ; ^ o 1
1 M+ ; 1 III ^
àOO}li5 1 1 lr-( 1
" ' i i i^ I i i i ^ .
'7 i íT ^ 1 t^ 1 1 1 1
! ï- i i i i 1 1 1 lO 1 1 1 05
i M+ i i ; I i §
; ^ ; ; ; : i + ! ! i '
i i i i
i i i ^
i i i s H : i ^
1 ; I . 1 1 1 1-^
i i i i i"^' :3 ; ; ^
1 ; I
i i i ^
i i i i íT 1 ; i §
I ! 1 ¡2 ¡ i 1 i i^ii i
=>C« 1 Oi
T ' i 1 1 , iO> I
1 ' ; • 1 i 1 1 I ^ 05 1 »2
Ï' i " 1 ICOCO 1 1
i i ' + i i i i i 1
; i i ^ : ; : S
! I : S
Id: Hi OCOO W
anna
mak
er's s
and
C 4
M
isce
llan
eous
: B
obde
l (B
obsh
aw 1
6)
C
oker
200
-4
C
oker
4in
l-5
H
ibre
d
Lon
esta
r an
d L
anka
rt
M
eban
e 14
0 an
d 14
1
O
klah
oma
Tri
umph
112
8
Sta
tion
21-
24
:
e3 Mg
.2 oj^o

20 TECHNICAL BULLETIN 9 31, U. S. DEPT. OF AGRICULTURE
t pa^snfpv 1.05
1.
06
1.00
.97
.96
.94
.95
1.00
§ ^^^ ^oíß^ ^^sßßßßß^
SUOIÍ^^IAaQ .SSS s §S S8 §S §8§ gs§§§g§
^$-f+ +^ r r ++ ++® r r r <=++ r+ r r+
1 Tí
1 O tí .a i
<5
tí .2
1 .G tí O
•0 "N 'eiliAsa^B^g ^ I 1 §
! i o 1 ! 4-
i ° \
lO
r ! ! S ! ! : i i r i i i
•nnox '911TAX0U3; ^' \ i t 1+ i i g i is ■i I i i 1
lO 1 1
•0 "S '80tI9J0l^ 4 ! oo 1
1 ?+ 1 o 1
r i lO I i o 1 ! 1
II + i i i
•^O 'no:}jTX 4 I i 38 ; !o 1 + i i ^ i i i
i I' 1 i i
•^O ':}a8niii8dxa ^ ! ö
! 1
■ o
+ î r i i Í4 IB \S -\ i+
•BiY 'ujnqny .^'i ¡o ! i i ;ê
■i ° i i Í4 > § ¡
1
1
-SSTH 9391100 a:iB:)g ^" t í
SB §S 1 ssg ¡ Î +++ i
•^T: 'qdasof -^g ^ s 1 1 oo oo i ++ ++
•SSTH '9lIiA8no;g ^' 1 § ! i <= r i
3 §§ SS i +++ i i i+
•nnaj, 'nos^io^f ^' ; +
o r 1 o 1 1 ! r r i
'my 'BnuBiJ^K 4 1 o
1 o : 1 +
i-l »o »o Olli o oo Olli
i i-r
.1 ce
i 3 o
'xax *9lliAU8ajo .§
^o o !
r 1* f r r r | i j i 'ß i í+
•xox 'eidraoj, 4 o f i ^ i i i i f ! i i
(srao^:^oq) -xa^ *noT;«;g 8S8IIOO
o
43 i + o 1 S§ i ! i ++ i i
(puBidn) -xax 'noi:^B:^g 9Saiioo •§' ; o
1 í 1 '' •BHO 'BqSB3[0Tqo
.S : 4o 1
O 1
+ i s
+ ! o o 1 o i + r i r r i i
•xox *9q;ooiiiiqo 41 o +
1 § ! ;§ i r i i I'
•X9X '^lOoqqnT: .8 :
I o I I !
•I
.si
1
•X8X *00t5lS8AV .§
1 iC
1 iC
<l 1
h !
§ 1 + i ° i i i i
i + i i i
'aSenoo 9;^^S
• i-lr-lO 1 s 1 : i + i i
1 (N 1 1 1 1 1 o 1 1 1 1
i +1111
•ziJV *no:^BOBg OOO (M
. i—l I—1 O o
•5$++ + ; g ; ; i + i
1 § i í ! : i +1111
•jil^o *J9WBqg .sss s ! g ! !
i + i i ^ i i i ' i + i i i i
.1 T)
'S S fe >
il -<
1 03 ! ! acob
ü
'fe:
¡m Ü
o ¡
2 «Sin 5 ©.a 0 tí a
SB'S 5gfl
.il Q<1
III fil
is"
pq oœ CO
ston
evil
le 2
B (
8275
)
Sto
nevi
lle
2C
S
tone
vill
e 62
-1-1
0..
.
Whi
te G
old
! fe '^
tí OTt<

FIBER AND SPINNING PROPERTIES OP COTTON 21
§s 8 Sggîe^g gS
r++ +++r(\ r r OS
i i^ ! i 1+ i
§
o 1 r 1 + i++
^
r ; 1 ;s ! 1 ! i^ i i i ir
ce OS
^+^ ! ! ! ^q ¡ ¡ 1
I' i i i ^
® + i i i i^ i i i il
^
r + ! i »o OS
1 1 1 Tt<
i ! i+ ^
1 <N 1 1
i + i i fe
^
OS
i i r i g
i r r i OS
^
i ^ i i i r i i i ^
r i r r i ^ 3> liO »O r-l 1 rH O
f i f I' 1 OS
1 \ß s i i r r i ^
Il iTtKN 1 1 lOO
! 1 i++ i ^
i ^ 1 -^tl 1 OS
i ^
05 ]
11: OCQO
Wan
nam
aker
's S
and
C 4
. M
isce
llan
eous
: B
obde
l (B
obsh
aw 1
6)-
..
Cok
er 2
00-4
C
oker
4 i
n 1-
5
Hib
red
L
ones
tar
and
Lan
kart
—
Meb
ane
140
and
141
O
klah
oma
T
rium
ph
1128
-
1 t
2 o
0 œ
n ̂ S
Art Ö
a^ a m 1 ^> "t^i a"c ^ No «.s Tl ^ 4^ crt
;:i a ÍÍ- S fi-HB
t

22 TECHNICAL BULLETIN 931, U. S. DEPT. OF AGRICULTURE
z pBlsnlpY
snoi:jBiA8(i "<t<>í50O es »H »CCS r-tCí -^-^ I II II II •^.Ä+H- ++4-
»H FH o es Tt< o •^ C^ ++ +1 +1
'0 'N '8IIIAS8:JB:^S
•nnox '9liiAxon-g[
'O -g 'aonaioij
•BO noyix
•e£) *;jn9uiiJ9dxa
•«ly 'njnqnv
I I
4-
CS I 11-«
I ; I
•SSTJ\[ '9291100 9;«:^s 5^
cs cocs I I I
•B1 'q(l9S0j[ •'\Q eocs
I t occes ++
•SSIJ^ '9niA9U0;g cs esco
I +1
•ua9x 'nos5[0Bf
•2ÍJY ''BnaBUBj\[
•X9JL '9nTAU99J£) ^-S +
•X9X *9l(iin9X
(srao;:^oq) -xgj, 'noT:}Bi}g 9291100 ^-"^"^
(pn^ldn) •X9X §, 'noi!j^:;g 9291100 j X-
•ei^lO '^qs^^ioiqo
■X9X 9q^ooniiqo
•X9X 'iiooqqriT: =i-í2 +
co»oo
+ i-f- :+
+
•X9X ' 00^189AV
•X9K 'N '9291100 ^%^%S ^.Ä++ '
*zuy 'uo:;BOBg s oso r-
•^lOT-t 1-t
•jTi^o 'J^w^qs l;5++ I
ill t>» -. — 53 Q.Ü5 ri c ' ;r"tTi^»^»^ O ! ST'-"-^ o 21-3" 59 r^^c^cs
<î O Q Ö ft « oQ
is iJ

FIBER AND SPINNING PROPEETIES OF COTTON 23
^- S^Í^SSooSSS
1 1 1 Tí< Tí< ■* r-t ÇO o eo CO
+111+ 1+
+ä
: ! : ¡o ¡ ¡ ¡ ¡ ¡ ^ =fS
^1 IT : M • ; ; i ; i fi2
CO 1 1
1 I : i ;t i i i ;+ +S
't' 1 1 i<N • I 1 '
! : i ' i i i i 7S
^00 > 1 1 ;
1 1 1 1 • i i>0
1 ;:■,:; :+ fS
iii +iiiii;i Î-
i i i i jî i i i i i «rs
■+;;;: Mi TS ÎJ138
ÍfSS
, , , 1 1 1 1 1 rti 1 1
: Î I i i i i 1+ i i ■pö
- , , , 1 . 1 loooo 1 1
; ! : ; i 1 i+1 i i '¡s
+^ , , 1 ikO 1 1 1
! ; : 1+ ! I 1
: i i i i i ' i+' i 1 1 irt« iCXí^O 1 ;;s 1 1 1 1 i-TÍ<<N ' ts
, 1 1 IOTíí I I I I I
: i i i' 'i : i i i 7g
3S 1
+ä TR
Il i
■e«9

24 TECHNICAL BULLETIN 931, U. S. DEPT. OF AGRICULTURE
Table 8 summarizes, in columns 2 and 3, the percentage of devia- tions for varieties and locations shown in tables 6 and 7, respectively. Column 4 summarizes the percentage of deviations obtained, as in tables 6 and 7, for equivalent staple minus the upper half mean. The equivalent staple was taken from the spinning reports and converted to equivalent decimal fractions. Since the estimate for equivalent staple IS based on average fiber strength, the equivalent staple minus the upper half mean should give that part of skein strength that may be attributable to abnormal fiber strength or to fiber properties other than length that contribute to skem strength. The close agreement for the percentage of deviations, shown in columns 3 and 4, is interpreted as indicating that skein strength of coarse counts that is not attribu- table to length IS largely accounted for by ± deviations from average fiber strength. The results presented in columns 5 (length deviations + strength deviations) and 6 (deviations for skein strength) further substantiate the assumption that these effects are cumulative.
TABLE S.-—Relation of varietal and environmental effects on fiber length and strength and on skein strength VARIETAL EFFECTS
Varietal types and strains and locations
(1)
Acala type: Acalal517 Acala 1517 W29-1 Acala P18--
Coker 100 type; Coker 100-6 Coker 100-7
Coker 100 Wilt type: Coker 100 Wilt 2 Coker 100 Wilt 3
Delfos type: Belfos 531C Delfos 651
Deltapine type: Deltapine 14 Deltapine 14 (833) A12 (Arkansas)
Rowden type: Rowden 41A . Rowden 41B B4 (Arkansas)
Stoneville type: Stoneville2B Stoneville 2B (8275) Stoneville 2C Stoneville 62-1-10 White Gold Empire Bobshaw l._- E4 (Arkansas)
Stonewilt type: Stonewilt 2 Stonewilt 3 Wannamaker's S and C 4_.
Deviations
(2)
Pet. +9 +10 +4
+1 0
-2 -1
■+4 +3
+3 +1 0
-5 -2
0 +2 +4 -6 +2 -2 -2 +2
-1 +2 +4
05^
(3)
Pet. +17 +18 -10
-2 -1
-6 -2
-1 -2
-4 -5 -1
+5 +5 +4
+1 +1 0
+2 -5 0
+5 -2
-5 -11 -5
(4)
Pet. +17 +22
-5 0
+1 +2
0 +5
-2 0
-2
-7 -6 +9
+2 +4 0
-2 -2 -6
-2 -8 -6
® +
(5)
Pet. +26 +28 -6
-1 -1
+3 +1
-1 -4 -1
+2 0
+2
+1 +3 +4 -4 -3 -2 +3 0
-1
(6)
Pet. +25 +32 -3
-2 +2
-1 +2
+5 +5
0 +2 -2
+10
+2 +6 +3 -10
0 -3 -4 -3
-3 -9 -2
Skein strength predicted from—
(7)
Lb. 105 106 100
97
99 97 96
93 91 94
96 98
100 90 98 94 94
95
> o
(8)
See footnotes at end of table.
Lb. +17 +18 -10
-2 -1
-1 -2
-4 -5 -1
+5 +5 +4
+1 +1
0 +2 -5
0 +5 -2
-5 -11 -5
(9)
Lb. 122 124 90
95 95
97 99 100 92 93 94 99 96
90 87 95
IS
(10)
Lb. 121 125 93
96
94 97
100 100
97 97 94
97 101
94 92 92 92
86 92

FIBER AND SPINNING PBOPERTIES OF COTTON 25
TABLE 8.—Relation of varietal and environmental effects on fiber length and strength and on skein strength—Continued VAKIETAL EFFECTS- ■Continued
Deviations Skein strength predicted from—
u 03 Ä ¿-" 43 % Varietal types and strains and locations
Si-a ii w
m Si rC3 if
■^1
be«
«'S
la 1 Xi "^ ¿+ s Z ¿ +
X2 D fXH w PM o ^ -tí P^ o
(1) (2) (3) (4) (5) (6) (7) (8) (9) (10)
Miscellaneous: Pet. Pet. Pet. Pet. Peí. Lb. X6. Lb. ZÖ. Bobdel (Bobshaw 16) . _ . +8 +5 +17 +13 +21 104 +5 109 117 Coker 200-4 +2 -5 -7 -3 -4 98 -5 93 91 Coker4inl-5 +3 -5 -i-l -2 +5 99 -5 94 100 Hibred . -21
-2 -1 +7
+9 +4
-22 +5
-14 +2
76 94
-1 +7
75 101
83 Lonestar and Lankart 98 Mebane 140 and 141 -10 0 -6 -10 -16 86 0 86 83 Oklahoma Triumph 1128 . -6 -4 -4 -10 -10 90 -4 86 87 Station 21-24 -4 +4 -5 0 -9 92 +4 96 88
ENVIRONMENTAL EFFECTS
Irrigated area: Shafter, Calif Sacaton, Ariz State College, N. Mex Weslaco, Tex
Texas-Oklahoma area: Lubbock, Tex Chillicothe, Tex Chickasha, Okla College Station, Tex. (upland).. College Station, Tex. (bottoms) Temple, Tex Greenville, Tex
Mid-South area: Marianna, Ark Jackson, Tenn Stoneville, Miss St. Joseph, La State College, Miss
Southeast area: Auburn, Ala Experiment, Qa. Tifton, Ga Florence, S. C Knoxville, Tenn — Statesville, N. C
+4 -5 -6 -1 -2 100 -5 95 -2 +1 -6 -1 -8 94 +1 95 +4 -14 -15 -10 -9 100 -14 86 +6 -1 0 +5 +6 102 -1 101
+2 -1 -2 +1 -1 98 -1 97 +1 +4 -2 +5 +2 97 +4 101 -3 +7 +5 +4 +3 93 +7 100 -1 -1 +1 -2 0 95 -1 94 +2 +1 -1 +3 +2 98 +1 99 +1 -4 -3 -3 -2 97 -4 93 -3 +7 +1 +4 -2 93 +7 100
-3 +2 +9 -1 +5 93 +2 95 -7 +9 +6 +2 -2 89 +8 97 +1 -1 +6 0 +7 97 -1 96 +3 -2 +1 +1 +4 99 -2 97 -1 +5 +1 +4 0 95 +5 100
+2 -4 -2 -2 +1 98 -4 94 0 -4 0 -4 0 96 -4 92
-3 +1 -2 -2 -5 93 +1 94 -1 -7 -5 -8 -5 95 -7 88 +6 -4 -6 +2 0 102 -4 98 -2 +1 +2 -1 0 94 +1 95
102
96 99 100 96 99 94 94
102 96 103 99
97 97 92 92 96
1 Means for environmental or varietal deviations as given in table 6 were converted to percent of 0.96 inch, the average upper half mean length for all varieties and locations.
2 Means for environmental or varietal deviations as given in table 7 were converted to percent of 81,000 pounds, the average estimated tensile strength for all varieties and locations.
3 Deviations for equivalent staple length minus the upper half mean length were obtained by subtracting the upper half mean length from the equivalent staple, tabulating the zhdifEerences, and estimating devia- tions for environmental or varietal effects in the manner shown in tables 4 and 5.
* Means for environmental or varietal deviations as given in column 2 plus those given in column 3. 6 Means for environmental or varietal deviations for weighted 22s as given in tables 4 and 5 were converted
to percent of 96 pounds, the average skein strength for all varieties and locations. « On the basis of these data skein strength imputed to fiber length would be: 0.96 inch for average upper
half mean über length=96 pounds for average skein strength for weighted 22s or increments of 0.01 inch for fiber length=increments of 1 pound for skein strength; or upper half mean lengthX100=expected skein strength if the fiber is of average strength.
7 On the basis of these data: 81,000 pounds for average estimated tensile strength=96 pounds for average skein strength for weighted 22s or increments of 1,000 pounds for fiber tensile strength=increments of 1.185 pounds for skein strength.
8 The values in column 7 plus those in column 8. * As shown in table 5.
26 TECHlSriCAL BULLETIN 931, U. S. DEPT. OF AGRICULTURE
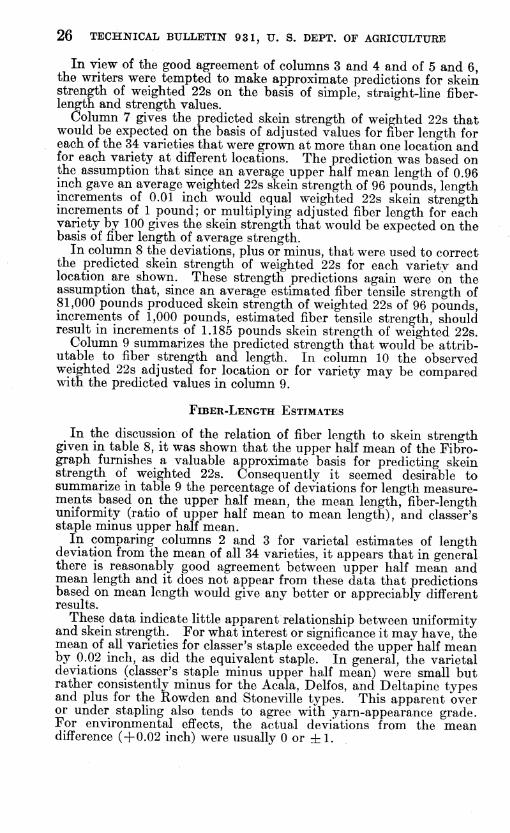
In view of the good agreement of columns 3 and 4 and of 5 and 6, the writers were tempted to make approximate predictions for skein strength of weighted 22s on the basis of simple, straight-line fiber- length and strength values.
Column 7 gives the predicted skein strength of weighted 22s that would be expected on the basis of adjusted values for fiber length for each of the 34 varieties that were grown at more than one location and for each variety at différent locations. The prediction was based on the assumption that since an average upper half mean length of 0.96 inch gave an average weighted 22s skein strength of 96 pounds, length increments of 0.01 inch would equal weighted 22s skein strength increments of 1 pound; or multiplying adjusted fiber length for each variety by 100 gives the skein strength that would be expected on the basis of fiber length of average strength.
In column 8 the deviations, plus or minus, that were used to correct the predicted skein strength of weighted 22s for each varietv and location are shown. These strength predictions again were on the assumption that, since an average estimated fiber tensile strength of 81,000 pounds produced skein strength of weighted 22s of 96 pounds, increments of 1,000 pounds, estimated fiber tensile strength, should result in increments of 1.185 pounds skein strength of weighted 22s.
Column 9 summarizes the predicted strength that would be attrib- utable to fiber strength and length. In column 10 the observed weighted 22s adjusted for location or for variety may be compared with the predicted values in column 9.
FIBER-LENGTH ESTIMATES
In the discussion of the relation of fiber length to skein strength given in table 8, it was shown that the upper half mean of the Fibro- graph furnishes a valuable approximate basis for predicting skein strength of weighted 22s. Consequently it seemed desirable to summarize in table 9 the percentage of deviations for length measure- ments based on the upper half mean, the mean length, fiber-length uniformity (ratio of upper half mean to mean length), and classeras staple minus upper half mean.
In comparing columns 2 and 3 for varietal estimates of length deviation from the mean of all 34 varieties, it appears that in general there is reasonably good agreement between upper half mean and mean length and it does not appear from these data that predictions based on mean length would give any better or appreciably different results.
These data indicate little apparent relationship between uniformity and skein strength. For what interest or significance it may have, the mean of all varieties for classer's staple exceeded the upper half mean by 0.02 inch, as did the equivalent staple. In general, the varietal deviations (classer's staple minus upper half mean) were small but rather consistently minus for the Acala, Delfos, and Deltapine types and plus for the Rowden and Stoneville types. This apparent over or under stapling also tends to agree with yarn-appearance grade. For environmental efl'ects, the actual deviations from the mean difference (+0.02 inch) were usually 0 or ±1.

FIBER AND SPINNING PROPERTIES OF COTTON 27 TABLE 9.—Summary of fiber measurements {lengthy strength, and fineness) picker
and card waste, neps in card web, and yarn-appearance grade, shown as the per- centage of deviation from the means of all varieties and locations
VARIETAL EFFECTS
Varietal types and strains and location
(1)
Fiber length meas- urements
a&.
(2) (3) (4)
is
c3 ÇX.
(5)
Fiber-strength indexes
(6)
-I-; tí
(7)
'3 Q
(8)
Fiber fineness and cell-wall development
(9) (10) (11)
Waste, neps, and yarn ap-
pearance
(12) (13)
05 <D
OS t*
(14)
Pd. -19 -9 -7
-24 -9
+5 +3
-20 -20
+1 0
-3
+8 +11 +16
+3 0
-12 +11 +8
0 +13 -h
+7 -3
0
-11 -12 -1
+23 -5
+11 +4
+19
Acala type: Acalal517 Acala 1517 W29-1 Acala P18
Coker 100 type: Coker 100-6 Coker 100-7
Coker 100 Wilt type: Coker 100 Wilt 2 Coker 100 Wilt 3
Delfos type: Delfos53lC Delfos 651
Deltapine type: Deltapine M.... Deltapine 14 (833) A12 (Arkansas)
Rowden type: Rowden 41A Rowden 41B.._ B4 (Arkansas)
Stone ville type: Stoneville 2B Stoneville2B (8275) Stoneville 2C .. Stoneville 62-1-10 White Gold Empire Bobshaw 1 E4 (Arkansas)
Stonewilt type: Stonewilt2 Stonewilt 3 Wannamaker's S and C 4
Miscellaneous: Bobdel (Bobshaw 16) Coker 200-4 Coker 4 in 1-5 Hibred Lonestar and Lankart Mebane 140 and 141 Oklahoma Triumph 1128. Station 21-24
Pd. +9 + 10 +4
+1 0
-2 -1
+4 +3
+3 +1 0
-3 -5 -2
0 +2 +4 -6 +2 -2 -2 +2
-1 +2 +4
+8 +2 +3 -21 -2 -10 -6 -4
Pet. +11 +17 +7
-3 -4
+1 0
-1 +1
+6 +1 0
-1 -1
0
-1 0
-1 -3 +4 -3 -1 -3
+1 0
+6
+4 +3 +7 -18 -1 -7 -4 0
Pd +1 +5 +3
-4 -4
+4 +1
-5 -1
+3 0 0
+1 +4 +3
Pet -2 -3 -2
+1 0
+1 +1
-2 +1
0 0
Pd. +12 +12 -22
-3 -3
-6 -3
Pd. +17 +18 -10
-2 -1
-6 -2
-1 -2
-4 -5 -1
+5 +5 +4
+1 +1 0
+2 -5 0
+5 -2
-5 -11 -5
+5 -5 -5 -1 +7 0
-4 +4
Pd. +17 +22
-5 0
+1 +2
0 +5
-2 0
-7 -6 +9
+2 +4 0
-3 -3 -2 -2 -6
+17 -7 +1 +9 +4 -6 -4 -5
Pd. +17 +22 +4
+11 +13
-4 0
+15 +11
0 +2 0
-20 -26 -4
+4 +11 +9 -9 +2 +2 -9 +4
0 +4 +4
+13 +2 +4 -28
0 -15 -6 -17
Pd +11 +5
0
+10 +12
-3 +4
+12 +9
-4 -2 +3
-18 -22 -4
+2 +8 +9 -7 0
+5 -7 +10
-2 +3 -3
+9 -2 +4 -14 +2 -13 +8 -18
Pd -4 0
+4
-7 -5
+1 -1
-4 -1
+3 +1 -3
+3 +5 +5
-3 -3 -5 +1 -3 -9 +3
Pd. +3 -11 -6
-6 +9
0 -3
+11 +6
-4 -3 -b
+11 +9 -11
-4 +3 +9 -2 -6 -3 0
+8
-2 -11 -14
+11 -4 -11 +17 -3 +8 +6 -3
Pd. +57 +100 +10
+52 +43
-14 0
+24 +76
-19 +10 -10
-52 -57 -38
-5 +10 +10 -34
0 +5 -29
0
-19 +10 -19
+67 -29 -5 -52 +10 -29 -14 -76
ENVIRONMENTAL EFFECTS
Irrigated area: Shafter, Calif Sacaton, Ariz State College, N. Mex. Weslaco, Tex
+4 +6 +1 -1 -3 -5 -6 -4 -5 +3 -2 -4 -3 +2 +6 +1 -6 -4 -2 +4 +4 +3 -1 -1 -12 -14 --15 0 +2 -3 +6 +3 -4 + 1 -3 -1 0 +4 +6 -5
See footnotes at end of table.
-6 -19 +27 +43 -4 +5
-121 0
-5 -16 -^12 -4

28 TECHNICAL BULLETIN 931, U. S. DEPT. OF AGRICULTURE
TABLE 9.—Summary of fiber measurements {length, strength, and fineness), picker and card waste, neps in card weh, and yarn-appearance grade, shown as the per- centage of deviation from the means of all varieties and locations—Continued
ENVIRONMENTAL EFFECTS—Continued
Varietal types and strains and location
Fiber lengtli meas- urements
ft
Fiber-Strength indexes!
5,ft
Fiber fineness and cell-wall development
Waste, neps, and yam ap-
pearance
(1) (2) (3) (4) (5) (6) (7) (8) (9) (10) (11) (12) (13) (14)
Texas-Oklahoma area: Lubbock, Tex Chillicothe, Tex. Chickasha, Okla College Station, Tex. (upland) College Station, Tex. (bot-
toms) Temple, Tex Greenville, Tex
Mid-South area: Marianna, Ark Jackson, Tenn Stoneville, Miss St. Joseph, La State College, Miss
Southeast area: Auburn, Ala... Experiment, Ga Tifton, Ga Florence, S. C. Knoxville, Tenn . Statesville, N. C
Pd +2 4-1 -3 -1
+2 +1 -3
-3 -7 +1 +3 -1
+2 0
-3 -1 +6 -2
Pet. +3 +3 -3 -3
-+4 0
-3
-6 -7
0 0
+4 +3 -6 +8 +7 0
Pd. +1 +1
0 -1
+1 -1 0
-3 0
-1 -3 -1
+1 +3 -3 +4
0 +3
-1 0 0 0
-2 -1 +1
+1 -1 +2 +2 -1
-2 +1 +1 -1 -6 0
Pd. -6 -3 +9 0
-3 -6 +6
+3 +9 +3 0
+6
+3 -12 -6 -6
Pd. . -1 +4 +7 -1
+3 -4 +7
+2 +9 -1 -2 +5
-4 -4 +1 -7 -4 +1
Pd -2 -2 +5 +1
-1 -3 +1
+9 +6 +6 +1 +1
-2 0
-2 -5 -6 +2
Pd +4 -4 -2 +15
-2 +6 -4
+6 -11 +4 +2
0
-2 -2 +4 0
-2 -4
Pd. +5 -8 -3
-1-20
-3 -5 -2
+6 -12 +6 -3 -3
+1 +1 +5 +3 +2 +1
Pd. -1 +5 +3
+3 -1 +5
+5 -3 0 0
+1 +3
+1
Pd. -18 +2 +2 -2
0 -2 -2
+18 0
-6 +4 +9
-12 +12 -2 -3 -20
Pd. 0
-14 0
+33
+19 -14 -10
+14 -52 +10
0 -19
-5 -14 +24 +24 —5 -19
Pd. -4 0
+5 -3
-1 -1 +3
+1 +19 -4 +1 +5
0 +5 -7 -1 -3 +8
I Deviations as percentage of the mean value, 0.96 inch. ' Deviations as percentage of the mean value, 0.72 inch. 3 Deviations as percentage of the mean value, 75 percent. * Deviations as percentage of 0.98 inch —0.96 inch, the averages for classer's staple and upper half mean,
respectively. « Deviations as percentage of the mean value, 32.1°; to facilitate comparisons, deviations were mul-
tiplied by -1. « Deviations as percentage of the mean value, 81,000 pounds. 7 Deviations as percentage of 0.98 inch —0.96 inch, the averages for equivalent staple and upper half mean,
respectively. 8 Deviations as percentage of the mean value, 4.6 micrograms per inch. » Deviations as percentage of the mean value, 2.93 square centigrams per milligram of fiber. 10 Deviations as percentage of the mean value, 73 percent of thick-walled fibers. II Deviations as percentage of the mean value, 6.6 percent of total picker and card waste. 1» Deviations as percentage of the mean value, 21 neps per 100 square inches of card web. 1» Deviations as percentage of the mean value, 7.5; grades were assigned numerical values as follows:
A-\-^12, A = ll, A-=^10, B-\- = 9, B=S, B-=7, C+=6, C=5, C-=4, X>+=3, Z)=2, D- = l.

FIBER AND SPINNING PROPERTIES OF COTTON 29
FIBER-STRENGTH ESTIMATES
Previously published reports have indicated that the X-ray angle may be used as an index of inherent fiber strength. It has been observed that strength degradation by photochemical action or by biological deterioration causes little or no appreciable effect on the X-ray angles. Hence, the X-ray index for fiber strength is of little value in predicting skein strength where the fibers have been sub- jected to prolonged exposure, to weathering in the field, or to biological decay prior to or after harvest.
On the other hand, fiber-strength index, as determined from Pressley index, may be of little value to the breeder in determining which strain might have been superior in strength if degradation, especially differential degradation, has occurred. Table 9 also sum- marizes varietal and Vocational deviations for strength as estimated by the X-ray angle, by the estimated Chandler method,^^ and from spinning tests as the equivalent staple length minus the upper half mean. The latter, as was pointed out in discussing table 8, is here used as an index of fiber strength that is better or poorer than average strength.
FIBER FINENESS AND CELL-WALL DEVELOPMENT
In columns 9 and 10 of table 9 a comparison is given of the per- centage of deviations for varietal fineness as measured by weight per inch and as surface area determined by the Arealometer, summarized from the detailed data presented in table 10. In general, a good rela- tionship is seen for the varietal and the locational deviations given in columns 9 and 10. Both measurements for fineness are obviously in good agreement with fiber-wall development given in column 11, as percentage of deviation for mature fibers. In exceptional cases where low weight per inch occurs with average or greater-than-average percentage of thick-walled fibers, deviations for surface-area measure- ments are lower than for those for weight per inch; or, conversely, where high weight per inch occurs with low maturity, the Arealometer fails to follow weight fineness. Low weight-per-inch and high surface- area values generally, however, characterize varieties or locations that give a low percentage of thick-walled fibers.
12 RICHARDSON, H. B., BAILEY, T. L. W., JR., and CONRAD, C. M. METHODS FOR THE MEASUREMENT OF CERTAIN CHARACTER PROPERTIES OF RAW COTTON. U. S. Dept. Agr. Tech. Bui. 545, 77 pp., illus. 1937.

30 TECHNICAL BULLETIN 931, U. S. DEPT. OF AGRICULTURE
?3>
Ö
Ö
O
ce
II
<ö
e ^
ce o e
2s I p9îsnfpv çF gcceôci ecoó ci« côeô «Nc^ieo cicicí eícôcó<Ncicócieo
snoi:^BiA8Q
3 CO
'0 'N *eilTAS8;^B:^s Í S t^ s ci CO CÓ
•nnaj, 'aniAxons P CO ci eó ci eó
"0 "S 'eonejoij 1^ eocô §5 eó
§5 eó ci
•BO 'noyij, |i coco eó eó
•BO ';nouiij8dxa 1 g g f2 ci ci ci c4eó eó
•BiY 'Hjnqnv 1 g g ci §2S : cieóc4 !
-ssiK '8281100 nns p CO g2 2g Í2^
ci CÓ CÓ ci ci 8è8
•B1 ♦qd8sor-(jg 1 g g 1 ^
CO CÓ eó ci ci cicócó
•ssiH *8iliA8no:^s p Cl CI
co'eo s í§g SS CÓ cócó cieó
§^55 0Ó
•un8x *nos5ioBf g. c4 ci ci
SS : ci ci !
•3[jy *BnUBTJBJ\[ j g g co eó s^ ^ss g CÓ CÓ ci ci eó có
S CÓ
1 ^¿>^ •X8X *8nTAn88JO 1 S g CO
1 ^ ci ci ci ci ci c4 ci ci
•X8J, *8i(ira8x ci g ci
§8 ci
(sino:^:^oq) -xaj, 'noi:^Bi^S 8281100 ' eó ci
§8 c4ci
(pnBidn) •X8X 'nOT^BI^S 9381100
cî CÓ CÓ
•BHO 'BqsB^oiqo |i^ ci £3 ci ci
288 ci ci ci CÓ
•X8J, '8q;ooiiiiqo |i^ ci ci ci
•X8X 'siOoqqnT: 8 eó
•X8I, *00BIS8^ ar co' eó CO
eó
•X8K •N '9381100 Q^^%S
"^ ç^o» o o CO ^S g ci CO có eó
o ! eó ¡ eó
•zpy 'no:^BOBg ^ g coco ci CÓ ci ! g ci
•jiIBO 'JQW^qs -S g ci CO ci ci ci ! ci
"3 S
II
1 II -<
à
c<
<1
oc
PH
à fi II
i o Ü
i .>-. i,
i«
co
I œ
-^ ü
..O
11 i 1
CO
il la il
PC
1 o
1 •«# pq
1! Il 02
S Cl
1 c
■g a
> a p
œ
c
é a
1 Ö
1
o 0 S 2
g O pq

FIBEB AND SPINNING PROPERTIES OF COTTON 31
§8S c4eo <N 3.
19
2.88
3.
04
2.52
2.98
2.54
2.69
2.
39
SS;
oí +CO
CO oicó +CO
|8§ ¡CO
i i ;^ ¡ 1 1^ ^co
2.86
3.
00
2,82
lO 1 1 1 1
cí i i i i ,-ci
c4cô i i 1=^' +ci
lO 1
CO 1 ooo
ig Ici
2S§ ,-ci
CO 1 CO 1
CO ¡
oo»-<
55g ,-ci
8Sô l'ci
ci ci ¡1 (ci
fci
s i i î CO ! í ! 41CÔ
ci ! ci ci 1 SS3 l'ci
S : 3 S : ci ! ci c4 ! |Ci
! 00 s ! ! ci ci î ^Icô
coco
8g +ci
l'ci
2f: ,-ci
m otna
CQ
"in M
1 opq
Lo
nest
ar
an
d
Lan
kart
M
eban
e 14
0 an
d 14
1.
O
kla
hom
a T
ri-
umph
112
8
Sta
tion
21-
24
II ïll
5e
II Sos >i2 ©'0
■ne
^a
coio ^^

32 TECHNICAL BULLETIN 931, U. S. DEPT. OF AGRICULTURE
YARN-APPEARANCE GRADE AND RELATED FIBER AND SPINNING PROPERTIES
It has been shown by Pearson, ^^ Cook and WiUis, ^* and others that yarn-appearance grade and neppiness is related to fiber maturity and fineness, as well as to fiber length and grade. It has also been apparent in previously published reports that neps per 100 square inches of card web are related to yarn-appearance grade. Table 9 consequently presents a summary of percentages of deviations for fineness as measured by the Arealometer and by weight per inch and maturity for any apparent relationships that these may have with neps in card web, amount of card waste, or yarn-appearance grade. For convenience in calculating deviations for yarn-appearance grade, numerical values were assigned, as indicated in footnote 13 for table 9.
Fair agreement for fineness and maturity and for yarn-appearance grade is readily apparent. There is an apparent relationship between fiber length and yarn-appearance grade, but since the varieties having a short staple were usually above average for weight-per-unit length and percentage of maturity, it is difficult to interpret such trends on the basis of these data. In the various tables it may be noted that, with the exception of fiber-length uniformity, the range of deviations for varieties was approximately twice that observed for environmental effects. While this approximate difference continues to hold for fineness, in table 9 it may be noted that the range of deviations for maturity, for neps per 100 square inches of card web, for picker and card waste, and for yarn-appearance grade is about equal for varietal and environmental effects.
FIBER FINENESS AS RELATED TO SKEIN STRENGTH OF HIGHER COUNTS
In the foregoing discussion it was indicated that fineness, as meas- ured by weight-per-unit length, is related to yarn-appearance grade, neps in card web, and to certain fiber properties shown in table 9. In discussing tables 4 to 8, it was pointed out that fineness apparently had little influence on skein strength of 22s, and that while it somewhat affected converted 22s derived from 36s, it did not appear necessary to take fineness into account for approximate weighted 22s skein- strength predictions. These and other data, however, indicate that the skein strength for 36s singles is somewhat affected by extreme variations in fiber fineness. Fineness very consistently influences skein strength of counts higher than 36s. For this reason counts finer than 36s were excluded from converted or weighted 22s. The effect of fiber fineness, in addition to fiber length plus strength, on skein strength of the higher counts is shown in table 11.
^* PEABSON, N. L. NEPS IN COTTON YARNS AS RELATED TO VARIETY, LOCATION, AND SEASON OF GROWTH. U. S. Dept. AgF. Tech. Bui. 878, 18 pp., illus. 1944.
14 See footnote 6, p. 13.

FIBER AND SPINNING PROPERTIES OF COTTON 33
TABLE 11.—Varietal and environmental effects on skein strength of 60s singles carded yarns
VARIETAL EFFECTS
Variety or location
Skein strength
Predicted from—
Fiber length 1
±devia- tion for
fiber strength '
dbdevia- tion for
fiber weight '
Fiber length+
strength+ weight *
Observed«
(1) (2) (3) (4) (5) (6)
Acala type: Acalal517 Acala 1517 W29-1 Acala P18
Coker 100 type: Coker 100-6 -- Coker 100-7 -.-
Coker 100 Wilt type: Coker 100 Wilt 2 Cokerl00Wilt3
Delfos type: De.lfos531C Delfos Ö51
Deltapine type: Deltapine 14 _- Deltapine 14 (833) A12 (Arkansas)
Rowden type: Rowden 41A ._ Rowden 41B B4 (Arkansas)
Stone ville type: Stoneville 2B Stoneville2B (8275) Stoneville 2C Stoneville 62-1-10 White Gold Empire Bobshaw l... E4 (Arkansas)
Stonewilt type: Stonewilt 2 Stonewilt 3 Wannamaker's S and C 4-,
Miscellaneous: Bobdel (Bobshaw 16) Coker 200-4 Coker 4 in 1-5 Hibred Lonestar and Lankart Mebane 140 and 141._ Oklahoma Triumph 1128.. Station 21-24
Lb. 26 26 25
24 24
24 24
25 25
25 24 24
23 23 24
24 24 25 22 24 24 24 24
24 24 25
26 24 25 19 24 22 22 23
Lb. +4 +4 -2
-1 0
-1 -1
0 -1
-1 -1
0
+1 +1 4-1
0 0 0
+1 -1
0 +1 -1
-1 -3 -1
+1 -1 -1
0 +2
0 -1 +1
Lb. Lb. +4 +5 +1 +3 +3
-1 0
+4 +3
0 0 0
+1 +3 +2 -2
0 0
-2 +1
0 +1 +1 +3
0 +1 -7
0 -4 -2 -4
ENVIRONMENTAL EFFECTS
Irrigated area: Shafter, Calif Sacaton, Ariz State College, N. Mex... Weslaco, Tex.-. -.
Texas-Oklahoma area: Lubbock, Tex _._ Chillicothe, Tex Chickasha, Okla --- College Station, Tex. (upland). College Station, Tex. (bottoms) Temple, Tex __ _ Greenville, Tex-_
25 -1 -1 23 24 0 -1 23 25 -3 0 22 26 0 +1 27
24 0 +1 25 24 +1 -1 24 23 +2 0 25 24 0 +4 28 24 0 0 24 24 -1 +2 25 23 +2 -1 24
Lb.
See footnotes at end of table.

34 TECHNICAL BULLETIN 931, U. S. DEPT. OF AGRICULTURE
TABLE 11.—Varietal and environmental effects on skein strength of 60s singles carded yarns—Continued
ENVIRONMENTAL EFFECTS—Continued
Variety or location
Skein strength
Predicted from-
Fiber length 1
±devia- tion for
fiber strength
dbdevia- tion for
fiber weight 3
Fiber length4-
strength+ weight *
Observed «
(1) (2) (3) (4) (5) (6)
Mid-South area: Marianna, Ark Jackson, Tenn Stone ville, Miss St. Joseph, La State College, Miss
Southeast area: Auburn, Ala...._.. Experiment, G a Tifton, Ga Florence, S. C Knoxville, Tenn Statesville, N. C...
Lb. Lb. +1 +2
0 -1 +1
-1 -1
0 -2 -1
0
Lb. +2 -3 +1
0 0
0 0
+1 0 0
-1
Lb. Lb. 26 21 27 26 24
24 24 22 22 24 24
1 Skein strength attributable to upper half mean, on the basis of these data: Upper half mean of 0.96 inch—skein strength of 24 pounds, the average for varieties and locations; or ÜHMX25=skein strength imputed to fiber length of average strength and fineness.
2 If 81,000 pounds for estimated fiber tensile strengtû for average length and fineness=24 pounds for skein strength, increments of 1,000 pounds for fiber strength=increments of 0.296 pound for skein strength.
3 If fiber fineness, as measured by weight per inch, of 4.6 micrograms=skein strength of 24 pounds, incre- ments of 0.1 microgram=increments of 0.5217 pound for skein strength.
* Sum of columns 2,3, and 4 (or as derived from the formula for predicted skein strength of 60s, p. 9). 6 The means for observed values for varieties or locations were obtained by estimating ideviations for
locations or varieties in the manner described in tables 4 and 5; where the finest count was coarser than 60s, conversions to 60s were made by the formula cited on p. 9.
In table 11 actual 60s were used where the samples were spun into 60s. Where the highest count was coarser than 60s, the regression formula (see p. 9) was used to convert the highest count to 60s. While it is true that 60s is much too fine to be practicable or possible for many of these lengths, this conversion, as would any other equiv- alent count, puts the lengths on a theoretically comparable basi^. For obvious reasons the weight-per-unit length deviations in micrograms that were greater or less (+ or — ) than the mean for the 34 varieties (4.6 /xg.) were multiphed by minus 1 to change the signs of the incre- ments recorded in columns 4 and 10.
This, of course, becomes a needless step if, instead of subtracting the mean from the observed value as for length or strength where the relationship to skein strength is direct, the observed weight-per-unit length is subtracted from the mean. For simphcity of table construc- tioQ, the figures given in table 11 are rounded off to the nearest whole number. This obviously results in a considerable error in dealing with such small values as for 60s skein strength.
These results, in conjunction with unpublished studies of similar results obtained in an analysis of 1,400 spinning tests, indicate that skein strength of singles yarn not finer than 36s can be predicted with considerable accuracy on the basis of fiber length and strength, but that ÍQ predicting skein strength of counts finer than 36s, fiber fineness must be taken into consideration. The procedure outlined above for
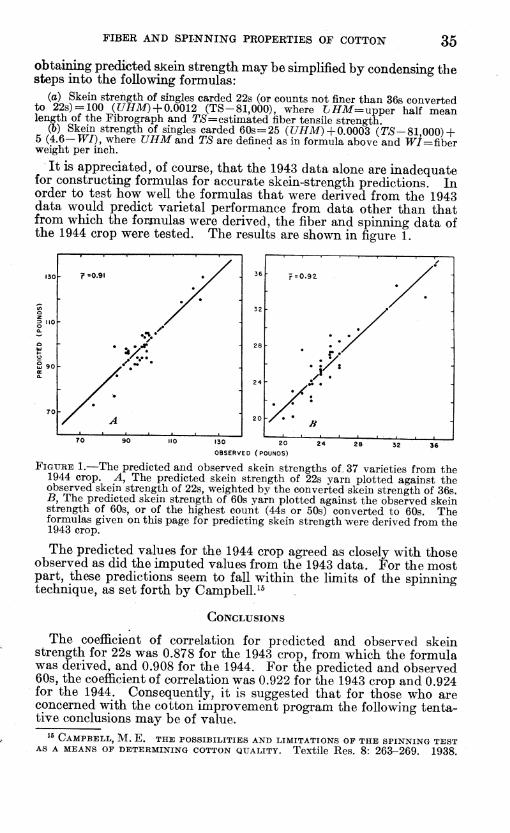
FIBER AND SPINNING PROPERTIES OF COTTON 35
obtaining predièted skein strength may be simplified by condensing the steps into the following formulas:
(a) Skein strength of singles carded 22s (or counts not finer than 36s converted to 22s) = 100 (C7J/M)+ 0.0012 (TS-81,000), where Li/M= upper half mean length of the Fibrograph and TO=estimated fiber tensile strength.
(b) Skein strength of singles carded 60s = 25 (UHM)-\-O.OOOS (TS-Sl 000) + 5 (4.6— WI), where UHM and TS are defined as in formula above and 177=fiber weight per inch.
It is appreciated, of course, that the 1943 data alone are inadequate for constructing formulas for accurate skein-strength predictions. In order to test how well the formulas that were derived from the 1943 data would predict varietal performance from data other than that from which the formulas were derived, the fiber and spinning data of the 1944 crop were tested. The results are shown in figure 1.
130 ? =0.91
m ^r
2 ¡no a.
o
£90 (C 0.
./ A- -
y / •
'• ' 70
/ A
130 20
OBSERVED (POUNDS)
FiGUKE 1.—The predicted and observed skein strengths of. 37 varieties from the 1944 crop. A, The predicted skein strength of 22s yarn plotted against the observed skein strength of 22s, weighted by the converted skein strength of 36s. B, The predicted skein strength of 60s yarn plotted against the observed skein strength of 60s, or of the highest count (44s or 50s) converted to 60s. The formulas given on this page for predicting skein strength were derived from the 1943 crop.
The predicted values for the 1944 crop agreed as closely with those observed as did the imputed values from the 1943 data. For the most part, these predictions seem to fall within the limits of the spinning technique, as set forth by Campbell.^^
CONCLUSIONS
The coefficient of correlation for predicted and observed skein strength for 22s was 0.878 for the 1943 crop, from which the formula was derived, and 0.908 for the 1944. For the predicted and observed 60s, the coefficient of correlation was 0.922 for the 1943 crop and 0.924 for the 1944. Consequently, it is suggested that for those who are concerned with the cotton improvement program the following tenta- tive conclusions may be of value.
^^ CAMPBELL, M. E. THE POSSIBILITIES AND LIMITATIONS OF THE SPINNING TEST AS A MEANS OP DETERMINING COTTON QUALITY. Textile Res. 8: 263-269. 1938.

36 TECHNICAL BULLETIN 931, U. S. DEPT. OF AGRICULTURE
Singles yarn strength of coarse to medium counts niay be increased by increasing fiber length or strength. If short fiber is processed rnore easily than long, the spinner may eventually pay a greater premium for fiber strength than for length.
Fiber fineness or low weight-per-unit length may be an undesirable fiber property where carded yarn-appearance grade is highly impor- tant, especially in lengths that are usually consumed in carded singles yarns of coarse to medium counts.
For cotton that is likely to be spun into counts finer than 36s, fineness is a very desirable fiber property that in value approximately equals fiber length and strength.
Until a more reliable basis for prediction is established from a much larger and more representative sample than was available from the 1943 tests, the cotton breeder may find the following formulas useful in establishing relative spinning performance from fiber data:
(a) Skein strength of singles carded 22s (or counts not finer than 36s converted to 22s) = 100 (UHM)+0.0012 (T>S-81,000), where 17//M= upper half mean length of the Fibrograph and TO=estimated fiber tensile strength.
(&) Skein strength of singles carded 60s=25 (l7HM)+0.0003 (TO-81,000) + 5 (4.6—TF/), where UHM and TS are defined as in formula above and WI=--ñhei weight per inch.
U. S. GOVERNMENT PRINTING OFFICE: 1946
For sale by the Superintendent of Documents, U. S. Government Printing Office Washington 25, D. C. - Price 10 cents