Embed Size (px)
Citation preview
2A new methodology for processing scanner data in the Dutch CPIANTONIO G. CHESSA (1)
Abstract: This paper presents a new methodology for processing electronic transaction data and for calculating price indices, with the aim of reducing the differences across the methods used for different retailers and consumer goods in the Dutch CPI.
Meaningful price indices can only be computed for homogeneously defined products. GTINs (barcodes) contain the highest degree of homogeneity. However, their use may be hampered by the occurrence of so-called ‘relaunches’. This term refers to existing items that re-enter the stores with a new GTIN. The old and new GTINs need to be linked in order to capture possible price increases after relaunches. This may be achieved through retailers’ own product codes (Stock Keeping Units), or otherwise through item characteristics. A sensitivity analysis is pro-posed for selecting item attributes, which quantifies the additional impact of attributes on price change.
The new index method calculates price indices as a ratio of a turnover index and a weighted quantity index. The method is in fact the Geary-Khamis method applied to the time domain. Quantity weights of homogeneous products are calculated from prices and quantities of each month in the current year. The weights, which are used to calculate indices with respect to a fixed base month, are updated each month. The method does not lead to chain drift as the price indices coincide with a transitive version of the method at the end of each year. Compari-sons with two weighting variants show that the results are robust.
The new methodology has replaced the current sample-based method in the CPI for mobile phones in January 2016. The paper concludes with future plans with the methodology for scan-ner data of different retailers.
JEL codes: C43, E31.
Keywords: CPI, scanner data, GTIN, relaunch, product homogeneity, chain drift, Geary-Khamis method.
(1) Statistics Netherlands, Team CPI.
A new methodology for processing scanner data in the Dutch CPI
EURONA — Eurostat Review on National Accounts and Macroeconomic Indicators50
2
1. IntroductionScanner data have clear advantages over traditional survey data collection, notably because such data sets offer a better coverage of items sold and they contain complete transaction information (prices and quantities). In spite of their potential, scanner data are used by a small number of statistical agencies in their CPI, but the number is gradually increasing (2).
By scanner data we mean transaction data that specify turnover and numbers of items sold by GTIN (barcode). At the time of introduction in the Dutch CPI in 2002, scanner data involved two supermarket chains. In January 2010, the number of supermarket chains was extended to six, as part of a re-design of the CPI (de Haan (2006), van der Grient and de Haan (2010), de Haan and van der Grient (2011)). At present, scanner data of 10 supermarket chains are used and surveys are not carried out anymore for supermarkets since January 2013. Meanwhile, also scanner data from other retailers are used in the CPI (e.g., do-it-yourself stores). Other forms of electronic data containing both price and quantity information that are used in the CPI include data from travel agencies, for fuel prices and for mobile phones. More than 20 % of the Dutch CPI is based on electronic transaction data (in terms of household expenditures of 2015).
Electronic transaction data sets offer possibilities of refining index methods compared with survey data. Expenditure shares can be used as weights at the most detailed product level and complete sets of sold GTINs can be processed instead of samples of items (3). With thousands of GTINs per retailer, the question is how to find efficient and satisfactory solutions. This has turned out to be a complex quest over the years, which is reflected in a range of different methods across retailers and consumer goods in the Dutch CPI (Walschots (2016)). The current method for supermarket scanner data processes ‘all’ GTINs (i.e., those that satisfy various filters), while the methods for other retailers still make use of samples of items.
As the search for new electronic data continues, the question was put forward whether a ge-neric index method could be developed that is applicable to different types of consumer goods and services and that is capable of handling issues that are not resolved in a satisfactory way so far in current methods. One of these issues is the so-called relaunch problem. A ‘relaunch’ could be defined as a return to the stores of an existing item after undergoing changes, which typi-cally concern packaging shape and formulation. The GTIN changes as well and the item may have a higher price than before the relaunch, which must be captured by a price index.
Section 2 gives a global outline of a new methodology for processing electronic transaction data. This section shows how the new methodology fits within the CPI system. The aim of the methodology is to process all GTINs, thus abandoning the traditional approach of selecting samples of products, and to have an index method that deals with assortment changes over time, that timely includes new products and that efficiently handles relaunches.
Sections 3 and 4 elaborate the essential components of the new methodology: product ho-mogeneity and price index calculation. When relaunches occur, GTINs are not appropriate as unique identifiers of homogeneous products. Product homogeneity should then be achieved at a broader level, at which GTINs are combined into groups. Homogeneous products could be defined by combining GTINs that share the same set of characteristics. These have to be selected in some way. Section 3 describes and illustrates a method for this purpose.
Turnover and sold quantities of items are summed and used to calculate unit values for homo-geneous products. These are subsequently combined into ‘quality-adjusted unit value indices’
(2) Until 2015, four countries were using scanner data in Europe (the Netherlands, Norway, Sweden, Switzerland). In April 2016, the number of countries had increased to seven (Belgium, Denmark and Iceland joined meanwhile).
(3) In this paper, the term ‘item’ and GTIN are used interchangeably.
A new methodology for processing scanner data in the Dutch CPI
EURONA — Eurostat Review on National Accounts and Macroeconomic Indicators 51
2(‘QU-indices’) for ‘consumption segments’, which consist of comparable homogeneous prod-ucts (e.g., a segment T-shirts with products that are described by different characteristics). The index method is described in Section 4.
The price index method uses prices and quantities of each month in the current year for cal-culating and monthly updating the adjustment factors of the quantities sold of each product (quantity weights). This means that relatively little information is used in the first months (two months in January, three in February, etc., with December as base month). In order to inves-tigate the impact of this smaller amount of information, price indices are compared with a transitive version of the method that uses all 13 months for calculating the quantity weights. The results of an empirical study are presented in Section 5.2.
A second issue concerns the weighting scheme used for calculating the quantity weights of the products. The product prices of each month are deflated by the price indices and weighted according to the share of the quantities sold in a month. In international price comparisons, this method is known as the Geary-Khamis (GK) method. The GK-method has been the subject of criticism because of the ‘substitution bias’. When time is replaced by country, the product prices of large countries receive larger weights than those of smaller countries. If the larger countries exhibit higher prices, then a situation can arise that is felt to contradict with economic theories (consumers tend to buy more of some good when prices decrease). In order to gain some in-sight into the extent of the substitution bias in intertemporal comparisons, two versions of the QU-method with different weighting schemes are considered and compared with the QU-GK method. The results of an empirical study are presented in Section 5.3.
Section 6 summarises the first experiences with the methodology in the Dutch CPI for mobile phones. Final remarks are made in Section 7.
2. Outline of a new processing frameworkThe development of different methods for different retailers in the Dutch CPI has made the system increasingly complex over time. Different choices were made when a new data set was added to the production system. The current index method for supermarkets uses a monthly chained Jevons index for consumption segments. Different types of price and turnover filters are built within the Jevons index. Because of the equal weighting of GTINs (taken as homoge-neous products), items with monthly turnover shares below a certain threshold are excluded. Old and new GTINs of relaunched items are not linked. A ‘dump price filter’ is applied to outgo-ing GTINs in order to limit downward biases of the index.
The methods for data of other retailers select samples of GTINs in order to have a better grip on relaunches. The method for do-it-yourself stores handles relaunches by manually replacing outgoing items by new ones. This method may be labour intensive during monthly produc-tion. The sample-based methods for a Dutch department store and for drugstores link GTINs automatically by making use of item characteristics.
Possibilities of developing a generic method have been studied in order to reduce the current methodological differences and issues in the Dutch CPI. These differences and issues cover three aspects: data processing, product homogeneity and price index calculation. The differ-ences with regard to these aspects apply to consumption segments in the CPI. This is a product group level below the most detailed ECOICOP4 level at which CPI figures are published. Con-
(4) ECOICOP = European Classification of Individual Consumption according to Purpose, defined in Annex 1 of Regulation (EU) 2016/792 (http://eur-lex.europa.eu/legal-content/EN/TXT/PDF/?uri=OJ:JOL_2016_135_R_0002&from=EN).
A new methodology for processing scanner data in the Dutch CPI
EURONA — Eurostat Review on National Accounts and Macroeconomic Indicators52
2sumption segments are created in order to link GTINs to ECOICOP in an efficient way. Consump-tion segments are derived from the retailers’ own classification of GTINs (called ‘ESBAs’ in the Dutch CPI (5)).
Aggregation of price indices for consumption segments to higher levels is carried out with Laspeyres type methods for different scanner data sets, so the methods become uniform at ECOICOP and higher levels. This section sets the methodological targets for a generic meth-odology for consumption segments. The methods suggested for reaching these targets are described in the next two sections.
Data processing
The new methodology aims at processing all GTINs, thus abandoning the traditional idea of calculating price indices for a sample of goods. With regard to index calculation this implies that assortment changes are directly included and the use of price and turnover filters is limited to identifying extremes in the data, such as implausible price changes.
Product homogeneity
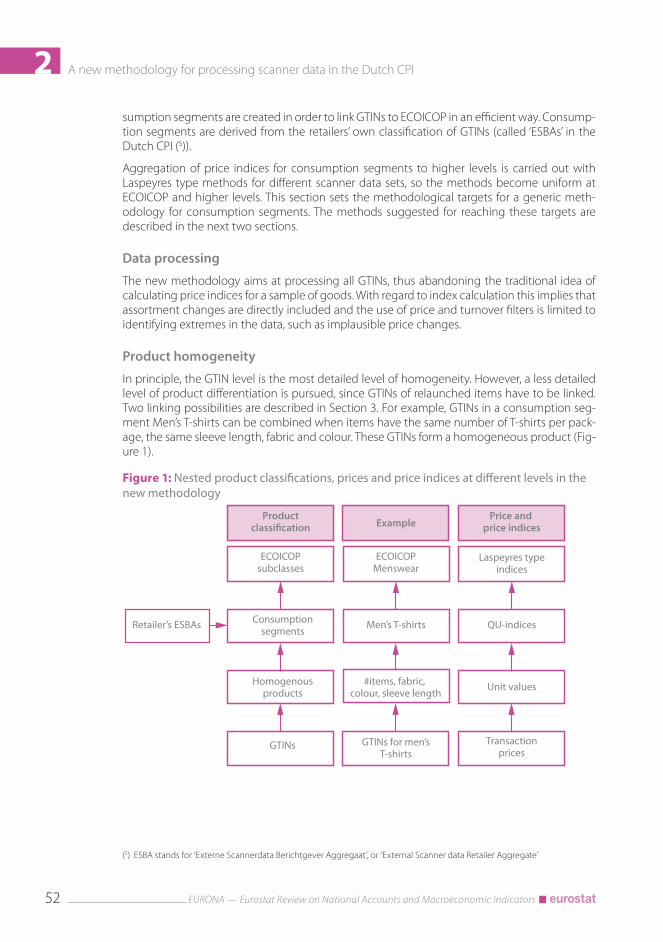
In principle, the GTIN level is the most detailed level of homogeneity. However, a less detailed level of product differentiation is pursued, since GTINs of relaunched items have to be linked. Two linking possibilities are described in Section 3. For example, GTINs in a consumption seg-ment Men’s T-shirts can be combined when items have the same number of T-shirts per pack-age, the same sleeve length, fabric and colour. These GTINs form a homogeneous product (Fig-ure 1).
Figure 1: Nested product classifications, prices and price indices at different levels in the new methodology
Consumptionsegments
Productclassi�cation Example
Price and price indices
ECOICOPsubclasses
ECOICOPMenswear
Laspeyres typeindices
Retailer’s ESBAs Men’s T-shirts QU-indices
Homogenousproducts
#items, fabric, colour, sleeve length
Unit values
GTINs GTINs for men’sT-shirts
Transactionprices
(5) ESBA stands for ‘Externe Scannerdata Berichtgever Aggregaat’, or ‘External Scanner data Retailer Aggregate’
A new methodology for processing scanner data in the Dutch CPI
EURONA — Eurostat Review on National Accounts and Macroeconomic Indicators 53
2Price index calculation
For each homogeneous product, a unit value is calculated by summing turnover and quanti-ties sold over GTINs that belong to the same product. Unit values and quantities sold for ho-mogeneous products are subsequently used to calculate a price index for each consumption segment. The QU-method is developed for this purpose, which is described in Section 4. This method is able to process all transactions, which means that it includes new products directly into the index. The new methodology is summarised in Figure 1.
3. Consumption segments and product homogeneityIn order to make choices about consumption segments and homogeneous products, statisti-cal agencies require information about item characteristics and classifications used by retailers (ESBAs). Our experiences with electronic data sets show that this information may be supplied in varying formats by different retailers. For instance, the variables in drugstore scanner data are all contained in separate columns (Chessa (2013)). On the other hand, information about item characteristics is only contained in text strings of GTIN descriptions in scanner data of a Dutch department store.
The first example is clearly the preferred data format. The second example requires some form of text mining in order to retrieve and place information about item characteristics in separate columns. Text mining falls outside the scope of this paper and will therefore not be treated further (for details, see Chessa et al. (2015)).
Consumption segments consist of comparable homogeneous products. Different degrees of comparability can be chosen; for instance, different types of socks combined into one seg-ment, or sports, thermal and walking socks as separate segments. We have decided to define consumption segments broadly (i.e., ‘men’s socks’ rather than ‘men’s sports socks’, ‘men’s thermal socks’ and so on). This results in fewer segments, which provides a more manageable system during monthly validation.
When consumption segments have been defined, the question is how to define homogeneous products. Before proceeding, we introduce the following terminology: by ‘characteristic’ of an item we refer to a specific value that an ‘attribute’ can take. For example, ‘white’ is a characteristic of a T-shirt that belongs to the attribute ‘colour’.
GTINs can be linked and combined into homogeneous products by using one of the following two approaches:
• Old and new GTINs can be matched through the retailer’s internal product codes or SKUs (Stock Keeping Units), which retailers use for their stock administration;
• If SKUs are not available, or cannot be used for some reason, then GTINs can be matched by making use of item characteristics.
SKUs provide direct GTIN matches. If SKUs are not available, then the question is which attri-butes should be selected for linking GTINs. Item characteristics may have to be extracted from GTIN descriptions, which may be time consuming. Such data sets require maintenance of lists of keywords for identifying characteristics, for example, for new items and because retailers can modify the coding of a characteristic in a text string. Not all attributes may be equally important
A new methodology for processing scanner data in the Dutch CPI
EURONA — Eurostat Review on National Accounts and Macroeconomic Indicators54
2to product homogeneity, so it is useful to find out whether a subset of item attributes suffices to describe a price index to some degree of accuracy (to be defined).
The traditional work of the consumer analyst, which involves setting up product descriptions for surveys, is combined with a sensitivity analysis that quantifies the impact of attributes on a price index. The suggested approach for selecting item attributes consists of the following steps:
1. For a given consumption segment, the consumer analyst selects an initial set of item attrib-utes that (s)he finds to be relevant;
2. A price index is calculated for the consumption segment according to the method of Section 4. GTINs that share the characteristics chosen in step 1 are combined into the same product;
3. A sensitivity analysis is performed: an attribute that was not selected in step 1 is now added and the price index is re-calculated. If the price index changes ‘significantly’, then the attrib-ute is added. This step can be repeated with other attributes. Attributes may also be omitted when their impact on the price index is negligible.
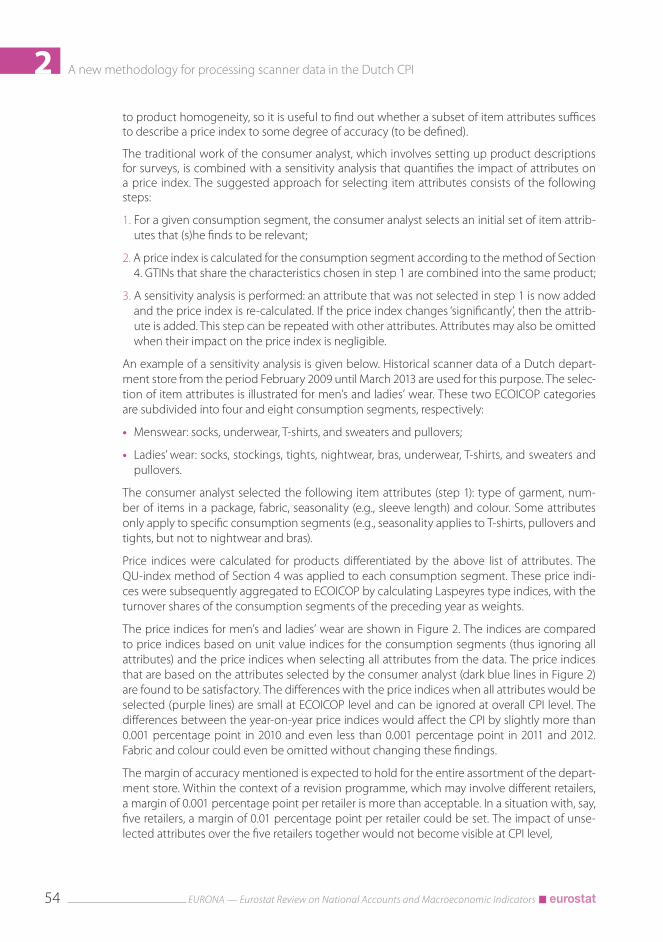
An example of a sensitivity analysis is given below. Historical scanner data of a Dutch depart-ment store from the period February 2009 until March 2013 are used for this purpose. The selec-tion of item attributes is illustrated for men’s and ladies’ wear. These two ECOICOP categories are subdivided into four and eight consumption segments, respectively:
• Menswear: socks, underwear, T-shirts, and sweaters and pullovers;
• Ladies’ wear: socks, stockings, tights, nightwear, bras, underwear, T-shirts, and sweaters and pullovers.
The consumer analyst selected the following item attributes (step 1): type of garment, num-ber of items in a package, fabric, seasonality (e.g., sleeve length) and colour. Some attributes only apply to specific consumption segments (e.g., seasonality applies to T-shirts, pullovers and tights, but not to nightwear and bras).
Price indices were calculated for products differentiated by the above list of attributes. The QU-index method of Section 4 was applied to each consumption segment. These price indi-ces were subsequently aggregated to ECOICOP by calculating Laspeyres type indices, with the turnover shares of the consumption segments of the preceding year as weights.
The price indices for men’s and ladies’ wear are shown in Figure 2. The indices are compared to price indices based on unit value indices for the consumption segments (thus ignoring all attributes) and the price indices when selecting all attributes from the data. The price indices that are based on the attributes selected by the consumer analyst (dark blue lines in Figure 2) are found to be satisfactory. The differences with the price indices when all attributes would be selected (purple lines) are small at ECOICOP level and can be ignored at overall CPI level. The differences between the year-on-year price indices would affect the CPI by slightly more than 0.001 percentage point in 2010 and even less than 0.001 percentage point in 2011 and 2012. Fabric and colour could even be omitted without changing these findings.
The margin of accuracy mentioned is expected to hold for the entire assortment of the depart-ment store. Within the context of a revision programme, which may involve different retailers, a margin of 0.001 percentage point per retailer is more than acceptable. In a situation with, say, five retailers, a margin of 0.01 percentage point per retailer could be set. The impact of unse-lected attributes over the five retailers together would not become visible at CPI level,
A new methodology for processing scanner data in the Dutch CPI
EURONA — Eurostat Review on National Accounts and Macroeconomic Indicators 55
2since figures are published up to the tenth percentage point. These ideas could serve as a guideline of how the problem of attribute selection may be dealt with in practice. Not only when it comes to defining products before introducing a new method into the CPI, but also when monitoring attributes during production. Experience has to be gained with these issues from this year onward in the Dutch CPI.
Figure 2: Price indices for men’s and ladies’ wear of a department store, compared with unit value based indices (no attributes selected for consumption segments) and price indices when all attributes are selected (Feb 2009 = 100)
60
70
80
90
100
110
120
130
140Menswear
60
70
80
90
100
110
120
130
140Ladies' wear
No attributes Selected attributes All attributes
2009
M02
2009
M06
2009
M10
2010
M02
2010
M06
2010
M10
2011
M02
2011
M06
2011
M10
2012
M02
2012
M06
2012
M10
2013
M02
2009
M02
2009
M06
2009
M10
2010
M02
2010
M06
2010
M10
2011
M02
2011
M06
2011
M10
2012
M02
2012
M06
2012
M10
2013
M02
Source: Author's calculations
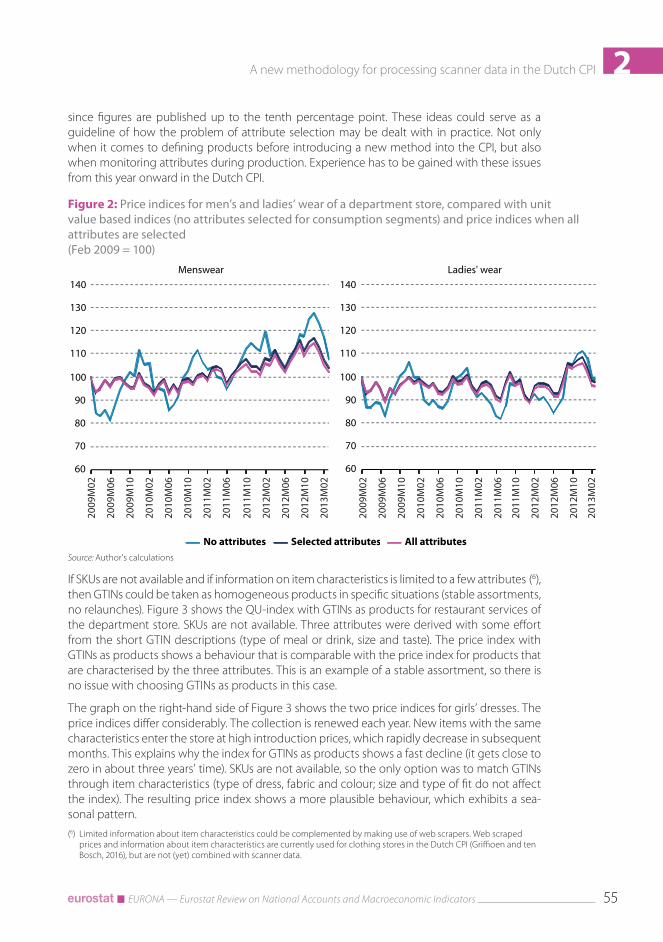
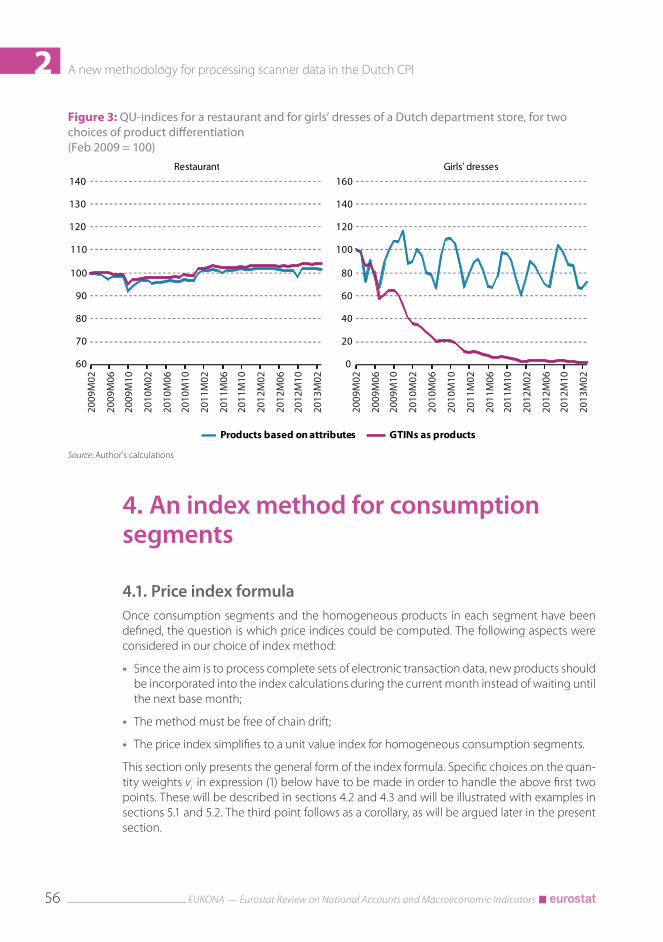
If SKUs are not available and if information on item characteristics is limited to a few attributes (6), then GTINs could be taken as homogeneous products in specific situations (stable assortments, no relaunches). Figure 3 shows the QU-index with GTINs as products for restaurant services of the department store. SKUs are not available. Three attributes were derived with some effort from the short GTIN descriptions (type of meal or drink, size and taste). The price index with GTINs as products shows a behaviour that is comparable with the price index for products that are characterised by the three attributes. This is an example of a stable assortment, so there is no issue with choosing GTINs as products in this case.
The graph on the right-hand side of Figure 3 shows the two price indices for girls’ dresses. The price indices differ considerably. The collection is renewed each year. New items with the same characteristics enter the store at high introduction prices, which rapidly decrease in subsequent months. This explains why the index for GTINs as products shows a fast decline (it gets close to zero in about three years’ time). SKUs are not available, so the only option was to match GTINs through item characteristics (type of dress, fabric and colour; size and type of fit do not affect the index). The resulting price index shows a more plausible behaviour, which exhibits a sea-sonal pattern.(6) Limited information about item characteristics could be complemented by making use of web scrapers. Web scraped
prices and information about item characteristics are currently used for clothing stores in the Dutch CPI (Griffioen and ten Bosch, 2016), but are not (yet) combined with scanner data.
A new methodology for processing scanner data in the Dutch CPI
EURONA — Eurostat Review on National Accounts and Macroeconomic Indicators56
2Figure 3: QU-indices for a restaurant and for girls’ dresses of a Dutch department store, for two choices of product differentiation (Feb 2009 = 100)
60
70
80
90
100
110
120
130
140Restaurant
0
20
40
60
80
100
120
140
160Girls' dresses
2009
M02
2009
M06
2009
M10
2010
M02
2010
M06
2010
M10
2011
M02
2011
M06
2011
M10
2012
M02
2012
M06
2012
M10
2013
M02
2009
M02
2009
M06
2009
M10
2010
M02
2010
M06
2010
M10
2011
M02
2011
M06
2011
M10
2012
M02
2012
M06
2012
M10
2013
M02
Products based on attributes GTINs as products
Source: Author's calculations
4. An index method for consumption segments
4.1. Price index formulaOnce consumption segments and the homogeneous products in each segment have been defined, the question is which price indices could be computed. The following aspects were considered in our choice of index method:
• Since the aim is to process complete sets of electronic transaction data, new products should be incorporated into the index calculations during the current month instead of waiting until the next base month;
• The method must be free of chain drift;
• The price index simplifies to a unit value index for homogeneous consumption segments.
This section only presents the general form of the index formula. Specific choices on the quan-tity weights vi in expression (1) below have to be made in order to handle the above first two points. These will be described in sections 4.2 and 4.3 and will be illustrated with examples in sections 5.1 and 5.2. The third point follows as a corollary, as will be argued later in the present section.
A new methodology for processing scanner data in the Dutch CPI
EURONA — Eurostat Review on National Accounts and Macroeconomic Indicators 57
2We introduce the following notation. Let G0 and Gt denote sets of homogeneous products for some consumption segment G in months 0 and t. The sets of homogeneous products in months 0 and t may be different. Let pi,t and qi,t denote the prices and quantities sold for product i Є Gt, respectively, in month t (7).
We denote the price index in month t with respect to, say, a base month 0 by Pt. The following formula is proposed for calculating price indices:
(1) Pt = ∑i Є Gt
pi,t qi,t / ∑i Є G0 pi,0 qi,0
.
∑i Є Gt vi qi,t / ∑i Є G0
vi qi,0
The numerator is a turnover index, while the denominator is a weighted quantity index. The quantity weights vi are the only unknown factors in formula (1). Choices concerning the defini-tion and calculation of the vi are described in sections 4.2 and 4.3.
Price index formula (1) can be written in the following compact form:
(2) Pt = pt / p0 ,
vt / v0
where pt and vt denote weighted arithmetic averages of the prices and the vi, respectively, over the set of products in month t, that is,
(3) pt = ∑i Є Gt
pi,t qi,t ,
∑i Є Gt qi,t
(4) vt = ∑i Є Gt
vi qi,t .
∑i Є Gt qi,t
If a consumption segment is homogeneous, then product quantities are summed (equal vi for all products) so that (1) simplifies to a unit value index, which is the numerator of (2). If con-sumption segments are not homogeneous, then the unit value index must be adjusted. The adjustment term is the denominator of (2). This term captures shifts in consumption patterns among different products between two months. A shift towards products with higher quantity weights (i.e., more expensive, higher quality products) increases the denominator of (2), which has a complementary downward effect on the price index. We call index (1)-(2) a ‘quality adjust-ed unit value index’ (‘QU-index’). Such methods have been studied and suggested previously in the price index literature (Silver (2010), von Auer (2014)).
4.2. Definition of the quantity weightsFormula (1) can be considered as a family of price indices. Different choices for the vi lead to dif-ferent price index formulas, which also include well-known bilateral indices. For instance, if we set the vi equal to the product prices from the current month t, then (1) simplifies to a Laspeyres index. If the vi are set equal to the prices in the base month 0, then (1) turns into a Paasche price index.
(7) A different notation is used in this paper from the commonly accepted notation of time as a superscript in prices, quantities and indices. In this paper, preference is given to the notation of both product and time indices as subscripts. This was done in order to reserve the superscript for other purposes (see Chessa (2015), Section 3).
A new methodology for processing scanner data in the Dutch CPI
EURONA — Eurostat Review on National Accounts and Macroeconomic Indicators58
2Bilateral indices have several shortcomings. Monthly chained indices are not able to deal with price changes for products that are temporarily unavailable, while direct indices cannot include new products until the next base month, unless prices are imputed. However, price imputations are not needed when the product prices from each month in the current year are included in the vi. This allows us to directly compute quantity weights for both existing and new products.
We define the vi by including the product prices and quantities from each month in the current year and the base month December of the previous year (i.e., for 13 months) (8). We define vi for product i as follows:
12
(5) vi = ∑φi,z pi,z
,
z=0 Pz
where
(6) φi,z = 12
qi,z
∑s=0 qi,s
denotes the share of month z in the total amount of quantities sold for product i over the 13 months. The vi are defined as a weighted average of deflated prices. Price change is thus re-moved from the product prices in order to yield weights vi in the weighted quantity index of (1).
Notice that price index (1) is transitive. However, in practice we can use prices and quantities of all 13 months only in the final month of a year, so that some updating method is needed for computing the vi each month. Such a method is suggested in Section 4.3.
The index method described by formulas (1), (5) and (6) is known as the Geary-Khamis (GK) method in international price comparisons, with time replaced by country (Geary (1958), Khamis (1972), Balk (1996, 2001, 2012)). We denote the QU-method with choices (5) and (6) for the quan-tity weights by the ‘QU-GK method’. The GK-method has been the subject of debates in the literature concerning substitution effects, to which we will return in Section 5.3.
4.3. Computation of price indices in practiceAs was pointed out in the previous section, it is not possible in practice to fix the quantity weights at the same values each month when the product prices and quantities from each month in the current year are used to compute the vi . This raises the question how the quantity weights could be updated each month, such that the resulting indices give good approxima-tions of the transitive index of Section 4.2. We refer to the transitive index as the ‘benchmark index’. The index with monthly updated quantity weights is called ‘real time index’.
Different methods exist for updating the quantity weights. Krsinich (2014) suggests a rolling 13-month window, which is used to calculate chained year-on-year indices each month. How-ever, this method has given quite volatile and biased results (Chessa (2015)). We propose the following approach for calculating real time price indices:
• A time window is used with December of the previous year as fixed base month. The first window consists of the base month and January of the present year. The window is enlarged each month with the current month;
(8) Periods of 13 months are preferred to periods with other lengths, as was argued in Chessa (2015).
A new methodology for processing scanner data in the Dutch CPI
EURONA — Eurostat Review on National Accounts and Macroeconomic Indicators 59
2• The vi are updated with product prices and quantities of the current month;
• The price index of the current month is calculated with respect to the base month, by making use of the updated vi ;
• The above three steps are repeated until December of the current year;
• The base month is shifted to December of the current year and the above procedure is re-peated in the subsequent year. The 13-month indices of each year are chained to the index of December of the previous year.
The third point ensures that the benchmark and real time indices are equal at the end of each year, so that real time indices are free of chain drift as well. This is an essential property of the method. The question is how the two price indices compare in previous months. This will be investigated in Section 5.2 for the Dutch department store.
We now describe a method for calculating the price index of a current month t. Price indices cannot be calculated directly, since the vi depend on the price indices. We propose a method that is easy to implement, which follows an iterative scheme:
1. Choose initial values Pz for the price indices from base month 0 up to month t ≥ z ≥ 0, with P0 = 1,
2. Calculate the vi for each product sold between the base month and month t by making use of product prices and quantities up to month t:
t
(7) vi = ∑φi,z pi,z
,
z=0 Pz
where
(8) φi,z = t
qi,z .
∑s=0 qi,s
3. Substitute the vi obtained in step 2 into expression (1) and calculate updated price indices up to month t;
4. Repeat steps 2 and 3 until the differences between the price indices obtained in the last two iterations are ‘small’, according to some pre-defined difference measure.
We conclude with the following remarks:
• The initial indices in step 1 can be chosen arbitrarily. But computation times can be reduced by choosing a constructive approach. A method for calculating initial indices is described in Chessa (2015), which has given very good approximations of the transitive benchmark indices;
• The above algorithm converges to a unique solution. Such a solution exists under mild condi-tions (Khamis (1972), p. 101)(9);
• The price indices of all previous months are re-calculated. However, the price indices of pre-vious months cannot be revised in the CPI (apart from exceptional cases). This means that
(9) Translated into CPI practice, this boils down to checking each month whether a product exists that has been sold both in the current month and in one of the previous months. If this is not the case, then the price index of the consumption segment will be imputed in the current month (e.g., from the corresponding ECOICOP).
A new methodology for processing scanner data in the Dutch CPI
EURONA — Eurostat Review on National Accounts and Macroeconomic Indicators60
2only the price index for the current month will be retained from the calculations, which itself will not be modified in successive months.
5. Results and discussion of some issues
5.1. Contribution of new productsOne of the targets in the quest for a more generic index method is the processing of com-plete data sets. This involves direct inclusion of new products into the index calculations. This section gives an example that shows the extent to which new products may contribute to a price index. QU-GK indices are compared to a direct bilateral index, in which new products are included only in next year’s base month.
The bilateral index follows from the QU-GK index with the vi calculated from prices and quanti-ties of the base month 0 (December of each year) and current month t. Solving (1), (5) and (6) gives the following expression:
(9) Pt = ∑iЄG0
Gtpi,t h(qi,0,qi,t) ,
∑iЄG0 Gt
pi,0 h(qi,0,qi,t)
where h is the harmonic mean of the quantities sold in the two months (see also Khamis (1972), p. 102).
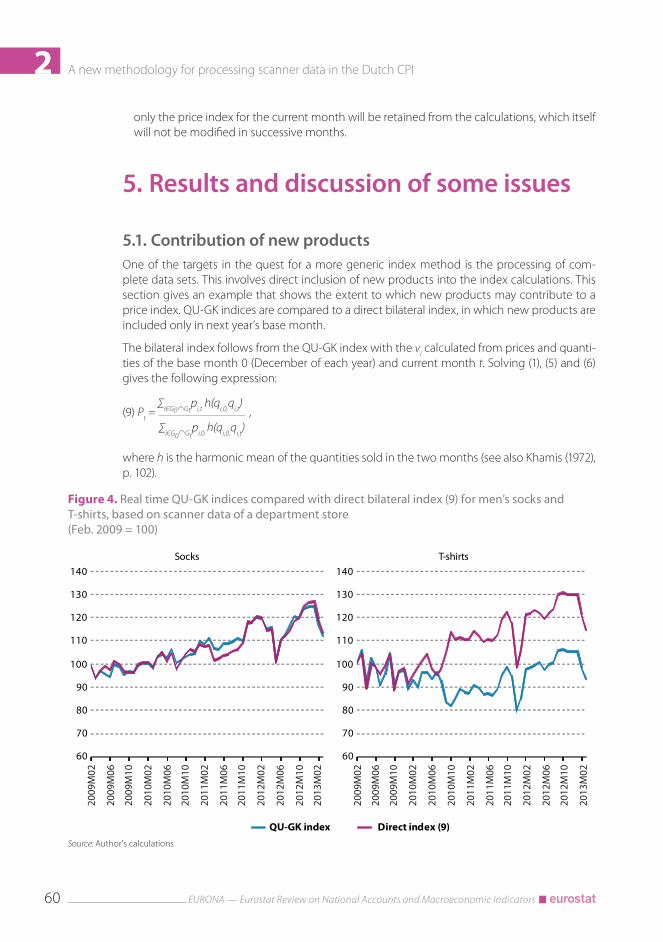
Figure 4. Real time QU-GK indices compared with direct bilateral index (9) for men’s socks and T-shirts, based on scanner data of a department store (Feb. 2009 = 100)
60
70
80
90
100
110
120
130
140Socks
60
70
80
90
100
110
120
130
140T-shirts
QU-GK index Direct index (9)
2009
M02
2009
M06
2009
M10
2010
M02
2010
M06
2010
M10
2011
M02
2011
M06
2011
M10
2012
M02
2012
M06
2012
M10
2013
M02
2009
M02
2009
M06
2009
M10
2010
M02
2010
M06
2010
M10
2011
M02
2011
M06
2011
M10
2012
M02
2012
M06
2012
M10
2013
M02
Source: Author's calculations
CC
A new methodology for processing scanner data in the Dutch CPI
EURONA — Eurostat Review on National Accounts and Macroeconomic Indicators 61
2Figure 4 compares the QU-GK index with direct index (9) for men’s socks and T-shirts (10). The results show large differences for T-shirts. The direct index does not capture the contribution from new products to price change in the year of introduction into the assortment. New types of T-shirts, made of organic cotton, were introduced in 2010 at high initial prices, which started to decrease after a few months. This price decrease is captured by the QU-GK index. The direct index only evidences the price behaviour of the existing part of the assortment, which, in con-trast to the new items, mainly shows a price increase in 2010.
The examples show that it is important to have an index method in which not only existing items enter the calculations, but in which also new items are timely included. This means that the vi should be calculated for new products as soon as these appear in an assortment (11).
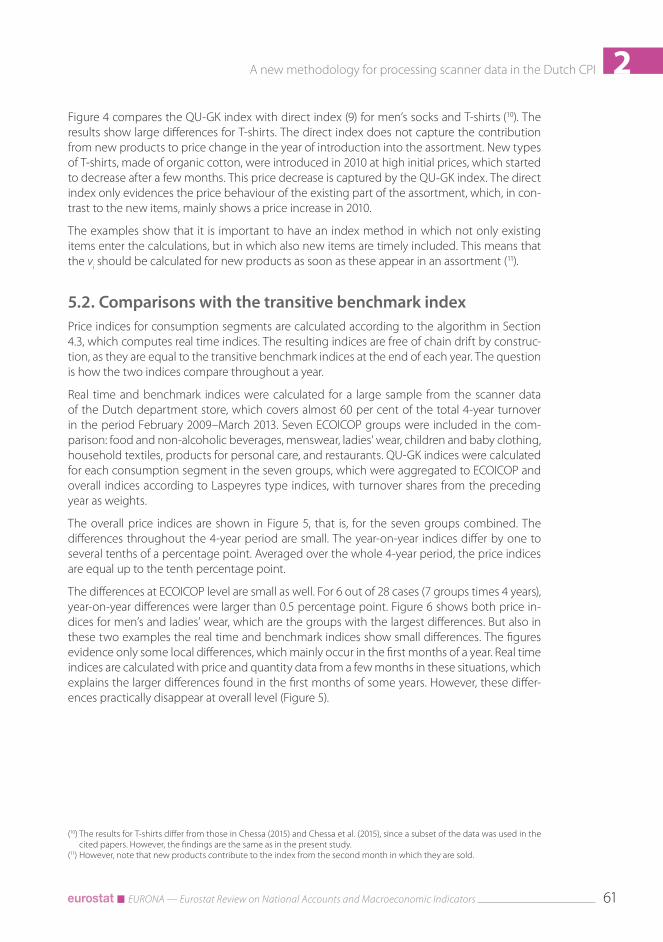
5.2. Comparisons with the transitive benchmark indexPrice indices for consumption segments are calculated according to the algorithm in Section 4.3, which computes real time indices. The resulting indices are free of chain drift by construc-tion, as they are equal to the transitive benchmark indices at the end of each year. The question is how the two indices compare throughout a year.
Real time and benchmark indices were calculated for a large sample from the scanner data of the Dutch department store, which covers almost 60 per cent of the total 4-year turnover in the period February 2009–March 2013. Seven ECOICOP groups were included in the com-parison: food and non-alcoholic beverages, menswear, ladies’ wear, children and baby clothing, household textiles, products for personal care, and restaurants. QU-GK indices were calculated for each consumption segment in the seven groups, which were aggregated to ECOICOP and overall indices according to Laspeyres type indices, with turnover shares from the preceding year as weights.
The overall price indices are shown in Figure 5, that is, for the seven groups combined. The differences throughout the 4-year period are small. The year-on-year indices differ by one to several tenths of a percentage point. Averaged over the whole 4-year period, the price indices are equal up to the tenth percentage point.
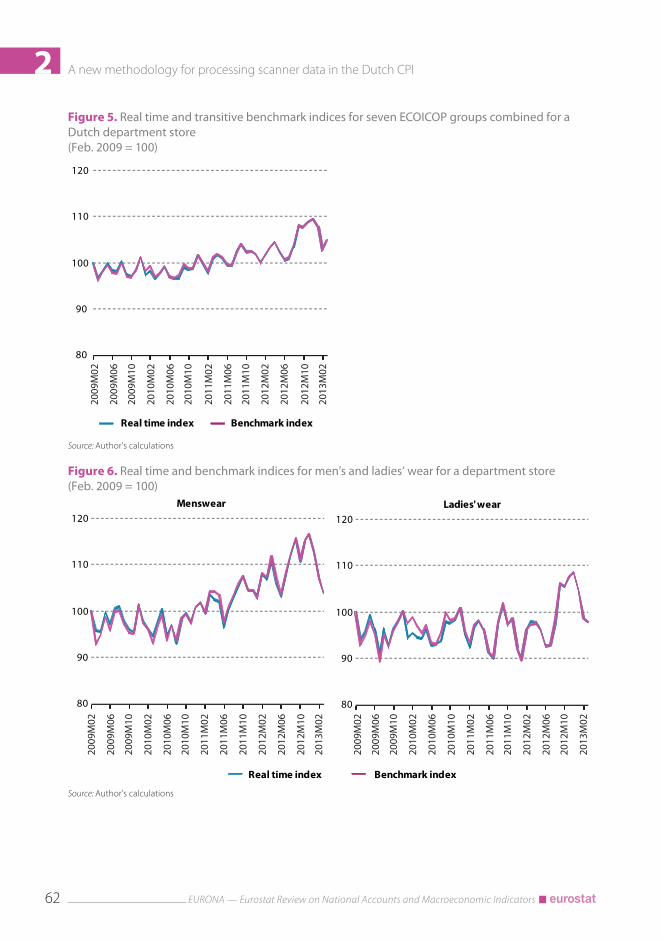
The differences at ECOICOP level are small as well. For 6 out of 28 cases (7 groups times 4 years), year-on-year differences were larger than 0.5 percentage point. Figure 6 shows both price in-dices for men’s and ladies’ wear, which are the groups with the largest differences. But also in these two examples the real time and benchmark indices show small differences. The figures evidence only some local differences, which mainly occur in the first months of a year. Real time indices are calculated with price and quantity data from a few months in these situations, which explains the larger differences found in the first months of some years. However, these differ-ences practically disappear at overall level (Figure 5).
(10) The results for T-shirts differ from those in Chessa (2015) and Chessa et al. (2015), since a subset of the data was used in the cited papers. However, the findings are the same as in the present study.
(11) However, note that new products contribute to the index from the second month in which they are sold.
A new methodology for processing scanner data in the Dutch CPI
EURONA — Eurostat Review on National Accounts and Macroeconomic Indicators62
2Figure 5. Real time and transitive benchmark indices for seven ECOICOP groups combined for a Dutch department store (Feb. 2009 = 100)
80
90
100
110
120
2009
M02
2009
M06
2009
M10
2010
M02
2010
M06
2010
M10
2011
M02
2011
M06
2011
M10
2012
M02
2012
M06
2012
M10
2013
M02
Real time index Benchmark index
Source: Author's calculations
Figure 6. Real time and benchmark indices for men’s and ladies’ wear for a department store (Feb. 2009 = 100)
80
90
100
110
120Menswear
80
90
100
110
120Ladies' wear
2009
M02
2009
M06
2009
M10
2010
M02
2010
M06
2010
M10
2011
M02
2011
M06
2011
M10
2012
M02
2012
M06
2012
M10
2013
M02
2009
M02
2009
M06
2009
M10
2010
M02
2010
M06
2010
M10
2011
M02
2011
M06
2011
M10
2012
M02
2012
M06
2012
M10
2013
M02
Real time index Benchmark index
Source: Author's calculations
A new methodology for processing scanner data in the Dutch CPI
EURONA — Eurostat Review on National Accounts and Macroeconomic Indicators 63
25.3. The impact of weighting in the quantity weightsThe GK-method has been the subject of some debate because of the use of quantity shares as weights in the vi. International reference prices of commodities (i.e. the vi, with time replaced by country) will be influenced most by the prices of larger countries. If the larger countries exhibit higher prices than the other countries in the comparison, then the reference prices are felt to contradict with economic theory, as consumers tend to buy more of some good when prices decrease (Balk (1996), Hill (1997), Diewert (2011)). This so-called ‘substitution bias’ is considered to be a potential problem for all average price methods.
The question is to what extent this bias plays a role in the time domain. This section presents an empirical study, which is aimed at quantifying the impact of different weighting schemes in the quantity weights on the price index (12). The QU-GK method is compared with two variants of the QU-method:
• In the first variant, the deflated prices are weighted according to a month’s share in the sum of turnover shares of a product over different months. We refer to this variant as the ‘QU-TS method’;
• In the second variant, each month receives equal weight. This variant will be referred to as the ‘QU-EW method’.
The first variant was proposed by Hill (2000) as an alternative to the GK-method in international price comparisons. If we denote the turnover share of product i in month t by wi,t, then the weights of the deflated prices in the vi become:
(10) φi,z = t
wi,z ,
∑s=0 wi,s
where t ≥ z ≥ 0 denotes the current month. Expression (10) is used in the calculation of real time indices, which replaces expression (8) in the algorithm of Section 4.3 (13).
The second variant applies the following weighting in the vi:
(11) φi,z = t
δi,z ,
∑s=0 δi,s
where δi,z = 1 if qi,t > 0, and δi,t = 0 otherwise. In other words, deflated prices in months with sales receive the same weight.
At first sight, it might seem odd to ignore the actual sales figures in the quantity weights and only include the information whether a product has been sold or not in a month. However, a deeper analysis shows that weighting scheme (11) leads to an interesting variant of the QU-method: under certain conditions, the price index in the bilateral case is equal to the Fisher index (14). For this observation alone it is interesting to include the second variant in the com-parison. But also because weighting scheme (11) may lead to completely different weights com-
(12) Chessa (2015) investigated non-linear forms for the vi. The price indices hardly differ from the QU-GK method.(13) It should be noted that summing turnover shares over different time periods is not allowed from the viewpoint of the theory
of measurement scales. Shares in different periods represent measurements from ratio scales with different scaling factors. The first variant is included in the comparison because it has been suggested as an alternative to the GK-method in PPP-studies. Turnover share based weighting is also used in other multilateral price index methods, like the time product dummy index.
(14) This holds in the situation where the turnover share of matched products is the same in both months, and in the case where the prices of all unmatched products are imputed. The general expression of the index formula is more complex. Details are left out in this study.
A new methodology for processing scanner data in the Dutch CPI
EURONA — Eurostat Review on National Accounts and Macroeconomic Indicators64
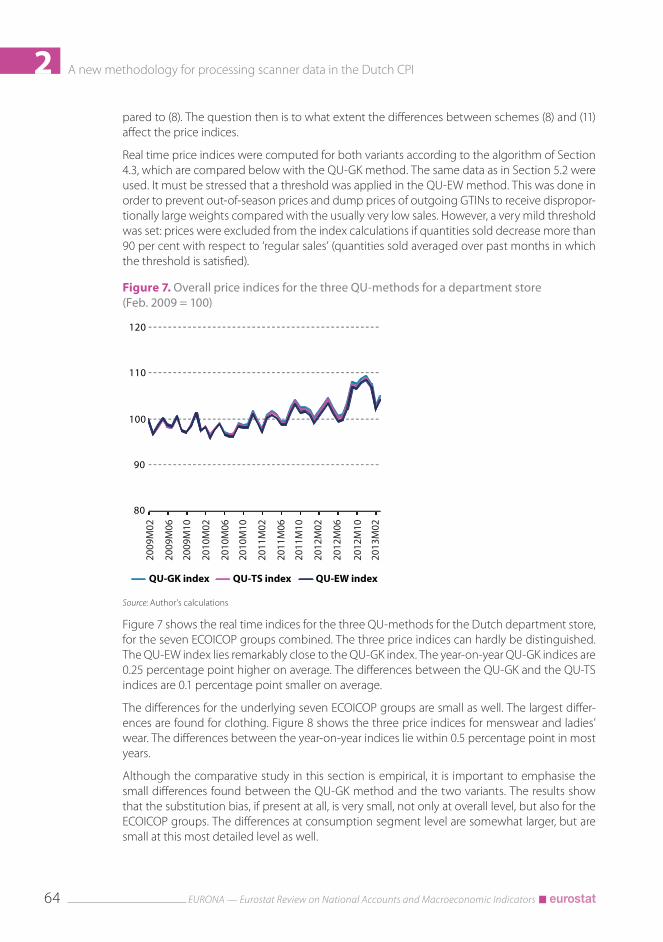
2pared to (8). The question then is to what extent the differences between schemes (8) and (11) affect the price indices.
Real time price indices were computed for both variants according to the algorithm of Section 4.3, which are compared below with the QU-GK method. The same data as in Section 5.2 were used. It must be stressed that a threshold was applied in the QU-EW method. This was done in order to prevent out-of-season prices and dump prices of outgoing GTINs to receive dispropor-tionally large weights compared with the usually very low sales. However, a very mild threshold was set: prices were excluded from the index calculations if quantities sold decrease more than 90 per cent with respect to ‘regular sales’ (quantities sold averaged over past months in which the threshold is satisfied).
Figure 7. Overall price indices for the three QU-methods for a department store (Feb. 2009 = 100)
80
90
100
110
120
2009
M02
2009
M06
2009
M10
2010
M02
2010
M06
2010
M10
2011
M02
2011
M06
2011
M10
2012
M02
2012
M06
2012
M10
2013
M02
QU-GK index QU-TS index QU-EW index
Source: Author's calculations
Figure 7 shows the real time indices for the three QU-methods for the Dutch department store, for the seven ECOICOP groups combined. The three price indices can hardly be distinguished. The QU-EW index lies remarkably close to the QU-GK index. The year-on-year QU-GK indices are 0.25 percentage point higher on average. The differences between the QU-GK and the QU-TS indices are 0.1 percentage point smaller on average.
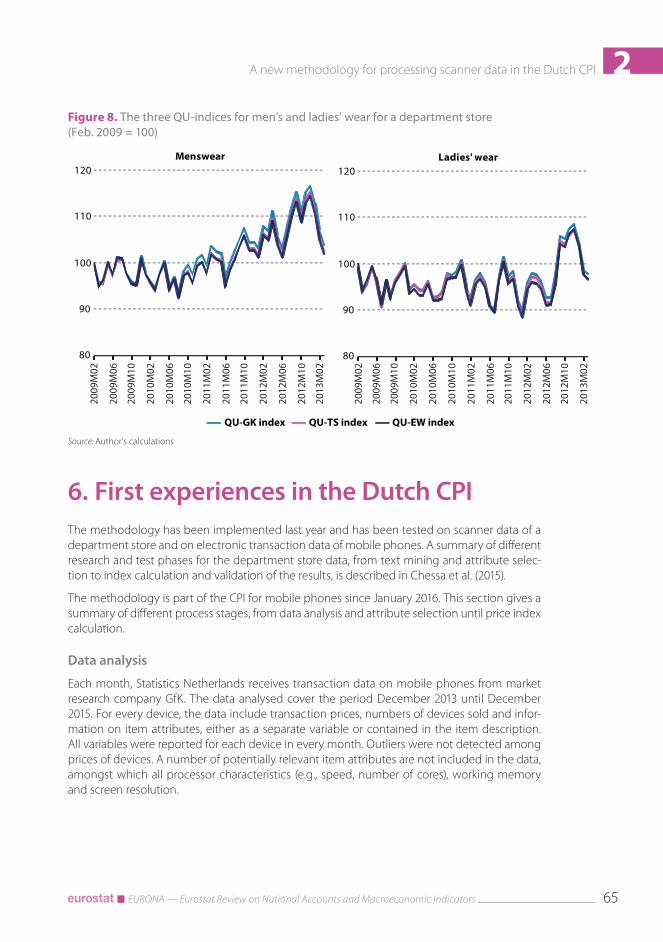
The differences for the underlying seven ECOICOP groups are small as well. The largest differ-ences are found for clothing. Figure 8 shows the three price indices for menswear and ladies’ wear. The differences between the year-on-year indices lie within 0.5 percentage point in most years.
Although the comparative study in this section is empirical, it is important to emphasise the small differences found between the QU-GK method and the two variants. The results show that the substitution bias, if present at all, is very small, not only at overall level, but also for the ECOICOP groups. The differences at consumption segment level are somewhat larger, but are small at this most detailed level as well.
A new methodology for processing scanner data in the Dutch CPI
EURONA — Eurostat Review on National Accounts and Macroeconomic Indicators 65
2Figure 8. The three QU-indices for men’s and ladies’ wear for a department store (Feb. 2009 = 100)
80
90
100
110
120Menswear
80
90
100
110
120Ladies' wear
2009
M02
2009
M06
2009
M10
2010
M02
2010
M06
2010
M10
2011
M02
2011
M06
2011
M10
2012
M02
2012
M06
2012
M10
2013
M02
2009
M02
2009
M06
2009
M10
2010
M02
2010
M06
2010
M10
2011
M02
2011
M06
2011
M10
2012
M02
2012
M06
2012
M10
2013
M02
QU-GK index QU-TS index QU-EW index
Source: Author's calculations
6. First experiences in the Dutch CPIThe methodology has been implemented last year and has been tested on scanner data of a department store and on electronic transaction data of mobile phones. A summary of different research and test phases for the department store data, from text mining and attribute selec-tion to index calculation and validation of the results, is described in Chessa et al. (2015).
The methodology is part of the CPI for mobile phones since January 2016. This section gives a summary of different process stages, from data analysis and attribute selection until price index calculation.
Data analysis
Each month, Statistics Netherlands receives transaction data on mobile phones from market research company GfK. The data analysed cover the period December 2013 until December 2015. For every device, the data include transaction prices, numbers of devices sold and infor-mation on item attributes, either as a separate variable or contained in the item description. All variables were reported for each device in every month. Outliers were not detected among prices of devices. A number of potentially relevant item attributes are not included in the data, amongst which all processor characteristics (e.g., speed, number of cores), working memory and screen resolution.
A new methodology for processing scanner data in the Dutch CPI
EURONA — Eurostat Review on National Accounts and Macroeconomic Indicators66
2Attribute selection and homogeneous products
Additional attributes were collected from a web site for a smaller set of 70 devices, which to-gether cover about 75 % of the 2-year turnover. The attributes were analysed by applying a sensitivity analysis as described in Section 3. The first step in this analysis was to quantify the impact of each attribute separately on the unit value index. Next, the most influential attribute was selected and others were added in order to quantify their additional contribution to the year-on-year index. Five attributes completely determine the index. Most attributes seem to be correlated, in the sense that, for instance, devices with a higher screen resolution usually have a more powerful processor.
From the set of 5 attributes, Near Field Communication was left out since paying by smart-phone is still in a pilot phase in the Netherlands. This may change in the coming years, in which case NFC could be added as a relevant attribute. Long Term Evolution (LTE/4G) adds less than 0.01 percentage point to the year-on-year index, so that LTE was omitted as well. Moreover, the majority of the smartphones is currently equipped with LTE. This share is still growing, so we do not expect this attribute to contribute much to product differentiation.
Three attributes were eventually selected: brand, internal storage capacity and ‘performance’. The latter is measured by a benchmark test score (15), which indicates how different compo-nents of a device act together when performing CPU and GPU tasks (processor type/model, number of cores, working memory). Benchmark scores are obviously not included in the data, so we collected scores from the internet. This has been done for more than 130 devices, which cover 88 per cent of the total 2-year turnover. Benchmark scores are subdivided into three per-formance segments (high, medium and lower performing devices). Refinements to 4 or 5 seg-ments did not affect the price index significantly.
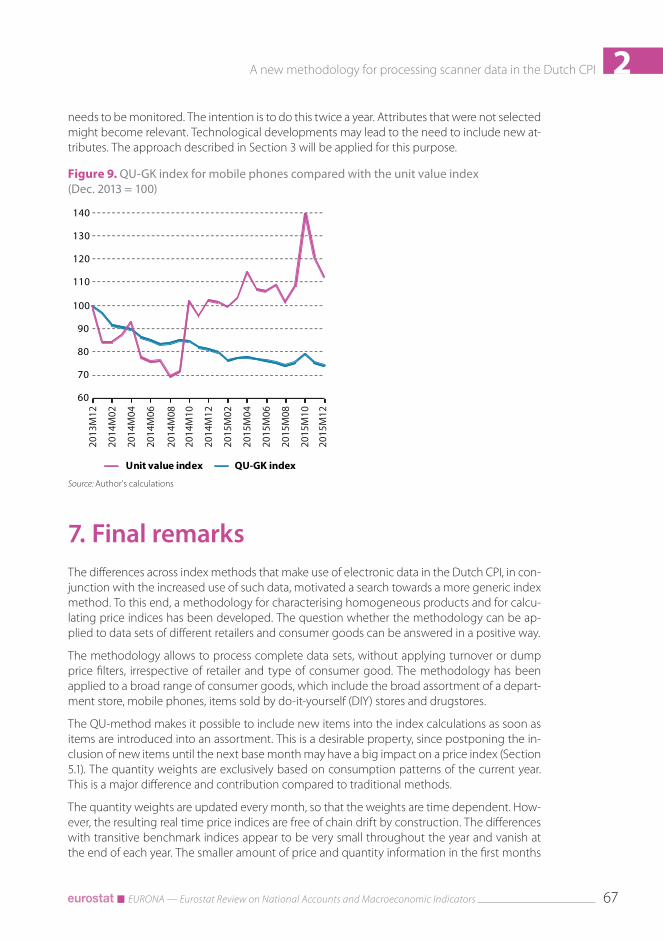
Price index
Mobile phones are defined as a consumption segment, but are also an ECOICOP subclass in the CPI. Mobile phones are differentiated into homogeneous products according to the three at-tributes mentioned above. An example of a product is a high performance, 16GB storage Apple product. This product contains the iPhones 5s, 6 and 6s. Another example is a medium perfor-mance, 16GB storage Samsung product, which contains the devices Galaxy S5 Mini, S3 and S4.
Figure 9 shows the real time QU-GK index for mobile phones, which is compared with the unit value index. The unit value index strongly deviates from the price index. Its volatile behaviour can be explained to a large extent by the introduction of new high-end devices. For instance, the introduction of the iPhone 6 in October 2014 and the iPhone 6s in October 2015 can be easily singled out. The price index lies above the unit value index before the introduction of the iPhone 6. This means that the consumption pattern initially shifted towards devices of lower quality. The introduction of the iPhones 6 and 6s attracted many consumers, which led to shifts towards higher quality devices. The quality-adjustment term of the QU-index, that is, the de-nominator of expression (2), can be used to quantify these shifts. The quality-adjustment term becomes greater than 1 in October 2014 and increases afterwards, as can be seen as well in Figure 9.
In order to carry out the monthly index calculations, benchmark scores for new devices have to be collected first (this requires a small amount of time). In addition to this, the set of attributes
(15) The benchmark Geekbench is used, which is developed by Primate Labs. Geekbench is widely used for testing smartphones and notebooks, and test scores are reported in reviews. Benchmark scores can be found on https://www.primatelabs.com/ and http://www.notebookcheck.net/
A new methodology for processing scanner data in the Dutch CPI
EURONA — Eurostat Review on National Accounts and Macroeconomic Indicators 67
2needs to be monitored. The intention is to do this twice a year. Attributes that were not selected might become relevant. Technological developments may lead to the need to include new at-tributes. The approach described in Section 3 will be applied for this purpose.
Figure 9. QU-GK index for mobile phones compared with the unit value index (Dec. 2013 = 100)
60
70
80
90
100
110
120
130
140
2013
M12
2014
M02
2014
M04
2014
M06
2014
M08
2014
M10
2014
M12
2015
M02
2015
M04
2015
M06
2015
M08
2015
M10
2015
M12
QU-GK indexUnit value index
Source: Author's calculations
7. Final remarksThe differences across index methods that make use of electronic data in the Dutch CPI, in con-junction with the increased use of such data, motivated a search towards a more generic index method. To this end, a methodology for characterising homogeneous products and for calcu-lating price indices has been developed. The question whether the methodology can be ap-plied to data sets of different retailers and consumer goods can be answered in a positive way.
The methodology allows to process complete data sets, without applying turnover or dump price filters, irrespective of retailer and type of consumer good. The methodology has been applied to a broad range of consumer goods, which include the broad assortment of a depart-ment store, mobile phones, items sold by do-it-yourself (DIY) stores and drugstores.
The QU-method makes it possible to include new items into the index calculations as soon as items are introduced into an assortment. This is a desirable property, since postponing the in-clusion of new items until the next base month may have a big impact on a price index (Section 5.1). The quantity weights are exclusively based on consumption patterns of the current year. This is a major difference and contribution compared to traditional methods.
The quantity weights are updated every month, so that the weights are time dependent. How-ever, the resulting real time price indices are free of chain drift by construction. The differences with transitive benchmark indices appear to be very small throughout the year and vanish at the end of each year. The smaller amount of price and quantity information in the first months
A new methodology for processing scanner data in the Dutch CPI
EURONA — Eurostat Review on National Accounts and Macroeconomic Indicators68
2of a year does not seem to be an issue. Also a recent study hardly showed any difference be-tween the real time and benchmark indices for drugstore scanner data (Chessa (forthcoming)). The index method of Section 4.3 thus seems to be an adequate updating method.
The empirical study of Section 5.3 suggests that the possible impact of the substitution bias is very small or can even be ignored (see also Chessa (forthcoming)). One of the two variants of the QU-GK method turned out to be very interesting, which is the one with equal weights applied to the deflated prices. The price indices for this variant show small differences with the QU-GK indices. This is an intriguing result, which deserves further study.
The comparable results obtained for the equal weights variant may reveal to be a very useful finding in view of the rapidly increasing popularity of using web scraped internet prices in price index methods (Griffioen and ten Bosch, 2016), because quantities sold are not available. This makes the QU-EW variant an interesting method for future studies with internet prices.
Application of the QU-GK method to the department store scanner data in the CPI is expected to be realised within several months. Application of the methodology to other scanner data sets is being investigated, in particular for DIY-stores. A test data set containing SKUs and infor-mation about additional attributes for paint and electrical equipment has been analysed. The use of SKUs for linking GTINs looks promising.
A study that compares the QU-GK method with the current method for supermarket scanner data and a comparative study that involves different methods for consumer electronics are planned at a later stage. These studies are part of a 4-year research programme at Statistics Netherlands (de Haan et al. (2016)).
AcknowledgmentsThe author wants to thank two anonymous reviewers for their valuable comments and his col-leagues at Statistics Netherlands for the many discussions. The views expressed in this paper are those of the author and do not necessarily reflect the policies of Statistics Netherlands.
ReferencesAuer, L. von (2014), ‘The generalized unit value index family’, Review of Income and Wealth, 60, pp. 843–861
Balk, B.M. (1996), ‘A comparison of ten methods for multilateral international price and volume comparison’, Journal of Official Statistics, 12, pp. 199–222.
Balk, B.M. (2001), ‘Aggregation methods in international comparisons: What have we learned?’, Paper originally prepared for the Joint World Bank — OECD Seminar on Purchasing Power Pari-ties, 30 January–2 February 2001, Washington DC, USA.
Balk, B.M. (2012), Price and Quantity Index Numbers: Models for Measuring Aggregate Change and Difference, Cambridge University Press, UK.
Chessa, A.G. (2013), ‘Comparing scanner data and survey data for measuring price change of drugstore articles’, Paper presented at the Workshop on Scanner Data for HICP, 26–27 Septem-ber 2013, Lisbon, Portugal.
A new methodology for processing scanner data in the Dutch CPI
EURONA — Eurostat Review on National Accounts and Macroeconomic Indicators 69
2Chessa, A.G. (2015), ‘Towards a generic price index method for scanner data in the Dutch CPI’, Room document for the Ottawa Group Meeting, 20–22 May 2015, Urayasu City, Japan.
Chessa, A.G. (forthcoming), ‘The QU-method: A new methodology for processing scanner data’, to appear in the Proceedings of Statistics Canada 2016 International Methodology Symposium.
Chessa, A.G., Boumans, S., and Walschots, J. (2015), ‘Towards a new methodology for processing scanner data in the Dutch CPI’, Paper presented at the Workshop on Scanner Data, 1–2 October 2015, Rome, Italy.
Diewert, W.E. (2011), ‘Methods of aggregation above the basic heading level within regions’, Chapter 5 in Measuring the Real Size of the World Economy, ICP Book, World Bank, Washington DC, USA.
Geary, R. C. (1958), ‘A note on the comparison of exchange rates and purchasing power between countries’, Journal of the Royal Statistical Society A, 121, pp. 97–99.
Grient, H.A., van der and de Haan (2010), ‘The use of supermarket scanner data in the Dutch CPI’, Paper presented at the Joint ECE/ILO Workshop on Scanner Data, 10 May 2010, Geneva, Switzerland.
Griffioen, R., and ten Bosch, O. (2016), ‘On the use of Internet data for the Dutch CPI’, Paper presented at the Meeting of the Group of Experts on Consumer Price Indices, 2–4 May 2016, Geneva, Switzerland.
Haan, J. de (2006), ‘The re-design of the Dutch CPI’, Statistical Journal of the United Nations Eco-nomic Commission for Europe, 23, pp. 101–118.
Haan, J., de and van der Grient, H.A. (2011), ‘Eliminating chain drift in price indexes based on scanner data’, Journal of Econometrics, 161, pp. 36–46.
Haan, J. de, Willenborg, L., and Chessa, A.G. (2016), ‘An overview of price index methods for scan-ner data’, Room document for the Meeting of the Group of Experts on Consumer Price Indices, 2–4 May 2016, Geneva, Switzerland.
Hill, R.J. (1997), ‘A taxonomy of multilateral methods for making international comparisons of prices and quantities’, Review of Income and Wealth, 43, pp. 49–69.
Hill, R.J. (2000), ‘Measuring substitution bias in international comparisons based on additive pur-chasing power parity methods’, European Economic Review, 44, pp. 145–162.
Khamis, S. H. (1972), ‘A new system of index numbers for national and international purposes’, Journal of the Royal Statistical Society A, 135, pp. 96–121.
Krsinich, F. (2014), ‘The FEWS Index: Fixed Effects with a Window Splice — Non-revisable quality-adjusted price indexes with no characteristic information’, Paper presented at the Meeting of the Group of Experts on Consumer Price Indices, 26–28 May 2014, Geneva, Switzerland.
Silver, M. (2010), ‘The wrongs and rights of unit value indices’, Review of Income and Wealth, 56 , pp. S206–S223.
Walschots, J. (2016), ‘Fifteen years of progress in the collection of prices data in the Netherlands’, Paper presented at the Meeting of the Group of Experts on Consumer Price Indices, 2–4 May 2016, Geneva, Switzerland.


![Programming Methodology (1). import java.util.*; public class FindCost3 { public static void main(String[] args ) { Scanner sc = new Scanner(System.in);](https://img.pdfslide.us/doc/110x75/56649e715503460f94b7010d/programming-methodology-1-import-javautil-public-class-findcost3-public.jpg)