Embed Size (px)
Citation preview
Technical Report Documentation Page 1. Report No.
FHWA/TX-11/9-1526-1 2. Government Accession No.
3. Recipient’s Catalog No.
4. Title and Subtitle Fatigue Life of Steel Base Plate to Pole Connections for Traffic Structures
5. Report Date January 2011; Revised July 2011
6. Performing Organization Code
7. Author(s) Andrew Stam, Nicholas Richman, Charles Pool, Craig Rios, Thomas Anderson, and Karl Frank
8. Performing Organization Report No. 9-1526-1
9. Performing Organization Name and Address Center for Transportation Research The University of Texas at Austin 1616 Guadalupe, Suite 4.202 Austin, TX 78701
10. Work Unit No. (TRAIS) 11. Contract or Grant No.
9-1526
12. Sponsoring Agency Name and Address Texas Department of Transportation Research and Technology Implementation Office P.O. Box 5080 Austin, TX 78763-5080
13. Type of Report and Period Covered Technical Report November 2005–August 2009
14. Sponsoring Agency Code
15. Supplementary Notes Project performed in cooperation with the Texas Department of Transportation with additional pooled funding from Iowa, Colorado, Wyoming, California, South Dakota, North Carolina, Minnesota, Wisconsin, and Pennsylvania DOTs.
16. Abstract This is a final report of an extensive experimental and analytical examination of the fatigue behavior of the welded end connection used on high-mast light structures and traffic signal masts. The weld details commonly used for these connections produce very poor fatigue performance. Their performance is a function of base plate stiffness, weld type and geometry, and number of anchor bolts. Older connection designs produced very poor fatigue performance far below the lowest AASHTO fatigue category. These connections can be improved by increasing the base or end plate thickness, improving weld details, and other geometric considerations. Due to the interaction of the overall connection geometry upon fatigue performance, the fatigue performance of the connection cannot be classified by simply the type of connection. The fatigue life can be improved to fatigue performance comparable to Category B but a similar connection with a thinner base plate can produce fatigue life of Category E. Recommended connections and their corresponding fatigue strength are given as well as recommended fabrication and welding specifications.
17. Key Words Fatigue, high-mast lighting, signal mast arms, stress concentrations, welding
18. Distribution Statement No restrictions. This document is available to the public through the National Technical Information Service, Springfield, Virginia 22161; www.ntis.gov.
19. Security Classif. (of report) Unclassified
20. Security Classif. (of this page) Unclassified
21. No. of pages 164
22. Price
Form DOT F 1700.7 (8-72) Reproduction of completed page authorized

Fatigue Life of Steel Base Plate to Pole Connections for Traffic Structures Andrew Stam Nicholas Richman Charles Pool Craig Rios Thomas Anderson Karl Frank CTR Technical Report: 9-1526-1 Report Date: January 2011; Revised July 2011 Project: 9-1526 Project Title: Investigation of the Fatigue Life of Steel Base Plate to Pole Connections for
Traffic Structures Sponsoring Agency: Texas Department of Transportation with additional pooled funding from
Iowa, Colorado, Wyoming, California, South Dakota, North Carolina, Minnesota, Wisconsin, and Pennsylvania DOTs
Performing Agency: Center for Transportation Research at The University of Texas at Austin Project performed in cooperation with the Texas Department of Transportation and the Federal Highway Administration.
Center for Transportation Research The University of Texas at Austin 1616 Guadalupe, Suite 4.202 Austin, TX 78701 www.utexas.edu/research/ctr Copyright (c) 2011 Center for Transportation Research The University of Texas at Austin All rights reserved Printed in the United States of America
v
Disclaimers Author's Disclaimer: The contents of this report reflect the views of the authors, who
are responsible for the facts and the accuracy of the data presented herein. The contents do not necessarily reflect the official view or policies of the Federal Highway Administration or the Texas Department of Transportation (TxDOT). This report does not constitute a standard, specification, or regulation.
Patent Disclaimer: There was no invention or discovery conceived or first actually reduced to practice in the course of or under this contract, including any art, method, process, machine manufacture, design or composition of matter, or any new useful improvement thereof, or any variety of plant, which is or may be patentable under the patent laws of the United States of America or any foreign country.
Engineering Disclaimer
NOT INTENDED FOR CONSTRUCTION, BIDDING, OR PERMIT PURPOSES.
Project Engineer: Dr. Karl Frank Professional Engineer License State and Number: Texas No. 48953
P. E. Designation: Research Supervisor
vi
Acknowledgments
The many suggestions and interactions of the project advisory committee during the performance of the project were extremely helpful and appreciated by the authors. Their input guided the selection of the details and geometries included in the test program. The project director was Timothy Bradberry from Texas DOT. The project advisory committee member from the sponsoring states were Stanley Johnson from California DOT, Bruce Brakke and Mike Todsen from Iowa DOT, Richard Osmun from Colorado DOT, Thomas Merritt from Minnesota DOT, Tom Koch from North Carolina DOT, Kent Bahler from Wisconsin DOT, Gregg Fredrick from Wyoming DOT, Gary Gordon from Pennsylvania DOT, and Steve Johnson from South Dakota DOT. The help of Carl Macchietto of Valmont Industries was crucial to the success of the project. He provided a fabricator insight into the design of the connections and was very helpful in getting the specimens fabricated. Kasey Scott from Pelco Products also assisted in the design and supply of the test specimens.
vii
Table of Contents
Chapter 1. Introduction................................................................................................................ 1 1.1 Typical Base Plate to Shaft Connections ...............................................................................1 1.2 Base Plate to Foundation or Mast Bolted Connection ...........................................................3 1.3 Base or End Plate Thickness ..................................................................................................5 1.4 Manufacturer ..........................................................................................................................6
1.4.1 Pelco ............................................................................................................................... 6 1.4.2 Ameron and Union Metal .............................................................................................. 6 1.4.3 Valmont .......................................................................................................................... 6
1.5 Nomenclature .........................................................................................................................6 1.6 Report Organization ...............................................................................................................7
Chapter 2. Test Setup and Experimental Procedure ................................................................. 9 2.1 Introduction ............................................................................................................................9 2.2 Test Setup ..............................................................................................................................9
2.2.1 Load Box and Connection ........................................................................................... 12 2.2.2 Hydraulic and Control Systems ................................................................................... 13
2.3 Testing Procedure ................................................................................................................14 2.3.1 Measurement and Inspection ....................................................................................... 14 2.3.2 Installation Procedure .................................................................................................. 14 2.3.3 Testing Loads and Displacements ............................................................................... 15
Chapter 3. Mast Arm Experimental Test Results and Observations .................................... 17 3.1 Fatigue Life Coefficient and AASHTO Fatigue Categories ................................................17 3.2 Fatigue Test Results .............................................................................................................18 3.3 Typical Failures ...................................................................................................................19
3.3.1 Full Penetration ............................................................................................................ 19 3.3.2 External Collar ............................................................................................................. 23
3.4 Results and Observations .....................................................................................................26 3.4.1 Comparison of Octagonal and Round Mast Arms ....................................................... 26 3.4.2 Comparison of Base Plate Geometry ........................................................................... 28 3.4.3 Comparison of External Collar and Full Penetration Details ...................................... 30 3.4.4 Base Plate Thickness .................................................................................................... 31 3.4.5 Mast Arm Diameter ..................................................................................................... 33 3.4.6 Backing Ring Welds on Full Penetration Details ........................................................ 37
3.5 Comparison of Manufacturers .............................................................................................41 3.5.1 Comparison of Black, Galvanized, and Peened Specimens ........................................ 42
3.6 Summary of Observations ...................................................................................................44
Chapter 4. Results from Analytical Parametric Evaluations of Mast Arm Connection ................................................................................................................................... 45
4.1 Nomenclature Used in Parametric Evaluations ...................................................................45 4.2 Results of Analytical Models ...............................................................................................45 4.3 Full Penetration Weld Connection Stiffness ........................................................................46
4.3.1 Base Plate Thickness .................................................................................................... 47 4.3.2 Mast arm Diameter ...................................................................................................... 51
viii
4.3.3 Mast Arm Shape .......................................................................................................... 53 4.3.4 Base Plate Geometry .................................................................................................... 55 4.3.5 Size of the Base Plate Hole in a Full Penetration Connection ..................................... 57 4.3.6 Base Plate Stiffness ...................................................................................................... 57
4.4 Failure Location ...................................................................................................................62 4.4.1 Presence of Backing Ring Fillet Welds ....................................................................... 62 4.4.2 External Collar Base Plate Evaluation ......................................................................... 63 4.4.3 Effect of Base Plate Stiffness on SCF for Hot Spots Away From Base Plate ............. 67
4.5 Evaluation of Fatigue Life Using Hot Spot Stress ...............................................................68 4.6 Summary of Results of Parametric Research ......................................................................69
Chapter 5. High-Mast Experimental Test Results and Observations .................................... 71 5.1 Introduction ..........................................................................................................................71 5.2 Fracture Locations ...............................................................................................................72 5.3 Results for Socket Details ....................................................................................................75 5.4 Results for Full Penetration Details .....................................................................................76 5.5 Results for Stool-Stiffened Details ......................................................................................78 5.6 Results Summary and Discussion ........................................................................................79
5.6.1 Phase I and II Socket Details ....................................................................................... 81 5.6.2 Phase I and II Full Penetration Details ........................................................................ 82 5.6.3 Phase I and II Stool Details .......................................................................................... 83
Chapter 6. Analytical Results of High-Mast Pole .................................................................... 85 6.1 Introduction ..........................................................................................................................85 6.2 Parametric Evaluations ........................................................................................................86
6.2.1 Wall Thickness and Shaft Diameter Evaluation .......................................................... 87 6.2.2 Anchor Rod Evaluation ................................................................................................ 92 6.2.3 Base Plate Inner Diameter Evaluation ......................................................................... 94 6.2.4 Collar Length Evaluation ............................................................................................. 96 6.2.5 Shaft Bend Radius Evaluation ..................................................................................... 98
6.3 Hot Spot Results for Experimental Specimens ....................................................................99
Chapter 7. Fatigue Tests and Galvanizing Cracking of Large Diameter High-mast Specimens................................................................................................................................... 103
7.1 Introduction ........................................................................................................................103 7.2 Specimens 33-3-12-TX-SG-A and 33-3-12-TX-SB-B ......................................................103
7.2.1 Ultrasonic Test Results .............................................................................................. 103 7.2.2 Fatigue Test Results ................................................................................................... 105 7.2.3 Destructive Test Results ............................................................................................ 108
7.3 Specimens 33-3-12-TX-VG-A and 33-3-12-TX-VG-B ....................................................113 7.3.1 Ultrasonic Test Results .............................................................................................. 114 7.3.2 Fatigue Test Results ................................................................................................... 114 7.3.3 Destructive Test Results ............................................................................................ 117
7.4 Weld Repair Specimens .....................................................................................................120 7.4.1 Ultrasonic Testing Results ......................................................................................... 120 7.4.2 Fatigue Testing Results .............................................................................................. 120
7.5 Specimens 33-3-12-TXEC-SG-A and 33-3-12-TXEC-SG-B ...........................................122 7.5.1 Ultrasonic Testing Results ......................................................................................... 122
ix
7.5.2 Fatigue Testing Results .............................................................................................. 123 7.6 Ultrasonic Testing Results Comparison ............................................................................124
7.6.1 Specimen Comparison ............................................................................................... 125 7.6.2 Detail Comparison Including TxDOT Inspections .................................................... 125
7.7 Fatigue Test Comparisons .................................................................................................127
Chapter 8. Conclusions and Design Recommendations ........................................................ 131 8.1 Conclusions ........................................................................................................................131 8.2 Fabrication and Erection Recommendations .....................................................................132
8.2.1 Fabrication Recommendations ................................................................................... 132 8.2.2 Erection Recommendations ....................................................................................... 133
8.3 Design Recommendations .................................................................................................134 8.3.1 Mast Arms .................................................................................................................. 134 8.3.2 High-mast Light Towers ............................................................................................ 136
References .................................................................................................................................. 139
Appendix A: Mast Arm Summary and Test Results ............................................................. 141
Appendix B: High-mast Test Specimen Summary ................................................................ 145
Appendix C: Recommended Changes to “AASHTO Standard Specifications for Structural Supports for Highway Signs, Luminaires, and Traffic Signals” 5th Edition ........................................................................................................................................ 147

x
xi
List of Figures
Figure 1.1: Socket Connection ........................................................................................................ 2
Figure 1.2: U Rib Stiffener and Stool Base Details ........................................................................ 3
Figure 1.3: Full Penetration Weld Detail—Texas on Right, Wyoming on Left ............................. 3
Figure 1.4: Square and Rectangular Mast Arm Base Plates ........................................................... 5
Figure 2.1: Test Setup (Rios, 2007) ................................................................................................ 9
Figure 2.2: Test Setup End Supports High-mast Test (Rios, 2007).............................................. 10
Figure 2.3: Portal Loading Frame High-mast and Mast Arm Tests ............................................. 11
Figure 2.4: MTS 55-kip Hydraulic Actuator ................................................................................ 11
Figure 2.5: Loading Box (Rios, 2007) .......................................................................................... 12
Figure 2.6: Double-Nut Connection and Nomenclature ............................................................... 13
Figure 2.7: Moment Diagram for Calculating Testing Loads (Rios, 2007) .................................. 15
Figure 3.1: Typical Weld Toe Failure of a Full Penetration Connection ..................................... 19
Figure 3.2: Cross Section of a Typical Full Penetration Connection ........................................... 20
Figure 3.3: Typical Failure at a Backing Ring Fillet Weld ........................................................... 21
Figure 3.4: An Etched Cross Section of a Full Penetration Connection with a Backing Ring Fillet Weld ................................................................................................................ 22
Figure 3.5: Typical Failure at a Backing Ring Tack Weld ........................................................... 23
Figure 3.6: Cross Section of a Tack Weld Failure ........................................................................ 23
Figure 3.7: Typical External Collar Failure .................................................................................. 24
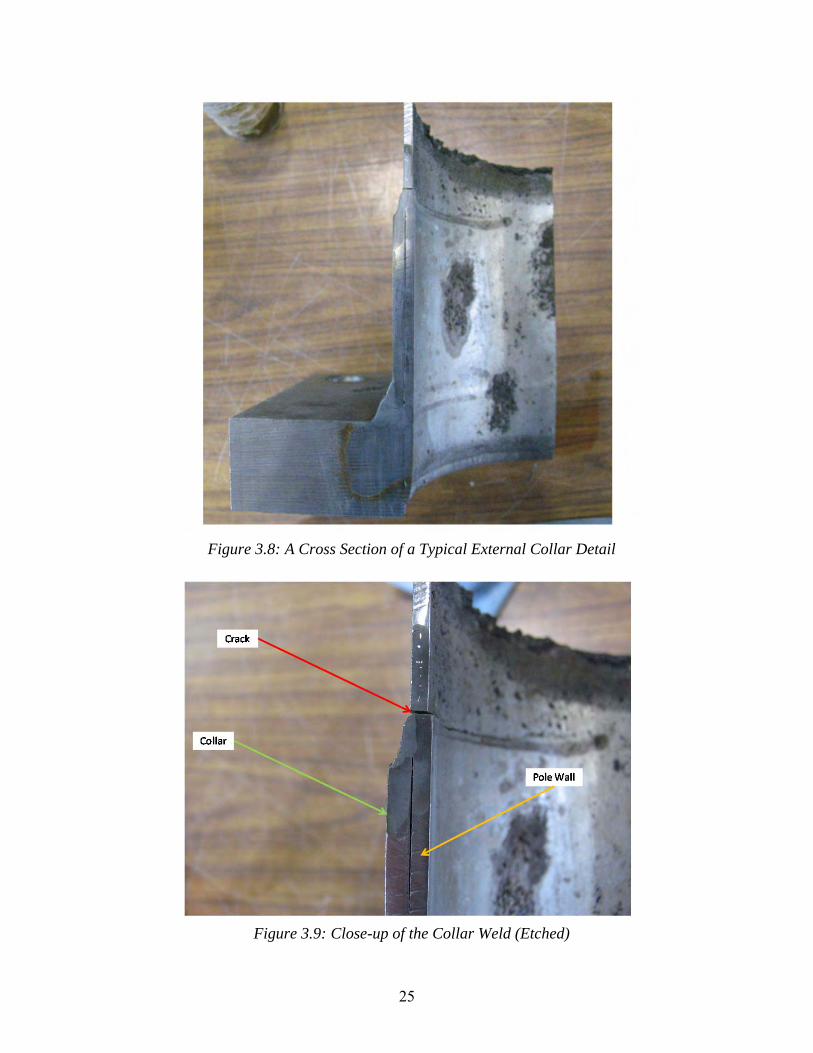
Figure 3.8: A Cross Section of a Typical External Collar Detail ................................................. 25
Figure 3.9: Close-up of the Collar Weld (Etched) ........................................................................ 25
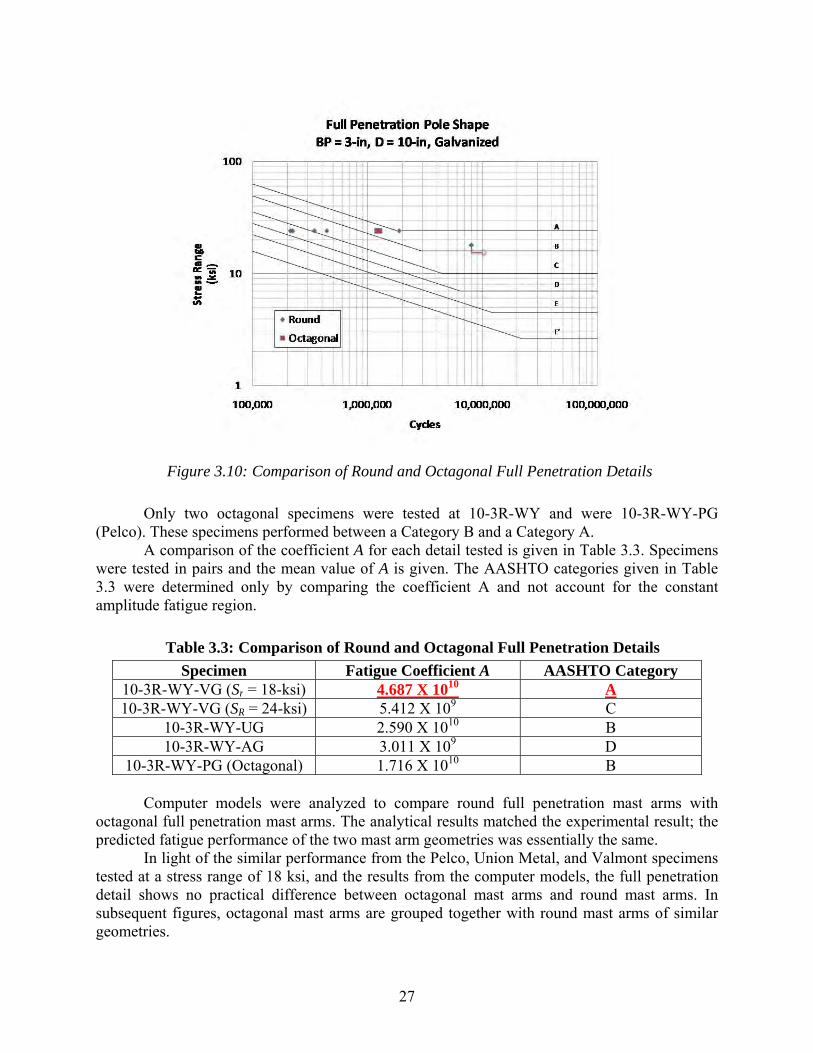
Figure 3.10: Comparison of Round and Octagonal Full Penetration Details ............................... 27
Figure 3.11: Comparison of S and SR Full Penetration Details ................................................... 28
Figure 3.12: Comparison of S and R Full Penetration Details ..................................................... 29
Figure 3.13: Comparison of Full Penetration and External Collar Details ................................... 30
Figure 3.14: Comparison of 2-in. and 3-in. Full Penetration Details ........................................... 32
Figure 3.15: Comparison of Mast arm Diameter, 2-in. Base Plate Full Penetration Details ........ 34
Figure 3.16: Comparison of Mast Arm Diameter, 3-in. Base Plate Full Penetration Details ....... 36
Figure 3.17: Comparison of Mast arm Diameter, 2-in. External Collar Details ........................... 37
Figure 3.18: Variation of Backing Ring Weld, 10-3R-WY .......................................................... 38
Figure 3.19: Variation of Backing Ring Welds, 8-2S-WY ........................................................... 40
Figure 3.20: Comparison of Manufacturers, 10-3R-WY .............................................................. 41
Figure 3.21: Comparison of Galvanized, Black, and Peened 10-3R-WY .................................... 43
Figure 4.1: Typical Through Thickness Stress Profile ................................................................. 47
Figure 4.2: 8-XR-WY (SCF versus Base Plate Thickness) .......................................................... 48
Figure 4.3: 12-XR-WY (SCF versus Base Plate Thickness) ........................................................ 49
xii
Figure 4.4: Bending of the Base Plate Connection (12-1.5R-WY) .............................................. 50
Figure 4.5: Bending in the Base Plate Connection (12-3R-WY).................................................. 51
Figure 4.6: Mast arm Diameter Evaluation (Hot Spot Stress versus Base Plate Thickness) ........ 52
Figure 4.7: Mast Arm Diameter Evaluation (SCF versus Base Plate Thickness) ........................ 52
Figure 4.8: Typical Cross Section of Octagonal Mast arm ........................................................... 53
Figure 4.9: Mast arm Shape Evaluation (SCF versus Base Plate Thickness) ............................... 54
Figure 4.10: Stress Distribution of a Typical Octagonal Mast arm (10-1.5R-WY) ..................... 55
Figure 4.11: Intermediate Base Plate Geometry ........................................................................... 56
Figure 4.12: Base Plate Geometry Evaluation (SCF) ................................................................... 56
Figure 4.13: Base Plate Hole Evaluation (SCF versus Base Plate Thickness) ............................. 57
Figure 4.14: Approximate Behavior of Base Plate ....................................................................... 58
Figure 4.15: Base Plate Moment of Inertia is Taken through the Center of the Hole .................. 59
Figure 4.16: SCF versus Base Plate Flexibility (Constant Applied Moment) .............................. 60
Figure 4.17: 10-3R-WY-FILLET Stress Distribution .................................................................. 62
Figure 4.18: 10-XR-WY-FILLET (SCF versus Base Plate Thickness) ....................................... 63
Figure 4.19: 12-XS-EC (SCF versus Base Plate Thickness) ........................................................ 64
Figure 4.20: Comparison of External Collar and Full Penetration SCF ....................................... 65
Figure 4.21: 12-1.5S-EC Stress Distribution ................................................................................ 66
Figure 4.22: 12-3S-EC Stress Distribution ................................................................................... 66
Figure 4.23: SCF versus Base Plate Flexibility for External Collar and Full Penetration with Fillet at Top of Backing Bar ..................................................................................... 67
Figure 5.1: Potential Fracture Locations and Weld Detail for Socket External Collar Connection ........................................................................................................................ 72
Figure 5.2: Base Plate Weld Fracture ........................................................................................... 73
Figure 5.3: Collar Weld Fracture .................................................................................................. 74
Figure 5.4: Stool Detail Fracture .................................................................................................. 74
Figure 5.5: Section of Valmont Socket External Collar Connection ............................................ 75
Figure 5.6: Section of Texas External Collar Connection ............................................................ 76
Figure 5.7: Section of Collar Weld in Wyoming External Collar Connection ............................. 77
Figure 5.8: Section of Stool Detail Fillet Weld ............................................................................ 78
Figure 5.9: Phase II Fatigue Test Results ..................................................................................... 79
Figure 5.10: Typical Collar Weld in Pelco SEC Connection ....................................................... 80
Figure 5.11: Socket Results for Phases I and II ............................................................................ 82
Figure 5.12: Full Penetration Results for Phases I and II ............................................................. 83
Figure 5.13: Stool Results for Phases I and II .............................................................................. 84
Figure 6.1: Analytical Model with Multiple Hot Spot Locations ................................................. 86
Figure 6.2: Connection Detail for Wall Thickness and Shaft Diameter Parametric Evaluation ......................................................................................................................... 88
xiii
Figure 6.3: Hot Spot Stresses for Socket Details in Wall Thickness and Shaft Diameter Evaluation ......................................................................................................................... 89
Figure 6.4: SCFs for Socket Details in Wall Thickness and Shaft Diameter Parametric Evaluation ......................................................................................................................... 90
Figure 6.5: Texas Connection Detail for Anchor Rod Parametric Evaluation ............................. 93
Figure 6.6: Results of Anchor Rod Parametric Evaluation ........................................................... 94
Figure 6.7: Wyoming Detail for Base Plate Inner Diameter Evaluation ...................................... 95
Figure 6.8: Results of Base Plate Inner Diameter Parametric Evaluation .................................... 96
Figure 6.9: Socket External Collar Connection Detail ................................................................. 97
Figure 6.10: Results of Collar Length Evaluation ........................................................................ 98
Figure 6.11: Results of Bend Radius Evaluation .......................................................................... 99
Figure 6.12: Experimental Fatigue Performance vs. Analytical SCF ......................................... 101
Figure 6.13: Experimental Fatigue Life vs. Hot spot Stress ....................................................... 101
Figure 7.1: TxDOT 150 foot Design........................................................................................... 104
Figure 7.2: Initial Crack Locations and Lengths in Specimens 33-3-12-TX-SG-A and 33-3-12-TX-SB-B ................................................................................................................ 105
Figure 7.3: Initial and Rotated Orientation of 33-3-12-TX-SG-A with Circled Bends Further Investigated ........................................................................................................ 106
Figure 7.4: Crack Length at Bend 5 on the Galvanized Specimen after 81,326 Cycles ............. 106
Figure 7.5: Fatigue Life of Galvanized Specimen Compared to AASHTO Fatigue Categories ....................................................................................................................... 107
Figure 7.6: View of Bend 5 after Sectioning. Length of Observed Initial Crack is Labeled ..... 109
Figure 7.7: Close-up of Fracture Surface at Bend 5 ................................................................... 110
Figure 7.8: Depth of Initial Crack at Weld Toe .......................................................................... 110
Figure 7.9: Fracture Surface at Bend 12 ..................................................................................... 111
Figure 7.10: Fatigue Cracks at Bends 8 and 9 ............................................................................ 112
Figure 7.11: Fracture Surface of Bend 8 ..................................................................................... 113
Figure 7.12: Ultrasonic Results and Initial Orientation of 33-3-12-TX-VG-A and 33-3-12-TX-VG-B ................................................................................................................... 114
Figure 7.13: Specimen 33-3-12-TX-VG-A after Fatigue Testing .............................................. 115
Figure 7.14: Fatigue Crack at Bend 8 ......................................................................................... 115
Figure 7.15: Specimen 33-3-12-TX-VG-B after Fatigue Testing .............................................. 116
Figure 7.16: S-N Plot for Samples in Initial Orientation and Flipped Orientation ..................... 117
Figure 7.17: Bend 3 of Specimen 33-3-12-TX-VG-A ................................................................ 118
Figure 7.18: Bend 3 of Specimen 33-3-12-TX-VG-A ................................................................ 118
Figure 7.19: Bend 8 of Specimen 33-3-12-TX-VG-A with Fatigue Failure through Weld ....... 119
Figure 7.20: Cross Section of Bend 8 of Specimen 33-3-12-TX-VG-A Showing Apparent Weld Defect .................................................................................................................... 120
Figure 7.21: Bend 11 of Specimen Field Repair with Failure through Weld ............................. 121
Figure 7.22: S-N Plot of Weld Repair Specimens ...................................................................... 122
xiv
Figure 7.23: Locations Inspected Using Ultrasonic Testing on External Collar Samples .......... 123
Figure 7.24: Crack Indications, Lengths, and Initial Orientation of External Collar Samples ........................................................................................................................... 123
Figure 7.25: S-N Plot of External Collar Samples ...................................................................... 124
Figure 7.26: Percentage of Cracks Found Compared to Ratio of the Volume of the Base Plate to the Volume of the Shaft ..................................................................................... 127
Figure 7.27: S-N Plot of All Specimens ..................................................................................... 128
Figure 7.28: Fatigue Results by Specimen Normalized for 12-ksi Stress Range ....................... 129
Figure 8.1: Mast Arm Fatigue Test Results—2-in. End Plates................................................... 135
Figure 8.2: Full Penetration Weld Detail .................................................................................... 135
Figure 8.3: External Sleeve Detail .............................................................................................. 137
Figure 8.4: Fatigue Performance of High-mast Details .............................................................. 138
xv
List of Tables Table 1.1: Range of Specimen Geometry ....................................................................................... 5
Table 3.1: AASHTO Fatigue Constants ....................................................................................... 17
Table 3.2: Experimental Test Data ............................................................................................... 18
Table 3.3: Comparison of Round and Octagonal Full Penetration Details ................................... 27
Table 3.4: Comparison of S and SR Full Penetration Details ....................................................... 28
Table 3.5: Comparison of S and R Full Penetration Details ......................................................... 30
Table 3.6: Comparison of Full Penetration and External Collar Details ...................................... 31
Table 3.7: Comparison of 2-in. and 3-in. Full Penetration Details ............................................... 32
Table 3.8: Comparison of Mast arm Diameter, 2-in. Base Plate Full Penetration Details ........... 34
Table 3.9: Average Fatigue Coefficients for 8-in., 10-in., and 12-in. Diameter Full Penetration Details ............................................................................................................ 35
Table 3.10: Comparison of Mast Arm Diameter, 3-in. Base Plate Full Penetration Details ........ 36
Table 3.11: Comparison of Mast arm Diameter, 2-in. External Collar Details ............................ 37
Table 3.12: Variation in Backing Ring Weld, 10-3R-WY ........................................................... 38
Table 3.13: Variation of Backing Ring Weld, 8-2S-WY .............................................................. 40
Table 3.14: Comparison of Manufacturers, 10-3R-WY ............................................................... 42
Table 3.15: Comparison of Galvanized, Black, and Peened 10-3R-WY ...................................... 43
Table 4.1: Key of New Nomenclature Variables .......................................................................... 45
Table 4.2: Computed Hot Spot Stresses and Stress Concentration Factors .................................. 46
Table 4.3: Base Plate Stiffness and SCF ....................................................................................... 61
Table 4.4: Base Plate Stiffness and SCF for External Collar and Full Penetration with Backing Ring .................................................................................................................... 67
Table 4.5: Fatigue Life and Hot Spot Stress Range ...................................................................... 68
Table 5.1: High-mast Test Specimens Phase I and II ................................................................... 71
Table 5.2: Fatigue Results for Socket Detail Specimens .............................................................. 75
Table 5.3: Fatigue Results for Full Penetration Details ................................................................ 78
Table 5.4: Fatigue Results for Stool-Stiffened Details ................................................................. 79
Table 6.1: Parametric Evaluation Matrix ...................................................................................... 87
Table 6.2: Hot Spot Stresses for Wall Thickness and Shaft Diameter Parametric Evaluation ......................................................................................................................... 88
Table 6.3: SCFs for Wall Thickness and Shaft Diameter Parametric Evaluation ........................ 89
Table 6.4: Results of Anchor Rod Parametric Evaluation ............................................................ 93
Table 6.5: Results of Access Hole Parametric Evaluation ........................................................... 95
Table 6.6: Results of Collar Length Evaluation ............................................................................ 97
Table 6.7: Results of Bend Radius Evaluation ............................................................................. 99
Table 6.8: Experimental and Analytical Results for Phase I and II Specimens ......................... 100
Table 7.1: Ultrasonic Testing Results for All Specimens ........................................................... 125
Table 7.2: TxDOT and Evaluation Specimen Ultrasonic Testing Results ................................. 126

�
1
Chapter 1. Introduction
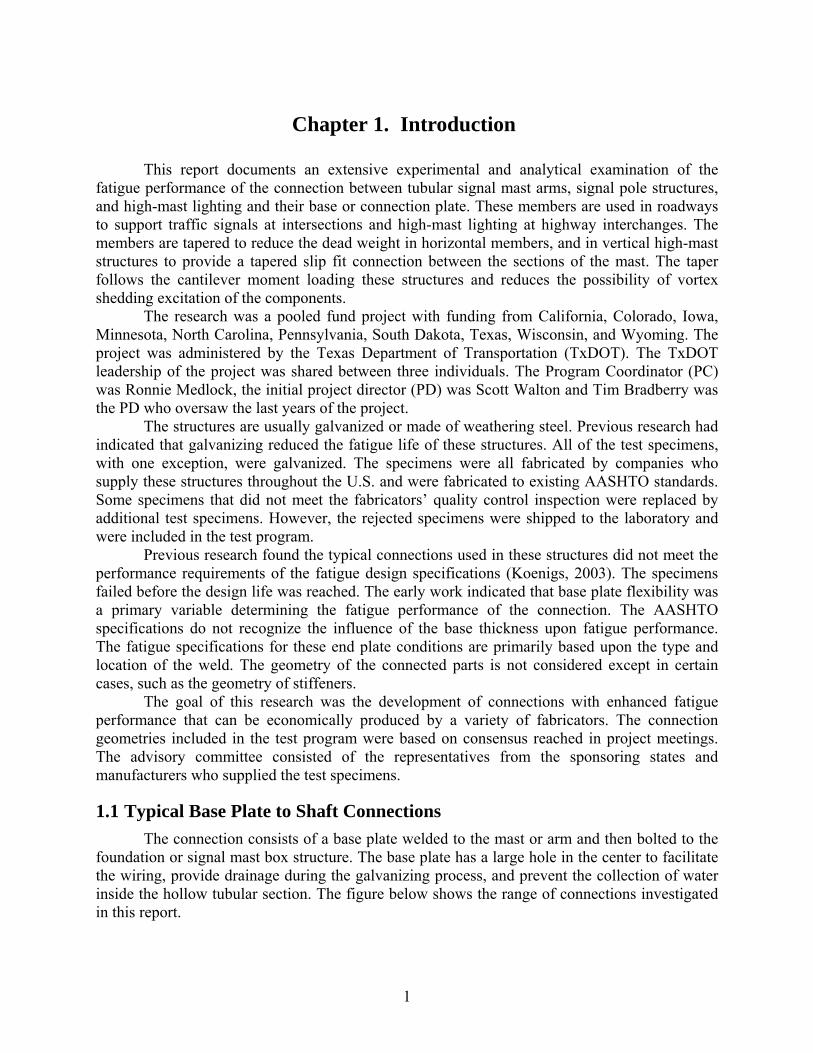
This report documents an extensive experimental and analytical examination of the fatigue performance of the connection between tubular signal mast arms, signal pole structures, and high-mast lighting and their base or connection plate. These members are used in roadways to support traffic signals at intersections and high-mast lighting at highway interchanges. The members are tapered to reduce the dead weight in horizontal members, and in vertical high-mast structures to provide a tapered slip fit connection between the sections of the mast. The taper follows the cantilever moment loading these structures and reduces the possibility of vortex shedding excitation of the components.
The research was a pooled fund project with funding from California, Colorado, Iowa, Minnesota, North Carolina, Pennsylvania, South Dakota, Texas, Wisconsin, and Wyoming. The project was administered by the Texas Department of Transportation (TxDOT). The TxDOT leadership of the project was shared between three individuals. The Program Coordinator (PC) was Ronnie Medlock, the initial project director (PD) was Scott Walton and Tim Bradberry was the PD who oversaw the last years of the project.
The structures are usually galvanized or made of weathering steel. Previous research had indicated that galvanizing reduced the fatigue life of these structures. All of the test specimens, with one exception, were galvanized. The specimens were all fabricated by companies who supply these structures throughout the U.S. and were fabricated to existing AASHTO standards. Some specimens that did not meet the fabricators’ quality control inspection were replaced by additional test specimens. However, the rejected specimens were shipped to the laboratory and were included in the test program.
Previous research found the typical connections used in these structures did not meet the performance requirements of the fatigue design specifications (Koenigs, 2003). The specimens failed before the design life was reached. The early work indicated that base plate flexibility was a primary variable determining the fatigue performance of the connection. The AASHTO specifications do not recognize the influence of the base thickness upon fatigue performance. The fatigue specifications for these end plate conditions are primarily based upon the type and location of the weld. The geometry of the connected parts is not considered except in certain cases, such as the geometry of stiffeners.
The goal of this research was the development of connections with enhanced fatigue performance that can be economically produced by a variety of fabricators. The connection geometries included in the test program were based on consensus reached in project meetings. The advisory committee consisted of the representatives from the sponsoring states and manufacturers who supplied the test specimens.
1.1 Typical Base Plate to Shaft Connections
The connection consists of a base plate welded to the mast or arm and then bolted to the foundation or signal mast box structure. The base plate has a large hole in the center to facilitate the wiring, provide drainage during the galvanizing process, and prevent the collection of water inside the hollow tubular section. The figure below shows the range of connections investigated in this report.
2
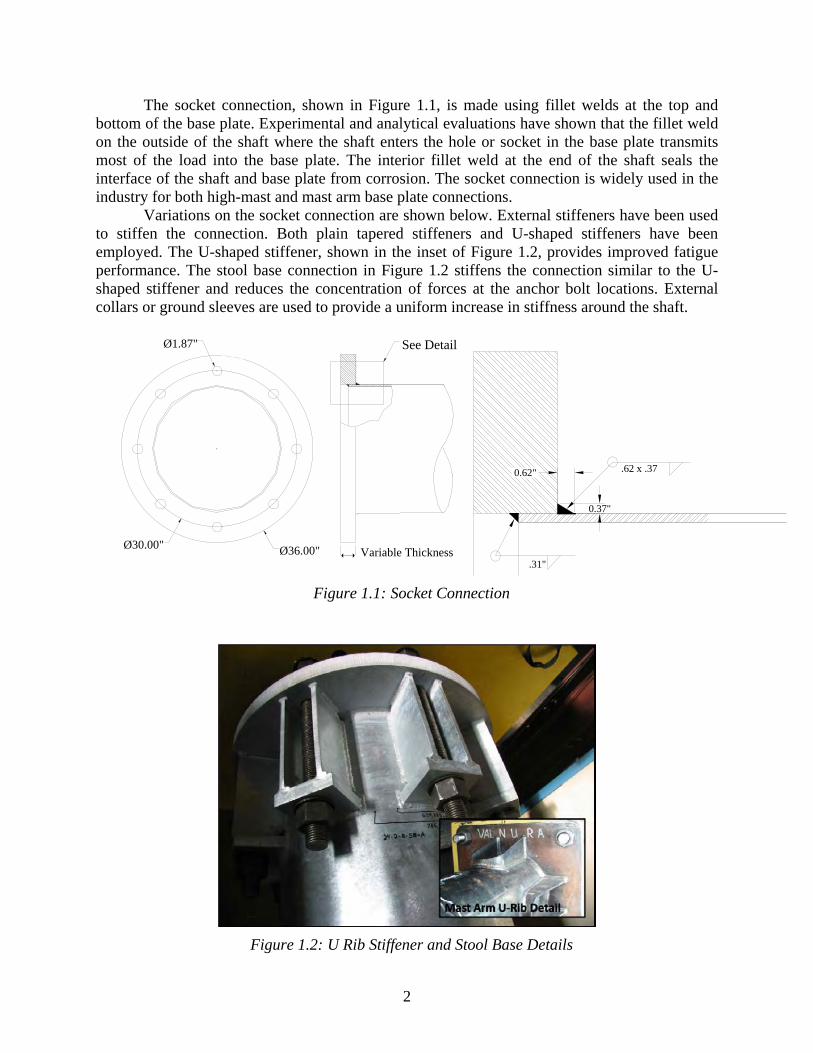
The socket connection, shown in Figure 1.1, is made using fillet welds at the top and bottom of the base plate. Experimental and analytical evaluations have shown that the fillet weld on the outside of the shaft where the shaft enters the hole or socket in the base plate transmits most of the load into the base plate. The interior fillet weld at the end of the shaft seals the interface of the shaft and base plate from corrosion. The socket connection is widely used in the industry for both high-mast and mast arm base plate connections.
Variations on the socket connection are shown below. External stiffeners have been used to stiffen the connection. Both plain tapered stiffeners and U-shaped stiffeners have been employed. The U-shaped stiffener, shown in the inset of Figure 1.2, provides improved fatigue performance. The stool base connection in Figure 1.2 stiffens the connection similar to the U-shaped stiffener and reduces the concentration of forces at the anchor bolt locations. External collars or ground sleeves are used to provide a uniform increase in stiffness around the shaft.
Figure 1.1: Socket Connection
Figure 1.2: U Rib Stiffener and Stool Base Details
.62 x .37
0.37"
0.62"
.31"
Ø1.87"
Ø30.00" Ø36.00" Variable Thickness
See Detail
3
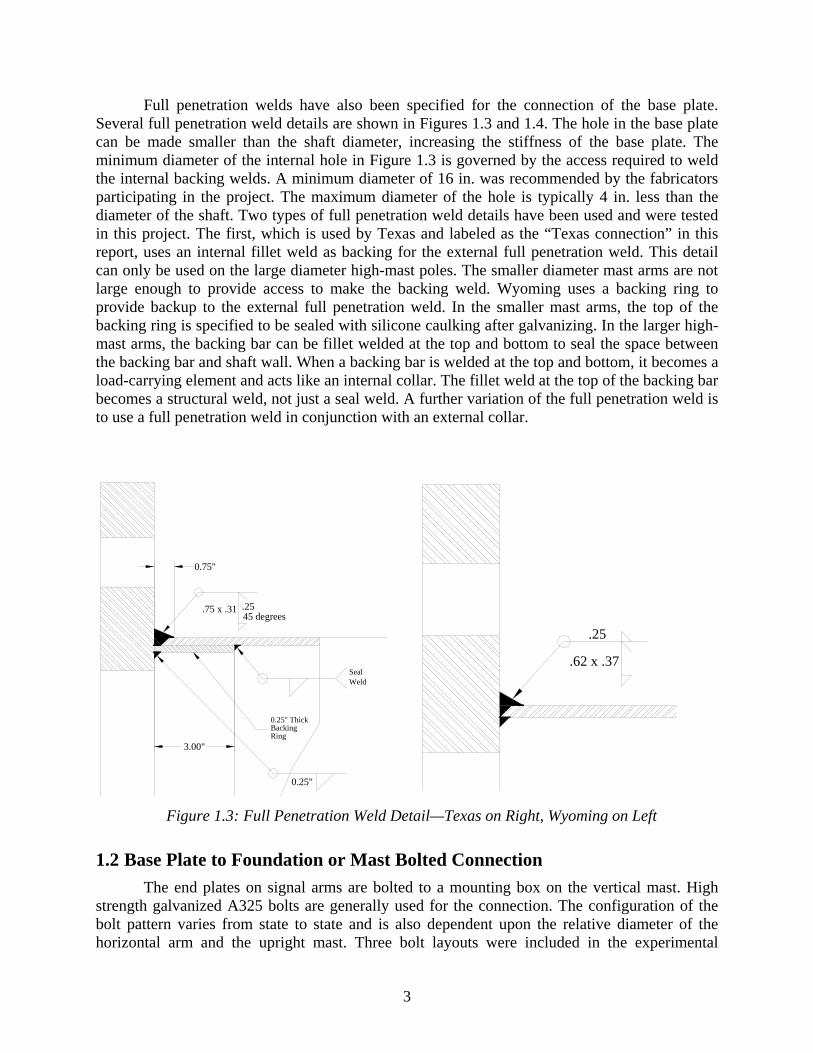
Full penetration welds have also been specified for the connection of the base plate. Several full penetration weld details are shown in Figures 1.3 and 1.4. The hole in the base plate can be made smaller than the shaft diameter, increasing the stiffness of the base plate. The minimum diameter of the internal hole in Figure 1.3 is governed by the access required to weld the internal backing welds. A minimum diameter of 16 in. was recommended by the fabricators participating in the project. The maximum diameter of the hole is typically 4 in. less than the diameter of the shaft. Two types of full penetration weld details have been used and were tested in this project. The first, which is used by Texas and labeled as the “Texas connection” in this report, uses an internal fillet weld as backing for the external full penetration weld. This detail can only be used on the large diameter high-mast poles. The smaller diameter mast arms are not large enough to provide access to make the backing weld. Wyoming uses a backing ring to provide backup to the external full penetration weld. In the smaller mast arms, the top of the backing ring is specified to be sealed with silicone caulking after galvanizing. In the larger high-mast arms, the backing bar can be fillet welded at the top and bottom to seal the space between the backing bar and shaft wall. When a backing bar is welded at the top and bottom, it becomes a load-carrying element and acts like an internal collar. The fillet weld at the top of the backing bar becomes a structural weld, not just a seal weld. A further variation of the full penetration weld is to use a full penetration weld in conjunction with an external collar.
Figure 1.3: Full Penetration Weld Detail—Texas on Right, Wyoming on Left
1.2 Base Plate to Foundation or Mast Bolted Connection
The end plates on signal arms are bolted to a mounting box on the vertical mast. High strength galvanized A325 bolts are generally used for the connection. The configuration of the bolt pattern varies from state to state and is also dependent upon the relative diameter of the horizontal arm and the upright mast. Three bolt layouts were included in the experimental
0.75"
.2545 degrees
.75 x .31
Seal Weld
0.25" ThickBackingRing
0.25"
3.00"
.62 x .37
.25
4
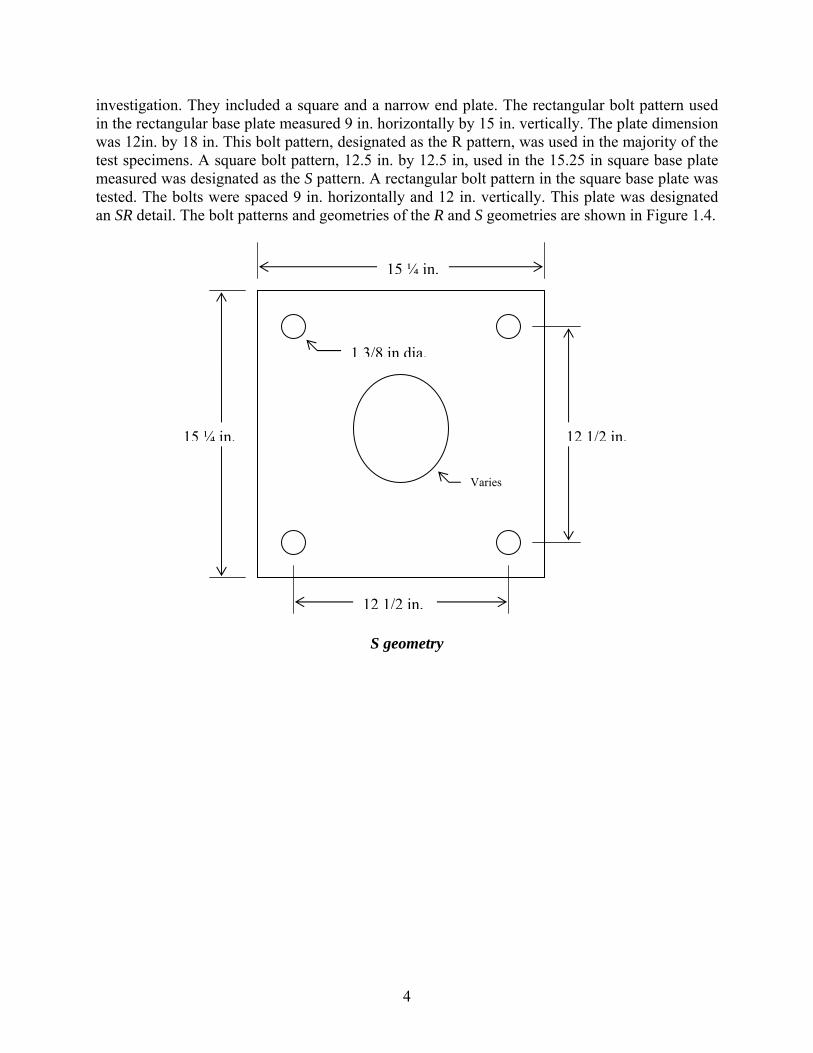
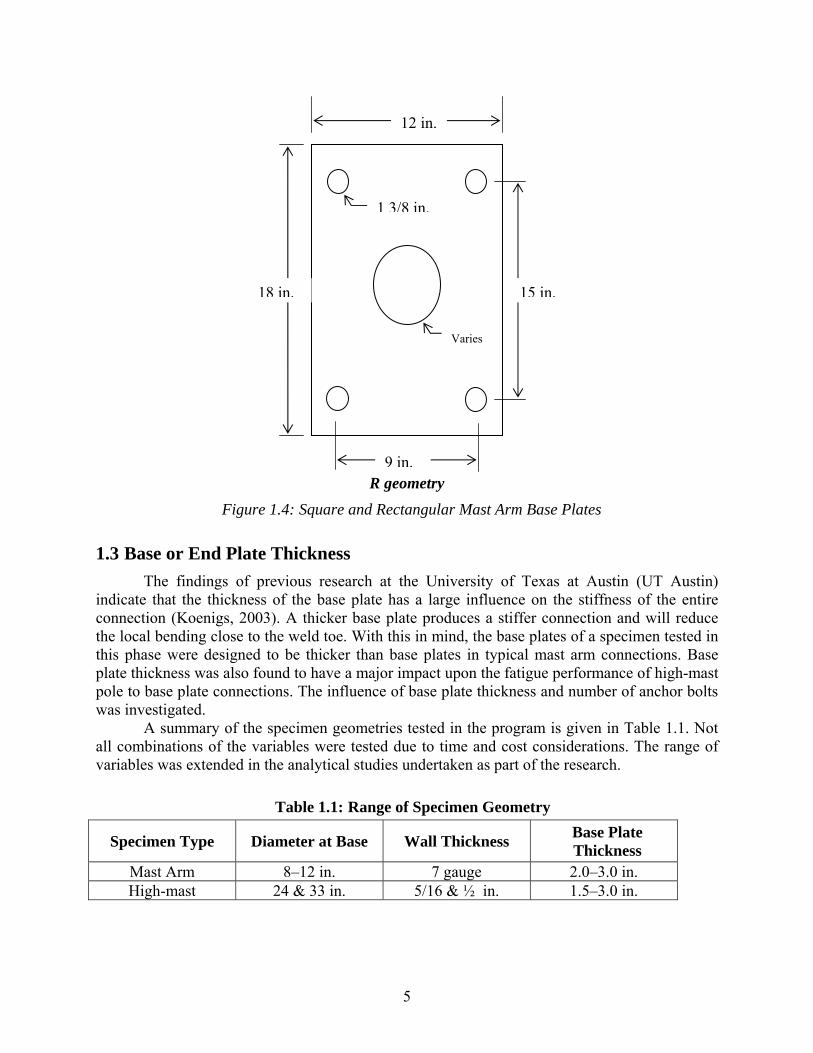
investigation. They included a square and a narrow end plate. The rectangular bolt pattern used in the rectangular base plate measured 9 in. horizontally by 15 in. vertically. The plate dimension was 12in. by 18 in. This bolt pattern, designated as the R pattern, was used in the majority of the test specimens. A square bolt pattern, 12.5 in. by 12.5 in, used in the 15.25 in square base plate measured was designated as the S pattern. A rectangular bolt pattern in the square base plate was tested. The bolts were spaced 9 in. horizontally and 12 in. vertically. This plate was designated an SR detail. The bolt patterns and geometries of the R and S geometries are shown in Figure 1.4.
S geometry
15 ¼ in.
15 ¼ in.
12 1/2 in.
12 1/2 in.
1 3/8 in dia.
Varies
5
R geometry
Figure 1.4: Square and Rectangular Mast Arm Base Plates
1.3 Base or End Plate Thickness
The findings of previous research at the University of Texas at Austin (UT Austin) indicate that the thickness of the base plate has a large influence on the stiffness of the entire connection (Koenigs, 2003). A thicker base plate produces a stiffer connection and will reduce the local bending close to the weld toe. With this in mind, the base plates of a specimen tested in this phase were designed to be thicker than base plates in typical mast arm connections. Base plate thickness was also found to have a major impact upon the fatigue performance of high-mast pole to base plate connections. The influence of base plate thickness and number of anchor bolts was investigated.
A summary of the specimen geometries tested in the program is given in Table 1.1. Not all combinations of the variables were tested due to time and cost considerations. The range of variables was extended in the analytical studies undertaken as part of the research.
Table 1.1: Range of Specimen Geometry
Specimen Type Diameter at Base Wall Thickness Base Plate Thickness
Mast Arm 8–12 in. 7 gauge 2.0–3.0 in. High-mast 24 & 33 in. 5/16 & ½ in. 1.5–3.0 in.
18 in.
12 in.
15 in.
9 in.
1 3/8 in.
Varies
6
1.4 Manufacturer
Prior to the research documented in this report, all specimens in the UT Austin research had been manufactured by Valmont Industries. To determine if there is a manufacturer-specific effect on the fatigue performance of a mast arm, it was desirable to test mast arms made by other manufacturers.
1.4.1 Pelco
A pair of 10-2S-WY-PB (the specimen nomenclature is given in Section 1.5) samples was tested. Pelco makes mast arms that are octagonal, as opposed to round. This is not indicated in the nomenclature of the mast arms, because Pelco was the only manufacturer that used an octagonal mast arm in this report. The difference between an octagonal and a round mast arm was looked at analytically and further discussion can be found in the chapters on analysis. Pelco also supplied high-mast poles for the test program.
1.4.2 Ameron and Union Metal
Ameron and Union Metal produced a pair of samples each (10-3R-WY-AG and 10-3R-WY-UG). However, both pairs included a specimen that was too long for the setup. The remaining samples from each manufacturer were tested together.
1.4.3 Valmont
The majority of specimens tested were produced by Valmont. Valmont has produced samples for previous phases and has worked closely with the researchers to determine feasibly constructible details.
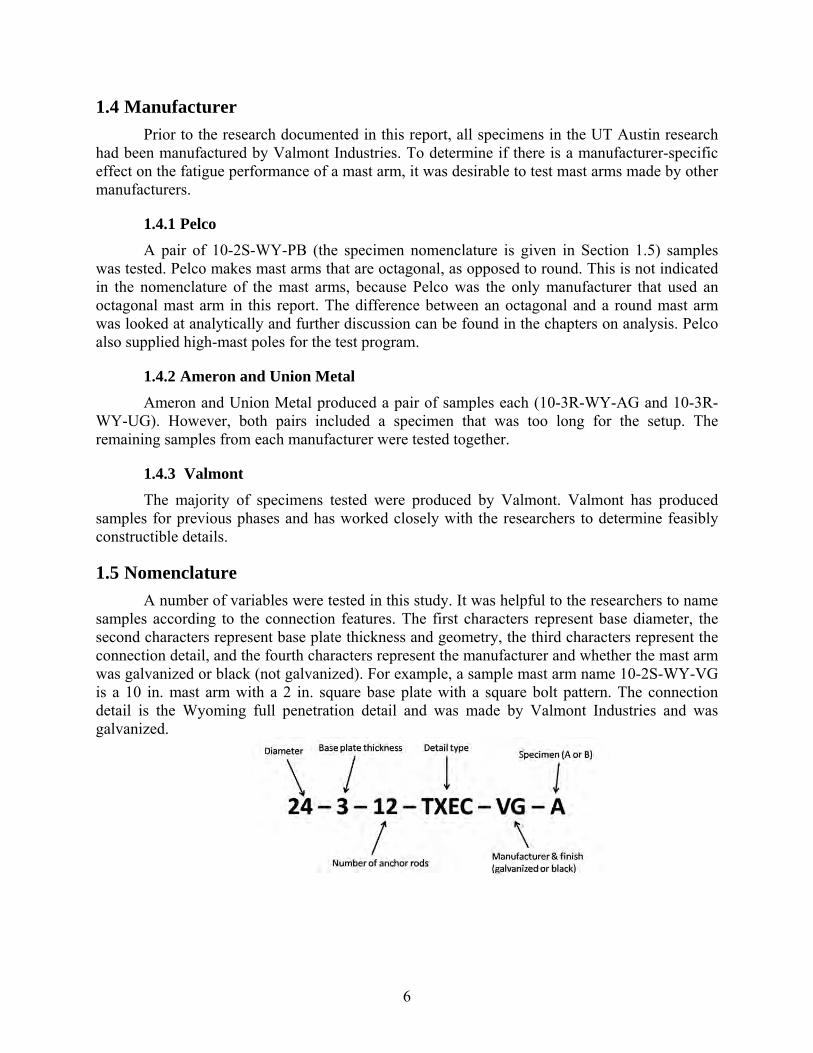
1.5 Nomenclature
A number of variables were tested in this study. It was helpful to the researchers to name samples according to the connection features. The first characters represent base diameter, the second characters represent base plate thickness and geometry, the third characters represent the connection detail, and the fourth characters represent the manufacturer and whether the mast arm was galvanized or black (not galvanized). For example, a sample mast arm name 10-2S-WY-VG is a 10 in. mast arm with a 2 in. square base plate with a square bolt pattern. The connection detail is the Wyoming full penetration detail and was made by Valmont Industries and was galvanized.
7
1.6 Report Organization
Chapter 2 summarizes the experimental techniques used to perform the fatigue tests. Chapters 3 and 4 present the results of the fatigue tests and analytical examination of the mast arms. Chapters 5 and 6 present the test and analytical results of the high-mast geometries studied. Chapter 7 provides the work on the large diameter high-mast specimens and the cracking found after galvanizing. The initial testing of repair techniques is also presented in Chapter 7. Chapter 8 presents the conclusions of the project and design recommendations. A tabular listing of the test results is given Appendices A and B. The theses of the five master students [Anderson (2007), Rios (2007), Richman (2009), Stam (2009), and Pool (2010)] who worked on the project provide additional detail of the testing and analysis and are available online at the Ferguson Laboratory web site (http://fsel.engr.utexas.edu/publications/).

8
9
Chapter 2. Test Setup and Experimental Procedure
2.1 Introduction
The test setups for the high-mast and mast arm fatigue tests were similar. The high-mast test setup used a larger, longer specimen length, and a larger capacity loading ram. The same test protocol was used for both test setups.
This test setup facilitated the easy loading of matched-pair specimens by testing them horizontally rather than in the vertical orientation. Though the horizontal configuration restricts the fatigue stresses to tension only, a limitation that will be discussed further, it radically decreases overall testing time by simplifying installation and allowing for simultaneous duplicate testing. This setup will be described in Section 2.2.
The testing procedure included several important tasks. The specimens were first measured to confirm sectional properties and inspect for any fabrication errors or misalignments. They were then installed into the setup using the same anchor rod and double-nut connection used in the field, and fatigue loading was executed using an MTS closed-loop control system.
2.2 Test Setup
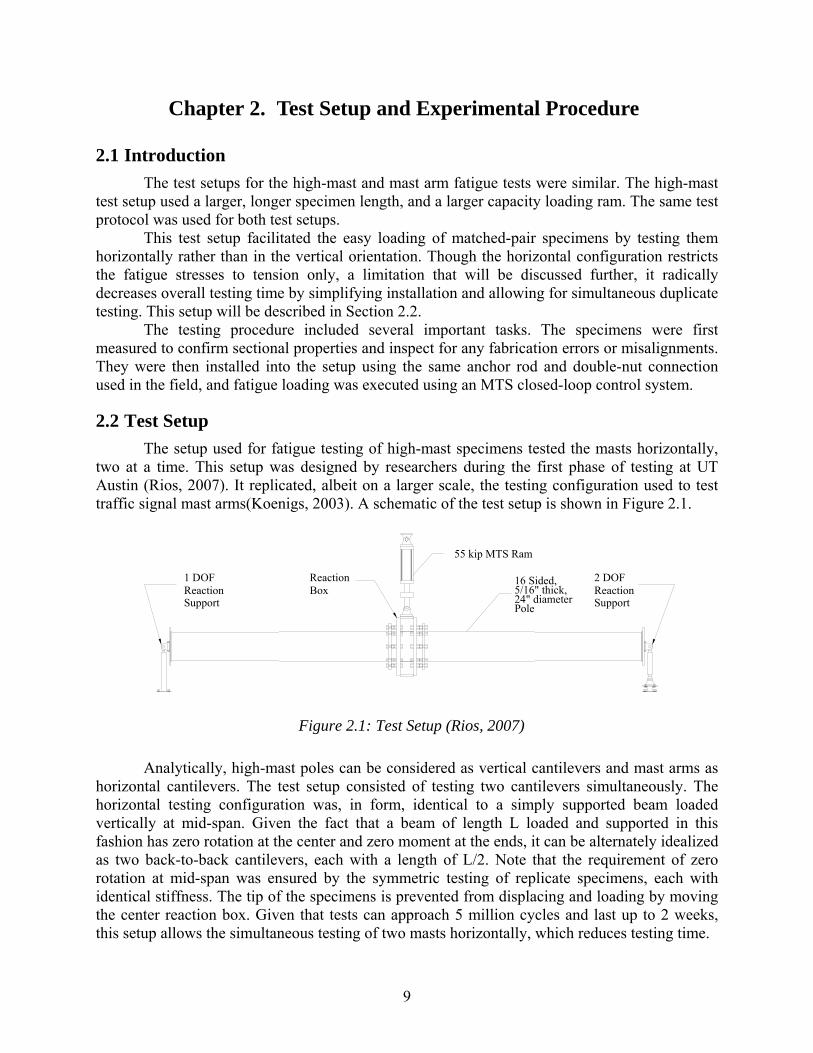
The setup used for fatigue testing of high-mast specimens tested the masts horizontally, two at a time. This setup was designed by researchers during the first phase of testing at UT Austin (Rios, 2007). It replicated, albeit on a larger scale, the testing configuration used to test traffic signal mast arms(Koenigs, 2003). A schematic of the test setup is shown in Figure 2.1.
Figure 2.1: Test Setup (Rios, 2007)
Analytically, high-mast poles can be considered as vertical cantilevers and mast arms as horizontal cantilevers. The test setup consisted of testing two cantilevers simultaneously. The horizontal testing configuration was, in form, identical to a simply supported beam loaded vertically at mid-span. Given the fact that a beam of length L loaded and supported in this fashion has zero rotation at the center and zero moment at the ends, it can be alternately idealized as two back-to-back cantilevers, each with a length of L/2. Note that the requirement of zero rotation at mid-span was ensured by the symmetric testing of replicate specimens, each with identical stiffness. The tip of the specimens is prevented from displacing and loading by moving the center reaction box. Given that tests can approach 5 million cycles and last up to 2 weeks, this setup allows the simultaneous testing of two masts horizontally, which reduces testing time.
ReactionBox
1 DOFReactionSupport
2 DOFReactionSupport
55 kip MTS Ram
16 Sided,5/16" thick,24" diameterPole
10
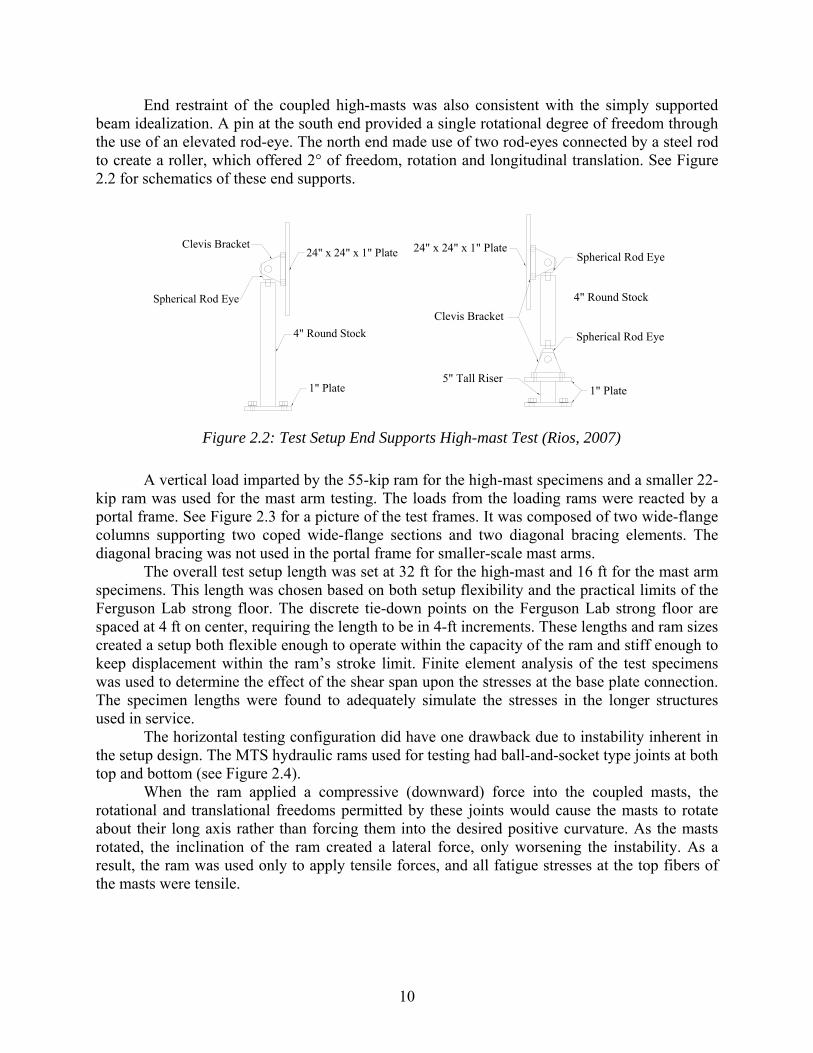
End restraint of the coupled high-masts was also consistent with the simply supported beam idealization. A pin at the south end provided a single rotational degree of freedom through the use of an elevated rod-eye. The north end made use of two rod-eyes connected by a steel rod to create a roller, which offered 2° of freedom, rotation and longitudinal translation. See Figure 2.2 for schematics of these end supports.
Figure 2.2: Test Setup End Supports High-mast Test (Rios, 2007)
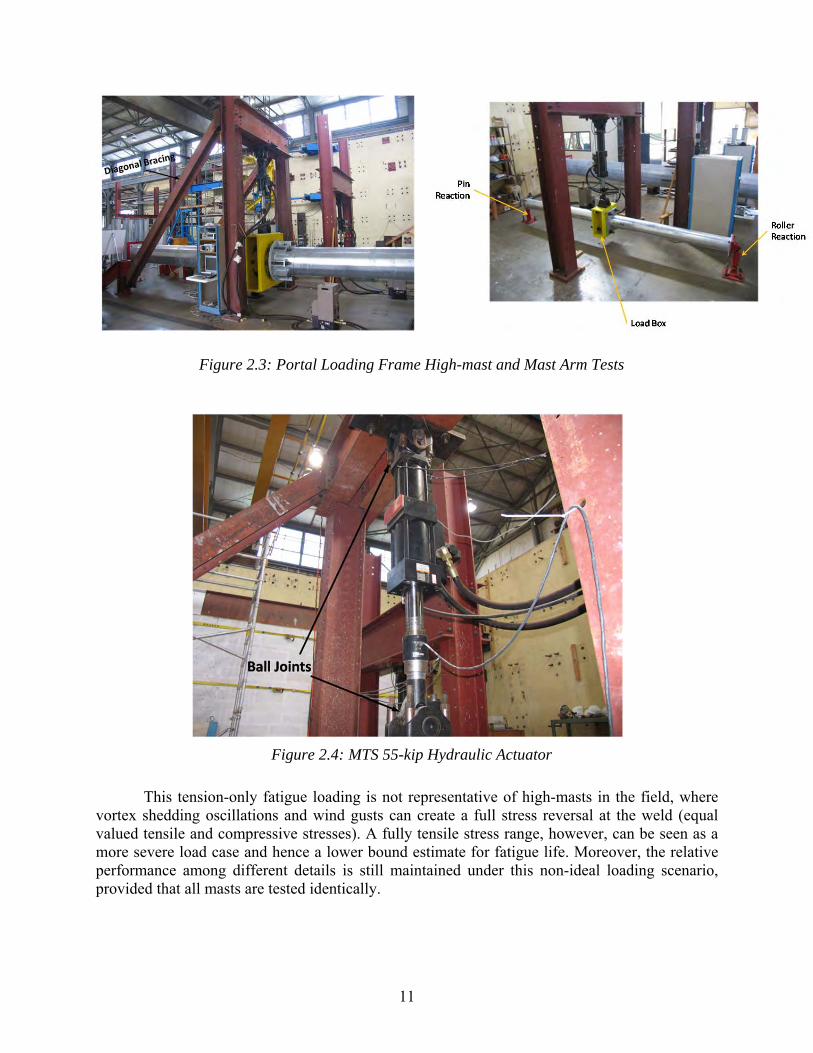
A vertical load imparted by the 55-kip ram for the high-mast specimens and a smaller 22-kip ram was used for the mast arm testing. The loads from the loading rams were reacted by a portal frame. See Figure 2.3 for a picture of the test frames. It was composed of two wide-flange columns supporting two coped wide-flange sections and two diagonal bracing elements. The diagonal bracing was not used in the portal frame for smaller-scale mast arms.
The overall test setup length was set at 32 ft for the high-mast and 16 ft for the mast arm specimens. This length was chosen based on both setup flexibility and the practical limits of the Ferguson Lab strong floor. The discrete tie-down points on the Ferguson Lab strong floor are spaced at 4 ft on center, requiring the length to be in 4-ft increments. These lengths and ram sizes created a setup both flexible enough to operate within the capacity of the ram and stiff enough to keep displacement within the ram’s stroke limit. Finite element analysis of the test specimens was used to determine the effect of the shear span upon the stresses at the base plate connection. The specimen lengths were found to adequately simulate the stresses in the longer structures used in service.
The horizontal testing configuration did have one drawback due to instability inherent in the setup design. The MTS hydraulic rams used for testing had ball-and-socket type joints at both top and bottom (see Figure 2.4).
When the ram applied a compressive (downward) force into the coupled masts, the rotational and translational freedoms permitted by these joints would cause the masts to rotate about their long axis rather than forcing them into the desired positive curvature. As the masts rotated, the inclination of the ram created a lateral force, only worsening the instability. As a result, the ram was used only to apply tensile forces, and all fatigue stresses at the top fibers of the masts were tensile.
1" Plate
4" Round Stock
Clevis Bracket
Spherical Rod Eye
24" x 24" x 1" Plate
1" Plate
Clevis Bracket
4" Round Stock
5" Tall Riser
Spherical Rod Eye
Spherical Rod Eye
24" x 24" x 1" Plate
11
Figure 2.3: Portal Loading Frame High-mast and Mast Arm Tests
Figure 2.4: MTS 55-kip Hydraulic Actuator
This tension-only fatigue loading is not representative of high-masts in the field, where vortex shedding oscillations and wind gusts can create a full stress reversal at the weld (equal valued tensile and compressive stresses). A fully tensile stress range, however, can be seen as a more severe load case and hence a lower bound estimate for fatigue life. Moreover, the relative performance among different details is still maintained under this non-ideal loading scenario, provided that all masts are tested identically.
12
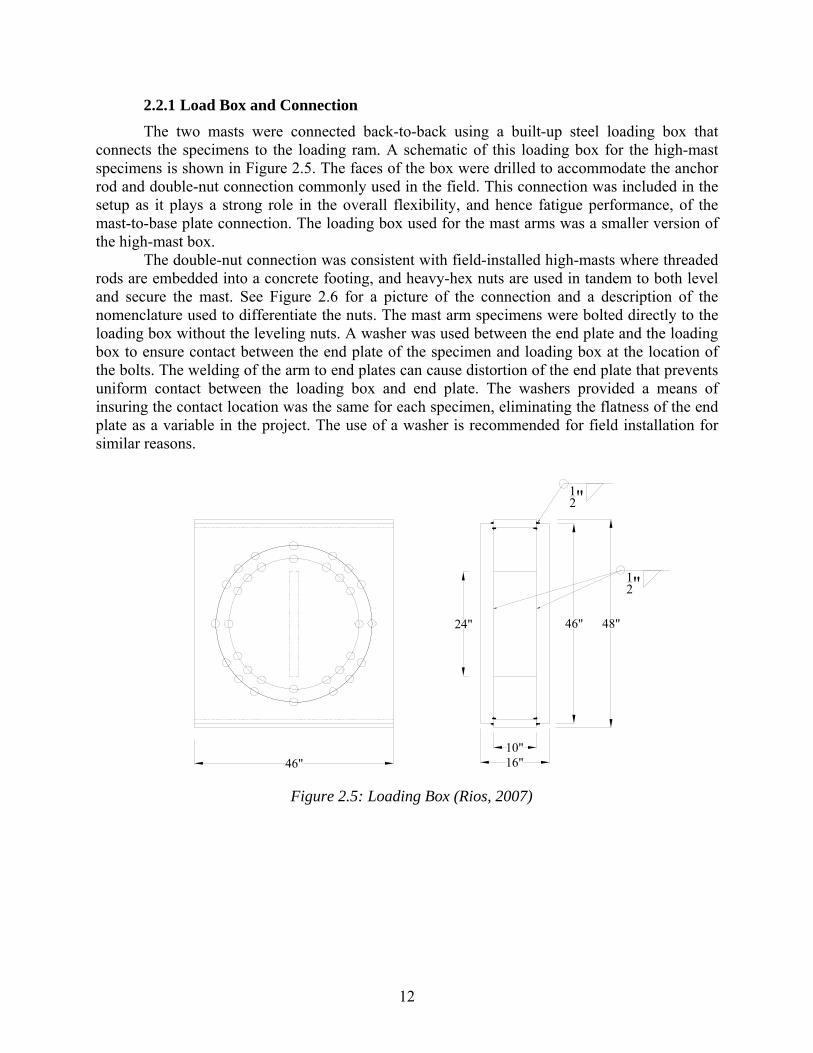
2.2.1 Load Box and Connection
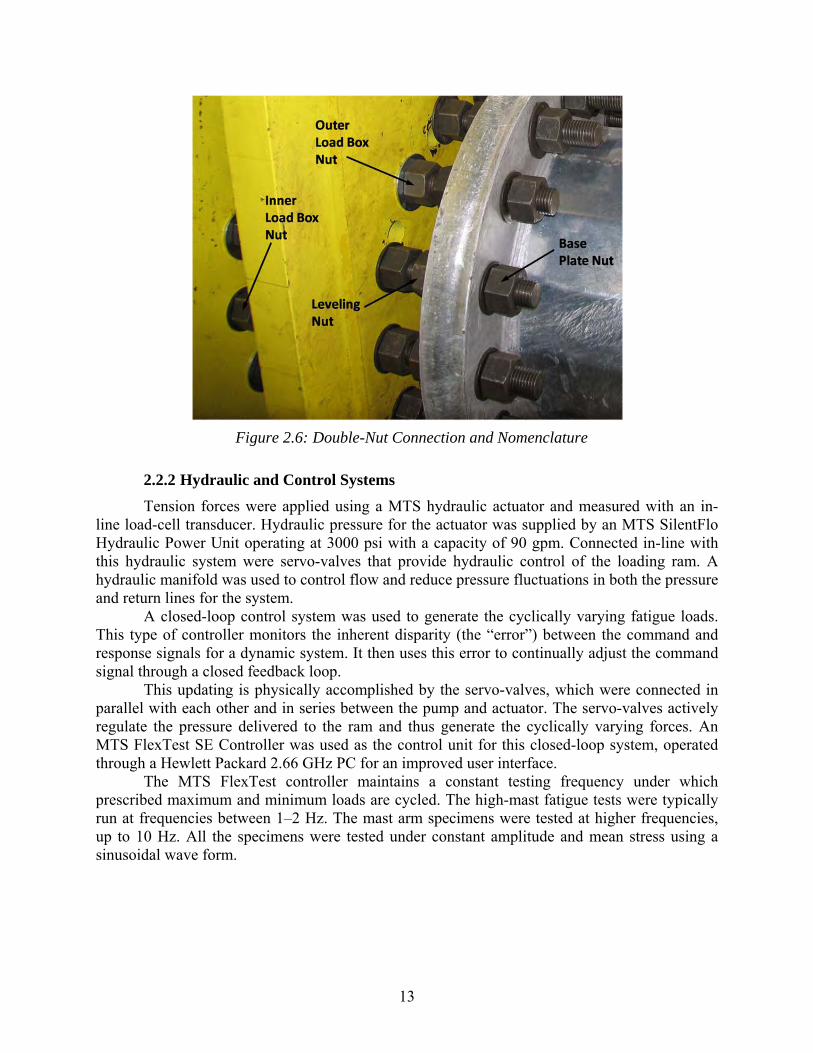
The two masts were connected back-to-back using a built-up steel loading box that connects the specimens to the loading ram. A schematic of this loading box for the high-mast specimens is shown in Figure 2.5. The faces of the box were drilled to accommodate the anchor rod and double-nut connection commonly used in the field. This connection was included in the setup as it plays a strong role in the overall flexibility, and hence fatigue performance, of the mast-to-base plate connection. The loading box used for the mast arms was a smaller version of the high-mast box.
The double-nut connection was consistent with field-installed high-masts where threaded rods are embedded into a concrete footing, and heavy-hex nuts are used in tandem to both level and secure the mast. See Figure 2.6 for a picture of the connection and a description of the nomenclature used to differentiate the nuts. The mast arm specimens were bolted directly to the loading box without the leveling nuts. A washer was used between the end plate and the loading box to ensure contact between the end plate of the specimen and loading box at the location of the bolts. The welding of the arm to end plates can cause distortion of the end plate that prevents uniform contact between the loading box and end plate. The washers provided a means of insuring the contact location was the same for each specimen, eliminating the flatness of the end plate as a variable in the project. The use of a washer is recommended for field installation for similar reasons.
Figure 2.5: Loading Box (Rios, 2007)
46"10"16"
48"46"
12"
12"
24"
13
Figure 2.6: Double-Nut Connection and Nomenclature
2.2.2 Hydraulic and Control Systems
Tension forces were applied using a MTS hydraulic actuator and measured with an in-line load-cell transducer. Hydraulic pressure for the actuator was supplied by an MTS SilentFlo Hydraulic Power Unit operating at 3000 psi with a capacity of 90 gpm. Connected in-line with this hydraulic system were servo-valves that provide hydraulic control of the loading ram. A hydraulic manifold was used to control flow and reduce pressure fluctuations in both the pressure and return lines for the system.
A closed-loop control system was used to generate the cyclically varying fatigue loads. This type of controller monitors the inherent disparity (the “error”) between the command and response signals for a dynamic system. It then uses this error to continually adjust the command signal through a closed feedback loop.
This updating is physically accomplished by the servo-valves, which were connected in parallel with each other and in series between the pump and actuator. The servo-valves actively regulate the pressure delivered to the ram and thus generate the cyclically varying forces. An MTS FlexTest SE Controller was used as the control unit for this closed-loop system, operated through a Hewlett Packard 2.66 GHz PC for an improved user interface.
The MTS FlexTest controller maintains a constant testing frequency under which prescribed maximum and minimum loads are cycled. The high-mast fatigue tests were typically run at frequencies between 1–2 Hz. The mast arm specimens were tested at higher frequencies, up to 10 Hz. All the specimens were tested under constant amplitude and mean stress using a sinusoidal wave form.
14
2.3 Testing Procedure
The testing procedure had three distinct phases. The process began with specimen measurement and inspection. This was followed by the physical installation of the specimens into the test setup. Finally, necessary loads and displacements were determined, and the test was commenced.
2.3.1 Measurement and Inspection
All relevant dimensions of the specimens were measured and documented. This process was completed prior to installation to allow for easier access to the base plate. Measured dimensions included:
1. Overall specimen length
2. Base plate thickness and corner bend radius
3. Pole diameter measured to flats
4. Pole diameter measured to corners
5. Pole diameter at 12 in. from base (flats)
6. Pole wall thickness
7. Weld dimensions (long leg, short leg)
8. Collar length (if applicable)
9. Base plate access hole (if applicable)
10. Stool dimensions (if applicable) This measurement process was conducted to both ensure that the specimens had been
fabricated as specified and to confirm dimensions for the calculation of sectional properties and nominal loads. Pole diameter was measured at two locations to calculate the specimen taper. All dimensions for Phase II specimens were within specified tolerances.
Pole wall thicknesses were measured using either a Vernier caliper or an ultrasonic thickness gauge. The caliper could be used only after the test when the base plate had been removed with an oxy-acetylene torch, so most thicknesses were measured ultrasonically. The gauge used was a Krautkramer USN 60 NDT device.
This measurement process also provided the opportunity to closely inspect the specimens for any misalignments. On several occasions, the specimens were found to have problems with the alignment of the base plate relative to the end plate. For these specimens, the two plates had not been indexed properly with one rotated slightly relative to the other, 10°at most. To still allow for testing, the end plates of these samples were re-drilled with properly indexed bolt holes.
2.3.2 Installation Procedure
Due to the awkward shape and unbalanced weight of the horizontally oriented high-masts, the installation process was complex and often a trial-and-error operation. The installation of the mast arms was simpler due to the smaller specimen size and the openness of the setup due to the lack of diagonal bracing.
15
Once a specimen failed, it was removed, flipped over, and used as a servant to allow for the continued testing of its replicate on the other side. Occasionally, this flipped specimen failed again before its replicate. In this event, another sample with similar stiffness was installed so testing could continue.
2.3.3 Testing Loads and Displacements
All high-mast specimens were tested under load ranges that created purely tensile stresses along the specimens’ top fibers. The longitudinal tension stresses are largest at the weld toe connecting the specimen’s base and pole shaft, the invariable location of fatigue cracking. At this spot, the calculated nominal bending stress is amplified by both the inherent flexibility of the connection and the notch effect of the weld toe. This notch effect, common to all fillet welds, was even more severe for welds with steep profiles or undercuts.
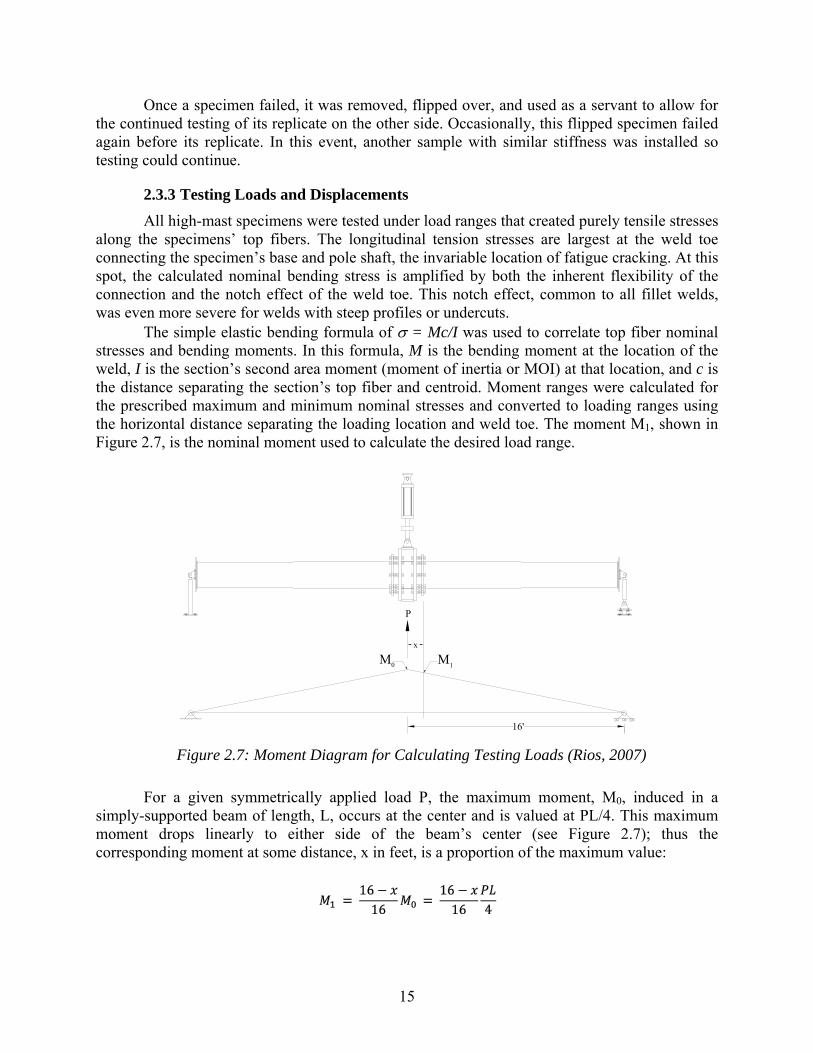
The simple elastic bending formula of = Mc/I was used to correlate top fiber nominal stresses and bending moments. In this formula, M is the bending moment at the location of the weld, I is the section’s second area moment (moment of inertia or MOI) at that location, and c is the distance separating the section’s top fiber and centroid. Moment ranges were calculated for the prescribed maximum and minimum nominal stresses and converted to loading ranges using the horizontal distance separating the loading location and weld toe. The moment M1, shown in Figure 2.7, is the nominal moment used to calculate the desired load range.
Figure 2.7: Moment Diagram for Calculating Testing Loads (Rios, 2007)
For a given symmetrically applied load P, the maximum moment, M0, induced in a simply-supported beam of length, L, occurs at the center and is valued at PL/4. This maximum moment drops linearly to either side of the beam’s center (see Figure 2.7); thus the corresponding moment at some distance, x in feet, is a proportion of the maximum value:
x
M
P
M0 1
16'
16
For the case of the high-mast setup, the horizontal distance, x, depended on the stand-off length and base plate thickness, but was typically about a foot.
Sectional properties of the tested masts were calculated assuming nominal dimensions. External collars and backing rings were not included in sectional calculations. The drafting software AutoCAD 2007, through the use of its “massprop” function, was used to determine the MOI and top fiber distance, c, corresponding to specimen nominal dimensions.
All the fatigue tests were executed under displacement control after the relationship between the calculated loads and ram displacement had been determined by slowly loading the specimens between the desired maximum and minimum loads. Displacement control was used because the large mass of the loading box connecting the specimens caused the dynamic load increase with testing speed. Under dynamic cycling in displacement control, the dynamic loads exerted on the specimens, however, will be correct provided the displacements are maintained.
Determining the testing displacement ranges was accomplished by manually moving the ram until the desired loads were observed. The corresponding displacements were recorded and testing was commenced with the ram cycling in displacement control between these experimentally determined displacements.
Testing would then proceed at a low frequency, 0.1 to 0.2 Hz, to allow the base plate and end plate connections to settle and self-adjust. Slippage would sometimes occur and cause the load range to drop. The setup was monitored closely during this initial loading, and the displacement range was adjusted to maintain the proper load range. Once the loads settled, the testing frequency was raised to its final value with testing run unattended. Periodically, the displacement and loads were checked to make sure the specimen loading was maintained.

17
Chapter 3. Mast Arm Experimental Test Results and Observations
The results presented in this chapter are mainly the detailed results of the last phase of the project; however, the results are compared with all previous work at UT Austin where applicable. Complete records of fatigue mast evaluations are contained in the theses of Koenigs (2003), Anderson (2007), and Richman (2009), as well as TxDOT report 0-4178-2 (Koenigs, et al. 2003).
3.1 Fatigue Life Coefficient and AASHTO Fatigue Categories
When a specimen is tested in fatigue, two variables are recorded. The independent variable is the nominal stress range (Sr) of the specimen and the dependent variable is the number of cycles (N) that the specimen experienced before failure at the selected stress range. For a given detail, an S-N plot can be produced by plotting Sr on the vertical axis and N on the horizontal axis, usually shown with a log-log scale. Above a threshold stress range, called the constant amplitude fatigue limit, under which fatigue life is theoretically infinite, the equation used to relate stress range and number of cycles is , where A is a constant that depends on detail geometry and size and pervasiveness of inherent defects. The coefficient A is used to designate fatigue life categories, ranging from Category A to Category E’. A list of AASHTO Fatigue Categories and corresponding values of the constant A is given in Table 3.1.
Table 3.1: AASHTO Fatigue Constants
AASHTO Category Fatigue Constant, A A 250 × 108 B 120 × 108 C 44 × 108 D 22 × 108 E 11 × 108
E’ 3.9 × 10⁸
A simple way to compare the fatigue life of different specimens is to compare the coefficient A of the sample. Using the equation , values of A were calculated for each specimen using the stress range and fatigue life recorded from the test. These were then compared with each other and the AASHTO fatigue categories in order to quantify the fatigue performance of each detail. This allowed for the comparison of samples that were tested at different stress ranges. The coefficient A will vary somewhat, due to scatter, but provides a convenient method to compare the fatigue performance of two details tested at different stress ranges.
When comparing fatigue performance, it is also necessary to consider the threshold stress range. If a specimen is cycled at a low enough stress range, the specimen will have an extended life or will simply not fail during the experiment. The calculation of the coefficient A will not account for this extended life at lower stress ranges and it is necessary to plot data points against the curves given for the AASHTO fatigue categories. The AASHTO categories account for the effect of extended life experienced at lower stress ranges by designating a threshold stress range (Sth) under which infinite life can be expected from the detail.
18
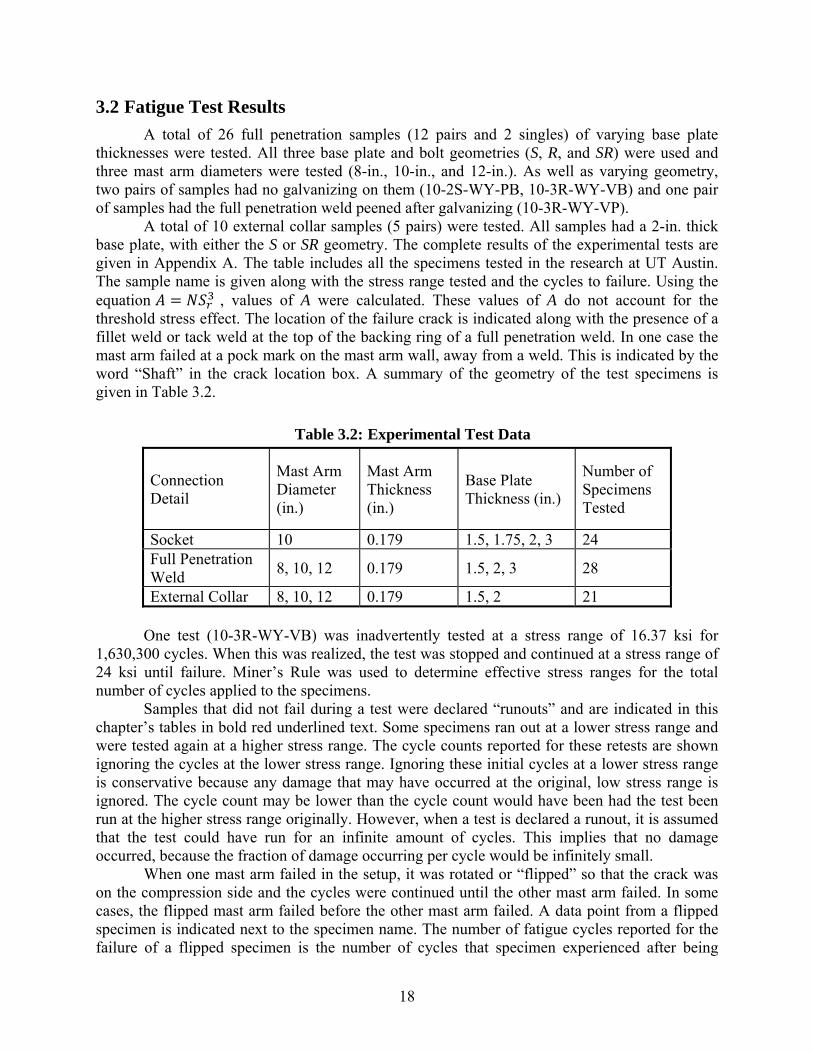
3.2 Fatigue Test Results
A total of 26 full penetration samples (12 pairs and 2 singles) of varying base plate thicknesses were tested. All three base plate and bolt geometries (S, R, and SR) were used and three mast arm diameters were tested (8-in., 10-in., and 12-in.). As well as varying geometry, two pairs of samples had no galvanizing on them (10-2S-WY-PB, 10-3R-WY-VB) and one pair of samples had the full penetration weld peened after galvanizing (10-3R-WY-VP).
A total of 10 external collar samples (5 pairs) were tested. All samples had a 2-in. thick base plate, with either the S or SR geometry. The complete results of the experimental tests are given in Appendix A. The table includes all the specimens tested in the research at UT Austin. The sample name is given along with the stress range tested and the cycles to failure. Using the equation , values of A were calculated. These values of A do not account for the threshold stress effect. The location of the failure crack is indicated along with the presence of a fillet weld or tack weld at the top of the backing ring of a full penetration weld. In one case the mast arm failed at a pock mark on the mast arm wall, away from a weld. This is indicated by the word “Shaft” in the crack location box. A summary of the geometry of the test specimens is given in Table 3.2.
Table 3.2: Experimental Test Data
Connection Detail
Mast Arm Diameter (in.)
Mast Arm Thickness (in.)
Base Plate Thickness (in.)
Number of Specimens Tested
Socket 10 0.179 1.5, 1.75, 2, 3 24 Full Penetration Weld
8, 10, 12 0.179 1.5, 2, 3 28
External Collar 8, 10, 12 0.179 1.5, 2 21
One test (10-3R-WY-VB) was inadvertently tested at a stress range of 16.37 ksi for 1,630,300 cycles. When this was realized, the test was stopped and continued at a stress range of 24 ksi until failure. Miner’s Rule was used to determine effective stress ranges for the total number of cycles applied to the specimens.
Samples that did not fail during a test were declared “runouts” and are indicated in this chapter’s tables in bold red underlined text. Some specimens ran out at a lower stress range and were tested again at a higher stress range. The cycle counts reported for these retests are shown ignoring the cycles at the lower stress range. Ignoring these initial cycles at a lower stress range is conservative because any damage that may have occurred at the original, low stress range is ignored. The cycle count may be lower than the cycle count would have been had the test been run at the higher stress range originally. However, when a test is declared a runout, it is assumed that the test could have run for an infinite amount of cycles. This implies that no damage occurred, because the fraction of damage occurring per cycle would be infinitely small.
When one mast arm failed in the setup, it was rotated or “flipped” so that the crack was on the compression side and the cycles were continued until the other mast arm failed. In some cases, the flipped mast arm failed before the other mast arm failed. A data point from a flipped specimen is indicated next to the specimen name. The number of fatigue cycles reported for the failure of a flipped specimen is the number of cycles that specimen experienced after being
19
flipped. Due to residual stresses in the weld toe, there may be some tension stress cycled on the bottom of the mast arm; however, this is conservatively ignored when reporting the number of cycles a flipped specimen experienced before failing.
3.3 Typical Failures
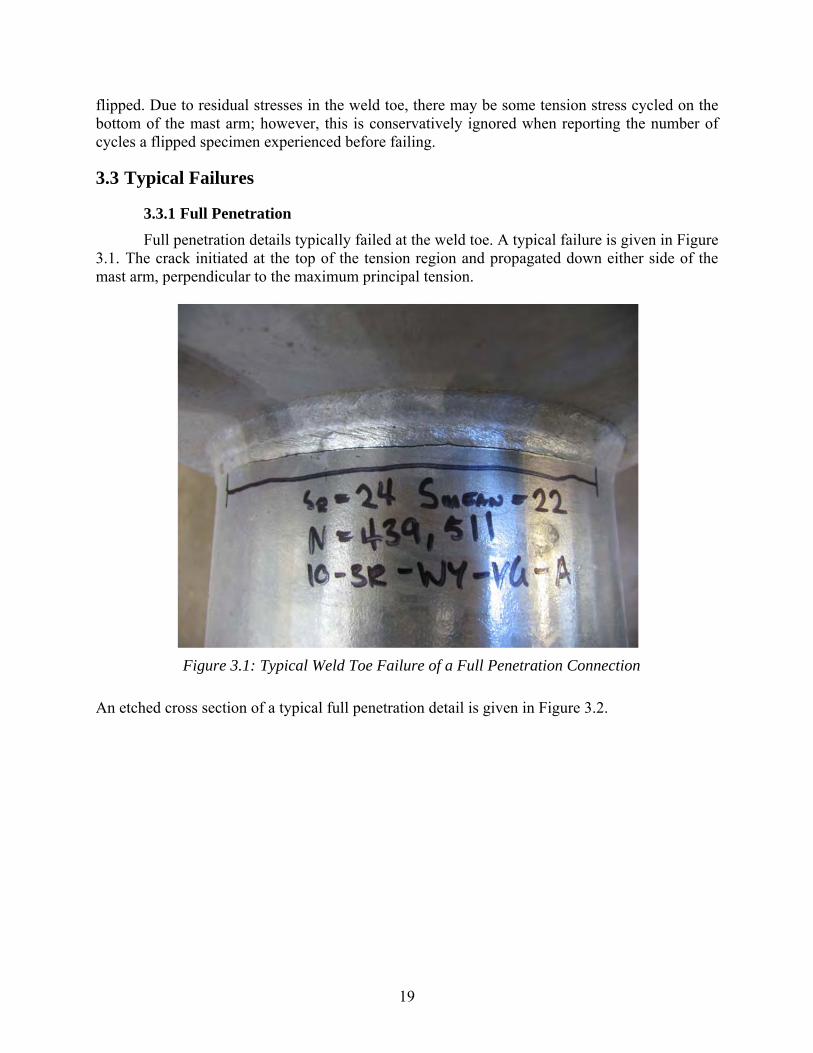
3.3.1 Full Penetration
Full penetration details typically failed at the weld toe. A typical failure is given in Figure 3.1. The crack initiated at the top of the tension region and propagated down either side of the mast arm, perpendicular to the maximum principal tension.
Figure 3.1: Typical Weld Toe Failure of a Full Penetration Connection
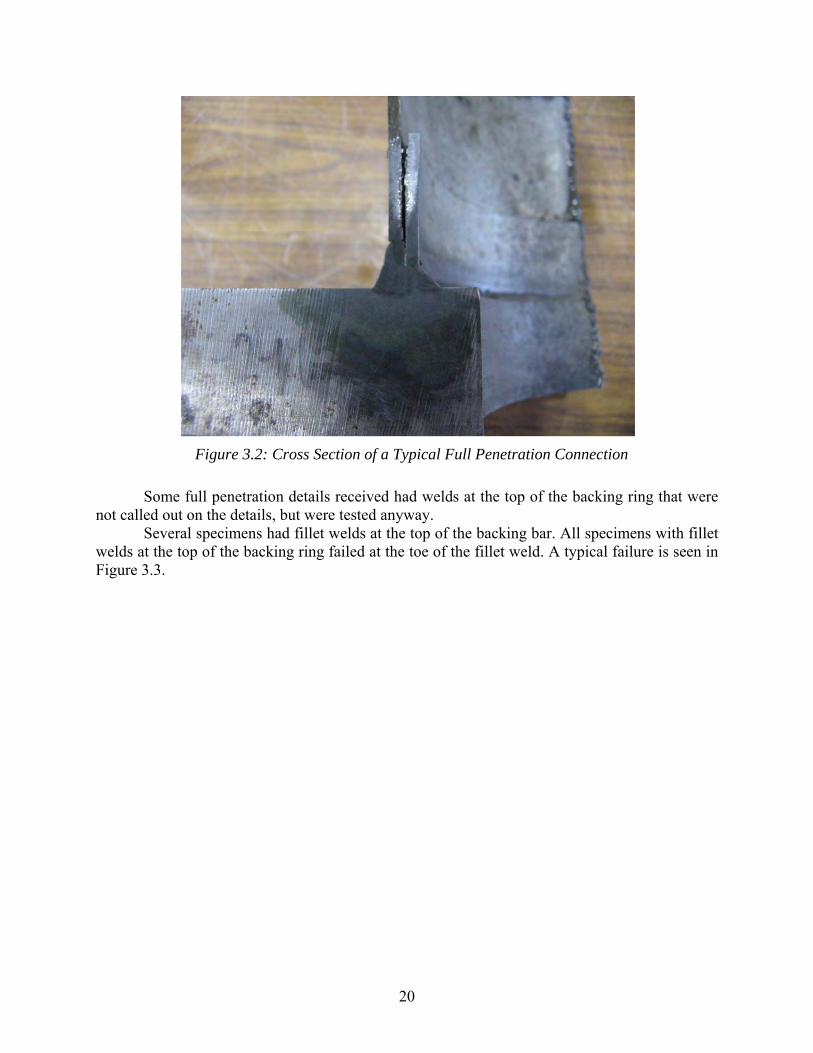
An etched cross section of a typical full penetration detail is given in Figure 3.2.
20
Figure 3.2: Cross Section of a Typical Full Penetration Connection
Some full penetration details received had welds at the top of the backing ring that were not called out on the details, but were tested anyway.
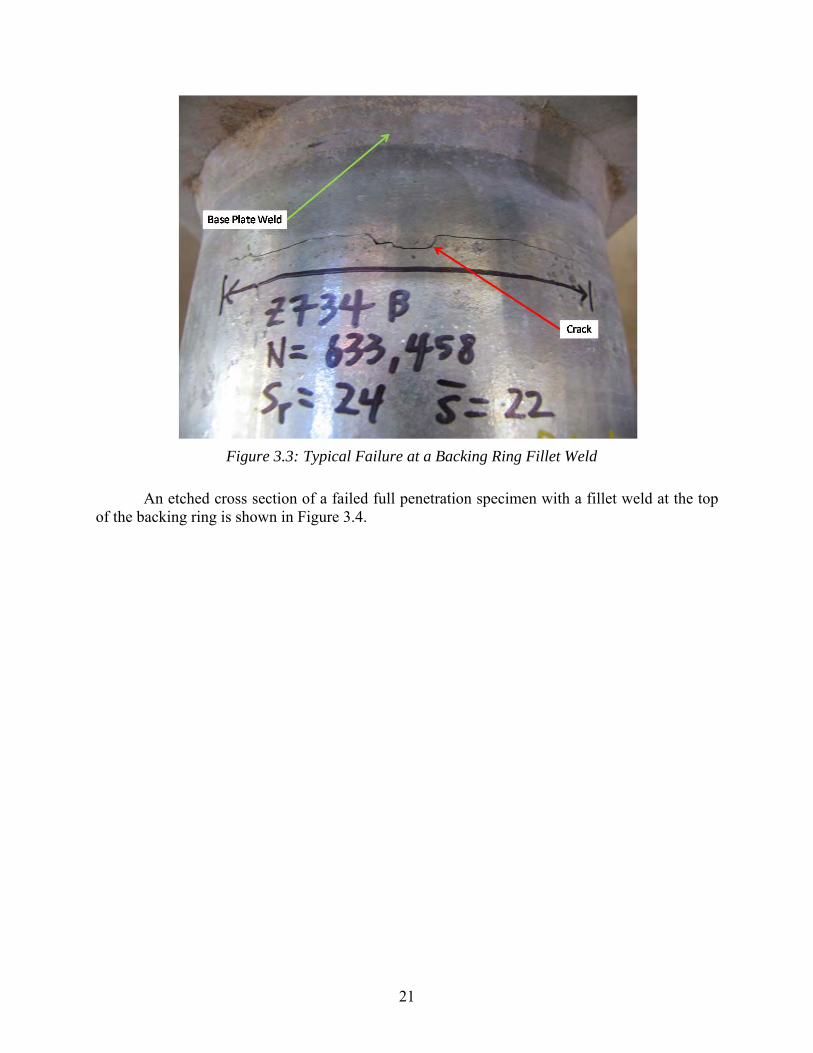
Several specimens had fillet welds at the top of the backing bar. All specimens with fillet welds at the top of the backing ring failed at the toe of the fillet weld. A typical failure is seen in Figure 3.3.
21
Figure 3.3: Typical Failure at a Backing Ring Fillet Weld
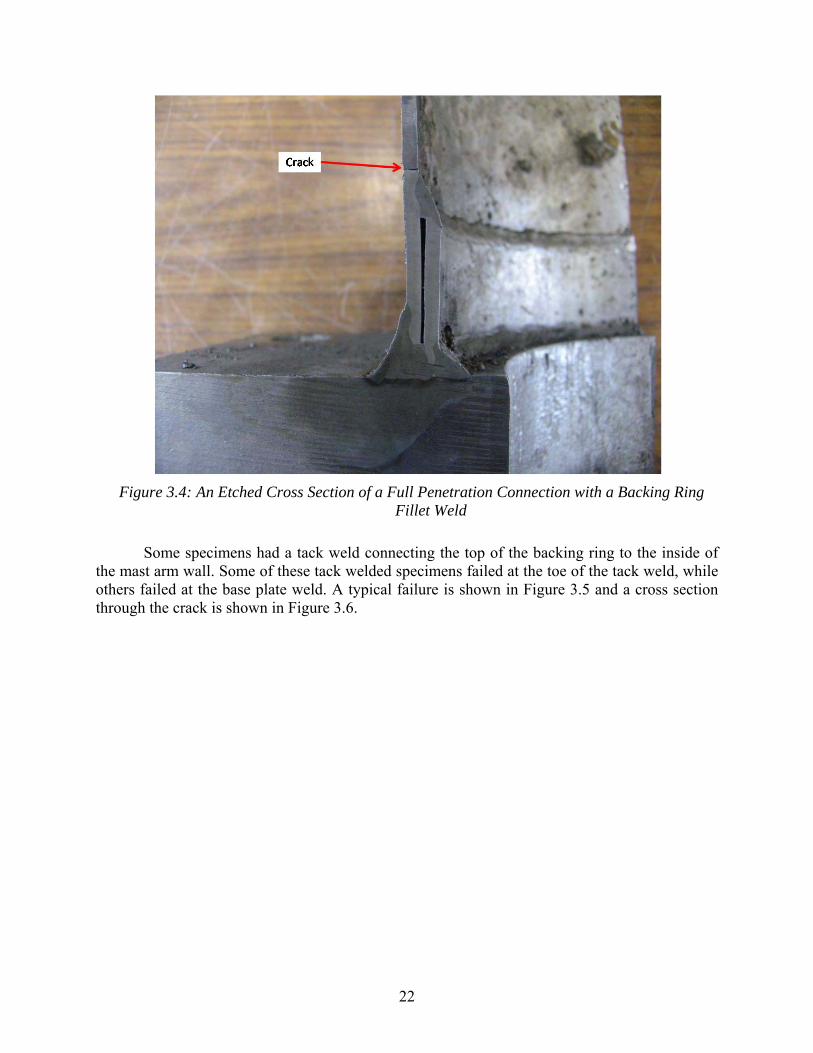
An etched cross section of a failed full penetration specimen with a fillet weld at the top of the backing ring is shown in Figure 3.4.
22
Figure 3.4: An Etched Cross Section of a Full Penetration Connection with a Backing Ring Fillet Weld
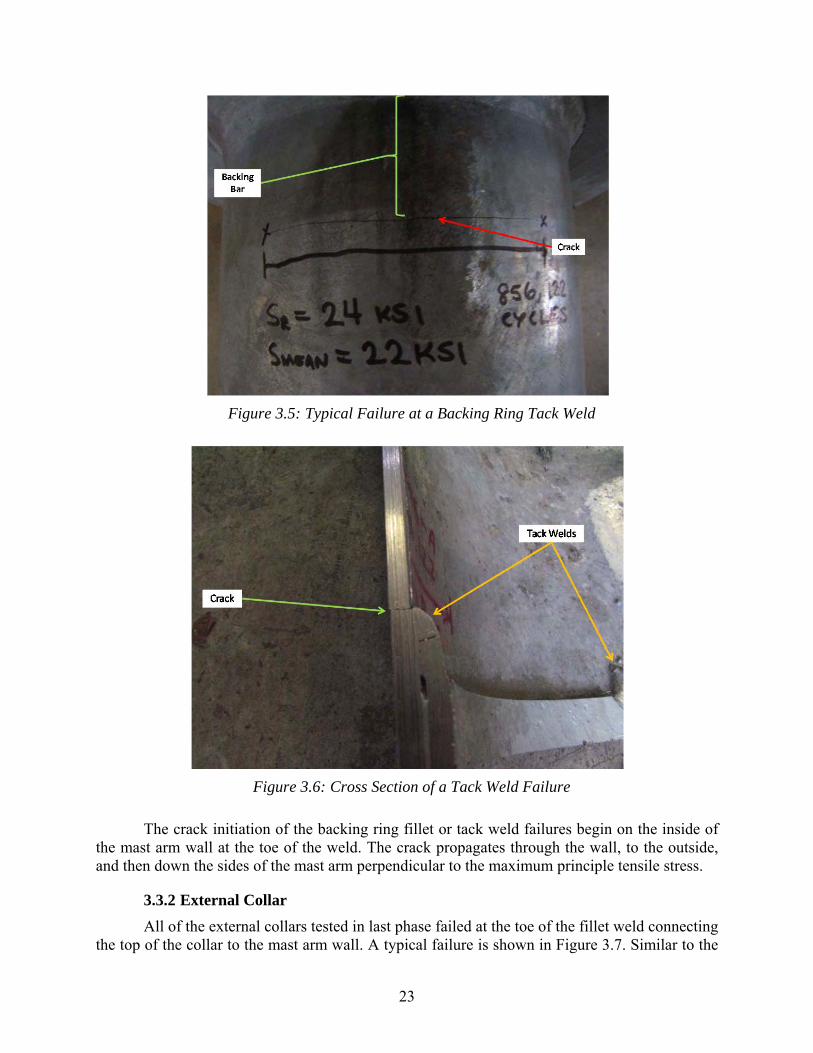
Some specimens had a tack weld connecting the top of the backing ring to the inside of the mast arm wall. Some of these tack welded specimens failed at the toe of the tack weld, while others failed at the base plate weld. A typical failure is shown in Figure 3.5 and a cross section through the crack is shown in Figure 3.6.
23
Figure 3.5: Typical Failure at a Backing Ring Tack Weld
Figure 3.6: Cross Section of a Tack Weld Failure
The crack initiation of the backing ring fillet or tack weld failures begin on the inside of the mast arm wall at the toe of the weld. The crack propagates through the wall, to the outside, and then down the sides of the mast arm perpendicular to the maximum principle tensile stress.
3.3.2 External Collar
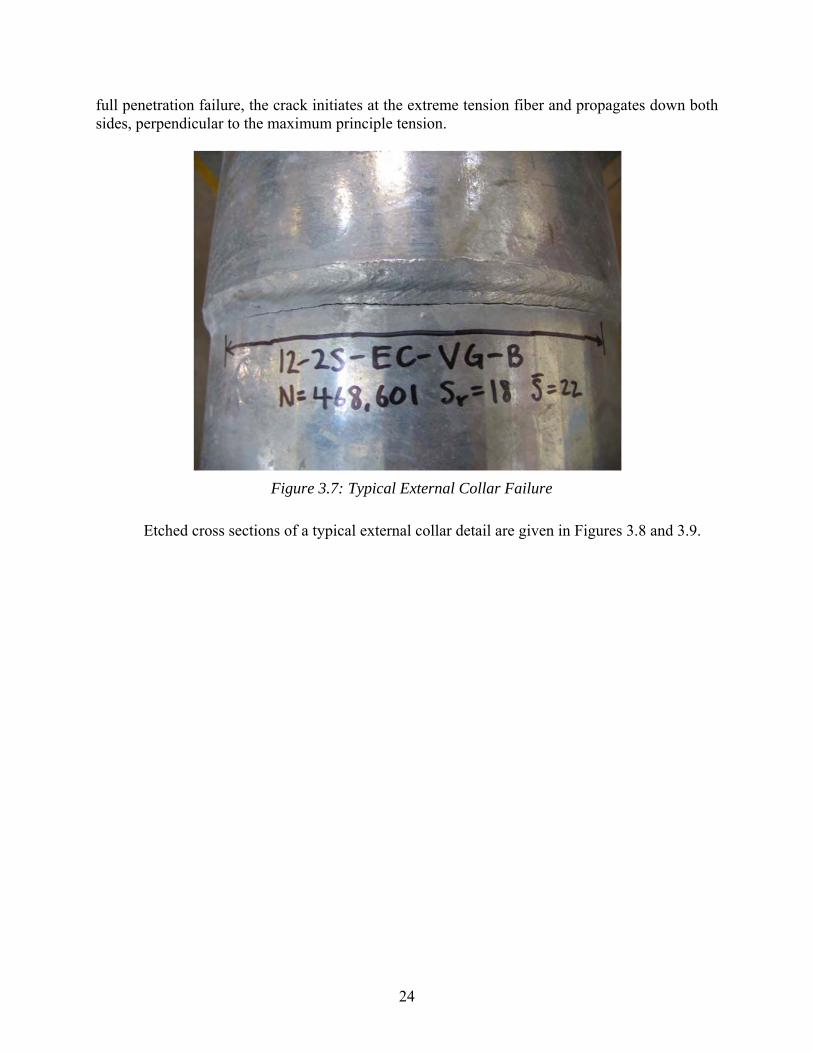
All of the external collars tested in last phase failed at the toe of the fillet weld connecting the top of the collar to the mast arm wall. A typical failure is shown in Figure 3.7. Similar to the
24
full penetration failure, the crack initiates at the extreme tension fiber and propagates down both sides, perpendicular to the maximum principle tension.
Figure 3.7: Typical External Collar Failure
Etched cross sections of a typical external collar detail are given in Figures 3.8 and 3.9.
25
Figure 3.8: A Cross Section of a Typical External Collar Detail
Figure 3.9: Close-up of the Collar Weld (Etched)
26
Previous external collar specimens had scalloped collars. A scalloped collar means that the distance from the base plate to the top of the collar varied around the mast arm. The predominant crack location of the scalloped external collars are at the base plate weld, except for two runouts and one that failed at the toe of the fillet weld that connects the top of the collar to the mast arm.
3.4 Results and Observations
The analysis of the results compares like specimens with only one variable changed in order to isolate the effect of that variable upon the fatigue performance. Many different variables were tested, which presents some difficulties in arranging the results into meaningful comparisons. The comparisons are arranged based on observations of the effects of specific variables and the findings from the finite element computer modeling.
3.4.1 Comparison of Octagonal and Round Mast Arms
3.4.1.1 Full Penetration Details
Round and octagonal mast arms with 3-in. base plates and 10-in. diameter mast arms (10-3R-WY) were studied with both full penetration details and external collar details. The influence of mast arm shape can be seen in Figure 3.10. The round full penetration detail contains data from three manufacturers. The two pairs of round specimens that performed between a Category B and a Category A were 10-3R-WY-UG (Union Metal) and 10-3R-WY-VG (Valmont). The Union Metal specimen was tested at 24 ksi to 1,873,499 cycles before failing and the two Valmont specimens experienced 8,037,420 cycles at a stress range of 18 ksi and did not fail (the two data points lie on top of each other on the graph and appear as one point). The two round data points that performed between a Category C and a Category B were the second tests of the 10-3R-WY-VG specimens, when the stress range was increased to 24 ksi. The stress range and cycle count reported for these specimens does not account for any fatigue damage that occurred during the first test at the 18-ksi stress range. This seems to be the case, because in the second test, the specimens did not perform in the same fatigue category as they did in the first test. The two round data points that performed between a Category D and a Category C were 10-3R-WY-AG (Ameron).
27
Figure 3.10: Comparison of Round and Octagonal Full Penetration Details
Only two octagonal specimens were tested at 10-3R-WY and were 10-3R-WY-PG (Pelco). These specimens performed between a Category B and a Category A.
A comparison of the coefficient A for each detail tested is given in Table 3.3. Specimens were tested in pairs and the mean value of A is given. The AASHTO categories given in Table 3.3 were determined only by comparing the coefficient A and not account for the constant amplitude fatigue region.
Table 3.3: Comparison of Round and Octagonal Full Penetration Details
Specimen Fatigue Coefficient A AASHTO Category 10-3R-WY-VG (Sr = 18-ksi) 4.687 X 10¹⁰ A 10-3R-WY-VG (SR = 24-ksi) 5.412 X 10⁹ C
10-3R-WY-UG 2.590 X 10¹⁰ B 10-3R-WY-AG 3.011 X 10⁹ D
10-3R-WY-PG (Octagonal) 1.716 X 10¹⁰ B
Computer models were analyzed to compare round full penetration mast arms with octagonal full penetration mast arms. The analytical results matched the experimental result; the predicted fatigue performance of the two mast arm geometries was essentially the same.
In light of the similar performance from the Pelco, Union Metal, and Valmont specimens tested at a stress range of 18 ksi, and the results from the computer models, the full penetration detail shows no practical difference between octagonal mast arms and round mast arms. In subsequent figures, octagonal mast arms are grouped together with round mast arms of similar geometries.
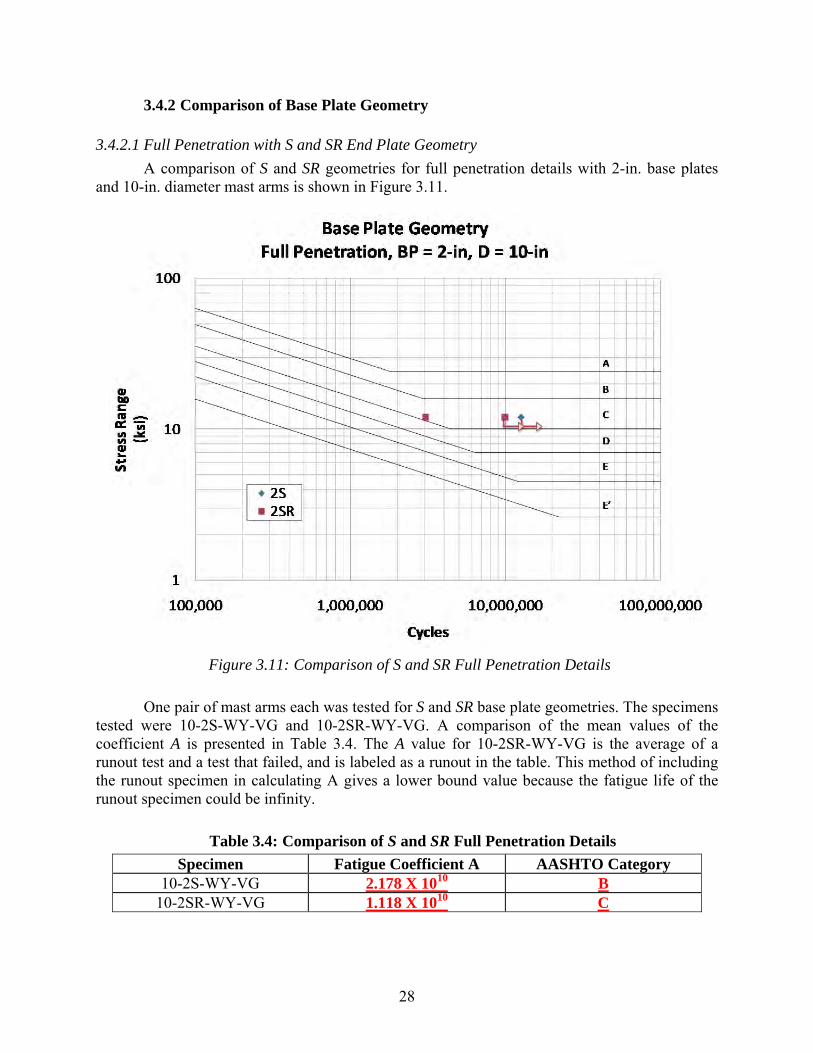
28
3.4.2 Comparison of Base Plate Geometry
3.4.2.1 Full Penetration with S and SR End Plate Geometry
A comparison of S and SR geometries for full penetration details with 2-in. base plates and 10-in. diameter mast arms is shown in Figure 3.11.
Figure 3.11: Comparison of S and SR Full Penetration Details
One pair of mast arms each was tested for S and SR base plate geometries. The specimens tested were 10-2S-WY-VG and 10-2SR-WY-VG. A comparison of the mean values of the coefficient A is presented in Table 3.4. The A value for 10-2SR-WY-VG is the average of a runout test and a test that failed, and is labeled as a runout in the table. This method of including the runout specimen in calculating A gives a lower bound value because the fatigue life of the runout specimen could be infinity.
Table 3.4: Comparison of S and SR Full Penetration Details
Specimen Fatigue Coefficient A AASHTO Category 10-2S-WY-VG 2.178 X 10¹⁰ B
10-2SR-WY-VG 1.118 X 10¹⁰ C
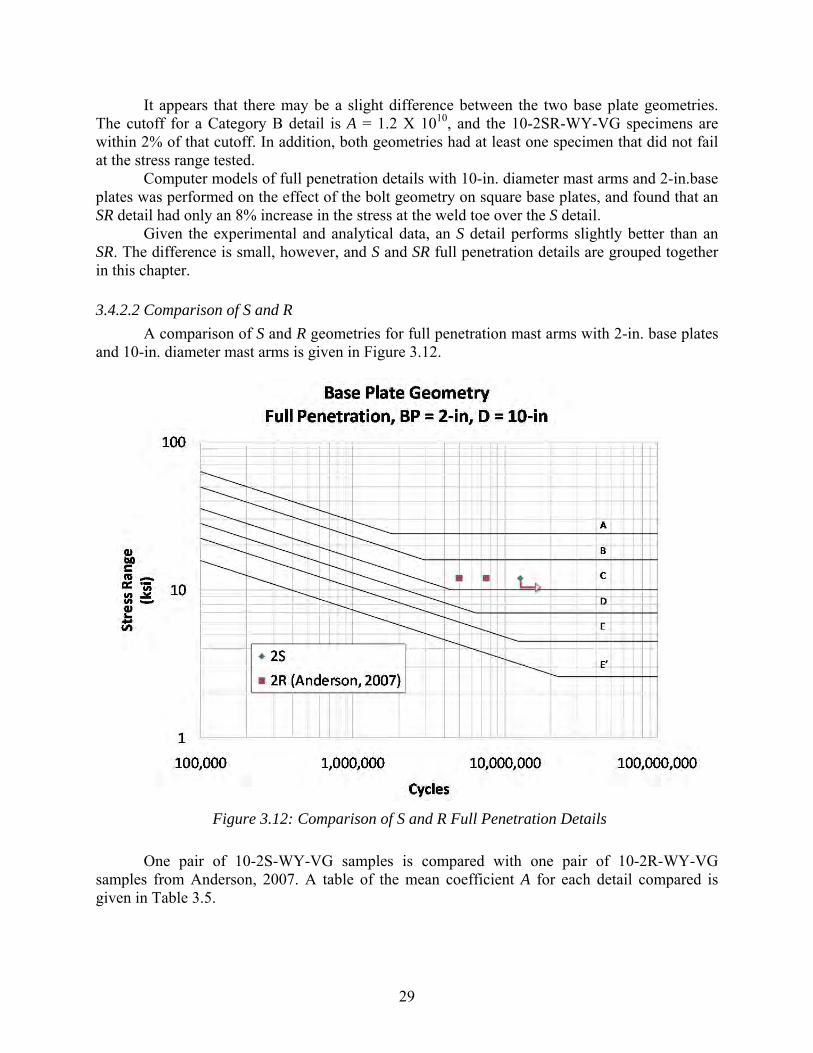
29
It appears that there may be a slight difference between the two base plate geometries. The cutoff for a Category B detail is A = 1.2 X 10¹⁰, and the 10-2SR-WY-VG specimens are within 2% of that cutoff. In addition, both geometries had at least one specimen that did not fail at the stress range tested.
Computer models of full penetration details with 10-in. diameter mast arms and 2-in.base plates was performed on the effect of the bolt geometry on square base plates, and found that an SR detail had only an 8% increase in the stress at the weld toe over the S detail.
Given the experimental and analytical data, an S detail performs slightly better than an SR. The difference is small, however, and S and SR full penetration details are grouped together in this chapter.
3.4.2.2 Comparison of S and R
A comparison of S and R geometries for full penetration mast arms with 2-in. base plates and 10-in. diameter mast arms is given in Figure 3.12.
Figure 3.12: Comparison of S and R Full Penetration Details
One pair of 10-2S-WY-VG samples is compared with one pair of 10-2R-WY-VG samples from Anderson, 2007. A table of the mean coefficient A for each detail compared is given in Table 3.5.
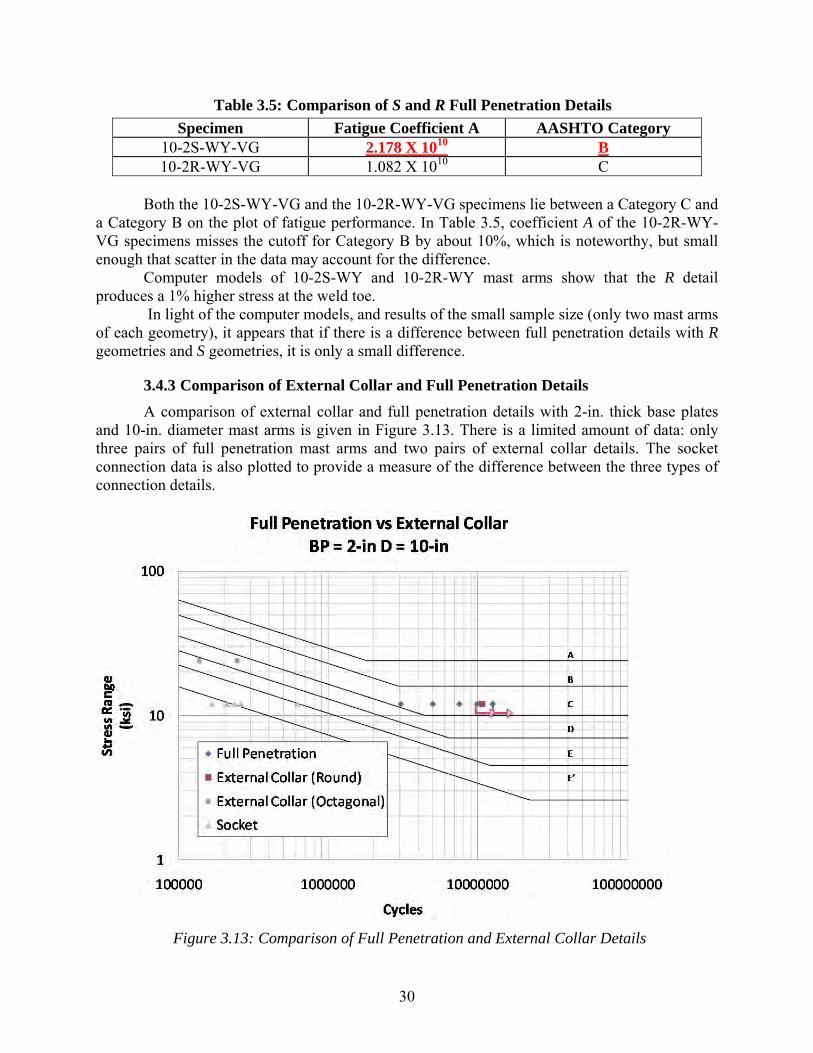
30
Table 3.5: Comparison of S and R Full Penetration Details
Specimen Fatigue Coefficient A AASHTO Category 10-2S-WY-VG 2.178 X 10¹⁰ B 10-2R-WY-VG 1.082 X 10¹⁰ C
Both the 10-2S-WY-VG and the 10-2R-WY-VG specimens lie between a Category C and
a Category B on the plot of fatigue performance. In Table 3.5, coefficient A of the 10-2R-WY-VG specimens misses the cutoff for Category B by about 10%, which is noteworthy, but small enough that scatter in the data may account for the difference.
Computer models of 10-2S-WY and 10-2R-WY mast arms show that the R detail produces a 1% higher stress at the weld toe.
In light of the computer models, and results of the small sample size (only two mast arms of each geometry), it appears that if there is a difference between full penetration details with R geometries and S geometries, it is only a small difference.
3.4.3 Comparison of External Collar and Full Penetration Details
A comparison of external collar and full penetration details with 2-in. thick base plates and 10-in. diameter mast arms is given in Figure 3.13. There is a limited amount of data: only three pairs of full penetration mast arms and two pairs of external collar details. The socket connection data is also plotted to provide a measure of the difference between the three types of connection details.
Figure 3.13: Comparison of Full Penetration and External Collar Details
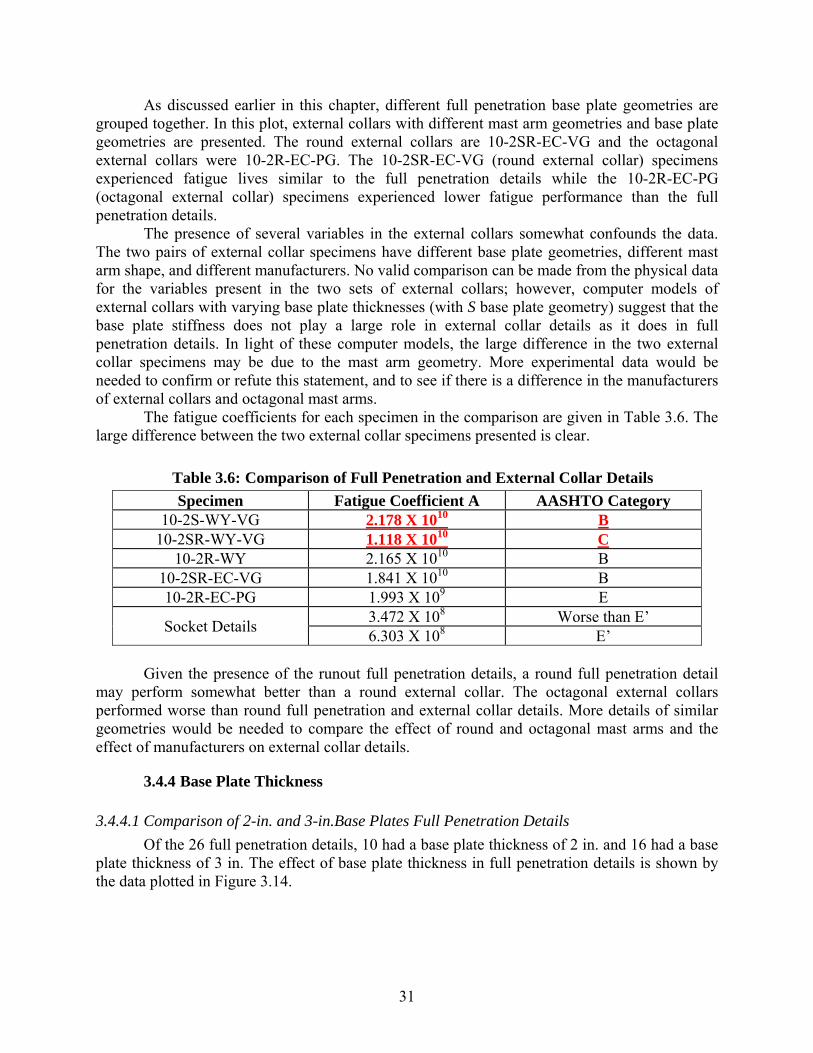
31
As discussed earlier in this chapter, different full penetration base plate geometries are grouped together. In this plot, external collars with different mast arm geometries and base plate geometries are presented. The round external collars are 10-2SR-EC-VG and the octagonal external collars were 10-2R-EC-PG. The 10-2SR-EC-VG (round external collar) specimens experienced fatigue lives similar to the full penetration details while the 10-2R-EC-PG (octagonal external collar) specimens experienced lower fatigue performance than the full penetration details.
The presence of several variables in the external collars somewhat confounds the data. The two pairs of external collar specimens have different base plate geometries, different mast arm shape, and different manufacturers. No valid comparison can be made from the physical data for the variables present in the two sets of external collars; however, computer models of external collars with varying base plate thicknesses (with S base plate geometry) suggest that the base plate stiffness does not play a large role in external collar details as it does in full penetration details. In light of these computer models, the large difference in the two external collar specimens may be due to the mast arm geometry. More experimental data would be needed to confirm or refute this statement, and to see if there is a difference in the manufacturers of external collars and octagonal mast arms.
The fatigue coefficients for each specimen in the comparison are given in Table 3.6. The large difference between the two external collar specimens presented is clear.
Table 3.6: Comparison of Full Penetration and External Collar Details
Specimen Fatigue Coefficient A AASHTO Category 10-2S-WY-VG 2.178 X 10¹⁰ B
10-2SR-WY-VG 1.118 X 10¹⁰ C 10-2R-WY 2.165 X 10¹⁰ B
10-2SR-EC-VG 1.841 X 10¹⁰ B 10-2R-EC-PG 1.993 X 10⁹ E
Socket Details 3.472 X 10⁸ Worse than E’ 6.303 X 10⁸ E’
Given the presence of the runout full penetration details, a round full penetration detail
may perform somewhat better than a round external collar. The octagonal external collars performed worse than round full penetration and external collar details. More details of similar geometries would be needed to compare the effect of round and octagonal mast arms and the effect of manufacturers on external collar details.
3.4.4 Base Plate Thickness
3.4.4.1 Comparison of 2-in. and 3-in.Base Plates Full Penetration Details
Of the 26 full penetration details, 10 had a base plate thickness of 2 in. and 16 had a base plate thickness of 3 in. The effect of base plate thickness in full penetration details is shown by the data plotted in Figure 3.14.
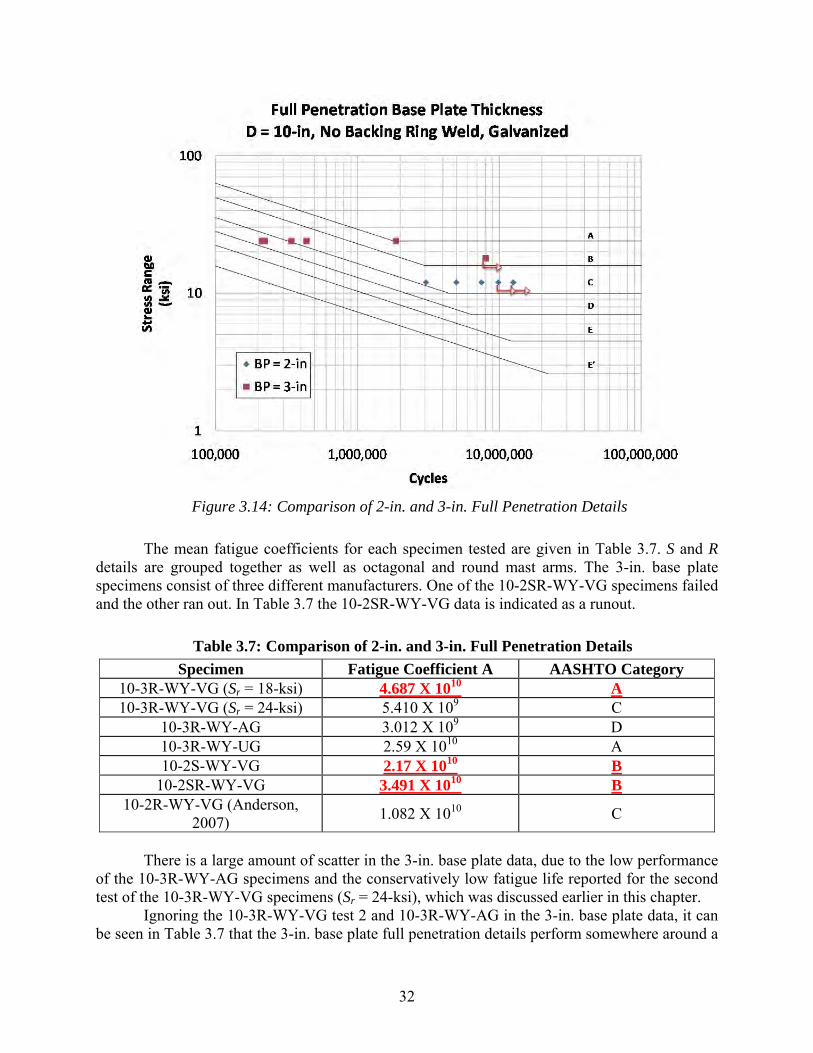
32
Figure 3.14: Comparison of 2-in. and 3-in. Full Penetration Details
The mean fatigue coefficients for each specimen tested are given in Table 3.7. S and R details are grouped together as well as octagonal and round mast arms. The 3-in. base plate specimens consist of three different manufacturers. One of the 10-2SR-WY-VG specimens failed and the other ran out. In Table 3.7 the 10-2SR-WY-VG data is indicated as a runout.
Table 3.7: Comparison of 2-in. and 3-in. Full Penetration Details
Specimen Fatigue Coefficient A AASHTO Category 10-3R-WY-VG (Sr = 18-ksi) 4.687 X 10¹⁰ A 10-3R-WY-VG (Sr = 24-ksi) 5.410 X 10⁹ C
10-3R-WY-AG 3.012 X 10⁹ D 10-3R-WY-UG 2.59 X 10¹⁰ A 10-2S-WY-VG 2.17 X 10¹⁰ B
10-2SR-WY-VG 3.491 X 10¹⁰ B 10-2R-WY-VG (Anderson,
2007) 1.082 X 10¹⁰ C
There is a large amount of scatter in the 3-in. base plate data, due to the low performance
of the 10-3R-WY-AG specimens and the conservatively low fatigue life reported for the second test of the 10-3R-WY-VG specimens (Sr = 24-ksi), which was discussed earlier in this chapter.
Ignoring the 10-3R-WY-VG test 2 and 10-3R-WY-AG in the 3-in. base plate data, it can be seen in Table 3.7 that the 3-in. base plate full penetration details perform somewhere around a
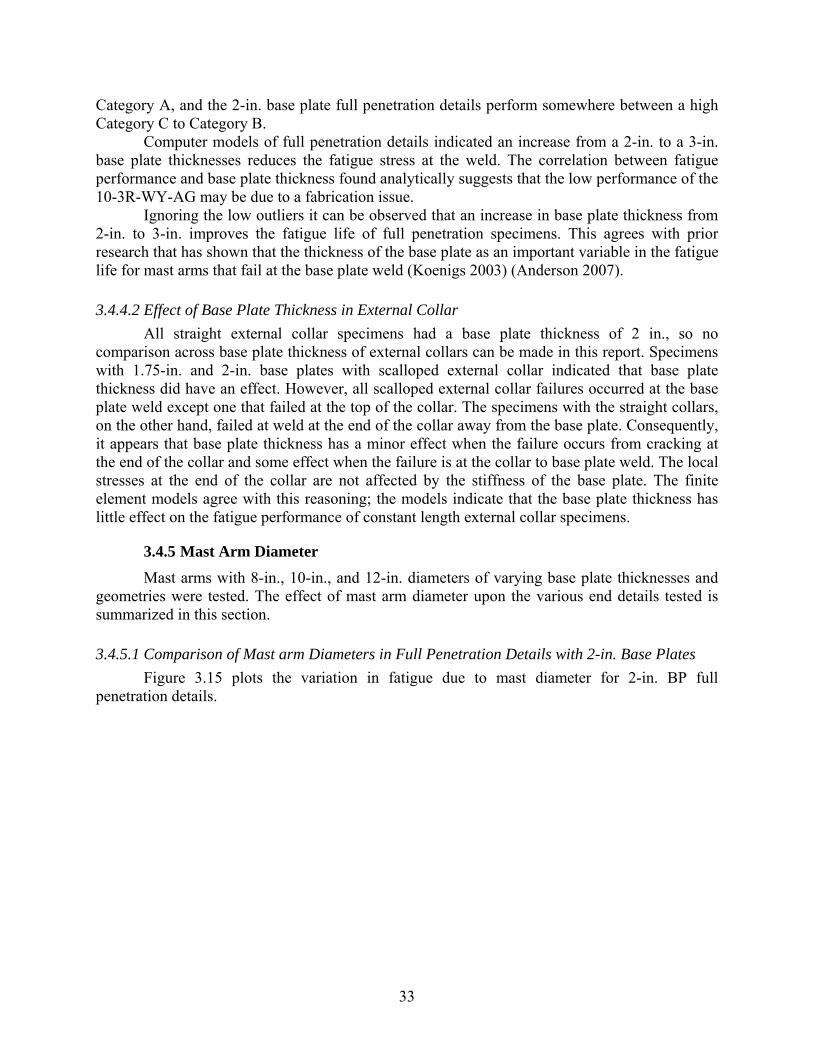
33
Category A, and the 2-in. base plate full penetration details perform somewhere between a high Category C to Category B.
Computer models of full penetration details indicated an increase from a 2-in. to a 3-in. base plate thicknesses reduces the fatigue stress at the weld. The correlation between fatigue performance and base plate thickness found analytically suggests that the low performance of the 10-3R-WY-AG may be due to a fabrication issue.
Ignoring the low outliers it can be observed that an increase in base plate thickness from 2-in. to 3-in. improves the fatigue life of full penetration specimens. This agrees with prior research that has shown that the thickness of the base plate as an important variable in the fatigue life for mast arms that fail at the base plate weld (Koenigs 2003) (Anderson 2007).
3.4.4.2 Effect of Base Plate Thickness in External Collar
All straight external collar specimens had a base plate thickness of 2 in., so no comparison across base plate thickness of external collars can be made in this report. Specimens with 1.75-in. and 2-in. base plates with scalloped external collar indicated that base plate thickness did have an effect. However, all scalloped external collar failures occurred at the base plate weld except one that failed at the top of the collar. The specimens with the straight collars, on the other hand, failed at weld at the end of the collar away from the base plate. Consequently, it appears that base plate thickness has a minor effect when the failure occurs from cracking at the end of the collar and some effect when the failure is at the collar to base plate weld. The local stresses at the end of the collar are not affected by the stiffness of the base plate. The finite element models agree with this reasoning; the models indicate that the base plate thickness has little effect on the fatigue performance of constant length external collar specimens.
3.4.5 Mast Arm Diameter
Mast arms with 8-in., 10-in., and 12-in. diameters of varying base plate thicknesses and geometries were tested. The effect of mast arm diameter upon the various end details tested is summarized in this section.
3.4.5.1 Comparison of Mast arm Diameters in Full Penetration Details with 2-in. Base Plates
Figure 3.15 plots the variation in fatigue due to mast diameter for 2-in. BP full penetration details.
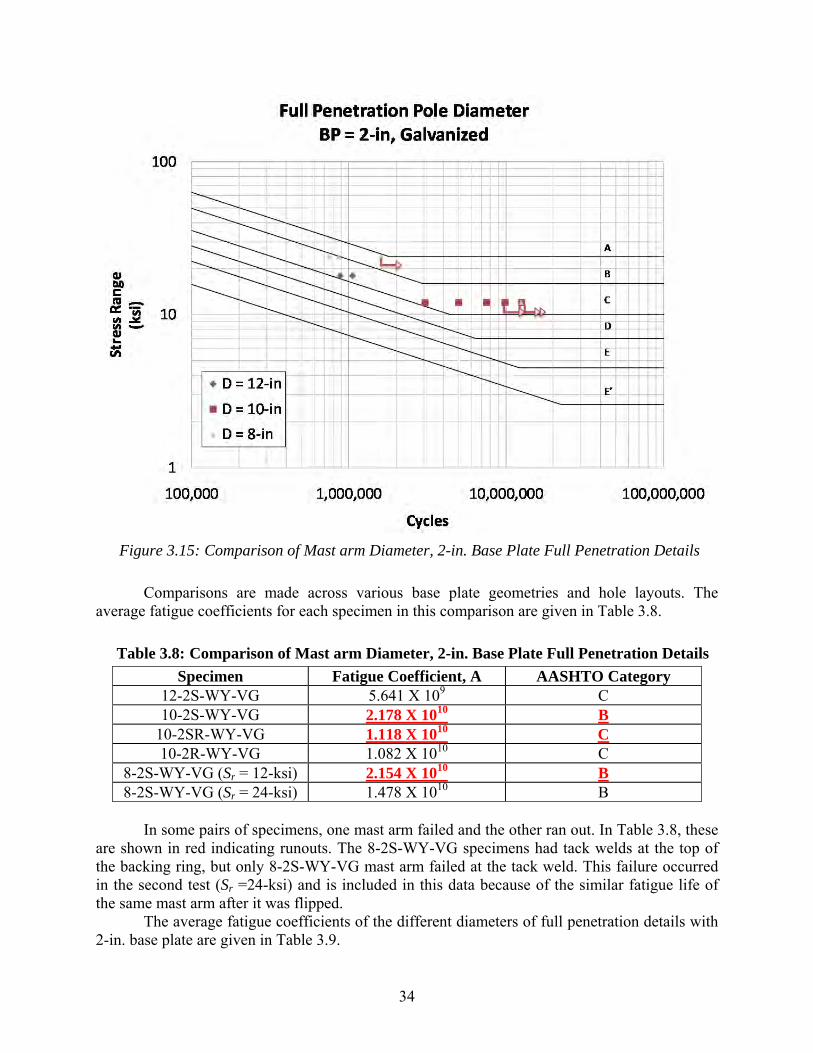
34
Figure 3.15: Comparison of Mast arm Diameter, 2-in. Base Plate Full Penetration Details
Comparisons are made across various base plate geometries and hole layouts. The average fatigue coefficients for each specimen in this comparison are given in Table 3.8.
Table 3.8: Comparison of Mast arm Diameter, 2-in. Base Plate Full Penetration Details
Specimen Fatigue Coefficient, A AASHTO Category 12-2S-WY-VG 5.641 X 10⁹ C 10-2S-WY-VG 2.178 X 10¹⁰ B
10-2SR-WY-VG 1.118 X 10¹⁰ C 10-2R-WY-VG 1.082 X 10¹⁰ C
8-2S-WY-VG (Sr = 12-ksi) 2.154 X 10¹⁰ B 8-2S-WY-VG (Sr = 24-ksi) 1.478 X 10¹⁰ B
In some pairs of specimens, one mast arm failed and the other ran out. In Table 3.8, these
are shown in red indicating runouts. The 8-2S-WY-VG specimens had tack welds at the top of the backing ring, but only 8-2S-WY-VG mast arm failed at the tack weld. This failure occurred in the second test (Sr =24-ksi) and is included in this data because of the similar fatigue life of the same mast arm after it was flipped.
The average fatigue coefficients of the different diameters of full penetration details with 2-in. base plate are given in Table 3.9.
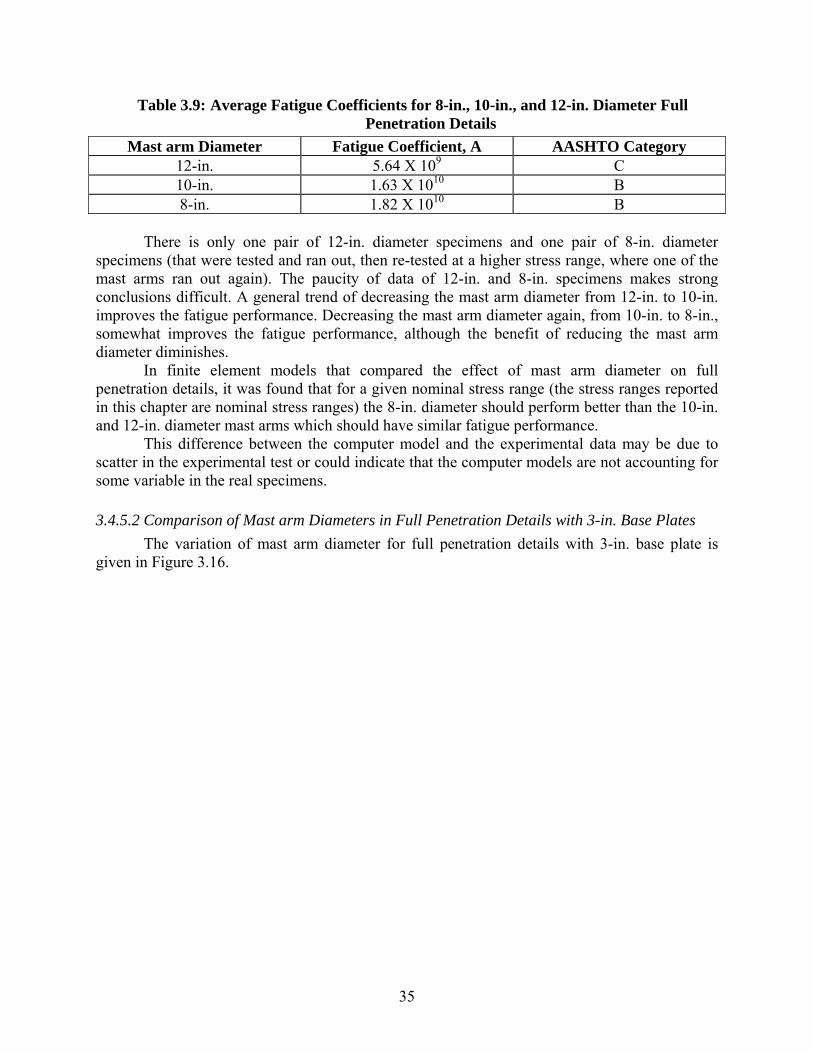
35
Table 3.9: Average Fatigue Coefficients for 8-in., 10-in., and 12-in. Diameter Full Penetration Details
Mast arm Diameter Fatigue Coefficient, A AASHTO Category 12-in. 5.64 X 10⁹ C 10-in. 1.63 X 10¹⁰ B 8-in. 1.82 X 10¹⁰ B
There is only one pair of 12-in. diameter specimens and one pair of 8-in. diameter
specimens (that were tested and ran out, then re-tested at a higher stress range, where one of the mast arms ran out again). The paucity of data of 12-in. and 8-in. specimens makes strong conclusions difficult. A general trend of decreasing the mast arm diameter from 12-in. to 10-in. improves the fatigue performance. Decreasing the mast arm diameter again, from 10-in. to 8-in., somewhat improves the fatigue performance, although the benefit of reducing the mast arm diameter diminishes.
In finite element models that compared the effect of mast arm diameter on full penetration details, it was found that for a given nominal stress range (the stress ranges reported in this chapter are nominal stress ranges) the 8-in. diameter should perform better than the 10-in. and 12-in. diameter mast arms which should have similar fatigue performance.
This difference between the computer model and the experimental data may be due to scatter in the experimental test or could indicate that the computer models are not accounting for some variable in the real specimens.
3.4.5.2 Comparison of Mast arm Diameters in Full Penetration Details with 3-in. Base Plates
The variation of mast arm diameter for full penetration details with 3-in. base plate is given in Figure 3.16.
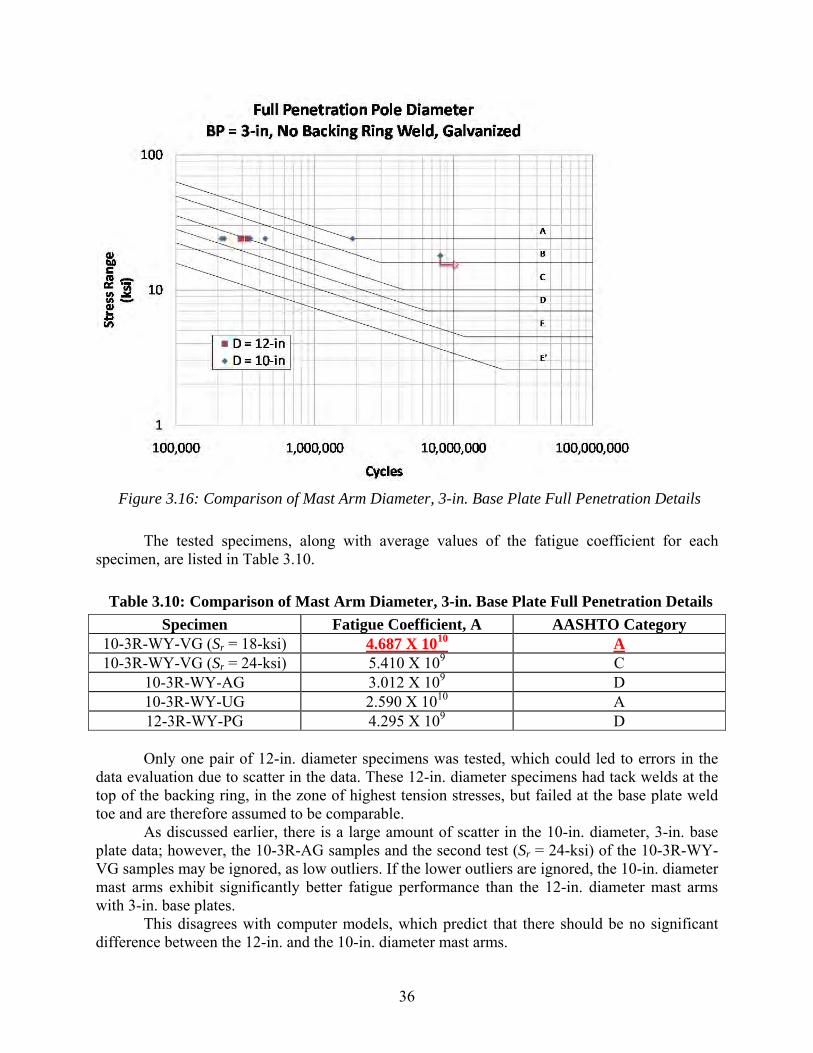
36
Figure 3.16: Comparison of Mast Arm Diameter, 3-in. Base Plate Full Penetration Details
The tested specimens, along with average values of the fatigue coefficient for each specimen, are listed in Table 3.10.
Table 3.10: Comparison of Mast Arm Diameter, 3-in. Base Plate Full Penetration Details
Specimen Fatigue Coefficient, A AASHTO Category 10-3R-WY-VG (Sr = 18-ksi) 4.687 X 10¹⁰ A 10-3R-WY-VG (Sr = 24-ksi) 5.410 X 10⁹ C
10-3R-WY-AG 3.012 X 10⁹ D 10-3R-WY-UG 2.590 X 10¹⁰ A 12-3R-WY-PG 4.295 X 10⁹ D
Only one pair of 12-in. diameter specimens was tested, which could led to errors in the
data evaluation due to scatter in the data. These 12-in. diameter specimens had tack welds at the top of the backing ring, in the zone of highest tension stresses, but failed at the base plate weld toe and are therefore assumed to be comparable.
As discussed earlier, there is a large amount of scatter in the 10-in. diameter, 3-in. base plate data; however, the 10-3R-AG samples and the second test (Sr = 24-ksi) of the 10-3R-WY-VG samples may be ignored, as low outliers. If the lower outliers are ignored, the 10-in. diameter mast arms exhibit significantly better fatigue performance than the 12-in. diameter mast arms with 3-in. base plates.
This disagrees with computer models, which predict that there should be no significant difference between the 12-in. and the 10-in. diameter mast arms.
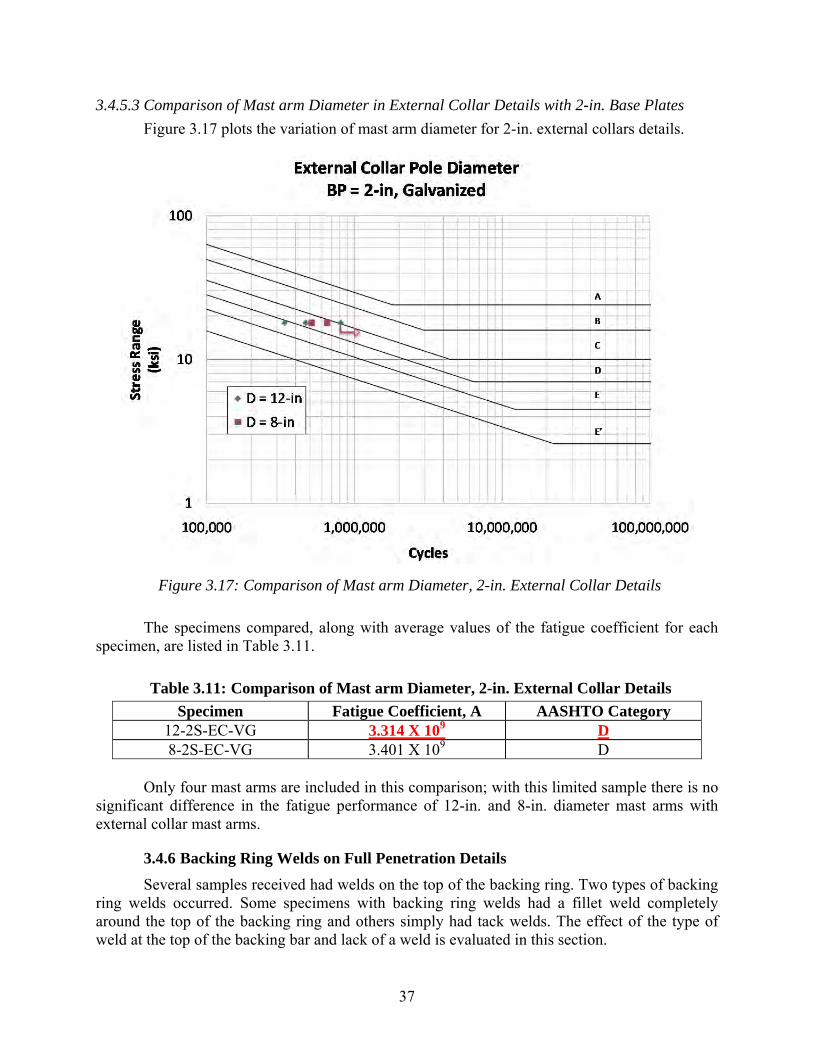
37
3.4.5.3 Comparison of Mast arm Diameter in External Collar Details with 2-in. Base Plates
Figure 3.17 plots the variation of mast arm diameter for 2-in. external collars details.
Figure 3.17: Comparison of Mast arm Diameter, 2-in. External Collar Details
The specimens compared, along with average values of the fatigue coefficient for each specimen, are listed in Table 3.11.
Table 3.11: Comparison of Mast arm Diameter, 2-in. External Collar Details
Specimen Fatigue Coefficient, A AASHTO Category 12-2S-EC-VG 3.314 X 10⁹ D 8-2S-EC-VG 3.401 X 10⁹ D
Only four mast arms are included in this comparison; with this limited sample there is no
significant difference in the fatigue performance of 12-in. and 8-in. diameter mast arms with external collar mast arms.
3.4.6 Backing Ring Welds on Full Penetration Details
Several samples received had welds on the top of the backing ring. Two types of backing ring welds occurred. Some specimens with backing ring welds had a fillet weld completely around the top of the backing ring and others simply had tack welds. The effect of the type of weld at the top of the backing bar and lack of a weld is evaluated in this section.
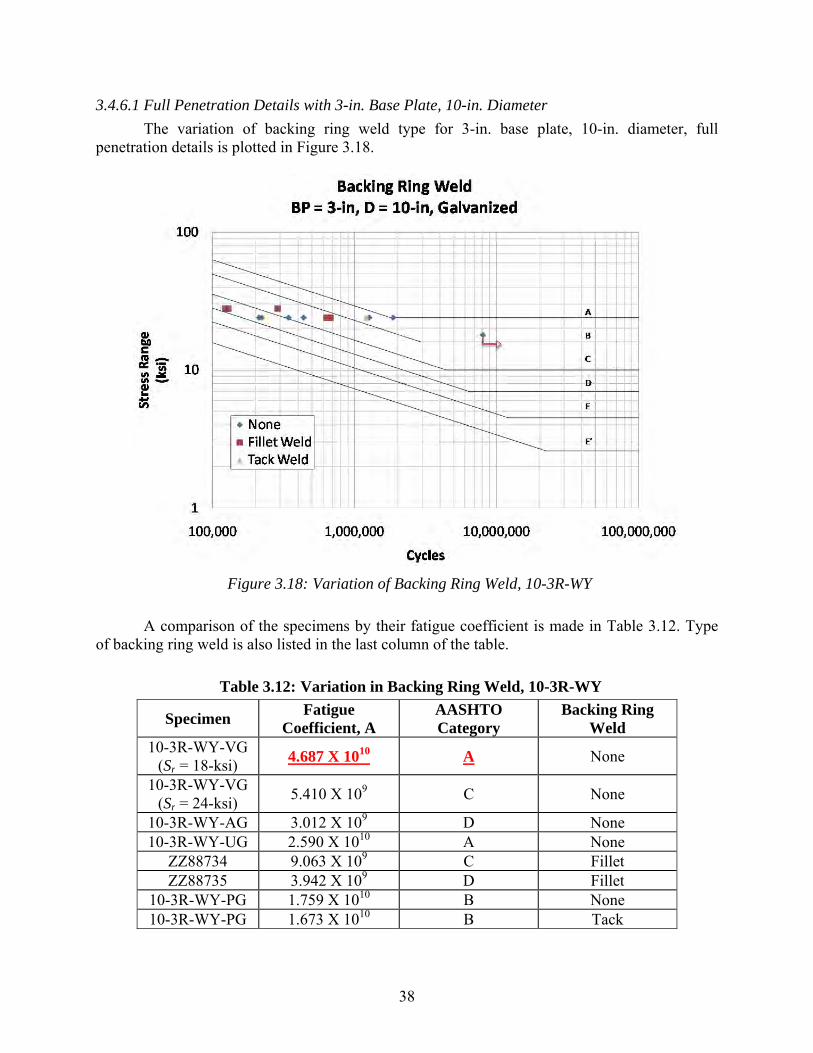
38
3.4.6.1 Full Penetration Details with 3-in. Base Plate, 10-in. Diameter
The variation of backing ring weld type for 3-in. base plate, 10-in. diameter, full penetration details is plotted in Figure 3.18.
Figure 3.18: Variation of Backing Ring Weld, 10-3R-WY
A comparison of the specimens by their fatigue coefficient is made in Table 3.12. Type of backing ring weld is also listed in the last column of the table.
Table 3.12: Variation in Backing Ring Weld, 10-3R-WY
Specimen Fatigue
Coefficient, A AASHTO Category
Backing Ring Weld
10-3R-WY-VG (Sr = 18-ksi)
4.687 X 10¹⁰ A None
10-3R-WY-VG (Sr = 24-ksi)
5.410 X 10⁹ C None
10-3R-WY-AG 3.012 X 10⁹ D None 10-3R-WY-UG 2.590 X 10¹⁰ A None
ZZ88734 9.063 X 10⁹ C Fillet ZZ88735 3.942 X 10⁹ D Fillet
10-3R-WY-PG 1.759 X 10¹⁰ B None 10-3R-WY-PG 1.673 X 10¹⁰ B Tack
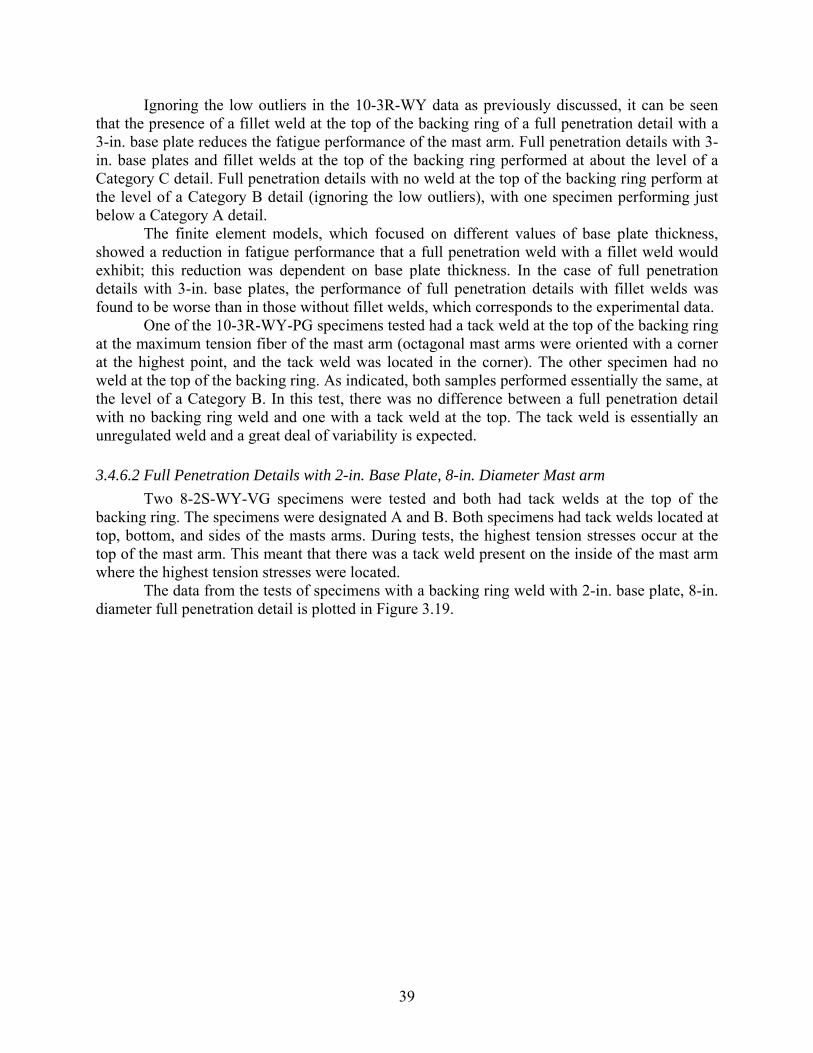
39
Ignoring the low outliers in the 10-3R-WY data as previously discussed, it can be seen that the presence of a fillet weld at the top of the backing ring of a full penetration detail with a 3-in. base plate reduces the fatigue performance of the mast arm. Full penetration details with 3-in. base plates and fillet welds at the top of the backing ring performed at about the level of a Category C detail. Full penetration details with no weld at the top of the backing ring perform at the level of a Category B detail (ignoring the low outliers), with one specimen performing just below a Category A detail.
The finite element models, which focused on different values of base plate thickness, showed a reduction in fatigue performance that a full penetration weld with a fillet weld would exhibit; this reduction was dependent on base plate thickness. In the case of full penetration details with 3-in. base plates, the performance of full penetration details with fillet welds was found to be worse than in those without fillet welds, which corresponds to the experimental data.
One of the 10-3R-WY-PG specimens tested had a tack weld at the top of the backing ring at the maximum tension fiber of the mast arm (octagonal mast arms were oriented with a corner at the highest point, and the tack weld was located in the corner). The other specimen had no weld at the top of the backing ring. As indicated, both samples performed essentially the same, at the level of a Category B. In this test, there was no difference between a full penetration detail with no backing ring weld and one with a tack weld at the top. The tack weld is essentially an unregulated weld and a great deal of variability is expected.
3.4.6.2 Full Penetration Details with 2-in. Base Plate, 8-in. Diameter Mast arm
Two 8-2S-WY-VG specimens were tested and both had tack welds at the top of the backing ring. The specimens were designated A and B. Both specimens had tack welds located at top, bottom, and sides of the masts arms. During tests, the highest tension stresses occur at the top of the mast arm. This meant that there was a tack weld present on the inside of the mast arm where the highest tension stresses were located.
The data from the tests of specimens with a backing ring weld with 2-in. base plate, 8-in. diameter full penetration detail is plotted in Figure 3.19.
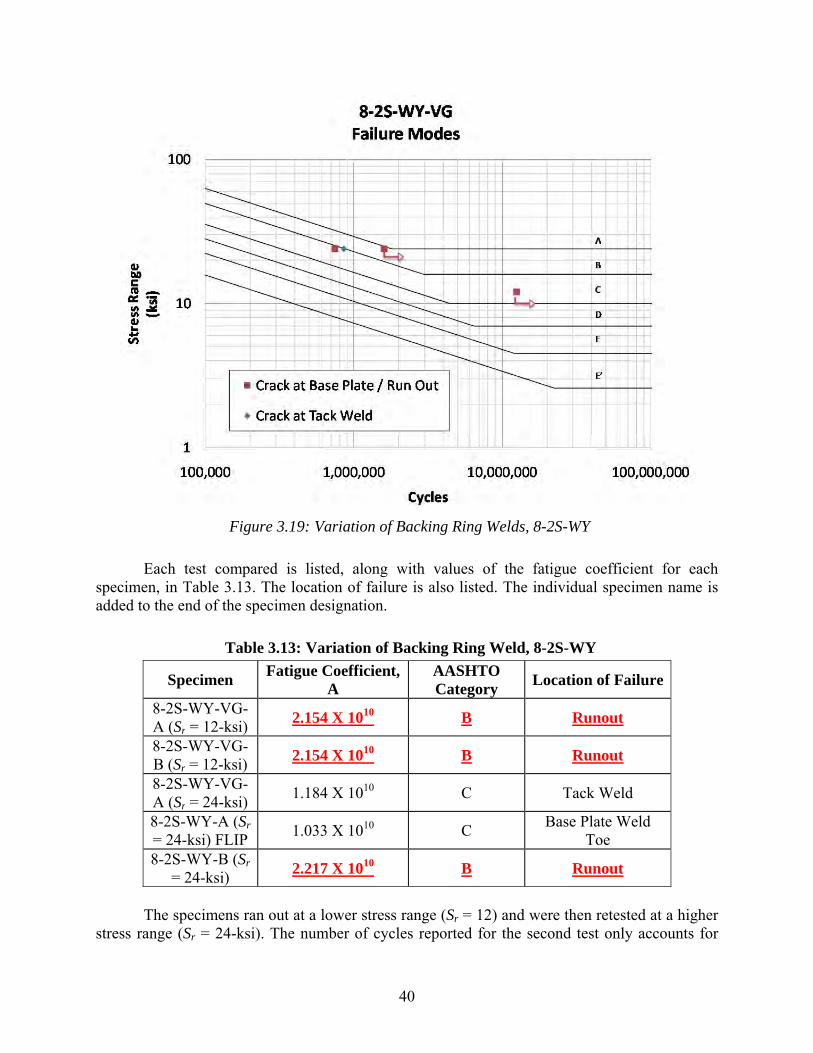
40
Figure 3.19: Variation of Backing Ring Welds, 8-2S-WY
Each test compared is listed, along with values of the fatigue coefficient for each specimen, in Table 3.13. The location of failure is also listed. The individual specimen name is added to the end of the specimen designation.
Table 3.13: Variation of Backing Ring Weld, 8-2S-WY
Specimen Fatigue Coefficient,
A AASHTO Category
Location of Failure
8-2S-WY-VG-A (Sr = 12-ksi)
2.154 X 10¹⁰ B Runout
8-2S-WY-VG-B (Sr = 12-ksi)
2.154 X 10¹⁰ B Runout
8-2S-WY-VG-A (Sr = 24-ksi)
1.184 X 10¹⁰ C Tack Weld
8-2S-WY-A (Sr = 24-ksi) FLIP
1.033 X 10¹⁰ C Base Plate Weld
Toe 8-2S-WY-B (Sr
= 24-ksi) 2.217 X 10¹⁰ B Runout
The specimens ran out at a lower stress range (Sr = 12) and were then retested at a higher
stress range (Sr = 24-ksi). The number of cycles reported for the second test only accounts for
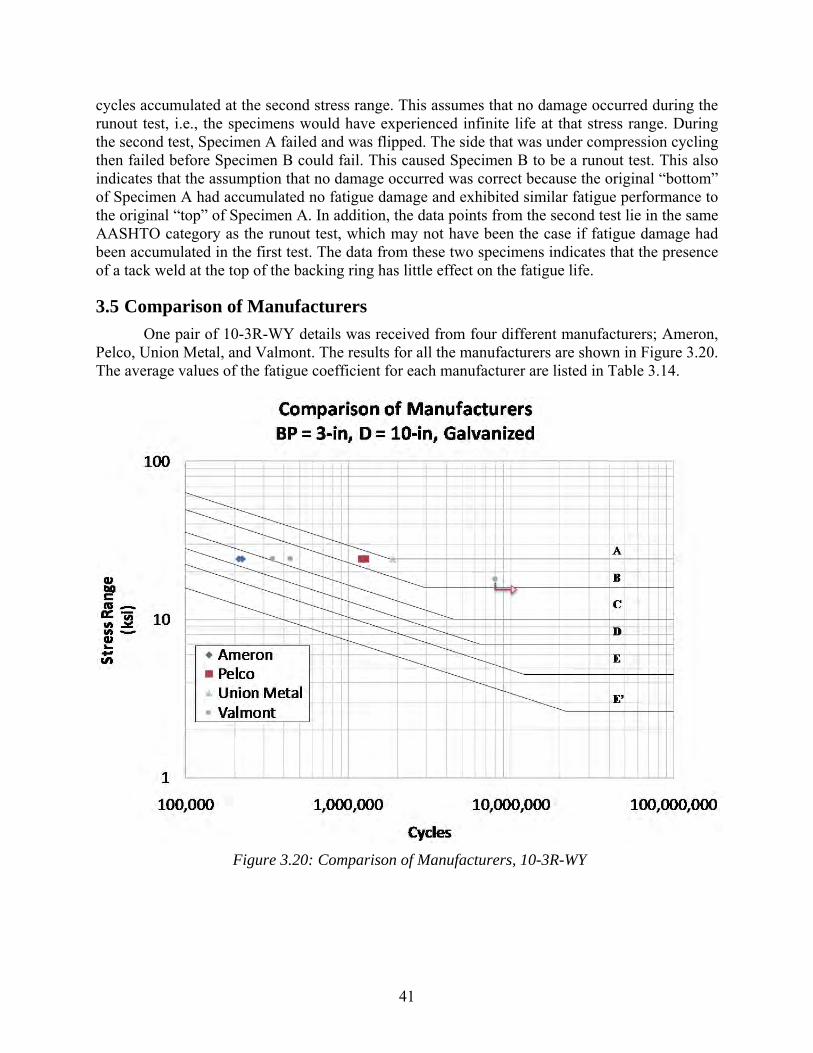
41
cycles accumulated at the second stress range. This assumes that no damage occurred during the runout test, i.e., the specimens would have experienced infinite life at that stress range. During the second test, Specimen A failed and was flipped. The side that was under compression cycling then failed before Specimen B could fail. This caused Specimen B to be a runout test. This also indicates that the assumption that no damage occurred was correct because the original “bottom” of Specimen A had accumulated no fatigue damage and exhibited similar fatigue performance to the original “top” of Specimen A. In addition, the data points from the second test lie in the same AASHTO category as the runout test, which may not have been the case if fatigue damage had been accumulated in the first test. The data from these two specimens indicates that the presence of a tack weld at the top of the backing ring has little effect on the fatigue life.
3.5 Comparison of Manufacturers
One pair of 10-3R-WY details was received from four different manufacturers; Ameron, Pelco, Union Metal, and Valmont. The results for all the manufacturers are shown in Figure 3.20. The average values of the fatigue coefficient for each manufacturer are listed in Table 3.14.
Figure 3.20: Comparison of Manufacturers, 10-3R-WY
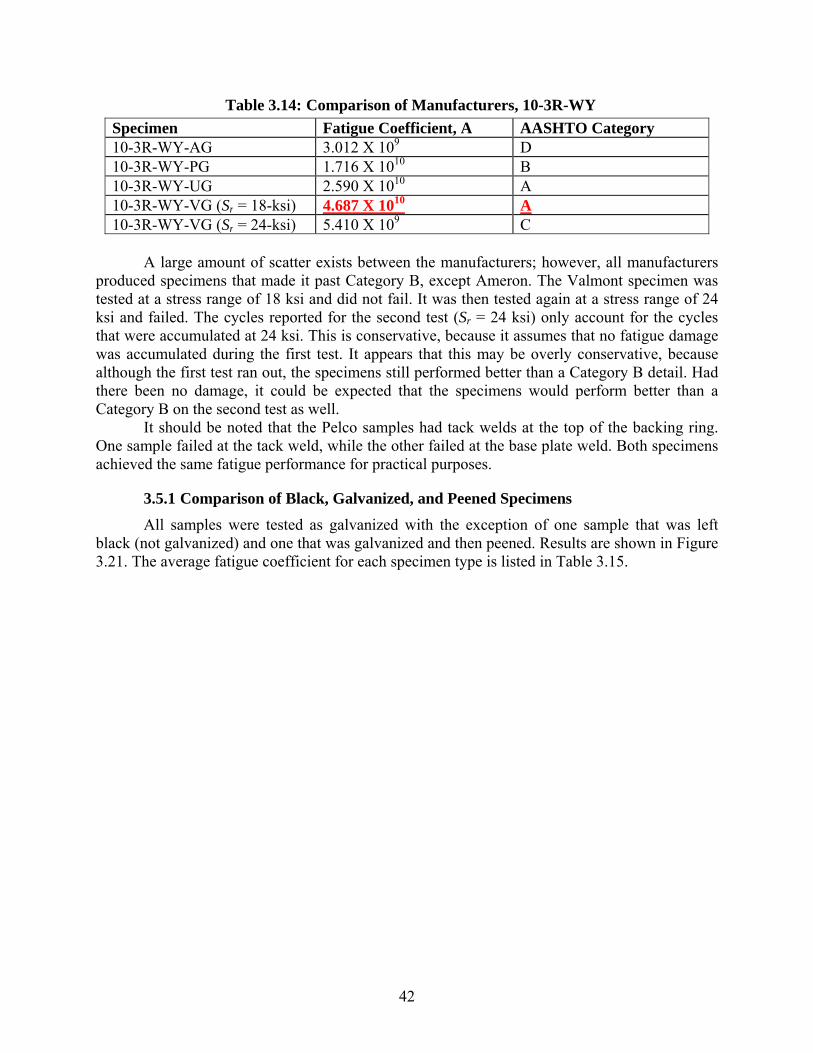
42
Table 3.14: Comparison of Manufacturers, 10-3R-WY
Specimen Fatigue Coefficient, A AASHTO Category 10-3R-WY-AG 3.012 X 10⁹ D 10-3R-WY-PG 1.716 X 10¹⁰ B 10-3R-WY-UG 2.590 X 10¹⁰ A 10-3R-WY-VG (Sr = 18-ksi) 4.687 X 10¹⁰ A 10-3R-WY-VG (Sr = 24-ksi) 5.410 X 10⁹ C
A large amount of scatter exists between the manufacturers; however, all manufacturers
produced specimens that made it past Category B, except Ameron. The Valmont specimen was tested at a stress range of 18 ksi and did not fail. It was then tested again at a stress range of 24 ksi and failed. The cycles reported for the second test (Sr = 24 ksi) only account for the cycles that were accumulated at 24 ksi. This is conservative, because it assumes that no fatigue damage was accumulated during the first test. It appears that this may be overly conservative, because although the first test ran out, the specimens still performed better than a Category B detail. Had there been no damage, it could be expected that the specimens would perform better than a Category B on the second test as well.
It should be noted that the Pelco samples had tack welds at the top of the backing ring. One sample failed at the tack weld, while the other failed at the base plate weld. Both specimens achieved the same fatigue performance for practical purposes.
3.5.1 Comparison of Black, Galvanized, and Peened Specimens
All samples were tested as galvanized with the exception of one sample that was left black (not galvanized) and one that was galvanized and then peened. Results are shown in Figure 3.21. The average fatigue coefficient for each specimen type is listed in Table 3.15.
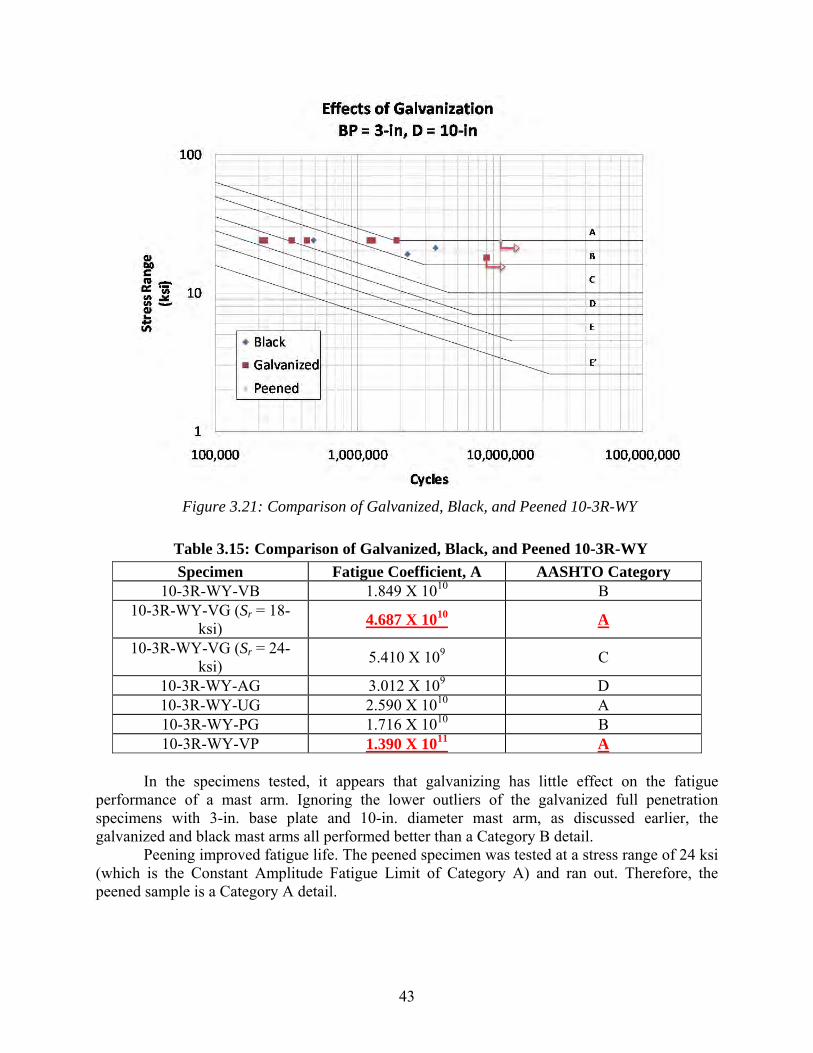
43
Figure 3.21: Comparison of Galvanized, Black, and Peened 10-3R-WY
Table 3.15: Comparison of Galvanized, Black, and Peened 10-3R-WY
Specimen Fatigue Coefficient, A AASHTO Category 10-3R-WY-VB 1.849 X 10¹⁰ B
10-3R-WY-VG (Sr = 18-ksi)
4.687 X 10¹⁰ A
10-3R-WY-VG (Sr = 24-ksi)
5.410 X 10⁹ C
10-3R-WY-AG 3.012 X 10⁹ D 10-3R-WY-UG 2.590 X 10¹⁰ A 10-3R-WY-PG 1.716 X 10¹⁰ B 10-3R-WY-VP 1.390 X 10¹¹ A
In the specimens tested, it appears that galvanizing has little effect on the fatigue
performance of a mast arm. Ignoring the lower outliers of the galvanized full penetration specimens with 3-in. base plate and 10-in. diameter mast arm, as discussed earlier, the galvanized and black mast arms all performed better than a Category B detail.
Peening improved fatigue life. The peened specimen was tested at a stress range of 24 ksi (which is the Constant Amplitude Fatigue Limit of Category A) and ran out. Therefore, the peened sample is a Category A detail.
44
3.6 Summary of Observations
There is no practical difference in the fatigue performance of full penetration details with round or octagonal mast arms.
The shape of the base plate and orientation of bolt holes in full penetration details has a slight effect on the fatigue performance of the connection but is a relatively minor factor.
Round full penetration details, octagonal full penetration details, and external collars exhibit similar fatigue performance and all perform much better than a socket connection. Octagonal external collars may not perform as well as round external collars.
Thicker base plates improve the fatigue performance of full penetration connections.
A reduction in fatigue performance was observed when a 12-in. diameter mast arm with a full penetration connection is compared with a 10-in. mast arm with the same weld detail and base plate thickness. No effect of diameter was found on the fatigue performance of external collar details.
In the 3-in. base plate full penetration details tested, the presence of a fillet weld at the top of the backing ring reduced the fatigue life of the connection.
The two specimens that failed at a tack weld connecting the top of the backing ring to the mast arm in the tension zone of the mast arm performed similar to specimens that did not fail at the backing ring. This may indicate that a tack weld does not have an effect on the fatigue performance of the connection. A tack weld that occurs in the compression region will have no effect on the fatigue life.
The mast arms received from Pelco, Union Metal, and Valmont performed equally. The mast arm manufactured by Ameron performed significantly worse.
Galvanization had little effect on fatigue performance in this report.
The peened sample performed exceptionally well.
45
Chapter 4. Results from Analytical Parametric Evaluations of Mast Arm Connection
The analysis work was divided into several parametric evaluations. The parametric evaluations changed one geometric variable while keeping others constant, to determine if there was a relationship between the given variable and the hot spot stress and stress concentration factor (SCF). Variables studied consisted of base plate thickness, mast arm diameter, mast arm shape, mast arm-to-base plate connection detail, the presence of a fillet weld at the top of the backing ring in a full penetration detail, and the size of the hole in the base plate of a full penetration detail. The effect moment of inertia of the base plate, taken at the center of the hole in the base plate, was also examined. The moment of inertia is a function of the base plate thickness, detail, and hole size. A detailed convergence examination and evaluation of methods of estimating the SCF were undertaken before the parametric analysis. The details of the initial research are given in Richman (2009). The methods of estimating the stress concentration utilize extrapolation methods to estimate stress at the weld toe, which is then divided by the nominal stress to calculate the SCF. The technique was first used in the offshore industry to estimate the fatigue strength of welded tubular connections. The DNV (Det Norske Veritas) method is used in offshore structures and consists of a linear extrapolation of the stress in the pole wall to the base plate. The Dong Method linearly extrapolates the surface stress weld toes including the state of stress through the wall. The SCF results were found to correlate to the calculated bending stiffness of the base plates.
4.1 Nomenclature Used in Parametric Evaluations
The basic nomenclature that has been used throughout this report is kept with new variables added that are indicated at the end of the model name. Table 4.1 shows the nomenclature used in the analysis. Several values of base plate thickness were studied for each model. An “X” is placed where the base plate thickness is usually called out to denote the range of base plate thicknesses that were studied. A key is given in Table 4.1.
Table 4.1: Key of New Nomenclature Variables
X All base plate thicknesses
Fillet A fillet weld at the top of the backing ring in a full
penetration connection NH No hole in the base plate 3H A 3-in. radius hole in the base plate P2 Octagonal with 2-in. bend radii
P(3/8) Octagonal with 3/8-in. bend radii
S# A square base plate with bolt holes positioned at #-in. by 12
in.
4.2 Results of Analytical Models
Computed hot spot stresses and SCFs for every model analyzed are presented in Table 4.2. Entries in the table are divided by model. Different hot spot locations on the same model—
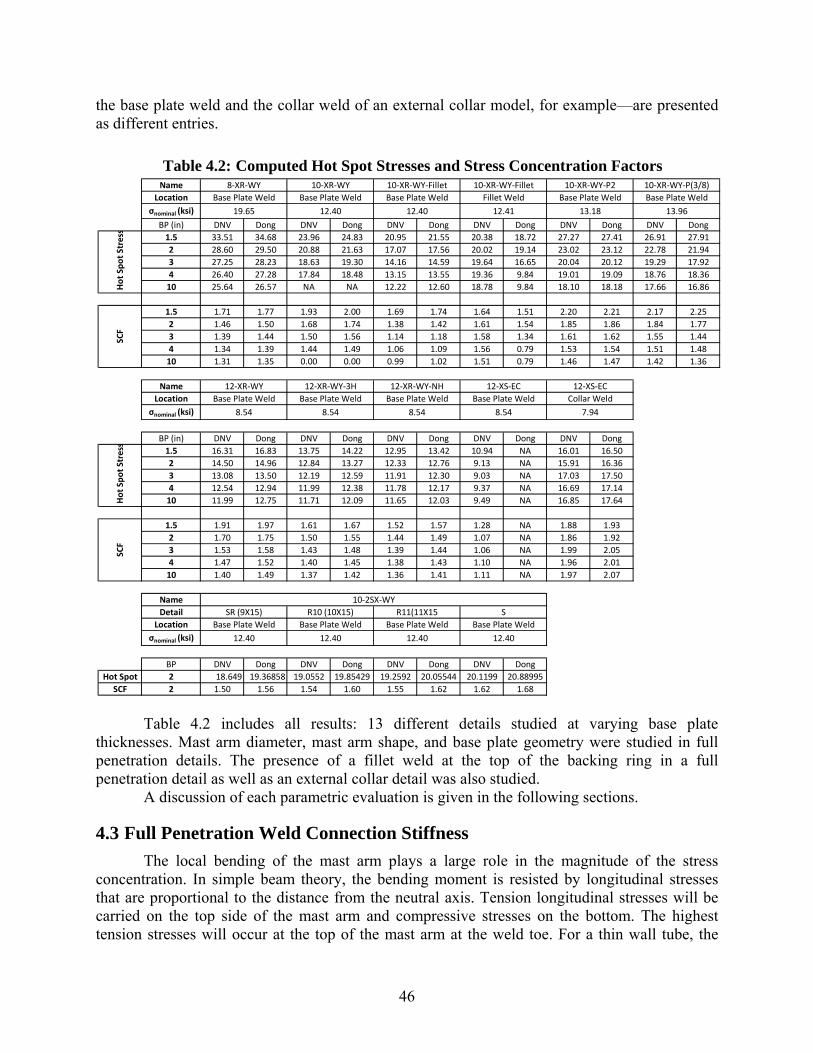
46
the base plate weld and the collar weld of an external collar model, for example—are presented as different entries.
Table 4.2: Computed Hot Spot Stresses and Stress Concentration Factors
Table 4.2 includes all results: 13 different details studied at varying base plate thicknesses. Mast arm diameter, mast arm shape, and base plate geometry were studied in full penetration details. The presence of a fillet weld at the top of the backing ring in a full penetration detail as well as an external collar detail was also studied.
A discussion of each parametric evaluation is given in the following sections.
4.3 Full Penetration Weld Connection Stiffness
The local bending of the mast arm plays a large role in the magnitude of the stress concentration. In simple beam theory, the bending moment is resisted by longitudinal stresses that are proportional to the distance from the neutral axis. Tension longitudinal stresses will be carried on the top side of the mast arm and compressive stresses on the bottom. The highest tension stresses will occur at the top of the mast arm at the weld toe. For a thin wall tube, the
Name
Location
σnominal (ksi)
BP (in) DNV Dong DNV Dong DNV Dong DNV Dong DNV Dong DNV Dong
1.5 33.51 34.68 23.96 24.83 20.95 21.55 20.38 18.72 27.27 27.41 26.91 27.91
2 28.60 29.50 20.88 21.63 17.07 17.56 20.02 19.14 23.02 23.12 22.78 21.94
3 27.25 28.23 18.63 19.30 14.16 14.59 19.64 16.65 20.04 20.12 19.29 17.92
4 26.40 27.28 17.84 18.48 13.15 13.55 19.36 9.84 19.01 19.09 18.76 18.36
10 25.64 26.57 NA NA 12.22 12.60 18.78 9.84 18.10 18.18 17.66 16.86
1.5 1.71 1.77 1.93 2.00 1.69 1.74 1.64 1.51 2.20 2.21 2.17 2.25
2 1.46 1.50 1.68 1.74 1.38 1.42 1.61 1.54 1.85 1.86 1.84 1.77
3 1.39 1.44 1.50 1.56 1.14 1.18 1.58 1.34 1.61 1.62 1.55 1.44
4 1.34 1.39 1.44 1.49 1.06 1.09 1.56 0.79 1.53 1.54 1.51 1.48
10 1.31 1.35 0.00 0.00 0.99 1.02 1.51 0.79 1.46 1.47 1.42 1.36
Name
Location
σnominal (ksi)
BP (in) DNV Dong DNV Dong DNV Dong DNV Dong DNV Dong
1.5 16.31 16.83 13.75 14.22 12.95 13.42 10.94 NA 16.01 16.50
2 14.50 14.96 12.84 13.27 12.33 12.76 9.13 NA 15.91 16.36
3 13.08 13.50 12.19 12.59 11.91 12.30 9.03 NA 17.03 17.50
4 12.54 12.94 11.99 12.38 11.78 12.17 9.37 NA 16.69 17.14
10 11.99 12.75 11.71 12.09 11.65 12.03 9.49 NA 16.85 17.64
1.5 1.91 1.97 1.61 1.67 1.52 1.57 1.28 NA 1.88 1.93
2 1.70 1.75 1.50 1.55 1.44 1.49 1.07 NA 1.86 1.92
3 1.53 1.58 1.43 1.48 1.39 1.44 1.06 NA 1.99 2.05
4 1.47 1.52 1.40 1.45 1.38 1.43 1.10 NA 1.96 2.01
10 1.40 1.49 1.37 1.42 1.36 1.41 1.11 NA 1.97 2.07
Name
Detail
Location
σnominal (ksi)
BP DNV Dong DNV Dong DNV Dong DNV Dong
Hot Spot 2 18.649 19.36858 19.0552 19.85429 19.2592 20.05544 20.1199 20.88995
SCF 2 1.50 1.56 1.54 1.60 1.55 1.62 1.62 1.68
12.40 12.40 12.40 12.40
Base Plate Weld Base Plate Weld Base Plate Weld Base Plate Weld
SR (9X15) R10 (10X15) R11(11X15 S
Hot Sp
ot Stress
SCF
10‐2SX‐WY
8.54 8.54 8.54 8.54 7.94
Base Plate Weld Base Plate Weld Base Plate Weld Base Plate Weld Collar Weld
12‐XS‐EC
Hot Sp
ot Stress
SCF
12‐XR‐WY 12‐XR‐WY‐3H 12‐XR‐WY‐NH 12‐XS‐EC
13.96
Base Plate Weld Base Plate Weld Base Plate Weld Fillet Weld Base Plate Weld Base Plate Weld
19.65 12.40 12.40 12.41 13.18
10‐XR‐WY‐P(3/8)8‐XR‐WY 10‐XR‐WY 10‐XR‐WY‐Fillet 10‐XR‐WY‐Fillet 10‐XR‐WY‐P2
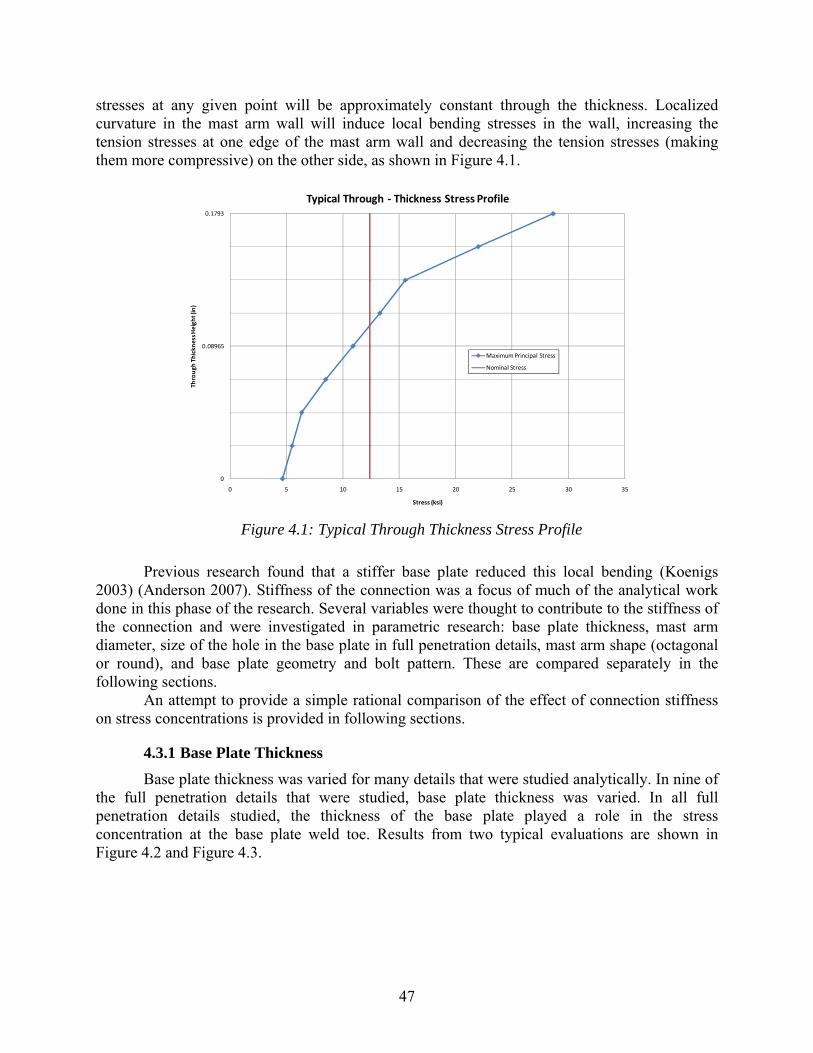
47
stresses at any given point will be approximately constant through the thickness. Localized curvature in the mast arm wall will induce local bending stresses in the wall, increasing the tension stresses at one edge of the mast arm wall and decreasing the tension stresses (making them more compressive) on the other side, as shown in Figure 4.1.
Figure 4.1: Typical Through Thickness Stress Profile
Previous research found that a stiffer base plate reduced this local bending (Koenigs 2003) (Anderson 2007). Stiffness of the connection was a focus of much of the analytical work done in this phase of the research. Several variables were thought to contribute to the stiffness of the connection and were investigated in parametric research: base plate thickness, mast arm diameter, size of the hole in the base plate in full penetration details, mast arm shape (octagonal or round), and base plate geometry and bolt pattern. These are compared separately in the following sections.
An attempt to provide a simple rational comparison of the effect of connection stiffness on stress concentrations is provided in following sections.
4.3.1 Base Plate Thickness
Base plate thickness was varied for many details that were studied analytically. In nine of the full penetration details that were studied, base plate thickness was varied. In all full penetration details studied, the thickness of the base plate played a role in the stress concentration at the base plate weld toe. Results from two typical evaluations are shown in Figure 4.2 and Figure 4.3.
0
0.08965
0.1793
0 5 10 15 20 25 30 35
Through
Thickn
ess H
eigh
t (in)
Stress (ksi)
Typical Through ‐ Thickness Stress Profile
Maximum Principal Stress
Nominal Stress
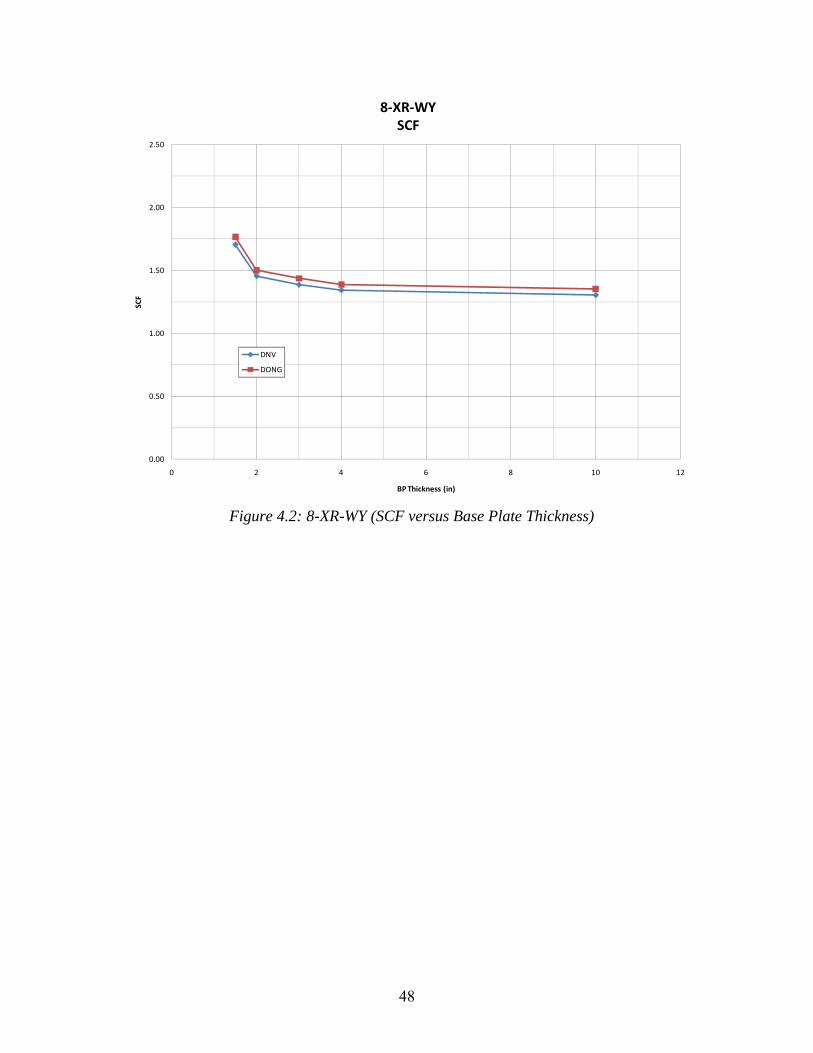
48
Figure 4.2: 8-XR-WY (SCF versus Base Plate Thickness)
0.00
0.50
1.00
1.50
2.00
2.50
0 2 4 6 8 10 12
SCF
BP Thickness (in)
8‐XR‐WY SCF
DNV
DONG
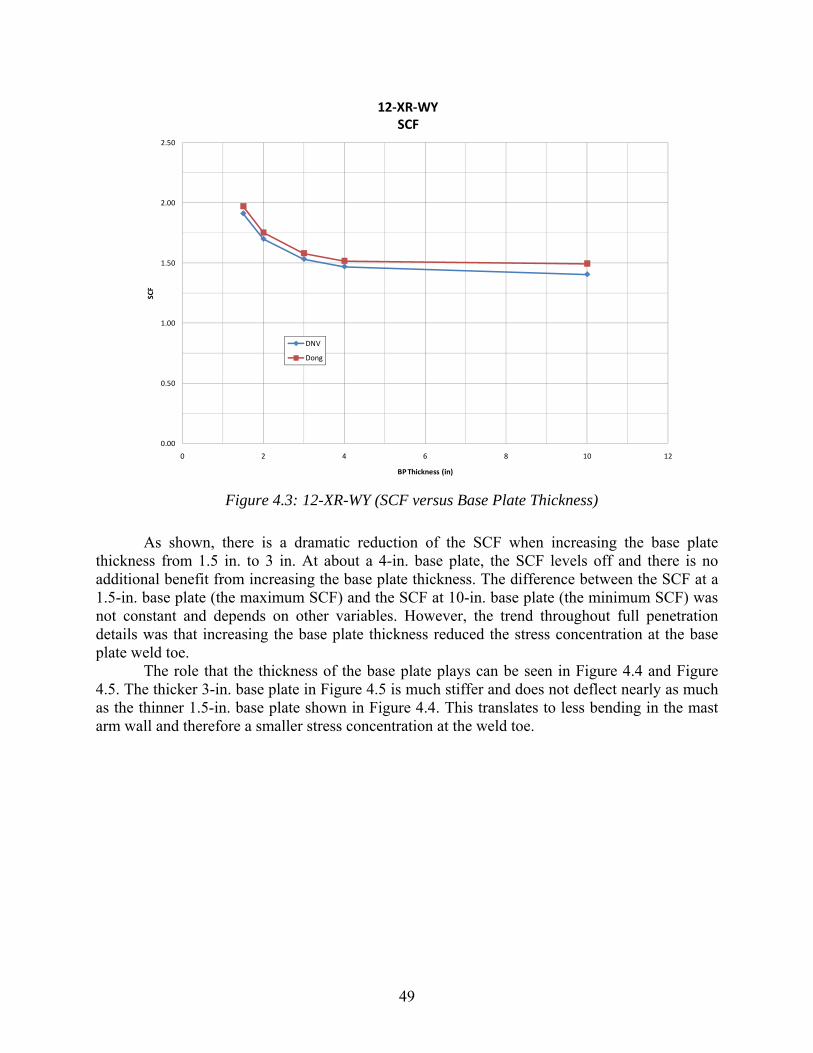
49
Figure 4.3: 12-XR-WY (SCF versus Base Plate Thickness)
As shown, there is a dramatic reduction of the SCF when increasing the base plate thickness from 1.5 in. to 3 in. At about a 4-in. base plate, the SCF levels off and there is no additional benefit from increasing the base plate thickness. The difference between the SCF at a 1.5-in. base plate (the maximum SCF) and the SCF at 10-in. base plate (the minimum SCF) was not constant and depends on other variables. However, the trend throughout full penetration details was that increasing the base plate thickness reduced the stress concentration at the base plate weld toe.
The role that the thickness of the base plate plays can be seen in Figure 4.4 and Figure 4.5. The thicker 3-in. base plate in Figure 4.5 is much stiffer and does not deflect nearly as much as the thinner 1.5-in. base plate shown in Figure 4.4. This translates to less bending in the mast arm wall and therefore a smaller stress concentration at the weld toe.
0.00
0.50
1.00
1.50
2.00
2.50
0 2 4 6 8 10 12
SCF
BP Thickness (in)
12‐XR‐WY SCF
DNV
Dong
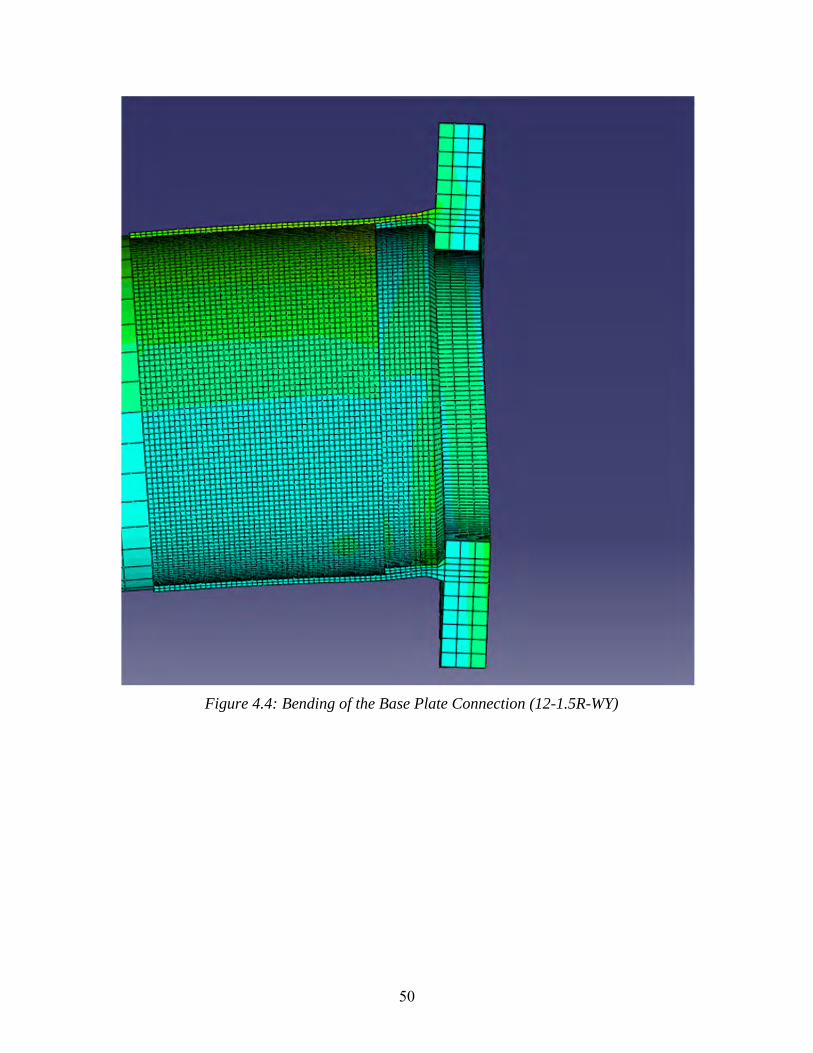
50
Figure 4.4: Bending of the Base Plate Connection (12-1.5R-WY)
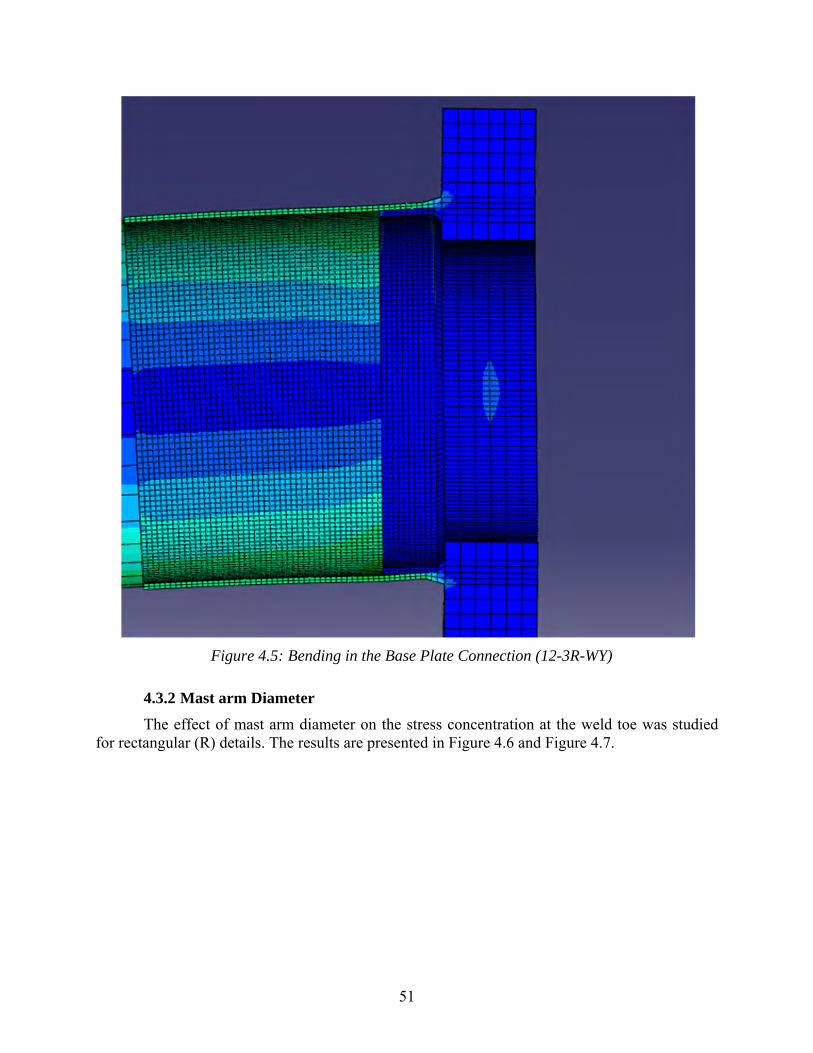
51
Figure 4.5: Bending in the Base Plate Connection (12-3R-WY)
4.3.2 Mast arm Diameter
The effect of mast arm diameter on the stress concentration at the weld toe was studied for rectangular (R) details. The results are presented in Figure 4.6 and Figure 4.7.
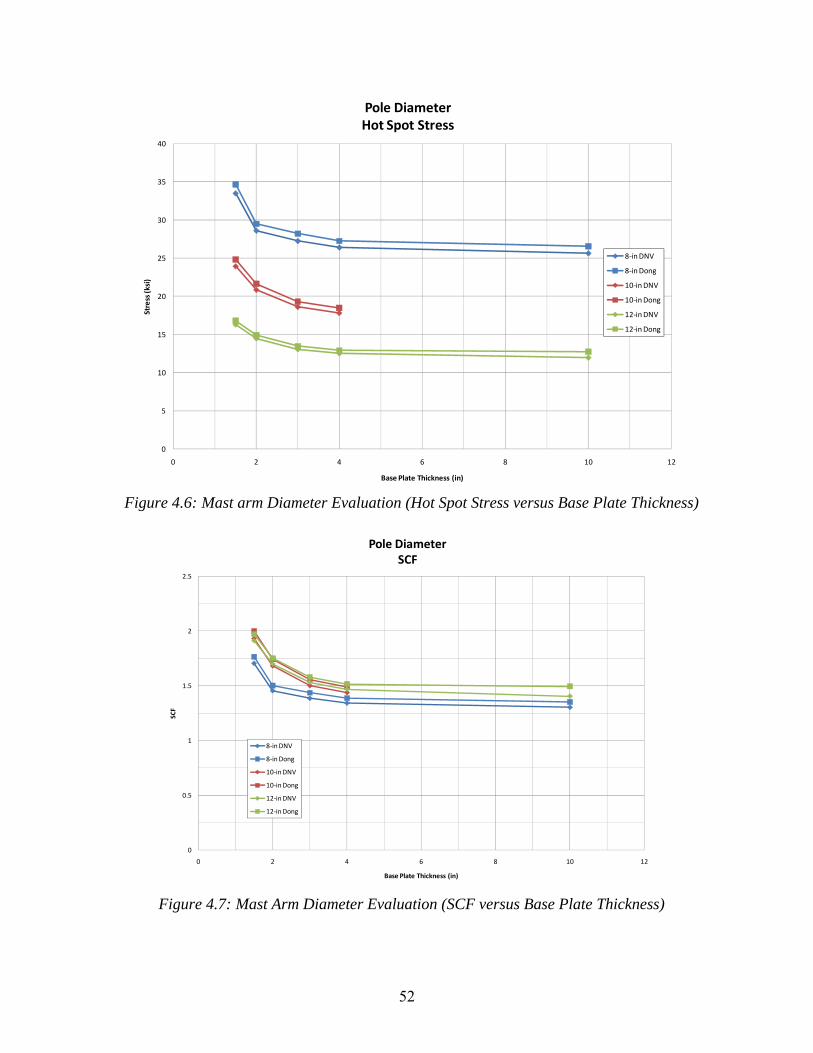
52
Figure 4.6: Mast arm Diameter Evaluation (Hot Spot Stress versus Base Plate Thickness)
Figure 4.7: Mast Arm Diameter Evaluation (SCF versus Base Plate Thickness)
0
5
10
15
20
25
30
35
40
0 2 4 6 8 10 12
Stress (ksi)
Base Plate Thickness (in)
Pole Diameter Hot Spot Stress
8‐in DNV
8‐in Dong
10‐in DNV
10‐in Dong
12‐in DNV
12‐in Dong
0
0.5
1
1.5
2
2.5
0 2 4 6 8 10 12
SCF
Base Plate Thickness (in)
Pole Diameter SCF
8‐in DNV
8‐in Dong
10‐in DNV
10‐in Dong
12‐in DNV
12‐in Dong
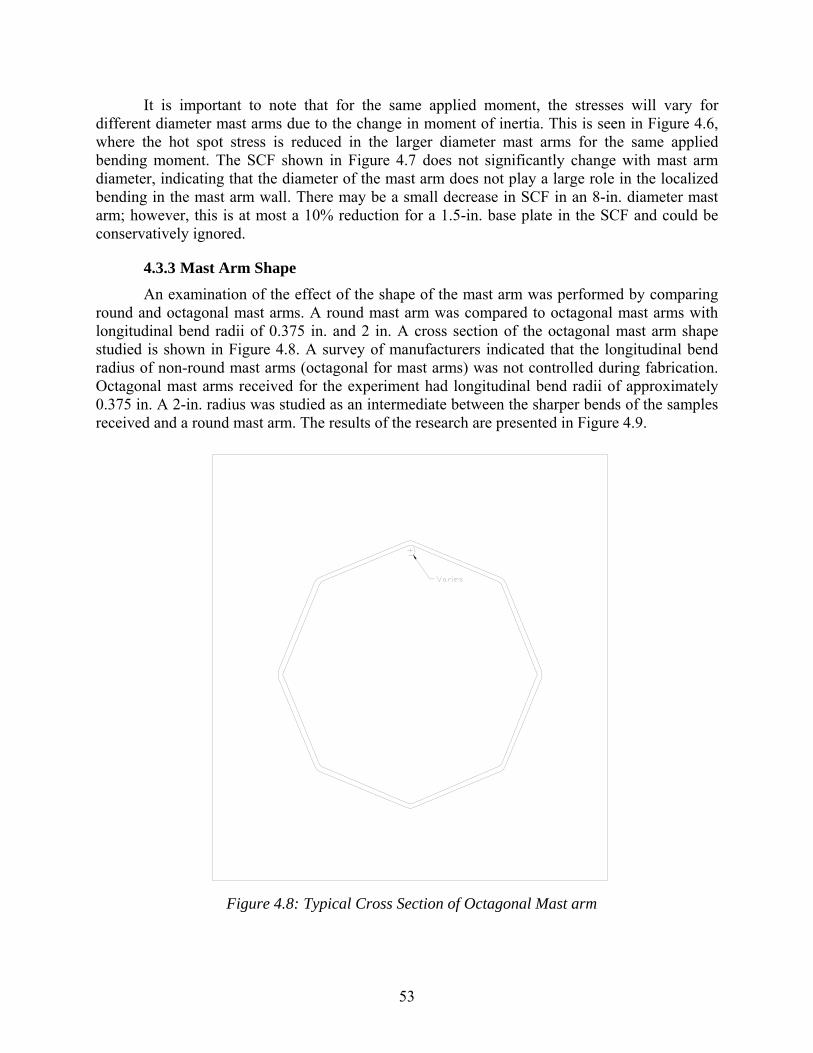
53
It is important to note that for the same applied moment, the stresses will vary for different diameter mast arms due to the change in moment of inertia. This is seen in Figure 4.6, where the hot spot stress is reduced in the larger diameter mast arms for the same applied bending moment. The SCF shown in Figure 4.7 does not significantly change with mast arm diameter, indicating that the diameter of the mast arm does not play a large role in the localized bending in the mast arm wall. There may be a small decrease in SCF in an 8-in. diameter mast arm; however, this is at most a 10% reduction for a 1.5-in. base plate in the SCF and could be conservatively ignored.
4.3.3 Mast Arm Shape
An examination of the effect of the shape of the mast arm was performed by comparing round and octagonal mast arms. A round mast arm was compared to octagonal mast arms with longitudinal bend radii of 0.375 in. and 2 in. A cross section of the octagonal mast arm shape studied is shown in Figure 4.8. A survey of manufacturers indicated that the longitudinal bend radius of non-round mast arms (octagonal for mast arms) was not controlled during fabrication. Octagonal mast arms received for the experiment had longitudinal bend radii of approximately 0.375 in. A 2-in. radius was studied as an intermediate between the sharper bends of the samples received and a round mast arm. The results of the research are presented in Figure 4.9.
Figure 4.8: Typical Cross Section of Octagonal Mast arm
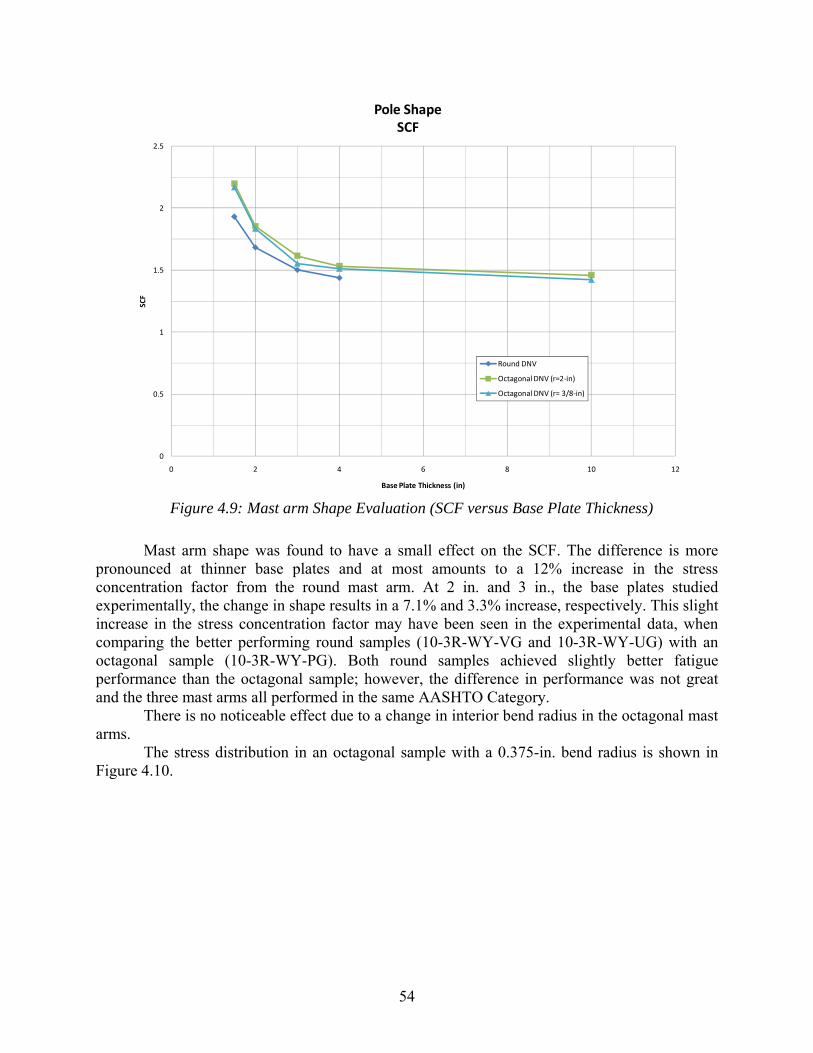
54
Figure 4.9: Mast arm Shape Evaluation (SCF versus Base Plate Thickness)
Mast arm shape was found to have a small effect on the SCF. The difference is more pronounced at thinner base plates and at most amounts to a 12% increase in the stress concentration factor from the round mast arm. At 2 in. and 3 in., the base plates studied experimentally, the change in shape results in a 7.1% and 3.3% increase, respectively. This slight increase in the stress concentration factor may have been seen in the experimental data, when comparing the better performing round samples (10-3R-WY-VG and 10-3R-WY-UG) with an octagonal sample (10-3R-WY-PG). Both round samples achieved slightly better fatigue performance than the octagonal sample; however, the difference in performance was not great and the three mast arms all performed in the same AASHTO Category.
There is no noticeable effect due to a change in interior bend radius in the octagonal mast arms.
The stress distribution in an octagonal sample with a 0.375-in. bend radius is shown in Figure 4.10.
0
0.5
1
1.5
2
2.5
0 2 4 6 8 10 12
SCF
Base Plate Thickness (in)
Pole Shape SCF
Round DNV
Octagonal DNV (r=2‐in)
Octagonal DNV (r= 3/8‐in)
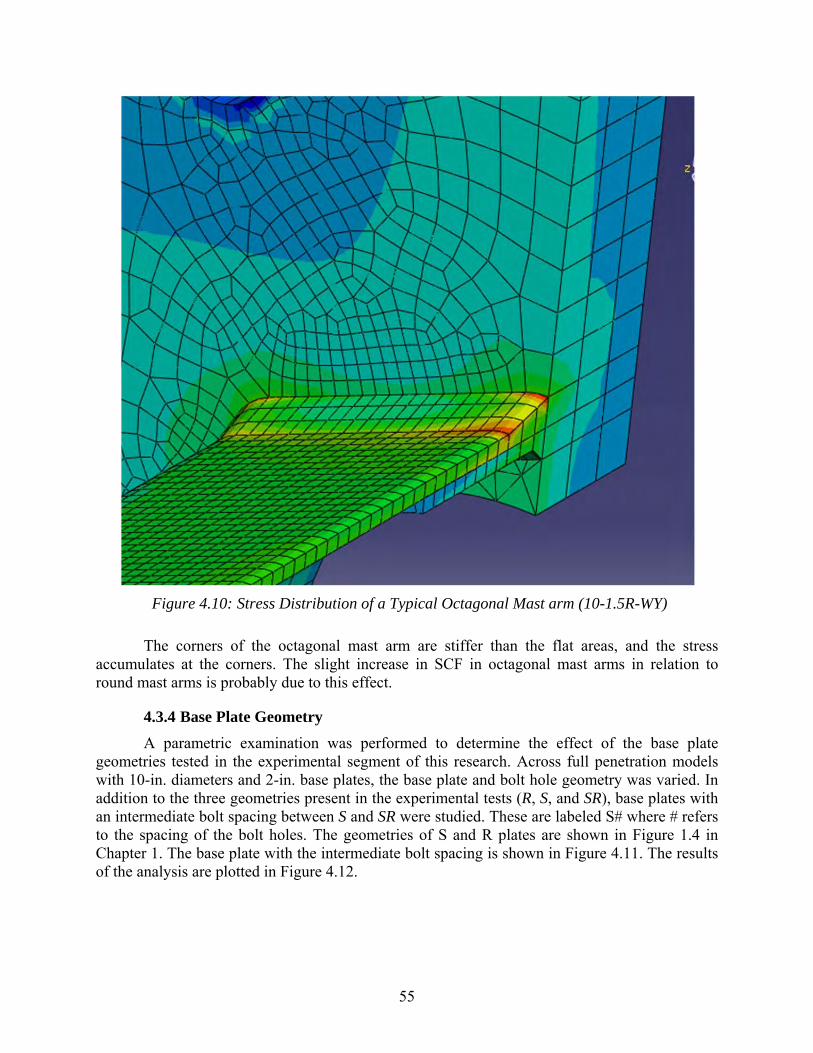
55
Figure 4.10: Stress Distribution of a Typical Octagonal Mast arm (10-1.5R-WY)
The corners of the octagonal mast arm are stiffer than the flat areas, and the stress accumulates at the corners. The slight increase in SCF in octagonal mast arms in relation to round mast arms is probably due to this effect.
4.3.4 Base Plate Geometry
A parametric examination was performed to determine the effect of the base plate geometries tested in the experimental segment of this research. Across full penetration models with 10-in. diameters and 2-in. base plates, the base plate and bolt hole geometry was varied. In addition to the three geometries present in the experimental tests (R, S, and SR), base plates with an intermediate bolt spacing between S and SR were studied. These are labeled S# where # refers to the spacing of the bolt holes. The geometries of S and R plates are shown in Figure 1.4 in Chapter 1. The base plate with the intermediate bolt spacing is shown in Figure 4.11. The results of the analysis are plotted in Figure 4.12.
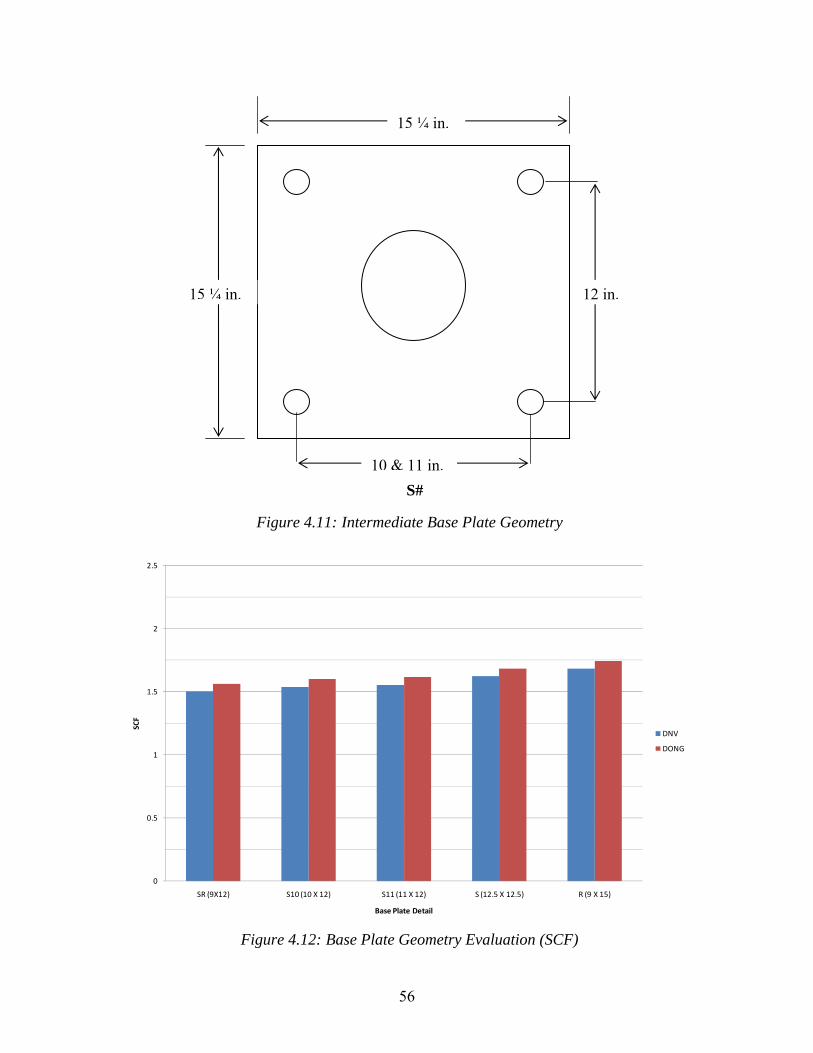
56
Figure 4.11: Intermediate Base Plate Geometry
Figure 4.12: Base Plate Geometry Evaluation (SCF)
0
0.5
1
1.5
2
2.5
SR (9X12) S10 (10 X 12) S11 (11 X 12) S (12.5 X 12.5) R (9 X 15)
SCF
Base Plate Detail
DNV
DONG
15 ¼ in.
15 ¼ in.
12 in.
10 & 11 in.
S#
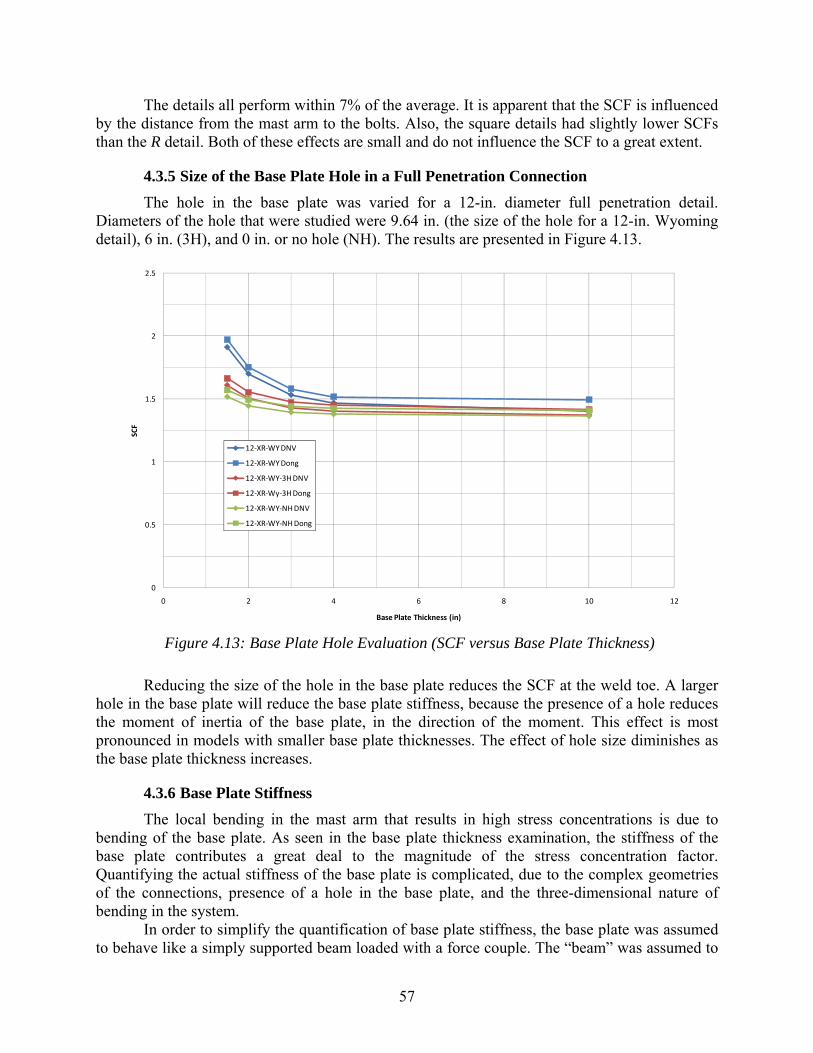
57
The details all perform within 7% of the average. It is apparent that the SCF is influenced by the distance from the mast arm to the bolts. Also, the square details had slightly lower SCFs than the R detail. Both of these effects are small and do not influence the SCF to a great extent.
4.3.5 Size of the Base Plate Hole in a Full Penetration Connection
The hole in the base plate was varied for a 12-in. diameter full penetration detail. Diameters of the hole that were studied were 9.64 in. (the size of the hole for a 12-in. Wyoming detail), 6 in. (3H), and 0 in. or no hole (NH). The results are presented in Figure 4.13.
Figure 4.13: Base Plate Hole Evaluation (SCF versus Base Plate Thickness)
Reducing the size of the hole in the base plate reduces the SCF at the weld toe. A larger hole in the base plate will reduce the base plate stiffness, because the presence of a hole reduces the moment of inertia of the base plate, in the direction of the moment. This effect is most pronounced in models with smaller base plate thicknesses. The effect of hole size diminishes as the base plate thickness increases.
4.3.6 Base Plate Stiffness
The local bending in the mast arm that results in high stress concentrations is due to bending of the base plate. As seen in the base plate thickness examination, the stiffness of the base plate contributes a great deal to the magnitude of the stress concentration factor. Quantifying the actual stiffness of the base plate is complicated, due to the complex geometries of the connections, presence of a hole in the base plate, and the three-dimensional nature of bending in the system.
In order to simplify the quantification of base plate stiffness, the base plate was assumed to behave like a simply supported beam loaded with a force couple. The “beam” was assumed to
0
0.5
1
1.5
2
2.5
0 2 4 6 8 10 12
SCF
Base Plate Thickness (in)
12‐XR‐WY DNV
12‐XR‐WY Dong
12‐XR‐WY‐3H DNV
12‐XR‐Wy‐3H Dong
12‐XR‐WY‐NH DNV
12‐XR‐WY‐NH Dong
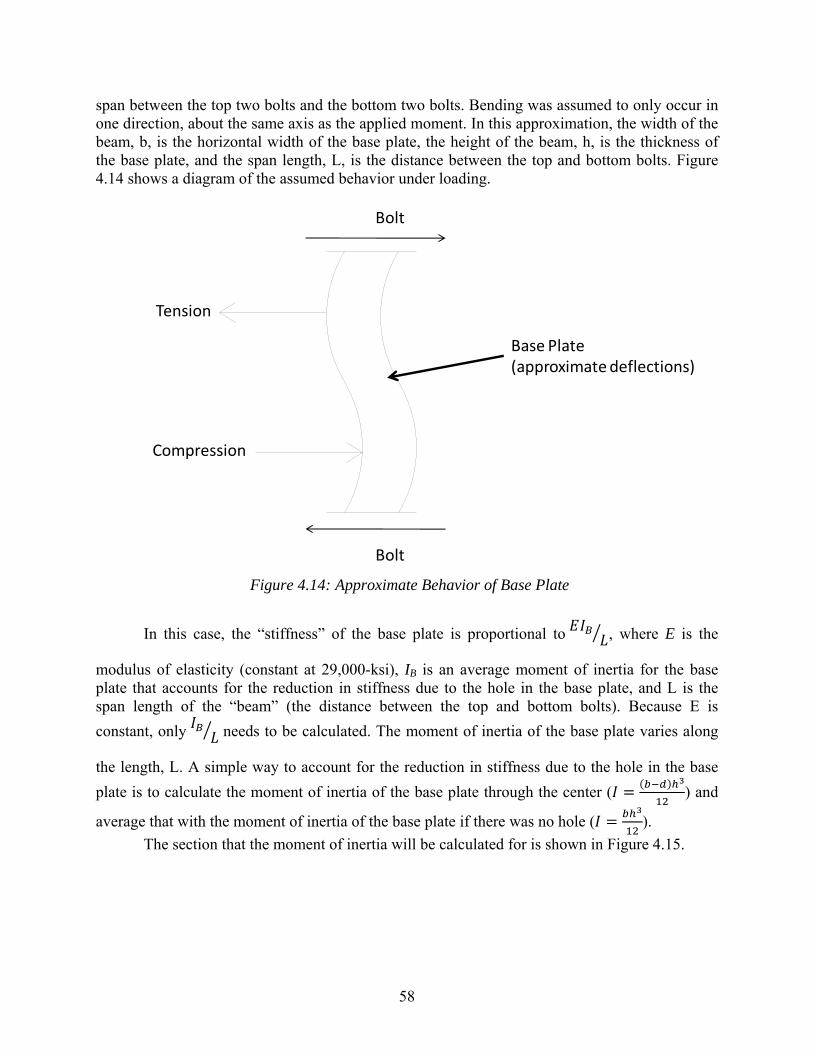
58
span between the top two bolts and the bottom two bolts. Bending was assumed to only occur in one direction, about the same axis as the applied moment. In this approximation, the width of the beam, b, is the horizontal width of the base plate, the height of the beam, h, is the thickness of the base plate, and the span length, L, is the distance between the top and bottom bolts. Figure 4.14 shows a diagram of the assumed behavior under loading.
Figure 4.14: Approximate Behavior of Base Plate
In this case, the “stiffness” of the base plate is proportional to , where E is the
modulus of elasticity (constant at 29,000-ksi), IB is an average moment of inertia for the base plate that accounts for the reduction in stiffness due to the hole in the base plate, and L is the span length of the “beam” (the distance between the top and bottom bolts). Because E is
constant, only needs to be calculated. The moment of inertia of the base plate varies along
the length, L. A simple way to account for the reduction in stiffness due to the hole in the base
plate is to calculate the moment of inertia of the base plate through the center ( ) and
average that with the moment of inertia of the base plate if there was no hole ( ).
The section that the moment of inertia will be calculated for is shown in Figure 4.15.
Tension
Compression
Base Plate (approximate deflections)
Bolt
Bolt
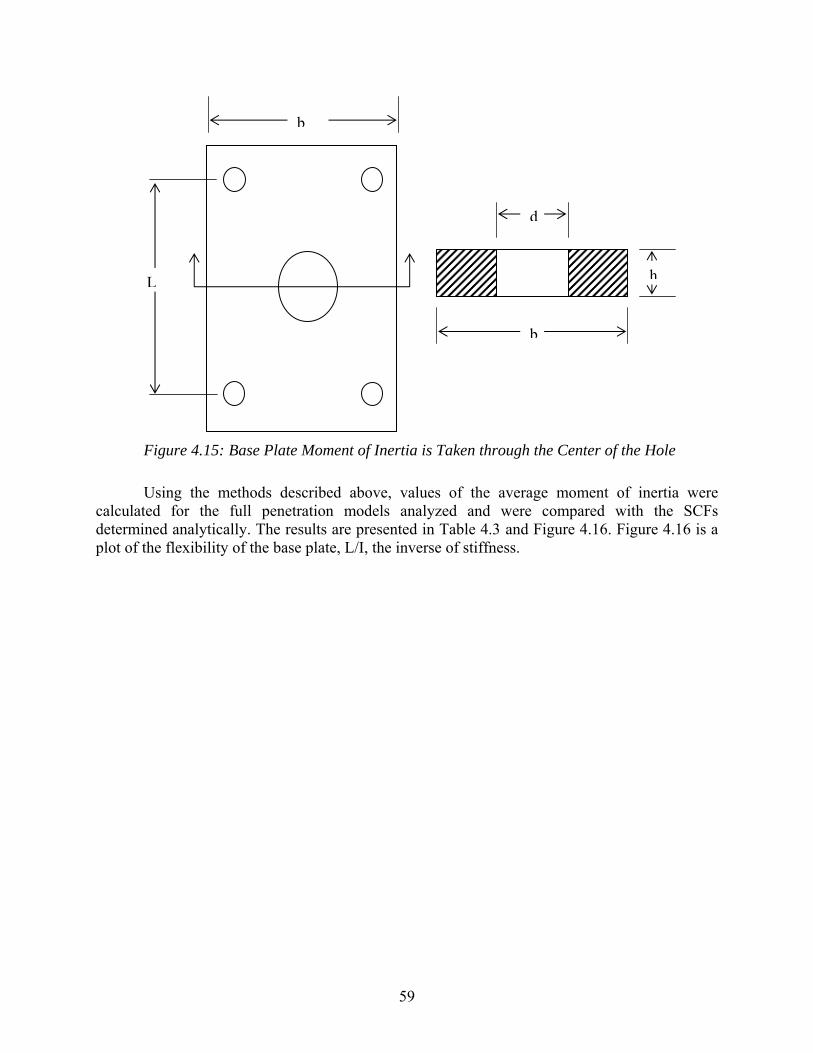
59
Figure 4.15: Base Plate Moment of Inertia is Taken through the Center of the Hole
Using the methods described above, values of the average moment of inertia were calculated for the full penetration models analyzed and were compared with the SCFs determined analytically. The results are presented in Table 4.3 and Figure 4.16. Figure 4.16 is a plot of the flexibility of the base plate, L/I, the inverse of stiffness.
b
L h
b
d
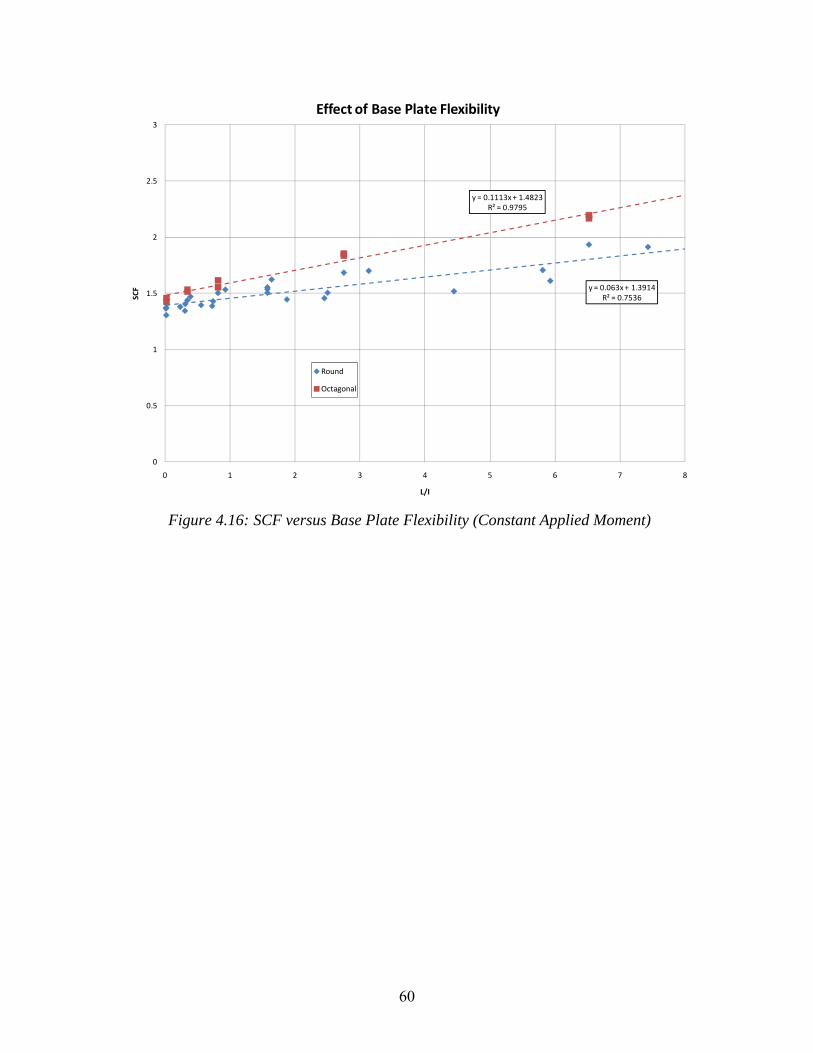
60
Figure 4.16: SCF versus Base Plate Flexibility (Constant Applied Moment)
y = 0.063x + 1.3914R² = 0.7536
y = 0.1113x + 1.4823R² = 0.9795
0
0.5
1
1.5
2
2.5
3
0 1 2 3 4 5 6 7 8
SCF
L/I
Effect of Base Plate Flexibility
Round
Octagonal
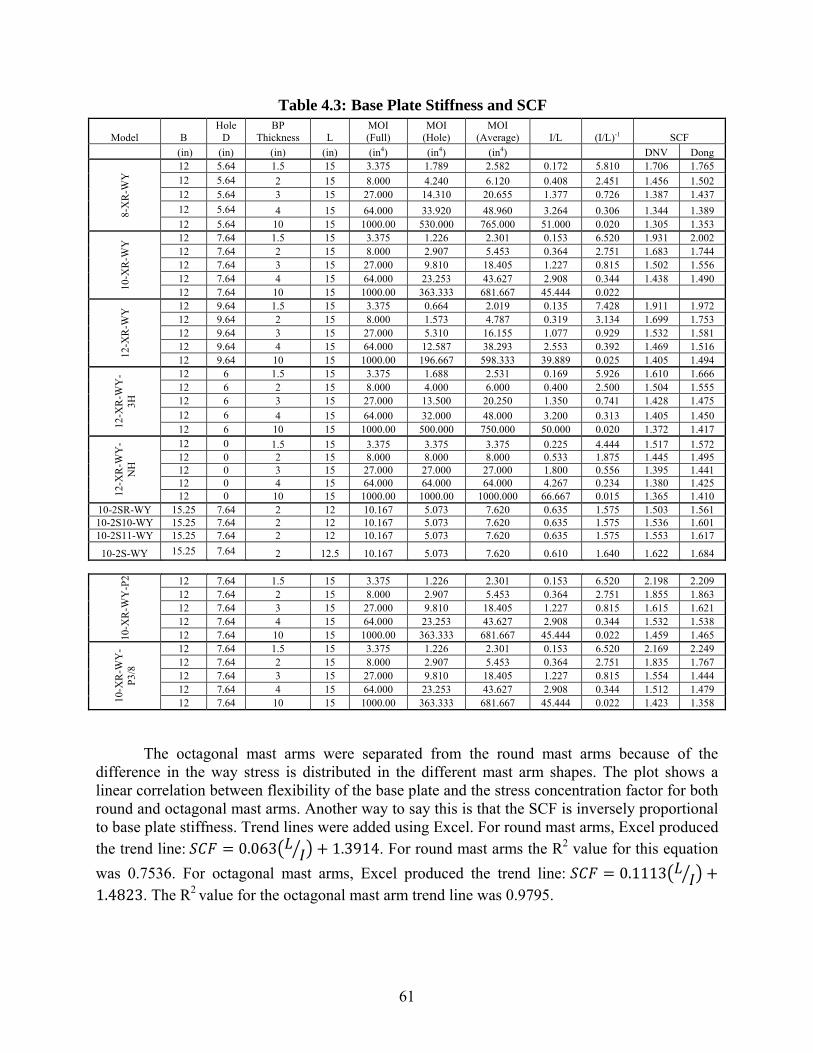
61
Table 4.3: Base Plate Stiffness and SCF
Model B Hole
D BP
Thickness L MOI (Full)
MOI (Hole)
MOI (Average) I/L (I/L)-1 SCF
(in) (in) (in) (in) (in4) (in4) (in4) DNV Dong
8-X
R-W
Y 12 5.64 1.5 15 3.375 1.789 2.582 0.172 5.810 1.706 1.765
12 5.64 2 15 8.000 4.240 6.120 0.408 2.451 1.456 1.502 12 5.64 3 15 27.000 14.310 20.655 1.377 0.726 1.387 1.437
12 5.64 4 15 64.000 33.920 48.960 3.264 0.306 1.344 1.389 12 5.64 10 15 1000.00 530.000 765.000 51.000 0.020 1.305 1.353
10-X
R-W
Y 12 7.64 1.5 15 3.375 1.226 2.301 0.153 6.520 1.931 2.002
12 7.64 2 15 8.000 2.907 5.453 0.364 2.751 1.683 1.744 12 7.64 3 15 27.000 9.810 18.405 1.227 0.815 1.502 1.556 12 7.64 4 15 64.000 23.253 43.627 2.908 0.344 1.438 1.490 12 7.64 10 15 1000.00 363.333 681.667 45.444 0.022
12-X
R-W
Y 12 9.64 1.5 15 3.375 0.664 2.019 0.135 7.428 1.911 1.972
12 9.64 2 15 8.000 1.573 4.787 0.319 3.134 1.699 1.753 12 9.64 3 15 27.000 5.310 16.155 1.077 0.929 1.532 1.581 12 9.64 4 15 64.000 12.587 38.293 2.553 0.392 1.469 1.516 12 9.64 10 15 1000.00 196.667 598.333 39.889 0.025 1.405 1.494
12-X
R-W
Y-
3H
12 6 1.5 15 3.375 1.688 2.531 0.169 5.926 1.610 1.666 12 6 2 15 8.000 4.000 6.000 0.400 2.500 1.504 1.555 12 6 3 15 27.000 13.500 20.250 1.350 0.741 1.428 1.475 12 6 4 15 64.000 32.000 48.000 3.200 0.313 1.405 1.450 12 6 10 15 1000.00 500.000 750.000 50.000 0.020 1.372 1.417
12-X
R-W
Y-
NH
12 0 1.5 15 3.375 3.375 3.375 0.225 4.444 1.517 1.572 12 0 2 15 8.000 8.000 8.000 0.533 1.875 1.445 1.495 12 0 3 15 27.000 27.000 27.000 1.800 0.556 1.395 1.441 12 0 4 15 64.000 64.000 64.000 4.267 0.234 1.380 1.425 12 0 10 15 1000.00 1000.00 1000.000 66.667 0.015 1.365 1.410
10-2SR-WY 15.25 7.64 2 12 10.167 5.073 7.620 0.635 1.575 1.503 1.561 10-2S10-WY 15.25 7.64 2 12 10.167 5.073 7.620 0.635 1.575 1.536 1.601 10-2S11-WY 15.25 7.64 2 12 10.167 5.073 7.620 0.635 1.575 1.553 1.617
10-2S-WY 15.25 7.64 2 12.5 10.167 5.073 7.620 0.610 1.640 1.622 1.684
10-X
R-W
Y-P
2 12 7.64 1.5 15 3.375 1.226 2.301 0.153 6.520 2.198 2.209 12 7.64 2 15 8.000 2.907 5.453 0.364 2.751 1.855 1.863 12 7.64 3 15 27.000 9.810 18.405 1.227 0.815 1.615 1.621 12 7.64 4 15 64.000 23.253 43.627 2.908 0.344 1.532 1.538 12 7.64 10 15 1000.00 363.333 681.667 45.444 0.022 1.459 1.465
10-X
R-W
Y-
P3/
8
12 7.64 1.5 15 3.375 1.226 2.301 0.153 6.520 2.169 2.249 12 7.64 2 15 8.000 2.907 5.453 0.364 2.751 1.835 1.767 12 7.64 3 15 27.000 9.810 18.405 1.227 0.815 1.554 1.444 12 7.64 4 15 64.000 23.253 43.627 2.908 0.344 1.512 1.479 12 7.64 10 15 1000.00 363.333 681.667 45.444 0.022 1.423 1.358
The octagonal mast arms were separated from the round mast arms because of the
difference in the way stress is distributed in the different mast arm shapes. The plot shows a linear correlation between flexibility of the base plate and the stress concentration factor for both round and octagonal mast arms. Another way to say this is that the SCF is inversely proportional to base plate stiffness. Trend lines were added using Excel. For round mast arms, Excel produced the trend line: 0.063 1.3914. For round mast arms the R2 value for this equation
was 0.7536. For octagonal mast arms, Excel produced the trend line: 0.11131.4823. The R2 value for the octagonal mast arm trend line was 0.9795.
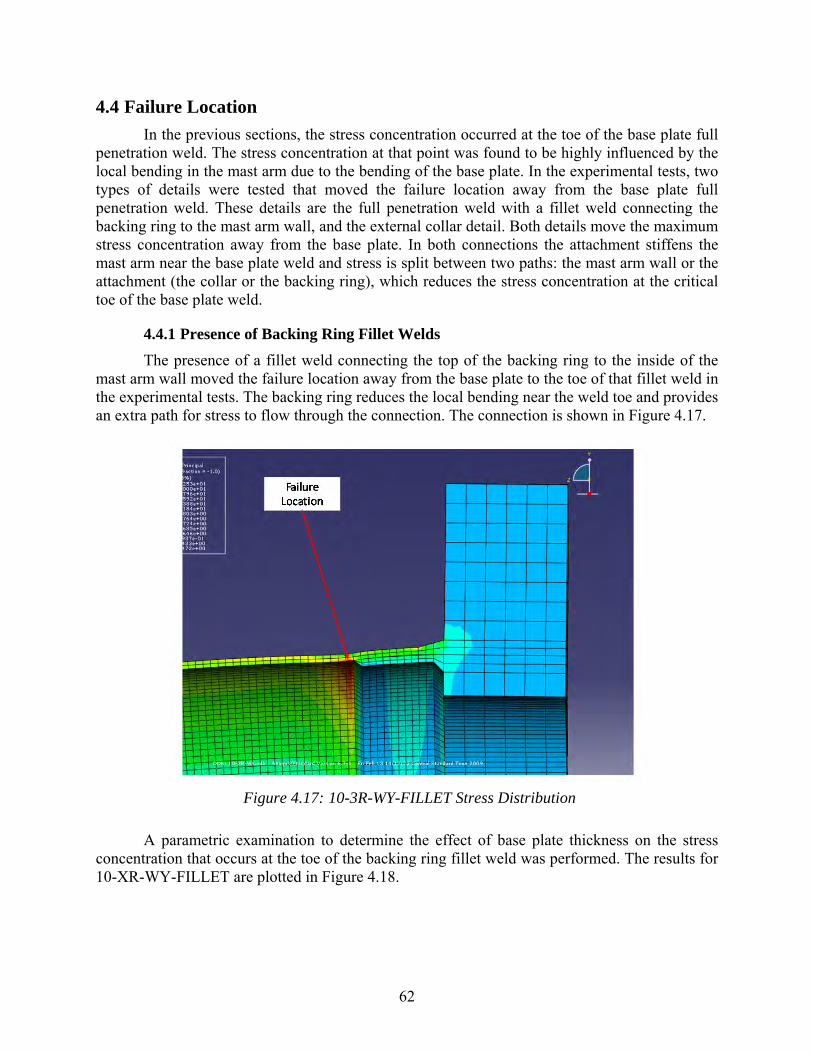
62
4.4 Failure Location
In the previous sections, the stress concentration occurred at the toe of the base plate full penetration weld. The stress concentration at that point was found to be highly influenced by the local bending in the mast arm due to the bending of the base plate. In the experimental tests, two types of details were tested that moved the failure location away from the base plate full penetration weld. These details are the full penetration weld with a fillet weld connecting the backing ring to the mast arm wall, and the external collar detail. Both details move the maximum stress concentration away from the base plate. In both connections the attachment stiffens the mast arm near the base plate weld and stress is split between two paths: the mast arm wall or the attachment (the collar or the backing ring), which reduces the stress concentration at the critical toe of the base plate weld.
4.4.1 Presence of Backing Ring Fillet Welds
The presence of a fillet weld connecting the top of the backing ring to the inside of the mast arm wall moved the failure location away from the base plate to the toe of that fillet weld in the experimental tests. The backing ring reduces the local bending near the weld toe and provides an extra path for stress to flow through the connection. The connection is shown in Figure 4.17.
Figure 4.17: 10-3R-WY-FILLET Stress Distribution
A parametric examination to determine the effect of base plate thickness on the stress concentration that occurs at the toe of the backing ring fillet weld was performed. The results for 10-XR-WY-FILLET are plotted in Figure 4.18.
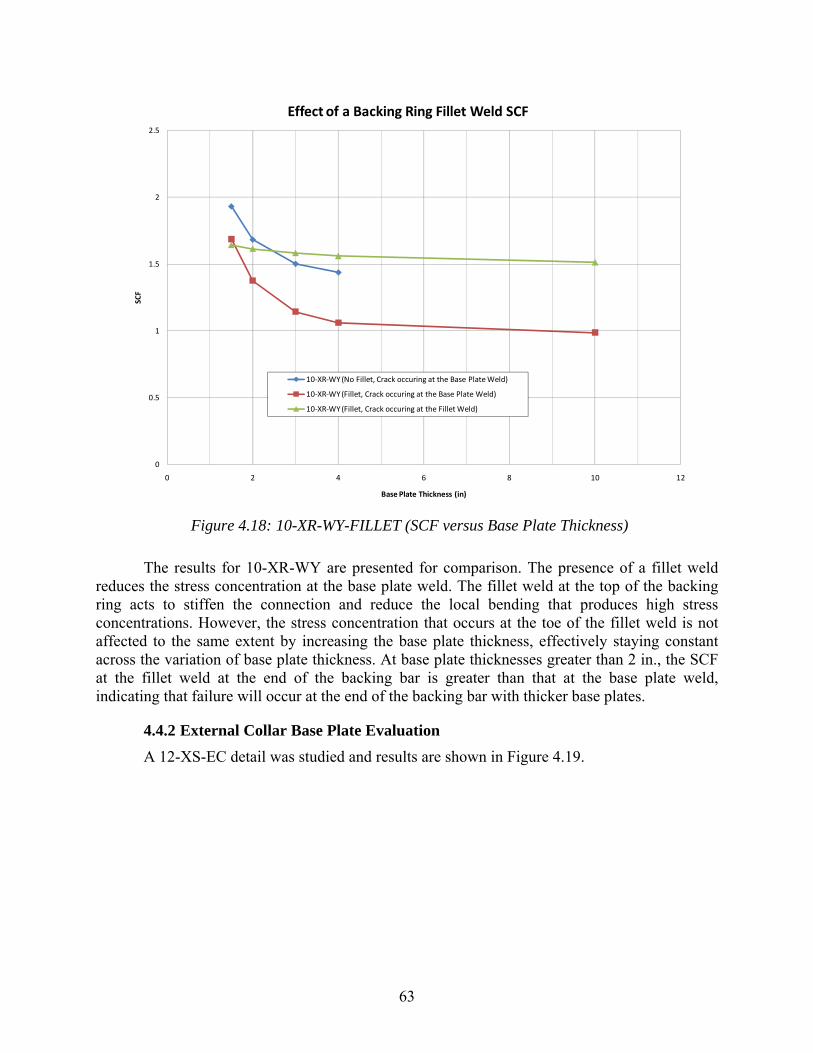
63
Figure 4.18: 10-XR-WY-FILLET (SCF versus Base Plate Thickness)
The results for 10-XR-WY are presented for comparison. The presence of a fillet weld reduces the stress concentration at the base plate weld. The fillet weld at the top of the backing ring acts to stiffen the connection and reduce the local bending that produces high stress concentrations. However, the stress concentration that occurs at the toe of the fillet weld is not affected to the same extent by increasing the base plate thickness, effectively staying constant across the variation of base plate thickness. At base plate thicknesses greater than 2 in., the SCF at the fillet weld at the end of the backing bar is greater than that at the base plate weld, indicating that failure will occur at the end of the backing bar with thicker base plates.
4.4.2 External Collar Base Plate Evaluation
A 12-XS-EC detail was studied and results are shown in Figure 4.19.
0
0.5
1
1.5
2
2.5
0 2 4 6 8 10 12
SCF
Base Plate Thickness (in)
Effect of a Backing Ring Fillet Weld SCF
10‐XR‐WY (No Fillet, Crack occuring at the Base Plate Weld)
10‐XR‐WY (Fillet, Crack occuring at the Base Plate Weld)
10‐XR‐WY (Fillet, Crack occuring at the Fillet Weld)
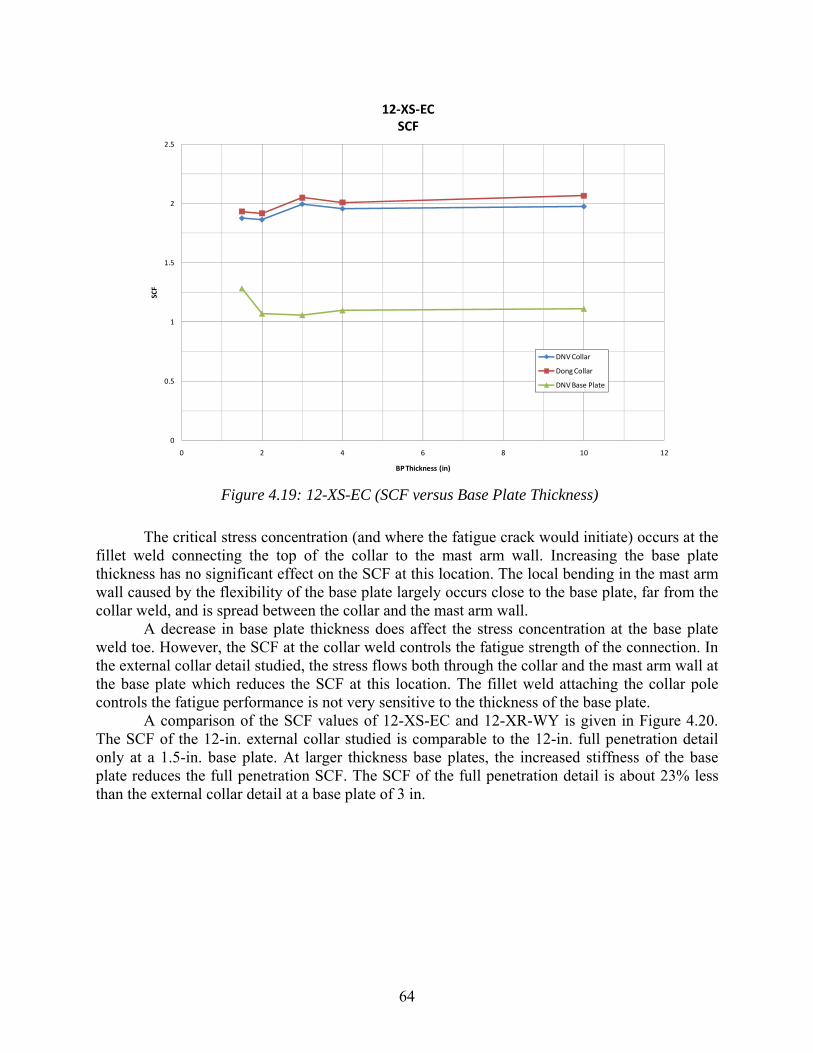
64
Figure 4.19: 12-XS-EC (SCF versus Base Plate Thickness)
The critical stress concentration (and where the fatigue crack would initiate) occurs at the fillet weld connecting the top of the collar to the mast arm wall. Increasing the base plate thickness has no significant effect on the SCF at this location. The local bending in the mast arm wall caused by the flexibility of the base plate largely occurs close to the base plate, far from the collar weld, and is spread between the collar and the mast arm wall.
A decrease in base plate thickness does affect the stress concentration at the base plate weld toe. However, the SCF at the collar weld controls the fatigue strength of the connection. In the external collar detail studied, the stress flows both through the collar and the mast arm wall at the base plate which reduces the SCF at this location. The fillet weld attaching the collar pole controls the fatigue performance is not very sensitive to the thickness of the base plate.
A comparison of the SCF values of 12-XS-EC and 12-XR-WY is given in Figure 4.20. The SCF of the 12-in. external collar studied is comparable to the 12-in. full penetration detail only at a 1.5-in. base plate. At larger thickness base plates, the increased stiffness of the base plate reduces the full penetration SCF. The SCF of the full penetration detail is about 23% less than the external collar detail at a base plate of 3 in.
0
0.5
1
1.5
2
2.5
0 2 4 6 8 10 12
SCF
BP Thickness (in)
12‐XS‐EC SCF
DNV Collar
Dong Collar
DNV Base Plate
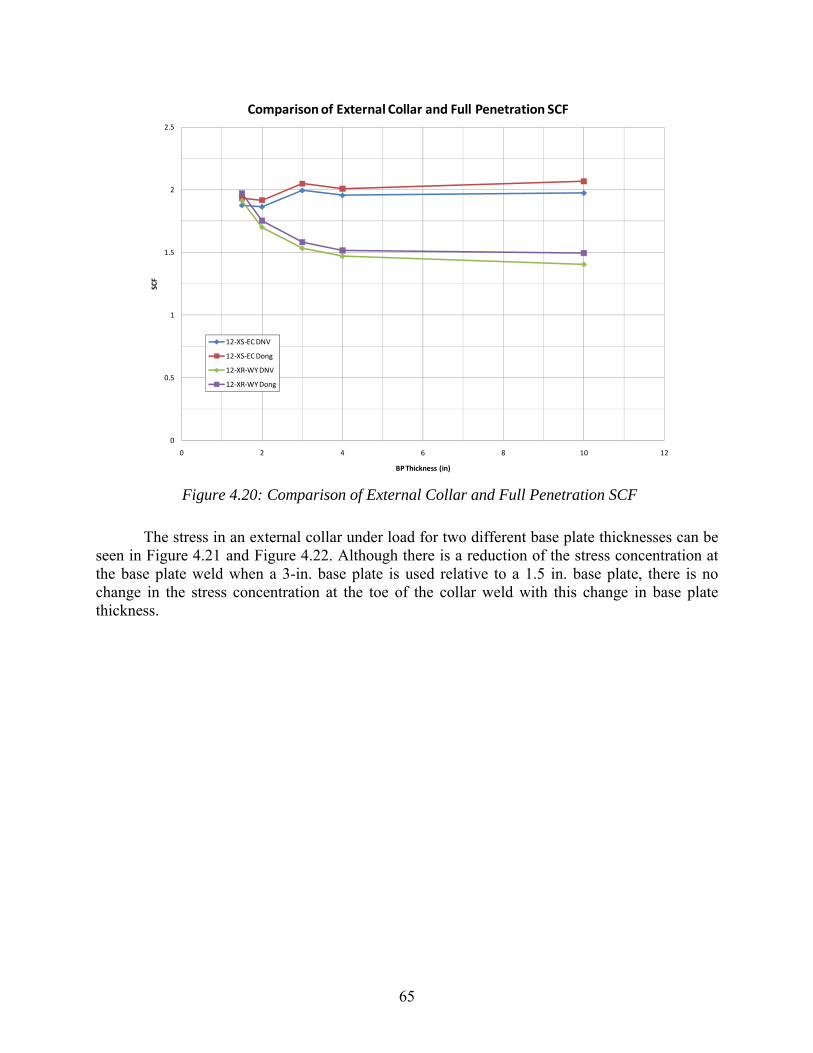
65
Figure 4.20: Comparison of External Collar and Full Penetration SCF
The stress in an external collar under load for two different base plate thicknesses can be seen in Figure 4.21 and Figure 4.22. Although there is a reduction of the stress concentration at the base plate weld when a 3-in. base plate is used relative to a 1.5 in. base plate, there is no change in the stress concentration at the toe of the collar weld with this change in base plate thickness.
0
0.5
1
1.5
2
2.5
0 2 4 6 8 10 12
SCF
BP Thickness (in)
Comparison of External Collar and Full Penetration SCF
12‐XS‐EC DNV
12‐XS‐EC Dong
12‐XR‐WY DNV
12‐XR‐WY Dong
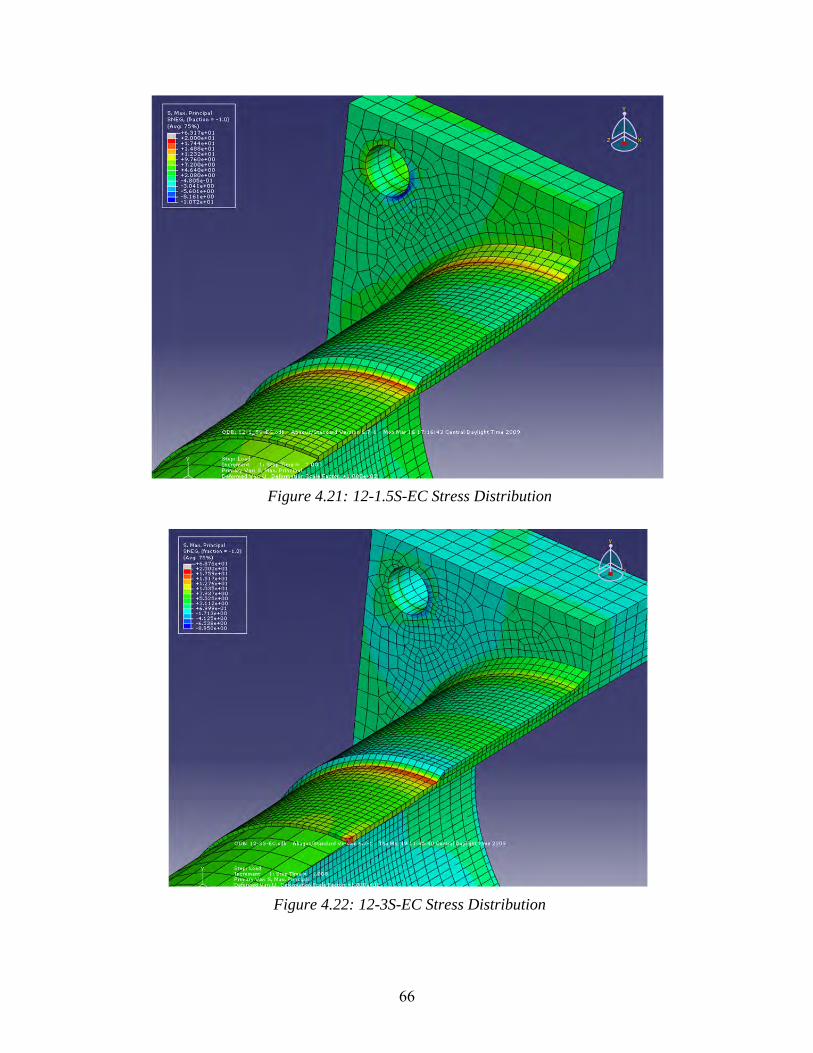
66
Figure 4.21: 12-1.5S-EC Stress Distribution
Figure 4.22: 12-3S-EC Stress Distribution
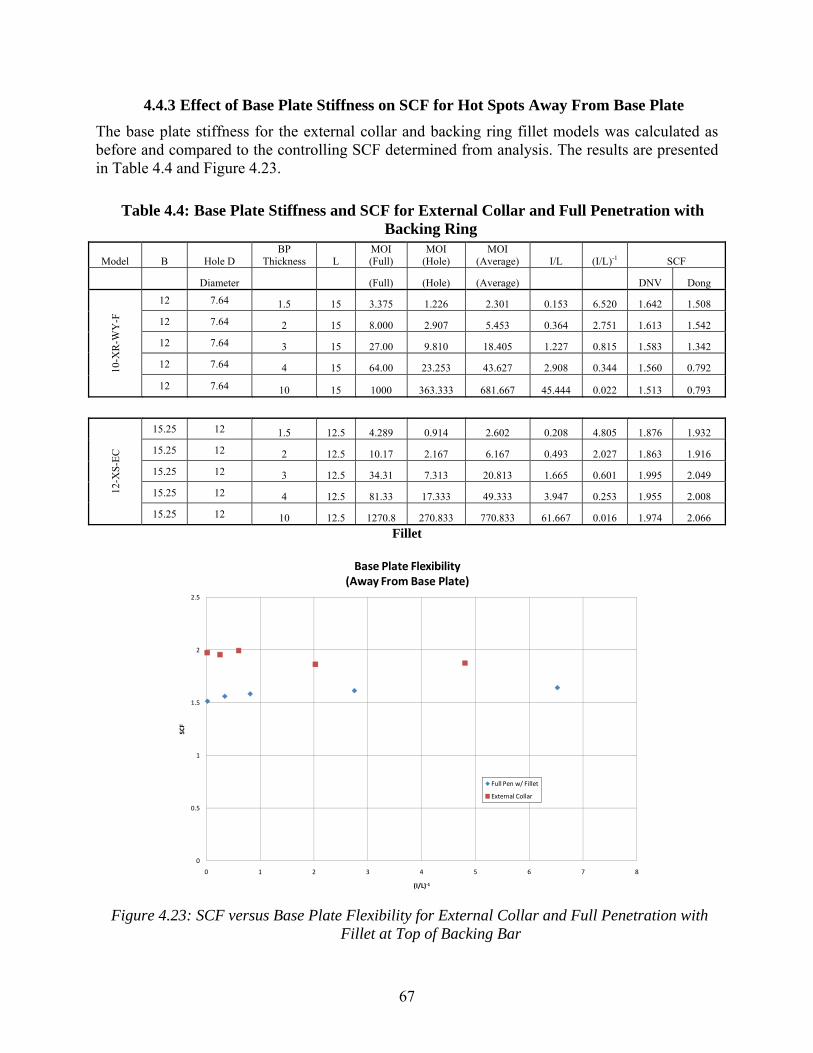
67
4.4.3 Effect of Base Plate Stiffness on SCF for Hot Spots Away From Base Plate
The base plate stiffness for the external collar and backing ring fillet models was calculated as before and compared to the controlling SCF determined from analysis. The results are presented in Table 4.4 and Figure 4.23.
Table 4.4: Base Plate Stiffness and SCF for External Collar and Full Penetration with Backing Ring
Model B Hole D BP
Thickness L MOI (Full)
MOI (Hole)
MOI (Average) I/L (I/L)-1 SCF
Diameter (Full) (Hole) (Average) DNV Dong
10-X
R-W
Y-F
12 7.64 1.5 15 3.375 1.226 2.301 0.153 6.520 1.642 1.508
12 7.64 2 15 8.000 2.907 5.453 0.364 2.751 1.613 1.542
12 7.64 3 15 27.00 9.810 18.405 1.227 0.815 1.583 1.342
12 7.64 4 15 64.00 23.253 43.627 2.908 0.344 1.560 0.792
12 7.64 10 15 1000 363.333 681.667 45.444 0.022 1.513 0.793
12-X
S-E
C
15.25 12 1.5 12.5 4.289 0.914 2.602 0.208 4.805 1.876 1.932
15.25 12 2 12.5 10.17 2.167 6.167 0.493 2.027 1.863 1.916
15.25 12 3 12.5 34.31 7.313 20.813 1.665 0.601 1.995 2.049
15.25 12 4 12.5 81.33 17.333 49.333 3.947 0.253 1.955 2.008
15.25 12 10 12.5 1270.8 270.833 770.833 61.667 0.016 1.974 2.066
Fillet
Figure 4.23: SCF versus Base Plate Flexibility for External Collar and Full Penetration with Fillet at Top of Backing Bar
0
0.5
1
1.5
2
2.5
0 1 2 3 4 5 6 7 8
SCF
(I/L)‐1
Base Plate Flexibility(Away From Base Plate)
Full Pen w/ Fillet
External Collar
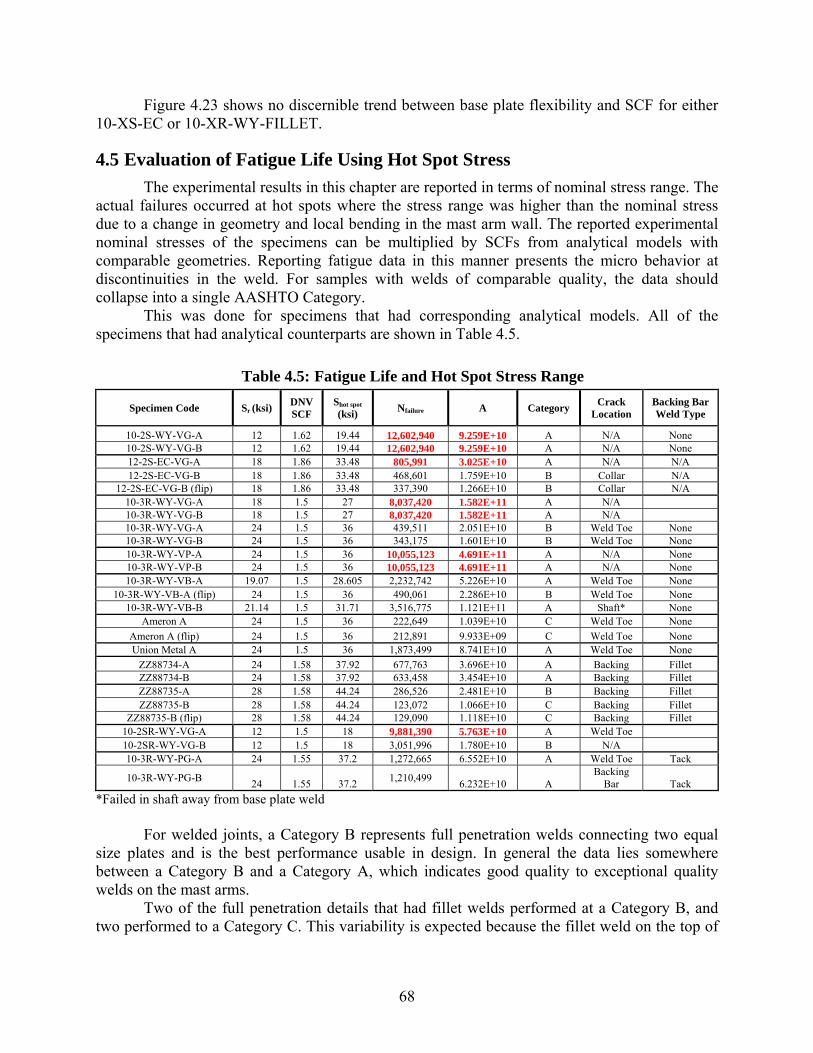
68
Figure 4.23 shows no discernible trend between base plate flexibility and SCF for either 10-XS-EC or 10-XR-WY-FILLET.
4.5 Evaluation of Fatigue Life Using Hot Spot Stress
The experimental results in this chapter are reported in terms of nominal stress range. The actual failures occurred at hot spots where the stress range was higher than the nominal stress due to a change in geometry and local bending in the mast arm wall. The reported experimental nominal stresses of the specimens can be multiplied by SCFs from analytical models with comparable geometries. Reporting fatigue data in this manner presents the micro behavior at discontinuities in the weld. For samples with welds of comparable quality, the data should collapse into a single AASHTO Category.
This was done for specimens that had corresponding analytical models. All of the specimens that had analytical counterparts are shown in Table 4.5.
Table 4.5: Fatigue Life and Hot Spot Stress Range
Specimen Code Sr (ksi) DNV SCF
Shot spot
(ksi) Nfailure A Category
Crack Location
Backing Bar Weld Type
10-2S-WY-VG-A 12 1.62 19.44 12,602,940 9.259E+10 A N/A None 10-2S-WY-VG-B 12 1.62 19.44 12,602,940 9.259E+10 A N/A None 12-2S-EC-VG-A 18 1.86 33.48 805,991 3.025E+10 A N/A N/A 12-2S-EC-VG-B 18 1.86 33.48 468,601 1.759E+10 B Collar N/A
12-2S-EC-VG-B (flip) 18 1.86 33.48 337,390 1.266E+10 B Collar N/A 10-3R-WY-VG-A 18 1.5 27 8,037,420 1.582E+11 A N/A 10-3R-WY-VG-B 18 1.5 27 8,037,420 1.582E+11 A N/A 10-3R-WY-VG-A 24 1.5 36 439,511 2.051E+10 B Weld Toe None 10-3R-WY-VG-B 24 1.5 36 343,175 1.601E+10 B Weld Toe None 10-3R-WY-VP-A 24 1.5 36 10,055,123 4.691E+11 A N/A None 10-3R-WY-VP-B 24 1.5 36 10,055,123 4.691E+11 A N/A None 10-3R-WY-VB-A 19.07 1.5 28.605 2,232,742 5.226E+10 A Weld Toe None
10-3R-WY-VB-A (flip) 24 1.5 36 490,061 2.286E+10 B Weld Toe None 10-3R-WY-VB-B 21.14 1.5 31.71 3,516,775 1.121E+11 A Shaft* None
Ameron A 24 1.5 36 222,649 1.039E+10 C Weld Toe None
Ameron A (flip) 24 1.5 36 212,891 9.933E+09 C Weld Toe None Union Metal A 24 1.5 36 1,873,499 8.741E+10 A Weld Toe None
ZZ88734-A 24 1.58 37.92 677,763 3.696E+10 A Backing Fillet ZZ88734-B 24 1.58 37.92 633,458 3.454E+10 A Backing Fillet ZZ88735-A 28 1.58 44.24 286,526 2.481E+10 B Backing Fillet ZZ88735-B 28 1.58 44.24 123,072 1.066E+10 C Backing Fillet
ZZ88735-B (flip) 28 1.58 44.24 129,090 1.118E+10 C Backing Fillet 10-2SR-WY-VG-A 12 1.5 18 9,881,390 5.763E+10 A Weld Toe 10-2SR-WY-VG-B 12 1.5 18 3,051,996 1.780E+10 B N/A 10-3R-WY-PG-A 24 1.55 37.2 1,272,665 6.552E+10 A Weld Toe Tack
10-3R-WY-PG-B 24 1.55 37.2
1,210,499 6.232E+10 A
Backing Bar Tack
*Failed in shaft away from base plate weld
For welded joints, a Category B represents full penetration welds connecting two equal size plates and is the best performance usable in design. In general the data lies somewhere between a Category B and a Category A, which indicates good quality to exceptional quality welds on the mast arms.
Two of the full penetration details that had fillet welds performed at a Category B, and two performed to a Category C. This variability is expected because the fillet weld on the top of
69
the backing ring is basically a blind weld. Generally, load-carrying fillet welds are given a Category C designation.
The 10-3R-WY specimens in general perform very well, with the exception of the two tests from Ameron, which performed at the level of a Category C detail. This suggests poor weld quality in the Ameron specimens.
The peened samples performed the best of all the specimens tested. In general the black specimens performed better than galvanized specimens, although one galvanized specimen ran out at a hot spot stress range of 27 ksi, which is very close to the hot spot stress ranges that the black samples experienced (28.6 ksi–36 ksi).
The specimens with 2-in. base plates, two full penetration details, and an external collar, collapsed into a Category B, indicating that the quality of the welds in the different samples was similar.
As stated in Chapter 5, an approximation was made when modeling the bolts that the base plate attaches to. The bolts were modeled by fixing the edges of the bolt holes. This boundary condition resulted in slightly high reported SCF values. The actual stress that occurred was somewhat lower than what is reported. The same assumptions were made across all models, and the relative performance would be the same.
4.6 Summary of Results of Parametric Research
Stress concentrations at points very near to the base plate are highly influenced by local bending in the mast arm due to the flexibility of the base plate. This local bending affects the full penetration weld in Wyoming details and the base plate weld in external collar details. For welds far enough away from the base plate, like collar welds, the base plate stiffness does not affect the SCF.
In this phase of the research, the base plates of external collars were relatively stiff, and the collar weld SCF controlled fatigue performance. The parametric examination of external collar SCF implied that if base plate stiffness was small enough, the SCF at the base plate weld of external collar details may be high enough to control fatigue performance. This was seen in concurrent research at UT, where high-masts (very large mast arms) were tested. High-mast external collars with stiffer base plates failed at the collar weld, while high-masts with more flexible base plates failed at the base plate weld (Stam 2009).
For full penetration details, the controlling stress concentration is at the toe of the weld connecting the mast arm to the base plate. The SCF is directly proportional to the flexibility of the base plate.
For full penetration details, the base plate thickness affects the stress concentration factor more than any other variable. This is reasonable, because the moment of inertia of the base plate is proportional to the cube of the thickness.
Other variables that affected the stress concentration factor in full penetration details were base plate geometry, the size of the hole in the base plate, the shape of the mast arm, and possibly the diameter of the mast arm, but these were smaller effects than the base plate thickness.
70
In the external collar detail and the full penetration detail with a fillet weld at the top of the backing ring, the failure location moved away from the base plate to the fillet weld connecting the backing bar or collar. The mast arm near to the base plate was stiffened by the backup bar. The maximum stress concentration occurred at the toe of the weld connecting the collar or backing ring to the mast arm wall. There was no or little relationship between base plate thickness and this stress concentration. The comparison of base plate stiffness and SCF for these details shows no trend.
At small base plate thickness, the external collar detail and full penetration detail perform comparably. As the base plate thickness is increased, the SCF of the full penetration detail is reduced but the SCF of the external collar detail remains the same. The effect of base plate stiffness on full penetration SCF can be used to size a full penetration mast arm to attain better fatigue performance than an external collar detail.
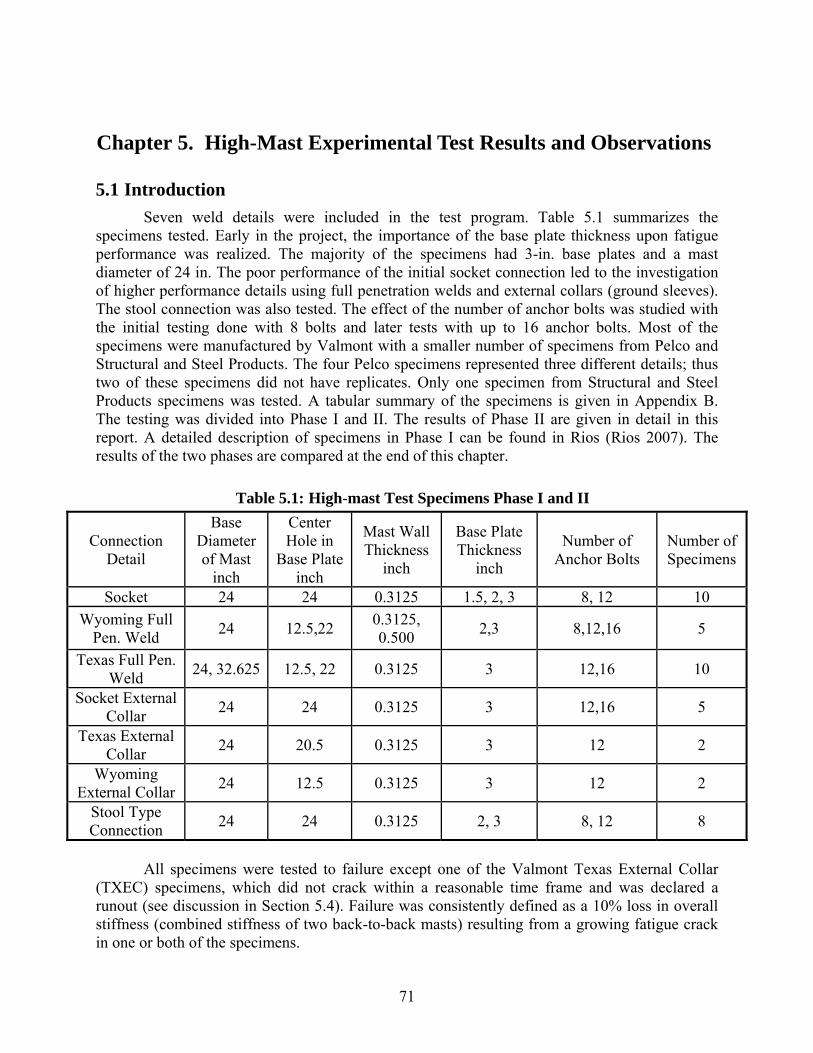
71
Chapter 5. High-Mast Experimental Test Results and Observations
5.1 Introduction
Seven weld details were included in the test program. Table 5.1 summarizes the specimens tested. Early in the project, the importance of the base plate thickness upon fatigue performance was realized. The majority of the specimens had 3-in. base plates and a mast diameter of 24 in. The poor performance of the initial socket connection led to the investigation of higher performance details using full penetration welds and external collars (ground sleeves). The stool connection was also tested. The effect of the number of anchor bolts was studied with the initial testing done with 8 bolts and later tests with up to 16 anchor bolts. Most of the specimens were manufactured by Valmont with a smaller number of specimens from Pelco and Structural and Steel Products. The four Pelco specimens represented three different details; thus two of these specimens did not have replicates. Only one specimen from Structural and Steel Products specimens was tested. A tabular summary of the specimens is given in Appendix B. The testing was divided into Phase I and II. The results of Phase II are given in detail in this report. A detailed description of specimens in Phase I can be found in Rios (Rios 2007). The results of the two phases are compared at the end of this chapter.
Table 5.1: High-mast Test Specimens Phase I and II
Connection Detail
Base Diameter of Mast
inch
Center Hole in
Base Plate inch
Mast Wall Thickness
inch
Base Plate Thickness
inch
Number of Anchor Bolts
Number of Specimens
Socket 24 24 0.3125 1.5, 2, 3 8, 12 10
Wyoming Full Pen. Weld
24 12.5,22 0.3125, 0.500
2,3 8,12,16 5
Texas Full Pen. Weld
24, 32.625 12.5, 22 0.3125 3 12,16 10
Socket External Collar
24 24 0.3125 3 12,16 5
Texas External Collar
24 20.5 0.3125 3 12 2
Wyoming External Collar
24 12.5 0.3125 3 12 2
Stool Type Connection
24 24 0.3125 2, 3 8, 12 8
All specimens were tested to failure except one of the Valmont Texas External Collar
(TXEC) specimens, which did not crack within a reasonable time frame and was declared a runout (see discussion in Section 5.4). Failure was consistently defined as a 10% loss in overall stiffness (combined stiffness of two back-to-back masts) resulting from a growing fatigue crack in one or both of the specimens.
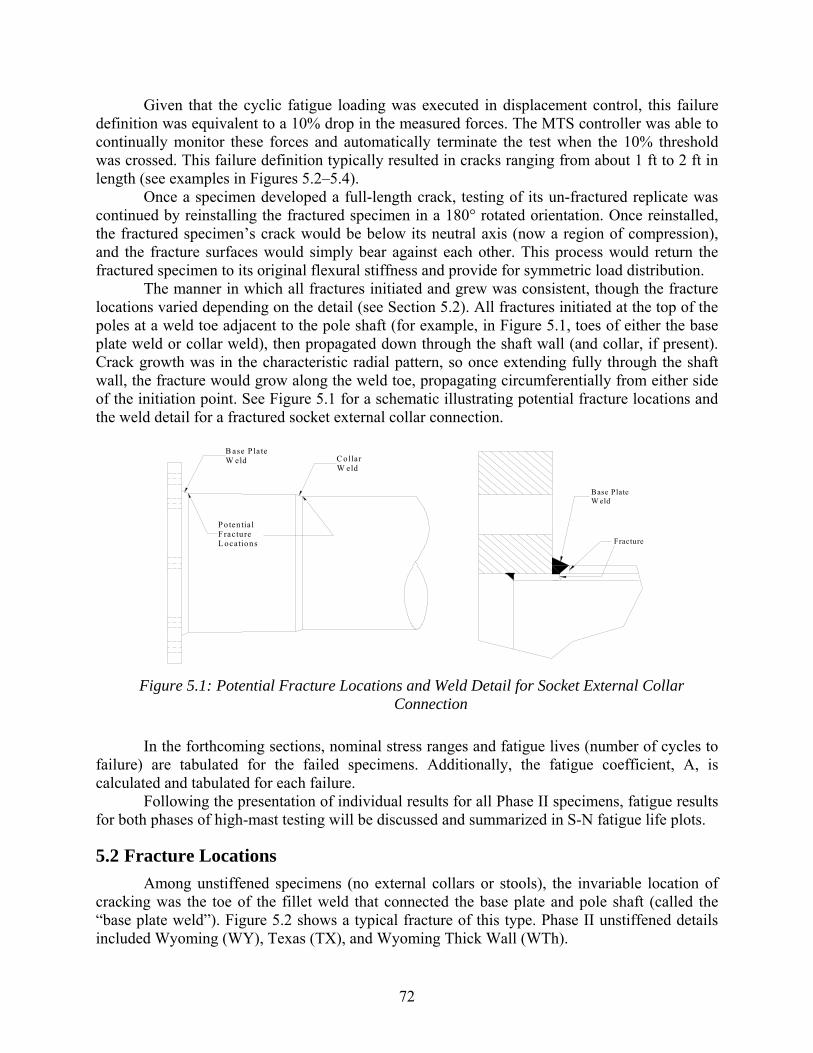
72
Given that the cyclic fatigue loading was executed in displacement control, this failure definition was equivalent to a 10% drop in the measured forces. The MTS controller was able to continually monitor these forces and automatically terminate the test when the 10% threshold was crossed. This failure definition typically resulted in cracks ranging from about 1 ft to 2 ft in length (see examples in Figures 5.2–5.4).
Once a specimen developed a full-length crack, testing of its un-fractured replicate was continued by reinstalling the fractured specimen in a 180° rotated orientation. Once reinstalled, the fractured specimen’s crack would be below its neutral axis (now a region of compression), and the fracture surfaces would simply bear against each other. This process would return the fractured specimen to its original flexural stiffness and provide for symmetric load distribution.
The manner in which all fractures initiated and grew was consistent, though the fracture locations varied depending on the detail (see Section 5.2). All fractures initiated at the top of the poles at a weld toe adjacent to the pole shaft (for example, in Figure 5.1, toes of either the base plate weld or collar weld), then propagated down through the shaft wall (and collar, if present). Crack growth was in the characteristic radial pattern, so once extending fully through the shaft wall, the fracture would grow along the weld toe, propagating circumferentially from either side of the initiation point. See Figure 5.1 for a schematic illustrating potential fracture locations and the weld detail for a fractured socket external collar connection.
Figure 5.1: Potential Fracture Locations and Weld Detail for Socket External Collar Connection
In the forthcoming sections, nominal stress ranges and fatigue lives (number of cycles to failure) are tabulated for the failed specimens. Additionally, the fatigue coefficient, A, is calculated and tabulated for each failure.
Following the presentation of individual results for all Phase II specimens, fatigue results for both phases of high-mast testing will be discussed and summarized in S-N fatigue life plots.
5.2 Fracture Locations
Among unstiffened specimens (no external collars or stools), the invariable location of cracking was the toe of the fillet weld that connected the base plate and pole shaft (called the “base plate weld”). Figure 5.2 shows a typical fracture of this type. Phase II unstiffened details included Wyoming (WY), Texas (TX), and Wyoming Thick Wall (WTh).
B ase P la teW eld C ollar
W eld
P o ten tialF ractureL ocations
Base PlateW eld
Fracture
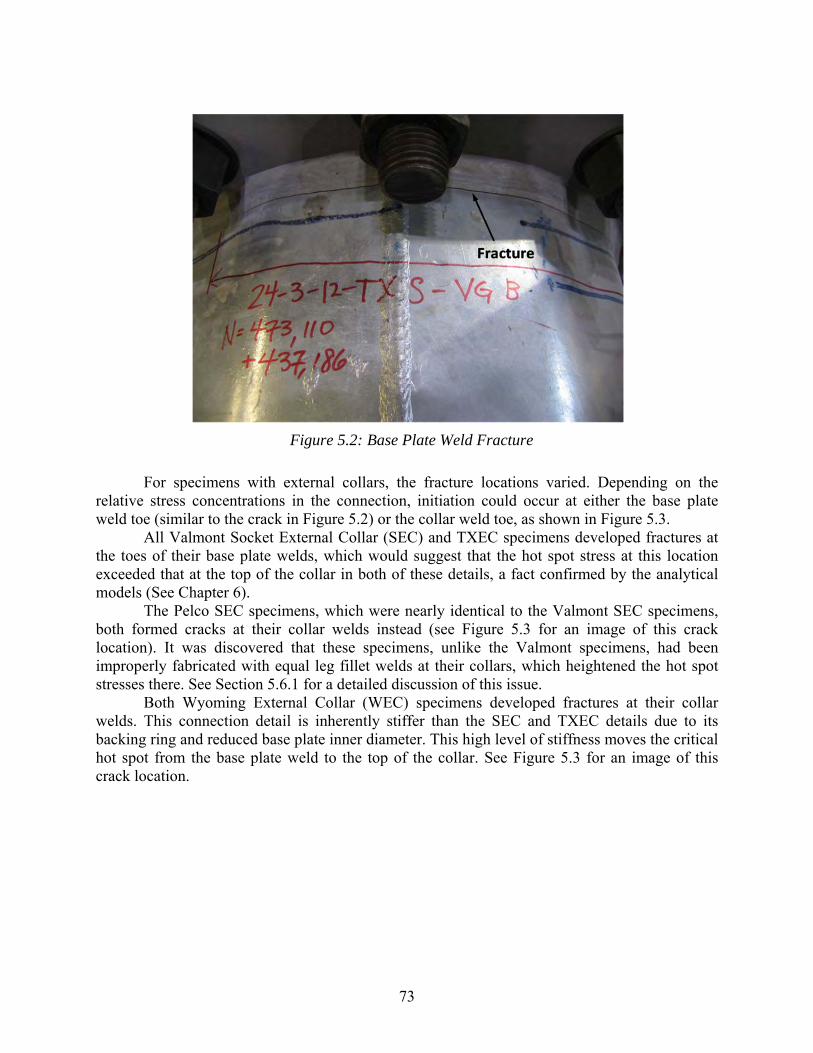
73
Figure 5.2: Base Plate Weld Fracture
For specimens with external collars, the fracture locations varied. Depending on the relative stress concentrations in the connection, initiation could occur at either the base plate weld toe (similar to the crack in Figure 5.2) or the collar weld toe, as shown in Figure 5.3.
All Valmont Socket External Collar (SEC) and TXEC specimens developed fractures at the toes of their base plate welds, which would suggest that the hot spot stress at this location exceeded that at the top of the collar in both of these details, a fact confirmed by the analytical models (See Chapter 6).
The Pelco SEC specimens, which were nearly identical to the Valmont SEC specimens, both formed cracks at their collar welds instead (see Figure 5.3 for an image of this crack location). It was discovered that these specimens, unlike the Valmont specimens, had been improperly fabricated with equal leg fillet welds at their collars, which heightened the hot spot stresses there. See Section 5.6.1 for a detailed discussion of this issue.
Both Wyoming External Collar (WEC) specimens developed fractures at their collar welds. This connection detail is inherently stiffer than the SEC and TXEC details due to its backing ring and reduced base plate inner diameter. This high level of stiffness moves the critical hot spot from the base plate weld to the top of the collar. See Figure 5.3 for an image of this crack location.
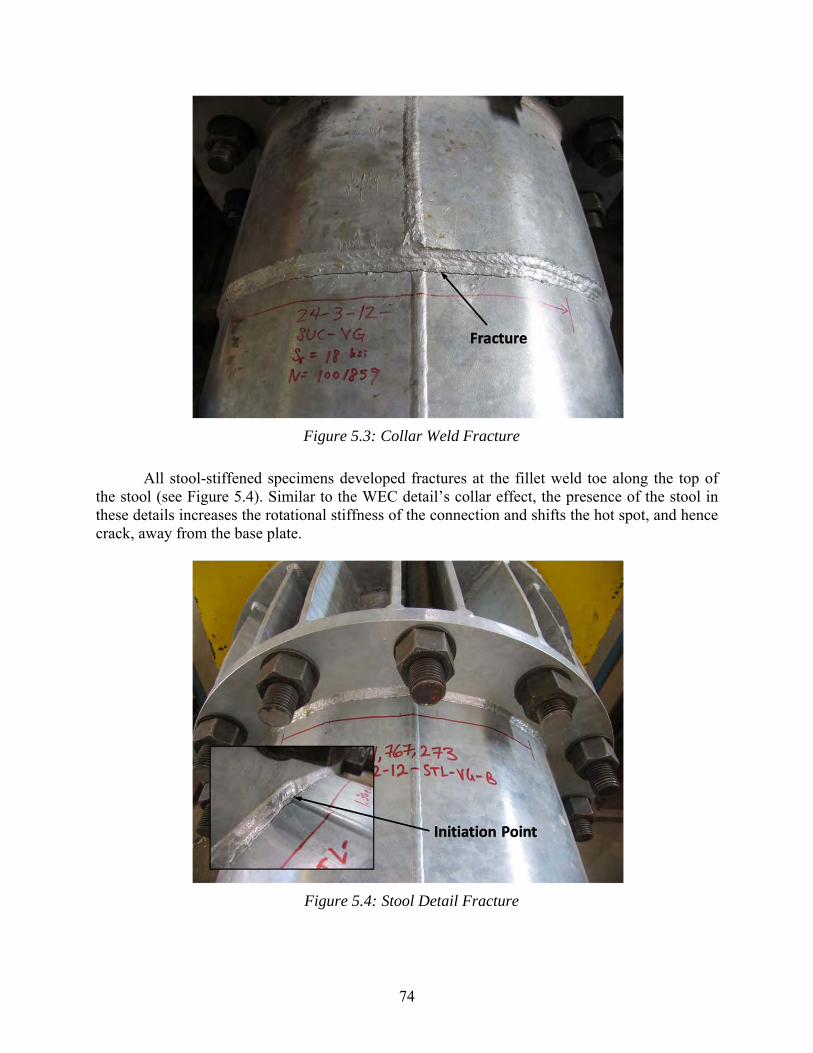
74
Figure 5.3: Collar Weld Fracture
All stool-stiffened specimens developed fractures at the fillet weld toe along the top of the stool (see Figure 5.4). Similar to the WEC detail’s collar effect, the presence of the stool in these details increases the rotational stiffness of the connection and shifts the hot spot, and hence crack, away from the base plate.
Figure 5.4: Stool Detail Fracture
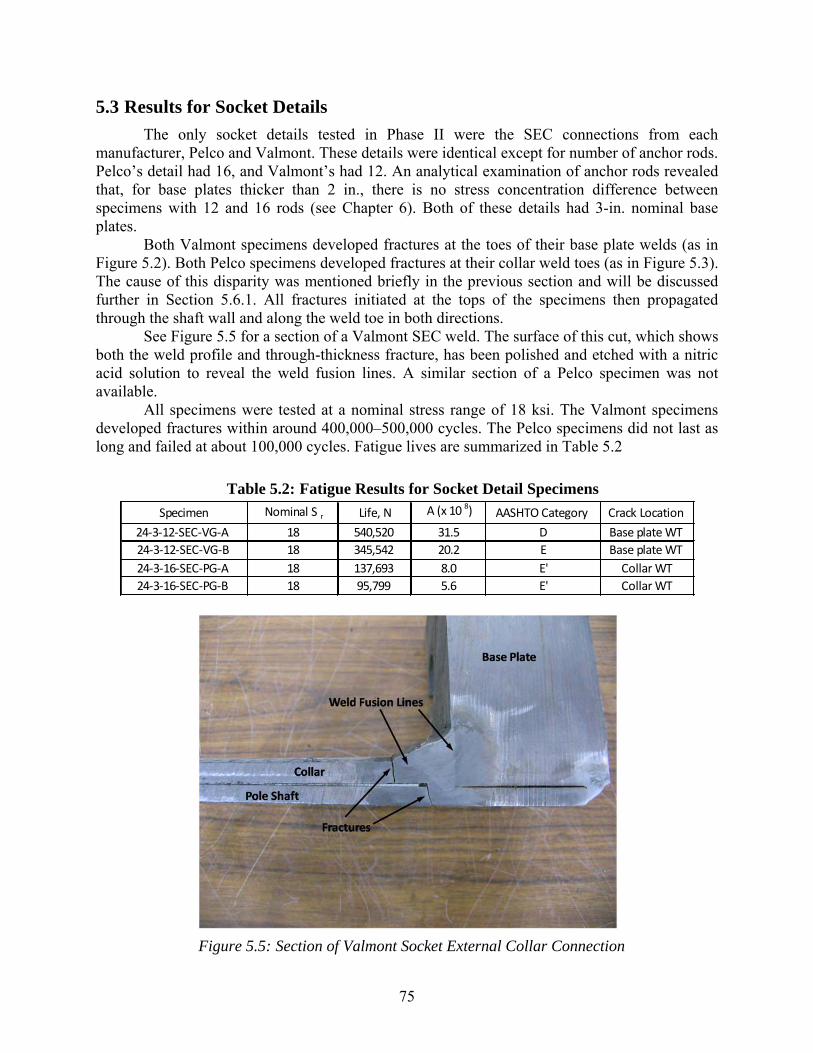
75
5.3 Results for Socket Details
The only socket details tested in Phase II were the SEC connections from each manufacturer, Pelco and Valmont. These details were identical except for number of anchor rods. Pelco’s detail had 16, and Valmont’s had 12. An analytical examination of anchor rods revealed that, for base plates thicker than 2 in., there is no stress concentration difference between specimens with 12 and 16 rods (see Chapter 6). Both of these details had 3-in. nominal base plates.
Both Valmont specimens developed fractures at the toes of their base plate welds (as in Figure 5.2). Both Pelco specimens developed fractures at their collar weld toes (as in Figure 5.3). The cause of this disparity was mentioned briefly in the previous section and will be discussed further in Section 5.6.1. All fractures initiated at the tops of the specimens then propagated through the shaft wall and along the weld toe in both directions.
See Figure 5.5 for a section of a Valmont SEC weld. The surface of this cut, which shows both the weld profile and through-thickness fracture, has been polished and etched with a nitric acid solution to reveal the weld fusion lines. A similar section of a Pelco specimen was not available.
All specimens were tested at a nominal stress range of 18 ksi. The Valmont specimens developed fractures within around 400,000–500,000 cycles. The Pelco specimens did not last as long and failed at about 100,000 cycles. Fatigue lives are summarized in Table 5.2
Table 5.2: Fatigue Results for Socket Detail Specimens
Figure 5.5: Section of Valmont Socket External Collar Connection
Specimen Nominal S r Life, N A (x 10 8) AASHTO Category Crack Location
24‐3‐12‐SEC‐VG‐A 18 540,520 31.5 D Base plate WT
24‐3‐12‐SEC‐VG‐B 18 345,542 20.2 E Base plate WT
24‐3‐16‐SEC‐PG‐A 18 137,693 8.0 E' Collar WT
24‐3‐16‐SEC‐PG‐B 18 95,799 5.6 E' Collar WT
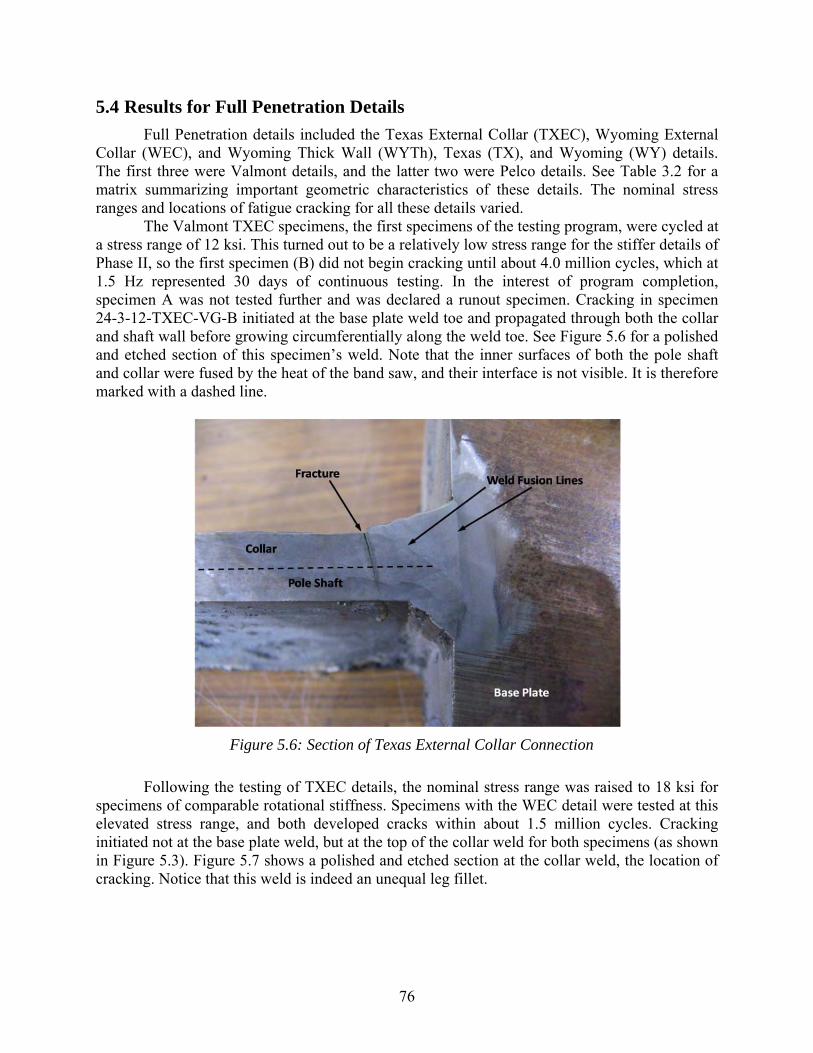
76
5.4 Results for Full Penetration Details
Full Penetration details included the Texas External Collar (TXEC), Wyoming External Collar (WEC), and Wyoming Thick Wall (WYTh), Texas (TX), and Wyoming (WY) details. The first three were Valmont details, and the latter two were Pelco details. See Table 3.2 for a matrix summarizing important geometric characteristics of these details. The nominal stress ranges and locations of fatigue cracking for all these details varied.
The Valmont TXEC specimens, the first specimens of the testing program, were cycled at a stress range of 12 ksi. This turned out to be a relatively low stress range for the stiffer details of Phase II, so the first specimen (B) did not begin cracking until about 4.0 million cycles, which at 1.5 Hz represented 30 days of continuous testing. In the interest of program completion, specimen A was not tested further and was declared a runout specimen. Cracking in specimen 24-3-12-TXEC-VG-B initiated at the base plate weld toe and propagated through both the collar and shaft wall before growing circumferentially along the weld toe. See Figure 5.6 for a polished and etched section of this specimen’s weld. Note that the inner surfaces of both the pole shaft and collar were fused by the heat of the band saw, and their interface is not visible. It is therefore marked with a dashed line.
Figure 5.6: Section of Texas External Collar Connection
Following the testing of TXEC details, the nominal stress range was raised to 18 ksi for specimens of comparable rotational stiffness. Specimens with the WEC detail were tested at this elevated stress range, and both developed cracks within about 1.5 million cycles. Cracking initiated not at the base plate weld, but at the top of the collar weld for both specimens (as shown in Figure 5.3). Figure 5.7 shows a polished and etched section at the collar weld, the location of cracking. Notice that this weld is indeed an unequal leg fillet.
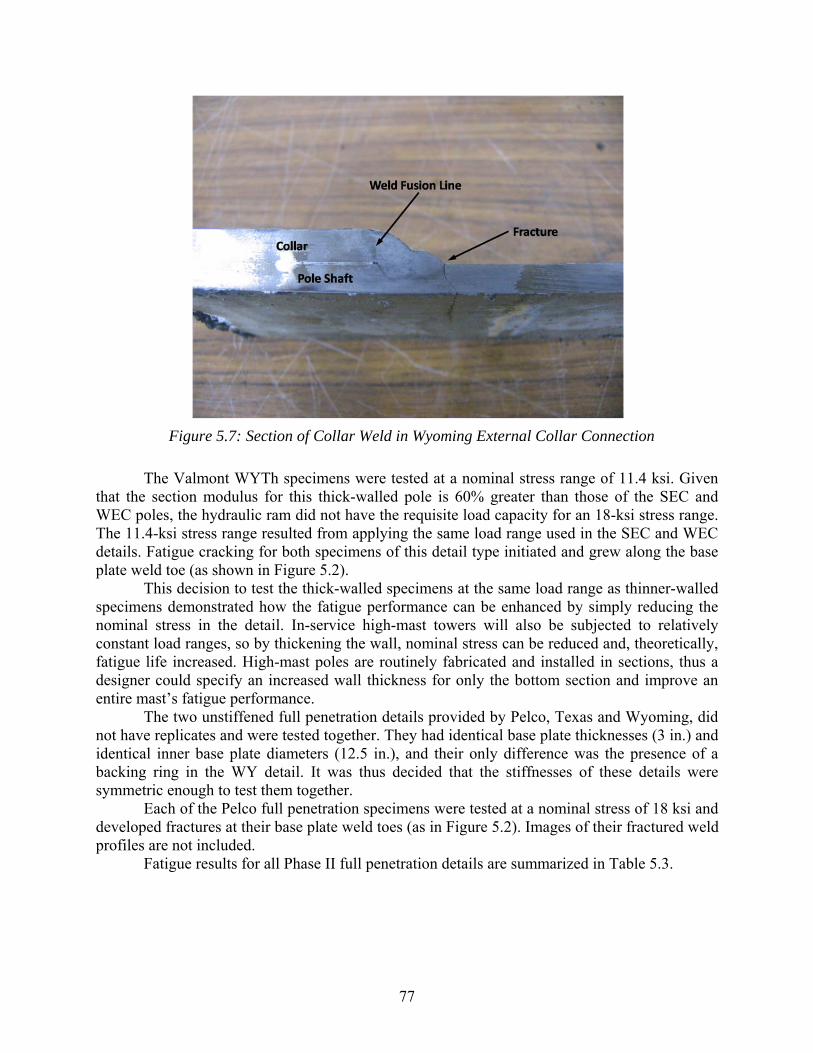
77
Figure 5.7: Section of Collar Weld in Wyoming External Collar Connection
The Valmont WYTh specimens were tested at a nominal stress range of 11.4 ksi. Given that the section modulus for this thick-walled pole is 60% greater than those of the SEC and WEC poles, the hydraulic ram did not have the requisite load capacity for an 18-ksi stress range. The 11.4-ksi stress range resulted from applying the same load range used in the SEC and WEC details. Fatigue cracking for both specimens of this detail type initiated and grew along the base plate weld toe (as shown in Figure 5.2).
This decision to test the thick-walled specimens at the same load range as thinner-walled specimens demonstrated how the fatigue performance can be enhanced by simply reducing the nominal stress in the detail. In-service high-mast towers will also be subjected to relatively constant load ranges, so by thickening the wall, nominal stress can be reduced and, theoretically, fatigue life increased. High-mast poles are routinely fabricated and installed in sections, thus a designer could specify an increased wall thickness for only the bottom section and improve an entire mast’s fatigue performance.
The two unstiffened full penetration details provided by Pelco, Texas and Wyoming, did not have replicates and were tested together. They had identical base plate thicknesses (3 in.) and identical inner base plate diameters (12.5 in.), and their only difference was the presence of a backing ring in the WY detail. It was thus decided that the stiffnesses of these details were symmetric enough to test them together.
Each of the Pelco full penetration specimens were tested at a nominal stress of 18 ksi and developed fractures at their base plate weld toes (as in Figure 5.2). Images of their fractured weld profiles are not included.
Fatigue results for all Phase II full penetration details are summarized in Table 5.3.
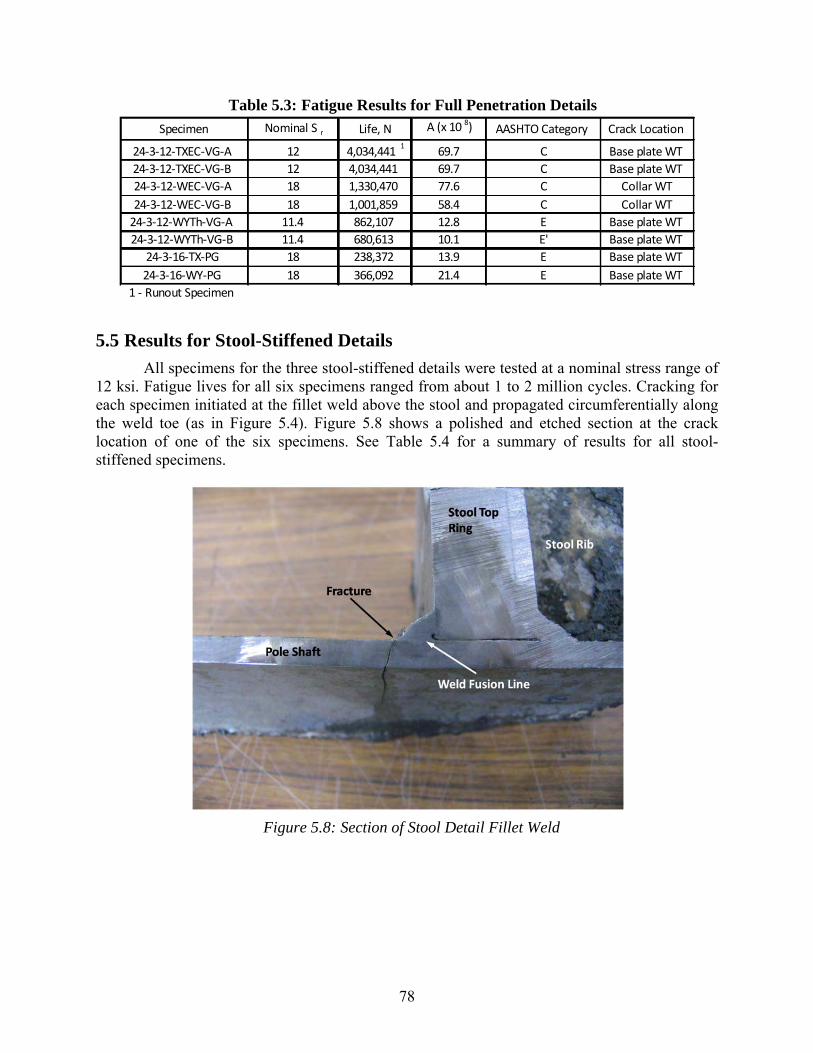
78
Table 5.3: Fatigue Results for Full Penetration Details
5.5 Results for Stool-Stiffened Details
All specimens for the three stool-stiffened details were tested at a nominal stress range of 12 ksi. Fatigue lives for all six specimens ranged from about 1 to 2 million cycles. Cracking for each specimen initiated at the fillet weld above the stool and propagated circumferentially along the weld toe (as in Figure 5.4). Figure 5.8 shows a polished and etched section at the crack location of one of the six specimens. See Table 5.4 for a summary of results for all stool-stiffened specimens.
Figure 5.8: Section of Stool Detail Fillet Weld
Specimen Nominal S r Life, N A (x 10 8) AASHTO Category Crack Location
24‐3‐12‐TXEC‐VG‐A 12 4,034,4411
69.7 C Base plate WT
24‐3‐12‐TXEC‐VG‐B 12 4,034,441 69.7 C Base plate WT
24‐3‐12‐WEC‐VG‐A 18 1,330,470 77.6 C Collar WT
24‐3‐12‐WEC‐VG‐B 18 1,001,859 58.4 C Collar WT
24‐3‐12‐WYTh‐VG‐A 11.4 862,107 12.8 E Base plate WT
24‐3‐12‐WYTh‐VG‐B 11.4 680,613 10.1 E' Base plate WT
24‐3‐16‐TX‐PG 18 238,372 13.9 E Base plate WT
24‐3‐16‐WY‐PG 18 366,092 21.4 E Base plate WT
1 ‐ Runout Specimen
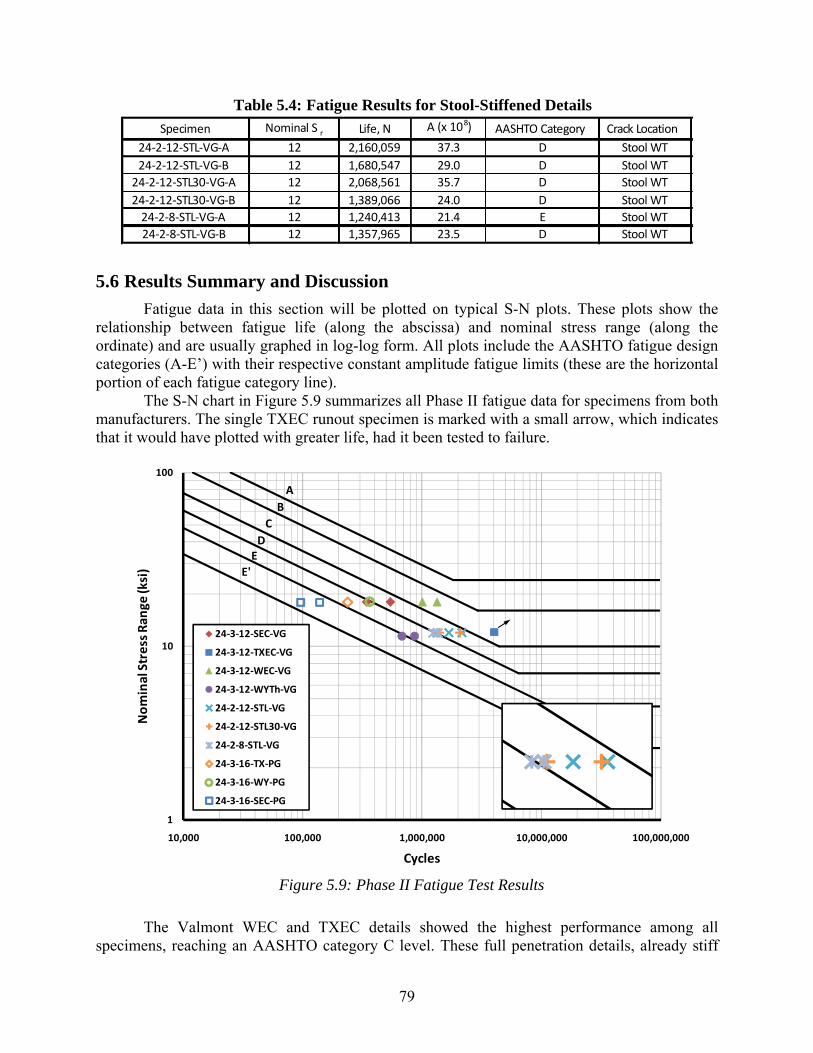
79
Table 5.4: Fatigue Results for Stool-Stiffened Details
5.6 Results Summary and Discussion
Fatigue data in this section will be plotted on typical S-N plots. These plots show the relationship between fatigue life (along the abscissa) and nominal stress range (along the ordinate) and are usually graphed in log-log form. All plots include the AASHTO fatigue design categories (A-E’) with their respective constant amplitude fatigue limits (these are the horizontal portion of each fatigue category line).
The S-N chart in Figure 5.9 summarizes all Phase II fatigue data for specimens from both manufacturers. The single TXEC runout specimen is marked with a small arrow, which indicates that it would have plotted with greater life, had it been tested to failure.
Figure 5.9: Phase II Fatigue Test Results
The Valmont WEC and TXEC details showed the highest performance among all specimens, reaching an AASHTO category C level. These full penetration details, already stiff
Specimen Nominal S r Life, N A (x 108) AASHTO Category Crack Location
24‐2‐12‐STL‐VG‐A 12 2,160,059 37.3 D Stool WT
24‐2‐12‐STL‐VG‐B 12 1,680,547 29.0 D Stool WT
24‐2‐12‐STL30‐VG‐A 12 2,068,561 35.7 D Stool WT
24‐2‐12‐STL30‐VG‐B 12 1,389,066 24.0 D Stool WT
24‐2‐8‐STL‐VG‐A 12 1,240,413 21.4 E Stool WT
24‐2‐8‐STL‐VG‐B 12 1,357,965 23.5 D Stool WT
A
B
C
DE
E'
1
10
100
10,000 100,000 1,000,000 10,000,000 100,000,000
Nominal Stress Ran
ge (ksi)
Cycles
24‐3‐12‐SEC‐VG
24‐3‐12‐TXEC‐VG
24‐3‐12‐WEC‐VG
24‐3‐12‐WYTh‐VG
24‐2‐12‐STL‐VG
24‐2‐12‐STL30‐VG
24‐2‐8‐STL‐VG
24‐3‐16‐TX‐PG
24‐3‐16‐WY‐PG
24‐3‐16‐SEC‐PG
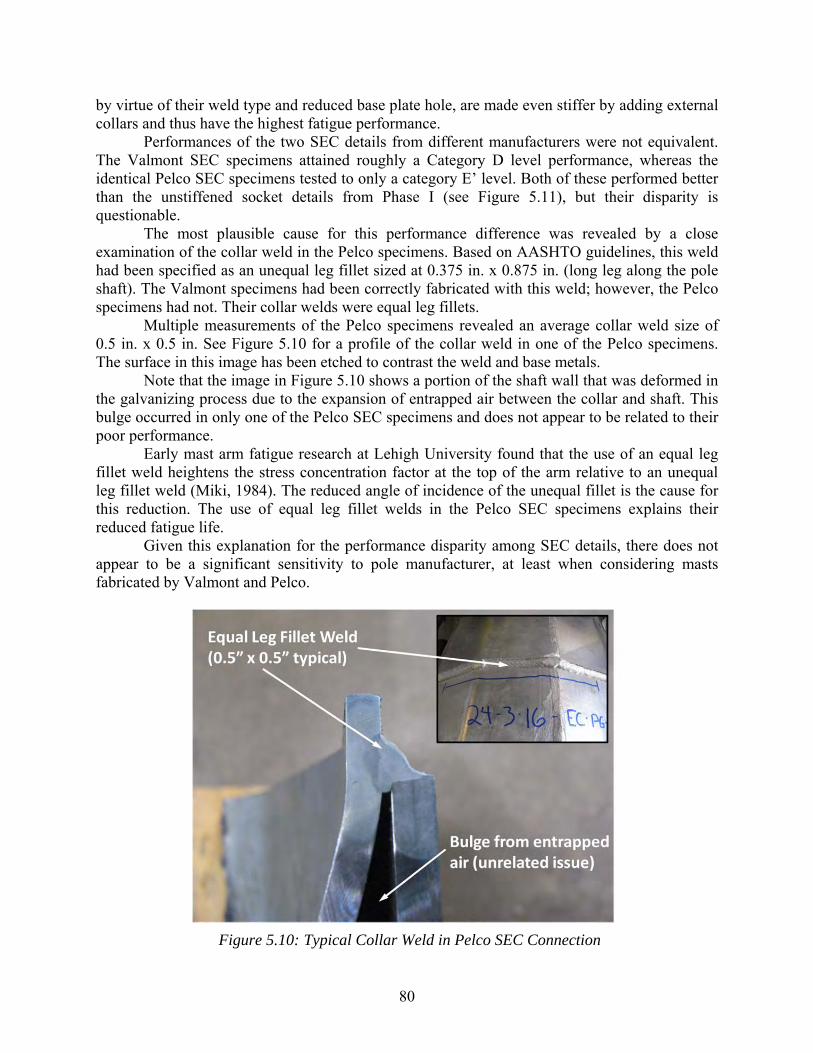
80
by virtue of their weld type and reduced base plate hole, are made even stiffer by adding external collars and thus have the highest fatigue performance.
Performances of the two SEC details from different manufacturers were not equivalent. The Valmont SEC specimens attained roughly a Category D level performance, whereas the identical Pelco SEC specimens tested to only a category E’ level. Both of these performed better than the unstiffened socket details from Phase I (see Figure 5.11), but their disparity is questionable.
The most plausible cause for this performance difference was revealed by a close examination of the collar weld in the Pelco specimens. Based on AASHTO guidelines, this weld had been specified as an unequal leg fillet sized at 0.375 in. x 0.875 in. (long leg along the pole shaft). The Valmont specimens had been correctly fabricated with this weld; however, the Pelco specimens had not. Their collar welds were equal leg fillets.
Multiple measurements of the Pelco specimens revealed an average collar weld size of 0.5 in. x 0.5 in. See Figure 5.10 for a profile of the collar weld in one of the Pelco specimens. The surface in this image has been etched to contrast the weld and base metals.
Note that the image in Figure 5.10 shows a portion of the shaft wall that was deformed in the galvanizing process due to the expansion of entrapped air between the collar and shaft. This bulge occurred in only one of the Pelco SEC specimens and does not appear to be related to their poor performance.
Early mast arm fatigue research at Lehigh University found that the use of an equal leg fillet weld heightens the stress concentration factor at the top of the arm relative to an unequal leg fillet weld (Miki, 1984). The reduced angle of incidence of the unequal fillet is the cause for this reduction. The use of equal leg fillet welds in the Pelco SEC specimens explains their reduced fatigue life.
Given this explanation for the performance disparity among SEC details, there does not appear to be a significant sensitivity to pole manufacturer, at least when considering masts fabricated by Valmont and Pelco.
Figure 5.10: Typical Collar Weld in Pelco SEC Connection
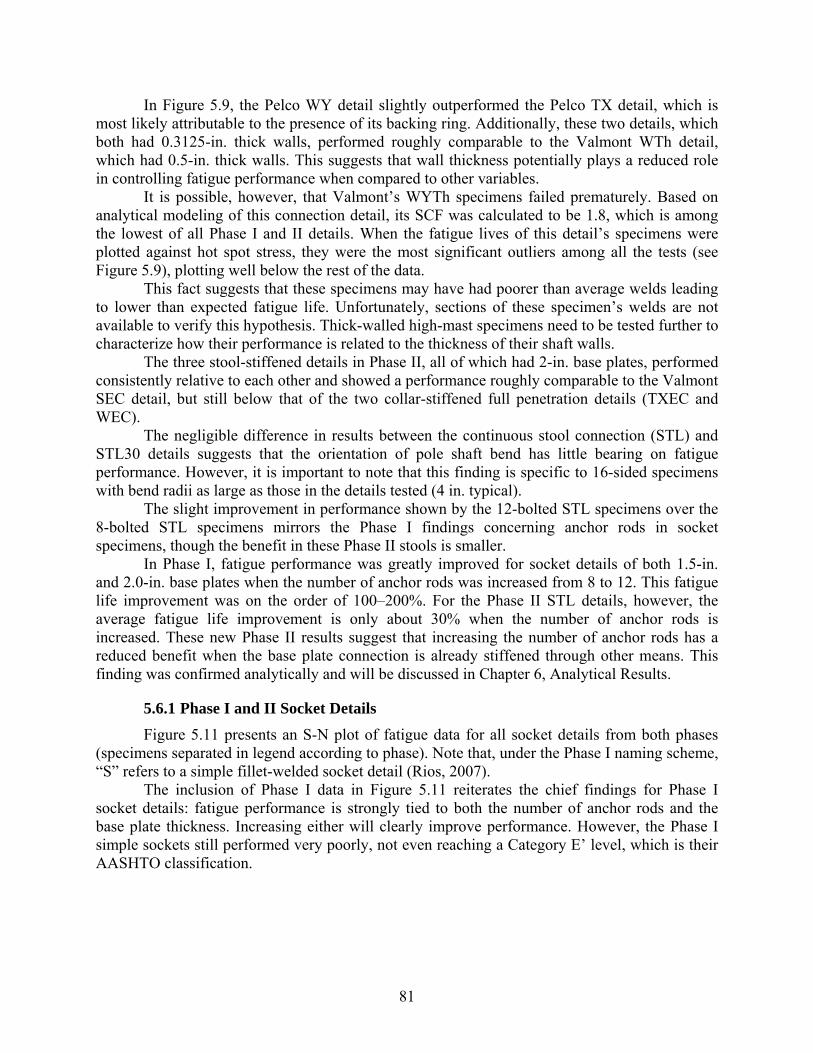
81
In Figure 5.9, the Pelco WY detail slightly outperformed the Pelco TX detail, which is most likely attributable to the presence of its backing ring. Additionally, these two details, which both had 0.3125-in. thick walls, performed roughly comparable to the Valmont WTh detail, which had 0.5-in. thick walls. This suggests that wall thickness potentially plays a reduced role in controlling fatigue performance when compared to other variables.
It is possible, however, that Valmont’s WYTh specimens failed prematurely. Based on analytical modeling of this connection detail, its SCF was calculated to be 1.8, which is among the lowest of all Phase I and II details. When the fatigue lives of this detail’s specimens were plotted against hot spot stress, they were the most significant outliers among all the tests (see Figure 5.9), plotting well below the rest of the data.
This fact suggests that these specimens may have had poorer than average welds leading to lower than expected fatigue life. Unfortunately, sections of these specimen’s welds are not available to verify this hypothesis. Thick-walled high-mast specimens need to be tested further to characterize how their performance is related to the thickness of their shaft walls.
The three stool-stiffened details in Phase II, all of which had 2-in. base plates, performed consistently relative to each other and showed a performance roughly comparable to the Valmont SEC detail, but still below that of the two collar-stiffened full penetration details (TXEC and WEC).
The negligible difference in results between the continuous stool connection (STL) and STL30 details suggests that the orientation of pole shaft bend has little bearing on fatigue performance. However, it is important to note that this finding is specific to 16-sided specimens with bend radii as large as those in the details tested (4 in. typical).
The slight improvement in performance shown by the 12-bolted STL specimens over the 8-bolted STL specimens mirrors the Phase I findings concerning anchor rods in socket specimens, though the benefit in these Phase II stools is smaller.
In Phase I, fatigue performance was greatly improved for socket details of both 1.5-in. and 2.0-in. base plates when the number of anchor rods was increased from 8 to 12. This fatigue life improvement was on the order of 100–200%. For the Phase II STL details, however, the average fatigue life improvement is only about 30% when the number of anchor rods is increased. These new Phase II results suggest that increasing the number of anchor rods has a reduced benefit when the base plate connection is already stiffened through other means. This finding was confirmed analytically and will be discussed in Chapter 6, Analytical Results.
5.6.1 Phase I and II Socket Details
Figure 5.11 presents an S-N plot of fatigue data for all socket details from both phases (specimens separated in legend according to phase). Note that, under the Phase I naming scheme, “S” refers to a simple fillet-welded socket detail (Rios, 2007).
The inclusion of Phase I data in Figure 5.11 reiterates the chief findings for Phase I socket details: fatigue performance is strongly tied to both the number of anchor rods and the base plate thickness. Increasing either will clearly improve performance. However, the Phase I simple sockets still performed very poorly, not even reaching a Category E’ level, which is their AASHTO classification.
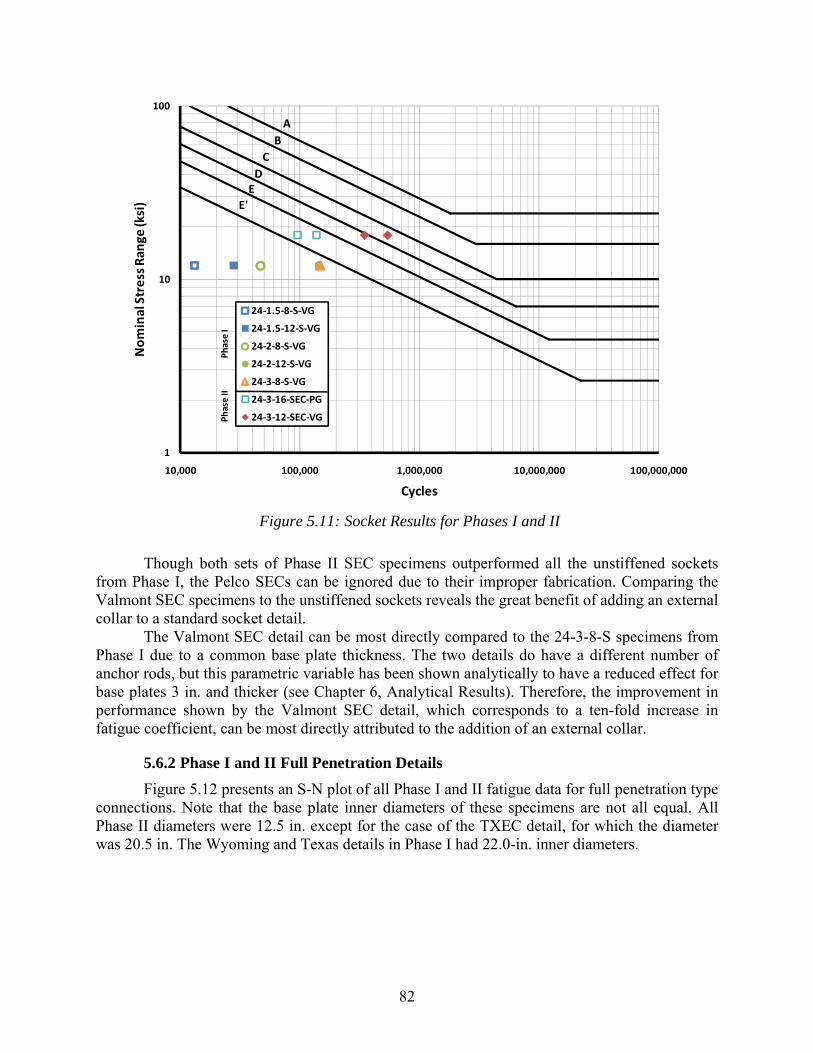
82
Figure 5.11: Socket Results for Phases I and II
Though both sets of Phase II SEC specimens outperformed all the unstiffened sockets from Phase I, the Pelco SECs can be ignored due to their improper fabrication. Comparing the Valmont SEC specimens to the unstiffened sockets reveals the great benefit of adding an external collar to a standard socket detail.
The Valmont SEC detail can be most directly compared to the 24-3-8-S specimens from Phase I due to a common base plate thickness. The two details do have a different number of anchor rods, but this parametric variable has been shown analytically to have a reduced effect for base plates 3 in. and thicker (see Chapter 6, Analytical Results). Therefore, the improvement in performance shown by the Valmont SEC detail, which corresponds to a ten-fold increase in fatigue coefficient, can be most directly attributed to the addition of an external collar.
5.6.2 Phase I and II Full Penetration Details
Figure 5.12 presents an S-N plot of all Phase I and II fatigue data for full penetration type connections. Note that the base plate inner diameters of these specimens are not all equal. All Phase II diameters were 12.5 in. except for the case of the TXEC detail, for which the diameter was 20.5 in. The Wyoming and Texas details in Phase I had 22.0-in. inner diameters.
A
B
C
DE
E'
1
10
100
10,000 100,000 1,000,000 10,000,000 100,000,000
Nominal Stress Ran
ge (ksi)
Cycles
24‐1.5‐8‐S‐VG
24‐1.5‐12‐S‐VG
24‐2‐8‐S‐VG
24‐2‐12‐S‐VG
24‐3‐8‐S‐VG
24‐3‐16‐SEC‐PG
24‐3‐12‐SEC‐VGPhase II
Phase I
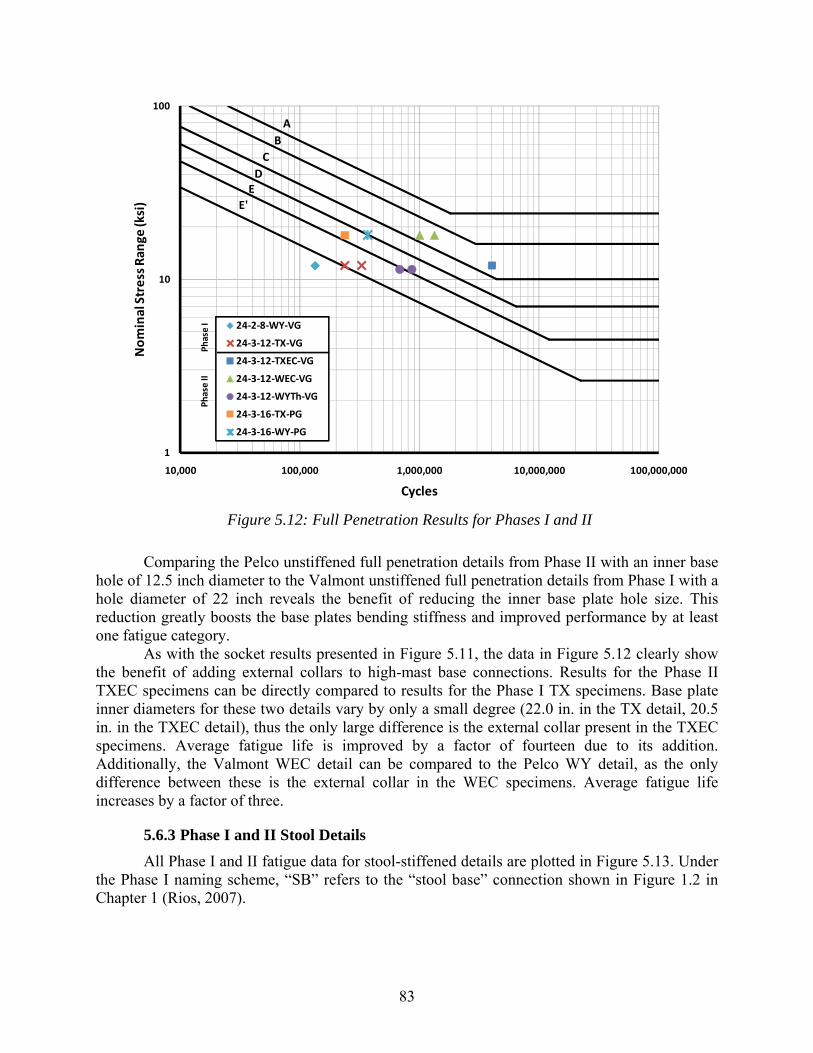
83
Figure 5.12: Full Penetration Results for Phases I and II
Comparing the Pelco unstiffened full penetration details from Phase II with an inner base hole of 12.5 inch diameter to the Valmont unstiffened full penetration details from Phase I with a hole diameter of 22 inch reveals the benefit of reducing the inner base plate hole size. This reduction greatly boosts the base plates bending stiffness and improved performance by at least one fatigue category.
As with the socket results presented in Figure 5.11, the data in Figure 5.12 clearly show the benefit of adding external collars to high-mast base connections. Results for the Phase II TXEC specimens can be directly compared to results for the Phase I TX specimens. Base plate inner diameters for these two details vary by only a small degree (22.0 in. in the TX detail, 20.5 in. in the TXEC detail), thus the only large difference is the external collar present in the TXEC specimens. Average fatigue life is improved by a factor of fourteen due to its addition. Additionally, the Valmont WEC detail can be compared to the Pelco WY detail, as the only difference between these is the external collar in the WEC specimens. Average fatigue life increases by a factor of three.
5.6.3 Phase I and II Stool Details
All Phase I and II fatigue data for stool-stiffened details are plotted in Figure 5.13. Under the Phase I naming scheme, “SB” refers to the “stool base” connection shown in Figure 1.2 in Chapter 1 (Rios, 2007).
A
B
C
DE
E'
1
10
100
10,000 100,000 1,000,000 10,000,000 100,000,000
Nominal Stress Ran
ge (ksi)
Cycles
24‐2‐8‐WY‐VG
24‐3‐12‐TX‐VG
24‐3‐12‐TXEC‐VG
24‐3‐12‐WEC‐VG
24‐3‐12‐WYTh‐VG
24‐3‐16‐TX‐PG
24‐3‐16‐WY‐PG
Phase I
Phase II
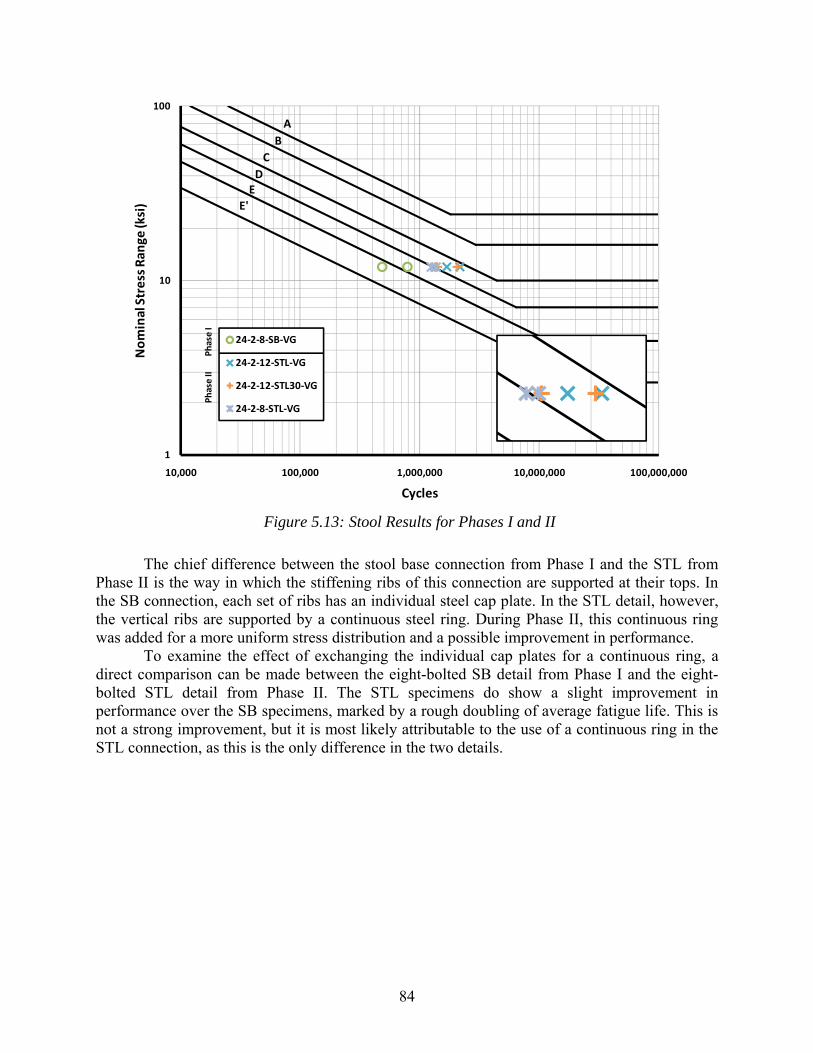
84
Figure 5.13: Stool Results for Phases I and II
The chief difference between the stool base connection from Phase I and the STL from Phase II is the way in which the stiffening ribs of this connection are supported at their tops. In the SB connection, each set of ribs has an individual steel cap plate. In the STL detail, however, the vertical ribs are supported by a continuous steel ring. During Phase II, this continuous ring was added for a more uniform stress distribution and a possible improvement in performance.
To examine the effect of exchanging the individual cap plates for a continuous ring, a direct comparison can be made between the eight-bolted SB detail from Phase I and the eight-bolted STL detail from Phase II. The STL specimens do show a slight improvement in performance over the SB specimens, marked by a rough doubling of average fatigue life. This is not a strong improvement, but it is most likely attributable to the use of a continuous ring in the STL connection, as this is the only difference in the two details.
A
B
C
DE
E'
1
10
100
10,000 100,000 1,000,000 10,000,000 100,000,000
Nominal Stress Ran
ge (ksi)
Cycles
24‐2‐8‐SB‐VG
24‐2‐12‐STL‐VG
24‐2‐12‐STL30‐VG
24‐2‐8‐STL‐VG
Phase II
Phase I
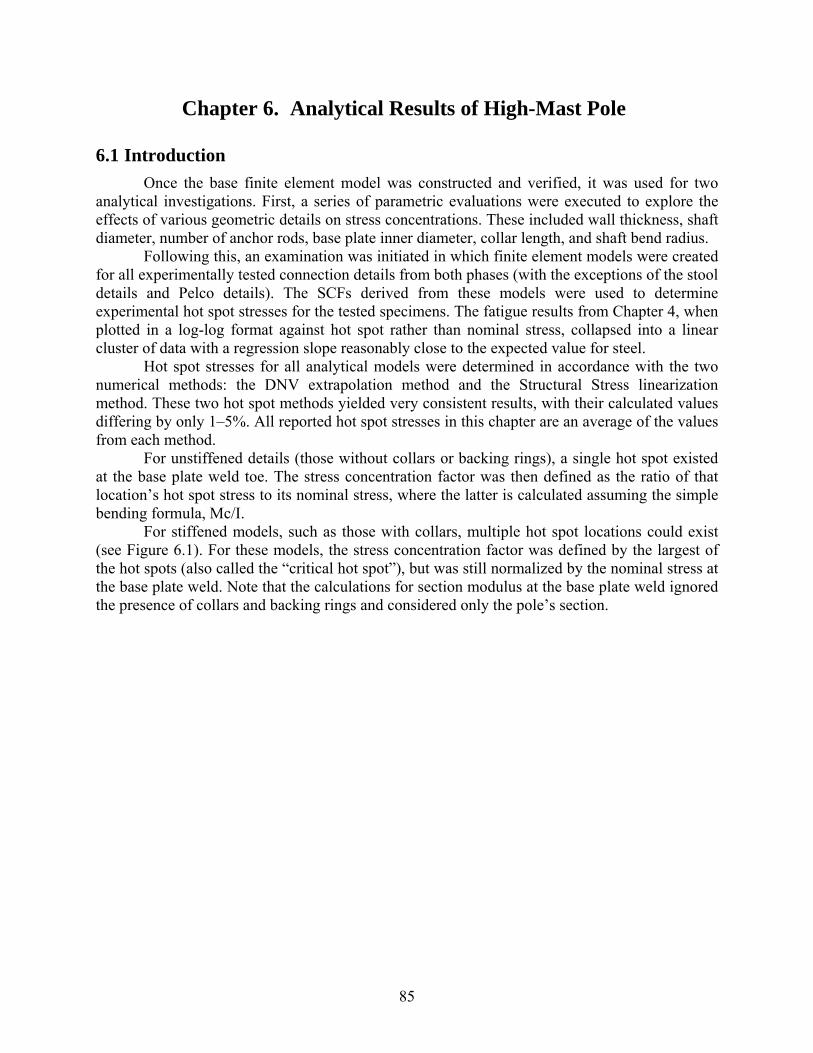
85
Chapter 6. Analytical Results of High-Mast Pole
6.1 Introduction
Once the base finite element model was constructed and verified, it was used for two analytical investigations. First, a series of parametric evaluations were executed to explore the effects of various geometric details on stress concentrations. These included wall thickness, shaft diameter, number of anchor rods, base plate inner diameter, collar length, and shaft bend radius.
Following this, an examination was initiated in which finite element models were created for all experimentally tested connection details from both phases (with the exceptions of the stool details and Pelco details). The SCFs derived from these models were used to determine experimental hot spot stresses for the tested specimens. The fatigue results from Chapter 4, when plotted in a log-log format against hot spot rather than nominal stress, collapsed into a linear cluster of data with a regression slope reasonably close to the expected value for steel.
Hot spot stresses for all analytical models were determined in accordance with the two numerical methods: the DNV extrapolation method and the Structural Stress linearization method. These two hot spot methods yielded very consistent results, with their calculated values differing by only 1–5%. All reported hot spot stresses in this chapter are an average of the values from each method.
For unstiffened details (those without collars or backing rings), a single hot spot existed at the base plate weld toe. The stress concentration factor was then defined as the ratio of that location’s hot spot stress to its nominal stress, where the latter is calculated assuming the simple bending formula, Mc/I.
For stiffened models, such as those with collars, multiple hot spot locations could exist (see Figure 6.1). For these models, the stress concentration factor was defined by the largest of the hot spots (also called the “critical hot spot”), but was still normalized by the nominal stress at the base plate weld. Note that the calculations for section modulus at the base plate weld ignored the presence of collars and backing rings and considered only the pole’s section.
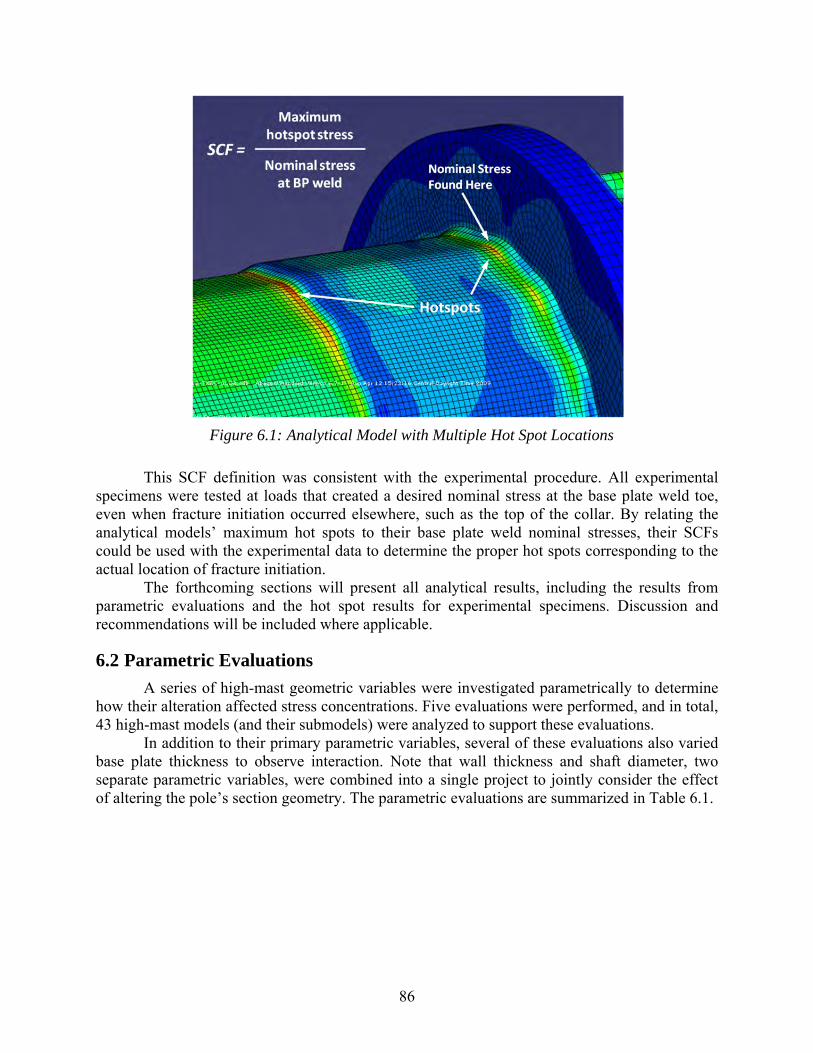
86
Figure 6.1: Analytical Model with Multiple Hot Spot Locations
This SCF definition was consistent with the experimental procedure. All experimental specimens were tested at loads that created a desired nominal stress at the base plate weld toe, even when fracture initiation occurred elsewhere, such as the top of the collar. By relating the analytical models’ maximum hot spots to their base plate weld nominal stresses, their SCFs could be used with the experimental data to determine the proper hot spots corresponding to the actual location of fracture initiation.
The forthcoming sections will present all analytical results, including the results from parametric evaluations and the hot spot results for experimental specimens. Discussion and recommendations will be included where applicable.
6.2 Parametric Evaluations
A series of high-mast geometric variables were investigated parametrically to determine how their alteration affected stress concentrations. Five evaluations were performed, and in total, 43 high-mast models (and their submodels) were analyzed to support these evaluations.
In addition to their primary parametric variables, several of these evaluations also varied base plate thickness to observe interaction. Note that wall thickness and shaft diameter, two separate parametric variables, were combined into a single project to jointly consider the effect of altering the pole’s section geometry. The parametric evaluations are summarized in Table 6.1.
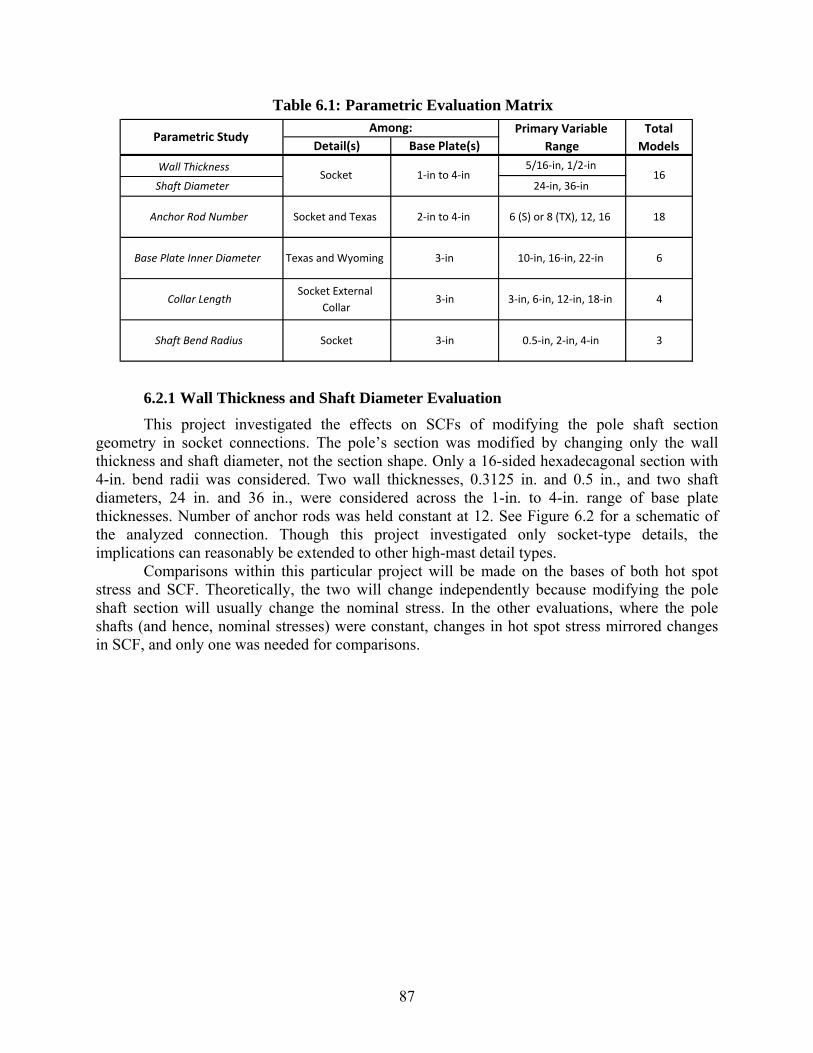
87
Table 6.1: Parametric Evaluation Matrix
6.2.1 Wall Thickness and Shaft Diameter Evaluation
This project investigated the effects on SCFs of modifying the pole shaft section geometry in socket connections. The pole’s section was modified by changing only the wall thickness and shaft diameter, not the section shape. Only a 16-sided hexadecagonal section with 4-in. bend radii was considered. Two wall thicknesses, 0.3125 in. and 0.5 in., and two shaft diameters, 24 in. and 36 in., were considered across the 1-in. to 4-in. range of base plate thicknesses. Number of anchor rods was held constant at 12. See Figure 6.2 for a schematic of the analyzed connection. Though this project investigated only socket-type details, the implications can reasonably be extended to other high-mast detail types.
Comparisons within this particular project will be made on the bases of both hot spot stress and SCF. Theoretically, the two will change independently because modifying the pole shaft section will usually change the nominal stress. In the other evaluations, where the pole shafts (and hence, nominal stresses) were constant, changes in hot spot stress mirrored changes in SCF, and only one was needed for comparisons.
Detail(s) Base Plate(s)
5/16‐in, 1/2‐in
24‐in, 36‐in
Anchor Rod Number Socket and Texas 2‐in to 4‐in 6 (S) or 8 (TX), 12, 16 18
Base Plate Inner Diameter Texas and Wyoming 3‐in 10‐in, 16‐in, 22‐in 6
Collar LengthSocket External
Collar3‐in 3‐in, 6‐in, 12‐in, 18‐in 4
Shaft Bend Radius Socket 3‐in 0.5‐in, 2‐in, 4‐in 3
Total
Models
Wall Thickness Shaft Diameter
Socket 16
Among:Parametric Study
1‐in to 4‐in
Primary Variable
Range
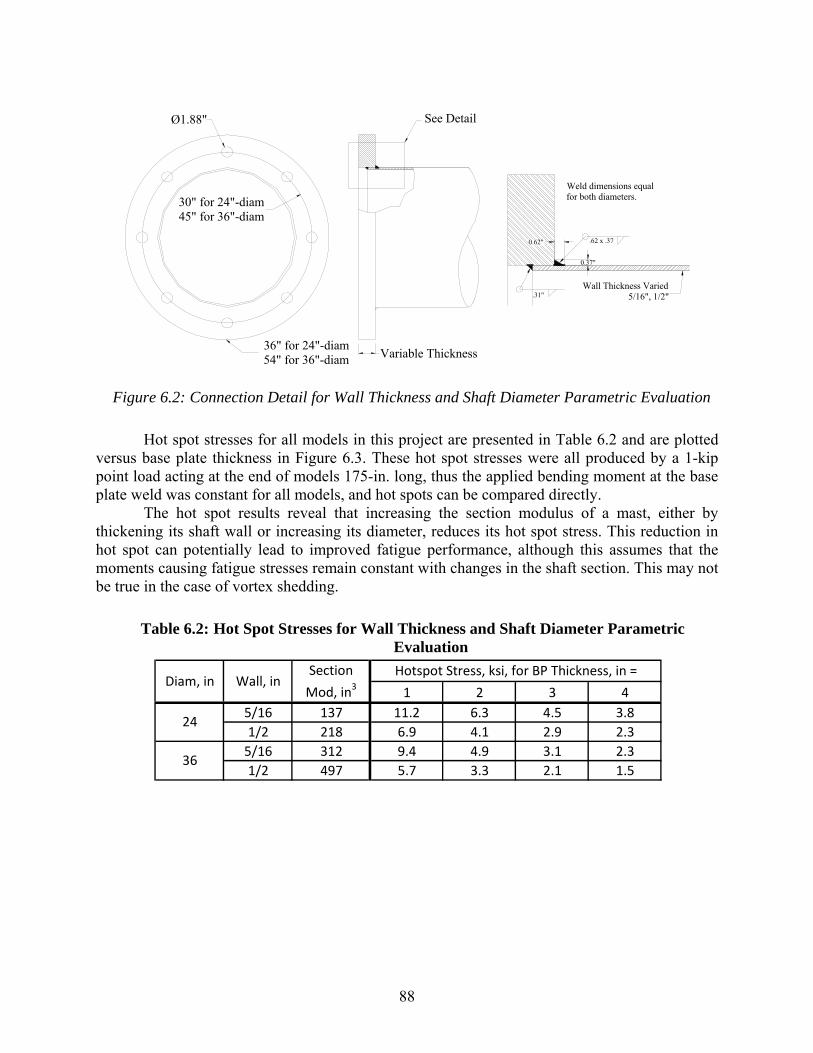
88
Figure 6.2: Connection Detail for Wall Thickness and Shaft Diameter Parametric Evaluation
Hot spot stresses for all models in this project are presented in Table 6.2 and are plotted versus base plate thickness in Figure 6.3. These hot spot stresses were all produced by a 1-kip point load acting at the end of models 175-in. long, thus the applied bending moment at the base plate weld was constant for all models, and hot spots can be compared directly.
The hot spot results reveal that increasing the section modulus of a mast, either by thickening its shaft wall or increasing its diameter, reduces its hot spot stress. This reduction in hot spot can potentially lead to improved fatigue performance, although this assumes that the moments causing fatigue stresses remain constant with changes in the shaft section. This may not be true in the case of vortex shedding.
Table 6.2: Hot Spot Stresses for Wall Thickness and Shaft Diameter Parametric Evaluation
Ø1.88"
Variable Thickness
See Detail
36" for 24"-diam54" for 36"-diam
30" for 24"-diam45" for 36"-diam
0.37"
0.62"
.31"
.62 x .37
Weld dimensions equalfor both diameters.
Wall Thickness Varied5/16", 1/2"
1 2 3 4
5/16 137 11.2 6.3 4.5 3.8
1/2 218 6.9 4.1 2.9 2.3
5/16 312 9.4 4.9 3.1 2.3
1/2 497 5.7 3.3 2.1 1.5
Wall, inDiam, inHotspot Stress, ksi, for BP Thickness, in =Section
Mod, in3
24
36
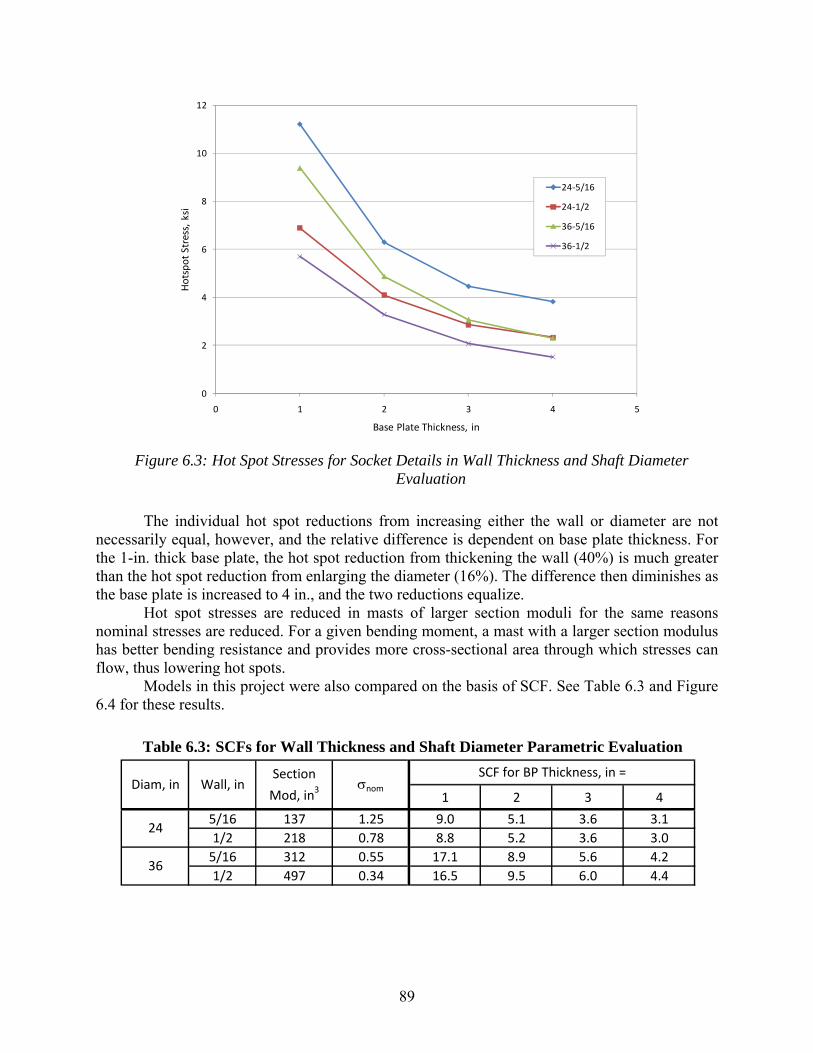
89
Figure 6.3: Hot Spot Stresses for Socket Details in Wall Thickness and Shaft Diameter Evaluation
The individual hot spot reductions from increasing either the wall or diameter are not necessarily equal, however, and the relative difference is dependent on base plate thickness. For the 1-in. thick base plate, the hot spot reduction from thickening the wall (40%) is much greater than the hot spot reduction from enlarging the diameter (16%). The difference then diminishes as the base plate is increased to 4 in., and the two reductions equalize.
Hot spot stresses are reduced in masts of larger section moduli for the same reasons nominal stresses are reduced. For a given bending moment, a mast with a larger section modulus has better bending resistance and provides more cross-sectional area through which stresses can flow, thus lowering hot spots.
Models in this project were also compared on the basis of SCF. See Table 6.3 and Figure 6.4 for these results.
Table 6.3: SCFs for Wall Thickness and Shaft Diameter Parametric Evaluation
0
2
4
6
8
10
12
0 1 2 3 4 5
Hotspot Stress, ksi
Base Plate Thickness, in
24‐5/16
24‐1/2
36‐5/16
36‐1/2
1 2 3 4
5/16 137 1.25 9.0 5.1 3.6 3.1
1/2 218 0.78 8.8 5.2 3.6 3.0
5/16 312 0.55 17.1 8.9 5.6 4.2
1/2 497 0.34 16.5 9.5 6.0 4.436
nomDiam, in Wall, inSection
Mod, in3SCF for BP Thickness, in =
24
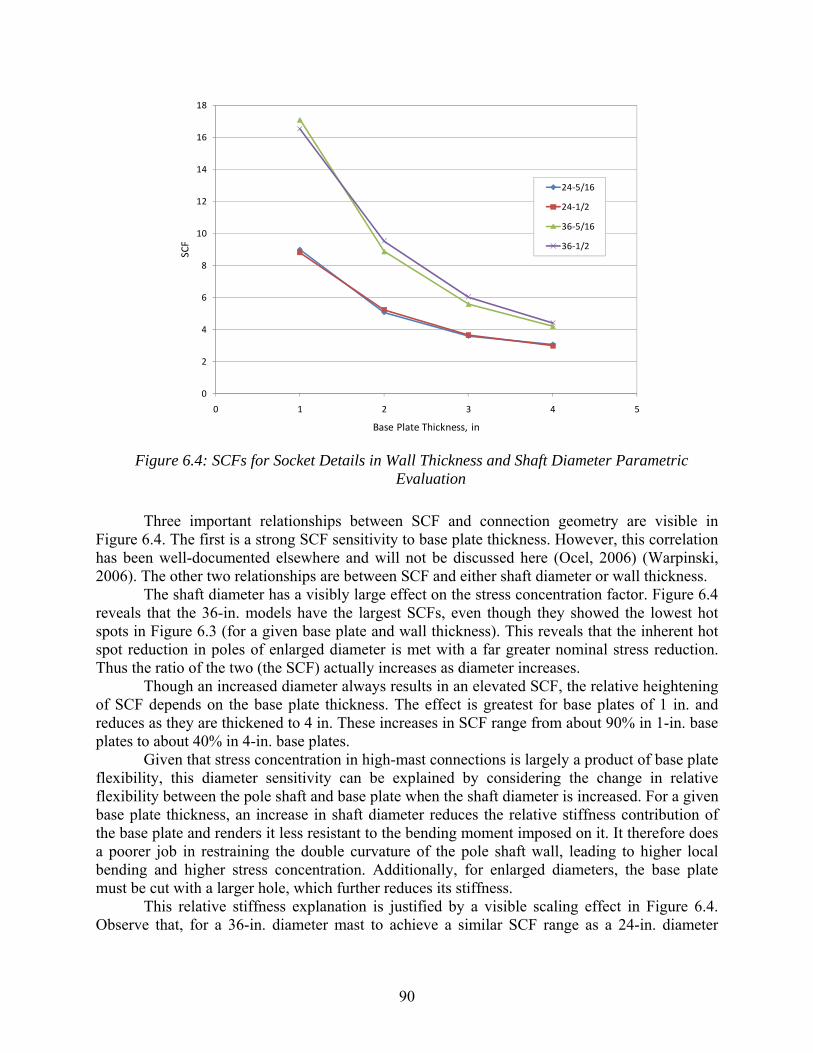
90
Figure 6.4: SCFs for Socket Details in Wall Thickness and Shaft Diameter Parametric Evaluation
Three important relationships between SCF and connection geometry are visible in Figure 6.4. The first is a strong SCF sensitivity to base plate thickness. However, this correlation has been well-documented elsewhere and will not be discussed here (Ocel, 2006) (Warpinski, 2006). The other two relationships are between SCF and either shaft diameter or wall thickness.
The shaft diameter has a visibly large effect on the stress concentration factor. Figure 6.4 reveals that the 36-in. models have the largest SCFs, even though they showed the lowest hot spots in Figure 6.3 (for a given base plate and wall thickness). This reveals that the inherent hot spot reduction in poles of enlarged diameter is met with a far greater nominal stress reduction. Thus the ratio of the two (the SCF) actually increases as diameter increases.
Though an increased diameter always results in an elevated SCF, the relative heightening of SCF depends on the base plate thickness. The effect is greatest for base plates of 1 in. and reduces as they are thickened to 4 in. These increases in SCF range from about 90% in 1-in. base plates to about 40% in 4-in. base plates.
Given that stress concentration in high-mast connections is largely a product of base plate flexibility, this diameter sensitivity can be explained by considering the change in relative flexibility between the pole shaft and base plate when the shaft diameter is increased. For a given base plate thickness, an increase in shaft diameter reduces the relative stiffness contribution of the base plate and renders it less resistant to the bending moment imposed on it. It therefore does a poorer job in restraining the double curvature of the pole shaft wall, leading to higher local bending and higher stress concentration. Additionally, for enlarged diameters, the base plate must be cut with a larger hole, which further reduces its stiffness.
This relative stiffness explanation is justified by a visible scaling effect in Figure 6.4. Observe that, for a 36-in. diameter mast to achieve a similar SCF range as a 24-in. diameter
0
2
4
6
8
10
12
14
16
18
0 1 2 3 4 5
SCF
Base Plate Thickness, in
24‐5/16
24‐1/2
36‐5/16
36‐1/2
91
mast, its base plate needs to be thickened by about 1 in. This reveals that the SCF can be maintained if both the pole shaft and base plate are enlarged simultaneously.
The other important relationship visible in Figure 6.4 is the effect of pole wall thickness on the stress concentration factor. Relative to shaft diameter, pole wall thickness plays a much smaller role in affecting the SCF, with differences due to thickness ranging from only 2–3% in the 24-in. masts and 3–8% in the 36-in. masts.
This insensitivity to wall thickness reveals that the hot spot reduction from thickening the shaft wall (shown in Figure 6.3) is met with a proportional reduction in nominal stress, thus rendering the SCF, which is the ratio of the two, relatively unchanged. For both diameters and all base plates, these two reductions consistently range between 35–40%.
It is intuitive that an increase in pole wall thickness should reduce the nominal stress due to an elevated section modulus. It is also intuitive that increasing the wall thickness should reduce the hot spot stress. Thicker pole walls are stiffer and thus better at resisting the local double curvature responsible for elevating the surface stresses. Evidently, for the tested details, these two reductions are proportional.
6.2.1.1 Verification of Findings and Conclusions
These findings concerning the effects of modifying the pole shaft section are in good agreement with analytical investigations of traffic poles at both UT and the University of Minnesota. However, they diverge slightly from analytical high-mast work carried out by M. Warpinski at Lehigh University. In that report, a slightly greater SCF dependency on wall thickness is observed than what is presented above (Warpinski, 2006).
The effect of increasing the shaft diameter was explored by R. Duraisamy at UT. Using Abaqus to model circular mast arms with socket details, Duraisamy also concluded that increasing the shaft diameter, in her experiment, from 6.5 in. to 11 in., increased the SCF (Duraisamy, 2005).
Like the results presented above, the relative increase in Duraisamy’s SCFs depended on the base plate thickness. For her experiment’s mast arms, increases in SCF due to an enlarged diameter ranged from 36% for 1-in. base plates to 8% for 3-in. base plates (Duraisamy, 2005). These increases are less than what was seen in the current project, but this can be attributed to the size effect of comparing 24-in. and 36-in. high-masts to mast arms less than 12-in. in diameter. Additionally, these mast arms’ base plates were rectangular, and the high-masts’ are circular.
Duraisamy also investigated the wall thickness effect by modeling two 10-in. diameter mast arms, one with a 0.179-in. wall and the other with a 0.239-in. wall. Both were on socket detailed models with 1.5-in. base plates. The difference in stress concentration factor between these two mast arms was only 6%.
This result is in agreement with earlier research performed at UT in which 10-in. mast arms of wall thicknesses equaling Duraisamy’s were modeled with 1.5-in. and 2.0-in. base plates. In that project, differences in stress concentration factor due to alteration of wall thickness were very small, ranging between only 1–3% (Koenigs, et al. 2003).
J. Ocel, in a Ph.D. dissertation at the University of Minnesota, presents results in very close agreement with the current findings. He found a strong SCF dependency on shaft diameter, modeling diameters of 15-in., 20-in., and 25-in., but virtually no relationship between SCF and wall thickness. For his experiment’s range of diameters, Ocel found a consistent rise in SCF of about 20% per 5-in. increase in diameter. Then, when considering wall thicknesses of 0.26-in.,
92
0.46-in., and 0.66-in. for his 20-in. model, SCFs were within 4% of each other, revealing little dependence (Ocel, 2006).
In an analytical investigation of 24-in. multi-sided high-masts at Lehigh University, however, Warpinski found a slightly greater SCF dependency on wall thickness than what was cited by Ocel and what is seen in the current project. Considering wall thicknesses of 0.3125-in. and 0.5-in. for a 1.25-in. base plate, she observed a 16% increase in SCF when the wall was thickened (Warpinski, 2006).
These independent findings, when considered alongside the current observations, suggest that the wall thickness relationship to SCF can possibly be sensitive to individual modeling assumptions and other unknown factors. What is consistent, however, is that the SCF dependency on wall thickness is less than those of other parametric variables such as shaft diameter and base plate thickness. Additionally, a thickened wall shaft is consistently found to reduce hot spot stresses, a finding that is confirmed by Warpinski (Warpinski, 2006).
Two major recommendations can be formed following this parametric examination. The first concerns the scaling effect of high-mast poles with enlarged diameters. When a high-mast diameter is increased, perhaps for reasons of strength design, its base plate needs also to be thickened to maintain the relative stiffness between the two and prevent excess stress concentration. The amount by which the base plate needs to be thickened is open to a designer’s judgment.
The second conclusion to draw from this research relates to the issue of wall thickness. Though this variable’s physical influence on stress concentration is debatable in light of the research, thickening the pole shaft wall appears to always reduce hot spot stresses, which can lead to improved fatigue performance. A designer can elect to increase only the wall thickness of the bottommost section in a spliced high-mast assembly and thus improve the performance of the entire mast without incurring too great an increase in cost.
6.2.2 Anchor Rod Evaluation
The second parametric evaluation investigated the effect of varying the number of anchor rods to observe the relationship with stress concentration factor. Hypothetically, increasing the number of anchor rods should act to stiffen the connection in the same way thickening the base plate does. Experience has shown that a stiffened connection results in less bending of the base plate and reduced hot spot stresses.
In Phase I of experimental testing, fatigue performance was greatly improved for socket detail specimens of 1.5-in. and 2.0-in. base plates when the number of anchor rods was increased from 8 to 12. In Chapter 4, this improvement was noted on the order of 100–200%. In Phase II, however, the fatigue life improvement for stool details in which the number of anchor rods was increased from 8 to 12 was only about 30%.
This reveals that for details that are already quite stiff, such as the stool-stiffened details, there is an upper limit on the additional stiffness to be gained by adding more rods. For the more flexible sockets in Phase I, boosting the number of anchor rods represented a larger stiffness contribution relative to the overall stiffness of the connection, and hence fatigue life was greatly improved.
Two detail types, Socket and Texas (full penetration), were considered for this parametric examination. The latter had a reduced base plate inner diameter of 16-in., and was thus inherently stiffer. Additionally, several base plate thicknesses—2 in., 3 in., and 4 in.—were
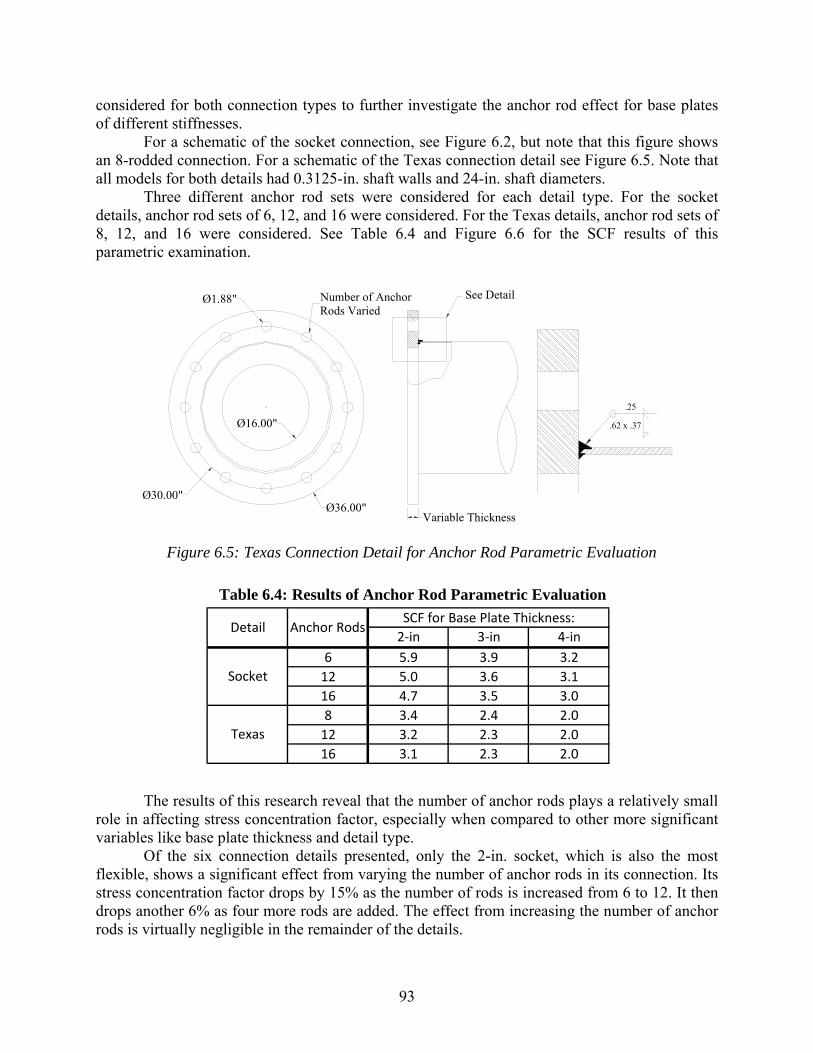
93
considered for both connection types to further investigate the anchor rod effect for base plates of different stiffnesses.
For a schematic of the socket connection, see Figure 6.2, but note that this figure shows an 8-rodded connection. For a schematic of the Texas connection detail see Figure 6.5. Note that all models for both details had 0.3125-in. shaft walls and 24-in. shaft diameters.
Three different anchor rod sets were considered for each detail type. For the socket details, anchor rod sets of 6, 12, and 16 were considered. For the Texas details, anchor rod sets of 8, 12, and 16 were considered. See Table 6.4 and Figure 6.6 for the SCF results of this parametric examination.
Figure 6.5: Texas Connection Detail for Anchor Rod Parametric Evaluation
Table 6.4: Results of Anchor Rod Parametric Evaluation
The results of this research reveal that the number of anchor rods plays a relatively small role in affecting stress concentration factor, especially when compared to other more significant variables like base plate thickness and detail type.
Of the six connection details presented, only the 2-in. socket, which is also the most flexible, shows a significant effect from varying the number of anchor rods in its connection. Its stress concentration factor drops by 15% as the number of rods is increased from 6 to 12. It then drops another 6% as four more rods are added. The effect from increasing the number of anchor rods is virtually negligible in the remainder of the details.
Ø1.88"
Ø30.00"Ø36.00"
Variable Thickness
See Detail
Ø16.00"
Number of AnchorRods Varied
.62 x .37
.25
2‐in 3‐in 4‐in
6 5.9 3.9 3.2
12 5.0 3.6 3.1
16 4.7 3.5 3.0
8 3.4 2.4 2.0
12 3.2 2.3 2.0
16 3.1 2.3 2.0
SCF for Base Plate Thickness:Anchor RodsDetail
Socket
Texas
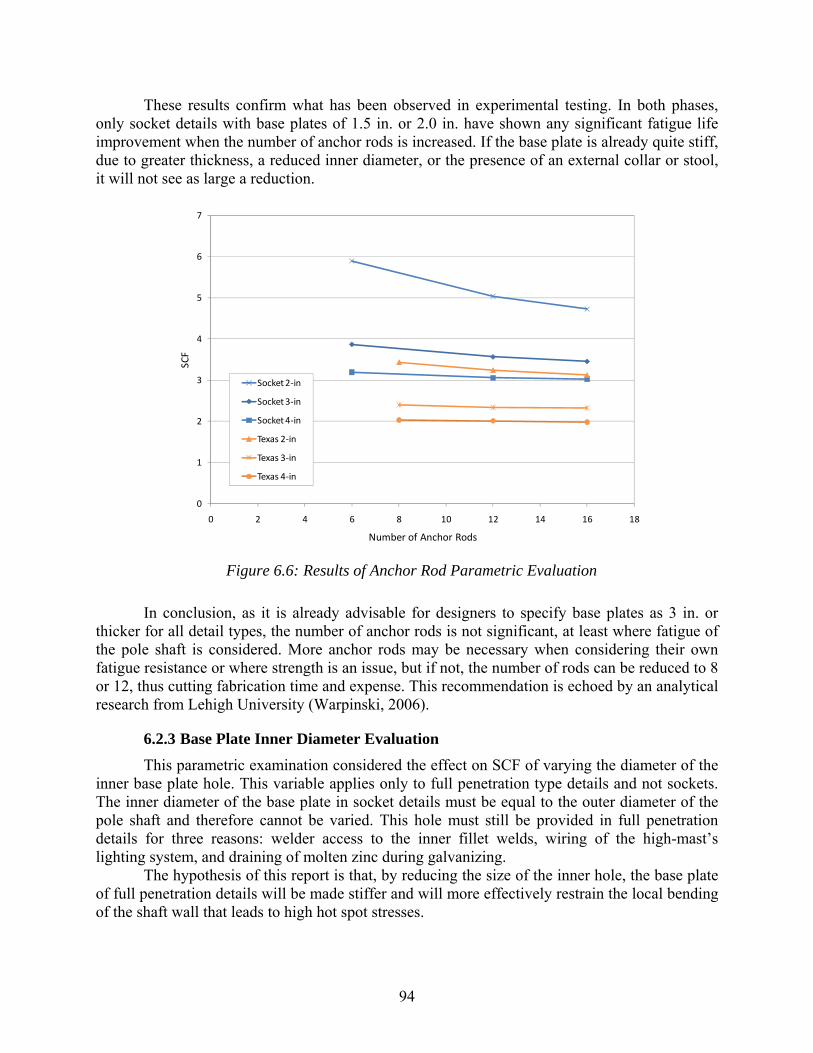
94
These results confirm what has been observed in experimental testing. In both phases, only socket details with base plates of 1.5 in. or 2.0 in. have shown any significant fatigue life improvement when the number of anchor rods is increased. If the base plate is already quite stiff, due to greater thickness, a reduced inner diameter, or the presence of an external collar or stool, it will not see as large a reduction.
Figure 6.6: Results of Anchor Rod Parametric Evaluation
In conclusion, as it is already advisable for designers to specify base plates as 3 in. or thicker for all detail types, the number of anchor rods is not significant, at least where fatigue of the pole shaft is considered. More anchor rods may be necessary when considering their own fatigue resistance or where strength is an issue, but if not, the number of rods can be reduced to 8 or 12, thus cutting fabrication time and expense. This recommendation is echoed by an analytical research from Lehigh University (Warpinski, 2006).
6.2.3 Base Plate Inner Diameter Evaluation
This parametric examination considered the effect on SCF of varying the diameter of the inner base plate hole. This variable applies only to full penetration type details and not sockets. The inner diameter of the base plate in socket details must be equal to the outer diameter of the pole shaft and therefore cannot be varied. This hole must still be provided in full penetration details for three reasons: welder access to the inner fillet welds, wiring of the high-mast’s lighting system, and draining of molten zinc during galvanizing.
The hypothesis of this report is that, by reducing the size of the inner hole, the base plate of full penetration details will be made stiffer and will more effectively restrain the local bending of the shaft wall that leads to high hot spot stresses.
0
1
2
3
4
5
6
7
0 2 4 6 8 10 12 14 16 18
SCF
Number of Anchor Rods
Socket 2‐in
Socket 3‐in
Socket 4‐in
Texas 2‐in
Texas 3‐in
Texas 4‐in
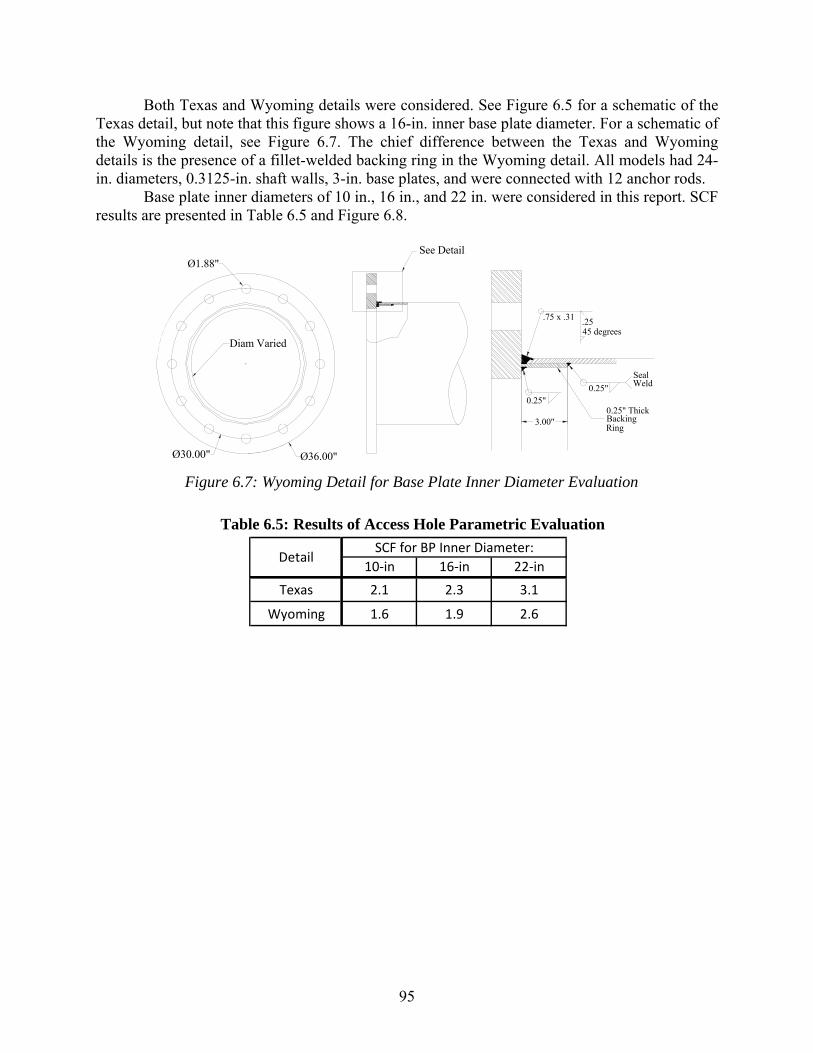
95
Both Texas and Wyoming details were considered. See Figure 6.5 for a schematic of the Texas detail, but note that this figure shows a 16-in. inner base plate diameter. For a schematic of the Wyoming detail, see Figure 6.7. The chief difference between the Texas and Wyoming details is the presence of a fillet-welded backing ring in the Wyoming detail. All models had 24-in. diameters, 0.3125-in. shaft walls, 3-in. base plates, and were connected with 12 anchor rods.
Base plate inner diameters of 10 in., 16 in., and 22 in. were considered in this report. SCF results are presented in Table 6.5 and Figure 6.8.
Figure 6.7: Wyoming Detail for Base Plate Inner Diameter Evaluation
Table 6.5: Results of Access Hole Parametric Evaluation
Ø1.88"
Ø30.00" Ø36.00"
See Detail
Diam Varied
0.25"
.2545 degrees
.75 x .31
Seal Weld
0.25" ThickBackingRing
0.25"
3.00"
10‐in 16‐in 22‐in
Texas 2.1 2.3 3.1
Wyoming 1.6 1.9 2.6
SCF for BP Inner Diameter:Detail
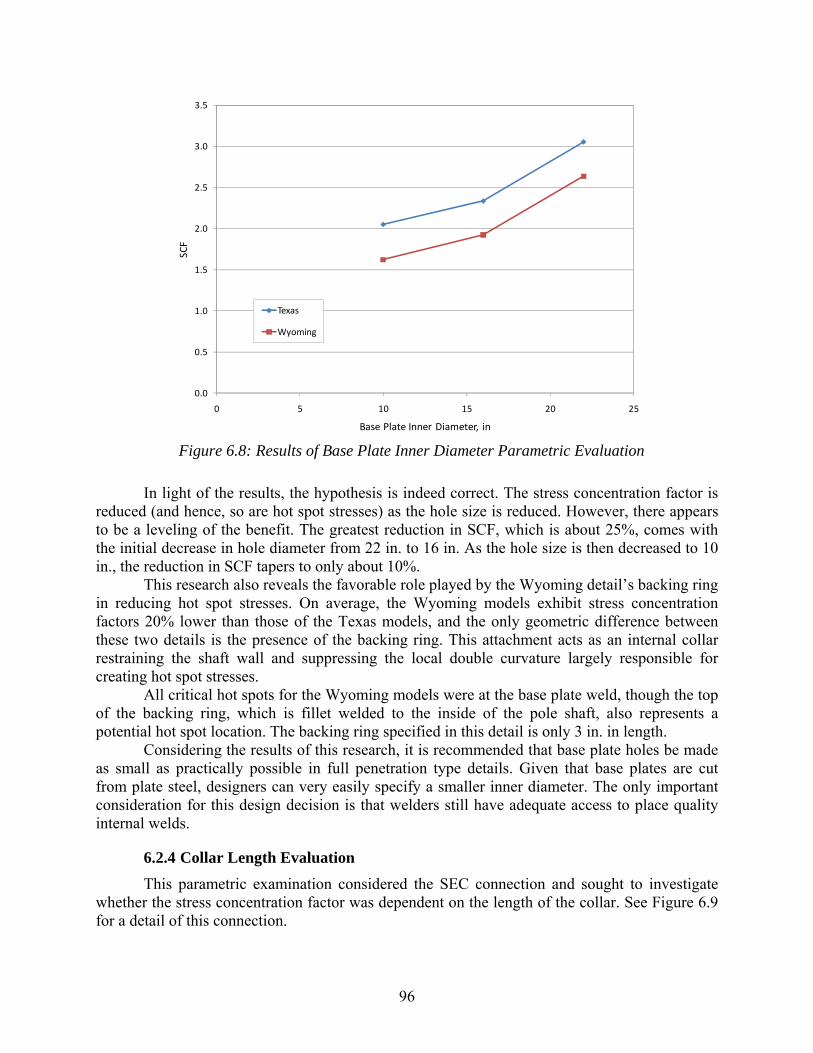
96
Figure 6.8: Results of Base Plate Inner Diameter Parametric Evaluation
In light of the results, the hypothesis is indeed correct. The stress concentration factor is reduced (and hence, so are hot spot stresses) as the hole size is reduced. However, there appears to be a leveling of the benefit. The greatest reduction in SCF, which is about 25%, comes with the initial decrease in hole diameter from 22 in. to 16 in. As the hole size is then decreased to 10 in., the reduction in SCF tapers to only about 10%.
This research also reveals the favorable role played by the Wyoming detail’s backing ring in reducing hot spot stresses. On average, the Wyoming models exhibit stress concentration factors 20% lower than those of the Texas models, and the only geometric difference between these two details is the presence of the backing ring. This attachment acts as an internal collar restraining the shaft wall and suppressing the local double curvature largely responsible for creating hot spot stresses.
All critical hot spots for the Wyoming models were at the base plate weld, though the top of the backing ring, which is fillet welded to the inside of the pole shaft, also represents a potential hot spot location. The backing ring specified in this detail is only 3 in. in length.
Considering the results of this research, it is recommended that base plate holes be made as small as practically possible in full penetration type details. Given that base plates are cut from plate steel, designers can very easily specify a smaller inner diameter. The only important consideration for this design decision is that welders still have adequate access to place quality internal welds.
6.2.4 Collar Length Evaluation
This parametric examination considered the SEC connection and sought to investigate whether the stress concentration factor was dependent on the length of the collar. See Figure 6.9 for a detail of this connection.
0.0
0.5
1.0
1.5
2.0
2.5
3.0
3.5
0 5 10 15 20 25
SCF
Base Plate Inner Diameter, in
Texas
Wyoming
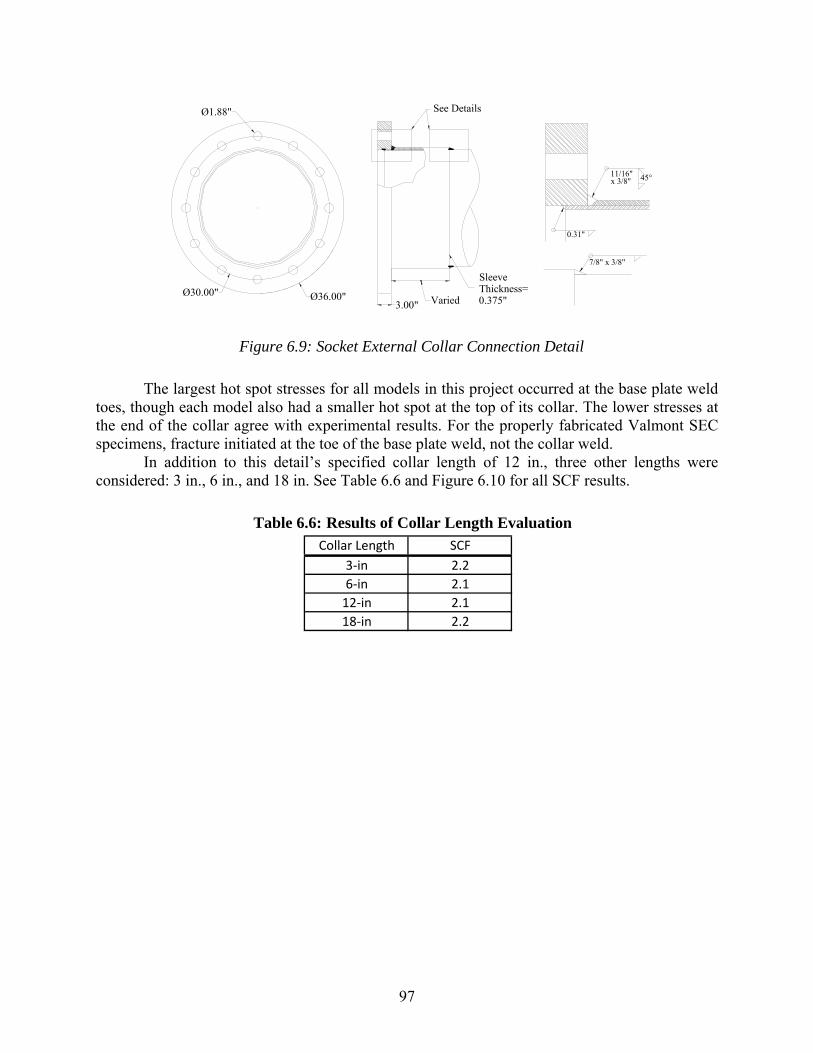
97
Figure 6.9: Socket External Collar Connection Detail
The largest hot spot stresses for all models in this project occurred at the base plate weld toes, though each model also had a smaller hot spot at the top of its collar. The lower stresses at the end of the collar agree with experimental results. For the properly fabricated Valmont SEC specimens, fracture initiated at the toe of the base plate weld, not the collar weld.
In addition to this detail’s specified collar length of 12 in., three other lengths were considered: 3 in., 6 in., and 18 in. See Table 6.6 and Figure 6.10 for all SCF results.
Table 6.6: Results of Collar Length Evaluation
Varied
Ø1.88"
Ø30.00" Ø36.00"3.00"
See Details
SleeveThickness=0.375"
x 3/8"11/16"
0.31"
45°
7/8" x 3/8"
Collar Length SCF
3‐in 2.2
6‐in 2.1
12‐in 2.1
18‐in 2.2
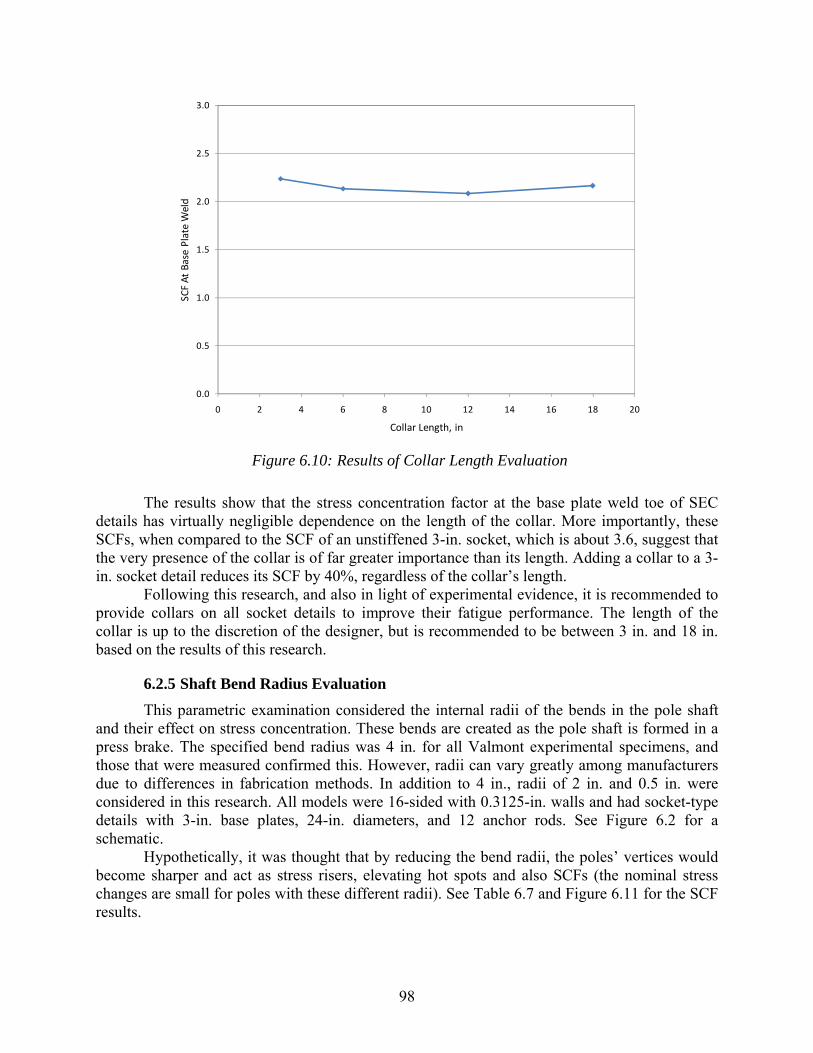
98
Figure 6.10: Results of Collar Length Evaluation
The results show that the stress concentration factor at the base plate weld toe of SEC details has virtually negligible dependence on the length of the collar. More importantly, these SCFs, when compared to the SCF of an unstiffened 3-in. socket, which is about 3.6, suggest that the very presence of the collar is of far greater importance than its length. Adding a collar to a 3-in. socket detail reduces its SCF by 40%, regardless of the collar’s length.
Following this research, and also in light of experimental evidence, it is recommended to provide collars on all socket details to improve their fatigue performance. The length of the collar is up to the discretion of the designer, but is recommended to be between 3 in. and 18 in. based on the results of this research.
6.2.5 Shaft Bend Radius Evaluation
This parametric examination considered the internal radii of the bends in the pole shaft and their effect on stress concentration. These bends are created as the pole shaft is formed in a press brake. The specified bend radius was 4 in. for all Valmont experimental specimens, and those that were measured confirmed this. However, radii can vary greatly among manufacturers due to differences in fabrication methods. In addition to 4 in., radii of 2 in. and 0.5 in. were considered in this research. All models were 16-sided with 0.3125-in. walls and had socket-type details with 3-in. base plates, 24-in. diameters, and 12 anchor rods. See Figure 6.2 for a schematic.
Hypothetically, it was thought that by reducing the bend radii, the poles’ vertices would become sharper and act as stress risers, elevating hot spots and also SCFs (the nominal stress changes are small for poles with these different radii). See Table 6.7 and Figure 6.11 for the SCF results.
0.0
0.5
1.0
1.5
2.0
2.5
3.0
0 2 4 6 8 10 12 14 16 18 20
SCF At Base Plate W
eld
Collar Length, in
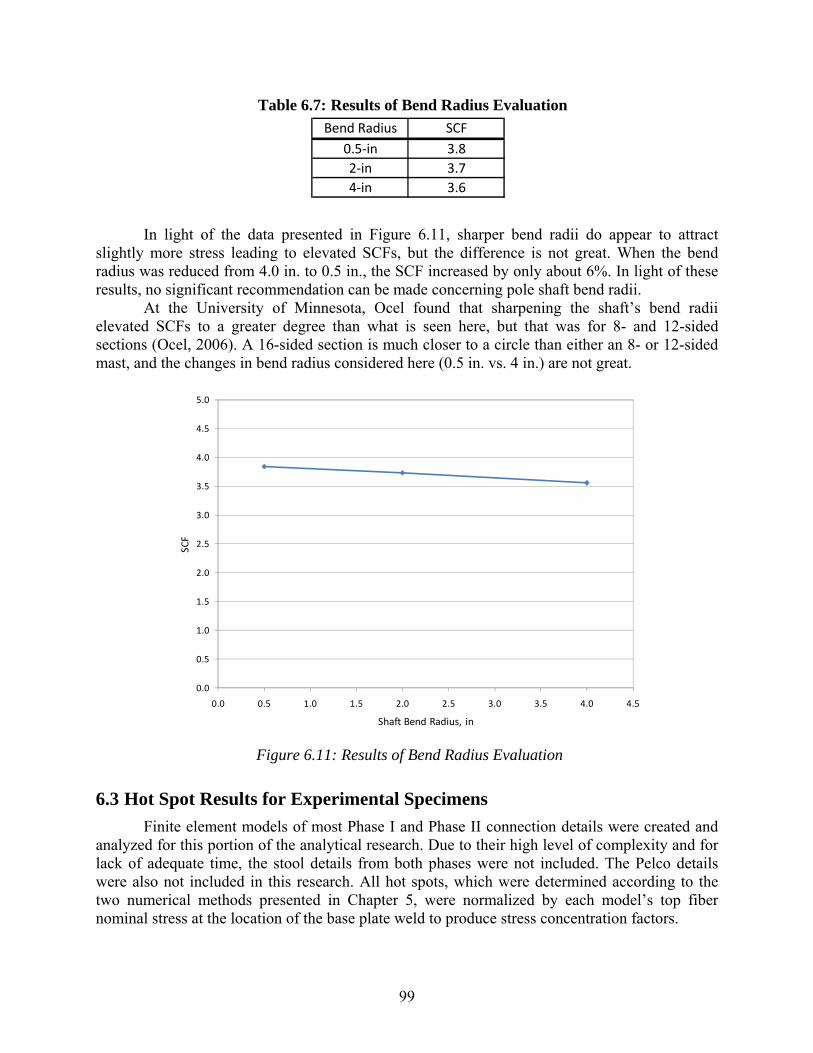
99
Table 6.7: Results of Bend Radius Evaluation
In light of the data presented in Figure 6.11, sharper bend radii do appear to attract slightly more stress leading to elevated SCFs, but the difference is not great. When the bend radius was reduced from 4.0 in. to 0.5 in., the SCF increased by only about 6%. In light of these results, no significant recommendation can be made concerning pole shaft bend radii.
At the University of Minnesota, Ocel found that sharpening the shaft’s bend radii elevated SCFs to a greater degree than what is seen here, but that was for 8- and 12-sided sections (Ocel, 2006). A 16-sided section is much closer to a circle than either an 8- or 12-sided mast, and the changes in bend radius considered here (0.5 in. vs. 4 in.) are not great.
Figure 6.11: Results of Bend Radius Evaluation
6.3 Hot Spot Results for Experimental Specimens
Finite element models of most Phase I and Phase II connection details were created and analyzed for this portion of the analytical research. Due to their high level of complexity and for lack of adequate time, the stool details from both phases were not included. The Pelco details were also not included in this research. All hot spots, which were determined according to the two numerical methods presented in Chapter 5, were normalized by each model’s top fiber nominal stress at the location of the base plate weld to produce stress concentration factors.
Bend Radius SCF
0.5‐in 3.8
2‐in 3.7
4‐in 3.6
0.0
0.5
1.0
1.5
2.0
2.5
3.0
3.5
4.0
4.5
5.0
0.0 0.5 1.0 1.5 2.0 2.5 3.0 3.5 4.0 4.5
SCF
Shaft Bend Radius, in
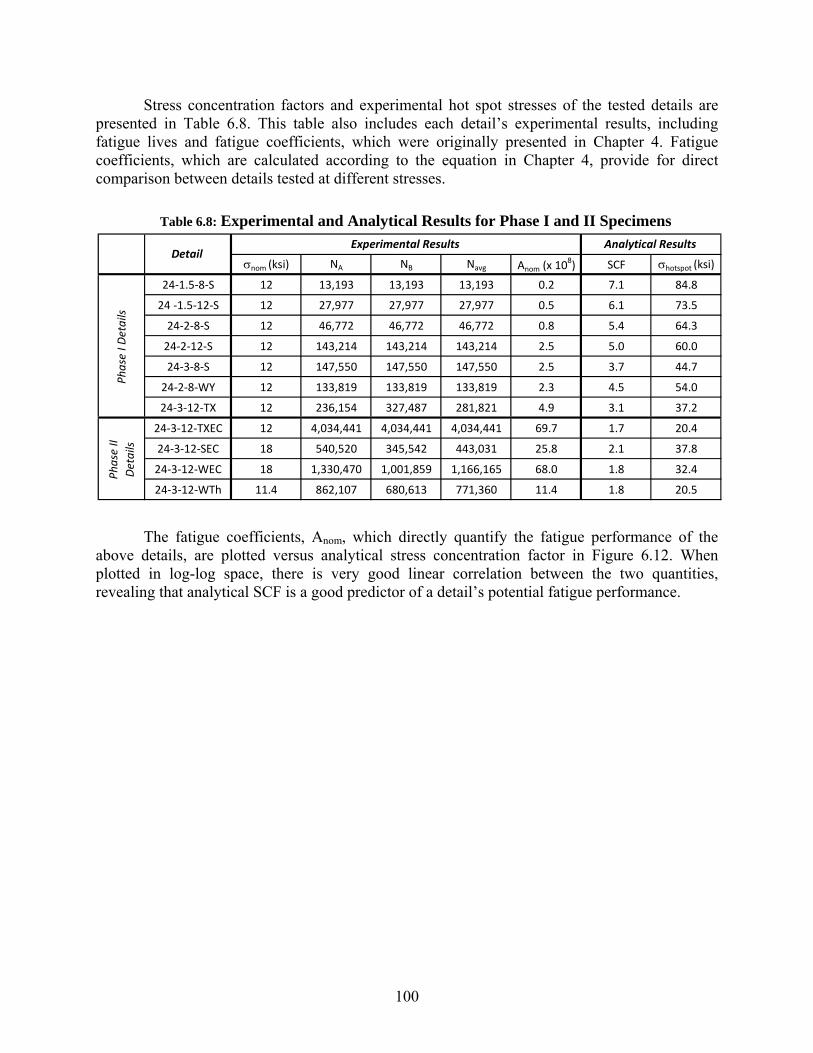
100
Stress concentration factors and experimental hot spot stresses of the tested details are presented in Table 6.8. This table also includes each detail’s experimental results, including fatigue lives and fatigue coefficients, which were originally presented in Chapter 4. Fatigue coefficients, which are calculated according to the equation in Chapter 4, provide for direct comparison between details tested at different stresses.
Table 6.8: Experimental and Analytical Results for Phase I and II Specimens
The fatigue coefficients, Anom, which directly quantify the fatigue performance of the above details, are plotted versus analytical stress concentration factor in Figure 6.12. When plotted in log-log space, there is very good linear correlation between the two quantities, revealing that analytical SCF is a good predictor of a detail’s potential fatigue performance.
nom (ksi) NA NB Navg Anom (x 108) SCF hotspot (ksi)
24‐1.5‐8‐S 12 13,193 13,193 13,193 0.2 7.1 84.8
24 ‐1.5‐12‐S 12 27,977 27,977 27,977 0.5 6.1 73.5
24‐2‐8‐S 12 46,772 46,772 46,772 0.8 5.4 64.3
24‐2‐12‐S 12 143,214 143,214 143,214 2.5 5.0 60.0
24‐3‐8‐S 12 147,550 147,550 147,550 2.5 3.7 44.7
24‐2‐8‐WY 12 133,819 133,819 133,819 2.3 4.5 54.0
24‐3‐12‐TX 12 236,154 327,487 281,821 4.9 3.1 37.2
24‐3‐12‐TXEC 12 4,034,441 4,034,441 4,034,441 69.7 1.7 20.4
24‐3‐12‐SEC 18 540,520 345,542 443,031 25.8 2.1 37.8
24‐3‐12‐WEC 18 1,330,470 1,001,859 1,166,165 68.0 1.8 32.4
24‐3‐12‐WTh 11.4 862,107 680,613 771,360 11.4 1.8 20.5
Analytical ResultsExperimental ResultsDetail
Phase I Details
Phase II
Details
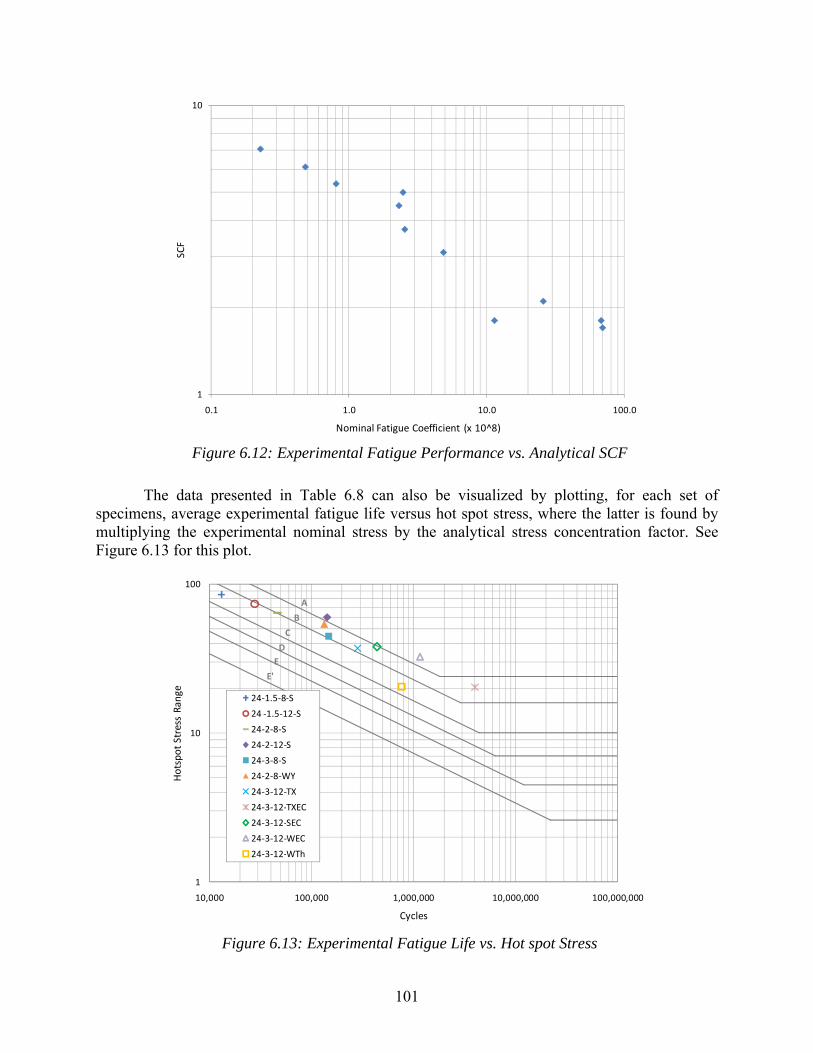
101
Figure 6.12: Experimental Fatigue Performance vs. Analytical SCF
The data presented in Table 6.8 can also be visualized by plotting, for each set of specimens, average experimental fatigue life versus hot spot stress, where the latter is found by multiplying the experimental nominal stress by the analytical stress concentration factor. See Figure 6.13 for this plot.
Figure 6.13: Experimental Fatigue Life vs. Hot spot Stress
1
10
0.1 1.0 10.0 100.0
SCF
Nominal Fatigue Coefficient (x 10^8)
A
B
C
D
E
E'
1
10
100
10,000 100,000 1,000,000 10,000,000 100,000,000
Hotspot Stress Range
Cycles
24‐1.5‐8‐S
24 ‐1.5‐12‐S
24‐2‐8‐S
24‐2‐12‐S
24‐3‐8‐S
24‐2‐8‐WY
24‐3‐12‐TX
24‐3‐12‐TXEC
24‐3‐12‐SEC
24‐3‐12‐WEC
24‐3‐12‐WTh
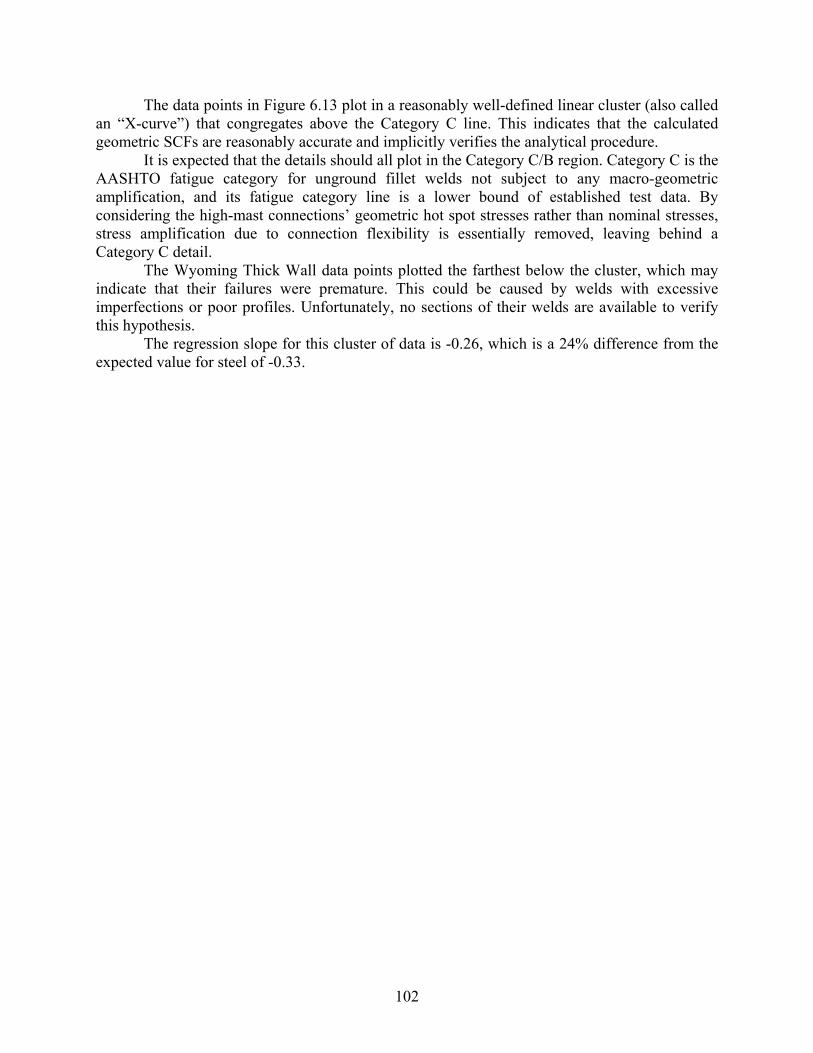
102
The data points in Figure 6.13 plot in a reasonably well-defined linear cluster (also called an “X-curve”) that congregates above the Category C line. This indicates that the calculated geometric SCFs are reasonably accurate and implicitly verifies the analytical procedure.
It is expected that the details should all plot in the Category C/B region. Category C is the AASHTO fatigue category for unground fillet welds not subject to any macro-geometric amplification, and its fatigue category line is a lower bound of established test data. By considering the high-mast connections’ geometric hot spot stresses rather than nominal stresses, stress amplification due to connection flexibility is essentially removed, leaving behind a Category C detail.
The Wyoming Thick Wall data points plotted the farthest below the cluster, which may indicate that their failures were premature. This could be caused by welds with excessive imperfections or poor profiles. Unfortunately, no sections of their welds are available to verify this hypothesis.
The regression slope for this cluster of data is -0.26, which is a 24% difference from the expected value for steel of -0.33.
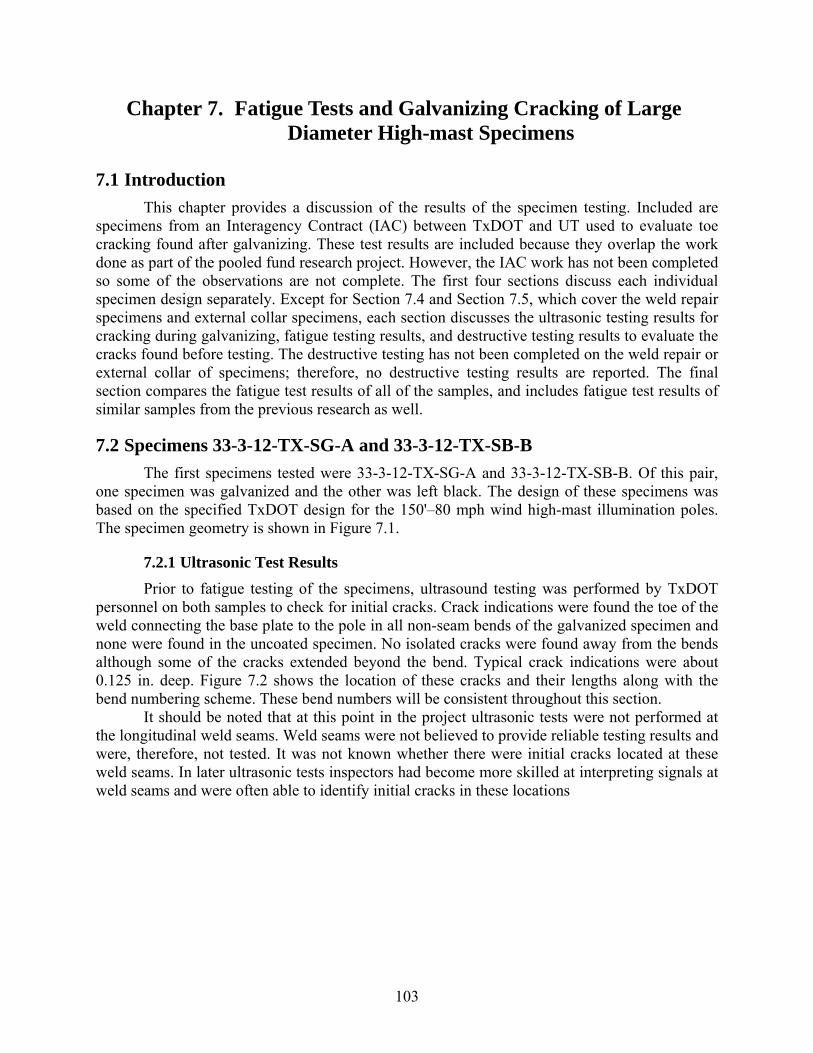
103
Chapter 7. Fatigue Tests and Galvanizing Cracking of Large Diameter High-mast Specimens
7.1 Introduction
This chapter provides a discussion of the results of the specimen testing. Included are specimens from an Interagency Contract (IAC) between TxDOT and UT used to evaluate toe cracking found after galvanizing. These test results are included because they overlap the work done as part of the pooled fund research project. However, the IAC work has not been completed so some of the observations are not complete. The first four sections discuss each individual specimen design separately. Except for Section 7.4 and Section 7.5, which cover the weld repair specimens and external collar specimens, each section discusses the ultrasonic testing results for cracking during galvanizing, fatigue testing results, and destructive testing results to evaluate the cracks found before testing. The destructive testing has not been completed on the weld repair or external collar of specimens; therefore, no destructive testing results are reported. The final section compares the fatigue test results of all of the samples, and includes fatigue test results of similar samples from the previous research as well.
7.2 Specimens 33-3-12-TX-SG-A and 33-3-12-TX-SB-B
The first specimens tested were 33-3-12-TX-SG-A and 33-3-12-TX-SB-B. Of this pair, one specimen was galvanized and the other was left black. The design of these specimens was based on the specified TxDOT design for the 150'–80 mph wind high-mast illumination poles. The specimen geometry is shown in Figure 7.1.
7.2.1 Ultrasonic Test Results
Prior to fatigue testing of the specimens, ultrasound testing was performed by TxDOT personnel on both samples to check for initial cracks. Crack indications were found the toe of the weld connecting the base plate to the pole in all non-seam bends of the galvanized specimen and none were found in the uncoated specimen. No isolated cracks were found away from the bends although some of the cracks extended beyond the bend. Typical crack indications were about 0.125 in. deep. Figure 7.2 shows the location of these cracks and their lengths along with the bend numbering scheme. These bend numbers will be consistent throughout this section.
It should be noted that at this point in the project ultrasonic tests were not performed at the longitudinal weld seams. Weld seams were not believed to provide reliable testing results and were, therefore, not tested. It was not known whether there were initial cracks located at these weld seams. In later ultrasonic tests inspectors had become more skilled at interpreting signals at weld seams and were often able to identify initial cracks in these locations
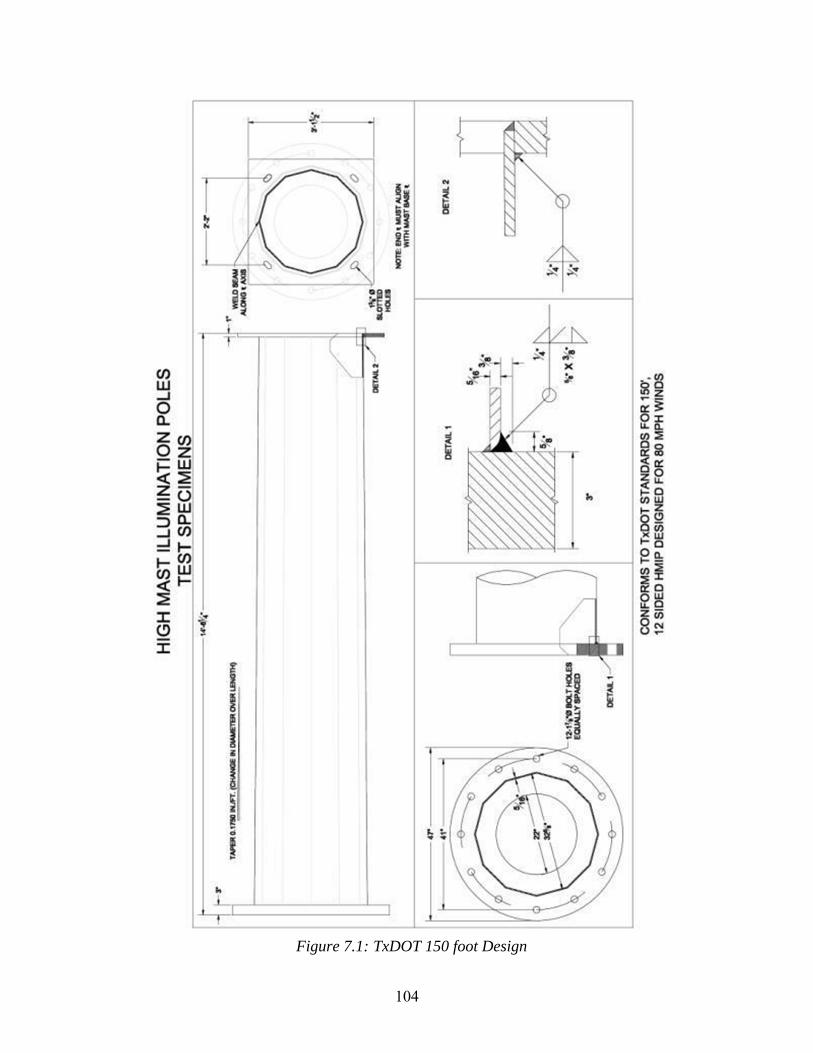
104
Figure 7.1: TxDOT 150 foot Design
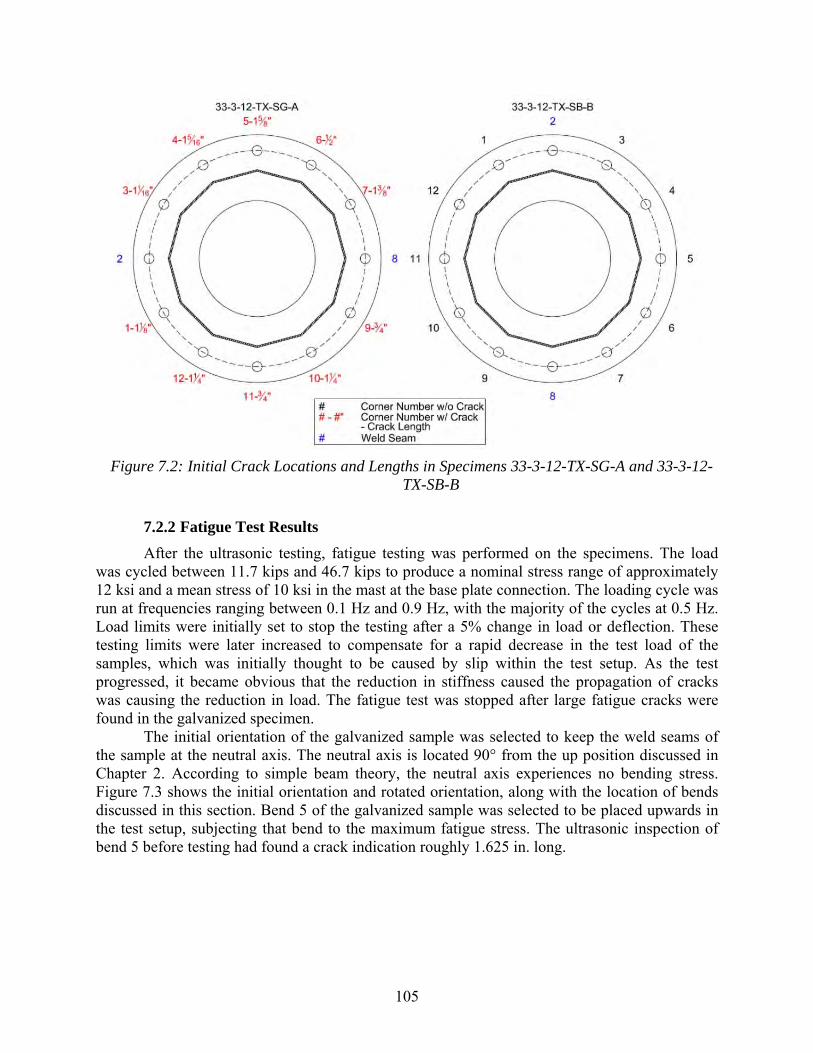
105
Figure 7.2: Initial Crack Locations and Lengths in Specimens 33-3-12-TX-SG-A and 33-3-12-TX-SB-B
7.2.2 Fatigue Test Results
After the ultrasonic testing, fatigue testing was performed on the specimens. The load was cycled between 11.7 kips and 46.7 kips to produce a nominal stress range of approximately 12 ksi and a mean stress of 10 ksi in the mast at the base plate connection. The loading cycle was run at frequencies ranging between 0.1 Hz and 0.9 Hz, with the majority of the cycles at 0.5 Hz. Load limits were initially set to stop the testing after a 5% change in load or deflection. These testing limits were later increased to compensate for a rapid decrease in the test load of the samples, which was initially thought to be caused by slip within the test setup. As the test progressed, it became obvious that the reduction in stiffness caused the propagation of cracks was causing the reduction in load. The fatigue test was stopped after large fatigue cracks were found in the galvanized specimen.
The initial orientation of the galvanized sample was selected to keep the weld seams of the sample at the neutral axis. The neutral axis is located 90° from the up position discussed in Chapter 2. According to simple beam theory, the neutral axis experiences no bending stress. Figure 7.3 shows the initial orientation and rotated orientation, along with the location of bends discussed in this section. Bend 5 of the galvanized sample was selected to be placed upwards in the test setup, subjecting that bend to the maximum fatigue stress. The ultrasonic inspection of bend 5 before testing had found a crack indication roughly 1.625 in. long.
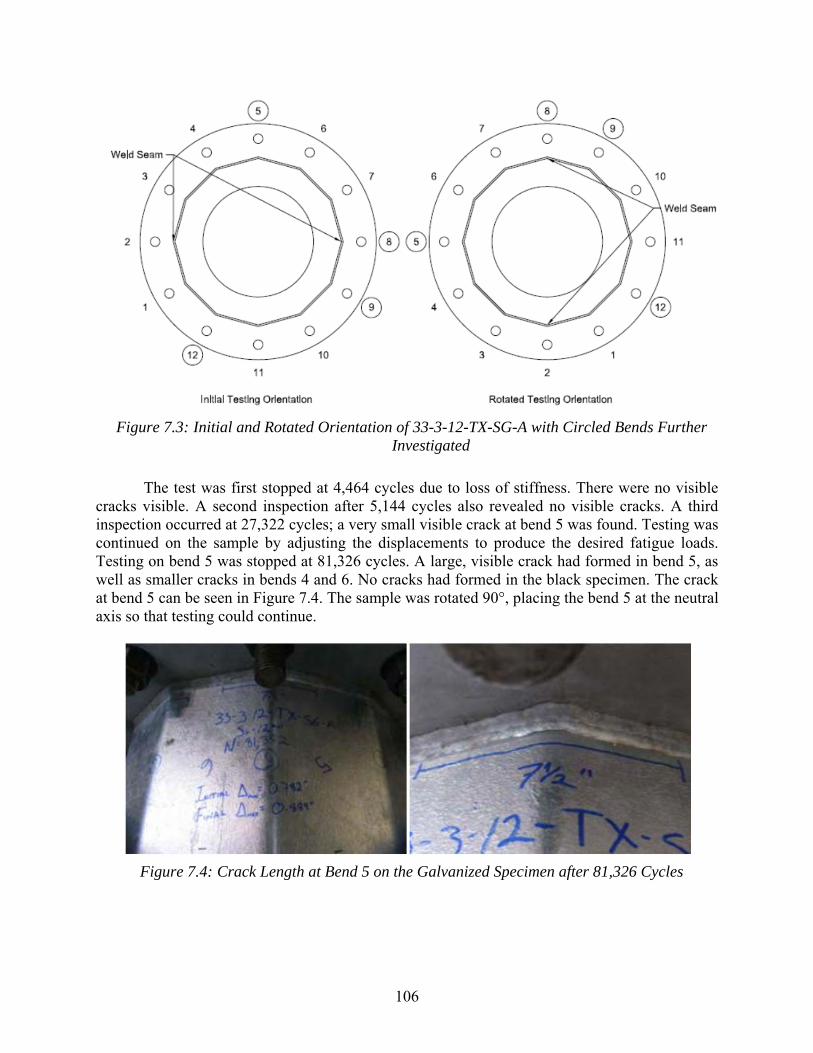
106
Figure 7.3: Initial and Rotated Orientation of 33-3-12-TX-SG-A with Circled Bends Further Investigated
The test was first stopped at 4,464 cycles due to loss of stiffness. There were no visible cracks visible. A second inspection after 5,144 cycles also revealed no visible cracks. A third inspection occurred at 27,322 cycles; a very small visible crack at bend 5 was found. Testing was continued on the sample by adjusting the displacements to produce the desired fatigue loads. Testing on bend 5 was stopped at 81,326 cycles. A large, visible crack had formed in bend 5, as well as smaller cracks in bends 4 and 6. No cracks had formed in the black specimen. The crack at bend 5 can be seen in Figure 7.4. The sample was rotated 90°, placing the bend 5 at the neutral axis so that testing could continue.
Figure 7.4: Crack Length at Bend 5 on the Galvanized Specimen after 81,326 Cycles
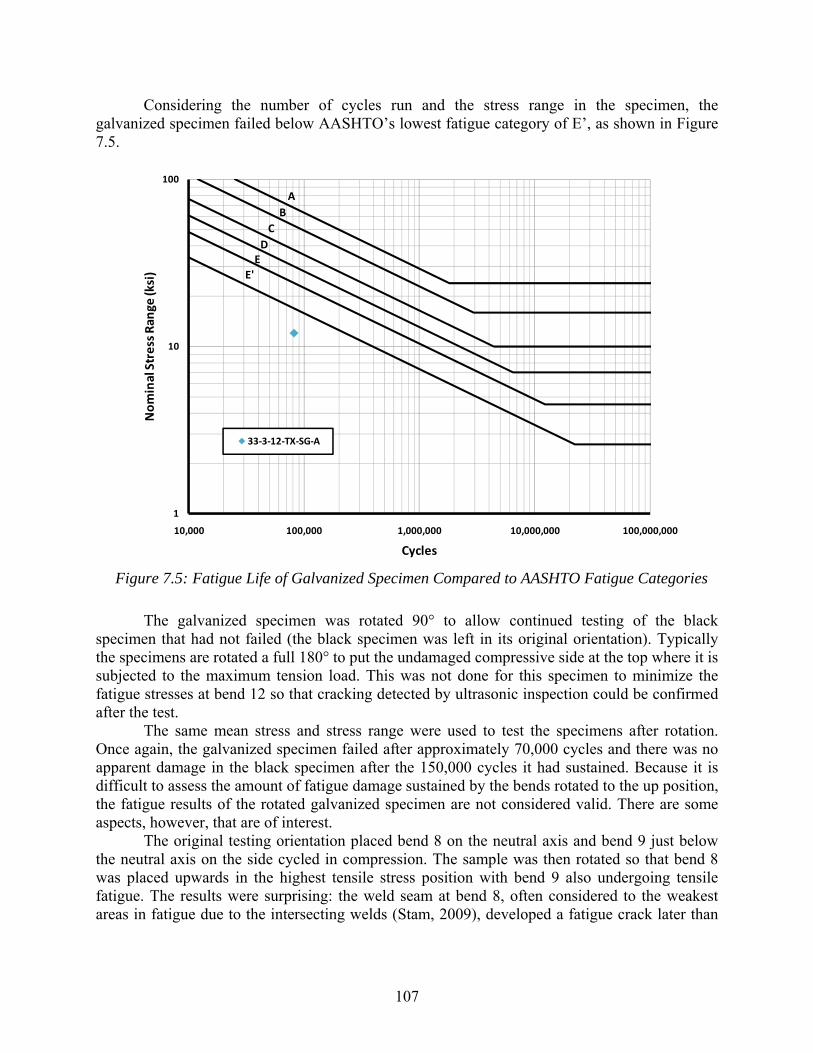
107
Considering the number of cycles run and the stress range in the specimen, the galvanized specimen failed below AASHTO’s lowest fatigue category of E’, as shown in Figure 7.5.
Figure 7.5: Fatigue Life of Galvanized Specimen Compared to AASHTO Fatigue Categories
The galvanized specimen was rotated 90° to allow continued testing of the black specimen that had not failed (the black specimen was left in its original orientation). Typically the specimens are rotated a full 180° to put the undamaged compressive side at the top where it is subjected to the maximum tension load. This was not done for this specimen to minimize the fatigue stresses at bend 12 so that cracking detected by ultrasonic inspection could be confirmed after the test.
The same mean stress and stress range were used to test the specimens after rotation. Once again, the galvanized specimen failed after approximately 70,000 cycles and there was no apparent damage in the black specimen after the 150,000 cycles it had sustained. Because it is difficult to assess the amount of fatigue damage sustained by the bends rotated to the up position, the fatigue results of the rotated galvanized specimen are not considered valid. There are some aspects, however, that are of interest.
The original testing orientation placed bend 8 on the neutral axis and bend 9 just below the neutral axis on the side cycled in compression. The sample was then rotated so that bend 8 was placed upwards in the highest tensile stress position with bend 9 also undergoing tensile fatigue. The results were surprising: the weld seam at bend 8, often considered to the weakest areas in fatigue due to the intersecting welds (Stam, 2009), developed a fatigue crack later than
A
B
C
DE
E'
1
10
100
10,000 100,000 1,000,000 10,000,000 100,000,000
Nominal Stress Ran
ge (ksi)
Cycles
33‐3‐12‐TX‐SG‐A
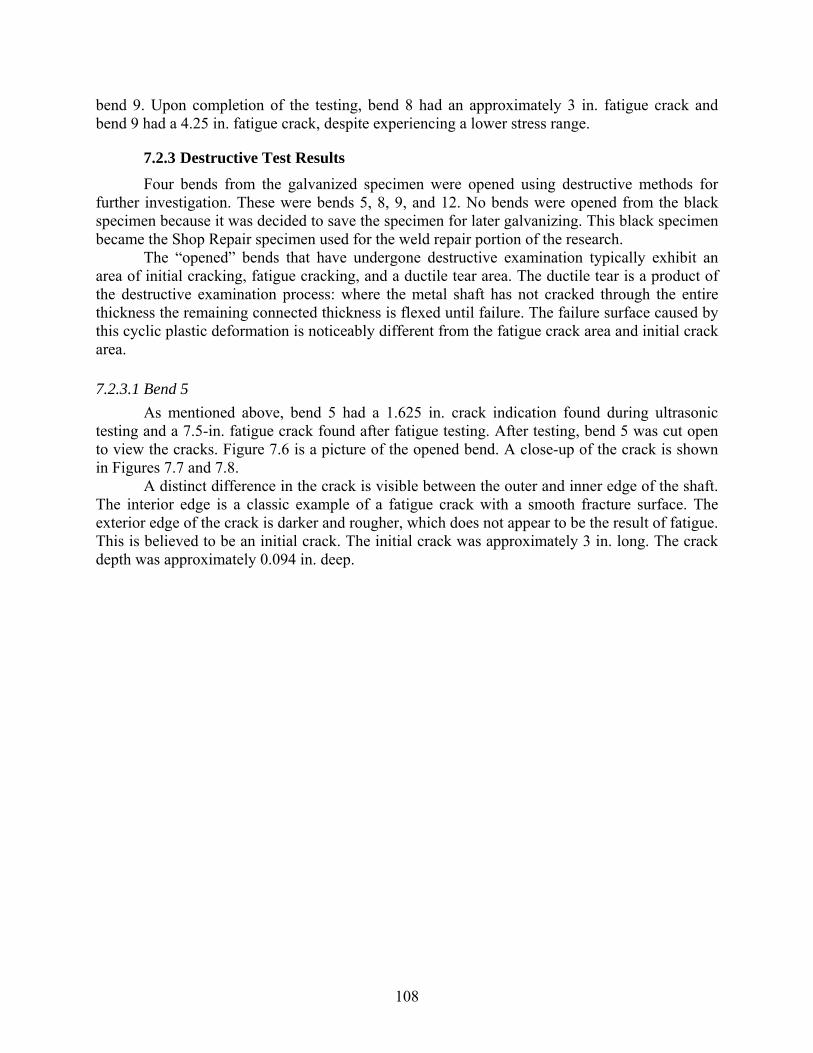
108
bend 9. Upon completion of the testing, bend 8 had an approximately 3 in. fatigue crack and bend 9 had a 4.25 in. fatigue crack, despite experiencing a lower stress range.
7.2.3 Destructive Test Results
Four bends from the galvanized specimen were opened using destructive methods for further investigation. These were bends 5, 8, 9, and 12. No bends were opened from the black specimen because it was decided to save the specimen for later galvanizing. This black specimen became the Shop Repair specimen used for the weld repair portion of the research.
The “opened” bends that have undergone destructive examination typically exhibit an area of initial cracking, fatigue cracking, and a ductile tear area. The ductile tear is a product of the destructive examination process: where the metal shaft has not cracked through the entire thickness the remaining connected thickness is flexed until failure. The failure surface caused by this cyclic plastic deformation is noticeably different from the fatigue crack area and initial crack area.
7.2.3.1 Bend 5
As mentioned above, bend 5 had a 1.625 in. crack indication found during ultrasonic testing and a 7.5-in. fatigue crack found after fatigue testing. After testing, bend 5 was cut open to view the cracks. Figure 7.6 is a picture of the opened bend. A close-up of the crack is shown in Figures 7.7 and 7.8.
A distinct difference in the crack is visible between the outer and inner edge of the shaft. The interior edge is a classic example of a fatigue crack with a smooth fracture surface. The exterior edge of the crack is darker and rougher, which does not appear to be the result of fatigue. This is believed to be an initial crack. The initial crack was approximately 3 in. long. The crack depth was approximately 0.094 in. deep.
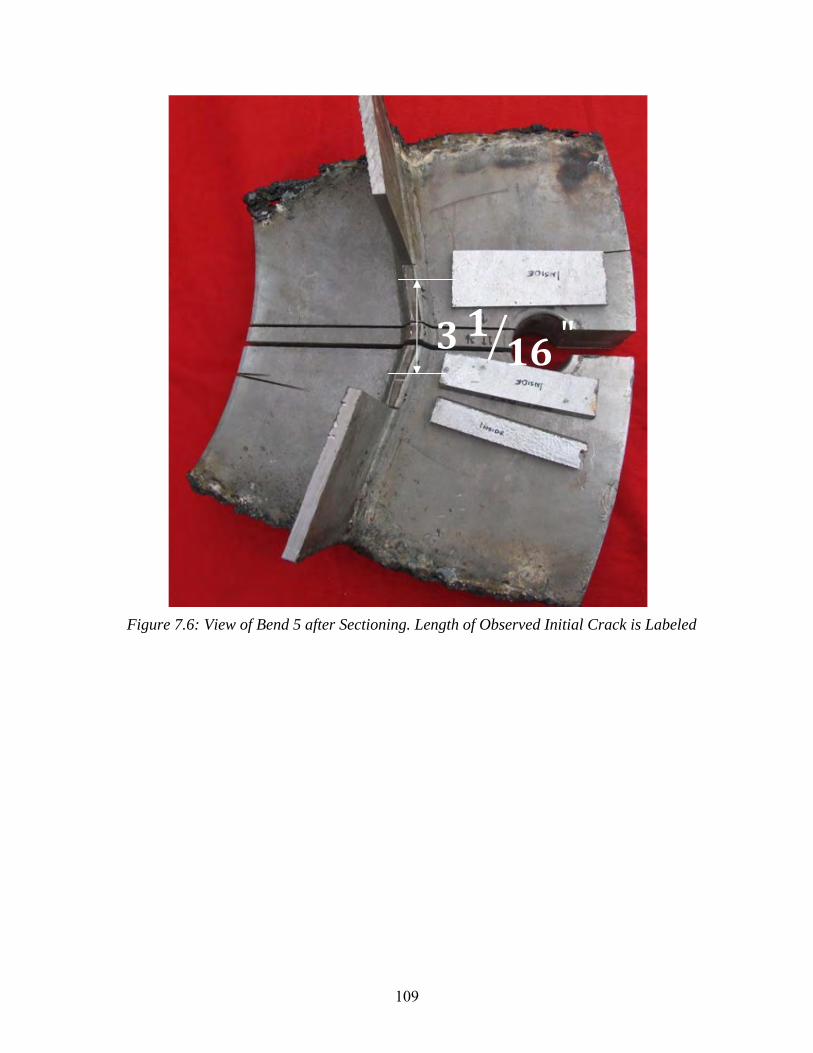
109
Figure 7.6: View of Bend 5 after Sectioning. Length of Observed Initial Crack is Labeled
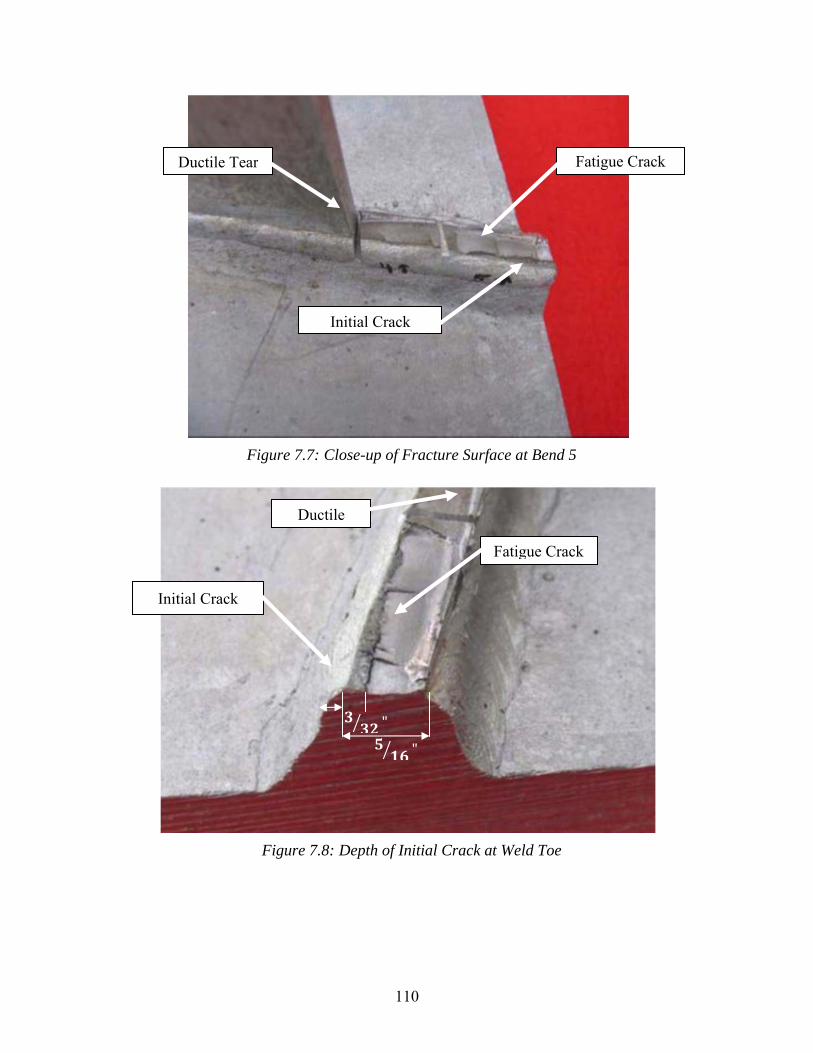
110
Figure 7.7: Close-up of Fracture Surface at Bend 5
Figure 7.8: Depth of Initial Crack at Weld Toe
Fatigue Crack
Initial Crack
Ductile Tear
Initial Crack
Fatigue Crack
Ductile
"
"
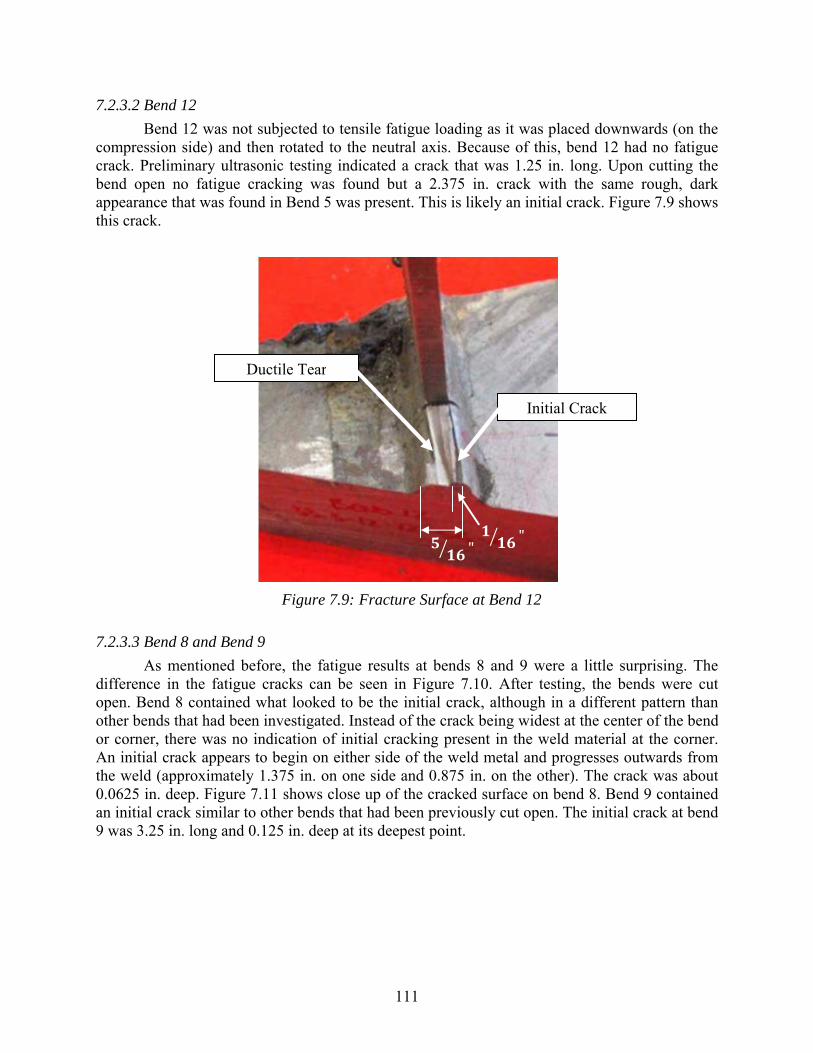
111
7.2.3.2 Bend 12
Bend 12 was not subjected to tensile fatigue loading as it was placed downwards (on the compression side) and then rotated to the neutral axis. Because of this, bend 12 had no fatigue crack. Preliminary ultrasonic testing indicated a crack that was 1.25 in. long. Upon cutting the bend open no fatigue cracking was found but a 2.375 in. crack with the same rough, dark appearance that was found in Bend 5 was present. This is likely an initial crack. Figure 7.9 shows this crack.
Figure 7.9: Fracture Surface at Bend 12
7.2.3.3 Bend 8 and Bend 9
As mentioned before, the fatigue results at bends 8 and 9 were a little surprising. The difference in the fatigue cracks can be seen in Figure 7.10. After testing, the bends were cut open. Bend 8 contained what looked to be the initial crack, although in a different pattern than other bends that had been investigated. Instead of the crack being widest at the center of the bend or corner, there was no indication of initial cracking present in the weld material at the corner. An initial crack appears to begin on either side of the weld metal and progresses outwards from the weld (approximately 1.375 in. on one side and 0.875 in. on the other). The crack was about 0.0625 in. deep. Figure 7.11 shows close up of the cracked surface on bend 8. Bend 9 contained an initial crack similar to other bends that had been previously cut open. The initial crack at bend 9 was 3.25 in. long and 0.125 in. deep at its deepest point.
Ductile Tear
Initial Crack
""
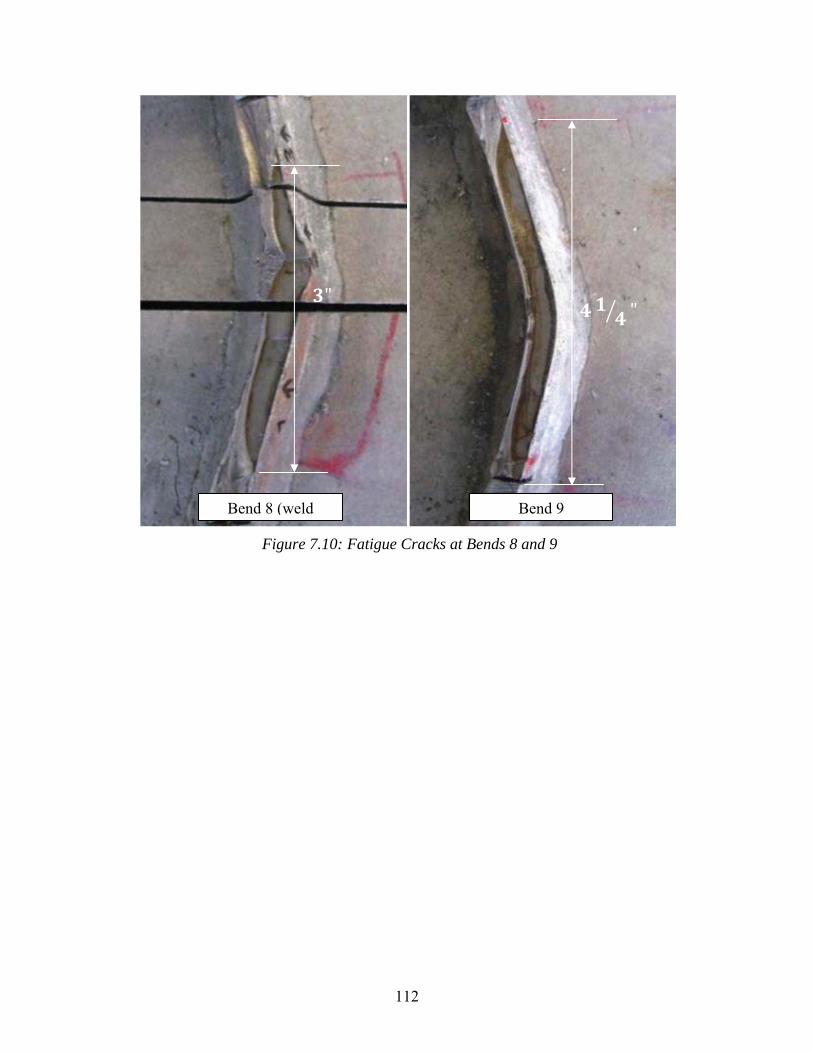
112
Figure 7.10: Fatigue Cracks at Bends 8 and 9
" "
Bend 9Bend 8 (weld
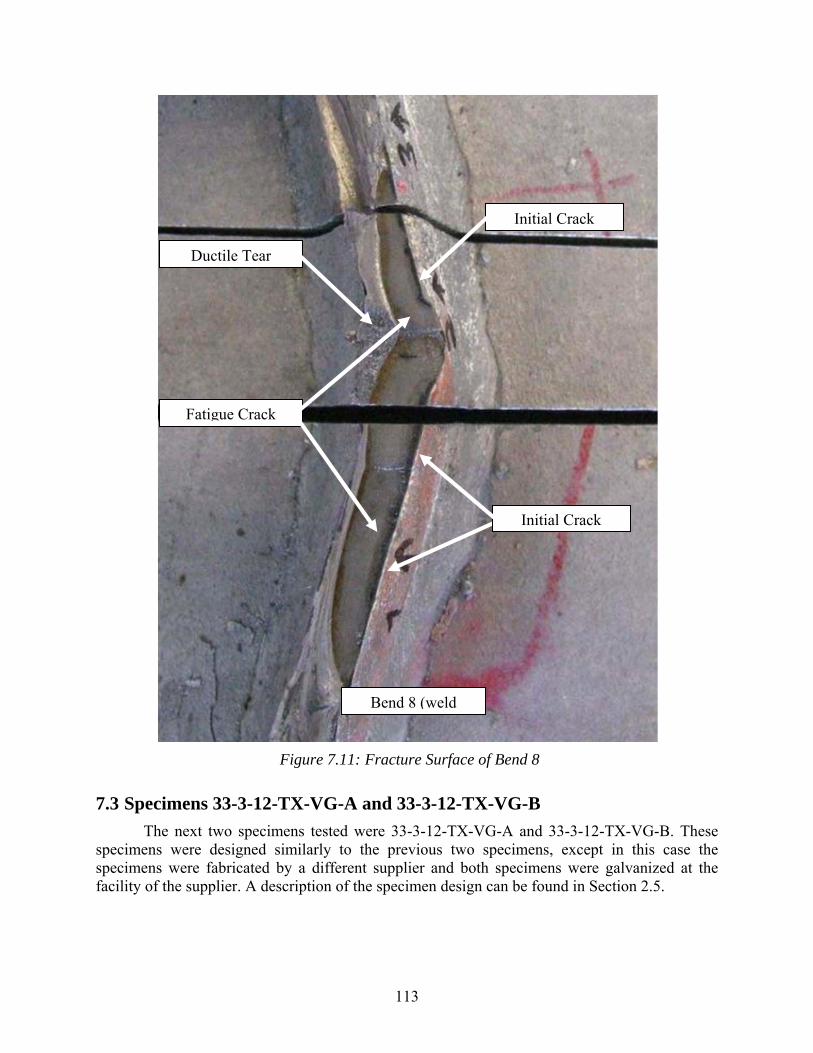
113
Figure 7.11: Fracture Surface of Bend 8
7.3 Specimens 33-3-12-TX-VG-A and 33-3-12-TX-VG-B
The next two specimens tested were 33-3-12-TX-VG-A and 33-3-12-TX-VG-B. These specimens were designed similarly to the previous two specimens, except in this case the specimens were fabricated by a different supplier and both specimens were galvanized at the facility of the supplier. A description of the specimen design can be found in Section 2.5.
Bend 8 (weld
Ductile Tear
Initial Crack
Initial Crack
Fatigue Crack
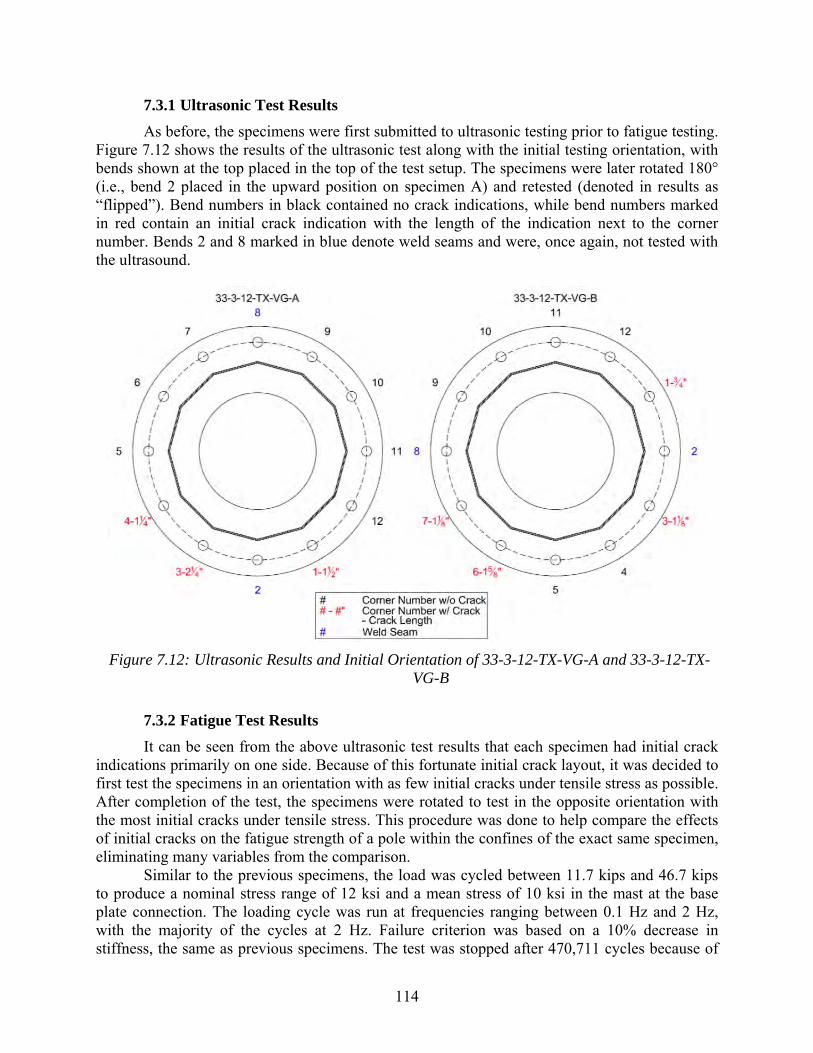
114
7.3.1 Ultrasonic Test Results
As before, the specimens were first submitted to ultrasonic testing prior to fatigue testing. Figure 7.12 shows the results of the ultrasonic test along with the initial testing orientation, with bends shown at the top placed in the top of the test setup. The specimens were later rotated 180° (i.e., bend 2 placed in the upward position on specimen A) and retested (denoted in results as “flipped”). Bend numbers in black contained no crack indications, while bend numbers marked in red contain an initial crack indication with the length of the indication next to the corner number. Bends 2 and 8 marked in blue denote weld seams and were, once again, not tested with the ultrasound.
Figure 7.12: Ultrasonic Results and Initial Orientation of 33-3-12-TX-VG-A and 33-3-12-TX-VG-B
7.3.2 Fatigue Test Results
It can be seen from the above ultrasonic test results that each specimen had initial crack indications primarily on one side. Because of this fortunate initial crack layout, it was decided to first test the specimens in an orientation with as few initial cracks under tensile stress as possible. After completion of the test, the specimens were rotated to test in the opposite orientation with the most initial cracks under tensile stress. This procedure was done to help compare the effects of initial cracks on the fatigue strength of a pole within the confines of the exact same specimen, eliminating many variables from the comparison.
Similar to the previous specimens, the load was cycled between 11.7 kips and 46.7 kips to produce a nominal stress range of 12 ksi and a mean stress of 10 ksi in the mast at the base plate connection. The loading cycle was run at frequencies ranging between 0.1 Hz and 2 Hz, with the majority of the cycles at 2 Hz. Failure criterion was based on a 10% decrease in stiffness, the same as previous specimens. The test was stopped after 470,711 cycles because of
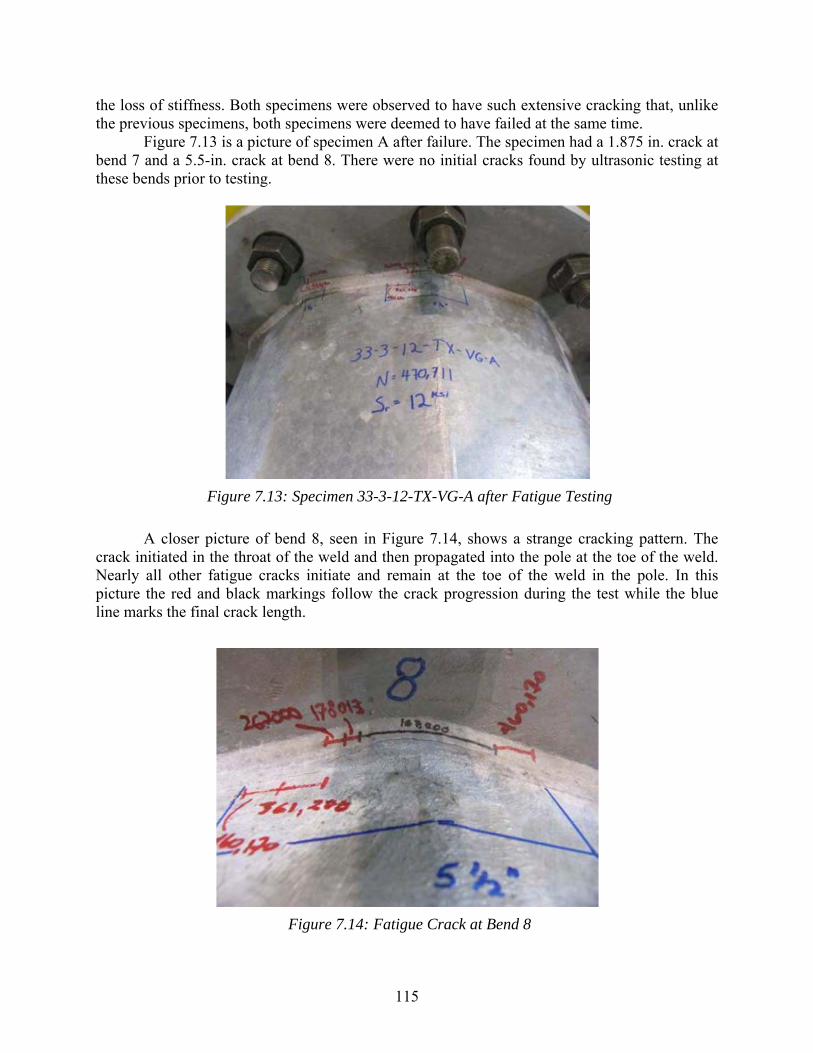
115
the loss of stiffness. Both specimens were observed to have such extensive cracking that, unlike the previous specimens, both specimens were deemed to have failed at the same time.
Figure 7.13 is a picture of specimen A after failure. The specimen had a 1.875 in. crack at bend 7 and a 5.5-in. crack at bend 8. There were no initial cracks found by ultrasonic testing at these bends prior to testing.
Figure 7.13: Specimen 33-3-12-TX-VG-A after Fatigue Testing
A closer picture of bend 8, seen in Figure 7.14, shows a strange cracking pattern. The crack initiated in the throat of the weld and then propagated into the pole at the toe of the weld. Nearly all other fatigue cracks initiate and remain at the toe of the weld in the pole. In this picture the red and black markings follow the crack progression during the test while the blue line marks the final crack length.
Figure 7.14: Fatigue Crack at Bend 8
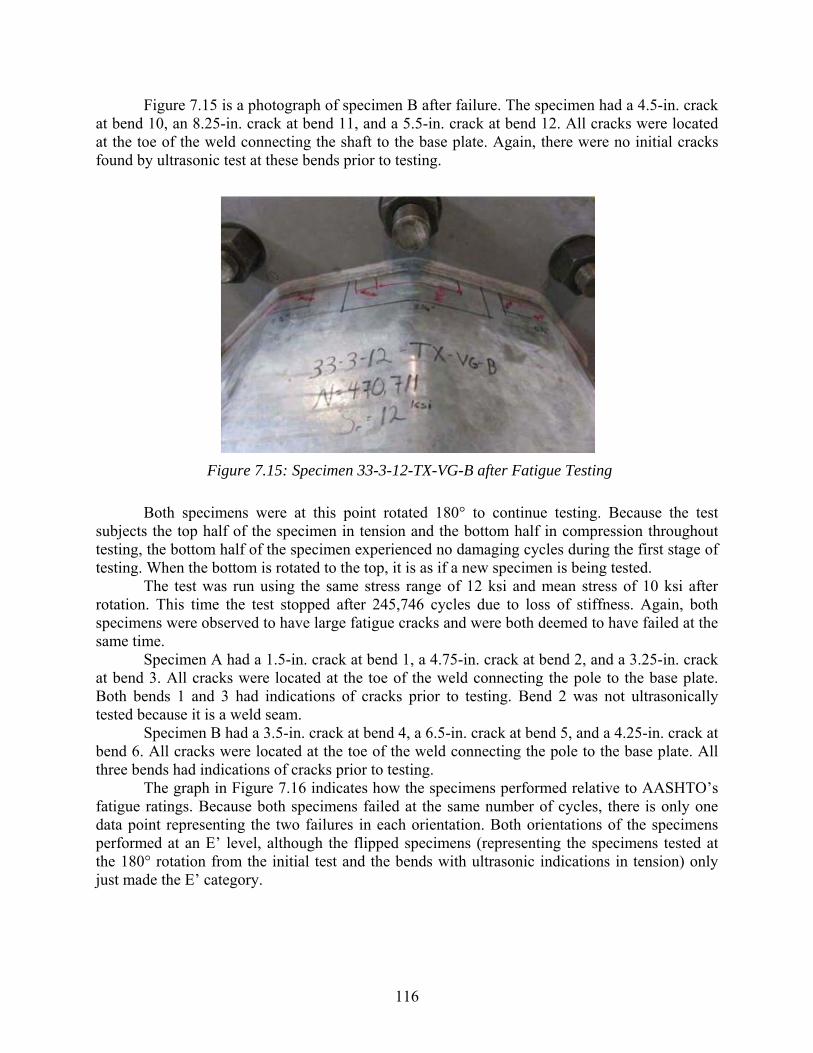
116
Figure 7.15 is a photograph of specimen B after failure. The specimen had a 4.5-in. crack at bend 10, an 8.25-in. crack at bend 11, and a 5.5-in. crack at bend 12. All cracks were located at the toe of the weld connecting the shaft to the base plate. Again, there were no initial cracks found by ultrasonic test at these bends prior to testing.
Figure 7.15: Specimen 33-3-12-TX-VG-B after Fatigue Testing
Both specimens were at this point rotated 180° to continue testing. Because the test subjects the top half of the specimen in tension and the bottom half in compression throughout testing, the bottom half of the specimen experienced no damaging cycles during the first stage of testing. When the bottom is rotated to the top, it is as if a new specimen is being tested.
The test was run using the same stress range of 12 ksi and mean stress of 10 ksi after rotation. This time the test stopped after 245,746 cycles due to loss of stiffness. Again, both specimens were observed to have large fatigue cracks and were both deemed to have failed at the same time.
Specimen A had a 1.5-in. crack at bend 1, a 4.75-in. crack at bend 2, and a 3.25-in. crack at bend 3. All cracks were located at the toe of the weld connecting the pole to the base plate. Both bends 1 and 3 had indications of cracks prior to testing. Bend 2 was not ultrasonically tested because it is a weld seam.
Specimen B had a 3.5-in. crack at bend 4, a 6.5-in. crack at bend 5, and a 4.25-in. crack at bend 6. All cracks were located at the toe of the weld connecting the pole to the base plate. All three bends had indications of cracks prior to testing.
The graph in Figure 7.16 indicates how the specimens performed relative to AASHTO’s fatigue ratings. Because both specimens failed at the same number of cycles, there is only one data point representing the two failures in each orientation. Both orientations of the specimens performed at an E’ level, although the flipped specimens (representing the specimens tested at the 180° rotation from the initial test and the bends with ultrasonic indications in tension) only just made the E’ category.
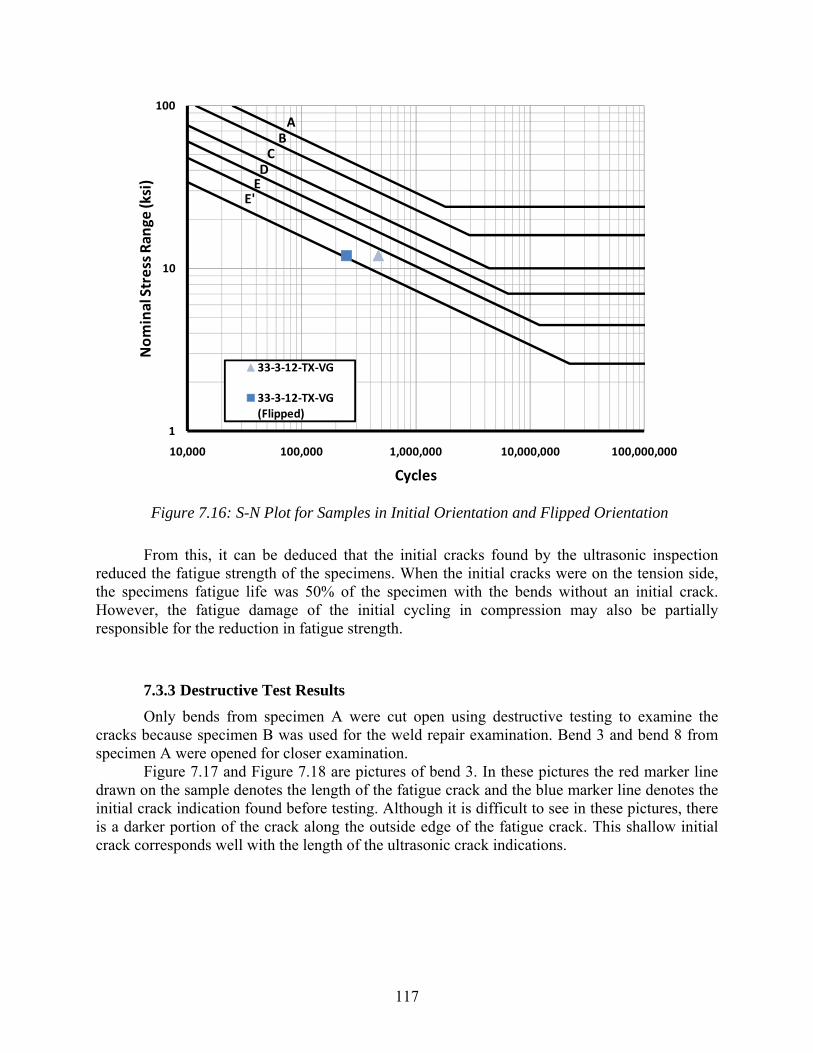
117
Figure 7.16: S-N Plot for Samples in Initial Orientation and Flipped Orientation
From this, it can be deduced that the initial cracks found by the ultrasonic inspection reduced the fatigue strength of the specimens. When the initial cracks were on the tension side, the specimens fatigue life was 50% of the specimen with the bends without an initial crack. However, the fatigue damage of the initial cycling in compression may also be partially responsible for the reduction in fatigue strength.
7.3.3 Destructive Test Results
Only bends from specimen A were cut open using destructive testing to examine the cracks because specimen B was used for the weld repair examination. Bend 3 and bend 8 from specimen A were opened for closer examination.
Figure 7.17 and Figure 7.18 are pictures of bend 3. In these pictures the red marker line drawn on the sample denotes the length of the fatigue crack and the blue marker line denotes the initial crack indication found before testing. Although it is difficult to see in these pictures, there is a darker portion of the crack along the outside edge of the fatigue crack. This shallow initial crack corresponds well with the length of the ultrasonic crack indications.
AB
CDE
E'
1
10
100
10,000 100,000 1,000,000 10,000,000 100,000,000
Nominal Stress Ran
ge (ksi)
Cycles
33‐3‐12‐TX‐VG
33‐3‐12‐TX‐VG (Flipped)
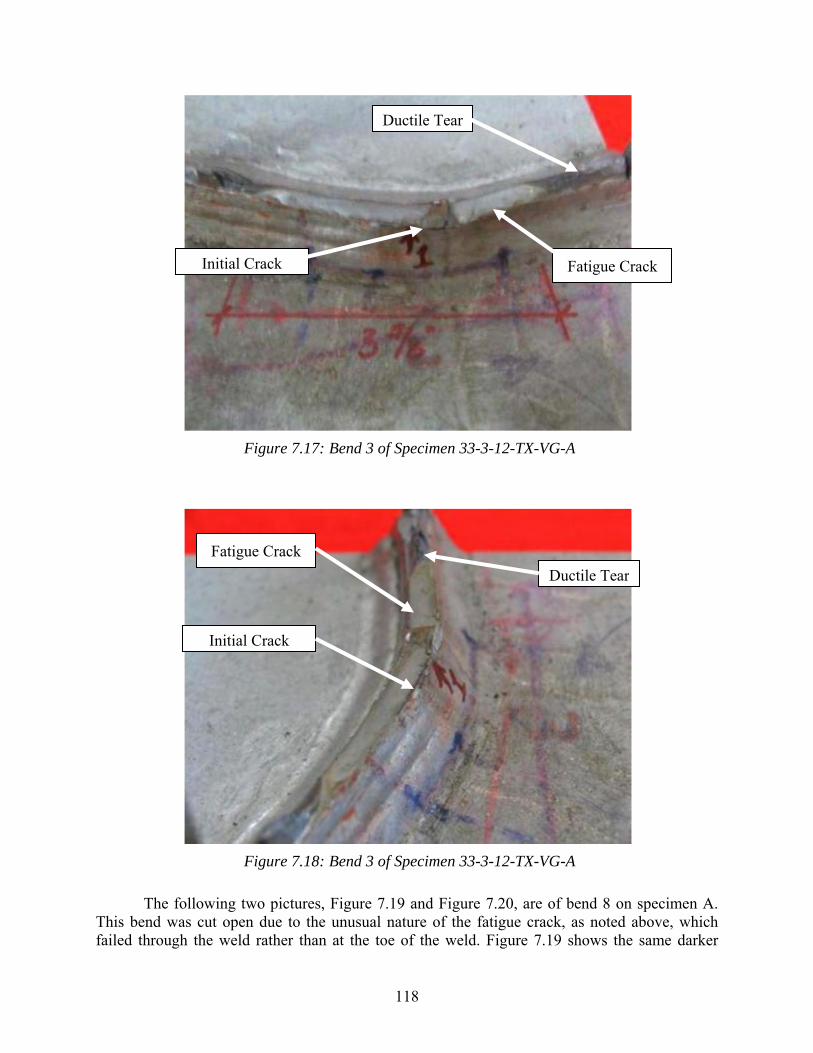
118
Figure 7.17: Bend 3 of Specimen 33-3-12-TX-VG-A
Figure 7.18: Bend 3 of Specimen 33-3-12-TX-VG-A
The following two pictures, Figure 7.19 and Figure 7.20, are of bend 8 on specimen A. This bend was cut open due to the unusual nature of the fatigue crack, as noted above, which failed through the weld rather than at the toe of the weld. Figure 7.19 shows the same darker
Initial Crack Fatigue Crack
Ductile Tear
Initial Crack
Fatigue Crack
Ductile Tear
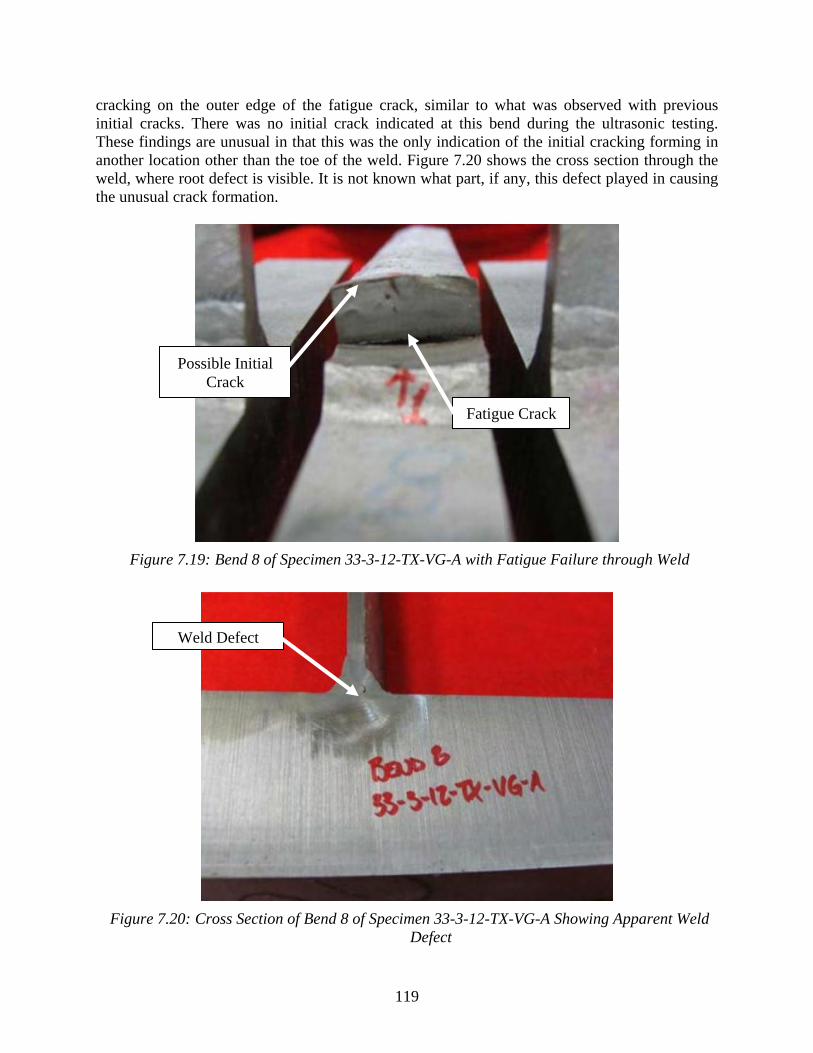
119
cracking on the outer edge of the fatigue crack, similar to what was observed with previous initial cracks. There was no initial crack indicated at this bend during the ultrasonic testing. These findings are unusual in that this was the only indication of the initial cracking forming in another location other than the toe of the weld. Figure 7.20 shows the cross section through the weld, where root defect is visible. It is not known what part, if any, this defect played in causing the unusual crack formation.
Figure 7.19: Bend 8 of Specimen 33-3-12-TX-VG-A with Fatigue Failure through Weld
Figure 7.20: Cross Section of Bend 8 of Specimen 33-3-12-TX-VG-A Showing Apparent Weld Defect
Possible Initial Crack
Fatigue Crack
Weld Defect
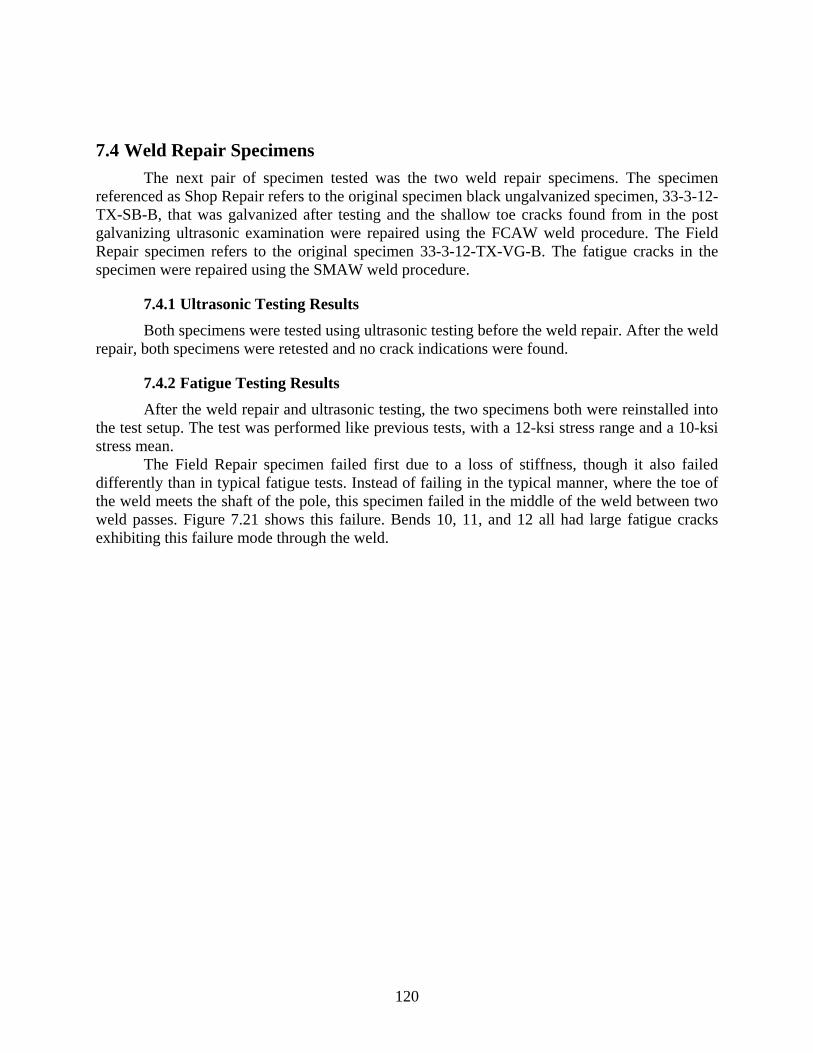
120
7.4 Weld Repair Specimens
The next pair of specimen tested was the two weld repair specimens. The specimen referenced as Shop Repair refers to the original specimen black ungalvanized specimen, 33-3-12-TX-SB-B, that was galvanized after testing and the shallow toe cracks found from in the post galvanizing ultrasonic examination were repaired using the FCAW weld procedure. The Field Repair specimen refers to the original specimen 33-3-12-TX-VG-B. The fatigue cracks in the specimen were repaired using the SMAW weld procedure.
7.4.1 Ultrasonic Testing Results
Both specimens were tested using ultrasonic testing before the weld repair. After the weld repair, both specimens were retested and no crack indications were found.
7.4.2 Fatigue Testing Results
After the weld repair and ultrasonic testing, the two specimens both were reinstalled into the test setup. The test was performed like previous tests, with a 12-ksi stress range and a 10-ksi stress mean.
The Field Repair specimen failed first due to a loss of stiffness, though it also failed differently than in typical fatigue tests. Instead of failing in the typical manner, where the toe of the weld meets the shaft of the pole, this specimen failed in the middle of the weld between two weld passes. Figure 7.21 shows this failure. Bends 10, 11, and 12 all had large fatigue cracks exhibiting this failure mode through the weld.
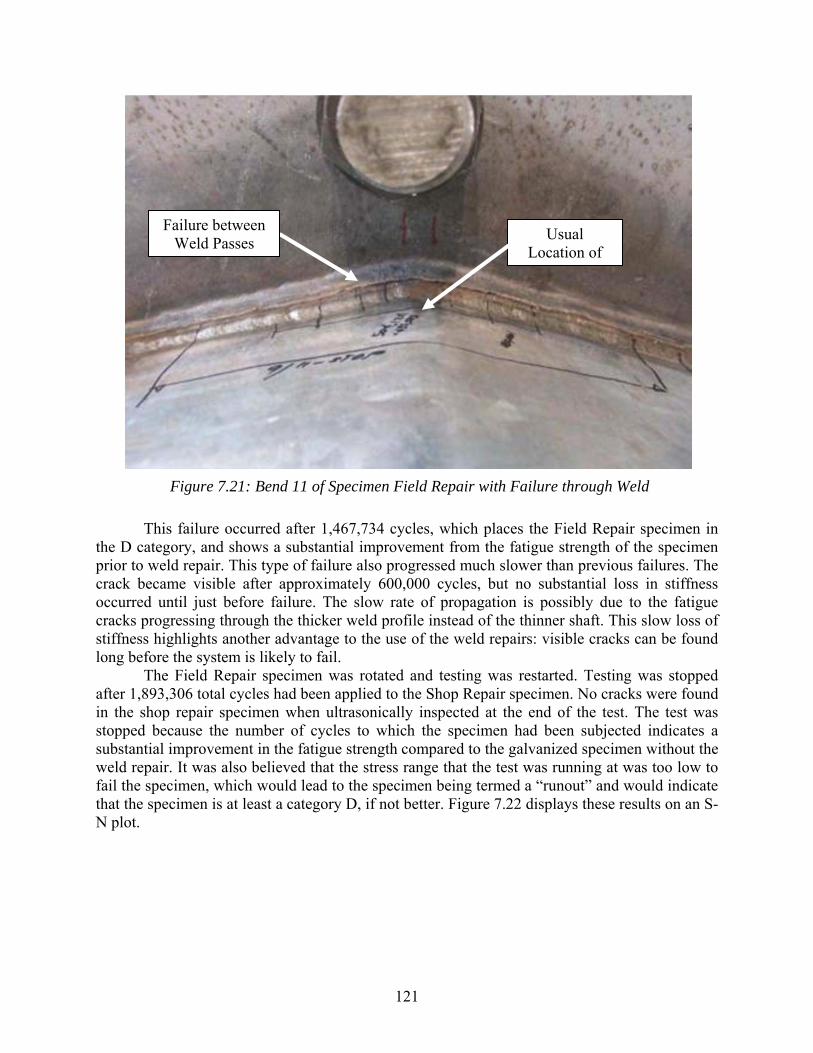
121
Figure 7.21: Bend 11 of Specimen Field Repair with Failure through Weld
This failure occurred after 1,467,734 cycles, which places the Field Repair specimen in the D category, and shows a substantial improvement from the fatigue strength of the specimen prior to weld repair. This type of failure also progressed much slower than previous failures. The crack became visible after approximately 600,000 cycles, but no substantial loss in stiffness occurred until just before failure. The slow rate of propagation is possibly due to the fatigue cracks progressing through the thicker weld profile instead of the thinner shaft. This slow loss of stiffness highlights another advantage to the use of the weld repairs: visible cracks can be found long before the system is likely to fail.
The Field Repair specimen was rotated and testing was restarted. Testing was stopped after 1,893,306 total cycles had been applied to the Shop Repair specimen. No cracks were found in the shop repair specimen when ultrasonically inspected at the end of the test. The test was stopped because the number of cycles to which the specimen had been subjected indicates a substantial improvement in the fatigue strength compared to the galvanized specimen without the weld repair. It was also believed that the stress range that the test was running at was too low to fail the specimen, which would lead to the specimen being termed a “runout” and would indicate that the specimen is at least a category D, if not better. Figure 7.22 displays these results on an S-N plot.
Usual Location of
Failure between Weld Passes
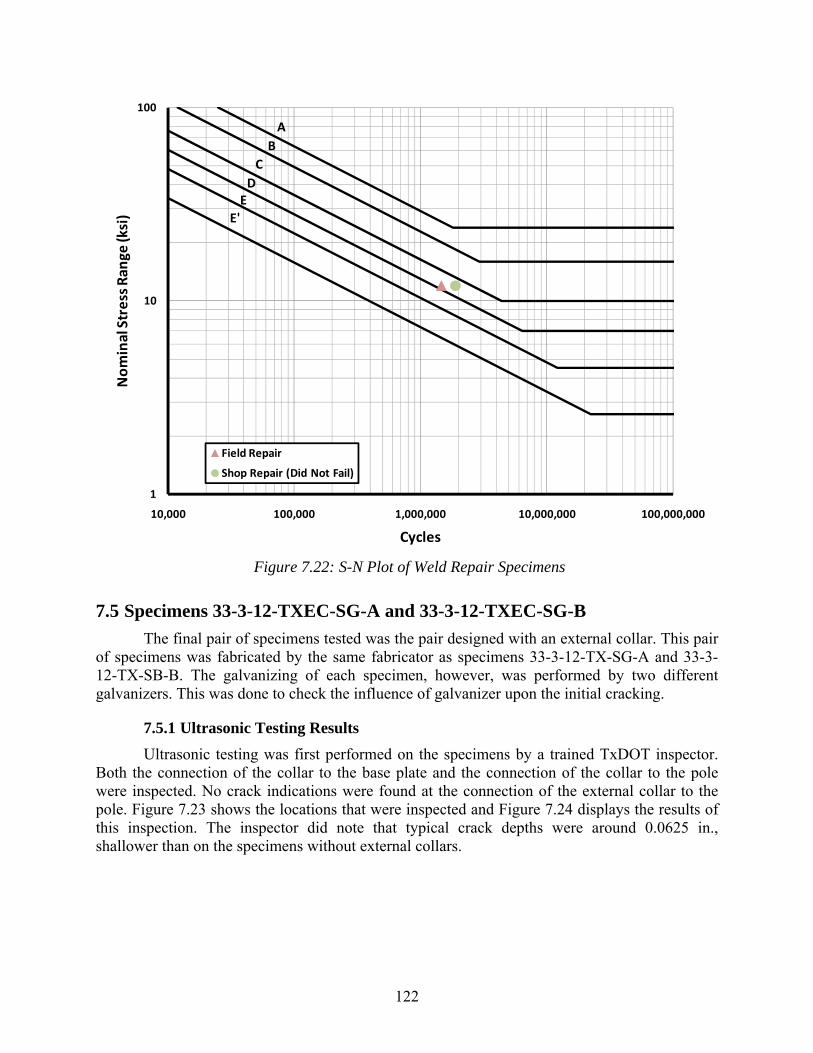
122
Figure 7.22: S-N Plot of Weld Repair Specimens
7.5 Specimens 33-3-12-TXEC-SG-A and 33-3-12-TXEC-SG-B
The final pair of specimens tested was the pair designed with an external collar. This pair of specimens was fabricated by the same fabricator as specimens 33-3-12-TX-SG-A and 33-3-12-TX-SB-B. The galvanizing of each specimen, however, was performed by two different galvanizers. This was done to check the influence of galvanizer upon the initial cracking.
7.5.1 Ultrasonic Testing Results
Ultrasonic testing was first performed on the specimens by a trained TxDOT inspector. Both the connection of the collar to the base plate and the connection of the collar to the pole were inspected. No crack indications were found at the connection of the external collar to the pole. Figure 7.23 shows the locations that were inspected and Figure 7.24 displays the results of this inspection. The inspector did note that typical crack depths were around 0.0625 in., shallower than on the specimens without external collars.
A
B
C
DE
E'
1
10
100
10,000 100,000 1,000,000 10,000,000 100,000,000
Nominal Stress Ran
ge (ksi)
Cycles
Field Repair
Shop Repair (Did Not Fail)
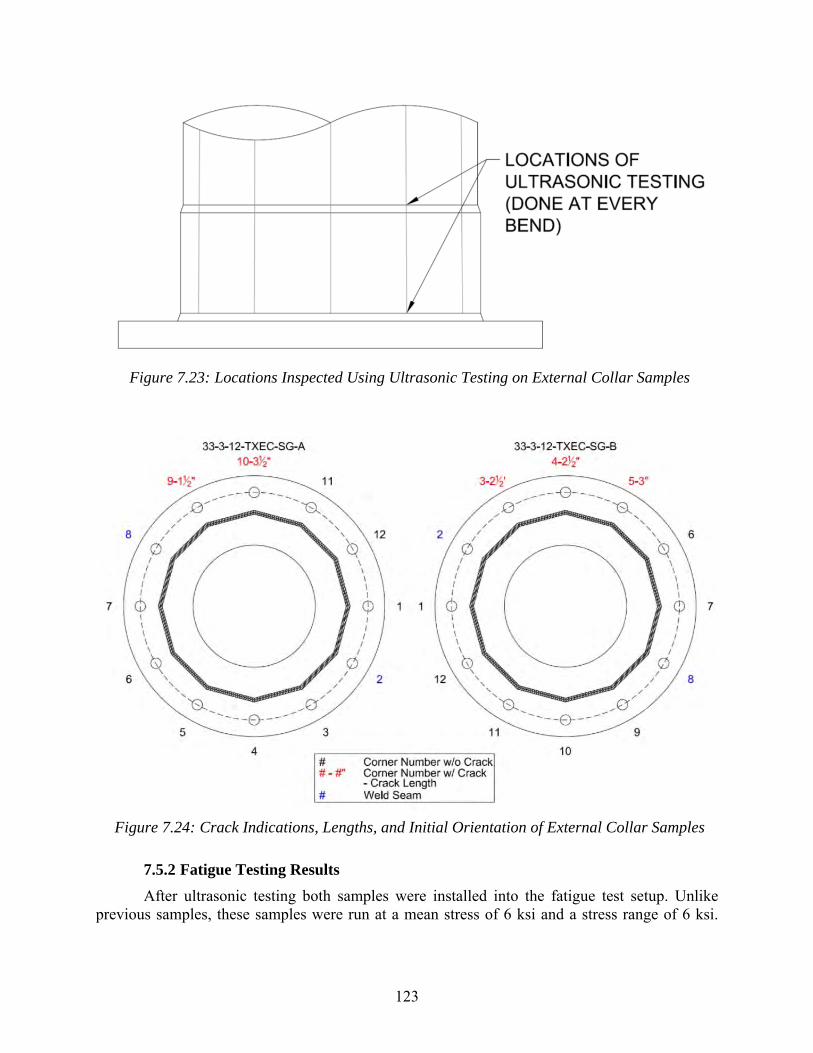
123
Figure 7.23: Locations Inspected Using Ultrasonic Testing on External Collar Samples
Figure 7.24: Crack Indications, Lengths, and Initial Orientation of External Collar Samples
7.5.2 Fatigue Testing Results
After ultrasonic testing both samples were installed into the fatigue test setup. Unlike previous samples, these samples were run at a mean stress of 6 ksi and a stress range of 6 ksi.
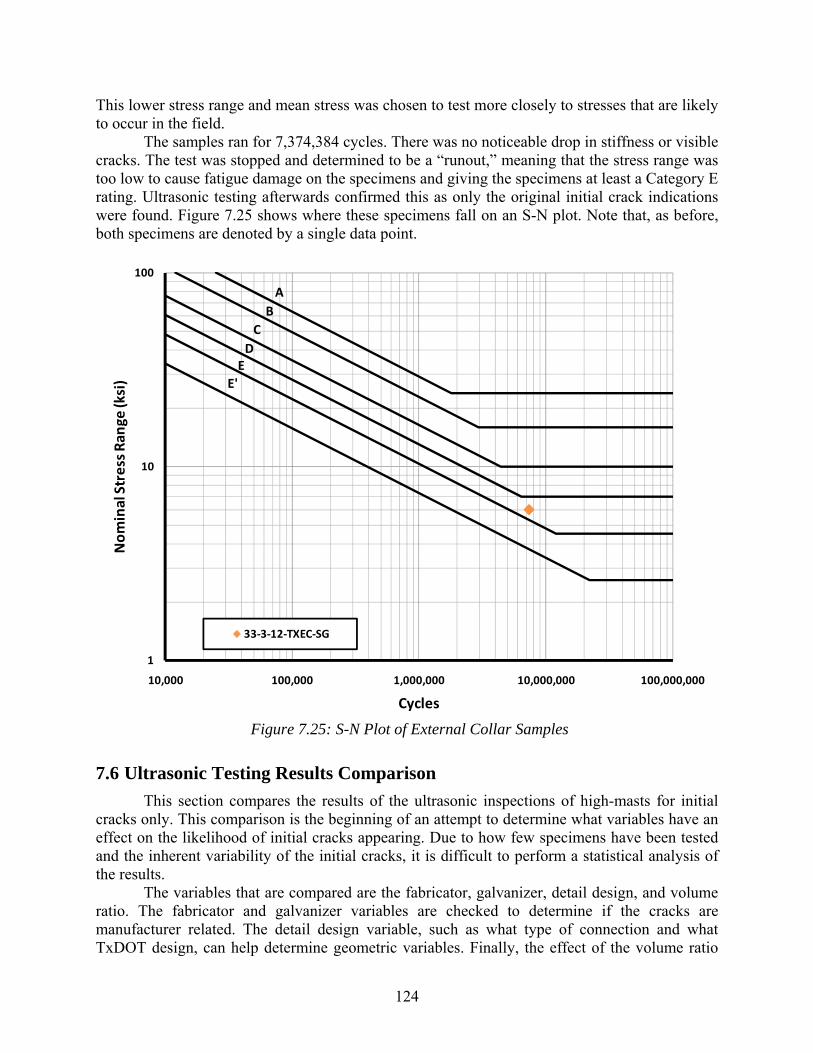
124
This lower stress range and mean stress was chosen to test more closely to stresses that are likely to occur in the field.
The samples ran for 7,374,384 cycles. There was no noticeable drop in stiffness or visible cracks. The test was stopped and determined to be a “runout,” meaning that the stress range was too low to cause fatigue damage on the specimens and giving the specimens at least a Category E rating. Ultrasonic testing afterwards confirmed this as only the original initial crack indications were found. Figure 7.25 shows where these specimens fall on an S-N plot. Note that, as before, both specimens are denoted by a single data point.
Figure 7.25: S-N Plot of External Collar Samples
7.6 Ultrasonic Testing Results Comparison
This section compares the results of the ultrasonic inspections of high-masts for initial cracks only. This comparison is the beginning of an attempt to determine what variables have an effect on the likelihood of initial cracks appearing. Due to how few specimens have been tested and the inherent variability of the initial cracks, it is difficult to perform a statistical analysis of the results.
The variables that are compared are the fabricator, galvanizer, detail design, and volume ratio. The fabricator and galvanizer variables are checked to determine if the cracks are manufacturer related. The detail design variable, such as what type of connection and what TxDOT design, can help determine geometric variables. Finally, the effect of the volume ratio
A
B
C
DE
E'
1
10
100
10,000 100,000 1,000,000 10,000,000 100,000,000
Nominal Stress Ran
ge (ksi)
Cycles
33‐3‐12‐TXEC‐SG
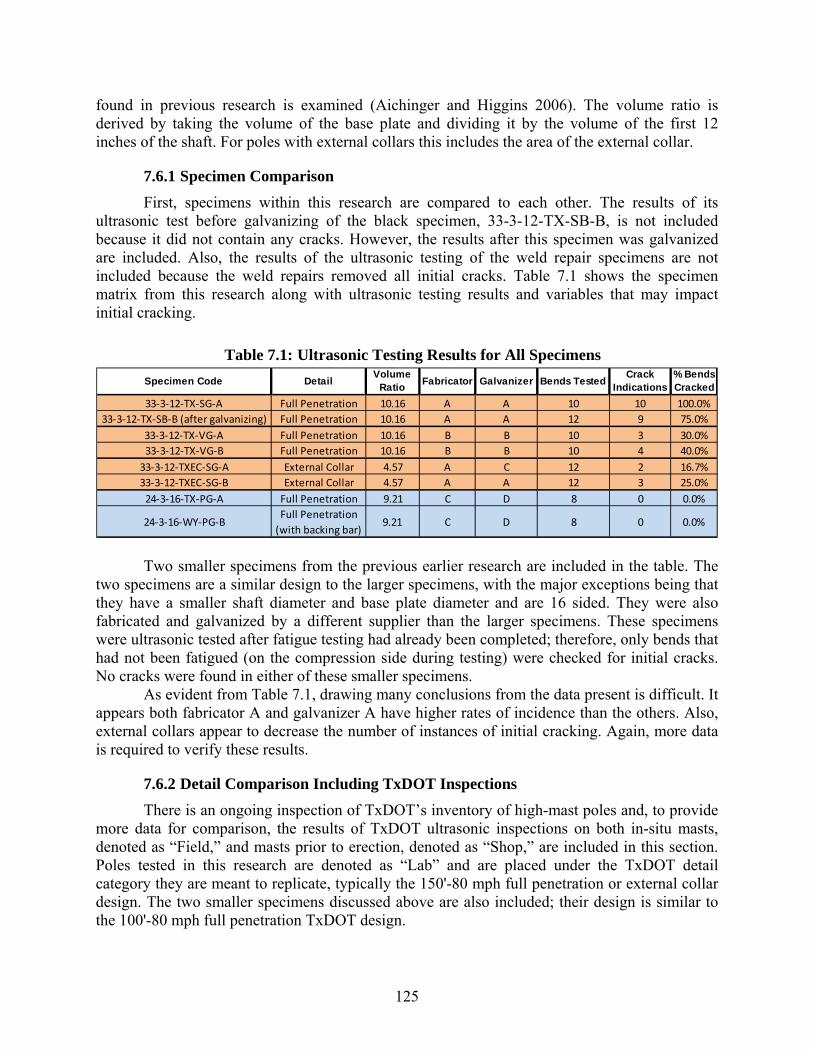
125
found in previous research is examined (Aichinger and Higgins 2006). The volume ratio is derived by taking the volume of the base plate and dividing it by the volume of the first 12 inches of the shaft. For poles with external collars this includes the area of the external collar.
7.6.1 Specimen Comparison
First, specimens within this research are compared to each other. The results of its ultrasonic test before galvanizing of the black specimen, 33-3-12-TX-SB-B, is not included because it did not contain any cracks. However, the results after this specimen was galvanized are included. Also, the results of the ultrasonic testing of the weld repair specimens are not included because the weld repairs removed all initial cracks. Table 7.1 shows the specimen matrix from this research along with ultrasonic testing results and variables that may impact initial cracking.
Table 7.1: Ultrasonic Testing Results for All Specimens
Two smaller specimens from the previous earlier research are included in the table. The
two specimens are a similar design to the larger specimens, with the major exceptions being that they have a smaller shaft diameter and base plate diameter and are 16 sided. They were also fabricated and galvanized by a different supplier than the larger specimens. These specimens were ultrasonic tested after fatigue testing had already been completed; therefore, only bends that had not been fatigued (on the compression side during testing) were checked for initial cracks. No cracks were found in either of these smaller specimens.
As evident from Table 7.1, drawing many conclusions from the data present is difficult. It appears both fabricator A and galvanizer A have higher rates of incidence than the others. Also, external collars appear to decrease the number of instances of initial cracking. Again, more data is required to verify these results.
7.6.2 Detail Comparison Including TxDOT Inspections
There is an ongoing inspection of TxDOT’s inventory of high-mast poles and, to provide more data for comparison, the results of TxDOT ultrasonic inspections on both in-situ masts, denoted as “Field,” and masts prior to erection, denoted as “Shop,” are included in this section. Poles tested in this research are denoted as “Lab” and are placed under the TxDOT detail category they are meant to replicate, typically the 150'-80 mph full penetration or external collar design. The two smaller specimens discussed above are also included; their design is similar to the 100'-80 mph full penetration TxDOT design.
Specimen Code DetailVolume
RatioFabricator Galvanizer Bends Tested
Crack Indications
% Bends Cracked
33‐3‐12‐TX‐SG‐A Full Penetration 10.16 A A 10 10 100.0%
33‐3‐12‐TX‐SB‐B (after galvanizing) Full Penetration 10.16 A A 12 9 75.0%
33‐3‐12‐TX‐VG‐A Full Penetration 10.16 B B 10 3 30.0%
33‐3‐12‐TX‐VG‐B Full Penetration 10.16 B B 10 4 40.0%
33‐3‐12‐TXEC‐SG‐A External Collar 4.57 A C 12 2 16.7%
33‐3‐12‐TXEC‐SG‐B External Collar 4.57 A A 12 3 25.0%
24‐3‐16‐TX‐PG‐A Full Penetration 9.21 C D 8 0 0.0%
24‐3‐16‐WY‐PG‐BFull Penetration
(with backing bar)9.21 C D 8 0 0.0%
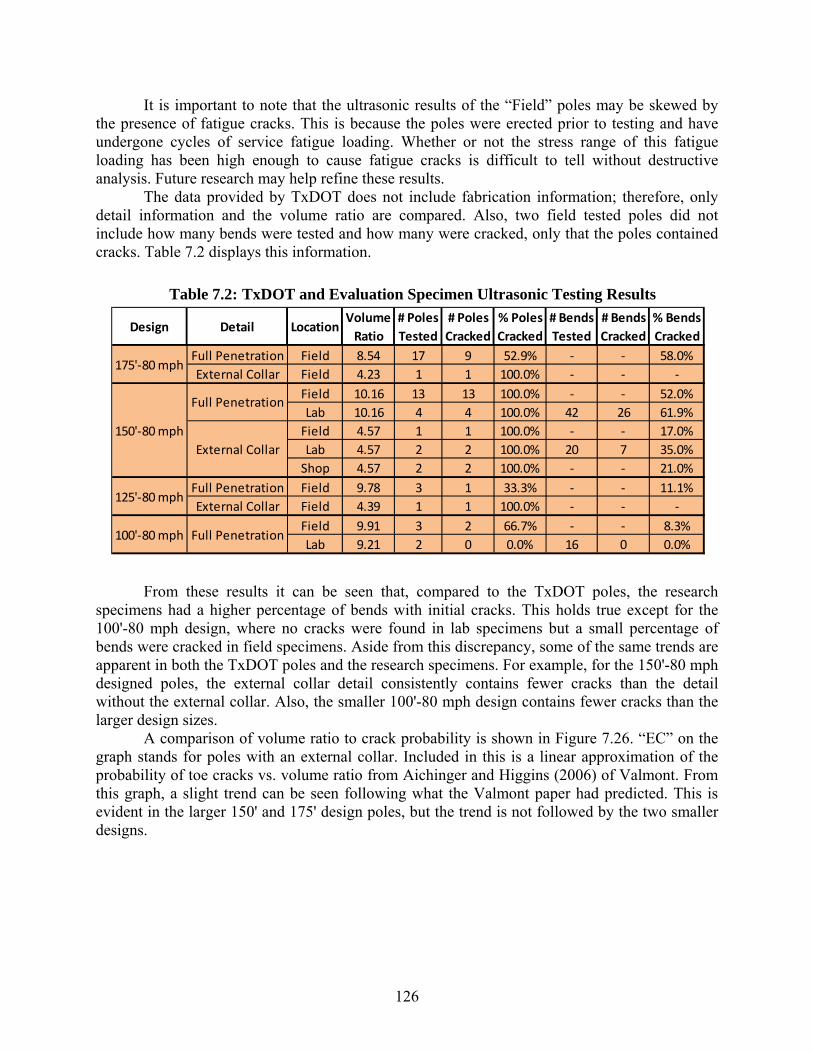
126
It is important to note that the ultrasonic results of the “Field” poles may be skewed by the presence of fatigue cracks. This is because the poles were erected prior to testing and have undergone cycles of service fatigue loading. Whether or not the stress range of this fatigue loading has been high enough to cause fatigue cracks is difficult to tell without destructive analysis. Future research may help refine these results.
The data provided by TxDOT does not include fabrication information; therefore, only detail information and the volume ratio are compared. Also, two field tested poles did not include how many bends were tested and how many were cracked, only that the poles contained cracks. Table 7.2 displays this information.
Table 7.2: TxDOT and Evaluation Specimen Ultrasonic Testing Results
From these results it can be seen that, compared to the TxDOT poles, the research specimens had a higher percentage of bends with initial cracks. This holds true except for the 100'-80 mph design, where no cracks were found in lab specimens but a small percentage of bends were cracked in field specimens. Aside from this discrepancy, some of the same trends are apparent in both the TxDOT poles and the research specimens. For example, for the 150'-80 mph designed poles, the external collar detail consistently contains fewer cracks than the detail without the external collar. Also, the smaller 100'-80 mph design contains fewer cracks than the larger design sizes.
A comparison of volume ratio to crack probability is shown in Figure 7.26. “EC” on the graph stands for poles with an external collar. Included in this is a linear approximation of the probability of toe cracks vs. volume ratio from Aichinger and Higgins (2006) of Valmont. From this graph, a slight trend can be seen following what the Valmont paper had predicted. This is evident in the larger 150' and 175' design poles, but the trend is not followed by the two smaller designs.
Design Detail LocationVolume
Ratio
# Poles
Tested
# Poles
Cracked
% Poles
Cracked
# Bends
Tested
# Bends
Cracked
% Bends
Cracked
Full Penetration Field 8.54 17 9 52.9% ‐ ‐ 58.0%
External Collar Field 4.23 1 1 100.0% ‐ ‐ ‐
Field 10.16 13 13 100.0% ‐ ‐ 52.0%
Lab 10.16 4 4 100.0% 42 26 61.9%
Field 4.57 1 1 100.0% ‐ ‐ 17.0%
Lab 4.57 2 2 100.0% 20 7 35.0%
Shop 4.57 2 2 100.0% ‐ ‐ 21.0%
Full Penetration Field 9.78 3 1 33.3% ‐ ‐ 11.1%
External Collar Field 4.39 1 1 100.0% ‐ ‐ ‐
Field 9.91 3 2 66.7% ‐ ‐ 8.3%
Lab 9.21 2 0 0.0% 16 0 0.0%
150'‐80 mph
175'‐80 mph
125'‐80 mph
100'‐80 mph
Full Penetration
External Collar
Full Penetration
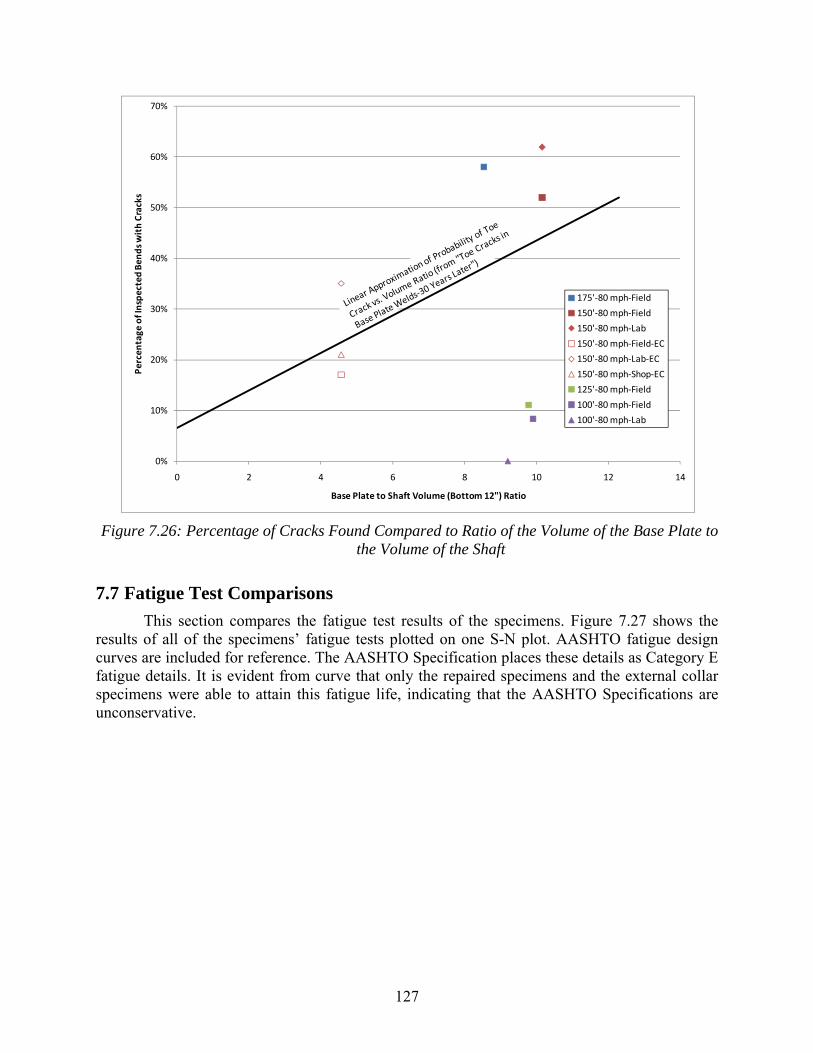
127
Figure 7.26: Percentage of Cracks Found Compared to Ratio of the Volume of the Base Plate to the Volume of the Shaft
7.7 Fatigue Test Comparisons
This section compares the fatigue test results of the specimens. Figure 7.27 shows the results of all of the specimens’ fatigue tests plotted on one S-N plot. AASHTO fatigue design curves are included for reference. The AASHTO Specification places these details as Category E fatigue details. It is evident from curve that only the repaired specimens and the external collar specimens were able to attain this fatigue life, indicating that the AASHTO Specifications are unconservative.
0%
10%
20%
30%
40%
50%
60%
70%
0 2 4 6 8 10 12 14
Percen
tage
of Inspected Ben
ds with Cracks
Base Plate to Shaft Volume (Bottom 12") Ratio
175'‐80 mph‐Field
150'‐80 mph‐Field
150'‐80 mph‐Lab
150'‐80 mph‐Field‐EC
150'‐80 mph‐Lab‐EC
150'‐80 mph‐Shop‐EC
125'‐80 mph‐Field
100'‐80 mph‐Field
100'‐80 mph‐Lab
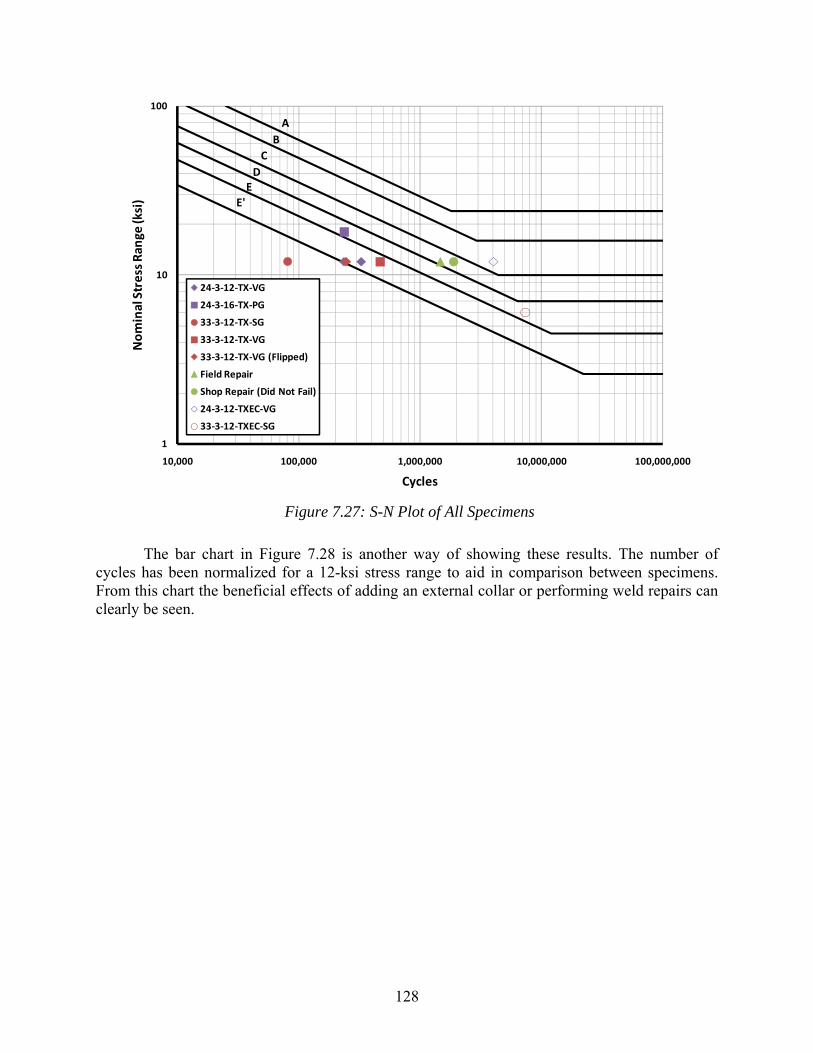
128
Figure 7.27: S-N Plot of All Specimens
The bar chart in Figure 7.28 is another way of showing these results. The number of cycles has been normalized for a 12-ksi stress range to aid in comparison between specimens. From this chart the beneficial effects of adding an external collar or performing weld repairs can clearly be seen.
A
B
C
DE
E'
1
10
100
10,000 100,000 1,000,000 10,000,000 100,000,000
Nominal Stress Ran
ge (ksi)
Cycles
24‐3‐12‐TX‐VG
24‐3‐16‐TX‐PG
33‐3‐12‐TX‐SG
33‐3‐12‐TX‐VG
33‐3‐12‐TX‐VG (Flipped)
Field Repair
Shop Repair (Did Not Fail)
24‐3‐12‐TXEC‐VG
33‐3‐12‐TXEC‐SG
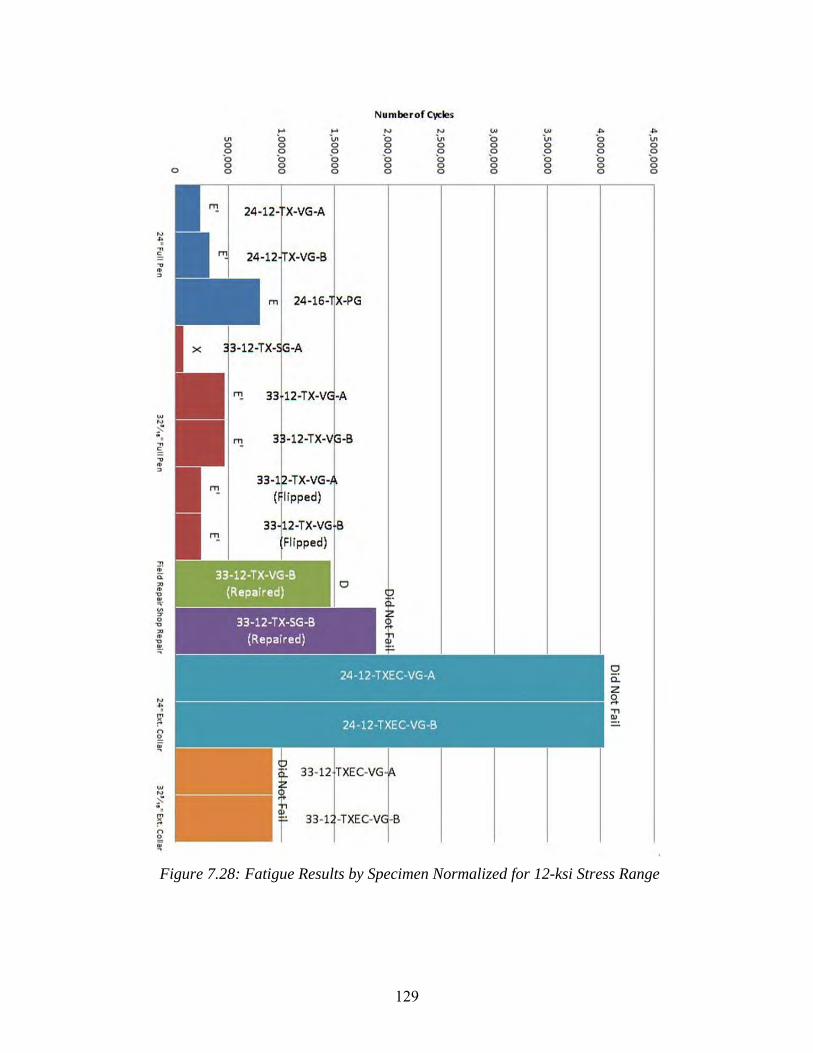
129
Figure 7.28: Fatigue Results by Specimen Normalized for 12-ksi Stress Range

130
131
Chapter 8. Conclusions and Design Recommendations
8.1 Conclusions
The fatigue tests and analytical evaluations undertaken in this research program have revealed that rather simple looking connection of a tubular member to end or base plate is not easy to quantify in terms of fatigue. The simple fatigue category approach used in the AASHTO and other structural design specifications cannot account for the influence of the connection geometry upon fatigue performance. The research indicates that the fatigue strength of the connection is dependent upon the following variables.
1. End/base plate stiffness
a. End plate thickness
b. Diameter of hole provided for drainage of galvanizing, wiring access, and welder access.
c. Number of anchor bolts in ring type end plates used in high-mast light towers.
2. Weld profile—unequal leg weld profile greatly enhances fatigue strength
3. Relative stiffness of mast or pole to the stiffness of base plate
a. Larger diameter or thicker poles need thicker base plates to maintain fatigue performance.
b. External collar increases the pole stiffness at the connection, improving fatigue performance and reducing the effect of base plate stiffness and number of anchor bolts.
c. Stool connection externally stiffens the connection and reduces effect of base plate stiffness.
4. Galvanizing
a. Early mast arm evaluations indicated a reduction in fatigue strength (Koenigs 2003); the present research did not show an effect.
b. Toe cracks formed during galvanizing reduced fatigue on large high-mast specimens.
i. Toe cracking was found in high-mast poles fabricated by different producers and galvanized by different galvanizers.
ii. Appears to be a function of relative temperature of shaft and base plate during immersion in the zinc bath, which is thought to be dependent upon the relative thickness or mass of the base plate and shaft, among other variables.
iii. Test poles after galvanizing using ultrasonic testing and repair any cracks found. The cracks’ indications after galvanizing were consistent with the cracks found during destructive examination. However, the crack size reported in the ultrasonic inspection often underestimated the total length of the crack. Magnetic particle inspection was not able to detect the toe cracks (Pool 2010).
132
8.2 Fabrication and Erection Recommendations
8.2.1 Fabrication Recommendations
The research revealed some fabrication problems peculiar to this type of structure.
8.2.1.1 Backing Bars
One problem occurs when a backing bar is used to make a full penetration weld from the outside of the pole. At the end of the backing bar away from the weld an open joint is formed. This joint will trap the pickling solution used to clean the pole before galvanizing and due to its limited opening will not be galvanized in the interface between the pole and the backing bar. This can result in future corrosion when the water drains into the open joint leading to hidden corrosion starting on the inside of the pole. In a high-mast tower water will drain down the inside and directly into the joint. On horizontal mast arms the exposure to water is much less.
Two solutions have been proposed. One solution is to use a silicone caulk after galvanizing to prevent water ingress into the joint. This approach has been used successfully in Wyoming. The second approach is to seal weld the top backing bar using a fillet weld. This weld is difficult to make inside a small mast arm and very difficult after the base plate is fitted due to the small opening in the base plate, usually 2 to 4 in. less than the mast arm. The poor quality of the seal weld can cause fatigue cracks to form internally in the arm. Similarly, tack welds used to hold the backing bar in place at this location can also jeopardize the fatigue strength of the connection. If welding is properly done, the backing bar acts as an internal collar reducing the stress at the weld toe and increasing fatigue performance. Recommendations:
1. It is recommended, due to the limited welder access, that welding of the end of backing bars not be allowed on signal mast arm structures. No seal or tack weld should be allowed. The backing bar should be caulked after galvanizing.
2. Backing bars used on high-mast structures should be fillet welded to seal the joint before galvanizing. The weld should be detailed as a fillet weld, not as seal weld, to ensure adequacy of the workmanship.
3. The full penetration weld detail used in Texas is another alternative to the backing bar weld. An inside fillet weld between the pole and base plate is used to seal the root of the weld. The outside is then beveled and the full penetration weld is made from the outside. This detail eliminates the potential for corrosion from the ungalvanized interface between the pole and backing bar. However, this detail can be used only on high-mast light tower bases because welder access into the inside is required.
8.2.1.2 Base Plate Center Hole on High-mast Lighting Poles
The base plate of the round structures forms an annulus with an outer diameter as required for the anchor bolts connecting the base plate to the foundation and the inside center hole, which can be equal to the pole diameter for a socket connection or just large enough to vent the pole during galvanizing and allow access for the electrical wiring. If a full penetration weld is
133
used, the hole must be large enough to provide access to weld the backup bar or internal fillet if the Texas connection is used. Holes as small as 12-in. diameter were used in this research with no apparent problems. The analytical results indicated that the effect of hole diameter diminishes as the hole is made smaller. It is recommended that the center hole have an inside diameter of 12 in. or half the nominal diameter of the pole, whichever is larger. This size hole will provide increased fatigue resistance and should be large enough for the welder to make the inside welds on the joint.
8.2.1.3 Profile of Base Plate Weld and External Collar Weld
All of the evaluations of end plate connections have shown that a weld with unequal legs should be used to reduce the stress at the weld toe. The AASHTO requirement of a 30° angle is adequate and should be applied to fillet and the reinforcement of full penetration welds connecting the shaft and or collar to the base plate. In addition, the same unequal leg weld geometry should be used to attach the end of an external collar to the shaft. The use of an equal leg fillet weld on the collar to shaft weld produced poor fatigue performance.
8.2.1.4 Ultrasonic Inspection of Welds after Galvanizing
Ultrasonic inspection after galvanizing of the base plate to shaft weld should be specified to prevent structures with pre-existing cracks from entering service. This appears to be primarily a problem with high-mast light structures. These shallow cracks can be easily repaired without jeopardizing the performance of the structure. Specialized ultrasonic testing procedures using small transducers must be employed. Most manufacturers have developed procedures because this type of testing is normally required for poles used in the power industry.
8.2.2 Erection Recommendations
8.2.2.1 Mast Arm to Pole End Plate Connection
The welding of the mast arm to the end plate may cause the end plate to warp. The mating plate on the pole may also be warped. It is impossible to flatten these plates using the connection bolts; this approach results in a gap at the joint and limited contact between the plates. The uneven seating of the two plates can cause an unequal distribution of forces among the bolts and in the weld connecting the end plate to the mast arm. It is recommended that galvanized washers on the bolts be used between the two plates. The washer ensures contact under the bolt head, which will produce a symmetric distribution of the forces. All of the mast arm test specimens used a washer on the bolt between the end plate and connecting box structure. The washer will ensure the connection behaves in a manner similar to the tests and eliminates the concerns about warping of the end plates.
8.2.2.2 Anchor Bolts on High-mast Towers
Both the experimental and analytical results showed that increasing the number of anchor bolts on simple connections such as the socket and full penetration welds increases the fatigue performance of the connection. It is important that the anchor bolts are installed correctly to ensure they participate in transmitting the forces from the base plate to the foundation. A loose anchor bolt increases the stress at the weld toe, reducing fatigue performance and resulting in the connection performing as a connection with fewer bolts. It is imperative that the leveling nuts be
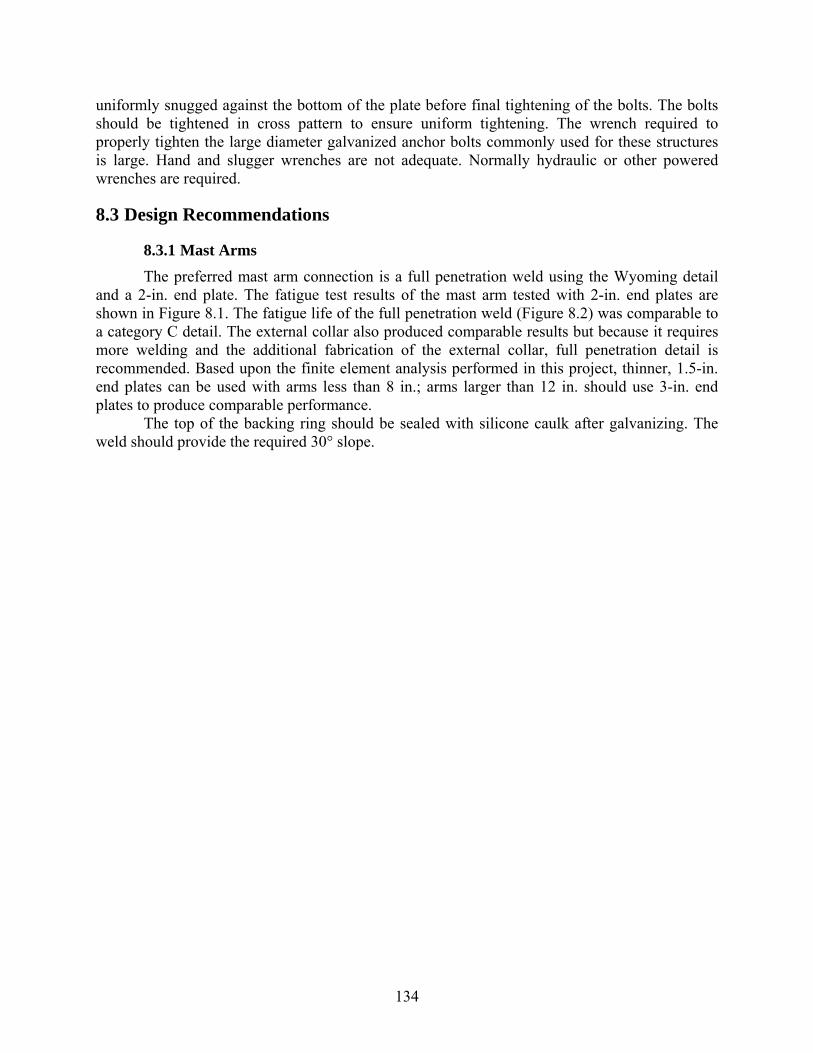
134
uniformly snugged against the bottom of the plate before final tightening of the bolts. The bolts should be tightened in cross pattern to ensure uniform tightening. The wrench required to properly tighten the large diameter galvanized anchor bolts commonly used for these structures is large. Hand and slugger wrenches are not adequate. Normally hydraulic or other powered wrenches are required.
8.3 Design Recommendations
8.3.1 Mast Arms
The preferred mast arm connection is a full penetration weld using the Wyoming detail and a 2-in. end plate. The fatigue test results of the mast arm tested with 2-in. end plates are shown in Figure 8.1. The fatigue life of the full penetration weld (Figure 8.2) was comparable to a category C detail. The external collar also produced comparable results but because it requires more welding and the additional fabrication of the external collar, full penetration detail is recommended. Based upon the finite element analysis performed in this project, thinner, 1.5-in. end plates can be used with arms less than 8 in.; arms larger than 12 in. should use 3-in. end plates to produce comparable performance.
The top of the backing ring should be sealed with silicone caulk after galvanizing. The weld should provide the required 30° slope.
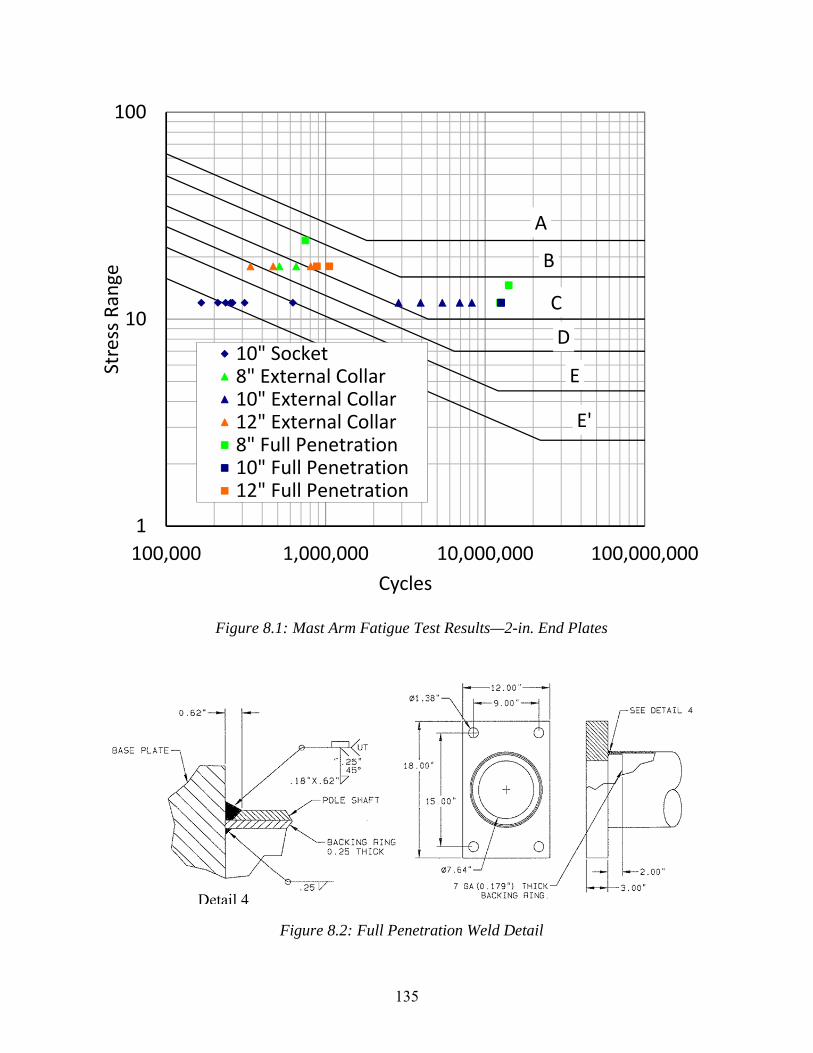
135
Figure 8.1: Mast Arm Fatigue Test Results—2-in. End Plates
Figure 8.2: Full Penetration Weld Detail
A
B
C
D
E
E'
1
10
100
100,000 1,000,000 10,000,000 100,000,000
Stress Range
Cycles
10" Socket8" External Collar10" External Collar12" External Collar8" Full Penetration10" Full Penetration12" Full Penetration
Detail 4
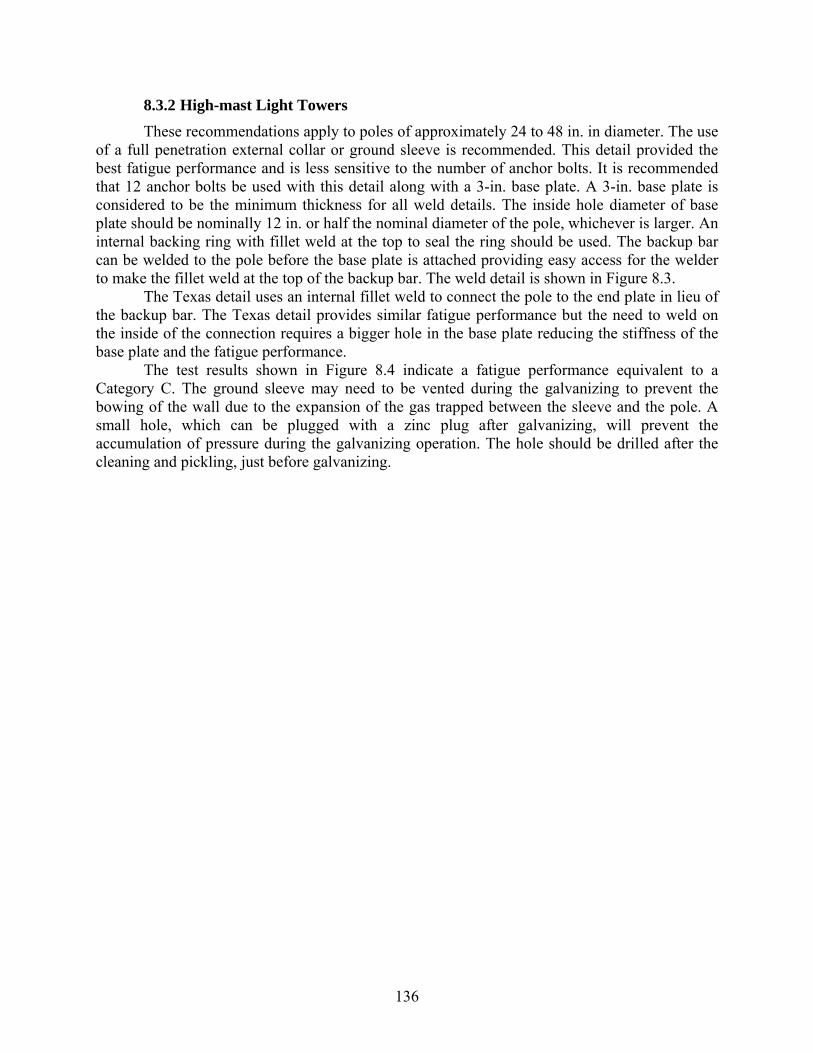
136
8.3.2 High-mast Light Towers
These recommendations apply to poles of approximately 24 to 48 in. in diameter. The use of a full penetration external collar or ground sleeve is recommended. This detail provided the best fatigue performance and is less sensitive to the number of anchor bolts. It is recommended that 12 anchor bolts be used with this detail along with a 3-in. base plate. A 3-in. base plate is considered to be the minimum thickness for all weld details. The inside hole diameter of base plate should be nominally 12 in. or half the nominal diameter of the pole, whichever is larger. An internal backing ring with fillet weld at the top to seal the ring should be used. The backup bar can be welded to the pole before the base plate is attached providing easy access for the welder to make the fillet weld at the top of the backup bar. The weld detail is shown in Figure 8.3.
The Texas detail uses an internal fillet weld to connect the pole to the end plate in lieu of the backup bar. The Texas detail provides similar fatigue performance but the need to weld on the inside of the connection requires a bigger hole in the base plate reducing the stiffness of the base plate and the fatigue performance.
The test results shown in Figure 8.4 indicate a fatigue performance equivalent to a Category C. The ground sleeve may need to be vented during the galvanizing to prevent the bowing of the wall due to the expansion of the gas trapped between the sleeve and the pole. A small hole, which can be plugged with a zinc plug after galvanizing, will prevent the accumulation of pressure during the galvanizing operation. The hole should be drilled after the cleaning and pickling, just before galvanizing.
137
Figure 8.3: External Sleeve Detail
Ø1.87"Base Plate I.D. = 12.5"
Ø30.00"
Ø36.00"3.00"
See Detail
SleeveThickness=0.375"
0.88" 0.38"
7/8" x 3/8"
.25" 30° 11/16"
x 3/8"
0.25" 0.25" ThickBackingRing
0.69"
.38"
0.25"
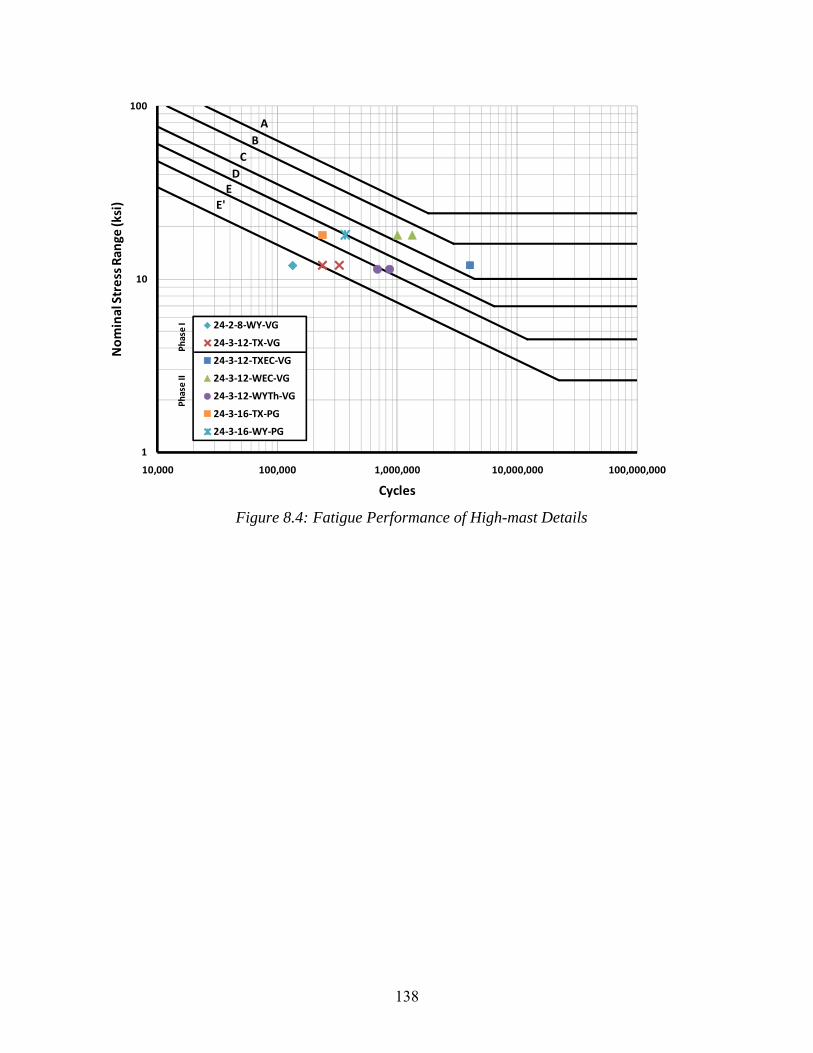
138
Figure 8.4: Fatigue Performance of High-mast Details
A
B
C
DE
E'
1
10
100
10,000 100,000 1,000,000 10,000,000 100,000,000
Nominal Stress Ran
ge (ksi)
Cycles
24‐2‐8‐WY‐VG
24‐3‐12‐TX‐VG
24‐3‐12‐TXEC‐VG
24‐3‐12‐WEC‐VG
24‐3‐12‐WYTh‐VG
24‐3‐16‐TX‐PG
24‐3‐16‐WY‐PG
Phase I
Phase II
139
References
1. Aichinger, R., Higgins, W., Toe Cracks in Base Plate Welds – 30 Years Later. Valmont Industries, Nebraska, 2006.
2. American Association of State Highway and Transportation Officials, AASHTO Standard Specifications for Structural Supports for Highway Signs, Luminaires and Traffic Signals. Fourth Edition, AASHTO, Washington, D.C., 2001.
3. Anderson, T.H., Fatigue Life Investigation of Traffic Mast-Arm Connection Details. M.S. Thesis, Department of Civil Engineering, The University of Texas at Austin, August 2007.
4. American Welding Society, AWS D1.1/D1.1M:2008 An American National Standard: Structural Welding Code – Steel. Twenty First Edition, AWS, Miami, Florida, June 2008.
5. Det Norske Veritas (DNV), Fatigue Design of Offshore Steel Structures. Recommended Practice, DNV-RP-C203, April 2008.
6. Dong, P., A structural stress definition and numerical implementation for fatigue analysis of welded joints. International Journal of Fatigue 23 (2001), pp. 865-876, June 2001.
7. Duraisamy, R., Finite Element Study of Mast Arm Socket Welded Connections. M.S. Thesis, Department of Civil Engineering, The University of Texas at Austin, December 2005.
8. Getting Started with ABAQUS. Version 6.6, Rising Sun Mills, Providence, RI, 2006.
9. High-mast Illumination Poles. Standard Plans, Texas Department of Transportation (TXDOT), August 1995.
10. Pool, C.S., Effect of Galvanization on the Fatigue Strength of High-mast Illumination Poles, M.S. Thesis, Department of Civil Engineering, The University of Texas at Austin, May 2010.
11. Kinstler, T.J., Current Knowledge of the Cracking of Steels During Galvanizing. GalvaScience LLC, Springfield, Alabama, 2006.
12. Koenigs, et al., Fatigue Resistance of Traffic Signal Mast-Arm Connections. Texas Department of Transportation, Technical Report 4178-2, Center for Transportation Research, August 2003.
13. Ocel, J.M., The Behavior of Thin Hollow Structural Section (HSS) to Plate Connections. Dissertation, The Department of Civil Engineering, The University of Minnesota, October, 2006.
14. Richman, N.B., Fatigue Life Investigation of High Performance Mast Arm Base Plate Connections. M.S. Thesis, Department of Civil Engineering, The University of Texas at Austin, May 2009.
15. Rios, C.A., Fatigue Performance of Multi-Sided High-Mast Lighting Towers. M.S. Thesis, Department of Civil Engineering, The University of Texas at Austin, May 2007.
16. Stam, A.P., Fatigue Performance of Base Plate Connections Used in High-mast Lighting Towers. M.S. Thesis, Department of Civil Engineering, The University of Texas at Austin, May 2009.

140
17. Warpinski, M.K., The Effect of Base Connection Geometry on the Fatigue Performance of Welded Socket Connections in Multi-sided High-mast Lighting Towers. M.S. Thesis, Department of Civil Engineering, Lehigh University, May 2006.
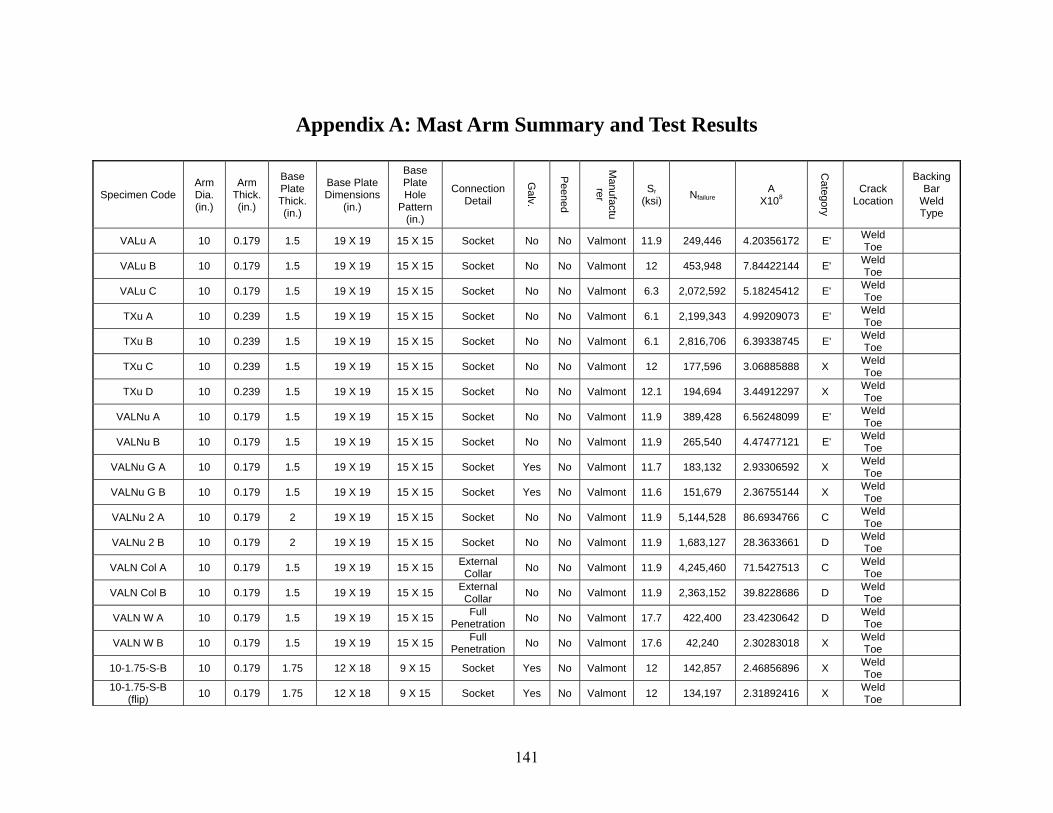
141
Appendix A: Mast Arm Summary and Test Results
Specimen Code Arm Dia. (in.)
Arm Thick. (in.)
Base Plate Thick. (in.)
Base Plate Dimensions
(in.)
Base Plate Hole
Pattern (in.)
Connection Detail
Galv.
Peened
Manufactu
rer
Sr
(ksi) Nfailure
A X108
Category
Crack Location
Backing Bar
Weld Type
VALu A 10 0.179 1.5 19 X 19 15 X 15 Socket No No Valmont 11.9 249,446 4.20356172 E' Weld Toe
VALu B 10 0.179 1.5 19 X 19 15 X 15 Socket No No Valmont 12 453,948 7.84422144 E' Weld Toe
VALu C 10 0.179 1.5 19 X 19 15 X 15 Socket No No Valmont 6.3 2,072,592 5.18245412 E' Weld Toe
TXu A 10 0.239 1.5 19 X 19 15 X 15 Socket No No Valmont 6.1 2,199,343 4.99209073 E' Weld Toe
TXu B 10 0.239 1.5 19 X 19 15 X 15 Socket No No Valmont 6.1 2,816,706 6.39338745 E' Weld Toe
TXu C 10 0.239 1.5 19 X 19 15 X 15 Socket No No Valmont 12 177,596 3.06885888 X Weld Toe
TXu D 10 0.239 1.5 19 X 19 15 X 15 Socket No No Valmont 12.1 194,694 3.44912297 X Weld Toe
VALNu A 10 0.179 1.5 19 X 19 15 X 15 Socket No No Valmont 11.9 389,428 6.56248099 E' Weld Toe
VALNu B 10 0.179 1.5 19 X 19 15 X 15 Socket No No Valmont 11.9 265,540 4.47477121 E' Weld Toe
VALNu G A 10 0.179 1.5 19 X 19 15 X 15 Socket Yes No Valmont 11.7 183,132 2.93306592 X Weld Toe
VALNu G B 10 0.179 1.5 19 X 19 15 X 15 Socket Yes No Valmont 11.6 151,679 2.36755144 X Weld Toe
VALNu 2 A 10 0.179 2 19 X 19 15 X 15 Socket No No Valmont 11.9 5,144,528 86.6934766 C Weld Toe
VALNu 2 B 10 0.179 2 19 X 19 15 X 15 Socket No No Valmont 11.9 1,683,127 28.3633661 D Weld Toe
VALN Col A 10 0.179 1.5 19 X 19 15 X 15 External Collar
No No Valmont 11.9 4,245,460 71.5427513 C Weld Toe
VALN Col B 10 0.179 1.5 19 X 19 15 X 15 External Collar
No No Valmont 11.9 2,363,152 39.8228686 D Weld Toe
VALN W A 10 0.179 1.5 19 X 19 15 X 15 Full
Penetration No No Valmont 17.7 422,400 23.4230642 D
Weld Toe
VALN W B 10 0.179 1.5 19 X 19 15 X 15 Full
Penetration No No Valmont 17.6 42,240 2.30283018 X
Weld Toe
10-1.75-S-B 10 0.179 1.75 12 X 18 9 X 15 Socket Yes No Valmont 12 142,857 2.46856896 X Weld Toe
10-1.75-S-B (flip)
10 0.179 1.75 12 X 18 9 X 15 Socket Yes No Valmont 12 134,197 2.31892416 X Weld Toe
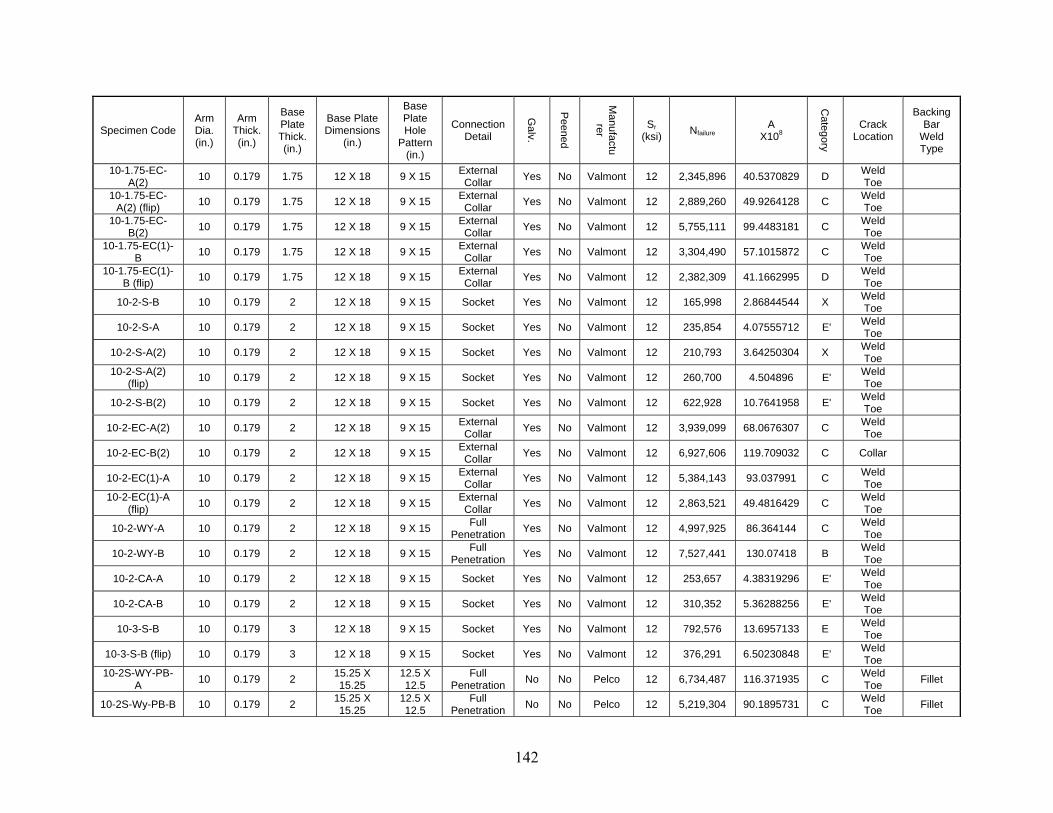
142
Specimen Code Arm Dia. (in.)
Arm Thick. (in.)
Base Plate Thick. (in.)
Base Plate Dimensions
(in.)
Base Plate Hole
Pattern (in.)
Connection Detail
Galv.
Peened
Manufactu
rer
Sr
(ksi) Nfailure
A X108
Category
Crack Location
Backing Bar
Weld Type
10-1.75-EC-A(2)
10 0.179 1.75 12 X 18 9 X 15 External Collar
Yes No Valmont 12 2,345,896 40.5370829 D Weld Toe
10-1.75-EC-A(2) (flip)
10 0.179 1.75 12 X 18 9 X 15 External Collar
Yes No Valmont 12 2,889,260 49.9264128 C Weld Toe
10-1.75-EC-B(2)
10 0.179 1.75 12 X 18 9 X 15 External Collar
Yes No Valmont 12 5,755,111 99.4483181 C Weld Toe
10-1.75-EC(1)-B
10 0.179 1.75 12 X 18 9 X 15 External Collar
Yes No Valmont 12 3,304,490 57.1015872 C Weld Toe
10-1.75-EC(1)-B (flip)
10 0.179 1.75 12 X 18 9 X 15 External Collar
Yes No Valmont 12 2,382,309 41.1662995 D Weld Toe
10-2-S-B 10 0.179 2 12 X 18 9 X 15 Socket Yes No Valmont 12 165,998 2.86844544 X Weld Toe
10-2-S-A 10 0.179 2 12 X 18 9 X 15 Socket Yes No Valmont 12 235,854 4.07555712 E' Weld Toe
10-2-S-A(2) 10 0.179 2 12 X 18 9 X 15 Socket Yes No Valmont 12 210,793 3.64250304 X Weld Toe
10-2-S-A(2) (flip)
10 0.179 2 12 X 18 9 X 15 Socket Yes No Valmont 12 260,700 4.504896 E' Weld Toe
10-2-S-B(2) 10 0.179 2 12 X 18 9 X 15 Socket Yes No Valmont 12 622,928 10.7641958 E' Weld Toe
10-2-EC-A(2) 10 0.179 2 12 X 18 9 X 15 External Collar
Yes No Valmont 12 3,939,099 68.0676307 C Weld Toe
10-2-EC-B(2) 10 0.179 2 12 X 18 9 X 15 External Collar
Yes No Valmont 12 6,927,606 119.709032 C Collar
10-2-EC(1)-A 10 0.179 2 12 X 18 9 X 15 External Collar
Yes No Valmont 12 5,384,143 93.037991 C Weld Toe
10-2-EC(1)-A (flip)
10 0.179 2 12 X 18 9 X 15 External Collar
Yes No Valmont 12 2,863,521 49.4816429 C Weld Toe
10-2-WY-A 10 0.179 2 12 X 18 9 X 15 Full
Penetration Yes No Valmont 12 4,997,925 86.364144 C
Weld Toe
10-2-WY-B 10 0.179 2 12 X 18 9 X 15 Full
Penetration Yes No Valmont 12 7,527,441 130.07418 B
Weld Toe
10-2-CA-A 10 0.179 2 12 X 18 9 X 15 Socket Yes No Valmont 12 253,657 4.38319296 E' Weld Toe
10-2-CA-B 10 0.179 2 12 X 18 9 X 15 Socket Yes No Valmont 12 310,352 5.36288256 E' Weld Toe
10-3-S-B 10 0.179 3 12 X 18 9 X 15 Socket Yes No Valmont 12 792,576 13.6957133 E Weld Toe
10-3-S-B (flip) 10 0.179 3 12 X 18 9 X 15 Socket Yes No Valmont 12 376,291 6.50230848 E' Weld Toe
10-2S-WY-PB-A
10 0.179 2 15.25 X 15.25
12.5 X 12.5
Full Penetration
No No Pelco 12 6,734,487 116.371935 C Weld Toe
Fillet
10-2S-Wy-PB-B 10 0.179 2 15.25 X 15.25
12.5 X 12.5
Full Penetration
No No Pelco 12 5,219,304 90.1895731 C Weld Toe
Fillet
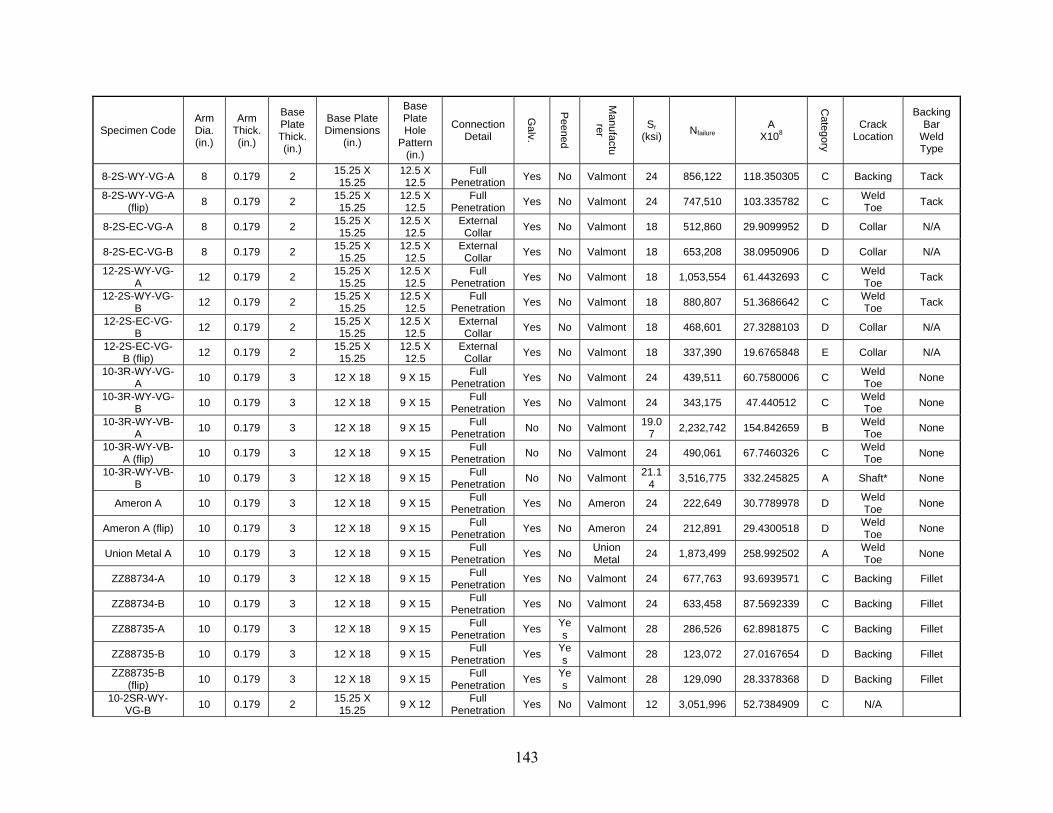
143
Specimen Code Arm Dia. (in.)
Arm Thick. (in.)
Base Plate Thick. (in.)
Base Plate Dimensions
(in.)
Base Plate Hole
Pattern (in.)
Connection Detail
Galv.
Peened
Manufactu
rer
Sr
(ksi) Nfailure
A X108
Category
Crack Location
Backing Bar
Weld Type
8-2S-WY-VG-A 8 0.179 2 15.25 X 15.25
12.5 X 12.5
Full Penetration
Yes No Valmont 24 856,122 118.350305 C Backing Tack
8-2S-WY-VG-A (flip)
8 0.179 2 15.25 X 15.25
12.5 X 12.5
Full Penetration
Yes No Valmont 24 747,510 103.335782 C Weld Toe
Tack
8-2S-EC-VG-A 8 0.179 2 15.25 X 15.25
12.5 X 12.5
External Collar
Yes No Valmont 18 512,860 29.9099952 D Collar N/A
8-2S-EC-VG-B 8 0.179 2 15.25 X 15.25
12.5 X 12.5
External Collar
Yes No Valmont 18 653,208 38.0950906 D Collar N/A
12-2S-WY-VG-A
12 0.179 2 15.25 X 15.25
12.5 X 12.5
Full Penetration
Yes No Valmont 18 1,053,554 61.4432693 C Weld Toe
Tack
12-2S-WY-VG-B
12 0.179 2 15.25 X 15.25
12.5 X 12.5
Full Penetration
Yes No Valmont 18 880,807 51.3686642 C Weld Toe
Tack
12-2S-EC-VG-B
12 0.179 2 15.25 X 15.25
12.5 X 12.5
External Collar
Yes No Valmont 18 468,601 27.3288103 D Collar N/A
12-2S-EC-VG-B (flip)
12 0.179 2 15.25 X 15.25
12.5 X 12.5
External Collar
Yes No Valmont 18 337,390 19.6765848 E Collar N/A
10-3R-WY-VG-A
10 0.179 3 12 X 18 9 X 15 Full
Penetration Yes No Valmont 24 439,511 60.7580006 C
Weld Toe
None
10-3R-WY-VG-B
10 0.179 3 12 X 18 9 X 15 Full
Penetration Yes No Valmont 24 343,175 47.440512 C
Weld Toe
None
10-3R-WY-VB-A
10 0.179 3 12 X 18 9 X 15 Full
Penetration No No Valmont
19.07
2,232,742 154.842659 B Weld Toe
None
10-3R-WY-VB-A (flip)
10 0.179 3 12 X 18 9 X 15 Full
Penetration No No Valmont 24 490,061 67.7460326 C
Weld Toe
None
10-3R-WY-VB-B
10 0.179 3 12 X 18 9 X 15 Full
Penetration No No Valmont
21.14
3,516,775 332.245825 A Shaft* None
Ameron A 10 0.179 3 12 X 18 9 X 15 Full
Penetration Yes No Ameron 24 222,649 30.7789978 D
Weld Toe
None
Ameron A (flip) 10 0.179 3 12 X 18 9 X 15 Full
Penetration Yes No Ameron 24 212,891 29.4300518 D
Weld Toe
None
Union Metal A 10 0.179 3 12 X 18 9 X 15 Full
Penetration Yes No
Union Metal
24 1,873,499 258.992502 A Weld Toe
None
ZZ88734-A 10 0.179 3 12 X 18 9 X 15 Full
Penetration Yes No Valmont 24 677,763 93.6939571 C Backing Fillet
ZZ88734-B 10 0.179 3 12 X 18 9 X 15 Full
Penetration Yes No Valmont 24 633,458 87.5692339 C Backing Fillet
ZZ88735-A 10 0.179 3 12 X 18 9 X 15 Full
Penetration Yes
Yes
Valmont 28 286,526 62.8981875 C Backing Fillet
ZZ88735-B 10 0.179 3 12 X 18 9 X 15 Full
Penetration Yes
Yes
Valmont 28 123,072 27.0167654 D Backing Fillet
ZZ88735-B (flip)
10 0.179 3 12 X 18 9 X 15 Full
Penetration Yes
Yes
Valmont 28 129,090 28.3378368 D Backing Fillet
10-2SR-WY-VG-B
10 0.179 2 15.25 X 15.25
9 X 12 Full
Penetration Yes No Valmont 12 3,051,996 52.7384909 C N/A
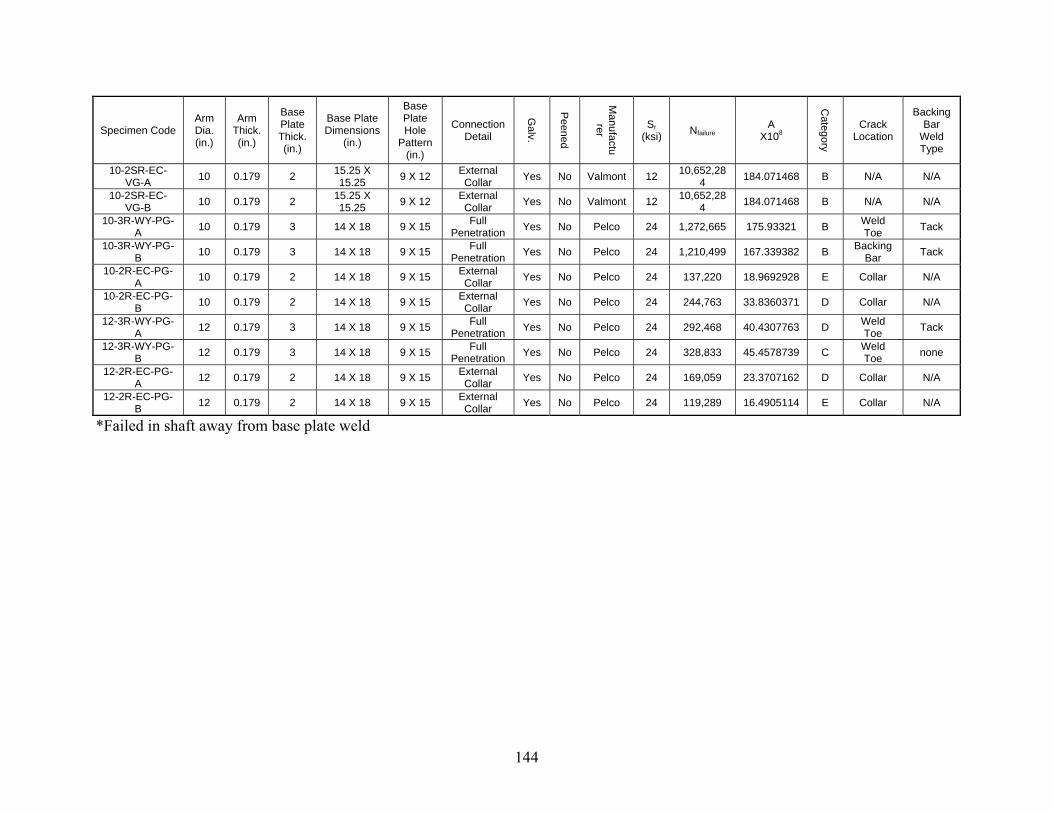
144
Specimen Code Arm Dia. (in.)
Arm Thick. (in.)
Base Plate Thick. (in.)
Base Plate Dimensions
(in.)
Base Plate Hole
Pattern (in.)
Connection Detail
Galv.
Peened
Manufactu
rer
Sr
(ksi) Nfailure
A X108
Category
Crack Location
Backing Bar
Weld Type
10-2SR-EC-VG-A
10 0.179 2 15.25 X 15.25
9 X 12 External Collar
Yes No Valmont 12 10,652,28
4 184.071468 B N/A N/A
10-2SR-EC-VG-B
10 0.179 2 15.25 X 15.25
9 X 12 External Collar
Yes No Valmont 12 10,652,28
4 184.071468 B N/A N/A
10-3R-WY-PG-A
10 0.179 3 14 X 18 9 X 15 Full
Penetration Yes No Pelco 24 1,272,665 175.93321 B
Weld Toe
Tack
10-3R-WY-PG-B
10 0.179 3 14 X 18 9 X 15 Full
Penetration Yes No Pelco 24 1,210,499 167.339382 B
Backing Bar
Tack
10-2R-EC-PG-A
10 0.179 2 14 X 18 9 X 15 External Collar
Yes No Pelco 24 137,220 18.9692928 E Collar N/A
10-2R-EC-PG-B
10 0.179 2 14 X 18 9 X 15 External Collar
Yes No Pelco 24 244,763 33.8360371 D Collar N/A
12-3R-WY-PG-A
12 0.179 3 14 X 18 9 X 15 Full
Penetration Yes No Pelco 24 292,468 40.4307763 D
Weld Toe
Tack
12-3R-WY-PG-B
12 0.179 3 14 X 18 9 X 15 Full
Penetration Yes No Pelco 24 328,833 45.4578739 C
Weld Toe
none
12-2R-EC-PG-A
12 0.179 2 14 X 18 9 X 15 External Collar
Yes No Pelco 24 169,059 23.3707162 D Collar N/A
12-2R-EC-PG-B
12 0.179 2 14 X 18 9 X 15 External Collar
Yes No Pelco 24 119,289 16.4905114 E Collar N/A
*Failed in shaft away from base plate weld
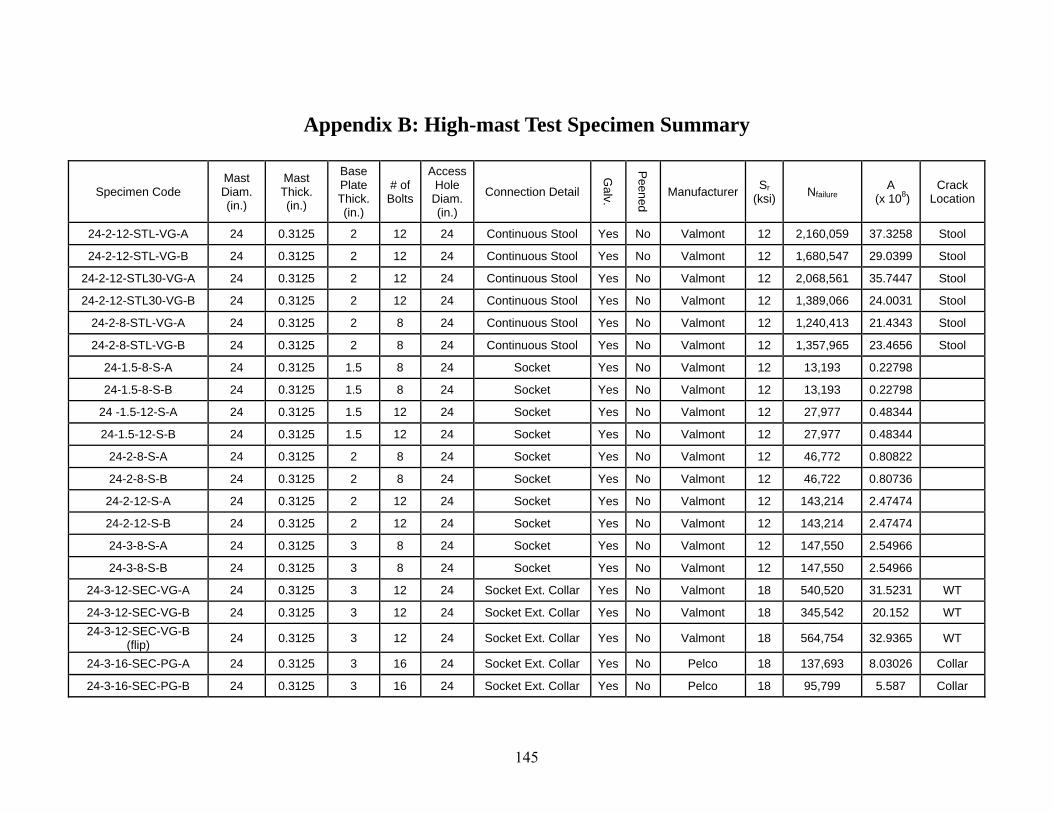
145
Appendix B: High-mast Test Specimen Summary
Specimen Code Mast Diam. (in.)
Mast Thick. (in.)
Base Plate Thick. (in.)
# of Bolts
Access Hole
Diam. (in.)
Connection Detail
Galv.
Peen
ed
ManufacturerSr
(ksi) Nfailure
A (x 108)
Crack Location
24-2-12-STL-VG-A 24 0.3125 2 12 24 Continuous Stool Yes No Valmont 12 2,160,059 37.3258 Stool
24-2-12-STL-VG-B 24 0.3125 2 12 24 Continuous Stool Yes No Valmont 12 1,680,547 29.0399 Stool
24-2-12-STL30-VG-A 24 0.3125 2 12 24 Continuous Stool Yes No Valmont 12 2,068,561 35.7447 Stool
24-2-12-STL30-VG-B 24 0.3125 2 12 24 Continuous Stool Yes No Valmont 12 1,389,066 24.0031 Stool
24-2-8-STL-VG-A 24 0.3125 2 8 24 Continuous Stool Yes No Valmont 12 1,240,413 21.4343 Stool
24-2-8-STL-VG-B 24 0.3125 2 8 24 Continuous Stool Yes No Valmont 12 1,357,965 23.4656 Stool
24-1.5-8-S-A 24 0.3125 1.5 8 24 Socket Yes No Valmont 12 13,193 0.22798
24-1.5-8-S-B 24 0.3125 1.5 8 24 Socket Yes No Valmont 12 13,193 0.22798
24 -1.5-12-S-A 24 0.3125 1.5 12 24 Socket Yes No Valmont 12 27,977 0.48344
24-1.5-12-S-B 24 0.3125 1.5 12 24 Socket Yes No Valmont 12 27,977 0.48344
24-2-8-S-A 24 0.3125 2 8 24 Socket Yes No Valmont 12 46,772 0.80822
24-2-8-S-B 24 0.3125 2 8 24 Socket Yes No Valmont 12 46,722 0.80736
24-2-12-S-A 24 0.3125 2 12 24 Socket Yes No Valmont 12 143,214 2.47474
24-2-12-S-B 24 0.3125 2 12 24 Socket Yes No Valmont 12 143,214 2.47474
24-3-8-S-A 24 0.3125 3 8 24 Socket Yes No Valmont 12 147,550 2.54966
24-3-8-S-B 24 0.3125 3 8 24 Socket Yes No Valmont 12 147,550 2.54966
24-3-12-SEC-VG-A 24 0.3125 3 12 24 Socket Ext. Collar Yes No Valmont 18 540,520 31.5231 WT
24-3-12-SEC-VG-B 24 0.3125 3 12 24 Socket Ext. Collar Yes No Valmont 18 345,542 20.152 WT
24-3-12-SEC-VG-B (flip)
24 0.3125 3 12 24 Socket Ext. Collar Yes No Valmont 18 564,754 32.9365 WT
24-3-16-SEC-PG-A 24 0.3125 3 16 24 Socket Ext. Collar Yes No Pelco 18 137,693 8.03026 Collar
24-3-16-SEC-PG-B 24 0.3125 3 16 24 Socket Ext. Collar Yes No Pelco 18 95,799 5.587 Collar
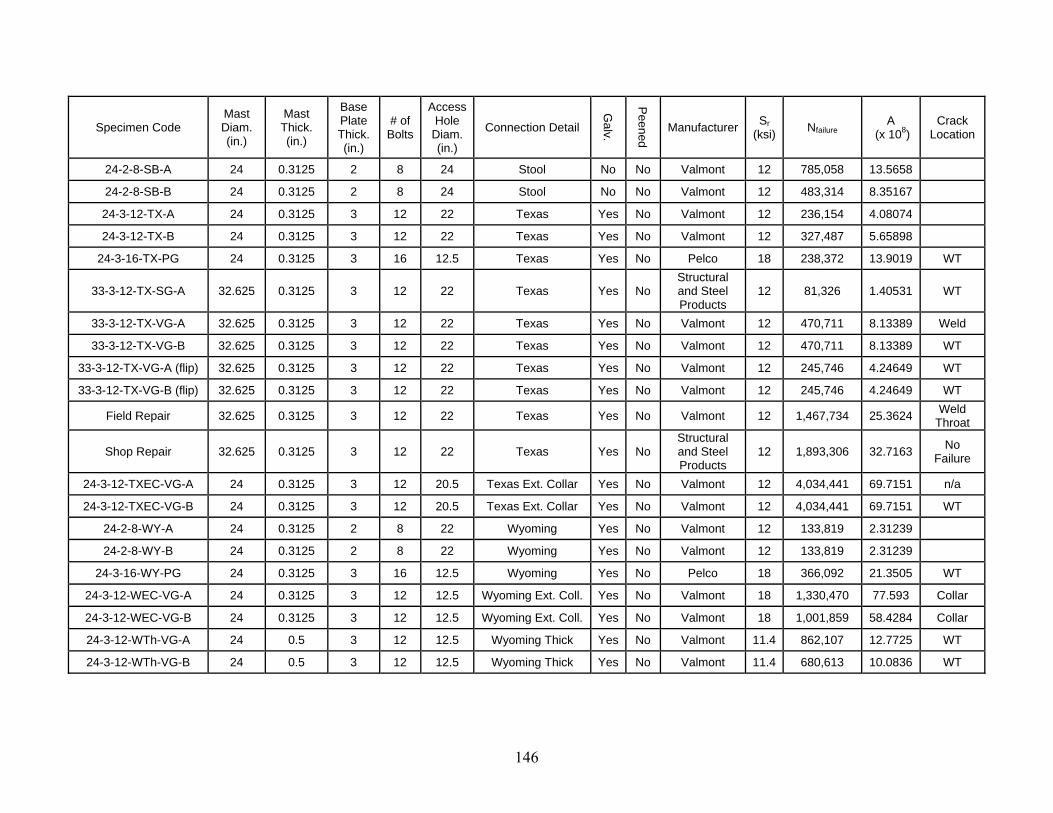
146
Specimen Code Mast Diam. (in.)
Mast Thick. (in.)
Base Plate Thick. (in.)
# of Bolts
Access Hole
Diam. (in.)
Connection Detail
Galv.
Peen
ed
ManufacturerSr
(ksi) Nfailure
A (x 108)
Crack Location
24-2-8-SB-A 24 0.3125 2 8 24 Stool No No Valmont 12 785,058 13.5658
24-2-8-SB-B 24 0.3125 2 8 24 Stool No No Valmont 12 483,314 8.35167
24-3-12-TX-A 24 0.3125 3 12 22 Texas Yes No Valmont 12 236,154 4.08074
24-3-12-TX-B 24 0.3125 3 12 22 Texas Yes No Valmont 12 327,487 5.65898
24-3-16-TX-PG 24 0.3125 3 16 12.5 Texas Yes No Pelco 18 238,372 13.9019 WT
33-3-12-TX-SG-A 32.625 0.3125 3 12 22 Texas Yes No Structural and Steel Products
12 81,326 1.40531 WT
33-3-12-TX-VG-A 32.625 0.3125 3 12 22 Texas Yes No Valmont 12 470,711 8.13389 Weld
33-3-12-TX-VG-B 32.625 0.3125 3 12 22 Texas Yes No Valmont 12 470,711 8.13389 WT
33-3-12-TX-VG-A (flip) 32.625 0.3125 3 12 22 Texas Yes No Valmont 12 245,746 4.24649 WT
33-3-12-TX-VG-B (flip) 32.625 0.3125 3 12 22 Texas Yes No Valmont 12 245,746 4.24649 WT
Field Repair 32.625 0.3125 3 12 22 Texas Yes No Valmont 12 1,467,734 25.3624 Weld
Throat
Shop Repair 32.625 0.3125 3 12 22 Texas Yes No Structural and Steel Products
12 1,893,306 32.7163 No
Failure
24-3-12-TXEC-VG-A 24 0.3125 3 12 20.5 Texas Ext. Collar Yes No Valmont 12 4,034,441 69.7151 n/a
24-3-12-TXEC-VG-B 24 0.3125 3 12 20.5 Texas Ext. Collar Yes No Valmont 12 4,034,441 69.7151 WT
24-2-8-WY-A 24 0.3125 2 8 22 Wyoming Yes No Valmont 12 133,819 2.31239
24-2-8-WY-B 24 0.3125 2 8 22 Wyoming Yes No Valmont 12 133,819 2.31239
24-3-16-WY-PG 24 0.3125 3 16 12.5 Wyoming Yes No Pelco 18 366,092 21.3505 WT
24-3-12-WEC-VG-A 24 0.3125 3 12 12.5 Wyoming Ext. Coll. Yes No Valmont 18 1,330,470 77.593 Collar
24-3-12-WEC-VG-B 24 0.3125 3 12 12.5 Wyoming Ext. Coll. Yes No Valmont 18 1,001,859 58.4284 Collar
24-3-12-WTh-VG-A 24 0.5 3 12 12.5 Wyoming Thick Yes No Valmont 11.4 862,107 12.7725 WT
24-3-12-WTh-VG-B 24 0.5 3 12 12.5 Wyoming Thick Yes No Valmont 11.4 680,613 10.0836 WT
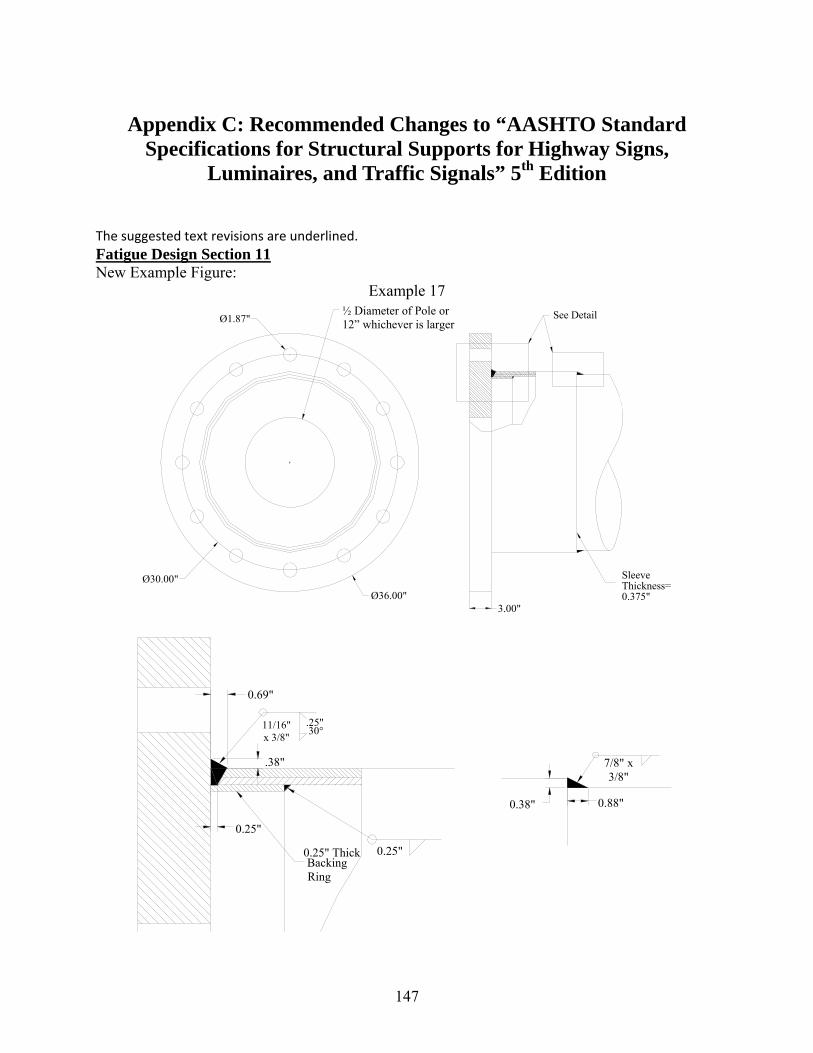
147
Appendix C: Recommended Changes to “AASHTO Standard Specifications for Structural Supports for Highway Signs,
Luminaires, and Traffic Signals” 5th Edition
The suggested text revisions are underlined.
Fatigue Design Section 11 New Example Figure:
Example 17
0.88" 0.38"
7/8" x 3/8"
.25" 30° 11/16"
x 3/8"
0.25" 0.25" ThickBackingRing
0.69"
.38"
0.25"
Ø1.87"½ Diameter of Pole or 12” whichever is larger
Ø30.00"
Ø36.00"3.00"
See Detail
SleeveThickness=0.375"
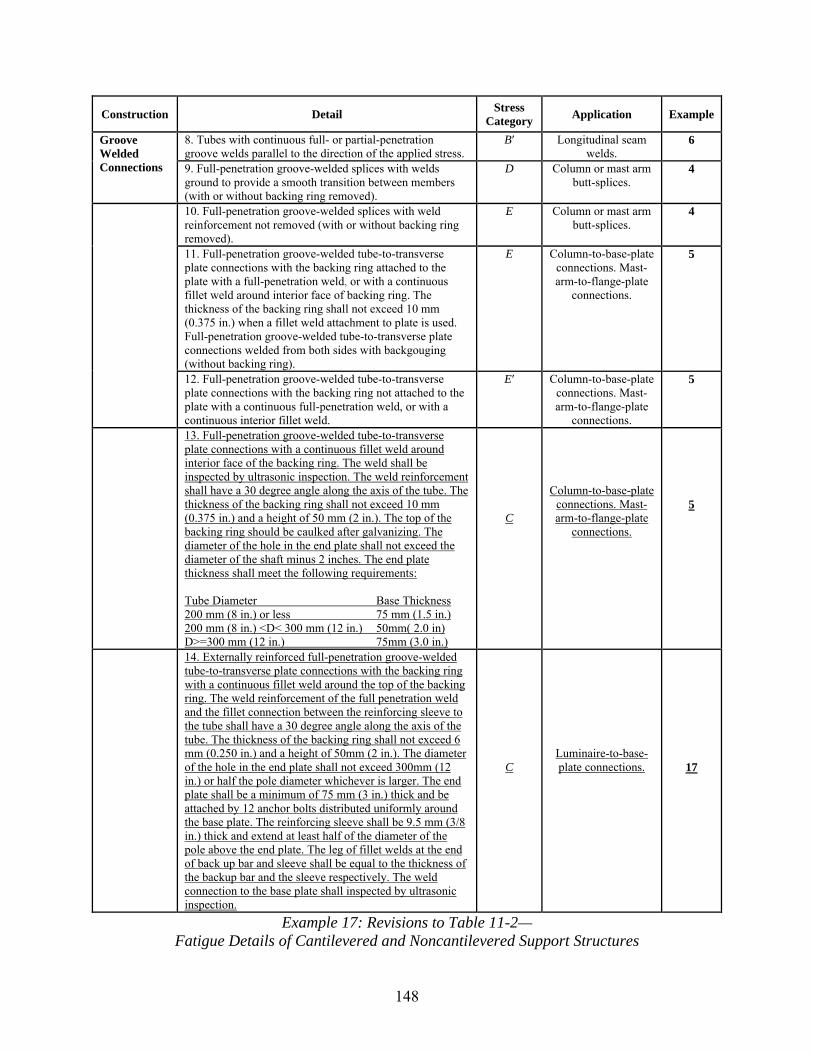
148
Construction Detail Stress
Category Application Example
Groove Welded Connections
8. Tubes with continuous full- or partial-penetration groove welds parallel to the direction of the applied stress.
B′ Longitudinal seam welds.
6
9. Full-penetration groove-welded splices with welds ground to provide a smooth transition between members (with or without backing ring removed).
D Column or mast arm butt-splices.
4
10. Full-penetration groove-welded splices with weld reinforcement not removed (with or without backing ring removed).
E Column or mast arm butt-splices.
4
11. Full-penetration groove-welded tube-to-transverse plate connections with the backing ring attached to the plate with a full-penetration weld, or with a continuous fillet weld around interior face of backing ring. The thickness of the backing ring shall not exceed 10 mm (0.375 in.) when a fillet weld attachment to plate is used. Full-penetration groove-welded tube-to-transverse plate connections welded from both sides with backgouging (without backing ring).
E Column-to-base-plate connections. Mast-arm-to-flange-plate
connections.
5
12. Full-penetration groove-welded tube-to-transverse plate connections with the backing ring not attached to the plate with a continuous full-penetration weld, or with a continuous interior fillet weld.
E′ Column-to-base-plate connections. Mast-arm-to-flange-plate
connections.
5
13. Full-penetration groove-welded tube-to-transverse plate connections with a continuous fillet weld around interior face of the backing ring. The weld shall be inspected by ultrasonic inspection. The weld reinforcement shall have a 30 degree angle along the axis of the tube. The thickness of the backing ring shall not exceed 10 mm (0.375 in.) and a height of 50 mm (2 in.). The top of the backing ring should be caulked after galvanizing. The diameter of the hole in the end plate shall not exceed the diameter of the shaft minus 2 inches. The end plate thickness shall meet the following requirements: Tube Diameter Base Thickness 200 mm (8 in.) or less 75 mm (1.5 in.) 200 mm (8 in.) <D< 300 mm (12 in.) 50mm( 2.0 in) D>=300 mm (12 in.) 75mm (3.0 in.)
C
Column-to-base-plate connections. Mast-arm-to-flange-plate
connections.
5
14. Externally reinforced full-penetration groove-welded tube-to-transverse plate connections with the backing ring with a continuous fillet weld around the top of the backing ring. The weld reinforcement of the full penetration weld and the fillet connection between the reinforcing sleeve to the tube shall have a 30 degree angle along the axis of the tube. The thickness of the backing ring shall not exceed 6 mm (0.250 in.) and a height of 50mm (2 in.). The diameter of the hole in the end plate shall not exceed 300mm (12 in.) or half the pole diameter whichever is larger. The end plate shall be a minimum of 75 mm (3 in.) thick and be attached by 12 anchor bolts distributed uniformly around the base plate. The reinforcing sleeve shall be 9.5 mm (3/8 in.) thick and extend at least half of the diameter of the pole above the end plate. The leg of fillet welds at the end of back up bar and sleeve shall be equal to the thickness of the backup bar and the sleeve respectively. The weld connection to the base plate shall inspected by ultrasonic inspection.
C
Luminaire-to-base-plate connections.
17
Example 17: Revisions to Table 11-2— Fatigue Details of Cantilevered and Noncantilevered Support Structures
149
Steel Design Section 5 5.15.3—Base Connection Welds C5.15.3 A random 25 percent of all base connection welds shall be inspected. Only one-time repair of base connection welds is allowed without written permission of the Owner. Welded support-to-base plate connections for high-level pole-type luminaire supports, overhead cantilever sign supports, overhead bridge sign supports with single-column end supports, common luminaire supports, and traffic signal supports shall be one of the following: • full-penetration groove welds, or • socket-type joint with two fillet welds. All full penetration welds classified as category C shall be ultrasonically inspected for toe cracks after galvanizing. This inspection is in addition to the volumetric inspection required after fabrication. Commentary: Cracking after galvanizing at the toe of the weld connection the shaft to the base plate has been observed. These initial cracks reduce the fatigue performance of the connection. The ultrasonic testing of the connections using a small angle beam transducer can be used to detect the shallow toe cracks. Research has shown they can be successfully repaired in the shop. 5.16—BOLTED CONNECTIONS Design of bolted connections shall be in accordance with the current Standard Specifications for Highway Bridges, except as provided for anchor bolts in Article 5.17. One galvanized hardened steel washer conforming to AASHTO M293 (ASTM F 436) at each connection bolt shall be used between the end plate of a mast arm and the mounting plate of the pole to ensure plate to plate contact is provided at each bolt. Commentary: The cutting of the plate and the welding of the mast arm to the end plate causes the plates to distort. Similar distortions occur on the mounting plate on the pole. The distortion of the plates makes it impossible to ensure uniform contact between the plates which makes it difficult to tighten the connection bolts equally. The washers ensure firm contact under the bolts connecting the plates which allows the bolts to be properly tensioned. Research has shown the washers do not reduce the fatigue strength of the connection. 5.17—ANCHOR BOLT CONNECTIONS This Article provides the minimum requirements for design of steel anchor bolts used to transmit loads from attachments into concrete supports or foundations by means of tension, bearing, and shear. A minimum of 12 anchor bolts shall be used to connect high-mast luminaires. Figure 5-1 shows a typical steel-to-concrete double-nut connection. Figure 5-2 shows a typical single-nut connection.
Commentary: The ring shaped base plate of a high-mast luminaires has low bending stiffness. The number of anchor bolts and the geometry of the base plate determine the stiffness of the base plate. Research, both fatigue tests and analytical studies, indicate using less than 12 bolts can result in a reduction in fatigue performance. The fatigue strength of the butt welded connection detail with an external collar reinforcement shown in example 17 is less sensitive to the number of anchor bolts and as few as 8 bolts can used with this detail. However, due to the field problems in properly tightening the anchor bolts, the use of 12 bolts is recommended to provide adequate anchorage stiffness.