Embed Size (px)
Citation preview
LINE EW-UAS an experimental unmanned system for coastal surveillance using ESM technology
-Eirik Skjelbreid GrimstvedtMorten AronsenEivind Bergh-NilssenFredrik GulbrandsenØistein HoelsæterBerit JahnsenMorten KlosterØyvind KureErlend LarsenKetil LundRobert MacdonaldJonas MoenJan-Rune NilssenJostein SanderTore SmestadThomas Thoresen
15/02442FFI-RAPPORT

FFI-RAPPORT 15/02442 1
LINE EW-UAS an experimental unmanned system for coastal
surveillance using ESM technology
Eirik Skjelbreid Grimstvedt Morten Aronsen
Eivind Bergh-Nilssen Fredrik Gulbrandsen
Øistein Hoelsæter Berit Jahnsen
Morten Kloster Øyvind Kure Erlend Larsen
Ketil Lund Robert Macdonald
Jonas Moen Jan-Rune Nilssen
Jostein Sander Tore Smestad
Thomas Thoresen
Norwegian Defence Research Establishment (FFI) May 09 2016

2 FFI-RAPPORT 15/02442
Keywords UAV (Unmanned Aerial Vehicle) ESM (Electronic Support Measures) Datakommunikasjon Nyttelast
FFI-rapport: FFI-RAPPORT 15/02442
Project number 505001
ISBN P: ISBN 978-82-464-2748-5 E: ISBN 978-82-464-2749-2
Approved by Berit Jahnsen, Research Manager Anders Eggen, Director
FFI-RAPPORT 15/02442 3
Summary
Drones and unmanned systems are attracting increasing interest from both military and civilian authorities alike, particularly in connection with surveillance and security technologies. An example of a use case for such an application is surveillance of maritime traffic along the coast. All vessels above a certain size are required to broadcast an Automatic Identification System (AIS) signal to identify themselves and their current position. Not everyone do this, which could be a sign of a vessel trying to pass by unnoticed. A system that verifies the existence of a ship where there is an AIS track, or localises a ship where there is no AIS track, would therefore be of great operational interest.
Electronic Support Measures (ESM) is a technology for passive collection and interpretation of electromagnetic signals, such as e.g. radar pulses. Two or more coordinated ESM sensors can use this information to geolocate the emitting radar. A ship that is deliberately faking its AIS signal is unlikely to run the risk of also turning off its navigation radar, making ESM a potential technology for the described coastal surveillance system. The passive nature of an ESM sensor also makes it well suited for deployment on Unmanned Aerial Vehicles (UAV), where battery time and payload size are important factors.
This report describes a complete system for geolocation of rotating maritime navigation radars using two UAVs equipped with ESM-sensor payloads. The payloads collect radar pulses from ships in the surrounding area and send pulse-metadata to a ground node where the information is coordinated and the results are presented in tools familiar to operational decision makers. The project has been carried out jointly between 8 different research groups from 5 different departments at the Norwegian Defence Research Establishment (FFI) and was created to highlight some of the opportunities and challenges of operating unmanned systems in an Electronic Warfare (EW) context. This has addressed a wide range of topics such as UAV operations and payload modification, 3D-printing, ESM technology, communication infrastructure, sensor networks as well as post-processing and presentation of data.
This work demonstrates that geolocation of rotating navigation radars is possible using two small, affordable ESM sensors. Examples are given of radars being tracked over time, highlighting the technologies’ potential in applications for coastal surveillance. A complete, functional data chain is also shown: from antenna to high-level presentation tool in the operation room.
4 FFI-RAPPORT 15/02442
Samandrag
Det er aukande interesse for bruk av dronar og andre ubemanna system, både frå sivilt og miltært hald. Ikkje minst gjeld dette i samband med teknologiar for overvaking og sikring. Eit eksempel på eit slikt bruksområde er overvaking av kystområde. Alle skip over ein viss storleik er pålagde å kontinuerleg sende ut eit Automatic Identification System (AIS) signal som identifiserer dei for omverda. Ikkje alle gjer dette slik dei skal, noko som kan vere ein indikasjon på at ein ynskjer å passere usett. Eit system som verifiserer at eit skip faktisk er der det hevdar i AIS signalet, eller som lokaliserer eit skip der det ikkje fins AIS spor vil derfor kunne vere av stor operativ nytte.
Electronic Support Measures (ESM) er teknologi for passiv innsamling og tolking av elektromagnetiske signal, slik som til dømes radarpulsar. To eller fleire ESM sensorar som samlar informasjon på ein koordinert måte er i stand til å geolokalisere ein radar. Eit skip som med viten og vilje forfalskar AIS signalet sitt er truleg ikkje villig til å ta risikoen forbunde med å samstundes slå av navigasjonsradaren, noko som gjer ESM-teknologi til ei mogleg løysing på problemstillinga i førre avsnitt. I og med at ESM sensorar er passive egnar dei seg også godt som nyttelaster i Unmanned Aerial Vehicles (UAV), der batteritid og storleik er viktige parameter.
Denne rapporten skildrar eit komplett system for geolokasjon av roterande maritime navigasjonsradarar ved bruk av to UAV-ar utstyrt med kvar sin ESM nyttelast. Dei to nyttelastane registrerer radarpulsar frå kringliggande skip og sender puls-metadata vidare til ein bakkenode der informasjonen vert koordinert og presentert i verktøy som er kjende for operative avgjerdstakarar. Prosjektet kom i stand som eit tverrfagleg samarbeid mellom 8 ulike forskingsgrupper frå 5 ulike avdelingar ved Forsvarets Forskningsinstitutt (FFI), og har hatt som mål å setje lys på nokre av dei mogelegheitene og utfordringane ein står ovanfor ved bruk av ubemanna system generelt og i samband med Elektronisk Krigføring (EK) operasjonar spesielt. Dette har inkludert problemstillingar knytt til operasjon av UAVar og tilpassing av nyttelaster, 3D-printing, ESM-tekniske aspekt, kommunikasjon og infrastruktur rundt dette, sensornettverk samt etterbehandling av data og presentasjon av desse.
Prosjektet demonstrerer at geolokasjon av roterande navigasjonsradarar er mogleg ved bruk av to små, rimelige ESM sensorar. Det vert vist døme på at ein gitt radar kan følgjas over tid, noko som stadfestar teknologien sitt potensial i samband med kystovervaking. Det vert også demonstrert ei fungerande, komplett datakjede: frå antenne til høgnivå presentasjonsverktøy i operasjonsrommet.
FFI-RAPPORT 15/02442 5
Content
1 Introduction 7 1.1 System and report overview 9
2 Operational use and integration of ST4658 CESMO 10 2.1 Sensor message format 10 2.2 Operational product 12 2.3 Implementation and interface with existing tactical networks 13 2.4 LINE EW-UAS as a tactical tool 14
3 Principles of geolocation by TDOA and scan phase 15 3.1 Introduction 15 3.2 Measurement principles and position uncertainty 16 3.3 Expected geolocation accuracy by two circulating UAVs 19
4 Operating the UAS 20 4.1 UAS requirements 20 4.2 The Penguin MR UAS 21 4.3 Operational aspects 24
5 The LINE EW-UAS payload 26 5.1 Introduction 26 5.2 Payload overview 27 5.3 Hardware 28 5.4 Software 37 5.5 Possible improvements to the payload 41
6 Ground node systems and software 41 6.1 Overview 41 6.2 The CESMO interface – communicating with the UAV payloads 41 6.3 Emitter geolocation software 42
7 Communications infrastructure 43 7.1 Introduction 43 7.2 Ambitions and motivation 43 7.3 The tactical domain network architecture 43 7.4 Sensor network 44 7.5 Tactical network 46

6 FFI-RAPPORT 15/02442
8 Trials and testing 47 8.1 Introduction 47 8.2 Testing the UAS at Eggemoen 47 8.3 The payload 48 8.4 Communications infrastructure and equipment 50
9 Final trial at Ørland 53 9.1 Introduction 53 9.2 The CESMO ground node 53 9.3 Establishing communications 54 9.4 Flight plan and execution 54 9.5 Results 56
10 Lessons learned 61 10.1 UAS operations 61 10.2 Communication infrastructure 67 10.3 ESM 68
11 Further work 68 11.1 Autonomy 68 11.2 Broadband Radar EW 69 11.3 Networked ESM 69 11.4 Communication infrastructure 70 11.5 LINE III 70
12 Conclusion 70
Appendix A 3D printing as enabling technology 72
Appendix B Project management 74
Appendix C Acknowledgments 77
Appendix D List of Abbreviations 78
References 82
FFI-RAPPORT 15/02442 7
1 Introduction
The use of Unmanned Airborne Systems (UAS) for long-endurance surveillance missions is of increasing operational interest, as recently highlighted in the Norwegian Strategic Defence Review of 2015 (1) (2) where such systems are suggested as an addition to the existing capacities for coastal surveillance. Monitoring a coastline the length of Norway’s is an incredibly demanding task in terms of resources, making unmanned systems an interesting technology given their potential for performing uninterrupted monitoring of relatively large areas for long periods of time.
This report is the result of FFI project 505001, LINE EW-UAS (Light Navigation-radar ESM Electronic Warfare Unmanned Airborne System). The project was initiated to demonstrate the feasibility of UAVs as payload carriers for electronic warfare operations and has been a collaborative effort between the following 8 FFI research groups: ESM, Operational EW-support, UAV, Defence Information Infrastructure (INI), Mechanical Prototyping, Communications Infrastructure, Autonomy and Maritime Surveillance. The project duration was 1 year. In this time frame a complete UAS system had to be acquired, payloads had to be constructed and a complete information flow chain had to be set up. The functional goal was to show that two ESM-sensors operating together would be able to geolocate ships by analysing the pulses emitted from nearby vessels X-band navigation radars1. To quickly cover a larger area than what is possible with ground-based systems, each of these sensors was to be carried by a UAV.
An important mechanism in maritime surveillance is the use of Automatic Identification System (AIS). This is an automatic reporting system used by ships and by Vessel Traffic Services (VTS) to identify and locate vessels by electronically exchanging data with other nearby ships and AIS base stations. The International Maritime Organization (IMO) made AIS compulsory for ships larger than 300 gross ton through the International Convention for the Safety of Life at Sea (SOLAS) in 2000, effective from 2004. However, AIS is not a fool-proof system, as the AIS transmitter can be turned off, or the information transmitted can be altered, for instance by transmitting a position that is different from the actual one.
The radar pulse data recorded in the ESM sensors were used to create a near-real-time picture (in the order of 20-30 seconds) of visible navigation radars in the area of flight. When used in conjunction with AIS data, this becomes a powerful tool for verifying AIS tracks or, ultimately, identifying those deliberately broadcasting a fake (or no) AIS signal. This leads to at least two clear advantages in that it adds an extra, redundant layer of surveillance, as well as making life harder for those vessels trying to pass by unnoticed – even these would be unlikely to turn off their navigation radar alongside their AIS, as this would pose a significant risk of collision.
1 The X-band is specified by the IEEE as covering the frequency range between 8.0 and 12.0 GHz, of which the navigation band covers 9.3 – 9.5 GHz.
8 FFI-RAPPORT 15/02442
The location of a radar can be found by looking at the intersection points of Time Difference Of Arrival (TDOA) and scan-phase curves, a technique previously demonstrated by FFI (see Chapter 3). One advantage of this approach is that it allows for near-instantaneous geolocation of an emitter using only two sensors, as opposed to TDOA-only based techniques which require at least three2.
An important goal has been to illustrate the advantages this system can provide by making use of standardised communication protocols and visualisation software that already fits directly into the operational chain of command. However, the concepts described in this work are in no way limited to military use and are equally applicable to civilian systems, even if based on a traditionally military technology such as ESM.
The ESM sensor used in this project is the LINE2, previously developed at FFI (3). This was initially chosen as it was the only FFI EW-sensor available with properties suitable for deployment on a UAS within the given time frame. The sensor forms the core of the payload together with software for processing of data, the latter being specifically developed for this project and running on a Banana Pro single-board computer. This is a low-cost, ARM-based computer suitable for rapid prototyping of lightweight software systems. An important part of the processing software is the implementation of a deinterleaver. This is a program that groups detected radar pulses believed to be emitted by the same radar. The deinterleaver chosen for this project is a third-party product called GLAMDRING, which was developed by ESROE Ltd.
The project has made extensive use of 3D printing to fabricate and adapt hardware solutions for the payload, such as fabrication of the payload frame and shielding, allowing for inexpensive, rapid manufacturing of the various components. Significant efforts regarding 3D printing of complete aircrafts and parts have also been funded as part of the project, through a student at the Faculty of Engineering and the Environment, University of Southampton.
NATO has recently ratified STANAG 4658 CESMO (Standard NATO Agreement 4658 Co-operative ESM Operations). This is a standard describing networked exchange of ESM information for geolocation purposes. There are considerable efforts being made within NATO for tests and development of CESMO, and this project has made use of the CESMO framework to communicate ESM data between sensor head and ground node. To our knowledge, this is the first use case for CESMO on an unmanned platform, and also the first time scan-phase messages are implemented in conjunction with the standard.
2 TDOA-based geolocation is possible using only two sensors, but this requires the sensors to move around for a certain period of time before a geolocation can be concluded.
FFI-RAPPORT 15/02442 9
1.1 System and report overview
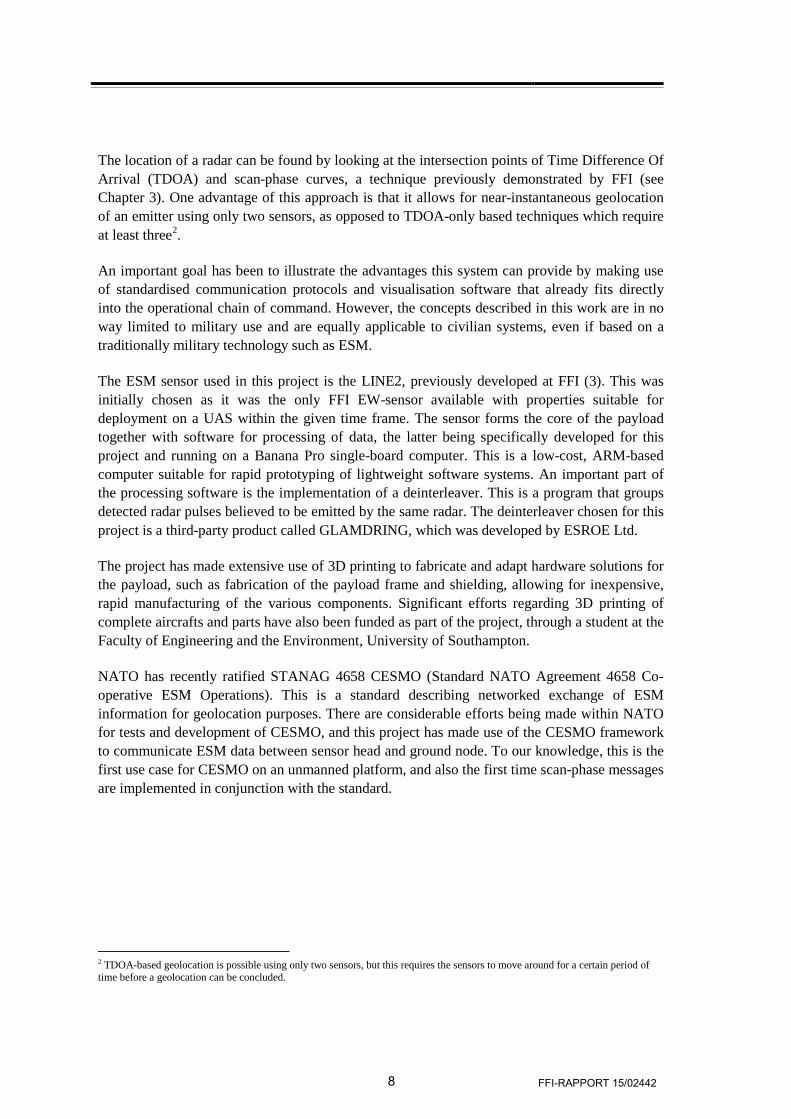
Figure 1.1 System overview.
A system overview can be seen in Figure 1.1. Data recorded in the two payloads are sent to a local ground node that runs software for handling the message exchange as well as calculating the scan-phase and TDOA geometries. Processed data are then sent to the operating room at FFI where they are visualised in a map, and the actual geolocation of emitters is performed based on the TDOA and scan-phase geometries’ intersection points. This information is then coupled with live AIS data to create the end product: a series of track-lists where each vessel’s AIS signal has been verified against the location of its navigation radar.
The various building blocks making up Figure 1.1 will be presented in this report. Chapter 2 describes the motivation for including a NATO communication standard into the system, and how this paves the way for integration into existing operational tools. Chapter 3 covers the background theory required to understand the geolocation process. Chapter 4 describes the UAS and some of the challenges related to operating an unmanned platform of the type chosen for the LINE EW-UAS system. Construction of the payload is covered in Chapter 5. This includes both the hardware and software used to process data, as well as the mechanical construction of the payload frame and the design of the on-board antennas. Chapter 6 deals with the program used to coordinate the exchange of data between the UAV payloads and the ground node. It also describes the program used to calculate the geolocation information for a given radar, based on data reported from the UAV payloads. A significant communications infrastructure had to be set up for this experiment. This is covered in Chapter 7 and describes the various network domains
10 FFI-RAPPORT 15/02442
and how communications were set up to allow for a live data stream all the way from the UAV payloads to the INI lab at FFI. Chapter 8 describes some of the extensive field testing that had to be carried out before a complete demonstration of the system could take place. Chapter 9 covers the final trial at Ørland in November 2015, along with the results. Examples are given of how the LINE EW-UAS system was able to track navigation radars over time, along with comments on system performance during this live test. Additional “lessons learned” are covered in more detail in Chapter 10. The authors see clear scope for further work and how LINE EW-UAS can be used as a basis for future projects that can span out in many different directions. Some of these ideas are summed up in Chapter 11.
2 Operational use and integration of ST4658 CESMO
2.1 Sensor message format
2.1.1 Motivation and background
The NATO air operations in the Balkans in the early 2000s revealed a clear capability gap in dealing with hostile ground-based air defense systems. The opposition deployed ageing Soviet-made surface-to-air missiles, but operated them in a competent and novel way. The consequence was that two NATO aircraft were shot down in the initial stages of operation, despite the threat having being detected by several individual sensors in the theater. Later analysis showed that had the separate information been combined, then the location of the threat could have been found and appropriate counteractions made in time.
There was an obvious need for coordinated real-time data collection from different nations’ ESM-sensor platforms in order to produce high-confidence classifications and geolocations in real time. The second step would then be to disseminate these results into tactical networks. Two obstacles had to be overcome before an operational tactic could be developed. First, an appropriate network had to be provided to coordinate and perform the data collection. Secondly, security information exchange agreements had to be signed. Meeting these two points put a number of restrictions on the network, such as fixed-length binary messages.
The network had to be compliant with level 4 of the NNEC (NATO Network Enabled Capabilities) functional ambitions. Existing tactical data links, such as Link 16, are clearly suitable to report the final classification and geolocation results, but are not able to perform coordinated data collection to the accuracy required.
FFI-RAPPORT 15/02442 11
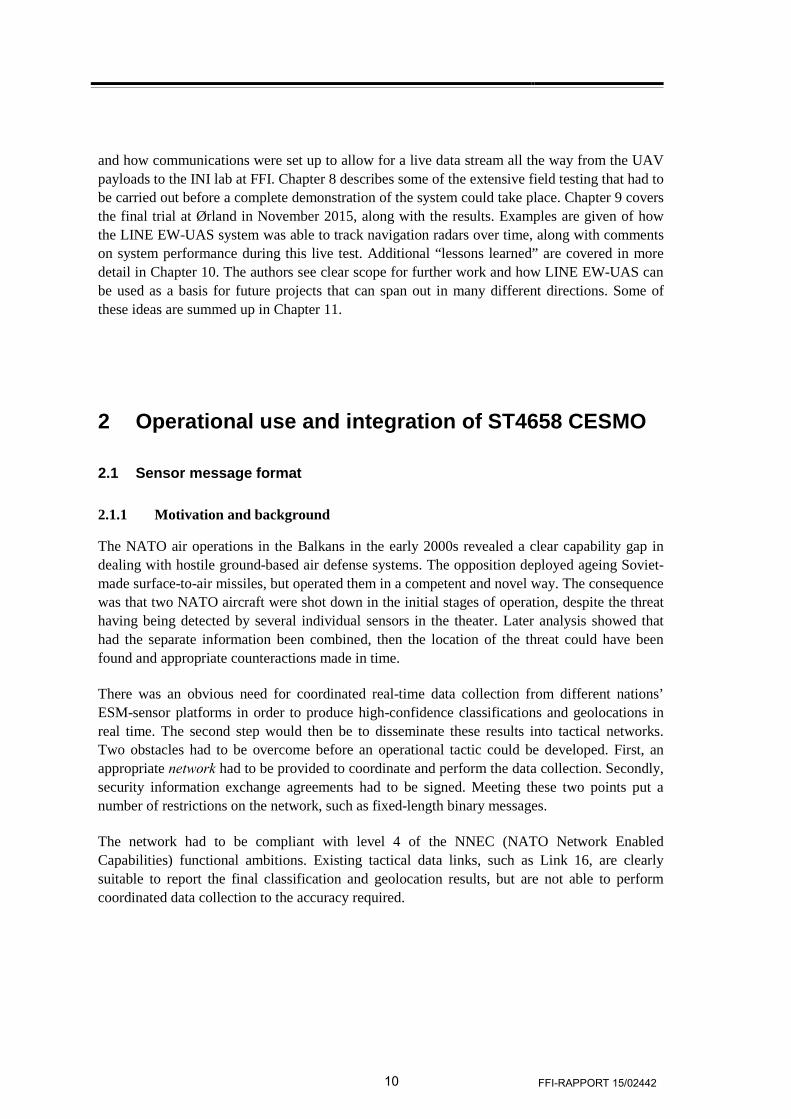
Through an initiative led by NATO SEWWG (SIGINT and Electronic Warfare Working Group), the CESMO (Co-operative ESM Operations) effort has been developed through operational trials using a technology demonstrator able to use existing radio and crypto devices already in service within NATO. See Figure 2.1Figure 3.1. These trials have run since 2006. The associated STANAG 4658 CESMO was ratified by Norway in 2013 and has currently been ratified by another 10 NATO countries (including USA and NATO itself).
2.1.2 NATO CESMO (Co-Operative ESM Operation)
Several implementations of the NATO CESMO system are in use, but they all follow the STANAG 4658 message standard, enabling interoperability. In general, most systems implement a map GIS (Geographical Information System) system, a service-oriented client/server for the CESMO interaction, and a suitable network interface for real-time radio exchange with crypto devices as appropriate.
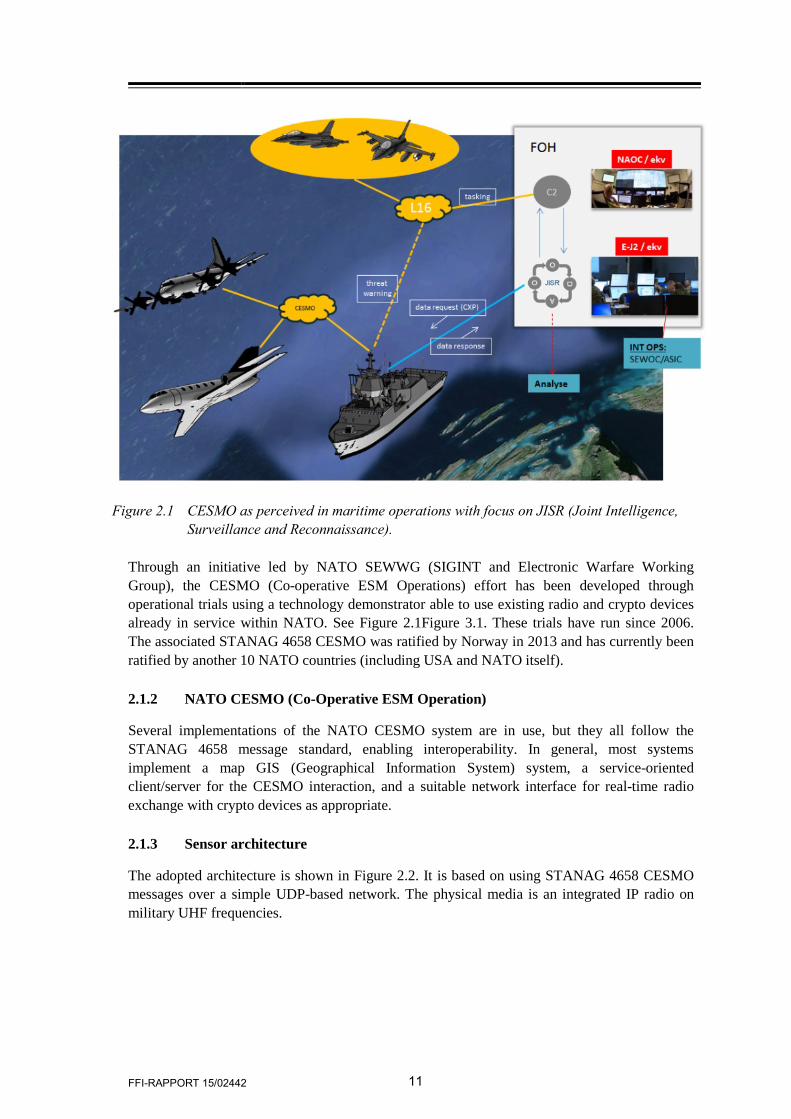
2.1.3 Sensor architecture
The adopted architecture is shown in Figure 2.2. It is based on using STANAG 4658 CESMO messages over a simple UDP-based network. The physical media is an integrated IP radio on military UHF frequencies.
Figure 2.1 CESMO as perceived in maritime operations with focus on JISR (Joint Intelligence, Surveillance and Reconnaissance).
12 FFI-RAPPORT 15/02442
Figure 2.2 Architecture.
The benefit of using STANAG 4658 is to be interoperable with real operational platforms in Norway and in NATO, which could be critical for future trials with the EW-UAS.
2.1.4 Implementation and adaptation of STANAG 4658/AEDP13
The implementation of STANAG 4658 was modified somewhat for the purpose of this experiment. Most notably this included changing the data flow to fit a system of two UAVs carrying autonomous ESM sensors. An overview is given in Section 5.4.5. The details of this scheme are beyond the scope of this report and can be found in a separate FFI publication (4). It is however envisaged that future implementations of the system will follow STANAG 4658 more rigorously, to allow for easier integration into existing operational networks.
2.2 Operational product
Commercial shipping has transit lanes along the entire Norwegian coastline. Major lanes run inshore, sheltered from weather and close to populated areas. Several government bodies manage and handle different affairs including pilot service, navigational aids and charts. The basis of the monitoring ability is the AIS transponder-based system in which merchant ships voluntarily transmit data containing their position, port of call and nationality on maritime VHF communication frequencies. A chain of AIS-receivers along the coastline maintained by the Norwegian Coastal Administration provide a near-real-time picture.
The armed forces have a responsibility to maintain control in order to ensure the safety of military installations. Foreign shipping has rights of access during peace-time according to international treaties, even within territorial waters (but not internal waters), provided they comply with the Regulation concerning the entry into and passage through Norwegian territorial waters (5). Certain restrictions apply, such as no anchoring, compulsory use of all navigational aid (including radar), no surveillance of military installations and so on. Ships are required to submit a notice 24 hours before entering national waters directly to the armed forces.
FFI-RAPPORT 15/02442 13
There is a serious concern than non-cooperating merchant ships will either fake their AIS data or turn it off completely. The AIS system itself is not designed to allow such fraudulent use, but it is technically easy to do so. This represents a capability gap on behalf of the armed forces’ ability to enforce national law. The proposed solution is to correlate the position of the merchant ship’s navigational radar to their transmitted AIS data, using multiple ESM sensors deployed on UAVs to enable volume coverage of sections of the shipping lane.
Experience shows that merchant ships seldom turn off their navigation radars, which would be a self-imposed hazard in inshore shipping lanes, especially at night and in poor visibility.
From an organisational point of view, handling the merchant shipping in peace-time is only a part of the overall armed forces’ maritime surveillance task. Maritime Surveillance is the effort to gain an effective understanding of anything associated with the maritime domain that could impact security, safety, the economy or the environment. The purpose of this is to provide political and operational decision makers the best basis to make correct and consistent decisions.
The LINE EW-UAS main operational product is a list of verified merchant ships in violation of the law. This is created by geolocating the ship by its radar, and then comparing this position with the position reported in the AIS data. This enables a far more robust maritime surveillance picture and is of huge benefit to the national ability to maintain national law in the maritime domain.
2.3 Implementation and interface with existing tactical networks
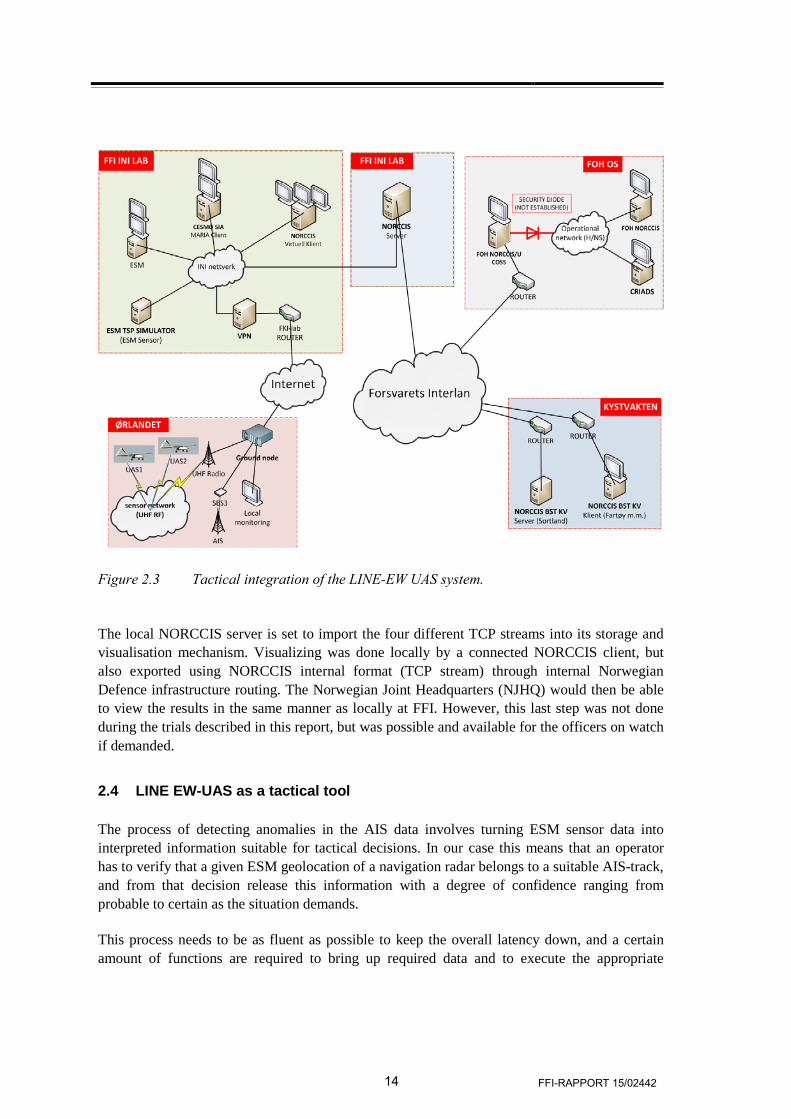
Figure 2.3 below shows an overview of how the LINE EW-UAS system integrated into existing tactical networks during the final trial at Ørland in November 2015.
Data is collected from the two UAV payloads and forwarded to the INI lab at FFI, where they are stored in a local MySQL database. This database is set up with four different tables: the AIS targets’ latest position verified with radar emitter detection, the latest UAV positions, the latest update on targets identified only by radar emitter detections, and the latest updates on targets only known by AIS information.
A Windows service reads these four database tables and converts each target into NATO Friendly Force Information (NFFI) format with the appropriate symbology code. This conversion is done to ensure compatibility with the operational systems. Each of the four tables results in a separate TCP Listener accepting TCP Client CallBacks on a given port. For a given interval (e.g. 10 seconds) the SQL query result will be written to a network stream available to the connected client(s), in this case a local NORCCIS (Norwegian Command and Control Information System) server. NORCCIS is a Norwegian Command and Control system, widely used throughout the Norwegian Defence. Using software that is recognized by operational personnel was an important part of this experiment, in order to more effectively demonstrate the operational value of our concept.
14 FFI-RAPPORT 15/02442
Figure 2.3 Tactical integration of the LINE-EW UAS system.
The local NORCCIS server is set to import the four different TCP streams into its storage and visualisation mechanism. Visualizing was done locally by a connected NORCCIS client, but also exported using NORCCIS internal format (TCP stream) through internal Norwegian Defence infrastructure routing. The Norwegian Joint Headquarters (NJHQ) would then be able to view the results in the same manner as locally at FFI. However, this last step was not done during the trials described in this report, but was possible and available for the officers on watch if demanded.
2.4 LINE EW-UAS as a tactical tool
The process of detecting anomalies in the AIS data involves turning ESM sensor data into interpreted information suitable for tactical decisions. In our case this means that an operator has to verify that a given ESM geolocation of a navigation radar belongs to a suitable AIS-track, and from that decision release this information with a degree of confidence ranging from probable to certain as the situation demands.
This process needs to be as fluent as possible to keep the overall latency down, and a certain amount of functions are required to bring up required data and to execute the appropriate
FFI-RAPPORT 15/02442 15
actions. Each detected ESM signal is stored in a database from which any current or historic ESM data relative to any given ESM-signal identification code can be visualized and presented on the GIS map system. As each signal is associated with several hundred to thousands of ESM data (scan-phase circles and TDOA hyperbolic curves), it is clear that filtering and real-time display are required.
The fusion process with the AIS is presently manual and carried out by the Signal Identification Authority (SIA) officer. This is a heavy burden, especially as ambiguity can exist where several navigational radars have very nearly the same parametric characteristics. The manual method also depends heavily on the deinterleaving process in the ESM sensor. An automatic geolocation process is required.
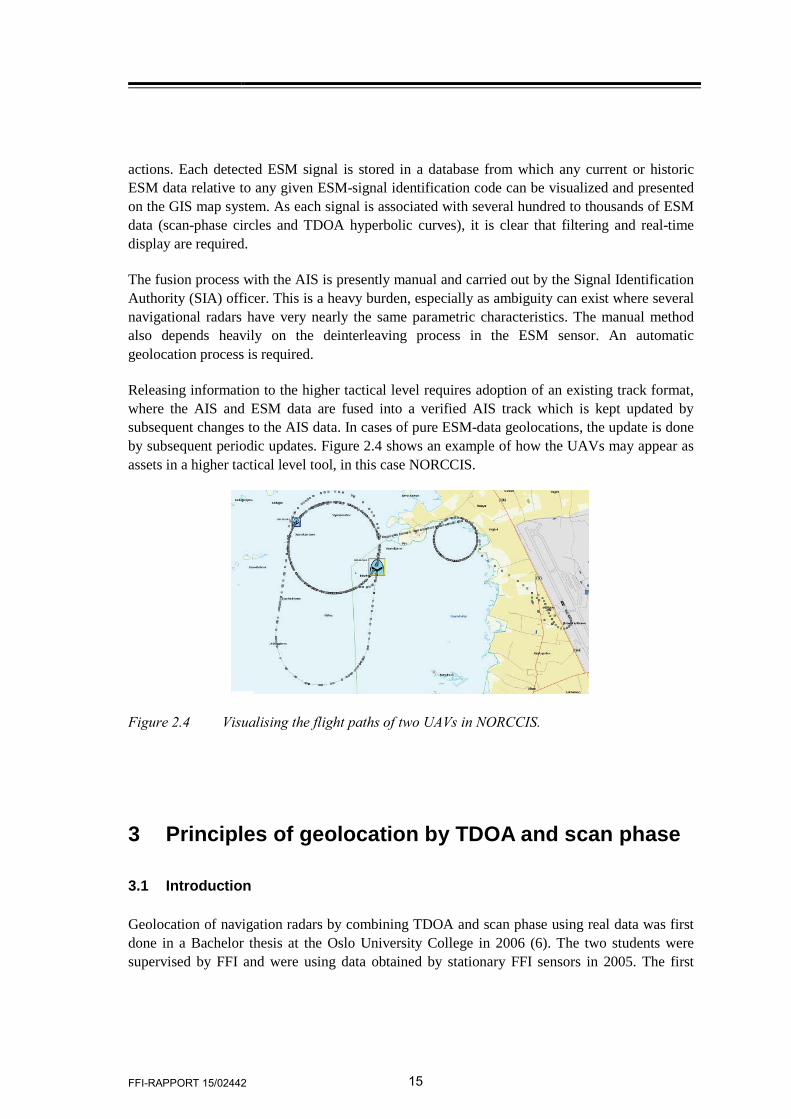
Releasing information to the higher tactical level requires adoption of an existing track format, where the AIS and ESM data are fused into a verified AIS track which is kept updated by subsequent changes to the AIS data. In cases of pure ESM-data geolocations, the update is done by subsequent periodic updates. Figure 2.4 shows an example of how the UAVs may appear as assets in a higher tactical level tool, in this case NORCCIS.
Figure 2.4 Visualising the flight paths of two UAVs in NORCCIS.
3 Principles of geolocation by TDOA and scan phase
3.1 Introduction
Geolocation of navigation radars by combining TDOA and scan phase using real data was first done in a Bachelor thesis at the Oslo University College in 2006 (6). The two students were supervised by FFI and were using data obtained by stationary FFI sensors in 2005. The first
16 FFI-RAPPORT 15/02442
(and up to now the only) live tracking of ships by TDOA and scan-phase using two LINE sensors was done during the NATO “Unified Vision 2012” trial at Ørland in June/July 2012 (7).
This chapter describes the basic measurement principles for the geolocation capability of LINE EW-UAS and the expected geolocation accuracy. Real-time geolocation of observed radars was neither done during the testing at Eggemoen in late August 2015 nor during the experiments at Ørland on November 5th. Geolocation was then done “manually” by visually inspecting the intersections of the two types of “location curves”, see description in the next section. Geolocation on the recorded data was done later and is presented in Section 9.5.
3.2 Measurement principles and position uncertainty
Two LINE sensors can, by combining their observations of received pulses from rotating radars, provide measurements of TDOA and scan phase. The latter is calculated from the time instances when the radar main lobe points to each sensor relative to the rotation period. A measured scan-phase value means there is a certain angle from the radar towards the two sensors, which in turn implies that the radar is located on a specific circular arc through the sensors. A measured TDOA value, however, implies that the radar is located on a specific hyperbola with the sensors in the focal points. Uncertainties in these measurements mean that nearby hyperbolas and circular arcs also may contain the radar. Combining the most likely hyperbola with the most likely arc determines the estimated position of the radar.
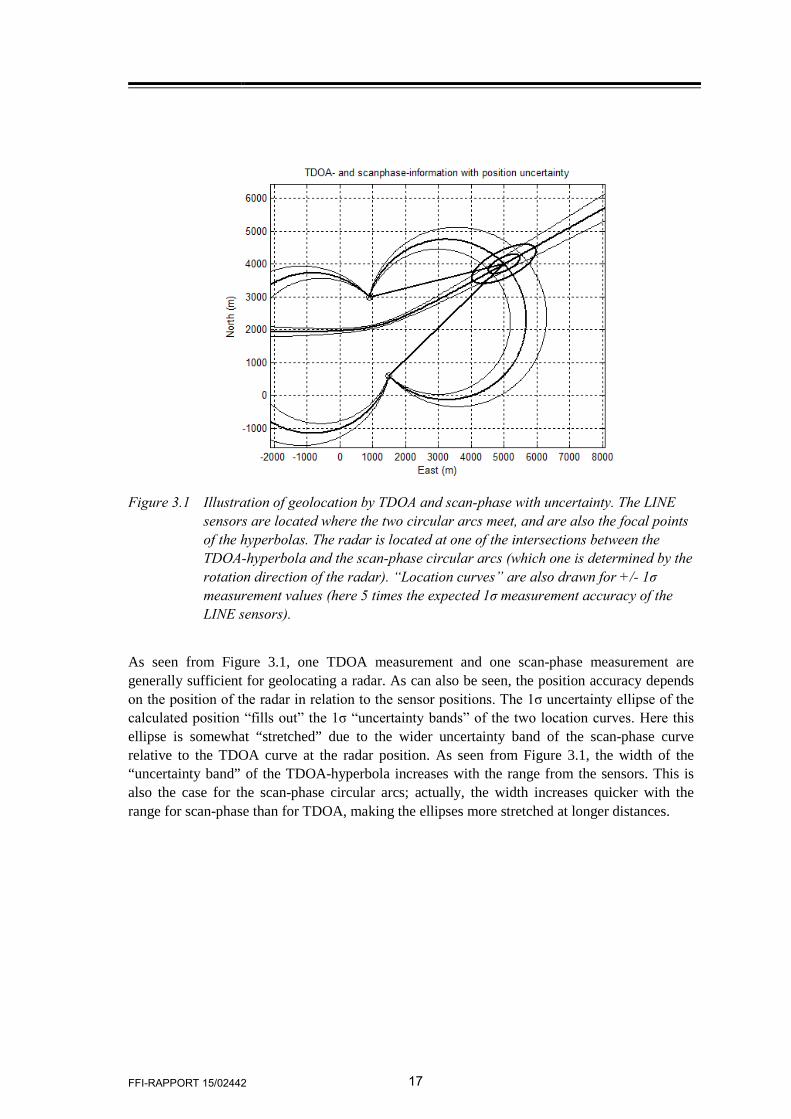
Figure 3.1 illustrates this geolocation principle by showing the two types of location curves in terms of a TDOA hyperbola and scan-phase circular-arcs. Two circular arcs are shown: one corresponding to a clockwise radar rotation and one to a counter-clockwise rotation of the radar (one has to know the rotation direction of the radar to determine which of the two is the right one). To show the position uncertainty, two additional hyperbolas and circular arcs are drawn here, each being hypothetical +/-1σ alternatives of the true ones. In Figure 3.1, the values used for each σ are actually 5x larger than the 1σ values estimated from real data. This is done for illustration purposes. The two uncertainty ellipses around the true position are 1σ- and 2σ error ellipses. The former is expected to contain 39% and the latter 87% of the estimates in case of Gaussian-distributed independent measurement errors.
FFI-RAPPORT 15/02442 17
Figure 3.1 Illustration of geolocation by TDOA and scan-phase with uncertainty. The LINE
sensors are located where the two circular arcs meet, and are also the focal points of the hyperbolas. The radar is located at one of the intersections between the TDOA-hyperbola and the scan-phase circular arcs (which one is determined by the rotation direction of the radar). “Location curves” are also drawn for +/- 1σ measurement values (here 5 times the expected 1σ measurement accuracy of the LINE sensors).
As seen from Figure 3.1, one TDOA measurement and one scan-phase measurement are generally sufficient for geolocating a radar. As can also be seen, the position accuracy depends on the position of the radar in relation to the sensor positions. The 1σ uncertainty ellipse of the calculated position “fills out” the 1σ “uncertainty bands” of the two location curves. Here this ellipse is somewhat “stretched” due to the wider uncertainty band of the scan-phase curve relative to the TDOA curve at the radar position. As seen from Figure 3.1, the width of the “uncertainty band” of the TDOA-hyperbola increases with the range from the sensors. This is also the case for the scan-phase circular arcs; actually, the width increases quicker with the range for scan-phase than for TDOA, making the ellipses more stretched at longer distances.
18 FFI-RAPPORT 15/02442
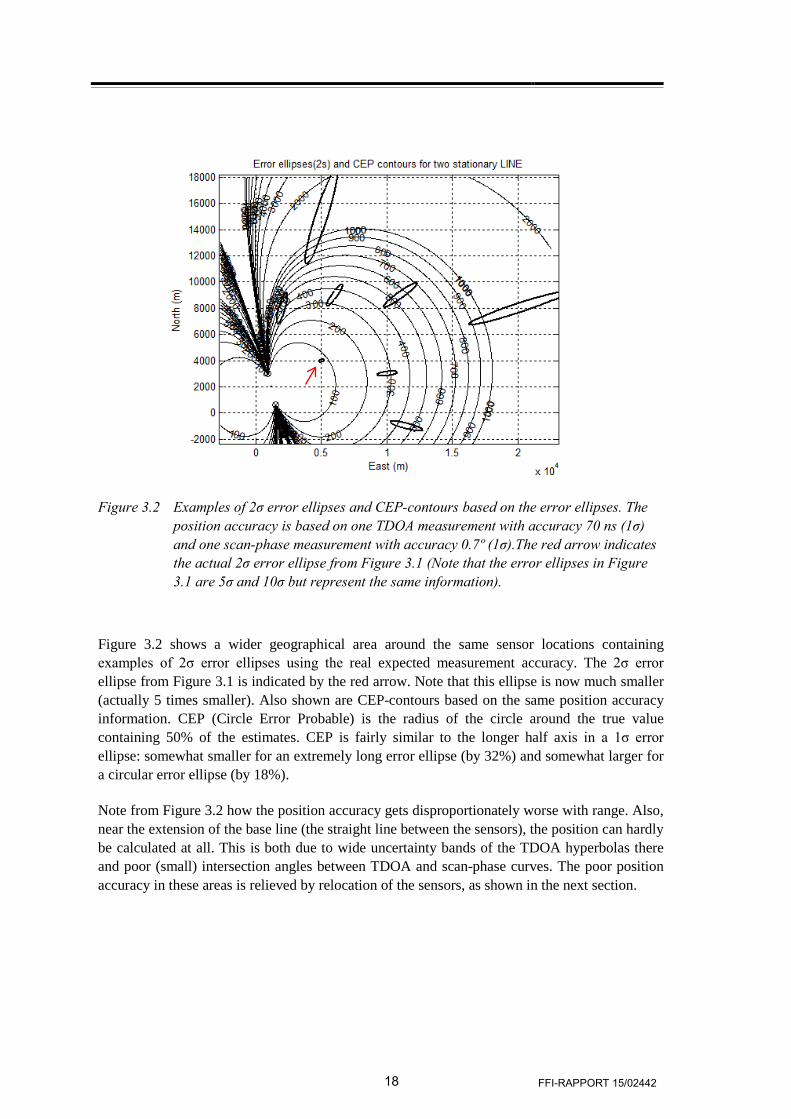
Figure 3.2 Examples of 2σ error ellipses and CEP-contours based on the error ellipses. The position accuracy is based on one TDOA measurement with accuracy 70 ns (1σ) and one scan-phase measurement with accuracy 0.7º (1σ).The red arrow indicates the actual 2σ error ellipse from Figure 3.1 (Note that the error ellipses in Figure 3.1 are 5σ and 10σ but represent the same information).
Figure 3.2 shows a wider geographical area around the same sensor locations containing examples of 2σ error ellipses using the real expected measurement accuracy. The 2σ error ellipse from Figure 3.1 is indicated by the red arrow. Note that this ellipse is now much smaller (actually 5 times smaller). Also shown are CEP-contours based on the same position accuracy information. CEP (Circle Error Probable) is the radius of the circle around the true value containing 50% of the estimates. CEP is fairly similar to the longer half axis in a 1σ error ellipse: somewhat smaller for an extremely long error ellipse (by 32%) and somewhat larger for a circular error ellipse (by 18%).
Note from Figure 3.2 how the position accuracy gets disproportionately worse with range. Also, near the extension of the base line (the straight line between the sensors), the position can hardly be calculated at all. This is both due to wide uncertainty bands of the TDOA hyperbolas there and poor (small) intersection angles between TDOA and scan-phase curves. The poor position accuracy in these areas is relieved by relocation of the sensors, as shown in the next section.
FFI-RAPPORT 15/02442 19
3.3 Expected geolocation accuracy by two circulating UAVs
In the previous section the expected geolocation accuracy was shown for two stationary LINE sensors assuming only one measurement of TDOA and one of scan-phase. The measurement accuracy was based on experienced measurement accuracies at a single sensor as follows:
TOA accuracy: 50 ns (1σ) Scan accuracy: 0.5º (1σ)
Note that a TDOA measurement involves one TOA measurement at each sensor, and one scan-phase measurement involves scan measurements at each sensor. This means that the above two values have to be multiplied by √2 (two independent errors), giving the values listed in the caption of Figure 3.2. The improvement using two circulating UAVs over the stationary sensors as shown in Figure 3.3 is both due to the change of geometry (a “poor area” can become a “good area”) and obtaining several measurements of the same radar. The latter effect is due to “averaging out” the errors; it gives an error reduction by a factor √N, where N is the number of observations. This factor applies for independent unbiased errors with the same error distribution. Any constant error (bias) in the measurement will not be reduced this way. In order not to get too optimistic results, the position accuracy is calculated from five measurements where the UAVs are doing a semi-circle, starting and ending at the sensor positions shown in Figure 3.2. The results are shown in Figure 3.3.
20 FFI-RAPPORT 15/02442
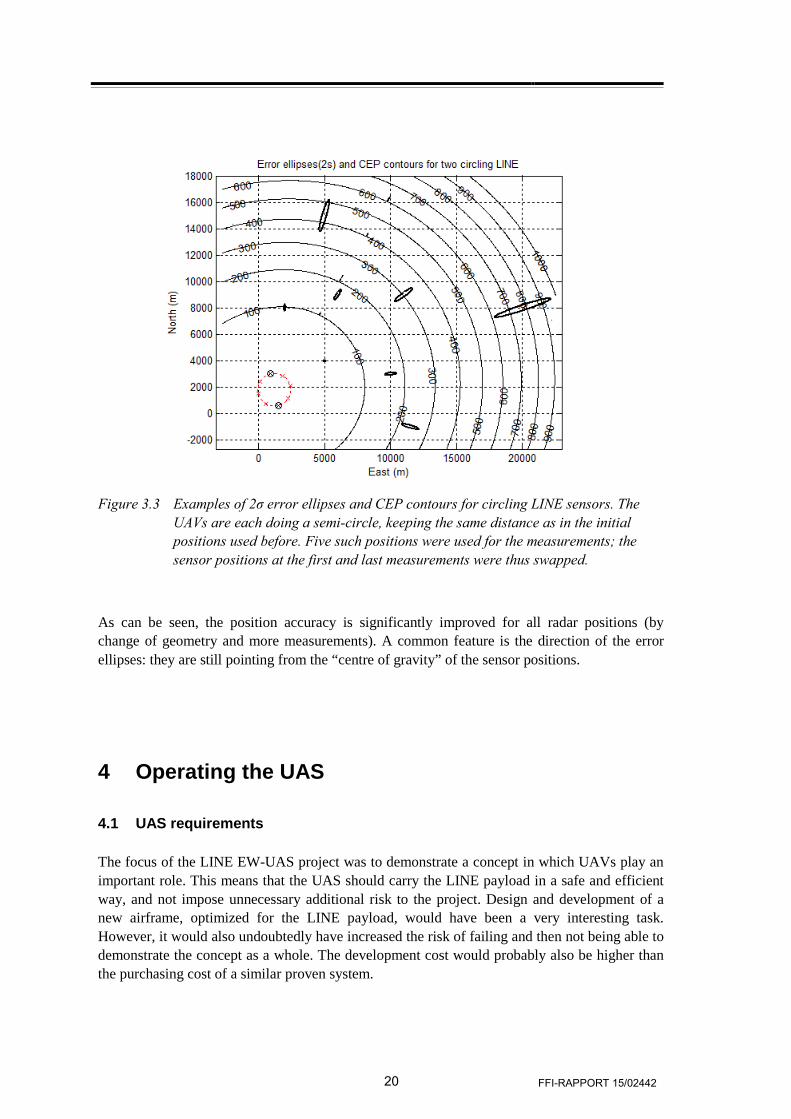
Figure 3.3 Examples of 2σ error ellipses and CEP contours for circling LINE sensors. The
UAVs are each doing a semi-circle, keeping the same distance as in the initial positions used before. Five such positions were used for the measurements; the sensor positions at the first and last measurements were thus swapped.
As can be seen, the position accuracy is significantly improved for all radar positions (by change of geometry and more measurements). A common feature is the direction of the error ellipses: they are still pointing from the “centre of gravity” of the sensor positions.
4 Operating the UAS
4.1 UAS requirements
The focus of the LINE EW-UAS project was to demonstrate a concept in which UAVs play an important role. This means that the UAS should carry the LINE payload in a safe and efficient way, and not impose unnecessary additional risk to the project. Design and development of a new airframe, optimized for the LINE payload, would have been a very interesting task. However, it would also undoubtedly have increased the risk of failing and then not being able to demonstrate the concept as a whole. The development cost would probably also be higher than the purchasing cost of a similar proven system.
FFI-RAPPORT 15/02442 21
The LINE payload was early on estimated to have a total weight of approximately 3-4 kg. The required endurance should be about 3-4 hours, allowing a simultaneous time on station for both vehicles of about 2 hours. This accounts for the time it takes to launch both vehicles in sequence, transit time from the launch site to the mission area, and the time to return and land both vehicles.
The endurance requirements indicate that a combustion engine/propulsion system should be used. Most electric UAVs of today are limited to no more than 2-3 hours endurance. Furthermore, as the system was required to reach a stand-off operation area within reasonable time, it was clear that a VTOL system would not be suitable and a fixed-wing solution would have to be used.
With 3-4 hours of flight time, the operational range will be limited by link range if a Line Of Sight (LOS)-type of link is used (assuming the vehicle travels at 100 km/hour). It was early on decided to go for several redundant command-and-telemetry links and include GPRS and Iridium. With the use of GPRS and Iridium, the operational range is in practical terms limited by the amount of on-board fuel.
As the LINE UAS is for experimental use only, it does not need to be as rugged as systems intended for operational military use. It will also be handled and operated by personnel taking better care of it than most soldiers would. For operational systems, the time needed to assemble and prepare the system for a flight is very important. This should also have some emphasis in an experimental system, but it is not as important since experiments normally are not that time critical.
One very important factor was to acquire a system that is also operated by other UAV-institutions in Norway. This makes collaboration and sharing of experience in the future much easier.
The system should be as robust and resistant to wind, weather and precipitation as possible. However, there exists no UAV system in the relevant class that has real all-weather capability. Wind, icing and precipitation will always be a factor with relatively small UAVs.
Based on the relatively coarse requirements described above, our own experience and judgment as well as the experience of NTNU and Maritime Robotics, it was decided to acquire a Penguin MR system with two UAVs and one ground control station. This system will be described in the next section. The fact that the system was already in use by our collaboration partners NTNU and MR was a very important decision factor, and made it permissible to acquire the system as a direct purchase.
4.2 The Penguin MR UAS
The UAS that was acquired for the LINE EW UAS project is called Penguin MR and is based on the Penguin B airframe. The Penguin MR system is integrated and developed by the
22 FFI-RAPPORT 15/02442
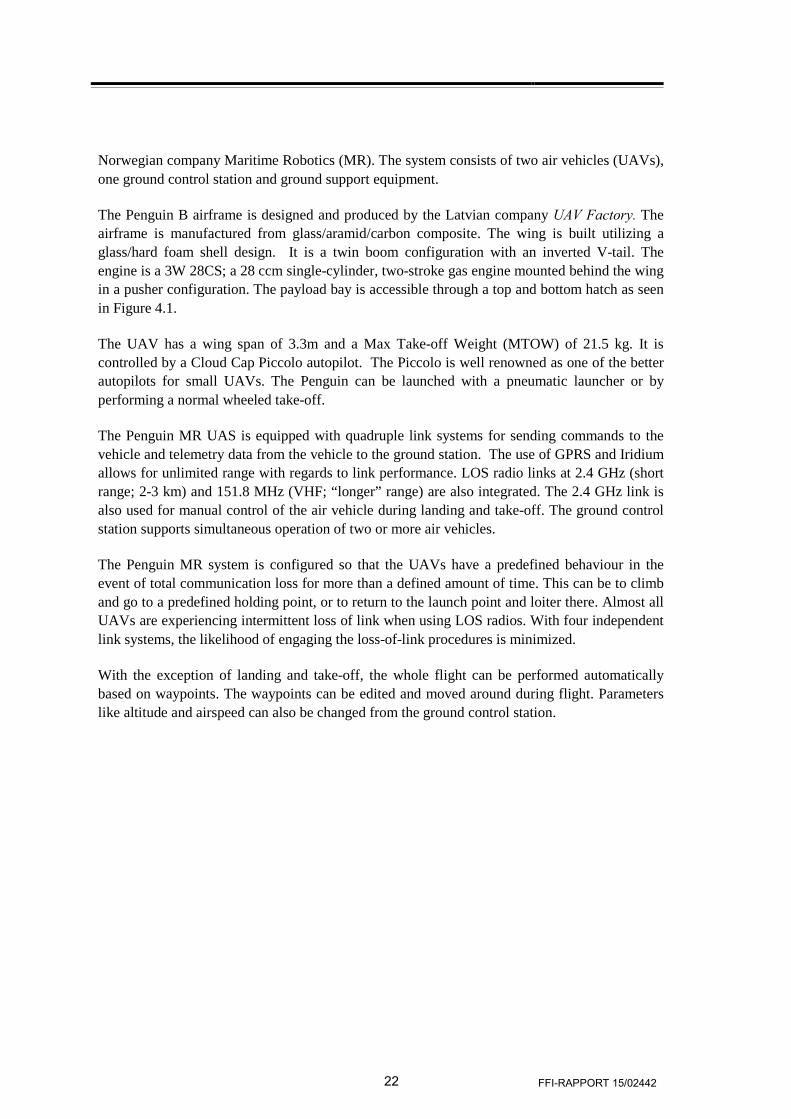
Norwegian company Maritime Robotics (MR). The system consists of two air vehicles (UAVs), one ground control station and ground support equipment.
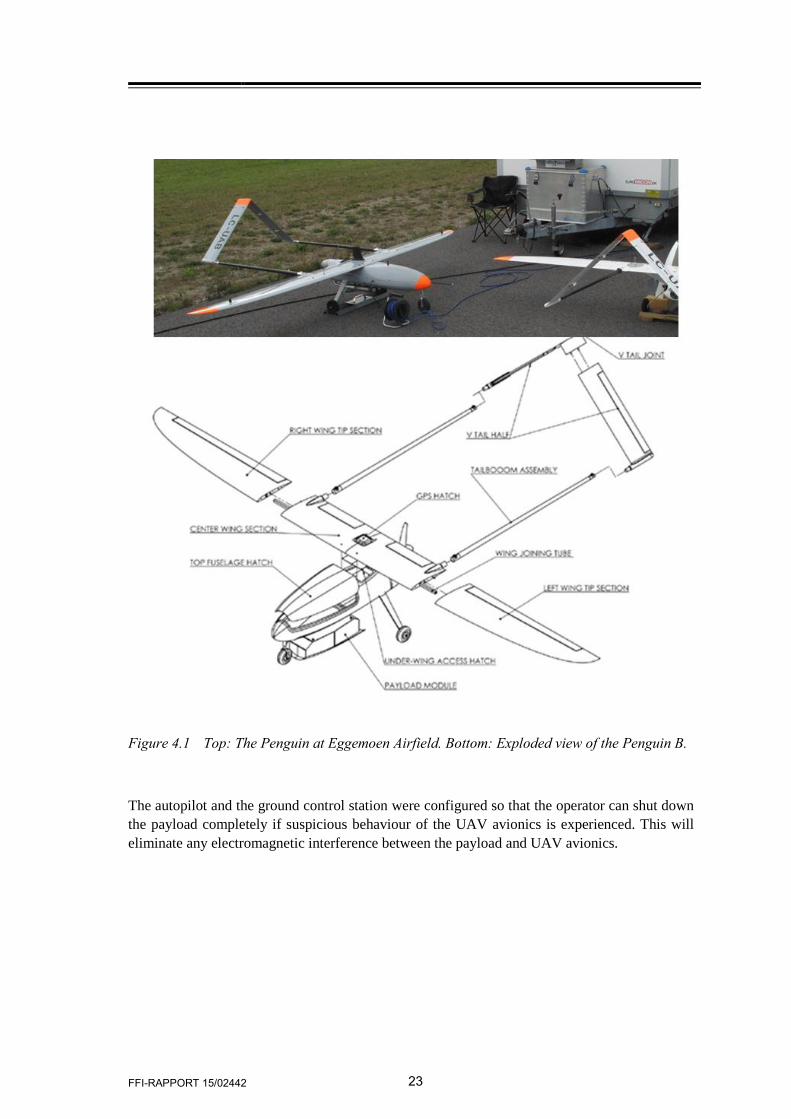
The Penguin B airframe is designed and produced by the Latvian company UAV Factory. The airframe is manufactured from glass/aramid/carbon composite. The wing is built utilizing a glass/hard foam shell design. It is a twin boom configuration with an inverted V-tail. The engine is a 3W 28CS; a 28 ccm single-cylinder, two-stroke gas engine mounted behind the wing in a pusher configuration. The payload bay is accessible through a top and bottom hatch as seen in Figure 4.1.
The UAV has a wing span of 3.3m and a Max Take-off Weight (MTOW) of 21.5 kg. It is controlled by a Cloud Cap Piccolo autopilot. The Piccolo is well renowned as one of the better autopilots for small UAVs. The Penguin can be launched with a pneumatic launcher or by performing a normal wheeled take-off.
The Penguin MR UAS is equipped with quadruple link systems for sending commands to the vehicle and telemetry data from the vehicle to the ground station. The use of GPRS and Iridium allows for unlimited range with regards to link performance. LOS radio links at 2.4 GHz (short range; 2-3 km) and 151.8 MHz (VHF; “longer” range) are also integrated. The 2.4 GHz link is also used for manual control of the air vehicle during landing and take-off. The ground control station supports simultaneous operation of two or more air vehicles.
The Penguin MR system is configured so that the UAVs have a predefined behaviour in the event of total communication loss for more than a defined amount of time. This can be to climb and go to a predefined holding point, or to return to the launch point and loiter there. Almost all UAVs are experiencing intermittent loss of link when using LOS radios. With four independent link systems, the likelihood of engaging the loss-of-link procedures is minimized.
With the exception of landing and take-off, the whole flight can be performed automatically based on waypoints. The waypoints can be edited and moved around during flight. Parameters like altitude and airspeed can also be changed from the ground control station.
FFI-RAPPORT 15/02442 23
Figure 4.1 Top: The Penguin at Eggemoen Airfield. Bottom: Exploded view of the Penguin B.
The autopilot and the ground control station were configured so that the operator can shut down the payload completely if suspicious behaviour of the UAV avionics is experienced. This will eliminate any electromagnetic interference between the payload and UAV avionics.
24 FFI-RAPPORT 15/02442
4.3 Operational aspects
4.3.1 Regulations
In Norway, all unmanned flying vehicles not used for a recreational purpose only, are considered to be a component in a Remotely Piloted Aircraft System (RPAS). An unmanned flying vehicle equipped with autopilot is considered to be a model airplane if used only for recreational purposes or competitions. Rules and regulations for model aircrafts are different than those for RPAS. Luftfartstilsynet (LT) is the governing authority for operations with RPAS and model airplanes in Norway.
The above regulations define the Penguin MR system used in this experiment as an RPAS. This requires the system to be described in an Operation Manual (OM), approved by Luftfartstilsynet. Further, as the LINE experiments would require Beyond Line of Sight (BLOS) operation of the UAS, a special permission for this must be issued by LT. As Maritime Robotics (MR) was the formal operator of the system during the campaigns, this permission was handled by them.
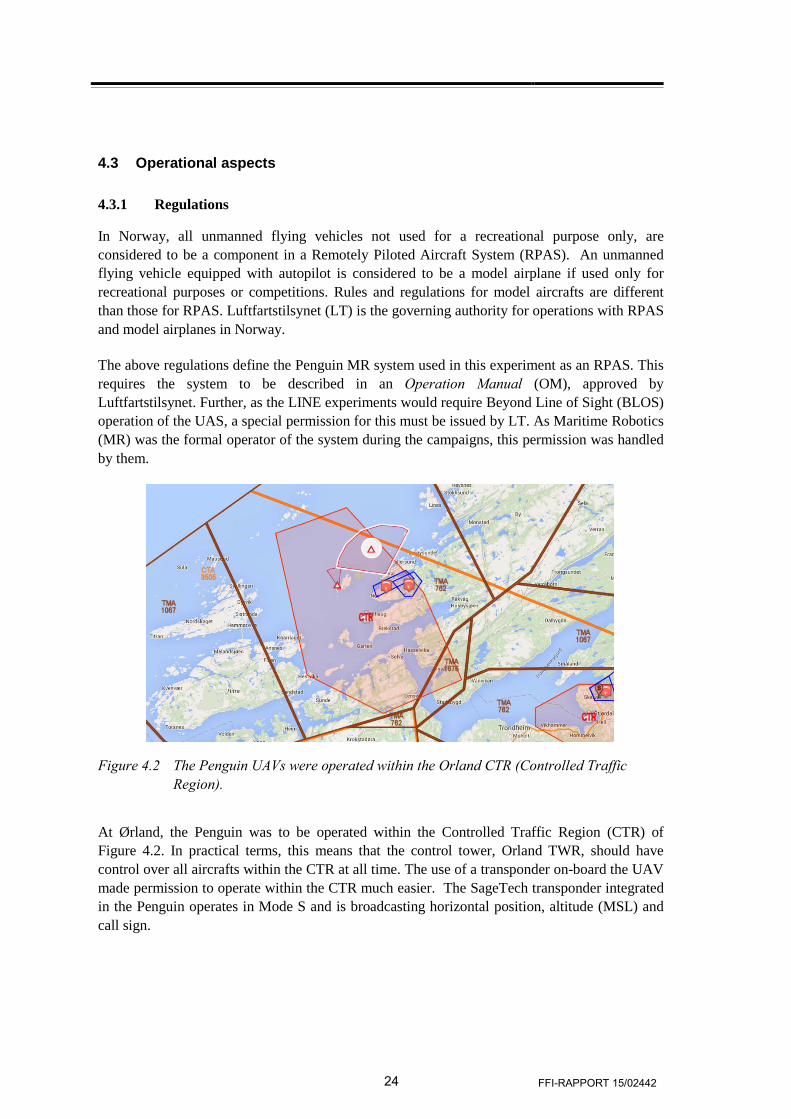
Figure 4.2 The Penguin UAVs were operated within the Orland CTR (Controlled Traffic Region).
At Ørland, the Penguin was to be operated within the Controlled Traffic Region (CTR) of Figure 4.2. In practical terms, this means that the control tower, Orland TWR, should have control over all aircrafts within the CTR at all time. The use of a transponder on-board the UAV made permission to operate within the CTR much easier. The SageTech transponder integrated in the Penguin operates in Mode S and is broadcasting horizontal position, altitude (MSL) and call sign.
FFI-RAPPORT 15/02442 25
To get access to facilities and permission to operate the UAS from Ørland Flystasjon, FFI sent a letter to 138 Luftving some time before the planned campaign. We experienced a very friendly and efficient cooperation with the 138 Luftving and their points of contact: Major Rushfeldt and Captain Raustein.
4.3.2 Other limiting factors
Weather is a limiting factor for all aircraft operations, but even more so for a relatively small UAV. The Penguin B is not sealed and waterproof, meaning it cannot operate during heavy precipitation. Light rain may be acceptable. For UAVs equipped with surveillance cameras, fog or a low cloud base will also deem the mission useless. This is however not a problem for the LINE payload.
Wind is a challenge for small UAVs, due to their relatively low air speed. For long-range missions, strong headwind may result in very low ground speed, making it impossible to return to the base due to lack of on-board energy. Wind and gust are especially critical during take-off and landing, but gusting winds might also pose problems during normal flight if the vehicle has a high wing loading and therefore operates close to its stall speed.
The wing loading of the Penguin used in our experiments is relatively high and the margin between its normal cruise speed and the stall speed is small. Wind and gust combined with tight turns are therefore possible risk factors. In open areas such as e.g. Ørland, the wind is usually laminar with less gusts and turbulence compared to more mountainous or hilly areas. If the wind is laminar and aligned with the runway, 10 m/s wind during take-off and landing should not be a problem. In other conditions, the wind limit will be subjective and based on the judgment of the operator.
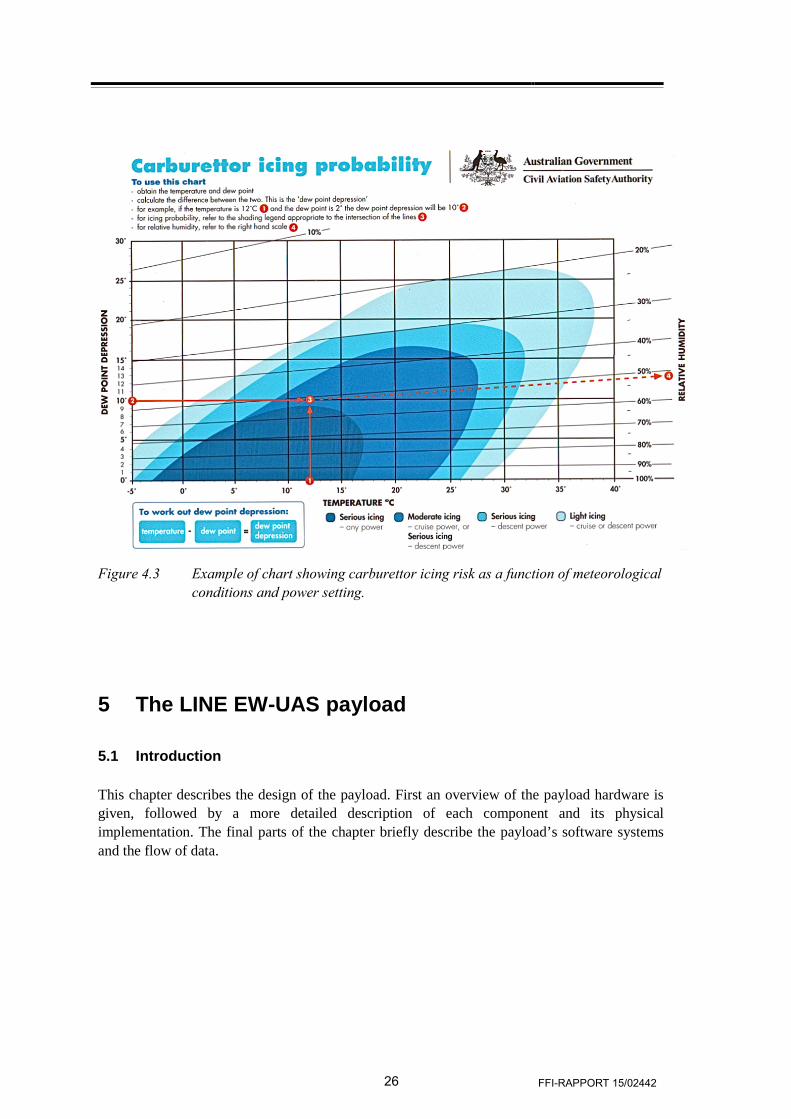
Icing is a severe challenge for UAS operations in Norway. Icing on the airframe (wings, fuselage and propeller), carburettor icing as well as ice on the pitot tube might all pose problems. The Penguin’s pitot tube is heated, making icing here a less likely issue. The Penguin has no protection against icing on the airframe. However, based on previous experience with similar engines in helicopter UAVs, carburettor icing is probably a more significant problem than airframe icing.
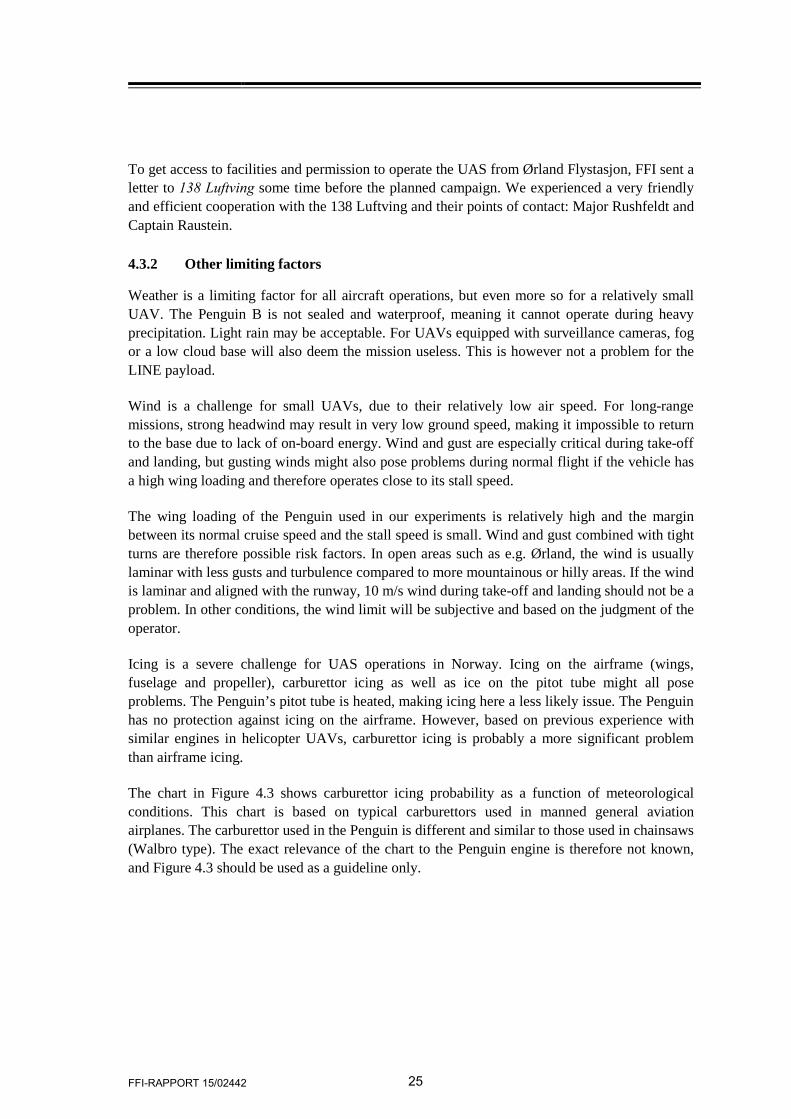
The chart in Figure 4.3 shows carburettor icing probability as a function of meteorological conditions. This chart is based on typical carburettors used in manned general aviation airplanes. The carburettor used in the Penguin is different and similar to those used in chainsaws (Walbro type). The exact relevance of the chart to the Penguin engine is therefore not known, and Figure 4.3 should be used as a guideline only.
26 FFI-RAPPORT 15/02442
Figure 4.3 Example of chart showing carburettor icing risk as a function of meteorological conditions and power setting.
5 The LINE EW-UAS payload
5.1 Introduction
This chapter describes the design of the payload. First an overview of the payload hardware is given, followed by a more detailed description of each component and its physical implementation. The final parts of the chapter briefly describe the payload’s software systems and the flow of data.
FFI-RAPPORT 15/02442 27
5.2 Payload overview
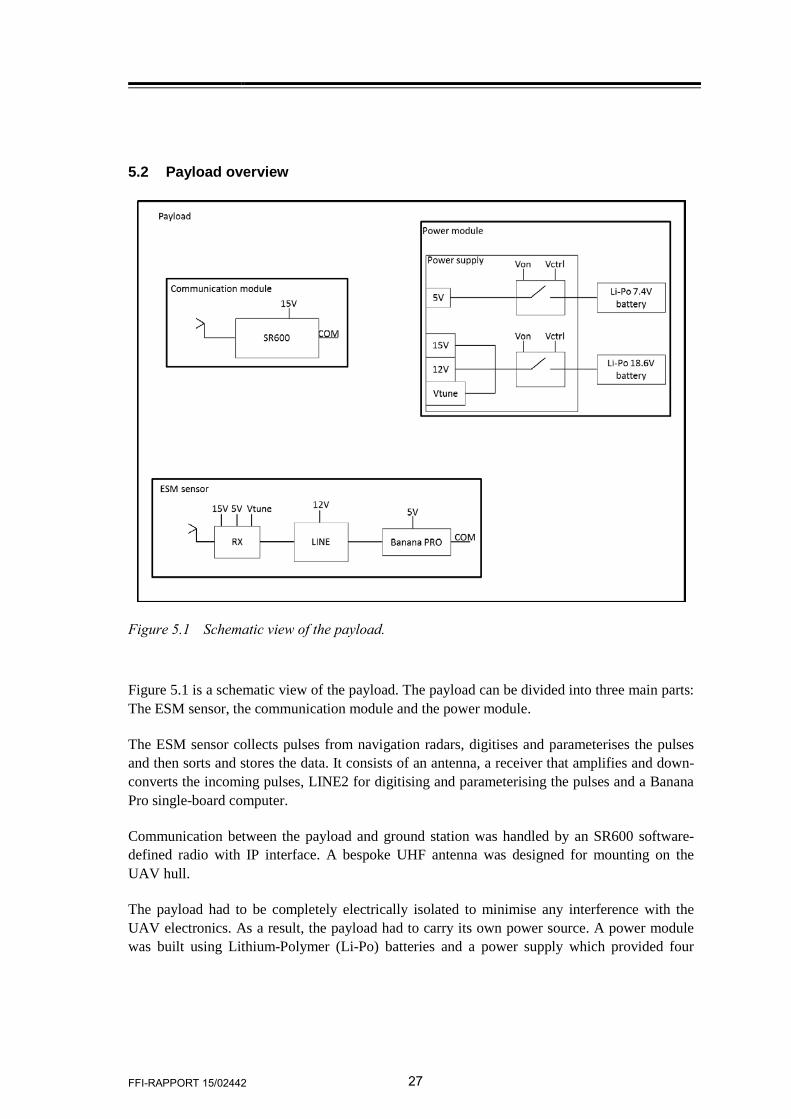
Figure 5.1 Schematic view of the payload.
Figure 5.1 is a schematic view of the payload. The payload can be divided into three main parts: The ESM sensor, the communication module and the power module.
The ESM sensor collects pulses from navigation radars, digitises and parameterises the pulses and then sorts and stores the data. It consists of an antenna, a receiver that amplifies and down- converts the incoming pulses, LINE2 for digitising and parameterising the pulses and a Banana Pro single-board computer.
Communication between the payload and ground station was handled by an SR600 software-defined radio with IP interface. A bespoke UHF antenna was designed for mounting on the UAV hull.
The payload had to be completely electrically isolated to minimise any interference with the UAV electronics. As a result, the payload had to carry its own power source. A power module was built using Lithium-Polymer (Li-Po) batteries and a power supply which provided four
28 FFI-RAPPORT 15/02442
different voltage levels. Additionally, the power module had an on/off switch that could be controlled by the UAV operator.
These components were mounted on a frame inside an EMI shield. Both the frame and the EMI shield were built using 3D-printing technology, which enabled rapid prototyping and flexibility.
5.3 Hardware
5.3.1 ESM sensor
The ESM sensor consists of four parts: Antenna, receiver, pulse processor (LINE2) and a Banana Pro single-board computer.
To save time in the design phase, existing systems such as the LINE2 sensor and commercial products such as the Banana Pro and the B3RX1620 receiver were used.
5.3.1.1 Antenna
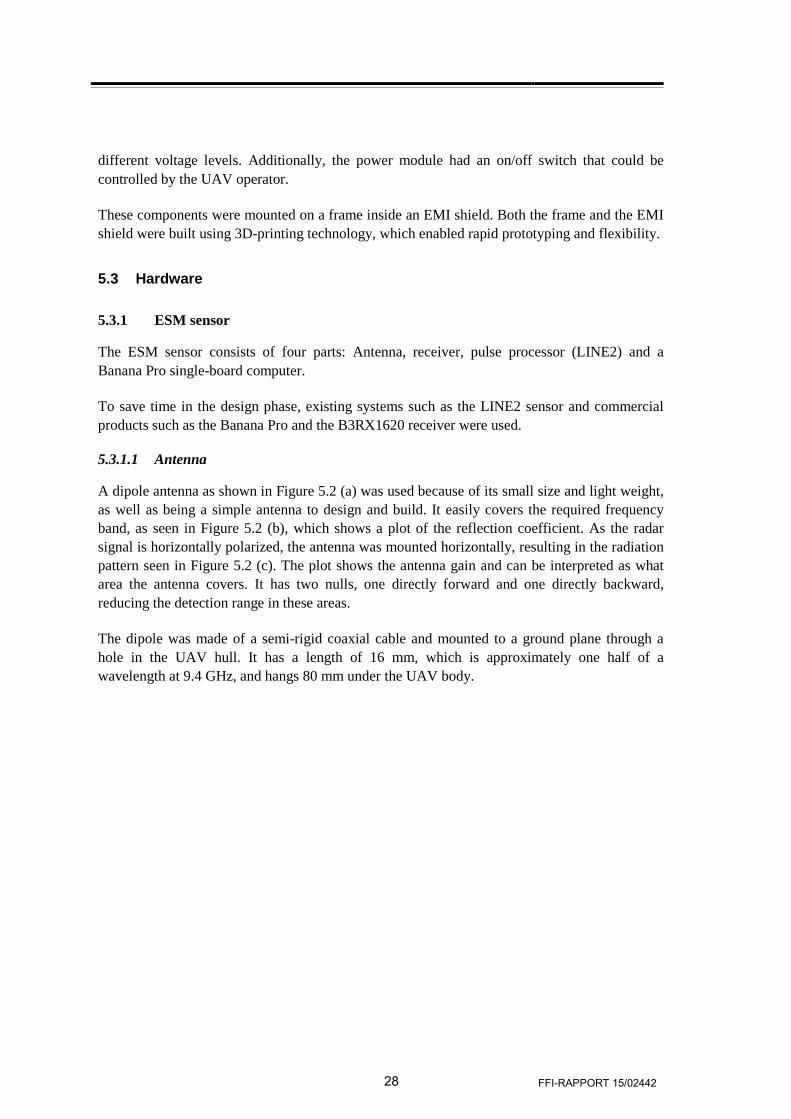
A dipole antenna as shown in Figure 5.2 (a) was used because of its small size and light weight, as well as being a simple antenna to design and build. It easily covers the required frequency band, as seen in Figure 5.2 (b), which shows a plot of the reflection coefficient. As the radar signal is horizontally polarized, the antenna was mounted horizontally, resulting in the radiation pattern seen in Figure 5.2 (c). The plot shows the antenna gain and can be interpreted as what area the antenna covers. It has two nulls, one directly forward and one directly backward, reducing the detection range in these areas.
The dipole was made of a semi-rigid coaxial cable and mounted to a ground plane through a hole in the UAV hull. It has a length of 16 mm, which is approximately one half of a wavelength at 9.4 GHz, and hangs 80 mm under the UAV body.
FFI-RAPPORT 15/02442 29
Figure 5.2 (a) A dipole antenna for 9.4 GHz. (b) Measured reflection coefficient of the two antennas used. (c) A simulated radiation pattern of a horizontally mounted dipole antenna.
5.3.1.2 Receiver
The receiver architecture can be seen in Figure 5.3. It is a single-conversion superheterodyne architecture, meaning that the incoming signal is down-converted to an intermediate frequency (IF) using a mixer and a local oscillator (LO). The receiver down-converts the incoming signal at 9.4 GHz to an IF of 60 MHz.
The receiver consists of a low noise amplifier (LNA), a down-converter and a low-pass filter. The LNA is placed in front to minimize the noise figure of the receiver. The down-converter is a B3RX1620 from E2V technologies. It down-converts the signal using a double balanced mixer and a voltage-controlled oscillator as the LO. Using a double balanced mixer reduces the image frequency, which in turn improves the sensor sensitivity. The LO frequency is 9.340 GHz and was set using the tuneable output on the power supply. The receiver has an instantaneous
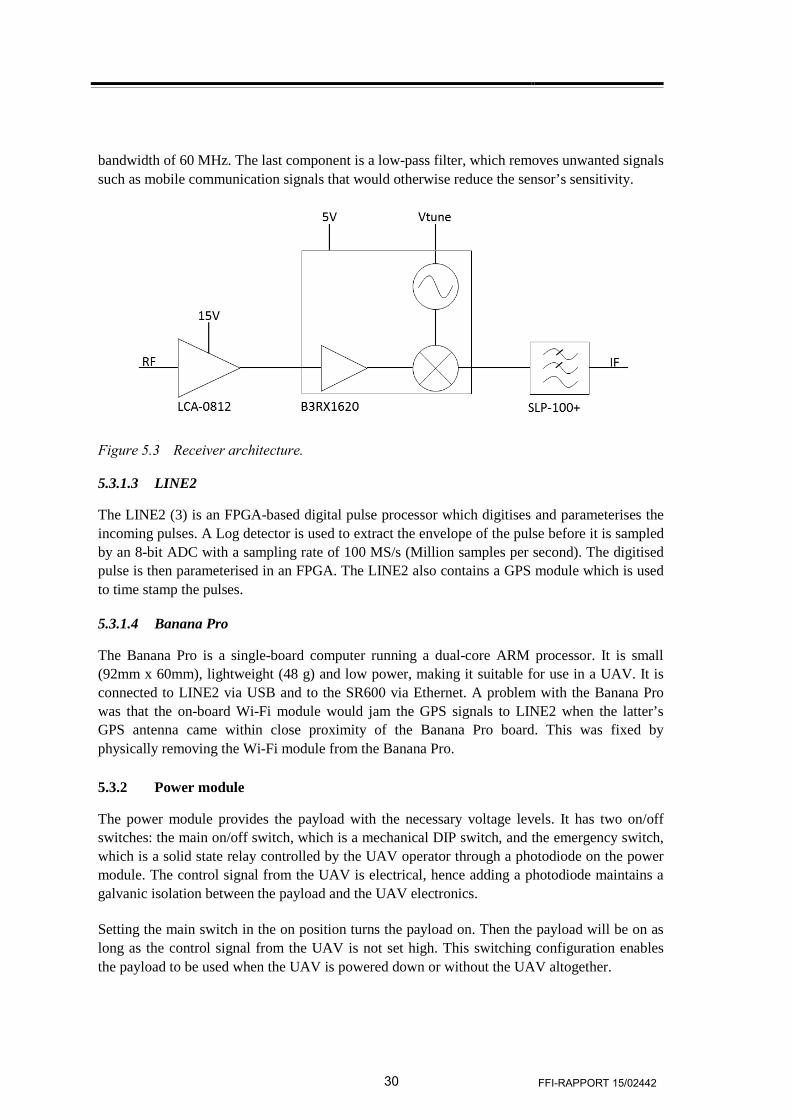
30 FFI-RAPPORT 15/02442
bandwidth of 60 MHz. The last component is a low-pass filter, which removes unwanted signals such as mobile communication signals that would otherwise reduce the sensor’s sensitivity.
Figure 5.3 Receiver architecture.
5.3.1.3 LINE2
The LINE2 (3) is an FPGA-based digital pulse processor which digitises and parameterises the incoming pulses. A Log detector is used to extract the envelope of the pulse before it is sampled by an 8-bit ADC with a sampling rate of 100 MS/s (Million samples per second). The digitised pulse is then parameterised in an FPGA. The LINE2 also contains a GPS module which is used to time stamp the pulses.
5.3.1.4 Banana Pro
The Banana Pro is a single-board computer running a dual-core ARM processor. It is small (92mm x 60mm), lightweight (48 g) and low power, making it suitable for use in a UAV. It is connected to LINE2 via USB and to the SR600 via Ethernet. A problem with the Banana Pro was that the on-board Wi-Fi module would jam the GPS signals to LINE2 when the latter’s GPS antenna came within close proximity of the Banana Pro board. This was fixed by physically removing the Wi-Fi module from the Banana Pro.
5.3.2 Power module
The power module provides the payload with the necessary voltage levels. It has two on/off switches: the main on/off switch, which is a mechanical DIP switch, and the emergency switch, which is a solid state relay controlled by the UAV operator through a photodiode on the power module. The control signal from the UAV is electrical, hence adding a photodiode maintains a galvanic isolation between the payload and the UAV electronics.
Setting the main switch in the on position turns the payload on. Then the payload will be on as long as the control signal from the UAV is not set high. This switching configuration enables the payload to be used when the UAV is powered down or without the UAV altogether.
FFI-RAPPORT 15/02442 31
The power module provides 4 different voltage levels: 15 V, 12 V, 5 V and a tuning voltage for the VCO (approximately 14-16 V). Linear voltage regulators were used to avoid the noise from switching regulators, which would otherwise reduce the sensitivity of the sensor. The use of linear regulators and the large span in required voltages made it necessary to use two batteries with different voltage levels to reduce heat dissipation in the regulators. Li-Po batteries were used as power source because of their light weight. Li-Po batteries are Lithium ion cells that are encapsulated in a polymer casing instead of metal, saving up to 20% of the weight. The cell voltage is approximately 3.7 V. A two-cell battery (7.4 V) was used to for the 5 V output and a five-cell battery (18.5 V) was used to provide the other voltages. The current drawn by each component was measured to determine the required capacity of the batteries. The total current drawn from the 5 V output was 650 mA and 1000 mA in total from all other outputs. For the payload to have an operating time of three hours, the required size of the batteries were determined to be 2200 mAh for the 7.4 V battery and 3300 mAh for the 18.5 V battery.
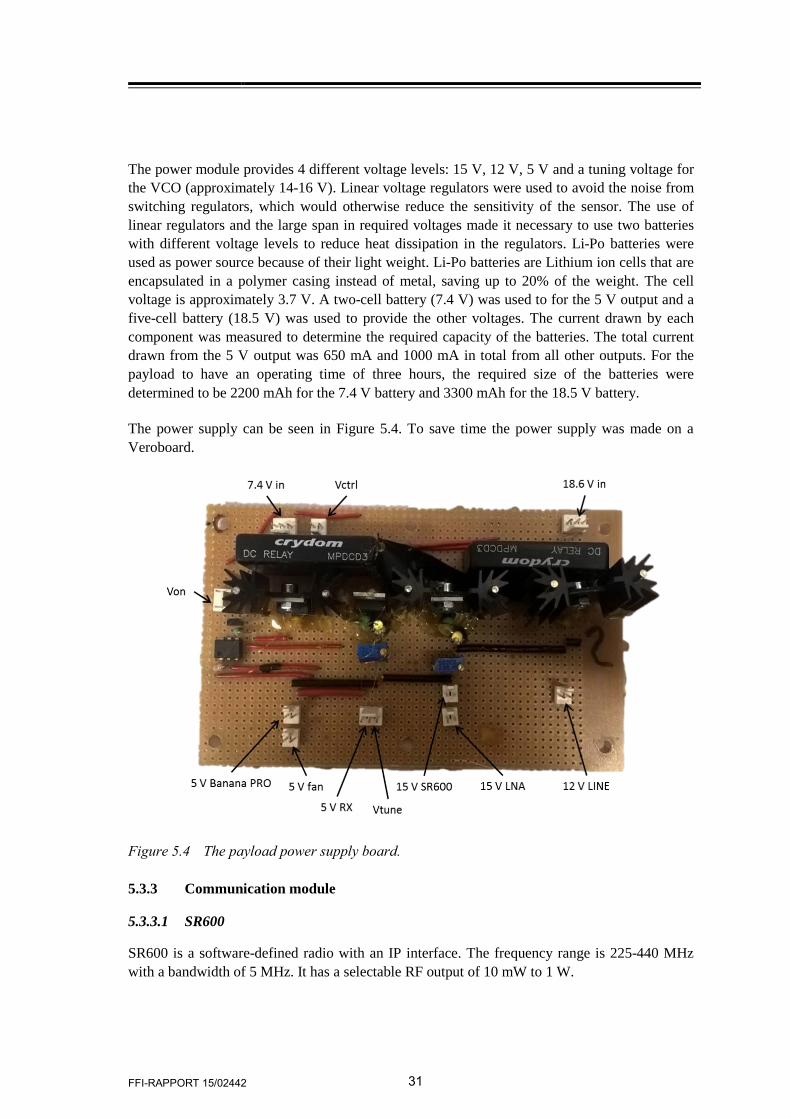
The power supply can be seen in Figure 5.4. To save time the power supply was made on a Veroboard.
Figure 5.4 The payload power supply board.
5.3.3 Communication module
5.3.3.1 SR600
SR600 is a software-defined radio with an IP interface. The frequency range is 225-440 MHz with a bandwidth of 5 MHz. It has a selectable RF output of 10 mW to 1 W.
32 FFI-RAPPORT 15/02442
5.3.3.2 Antenna
The original SR 600 antenna was a monopole antenna mounted directly on the radio chassis, with a length of 24 cm. Measurements showed that the antenna could not be separated from the radio chassis without severely degrading its input impedance characteristic. Also the size of the antenna made it difficult to mount on the UAV. A new antenna for radio communication was therefore designed and built.
The new antenna was designed for a centre frequency of 323 MHz and a bandwidth of at least 5 MHz. For it to be mounted underneath the UAV, the maximum length would be 16 cm. The antenna simulation tool HFSS was used to design the new antenna.
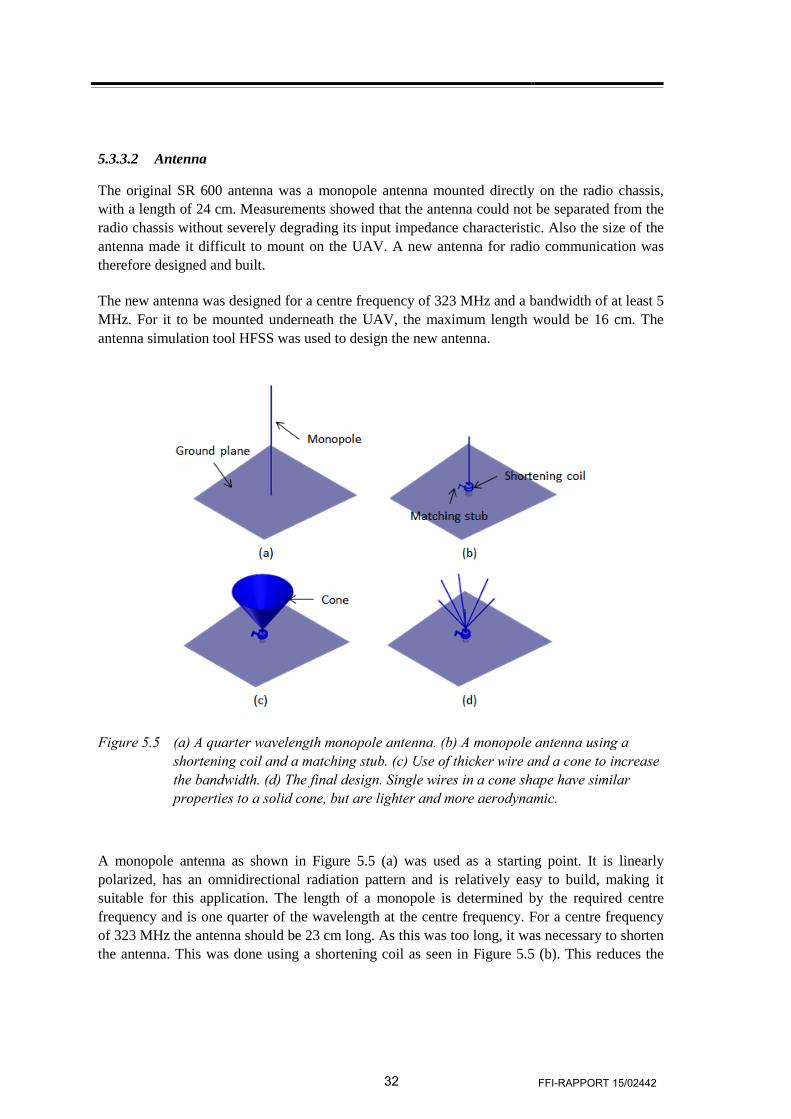
Figure 5.5 (a) A quarter wavelength monopole antenna. (b) A monopole antenna using a shortening coil and a matching stub. (c) Use of thicker wire and a cone to increase the bandwidth. (d) The final design. Single wires in a cone shape have similar properties to a solid cone, but are lighter and more aerodynamic.
A monopole antenna as shown in Figure 5.5 (a) was used as a starting point. It is linearly polarized, has an omnidirectional radiation pattern and is relatively easy to build, making it suitable for this application. The length of a monopole is determined by the required centre frequency and is one quarter of the wavelength at the centre frequency. For a centre frequency of 323 MHz the antenna should be 23 cm long. As this was too long, it was necessary to shorten the antenna. This was done using a shortening coil as seen in Figure 5.5 (b). This reduces the
FFI-RAPPORT 15/02442 33
height of the antenna while the wire length remains approximately the same. The shortening coil has three turns and a radius of 7 mm.
One disadvantage of using a shortening coil is the reduction in bandwidth. Therefore additional techniques were used to achieve the specified bandwidth, such as using thicker wire in the shortening coil, and using a cone shape for the upper part of the antenna. Using a solid cone would affect the UAVs aerodynamics, so thin copper wires were used to make a discrete cone. The final antenna can be seen in Figure 5.5 (d).
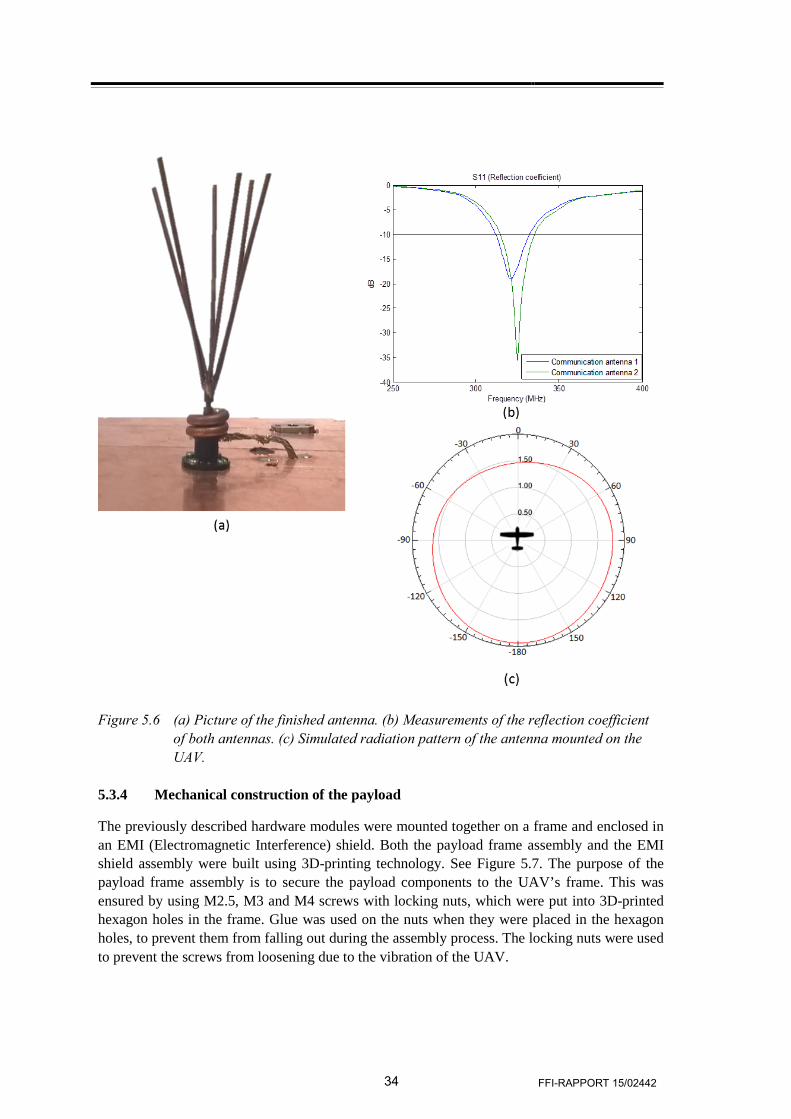
To ease installation on the UAV, the antenna was built in three parts: ground plane, shortening coil and cone. The antenna was tuned by adjusting the length of the cone wires and the matching stub. The tuning was done with the antenna mounted on the payload frame. Figure 5.6 (b) and (c) show the measured reflection coefficient and the simulated gain of the antenna mounted on the UAV, respectively. A bandwidth of 20 MHz was achieved. The gain plot in Figure 5.6 (c) shows an almost omnidirectional antenna pattern, but with a small reduction in gain in the forward direction. This is caused by the UAVs nose wheel.
34 FFI-RAPPORT 15/02442
Figure 5.6 (a) Picture of the finished antenna. (b) Measurements of the reflection coefficient of both antennas. (c) Simulated radiation pattern of the antenna mounted on the UAV.
5.3.4 Mechanical construction of the payload
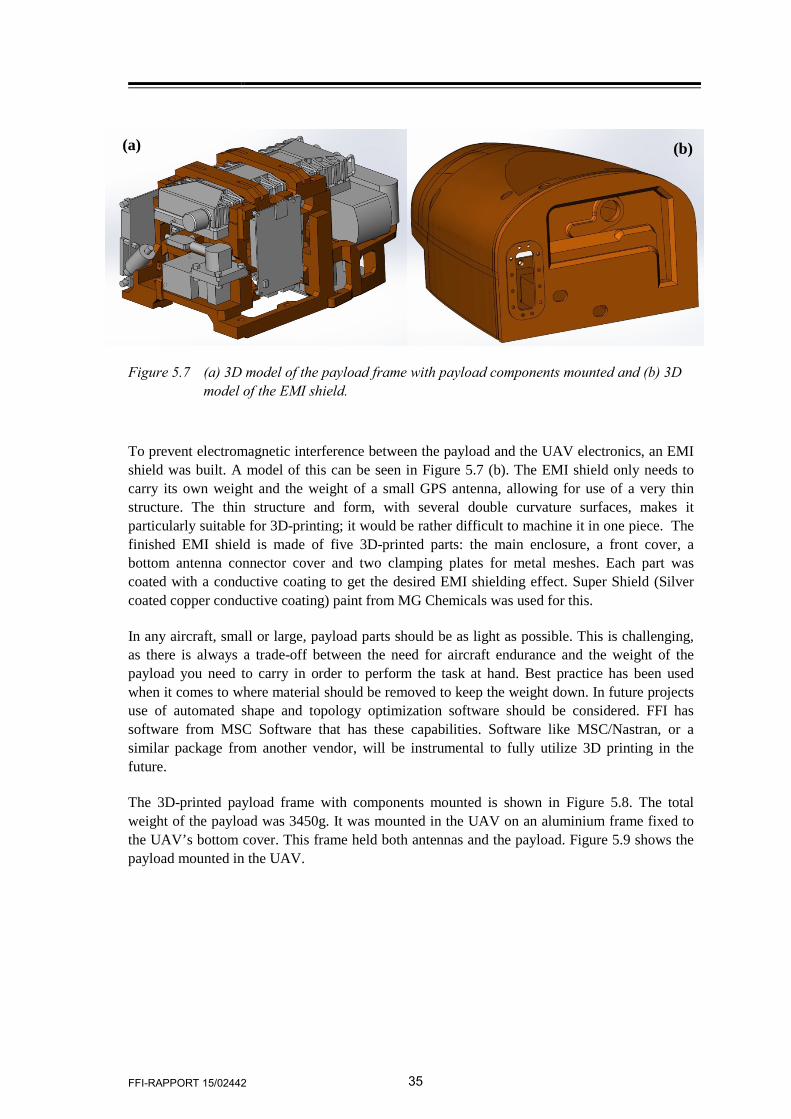
The previously described hardware modules were mounted together on a frame and enclosed in an EMI (Electromagnetic Interference) shield. Both the payload frame assembly and the EMI shield assembly were built using 3D-printing technology. See Figure 5.7. The purpose of the payload frame assembly is to secure the payload components to the UAV’s frame. This was ensured by using M2.5, M3 and M4 screws with locking nuts, which were put into 3D-printed hexagon holes in the frame. Glue was used on the nuts when they were placed in the hexagon holes, to prevent them from falling out during the assembly process. The locking nuts were used to prevent the screws from loosening due to the vibration of the UAV.
FFI-RAPPORT 15/02442 35
Figure 5.7 (a) 3D model of the payload frame with payload components mounted and (b) 3D model of the EMI shield.
To prevent electromagnetic interference between the payload and the UAV electronics, an EMI shield was built. A model of this can be seen in Figure 5.7 (b). The EMI shield only needs to carry its own weight and the weight of a small GPS antenna, allowing for use of a very thin structure. The thin structure and form, with several double curvature surfaces, makes it particularly suitable for 3D-printing; it would be rather difficult to machine it in one piece. The finished EMI shield is made of five 3D-printed parts: the main enclosure, a front cover, a bottom antenna connector cover and two clamping plates for metal meshes. Each part was coated with a conductive coating to get the desired EMI shielding effect. Super Shield (Silver coated copper conductive coating) paint from MG Chemicals was used for this.
In any aircraft, small or large, payload parts should be as light as possible. This is challenging, as there is always a trade-off between the need for aircraft endurance and the weight of the payload you need to carry in order to perform the task at hand. Best practice has been used when it comes to where material should be removed to keep the weight down. In future projects use of automated shape and topology optimization software should be considered. FFI has software from MSC Software that has these capabilities. Software like MSC/Nastran, or a similar package from another vendor, will be instrumental to fully utilize 3D printing in the future.
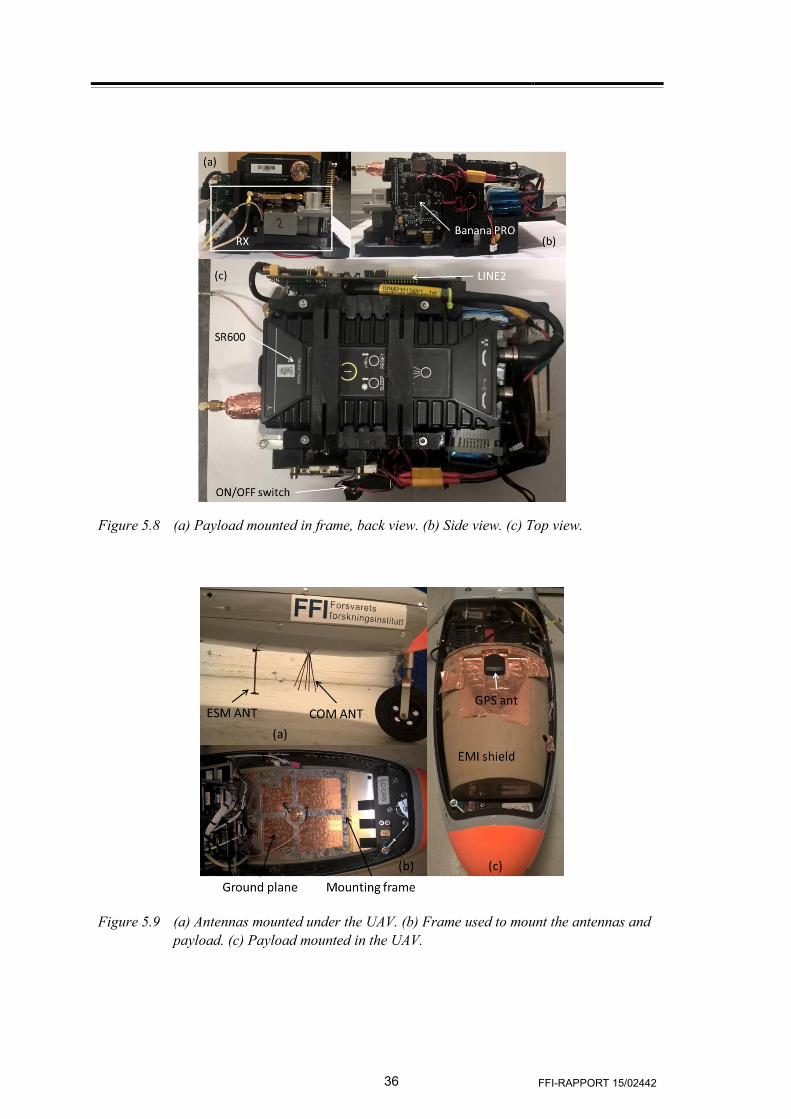
The 3D-printed payload frame with components mounted is shown in Figure 5.8. The total weight of the payload was 3450g. It was mounted in the UAV on an aluminium frame fixed to the UAV’s bottom cover. This frame held both antennas and the payload. Figure 5.9 shows the payload mounted in the UAV.
(a) (b)
36 FFI-RAPPORT 15/02442
Figure 5.8 (a) Payload mounted in frame, back view. (b) Side view. (c) Top view.
Figure 5.9 (a) Antennas mounted under the UAV. (b) Frame used to mount the antennas and
payload. (c) Payload mounted in the UAV.
FFI-RAPPORT 15/02442 37
5.4 Software
5.4.1 Introduction
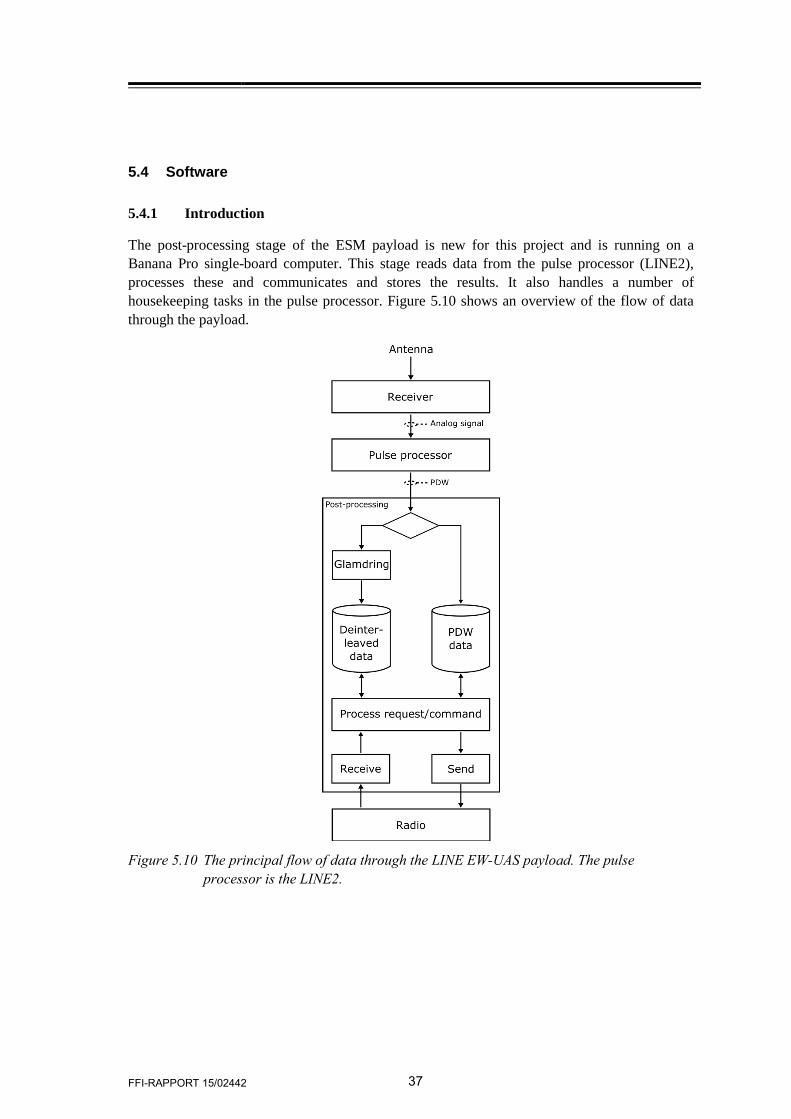
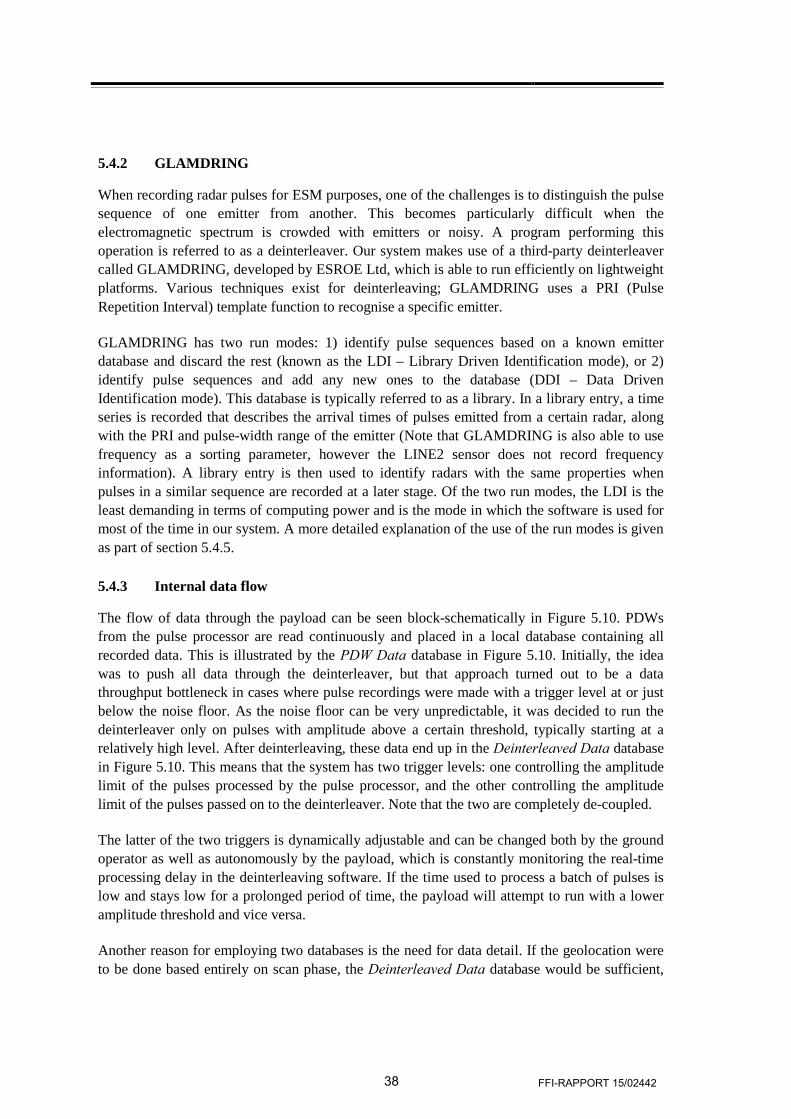
The post-processing stage of the ESM payload is new for this project and is running on a Banana Pro single-board computer. This stage reads data from the pulse processor (LINE2), processes these and communicates and stores the results. It also handles a number of housekeeping tasks in the pulse processor. Figure 5.10 shows an overview of the flow of data through the payload.
Figure 5.10 The principal flow of data through the LINE EW-UAS payload. The pulse
processor is the LINE2.
38 FFI-RAPPORT 15/02442
5.4.2 GLAMDRING
When recording radar pulses for ESM purposes, one of the challenges is to distinguish the pulse sequence of one emitter from another. This becomes particularly difficult when the electromagnetic spectrum is crowded with emitters or noisy. A program performing this operation is referred to as a deinterleaver. Our system makes use of a third-party deinterleaver called GLAMDRING, developed by ESROE Ltd, which is able to run efficiently on lightweight platforms. Various techniques exist for deinterleaving; GLAMDRING uses a PRI (Pulse Repetition Interval) template function to recognise a specific emitter.
GLAMDRING has two run modes: 1) identify pulse sequences based on a known emitter database and discard the rest (known as the LDI – Library Driven Identification mode), or 2) identify pulse sequences and add any new ones to the database (DDI – Data Driven Identification mode). This database is typically referred to as a library. In a library entry, a time series is recorded that describes the arrival times of pulses emitted from a certain radar, along with the PRI and pulse-width range of the emitter (Note that GLAMDRING is also able to use frequency as a sorting parameter, however the LINE2 sensor does not record frequency information). A library entry is then used to identify radars with the same properties when pulses in a similar sequence are recorded at a later stage. Of the two run modes, the LDI is the least demanding in terms of computing power and is the mode in which the software is used for most of the time in our system. A more detailed explanation of the use of the run modes is given as part of section 5.4.5.
5.4.3 Internal data flow
The flow of data through the payload can be seen block-schematically in Figure 5.10. PDWs from the pulse processor are read continuously and placed in a local database containing all recorded data. This is illustrated by the PDW Data database in Figure 5.10. Initially, the idea was to push all data through the deinterleaver, but that approach turned out to be a data throughput bottleneck in cases where pulse recordings were made with a trigger level at or just below the noise floor. As the noise floor can be very unpredictable, it was decided to run the deinterleaver only on pulses with amplitude above a certain threshold, typically starting at a relatively high level. After deinterleaving, these data end up in the Deinterleaved Data database in Figure 5.10. This means that the system has two trigger levels: one controlling the amplitude limit of the pulses processed by the pulse processor, and the other controlling the amplitude limit of the pulses passed on to the deinterleaver. Note that the two are completely de-coupled.
The latter of the two triggers is dynamically adjustable and can be changed both by the ground operator as well as autonomously by the payload, which is constantly monitoring the real-time processing delay in the deinterleaving software. If the time used to process a batch of pulses is low and stays low for a prolonged period of time, the payload will attempt to run with a lower amplitude threshold and vice versa.
Another reason for employing two databases is the need for data detail. If the geolocation were to be done based entirely on scan phase, the Deinterleaved Data database would be sufficient,
FFI-RAPPORT 15/02442 39
as one would only be interested in finding the times where any given radar’s main lobe illuminates the sensor. However, as the geolocation of radars also requires TDOA, it is necessary to report data points stretching further down towards the noise floor (effectively capturing a larger part of the radar beam’s side lobes) to ensure reliable TDOA calculations can be made.
5.4.4 Communication with the ground node
All flow of data to and from the payload is governed by the ground node. The payload will record ESM data, but no data will be transferred unless specifically queried by the ground-node software. This is done to avoid data collision where the two payloads broadcast at the same time. All communication makes use of the UDP protocol, which contains no mechanism for automatic retransmission if a message is lost due to e.g. collisions. Since both payloads share the same radio channel, a communications scheme was developed to minimise unnecessary data loss and utilise as much as possible of the available bandwidth. Each payload is polled in turn, and assigned a fixed time interval in which it can transmit its data upon receiving a poll. A payload will transmit as many messages from its queue as the bandwidth will allow within the transmit window. With a few exceptions, all messages received by a payload will trigger a transmit sequence. The specific details of this scheme are outlined in a separate publication (4).
The above scheme was designed to ensure that the system transfers a close-to-continuous stream of data from either payload. This is not necessarily in line with the CESMO standard, as the standard does not demand a coordination of the transmissions between nodes, hence accepting a higher probability of package loss.
40 FFI-RAPPORT 15/02442
5.4.5 Data exchange
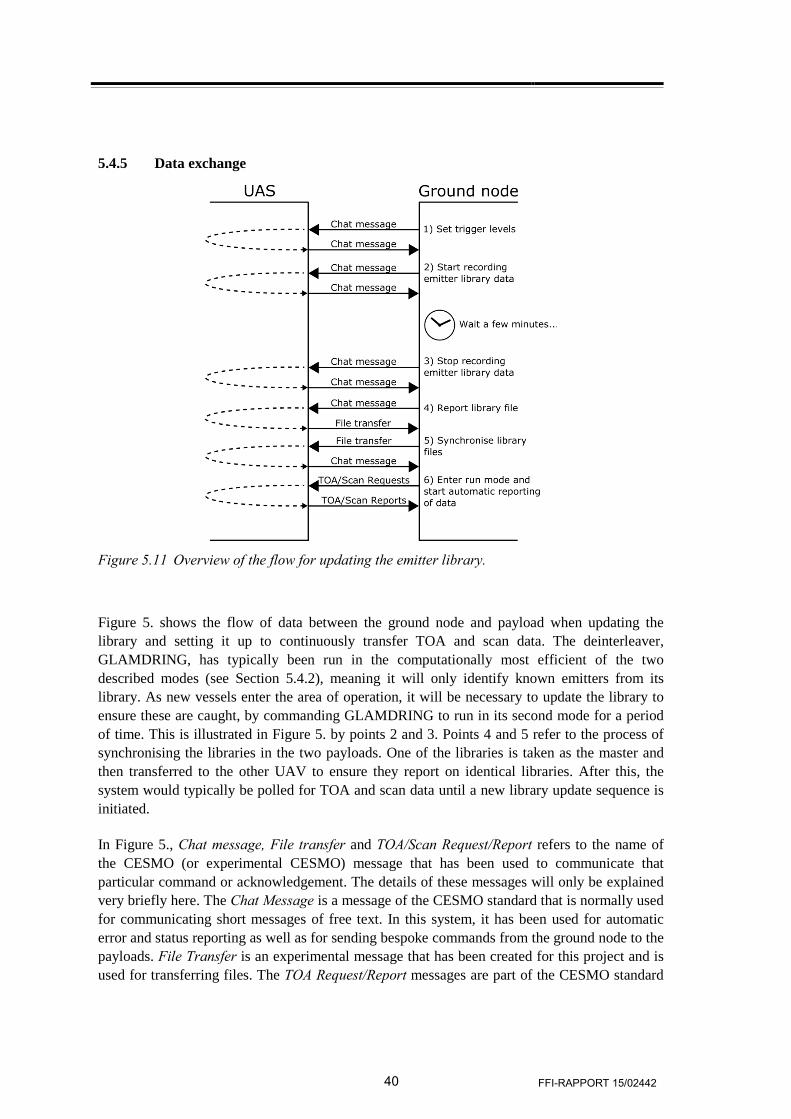
Figure 5.11 Overview of the flow for updating the emitter library.
Figure 5. shows the flow of data between the ground node and payload when updating the library and setting it up to continuously transfer TOA and scan data. The deinterleaver, GLAMDRING, has typically been run in the computationally most efficient of the two described modes (see Section 5.4.2), meaning it will only identify known emitters from its library. As new vessels enter the area of operation, it will be necessary to update the library to ensure these are caught, by commanding GLAMDRING to run in its second mode for a period of time. This is illustrated in Figure 5. by points 2 and 3. Points 4 and 5 refer to the process of synchronising the libraries in the two payloads. One of the libraries is taken as the master and then transferred to the other UAV to ensure they report on identical libraries. After this, the system would typically be polled for TOA and scan data until a new library update sequence is initiated.
In Figure 5., Chat message, File transfer and TOA/Scan Request/Report refers to the name of the CESMO (or experimental CESMO) message that has been used to communicate that particular command or acknowledgement. The details of these messages will only be explained very briefly here. The Chat Message is a message of the CESMO standard that is normally used for communicating short messages of free text. In this system, it has been used for automatic error and status reporting as well as for sending bespoke commands from the ground node to the payloads. File Transfer is an experimental message that has been created for this project and is used for transferring files. The TOA Request/Report messages are part of the CESMO standard
FFI-RAPPORT 15/02442 41
and are used to request and report pulse arrival times for an emitter over a certain period of time. The Scan Request/Report messages are used to request and report scan peaks and are currently experimental messages.
There might be situations or phases of the operation (e.g. transit) where ESM data is of no interest to the operator, and no TOA or scan data are requested. In such cases, the payload will still record and process radar pulses, but no messages will be created for broadcast, apart from the CESMO Platform Status Message, which is continuously populated with GPS and system information.
5.5 Possible improvements to the payload
To save time, existing systems and commercial products were used to build the payload. This was necessary to be able to demonstrate the system within the project time frame of one year. However, few of these components were suitable for use in UAVs, especially regarding weight and power consumption. Lighter components enable more fuel in the UAV and more efficient components mean the payload can operate longer on a smaller battery pack. A new payload using more specialized components throughout would therefore significantly increase the operating time of the UAV.
6 Ground node systems and software
6.1 Overview
This chapter describes the system that made up the ground node of the local CESMO network. Note that this is separate from the ground control station used to pilot the UAVs. The CESMO ground node is made up of a standard issue laptop running Windows 7 Enterprise and a UHF radio for communicating with the UAS. The custom software running on the laptop is split into two parts: one handling communication with the UAV payloads and one calculating emitter locations.
6.2 The CESMO interface – communicating with the UAV payloads
As mentioned in Section 395.4.4, a special scheme was created for the communication between the payloads and the ground node. A program was written to automate this task as much as possible, particularly in the phase of operation where the payloads return continuous streams of geolocation data.
42 FFI-RAPPORT 15/02442
This program also acts as the CESMO ground operator’s control module for the two payloads. It can be used to create and send correctly formatted commands for controlling the operation of the pulse processor as well as decode incoming messages from either payload. This includes display of payload GPS data, collection status and GLAMDRING processing status.
Another important task is to collate and prepare TOA and scan data received from the payloads and then format and send these to the geolocation software that is running in a separate application. These data are transferred in bursts, once per second, with each burst containing all received data for the second in question. A delay of 20 seconds is introduced at this point to ensure all data are received for a given second before they are forwarded to the geolocation software.
The CESMO interface and geolocation software communicate via local UDP ports: one port for scan data and one for TOA data for each payload, in total 4 ports.
6.3 Emitter geolocation software
The inputs to the emitter geolocation software are streams of positions, timestamps and scan description words from the two airborne sensors.
The scan description words are combined according to their library index, which indicates which pulse pattern in the GLAMDRING library they have been matched with. The results are a scan phase and a rotation time for each emitter that is detected by both sensors. These are sent to the GIS system where the resulting arc of possible locations on the geoid (see Chapter 3) are calculated and displayed.
The TOAs are combined to create all possible TDOA values given the distance between the sensors. Then time series with near-constant PRI and close to same TDOA values are extracted, and assumed to represent “real” TDOA values, i.e. the difference in travel time for pulses from one emitter to reach the sensors. The pulse series corresponding to one emitter is then compared to the emitter library either in GLAMDRING mode, running it through GLAMDRING’s LDI processing (see Section 5.4.2), or by matching the average PRI with the average PRI of the library entries. TDOAs getting a match in the library are then tagged with the library index and sent to the GIS system over UDP.
FFI-RAPPORT 15/02442 43
7 Communications infrastructure
7.1 Introduction
The primary use case for the LINE EW-UAS experiment was to collect sensor information and bring it to the decision makers, refined and fused with other sensor information. Ideally, it should be possible to deploy the sensors flexibly, without being restrained by communication setup requirements. Such restraints could include planning time, location of the UAV and ground node, reconfigurations, etc. In this chapter we present the communications infrastructure as it was at the time of the experiment at Ørland, the 5th of November 2015. This consists of the physical communication links and the network constructed over these. While the experiment includes data flowing from sensor network to strategic network, and also entails the communication to control the UAVs, this chapter focuses on solutions for payload data transport in the tactical domain.
7.2 Ambitions and motivation
The research program “Communications Infrastructure” at FFI, Division for Cyber Systems and Electronic Warfare, is one of several participants in the LINE EW-UAS experiment, contributing resources to support communication capabilities. These contributions have included support in defining a working concept for communication between the UAVs and from the UAVs to the FFI INI lab, support in the choice of communications bearers, procurement of communications equipment, implementation support, and participation during the experiment. A major incentive for this contribution has been the establishment of a platform to study the use of UAVs as communication nodes.
7.3 The tactical domain network architecture
The LINE EW-UAS experiment consists of several network segments. In the tactical domain, the network segments are the sensor network and the tactical network. The sensor network interconnects the UAV payloads and the CESMO ground node. The tactical network interconnects the CESMO ground node and the INI lab. The communication infrastructure for the tactical domain is shown in Figure 7.1.
44 FFI-RAPPORT 15/02442
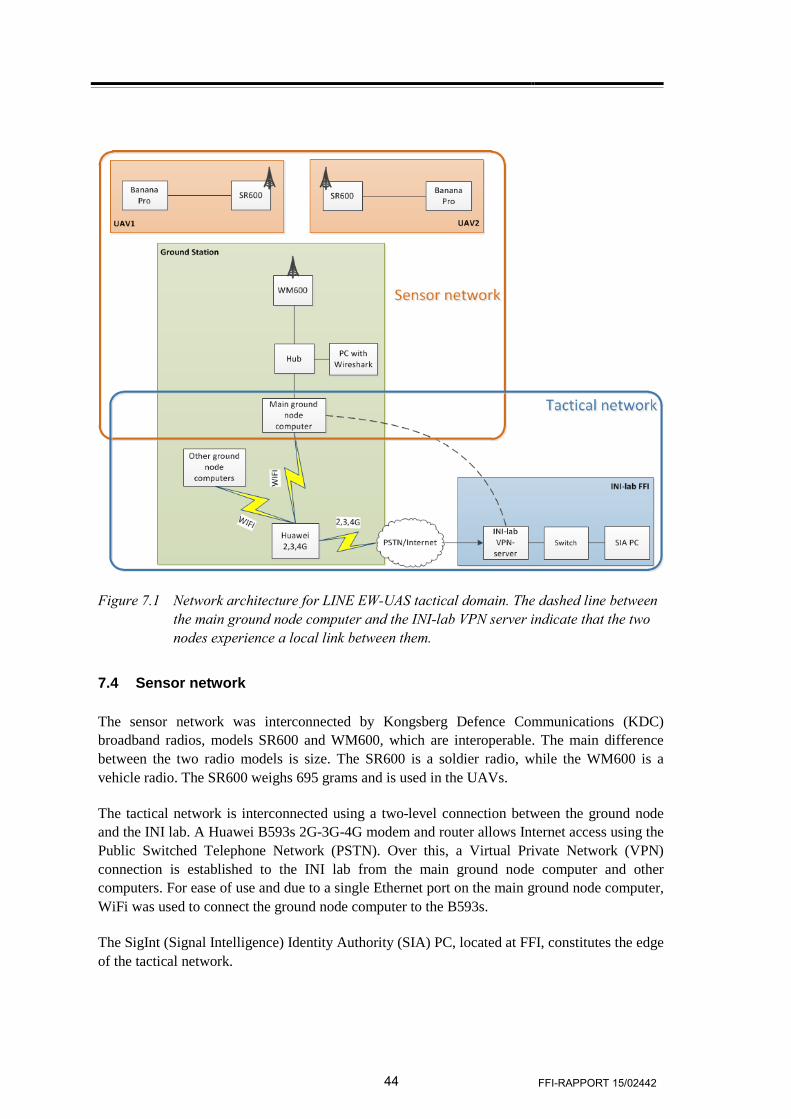
Figure 7.1 Network architecture for LINE EW-UAS tactical domain. The dashed line between the main ground node computer and the INI-lab VPN server indicate that the two nodes experience a local link between them.
7.4 Sensor network
The sensor network was interconnected by Kongsberg Defence Communications (KDC) broadband radios, models SR600 and WM600, which are interoperable. The main difference between the two radio models is size. The SR600 is a soldier radio, while the WM600 is a vehicle radio. The SR600 weighs 695 grams and is used in the UAVs.
The tactical network is interconnected using a two-level connection between the ground node and the INI lab. A Huawei B593s 2G-3G-4G modem and router allows Internet access using the Public Switched Telephone Network (PSTN). Over this, a Virtual Private Network (VPN) connection is established to the INI lab from the main ground node computer and other computers. For ease of use and due to a single Ethernet port on the main ground node computer, WiFi was used to connect the ground node computer to the B593s.
The SigInt (Signal Intelligence) Identity Authority (SIA) PC, located at FFI, constitutes the edge of the tactical network.
FFI-RAPPORT 15/02442 45
7.4.1 SR600 and WM600 broadband radios
The sensor network employed the KDC TacLAN UHF radio system. The UAVs were fitted with one KDC SR600 each. The standard monopole whip antenna was replaced with a custom antenna designed and produced at FFI, to be able to fit the radio in the payload compartment in the UAV. The antenna is described further in Section 5.3.3.2. A KDC WM600 broadband radio communicated with the UAVs. The SR600 and WM600 radios are compatible on air and can communicate in ad hoc modus, i.e., they can relay traffic from each other beyond the range of one link. The radios in the TacLAN system can be configured to use various transmission rates. In the experiment, the rates used were 1024 kbps and 128 kbps.
According to information from KDC, the standard queue size for the radio interface was 64 packets for 1024 kbps and 8 packets for 128 kbps, configured through the program “tc qdisc”. These queue limits were removed. The radio interface queue size was instead set to 1000 packets. The reason for removing the queue limits was to enable detection of radio loss and latency without wrongfully interpreting queue losses as transmission loss.
The SR600 radios were modified to add a timestamp in an IPv4 optional header, using the Click Modular Router framework3. The timestamp is in milliseconds and starts at 0 at the start of every new day. However, there was no time synchronization in this experiment, and the radios are reset to the Unix epoch (1970-01-01T00:00:00Z) at each power-up. Thus, as long as the power-up was not performed more than 24 hours ago, the timestamp reflects the time since the last radio power-up. In addition to the timestamp, all tagged packets were assigned a new incremental IPv4 sequence number, to easily identify packet loss and packet reordering at the ground node.
A Click script and code was developed to add the timestamp and sequential IPv4 identification to the packets originating from the CESMO application on each UAV, addressed to the ground node’s UDP port number 9050. No other packets were tagged. The size of the IPv4 optional header is 12 bytes. Care was taken not to change packets that would increase in size beyond Maximum Transmission Unit (MTU) and become fragmented because of this.
The radios were able to operate on frequencies spanning from 225 MHz to 400 MHz with up to 5 MHz bandwidth. A centre frequency of 323.000 MHz with 5 MHz bandwidth was selected. The use of this frequency is coordinated by the National Allied Radio Frequency Agency (NARFA) Norway, who granted the use, based on a simple application specifying when, where, altitude, power, frequency and bandwidth.
7.4.2 Wireshark PC
The Wireshark application is a network packet analyser. The Wireshark PC in Figure 7.1 is named after the application that runs on the computer and performs the logging of network data. A ruggedized Panasonic laptop running Windows 7 was used to log the traffic between the main 3 http://read.cs.ucla.edu/click/click
46 FFI-RAPPORT 15/02442
ground node computer and the UAVs. Using the hub, all traffic to or from the main ground node computer was repeated on the local network interface of the Wireshark PC.
Wireshark timestamps all logged packets, and thus we obtain two timestamps for each packet: one when the packet enters the radio network, and one as the packet leaves the network. This enables calculation of the queuing and transmission delay. In addition, the collection of all packets with sequential IPv4 identification makes it possible to evaluate the packet loss across the radio network.
7.5 Tactical network
The tactical network was interconnected using a public cell phone service, with a VPN connection on top of this. The Huawei B593s allowed a connection to the Internet, and the ground node main computer established a VPN connection to the lab network at the INI lab on top of this.
7.5.1 Huawei B593s 2-4G modem and router
The Huawei B593s interconnects the tactical network, enabling the VPN-connection to the INI lab for the main ground node computer. The B593s automatically selects the best available network (2G, 3G, 4G), and also supports Wi-Fi for local units.
7.5.2 VPN connection to the INI lab
A successful connection between the B593s and the Internet through the PSTN makes it possible to set up a VPN connection to the INI lab. The VPN server has a public IP address 128.39.8.30 and uses the protocol Point-to-Point Tunnelling Protocol (PPTP). Logging into this account assigns the client computer an IP address on the INI-lab LINE experiment network in the IP subnet range 10.10.40.x/24. Several client computers may use the same account simultaneously. A limitation of this setup is that the units are not reachable between the ends of the network, i.e. units at the INI-lab network will not be able to reach the UAV network. This could however also be seen as a feature, preventing unwanted communication between the operational network and the sensor network.
FFI-RAPPORT 15/02442 47
8 Trials and testing
8.1 Introduction
The project has been a joint effort by 8 different research groups from 5 different departments at FFI, each contributing subsystems and concepts that all require testing. This chapter describes some of the extensive field trials and tests that had to be carried out before the final demonstration could take place.
8.2 Testing the UAS at Eggemoen
A number of acceptance tests were performed at Eggemoen in August 2015. The tests focused on the fulfilment of all major requirements described in the contract between FFI and Maritime Robotics. The contract required each UAV to have a documented flight time of 10 hours before delivery. Due to time constraints and the overall impression of the system, it was decided to accept the UAVs as fully tested after about 5 hours flight time for each vehicle.
The delivery of the Penguin UAS to FFI was somewhat delayed as one of the vehicles crashed and was totally destroyed during testing at Eggemoen. As the vehicle was not yet formally delivered to FFI when this happened, the cost and responsibility for building another aircraft was on Maritime Robotics. A new vehicle was built and tested by MR and the complete system was delivered to FFI about 3 weeks after schedule.
During the acceptance tests, the complete system was also tested for any mutual interference between the payload and the vehicle avionics. Regarding flight safety, the most important issue is to ensure that the vehicle avionics (especially the GPS, based on previous experience) are not affected by the payload. And, of course, the payload must work properly also when installed in a powered-up aircraft.
During the ground tests, no mutual interference was observed. This was confirmed by all subsequent test flights.
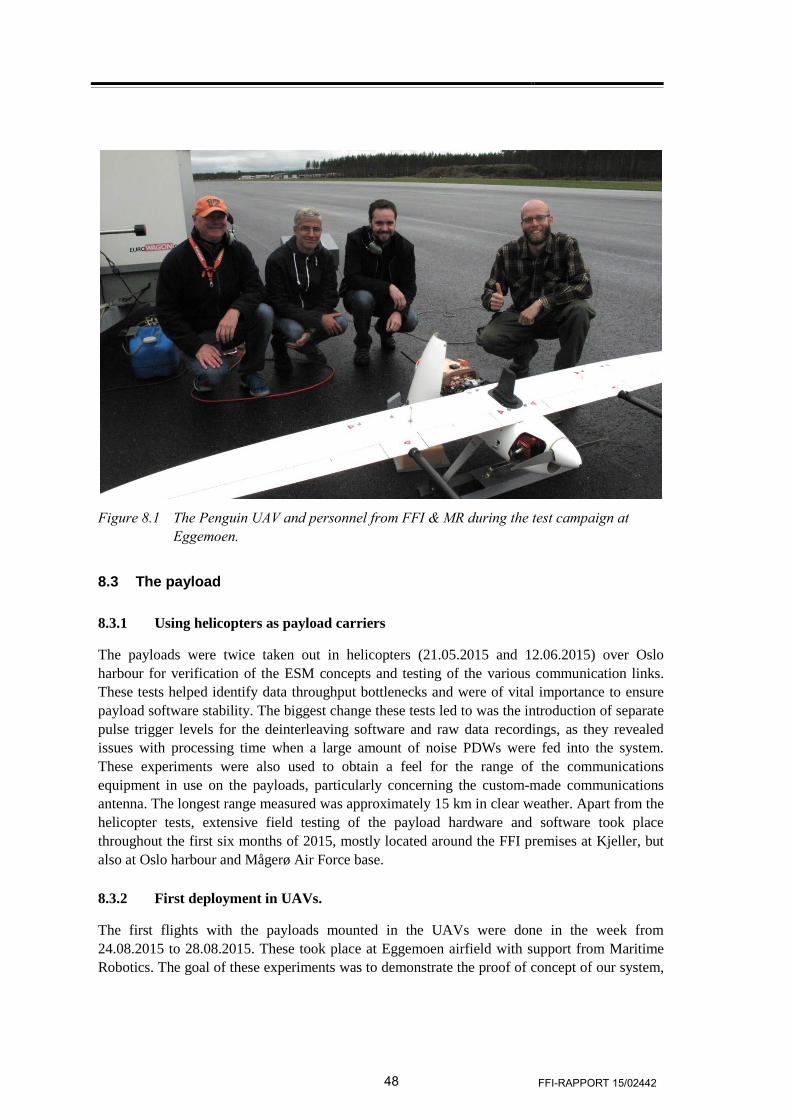
48 FFI-RAPPORT 15/02442
Figure 8.1 The Penguin UAV and personnel from FFI & MR during the test campaign at
Eggemoen.
8.3 The payload
8.3.1 Using helicopters as payload carriers
The payloads were twice taken out in helicopters (21.05.2015 and 12.06.2015) over Oslo harbour for verification of the ESM concepts and testing of the various communication links. These tests helped identify data throughput bottlenecks and were of vital importance to ensure payload software stability. The biggest change these tests led to was the introduction of separate pulse trigger levels for the deinterleaving software and raw data recordings, as they revealed issues with processing time when a large amount of noise PDWs were fed into the system. These experiments were also used to obtain a feel for the range of the communications equipment in use on the payloads, particularly concerning the custom-made communications antenna. The longest range measured was approximately 15 km in clear weather. Apart from the helicopter tests, extensive field testing of the payload hardware and software took place throughout the first six months of 2015, mostly located around the FFI premises at Kjeller, but also at Oslo harbour and Mågerø Air Force base.
8.3.2 First deployment in UAVs.
The first flights with the payloads mounted in the UAVs were done in the week from 24.08.2015 to 28.08.2015. These took place at Eggemoen airfield with support from Maritime Robotics. The goal of these experiments was to demonstrate the proof of concept of our system,
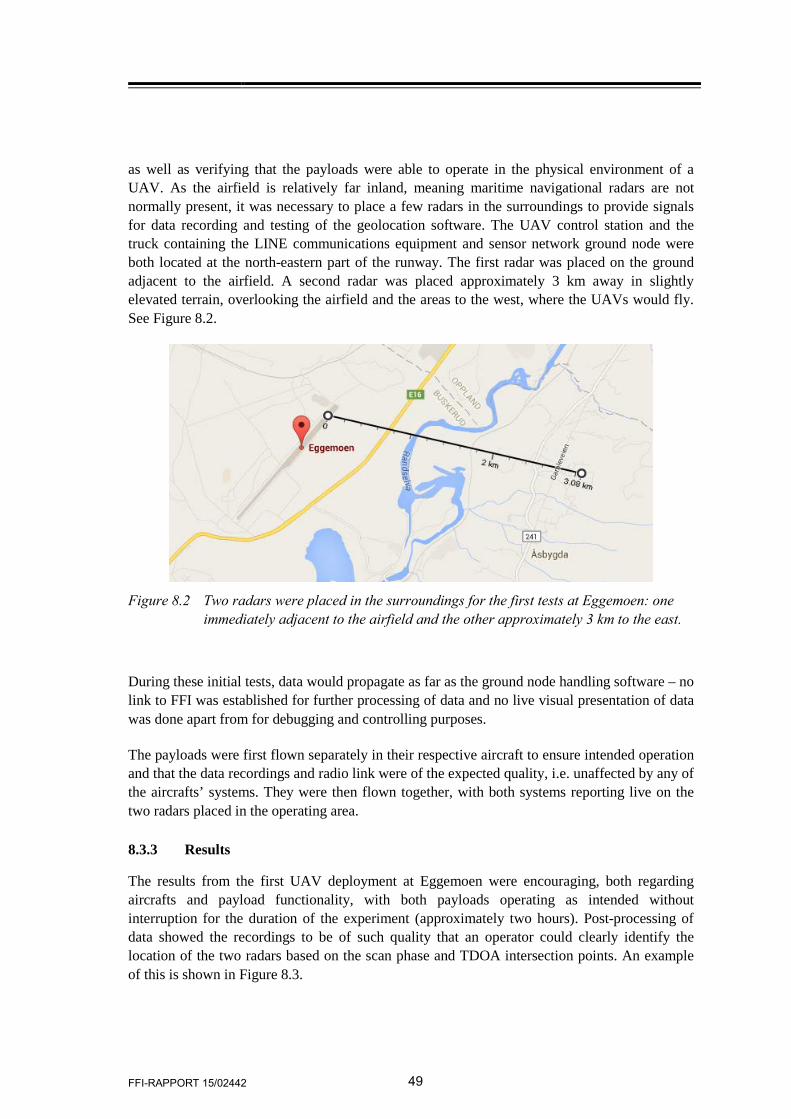
FFI-RAPPORT 15/02442 49
as well as verifying that the payloads were able to operate in the physical environment of a UAV. As the airfield is relatively far inland, meaning maritime navigational radars are not normally present, it was necessary to place a few radars in the surroundings to provide signals for data recording and testing of the geolocation software. The UAV control station and the truck containing the LINE communications equipment and sensor network ground node were both located at the north-eastern part of the runway. The first radar was placed on the ground adjacent to the airfield. A second radar was placed approximately 3 km away in slightly elevated terrain, overlooking the airfield and the areas to the west, where the UAVs would fly. See Figure 8.2.
Figure 8.2 Two radars were placed in the surroundings for the first tests at Eggemoen: one
immediately adjacent to the airfield and the other approximately 3 km to the east.
During these initial tests, data would propagate as far as the ground node handling software – no link to FFI was established for further processing of data and no live visual presentation of data was done apart from for debugging and controlling purposes.
The payloads were first flown separately in their respective aircraft to ensure intended operation and that the data recordings and radio link were of the expected quality, i.e. unaffected by any of the aircrafts’ systems. They were then flown together, with both systems reporting live on the two radars placed in the operating area.
8.3.3 Results
The results from the first UAV deployment at Eggemoen were encouraging, both regarding aircrafts and payload functionality, with both payloads operating as intended without interruption for the duration of the experiment (approximately two hours). Post-processing of data showed the recordings to be of such quality that an operator could clearly identify the location of the two radars based on the scan phase and TDOA intersection points. An example of this is shown in Figure 8.3.
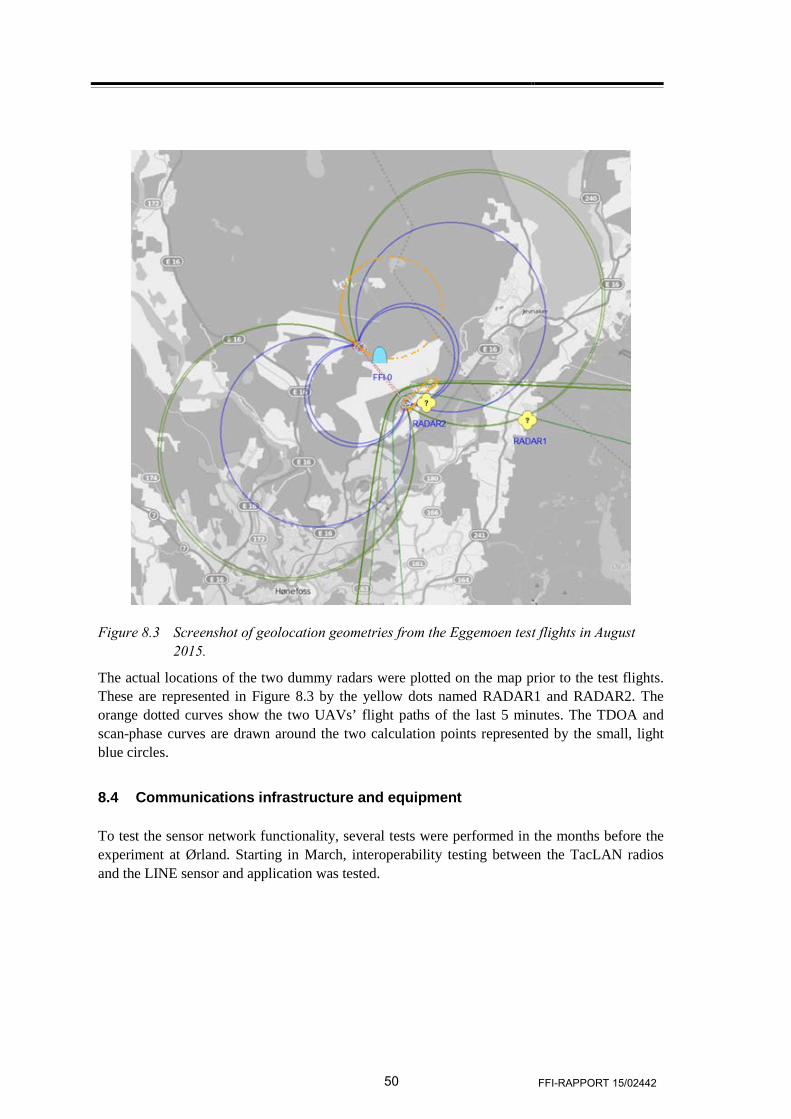
50 FFI-RAPPORT 15/02442
Figure 8.3 Screenshot of geolocation geometries from the Eggemoen test flights in August 2015.
The actual locations of the two dummy radars were plotted on the map prior to the test flights. These are represented in Figure 8.3 by the yellow dots named RADAR1 and RADAR2. The orange dotted curves show the two UAVs’ flight paths of the last 5 minutes. The TDOA and scan-phase curves are drawn around the two calculation points represented by the small, light blue circles.
8.4 Communications infrastructure and equipment
To test the sensor network functionality, several tests were performed in the months before the experiment at Ørland. Starting in March, interoperability testing between the TacLAN radios and the LINE sensor and application was tested.
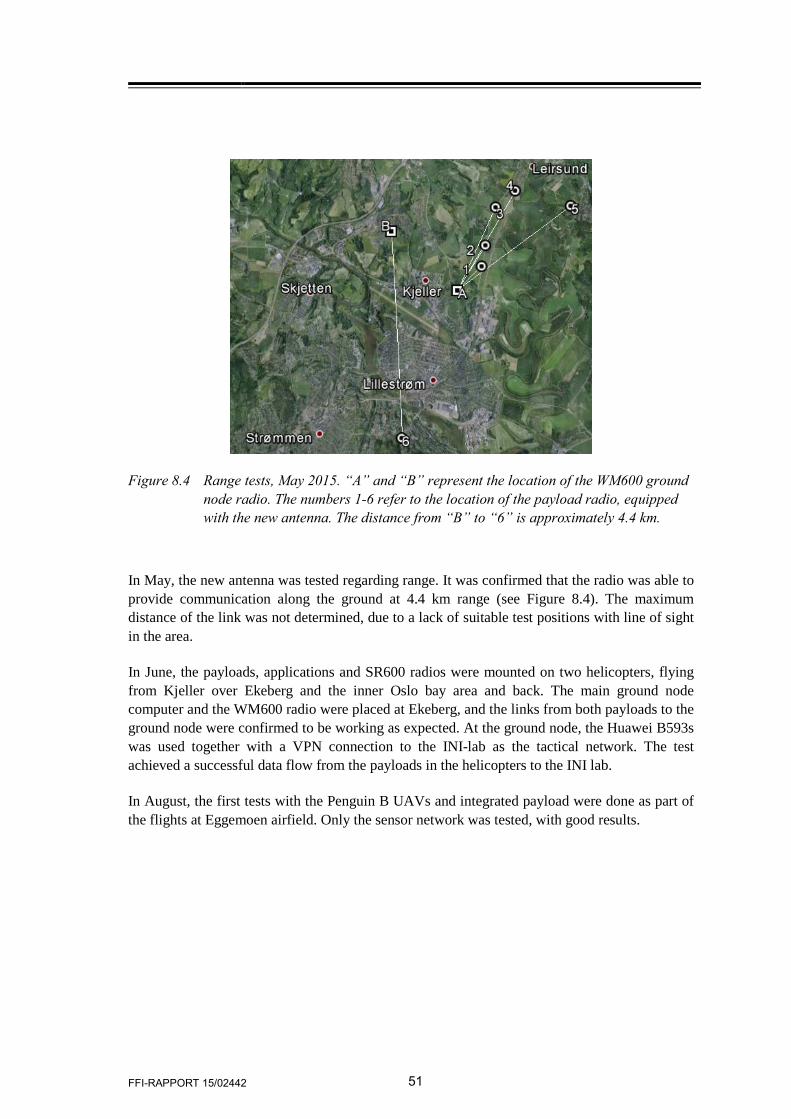
FFI-RAPPORT 15/02442 51
Figure 8.4 Range tests, May 2015. “A” and “B” represent the location of the WM600 ground node radio. The numbers 1-6 refer to the location of the payload radio, equipped with the new antenna. The distance from “B” to “6” is approximately 4.4 km.
In May, the new antenna was tested regarding range. It was confirmed that the radio was able to provide communication along the ground at 4.4 km range (see Figure 8.4). The maximum distance of the link was not determined, due to a lack of suitable test positions with line of sight in the area.
In June, the payloads, applications and SR600 radios were mounted on two helicopters, flying from Kjeller over Ekeberg and the inner Oslo bay area and back. The main ground node computer and the WM600 radio were placed at Ekeberg, and the links from both payloads to the ground node were confirmed to be working as expected. At the ground node, the Huawei B593s was used together with a VPN connection to the INI-lab as the tactical network. The test achieved a successful data flow from the payloads in the helicopters to the INI lab.
In August, the first tests with the Penguin B UAVs and integrated payload were done as part of the flights at Eggemoen airfield. Only the sensor network was tested, with good results.
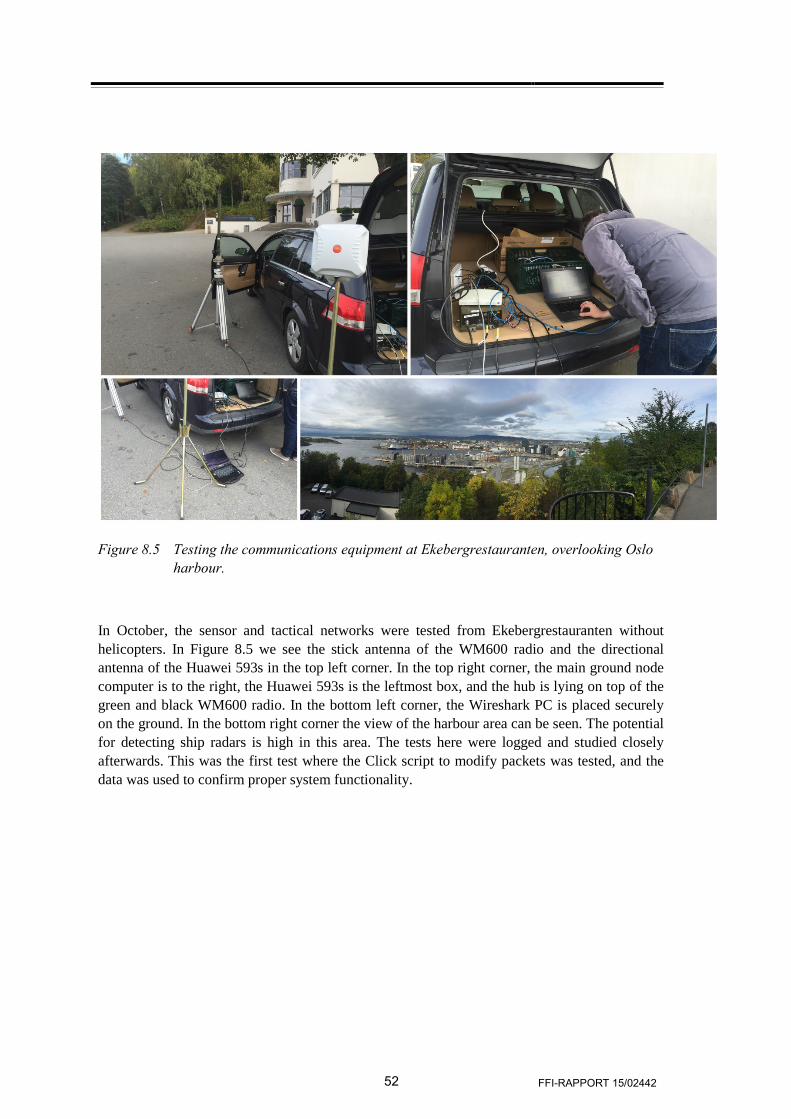
52 FFI-RAPPORT 15/02442
Figure 8.5 Testing the communications equipment at Ekebergrestauranten, overlooking Oslo harbour.
In October, the sensor and tactical networks were tested from Ekebergrestauranten without helicopters. In Figure 8.5 we see the stick antenna of the WM600 radio and the directional antenna of the Huawei 593s in the top left corner. In the top right corner, the main ground node computer is to the right, the Huawei 593s is the leftmost box, and the hub is lying on top of the green and black WM600 radio. In the bottom left corner, the Wireshark PC is placed securely on the ground. In the bottom right corner the view of the harbour area can be seen. The potential for detecting ship radars is high in this area. The tests here were logged and studied closely afterwards. This was the first test where the Click script to modify packets was tested, and the data was used to confirm proper system functionality.
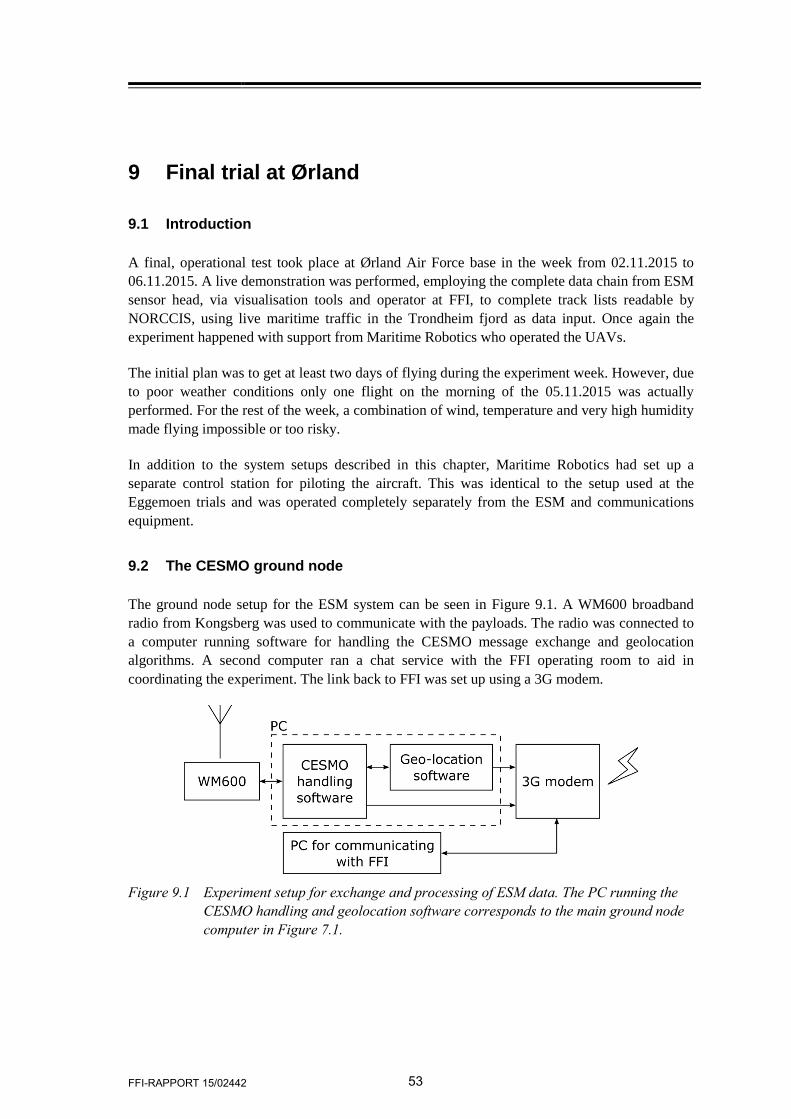
FFI-RAPPORT 15/02442 53
9 Final trial at Ørland
9.1 Introduction
A final, operational test took place at Ørland Air Force base in the week from 02.11.2015 to 06.11.2015. A live demonstration was performed, employing the complete data chain from ESM sensor head, via visualisation tools and operator at FFI, to complete track lists readable by NORCCIS, using live maritime traffic in the Trondheim fjord as data input. Once again the experiment happened with support from Maritime Robotics who operated the UAVs.
The initial plan was to get at least two days of flying during the experiment week. However, due to poor weather conditions only one flight on the morning of the 05.11.2015 was actually performed. For the rest of the week, a combination of wind, temperature and very high humidity made flying impossible or too risky.
In addition to the system setups described in this chapter, Maritime Robotics had set up a separate control station for piloting the aircraft. This was identical to the setup used at the Eggemoen trials and was operated completely separately from the ESM and communications equipment.
9.2 The CESMO ground node
The ground node setup for the ESM system can be seen in Figure 9.1. A WM600 broadband radio from Kongsberg was used to communicate with the payloads. The radio was connected to a computer running software for handling the CESMO message exchange and geolocation algorithms. A second computer ran a chat service with the FFI operating room to aid in coordinating the experiment. The link back to FFI was set up using a 3G modem.
Figure 9.1 Experiment setup for exchange and processing of ESM data. The PC running the
CESMO handling and geolocation software corresponds to the main ground node computer in Figure 7.1.
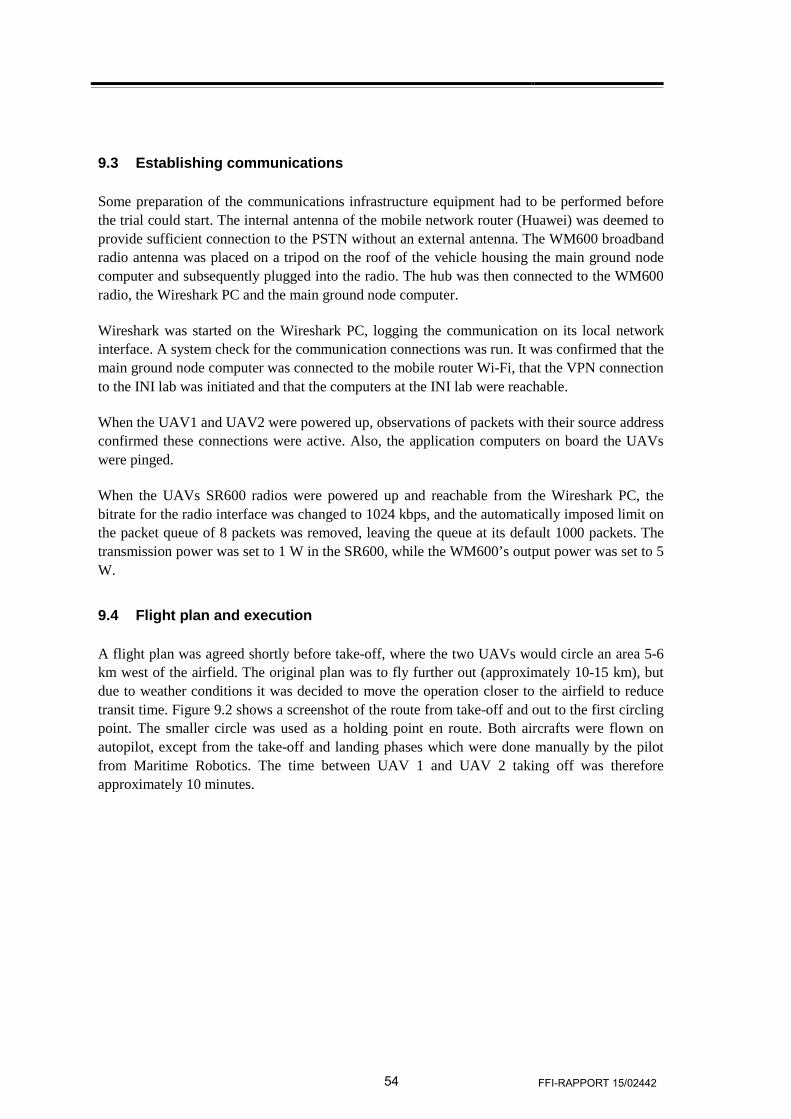
54 FFI-RAPPORT 15/02442
9.3 Establishing communications
Some preparation of the communications infrastructure equipment had to be performed before the trial could start. The internal antenna of the mobile network router (Huawei) was deemed to provide sufficient connection to the PSTN without an external antenna. The WM600 broadband radio antenna was placed on a tripod on the roof of the vehicle housing the main ground node computer and subsequently plugged into the radio. The hub was then connected to the WM600 radio, the Wireshark PC and the main ground node computer.
Wireshark was started on the Wireshark PC, logging the communication on its local network interface. A system check for the communication connections was run. It was confirmed that the main ground node computer was connected to the mobile router Wi-Fi, that the VPN connection to the INI lab was initiated and that the computers at the INI lab were reachable.
When the UAV1 and UAV2 were powered up, observations of packets with their source address confirmed these connections were active. Also, the application computers on board the UAVs were pinged.
When the UAVs SR600 radios were powered up and reachable from the Wireshark PC, the bitrate for the radio interface was changed to 1024 kbps, and the automatically imposed limit on the packet queue of 8 packets was removed, leaving the queue at its default 1000 packets. The transmission power was set to 1 W in the SR600, while the WM600’s output power was set to 5 W.
9.4 Flight plan and execution
A flight plan was agreed shortly before take-off, where the two UAVs would circle an area 5-6 km west of the airfield. The original plan was to fly further out (approximately 10-15 km), but due to weather conditions it was decided to move the operation closer to the airfield to reduce transit time. Figure 9.2 shows a screenshot of the route from take-off and out to the first circling point. The smaller circle was used as a holding point en route. Both aircrafts were flown on autopilot, except from the take-off and landing phases which were done manually by the pilot from Maritime Robotics. The time between UAV 1 and UAV 2 taking off was therefore approximately 10 minutes.
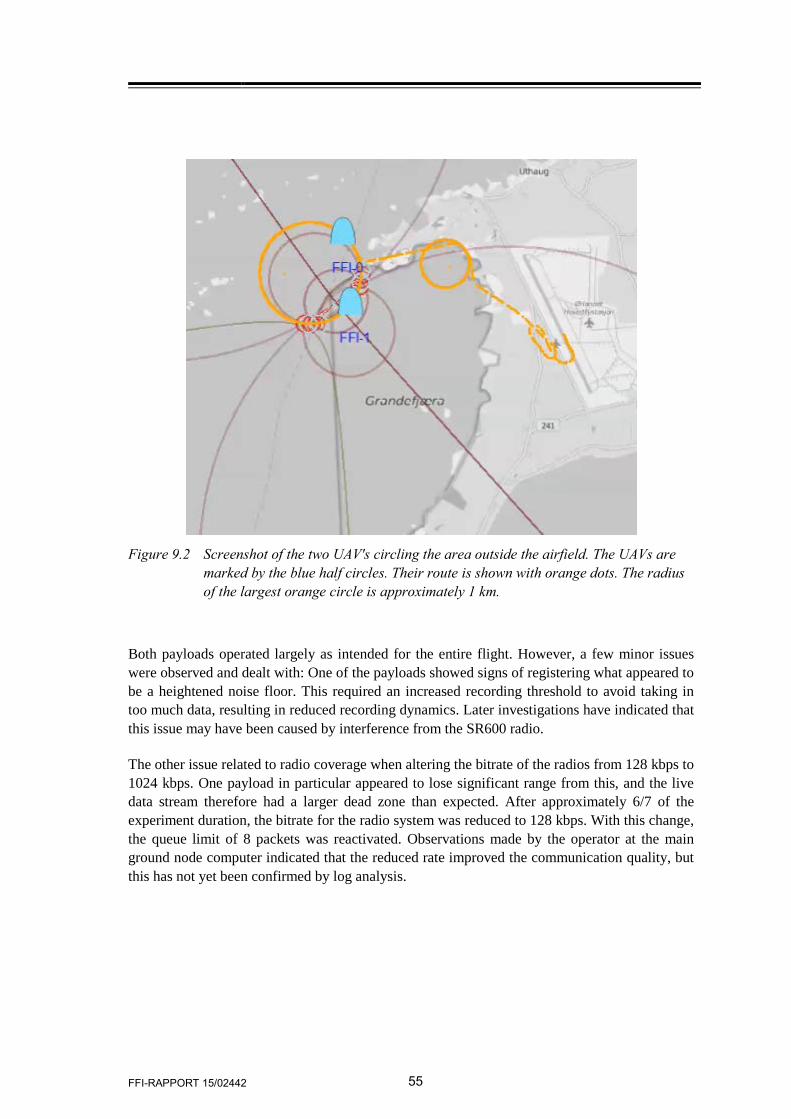
FFI-RAPPORT 15/02442 55
Figure 9.2 Screenshot of the two UAV's circling the area outside the airfield. The UAVs are
marked by the blue half circles. Their route is shown with orange dots. The radius of the largest orange circle is approximately 1 km.
Both payloads operated largely as intended for the entire flight. However, a few minor issues were observed and dealt with: One of the payloads showed signs of registering what appeared to be a heightened noise floor. This required an increased recording threshold to avoid taking in too much data, resulting in reduced recording dynamics. Later investigations have indicated that this issue may have been caused by interference from the SR600 radio.
The other issue related to radio coverage when altering the bitrate of the radios from 128 kbps to 1024 kbps. One payload in particular appeared to lose significant range from this, and the live data stream therefore had a larger dead zone than expected. After approximately 6/7 of the experiment duration, the bitrate for the radio system was reduced to 128 kbps. With this change, the queue limit of 8 packets was reactivated. Observations made by the operator at the main ground node computer indicated that the reduced rate improved the communication quality, but this has not yet been confirmed by log analysis.
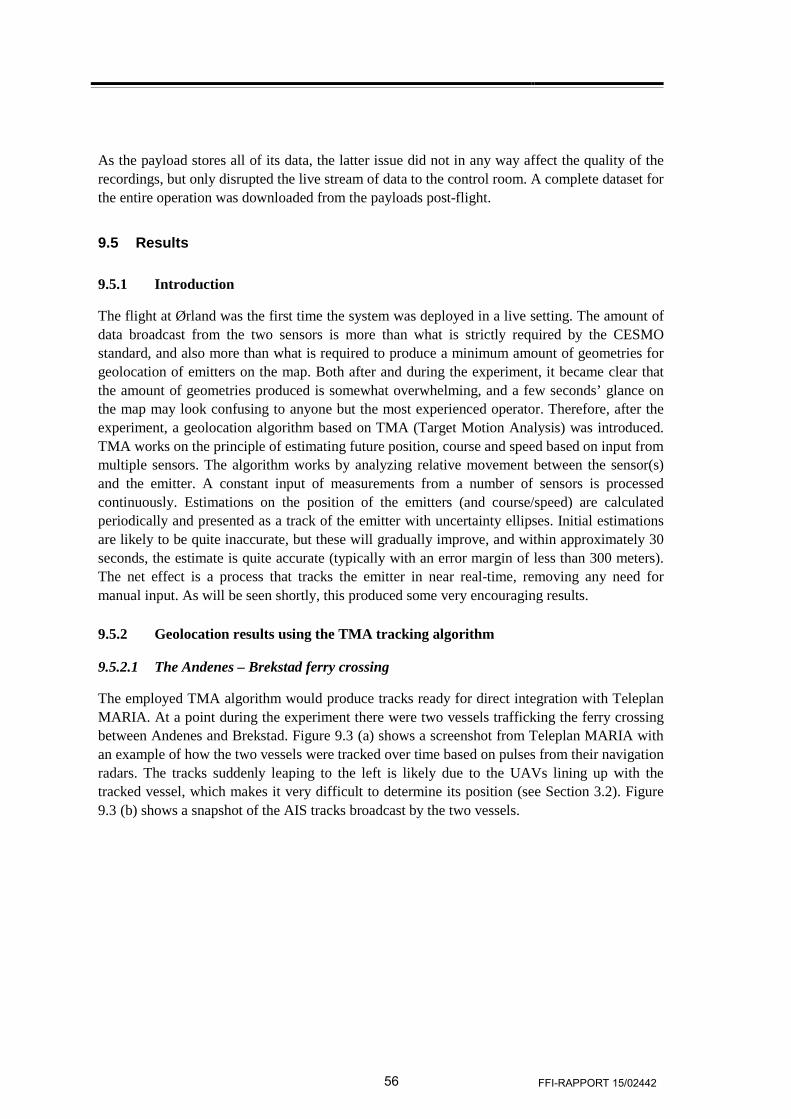
56 FFI-RAPPORT 15/02442
As the payload stores all of its data, the latter issue did not in any way affect the quality of the recordings, but only disrupted the live stream of data to the control room. A complete dataset for the entire operation was downloaded from the payloads post-flight.
9.5 Results
9.5.1 Introduction
The flight at Ørland was the first time the system was deployed in a live setting. The amount of data broadcast from the two sensors is more than what is strictly required by the CESMO standard, and also more than what is required to produce a minimum amount of geometries for geolocation of emitters on the map. Both after and during the experiment, it became clear that the amount of geometries produced is somewhat overwhelming, and a few seconds’ glance on the map may look confusing to anyone but the most experienced operator. Therefore, after the experiment, a geolocation algorithm based on TMA (Target Motion Analysis) was introduced. TMA works on the principle of estimating future position, course and speed based on input from multiple sensors. The algorithm works by analyzing relative movement between the sensor(s) and the emitter. A constant input of measurements from a number of sensors is processed continuously. Estimations on the position of the emitters (and course/speed) are calculated periodically and presented as a track of the emitter with uncertainty ellipses. Initial estimations are likely to be quite inaccurate, but these will gradually improve, and within approximately 30 seconds, the estimate is quite accurate (typically with an error margin of less than 300 meters). The net effect is a process that tracks the emitter in near real-time, removing any need for manual input. As will be seen shortly, this produced some very encouraging results.
9.5.2 Geolocation results using the TMA tracking algorithm
9.5.2.1 The Andenes – Brekstad ferry crossing
The employed TMA algorithm would produce tracks ready for direct integration with Teleplan MARIA. At a point during the experiment there were two vessels trafficking the ferry crossing between Andenes and Brekstad. Figure 9.3 (a) shows a screenshot from Teleplan MARIA with an example of how the two vessels were tracked over time based on pulses from their navigation radars. The tracks suddenly leaping to the left is likely due to the UAVs lining up with the tracked vessel, which makes it very difficult to determine its position (see Section 3.2). Figure 9.3 (b) shows a snapshot of the AIS tracks broadcast by the two vessels.
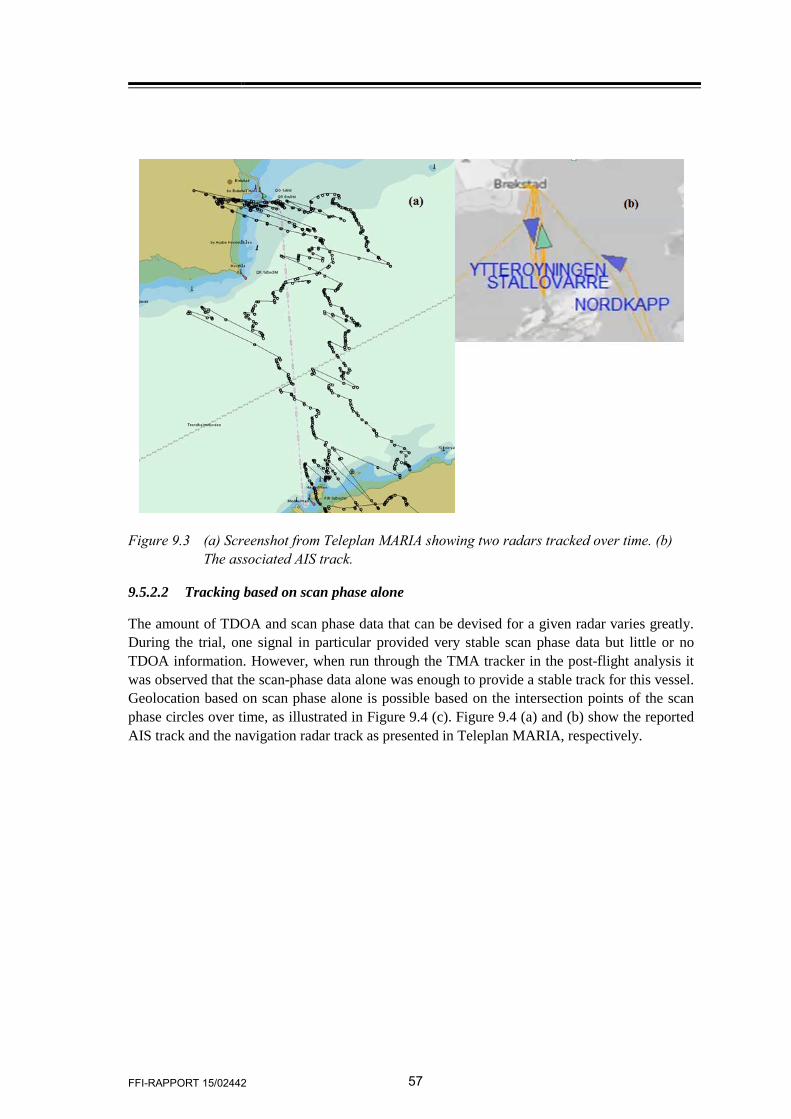
FFI-RAPPORT 15/02442 57
Figure 9.3 (a) Screenshot from Teleplan MARIA showing two radars tracked over time. (b) The associated AIS track.
9.5.2.2 Tracking based on scan phase alone
The amount of TDOA and scan phase data that can be devised for a given radar varies greatly. During the trial, one signal in particular provided very stable scan phase data but little or no TDOA information. However, when run through the TMA tracker in the post-flight analysis it was observed that the scan-phase data alone was enough to provide a stable track for this vessel. Geolocation based on scan phase alone is possible based on the intersection points of the scan phase circles over time, as illustrated in Figure 9.4 (c). Figure 9.4 (a) and (b) show the reported AIS track and the navigation radar track as presented in Teleplan MARIA, respectively.
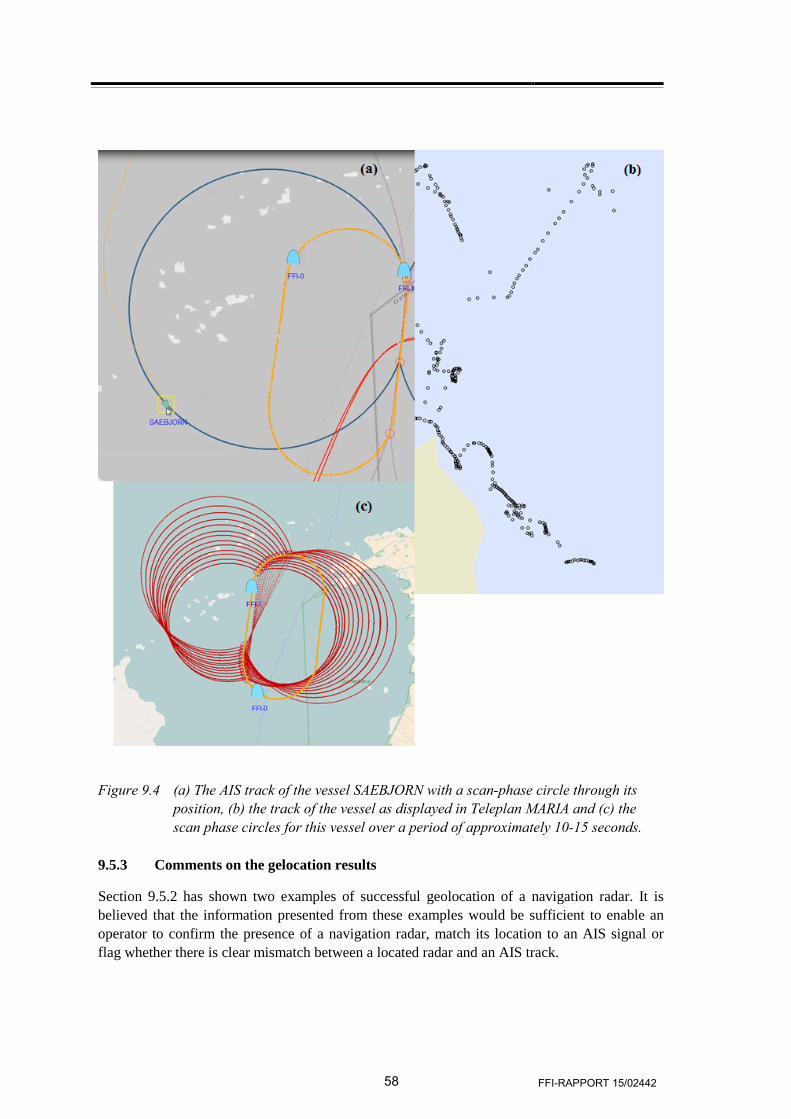
58 FFI-RAPPORT 15/02442
Figure 9.4 (a) The AIS track of the vessel SAEBJORN with a scan-phase circle through its position, (b) the track of the vessel as displayed in Teleplan MARIA and (c) the scan phase circles for this vessel over a period of approximately 10-15 seconds.
9.5.3 Comments on the gelocation results
Section 9.5.2 has shown two examples of successful geolocation of a navigation radar. It is believed that the information presented from these examples would be sufficient to enable an operator to confirm the presence of a navigation radar, match its location to an AIS signal or flag whether there is clear mismatch between a located radar and an AIS track.
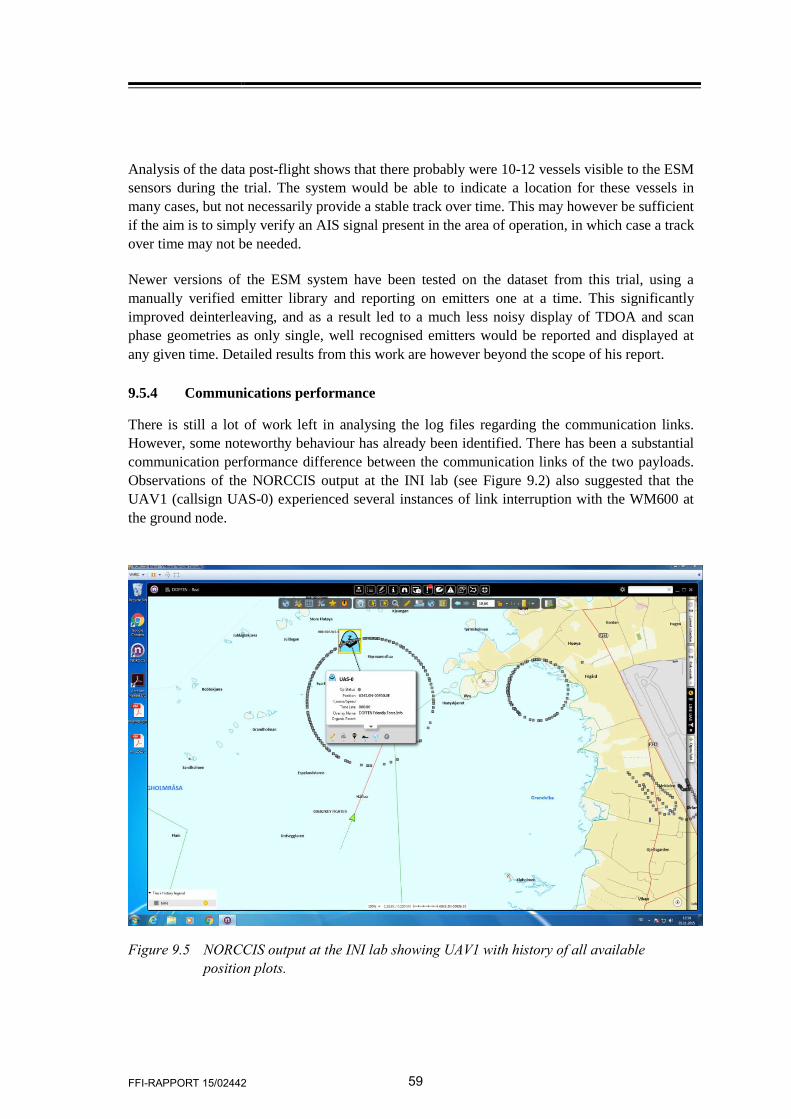
FFI-RAPPORT 15/02442 59
Analysis of the data post-flight shows that there probably were 10-12 vessels visible to the ESM sensors during the trial. The system would be able to indicate a location for these vessels in many cases, but not necessarily provide a stable track over time. This may however be sufficient if the aim is to simply verify an AIS signal present in the area of operation, in which case a track over time may not be needed.
Newer versions of the ESM system have been tested on the dataset from this trial, using a manually verified emitter library and reporting on emitters one at a time. This significantly improved deinterleaving, and as a result led to a much less noisy display of TDOA and scan phase geometries as only single, well recognised emitters would be reported and displayed at any given time. Detailed results from this work are however beyond the scope of his report.
9.5.4 Communications performance
There is still a lot of work left in analysing the log files regarding the communication links. However, some noteworthy behaviour has already been identified. There has been a substantial communication performance difference between the communication links of the two payloads. Observations of the NORCCIS output at the INI lab (see Figure 9.2) also suggested that the UAV1 (callsign UAS-0) experienced several instances of link interruption with the WM600 at the ground node.
Figure 9.5 NORCCIS output at the INI lab showing UAV1 with history of all available position plots.
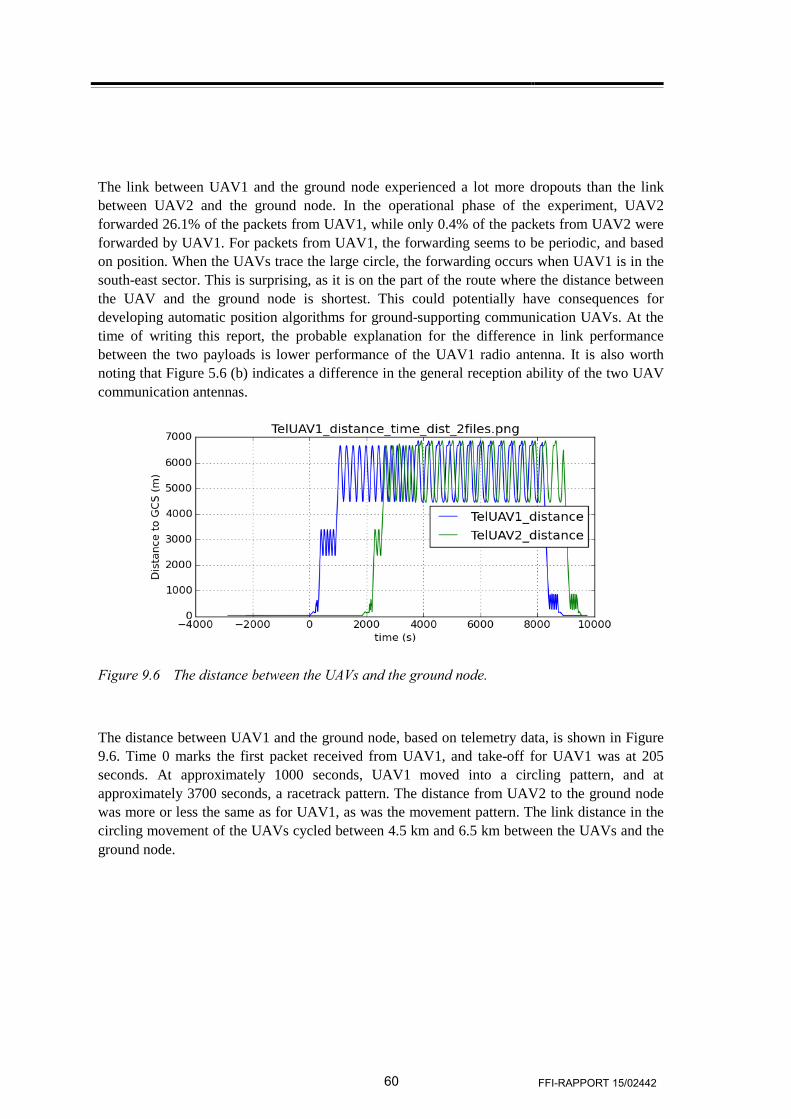
60 FFI-RAPPORT 15/02442
The link between UAV1 and the ground node experienced a lot more dropouts than the link between UAV2 and the ground node. In the operational phase of the experiment, UAV2 forwarded 26.1% of the packets from UAV1, while only 0.4% of the packets from UAV2 were forwarded by UAV1. For packets from UAV1, the forwarding seems to be periodic, and based on position. When the UAVs trace the large circle, the forwarding occurs when UAV1 is in the south-east sector. This is surprising, as it is on the part of the route where the distance between the UAV and the ground node is shortest. This could potentially have consequences for developing automatic position algorithms for ground-supporting communication UAVs. At the time of writing this report, the probable explanation for the difference in link performance between the two payloads is lower performance of the UAV1 radio antenna. It is also worth noting that Figure 5.6 (b) indicates a difference in the general reception ability of the two UAV communication antennas.
Figure 9.6 The distance between the UAVs and the ground node.
The distance between UAV1 and the ground node, based on telemetry data, is shown in Figure 9.6. Time 0 marks the first packet received from UAV1, and take-off for UAV1 was at 205 seconds. At approximately 1000 seconds, UAV1 moved into a circling pattern, and at approximately 3700 seconds, a racetrack pattern. The distance from UAV2 to the ground node was more or less the same as for UAV1, as was the movement pattern. The link distance in the circling movement of the UAVs cycled between 4.5 km and 6.5 km between the UAVs and the ground node.
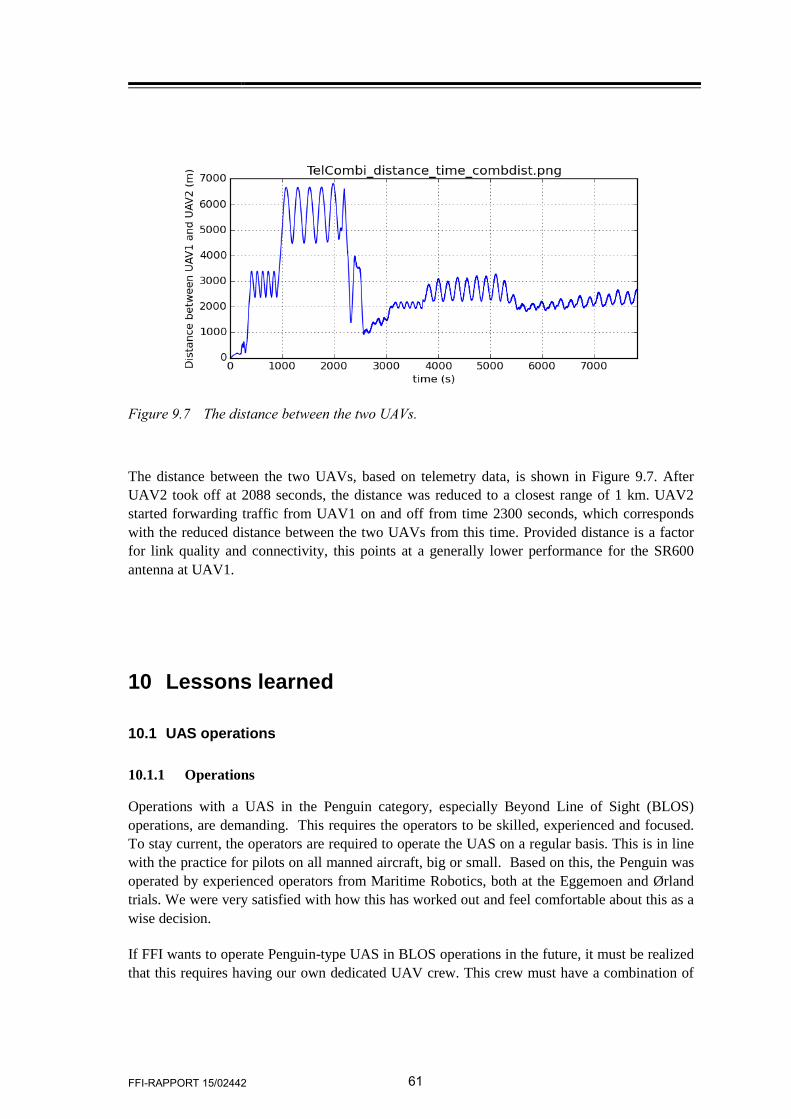
FFI-RAPPORT 15/02442 61
Figure 9.7 The distance between the two UAVs.
The distance between the two UAVs, based on telemetry data, is shown in Figure 9.7. After UAV2 took off at 2088 seconds, the distance was reduced to a closest range of 1 km. UAV2 started forwarding traffic from UAV1 on and off from time 2300 seconds, which corresponds with the reduced distance between the two UAVs from this time. Provided distance is a factor for link quality and connectivity, this points at a generally lower performance for the SR600 antenna at UAV1.
10 Lessons learned
10.1 UAS operations
10.1.1 Operations
Operations with a UAS in the Penguin category, especially Beyond Line of Sight (BLOS) operations, are demanding. This requires the operators to be skilled, experienced and focused. To stay current, the operators are required to operate the UAS on a regular basis. This is in line with the practice for pilots on all manned aircraft, big or small. Based on this, the Penguin was operated by experienced operators from Maritime Robotics, both at the Eggemoen and Ørland trials. We were very satisfied with how this has worked out and feel comfortable about this as a wise decision.
If FFI wants to operate Penguin-type UAS in BLOS operations in the future, it must be realized that this requires having our own dedicated UAV crew. This crew must have a combination of
62 FFI-RAPPORT 15/02442
engineering skills, operational experience and a thorough understanding of the working principles of flying vehicles. UAV operations must this crew’s primary activity. This is e.g. how NTNU has organized their experimentation with UAVs. For FFI to operate the Penguin UAS, it is assumed that two persons would have to be dedicated to this at least 50% of their working time. They would have to spend time preparing, maintaining and not least, flying the system frequently to be able to perform in a test campaign in a safe and timely manner.
The Penguin MR is configured in such a way that the plane needs to be manually controlled during take-off and landing. Due to the high weight and low power of the vehicle, a very skilled model aircraft pilot knowing the characteristics of the Penguin is needed for take-off and landing. The plane will stall as a result of the smallest error from the pilot. A medium level RC-pilot will not be able to fly the Penguin safely.
Visual Line Of Sight (VLOS) operations with lower cost, size and weight vehicles could be operated by personnel that do not have UAS operations as their primary task. However, it is strongly advised that also these types of operations are performed by selected personnel that actually operate UAVs frequently.
10.1.2 Weather conditions and icing
During our campaign at Ørland, the planned flights were delayed several days due to a combination of precipitation, wind and icing conditions. This type of weather is however quite typical in the coastal areas of Norway at this time of year. This emphasizes that smaller UAVs must be developed further to become more robust overall if they are to be used in our harsh environment, especially along the coast. This includes on-board icing detection and anti-icing, sealing against precipitation, as well as airframes able to penetrate stronger winds.
The UAV ground control systems should also be developed further to include mission planning tools that make use of local weather forecasts and weather prediction models.
During the one and only mission flown at Ørland, the humidity was in the region 85-90% relative humidity, and the temperature was 4-7 °C. As can be seen from Figure 4.3, this is a weather condition that implies serious risk of carburettor icing. Based on reports from a manned airplane pilot that had just flown in the same area and experienced no icing, it was decided to take a calculated risk and put the mission through. Both UAVs performed their mission without any problems, but the icing risk is still a factor that has to be considered when planning UAS operations.
10.1.3 Payload integration
For safe UAS operations it is extremely important that the payload integrated into the vehicle does not interfere with the on-board avionics, and that the weight and centre of gravity is not altered beyond acceptable limits. An example of weighting of the Penguin B is shown in Figure 10.1. During development of the payload, its weight was constantly monitored to ensure that the total weight limit was not reached.
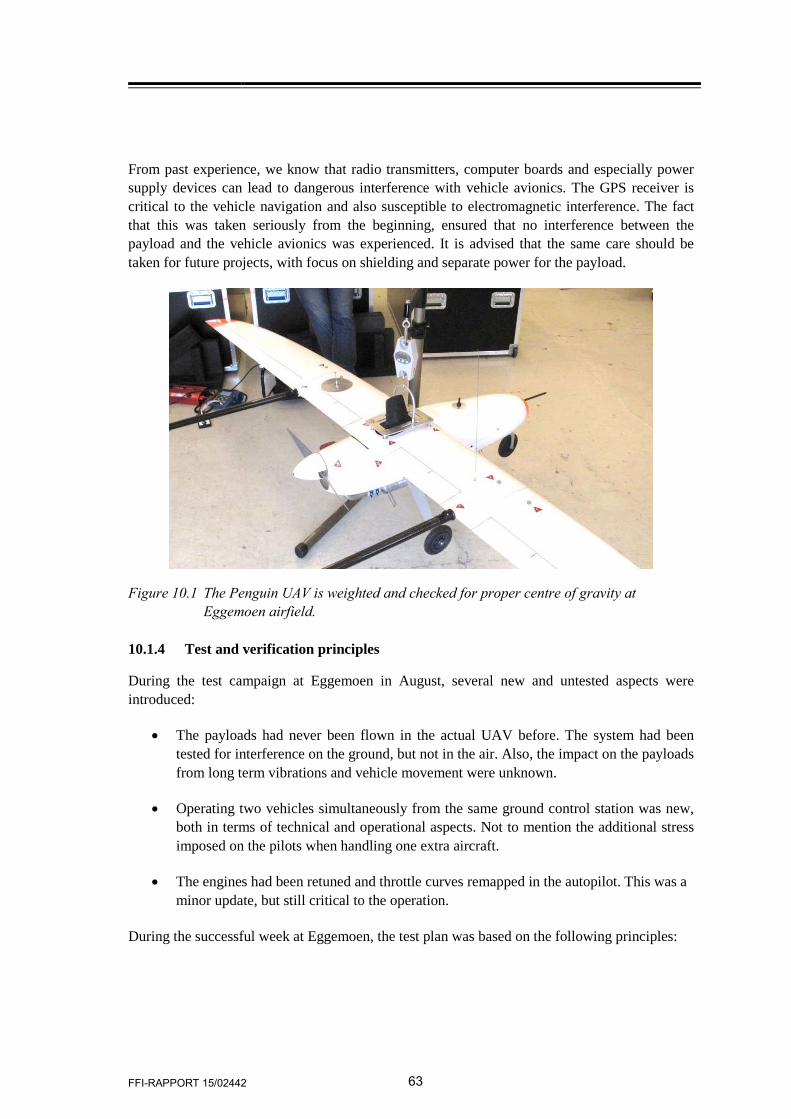
FFI-RAPPORT 15/02442 63
From past experience, we know that radio transmitters, computer boards and especially power supply devices can lead to dangerous interference with vehicle avionics. The GPS receiver is critical to the vehicle navigation and also susceptible to electromagnetic interference. The fact that this was taken seriously from the beginning, ensured that no interference between the payload and the vehicle avionics was experienced. It is advised that the same care should be taken for future projects, with focus on shielding and separate power for the payload.
Figure 10.1 The Penguin UAV is weighted and checked for proper centre of gravity at Eggemoen airfield.
10.1.4 Test and verification principles
During the test campaign at Eggemoen in August, several new and untested aspects were introduced:
• The payloads had never been flown in the actual UAV before. The system had been tested for interference on the ground, but not in the air. Also, the impact on the payloads from long term vibrations and vehicle movement were unknown.
• Operating two vehicles simultaneously from the same ground control station was new, both in terms of technical and operational aspects. Not to mention the additional stress imposed on the pilots when handling one extra aircraft.
• The engines had been retuned and throttle curves remapped in the autopilot. This was a minor update, but still critical to the operation.
During the successful week at Eggemoen, the test plan was based on the following principles:
64 FFI-RAPPORT 15/02442
• Test and verify only one new aspect at a time; e.g. do not fly two vehicles simultaneously without testing each plane and each payload on its own.
• Keep cool and think twice.
• Do not rush or skimp on pre-flight checks due to e.g. time restraints or weather conditions.
These principles should also be followed for future campaigns involving UAVs. In test campaigns involving UAVs, the concept of “let’s try – it might work” is not an option!
10.1.5 The Penguin MR UAS
In general, the Penguin MR system can be said to have performed well during both the Eggemoen and at Ørland trials, with no serious problems occurring.
10.1.6 Airframe performance
The payload capacity of the Penguin can be described as just-about sufficient, as the maximum take-off weight of 21.5 kg was almost reached with the payload installed. Note that this is the limit set by the manufacturer of the Penguin airframe. The airframe will certainly fly at an even higher weight; however, the take-off and landing will in practical terms be almost impossible or at least very, very sensitive.
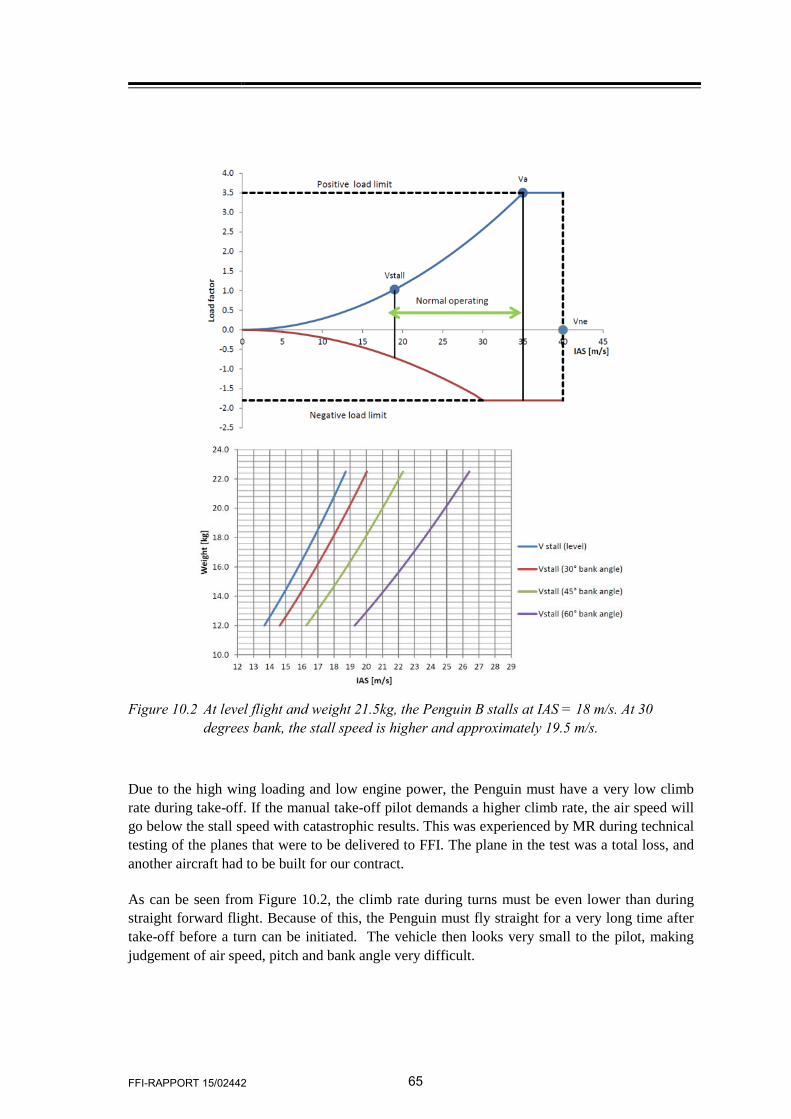
FFI-RAPPORT 15/02442 65
Figure 10.2 At level flight and weight 21.5kg, the Penguin B stalls at IAS = 18 m/s. At 30 degrees bank, the stall speed is higher and approximately 19.5 m/s.
Due to the high wing loading and low engine power, the Penguin must have a very low climb rate during take-off. If the manual take-off pilot demands a higher climb rate, the air speed will go below the stall speed with catastrophic results. This was experienced by MR during technical testing of the planes that were to be delivered to FFI. The plane in the test was a total loss, and another aircraft had to be built for our contract.
As can be seen from Figure 10.2, the climb rate during turns must be even lower than during straight forward flight. Because of this, the Penguin must fly straight for a very long time after take-off before a turn can be initiated. The vehicle then looks very small to the pilot, making judgement of air speed, pitch and bank angle very difficult.
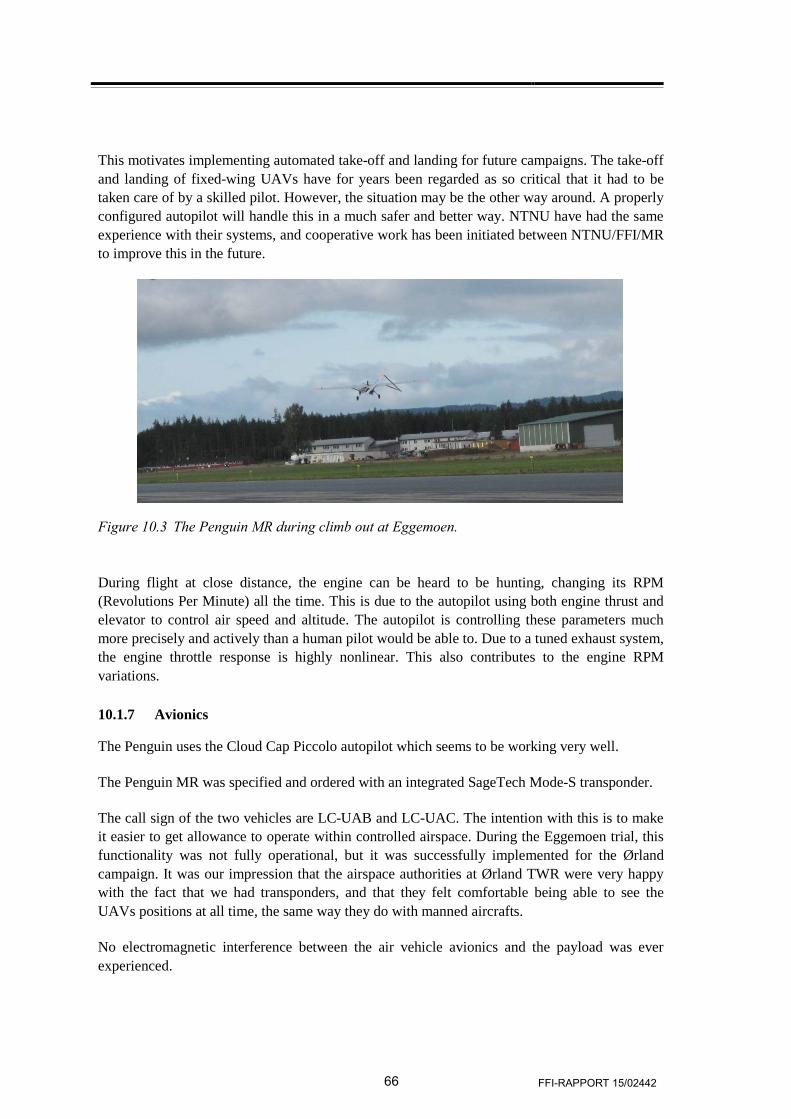
66 FFI-RAPPORT 15/02442
This motivates implementing automated take-off and landing for future campaigns. The take-off and landing of fixed-wing UAVs have for years been regarded as so critical that it had to be taken care of by a skilled pilot. However, the situation may be the other way around. A properly configured autopilot will handle this in a much safer and better way. NTNU have had the same experience with their systems, and cooperative work has been initiated between NTNU/FFI/MR to improve this in the future.
Figure 10.3 The Penguin MR during climb out at Eggemoen.
During flight at close distance, the engine can be heard to be hunting, changing its RPM (Revolutions Per Minute) all the time. This is due to the autopilot using both engine thrust and elevator to control air speed and altitude. The autopilot is controlling these parameters much more precisely and actively than a human pilot would be able to. Due to a tuned exhaust system, the engine throttle response is highly nonlinear. This also contributes to the engine RPM variations.
10.1.7 Avionics
The Penguin uses the Cloud Cap Piccolo autopilot which seems to be working very well.
The Penguin MR was specified and ordered with an integrated SageTech Mode-S transponder.
The call sign of the two vehicles are LC-UAB and LC-UAC. The intention with this is to make it easier to get allowance to operate within controlled airspace. During the Eggemoen trial, this functionality was not fully operational, but it was successfully implemented for the Ørland campaign. It was our impression that the airspace authorities at Ørland TWR were very happy with the fact that we had transponders, and that they felt comfortable being able to see the UAVs positions at all time, the same way they do with manned aircrafts.
No electromagnetic interference between the air vehicle avionics and the payload was ever experienced.
FFI-RAPPORT 15/02442 67
10.2 Communication infrastructure
10.2.1 Tactical network alternatives
The chosen solution for connecting the main ground node computer and the INI lab was to use the civilian cell phone network. This was chosen due to its coverage on the Norwegian main land, its low cost and high capacity. However, there are several other solutions that could have been used instead. These are briefly discussed below.
Solutions from the Iridium satellite system could potentially have provided sufficient capacity. However, the cost per byte is a lot higher than the PSTN. Geostationary satellite communication (SatCom) resources could have been leased, but the cost would have been even higher than for Iridium. It is also not as flexible as needed, with an expected delay of one month for ordering and a lower limit of one month of lease.
HF radio could have been used, but several aspects were deemed to disfavour this technology. If the communication rate over the distance between Ørland and Kjeller was to surpass 1-2 kbps, a suitable HF antenna would have to be very large to provide the necessary gain. There would also be a potential for interrupted communications due to electromagnetic radiation from the sun, which could vary on an hourly basis.
The chain of VHF radio stations along the coast was considered as an option, but was never looked into in detail, due to expected capacity limits.
ICE was considered, but in 2015 all ICE modems were upgraded to 4G technology along with all base stations. It was unknown at what time the network at Ørland would receive the upgrade. Investing in both old and new equipment to reduce the risk of link downtime at the time of the experiment was considered to be an unnecessary cost.
ADSL and other cable-based civilian ISP-operated technologies could have been used, but this would require an available connection near the main ground node computer. Either a connection in a nearby house would have to be obtained, or a connection would have to be ordered months in advance. Neither option was considered viable.
The Norwegian Armed Forces Interlan is a Local Area Network (LAN)-to-LAN data communication service that efficiently supports information exchange in the NAF data systems. This service was also considered, as the experiment was to take place near a major military airbase. However, the exact location of the operation within the airbase was not known until the day of the experiment, and the flexibility given by a wireless connection to the INI lab was preferred. The setup time for connecting equipment into the Interlan was also unknown.
There was also work done on a military 3G communication node, to connect through Interlan to the INI lab. However, this was prototype equipment and ended up consuming too much manpower in order to make it work the way we wanted it to.
68 FFI-RAPPORT 15/02442
10.3 ESM
10.3.1 Data processing in the payload
Constructing an autonomous ESM payload for real-time operation is challenging and requires implementation of a carefully thought-through architecture to ensure stable operation. The system must be able to make independent decisions regarding its own processing load, particularly in the presence of noisy emitters or a high general noise floor. Achieving this requires extensive system profiling to identify potential throughput bottlenecks. There is also no substitute for testing and monitoring in a real-life environment, as a live electromagnetic spectrum always contains unexpected disturbances that are hard to mimic in the lab. Oslo harbour proved to be a particularly useful testing environment in this regard.
10.3.2 Presenting confident geolocations
As mentioned at the beginning of Chapter 9, one of the problems faced when presenting the results was the large amount of data reported. This is more than anything a consequence of the system operating in a crowded electromagnetic spectrum (as will always be the case). Navigation radars tend to share many similar properties, and radars from the same manufacturer may in many cases be indistinguishable to the GLAMDRING software, particularly in this scenario where GLAMDRING will have to work with a minimum of sorting parameters. Another factor that has already been mentioned is the fact that the system reported all data from all library tags, instead of data from just one tag at a time, which would be more in line with CESMO. This requires an automated tracker on the ground, as the sheer amount of data is simply overwhelming to a manual operator, particularly if there are overlapping library tags for the same radar or if two or more radars are indistinguishable.
11 Further work
11.1 Autonomy
Autonomous control of multiple unmanned systems is in many respects advantageous. The coordinated use of many units can often result in a task being completed faster and more efficiently compared to the use of a single-unit system. In addition, if these tasks can be completed autonomously, considerable operational savings in human resources can be expected.
LINE EW-UAS is fundamentally based on multiple UAVs flying co-ordinately in order to work efficiently. This is due to the nature of the geolocation algorithm employed, which dynamically compares radar pulse data obtained from several spatially distributed sensors. It is challenging to operate distributed systems autonomously. As a result, the first demonstration of the LINE
FFI-RAPPORT 15/02442 69
EW-UAS concept was manually steered and controlled in order to lower project risk. Now that a proof-of-concept is demonstrated, autonomous steering of the UAVs based on sensor input can be introduced and studied. Since LINE EW-UAS consists of 2 independent UAVs it should be straightforward to dynamically calculate the optimal configuration using the Cramer-Rao Lower Bound. The Autonomy project at FFI will develop and optimize a TDOA simulator applicable to LINE EW-UAS. This simulator can be used to produce optimal UAV guidance in real-world LINE EW-UAS tests. The simulator will take real-time sensor data via ground link and produce optimal waypoints that can be fed to the UAV control station, monitored by a flight operator for safety. A fully autonomous LINE EW-UAS system, with minimal human intervention during all aspects of operation, is the end goal of LINE EW-UAS regarding autonomy.
11.2 Broadband Radar EW
The LINE2 sensor was chosen as a starting point for UAV-based radar EW applications for two reasons: the first one is that LINE2 was the only (near) operational EW sensor available at the time of the project kick-off. The second is that LINE2 is the least complex sensor system among the EW sensors being developed at FFI. LINE2 is a narrowband radar ESM sensor capable of detecting maritime navigation radars at 9.4 GHz. This makes LINE2 unsuitable for general radar ESM applications. The future and more capable DIPP3/EKKO3 sensor suite allows for broadband EW. This type of broadband radar EW sensors is particularly interesting in a Suppression of Enemy Air Defence (SEAD) setting where unknown radar systems are detected and geolocated using ESM techniques like TDOA and countered using different electronic countermeasures techniques. An autonomous swarm of UAV-based broadband EW sensors are ideally suited for such operations, especially when the air defence systems are mobile. When DIPP3/EKKO3 is operational, a swarm of autonomous broadband EW-UAS should be built and tested in a SEAD scenario. Efficient SEAD is one of the main goals of UAV-based EW.
11.3 Networked ESM
There is wide scope for connecting sensors in a network in the ESM context. An ESM sensor operating alone can only warn against the presence of a radar and will not be able to geolocate it. Two or more together can locate the radar but require coordination of their recorded information to do so, for example over a network. Geometries (i.e. placement of the sensors relative to the emitter) also play an important part in the geolocation process, and availability of several sensors on the same network can therefore aid the system operator in selecting the sensors likely to form the best geometries relative to the emitter in question. An intriguing extension to this is to use the sensor nodes not in use as communication relays for the “active” ones, which in turn reduces the need for the system to include a powerful radio, resulting in an even more compact system.
70 FFI-RAPPORT 15/02442
11.4 Communication infrastructure
A platform for further experimentation with UAV–ground and UAV–UAV communications has been established through the LINE EW-UAS experiment. The preliminary results from the first experiment with this platform indicate that there is substantial variance in the communication performance between the two (expectedly) identical platforms, which should be investigated further.
When the technical issues are resolved, the potential for using the UAV for ground network performance increase should be investigated further. A first proposed experiment is to establish a ground network of three or four vehicles, stretched as far as possible, and then introducing the UAV as an elevated network node. Evaluating the link quality and the size of the extended network radius could give valuable information for further study of UAVs used to increase the performance of tactical ground networks.
Further, the platform can be used to evaluate algorithms for UAV placement to improve ground and air networks. Antennas mounted on fixed-wing UAVs will move with the attitude of the vehicle, making even the performance of omni-directional antennas dependent on the vehicle attitude.
11.5 LINE III
Work is underway to implement LINE III, an optimised sensor package based on the payload system described in this report. LINE III will make use of a Xilinx Zynq chip, combining an FPGA and a dual-core ARM processor on the same die, resulting in a significantly more compact system. Collection capabilities will be improved, and the processing system will be redesigned to fully implement the CESMO standard, allowing the system to enter into bigger, collaborative networks of ESM sensors.
12 Conclusion
This report has described a practical use case for UAVs in the context of a surveillance operation based on EW technology. We demonstrate how ESM technology can be applied to create a system for surveillance of civilian, maritime traffic using low-cost, stock components. We also show the steps required to construct a UAV payload of such a system. Finally, it is shown how sensor data produced in the payloads can be carried forward and presented in high-level operational tools that are already well known to prospective end-users.

FFI-RAPPORT 15/02442 71
The entire project duration was approximately 1 year. Successful project completion within this short time frame was made possible by a collective, cross-departmental effort by no less than 8 different FFI research groups.
72 FFI-RAPPORT 15/02442
Appendix A 3D printing as enabling technology
A.1 Introduction
3D printing is the enabling technology that could allow us to design, adapt and optimize platforms around sensors, and not vice versa. This design philosophy emphasizes the sensor-driven development of unmanned vehicles, acknowledging that sensors (and effectors) give meaning to the deployment of autonomous systems. Also, a technology that allows adaptation of the platform instead of the sensors, would greatly reduce the risk of sensor efficiency loss when integrating the unmanned system. Furthermore, when 3D printing multi-materials (8), one could even envision fully integrated sensor electronics, directly printed into the platform structure. Structronics, a term used by the University of Southampton (9), is when electronic wirings, antennas, servos, propulsion systems and even computational units are printed and embedded into mechanical platform structures. As a consequence, structronics holds the potential for a true holistic approach to autonomous system optimization. The emerging technology of structronics requires FFI to inquire the state-of-the-art within the field of 3D printing, and research the applicability of structronics to the development of future autonomous systems.
A.2 3D printing in the LINE EW-UAS project
The LINE EW-UAS project has followed two approaches to 3D printing. The first being more academically orientated, with research into materials properties applicable to 3D-printed UAVs (10), structronics with 3D-printed antennas integrated into UAV structures (11), and low-cost fixed-wing VTOL (Vertical Take-Off and Landing) UAVs based on hybrid production technologies mixing 3D printing and conventional foam cutting methods (12). All of this research has been conducted in cooperation with the University of Southampton. Results obtained clearly indicate that further research into hybrid technologies for low cost UAV production (13) and novel embedded structronics are promising research topics, with high potential for future operational use in unmanned and autonomous systems.
The second approach to 3D printing in the LINE EW-UAS project is more practically oriented, focusing on 3D printing of UAV components. FFI purchased a Stratasys Fortus 400mc additive manufacturing production machine in 2011 that has later been used in different projects throughout the institute. The ability to produce polymer parts using an additive process has given benefits compared to a subtractive process. Complicated structures have previously often required more components, whereas the additive process now allows us to produce the same structure with fewer parts.
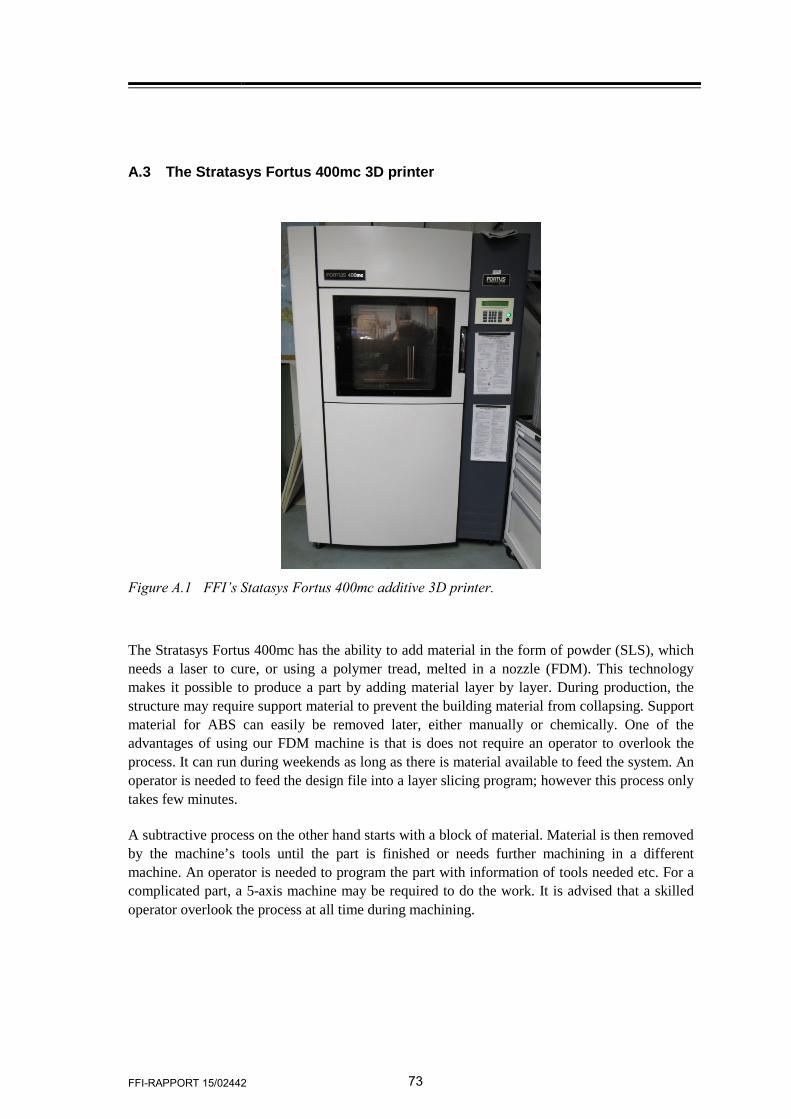
FFI-RAPPORT 15/02442 73
A.3 The Stratasys Fortus 400mc 3D printer
Figure A.1 FFI’s Statasys Fortus 400mc additive 3D printer.
The Stratasys Fortus 400mc has the ability to add material in the form of powder (SLS), which needs a laser to cure, or using a polymer tread, melted in a nozzle (FDM). This technology makes it possible to produce a part by adding material layer by layer. During production, the structure may require support material to prevent the building material from collapsing. Support material for ABS can easily be removed later, either manually or chemically. One of the advantages of using our FDM machine is that is does not require an operator to overlook the process. It can run during weekends as long as there is material available to feed the system. An operator is needed to feed the design file into a layer slicing program; however this process only takes few minutes.
A subtractive process on the other hand starts with a block of material. Material is then removed by the machine’s tools until the part is finished or needs further machining in a different machine. An operator is needed to program the part with information of tools needed etc. For a complicated part, a 5-axis machine may be required to do the work. It is advised that a skilled operator overlook the process at all time during machining.

74 FFI-RAPPORT 15/02442
Appendix B Project management
The LINE EW-UAS project has been developed, financed and organized in a somewhat untraditional way for FFI. The process of developing and financing the project can be viewed as a cooperative network (14) of different research groups pooling their resources together in order to reach a common goal, though still in line with each participant’s research agenda. However, once project funding and collaborative resources were contractually secured, standard FFI guidelines with an appointed project manager were followed.
B.1 Project development and financing - LINE EW-UAS as a cooperative network
In the case of LINE EW-UAS, the cooperative network consisted of 8 different FFI research groups and a core funding provided by FFI centrally. These collaborators conceived and developed the initial concept of using UAV-based RF sensors to produce useful electronic warfare information in an operational maritime surveillance setting.
A cooperative network is a way of organising research and academics in order to promote cross disciplinary innovation that is able to transcend cultural, geographical and organisational differences so common to many traditional organisations. This type of organisation is particularly suitable for solving complex problems that require the dynamic mobilisation of many different types of knowledge and skills in order to succeed, (15) (16) (17). The network participators are not “employees” but contribute according to their own wish and with their own resources, in order to promote and develop the network organisation. Cooperative networks are typically considered to be extensively experimental, promoting ad-hoc cooperation and use peer evaluation for “steering”. Such cooperative networks are characterised by two fundamental self-reinforcing processes (called network effects) (15):
• The possibility of cooperation, sharing of resources and exchange of information increases with the level of participation.
• The larger the network, the more attractive it is to use and contribute to common network resources.
These are key properties that many organisations strive to achieve in order to promote innovation.
B.2 Project risk
The major risks in all kinds of projects can be coarsely categorised as follows:
• Cost overrun and time delays due to unexpected lack of available resources.
FFI-RAPPORT 15/02442 75
• Knowledge gaps and loss of project synchronisation.
The sheer number of collaborators in the LINE EW-UAS project is in itself a risk reducing factor, as cost overruns can be shared between different groups and a larger span of human resources is available to fill in unexpected knowledge gaps. On the other hand, the large number of participants is also the biggest risk factor, due to the increased complexity in synchronising the project. However, this has been addressed by running the project as a traditional FFI project with an assigned project leader responsible for the day-to-day management.
The biggest identified risk, in course of the LINE EW-UAS project, was the cost and time delay associated with replacing a Penguin B UAV that crashed during qualification flight tests (see Section 8.2). Fortunately, the crashed UAV did not carry a payload and a replacement unit was acquired relatively swiftly. The cost of the replacement was also not on FFI as the aircraft was not yet formally delivered. However, the accident reminds us that UAVs are expandable goods that may sooner or later crash. In the worst case, replacing a Penguin B from UAV Factory would cost about 500.000 NOK and take about 6 months of delivery and qualification time before normal operation could be resumed. Such high figures would most definitely pose a high risk to the continued operation of LINE EW-UAS and other novel projects using the same platform.
The 2SEAS (13) project at the University of Southampton addresses the questions of cutting the cost and delivery time of fixed-wing UAVs. Based on hybrid production technologies, mixing 3D printing and conventional foam cutting methods, the cost and production time is likely to be less than 1/10th of a commercial platform like the Penguin B. Consequently, in future rapid prototyping of UAVs, further research into hybrid UAV production is one of the major risk reducing measures that can be taken.
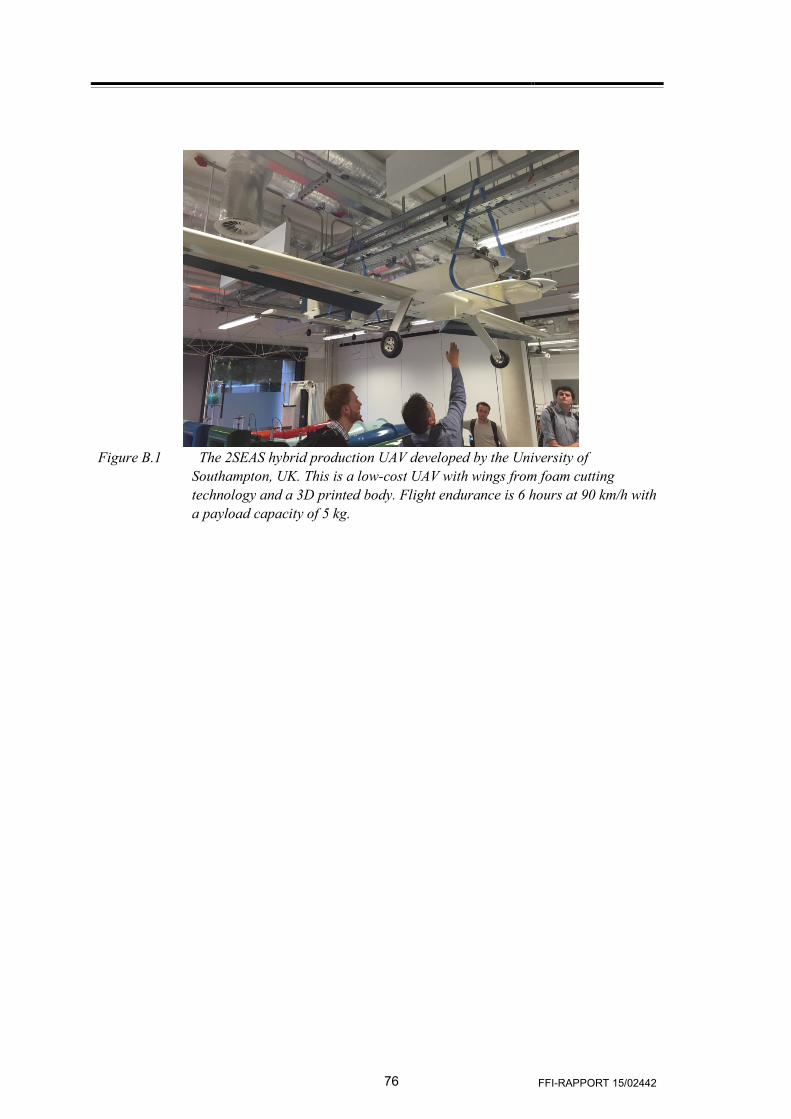
76 FFI-RAPPORT 15/02442
Figure B.1 The 2SEAS hybrid production UAV developed by the University of
Southampton, UK. This is a low-cost UAV with wings from foam cutting technology and a 3D printed body. Flight endurance is 6 hours at 90 km/h with a payload capacity of 5 kg.

FFI-RAPPORT 15/02442 77
Appendix C Acknowledgments
The authors wish to thank Maritime Robotics for excellent support throughout the project period. Thanks also to ESROE Ltd for support on the GLAMDRING software and to the staff at Ørland Air Force Base for help in facilitating the experiment during the trial in November 2015.

78 FFI-RAPPORT 15/02442
Appendix D List of Abbreviations
ADC Analogue to Digital Converter
ADSL Asymmetric Digital Subscriber Line
AIS Automatic Identification System
APN Access Point Name
BLOS Beyond Line Of Sight
CESMO Co-operative ESM Operations
CEP Circle Error Probable
CTR Control Zone
DDI Data Driven Identification
DIP Dual In-line Package
DNS Domain Name System
ECM Electronic Countermeasures
EMI Electromagnetic Interference
ESM Electronic Support Measures
EW Electronic Warfare
FDM Fused Deposition Modelling
FFI Norwegian Defence Research Establishment
FPGA Field Programmable Gate Array
GCS Ground Control Station
GIS Geographic Information System
GPS Global Positioning System

FFI-RAPPORT 15/02442 79
GPRS General Packet Radio Service
IMO The International Maritime Organization
INI Defence Information Infrastructure
ISP Internet Service Provider
JISR Joint Intelligence, Surveillance and Reconnaissance
KDC Kongsberg Defence Communications
LAN Local Area Network
LDI Library Driven Identification
LINE Light Navigation Radar ESM
LNA Low Noise Amplifier
LO Local Oscillator
LOS Line Of Sight
LT Norwegian Civil Aviation Authority
MR Maritime Robotics
MSL Mean Sea Level
MTOW Maximum Take-Off Weight
MTU Maximum Transmission Unit
NAF Norwegian Armed Forces
NARFA National Allied Radio Frequency Agency
NATO North Atlantic Treaty Organization
NFFI NATO Friendly Force Information
NJHQ Norwegian Joint Headquarters

80 FFI-RAPPORT 15/02442
NNEC Network Enabled Capabilities
NORCCIS Norwegian Command and Control Information System
NTNU Norwegian University of Science and Technology
OM Operation Manual
PDW Pulse Descriptor Word
PPTP Point-to-Point Tunnelling Protocol
PRI Pulse Repetition Interval
PSTN Public Switched Telephone System
RC Radio Controlled
RPAS Remotely Piloted Aircraft System
RPM Revolutions Per Minute
SDR Software Defined Radio
SEAD Suppression of Enemy Air Defence
SEWWG SIGINT and Electronic Warfare Working Group
SIA Signal Identification Authority
SIGINT Signal Intelligence
SOLAS Safety Of Life At Sea
STANAG Standard NATO Agreement
TCP Transmission Control Protocol
TDOA Time Difference Of Arrival
TMA Target Motion Analysis
TOA Time Of Arrival
UAS Unmanned Airborne System

FFI-RAPPORT 15/02442 81
UAV Unmanned Aerial Vehicle
UDP User Datagram Protocol
UHF Ultra High Frequency
URL Uniform Resource Locator
USB Universal Serial Bus
VCO Voltage Controlled Oscillator
VHF Very High Frequency
VLOS Visual Line Of Sight
VPN Virtual Private Network
VTOL Vertical Take-Off and Landing
VTS Vessel Traffic Services
82 FFI-RAPPORT 15/02442
References
1. The Norwegian Chief of Defence. Norwegian Armed Forces in Transition - Strategic Defence Review, abridged version. forsvaret.no. [Online] 2015. https://forsvaret.no/en/ForsvaretDocuments/Strategic_Defence_Review_2015_abridged.pdf.
2. Forsvarssjefen. Et Forsvar i Endring - Forsvarssjefens Fagmilitære Råd. forsvaret.no. [Online] 2015. https://forsvaret.no/fakta_/ForsvaretDocuments/EtForsvariEndring-Nett.pdf.
3. Sørnes, P. LINE2 - Hardwarebeskrivelse. s.l. : Forsvarets Forskningsinstitutt, 2012. UGRADERT. FFI-notat 2012/01528.
4. Grimstvedt, E. Data Processing and Use of STANAG 4658 CESMO in LINE EW-UAS. s.l. : Forsvarets Forskningsintitutt, 2016. UNNTATT OFFENTLIGHET. FFI-notat 2015/02441.
5. Forskrift om fremmede ikke-militære fartøyers anløp av og ferdsel i norsk territorialfarvann under fredsforhold. lovdata.no. [Online] 1994. http://www.lovdata.no/dokument/SF/forskrift/1994-12-23-1130.
6. Grønvold, L and Oftebro, S. Labview-program for lokalisering av båter med tidsinformasjon fra to sensorer. Høgskolen i Oslo. 2006. B.Eng. thesis.
7. Smestad, T. LINE - Liten Multilatererende ESM-sensor for maritim overvåkning. FFI fredagsforum. [Presentation]. 13 December 2013.
8. Multiple Material Additive Manufacturing - Part 1: a review. Vaezi, M, et al. 1, 2013, Virtual and Physical Prototyping, Vol. 8, pp. 19-50.
9. Structronics Research. University of Southampton. [Online] 2015. http://www.southampton.ac.uk/engineering/research/projects/structronics_research.page#profile.
10. Holm, G. Design of a 3D-printed Modular UAV: Assessment of Additive Manufacturing for Production of Unmanned Aerial Vehicles. University of Southampton. 2015. M.Eng. thesis.
11. Characterization of a 3D-printed Wideband Waveguide and Horn Antenna Structure Embedded in a UAV Wing. Hoel, K. V, et al. 2016. EuCap 2016.
12. Holm, G, et al. Design, Build and Test of the VTOL UAV - 'Kestrel'. University of Southampton. 2016. Group design project.
13. 3i/University of Southampton. 2-seas UAV. 2seas-uav.com. [Online] 2016. http://www.2seas-uav.com.

FFI-RAPPORT 15/02442 83
14. Stadig flere jobber i nettverk uten sjefer. forskning.no. [Online] November 2014. http://forskning.no/ledelse-og-organisasjon-naeringsliv/2014/11/notteknekkere-i-nettverk.
15. Kolbjørnrud, V. On governance in collaborative communities. BI Norwegian Business School. 2014. Ph.D. dissertation.
16. Strategi blir til mens vi jobber. forskning.no. [Online] June 2015. http://forskning.no/ledelse-og-organisasjon-naeringsliv/2015/06/strategi-blir-til-mens-vi-jobber.
17. Hydle, K. M. Cross border practices: Transnational Practices in Professional Service Firms. BI Norwegian Business School. 2015. Ph.D. dissertation.

Administrative Staff Strategy and Planning
Defence Industrial Strategy
Ministry of Defence
FFI´s Board
Analysis Maritime SystemsCyber Systems and Electronic Warfare
Air and Space SystemsLand Systems Protection and
Societal Security
Defence Research Review Board
Internal Audit
Director General
About FFIThe Norwegian Defence Research Establishment (FFI) was founded 11th of April 1946. It is organised as an administrative agency subordinate to the Ministry of Defence.
FFI’s mIssIonFFI is the prime institution responsible for defence related research in Norway. Its principal mission is to carry out research and development to meet the require-ments of the Armed Forces. FFI has the role of chief adviser to the political and military leadership. In particular, the institute shall focus on aspects of the development in science and technology that can influence our security policy or defence planning.
FFI’s vIsIonFFI turns knowledge and ideas into an efficient defence.
FFI’s chArActerIstIcsCreative, daring, broad-minded and responsible.
om FFIForsvarets forskningsinstitutt ble etablert 11. april 1946. Instituttet er organisert som et forvaltnings organ med særskilte fullmakter underlagt Forsvarsdepartementet.
FFIs FormålForsvarets forskningsinstitutt er Forsvarets sentrale forskningsinstitusjon og har som formål å drive forskning og utvikling for Forsvarets behov. Videre er FFI rådgiver overfor Forsvarets strategiske ledelse. Spesielt skal instituttet følge opp trekk ved vitenskapelig og militærteknisk utvikling som kan påvirke forutsetningene for sikkerhetspolitikken eller forsvarsplanleggingen.
FFIs vIsjonFFI gjør kunnskap og ideer til et effektivt forsvar.
FFIs verdIerSkapende, drivende, vidsynt og ansvarlig.
FFI’s organisation

Forsvarets forskningsinstituttPostboks 25 2027 Kjeller
Besøksadresse:Instituttveien 202007 Kjeller
Telefon: 63 80 70 00Telefaks: 63 80 71 15Epost: [email protected]
Norwegian Defence Research Establishment (FFI)P.O. Box 25NO-2027 Kjeller
Office address:Instituttveien 20 N-2007 Kjeller
Telephone: +47 63 80 70 00 Telefax: +47 63 80 71 15 Email: [email protected]