Embed Size (px)
Citation preview

Abstract— This project develops a fetal heart rate (FHR) extraction application to analyze the fetus activity in the mother uterus. Several methods are available that can be used to detect FHR such as using the fetal electrocardiogram (FECG) that generated by fetus’ heart. Extracting FECG signals is considered a major challenge while the fetus is inside the mother uterus. Normalized Least Mean Square (NLMS) algorithm is one of adaptive filters that is chosen as adaptive filter to get FECG. Pan Tompkins algorithm is used for tracking R-peaks of heartbeat pulses of FECG signal. After detecting the RR interval a formula is used to calculate the bpm (heartbeat per minute) of FECG. Abdominal and direct FECG (ADFECG) database will be used to evaluate the implemented techniques as it has reference signal. At the end of research, calculated FHR is varied from 125.4 bpm to 130.3 bpm. When comparison is done between abdominal ECG (AECG) and direct FECG (DFECG), the error of FHR is 0.1%. The accuracy of R-peaks extraction is 100% where all R-peaks are detected by implemented techniques. MATLAB is used for signal simulations. This system will have ability to interpret the non-invasive FECG (NIFECG) database and compute its FHR.
Keywords—NLMS Algorithm, Pan Tompkins Algorithm and Fetal Heart Rate Extraction.
I. INTRODUCTION Nowadays, Doppler ultrasound is widely used in FHR
monitoring in clinic. [1] However, it has not been proved that the use of ultrasound is fully safe for the fetus. [2] Furthermore, doppler ultrasound requires extensive training and high costs to purchase. Hence, other than doppler ultrasound, there are also many methods to monitoring the FHR. One of the examples, the non-invasive fetal electrocardiography (NIFECG) places the electrodes on the thorax to record the maternal electrocardiography (MECG) signal and abdomen to record the abdominal electrocardiography (AECG) signal. The recorded signals of NIFECG can be used to estimate the FHR which is considered as an alternative FHR monitoring approach to the Doppler ultrasound [20].
The AECG signal is formed by the summation of the different influences that overlaps the FECG signal [3]. The influences are majority come from MECG signal. The FECG signal is hardly noticeable in the AECG recordings. Without proper signal processing, it is not possible to extract useful information from AECG signal [3]. The location of fetal R-peaks, which is used for FHR calculation, is primary feature that needs to extract from the AECG signal. However, detecting the R-peaks from the AECG remains a challenging task [4]. One of the reasons is the relatively low signal to noise ratio (SNR) of the FECG signal compared to MECG signal [5].
Therefore, these influences may cause the difficulty to detect the FHR in AECG signal and result NIFECG placement method cannot be used in clinic.
Extracting FECG signals while the fetus in the mother uterus is consider a major challenge. The AECG signal is overlap with MECG signal and noise from outside. Normally, an FECG signal is weaker than the MECG signal in strength. The MECG signal is usually around 3.5mV, while the FECG is in the range of 0.1-0.25mV [6]. In previous work [22], Mrs. Sonali used Abdominal and Direct Fetal Electrocardiogram (ADFECG) database from Physionet to test the performance of Fast Independent Components Analysis (Fast ICA) techniques. After that, the techniques are applied on NIFECG on same person where result are range in 108 – 187 bpm. The range is huge in changing. But, in another previous work [8], the Fast ICA technique has a weakness. The R-peaks detected has only 90%. Another 10% had missing. This may affect the FHR calculation. Besides, the AECG signals are unavoidable influence by a variety of unwanted noises. In previous work [17], the signal with high-frequency noise made the MECG signal and FECG signal were indistinguishable. This may affect the FHR calculation. The unwanted noise can be reduced by filter to increase SNR to ease the detection of QRS complexes. Fetal R-peaks detection is essential step for FHR information. In previous work, Z. Ji [9] used Biorthogonal Spline Wavelet to detect QRS complex. But the disadvantage of this method is that the R-peaks is determined only by some threshold, resulting in the week anti-interference performance. From the problem statement above, the main objective of this project is to extract R peak on FECG signal for FHR calculation.
II. METHODOLOGY
A. Project Implementation Flow
The overall project implementation flow is shown in Figure 1. The flowchart of the project implementation flow on FHR detection system. First is design an adaptive filter to suppress the MECG signal in AECG signal. Next step is designing a Pan Tompkins algorithm for FECG signal to remove noise and track the R-peaks. The functionality of designed techniques is tested using abdominal and direct FECG (ADFECG) database from Physionet. The designed techniques are also used on non-invasive FECG (NIFECG) database for further analysis. Last, build FHR detection system on MATLAB GUI.
B. Project Requirement
In this project, there is only one software is required which is version MATLAB R2018b. There is also required DFECG signal, AECG signals and MECG signal to develop FHR detection system. Physionet is one of the famous websites which stores many types of ECG signal. ADFECG database is chosen to do experiment on implemented techniques as the
Fetal Heart Rate Extraction using NLMS Algorithm
Ricky K1., Arjuna M1,2, Sadegh Aminifar3
1School of Electrical and Electronic Engineering Universiti Sains Malaysia (USM), Engineering Campus, Nibong Tebal, 14300, Penang, Malaysia.
2School of Science and Technology, Wawasan Open University, 54, Jalan Sultan Ahmad Shah 10050, Penang, Malaysia
3Electrical Electronics Engineering Department, Mahabad Branch, Islamic Azad University, Mahabad 5913933137, Iran
Received: October 26, 2020. Revised: March 7, 2021. Accepted: April 2, 2021. Published: April 7, 2021.
INTERNATIONAL JOURNAL OF BIOLOGY AND BIOMEDICAL ENGINEERING DOI: 10.46300/91011.2021.15.8 Volume 15, 2021
Ε-ISSN: 1998-4510 61

recording information contains: Signals recorded from 5 different women in labor, between 38 and 41 weeks of gestation, four signals acquired from maternal abdomen and Direct electrocardiogram recorded simultaneously from fetal head. NIFECG database is chosen for further analysis of implemented technique. The database recording contains: 2 thoracic signals, 3 or 4 abdominal signals (most records include 4) and signals are taken from a single subject between 21 to 40 weeks of pregnancy.
Fig. 1: Flowchart of the project implementation flow on FHR detection
system
C. Experiment Proceduce
First of all, the input signal from Physionet Database used is ADFECG database before applying to NIFECG database. This is because the NIFECG database doesn’t provide any truth data of FECG signal but ADFECG database does. DFECG signal will be used as reference to compare with the extracted FECG signal from AECG signal. All database will be saved as ‘.mat’ format. The database is recorded in voltage (µV) against time (ms). The sample data is processed into readable file in MATLAB. Due to the sample data file contains several abdomen data, a mean calculation is done separately on abdomen data. Last, these data will be used in following subsection.
1. Normalized LMS (NLMS) Algorithm
NLMS algorithm [10] is another type of adaptive filtering that involves the changing of filter parameters (coefficients) over time, to adapt to changing signal characteristics. LMS algorithm is having a fixed step size parameter for every iteration which suitable for constant signal. However, sample from Physionet is unknown statistics signal and hence the step size cannot be chosen. NLMS algorithm is an extension of the LMS algorithm which by passes this issue by selecting a different step size value, µ(n), for each iteration of the algorithm. The step size parameter is chosen based on the current input values.
As the NLMS is an extension of the LMS algorithm, the NLMS algorithms is very similar to that of the LMS algorithm. Each iteration of the NLMS algorithm requires these equations. The output of adaptive filter is calculated based on formula
𝑦(𝑛) = 𝑤𝑇(𝑛)𝑥(𝑛)
where x(n) is input signal and wT(n) is transpose of weight vector.
As error signal is calculated based on formula
𝑒(𝑛) = 𝑑(𝑛) − 𝑦(𝑛)
where d(n) is desired signal and y(n) is output of the adaptive filter.
The step size values for the input vector is calculated using formula
µ(𝑛) =1
𝑥𝑇(𝑛)𝑥(𝑛)
where x(n) is input signal and xT(n) is transpose of input signal.
The filter tap weights are updated in preparation for the next iteration. The formula of filter tap weights is
𝑤(𝑛) = 𝑤(𝑛 − 1) + µ(𝑛)𝑒(𝑛)𝑥∗(𝑛)
𝜀 + 𝑥𝐻(𝑛)𝑥(𝑛)
where w(n-1) is previous of filter tap weight vector, µ(n) is step size of filter, e(n) is error signal and x∗(n) is complex conjugate of input signal, 𝜀 is a constant, and 𝑥𝐻(𝑛) is transpose of conjugate of input signal and x (n) is input signal.
When process ADFECG database, the input signal, x is AECG signal and desired signal, d is direct FECG (DFECG) signal. When the AECG signal is moved into adaptive filter, the signal is processed. Then, the output of adaptive filter, y is filtered AECG signal which also known as extracted FECG signal. A subtraction is done between d and y signal left over residue signal named error signal. The error signal should be zero as both extracted FECG signal and DFECG signal are same. A block diagram is shown in Figure 2 for easy understanding. Extracted FECG signal and DFECG signal is bring forward to Pan Tompkins algorithm for removing noise and track R-peaks.
Fig. 2: Block Diagram of Adaptive Filter Algorithm (1)
(2)
(3)
(4)
INTERNATIONAL JOURNAL OF BIOLOGY AND BIOMEDICAL ENGINEERING DOI: 10.46300/91011.2021.15.8 Volume 15, 2021
Ε-ISSN: 1998-4510 62

2. Pan Tompkins Algorithm
Pan Tompkins algorithms [11] is one of the methods for the detection of PQRST points and R-R peak on FECG signal. Pan Tompkins algorithm was achieved by linear filtering, non-linear transformation, and decision rule algorithm. Pan Tompkins algorithm consists of the following steps: bandpass filtering, derivative filtering, squaring function, moving window integration and adjusting the thresholds.
Band-Pass filtering
The main function of band-pass FIR with Hamming Window filter is reduce the influence of muscle noise, baseline wander, 60Hz interference and T-wave interference from the original signal. The desirable passband to maximize the QRS energy is approximately 5-15Hz and used to increases the signal to noise (SNR) ratio of ECG signal.
Derivative Filtering
A derivative filter is used to find the high slopes information in the ECG signal. QRS complex tends have a larger variation in its slope in the ECG wave. The derivative procedure suppresses the low-frequency components of P and T waves.
A five points derivative is used with the transfer function:
𝐻(𝑧) = (−𝑧−2 − 2𝑧−1 + 2𝑧1 + 𝑧2)
8𝑇
The amplitude response is
|𝐻(⍵𝑇)| = sin(2⍵𝑇) + 2 sin(⍵𝑇)
4𝑇
The difference equation is
𝑑(𝑛𝑇)
= −𝑥(𝑛𝑇 − 2𝑇) − 2𝑥(𝑛𝑇 − 𝑇) + 2𝑥(𝑛𝑇 + 𝑇) + 𝑥(𝑛𝑇 + 2𝑇)
8𝑇
Squaring Function
After derivative filtering, the signal is squared point by point.
The equation of this operation is
𝑠(𝑛𝑇) = [(𝑑(𝑛𝑇)]2
This equation makes all data points positive and does non-linear amplification of the output amplification of the output of the derivative emphasizing the higher frequencies.
Moving Window Integration
The purpose of moving-window integration is to obtain waveform feature information in addition to the slope of the R wave. It is calculated form
𝑚(𝑛𝑇) = 𝑠(𝑛𝑇−(𝑁−1)𝑇)+𝑠(𝑛𝑇−(𝑁−2)𝑇)+⋯+𝑠(𝑛𝑇)
𝑁
where N is the number of samples in the width of the integration window.
The number of samples N in the moving window is important. The width of the window should be the same as the width of QRS complex. If the window is too wide, the T wave will merge the QRS complex together. In opposite, if the window is too narrow, QRS complexes will produce several
peaks which can cause difficulty in subsequent QRS detection processes.
Adjusting the Thresholds
The thresholds are automatically adjusted in the ECG signal by computing running estimates of signal and noise peaks. A peak is said to be detected whenever the final output changes direction within a specified interval.
In the following discussion, SPKI represents the peak level that corresponding to QRS peaks, and NPKI represents the peak level related to noise peaks. THRESHOLD I1 and THRESHOLD I2 are two thresholds used to categorize the peaks detected as signal (QRS) or noise. If a peak exceeds THRESHOLD I1, it is classified as a QRS (signal) peak. If the search-back technique is used, the peak should be above THRESHOLD I2 to be called a QRS. The set of thresholds initially applied to the integration waveform is computed from
SPKI(n) = 0.125 PEAKI(n-1) + 0.875 SPKI(n-1); (if PEAKI is the signal peak)
NPKI(n) = 0.125 PEAKI(n-1) + 0.875 NPKI(n-1); (if PEAKI is the noise peak)
THRESHOLD I1 = NPKI(n)+ 0.25 (SPKI(n)-NPKI(n))
THRESHOLDI2 = 0.5 THRESHOLD I2
When the QRS complex is found using the second threshold, the formula for SPKI is changed to
SPKI(n+1) = 0.25 PEAK1(n) + 0.75 SPKI(n)
In the following discussion is about search-back procedure. The Pan-Tompkins algorithm maintains two RR interval averages. One is the average of the eight most-recent beats (RR AVERAGE1) and the other is the average of the eight most-recent beats having RR intervals that fall within certain limits (RR AVERAGE2). These two separate averages are able to adapt to quickly changing or irregular heart rates [15]. The formula of these averages is
RR AVERAGE1 = 1
8 (𝑅𝑅𝑛−7 + 𝑅𝑅𝑛−6 + ⋯ + 𝑅𝑅𝑛)
RR AVERAGE2 = 1
8 (𝑅𝑅′𝑛−7 + 𝑅𝑅′𝑛−6 + ⋯ + 𝑅𝑅′𝑛)
where 𝑅𝑅𝑛 is the most-recent RR interval and 𝑅𝑅′𝑛 is the most-recent RR interval that fell between the acceptable low and high RR interval limits. The RR interval limits are
RR LOW LIMIT = 0.92 RR AVERAGE2
RR HIGH LIMIT = 1.16 RR AVERAGE2.
Whenever a QRS complex is not found during the interval specified by the RR MISSED LIMIT, the QRS is taken to be the peak between the established thresholds applied in the search-back procedure.
RR MISSED LIMIT = 1.66 RR AVERAGE2
Pan Tompkins algorithm contains many steps. Each step has formula and parameter required. Since this algorithm was designed for adult, then R-peaks in MECG signal can be detected with original parameter. This algorithm can be used to detect R-peaks in FECG signal with different parameters. The FHR is in range of 110 bpm to 160 bpm and maternal heart rate (MHR) is in range of 60 bpm to 90 bpm. This means the FHR is 1.8 times of MHR. Therefore, the parameters apply
(5)
(6)
(7)
(8)
(9) (10)
(11)
(12)
(13)
(14)
(15)
(16) (17)
(18)
INTERNATIONAL JOURNAL OF BIOLOGY AND BIOMEDICAL ENGINEERING DOI: 10.46300/91011.2021.15.8 Volume 15, 2021
Ε-ISSN: 1998-4510 63

on FECG signal should be about 1.8 times of MECG signal [12]. The cutoff frequency of FECG and MECG used in bandpass filter step is 9Hz-27Hz and 5Hz-15Hz respectively. The window width of FECG and MECG signal is 80ms and 150 respectively.
The Pan-Tompkins algorithm maintains two RR interval averages. One is the average of the eight most-recent beats (RR AVERAGE1) and the other is the average of the eight most-recent beats having RR intervals that fall within certain limits (RR AVERAGE2).
These two separate averages are able to adapt to quickly changing or irregular heart rates.'
3. Fetal Heart Rate
The value of average RR interval after Pan Tompkins algorithm will be used in this section to calculate the FHR. The formula of FHR [13] is:
𝐹𝐻𝑅 =60 𝑠𝑒𝑐𝑜𝑛𝑑𝑠 𝑥 𝑠𝑎𝑚𝑝𝑙𝑖𝑛𝑔 𝑓𝑟𝑒𝑞𝑢𝑒𝑛𝑐𝑦
𝐴𝑣𝑒𝑟𝑎𝑔𝑒 𝑜𝑓 𝑅𝑅 𝐼𝑛𝑡𝑒𝑟𝑣𝑎𝑙(𝑏𝑝𝑚)
where sampling frequency of input source is 1kHz. The FHR will interpret into three condition which are normal condition (110-160 bpm), abnormal condition (<110 bpm) and dangerous condition (>160 bpm).
D. Project Requirement
MATLAB R2018b is used to develop the GUI for FHR detection system and named “FHR Detection System”. This application is built for FHR calculation on non-invasive database. This application consists solely of main page activity. The layout of the main page consists of two buttons, i.e. “Upload AECG” and “Load”. The layout also consists of two graphs for the original ECGs data: One of the graphs for AECG and FECG and another one is for MECG. There are two displays for showing the heart rate for both FECG and MECG. There are also consists of several radio buttons which work in toggle style. These buttons are used to display the different processed graphs for analysis. By pressing the “Upload AECG”, a selection of AECG file will pop out. After the user had selected the AECG file, user can press the “Load” for processing the AECG. The FHR Detection System will process the AECG signal by using NLMS and Pan Tompkins algorithm. All processed results are stored and ready to display. If user want to see the process after bandpass filtering, user can choose radio button named “Bandpass Filter” to analyze the graphs. The FHR and MHR will be displayed as well. If user want to analyze different AECG signal, user can direct press “Upload AECG” and choose new AECG signal.
III. RESULT AND DISCUSSION
A. Sample Data from Physionet
ADFECG database is processed from “.mat” file into readable file in MATLAB. The database used is named as r04. The mean of original AECG signal (blue line) and DFECG signal (orange line) are plotted as on same figure as shown in Figure 3 to analyze their differences. As we can see, there are some peaks in AECG signal was affected by FECG signal. In order to test the functionality of implemented techniques, AECG signal will be used as input signal and DFECG signal will be desired signal. NLMS algorithm process is done by rescaling AECG signal to match with DFECG signal.
B. NLMS Algorithm
The original AECG signal is processed under NLMS algorithm (adaptive filter). The original AECG signal and filtered AECG signal is plotted in Figure 4 (purple line) to analyze the change of AECG signal. Clearly, filtered AECG signal (black line) is rescaled and match the DFECG signal(green line). Then, a subtraction is done by process of NLMS algorithm between filtered AECG signal and DFECG signal and result is plotted in same figure (red line) which known as MECG signal. Filtered AECG signal and DFECG signal are move into Pan Tompkins algorithm to eliminate noises and track the R-peaks.
Fig. 3: Original AECG signal and DFECG signal
C. Pan Tompkins Algorithm
All results in Pan Tompkins algorithm are shown in Figure 5. The unwanted noises are reduced after moved in bandpass filter. P and T waves of filtered AECG signal is suppressed as well after process of derivative filter. The signal is squared to emphasize the large different of QRS complexes. The squared signal is processed under moving window integrator to smooth up the signal for better track of R-peaks. Adjusting the threshold had classified the signal peaks and ignored the noises peaks.
Fig. 4: Result of NLMS Algorithm
(19)
INTERNATIONAL JOURNAL OF BIOLOGY AND BIOMEDICAL ENGINEERING DOI: 10.46300/91011.2021.15.8 Volume 15, 2021
Ε-ISSN: 1998-4510 64

Fig. 5: Result of Pan Tompkins Algorithm
D. Fetal Heart Rate
For calculation of FHR, the formula of FHR is applied to both ECG signals. The computed of FHR in filtered AECG signal is 126 bpm which are same as DFECG signal. The implemented techniques are also applied to r01, r07, r08 and r10, the FHR computed is varied from 125.4 – 130.3 bpm. The percentage error of FHR between DFECG and filtered AECG signal is 0.1%. This indicates the extraction of FECG signal in AECG signal is 99.9%.
E. Comparison the Implemented Techniques with Other
Techniques
In 2016, Sonal [8] had presented their work on Fast ICA based technique for non-invasive FECG extraction and at the end of the research, 90.35% of R-peaks in extracted FECG signal were matched with R-peaks detected in DFECG signal.
When the implemented technique in this thesis is also applied to 10 seconds of ADFECG database, the results are tabulated in TABLE IV. As we can see, the number of detected R-peaks in DFECG on both techniques are same. In TABLE I, the number of R-peaks detected in extracted FECG signal (also known as filtered AECG signal) is same as number of R-peaks detected in DFECG signal. This mean that the implemented techniques have extracted all FECG signal in AECG signal. TABLE I: R-peaks Extraction Percentage on Implemented Techniques.
Record of ADFECG database
Number of R-peaks detected Extraction Percentage
(%) DFECG Extracted FECG
r01 21 21 100
r04 21 21 100
r07 21 21 100
r10 20 20 100
Average percentage of extraction 100
In 2017, Mrs Sonali [7] presented a work on extraction of FECG from abdominal recordings using Fast ICA techniques. First, they had applied the techniques on ADFECG database and obtained result was 124 bpm. After that, they had applied to another database from Physionet called NIFECG database and obtained results are shown in TABLE II.
When implemented technique is applied to ADFECG database, the computed FHR is varied from 125.4 – 130.3 bpm which are slightly different from Fast ICA techniques. One of
the possible reasons is the missed extraction of FECG signal in AECG signal as we can proved in case1. The proposed technique is applied to NIFECG database and the results are also tabulated in TABLE II. As we can see, the FHR are inconsistent. Because, the NIFECG database is taken from a single pregnant mother in different weeks, the FHR should be consistent in a small range. But in [18], the FHR have a huge jump from 110 bpm to 187 bpm which are not logical. Moreover, the ecgca968 and 776 are recorded continuously at same date. The FHR should be exactly the same. But in [19], the FHR is increased from 108 bpm in ecgca968 to 185 bpm in ecgca776. Obviously, the increasement is abnormal. Unlike the implemented techniques, the FHR on both ecgca968 and 776 are closer to each other. Last, we cannot say the adaptive filter techniques are better than Fast ICA techniques. In [20] and [21], the main objective of their work is using the Fast ICA techniques to do the FECG signal extraction and not for the FHR detection system. They are more focus on ECG thingy like P, Q, R, S and T waves. Unlike this thesis, we are more focus on R-peaks only for FHR calculation. That’s why the R-peaks on case 1 and case 2 are not accurate as they may detected wrong peaks on FECG signal. Furthermore, there have not reference value on Physionet as benchmark to do correction. So, we can’t say both techniques are wrong. TABLE II: Estimated FHR on NIFECG using different techniques.
Signal from
Database
Signal Recorded FHR computed
Date Time Fast ICA [7]
Adaptive Filter
ecgca880 8/12/2003 22:53:00-23:00:00 187 155
ecgca968 6/2/2004 17:06:00-17:15:30 108 167
ecgca776 6/2/2004 17:17:00-17:25:20 185 162
ecgca886 10/3/2004 20:03:00-20:10:05 110 161
ecgca896 15/02/2004 23:27:00-23:32:00 136 158
ecgca840 15/03/2004 23:00:00-23:05:20 183 163
ecgca771 21/03/2004 11.32:00-12:18:20 172 164
ecgca998 29/01/2004 23:38:00-23:31:45 110 148
In 2017, Tashreque [14] had done his research on extraction FHR from MECG. In his research, the AECG signal is preprocessed with improved multistep filtering techniques to detect the Maternal QRS (MQRS) complexes, which are dominant in the AECG signal. The final obtained results are tabulated in TABLE III. TABLE III shows the record ‘r01_edfm-1’ and ‘r04_edfm-4’ demonstrates high accuracies of over 95% because in both cases, there was only 1 False Negative (FN) peak and no False Positive (FP) peaks. Record ‘r04_edfm-1’ on the other hand showed a relatively lower accuracy of just over 81%. R-peaks detected in DFECG is equal to True Positive (TP) + FN. TABLE III: Accuracy table of the results obtained by multistep filtering techniques when compared to the reference fetal scalp ECG.
Record Abdomen #
TP FP FN TP+FN Accuracy (%)
INTERNATIONAL JOURNAL OF BIOLOGY AND BIOMEDICAL ENGINEERING DOI: 10.46300/91011.2021.15.8 Volume 15, 2021
Ε-ISSN: 1998-4510 65
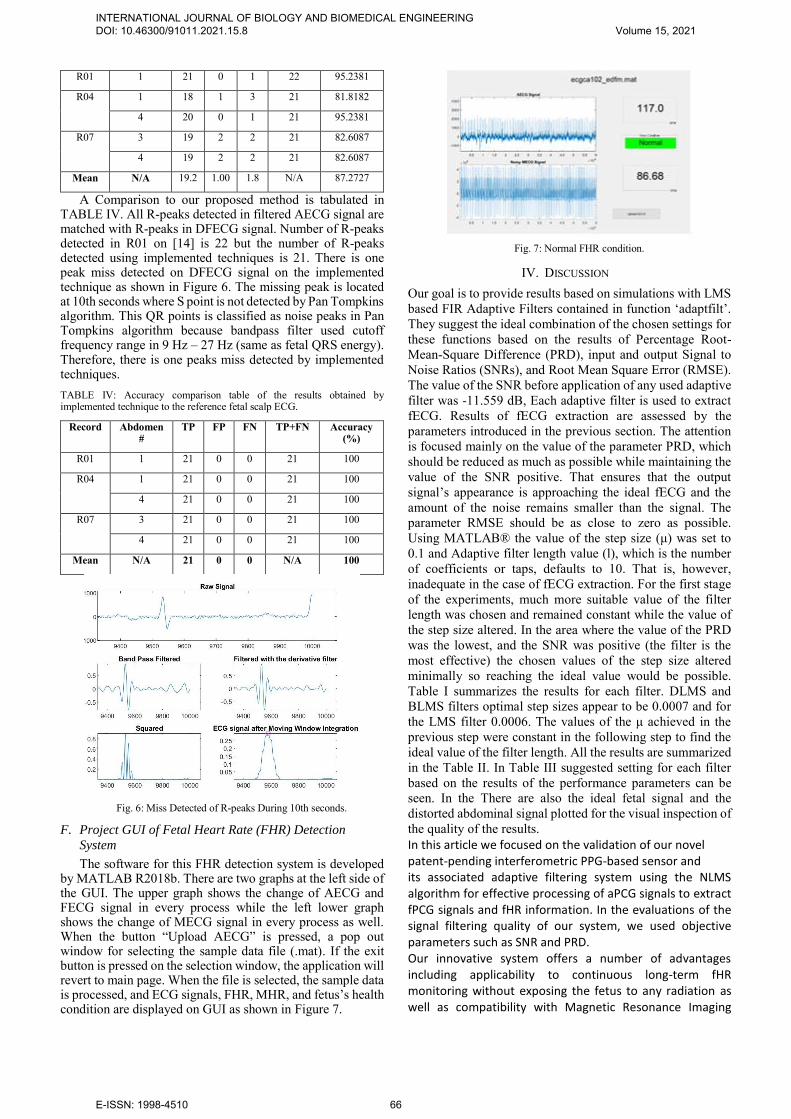
R01 1 21 0 1 22 95.2381
R04 1 18 1 3 21 81.8182
4 20 0 1 21 95.2381
R07 3 19 2 2 21 82.6087
4 19 2 2 21 82.6087
Mean N/A 19.2 1.00 1.8 N/A 87.2727
A Comparison to our proposed method is tabulated in TABLE IV. All R-peaks detected in filtered AECG signal are matched with R-peaks in DFECG signal. Number of R-peaks detected in R01 on [14] is 22 but the number of R-peaks detected using implemented techniques is 21. There is one peak miss detected on DFECG signal on the implemented technique as shown in Figure 6. The missing peak is located at 10th seconds where S point is not detected by Pan Tompkins algorithm. This QR points is classified as noise peaks in Pan Tompkins algorithm because bandpass filter used cutoff frequency range in 9 Hz – 27 Hz (same as fetal QRS energy). Therefore, there is one peaks miss detected by implemented techniques. TABLE IV: Accuracy comparison table of the results obtained by implemented technique to the reference fetal scalp ECG.
Record Abdomen #
TP FP FN TP+FN Accuracy (%)
R01 1 21 0 0 21 100
R04 1 21 0 0 21 100
4 21 0 0 21 100
R07 3 21 0 0 21 100
4 21 0 0 21 100
Mean N/A 21 0 0 N/A 100
Fig. 6: Miss Detected of R-peaks During 10th seconds.
F. Project GUI of Fetal Heart Rate (FHR) Detection
System
The software for this FHR detection system is developed by MATLAB R2018b. There are two graphs at the left side of the GUI. The upper graph shows the change of AECG and FECG signal in every process while the left lower graph shows the change of MECG signal in every process as well. When the button “Upload AECG” is pressed, a pop out window for selecting the sample data file (.mat). If the exit button is pressed on the selection window, the application will revert to main page. When the file is selected, the sample data is processed, and ECG signals, FHR, MHR, and fetus’s health condition are displayed on GUI as shown in Figure 7.
Fig. 7: Normal FHR condition.
IV. DISCUSSION Our goal is to provide results based on simulations with LMS based FIR Adaptive Filters contained in function ‘adaptfilt’. They suggest the ideal combination of the chosen settings for these functions based on the results of Percentage Root-Mean-Square Difference (PRD), input and output Signal to Noise Ratios (SNRs), and Root Mean Square Error (RMSE). The value of the SNR before application of any used adaptive filter was -11.559 dB, Each adaptive filter is used to extract fECG. Results of fECG extraction are assessed by the parameters introduced in the previous section. The attention is focused mainly on the value of the parameter PRD, which should be reduced as much as possible while maintaining the value of the SNR positive. That ensures that the output signal’s appearance is approaching the ideal fECG and the amount of the noise remains smaller than the signal. The parameter RMSE should be as close to zero as possible. Using MATLAB® the value of the step size (μ) was set to 0.1 and Adaptive filter length value (l), which is the number of coefficients or taps, defaults to 10. That is, however, inadequate in the case of fECG extraction. For the first stage of the experiments, much more suitable value of the filter length was chosen and remained constant while the value of the step size altered. In the area where the value of the PRD was the lowest, and the SNR was positive (the filter is the most effective) the chosen values of the step size altered minimally so reaching the ideal value would be possible. Table I summarizes the results for each filter. DLMS and BLMS filters optimal step sizes appear to be 0.0007 and for the LMS filter 0.0006. The values of the μ achieved in the previous step were constant in the following step to find the ideal value of the filter length. All the results are summarized in the Table II. In Table III suggested setting for each filter based on the results of the performance parameters can be seen. In the There are also the ideal fetal signal and the distorted abdominal signal plotted for the visual inspection of the quality of the results. In this article we focused on the validation of our novel patent-pending interferometric PPG-based sensor and its associated adaptive filtering system using the NLMS algorithm for effective processing of aPCG signals to extract fPCG signals and fHR information. In the evaluations of the signal filtering quality of our system, we used objective parameters such as SNR and PRD. Our innovative system offers a number of advantages including applicability to continuous long-term fHR monitoring without exposing the fetus to any radiation as well as compatibility with Magnetic Resonance Imaging
INTERNATIONAL JOURNAL OF BIOLOGY AND BIOMEDICAL ENGINEERING DOI: 10.46300/91011.2021.15.8 Volume 15, 2021
Ε-ISSN: 1998-4510 66

(MRI) environments. The long-term monitoring capacity of our system is highly desirable, especially in those cases when the pregnant woman faces a dangerous situation (such as after an accident), and it becomes absolutely necessary to perform a time consuming MRI examination to ensure that the unborn fetus is intact and safe [23]. The other specific advantage of our technology is that it can be used in water deliveries[24]. In our future research, we intend to use data from clinical practice to investigate a variety of challenging research topics such as the influence of sensor placement, fetal position and gestational age on aPCG signal filtering, fPCG signal extraction, and fHR monitoring.
V. CONCLUSION In conclusion, MECG signal is suppressed and matched the FECG signal with DFECG signal. Pan Tompkins algorithm had reduce unwanted noise where signals are undergone band pass filtering. Calculated FHR is varied from 125.4 bpm to 130.3 bpm. The comparison between AECG and DFECG signals shows 0.1% error of FHR. The accuracy of R-peaks extraction is 100%, in other words, all R-peaks are extracted by implemented technique. In this project, the software of FHR detection system is successfully developed.
ACKNOWLEDGMENT This work is supported by Universiti Sains Malaysia,
RUI1001/PELECT/8014008 and the Education Ministry of Malaysia, FRGS-203/PELECT/6071417.
REFERENCES [1] M. J. Lewis, “Review of electromagnetic source investigations of the
fetal heart,” Medical Engineering and Physics, vol 25, no.10, pp. 801-810, 2013.
[2] J. Behar, F. Andreotti, S. Zaunseder, J, Oster, and G. D Clifford, “A practical guide to non-invasive foetal electrocardiogram extraction and analysis,” Physiological measurement, vol. 37, pp. R1-R35, 2016.
[3] R. Martinek, R. Kahankova, H. Nazeran, “Non-Invasive Fetal Monitoring: A Maternal Surface ECG Electrode Placement-Based Novel Approach for Optimization of Adaptive Filter Control Parameters Using the LMS and RLS Algorithms,” Sensors, vol. 17, no. 5, pp. 1154, 2017.
[4] W. Zhong, C. Zhongping, W. Ding, G. Xuemei and W. Guoli, “A tree-search method for single-channel fetal QRS complexes detection in fetal heart rate monitoring,” 2017 IEEE International Conference on Bioinformatics and Biomedicine (BIBM), 2018.
[5] W. Zhong, L. Lijuan, G. Xuemei and W. Guoli, “A deep learning approach for fetal QRS complex detection,” Institute of Physics and Engineering in Medicine, 2018.
[6] T. M. Haq, S. Arefin, S. Rahman and T. Rahman, “Extraction of fetal heart rate from maternal ecg – Non-invasive approach for continuous monitoring during labor,” Proceedings, 2018.
[7] Sonali H. Jadhav and D. N. Dhang, “Extraction of Fetal ECG from Abdominal Recoridngs Combing BSS-ICA and WT Techniques,”
International Journal of Engineering Research and Technology, vol. 10, no. 1, 2017.
[8] Sonal Nikam and Shankar Deosarkar, “Fast ICA Based Technique for Non-invasive Fetal ECG Extraction,” Conference on Advances in Signal Processing (CASP), 2016.
[9] J. Zhen, X.Y. Zheng, J. Luo, Z. Li, "Detection of QRS complexes based on biorthogonal spline wavelet," Journal of Shenzhen University Science and Engineering, pp. 167-172, 2006.
[10] Michael Hutson, “Acoustic Echo using Digital Signal Processing,” B.S. thesis, University of Queensland, 2003.
[11] Jiapu Pan and Willis J. Tompkins, “A Real-Time QRS Detection Algorithm,” IEEE Transactions on Biomedical Engineering, vol. BME-32, no. 3, 1985.
[12] Angela Agostinelli, Ilaria Marcantoni, and Elisa Moretti, “Noninvasive Fetal Electrocardiography,” The Open Biomedical Engineering Journal, 2017.
[13] Stephanie Pildner von Steinburg, Anne-Laure Boulesteix, and Christian Lederer, “What is the “normal” fetal heart rate?” PeerJ DOI 10.7717/peerj.82, Jun 2013.
[14] Tashreque M. H., Safkat A., Shamiur R. and Tanzilur R., “Extraction of Fetal Heart Rate from Maternal ECG-Non Invasive Approach for Continuous Monitoring during Labor,” Proceedings, vol. 2, no. 13, pp. 1009, 2018.
[15] Marzuki, A., Tee, S. Y., & Aminifar, S. (2014). Study of fuzzy systems with Sugeno and Mamdanitype fuzzy inference systems for determination of heartbeat cases on Electrocardiogram (ECG) signals. International Journal of Biomedical Engineering and
Technology, 14(3), 243-276. [16] Jaros, R., Martinek, R., Kahankova, R., & Koziorek, J. (2019). Novel
hybrid extraction systems for fetal heart rate variability monitoring based on non-invasive fetal electrocardiogram. IEEE Access, 7, 131758-131784.
[17] Sutha, P., & Jayanthi, V. E. (2018). Fetal electrocardiogram extraction and analysis using adaptive noise cancellation and wavelet transformation techniques. Journal of medical systems, 42(1), 1-18.
[18] Ahmad, A. A., Kuta, A. I., & Loko, A. Z. (2017). Analysis of abdominal ECG signal for fetal heart rate estimation using adaptive filtering technique. International Journal of Image, Graphics and Signal Processing, 9(2), 19.
[19] Martinek, R., Nedoma, J., Fajkus, M., Kahankova, R., Konecny, J., Janku, P., ... & Nazeran, H. (2017). A phonocardiographic-based fiber-optic sensor and adaptive filtering system for noninvasive continuous fetal heart rate monitoring. Sensors, 17(4), 890.
[20] Kahankova, R., Martinek, R., & Bilik, P. (2017, May). Fetal ECG extraction from abdominal ECG using RLS based adaptive algorithms. In 2017 18th International Carpathian Control Conference (ICCC) (pp. 337-342). IEEE.
[21] Murawwat, S., Batool, A., Ahmed, A., Ansar, A., & Iqbal, A. (2018, November). FECG Extraction Using Adaptive LMS. In 2018 International Conference on Computing, Electronic and Electrical Engineering (ICE Cube) (pp. 1-6). IEEE.
[22] Subha, T. D., & Reshma, V. D. (2017). A study of non-invasive heart rate monitoring system by using FPGA. Materials Today: Proceedings, 4(2), 4228-4238.
[23] Shuang Cong, Zisheng Zou, Shiqi Duan, Ding Chen, State Filtering and Nonlinear Control of Fine Tracking System in Quantum Positioning Systems, WSEAS Transactions on Systems and Control, ISSN / E-ISSN: 1991-8763 / 2224-2856, Volume 14, 2019, Art. #34, pp. 264-276.
[24] Tintu Mary John, Shanty chacko, Design of high speed VLSI Architecture for FIR filter using FPPE, Engineering world, pp. 51-57, Volume 1, 2019.
INTERNATIONAL JOURNAL OF BIOLOGY AND BIOMEDICAL ENGINEERING DOI: 10.46300/91011.2021.15.8 Volume 15, 2021
Ε-ISSN: 1998-4510 67
Creative Commons Attribution License 4.0 (Attribution 4.0 International, CC BY 4.0) This article is published under the terms of the Creative Commons Attribution License 4.0 https://creativecommons.org/licenses/by/4.0/deed.en_US