Embed Size (px)
Citation preview

Institute of Crop Sciences
University of Hohenheim
Fertilisation and Soil Matter Dynamics (340 i)
Prof. Dr. Torsten Müller
Fertilizer placement and the potential for its combination
with bio-effectors to improve crop nutrient acquisition and
yield
Dissertation
Submitted in fulfilment of the requirements for the Degree
„Doktor der Agrarwissenschaften“
(Dr. sc. agr. / Ph.D in Agricultural Sciences)
to the
Faculty of Agricultural Sciences
by
Peteh Mehdi Nkebiwe
born 05 October 1982, Buea, Cameroon
2016

This thesis was accepted as a doctoral dissertation in fulfilment of the requirements for the
degree „Doktor der Agrarwissenschaften“ (Dr. sc. Agr. / Ph.D. in Agricultural Sciences) by
the Faculty of Agricultural Sciences at University of Hohenheim on the 16 November 2016.
Date of oral examination: 21 February 2017
Examination Committee:
Head of the Committee: Prof. Dr. Andrea Knierim
Supervisor and Reviewer: Prof. Dr. Torsten Müller
Co-Reviewer: Prof. Dr. Andreas de Neergaard
Additional Examiner: Prof. Dr. Wilhelm Claupein

i
Table of contents
List of figures ............................................................................................................................. v
List of tables ............................................................................................................................. vii
List of equations ...................................................................................................................... viii
List of abbreviations .................................................................................................................. ix
1 Summary ............................................................................................................................. 1
2 Zusammenfassung ............................................................................................................... 3
3 General introduction ........................................................................................................... 5
3.1 Phosphate fertilizers for agricultural productivity ....................................................... 5
3.2 Placement of fertilizers and bio-effector as options to improve plant-P acquisition ... 9
3.3 Fertilizer placement in potted soil compared to field soil ......................................... 12
3.4 Aims and objectives................................................................................................... 13
3.5 References ................................................................................................................. 15
4 Fertilizer placement to improve crop nutrient acquisition and yield: A review and
meta-analysis ......................................................................................................................... 19
4.1 Abstract ...................................................................................................................... 20
4.2 Introduction ............................................................................................................... 21
4.3 Literature review ........................................................................................................ 24
Methodology ...................................................................................................... 24
Techniques for fertilizer placement .................................................................... 25
Fertilizers suitable for placement as depots ....................................................... 27
4.4 Meta-analyses of relative effects of fertilizer placement to fertilizer broadcast on
crop yield and nutrient uptake .............................................................................................. 32
Prerequisites for data inclusion .......................................................................... 32
Methodology ...................................................................................................... 33
Sensitivity analyses ............................................................................................ 39
Results ................................................................................................................ 41
4.5 Discussion .................................................................................................................. 52
4.6 Conclusion ................................................................................................................. 55
4.7 References ................................................................................................................. 56
5 Densely rooted rhizosphere hotspots induced around subsurface NH4+-fertilizer depots: a
home for P-solubilizing PGPMs? ............................................................................................. 65
5.1 Abstract ...................................................................................................................... 66
ii
Background ........................................................................................................ 67
Materials and methodology ................................................................................ 70
Results ................................................................................................................ 81
5.1.3.3 Solubilization of inorganic phosphates by PGPMs ........................................ 87
Discussion .......................................................................................................... 91
Conclusions ........................................................................................................ 98
References ........................................................................................................ 100
6 Improving fertilizer-depot exploitation and maize growth by inoculation with plant
growth-promoting bacteria – from lab to field ....................................................................... 104
6.1 Abstract .................................................................................................................... 105
6.2 Background .............................................................................................................. 106
6.3 Methods ................................................................................................................... 109
Greenhouse experiments .................................................................................. 109
Field experiments ............................................................................................. 116
Statistics ........................................................................................................... 122
6.4 Results ..................................................................................................................... 122
Pot experiment .................................................................................................. 122
Rhizobox experiment ....................................................................................... 123
Field experiment 2014 ...................................................................................... 126
Field experiment 2015 ...................................................................................... 129
6.5 Discussion ................................................................................................................ 132
6.6 Conclusions ............................................................................................................. 137
6.7 References ............................................................................................................... 139
7 Mobilization of sparingly –soluble soil P and alternative P-fertilizers by bio-effectors 143
7.1 Screening bio-effectors for ability to mobilize soil-P for improved maize growth . 143
Background and objectives .............................................................................. 143
Hypotheses ....................................................................................................... 144
Methodology .................................................................................................... 144
Results .............................................................................................................. 146
Conclusion ........................................................................................................ 147
7.2 Growth-promoting effects of Pseudomonas sp. DSMZ 13134 on maize plants upon
homogenous or placed application of soluble N and sparingly available P-fertilizer ........ 148
Background and objectives .............................................................................. 148
Hypotheses ....................................................................................................... 149

iii
Methodology: ................................................................................................... 149
Results: ............................................................................................................. 150
Conclusion: ....................................................................................................... 153
7.3 Microbial bio-effectors for the mobilization of calcium phosphates in the rhizosphere
154
Background and objectives .............................................................................. 154
Hypothesis ........................................................................................................ 154
Methodology: ................................................................................................... 154
Results: ............................................................................................................. 155
Conclusion: ....................................................................................................... 156
7.4 Influence of P-solubilizing microorganisms on P acquisition from rock phosphate by
maize 157
Background and objectives .............................................................................. 157
Hypotheses ....................................................................................................... 158
Methodology: ................................................................................................... 158
Results: ............................................................................................................. 159
Conclusion: ....................................................................................................... 160
7.5 N-form dependent solubilization of rock-phosphate in maize inoculated with
microbial bio-effectors ....................................................................................................... 161
Background and objectives .............................................................................. 161
Hypotheses ....................................................................................................... 162
Methodology: ................................................................................................... 162
Results: ............................................................................................................. 163
Conclusion ........................................................................................................ 165
7.6 Preliminary title: Effects of BE and N-form on P nutrition and growth of maize
plants supplied with different sparingly soluble inorganic/recycled P fertilizers. ............. 166
Background and objectives .............................................................................. 166
Hypotheses ....................................................................................................... 166
Methodology: ................................................................................................... 166
Results .............................................................................................................. 167
Conclusions: ..................................................................................................... 168
7.7 BE-assisted P nutrition of spring wheat supplied with rock phosphate and placed
NH4+ 169
Background and objectives .............................................................................. 169
Hypotheses ....................................................................................................... 170

iv
Methodology: ................................................................................................... 170
Results: ............................................................................................................. 171
Conclusion: ....................................................................................................... 173
7.8 References ............................................................................................................... 174
8 General discussion and conclusion ................................................................................. 175
8.1 Meta-analysis on fertilizer placement ...................................................................... 175
8.2 Induced rhizosphere hotspots as a “home” for inoculated microbial BEs .............. 176
8.3 P-solubilizing BEs and potential to contribute to improved plant P-acquisition .... 178
8.4 Conclusion ............................................................................................................... 180
8.5 References ............................................................................................................... 181
9 List of publications and presentations ............................................................................. 183
9.1 Peer-reviewed publications ...................................................................................... 183
9.2 Conference proceedings .......................................................................................... 183
9.3 Oral Presentations (15-25 minutes) ......................................................................... 183
9.4 Poster Presentations ................................................................................................. 183
10 Acknowledgments ....................................................................................................... 185
11 Curriculum Vitae ......................................................................................................... 188
12 Eidesstattliche Versicherung ....................................................................................... 191

v
List of figures
Figure 4.1. Fertilizer placement techniques ............................................................................. 25
Figure 4.2. Relative yield of fertilizer placement by yield component .................................... 43
Figure 4.3. Relative yield of fertilizer placement by crop type ................................................ 43
Figure 4.4. Relative yield of fertilizer placement by fertilizer placement method .................. 44
Figure 4.5. Relative yield of fertilizer placement by fertilizer type and placement depth ....... 45
Figure 4.6. Relative nutrient concentration of plant parts by nutrient, fertilizer type and
placement depth (0, 5 – 10, and > 10 cm) ................................................................................ 48
Figure 4.7. Relative contents of N, P and K in above-ground biomass by fertilizer type and
placement depth (0, 5 – 10, and > 10 cm) ................................................................................ 51
Figure 5.1. Root length around the NH4+-depot at 36 (A) and 56 (B) days after planting. .... 82
Figure 5.2. Phytotoxicity of concentrated NH4+ inhibited root growth in the immediate
surrounding of the depot and induced intense rooting in zones with non-toxic NH4+ levels at
56 dap. ...................................................................................................................................... 82
Figure 5.3. Residual Nmin in the bulk soil (A) and in the NH4+-depot (B) at 56 dap ............. 83
Figure 5.4. Qualitative (A) and quantitative (B) comparison of growth of Trichoderma
harzianum T-50 on Malt extract peptone agar with increasing NH4-N concentrations after 48
hrs. ............................................................................................................................................ 84
Figure 5.5. Bacillus amyloliquefaciens FZB42 grown on DEV medium ................................ 85
Figure 5.6. Mycelium diameter of Trichoderma harzianum T-22 affected by 15 minutes pre-
incubation in NH4-N solution with or without DMPP ............................................................. 87
Figure 5.7. PGPMs clarified cloudy Ca-P precipitate but not rock phosphate (RP) or sewage
sludge ash (SA). ....................................................................................................................... 88
Figure 5.8. Change in pH (a), total P concentration (b) ), acid- (c) and alkaline-phosphatase
activity (d) in the liquid fraction of media 65 hours after onset of incubation ........................ 89
Figure 5.9. Root colonization by fluorescent Pseudomonas sp. 5 x 5 cm to seed (8 cm radius)
.................................................................................................................................................. 91
Figure 6.1. Shoot dry weight (A) and P content (B) (Pot experiment) .................................. 123
Figure 6.2. Root length density within (A) or outside (B) the NH4+-Depot or corresponding
soil zone (Rhizobox) .............................................................................................................. 124
Figure 6.3. Root surface pH within (A, C) or outside (B) the NH4+-Depot or corresponding
soil zone (Rhizobox) .............................................................................................................. 125
Figure 6.4. Root colonization by fluorescent Pseudomonas sp. within the NH4+-Depot or
corresponding soil zone (Rhizobox) ...................................................................................... 125
Figure 6.5. Root growth (A) and density (B) in NH4+-Depot and non-Depot row-sides (Field
2014 and 2015) ....................................................................................................................... 131
Figure 7.1. Shoot dry weight (A) and shoot P content (B) and concentration (C) and root
length density (D) in response to inoculation of BEs. ............................................................ 147
Figure 7.2. Densely rooted rhizosphere hotspot around a fertilizer depot ((NH4+/RP -enriched
manure depot). ........................................................................................................................ 151
Figure 7.3. Shoot biomass (A), shoot P concentration (B), P content (C) and N content (D).
................................................................................................................................................ 151
Figure 7.4. Shoot dry matter (A) and shoot P content (B), root dry matter (C) and total root
length (D) ............................................................................................................................... 156

vi
Figure 7.5. Shoot dry matter (A) and shoot P content (B), root dry matter (C) and total root
length (D) ............................................................................................................................... 159
Figure 7.6. Effect of BEs on shoot dry matter (A), shoot P content (B) and P concentration (C)
and root dry matter (D). .......................................................................................................... 165
Figure 7.7. Effect of treatments with NH4+, BEs and P-fertilizers on shoot DM (A), Shoot P
content (B), root DM (C) and root length density (D). .......................................................... 168
Figure 7.8. Effect of BE on shoot biomass production at the booting stage (A), straw biomass
(B) and grain yield (C) at senescence stage. .......................................................................... 172

vii
List of tables
Table 4.1. Effective diffusion coefficients of macronutrients in soil ....................................... 29
Table 5.1. List of PGPMs ......................................................................................................... 72
Table 5.2. RLD and rhizosphere pH 5x5 cm to seeds, shoot 15N signal, shoots Shoot N and P
concentration and content, and shoot dry matter, 55 days after sowing .................................. 90
Table 6.1. Treatments (Field experiments 2014 and 2015) .................................................... 117
Table 6.2. Shoot N and P concentration and content, and shoot dry matter, 55 days after
sowing, (Rhizobox experiment) ............................................................................................. 126
Table 6.3. NH4+-application and bio-effector effects on Ear-leaf N and P, and grain yield
(Field experiment 2014) ......................................................................................................... 128
Table 6.4. Sources of variation (Two-Way ANOVA, Field experiment 2015) ..................... 130
Table 7.1. Source of variation and Least square means (Two-way ANOVA, ns P>0.1) ....... 146
Table 7.2. Source of variation (Three-way ANOVA) (ns P>0.1) .......................................... 164
Table 7.3. Least square means (Three-way ANOVA) ........................................................... 164
Table 7.4. Two-way ANOVA for factors BE and P-fertilizer (ns P >0.1)............................. 167
Table 7.5. Relative effect (%) of NH4+ to NO3
- and Pro to NoBE on shoot, straw and grain dry
matter, and contents and concentrations of different nutrients at booting and senescence
growth stages in shoot, straw and grain. ................................................................................ 171
Table 7.6. Effect of BE on shoot N and P content (Booting stage) and root biomass, grain and
straw characteristics ............................................................................................................... 173

viii
List of equations
Equation 4.1. The effective diffusion coefficient of a nutrient in soil (De).............................. 27
Equation 4.2. Effect sizes (response ratios, ln R) ..................................................................... 35
Equation 4.3. Variance of effect sizes (VlnR) ........................................................................... 35
Equation 4.4. Fixed-effects weight (Wi) .................................................................................. 36
Equation 4.5. Overall mean effect size (𝑬) .............................................................................. 36
Equation 4.6. Variance of the overall mean effect size (𝑺𝑬𝟐) ................................................. 36
Equation 4.7. Confidence interval of mean effect size ............................................................ 37
Equation 4.8. Total heterogeneity (QT) (1) .............................................................................. 37
Equation 4.9. Total heterogeneity (QT) (2) .............................................................................. 37
Equation 4.10. Sum of individual group heterogeneity (QM)................................................... 37
Equation 4.11. Residual error heterogeneity (QE) .................................................................... 38
Equation 4.12. Pooled study variance (σ2pooled) ........................................................................ 38
Equation 4.13. Random-effects weight (Wi(rand)) ..................................................................... 38
Equation 5.1. Preparation of (Ca3(PO4)2) ................................................................................. 75

ix
List of abbreviations
+P, treatment with Ca(NO3)2 and Ca(H2PO4)2 homogenously mixed in soil
ACC, 1-aminocyclopropane-1-carboxylate
ANR, Apparent Nutrient Recovery efficiency
B.atr., Bacillus atrophaeus
B.s.R41, Bacillus simplex R41 (cold-adapted strain)
B.spec, Bacillus spec,
Bact, Bactofil (BE consortia comprising: Azospirillum brasielnse, Azotobacter vinerólandii,
B. megaterium, Bacillus polymyxa, Pseudomonas fluorescens, Sterptomyces albus)
BE, Bio-effector or PGPM
BFDC, Penicillium sp. PK 112 (surfactant dispersion, “Tenside” in German);
BFOD, Penicillium sp. PK 112 (oil dispersion)
Broad., Fertilizer broadcasted and incorporated in soil (Field)
CAN, Calcium ammonium nitrate
CI95%, Bias-corrected percentile bootstrap confidence intervals (95 %) with 999 iterations
at the power α = 0.05
ComA, CombiFectorA (consortia BE comprising: Trichoderma. harzianum OMG08,
Pseudomonas fluorescens, Bacillus subtilis).
CULTAN, Controlled Long-Term Ammonium Nutrition
DAP, di-ammonium phosphate
DAS, Days after sowing
dap, Days after planting
Depot, Fertilizer placed as a subsurface localized depot
DM, dry matter
DMPP, 3, 4-Dimethylpyrazole phosphate
MAP, Mono-ammonium phosphate
Meg, MegaNit, (BE consortia comprising: A. chroccoccum, Azospirillum ssp., B. megaterium,
Bacillus subtilis)
Mixed, Fertilizer evenly mixed in soil (Greenhouse)
NH4+-Depot, treatment with (NH4)2SO4 placed as a concentrated depot
NO3--Mixed, treatment with Ca(NO3)2 homogenously mixed in soil
NoBE, no inoculated BE or PGPM
OmG08, Trichoderma harzianum OmG-08
P-Depot, treatment with placed RP-enriched manure placed as a concentrated depot
PGPMs, Plant Growth-Promoting Microorganisms
Phyl, Phylazonit (BE consortia comprising: Azotobacter chrococcum, Bacillus megaterium)
P-Mixed, treatment with RP-enriched manure homogenously mixed in soil
P-Mixed10cm, treatment with RP-enriched manure homogenously mixed in top 10 cm soil

x
Pro, Pseudomonas sp. DSMZ 13134, Proradix®
Rhiz, Bacillus amyloliquefaciens FZB42, Rhizovital42®
RLD, Root length density
RP, rock phosphate
RPE, Relative placement effect
SP11, Vitalin SP11 (consortia BE comprising: Bacillus subtilis, Pseudomonas sp.,
Streptomyces spp., natural humic acids und extracts of the seaweed Ascophyllum nodosum.
SSA/SA, sewage sludge ash.
STD, Standard deviations
STR, struvite (magnesium ammonium phosphate, NH4MgPO4·6H2O)
T-22, Trichoderma harzianum -T22
T50, Trichoderma harzianum T50
TSP, Triple superphosphate
USDA, United States Department of Agriculture
WG, Trichoderma harzianum WG

1: Summary
1
1 Summary
Even when total nitrogen (N) and phosphorus (P) concentrations in most agricultural soils are
high, the concentrations of plant-available N and P fractions are often inadequate for
acceptable yield. In comparison to conventional fertilizer application by homogenous
broadcast over the soil surface (with or without subsequent incorporation), fertilizer
placement in defined soil areas/volumes close to seeds or crop roots is a more effective
application method to enhance the plant-availability of applied fertilizers. Nevertheless,
considerable root growth in subsurface nutrient patches or around concentrated fertilizer-
depots (and/or improved nutrient influx rates in roots) is a prerequisite for improved uptake of
placed nutrients. Furthermore, zones with intense rooting around placed fertilizer depots
(“rhizosphere hotspots”) with high concentrations of organic nutrients released as root
exudates may be favorable for the survival and establishment of inoculated plant-growth-
promoting microorganisms (PGPMs), which mobilize nutrients in soil to favor plant growth.
In the last three decades, several published field studies comparing fertilizer placement to
fertilizer broadcast arrived at different and often conflicting results regarding their effects on
yield and nutrient status of various crops. For this reason, the first task was to conduct a Meta-
analysis on data in published peer-reviewed field studies on fertilizer placement that met a set
of pre-defined criteria for inclusion. We investigated the relative effect of fertilizer placement
for specific fertilizer formulations (e.g. NH4+ and CO(NH2)2 without or in combination with
soluble P (HPO42-; H2PO4
-); soluble K; solid or liquid manure) in a precise restricted area on
surface or subsurface soil in comparison to fertilizer broadcast on yield, nutrient concentration
and content in above-ground plant parts. We utilized data from a total of 40 field studies
published between 1982 and 2015 (85% of studies published from 2000) that met our criteria.
We used the method of “baseline contrasts” to compare different fertilizer placement
treatments to fertilizer broadcast as a common control or baseline treatment. Results showed
that overall, fertilizer placement led to +3.7% higher yields, +3.7% higher concentrations of
nutrients in above-ground plant parts and +11.9% higher contents of nutrients also in above-
ground plant parts than fertilizer broadcast application. Placement depth had a strong effect of
the outcome of fertilizer placement because relative placement effects increased with
increasing fertilizer placement depth. Composition of fertilizer formulations was also an
important factor. High yields of fertilizer placement relative to fertilizer broadcast application
were obtained for CO(NH2)2 in combination with soluble P (HPO42-; H2PO4
-) (+27%) or NH4+
in combination with HPO42-; H2PO4
- (+15%) (Nkebiwe et al., 2016 a: Field Crops Research
196: 389–401).
The next aim was to investigate the effect of fertilizer placement in subsurface soil in
combination with application of bio-effectors (BEs) (PGPMs and natural active substances
such as humic acids and seaweed extracts) on root growth of crop plants, establishment of
inoculated PGPM in the rhizosphere, grain and biomass production as well as plant nutrient
status for maize (Zea mays L) and wheat (Triticum aestivum L) cultures. Through various pot
and rhizobox experiments, we observed that placement of a subsurface concentrated NH4+-
fertilizer depot stabilized with the nitrification inhibitor DMPP (3,4-di-

1: Summary
2
methylpyrazolphosphate) induced dense rooting around the depot contributing to more
efficient exploitation of the depot. For this, it was crucial the N persisted in the depot mainly
as poorly mobile NH4+, in order to induce localized depot-zone root-growth as well as
favorable chemical and biological changes in the rhizosphere to improve N and P uptake by
crop plants. Through in vitro culture experiments on solid and liquid media, we could show
that via acidification of the growth media, several selected microbial BEs were capable to
solubilize sparingly soluble inorganic phosphates and also that these BEs showed
considerable tolerance to high concentrations of NH4+ und DMPP. The latter indicated a
potential for the BEs to colonize plant roots in NH4+-rich well rooted soil zones around a
subsurface NH4+-fertilizer depot (Nkebiwe et al., 2016 c: Manuscript submitted). Through
further pot experiments and four others experiments as Bachelor and Master theses
conduction under my supervision, we observed that certain BEs that readily solubilized tri-
calcium phosphates in vitro were able to mobilize rock phosphate (RP) applied in soil-based
substrates when N was supplied as stabilized NH4++DMPP, thereby contributing to enhanced
P uptake and growth of maize and wheat plants. The bacterial BE Pseudomonas sp. DSMZ
13134 and BE consortia products containing bacteria and fungi such as CombiFectorA were
good candidates. BE-induced RP-solubilzation occurred mainly in substrates with low CaCO3
contents indicating low P sorption capacity for neutral and moderately alkaline soils. With
CombiFectorA, maize P-acquisition from sewage sludge ash could be enhanced, thus
increasing the efficiency of a sparingly soluble fertilizer based of recycled wastes. Possible
explanations for the beneficial effects of best performing BEs to improve plant growth were
enhanced solubility of sparingly soluble P fertilizers via acidification of the rhizosphere and
release of nutrient-chelating substances as well as improvement of root growth for better
spatial interception of nutrients (Nkebiwe et al., 2016 d: Manuscript in preparation).
Alongside, more greenhouse and two field experiments (grain maize 2014 and maize silage
2015) were designed, planned, conducted and evaluated. A peer-reviewed paper from this
work has already been published (Nkebiwe et al., 2016 b: Chemical and Biological
Technologies in Agriculture 3:15). In the greenhouse and experiments, placement of a
concentrated stabilized NH4+-fertilizer depot led to improved root and shoot growth, and
increased shoot N and P contents. Through intense root growth of maize around the NH4+-
depot, increased root-colonization by Pseudomonas sp. DSMZ 13134 close to seeds could be
observed. In the field, many weeks after subsurface placement of the concentrated stabilized
NH4+-depot, it could be shown that N considerably persisted in the depot-zone as NH4
+,
which strongly induced depot-zone root growth. Placement of the NH4+-depot led to +7.4 %
increase in grain yield of maize (2014) and +5.8% increase in maize silage yield (2015) in
comparison to fertilizer broadcast. Placement of Pseudomonas sp. DSMZ 13134 inoculum in
the sowing row let to +7.1% increase in yield of maize silage (2015) in comparison to the
non-inoculated control.
In total, these results showed that precise placement of specific fertilizer formulations in
combination with the application of selected PGPMs can lead to improved plant growth,
improved N and P uptake with a potential to save resources.
2: Zusammenfassung
3
2 Zusammenfassung
In landwirtschaftlichen Böden kommt es oft vor, dass die Konzentrationen von pflanzen-
verfügbarem Stickstoff (N) und Phosphor (P) für einen guten Ertrag nicht ausreichen, selbst
bei hohen Konzentrationen vom Gesamt-N und -P. Im Vergleich zur üblichen breitflächigen
Düngerausbringung auf der Bodenoberfläche (mit oder ohne anschließender Einarbeitung), ist
die präzise Platzierung von Dünger möglichst nah an Saatgut oder Wurzel eine
vielversprechende Alternative zur Erhöhung der Pflanzenverfügbarkeit von Düngemitteln.
Eine gute Durchwurzelung um den Depotbereich ist allerdings eine Voraussetzung für die
wirksame Platzierung von Dünger, mit dem Ziel die Nährstoffaufnahme zu verbessern und
gleichzeitig günstige Bedingungen für wachstumsfördernden Bodenmikroorganismen zu
schaffen.
In den letzten drei Jahrzehnten kamen zahlreiche Feldversuche zur Platzierung von Dünger im
Vergleich zur breitflächige Ausbringung zu scheinbar unterschiedlichen Ergebnissen
hinsichtlich Ertrag und Nährstoffaufnahme von Kulturpflanzen. Deshalb wurde zum Beginn,
mit Studien die bestimmten Voraussetzungen erfüllten, eine Meta-Analyse durchgeführt,.
Dabei wurde der Effekt der gezielten Platzierung von unterschiedlichen Dünger (zB. NH4+
oder CO(NH2)2 ohne oder mit wasserlöslichem Phosphor (HPO42-; H2PO4
-); wasserlöslichem
Kaliumr; Stallmist oder Gülle) in einen begrenzten Bereich auf der Bodenoberfläche oder im
Unterboden im Vergleich zur breitflächigen Ausbringung auf Ertrag, Nährstoffgehalt und
Nährstoffaufnahme bei verschiedenen Kulturpflanzen untersucht. Insgesamt wurden
Ergebnissen aus vierzig Feldversuchen verwendet, die zwischen 1982 und 2015 stattfanden
(85% der Versuche ab 2000). Mit Hilfe der Methode “Baseline contrasts”, haben wir
unterschiedliche Behandlungen von Düngerplatzierung mit breitflächiger Ausbringung von
Dünger als Kontrolle verglichen. Die Ergebnisse zeigen, dass Düngerplatzierung zu +3,7 %
mehr Ertrag, +3,7% höherer Nährstoffkonzentration und +11,9% höherer Nährstoffgehalte in
oberirdischer Biomasse als breitflächige Ausbringung führt. Die Tiefe der Platzierung hatte
auch einen deutlichen Effekt (je tiefer, desto höherer der Platzierung-Effekt), ebenso die
Kombination von Nährstoffen, mit höheren Erträgen bei der Platzierung eine
Düngermischung aus Harnstoff und Phosphat (+27% Ertrag) oder Ammonium und Phosphat
(+15% Ertrag) als bei der breitflächigen Ausbringung (Nkebiwe et al., 2016 a: Field Crops
Research 196: 389–401).
Zunächst wurde der Effekt der Platzierung von Düngern in Kombination mit der Applikation
von Bio-Effektoren (Pflanzenwachstums-stimulierende Mikroorganismen und natürliche,
wirkaktive Stoffen wie Huminsäure und Algenextrakte) auf das Wurzelwachstum von
Kulturpflanzen, die Etablierung der mikrobiellen Inokula in der Rhizosphere, Korn- und
Biomassebildung, sowie Nährstoffinhalt bei Mais (Zea mays L) und Weizen (Triticum
aestivum L) untersucht. Mit Hilfe von Topf- und Wurzelkastenversuchen habe ich festgestellt,
dass ein konzentriertes Düngedepot aus NH4+ stabilisiert mit DMPP (der
Nitrifikationshemmer 3,4-Dimethylpyrazolphosphat) zu einer starken Durchwurzelung und
Erschließung des Düngerdepots führt. Dabei war es wichtig, dass die Stickstoffform im Depot
hauptsächlich als wenig mobiles NH4+ besteht, sowohl um lokalisiertes Wurzelwachstum

2: Zusammenfassung
4
anzuregen, als auch um günstige chemische und biologische Bedingungen für eine verbesserte
Stickstoff- und Phosphataufnahme der Pflanzen zu ermöglichen. Durch in vitro Versuche auf
feste und flüssige Kulturmedien konnte gezeigt werden, dass einige wachstumsfördernde
Bakterien und Pilze in der Lage sind, schwerlösliches, unorganisches P durch Ansäuerung
aufzulösen und dass sie Toleranz an hohen Konzentrationen von NH4+ und DMPP zeigen.
Damit zeigen die wachstumsfördernde Mikroorganismen ein Potenzial den ammonium-
reichen Boden um das Düngerdepot gut zu besiedeln (Nkebiwe et al., 2016 c: Manuskript in
eingereicht). Durch eigene Topfversuche und vier betreute Bachelor- und Masterarbeit haben
wir festgestellt, dass einige Trikalciumphosphat-lösende mikrobielle Bio-Effektoren das
Rohphosphat- aneignungsvermögen von Mais und Sommerweizen verbessern wenn N als
stabilisiertem Ammonium (NH4++DMPP) gedüngt ist. Dies galt besonders für bakterielle Bio-
Effektoren wie Pseudomonas sp. DSMZ 13134 oder Kombi-Produkten aus Bakterien und
Pilzen wie CombiFectorA. Dieser Effekt war deutlich in Substraten mit geringem Kalkgehalt
bzw. mit geringer Sorptionsfähigkeit für Phosphat in Böden mit neutralem oder leicht
erhöhtem pH-Werten. Mit CombiFectorA konnte die P-Aneignungsvermögen von Mais aus
schwerlöslicher Klärschlammasche verbessert. Auf diese Weise konnte die Effizienz der
schwerlöslichen Klärschlammasche als Recycling-Phosphatdünger erhöht werden. Die
Verbesserung der Lösbarkeit von schwerlöslichem Phosphat durch Ansäuerung der
Rhizosphäre und Ausscheidung von Chelaten wie auch die Verstärkung des
Wurzelwachstums bei Mais und Sommerweizen waren mögliche Wirkmechanismen der
erfolgreichsten mikrobiellen Bio-Effektoren (Nkebiwe et al., 2016 d: Manuskript in
Vorbereitung).
Daneben wurden weitere Gewächshausversuche und zwei Feldversuche (Körnermais 2014
und Maissilage 2015) geplant, umgesetzt, ausgewertet und evaluiert. Ein peer-reviewed Paper
wurde mit Ergebnissen aus diesen Versuchen publiziert (Nkebiwe et al., 2016 b: Chemical
and Biological Technologies in Agriculture 3:15). Bei Gewächshausversuchen hat die
Platzierung von stabilisiertem Ammoniumdepot zum verbesserten Wurzel- und
Sproßwachstum und zu höheren Sproß-N und -P Gehalt geführt. Durch gute Erschließung des
Ammoniumdepots mit Maiswurzeln wurde die Besiedlung des Inokulums Pseudomonas sp.
DSMZ 13134 im Bereich des Düngerdepots verbessert. In den Feldversuchen konnte mehrere
Wochen nach Platzierung des Düngerdepots (Ammonium+DMPP) nachgewiesen werden,
dass Stickstoff hauptsächlich als NH4+ in dem Depotbereich verblieb, was zu verstärktem
Wurzelwachstum im Depotbereich führte. Durch Platzierung von Ammoniumdepot konnte
ein Ertrag von +7,4% für Körnermais (2014) und +5,8% für Maissilage (2015) in Vergleich
zu breitflächiger Ausbringung erzielt werden. Auch durch die Platzierung von Pseudomonas
sp. DSMZ 13134 unter der Saatreihe wurde +7,1% mehr Maissilage (2015) im Vergleich zur
Kontrolle ohne Inokulum festgestellt.
Insgesamt zeigen die Ergebnisse, dass die präzise Platzierung von speziellen Düngemitteln
und die Applikation von wachstumsfördernde Mikroorganismen zu verbessertem
Pflanzenwachstum, verbesserter N und P Aufnahme und höherer Ertrag bei gleichzeitiger
Ressourcensparung führen.

3: General introduction
5
3 General introduction
3.1 Phosphate fertilizers for agricultural productivity
Phosphorus (P) is a major element present in different cell organelles (e.g. phospholipid
plasma membranes); macromolecules (e.g. DNA and RNA); and energy transfer compounds
(e.g. ATP, UTP, GTP, and the phosphate esters glucose 6-phoshate and
phosphoglyceraldehyde) involved in vital processes such as nutrient transport, respiration,
photosynthesis, starch and cellulose synthesis (Hawkesford et al. 2012). Given the importance
of P to most biological processes, with increasing P supply, organisms tend to store P for later
use as orthophosphates (HPO42-/H2PO4
-) in cell vacuoles, as polyphosphates for bacteria,
fungi and lower plants, and as phytate in roots, tubers, pollen, grain and seeds for higher
plants (Hawkesford et al. 2012; White 2012).
In many agricultural systems, phosphate (PO43-) (taken up by plants in the form HPO4
2-
/H2PO4-) is frequently the most limiting among macronutrients for optimal crop productivity
(Grant et al. 2001; Hinsinger 2001). Since the early history of agriculture, P-rich farm inputs
like manure and more recently guano, bone meal, rock phosphate (RP) and phosphate-rich
industrial by-products have been important P fertilizers for crop production. Today, manures
and RP are still valuable P fertilizers especially in organic farming systems whereas soluble
mineral PO43- fertilizers have gained significant importance especially in intensive farming
systems.
Only a small fraction of soluble PO43- fertilizer that is applied to soil becomes available to
plants over time. This is because soluble PO43- becomes converted to less soluble and less
available P-forms by fixation processes such as precipitation and adsorption reactions in soil,
depending on soil pH, concentrations of reactive Ca2+, Fe3+ and Al3+, and concentrations and
types of clays and organic matter present (Hansen et al. 2002). The fraction of applied soluble

3: General introduction
6
PO43- that is immediately plant-available to the total amount of soluble PO4
3- applied as
fertilizer in soil could be as high as 1:3 or less than 1:20, depending on fertilizer application
rate, soil P-sorption properties and duration since fertilizer application (Hansen et al. 2002).
In four long term studies for example, measured soluble plant-available PO43- was <5% of
total soil P for sites with no P fertilization and 6 - 87% for sites regularly fertilized with
soluble PO43- fertilizers or manure, depending on fertilization rates, soil type and texture
(Hansen et al. 2002).
Soluble mineral PO43- fertilizers are mostly prepared by acid-digestion of non-renewable RP
mined from a few major global reserves. Known world RP reserves are disproportionately
located in a few countries (72 % in Morocco and Western Sahara), among which the rate of
mine production of RP is also disproportionately allocated (45% 2015 global mine production
by China) (USGS, 2016). According to current estimates (mine production rate 218-223 Pg a-1
from 2014-2015 and total world reserves 69,000 Pg, 2016), global RP reserves may become
depleted in about 300 years or earlier given that mine production rate is projected to increase
(USGS, 2016). The need for agricultural products will continue to grow because of a growing
global population (Tilman et al. 2002). Given depleting global P reserves, soluble PO43-
fertilizers required for crop production will certainly become more expensive. Resource
scarcity for food production may also give way to future geo-political tensions. In this light,
the challenge to adequately supply agricultural crops with PO43- may only grow in its severity.
Therefore, every promising strategy to improve PO43- availability in crop production is worth
close consideration alone and in combination with other compatible strategies.
An important approach to resolve the PO43- insufficiency problem is using soil P reserves and
P-fertilizers efficiently by adopting measures that increase the uptake-efficiency of P-
fertilizers by crop plants. In the tropics and subtropics, the quantity of P apparently recovered
in harvested crops during the first year of application is only about 10% the amount of soluble
3: General introduction
7
PO43- fertilizer applied (Baligar et al. 2001; Raun and Johnson 1999). For soluble PO4
3-
fertilizers, P-uptake efficiency can be considerable increased by adopting fertilizer application
techniques that enhance plant P-acquisition. Through precise placement of mineral or organic
phosphate fertilizers close to seeds, growth and P status of crop plants can be considerably
enhanced, especially during critical early growth stages (Grant et al. 2001; Bittman et al.
2012). Nevertheless, several published field studies comparing fertilizer placement to
fertilizer broadcast in the last three decades arrived at different and often conflicting results
regarding their effects on yield and nutrient acquisition of field crops. This meant a
knowledge gap existed regarding the effect of fertilizer placement on crop nutrition and yield
in comparison to conventional fertilizer application by broadcast. Furthermore, requirements
for effective fertilizer placement were still unknown.
When a complete dose of P- and N-fertilizer is placed in subsurface soil at a high rate, the
point of placement is usually farther away from seeds than starter-fertilizer to avoid seed
injury. In such cases, P and N uptake efficiency of the placed fertilizer depends on
considerable root growth in and around the subsurface fertilizer patch or depot. It has been
repeatedly shown that uptake of placed PO43- fertilizers by crop plants can be significantly
improved when a PO43- fertilizer is placed in combination with an NH4
+ fertilizer, likely due
to a stronger localized root-growth response of NH4+ at the site of contact with roots than
PO43- and due to the pH-decreasing effect of NH4
+ nutrition (Lynch et al. 2012; Jing et al.
2012; Miller and Ohlrogge 1958). Furthermore, when less expensive but less soluble P
fertilizers are added to biomass during composting, their solubility and plant uptake-
efficiency can be considerably enhanced (Biswas and Narayanasamy 2006; Bustamante et al.
2016; Moharana and Biswas 2016).
Plant P-acquisition from sparingly available P resources in soil and from P applied via
fertilizer can be improved by measures that enhance P mobilization via enhancing

3: General introduction
8
mineralization and solubilization of organic and inorganic P pools respectively. Plant P-
acquisition from sparingly available organic and inorganic soil pools can be improved by
application of bio-effectors (Weinmann and Römheld 2012). The term bio-effector describes
viable plant growth-promoting microorganisms (PGPMs) such as phosphate solubilizing
bacteria (PSB), mycorrhiza-helper bacteria (MHB), IAA- or ACC-deaminase-producing
bacteria that improve plant growth via phytohormone signaling, and active natural substances
such as humic acids and seaweed extracts that promote growth and nutrient acquisition of
crops plants via several interacting mechanisms (Altomare et al. 1999; Lugtenberg and
Kamilova 2009; Richardson et al. 2009; Jiang et al. 2012; Zahir et al. 2009; Glick 2005;
Sharma et al. 2012). A major problem with the application foreign microorganisms in soil to
promote plant growth is that their populations in soil rapidly decline as a consequence of
adverse prevailing biotic and/or abiotic conditions (van Veen et al., 1997). Among others,
competition for nutrients is a key cause for declining populations of soil-inoculated PGPMs.
If PGPMs are inoculated in densely-rooted soil, their established may be promoted by the
presence of high concentrations of nutrients exuded by roots.
Furthermore, soil P turnover and plant-availability can also be strongly influenced by farm
management practices such as tillage (aeration and improved soil microbial activity,
incorporation of P stratified on the soil surface from broadcast fertilization), application of
soil amendments like organic matter and lime (modification of soil texture and pH), cropping
systems and crop rotations (Fink et al. 2016; Kleinman et al. 2015; Redel et al., 2007).
A complementary approach to resolve the increasingly difficult challenge of inadequate PO43-
supply to crops is to develop a more closed flow cycle of P resources by reducing losses from
“farm to fork” and by increasing the value of recycling. However, P-rich materials from waste
recycling or by-products from industrial processes can gain value as PO43- fertilizers if their
plant-availability and therefore efficiency can be considerable improved and if their

3: General introduction
9
concentrations of impurities can be kept below the accepted threshold. Unlike manure and
composts containing large pools of organically bound P that can be mineralized over the
course of a few years, recycled P fertilizers like ashes from incineration of sewage sludge; P-
enriched slags as by-products from the metallurgical industry (e.g. Thomas phosphate); and
products from pyrolysis of biomass (e.g. biochars) are generally not soluble and only
sparingly plant-available in neutral to slightly alkaline soils. On the contrary, a recycled P
fertilizer like struvite (NH₄MgPO₄·6H₂O) - crystalized out of solution during sewage
treatment - is also sparingly soluble in water, however, more available than the ashes
described above because it readily releases PO43- into soil solution to equilibrate for P taken
up by roots, thus performing as a valuable slow-release N-P-Mg fertilizer (Ryu et al. 2011;
Talboys et al. 2016; Vaneeckhaute et al. 2015). To reduce loss of P from fertilizers to surface
water bodies via runoffs (particulate P, dissolved PO43- and suspending colloidal-dissolved
organic PO43-), subsurface placement of PO4
3- fertilizers and manures is a means to overcome
P stratification an the soil surface, which is associated with high risk for runoff losses
(Kleinman et al. 2015; Sharpley and Jarvie 2012).
3.2 Placement of fertilizers and bio-effector as options to improve plant-P acquisition
A combination of improved mobilization of sparingly soluble P-forms in the rhizosphere and
increased localize root growth been presented as an approach to improve plant uptake of P
from labile and moderately labile pools present in soil as well as from applied fertilizers.
Chemical mobilization of P (and other elements like Fe and Zn) can be improved by root
exudation of protons, which acidify the rhizosphere especially by plants under ammonium
nutrition (Marschner et al., 1986; Marschner et al., 1989; Neumann and Römheld, 2007).
Furthermore, roots are capable of secreting metal-complexing compounds like carboxylates,
which improve P solubility and regulate the concentration of phosphate-immobilizing cations
like Ca2+, Fe3+ and Al3+ in the rhizosphere (Lipton et al., 1987; Neumann and Römheld 2007).
3: General introduction
10
Similarly, plant growth-promoting rhizobacteria (PGPR) (Vassilev et al., 2006; Rodríguez et
al., 2006; Lugtenberg and Kamilova, 2009) and fungi (Altomare et al., 1999) may secrete
organic acids for P mobilization. Plant growth-promoting microorganisms (PGPM) may
enhance mycorrhization (Richardson et al., 2009) and secrete root-growth-stimulating
phytohormones (Jiang et al., 2012) as modes of action to improve spatial P acquisition. Root
growth, especially fine roots (< 2 mm ø) and root hairs, determines the capacity of plants to
take up mineral nutrients and water (Jackson et al., 1997). However, the full potential of
active mobilization of P and other less mobile nutrients by plant roots may only be exploited
if those nutrients are present in the rhizosphere in considerable amounts. Placement of root-
attracting fertilizers at high concentrations below the soil surface with a subsequent
exploration of the fertilizer spots by plant roots may, thus, be an effective option.
In natural ecosystems, nutrients are unevenly distributed in soil and plants optimize nutrient
acquisition by maximizing uptake from nutrient-rich sites whereas efforts to acquire nutrients
from poor soil zones are kept low (Hutchings and John, 2004). In agro-ecosystems, fertilizer
placement creates strong heterogeneity of nutrient concentrations in soil. Under such
conditions, the gradients of nutrient concentrations between a nutrient depot and the
surrounding soil is influenced by the method of fertilizer application, fertilization history,
mobility of the nutrient in soil, and biotic and abiotic processes that transform and mobilize
soil nutrients. Therefore, root and shoot growth response of plants to fertilizer placement is
proposed to be stronger on soils with suboptimal fertility than on nutrient-rich ones (Randall
and Hoeft, 1988; Buah et al., 2000; Borges and Mallarino, 2001; Grant et al., 2001). Plant
response to placed nutrients has been shown to be strong when a considerable proportion of
the total nutrient requirement of the crop plant is supplied within the subsurface nutrient depot
(Hodge, 2004).

3: General introduction
11
Below ground PO43- patches have been shown to induce root growth towards the patch in
crops such as canola, wheat (Rose et al., 2009), and maize (Chassot et al., 2001; Qin et al.,
2005). However, plants show a stronger root-growth response within or close to nutrient
patches containing soluble N fertilizers (especially NH4+) in comparison to soluble PO4
3-
fertilizers (Lynch et al., 2012). Furthermore, root growth towards nutrient patches is stronger
for NH4+ than for NO3
- or CO(NH2)2 at the area of contact with the nutrient patch (Anghinoni
and Barber, 1990; Jing et al., 2010, 2012). Under certain abiotic stresses, uptake of NH4+ can
be advantageous to plants compared to uptake of NO3-. An example is early spring in
temperate regions characterized by low temperatures, reduced organic matter mineralization,
slowed root growth caused by low temperature-impaired root cell wall extensibility
(Kristoffersen et al., 2005; Lynch et al., 2012) as well as low light and low root carbohydrate
supply. Under such suboptimal conditions, several crops preferentially take up NH4+ instead
of NO3-, thus, utilizing ATP required for N assimilation more efficiently (Covey-Crump et al.,
2002; Tischner, 2000; White, 2012).
The ability of plants to efficiently exploit placed subsurface fertilizer depots containing root-
growth stimulating nutrients like NH4+ and PO4
3- is also influenced by plant species
characteristics. Plant species predisposed with high root turnover rates may be more efficient
utilizers of placed nutrients that have low mobility in soil (e.g. NH4+ and PO4
3-) because with
increasing root growth the depletion zones of individual roots rapidly overlap in a nutrient
patch with high root density (Marschner and Rengel, 2012). Placed NH4+ and/or PO4
3-
function as chemo-attractants of roots and as plant macronutrients taken in substantial
quantities (Hawkesford et al., 2012; Jing et al., 2012; Lynch et al., 2012). During early plant
growth stages, when P availability is crucial for plant development (Grant et al., 2001),
placement of a PO43- fertilizer in a small soil volume close to a growing seedling is an
effective method to ensure adequate P supply to young plants. In field-grown maize (Zea

3: General introduction
12
mays L.), for example, placement of PO43- fertilizer (100 kg P ha-1) in 3 – 6 % of the total soil
volume in the row (0.28 m3 assuming 2 rows plot-1, 75 cm inter-row distance, 250 cm row
length and 15 cm plow layer) was associated with higher shoot P concentration and shoot P
content than placement in 12 – 25% of total row soil volume during early growth stages (Lu
and Miller, 1993).
3.3 Fertilizer placement in potted soil compared to field soil
The enormous difference in the total volume of soil that can be rooted under field conditions
in comparison to the volume in pots under controlled greenhouse/climate chamber conditions
makes it inappropriate to directly compare methods to apply fertilizers in field soil to those in
potted soil. In this light, homogenous mixture of a fertilizer in a potted substrate may be
commensurate to placement in a similar restricted soil volume during early growth stages
under field conditions when root growth is still limited. This assumption is relevant to the pot
experiments described in sections 5, 6 and 7. Given that PO43- and NH4
+ have very low
effective diffusion coefficients in soil compared to other macronutrient ions or molecules, and
because they readily bind to charged surfaces in soil (Barber 1984; Clarke and Barley 1968;
Neumann and Römheld 2012; Pang et al. 1973; Schenk and Barber 1979), their uptake by
plants mostly depends on root interception (chemotropism) and diffusion rather than on mass
flow. Therefore, in pots in which total potential rooting soil volume is very restricted, it may
be expected that the higher the proportion of total soil volume that is fertilized with poorly
mobile PO43- and/or NH4
+, the higher the quantity of fertilizer P or N that is taken up
(Anghinoni and Barber 1988). Conversely, under field conditions where total potential
rooting soil volume is more or less limitless, placement of a fertilizer in a restricted soil
volume close to seeds or plant roots (5-10 cm) leads to higher nutrient uptake especially
during early growth stages than homogenous broadcast and incorporation (Nkebiwe et al.
2016). Homogenous broadcast and incorporation of P-fertilizers increase contact with PO43- -

3: General introduction
13
fixing cations (Ca2+, Fe3+, Al3+) (Grant et al. 2001) and enhances immobilization by soil
microorganisms- even though the latter functions as an important sink and source for soil P
(Gichangi et al. 2009; Bünemann et al., 2011). In contrast, placement of a PO43--fertilizer in a
restricted soil volume reduces P fixation and immobilization. Nevertheless, for PO43- that is
extremely immobile in soil and for sparingly-soluble inorganic P-fertilizers (e.g. rock
phosphates and apatite-rich incineration ashes from recycled wastes), placement in a
concentrated point in soil may limit P uptake when optimum root density and maximum root
influx rate is reached. Therefore, to increase the concentration of H2PO4-/HPO4
2- in soil
solution around the root system of target crop plants under field conditions, instead of
broadcast and incorporation in the entire plough layer or point placement at a high
concentration in a very restricted soil volume distant from seeds (to avoid seed injury), P-
fertilizers may be placed by banding on the sowing row followed by incorporation as shown
by (Lu and Miller 1993) where PO43--fertilizer was placed only in 3-6% of total soil volume in
the plough layer for in maize (Zea mays L.) cultures. For soils with high P sorption capacity,
P uptake by maize was high when the fraction of fertilized soil volume was low (Anghinoni
and Barber 1980). Nevertheless, at very low fertilization rates, it is a standard farmer’s
practice in many regions of Europe and North America to place a soluble PO43- and NH4
+-
fertilizer such as diammonium phosphate as a concentrated point close to seeds to improve
early season P-availability without causing injury to seeds.
3.4 Aims and objectives
The main aim of this Ph.D. research was to investigate the potential for improving crop
nutrient-acquisition and yield by fertilizer placement in combination with the application of
bio-effectors (BEs). Maize (Zea mays L) and wheat (Triticum aestivum L.) were chosen as
test crops for this research because they are important crop species in Europea as well as in

3: General introduction
14
many other parts of the world. This dissertation is structured in the following order of
objectives:
1. To cover the knowledge gap that exist regarding the overall effect of fertilizer placement
in comparison to conventional fertilizer application by broadcast on crop nutrient
acquisition and yield by conducting a comprehensive meta-analysis on field studies
published in accepted peer-reviewed journals in the last three decades.
2. To explore how subsurface fertilizer placement could be used as a tool to spatially control
the rhizosphere by stimulating the development of zones of intense root-growth around
fertilizer depots. These “rhizosphere hotspots” are proposed as soil areas with a high
potential for effective colonization by inoculated microbial BEs.
3. To investigate the ability of selected microbial BEs to solubilize different sparingly-
soluble inorganic P-forms in vitro, as an indicator of their potential to improve plant P-
acquisition from sparingly available soil P pools or from applied sparingly soluble P-
fertilizers under greenhouse and field conditions.
4. To investigate the potential of microbial BEs to establish in rhizosphere hotspots by
studying their survival and growth characteristics firstly in vitro under extreme
concentrations of fertilizer ions, pH and salinity - simulating chemical conditions within
and around a rich subsurface fertilizer depot - and secondly in pot-grown plants.

3: General introduction
15
3.5 References
Altomare, C., Norvell, W. A., Björkman, T., Harman, G. E. (1999): Solubilization of phosphates
and micronutrients by the plant-growth-promoting and biocontrol fungus Trichoderma
harzianum Rifai 1295-22. Appl. Environ. Microbiol. 65, 2926–2933.
Anghinoni, I., Barber, S. A. (1980): Predicting the most efficient phosphorus placement for corn.
Soil Sci. Soc. Am. J. 44, 1016–1020.
Anghinoni, I., Barber, S. A. (1988): Corn Root Growth and Nitrogen Uptake as Affected by
Ammonium Placement. Agron. J. 80, 799–802.
Anghinoni, I., Barber, S. A. (1990): Predicting the effect of ammonium placement on nitrogen
uptake by corn. Agron. J. 82, 135–138.
Baligar, V. C., Fageria, N. K., He, Z. L. (2001): Nutrient use efficiency in plants. Commun. Soil
Sci. Plant Anal. 32, 921–950.
Barber, S. A. (1984): Soil nutrient bioavailability. A mechanistic approach. Wiley, New York
Biswas, D. R., Narayanasamy, G. (2006): Rock phosphate enriched compost: An approach to
improve low-grade Indian rock phosphate. Bioresource Technol. 97, 2243–2251.
Bittman, S., Liu, A., Hunt, D., Forge, T., Kowalenko, C., Chantigny, M., Buckley, K. (2012):
Precision placement of separated dairy sludge improves early phosphorus nutrition and
growth in corn (L.). .). J. Environ. Qual. 41, 582–591.
Borges, R., Mallarino, A. P. (2001): Deep banding phosphorus and potassium fertilizers for corn
managed with ridge tillage. Soil Sci. Soc. Am. J. 65, 376–384.
Buah, S., Polito, T. A., Killorn, R. (2000): No‐tillage corn response to placement of fertilizer
nitrogen, phosphorus, and potassium. Commun. Soil Sci. Plant Anal. 31, 3121–3133.
Bünemann, E. K, Prusisz, B,. Ehlers, K. (2011): Characterization of phosphorous forms in soil
microorganisms, in Bünemann, E. K., Oberson, A., Frossard, E.: Phosphorous in action,
Biological processes in soil phosphorous cycling. Springer-Verlag Berlin Heidelberg. pp.
37–58.
Bustamante, M. A., Ceglie, F. G., Aly, A., Mihreteab, H. T., Ciaccia, C., Tittarelli, F. (2016):
Phosphorus availability from rock phosphate: Combined effect of green waste composting
and sulfur addition. J. Environ. Manage. 182, 557–563.
Chassot, A., Stamp, P., Richner, W. (2001): Root distribution and morphology of maize seedlings
as affected by tillage and fertilizer placement. Plant Soil 231, 123–135.
Clarke, A. L., Barley, K. P. (1968): The uptake of nitrogen from soils in relation to solute
diffusion. Aust. J. Soil Res. 6, 75–92.
Covey-Crump, E. M., Attwood, R. G., Atkin, O. K. (2002): Regulation of root respiration in two
species of Plantago that differ in relative growth rate: the effect of short- and long-term
changes in temperature. Plant Cell Environ. 25, 1501–1513.
Fink, J. R., Inda, A. V., Tiecher, T., Barrón, V. (2016): Iron oxides and organic matter on soil
phosphorus availability. Ciênc. agrotec. 40, 369–379.
Gichangi, E. M., Mnkeni, P. N. S., Brookes, P. C. (2009): Effects of goat manure and
inorganic phosphate addition on soil inorganic and microbial biomass phosphorus
fractions under laboratory incubation conditions. Soil Sci. Plant Nutr. 55, 764–771.
Glick, B. R. (2005): Modulation of plant ethylene levels by the bacterial enzyme ACC deaminase.
FEMS Microbiol. Lett. 251, 1–7.

3: General introduction
16
Grant, C. A., Flaten, D. N., Tomasiewicz, D. J., Sheppard, S. C. (2001): The importance of early
season phosphorus nutrition. Can. J. Plant Sci. 81, 211–224.
Hansen, N. C., Daniel, T. C., Sharpley, A. N., Lemunyon, J. L. (2002): The fate and transport of
phosphorus in agricultural systems. J.Soil Water Conserv. 57, 408–417.
Hawkesford, M., Horst, W., Kichey, T., Lambers, H., Schjoerring, J., Møller, I. S., White, P.
(2012): Functions of macronutrients, in Marschner P.: Marschner’s Mineral Nutrition of
Higher Plants, Third edition, Academic Press, Elsevier, Amsterdam, pp. 135–178.
Hinsinger, P. (2001): Bioavailability of soil inorganic P in the rhizosphere as affected by root-
induced chemical changes: a review. Plant Soil 237, 173-195.
Hodge, A. (2004): The plastic plant: root responses to heterogeneous supplies of nutrients. New
Phytol. 162, 9–24.
Hutchings, M. J., John, E. A. (2004): The effects of environmental heterogeneity on root growth
and root/shoot partitioning. Anna. Bot.-London 94, 1–8.
Jackson, R. B., Mooney, H. A., Schulze, E.-D. (1997): A global budget for fine root biomass,
surface area, and nutrient contents. Proc. Natl. Acad. Sci. (USA) 94, 7362–7366.
Jiang, Y., Wu, Y., Xu, W., Cheng, Y., Chen, J., Xu, L., Hu, F., Li, H. (2012): IAA-producing
bacteria and bacterial-feeding nematodes promote Arabidopsis thaliana root growth in
natural soil. Eur. J. Soil Biol. 52, 20–26.
Jing, J., Rui, Y., Zhang, F., Rengel, Z., Shen, J. (2010): Localized application of phosphorus and
ammonium improves growth of maize seedlings by stimulating root proliferation and
rhizosphere acidification. Field Crop. Res. 119, 355–364.
Jing, J., Zhang, F., Rengel, Z., Shen, J. (2012): Localized fertilization with P plus N elicits an
ammonium-dependent enhancement of maize root growth and nutrient uptake. Field Crop.
Res. 133, 176–185.
Kleinman, P. J. A., Sharpley, A. N., Withers, P. J. A., Bergström, L., Johnson, L. T., Doody, D. G.
(2015): Implementing agricultural phosphorus science and management to combat
eutrophication. AMBIO 44, 297–310.
Kristoffersen, A. Ø., Riley, H., Sogn, T. A. (2005): Effects of p fertilizer placement and temperature
on root hair formation, shoot growth and p content of barley grown on soils with varying p
status. Nutr. Cycl. Agroecosys. 73, 147–159.
Lipton, D. S., Blanchar, R. W., Blevins, D. G. (1987): Citrate, malate, and succinate concentration
in exudates from P-sufficient and P-stressed Medicago sativa L. seedlings. Plant Physiol.
85, 315–317.
Lu, S., Miller, M. H. (1993): Determination of the most efficient phosphorus placement for field-
grown maize (Zea mays L.) in early growth stages. Can. J. Soil. Sci. 73, 349–358.
Lugtenberg, B., Kamilova, F. (2009): Plant-Growth-Promoting Rhizobacteria. Annu. Rev.
Microbiol. 63, 541–556.
Lynch, J., Marschner, P., Rengel, Z. (2012): Effect of internal and external factors on root growth
and development, in Marschner P.: Marschner’s Mineral Nutrition of Higher Plants, Third
edition, Academic Press, Elsevier, Amsterdam, pp.331–346.
Marschner, H., Römheld, V., Horst, W. J., Martin, P. (1986): Root-induced changes in the
rhizosphere: Importance for the mineral nutrition of plants. Z. Pflanzenernaehr. Bodenk.
149, 441–456.

3: General introduction
17
Marschner, H., Treeby, M., Römheld, V. (1989): Role of root-induced changes in the rhizosphere
for iron acquisition in higher plants. Z. Pflanzenernaehr. Bodenk. 152, 197–204.
Marschner, P., Rengel, Z. (2012): Nutrient availability in soils, in Marschner P.: Marschner’s
Mineral Nutrition of Higher Plants, Third edition, Academic Press, Elsevier, Amsterdam,
pp. 315–330.
Miller, M. H., Ohlrogge, A. J. (1958): Principles of nutrient uptake from fertilizer bands 1. Effect
of placement of nitrogen fertilizer on the uptake of band-placed phosphorus at different soil
phosphorus levels1. Agron. J. 50, 95–97.
Moharana, P. C., Biswas, D. R. (2016): Assessment of maturity indices of rock phosphate
enriched composts using variable crop residues. Bioresource Technol. 222, 1–13.
Neumann, G., Römheld, V. (2007): The Release of Root Exudates as Affected by the Plant
Physiological Status, in Pinton, R., Varanini, Z.; Nannipieri, P.: The Rhizosphere.
Biochemistry and organic substances at the soil-plant interface, Ed. 2. CRC Press, Boca
Raton, Florida pp. 23–72.
Neumann, G., Römheld, V. (2012): Rhizosphere Chemistry in Relation to Plant Nutrition, in
Marschner, P.: Marschner's Mineral Nutrition of Higher Plants. 3rd ed. Academic Pr, United
States of America, pp. 347–360.
Nkebiwe, P. M., Weinmann, M., Bar-Tal, A., Müller, T. (2016): Fertilizer placement to improve
crop nutrient acquisition and yield: A review and meta-analysis. Field Crop. Res. 196, 389–
401.
Pang, P. C., Hedlin, R. A., Cho, C. M. (1973): Transformation and movement of band-applied
urea, ammonium sulfate, and ammonium hydroxide during incubation in several manitoba
soils. Can. J. Soil. Sci. 53, 331–341.
Qin, R., Stamp, P., Richner, W. (2005): Impact of tillage and banded starter fertilizer on maize root
growth in the top 25 centimeters of the soil. Agron. J. 97, 674–683.
Randall, G. W., Hoeft, R. G. (1988): Placement methods for improved efficiency of P and K
fertilizers: A Review. J. Prod. Agr. 1, 70–79.
Raun, W. R., Johnson, G. V. (1999): Improving nitrogen use efficiency for cereal production.
Agron. J. 91, 357–363.
Redel, Y. D., Rubio, R., Rouanet, J. L., Borie, F. (2007): Phosphorus bioavailability affected by
tillage and crop rotation on a chilean volcanic derived ultisol. Geoderma 139, 388–396.
Richardson, A. E., Barea, J.-M., McNeill, A. M., Prigent-Combaret, C. (2009): Acquisition of
phosphorus and nitrogen in the rhizosphere and plant growth promotion by microorganisms.
Plant Soil 321, 305–339.
Rodríguez, H., Fraga, R., Gonzalez, T., Bashan, Y. (2006): Genetics of phosphate solubilization
and its potential applications for improving plant growth-promoting bacteria. Plant Soil 287,
15–21.
Rose, T. J., Rengel, Z., Ma, Q. F., Bowden, J. W. (2009): Crop species differ in root plasticity
response to localised P supply. J. Plant Nutrit. Soil Sci. 172, 360–368.
Ryu, H.-D., Lim, C.-S., Kim, Y.-K., Kim, K.-Y., Lee, S.-I. (2011): Recovery of struvite obtained
from semiconductor wastewater and reuse as a slow-release fertilizer. Environ. Eng. Sci. 29,
540–548.
Schenk, M. K., Barber, S. A. (1979): Phosphate uptake by corn as affected by soil characteristics
and root morphology1. Soil Sci. Soc. Am. J. 43, 880–883.

3: General introduction
18
Sharma, S. H. S., Lyons, G., McRoberts, C., McCall, D., Carmichael, E., Andrews, F., Swan, R.,
McCormack, R., Mellon, R. (2012): Biostimulant activity of brown seaweed species from
Strangford Lough: compositional analyses of polysaccharides and bioassay of extracts using
mung bean (Vigno mungo L.) and pak choi (Brassica rapa chinensis L.). J. Appl. Phycol. 24,
1081–1091.
Sharpley, A. N., Jarvie, H. P. (2012): Agricultural management, water quality & ecology: Putting
practice into policy, in National Agricultural Biotechnology Council Conference
Proceedings, pp. 87–116.
Talboys, P. J., Heppell, J., Roose, T., Healey, J. R., Jones, D. L., Withers, P. J. A. (2016): Struvite:
a slow-release fertiliser for sustainable phosphorus management? Plant Soil 401, 109–123.
Tilman, D., Cassman, K. G., Matson, P. A., Naylor, R., Polasky, S. (2002): Agricultural
sustainability and intensive production practices. Nature 418, 671–677.
Tischner, R. (2000): Nitrate uptake and reduction in higher and lower plants. Plant Cell and
Environ. 23, 1005–1024.
USGS, (2016): Phosphate rock, Annual publication of mineral commodity summerises by The
United States Geological Survey (USGS), www.usgs.gov. Downloaded from
http://minerals.usgs.gov/minerals/pubs/commodity/phosphate_rock/mcs-2016-phosp.pdf on
18.10.2016
Vaneeckhaute, C., Janda, J., Meers, E., Tack, F. M. G. (2015): Efficiency of soil and fertilizer
phosphorus use in time: a comparison between recovered struvite, FePO4-Sludge, digestate,
animal manure, and synthetic fertilizer, in Rakshit, A., Singh, H. B., Sen, A.: Nutrient Use
Efficiency: from Basics to Advances. Springer India, New Delhi, pp. 73–85.
van Veen, J. A., van Overbeek, L. S., van Elsas, J. D. (1997): Fate and activity of microorganisms
introduced into soil. Microbiol. Mol. Biol. R. 61, 121–135.
Vassilev, N., Vassileva, M., Nikolaeva, I. (2006): Simultaneous P-solubilizing and biocontrol
activity of microorganisms: potentials and future trends. Appl. Microbiol. Biot. 71, 137–144.
Weinmann, M., Römheld, V.: Resource Preservation by Application of BIOefFECTORs in
European Crop Production (Research proposal). European Community's Seventh
Framework Programme (FP7/2007-2013) under grant agreement n° 312117 (BIOFECTOR).
White, P. J. (2012): Long-distance transport in the xylem and phloem, in Marschner, P.:
Marschner's Mineral Nutrition of Higher Plants. 3rd ed. Academic Pr, United States of
America, pp. 49–70.
Zahir, Z. A., Ghani, U., Naveed, M., Nadeem, S. M., Asghar, H. N. (2009): Comparative
effectiveness of Pseudomonas and Serratia sp. containing ACC-deaminase for improving
growth and yield of wheat (Triticum aestivum L.) under salt-stressed conditions. Arch.
Microbiol. (Archives of Microbiology) 191, 415–424.

4: Fertilizer placement: A review and meta-analysis
19
4 Fertilizer placement to improve crop nutrient acquisition and
yield: A review and meta-analysis
Peteh Mehdi Nkebiwea*, Markus Weinmannb, Asher Bar-Talc, Torsten Müllerd
Affiliations and addresses:
a, and d: Fertilisation and Soil Matter Dynamics (340 i),
b,: Nutritional Crop Physiology (340 h),
Institute of Crop Science, University of Hohenheim,
70593 Stuttgart, Germany
a: [email protected] (*Corresponding author)
c: Institute of Soil, Water and Environmental Sciences, The Agricultural
Research Organisation of Israel (ARO) – The Volcani Centre,
P.O.B. 6, Bet Dagan 50250, Israel
Original article published in: Field Crops Research (2016), Volume 196, pages 389–401
DOI: http://dx.doi.org/10.1016/j.fcr.2016.07.018
Reprinted from Field Crops Research, Nkebiwe, P. M., Weinmann, M., Bar-Tal, A., & Müller,
T. (2016). Fertilizer placement to improve crop nutrient acquisition and yield: A review and
meta-analysis, 196, 389-401, DOI: http://dx.doi.org/10.1016/j.fcr.2016.07.018 with kind
permission from Elsevier.

4: Fertilizer placement: A review and meta-analysis
20
4.1 Abstract
In agricultural soils, plant-available nitrogen (N) and phosphorous (P) may be inadequate for
crop production although total N and P concentrations are high. Therefore, N and/or P
fertilizer is commonly applied to field soil by broadcast, even though broadcast does not
ensure that a considerable proportion of applied fertilizer is available at the right time and
place for optimal root uptake. Fertilizer placement in soil, which refers to precise application
of specific fertilizer formulations close to seeds or plant roots to ensure high nutrient
availability, may be a more effective alternative to broadcast application. The objectives of
this paper are: (1) to summarize current techniques for fertilizer placement in soil and to
identify fertilizers that are suitable for subsurface placement; and (2) to quantify the relative
effects of fertilizer placement to fertilizer broadcast on crop nutrient acquisition and yield. To
achieve these aims, we reviewed scientific literature on the dynamics of nutrient movement
from soil into roots and studies on fertilizer placement under field conditions. Additionally,
we performed three meta-analyses according to the method of baseline contrasts on the
relative effects of fertilizer placement (Treatment) to fertilizer broadcast (Control) on yield,
nutrient concentration and content in above-ground plant parts. In all, we used 1022 datasets
from 40 field studies published from 1982 to 2015 (85 % of studies from 2000). Results
showed that overall, fertilizer placement led to 3.7 % higher yield, 3.7 % higher nutrient
concentration and 11.9 % higher nutrient content in above-ground parts than fertilizer
broadcast. For CO(NH2)2 and soluble phosphate (PO43-), NH4
+ and PO43-, CO(NH2)2, NH4
+,
and PO43-, fertilizer placement led to 27.3 %, 14.7 %, 11.6 %, 3.8 % and 0.0% increase in
yield in comparison to broadcast respectively. Increase in relative yield and relative nutrient
uptake from subsurface placed CO(NH2)2, CO(NH2)2 and PO43-, NH4
+, NH4+ and PO4
3- or K+
tend to increase with increasing placement depth to more than 10 cm. Results show that deep
subsurface placed NH4+ (± PO4
3-) or CO(NH2)2 (±PO43-), K+, solid or liquid manure is more
effective to improve deep rooting, nutrient uptake and yield than broadcast. Thus, deep
subsurface fertilizer placement could be one more tool to mitigate negative consequences of
increasingly frequent high temperatures and drought that threaten food production globally.
Keywords: fertilizer placement; meta-analysis; yield; nutrient mobilization; nutrient uptake

4: Fertilizer placement: A review and meta-analysis
21
4.2 Introduction
Intensive agriculture, which requires substantial amounts of soluble fertilizers and other
inputs, has considerably increased global food production (Matson et al., 1997; Tilman et al.,
2002). However, it has also increased the risk of negative consequences on ecosystems,
climate and public health (Delgado and Scalenghe, 2008; Matson et al., 1997; Tilman et al.,
2002; Tscharntke et al, 2012). High energy costs for ammonia synthesis (Michalsky and
Pfromm, 2012) and increasing scarcity in quality and quantity of rock phosphate reserves
(Cordell et al, 2009) suggest that synthetic mineral N and P fertilizers, and agricultural goods
produced using them will become more expensive.
Overuse of soluble fertilizers in intensive production systems is often associated with low
crop nutrient use efficiency (Fan et al., 2012). In the tropics and sub-tropics, apparent nutrient
recovery efficiency (ANR) of applied mineral N, P and K within the first year of application
is estimated to be less than 50%, 10% and 40% respectively (Baligar and Bennett, 1986;
Baligar et al, 2001; Raun and Johnson, 1999). Excess fertilizer nutrients that cannot be
contained in the soil matrix or in soil microbial biomass may be released to the atmosphere
(e.g. NH3, N2O, NOx and N2) and to surface and/or below-ground water bodies (e.g. NO3-,
HPO42-/H2PO4
-) (Fan et al., 2012; Tunney et al., 1997; Weaver et al. 1988).
Compared to other macronutrients, plant-available P is frequently the prime limiting nutrient
for plant growth in most agricultural soils (Hinsinger, 2001). Like any other essential nutrient,
severe P deficiency, especially during early growth stages in annual plants, may lead to
irreversible restrictions in plant growth and development, which may not be corrected even
after optimal P supply during later growth stages, thus, limiting crop yield (Colomb et al.
2000; Grant et al., 2001).

4: Fertilizer placement: A review and meta-analysis
22
After long-term P fertilization, plant-available P levels may become suboptimal for crop
production although total P is high (Hinsinger, 2001). A fraction of applied P is taken up by
plants and by soil microorganisms, the latter acting as an important sink and source for soil P
(Bünemann et al., 2011; Gichangi et al., 2009). The other fraction may be rendered partially
or fully unavailable to plants through fixation or occlusion respectively. P fixation may occur
by adsorption of PO43- and or stabilized organic phosphates (e.g. phosphate monoesters) to
sorbent surfaces on soil colloids such as iron and other metal hydroxides (Turner et al., 2005).
It may also occur through precipitation of PO43- as sparingly soluble Ca-phosphates in
calcareous soils with neutral or alkaline pH (up to about 8) (Lu et al., 1987; Moody et al.,
1995) or as Fe- or Al-phosphates in acidic soils (pH below 5.5) (Prochnow et al., 2004; Redel
et al., 2007).
To optimize N and P availability to crop plants especially in early growth stages, N and P
fertilizer can be applied by localized placement at moderate amounts in the seeding zone or in
high amounts given sufficient spacing to plants as opposed to conventional fertilizer
application by homogenous broadcast over the entire soil surface, with or without subsequent
incorporation (Grant et al., 2001; Lu and Miller, 1993; Valluru et al., 2010). In this paper,
“fertilizer placement” refers to localized application of fertilizers to small areas on surface or
subsurface soil. Early studies on fertilizer placement mainly focused on the effects on crop
yields. They reported enhanced plant growth and yield for placement of N and NPK fertilizers
and conflicting results for placement of P or K fertilizers (Cooke, 1954; Reith, 1954). Within
the last two decades, the significance of fertilizer placement in comparison to broadcast can
be appreciated through the wide range of published peer-reviewed articles on the topic. There
has been much interest in the effects of fertilizer placement in comparison to fertilizer
broadcast on crop performance attributes like root growth and nutrient uptake (Hodge, 2004;
Rose et al., 2009; Weligama et al., 2008;); crop yield (Jing et al., 2012; Kelley and Sweeney,

4: Fertilizer placement: A review and meta-analysis
23
2007; Schlegel et al., 2003) and yield quality (Boelcke, 2003; Weber et al. , 2008); and on
environmental aspects like NO3- leaching (Baker, 2001; Ruidisch et al., 2013; Zhou et al.,
2008); emission of N2O (Engel et al., 2010; Halvorson and Del Grosso, 2012; Pfab et al.,
2012; Nash et al., 2012); release of CH4 (Linquist et al, 2012; van Kessel et al-., 2012); and
volatilization of NH3 (Hayashi et al., 2009; Ma et al., 2010; Rochette et al., 2009). Fertilizer
placement has also gained much interest in weed management where effective fertilizer
placement disproportionately favors nutrition of target crop plants and enables them to be
more competitive against weeds (Blackshaw et al., 2002; Légère et al., 2013; Melander et al.,
2005; Petersen, 2005). Interest in fertilizer placement can also be appreciated by continuous
development of improved placement machinery (Bautista et al., 2001; Nyord et al., 2008).
In more recent decades, many studies on fertilizer placement have also reported conflicting
results on its effect on crop performance in comparison to fertilizer broadcast and
requirements for effective fertilizer placement remain unclear. Open questions still exist, such
as: Which fertilizers and placement techniques have been shown to be consistently effective?
Can placement improve the efficiency of alternative recycled N and/or P fertilizers that are
usually sparingly soluble (e.g. sewage sludge ash, biogas digestates or P-rich industrial by-
products, if levels of heavy metals and other impurities are acceptable)?
The objectives of this paper are: (1) to summarize current techniques for fertilizer placement
in the field and to outline properties of fertilizers suitable for placement as a subsurface depot;
and (2) to compare the relative effect of fertilizer placement (Treatment) to fertilizer broadcast
(Control) on yield and nutrient concentration and content in above-ground biomass, for
various field crops, fertilizers and placement techniques through comprehensive meta-
analyses on data published from field studies within the last three decades. Fertilizer
placement effect on biomass nutrient concentration is addressed in terms of post-harvest
nutritional value of crops (e.g. relation of N concentration to protein content and baking

4: Fertilizer placement: A review and meta-analysis
24
quality of bread wheat) (Boelcke, 2003; Grant et al., 2016) and not regarded as an indicator
for crop nutrition or yield potential, given the general inverse allometric relation of nutrient
concentration to dry biomass yield per unit area, as clearly illustrated for N concentration in
different crop species (Greenwood et al., 1991).
4.3 Literature review
Methodology
In order to compile and summarize relevant information on fertilizer placement techniques
and fertilizers suitable for placement, and data on yield, nutrient concentration and content in
above-ground biomass from fertilizer placement in comparison to fertilizer broadcast, we
used published peer-reviewed articles and reviews obtained through recognized literature
databases like Scopus and EBSCO EDS-global index as well as free scientific publication
servers like Google Scholar. In our comprehensive literature search, we initially employed the
following keywords and their combinations: fertilizer application methods, fertilizer
application techniques, fertilizer placement, nutrient placement, localized fertilizer, localized
nutrient supply, soil fertilizer depot, nitrogen placement, phosphorous placement, potassium
placement, manure placement, slurry placement, field soil, field crops. These searches yielded
more specific keywords and technical terms that were subsequently used particularly in
literature search for data used in the meta-analyses described in section 3. Further keywords
and technical terms included: starter fertilizer, 2x2 fertilizer, 5x5 fertilizer, pop-up fertilizer,
fertilizer band, furrow fertilizer, below-seed fertilizer, deep placement, fertilizer side-dress,
fertilizer injection, CULTAN, fertilizer depot placement, N-fertilizer depot, fertilizer nests,
knife fertilizer, coulter-knife fertilizer, fertilizer broadcast, broadcast-incorporated, fertilizer
topdress, yield, nutrient uptake, yield quality, yield composition, maize, wheat, field
experiment, field study. Using defined time ranges, priority was given to scientific papers
published from recent years till 2000 before older publications were considered.

4: Fertilizer placement: A review and meta-analysis
25
Books were obtained through the library services of the University of Hohenheim, Stuttgart,
Germany.
Techniques for fertilizer placement
Common techniques for fertilizer placement in soil include: indirect placement by pre-
treatment of seeds with fertilizers before sowing (Peltonen-Sainio et al., 2006; Sekiya and
Yano, 2010); in the seed hole or furrow during seeding (Hocking et al., 2003), on the soil
surface as a band with or without incorporation (Kelley and Sweeney, 2007); subsurface as:
shallow or deep band (Pfab et al., 2012), in a shallow or deep trench cut in the soil (“knife” or
“coulter-knife” application, Kelley and Sweeney, 2007), as shallow or deep point placement
(“nest” placement, Engel et al., 2010 ) or point injection (Sommer, 2005; Weber et al., 2008)
(Figure 4.1). Fertilizer bands could also be placed on or below the soil surface, on or to the
side(s) of the crop row. These techniques can be applied to both inorganic and organic
fertilizers (Bittman et al, 2012; Dell et al., 2011) as well as to solid, liquid and gaseous
fertilizer formulations, the latter requiring special equipment to minimize gaseous losses.
Effective fertilizer placement requires good timing to crop demand and environmental
conditions with low risk of nutrient loss. Split fertilizer placement at key growth stages with
high nutrient demand enhances nutrient uptake and crop yield (Saleem et al. 2009), however,
it may entail higher labor and energy costs.
Figure 4.1. Fertilizer placement techniques

4: Fertilizer placement: A review and meta-analysis
26
Seed placement ensures that as seed nutrient reserves become depleted, nutrients (especially
macronutrients N and P) are sufficiently available during susceptible early growth stages
when rooting is small. Nevertheless, high seed NH4+ and PO4
3- rates are not advisable to avoid
injury on seeds and young plants.
Surface placement without incorporation is not advisable for N fertilizers such as liquid
manure, NH4+-fertilizer and CO(NH2)2 because it may lead to high gaseous NH3 losses
especially on alkaline or dry soils and under high air temperatures (Adamsen and Sabey, 1987;
Dell et al., 2011; Köhler et al., 2003). Surface-placed fertilizers are more prone to wind and
water erosion and more likely to emit undesirable odors (especially for manures) than
incorporated or subsurface placed fertilizers. Although soil incorporation may reduce NH3
volatilization from NH4+-fertilizer or CO(NH2)2, it increases the surface area of contact with
soil microorganisms, thereby promoting biological oxidation with high risk for NO3- leaching
and gaseous N2O, NOx and N2 losses (Malhi et al., 2001; Nash et al., 2012).
Subsurface fertilizer placement may be shallow (often 5 – 10 cm) or deep (>10 cm). Similarly
to seed placement, fertilizer application rates should be kept low if they are placed below
ground and close to the seed row (Zhang and Rengel, 2002). If placed close to seeds,
granulated fertilizers may be less harmful to seeds than fine and/or highly soluble ones due to
slower nutrient release (Olson and Dreier, 1956). “Starter fertilizer” usually refers to
macronutrient(s) especially NH4+ and PO4
3- (e.g. (NH4)2HPO4) banded only about 5 cm
sideways and 5 cm below seeds, in the seeding hole or on/in the sowing row to ensure high
nutrient availability during early crop development stages (Grant et al., 2001; Kristoffersen et
al., 2005; Qin et al., 2005; Niehues et al., 2004). Unlike even broadcast with or without
incorporation, banding reduces the surface area of contact with soil and soil microorganisms,
thereby reducing PO43- immobilization by fixation to various cations (Grant et al., 2001) and
NH4+ nitrification by soil microorganisms (Malhi et al., 2001). NH4
+-fertilizers containing

4: Fertilizer placement: A review and meta-analysis
27
nitrification inhibitors may be suitable for placement (For chemical structures and inhibited
reactions of nitrification and urease inhibitors tested in the field studies used in the meta-
analyses described in section 3, see Table A.1, Online appendix:
http://www.sciencedirect.com/science/article/pii/S0378429016302283).
Whereas fertilizers placed deep in soil with high moisture content may be more plant-
available than those placed at shallow depths with less moisture (Ma et al., 2009; Singh et al.,
2005), nutrients placed too deep may be less plant-available during early stages of plant
growth when root density is still low at high depths.
Fertilizers suitable for placement as depots
To effectively place fertilizer to form a subsurface nutrient depot, we propose the following
prerequisites. Fertilizer ions should:
a. be taken up by plants in relevant quantities (macronutrients).
b. considerably stimulate root-growth and attract roots at the site of contact.
c. have limited mobility from the depot. This is feasible for nutrients that have low effective
diffusion coefficients in soil due to their adsorption properties (Table 1) although being
water-soluble.
d. be relatively stable in chemical form and plant- availability especially at depot borders
accessible to roots.
e. be placed at an appropriate distance from the seeding zone to avoid injury to plants.
Equation 4.1. The effective diffusion coefficient of a nutrient in soil (De)
De=(Dlθ⨍ldCl)
dCs Eqn.4.1

4: Fertilizer placement: A review and meta-analysis
28
Dl, diffusion coefficient of the nutrient in water; θ, volumetric moisture content of soil; ⨍l,
tortuosity, the capacity of the soil to impede diffusion of non-adsorbed ions; dCl/dCs,; the
reciprocal of the soil buffer capacity for the nutrient (Barber, 1984).
An effective approach is to place fertilizers at a high dose and concentration in a limited soil
volume to form a nutrient depot providing high and persistent nutrient-availability during the
growing season. For placement of NH4+ (with or without PO4
3-) as a rich subsurface depot,
Sommer (2005) proposed the term Controlled Long-Term Ammonium Nutrition (CULTAN),
which describes a single application of a high phytotoxic concentration of fertilizer solution or
granules at a safe distance from plant roots or seeds (Deppe et al., 2016). Toxic NH4+
concentrations inhibit NH4+ oxidation by soil microorganisms (Müller et al., 2006; Shaviv,
1988). Nutrient concentration in such a rich depot could be in the order of 1000 mg N or P kg
-1 dry soil and even higher (Lu and Miller, 1993; Pfab et al., 2012).

4: Fertilizer placement: A review and meta-analysis
29
Table 4.1. Effective diffusion coefficients of macronutrients in soil
Nutrient Effective diffusion
coefficient in soil
(x 10-6 cm2 s-1)
Soil
texture
Volumetric
moisture
content
(%)
Bulk
density
(g cm-3)
Subgroup
(USDA soil
taxonomy)
Source
H2PO4- 0.00001 – 0.01 Marschner and Rengel, 2012;
Neumann and Römheld, 2012
H2PO4- 0.0023 Silt loam Barber, 1984
H2PO4- 0.007 – 0.025 Sandy
loam
Bhat and Nye; 1973
H2PO4- 0.0042 Loamy
sand
20 1.5 Typic
Udipsammen
t
Schenk and Barber, 1979
H2PO4- 0.0062 Loam 24 1.2 Typic
Argiaquoll
Schenk and Barber, 1979
H2PO4- 0.0097 Silt loam 24 1.2 Ultic
Hapludalf
Schenk and Barber, 1979
H2PO4- 0.0131 Silt loam 24 1.2 Typic
Halplaquoll
Schenk and Barber, 1979
H2PO4- 0.0152 Silt loam 24 1.2 Aeric
Ochraqualf
Schenk and Barber, 1979
H2PO4- 0.0893 Silt loam 20 1.2 Aquic
Argiudoll
Schenk and Barber, 1979
K+ 0.01 – 0.1 Marschner and Rengel, 2012;
Neumann and Römheld, 2012
K+ 0.019 Silt loam Barber, 1984
K+ 0.066 Silt loam Typic
Halplaquoll
Barber, 1984
K+ 0.075 Silt loam Ultic
Hapludalf
Barber, 1984

4: Fertilizer placement: A review and meta-analysis
30
NH4+ 0.157a Loam 20 1.14 –
1.23
Clarke and Barley, 1968
NH4+ 0.319 a Sand 20 1.48 -
1.55
Clarke and Barley, 1968
NH4+ 0.73 Clay loam 32 Pang et al., 1973
NH4+ 0.82 Silty clay
loam
42 Pang et al., 1973
NH4+ 1.24 Fine sandy
loam
17 Pang et al., 1973
CO(NH2)2 0.62 Sandy
clay
52 1.22 Typic
Hapludults
Sadeghi et al, 1989
CO(NH2)2 0.805 Silt loam 58.6 1.37 Cumulic
Hapludolls
Sadeghi et al, 1989
NO3- 0.1 – 1.0 Marschner and Rengel, 2012;
Neumann and Römheld, 2012
NO3- 1.99 a Loam 20 1.14 –
1.23
Clarke and Barley, 1968
NO3- 2.5 Silt loam Barber, 1984;
NO3- 4.76 a Sand 20 1.48 -
1.55
Clarke and Barley, 1968
USDA, United States Department of Agriculture a, effective diffusion coefficient derived from equations of effective diffusion as a function of volumetric water content
(Clarke and Barley, 1968)

4: Fertilizer placement: A review and meta-analysis
31
Based on the suggested criteria, fertilizers containing the macronutrient N in the form
of NH4+ and/or P normally in the oxidized form of PO4
3- (e.g. (NH4)2SO4,
Ca(H2PO4)2, NH4H2PO4, (NH4)2HPO4 and ammonium polyphosphate – [NH4 PO3]n)
are the best candidates to be recommended for placement as a subsurface depot. NH4+
and PO43- ions are both macronutrients that strongly stimulate initiation and
elongation of lateral roots on the part of the root system that is within or close to their
respective nutrient depots (Anghinoni and Barber, 1990; Chassot et al., 2001; Drew,
1975; Jing et al., 2012), also with a potential to contribute to root growth in soil zones
distant from the nutrient patch (Zhang et al., 2000). NH4+ and PO4
3- generally have
low effective diffusion coefficients in soils (Barber, 1984; Neumann and Römheld,
2012). NH4+ readily binds to negative charges on the surface of clay minerals and
becomes fixed, especially in 2:1 type clay-rich soils, when it penetrates the clay
mineral interlayers and becomes trapped between its silicate sheets (Nieder et al,
2011). As previously indicated, PO43- is readily fixed by adsorption to iron and other
metal hydroxides or is precipitated depending on pH as Fe-, Al- and Ca-phosphates.
PO43- sorption capacity of soil can be measured from the concentration of Fe, Al and
Ca cations upon extraction with Mehlich-3 solution (Zhang et al., 2005). According to
Sommer (2005), high concentrations of NH4+ inhibit nitrification in subsurface NH4
+-
depots, thereby lowering the potential for NO3--related N losses. As a further step, the
stability of NH4+ in a subsurface depot may be increased by using NH4
+ treated with
nitrification inhibitors e.g. 3, 4-Dimethylpyrazole phosphate (DMPP) (Zerulla et al.,
2001). Through localized placement of NH4+ and/or PO4
3- in small soil volumes, the
surface area for contact to soil microorganisms (biological transformation or
immobilization) or to soil minerals (for chemical transformation, adsorption, fixation
or occlusion) is greatly reduced, thus, promoting nutrient stability in soil.

4: Fertilizer placement: A review and meta-analysis
32
NO3-, CO(NH2)2 and K+ do not substantially stimulate initiation and growth of lateral
roots upon contact and are highly mobile in soil due to rapid diffusion and movement
by mass flow. Therefore, they are less suitable candidates for placement to form a
localized subsurface depot. Nevertheless, CO(NH2)2 may be placed as a depot if
conditions are optimal for rapid ammonification and reduced NH3 volatilization.
4.4 Meta-analyses of relative effects of fertilizer placement to fertilizer
broadcast on crop yield and nutrient uptake
Prerequisites for data inclusion
Studies included in the meta-analysis fulfilled the following conditions:
• Published in an international peer-reviewed journal. Two exceptions were
made specific to the fertilizer placement technique termed CULTAN
(Sommer, 2005): a Ph.D. Thesis and a publication in a national agricultural
research center journal
• Performed under field conditions
• Contained at least one fertilizer placement treatment (Treatment) and one
fertilizer broadcast (or broadcast/incorporation) treatment (Control)
• Applied the same or comparable fertilizer types and application rates for
Treatments and Control
To compile published peer-reviewed studies that were included in these meta-
analyses, we used specific keywords to search in recognized scientific literature
databases as already described in section 2.1. For yield, nutrient concentration in plant
parts and nutrient uptake combined, there were 1022 datasets collected from 40
studies: six from 1982 – 1999 and 34 from 2000 – 2015. The term “dataset” refers to a
pair of means (X̄), standard deviations (S) and sample sizes (N), one for Treatment

4: Fertilizer placement: A review and meta-analysis
33
and the other for Control derived from the same experiment. Many datasets could be
retrieved because several studies were extensive e.g. Borges and Mallarino (2000)
which covered 20 field tests in long-term trials and 11 field tests in short-term trials.
Additionally, many studies investigated different fertilizer types, application rates,
timing and techniques under different systems for cropping, rotation, irrigation and
tillage.
Information about crops, soil types, fertilizer types, broadcast and placement
techniques, result of fertilizer broadcast and fertilizer placement on yield, nutrient
uptake and nutrient concentration in plant parts, relative effects of fertilizer placement
to broadcast and source of studies are summarized in Table A.1 (Online appendix:
http://www.sciencedirect.com/science/article/pii/S0378429016302283 ).
Methodology
In order to combine treatment effects across several primary independent randomized
studies, a suitable method used in most meta-analyses is baseline contrasts, which
puts the results of these studies in a common framework to enable comparison. This
method expresses the effect of an experimental treatment in a study as a contrast or
response ratio to the effect of a baseline or control treatment within the same study
(Akiyama, 2010; Piepho, 2012). A random effects model with grouping variable was
used to analyze the data (data structured in groups e.g. crop species). This model
accounted for sampling error between studies and random variation in effect sizes
between studies.
The whole data used in each meta-analysis could be arranged according to one of
several grouping variables into different subgroups. For relative yield, five grouping
variables and their subgroups included: Crop type (15: maize, winter wheat, spring

4: Fertilizer placement: A review and meta-analysis
34
wheat, winter rye, sorghum, rice, soybean, rapeseed, turnip rape, potato, sugar beet,
lettuce, cauliflower, Chinese cabbage and mixed grassland grass species); Yield
component (6: grain – for cereals, oilseeds and pulses; cob – for maize only; straw –
for cereals, oilseeds and pulses; above-ground biomass; tuber – for potato and sugar
beet; sucrose – for sugar beet); Fertilizer type (9: ammonium, ammonium and
phosphorus, N (no description), urea, urea and phosphorus, phosphorus, potassium,
liquid manure and solid manure); Placement technique (11: surface band, seed, below
seed, shallow band, shallow knife, shallow point placement, shallow point injection,
deep band, deep knife, deep point placement and deep point injection); Placement
depth (3: 0 cm, 5 –10 cm and >10 cm). For relative nutrient concentration in plant
parts, six grouping variables and subgroups were: Crop type (4: maize, winter wheat,
soybean and turnip rape); Plant part (3: grain – for cereals, oilseeds and pulses; leaf –
youngest or ear-leaf; and above-ground biomass); Nutrient (4: N, P, K and Grain-
protein); Fertilizer type (6: ammonium, ammonium and phosphorus, urea,
phosphorus, potassium and liquid manure); Placement technique (6: surface band,
seed, shallow band, shallow point injection, deep band and deep point injection);
Placement depth (3: same as for yield). Finally, for relative nutrient uptake, five
grouping variables and subgroups comprised: Crop type (10: maize, winter wheat,
winter rye, sorghum, soybean, rapeseed, turnip rape, lettuce, cauliflower and mixed
grassland grass species); Nutrient (4: N, P, K and S), Fertilizer type (8: ammonium,
ammonium and phosphorus, urea, urea and phosphorus, phosphorus, potassium, liquid
manure and solid manure); Placement technique (8: surface band, shallow band,
shallow knife, shallow point injection, deep band, deep knife, deep point placement
and deep point injection); Placement depth (3: same as for yield).
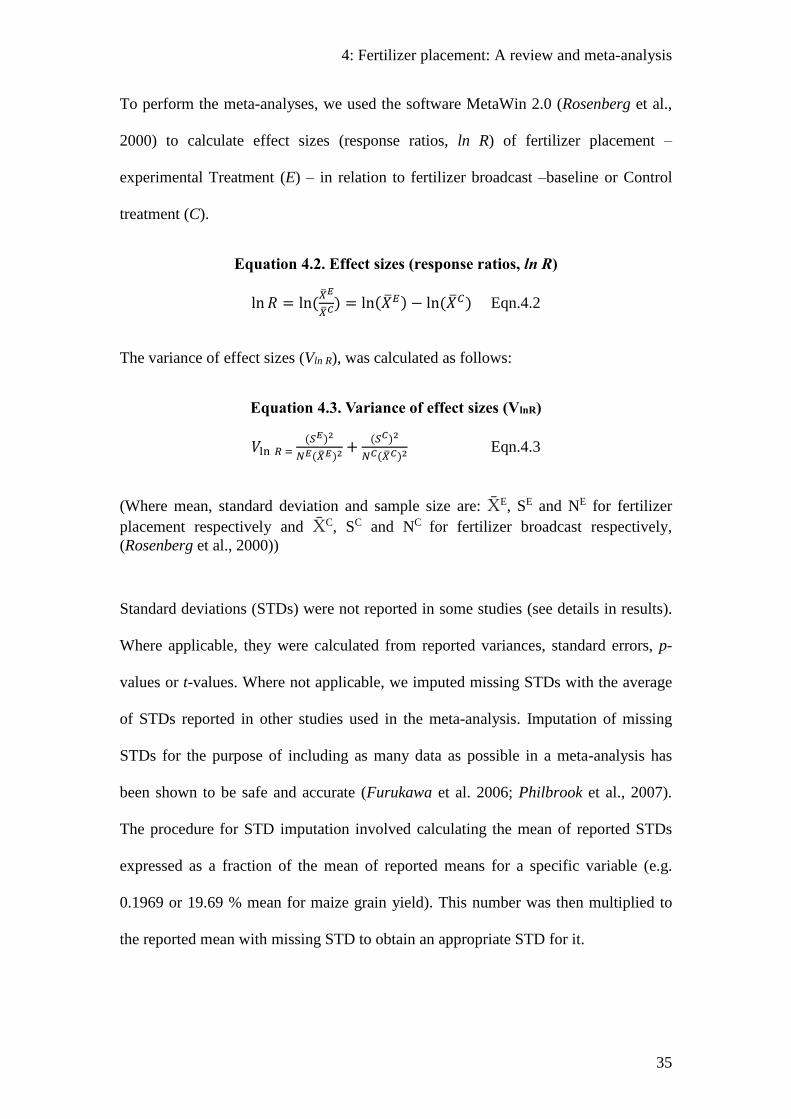
4: Fertilizer placement: A review and meta-analysis
35
To perform the meta-analyses, we used the software MetaWin 2.0 (Rosenberg et al.,
2000) to calculate effect sizes (response ratios, ln R) of fertilizer placement –
experimental Treatment (E) – in relation to fertilizer broadcast –baseline or Control
treatment (C).
Equation 4.2. Effect sizes (response ratios, ln R)
ln 𝑅 = ln(�̅�𝐸
�̅�𝐶) = ln(�̅�𝐸) − ln(�̅�𝐶) Eqn.4.2
The variance of effect sizes (Vln R), was calculated as follows:
Equation 4.3. Variance of effect sizes (VlnR)
𝑉ln 𝑅=(𝑆𝐸)2
𝑁𝐸(�̅�𝐸)2+
(𝑆𝐶)2
𝑁𝐶(�̅�𝐶)2 Eqn.4.3
(Where mean, standard deviation and sample size are: X̄E, SE and NE for fertilizer
placement respectively and X̄C, SC and NC for fertilizer broadcast respectively,
(Rosenberg et al., 2000))
Standard deviations (STDs) were not reported in some studies (see details in results).
Where applicable, they were calculated from reported variances, standard errors, p-
values or t-values. Where not applicable, we imputed missing STDs with the average
of STDs reported in other studies used in the meta-analysis. Imputation of missing
STDs for the purpose of including as many data as possible in a meta-analysis has
been shown to be safe and accurate (Furukawa et al. 2006; Philbrook et al., 2007).
The procedure for STD imputation involved calculating the mean of reported STDs
expressed as a fraction of the mean of reported means for a specific variable (e.g.
0.1969 or 19.69 % mean for maize grain yield). This number was then multiplied to
the reported mean with missing STD to obtain an appropriate STD for it.

4: Fertilizer placement: A review and meta-analysis
36
The procedure for the weighted random effects model analysis consisted of: 1.)
Running a fixed effects model to produce summary statistics (mean effect size and
total heterogeneity). 2.) Using the resulting summary statistics to estimate a pooled
variance. 3.) Using the pooled variance to calculate random effects-weights for each
individual study, which were then used in further calculations (Rosenberg et al.,
2000).
For the fixed effects model, weighted mean effect sizes were calculated because
individual studies had different sample sizes. The fixed-effects weight of the ith study
or dataset (wi), was calculated by inverting the variance of its effect size:
Equation 4.4. Fixed-effects weight (Wi)
𝑤i =1
𝑉ln R Eqn.4.4
The overall mean effect size (�̿�) for all studies was given as:
Equation 4.5. Overall mean effect size (�̿�)
�̿� =∑ 𝑤𝑖𝑛𝑖=1 𝐸𝑖
∑ 𝑤𝑖𝑛𝑖=1
Eqn.4.5
(n = number of studies or datasets; Ei = effect size of the ith study or dataset)
The variance of the overall mean effect size (𝑆�̿�2) was given a function of the
individual weights.
Equation 4.6. Variance of the overall mean effect size (𝑺�̿�𝟐)
𝑆�̿�2 =
1
∑ 𝑤𝑖𝑛𝑖=1
Eqn.4.6
Using 𝑆�̿�2, the confidence interval (CI) around �̿� was calculated as follows:

4: Fertilizer placement: A review and meta-analysis
37
Equation 4.7. Confidence interval of mean effect size
𝐶𝐼 = 𝐸̿ ± 𝑡𝛼/2[𝑛−1] ∗ 𝑆�̿� Eqn.4.7
(t = two-tailed critical value from the Student’s t-distribution at the critical level α)
Total heterogeneity (QT) was given as:
Equation 4.8. Total heterogeneity (QT) (1)
𝑄𝑇 = ∑ 𝑤𝑖𝑛𝑖=1 𝐸𝑖
2 −(∑ 𝑤𝑖𝐸𝑖
𝑛𝑖=1 )
2
∑ 𝑤𝑖𝑛𝑖=1
= ∑ 𝑤𝑖(𝐸𝑖 − �̿�)2𝑛
𝑖=1 Eqn.4.8
QT was used for Q statistical test for variability in effect sizes across studies. For this,
QT was tested against a X 2-distribution (Chi-Square) at appropriate degrees of
freedom. Presence of significant sample heterogeneity showed that variance among
effect sizes was greater than expected by sampling error and therefore, the appropriate
weight for each study or dataset should incorporate a pooled study variance.
Total heterogeneity (QT) is the sum of model-derived effect size heterogeneity
between studies (or effect size heterogeneity between groups for data with grouping
structure) (QM) and residual error variance (QE).
Equation 4.9. Total heterogeneity (QT) (2)
𝑄𝑇 = 𝑄𝑀 + 𝑄𝐸 Eqn.4.9
For the jth group of studies or datasets, the mean effect size ( �̅�𝑗), its variance (𝑆�̅�𝑗2 ),
confidence intervals (𝐶𝐼�̅�𝑗) and heterogeneity (𝑄𝑤𝑗) were also calculated as shown by
Eqns. 4.5, 4.6, 4.7, and 4.8-4.9 respectively.
The sum of individual group heterogeneity (QM) was given by:
Equation 4.10. Sum of individual group heterogeneity (QM)
𝑄𝑀 = ∑ ∑ 𝑤𝑖𝑗(�̅�𝑗 − �̿�)2𝑘𝑗
𝑖=1𝑚𝑗=1 Eqn.4.10

4: Fertilizer placement: A review and meta-analysis
38
(m = number of groups; kj = number of studies in the jth group; wij =weight for the ith
study in the jth group; �̅�𝑗= mean effect size for the jth group; and �̿� is the overall mean
effect size given in Eqn.4.5)
Residual error heterogeneity (QE), the sum of within-group heterogeneity, was
given b
Equation 4.11. Residual error heterogeneity (QE)
𝑄𝐸 = ∑ 𝑄𝑤𝑗𝑚𝑗=1 = ∑ ∑ 𝑤𝑖𝑗(𝐸𝑖𝑗 − �̅�𝑗)
2𝑘𝑗𝑖=1
𝑚𝑗=1 Eqn. 4.11
(QWj = individual within-group heterogeneity; m = number of groups; kj = number of
studies in the jth group; wij = weight and Eij = effect size for the ith study in the jth
group; �̅�𝑗= the effect size for the jth group).
With QE known, the pooled study variance (between-study variance) for data with
grouping structure (σ2pooled), was calculated as follows:
Equation 4.12. Pooled study variance (σ2pooled)
𝜎𝑝𝑜𝑜𝑙𝑒𝑑2 =
𝑄𝐸−(𝑛−𝑚)
∑ (∑ 𝑤𝑖𝑗−∑ 𝑤𝑖𝑗
2𝑘𝑗𝑖=1
∑ 𝑤𝑖𝑗
𝑘𝑗𝑖=1
𝑘𝑗𝑖=1
)𝑚𝐽=1
Eqn. 4.12
(QE = residual error heterogeneity from the fixed-effects model; n = total number of
studies, m = the number of groups; kj = the number of studies in the jth group; wij = the
fixed-effects weight for the ith study in the jth group)
Using σ2pooled, the random-effects weight of the ith study or dataset (wi(rand)) was then
calculated:
Equation 4.13. Random-effects weight (Wi(rand))
𝑤𝑖(𝑟𝑎𝑛𝑑) =1
𝑉𝑖+𝜎𝑝𝑜𝑜𝑙𝑒𝑑2 Eqn. 4.13

4: Fertilizer placement: A review and meta-analysis
39
These random-effects weights, which account for pooled variance, were then used for
calculation of mean effect sizes according to Equations 4.5, 4.6 and 4.7. As a pre-
requisite for meta-analysis, normality was checked for bell-shaped distribution in
Weighted Histograms (sum of study weights per effect size class plotted against effect
size classes) and for location of data points within confidence bands in Normal
Quantile Plots (Rosenberg et al., 2000). Finally, the unlogged overall and group mean
effect sizes, which show the relative effect of fertilizer placement to fertilizer
broadcast, together with their bias-corrected percentile bootstrap confidence intervals
with 999 iterations at the power α = 0.05, were reported. Any groups with less than
two datasets were excluded by default settings from the meta-analysis. We used the
software SigmaPlot 12.0 (Systat Software Inc.) to create scatter plots of relative mean
effects and their confidence intervals.
Sensitivity analyses
We conducted sensitivity analyses to investigate whether non-targeted input factors
associated with individual studies affected the outcome of the meta-analysis. In
addition to the grouping variables described earlier (section 3.2), the whole data used
for each meta-analysis could be further arranged according to one of the following
groupings: Outlier study ± 3 STDs (yes, no), Source of STD (reported or imputed),
Broadcast method (surface, incorporation) and Phenological crop development stage
(vegetative, reproductive, maturity). For the first and second sensitivity analyses
respectively, mean effect sizes estimated using the whole dataset were compared to
values estimated using datasets excluding outliers (limits, ± 3 STDs) or data for which
STDs were missing. For the third and fourth, we checked whether (1.) fertilizer
broadcast method (surface broadcast and broadcast/incorporation) and (2.)
phenological crop development stage (vegetative, reproductive and maturity) affected

4: Fertilizer placement: A review and meta-analysis
40
the outcome of meta-analysis. Additionally, we checked the outcome of the third and
fourth sensitivity analyses by running a linear mixed model on weighted study effect
sizes (using random–effects weights) as the dependent variable with broadcast method
and crop development stage as independent fixed effects variables, and study as the
random effects variable, using SAS 9.4 (SAS Institute Inc., Cary, NC, USA).
To check whether there was a propensity that studies showing statistical significant
results were selectively published over those that did not, a condition termed
Publication bias, we checked for symmetry in Funnel Plots of effect size against
sample size (widely scattered effect sizes at lowest sample size, bottom; closely
placed effect sizes at highest sample size, top) (Rosenberg and Goodnight, 2005). We
also looked for linearity and absence of gaps in Normal Quantile Plots of
standardized effect sizes against normal quantiles (Rosenberg et al., 2000). For a
numerical test that is simple to calculate and easy to interpret, we additionally used
fail-safe numbers (NR) according to Rosenthal’s method (α = 0.05) (Rosenberg et al.,
2000; Rosenberg and Goodnight, 2005). NR represents the number of additional non-
significant unpublished studies (or datasets), with a mean effect size of zero, that need
to be added in order to reduce combined significance of a meta-analysis to non-
significant i.e. P ≥ . 5n + 10 (n, total number of studies) is given as a reasonable
conservative critical lower limit for NR. Nevertheless, it is recommended to check NR
results with other tests such as symmetry in Funnel Plots, because use of NR only
cannot adequately detect presence of publication bias (Rosenberg and Goodnight,
2005).

4: Fertilizer placement: A review and meta-analysis
41
Results
4.4.4.1 Explanation
For the sake of brevity in this subsection, “placement” refers to fertilizer placement in
soil using any of the techniques described in Figure 4.1 (Section 4.3.2) and
“broadcast” refers to fertilizer application on the soil surface with or without
incorporation. All relative mean effects of placement to broadcast are given as
percentage (%) differences from broadcast. Directly after each relative mean effect,
its 95% confidence interval (CI95%) is given. If CI95% was below zero, there was a
negative relative placement effect (RPE) on the measured variable (i.e. Placement <
Broadcast); if CI95% included zero, there was no RPE (i.e. Placement = Broadcast);
and if CI95% was above zero, there a positive RPE (i.e. Placement > Broadcast). RPE
was considered different between groups if their CI95% did not overlap. After the
CI95%, the number of datasets in each group (n) is given. In figures, “n” is shown in
brackets after the name of each group.
4.4.4.2 Yield
Overall, 772 datasets from 39 studies were used for this meta-analysis (six from 1982
to1999 and 33 from 2000 to 2015). Mean effects from all datasets showed that
placement resulted in significantly higher yield than broadcast. The RPE on yield was
3.7 %, CI95% 3.1 to 4.3, n = 772 (P < 0.00001). Symmetrical funnel plot and high NR
(120085) observed suggest absence of significant publication bias. Exclusion of 17
outlier datasets did not change the outcome of the meta-analysis (3.6 %, CI95% 3.0 to
4.3, n = 755). Furthermore, there was no difference in RPE on yield between all 772
datasets and datasets with reported STDs (3.1 %, CI95% 2.3 to 3.8, n = 444) or
datasets with imputed STDs (4.6 %, CI95% 3.5 to 6.0, n = 328). For broadcast
methods, there was also no difference in RPE on yield between Surface broadcast (3.6

4: Fertilizer placement: A review and meta-analysis
42
%, CI95% 2.8 to 4.2, n = 719) and Broadcast/incorporation (5.2 %, CI95% 2.2 to 9.2,
n = 53). For different crop phenological growth stages, the same RPE was observed:
Vegetative (5.7 %, CI95% 3.3 to 8.0, n = 133); Reproductive (3.7 %, CI95% 1.3 to
6.7, n = 13); Maturity (3.4 %, CI95% 2.7 to 4.1, n = 626). The RPE on yield for each
broadcast method or phenological growth stage did not differ from the overall RPE on
yield. Linear model analysis confirmed that broadcast method (P=0.2932) and crop
development stage (P=0.9793) had no effect on weighted study effect sizes.
According to yield components, RPE on yield for Tubers (potato and sugar beet) (9.4
%, CI95% 4.8 to 16.0, n = 16) was higher than that for Grains (3.0 %, CI95% 2.4 to
3.6, n = 566) (Figure 4.2). Among 15 crop species analyzed, yield from placement
was higher than yield from broadcast in nine species. The RPE on yield was higher in
Winter wheat (9.5 %, CI95% 6.8 to 12.4, n = 112) than in Maize (4.5 %, CI95% 3.6
to 5.5, n = 408) (Figure 4.3). Other crop species for which placement had a positive
effect on yield, are shown in Figure 4.3. Placement did not have an effect on yield in
the following six crop species: Cauliflower, Mixed grassland grass species, Lettuce,
Winter rye, Soybean and Turnip rape (Figure 4.3).
Sorted by 11 placement techniques involved, yield from placement was higher than
yield from broadcast in eight placement techniques. For placement techniques with
more than 100 datasets, Subsurface deep point injection showed the highest RPE on
yield (6.4 %, CI95% 4.3 to 8.5, n = 114) (Figure 4.4). There was no RPE on yield for
the following placement methods: Seed, Below-seed and Subsurface shallow point
injection (Figure 4.4).

4: Fertilizer placement: A review and meta-analysis
43
Relative yield
1,0 1,1 1,2 1,3 1,4 1,5 1,6
Sucrose (Sugar beet) (10)
Tuber (Potato and Sugar beet) (16)
Above-ground biomass (All crops) (166)
Straw (Cereals, oilseeds and pulses) (10)
Cob (Maize) (4)
Grain (Cereals, oilseeds and pulses) (566)
All yield components (772)
Figure 4.2. Relative yield of fertilizer placement by yield component
Y-axis, categories and number of datasets per category in brackets; X-axis, relative
value of fertilizer Placement to fertilizer Broadcast; Error bars, 95 % confidence
intervals; Placement ≠ Broadcast, if error bars do not included 1.0; Relative values
of a pair of categories are different from each other if their 95% confidence intervals
do not overlap.
Relative yield
0,8 0,9 1,0 1,1 1,2 1,3 1,4 1,5
Wheat, winter variety (112)
Wheat, spring variety (3)
Turnip rape (40)
Sugar beet (20)
Soybean (134)
Sorghum (4)
Rye, winter variety (16)
Rice (6)
Rapeseed (12)
Potato (6)
Maize (408)
Lettuce (2)
Grasses, mixed species (3)
Chinese cabbage (4)
Cauliflower (2)
All crops (772)
Figure 4.3. Relative yield of fertilizer placement by crop type
Y-axis, categories and number of datasets per category in brackets; X-axis, relative
value of fertilizer Placement to fertilizer Broadcast; Error bars, 95 % confidence
intervals; Placement ≠ Broadcast, if error bars do not included 1.0; Relative values
of a pair of categories are different from each other if their 95% confidence intervals
do not overlap.

4: Fertilizer placement: A review and meta-analysis
44
Relative yield
1,0 1,1 1,2 1,3 1,4
Subsurface deep point injection (114)
Subsurface deep point placement (8)
Subsurface deep knife (38)
Subsurface deep band (202)
Subsurface shallow point injection (37)
Subsurface shallow point placement (2)
Subsurface shallow knife (10)
Subsurface shallow band (215)
Below seed (3)
Seed (42)
Surface band (101)
All placement methods (772)
Figure 4.4. Relative yield of fertilizer placement by fertilizer placement method
Y-axis, categories and number of datasets per category in brackets; X-axis, relative
value of fertilizer Placement to fertilizer Broadcast; Error bars, 95 % confidence
intervals; Placement ≠ Broadcast, if error bars do not included 1.0; Relative values
of a pair of categories are different from each other if their 95% confidence intervals
do not overlap.
Yield from placement for each placement depth was higher than that from broadcast.
The RPE on yield was the same across placement depths. Nevertheless, there was a
slight tendency for RPE on yield to increase with increasing placement depth: Surface
placement (0 cm) (3.9 %, CI95% 1.9 to 5.6, n = 101); 0 – 5 cm (3.4 %, CI95% 2.4 to
4.6, n = 317); > 10 cm (4.1 %, CI95% 3.1 to 5.0, n = 354) (Figure 4.5).
According to fertilizer type irrespective of placement depth, there was no RPE on
yield for Solid manure (7.9 %, CI95% -0.1 to 14.6, n = 6); Soluble P fertilizers (P)
(0.0 %, CI95% -0.6 to 0.7, n = 136) and Undescribed soluble N fertilizers (1.4 %,
CI95% -1.5 to 4.4, n = 48). Effective fertilizer types were in the following order of
strongest to weakest relative RPE: Urea combined with soluble P (27.3 %, CI95%
21.7 to 34.7, n = 12); Ammonium combined with soluble P (14.7 %, CI95% 12.9 to
17.0, n =163); Liquid manure (11.6 %, CI95% 5.9 to 18.3, n = 24); Urea (11.0 %,
CI95% 5.7 to 17.5, n = 64); Ammonium (3.8 %, CI95% 2.2 to 5.4, n = 134); and
soluble Potassium (1.6 %, CI95% 0.8 to 2.4, n = 185). These results showed that

4: Fertilizer placement: A review and meta-analysis
45
placement of combinations of Ammonium and soluble P or Urea and soluble P was
more effective to improve yield than placement of ammonium, urea or soluble P
uncombined. This occurrence can also be seen in Figure 4.5, which also shows that
yield from placement of urea or ammonium (each with or without soluble P) or K
tends to increase with increasing placement depth from 5 cm to more than 10cm.
Figure 4.5. Relative yield of fertilizer placement by fertilizer type and placement
depth
Y-axis, categories and number of datasets per category in brackets; X-axis, relative
value of fertilizer Placement to fertilizer Broadcast; Error bars, 95 % confidence
intervals; Placement ≠ Broadcast, if error bars do not included 1.0; Relative values
of a pair of categories are different from each other if their 95% confidence intervals
do not overlap.
Relative yield
1,0 1,1 1,2 1,3 1,4 1,5 1,6
Liquid manure (6)
Potassium (40)
Ammonium and Phosphorous (54)
All fertilizer placed on the soil surface (100)
Relative yield
1,0 1,1 1,2 1,3 1,4 1,5 1,6
Solid manure (6)
Liquid manure (9)
Potassium (62)
Phosphorous (35)
Urea and phosphorous (8)
Urea (44)
N (no description) (48)
Ammonium and Phosphorous (68)
Ammonium (37)
All fertilizer placed 5 - 10 cm deep (317)
Relative yield
1,0 1,1 1,2 1,3 1,4 1,5 1,6
Liquid manure (9)
Potassium (83)
Phosphorous (101)
Urea and phosphorous (4)
Urea (20)
Ammonium and Phosphorous (41)
Ammonium (96)
All fertilizer placed >10 cm deep (354)
0 cm
5 – 10 cm
> 10 cm

4: Fertilizer placement: A review and meta-analysis
46
Meaningful RPE regarding the use of nitrification inhibitors; urease inhibitors (or
both); toxic concentrations of ammonium depot solutions; urea coating; or
palletization of solid manure, methods used to stabilize mineral and/or organic N
fertilizers with the aim to optimize N uptake and yield, could not be obtained from
this meta-analysis. The reason was that the number of datasets for each of these
modified or stabilized N fertilizer groups was too small in comparison to the number
of datasets for unmodified N fertilizers.
4.4.4.3 Nutrient concentration in above-ground biomass
357 datasets from 11 studies (two studies published in 1982 and nine from 2000 to
2013) were used for this meta-analysis. In all, placement resulted in higher
concentrations of N, P, K or grain protein in different above-ground plant parts than
broadcast. For all plant parts combined, overall RPE on nutrient concentration in plant
parts was 3.7 %, CI95% 2.7 to 4.9, n = 357 (P < 0.00001). Exclusion of six outliers or
imputation of missing STDs for 190 datasets did not change the outcome of the meta-
analysis. Analysis according broadcast methods (Surface broadcast 3.8%,
Broadcast/Incorporation 2.1%) or crop development stages (Reproductive 2.3%,
Vegetative 3.2%, Maturity 5.03%) did not change the result. Linear model analysis
confirmed that broadcast method had no effect on weighted study effect sizes
(P=0.1093). However, crop development stage had an effect (P=0.0222) with the
same increasing trend from Reproductive, Vegetative to Maturity shown by the meta-
analysis. There was no difference between the RPE on nutrient concentration in plant
parts between each plant part (Leaf (ear or youngest developed leaf), Total above-
ground biomass and Grain) and all parts combined. RPE on nutrient concentration
tend to decrease slightly from Leaf (5.7 %, CI95% 3.8 to 7.7, n = 123) to Total above-
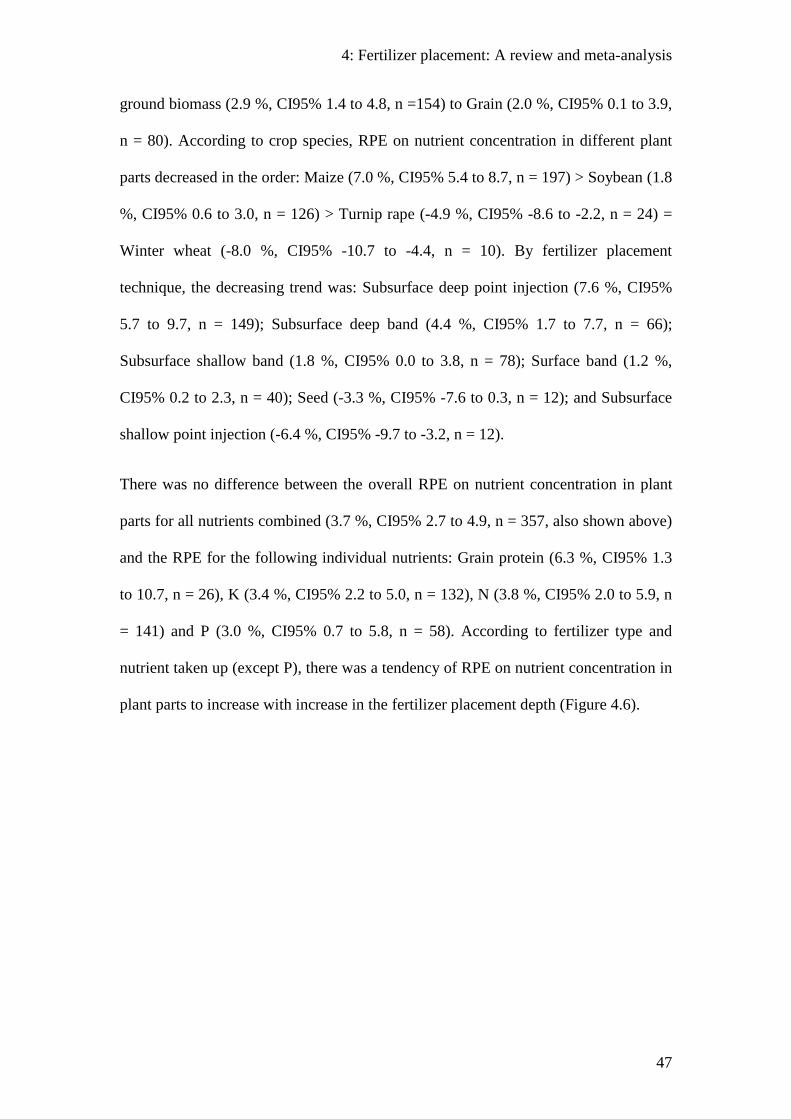
4: Fertilizer placement: A review and meta-analysis
47
ground biomass (2.9 %, CI95% 1.4 to 4.8, n =154) to Grain (2.0 %, CI95% 0.1 to 3.9,
n = 80). According to crop species, RPE on nutrient concentration in different plant
parts decreased in the order: Maize (7.0 %, CI95% 5.4 to 8.7, n = 197) > Soybean (1.8
%, CI95% 0.6 to 3.0, n = 126) > Turnip rape (-4.9 %, CI95% -8.6 to -2.2, n = 24) =
Winter wheat (-8.0 %, CI95% -10.7 to -4.4, n = 10). By fertilizer placement
technique, the decreasing trend was: Subsurface deep point injection (7.6 %, CI95%
5.7 to 9.7, n = 149); Subsurface deep band (4.4 %, CI95% 1.7 to 7.7, n = 66);
Subsurface shallow band (1.8 %, CI95% 0.0 to 3.8, n = 78); Surface band (1.2 %,
CI95% 0.2 to 2.3, n = 40); Seed (-3.3 %, CI95% -7.6 to 0.3, n = 12); and Subsurface
shallow point injection (-6.4 %, CI95% -9.7 to -3.2, n = 12).
There was no difference between the overall RPE on nutrient concentration in plant
parts for all nutrients combined (3.7 %, CI95% 2.7 to 4.9, n = 357, also shown above)
and the RPE for the following individual nutrients: Grain protein (6.3 %, CI95% 1.3
to 10.7, n = 26), K (3.4 %, CI95% 2.2 to 5.0, n = 132), N (3.8 %, CI95% 2.0 to 5.9, n
= 141) and P (3.0 %, CI95% 0.7 to 5.8, n = 58). According to fertilizer type and
nutrient taken up (except P), there was a tendency of RPE on nutrient concentration in
plant parts to increase with increase in the fertilizer placement depth (Figure 4.6).

4: Fertilizer placement: A review and meta-analysis
48
Figure 4.6. Relative nutrient concentration of plant parts by nutrient, fertilizer
type and placement depth (0, 5 – 10, and > 10 cm)
Y-axis, categories and number of datasets per category in brackets; X-axis, relative
value of fertilizer Placement to fertilizer Broadcast; Error bars, 95 % confidence
intervals; Placement ≠ Broadcast, if error bars do not included 1.0; Relative values
of a pair of categories are different from each other if their 95% confidence intervals
do not overlap.
Relative nutrient concentration
0,8 0,9 1,0 1,1 1,2 1,3
All N placed >10 cm deep (107)
Liquid manure (9)
Ammonium (98)
All N placed 5 - 10 cm deep (34)
N (not described) (24)
Ammonium (10)
Relative nutrient concentration
0,8 0,9 1,0 1,1 1,2 1,3
All P placed >10 cm deep (39)
Phosphorous (28)
Liquid manure (9)
Ammonium and phosphorous (2)
All P placed 5 - 10 cm deep (19)
Relative nutrient uptake
0,8 0,9 1,0 1,1 1,2 1,3
All K placed >10 cm deep (45)
Potassium (26)
Phosphorous (8)
Liquid manure (9)
Ammonium and phosphorous (2)
All K placed 5 - 10 cm deep (47)
All K placed on the soil surface (40)
Relative nutrient concentration
0,8 0,9 1,0 1,1 1,2 1,3
All ammonium & urea placed >10 cm deep (24)
Urea (11)
Ammonium (13)
All ammonium placed 5 - 10 cm (2)
N
5 – 10 cm
> 10 cm
P
5 – 10 cm
> 10 cm
K
Grain protein
5 – 10 cm
> 10 cm
5 – 10 cm
> 10 cm
0 cm

4: Fertilizer placement: A review and meta-analysis
49
4.4.4.4 Nutrient content in above-ground biomass
In this study, the term “nutrient content” refers to the quantity of N, P, K and S in
kilograms recovered in total or partial above-ground crop biomass per hectare of
agricultural land.
The meta-analysis in this section involved 245 datasets from 22 studies (three studies
published from 1993 to 1999 and 19 from 2000 to 2015). Overall, nutrient content
from placement was higher than nutrient content from broadcast. The overall RPE on
nutrient content was 11.9 %, CI95% 9.7 to 14.5, n =245 (P < 0.00001). Removal of
two outlier studies did not change the outcome of the meta-analysis. For 148 datasets
with reported STDs, RPE was 19.2 %, CI95% 15.5 to 23.0, n = 148. Therefore,
imputation of STDs for 97 datasets resulted in an underestimation of the RPE on
nutrient content. RPE on nutrient content was the same irrespective of broadcast
method. According to phenological growth stage, RPE on nutrient content was higher
in the vegetative growth stage than in later growth stages: Vegetative (20.3 %, CI95%
15.8 to 26.1, n =91) > Maturity (9.2 %, CI95% 6.5 to 12.0, n = 138) = Reproductive
(6.5 %, CI95% 1.2 to 11.7, n = 16). Linear model analysis also confirmed that
broadcast method had no effect on weighted study effect sizes (P=0.1022) and that
crop development stage had an effect (P=0.0372), with the same decreasing trend
from Vegetative, Maturity to Reproductive. RPE on nutrient content was higher in the
Vegetative than in Generative growth stage (i.e. Reproductive and Maturity stages
combined). By crop type only, RPE on nutrient content for different crop species were
in the following order: Rapeseed (36.4 %, CI95% 30.2 to 43.3, n = 36); Turnip rape
(30.3 %, CI95% 28.1 to 32.9, n = 2); Sorghum (17.7 %, CI95% 10.8 to 26.4, n = 12);
Maize (12.2 %, CI95% 8.7 to 16.1, n = 112); Cauliflower (12.2 %, CI95% 9.1 to 15.4,
n = 2); Winter wheat (7.2 %, CI95% 3.5 to 11.1, n = 57); Soybean (2.2 %, CI95% 0.6

4: Fertilizer placement: A review and meta-analysis
50
to 4.1, n = 2); Mixed grass species (0.0 %, CI95% 0.0 to 0.0, n = 3); Lettuce (-2.0 %,
CI95% -17.4 to 13.2, n = 2); Winter rye (-3.1 %, CI95% -9.0 to 0.8, n = 16).
According to crop type and development stage the following trend of RPE on nutrient
content was observed: Maize-Vegetative (19.6 %, CI95% 13.9 to 26.9, n = 60) >
Maize-Generative (7.5 %, CI95% 3.4 to 12.0, n = 52); Rapeseed-Vegetative (52.6 %,
CI95% 40.9 to 66.7, n = 18) > Rapeseed-Generative (29.1 %, CI95% 23.5 to 36.7, n =
18); Sorghum-Vegetative (32.7 %, CI95% 10.7 to 56.2, n = 6) > Sorghum-Generative
(13.7 %, CI95% 6.4 to 20, n = 6).
In two out of eight fertilizer placement methods (Subsurface shallow point injection
and Subsurface deep point injection), nutrient content from placement was the same
as that from broadcast. In six placement methods, it was higher than that from
broadcast. For groups with more than 50 datasets, the trend of RPE on nutrient
content was: Subsurface shallow band (15.2 %, CI95% 11.8 to 19.5, n = 98) =
Subsurface deep band (14.4 %, CI95% 9.8 to19.9, n = 60).
During vegetative growth, RPE on nutrient content showed the following decreasing
trend according to placement depth: > 10 cm (24.9 %, CI95% 16.8 to 33.8, n = 36) =
5 – 10 cm (23.4 %, CI95% 16.2 to 32.5, n = 51) > Surface (-5.7 %, CI95% -15.4 to
6.3, n = 4). For the generative growth stage (Reproductive and Maturity combined),
nutrient content for all placement depths combined (8.7 %, CI95% 6.3 to 11.2, n =
154) was higher than that for broadcast. There were no differences in relative nutrient
content between placement depths.
According to fertilizer type and placement depth, there was also a tendency for the
RPE on uptake of N, P and K to increase with increasing placement depth (Figure
4.7). Placement of a combination of ammonium or urea with soluble P showed a

4: Fertilizer placement: A review and meta-analysis
51
tendency to lead to stronger RPE on N or P uptake than placement of ammonium,
urea or soluble P uncombined (Figure 4.7).
Figure 4.7. Relative contents of N, P and K in above-ground biomass by fertilizer
type and placement depth (0, 5 – 10, and > 10 cm)
Y-axis, categories and number of datasets per category in brackets; X-axis, relative
value of fertilizer Placement to fertilizer Broadcast; Error bars, 95 % confidence
intervals; Placement ≠ Broadcast, if error bars do not included 1.0; Relative values
of a pair of categories are different from each other if their 95% confidence intervals
do not overlap.
Relative nutrient uptake
0,8 1,0 1,2 1,4 1,6 1,8 2,0 2,2
All N placed >10 cm deep (47)
Urea and phosphorous (4)
Urea (16)
Ammonium and phosphorous (7)
Ammonium (20)
All N placed 5 - 10 cm deep (80)
Solid manure (6)
Liquid manure (9)
Urea and phosphorous (8)
Urea (24)
Ammonium and phosphorous (19)
Ammonium (14)
All N placed on the soil surface (14)
Liquid manure (5)
Ammonium and phosphorous (8)
Relative nutrient uptake
0,8 1,0 1,2 1,4 1,6 1,8 2,0 2,2
All P placed >10 cm deep (27)
Phosphorous (20)
Urea and phosphorous (4)
Ammonium and phosphorous (3)
All P placed 5 - 10 cm deep (25)
Urea and phosphorous (8)
Ammonium and phosphorous (17)
All P placed on the soil surface (5)
Relative nutrient uptake
0,8 1,0 1,2 1,4 1,6 1,8 2,0 2,2
All K placed >10 cm deep (24)
All K placed 5 - 10 cm deep (15)
All K placed on the soil surface(2)
N
P
K
0 cm
5 – 10 cm
> 10 cm
0 cm
5 – 10 cm
> 10 cm
0 cm
> 10 cm
5 – 10
cm

4: Fertilizer placement: A review and meta-analysis
52
4.5 Discussion
Subsurface placement of fertilizers close to seeds or plant roots has been shown to
lead to higher nutrient uptake, higher concentration of nutrients in above-ground
biomass and higher yield than homogenous broadcast of fertilizers. Likely modes of
occurrence include: (1) persistence of high levels of nutrients in plant-available form
close to roots; (2) stimulation of root growth close to and away from fertilizer depots
based on NH4+, CO(NH2)2, PO4
3- or their combinations for improved depot
exploitation (Arkoun et al., 2012; Forde and Lorenzo, 2001; Zhang et al., 2000); (3)
induction of favorable changes in chemical (Jing et al., 2012; Marschner et al., 1986;
Neumann and Römheld, 2007) and biological properties of the rhizosphere (Ghorbani
et al., 2008; Huber et al, 2012; Marschner, 2012; Murakami et al., 2002); and (4)
reduction of nutrient loss to the environment (Dell et al., 2011; Shaviv, 1988; Sommer,
2003).
In accordance with prerequisite a formulated in section 2.3 – fertilizers suitable for
placement in soil as a depot should be taken up by plants in relevant quantities – most
published studies on fertilizer placement under field conditions that we found and
utilized in our meta-analysis (shown in Table A.1, Online appendix:
http://www.sciencedirect.com/science/article/pii/S0378429016302283) mainly
investigated the effect of placing macronutrients N, P or K or their combinations (also
organic fertilizers) on crop performance. We found little literature on placement of
micronutrients in field soil (Malhi and Karamanos, 2006), given that it is not a
common farming practice. Micronutrient application in soil is associated with lower
nutrient recovery efficiencies than seed treatment and foliar sprays, which are more
effective alternatives (Farooq et al., 2012).

4: Fertilizer placement: A review and meta-analysis
53
Prerequisite b formulated in section 2.3, – fertilizers considered for placement as a
depot should considerably stimulate root growth and attract roots – could also be
supported. The meta-analyses showed that subsurface placement of NH4+ or
CO(NH2)2 or both (with or without soluble phosphates, PO43-) resulted in statistically
higher (or a tendency of higher) relative yield, nutrient concentration and content in
above-ground ground plant parts than subsurface placement of PO43-. Under favorable
conditions, subsurface placed CO(NH2)2 may be rapidly hydrolyzed to root growth-
stimulating NH4+. Subsurface placement of liquid or solid manure, which also
contains NH4+ and PO4
3- led to higher yield and nutrient content in above-ground
biomass than broadcast.
In disagreement to the requirement suggested at c, section 2.3 – suitable fertilizers for
depot placement should have limited mobility in soil – subsurface placed CO(NH2)2 or
CO(NH2)2 and PO43- performed better than NH4
+ or NH4+ and PO4
3- at improving
yield and biomass N or P contents. Su et al. (2015) observed that deep subsurface
placement of CO(NH2)2 and superphosphate in winter rapeseed was associated with
increased growth of lateral roots at deep soil layers as well as increased taproot
diameter and length, which functioned as an important nutrient storage organ. High
moisture availability in deep soil layers may promote rapid hydrolysis of CO(NH2)2 to
NH4+ with lower mobility and stronger root growth-promotion effects. Furthermore,
deep-placed CO(NH2)2 is more protected from NH3 volatilization than one that is
surface-placed or applied by broadcast and incorporated (Ma et al., 2010). In line with
c, section 2.3, among all field studies reviewed, NO3- was placed in subsurface soil
only in combination with NH4+, CO(NH2)2 or PO4
3- or their combinations.
In divergence from the suggested prerequisites: localized root-growth stimulation (b,
section 2.3) and limited mobility in soil (c, section 2.3), subsurface placement of

4: Fertilizer placement: A review and meta-analysis
54
soluble K+ produced statistically higher yields (>10 cm depth), K concentrations (>10
cm depth) and K content (0, 5 – 10 and > 10 cm depth) in above-ground plant parts
than broadcast. This can be explained by high moisture content in deep soil layers
than on the surface because K movement to roots is mainly determined mass flow and
not by root interception (Barber, 1984). Under drought stress, it is not advisable to
place any fertilizer on the soil surface or at shallow depths (Su et al., 2015). Under
such conditions, deep subsurface fertilizer placement has been shown to enhance
resilience of crop plants to drought stress, thereby increasing yields (Garwood and
Williams, 1967; Ma et al., 2009; Randall and Hoeft, 1988; Singh et al., 2005; Su et al.,
2015). Nevertheless, to adopt deep subsurface fertilizer placement, cost of additional
mechanical power required should be considered (Su et al., 2015).
The effect of placement depth on the effectiveness of fertilizer placement could be
confirmed by the meta-analysis. With increasing placement depth from 0 cm to more
than 10 cm, fertilizers based on NH4+, NH4
+ and PO43-, CO(NH2)2, CO(NH2)2 and
PO43-, or K+ tend to result in an increase in yield, nutrient concentration and content in
above-ground plant parts. Contrarily, placement of PO43- without combination with
NH4+ or CO(NH2)2, at 5-10 cm depth or >10 cm resulted in the same yield and
nutrient content in above-ground biomass as broadcast. This suggests that PO43-
depots can be more efficiently exploited by plant roots if NH4+ or CO(NH2)2 is added
to the depot to induce stronger root signaling and root-growth.
Seed treatment with fertilizer or subsurface placement of fertilizer in the seeding hole
was shown to produce the same yield as broadcast. Niehues et al. (2004) showed that
NH4+ placed on maize seeds at high rates (> 22 kg N ha-1) led to seed or seedling
damage, reduced plant density and grain yield.
4: Fertilizer placement: A review and meta-analysis
55
Nutrient acquisition by plants from moderately or sparingly available nutrient pools in
soil or from placed fertilizers may also be improved by bio-effectors (Weinmann and
Römheld, 2012), which refer to plant growth-promoting microorganisms (PGPMs)
(Altomare et al., 1999; Grant et al., 2001; Jiang et al., 2012; Lugtenberg and
Kamilova, 2009; Richardson et al., 2009; Vassilev et al., 2006;) or active natural bio-
stimulants like humic acids (Giovannini et al., 2013; Muhammad et al., 2007; Uygur
and Karabatak, 2009) and seaweed extracts (Sharma et al., 2012). Such bio-effectors
can be applied to seeds, aerial plant parts or soil. First field studies combining
fertilizer placement and inoculation of fluorescent Pseudomonads as bio-effectors
show promising growth-promotion effects on chickpea (Cicer arietinum) (Dutta and
Bandyopadhyay ; 2009) and maize (Zea mays L.) (Nkebiwe et al., 2016).
4.6 Conclusion
Collectively, several field studies showed that fertilizer placement resulted in 3.7 %
higher yield than broadcast and up to 27.3% for placement of urea and soluble P, and
14.7% for ammonium and soluble P. Fertilizer placement also led to higher nutrient
concentrations in different plant parts by 3.7 % and nutrient content in above-ground
biomass by 11.9 % than fertilizer broadcast. Deep subsurface placement of
ammonium (±P) or urea (±P), potassium, solid or liquid manure (10 - 30 cm) is more
effective to improve nutrient uptake and yield of field crops than broadcast with or
without incorporation. This suggests that deep subsurface fertilizer placement may be
an additional tool for the mitigation of negative consequences of increasingly frequent
extreme weather events like high temperatures, droughts or heavy rainfall (Parry et
al., 2004), which affect food production for an expanding global population.

4: Fertilizer placement: A review and meta-analysis
56
4.7 References
Adamsen, F. J., Sabey, B. R. (1987): Ammonia volatilization from liquid digested
sewage sludge as affected by placement in soil. Soil Sci. Am. J. 51, 1080–1082.
Akiyama, H., Yan, X., Yagi, K. (2010): Evaluation of effectiveness of enhanced-
efficiency fertilizers as mitigation options for N2O and NO emissions from
agricultural soils: meta-analysis. Glob. Change Biol. 16, 1837–1846
Altomare, C., Norvell, W. A., Björkman, T., Harman, G. E. (1999): Solubilization of
phosphates and micronutrients by the plant-growth-promoting and biocontrol
fungus Trichoderma harzianum Rifai 1295-22. Appl. Environ. Microbiol.
65(7), 2926–2933.
Anghinoni, I., Barber, S. A. (1990): Predicting the effect of ammonium placement on
nitrogen uptake by corn. Agron. J. 82, 135–138.
Arkoun, M., Sarda, X., Jannin, L., Laîné, P., Etienne, P., Garcia-Mina, J.-M., Yvin, J.-
C., Ourry, A. (2012): Hydroponics versus field lysimeter studies of urea,
ammonium and nitrate uptake by oilseed rape (Brassica napus L.). J. Exp. Bot.
63, 5245–5258.
Baker, J. L. (2001): Limitations of improved nitrogen management to reduce nitrate
leaching and increase use efficiency. TheScientificWorldJOURNAL 1, 10–16.
Baligar, V. C., Bennett, O. L. (1986): Outlook on fertilizer use efficiency in the
tropics. Fert. Res. 10, 83–96.
Baligar, V. C., Fageria, N. K., He, Z. L. (2001): Nutrient use efficiency in plants.
Commun. Soil Sci. Plant Anal. 32, 921–950.
Barber, S. A. (1984): Soil nutrient bioavailability. A mechanistic approach. Wiley,
New York pp. 90–113, 218, 251.
Bautista, E., Koike, M., Suministrado, D. (2001): PM—Power and Machinery:
Mechanical deep placement of nitrogen in wetland rice. J. Agri. Eng. Res. 78,
333–346.
Bittman, S., Liu, A., Hunt, D., Forge, T., Kowalenko, C., Chantigny, M., Buckley, K.
(2012): Precision placement of separated dairy sludge improves early
phosphorus nutrition and growth in corn (Zea mays L.). J. Environ. Qual. 41,
582–591.
Bhat, K. K. S., Nye, P. H. (1973): Diffusion of phosphate to plant roots in soil. Plant
Soil 38, 161–175.
Blackshaw, R. E., Semach, G., Janzen, H. H. (2002): Fertilizer application method
affects nitrogen uptake in weeds and wheat. Weed Sci. 50, 634–641.
Boelcke, B. (2003): Effekt der N-Injektionsdüngung auf Ertrag und Qualität von
Getreide un Raps in Mecklenburg-Vorpommern, in Kücke, M.:
Anbauverfahren mit N-injektion (CULTAN), Ergebnisse, Perspektiven ,
Erfahrungen (Beiträge des Workshops am 29. November 2001 in
Braunschweig). Bundesforschungsantalt für Landwirthschaft (FAL),
Landbauforschung Völkenrode, Sonderheft 245 (FAL Agricultural Reasearch,
special issue 245) pp. 45–53.

4: Fertilizer placement: A review and meta-analysis
57
Borges, R., Mallarino, A. P. (2000): Grain yield, early growth, and nutrient uptake of
no-till soybean as affected by phosphorus and potassium placement. Agron. J.
92, 380–388.
Bünemann, E. K, Prusisz, B,. Ehlers, K. (2011): Characterization of phosphorous
forms in soil microorganisms, in Bünemann, E. K., Oberson, A., Frossard, E.:
Phosphorous in action, Biological processes in soil phosphorous cycling.
Springer-Verlag Berlin Heidelberg, Germany. pp. 37–58
Chassot, A., Stamp, P., Richner, W. (2001): Root distribution and morphology of
maize seedlings as affected by tillage and fertilizer placement. Plant Soil 231,
123–135.
Clarke, A. L., Barley, K. P. (1968): The uptake of nitrogen from soils in relation to
solute diffusion. Aust. J. Soil Res. 6, 75–92.
Colomb, B., Kiniry, J. R., Debaeke, P. (2000): Effect of soil phosphorus on leaf
development and senescence dynamics of field-grown maize. Agron. J. 92,
428–435.
Cooke, G. W. (1954): Recent advances in fertilizer placement. II.—Fertilizer
placement in england. J. Sci. Food Agric. 5, 429–440.
Cordell, D., Drangert, J.-O., White, S. (2009): The story of phosphorus: Global food
security and food for thought. Global Environ.Chang. 19, 292–305.
Delgado, A., Scalenghe, R. (2008): Aspects of phosphorus transfer from soils in
Europe. J. Plant Nutr. Soil Sci. 171, 552–575.
Dell, C. J., Meisinger, J. J., Beegle, D. B. (2011): Subsurface application of manures
slurries for conservation tillage and pasture soils and their impact on the
nitrogen balance. J. Environ. Qual. 40, 352–361.
Deppe, M., Well, R., Kücke, M., Fuß, R., Giesemann, A., Flessa, H. (2016): Impact of
CULTAN fertilization with ammonium sulfate on field emissions of nitrous
oxide. Agric. Ecosyst. Environ. 219, 138–151.
Drew, M. C. (1975): Comparison of the effects of a localised supply of phosphate,
nitrate, ammonium and potassium on the growth of the seminal root system,
and the shoot, in barley. New Phytol. 75, 479–490.
Dutta, D., Bandyopadhyay, P. (2009): Performance of chickpea (Cicer arietinum L.)
to application of phosphorus and bio-fertilizer in laterite soil. Arch. Agron. Soil
Sci. 55, 147–155.
Engel, R., Liang, D. L., Wallander, R., Bembenek, A. (2010): Influence of urea
fertilizer placement on nitrous oxide production from a silt loam soil. J.
Environ. Qual. 39, 115–125.
Fan, M., Shen, J., Yuan, L., Jiang, R., Chen, X., Davies, W. J., Zhang, F. (2012):
Improving crop productivity and resource use efficiency to ensure food security
and environmental quality in China. J. Exp. Bot. 63(1), 13–24.
Farooq, M., Wahid, A., Siddique, K. H. M. (2012): Micronutrient application through
seed treatments. A review. J. soil sci. plant nutr. 12, 125–14,

4: Fertilizer placement: A review and meta-analysis
58
Forde, B., Lorenzo, H. (2001): The nutritional control of root development. Plant Soil
232, 51–68.
Furukawa, T. A., Barbui, C., Cipriani, A., Brambilla, P., Watanabe, N. (2006):
Imputing missing standard deviations in meta-analyses can provide accurate
results. J. Clin. Epidemiol. 59, 7–10.
Garwood, E. A,. Williams, T. E. (1967): Growth, water use and nutrient uptake from
the subsoil by grass swards. J. Agric. Sc. 69, 125–130.
Ghorbani, R., Wilcockson, S., Koocheki, A., Leifert, C. (2008): Soil management for
sustainable crop disease control: a review. Environ. Chem. Lett. 6, 149–162.
Gichangi, E. M., Mnkeni, P. N. S., Brookes, P. C. (2009): Effects of goat manure and
inorganic phosphate addition on soil inorganic and microbial biomass
phosphorus fractions under laboratory incubation conditions. Soil Sci. Plant
Nutr. 55, 764–771.
Giovannini, C., Garcia-Mina, J. M., Ciavatta, C., Marzadori, C. (2013): Effect of
organic-complexed superphosphates on microbial biomass and microbial
activity of soil. Biol. Fertil. Soils 49, 395–401.
Grant, C. A., Flaten, D. N., Tomasiewicz, D. J., Sheppard, S. C. (2001): The
importance of early season phosphorus nutrition. Can. J. Plant Sci. 81, 211–
224.
Grant, C. A., Moulin, A. P., Tremblay, N. (2016): Nitrogen management effects on
spring wheat yield and protein concentration vary with seeding date and slope
position. Agron. J. 108, 1246–1256.
Greenwood, D. J., Gastal, F., Lemaire, G., Draycott, A., Millard, P., Neeteson, J. J.
(1991): Growth rate and % N of field grown crops: Theory and experiments.
Ann. Bot. 67, 181–190.
Halvorson, A. D., Del Grosso, S. J. (2012): Nitrogen source and placement effects on
soil nitrous oxide emissions from no-till corn. J. Environ. Qual. 41, 1349–1360.
Hayashi, K., Koga, N., Yanai, Y. (2009): Effects of field-applied composted cattle
manure and chemical fertilizer on ammonia and particulate ammonium
exchanges at an upland field. Atmos. Environ. 43, 5702–5707.
Hinsinger, P. (2001): Bioavailability of soil inorganic P in the rhizosphere as affected
by root-induced chemical changes: a review. Plant Soil 237, 173–195.
Hocking, P. J., Mead, J. A., Good, A. J., Diffey, S. M. (2003): The response of canola
(Brassica napus L.) to tillage and fertiliser placement in contrasting
environments in southern NSW. Aust. J. Exp. Agric. 43, 1323–1335.
Hodge, A. (2004): The plastic plant: root responses to heterogeneous supplies of
nutrients. New Phytol. 162, 9–24.
Huber, D., Römheld, V., Weinmann, M. (2012): Relationship between nutrition, plant
diseases and pests, in Marschner P.: Marschner’s Mineral Nutrition of Higher
Plants, Third edition, Academic Press, Elsevier, Amsterdam, pp. 283–298.

4: Fertilizer placement: A review and meta-analysis
59
Jiang, Y., Wu, Y., Xu, W., Cheng, Y., Chen, J., Xu, L., Hu, F., Li, H. (2012): IAA-
producing bacteria and bacterial-feeding nematodes promote Arabidopsis
thaliana root growth in natural soil. Eur. J. Soil Biol. 52, 20–26.
Jing, J., Zhang, F., Rengel, Z., Shen, J. (2012): Localized fertilization with P plus N
elicits an ammonium-dependent enhancement of maize root growth and
nutrient uptake. Field Crop. Res. 133, 176–185.
Kelley, K. W., Sweeney, D. W. (2007): Placement of preplant liquid nitrogen and
phosphorus fertilizer and nitrogen rate affects no-till wheat following different
summer crops. Agron. J. 99, 1009–1017.
Köhler, S., Bischoff, W.-A, Liebig, H.-P. (2003): Cultandüngung- ein Beitrag zum
Grundwasserschutz durch Verringerung des Nitrataustrages, in Kücke, M.:
Anbauverfahren mit N-injektion (CULTAN), Ergebnisse, Perspektiven ,
Erfahrungen (Beiträge des Workshops am 29. November 2001 in
Braunschweig). Bundesforschungsantalt für Landwirthschaft (FAL),
Landbauforschung Völkenrode, Sonderheft 245 (FAL Agricultural Reasearch,
special issue 245) pp. 117–127.
Kristoffersen, A. Ø., Riley, H., Sogn, T. A. (2005): Effects of P fertilizer placement
and temperature on root hair formation, shoot growth and P content of barley
grown on soils with varying P status. Nutr. Cycl. Agroecosys. 73, 147–159.
Légère, A., Shirtliffe, S. J., Vanasse, A., Gulden, R. H. (2013): Extreme grain-based
cropping systems: when herbicide-free weed management meets conservation
tillage in northern climates. Weed Technol. 27, 204–211.
Linquist, B. A., Adviento-Borbe, M. A., Pittelkow, C. M., van Kessel, C., van
Groenigen, K. J. (2012): Fertilizer management practices and greenhouse gas
emissions from rice systems: A quantitative review and analysis. Field Crop.
Res.135, 10–21.
Lu, D. Q., Chien, H. S., Henao, J., Sompongse, D. (1987): Evaluation of short-term
efficiency of diammonium phosphate versus urea plus single superphosphate
on a calcareous soil. Agron. J. 79, 896–900.
Lu, S., Miller, M. H. (1993): Determination of the most efficient phosphorus
placement for field-grown maize (Zea mays L.) in early growth stages. Can. J.
Soil. Sci. 73, 349–358.
Lugtenberg, B., Kamilova, F. (2009): Plant-growth-promoting rhizobacteria. Annu.
Rev. Microbiol. 63, 541–556.
Ma, Q., Rengel, Z., Rose, T. (2009): The effectiveness of deep placement of fertilisers
is determined by crop species and edaphic conditions in Mediterranean-type
environments: a review. Aust. J. Soil Res. 47, 19–32.
Ma, B. L., Wu, T. Y., Tremblay, N., Deen, W., McLaughlin, N. B., Morrison, M. J.,
Stewart, G. (2010): On-farm assessment of the amount and timing of nitrogen
fertilizer on ammonia volatilization. Agron. J. 102, 134–144.
Malhi, S. S., Grant, C. A., Johnston, A. M., Gill, K. S. (2001): Nitrogen fertilization
management for no-till cereal production in the Canadian Great Plains: a
review. Soil Till. Res. 60, 101–122.

4: Fertilizer placement: A review and meta-analysis
60
Malhi, S. S., Karamanos, R. E. (2006): A review of copper fertilizer management for
optimum yield and quality of crops in the Canadian Prairie Provinces. Can. J.
Plant Sci. 86, 605–619.
Marschner, P., Rengel, Z. (2012): Nutrient availability in soils, in Marschner P.:
Marschner’s Mineral Nutrition of Higher Plants, Third edition, Academic
Press, Elsevier, Amsterdam, pp. 315–330.
Marschner, P. (2012): Rhizosphere biology, in Marschner P.: Marschner’s Mineral
Nutrition of Higher Plants, Third edition, Academic Press, Elsevier,
Amsterdam, pp. 369–388.
Marschner, H., Römheld, V., Horst, W. J., Martin, P. (1986): Root-induced changes in
the rhizosphere: Importance for the mineral nutrition of plants. Z.
Pflanzenernaehr. Bodenk. 149, 441–456.
Matson, P. A., Parton, W. J., Power, A. G., Swift, M. J. (1997): Agricultural
intensification and ecosystem properties. Science 277, 504–509.
Melander, B., Rasmussen, I. A., Bàrberi, P. (2005): Integrating physical and cultural
methods of weed control— examples from European research. Weed Sci. 53,
369–381.
Michalsky, R., Pfromm, P. H. (2012): Thermodynamics of metal reactants for
ammonia synthesis from steam, nitrogen and biomass at atmospheric pressure.
AIChE J. 58, 3203–3213.
Moody, P. W., Edwards, D. G., Bell, L. C. (1995): Effect of banded fertilizers on soil
solution composition and short-term root growth. II. mono- and di-ammonium
phosphates. Aust. J. Soil Res. 33, 689–707.
Muhammad, S., Müller, T., Joergensen, R. G. (2007): Compost and P amendments for
stimulating microorganisms and maize growth in a saline soil from Pakistan in
comparison with a nonsaline soil from Germany. J. Plant Nutr. Soil Sci. 170,
745–751.
Müller, T., Walter, B., Wirtz, A., Burkovski, A. (2006): Ammonium toxicity in
bacteria. Curr. Microbiol. 52, 400–406.
Murakami, H., Tsushima, S., Shishido, Y. (2002): Factors affecting the pattern of the
dose response curve of clubroot disease caused by Plasmodiophora brassicae.
Soil Sci. Plant Nut. 48, 421–427.
Nash, P. R., Motavalli, P. P., Nelson, K. A. (2012): Nitrous oxide emissions from
claypan soils due to nitrogen fertilizer source and tillage/fertilizer placement
practices. Soil Sci. Soc. Am. J. 76, 983–993.
Neumann, G., Römheld, V. (2007): The release of root exudates as affected by the
plant physiological status, in Pinton, R., Varanini, Z.; Nannipieri, P.: The
Rhizosphere. Biochemistry and organic substances at the soil-plant interface,
Ed. 2. CRC Press, Boca Raton, Florida pp. 23–72.
Neumann, G., Römheld, V. (2012): Rhizosphere chemistry in relation to plant
nutrition, in Marschner P.: Marschner’s Mineral Nutrition of Higher Plants,
Third edition, Academic Press, Elsevier, Amsterdam, pp.347–360.

4: Fertilizer placement: A review and meta-analysis
61
Nieder, R., Benbi, D., Scherer, H. (2011): Fixation and defixation of ammonium in
soils: a review. Biol. Fert. Soils 47, 1–14.
Niehues, B. J., Lamond, R. E., Godsey, C. B., Olsen, C. J. (2004): Starter nitrogen
fertilizer management for continuous no-till corn production contribution no.
04-099-J, K-State Research and Extension. Agron. J. 96, 1412–1418.
Nkebiwe, P. M., Weinmann, M., Müller, T. (2016): Improving fertilizer-depot
exploitation and maize growth by inoculation with plant growth-promoting
bacteria: from lab to field. Chem. biol. technol. agric. 3, 1–16.
Nyord, T., Søgaard, H. T., Hansen, M. N., Jensen, L. S. (2008): Injection methods to
reduce ammonia emission from volatile liquid fertilisers applied to growing
crops. Biosystems Engineering 100, 235–244.
Olson, R. A., Dreier, A. F. (1956): Fertilizer placement for small grains in relation to
crop stand and nutrient efficiency in Nebraska. Soil Sci. Soc. Am. J. 20, 19–24.
Pang, P. C., Hedlin, R. A., Cho, C. M. (1973): Transformation and movement of
band-applied urea, ammonium sulfate, and ammonium hydroxide during
incubation in several Manitoba soils. Can. J. Soil. Sci. 53, 331–341
Parry, M. L., Rosenzweig, C., Iglesias, A., Livermore, M., Fischer, G. (2004): Effects
of climate change on global food production under SRES emissions and socio-
economic scenarios. Climate Change 14, 53–67
Peltonen-Sainio, P., Kontturi, M., Peltonen, J. (2006): Phosphorus seed coating
enhancement on early growth and yield components in oat. Agron. J. 98, 206–
211.
Petersen, J. (2005): Competition between weeds and spring wheat for 15N-labelled
nitrogen applied in pig slurry. Weed Res. 45, 103–113.
Pfab, H., Palmer, I., Buegger, F., Fiedler, S., Müller, T., Ruser, R. (2012): Influence
of a nitrification inhibitor and of placed N-fertilization on N2O fluxes from a
vegetable cropped loamy soil. Agric. Ecosyst. Environ. 150, 91–101.
Philbrook, H. T., Barrowman, N., Garg, A. X. (2007): Imputing variance estimates do
not alter the conclusions of a meta-analysis with continuous outcomes: a case
study of changes in renal function after living kidney donation. J. Clin.
Epidemiol. 60, 228–240.
Piepho, H. P., Williams, E. R., Madden, L. V. (2012): The use of two-way linear
mixed models in multitreatment meta-analysis. Biometrics 68, 1269–1277
Prochnow, L. I., Chien, S.H., Carmona, G., Henao, J. (2004): Greenhouse evaluation
of phosphorous sources produced from low-reactive Brazilian phosphate rock.
Agron. J. 96, 761–768.
Qin, R., Stamp, P., Richner, W. (2005): Impact of tillage and banded starter fertilizer
on maize root growth in the top 25 centimeters of the soil. Agron. J. 97, 674–
683.
Randall, G. W., Hoeft, R. G. (1988): Placement methods for improved efficiency of P
and K fertilizers: A Review. J. Prod. Agr. 1, 70–79.

4: Fertilizer placement: A review and meta-analysis
62
Raun, W. R., Johnson, G. V. (1999): Improving nitrogen use efficiency for cereal
production. Agron. J. 91, 357–363.
Reith, J. W. S. (1954): Recent advances in fertilizer placement. I. Fertilizer placement
for swedes and turnips in Scotland. J. Sci. Food Agric. 5, 421–428.
Rochette, P., Angers, D. A., Chantigny, M. H., MacDonald, J. D., Gasser, M.-O.,
Bertrand, N. (2009): Reducing ammonia volatilization in a no-till soil by
incorporating urea and pig slurry in shallow bands. Nutr. Cycl. Agroecosys. 84,
71–80.
Redel, Y. D., Rubio, R., Rouanet, J. L., Borie, F. (2007): Phosphorus bioavailability
affected by tillage and crop rotation on a Chilean volcanic derived Ultisol.
Geoderma, 139, 388–396.
Richardson, A. E., Barea, J.-M., McNeill, A. M., Prigent-Combaret, C. (2009):
Acquisition of phosphorus and nitrogen in the rhizosphere and plant growth
promotion by microorganisms. Plant Soil 321, 305–339.
Rose, T. J., Rengel, Z., Ma, Q. F., Bowden, J. W. (2009): Crop species differ in root
plasticity response to localised P supply. J. Plant Nutrit. Soil Sci. 172, 360–368.
Rosenberg, M. S., Adams, D. C., Gurevitch, J. (2000): MetaWin. Statistical software
for meta-analysis, version 2. Sinauer Associates, Sunderland, MA. USA.
Rosenberg, M. S., Goodnight, C. (2005): The file-drawer problem revisited: a general
weighted method for calculating fail-safe numbers in meta-analysis. Evolution
.59, 464–468.
Ruidisch, M., Bartsch, S., Kettering, J., Huwe, B., Frei, S. (2013): The effect of
fertilizer best management practices on nitrate leaching in a plastic mulched
ridge cultivation system. Agr. Ecosyst. Environ. 169, 21–32.
Sadeghi, A. M., Kissel, D. E., Cabrera, M. L. (1989): Estimating molecular diffusion
coefficients of urea in unsaturated soil. Soil Sci. Soc. Am. J. 53, 15–18.
Saleem, M. F., Randhawa, M. S., Hussain, S., Wahid, M. A., Anjum, S. A. (2009):
Nitrogen management studies in autumn planted maize (Zea Mays L.) hybrids.
J. Anim. Plant Sci. 19, 140–143.
Schenk, M. K., Barber, S. A. (1979): Phosphate uptake by corn as affected by soil
characteristics and root morphology. Soil Sci. Soc. Am. J. 43, 880–883.
Schlegel, A. J., Dhuyvetter, K. C., Havlin, J. L. (2003): Placement of UAN for dryland
winter wheat in the central high plains. Agron. J. 95, 1532–1541.
Sekiya, N., Yano, K. (2010): Seed P-enrichment as an effective P supply to wheat.
Plant Soil 327, 347-354
Sharma, S. H. S., Lyons, G., McRoberts, C., McCall, D., Carmichael, E., Andrews, F.,
Swan, R., McCormack, R., Mellon, R. (2012): Biostimulant activity of brown
seaweed species from Strangford Lough: compositional analyses of
polysaccharides and bioassay of extracts using mung bean (Vigno mungo L.)
and pak choi (Brassica rapa chinensis L.). J. Appl. Phycol. 24, 1081–1091.
4: Fertilizer placement: A review and meta-analysis
63
Shaviv, A. (1988): Control of nitrification rate by increasing ammonium
concentration. Fert. Res. 17, 177–188.
Singh, D. K., Sale, P. W. G., Routley, R. R. (2005): Increasing phosphorus supply in
subsurface soil in northern Australia: Rationale for deep placement and the
effects with various crops. Plant Soil 269, 35–44.
Sommer, K. (2005): CULTAN-Düngung: Physiologisch, ökologisch, ökonomisch
optimiertes Düngungsverfahren für Ackerkulturen, Grünland, Gemüse,
Zierpflanzen und Obstgehölze, Verlag Th. Mann, Gelsenkirchen-Buer,
Germany.
Sommer, K. (2003): Grundlagen des “ CULTAN”- Verfahrens, in Kücke, M.:
Anbauverfahren mit N-injektion (CULTAN), Ergebnisse, Perspektiven ,
Erfahrungen (Beiträge des Workshops am 29. November 2001 in
Braunschweig). Bundesforschungsantalt für Landwirthschaft (FAL),
Landbauforschung Völkenrode, Sonderheft 245 (FAL Agricultural Reasearch,
special issue 245), pp. 1–22.
Su, W., Liu, B., Liu, X., Li, X., Ren, T., Cong, R., Lu, J. (2015): Effect of depth of
fertilizer banded-placement on growth, nutrient uptake and yield of oilseed rape
(Brassica napus L.). Eur. J. Agron. 62, 38–45.
Tilman, D., Cassman ,G. K., Matson, P. A., Naylor, R. Polasky, S. (2002):
Agricultural sustainability and intensive production practices. Nature 418, 671–
677.
Tscharntke, T., Clough, Y., Wanger, T. C., Jackson, L., Motzke, I., Perfecto, I.,
Vandermeer, J., Whitbread, A. (2012): Global food security, biodiversity
conservation and the future of agricultural intensification. Biol. Conserv. 151,
53–59.
Tunney, H., Carton, O.T., Brookes, P.C., Johnston, A.E. (1997): Phosphorous loss
from soil to water. CAB International, Wellingford, UK. pp. 3, 138, 185,273
and 276.
Turner, B.L., Frossard, E., Baldwin, D.S (2005): Organic phosphorous in the
environment. CAB International, Wellingford, UK. pp. 1–2, 75, 92–96,113,
133, 165 and 175.
Uygur, V., Karabatak, I. (2009): The effect of organic amendments on mineral
phosphate fractions in calcareous soils. J. Plant Nutr. Soil Sci. 172, 336–345.
Valluru, R., Vadez, V., Hash, C. T., Karanam, P. (2010): A minute P application
contributes to a better establishment of pearl millet (Pennisetum glaucum (L.)
R. Br.) seedling in P deficient soils. Soil Use Manag. 26, 36–43.
van Kessel, C., Venterea, R., Six, J., Adviento-Borbe, M. A., Linquist, B., van
Groenigen, K. J. (2012): Climate, duration, and N placement determine N2O
emissions in reduced tillage systems: a meta-analysis. Glob. Change Biol. 19,
33–44.
Vassilev, N., Vassileva, M., Nikolaeva, I. (2006): Simultaneous P-solubilizing and
biocontrol activity of microorganisms: potentials and future trends. Appl.
Microbiol. Biot. 71, 137–144.

4: Fertilizer placement: A review and meta-analysis
64
Weaver, D. M., Ritchie, G. S., Anderson, G. C., Deeley, D. M. (1988): Phosphorus
leaching in sandy soils .I. Short-term effects of fertilizer applications and
environmental conditions. Aust. J. Soil Res. 26, 177–190
Weber, E. A., Koller, W.-D., Graeff, S., Hermann, W., Merkt, N., Claupein, W. (2008):
Impact of different nitrogen fertilizers and an additional sulfur supply on grain
yield, quality, and the potential of acrylamide formation in winter wheat. J.
Plant Nutr. Soil Sci. 171, 643–655.
Weligama, C., Tang, C., Sale, P. W. G., Conyers, M. K., Liu, D. L. (2008): Localised
nitrate and phosphate application enhances root proliferation by wheat and
maximises rhizosphere alkalisation in acid subsoil. Plant Soil 312, 101–115.
Weinmann, M,. Römheld, V. (2012): Resource Preservation by Application of
BIOefFECTORs in European Crop Production (Research proposal). European
Community's Seventh Framework Programme (FP7/2007-2013) under grant
agreement n° 312117 (BIOFECTOR). http://www.biofector.info/
Zerulla, W., Barth, T., Dressel, J., Erhardt, K., Horchler von Locquenghien, K.,
Pasda, G., Rädle, M., Wissemeier, A. (2001): 3,4-Dimethylpyrazole phosphate
(DMPP) - a new nitrification inhibitor for agriculture and horticulture. Biol.
Fert. Soils 34, 79–84.
Zhang, H., Schroder, J. L., Fuhrman, J. K., Basta, N. T., Storm, D. E., Payton, M. E.
(2005): Path and multiple regression analyses of phosphorus sorption capacity.
Soil Sci. Soc. Am. J. 69, 96–106.
Zhang, M., Nyborg, M., Malhi, S. S., Solberg, E. D. (2000): Localized root growth in
soil induced by controlled‐release urea granule and barley nitrogen uptake. J.
Plant. Nut. 23, 413–422.
Zhang, X. K., Rengel, Z. (2002): Temporal dynamics of gradients of phosphorus,
ammonium, pH, and electrical conductivity between a di-ammonium phosphate
band and wheat roots. Aust. J. Agric. Res. 53, 985–992.
Zhou, S.-L., Wu, Y.-C., Wang, Z.-M., Lu, L.-Q., Wang, R.-Z. (2008): The nitrate
leached below maize root zone is available for deep-rooted wheat in winter
wheat–summer maize rotation in the North China Plain. Environ. Pollut. 152,
723–730.

5: Rhizosphere hotspots: A home for PGPM
65
5 Densely rooted rhizosphere hotspots induced around subsurface NH4+-
fertilizer depots: a home for P-solubilizing PGPMs?
Peteh Mehdi Nkebiwe1§, Günter Neumann 2*, Torsten Müller1*
1Fertilisation and Soil Matter Dynamics (340 i), University of Hohenheim, 70593
Stuttgart, Germany
2Nutritional Crop Physiology (340 h), University of Hohenheim, 70593 Stuttgart,
Germany
*These authors contributed equally to this work
§Corresponding author
Email addresses:
PMN: [email protected]
Original revised article accepted for publication in: Chemical and Biological
Technologies in Agriculture, 13.11.2017, DOI: 10.1186/s40538-017-0111-y
Reprinted from Chemical and Biological Technologies in Agriculture, Nkebiwe, P.
M., Neumann G. & Müller, T. (2017). Densely rooted rhizosphere hotspots induced
around subsurface NH4+-fertilizer depots: a home for soil PGPMs?
DOI: 10.1186/s40538-017-0111-y with kind permission from Springer International
Publishing.

5: Rhizosphere hotspots: A home for PGPM
66
5.1 Abstract
In natural soil, populations of inoculated plant growth-promoting microorganisms
(PGPMs) generally decline after application due to one or more unfavorable biotic
and/or abiotic factors. Placement of a subsurface fertilizer depot that is based on
concentrated stabilized NH4+ stimulates localized zones of dense rooting (rhizosphere
hotspots). In such densely rooted soil areas, inoculated PGPMs may thrive supported
by the presence of high concentrations of organic nutrients released as root exudates.
Nevertheless, sometimes placement of an NH4+–depot does not adequately stimulate
dense localized rooting due to other factors. The objectives of this study were to
investigate: 1.) the effect of background soil Nmin on localized root-growth around
NH4+ –depots 2.) the tolerance of selected PGPMs to high concentrations of
NH4+±DMPP (nitrification inhibitor 3, 4-dimethylpyrazole phosphate) as can be
found around a rich NH4+ –depot; 3.) the ability of selected NH4
+-tolerant PGPMs to
solubilize inorganic P; and 4.) the establishment of the most promising NH4+-tolerant
and P-solubilizing PGPM in soil around an NH4+ –depot. We conducted a rhizobox
experiment with spring wheat (Triticum aestivum L) to investigate the effect of
background Nmin (0, 5, 20 and 60 mg N kg-1) on localized root growth around a 1g
NH4+-N depot. Through in vitro tests, we investigated the tolerance of selected
PGPMs to 0, 2, 10, 50, 250, 1250 mM NH4-N and 0, 0.1, 1 and 3 M NH4-N±DMPP,
of which selected candidates were tested for their ability to solubilize the tri-calcium
phosphate (Ca3(PO4)2) (Ca-P), rock phosphate (RP) or sewage sludge ash (SA). One
candidate PGPM was tested in a rhizobox experiment with maize (Zea mays L.) for its
ability to establish in soil around a 15N-labelled (NH4)2SO4+DMPP depot. Moderate
background Nmin (5 and 20 mg N kg-1) improved depot-zone root growth whereas
high bulk soil Nmin (60 mg N kg-1) had a negative effect. All PGPMs showed
substantial tolerance to up to 1250 mM NH4-N. Through acidification, Pseudomonas
sp. DSMZ 13134 and B. amyloliquefaciens FZB42 (not Trichoderma harzianum T-
22) solubilized Ca-P and RP whereas SA was not solubilized despite marked
acidification. Placed 15N-labelled (NH4)2SO4+DMPP-depot led to increased localized
rooting, rhizosphere acidification, Shoot 15N signal, N and P concentrations and
contents than homogenously applied Ca(NO3)2. Inoculation of Pseudomonas sp.
DSMZ 13134 tended to increase shoot N and P concentrations, and shoot N content
relative to the non-inoculated control. Higher colonization rate of Pseudomonas sp.
DSMZ 13134 could be measured in soil 5x5 cm to seeds for the treatments with
placed (NH4)2SO4+DMPP depot than in those with homogenous supply of Ca(NO3)2.
Results suggest that the survival and establishment of P-solubilizing PGPMs that are
tolerant to high NH4+ concentrations can be enhanced if they are inoculated in soil
around a concentrated subsurface NH4+-fertilizer depot.
Keywords: fertilizer placement; localized root-growth; PGPM; P-solubilizing bacteria

5: Rhizosphere hotspots: A home for PGPM
67
Background
Placement of manures or mineral fertilizers in subsurface soil has been shown to
result in higher nutrient uptake and yield in different crop species than conventional
fertilizer application by surface broadcast (Federolf et al. 2016; Jing et al. 2012;
Miller and Ohlrogge 1958; Nkebiwe et al. 2016a). Among other factors, efficient
exploitation of subsurface fertilizer depots depends on intense rooting around the
nutrient patch and on improved nutrient uptake rates. Therefore, it is necessary that
subsurface fertilizer depots contain high concentrations of nutrients like NH4+ or
HPO42-/ H2PO4
- (or CO(NH2)2 if conditions for ammonification are optimal) that are
poorly mobile in soil, therefore remain in the vicinity of the depot (Barber 1984;
Clarke and Barley 1968; Pang et al. 1973; Schenk and Barber 1979) and strongly
stimulate localized root growth at the depot upon contact with roots (Drew 1975; Jing
et al. 2012). In contrasting investigations, however, it has been observed that intense
rooting does not occur in a subsurface fertilizer patch based on manure or mineral N-
fertilizer under both greenhouse and field conditions (Lamb et al. 2004; Müller et al.
2009, unpublished results). As an explanation of this contradiction, we hypothesized
that localized root-growth around a subsurface NH4+-depot depends on a high nutrient
concentration gradient between the nutrient patch and the background or bulk soil and
that localized root-growth response at a fertilizer depot is more likely to occur in
nutrient-poor soils than in nutrient-rich ones. Likewise, it is proposed to place high
and even toxic concentrations of NH4+ in subsurface soil to form a rich N-depot
certainly contrasting the N-concentration in its surrounding. In addition toxicity
inhibits microbial nitrification in the depot, persistently releasing NH4+ to induce
intense localized rooting, a method labelled Controlled Long-term Ammonium
Nutrition (CULTAN) (Sommer 2005). An NH4+-Depot containing a nitrification

5: Rhizosphere hotspots: A home for PGPM
68
inhibitor (NI) such as 3, 4-dimethylpyrazole phosphate (DMPP) (Zerulla et al. 2001)
is certainly of additional benefit to enhance the persistence of N in the form of NH4+
in soil.
Nevertheless, for certain plant species responding to nutrient patches by high root
turnover rates within the patch (equally high root birth and death rates) e.g. Ambrosia
artemisiifolia, no net increase in root density may be observed in the nutrient patch
even weeks after subsurface fertilizer placement (Gross et al. 1993).
An approach to improve plant nutrient acquisition from placed subsurface NH4+-
depots is to inoculate soil immediately surrounding the depot with plant growth
promoting microorganisms (PGPMs) such as P-solubilizing bacteria.
PGPMs have been described to promote plant growth via several mechanisms and
each PGPM typically improves plant growth by more than one of these mechanisms.
PGPMs like Pseudomonas sp. Bacillus sp. or Xanthomonas sp. have been shown to
produce the phytohormone indole acetic acid (IAA) to promote plant root-growth and
/or the enzyme ACC-deaminase, which reduces ethylene levels thus delaying root
senescence under stress conditions (Jiang et al. 2012; Lugtenberg and Kamilova 2009;
Mohite 2013; Shakir et al. 2012). Additionally, these PGPMs have been shown to
synthesize antifungal metabolites (e.g. various phenols and phenazines) for direct
control of root pathogenic fungi in soil and low-molecular weight iron-complexing
ligands (e.g. the siderophore pyoverdine) for indirect suppression of root-disease
agents via competition against root pathogens for iron and other nutrients (Mavrodi et
al. 2012; Vassilev et al. 2006). Other species of Bacillus, Pseudomonas, Enterobacter
and Trichoderma have been shown to release protons, organic acids and chelating
metabolites (e.g. Oxalic, fumaric, citric, DL-malic, DL-lactic and succinic acids) that

5: Rhizosphere hotspots: A home for PGPM
69
enhance the solubility of sparingly soluble mineral phosphates and/or secrete enzymes
like phytases and phosphatases to mineralize organic phosphates in soil (Altomare et
al. 1999; Barea et al. 2002; Bashan et al. 2013; Panda et al. 2016; Pérez et al. 2007;
Singh and Satyanarayana 2012). However, for the approach to inoculate soil around
subsurface NH4+-depots with PGPMs to be effective, PGPMs must show considerable
tolerance to extreme pH, high NH4+ concentrations and possibly nitrification and
urease inhibitors present in and around the fertilizer-depot, in order to colonize the
gradually developing densely rooted rhizosphere hotspot.
The main aim of this study was to employ fertilizer placement as a tool to induce
dense localized rooting in soil areas around subsurface fertilizer depots (“rhizosphere
hotspot”). Rhizosphere hotspots are proposed to be soil areas with dense root-growth
and a high potential for the establishment of inoculated P-solubilizing PGPMs, which
may be supported by the presence of high concentrations of organic C and N nutrients
released as root exudates into the rhizosphere. The objectives of this study were to
investigate: 1.) the effect of background mineral N concentration on depot-zone root-growth
aiming on the stimulation of dense rooting around concentrated subsurface NH4+-depots and;
2.) the tolerance of selected microbial bio-effectors (BEs) to high NH4+- concentrations (in
vitro) comparable to those in boarder areas of concentrated subsurface NH4+-depots with and
without the nitrification inhibitor DMPP; 3.) the potential of selected microbial BEs to
solubilize different sparingly soluble inorganic P forms; and 4.) the establishment of the best
performing P-solubilizing PGPM in a rhizosphere hotspot around a placed subsurface 15N
labelled (NH4)2SO4+DMPP depot.
We hypothesized that: 1.) Development of rhizosphere hotspots around (NH4)2SO4 depots
depends on background substrate Nmin and rhizosphere hotspots form when background Nmin
is low and not when it is high. 2.) In in vitro cultures, microbial BEs tolerate to high

5: Rhizosphere hotspots: A home for PGPM
70
concentrations of NH4+-N ((NH4)2SO4 with and without the nitrification inhibitor DMPP) that
are toxic even for crops species (e.g. rice, Oryza sativa L.) that show tolerance to NH4+. 3.)
Microbial BEs are able to solubilize different sparingly soluble mineral phosphates in solid
and liquid in vitro cultures. 4). Inoculation of a P-solubilizing microbial BE in the rhizosphere
hotpot around a subsurface NH4+-depot improves BE establishment and increases P uptake by
maize (Zea mays L.).
Materials and methodology
5.1.2.1 Effect of background Nmin on root growth around subsurface NH4+-
depots
We cultivated spring wheat (Triticum aestivum L. var Schirocco, KWS, 1197, 29296
Bergen, Germany) in PVC-rhizoboxes (40 x 20 x 2 cm, H x W x D). The Substrate
was composed of 80 % C-horizon loess (PCAL, 5 mg kg−1; Ptotal, 332 mg kg−1; pH
(CaCl2), 7.6; Corg, <0.3 %; Ntotal 0.02 %) and 20 % quartz sand (0.6–1.2 mm Ø) (w/w).
Basic fertilization included (kg-1 dry soil DM): 150 mg P (Ca(H2PO4)2), 200 mg K
(K2SO4), 100 mg Mg (MgSO4), 20 μmol Fe-EDDHA (Sequestrene138, 6 % Fe), 2.6 g
Zn (ZnSO4); 1 mg Cu (CuSO4); 2.2 mg Mn (MnSO4), 0.54 mg Mo (Na2MoO4) and
0.86 mg B (H3BO3). Moisture content was set to 26% (60-70% max. WHC).
Treatments included increasing bulk soil Nmin concentrations: 0, 5, 20, and 60 mg N
kg-1 soil DM (NH4NO3). A stabilized NH4+-depot was placed 7 cm to the side and 16
cm below two wheat seedlings in each rhizobox. The NH4+ depot (1.0 g NH4-N
+0.17g NO3-N + 0.01 g DMPP) was made by placing 3.49 g (NH4)2SO4 in soil over
which 2.5 ml solution of 1.1 M NH4NO3 containing DMPP(4 g L-1) was pipetted. The
depot was mixed in a small soil volume of 5 cm3 (2.5 cm Ø x 2cm depth) resulting in
a very high NH4-N concentration within the depot of 78.4 mg g-1 soil (bulk density,
1.3 g cm-3). DMPP was added at the recommended rate of 1% NH4-N (w/w) (Zerulla
et al. 2001). Each rhizobox contained 2.6 kg substrate.

5: Rhizosphere hotspots: A home for PGPM
71
Before transplanting, seed surfaces were disinfected by soaking in 3 % H2O2 for 10
min. Afterwards seeds were soaked for 10 hrs. in 2.5 mM CaSO4 and pre-germinated
on filter papers that were also soaked in 2.5 mM CaSO4 (48 hours at 25°C in
darkness). Two healthy seedlings (distinct shoot and root length ≥ 2 cm) were
transplanted to each rhizobox. Greenhouse conditions were as follows: day/night
length: 8h/16 h, daytime light intensity: 311 µmol m-2s-1 (ALMEMO 239-3,
AHLBORN), av. daily temperature 15 °C (8-21 °C) and av. daily relative humidity 42
% (30 %-65 %) (Voltcraft, DL-141 TH). Four replicates were made per treatment and
were arranged in a completely randomized design. Plants were grown for 60 days (10
February - 07 April 2013). Total root length visible through the root observation
window of the rhizobox in the radial zones: 0-4, 4-8 and > 8 cm from the nutrient
depot was measured at 12, 36 and 56 days after planting. Roots were drawn on a clear
plastic sheet (40 X 20 cm) placed over the soil surface on the rhizobox window using
a fine black water-resistant marker. Drawings were scanned (Epson Expression 10000
XL) and analyzed for total root length using WinRhizo Pro V. 2009c (Regent
Instruments Inc., Canada). At the end of the growth period, root length density (cm
cm-3 of substrate) could not be appropriately measured because, as shown in Fig. 2,
roots grew into the nylon sheet lining the rear of the rhizobox, making it impossible to
satisfactorily harvest roots. After harvesting, shoot dry weight were measured, depot
and bulk soil samples were collected and frozen for later analysis of NH4-N and NO3-
N concentrations.

5: Rhizosphere hotspots: A home for PGPM
72
5.1.2.2 PGPM tolerance to high N concentrations
The following PGPMs were cultured on various solid nutrient media with increasing
N concentrations (Table 5.1):
Table 5.1. List of PGPMs
Nr. Active
microorganism
Product
name
Supplier Recommended
solid nutrient
media
1 Bacillus
atrophaeus -
ABiTEP GmbH, Berlin,
Germany
Nutrient agar
(NA)
2 Bacillus simplex
R41 -
ABiTEP GmbH, Berlin,
Germany
NA
3 Bacillus spec. -
ABiTEP GmbH, Berlin,
Germany
NA
4 Penicillium sp.
PK 112
Biological
Fertilizer
DC
Bayer Crop Science,
Germany
Malt extract
peptone agar
(MEP)
5 Bacillus
amyloliquefaciens
FZB42
RhizoVital
®42
ABiTEP GmbH, Berlin,
Germany
Deutsche
Einheitsverfahren
Agar (DEV) and
NA
6 Pseudomonas sp.
DSMZ 13134
Proradix®
WP
Sourcon Padena,
Tübingen, Germany
King’s B
medium (KM)
7 Trichoderma
harzianum
OmG08
- Hochschule Anhalt,
Bernburg, Germany
MEP
8 Trichoderma
harzianum
Trichoderm
a-WG
Bayer Crop Science,
Germany
MEP
9 Trichoderma
harzianum T50
Vitalin T50 Vitalin
Pflansengesundheit
GmbH, Ober-Ramstadt,
Germany
MEP
10 Trichoderma
harzianum T-22
(only in tests ±
nitrification
inhibitor DMPP)
Trianum-P Koppert Biological
Systems B.V., The
Netherlands
MEP
5: Rhizosphere hotspots: A home for PGPM
73
For each culture medium, six solutions with the following NH4+ concentrations were
prepared using deionized water: 0, 2, 10, 50, 250 and 1250 mM NH4-N ((NH4)2SO4).
For each NH4+-level, the constituents per liter of medium were dissolved in the
corresponding solution to a final volume of 1000 ml. The pH was then adjusted to the
desired level using 1N NaOH or HCl and finally, the medium was sterilized by
autoclaving at 121°C for 20 min.
The following solid media were prepared for each NH4+-level:
1.) Nutrient agar (5.0 g peptone; 3.0 g meat extract; 15.0 g agar; pH 7); 2.) King’s B
medium (From ready-made preparation (King’s B medium (Basis), Carl Roth GmbH
+ Co. KG). (38 g medium and 10 ml glycerol in 990 ml deionized water; pH 7); 3.)
DEV medium (Deutsche Einheitsverfahren) (10.0 g peptone; 10.0 g meat extract; 5.0
g NaCl; 18.0 g agar; pH 7.2); and 4.) Malt extract peptone agar (30.0 g malt extract;
3.0 g soya peptone; 15.0 g agar; pH 5.6).
At 45 °C, about 20 ml of each medium was poured into a sterile petri dish. For
bacterial PGPMs, inocula were prepared as diluted suspensions in 2.5 mM CaSO4.
For each bacteria and NH4+-level, 100 µl inoculum (about 50 CFUs) was pipetted
onto a petri dish and evenly spread using a Drigalski spatula. For each fungi, a small
fragment of pre-cultured mycelium was placed at the center of the petri dish. There
were three replicates per treatment randomly placed on the same incubator shelf
(Incubator: WBT, Binder, Typ 1711509900313, Tuttlingen, Germany) and cultured at
24 ± 1°C under aerobic conditions in darkness. Trichoderma were grown for 48 hours
and the remaining PGPMs for 1 week.
An additional incubation test on normal NH4+-free agar was performed with selected
microbial BEs, which were each pre-incubated at 25 ± 2°C for 15 min. or 24 hrs. in

5: Rhizosphere hotspots: A home for PGPM
74
solutions containing high concentrations of NH4+ ((NH4)2SO4 ± DMPP) before
inoculation on normal nutrient agar. This was to investigate whether BEs could
survive when applied in a concentrated NH4+-fertilizer solution ((NH4)2SO4 ± DMPP)
before placement in soil. Pseudomonas sp. DSMZ 13134, Bacillus amyloliquefaciens
FZB42 and Trichoderma harzianum T-22 were tested. After pre-incubation for 15
minutes, 100 µl of each bacterial inoculum suspension in 0, 0.1, 1 or 3 M (NH4)2SO4
± DMPP (about 50 CFUs) was inoculated on culture media and incubated at 25 ± 2°C
for 48 hrs. in darkness under aerobic conditions. For T. harzianum T-22, 100 µl 0, 0.1,
1 or 3 M (NH4)2SO4 ± DMPP was pipetted on a fragment of pre-cultured mycelium
and after 15 min., the mycelium fragment was placed on NH4+-free agar. This
procedure was adopted for T. harzianum T-22 because the effect of (NH4)2SO4 ±
DMPP on its survival and growth could be best quantitatively analyzed by measuring
the diameter of intact pieces of growing mycelium. There were four randomly placed
replicates per treatment. The other duration for pre-incubation of BEs was 24 hrs. For
this test, BEs were pre-incubated only in 1 or 3 M (NH4)2SO4 ± DMPP with three
replicates per treatment to reduce bulk and facilitate overall management of the
incubation experiments. For 24 hrs. pre-incubation, T. harzianum T-22 spores were
used as inoculum instead of a fragment of pre-cultured mycelium because it is more
relevant to field application. However, only qualitative analysis of the survival and
growth of T. harzianum T-22 was possible because of the absence of a distinct
circular mycelium for measurement of diameter .For T. harzianum T-22, the diameter
of the mycelium was measured. For bacteria, colony characteristics were recorded and
for Pseudomonas, colonies were observed under UV light for typical yellow-green
fluorescence.

5: Rhizosphere hotspots: A home for PGPM
75
5.1.2.3 Solubilization of inorganic phosphates by PGPMs
5.1.2.3.1 Solid media culture
To investigate the ability of selected PGPMs to solubilize insoluble inorganic
phosphates, Deubel-Muromcev solid agar containing suspended precipitates of tri-
calcium phosphate (Ca3(PO4)2) (Ca-P) was prepared (Deubel, 1996; Muromcev 1958).
0.2 g K2SO4, 0.4 g MgSO4•7H2O, 20 g Purified agar (Oxoid, No. LP 0028) were
dissolved to a total volume of 1000 ml using deionized water. The pH of the solution
was adjusted to 6.9 using and then it was autoclaved (121°C, 20 min). After cooling
the solution to 60 °C, 10 g D (+) Glucose monohydrate (6887.1, Roth, Karlsruhe,
Germany) dissolved in 110 ml deionized water and 1 g L-Asparagine monohydrate
(11160, Fluka, Buchs, Germany) dissolved in 50 ml deionized water were added
(Solution A). To precipitate non-soluble Ca-P in the medium, 2.2 g CaCl2•2H2O
(2461.1000 Chem Solute Th.Geyer, Renningen, Germany) dissolved in 20 ml
deionized water and 3.8 g Na3PO4•12H2O (6578, E. Merck, Darmstadt, Germany)
also dissolved in 20 ml deionized water were each autoclaved (121°C, 20 min),
cooled down 60°C and simultaneously added to Solution A under continuous stirring
resulting in immediate clouding of the medium through the formation of Ca-P
(Ca3(PO4)2) (Eqn. 5.1)
Equation 5.1. Preparation of (Ca3(PO4)2)
3CaCl2.2H2O + 2Na3PO4.12H2O Ca3(PO4)2 + 6NaCl + 30H2O (Eqn. 5.1)
Between 40-45°C the medium was poured into petri dishes.
After solidification and cooling of the agar, suspensions of PGPMs in 2.5 mM CaSO4
(1 X 10⁴ CFU or spores ml-1) were inoculated and plates were incubated at 25 °C.

5: Rhizosphere hotspots: A home for PGPM
76
PGPMs included: (1) Penicillium sp. PK 112, (2) Pseudomonas sp. DSMZ 13134, (3)
Vitalin SP11 (combined product: Bacillus subtilis, Pseudomonas sp., Streptomyces
spp., natural humic acids and seaweed extract (Ascophyllum nodosum)) (Vitalin
Pflansengesundheit GmbH, Ober-Ramstadt, Germany), (4), Paenibacillus
mucilagenosus (ABiTEP GmbH, Berlin, Germany), (5) Bacillus amyloliquefaciens
FZB 42, (6). Trichoderman harzianum T-22.
Additionally, two other media were prepared in which instead of simultaneously
adding solutions of CaCl2•2H2O and Na3PO4•12H2O at 60 °C under stirring to
produce Ca-P precipitate, finely ground (< 1 mm Ø) rock phosphate (RP, 7.6 % P) or
sewage sludge ash (SA, 10.3 % P) was added at the rate of 0.3 g P l-1. RP was chosen
because it is an important low-cost sparingly-soluble inorganic P-fertilizer (the only
mineral P fertilizer allowed in organic farming) and SA was chosen as renewable low-
cost sparingly-soluble P fertilizer produced from waste recycling. Only Pseudomonas
sp. DSMZ 13134 was inoculated on RP and SA media.
After two days all petri dishes were observed for clarification of Ca-P, RP or SA
along streaks and then scanned on a dark background.
5.1.2.3.2 Liquid media culture
5.1.2.3.2.1 Treatments
Based on Deubel-Muromcev solid agar, liquid media with Ca-P was prepared by
simply omitting addition of agar to solidify the media. Two other liquid media were
prepared in which Ca-P was replaced by either rock phosphate (RP, 7.6 %) or sewage
sludge ash (SA, 10.3 %). For each of these media Ca-P, RP or SA was the only source
of P present. The liquid culture conditions, sample collection and preparation, and
analysis were based on methods described by (de Freitas et al. 1997). Treatments

5: Rhizosphere hotspots: A home for PGPM
77
included factorial combinations of three levels of sparingly soluble P fertilizers (Ca-
P, RP or SA) and four PGPM levels as microbial bio-effector (No bio-effector (No
BE), Pseudomonas sp. DSMZ 13134 (Pro); Bacillus amyloliquefaciens FZB42
(Rhiz); and Trichoderma harzianum T-22 (T-22). There were four replicates per
treatment.
5.1.2.3.2.2 Preparation of solutions
Using sterile deionized water (autoclaved at 121° C for 20 min), 0.2 g K2SO4 and 0.4
g MgSO4.7H2O were dissolved to 1000 ml and pH was adjusted 6.9 (Basal solution);
45.45 g D-Glucose was dissolved to 500 ml (Glucose); 4 g of L-Asparagine was
dissolved to 200 ml (L-Asparagine); 5.5 g CaCl2.2 H2O was dissolved to 50 ml
(CaCl2); 9.5 g Na3PO4.12H2O was dissolved to 50 ml (Na3PO4). 60 ml of Basal
solution was transferred into 100 ml Erlenmeyer flasks, autoclaved and then allowed
to cool down in a water bath to 80-90 °C. Glucose and L-asparagine were each heated
up to 70 °C in a water bath for 30 min. CaCl2 and Na3PO4 were each autoclaved and
allowed to cool down to room temperature.
5.1.2.3.2.3 Preparation liquid media
Each P form (Ca-P, RP and SA) was applied separately at the level of each
experimental unit (100 ml Schott Duran flak) ensuring 0.018 g P flask-1 because it
was impossible to pour the right quantity of P from a stock suspension into each 100
ml flask due to normal rapid sedimentation of P forms after suspension. 1.2 ml CaCl2
and 1.2 ml Na3PO4 were added to 60 ml Basal solution in each flask under continuous
stirring to evenly disperse the Ca-P precipitate formed. The total concentration of P
was 0.3 g l-1 and NaCl was 1.75 g l-1.
5: Rhizosphere hotspots: A home for PGPM
78
0.237 g (0.018 g P) RP (composition %: PTotal 7.6; PCitric acid 6.8; PNaHCO3 1.7; Al 1.4;
Ca 22.5; Fe 5.1; Si 7.7) or 0.174 g (0.018 g P) SA (composition %: PTotal 10.34; PCitric
acid 4.49; Al 9.9; Ca 8.6; Fe 4.2; composition ppm: Cd 4.2; Cr 90.8; Cu 814; Ni 78.5;
Pb 224; V 59.1; Zn 4004) was weighed with a semi/micro analytical balance (Mettler
AT261 DeltaRange, Mettler-Toledo GmbH, Giessen, Germany ) and added under
continuous stirring to 60 ml Basal solution. Total P concentration was also 0.3 g P l-1.
0.105 g of NaCl was added to each RP or SA flask to maintain the same NaCl
concentration in Ca-P flasks (1.75 g l-1.). In each Ca-P, RP or SA flask, 6.6 ml
Glucose and 3 ml L-asparagine was added and swelled to mix.
5.1.2.3.2.4 Inoculation and incubation
Using sterile 2.5 mM CaSO4, without PGPM (Control) or with the PGPMs:
Pseudomonas sp. DSMZ 13134, 6.6 X 10¹⁰ CFUs g-1 (Pro), Bacillus
amyloliquefaciens FZB42, 2.5 X 10¹⁰ Spores ml-1 (Rhiz) and Trichoderma harzianum
T-22, 1 X 10⁹ Spores g-1 (T-22) were each sequentially diluted to produce a
suspension of 1 X 10⁴ CFU or spores ml-1.
For the non-inoculated control, 2 ml of sterile 2.5 mM CaSO4 solution was added to
each flask. For each PGPM treatment, 2 ml inoculum suspension was added. All
flasks were randomly placed on two shelves in an incubator (GFL Typ 3032,
Gesselschaft für Labortechnik mbH, Burgwedel, Germany) in darkness at 30 °C. To
prevent sedimentation of Ca-P, RP or SA, the incubator was set to swell flasks
continuously horizontally at 125 rpm.
5.1.2.3.2.5 Measurements
After 65 hrs. of incubation, 10 ml sample of medium was collected from each flask
into a sterile 50 ml falcon tube after solids were allowed to settle. Tubes were

5: Rhizosphere hotspots: A home for PGPM
79
centrifuged at 5000xg for 15 min. and supernatants were carefully poured into 30 ml
polyethylene bottles and stored frozen (-18 °C). For further analysis, samples were
defrosted at room temperature, pH was measured (pH/Conductivity Meter, MPC227,
Metler Toledo) and they were filtered through P-free blue-band filter papers (MN 640
d) for later analysis of total P concentration by Inductively Coupled Plasma Optical
Emission Spectrometry (ICP-OES) ( L.A. Chemie, University of Hohenheim).
Acid and alkaline phosphatase activity in the samples were also measured. Based on a
modified p-nitrophenyl phosphate method ((Tabatabai and Bremner 1969), acid
phosphatase activity was measured by dephosphorylation of 0.1 ml 150 mM p-
nitrophenyl phosphate as substrate in a 1.5 ml Eppendorf tube containing 0.4 ml
buffer (200 mM Na-acetate buffer, pH 5.2 for acid phosphatase or 200 mM Na-borate
buffer, pH 8.2 for alkaline phosphatase), 0.4 ml deionized water and 0.1 ml liquid
culture supernatant sample by incubation at 30 °C under continuous shaking. For acid
phosphatase activity incubation was stopped after 30 minutes whereas for alkaline
phosphatase activity, it was stopped after 45 minutes because of weak coloration
observed at 30 minutes. To stop enzyme activity, 0.5 ml of 0.5 M NaOH was added
immediately after incubation. For controls or blanks, a second set of tubes containing
liquid media sample, buffer and was incubated as described above. After incubation,
NaOH was added followed by substrate p-nitrophenyl phosphate. Both sets of
samples and blanks were centrifuged (14000 rpm for 5 min.). About 800µl
supernatant was pipetted into a 1 ml disposable micro cuvette and measured for
absorbance of yellow coloration at 405 nm using p-nitrophenol (p-NP) standards
containing volumes of p-NP stock (20 µg ml-1), 500 µl 0.5 M NaOH and volumes of
deionized water to top up to 1.5 ml. p-NP standards included: 0, 2, 4, 8, 12, 16 and 20
µg p-NP ml-1).

5: Rhizosphere hotspots: A home for PGPM
80
5.1.2.4 Establishment of Pseudomonas sp. DSMZ13134 rhizosphere hotspots
The methodology for this experiment is fully described in (Nkebiwe et al.
2016b).Using a substrate composed of 80% loess ((PCAL, 5 mg kg−1; Ptotal, 332 mg
kg−1; pH (CaCl2), 7.6; CaCO3, 23.3%; Corg, <0.3 %; Ntotal 0.02 %))and 20% sand
filled in rhizoboxes as also described in section 2.1, maize (Zea mays L. var Colisee)
was grown to investigate the establishment of Pseudomonas sp. DSMZ13134 in
rhizosphere hotspots around NH4+-depots. The substrate was optimally supplied (kg-
1 soil DM) with 150 mg P (Ca(H2PO4)2), 150 mg K (K2SO4); 50 mg Mg (MgSO4);
20 µmol Fe, (Sequestrene138, 6 % Fe); 2.6 mg Zn (ZnSO4) and 1 mg Cu, (CuSO4).
Moisture content was 18% about 2400 g of substrate were filled into each rizobox (H
x W x D: 40 x 20 x 2 cm).
Treatments included two factorial combinations of two N levels: 100 mg NO3-N kg-1
soil as CaNO3 homogenously mixed in the substrate (NO3--Mixed) and 100 mg
NH4-N as concentrated 15N labelled stabilized (NH4)2SO4+DMPP (64 mg N ml-1)
placed as a depot 5x5 cm to the maize seed (NH4+-Depot) and two BE levels: non-
inoculated control (NoBE) and Pseudomonas sp. DSMZ13134 inoculated twice at 0
and 23 DAS each at the rate 1 x 10⁹ CFUs kg-1 soil by placing 2.5 cm around the
NH4+-depot or corresponding location for NO3
--Mixed treatments. The 15N-labelled
(NH4)2SO4 fertilizer solution was enriched using 15N-(NH4)2SO4 to10 atom %.
Concentration and contents of shoot N and P, shoot DM, rhizosphere pH, root length
density and root colonization of Pseudomonas sp. DSMZ13134 the NH4+-depot or
corresponding location for NO3--Mixed treatments as described in (Nkebiwe et al.
2016b). 15N signal of dried shoot biomass was measure by Isotope ratio mass
spectrometer (IRMS). During grinding of dried maize shoot samples, some

5: Rhizosphere hotspots: A home for PGPM
81
contamination of non labelled samples occurred by labelled ones. Nevertheless, large
differences in 15N signal between labelled and non labelled plants could be expected
because of the very high 15N labelling rate of the placed (NH4)2SO4+DMPP
fertilizer.
Results
5.1.3.1 Effect of background Nmin on root growth around subsurface NH4+-
depots
At 12 days after planting (dap), no root-growth towards the NH4+-depot was observed.
At 36 dap, root length (or length per unit surface area) 4 cm around the depot was
low, without differences across treatments (Fig. 5.1 A). At 4-8 cm around the depot,
root length was lower in soil with no background N fertilization (0 mg N kg-1) than in
those with 5, 20 and 60 mg N kg-1. At > 8 cm around the depot, it increased with
increasing background N from 0, 5 to 20 mg N kg-1 and then slightly decreased at 60
mg N kg-1. At 56 dap in the zone > 8cm around the depot, the same trend could be
observed (Fig. 5.1 B). Furthermore, there were no differences in root growth 0-4 cm
and 4-8 cm around the depot across treatments at 56 dap (Fig. 5.1 B and Fig. 5.2).
However, after washing away soil from the rhozoboxes, intense rooting induced by
the NH4+-depot in distant soil volumes with less toxic NH4
+ concentrations could be
observed across all background Nmin levels (Fig. 5.2).

5: Rhizosphere hotspots: A home for PGPM
82
Figure 5.1. Root length around the NH4+-depot at 36 (A) and 56 (B) days after
planting.
Different letters show significant difference between treatments (P < 0.05) (Mean ±
SEM, n = 4, One Way ANOVA, Tukey test, α=0.05). Bold letters: total root length;
small letters: root length within radial zones around the depot only if differences were
significant. Brown, yellow and green sections of bars represent root growth at radial
zones 0-4 cm, 4-8 cm and >8 cm from the depot respectively. Numbers within bars
represent root length per unit surface area on the rhizobox window (cm cm-2).
Figure 5.2. Phytotoxicity of concentrated NH4+ inhibited root growth in the
immediate surrounding of the depot and induced intense rooting in zones with
non-toxic NH4+ levels at 56 dap.

5: Rhizosphere hotspots: A home for PGPM
83
As expected, residual NO3-N in the bulk soil increased with increasing background N
fertilization from 0 to 60 mg N kg-1 whereas residual NH4-N was low and similar
across treatments (Fig. 5.3 A). Within the NH4+-depot, NO3-N levels were low
whereas NH4-N levels where high, with no differences across treatments (Fig. 5.3 B).
Figure 5.3. Residual Nmin in the bulk soil (A) and in the NH4+-depot (B) at 56
dap
Different letters show significant difference between treatments, if differences were
significant (P < 0.05) (Mean ± SEM, n = 4, One Way ANOVA, Tukey test, α=0.05).
Data for bulk soil NH4+-N and total Nmin was transformed by square roots. Block
letters: difference in total Nmin concentrations; small letters: difference in NH4+-N
concentrations. Yellow and green sections of bars represent NH4+-N and NO3
--N
concentrations respectively.
Shoot dry matter per rhizobox at background N fertilization of 20 mg N kg-1 (3.7 g)
was higher than those of 0 mg N kg-1 (2.9 g) and 5 mg N kg-1 (2.6 g) but not different
from that of 60 mg N kg-1 (3.4 g) (n =4, tukey test, P < 0.05).
5.1.3.2 PGPM tolerance to high N concentrations
For all strains of Trichoderma harzianum, mycelia diameter showed a tendency to
increase with increasing NH4-N concentrations from 0-10 mM, followed by a
decrease at 50 mM NH4-N. Mycelium diameter at 50 mM NH4-N was higher than the
one at 250 mM, which again was higher than the one at 1250 mM (Fig. 5.4).

5: Rhizosphere hotspots: A home for PGPM
84
Figure 5.4. Qualitative (A) and quantitative (B) comparison of growth of
Trichoderma harzianum T-50 on Malt extract peptone agar with increasing NH4-
N concentrations after 48 hrs.
Different letters show significant difference between treatments (P < 0.05) (Mean ±
SE, n=3, One Way ANOVA, Tukey test, α=0.05)
After one week, there was considerable growth at 1250 mM NH4-N for all T.
harzianum strains meanwhile the typical green centric ring indicating conidia
formation at maturity (Mendoza et al. 2015) could be seen only petri dishes with NH4-
N levels from 0–250 mM NH4-N.
Penicillium sp. PK 112 grew slower than Trichoderma. After one week the mycelium
diameter of Penicillium sp. PK 112 at 10 and 50 mM NH4-N were higher than those at
0 and 2 mM NH4-N. It increased from 2.53 cm at 0 mM NH4-N to 2.93 cm at 50 mM
NH4-N (P < 0.05), after which it showed a tendency to decrease to 2.87 cm at 250
mM NH4-N (no significant difference). Limited growth activity was observed at 1250
mM NH4-N.

5: Rhizosphere hotspots: A home for PGPM
85
For bacterial PGPMs, considerable growth could be observed at high NH4-N levels
after one week. For Pseudomonas sp. DSMZ 13134 colonies were circular, yellow,
smooth, glistening, entire and convex. The typical yellow pigment which was spread
outwards from each colony was intense and distinct only in agar containing 0-250
mM NH4-N. Colonies also showed typical yellow-green fluorescence under UV light.
On DEV medium, Bacillus amyloliquefaciens FZB42 formed distinct punctiform
colonies with typical spreading bio-films, which were less spread at 250 and 1250
mM NH4-N (Fig. 5.5). There were more B. amyloliquefaciens FZB42 colonies at 250
mM NH4-N (97) than at 0 mM (59) (P = 0.017) (Fig. 5.5). On nutrient agar, colonies
of B. amyloliquefaciens FZB42, B. atrophaeus, B. simplex R41 and Bacillus spec.
were less distinct and bio-films were also observed across all NH4-N concentrations.
Figure 5.5. Bacillus amyloliquefaciens FZB42 grown on DEV medium
Different letters show significant difference between treatments (P < 0.05) (Mean ±
SE, n=3, One way ANOVA, Tukey test, α=0.05)

5: Rhizosphere hotspots: A home for PGPM
86
For T. harzianum T-22 after 15 minutes pre-incubation of mycelium fragment in
NH4+±DMPP, NH4-N concentration (P=0.007) and presence of DMPP (P =0.015)
affected mycelium diameter without any interaction between factors (P=0.575).
Irrespective of the presence of DMPP, mycelium diameter at 3 M NH4-N (4.95 cm)
was less than the one at 0 M NH4-N (5.54 cm) (P=0.005); and irrespective of NH4-N
level, mycelium diameter with DMPP (5.16 cm) was less than the one without (5.44
cm) (P=0.015) (Fig 5.6). After 15 minutes pre-incubation in 0 and 0.1 M NH4-N,
Pseudomonas sp. DSMZ 13134 and B. amyloliquefaciens FZB42 showed growth
activity without any observable effect by DMPP. At 1 and 3 M NH4-N, growth of
both Pseudomonas sp. DSMZ 13134 and B. amyloliquefaciens FZB42 was
suppressed (more for Pseudomonas sp. DSMZ 13134) and normal morphological
colony characteristics where absent. Nevertheless, typical fluorescence under UV
light was observed for Pseudomonas sp. DSMZ 13134 and typical bio-film formation
was observed for B. amyloliquefaciens FZB42.

5: Rhizosphere hotspots: A home for PGPM
87
Figure 5.6. Mycelium diameter of Trichoderma harzianum T-22 affected by 15
minutes pre-incubation in NH4-N solution with or without DMPP
Block letters: difference between variants with DMPP and those without (significant
effect of DMPP P=0.015); Significant effect of NH4+ molarity (P=0.007); small
letters: tendency of difference between treatments (P=0.055) (Mean ± SE, n=4, One
and Two-way ANOVA, Tukey test, α=0.05)
After 24 hours pre-incubation of PGPM in 1 or 3M NH4-N solution with or without
DMPP, growth of T. harzianum T-22, Pseudomonas sp. DSMZ 13134 or Bacillus
amyloliquefaciens FZB42 was strongly suppressed.
5.1.3.3 Solubilization of inorganic phosphates by PGPMs
All tested PGPMs except T. harzianum T-22 were able to solubilize Ca-P by clarifying
the agar along PGPM streaks (Fig. 5.7 a-f). No visible changes could be observed
along streaks of Pseudomonas sp. DSMZ 13134 on RP or SA agar (Fig. 5.7 i).
Sedimentation of RP or SA at the bottom of the petri dishes (Fig. 5.7 g-h), suggested
lack of contact between growing Pseudomonas on the agar surface and RP or SA at
the bottom. This implied that liquid media cultures were more appropriate to test the
ability of PGPMs to solubilize RP and SA.

5: Rhizosphere hotspots: A home for PGPM
88
Figure 5.7. PGPMs clarified cloudy Ca-P precipitate but not rock phosphate
(RP) or sewage sludge ash (SA).
Cloudy Ca-P precipitate (Ca3(PO4)2) solubilized and clarified by Penicillium sp. PK
112 (a), Pseudomonas sp. DSMZ 13134 (b), Vitalin SP11 (combined product:
Bacillus subtilis, Pseudomonas sp., Streptomyces spp., natural humic acids and
seaweed extract (Ascophyllum nodosum)) (c), Paenibacillus mucilagenosus (d),
Bacillus amyloliquefaciens FZB 42 (e). But it was not solubilized by Trichoderma
harzianum T-22 (f). Growth of Pseudomonas sp did not lead to any visual changes
with RP (g) or SA (h). A piece of agar inverted to show SA sediment (i)
The pH of the media after 65 hours varied among and within treatments. In
comparison to the starting pH, there was a reduction in the pH of the nutrient medium
in the following treatments: Ca-P/Pro, RP, RP/Pro, RP/Rhiz, SA, SA/Pro, SA/Rhiz
and SA/T-22 (Fig. 5.8 a). The concentration of P in liquid media (Pconc.) was
decreasing in the following order: Ca-P/Pro, RP/Pro, RP/Rhiz, RP/T-22 and RP. Very
low Pconc.were measured in the other treatments (Fig. 5.8 b). For all treatments, pH
showed a significant negative correlation with Pconc. (P = 0.002; r = -0.47).
Increase in microbial biomass could be observed by the cloudy or murky appearance
of the media for Pro and Rhiz variants and a thick mesh of mycelium for T-22
variants.

5: Rhizosphere hotspots: A home for PGPM
89
There was also much variability in acid and alkaline phosphatase activity (Pase) among
and within treatments (Figure 5.8 c and d). pH or Pconc. did not correlate with acid or
alkaline phosphatase activity.
Figure 5.8. Change in pH (a), total P concentration (b) ), acid- (c) and alkaline-
phosphatase activity (d) in the liquid fraction of media 65 hours after onset of
incubation
Ca-P, Ca3(PO4)2; RP, rock phosphate; SA, sewage sludge ash; Pro, Pseudomonas sp.
DSMZ 13134; Rhiz, Bacillus amyloliquefaciens FZB42; T-22, Trichoderma
harzianum T-22. pH was inversely correlated to total P concentration (P = 0.002; r = -
0.47)
5.1.3.4 Establishment of Pseudomonas sp. DSMZ13134 rhizosphere hotspots
Placement of -labelled stabilized (NH4)2SO4 +DMPP had an effect on root length
density (RLD), and rhizosphere pH 5x5 cm to seeds, shoot 15N signal and shoot N and
P concentrations and contents at 55DAS. Inoculation of Pseudomonas sp.
DSMZ13134 had an effect on shoot 15N signal and shoot N concentrations (Table 5.2)
at 55DAS.

5: Rhizosphere hotspots: A home for PGPM
90
Table 5.2. RLD and rhizosphere pH 5x5 cm to seeds, shoot 15N signal, shoots Shoot N and P concentration and content, and shoot dry
matter, 55 days after sowing
Source of variation
RLD 5x5 cm
to seed (8 cm
radius) (cm
cm-3)
Rhizosphere
pH 5x5 cm
to seed (8 cm
radius)
δ15N (o/oo) 15N/14N N conc.
(% DM)
N content
(mg N
plant-1)
P conc.
(mg P g-1
DM)
P content
(mg P
plant-1)
Shoot DM
(g plant-1 )
LS Means N*BE 14NO3
--Mixed*NoBE 6.4 5.62 170 1.83 114.0 2.18 13.7 6.35 14NO3
--Mixed*Pro 6.2 5.89 148 2.22 130.1 2.32 13.6 5.91 15NH4
+-Depot*NoBE 10.5 4.41 25260 2.47 137.1 2.93 16.2 5.60 15NH4
+-Depot*Pro 9.9 4.55 21257 2.66 133.9 3.15 15.9 5.09
Standard error 0.68 0.13 831 0.13 4.69 0.146 0.62 0.420
Two-Way ANOVA
N <0.001*** <0.001*** <0.001*** 0.002 ** 0.014* <0.001*** 0.002 ** NS 14NO3
- 6.3 5.75 159 2.03 b 122.0 b 2.52 b 13.6 b 6.13 15NH4
+ 10.2 4.48 23259 2.57 a 135.5 a 3.04 a 16.0 a 5.35
BE NS NS 0.036 0.051 NS NS NS NS
NoBE 8.4 5.01 12715 2.15 125.7 2.56 15.0 5.97
Pro 8.0 5.22 10702 2.44 132.0 2.73 14.7 5.50
N * BE NS NS NS NS NS NS NS
P values are in italics; NS, no significant difference, P ≥ 0.1; P < 0.1 is bold; * P < 0.5; ** P< 0.01; *** P< 0.001; Means not sharing the same
letters are significantly different from each other, Tukey test α = 0.05; Factors and interaction is bold; 14NO3-, non-isotopically labelled
Ca(NO3)2 homogenously mixed in substrate; 15NH4+, 15N-labelled stabilized (NH4)2SO4 +DMPP placed in substrate as a depot; BE, bio-
effector; NoBE, no bio-effector; Pro, Pseudomonas sp. DSMZ 13134. ANOVA on δ15N (o/oo) 15N/14N was performed on square root
transformed data. RLD, root length density

5: Rhizosphere hotspots: A home for PGPM
91
More fluorescent Pseudomonas could be recovered from the soil zone 5 x 5 cm to seed (8 cm
radius) in the NH4+-Depot than treatment than in NO3
--Mixed treatment. (Fig. 5.9)
Figure 5.9. Root colonization by fluorescent Pseudomonas sp. 5 x 5 cm to seed (8 cm
radius)
NO3--Mixed, Ca(NO3)2 homogenously mixed in substrate; NH4
+-Depot, stabilized
(NH4)2SO4 placed in substrate as a depot; BE, bio-effector; NoBE, no bio-effector; BE1,
Pseudomonas sp. DSMZ 13134, (t-test, P = 0.045)
Discussion
Root growth within the NH4+-depot was strongly inhibited most likely due to the presence of
high phytotoxic levels of NH4+, as confirmed by Nmin analysis of depot soil. Alternatively,
root length per unit area on the rhizobox window was calculated. During the growth period,
root length increased in all radial zones around the NH4+-depot. During early growth stages,
root length in all zones towards the depot increased with increasing background Nmin from 0
to 20 mg N kg-1 only. This was likely because at low background Nmin levels during early
growth stages, N supply to shallow root systems was inadequate for optimal root growth
towards the depot. Localized root growth around the depot increased at later growth stages
when the expanding N-rich boarder areas of the NH4+-depot became accessible as N
progressively diffused outwards from the depot. This suggests that to optimally supply plants

5: Rhizosphere hotspots: A home for PGPM
92
with N especially during early growth stages, it is effective to place starter N fertilizer closer
to seeds (about 5 cm below) to ensure rapid roots access(Nkebiwe et al. 2016a). However, in
case of considerable nutrient mobility from depot to seeds, it is advisable to place starter N
farther from seeds to avoid harmful osmotic effects and ion toxicity (Niehues et al. 2004). At
56 dap, differences in root length occurred only in the zone > 8 cm, in which root growth was
also most intense. Increasing root length in all radial zones around the depot with time and
with increasing background Nmin from 0 – 20 mg N kg-1 suggest that moderate N availability
in the bulk soil favored initial root growth and subsequent root growth intensification around
the NH4+-depot. Given very high NH4-N levels in the depot, the high background N level of
60 mg N kg-1 may have led to N toxicity effects resulting in reduced overall root and shoot
growth.
Although background N fertilization was with an NH4-N share of 50%, only traces of NH4-N
could be measured in the bulk soil after 56 days. This showed that rapid nitrification of NH4-
N applied in the bulk soil occurred, resulting in residual Nmin with an NH4-N share of only 2.4
% (60 mg N kg-1) to 11.9 % (5 mg N kg-1). This can be partially explained by the absence of a
nitrification inhibitor (NI) in the NH4NO3 used for bulk soil N fertilization. However, in soil
without background N fertilization (0 mg N kg-1), low Nmin levels (2.8 mg NO3-N kg-1 and
0.87 mg NH4-N kg-1) could be measured in the bulk soil with a low NH4-N share of 23.7%,
suggesting diffusion of N from the depot into the bulk soil as NH4+ as well as NO3
- after
nitrification. In the treatments 5, 10, 20 and 60 mg N kg-1, bulk soil NH4-N concentrations
were similar to the one in the treatment without background N fertilization (0 mg N kg-1) after
the growth period. This confirmed that bulk soil NH4+ at the end of the growth period partially
originated from the stabilized NH4+-depot directly by diffusion of NH4
+.
Given the small substrate volume of the depot, the low clay and organic matter content of the
loess-dominated substrate, the high moisture content of the substrate and high quantity of

5: Rhizosphere hotspots: A home for PGPM
93
NH4+ that was placed, NH4
+ must have considerably diffused out of the initial depot boarders
after sites for NH4+-fixation became exhausted. This explanation is supported by the wide
zones around the initial depot boarders with little or no root growth likely due to presence of
phytotoxic NH4+ levels. This is further proven by the strong decrease in the NH4-N
concentration within the depot from the estimated rate of 78.4 mg g-1 soil (estimated
placement rate 1 g NH4+-N to 5 cm3 depot soil volume (2.5 cm Ø x 2cm depth, bulk density,
1.3 g cm-3)) at the start of the experiment to the measured concentration of 0.18 mg NH4-N g-1
after 56 days.
Despite considerable diffusion of NH4+ from the depot into the bulk soil during the
experiment, low residual NH4+ concentrations measured in the bulk soil after 56 days may be
explained by nitrification after diffusion of NH4+ out of the phytotoxic zones surrounding the
depot resulting in NO3--formation with the outcome of even faster diffusion than NH4
+
(Barber 1984; Nkebiwe et al. 2016a). High residual NH4+ concentrations in the depot (0.18
mg NH4-N g-1) at the end of the growth period showed that high concentrations of (NH4)2SO4
+ DMPP in a subsoil depot inhibits biological nitrification of the placed NH4+ by both toxicity
effects of high NH4+ concentrations and presence of DMPP (Shaviv 1988; Sommer 2005;
Zerulla et al. 2001). This enabled placed N to persist in the depot zone as root growth
stimulating and root attracting NH4+. Therefore, intense localized root-growth could be
observed around a subsurface fertilizer-depot based on high concentrations of NH4+ stabilized
with DMPP, which led to higher N and P concentrations and contents in maize shoots (Zea
mays L.) in comparison to variants with homogenously incorporated NO3--fertilizer(Nkebiwe
et al. 2016b).
This study also showed that soil zones around NH4+-depots with high root densities may be
sites for effective root colonization by inoculated PGPMs. Growing PGPMs may be
supported by the presence of organic C and N sources for growth and activity of rhizosphere

5: Rhizosphere hotspots: A home for PGPM
94
dwelling microorganisms released as root exudates (Bonkowski et al. 2000; Lugtenberg and
Kamilova 2009; van Overbeek and van Elsas 1995; van Veen et al. 1997), which may be
present in high concentrations in densely rooted soil.
All tested fungal and bacterial PGPMs showed normal or improved growth activity on solid
nutrient agar containing as high as 50 mM NH4-N and slightly inhibited growth at 250 mM
NH4-N except for B. amyloliquefaciens FZB42 and Penicillium sp. PK 112. In contrast to
plant and animal cells, bacteria preferentially use NH4+ as a source of N and can be tolerant
even to molar concentrations of NH4-N, at which point growth limiting effects may be related
more to osmotic or ionic imbalances than to direct toxic effects of NH4+ ions per se (Müller et
al. 2006).
The threshold concentration range of 50-250 mM NH4-N at which cultured PGPMs showed
inhibited growth is above the range for NH4+ toxicity in sensitive crop species like barley
(Hordeum vulgare L.) and tolerant ones like rice (Oryza sativa L.) grown hydroponically
(Chen et al. 2013; Coskun et al. 2013; Esteban et al. 2016). The NH4+ tolerance threshold for
our tested PGPMs (50-250 mM NH4-N) range is also above the range of 2–20 mM that can be
common in soil solution of most agricultural soils (Britto and Kronzucker 2002). The
threshold range NH4+ tolerance of tested PGPMs (50-250 mM NH4-N) is also above the NH4-
N concentrations that can be measured in soil solution extracted by centrifuging soil samples
collected a few centimeters from a subsurface NH4+-fertilizer band (<0.001-37 mM NH4-N
and 0.4 - 91 mM NH4-N from a distance 4-2 cm to a fertilizer band of (NH4)2S04) and di-
ammonium phosphate respectively, after 5 days of contact of bands with soil, for tests on 5
different soil types) (Moody et al. 1995a; Moody et al. 1995b).
Furthermore, all tested PGPMs showed limited growth activity at the very high NH4-N level
of 1250 mM, which could be explained by osmotic and ionic imbalances as proposed earlier.

5: Rhizosphere hotspots: A home for PGPM
95
After 15 minutes pre-incubation of inoculum suspended in 0–3 M NH4-N, growth of T.
harzianum T-22 was slightly inhibited in the presence of DMPP meanwhile for Pseudomonas
sp. DSMZ 13134 and B. amyloliquefaciens FZB42 after pre-incubation in 0–0.1M NH4-N,
growth activity was not affected by DMPP. After 24 hours pre-incubation in 1–3 M NH4-N
solution with or without DMPP, normal growth activity of PGPMs on solid media could no
longer be achieved. This suggests that PGPMs may not be applied directly into a concentrated
NH4+-fertilizer solution (> 50 mM NH4-N). Alternatively, PGPMs should be inoculated in soil
zones with lower NH4-N levels in the border regions of a concentrated toxic ammonium
(Nkebiwe et al. 2016b) or directly into the NH4+-fertilizer solution if it is less concentrated.
The classical test for P-solubilization on solid Ca-P media confirmed that all the tested
PGPMs except Trichoderma harzianum T-22 were capable to solubilize inorganic P. On solid
media culture, Pseudomonas sp. DSMZ 13134 effectively solubilized Ca-P whereas it led to
no observable changes after growth on agar with rock phosphate (RP) or sewage sludge ash
(SA). However, in liquid media cultures, Pseudomonas sp. DSMZ 13134, Bacillus
amyloliquefaciens FZB42 and Trichoderma harzianum T-22 solubilized RP more than SA.
Best performing PGPMs were Pseudomonas sp. DSMZ 13134 and B. amyloliquefaciens
FZB42. Increase in microbial biomass, especially for T. harzianum T-22, suggested that the P
concentrations measured in cell-free culture media filtrates represented underestimations of
the P-solubilizing potential of tested PGPMs because measured P concentrations did not
account for solubilized P that was subsequently immobilized in microbial biomass of T.
harzianum T-22 (Altomare et al. 1999). Inoculation of T-22 did not result in considerable
acidification of the Ca-P medium. Similarly to the results described by (Altomare et al.
1999)(2µg P ml-1 at pH 5, 48 hrs. incubation of medium containing 0.16 g RP-P l-1),
inoculation of T-22 resulted in acidification of the RP medium, however, it did not lead to

5: Rhizosphere hotspots: A home for PGPM
96
high P concentrations in media filtrates (35.7µg P ml-1 at pH 5.7-7.4, 65 hrs. incubation
containing 0.3 g RP-P l-1). This can also be explained by immobilization of solubilized PO43-
in the dense T-22 mycelium that was observed. Low pH values were measured in SA media
with or without inoculated PGPM which corresponded to low P concentrations in media
filtrates. In addition to immobilization of solubilized PO43- in microbial biomass, low P
concentrations in SA medium despite low medium pH may be explained by fixation of PO43-
by Al3+ and Fe3+ which may be available at low pH conditions given the high SA
concentrations of Al (9.9%, 0.29 g SA-Al l-1) and Fe (4.2%, 0.12 g SA-Fe l-1). This
explanation supports the observation that P concentrations increased with decreasing pH in
the RP medium because RP had a much lower concentrations of Al (1.4%, 0.06 g RP-Al l-1)
and about the same concentration of Fe (5.1 %, 0.20 g RP-Fe l-1) as the SA medium. We
recorded pH values as low as 3.7 in cell-free filtrates of culture media inoculated with
Pseudomonas sp. DSMZ 13134 or B. amyloliquefaciens FZB42. This suggested that
acidification by release of protons and/or low molecular weight organic acids as reported by
(Altomare et al. 1999; Cunningham and Kuiack 1992; García-López et al. 2016; Goldstein
1995; Pérez et al. 2007) may have been the likely mode of action to solubilize the inorganic P
forms. This argument is supported by the significant negative correlation between pH and P
concentration in the media (P = 0.002; r = -0.47). For liquid media with RP only, the
correlation was even stronger (P < 0.0001; r = -0.84). Similarly to pH and total P
concentration, there was high variability in acid and alkaline phosphatase activity within and
between treatments. Measured acid and alkaline phosphatase activities may only be regarded
as an indicator of the turnover or mineralization of organic P and not as a marker for
solubilization of inorganic P. For the RP medium, there was a positive correlation between P
concentration and phosphatase activity (P = 0.015; r = -0.77). Nevertheless, solubilization of
inorganic P by various PGPMs in in vitro cultures does not guarantee improved P acquisition

5: Rhizosphere hotspots: A home for PGPM
97
and yield of plants in soil systems containing inorganic P and inoculated with a P-solubilizing
PGPM (García-López et al. 2016). Bashan et al. (2013) criticized the common use of Ca-P
solubilization tests as a universal test to identify potential P-solubilizing microorganisms
across different soil types. To increase the chance of obtaining candidates PGPMs that can
actually contribute to P nutrition of plants grown in natural soil systems, it may be more
appropriate in future experiments, to test solubilization of Ca-P or rock phosphate with
PGPMs isolated from alkaline soils; Fe- and Al-bound-PO43- those from acid soils; and
phytate with those from soils rich in organic matter (Bashan et al. 2013).
Several mechanisms for PGPMs to directly or indirectly improve acquisition of nutrients in
soil by crop plants such as root-growth stimulation, nutrient solubilization and mineralization,
and induction of resistance to biotic and abiotic stresses have been clearly described already
(Altomare et al. 1999; Barea et al. 2002; Bonkowski et al. 2000; Jiang et al., 2012; Jones and
Oburger, 2011; Lugtenberg and Kamilova 2009; Mavrodi et al. 2012; Mohite 2013;
Richardson et al. 2009; Singh and Satyanarayana 2012; Vassilev et al. 2006)).
Sometimes, promised beneficial effects of several commercially available PGPMs are not
realized even in controlled greenhouse conditions (Schenck zu Schweinsberg-Mickan and
Müller 2009) or in the field (Lugtenberg and Kamilova 2009).This may be explained by rapid
the decline in PGPM populations often observed after inoculation in natural soil due to
competition for nutrients, predation by other soil organisms or other unfavorable biotic or
abiotic factors (van Veen et al. 1997).
In our rhizobox experiment, placement of 15N-labelled stabilized (NH4)2SO4+DMPP as a
depot led to formation of intense localized root growth around the depot (rhizosphere
hotspot), which in turn led to improved N-uptake as shown by higher shoot N concentration,

5: Rhizosphere hotspots: A home for PGPM
98
15N signal and N content compared to plants under homogenous supply of NO3-. Placement of
the NH4+-depot also led to rhizosphere acidification, which together dense localized root
growth led to higher shoot P concentration and content than in plants under homogenous
supply of NO3-. Inoculation of Pseudomonas sp. DSMZ13134 in soil zones in which
rhizosphere hotspots developed in response to placed root-attracting NH4+-depots promoted
the establishment of fluorescent Pseudomonas (Nkebiwe et al. 2016b). Inoculation of
Pseudomonas sp. DSMZ13134 showed a trend to improve shoot N concentration and content
and shoot P concentration when compare to the non-inoculated control.
A possible explanation is that inoculated Pseudomonas may be supported by the presence of
high concentrations of organic nutrients released as exudates in densely rooted soil. Improved
rhizosphere-colonization of maize roots (Zea mays L.) around an NH4+-depot by rifampicin-
resistant Bacillus amyloliquefaciens FZB42 has also been observed in a pot experiment
(Mohammad et al., 2016, unpublished master thesis, Nutritional Crop Physiology, University
of Hohenheim).
In addition to inoculating PGPMs in NH4+-based rhizosphere hotspots, inoculation of PGPM
strains that are adapted or compatible to specific soil properties (Bashan et al. 2013; Zahir et
al. 2009), utilization of suitable nutrient additives, carrier materials and inoculation techniques
may increase their survival rates of PGPMs after inoculation in soil (van Veen et al. 1997;
Marschner, 2012).
Conclusions
Placement of a highly concentrated subsurface NH4+-depot induced the formation of
rhizosphere hotspots with intense rooting around the depots. At high bulk soil Nmin, localized
root growth around the concentrated NH4+-depot may be reduced possibly because of NH4
+-
toxicity effect on root growth. PGPMs that readily solubilized sparingly soluble inorganic

5: Rhizosphere hotspots: A home for PGPM
99
PO43- showed considerable tolerance to high NH4
+ concentrations that are comparable to those
in soil surrounding a concentrated subsurface NH4+-depot. Among investigated NH4
+-tolerant
PGPMs, rhizosphere hotspot establishment of Pseudomonas sp. DSMZ13134 was tested by
inoculating it in soil around NH4+-depots in rhizobox-grown maize (Zea mays L.) resulting in
improved establishment of Pseudomonas sp in NH4+-depot soil in comparison to soil with
homogenous supply of NO3-.

5: Rhizosphere hotspots: A home for PGPM
100
References
Altomare, C., Norvell, W. A., Björkman, T., Harman, G. E. (1999): Solubilization of
phosphates and micronutrients by the plant-growth-promoting and biocontrol fungus
Trichoderma harzianum Rifai 1295-22. Appl. Environ. Microbiol. 65, 2926–2933.
Barber, S. A. (1984): Soil nutrient bioavailability. A mechanistic approach. Wiley, New York.
Barea, J. M., Toro, M., Orozco, M. O., Campos, E., Azcon, R. (2002): The application of
isotopic (32P and 15N) dilution techniques to evaluate the interactive effect of phosphate-
solubilizing rhizobacteria, mycorrhizal fungi and Rhizobium to improve the agronomic
efficiency of rock phosphate for legume crops. Nutr. Cycl. Agroecosys. 63, 35–42,
Bashan, Y., Kamnev, A. A., de-Bashan, L. E. (2013): Tricalcium phosphate is inappropriate as
a universal selection factor for isolating and testing phosphate-solubilizing bacteria that
enhance plant growth: a proposal for an alternative procedure. Biol.Fert. Soils 49, 465–
479.
Bonkowski, M., Cheng, W., Griffiths, B. S., Alphei, J., Scheu, S. (2000): Microbial-faunal
interactions in the rhizosphere and effects on plant growth. Eur. J. Soil Biol. 36, 135–
147.
Britto, D. T., Kronzucker, H. J. (2002): NH4+ toxicity in higher plants: a critical review. J.
Plant Physiol. 159, 567–584.
Chen, G., Guo, S., Kronzucker, H. J., Shi, W. (2013): Nitrogen use efficiency (NUE) in rice
links to NH4+ toxicity and futile NH4cycling in roots. Plant Soil 369, 351–363.
Clarke, A. L., Barley, K. P. (1968): The uptake of nitrogen from soils in relation to solute
diffusion. Aust. J. Soil Res. 6, 75–92.
Coskun, D., Britto, D. T., Li, M., Becker, A., Kronzucker, H. J. (2013): Rapid ammonia gas
transport accounts for futile transmembrane cycling under NH3/NH4+ toxicity in plant
roots. Plant Physiol. 163, 1859–1867.
Cunningham, J. E., Kuiack, C. (1992): Production of citric and oxalic acids and solubilization
of calcium phosphate by Penicillium bilaii. Appl. Environ. Microb. 58, 1451–1458.
de Freitas, J. R., Banerjee, M. R., Germida, J. J. (1997): Phosphate-solubilizing rhizobacteria
enhance the growth and yield but not phosphorus uptake of canola (Brassica napus L.).
Biol. Fertil. Soils 24, 358-364.
Deubel, A. (1996): Einfluß wurzelbürtiger organischer Kohlenstoffverbindungen auf
Wachstum und Phosphatmobilisierungsleistung verschiedener Rhizosphärenbakterien.
Dissertation., Martin-Luther-Universität, Halle-Wittenberg, Germany.
Drew, M. C. (1975): Comparison of the effects of a localised supply of phosphate, nitrate,
ammonium and potassium on the growth of the seminal root system, and the shoot, in
barley. New Phytol. 75, 479–490.
Esteban, R., Ariz, I., Cruz, C., Moran, J. F. (2016): Review: Mechanisms of ammonium
toxicity and the quest for tolerance. Plant Science 248, 92–101,
Federolf, C.-P., Westerschulte, M., Olfs, H.-W., Broll, G., Trautz, D. (2016): Enhanced
nutrient use efficiencies from liquid manure by positioned injection in maize cropping
in northwest Germany. Eur. J. Agron. 75, 130–138,
García-López, A. M., Avilés, M., Delgado, A. (2016): Effect of various microorganisms on
phosphorus uptake from insoluble Ca-phosphates by cucumber plants. J. Plant Nutr.
Soil Sci. 179, 454–465.

5: Rhizosphere hotspots: A home for PGPM
101
Goldstein, A. H. (1995): recent progress in understanding the molecular genetics and
biochemistry of calcium phosphate solubilization by gram negative bacteria. Biol.
Agric. Hortic. 12, 185–193,
Gross, K. L., Peters, A., Pregitzer, K. S. (1993): Fine root growth and demographic responses
to nutrient patches in four old-field plant species. Oecologia 95, 61–64,
Jiang, Y., Wu, Y., Xu, W., Cheng, Y., Chen, J., Xu, L., Hu, F., Li, H. (2012): IAA-producing
bacteria and bacterial-feeding nematodes promote Arabidopsis thaliana root growth in
natural soil. Eur. J. Soil Biol. 52, 20–26.
Jing, J., Zhang, F., Rengel, Z., Shen, J. (2012): Localized fertilization with P plus N elicits an
ammonium-dependent enhancement of maize root growth and nutrient uptake. Field
Crop. Res. 133, 176–185.
Jones, D., L., Oburger, E. (2011): Solubilization of phosphorus by soil microorganisms, in
Bünemann, E., Oberson, A., Frossard, E.: Phosphorus in Action. Biological Processes in
Soil Phosphorus Cycling. Springer-Verlag, Berlin, Germany, pp. 169–198.
Lamb, E. G., Haag, J. J., Cahill, J. F. (2004): Patch–background contrast and patch density
have limited effects on root proliferation and plant performance in Abutilon theophrasti.
Funct. Ecol. 18, 836–843.
Lugtenberg, B., Kamilova, F. (2009): Plant-Growth-Promoting Rhizobacteria. Annu. Rev.
Microbiol. 63, 541–556.
Marschner, P. (2012): Rhizosphere Biology, in Marschner P.: Marschner’s Mineral Nutrition
of Higher Plants, Third edition, Academic Press, Elsevier, Amsterdam, pp. 369–388.
Mavrodi, O. V., Walter, N., Elateek, S., Taylor, C. G., Okubara, P. A. (2012): Suppression of
Rhizoctonia and Pythium root rot of wheat by new strains of Pseudomonas. Biol.
Control 62, 93–102.
Mendoza, J. L. H., Pérez, M. I. S., Prieto, J. M. G., Velásquez, J. D. Q., Olivares, J. G. G.,
Langarica, H. R. G. (2015): Antibiosis of Trichoderma spp strains native to
northeastern Mexico against the pathogenic fungus Macrophomina phaseolina. Braz. J.
Microbiol. 46, 1093–1101.
Miller, M. H., Ohlrogge, A. J. (1958): Principles of nutrient uptake from fertilizer bands 1.
Effect of placement of nitrogen fertilizer on the uptake of band-placed phosphorus at
different soil phosphorus levels1. Agron. J. 50, 95–97.
Mohite, B. (2013): Isolation and characterization of indole acetic acid (IAA) producing
bacteria from rhizospheric soil and its effect on plant growth. J. Soil Scie. Plant Nutr.
13, 638–649.
Moody, P. W., Aitken, R. L., Yo, S. A., Edwards, D. G., Bell, L. C. (1995a): Effect of banded
fertilizers on soil solution composition and short-term root-growth .1. Ammonium-
sulfate, ammonium-nitrate, potassium-nitrate and calcium nitrate. Soil Res. 33, 673–
687.
Moody, P. W., Edwards, D. G., Bell, L. C. (1995b): Effect of banded fertilizers on soil solution
composition and short-term root-growth .2. Mono-ammonium and di-ammonium
phosphates. Soil Res. 33, 689–707.
Müller, T., Walter, B., Wirtz, A., Burkovski, A. (2006): Ammonium toxicity in bacteria. Curr.
Microbiol. 52, 400–406.
Muromcev, G. S. (1958): Die lösende Wirkung einiger Wurzel-und Bodenmikroorganismen
auf die wasserunlöslichen Kalziumphosphate (russ.). Agrobiologija 5, 31–36.

5: Rhizosphere hotspots: A home for PGPM
102
Niehues, B. J., Lamond, R. E., Godsey, C. B., Olsen, C. J. (2004): Starter nitrogen fertilizer
management for continuous no-till corn production contribution no. 04-099-J, K-State
Research and Extension. Agron. J. 96, 1412–1418.
Nkebiwe, P. M., Weinmann, M., Bar-Tal, A., Müller, T. (2016a): Fertilizer placement to
improve crop nutrient acquisition and yield: A review and meta-analysis. Field Crops
Res. 196, 389–401,
Nkebiwe, P. M., Weinmann, M., Müller, T. (2016b): Improving fertilizer-depot exploitation
and maize growth by inoculation with plant growth-promoting bacteria: from lab to
field. Chem. Biol Technol. Agric. 3, 1–16.
Panda, B., Rahman, H., Panda, J. (2016): Phosphate solubilizing bacteria from the acidic soils
of Eastern Himalayan region and their antagonistic effect on fungal pathogens.
Rhizosphere, Available online 6 August 2016, ISSN 2452-2198,
http://dx.doi.org/10.1016/j.rhisph.2016.08.001.
Pang, P. C., Hedlin, R. A., Cho, C. M. (1973): Transformation and movement of band-applied
urea, ammonium sulfate, and ammonium hydroxide during incubation in several
Manitoba soils. Can. J. Soil. Sci. 53, 331–341.
Pérez, E., Sulbarán, M., Ball, M. M., Yarzábal, L. A. (2007): Isolation and characterization of
mineral phosphate-solubilizing bacteria naturally colonizing a limonitic crust in the
south-eastern Venezuelan region. Soil Biol. Biochem. 39, 2905–2914.
Richardson, A., Barea, J.-M., McNeill, A., Prigent-Combaret, C. (2009): Acquisition of
phosphorus and nitrogen in the rhizosphere and plant growth promotion by
microorganisms. Plant Soil 321, 305-339.
Schenck zu Schweinsberg-Mickan, M., Müller, T. (2009): Impact of effective microorganisms
and other biofertilizers on soil microbial characteristics, organic-matter decomposition,
and plant growth. J. Plant Nutr. Soil Sci. 172, 704–712.
Schenk, M. K., Barber, S. A. (1979): Phosphate uptake by corn as affected by soil
characteristics and root morphology. Soil Sci. Soc. Am. J. 43, 880–883.
Shakir, M. A., Bano, A., Arshad, M. (2012): PGPR with ACC deaminase confer drought
tolerance wheat. Soil Environ. 31, 108–112.
Shaviv, A. (1988): Control of nitrification rate by increasing ammonium concentration. Fert.
Res. 17, 177-188.
Singh, B., Satyanarayana, T. (2012): Plant growth promotion by phytases and phytase-
producing microbes due to amelioration in phosphorus availability, in Satyanarayana,
T., Johri, N. B.: Microorganisms in Sustainable Agriculture and Biotechnology.
Springer Netherlands, Dordrecht, pp. 3–15.
Sommer, K. (2005): CULTAN-Düngung: physiologisch, ökologisch, ökonomisch optimiertes
Düngungsverfahren für Ackerkulturen, Grünland, Gemüse, Zierpflanzen und
Obstgehölze. Verlag Th. Mann, Gelsenkirchen-Buer, Germany.
Tabatabai, M. A., Bremner, J. M. (1969): Use of p-nitrophenyl phosphate for assay of soil
phosphatase activity. Soil Biol. Biochem. 1, 301–307.
van Overbeek, L. S., van Elsas, J. D. (1995): Root exudate-induced promoter activity in
Pseudomonas fluorescens mutants in the wheat rhizosphere. Appl. Environ. Microb. 61,
890–898.
van Veen, J. A., van Overbeek, L. S., van Elsas, J. D. (1997): Fate and activity of
microorganisms introduced into soil. Microbiol. Mol. Biol. R. 61, 121–135.

5: Rhizosphere hotspots: A home for PGPM
103
Vassilev, N., Vassileva, M., Nikolaeva, I. (2006): Simultaneous P-solubilizing and biocontrol
activity of microorganisms: potentials and future trends. Appl. Microbiol. Biot. 71, 137–
144.
Zahir, Z. A., Ghani, U., Naveed, M., Nadeem, S. M., Asghar, H. N. (2009): Comparative
effectiveness of Pseudomonas and Serratia sp. containing ACC-deaminase for
improving growth and yield of wheat (Triticum aestivum L.) under salt-stressed
conditions. Arch. Microbiol. 191, 415–424.
Zerulla, W., Barth, T., Dressel, J., Erhardt, K., Horchler von Locquenghien, K., Pasda, G.,
Rädle, M., Wissemeier, A. (2001): 3,4-Dimethylpyrazole phosphate (DMPP) - a new
nitrification inhibitor for agriculture and horticulture. Biol. Fert. Soils 34, 79–84.

6: Improving fertilizer-depot exploitation by PGPM
104
6 Improving fertilizer-depot exploitation and maize growth by inoculation with plant
growth-promoting bacteria – from lab to field
Peteh M Nkebiwe1§, Markus Weinmann 2*, Torsten Müller1*
1Fertilisation and Soil Matter Dynamics (340 i), University of Hohenheim, 70593 Stuttgart,
Germany
2Nutritional Crop Physiology (340 h), University of Hohenheim, 70593 Stuttgart, Germany
*These authors contributed equally to this work
§Corresponding author
Email addresses:
PMN: [email protected]
Original article published in: Chemical and Biological Technologies in Agricultur (2016),
Volume 3 (1):15, DOI: http://dx.doi.org/10.1186/s40538-016-0065-5
Reprinted from Chemical and Biological Technologies in Agriculture, Nkebiwe, P. M.,
Weinmann M. & Müller, T. (2016). Improving fertilizer-depot exploitation and maize growth
by inoculation with plant growth-promoting bacteria – from lab to field, 3(1):15, DOI:
http://dx.doi.org/10.1186/s40538-016-0065-5 with kind permission from Springer
International Publishing.

6: Improving fertilizer-depot exploitation by PGPM
105
6.1 Abstract
Among other responses, plants tend to increase root growth to scavenge nutrients from more
soil when soil nutrient concentrations are low. Placement of fertilizers near seeds or roots
facilitates nutrient acquisition by target crop plants. Nevertheless, nutrient uptake from soil-
placed fertilizer-depots depends on increased uptake rates and efficient spatial exploitation of
the depot by roots. The aim of our study was to optimize exploitation of subsurface fertilizer-
depots by inoculating the depot-zone with promising plant growth-promoting microorganisms
(PGPMs) as bio-effectors. If included in depots, root-attracting NH4+ or HPO4
2-/ H2PO4- ions
may also enhance rooting within the depot, which in turn, improves survival and root-
colonization by inoculated PGPMs; a consequence of high levels of microbial nutrients
exuded in densely rooted soil. We tested maize (Zea mays L.) in two greenhouse (pot and
rhizobox) and two field experiments (2014 and 2015). A core treatment was NH4+-fertilizer
placed as a subsurface depot (Depot). In the field, there was also NH4+-fertilizer broadcasted
and incorporated in soil (Broad.). Depot and Broad. were each with PGPM as bio-effector
(BE) or without (NoBE). Bio-effectors included: Pseudomonas sp. DSMZ 13134 (Pro) and
Bacillus amyloliquefaciens FZB42 (Rhiz, only in field trials). In pots, Depot with Pro led to
59% higher shoot dry matter, 50% higher shoot N content and 64% higher shoot P content
than without PGPM. In rhizoboxes, higher root length density (RLD), lower rhizosphere pH
and higher Pro-colonization rate were measured in the fertilizer depot compared to the
corresponding zone for controls with homogenous NO3- supply. Depot led to higher shoot N
and P concentrations (+26.6% N; +20.6% P) and contents (+11.1% N; +17.6% P) than
control. Pro led to higher shoot N concentration (+13.5 %) than NoBE.
In the field, fertilizer-depot soil had higher RLD than corresponding non-depot soil. Pro led to
doubled fertilizer-depot RLD in comparison to without (2014). In 2014, Depot led to 7.4%
higher grain yield than Broad (not statistically significant) whereas BE broadcast had no
effect. In 2015, Depot led to 5.8% higher fresh shoot biomass than Broad., below-seed
placement of Pro led to higher fresh (+7.1%) and dry (+8.0%) shoot biomass than NoBE.
Results show promising growth-effects of Pseudomonas on field-grown maize.
Keywords: Fertilizer placement, Localized root-growth, Nutrient acquisition, PGPM

6: Improving fertilizer-depot exploitation by PGPM
106
6.2 Background
Of increasing importance in sustainable agriculture systems are the effective use of crop bio-
stimulants (Sharma et al., 2012; Halpern et al., 2015) and/ or plant growth-promoting
microorganisms (PGPMs), which have been shown to fix N (Barea et al., 2002), mineralize
organic soil N (Ferris et al., 1998), stimulate plant root growth (Mao et al., 2006; Jiang et al.,
2012; Mohite 2013) and mycorrhization (Mauricio, 2005; Frey-Klett et al., 2007; Richardson
et al., 2009); which enhances spatial nutrient acquisition from large soil volumes; and also to
induce tolerance or resistance to biotic (Ghorbani et al., 2008) and abiotic stresses (Yang et
al., 2009; Shakir et al., 2012). Nevertheless, plant growth-promoting effects of PGPMs
realized in labs and greenhouses tend to be weak or even disappear when PGPMs are tested
under field conditions. PGPM ineffectiveness in the field is likely due to a suboptimal or
unfavorable interaction between field-inoculated PGPM and the biotic and abiotic
environment (van Veen et al., 1997; Lugtenberg and Kamilova, 2009).
Central to the concept of sustainable agriculture is reduction of environmental costs
associated with farming. Among others, it requires responsible use of chemical fertilizers.
This can be achieved through use of suitable fertilizer types and application rates timed to
crop demand, seasons and weather conditions with low risk of fertilizer loss to the
environment. Responsible use of chemical fertilizers also requires utilization of effective
fertilizer application techniques. In contrast to conventional fertilizer application by even
broadcast on the soil surface (with or without incorporation), several innovative fertilizer
placement techniques have been developed, through which fertilizer can be targeted to the
seed, root or canopy of young crop plants. Furthermore, fertilizer placement in soil improves
fertilizer acquisition by target crop plants as opposed to weeds (Blackshaw et al., 2002;
Petersen, 2005) and reduces the risk of nutrient loss to the environment. Based on fertilizer
composition, application technique and timing, effective fertilizer placement can lead to

6: Improving fertilizer-depot exploitation by PGPM
107
reduced leaching of nitrate to ground waters (Ruidisch et al., 2013), low emission of nitrous
oxide (Nash et al., 2012), methane (Linquist et al., 2012) and ammonia(Ma et al., 2010)
originating from fertilizer applied in soil. Fertilizer placement can also improve nutrient
content in crop above-ground biomass as well as crop yield in comparison to conventional
fertilizer broadcast (Nkebiwe et al., 2016).
Some of the earliest studies on fertilizer placement reported positive plant growth and yield
effects (Reith, 1954; Cooke, 1954). Today, “starter” fertilizers (e.g. di-ammonium phosphate
for maize), are commonly applied close to plant roots to ensure optimal N and P supply
during critical early growth stages especially in cold climate regions(Grant et al., 2001).
“Complete” fertilizer placement is also performed, in which the fertilizer need for the
vegetative season is supplied as a single rich subsurface fertilizer-depot. Nevertheless, poor
root-growth in the fertilizer-depot zone often limits crop nutrient acquisition from the depot.
Inclusion of root-attracting nutrients like ammonium and orthophosphate ions, or inoculation
of root-growth-stimulating PGPMs in the fertilizer depot zone, is a possible solution. There is
evidence that fertilizer depots comprising ammonium and phosphates lead to higher N and P
uptake and yield than fertilizer depots comprising either ammonium or phosphate and not
both (Nkebiwe et al., 2016). This phenomenon is primarily due to stronger localized root
growth induced within the fertilizer depot by the presence of ammonium than by phosphates
(Jing et al., 2010). Secondly, NH4+-uptake from NH4
+-rich subsurface fertilizer depots
induces rhizosphere acidification around the depot-zone, which enhances plant P-acquisition
in neutral to alkaline soils (Jing et al., 2010). Low rhizosphere pH may also modify
proliferation and cell-wall mechanical properties of root cells (Jing et al., 2010).
(Sommer, 2005)proposed the term Controlled Long-Term Ammonium Nutrition (CULTAN)
to describe a technique for “complete” N-fertilizer placement in which a subsurface fertilizer

6: Improving fertilizer-depot exploitation by PGPM
108
depot based on toxic concentrated NH4+ solution is placed at a rate to cover crop N demand
during the vegetation season.
Although subsurface fertilizer placement and soil-inoculated plant growth-promoting
microorganisms (PGPMs) have been separately studied considerably and somewhat also
separately adopted, little is known about the combination of both. We propose that root
colonization by PGPMs can be enhanced if PGPMs are inoculated in rhizosphere “hotspots”,
developing around an NH4+-based fertilizer depot, due to NH4
+-induced dense root-growth
and consequently, high levels of organic nutrients for microbes released as root
exudates(Lugtenberg and Kamilova, 2009; Bonkowski et al., 2000).
Preliminary studies on fertilizer placement in combination with inoculation of PGPMs, such
as subsurface banding of inorganic P fertilizer combined with seed-inoculated PGPM(s)
(Dutta and Bandyopadhyay, 2009) or subsurface banding of NPK-enriched bio-compost
treated with PGPMs (Arshad and Waqas, 2011), have produced promising results.
Using maize (Zea mays L.) as a test crop, our objective was to investigate the effect of N
fertilization by placement of an NH4+-depot and substrate-inoculation of the most promising
PGPMs on root growth, rhizosphere modification, root-colonization by PGPM, plant growth
and development, shoot nutrient concentration and content, and yield. PGPMs were selected
based on initial in vitro laboratory tests from which promising candidates showed
considerable tolerance to high levels of stabilized NH4+ and ability to solubilize insoluble
Ca3(PO4)2 (Nkebiwe et al., 2014 submitted). We hypothesized that: (1) Placement of NH4+-
fertilizer as a subsurface depot stimulates intense root growth around the depot, forming
“rhizosphere hotspots”. (2) Marked rhizosphere acidification occurs within and around the
NH4+-depot zone. (3) Survival and colonization of inoculated PGPMs is higher in the
“rhizosphere hotspot” than in the comparable soil volume with respect to plant position that is
supplied homogeneously with NO3- fertilizer. (4) Inoculated and established PGPMs further

6: Improving fertilizer-depot exploitation by PGPM
109
promote root development around the NH4+-depot zone. (5) Consequently, NH4
+-depot
fertilization combined with inoculated PGPMs leads to higher nutrient uptake and higher
yields than NH4+-depot fertilization without PGPMs.
6.3 Methods
Greenhouse experiments
6.3.1.1 Choice of N-form for placement
A central theme in this study was N-fertilizer placement in subsurface soil to improve crop N-
acquisition. Effective N-fertilizer placement required application of a suitable N-source to
form a relatively stable subsurface N-depot that is sufficiently close to seeds or plant roots for
optimal N-acquisition but distant enough not to impair seed germination and plant growth.
Therefore, for main experimental treatments, NH4+ was selected over NO3
- and CO(NH2)2
because of its low mobility in soil owing to a low effective diffusion coefficient and low mass
flow (Barber 1984; Anghinoni and Barber, 1990; Neumann and Römheld, 2012) and also due
to its ability to bind or be fixed to negatively charged sites on clay particles(Nieder et al.,
2011). This property of NH4+ favorably inhibits N movement out of the depot zone to the
surrounding unfertilized soil. For these reasons, it is not logical to locally place NO3- as a N-
depot in soil because it will rapidly move out of the original spot into the surrounding soil by
diffusion and mass flow (Anghinoni and Barber, 1990). NH4+ was also selected because it
induces stronger localized root growth at the site of contact with roots than NO3- or CO(NH2)2
(Anghinoni and Barber, 1990; Drew, 1975; Hawkesford et al., 2012; Jing et al., 2012). This
feature coupled with low mobility in soil makes NH4+ the ideal N-form to stimulate the
formation densely rooted soil zones, “rhizosphere hotspots”. The NH4+-fertilizer chosen was
further stabilized with a nitrification inhibitor (3, 4-Dimethylpyrazole phosphate (DMPP)
(Zerulla et al., 2001) to reduce N movement out of the depot as NO3-. Moreover, to minimize
microbial nitrification, a highly concentrated, toxic NH4+-depot solution was used to create a

6: Improving fertilizer-depot exploitation by PGPM
110
stable persisting NH4+- depot in which microbial-growth, root-growth and root N uptake is
initially limited to the outer boarder areas with less toxic NH4+ levels (Sommer, 2005).
Therefore, in these experiments on natural-soils or soil-based substrates, localized supply of N
could only be realized as a subsurface NH4+ -depot - with its associated effects on localized
root-growth stimulation and rhizosphere acidification - and not as NO3-.
If the experimental treatment is localized nutrient supply, the logical control should be
uniform nutrient supply (Robinson, 1994) given that the quantity of nutrient supplied per
experiment unit (treatment or control) is the same.
For control treatments, NO3- (e.g. calcium ammonium nitrate, CAN) or CO(NH2)2 were
suitable low-cost N-fertilizers commonly used by farmers and applied simply by broadcast
and incorporation. In natural soil, NO3- or CO(NH2)2 is not normally and cannot be placed
locally as a subsurface depot; not without the use of wax membranes (Drew, 1975) or other
water-tight barriers(Robinson, 1994). This is because NO3- or CO(NH2)2 cannot to bind to
clay particles and are very mobile soil(Drew, 1975). For these reasons, NO3- homogenously
mixed in the substrate was chosen as a suitable control. It was not considered necessary to
include homogenously mixed NH4+ and locally placed NO3
- for the sake of completeness
because with NH4+ nitrification and NO3
- diffusion, as discussed, these treatments will, within
a few days, become essentially the same as homogeneously mixed NO3-.
6.3.1.2 Pot experiment
Maize (Zea mays L. var Colisee, KWS, Germany) was grown in 1.6 l pots (20 cm X 10 cm Ø)
under controlled root-zone temperature of 20 ± 2 °C. The substrate was based on 66 % low-P
soil from a long-term unfertilized grassland (0-20 cm depth; PCAL, 30 mg kg-1; Ptotal, 667 mg
kg-1; KCAL, 233 mg kg-1; MgCaCl2, 66 mg kg-1; pH (CaCl2), 7.1; Corg, 2.4%; Ntotal 0.24 %) and
34 % quartz sand (0.6 -1.2 mm Ø), on weight basis. There was a control treatment without

6: Improving fertilizer-depot exploitation by PGPM
111
any fertilizer (No P). The substrate for the treatment NH4+-Depot was fertilized as follows
(kg-1 soil DM): 100 mg N ((NH4)2SO4); 150 mg K (K2SO4); 50 mg Mg (MgSO4); and 22 %
H2O (75 % max. water holding capacity). Apart from (NH4)2SO4, which was applied in salt
form as a concentrated depot (7 cm long band located 5 cm below and 5 cm to the side of the
maize seed, 5 x5 cm), all other nutrients where homogenously mixed in the substrate. There
were two variants of the NH4+-Depot treatment; one without PGPM and the other inoculated
with Pseudomonas sp. DSMZ13134 as bio-effector (Pro). Bio-effectors (BEs) are viable plant
growth-promoting microorganisms (PGPMs) and/or active natural compounds which directly
or indirectly promote plant growth with a negligible direct input of nutrients and/or organic
matter (Weinmann and Römheld, 2012). Additionally, there was a positive P control (+P),
with its substrate fertilized similarly to that of NH4+-Depot described above except that N
(100 mg N as CaNO3) and P (150 mg as Ca(H2PO4)2) where homogenously mixed in the
substrate.
The inoculum of Pseudomonas sp. DSMZ13134 (Pro) was prepared from the commercially
available product Proradix, which is a powder formulation of viable cells and other additives
(Sourcon Padena, Tübingen, Germany). For treatment of turf, the producer recommended rate
is 10 g Proradix suspended in 200 – 400 l water and applied on an area of 1000 m2. This rate
is commensurate with 4.4 x 10⁶ CFUs kg-1 soil DM, assuming a soil bulk density of 1.5 g cm-3
and a treated soil depth of 10 cm. The producer also refers to higher application rates for
different plant species: 1 x 10¹⁰ CFUs kg-1 soil for substrate-inoculation in pot-grown tomato
or barley (Yusran et al., 2007; Fröhlich et al., 2012) and 8 x 10¹⁰ CFUs kg-1 seed for seed-
inoculation in pot- and field-grown barley(Fröhlich et al., 2012). In an initial screening test
with c among other bacterial and fungal PGPMs on maize, the inoculation rate of 2 x 10⁸
CFUs kg-1 soil DM led to little or no effect on root or shoot growth in comparison to the non-
inoculated controls. Therefore, in this pot experiment, we employed a high inoculation rate of

6: Improving fertilizer-depot exploitation by PGPM
112
1 x 10¹¹ CFUs kg-1 soil DM. This was to improve the chance for early root colonization in the
immediate seeding-zone as well as late root colonization in the fertilizer depot zone.
Each pot was filled with 1.9 kg of substrate. For each pot of treatment Pro, half of the total
quantity of inoculum was drenched over the seeding hole at sowing to ensure early root
colonization and the other half was placed directly over the NH4+-depot to promote root
colonization in the developing rhizosphere “hotspot”. To prepare the inoculum for the seed-
hole, Proradix (6.6 x 10¹⁰ CFUs g-1) was suspended in 2.5 mM CaSO4 to a concentration of 5
x 109 CFU ml-1 and 10 ml of the suspension (5 x 10¹⁰ CFUs) was applied by drenching over
the seed in the seed-hole. To maintain a concentrated NH4+-depot, the inoculum suspension
applied over the NH4+-depot was more concentrated than the one drenched over the seed-hole.
It had a concentration of 2.5 x 10¹⁰ CFU ml-1 and 2 ml of the suspension (5 x 10¹⁰ CFUs) was
pipetted directly over the (NH4)2SO4 depot. The total inoculation rate for Pro pots was,
therefore, 1 x 10¹¹ CFUs kg-1 soil DM (1 kg Soil DM pot-1). For other treatments, volumes of
2.5 mM CaSO4 were applied accordingly. There were 4 replicates per treatment arranged in a
completely randomized design. There was16 h. light and 8 h. darkness. Average daily
temperature was 20 ± 2 °C (Max. 26.9 °C and min. 14.6 ° C).
The diameter of the stem base and the maximum area of the youngest fully developed leaf
were measured at 55 days after sowing (DAS). At 56 DAS, SPAD values were measured on
the youngest fully developed leaf (average of 6 measurements leaf-1) using SPAD 502 Plus
(Konica Minolta, Chiyoda, Japan). SPAD values represent chlorophyll concentrations, which
positively correlate with leaf N-concentration.
Shoot and root biomass (65 DAS) were harvested and dried (60 °C 48 h.). Shoot N and P
concentrations were measured using CN elemental analyzer and molybdate-vanadate method
(Gericke and Kurmies, 1952) respectively.

6: Improving fertilizer-depot exploitation by PGPM
113
6.3.1.3 Rhizobox experiment
Maize (Zea mays L. var Colisee) was grown in rhizoboxes (40 x 20 x 2 cm; H x W x D). The
substrate was based on 80 % low-P, loess-based, C-horizon subsoil (PCAL, 5 mg kg-1; Ptotal,
332 mg kg-1; pH (CaCl2), 7.6; Corg, < 0.3%; Ntotal 0.02 %; CaCO3, 23 %) and 20 % quartz sand
(0.6 -1.2 mm Ø), on weight basis. The substrate was adequately supplied with the following
nutrients (kg-1 soil DM): N (100 mg, Ca(NO3)2 or (NH4)2(SO4); P (150 mg, Ca(H2PO4)2); K
(150 mg, K2SO4); Mg (50 mg, MgSO4); micronutrients: 20 µmol Fe, Sequestrene138, 6 % Fe;
2.6 mg Zn, ZnSO4; 1 mg Cu, CuSO4); and H2O (60 % max. water holding capacity, 18 %
moisture). Each rhizobox was filled with 2.4 kg of substrate.
Treatments included two N levels: 1.) CaNO3 homogenously mixed in the substrate (NO3--
Mixed) and 2.) Concentrated (NH4)2SO4, fertilizer (64 mg N ml-1) stabilized with the
nitrification inhibitor 3, 4-Dimethylpyrazole phosphate (DMPP) (Zerulla et al., 2001)
(NovaTec® Solub 21, Compo Expert, Münster, Germany) placed as a depot 5 x5 cm to the
maize seed (NH4+-Depot); in factorial combination with two BE levels: 1.) no inoculation
(NoBE) and 2.) inoculation with (Pro) at the rate 1 x 10⁹ CFUs kg-1 soil DM (x 2
applications). The inoculation rate of 1 x 10⁹ CFUs or Spores kg-1 soil DM for bacterial bio-
effectors was later recommended by project management as consistent with producer
suggested rates for different soil-inoculated microbial PGPMs.
To prepare the inoculum, Proradix (6.6 x 10¹⁰ CFUs g-1) was suspended in 2.5 mM CaSO4 to
a concentration of 5 x 10⁸ CFU ml-1. Through the rhizobox window after sowing, 3.26 ml of
the inoculum suspension was pipetted on the substrate 2.5 cm around the NH4+-depot zone or
corresponding soil zone in NO3--Mixed treatments. The second inoculation was performed
two weeks after sowing. There were 4 replicates per treatment arranged in a completely
randomized design. Greenhouse conditions were set at 16 h. light at 25°C and 8 h. darkness at
18 °C.

6: Improving fertilizer-depot exploitation by PGPM
114
At 32 DAS, SPAD values on the youngest fully developed leaf, plant height and stem
diameter were measured. Plants were harvested at 55 DAS. pH on the root surface 0 – 8 cm
from and >8 cm away from the NH4+ depot or corresponding soil zone in NO3
--Mixed
treatments was assessed qualitatively for color changes with Bromocresol-purple pH-indicator
agar (Marschner and Römheld, 1983; Häussling et al., 1985) and quantitatively by
measurement of potential difference using antimony micro-electrodes (Marschner and
Römheld, 1983; Schaller and Fischer, 1985).
For qualitative pH assessment with Bromocresol-purple pH-indicator agar, 1 % bromocresol-
purple solution was prepared two weeks before use as recommended. For it, 1 g bromocresol-
purple was suspended in 80 ml dest. water in a 100 ml Erlenmeyer flask. For dissolution to
occur, 1N NaOH was added dropwise under continuous stirring ensuring with a pH meter that
the pH of the solution did not exceed 9. After about 30 minutes, the pH ceased to decrease
indicating complete dissolution. At that point, the pH of the solution was lowered to 6 using
1N H2SO4. The flask was filled up with dest. water to the 100 ml mark. Under stirring, 5g
Agar was suspended and cooked in 400 ml dest. water in a 500 ml Erlenmeyer flask to
completely dissolve. 5 ml of 1 % bromocresol-purple solution was added and then the flask
was filled up with dest. water to 500 ml. At about 40 °C, bromocresol-purple-agar solution
was then poured on a Plexiglas tray to a layer about 3 mm thick. Once solidified, the layer of
agar was carefully placed over the soil surface on the rhizobox window to cover the NH4+-
depot zone or the corresponding zone in NO3--Mixed treatments. After a few minutes, color
change along the root surface could be observed, yellow for acidification below pH 5.2 and
purple for alkalinization above pH 6.8. In order to read pH changes, color standards were
prepared by mixing 50 µl pH buffer solutions (4, 5, 6, 7, 8, 9, and 10) with 450 µl
bromocresol-purple-agar solution in small transparent glass-vial caps and allowed to solidify.

6: Improving fertilizer-depot exploitation by PGPM
115
For quantitative potentiometric pH measurements, antimony micro-electrodes were calibrated
by measuring the potential difference (200 to 500 mV) of pH buffer solutions (4, 5, 6, 7, 8, 9,
and 10) and generating the following best fitting sigmoidal calibration curve with five
parameters: f = y0+a/(1+exp(-(x-x0)/b))^c; R2 = 0.99, SEM = 0.2; f = pH; x = potential
difference (mV); a = 6.1419; b = 47.8570; c = 1.9364; x0 = 339.7333; and y0= 4.0089). For
the regression, SigmaPlot 12.0 was used (Systat Software Inc.(SSI), San Jose, California,
USA).The potential difference on the root surface below the bromocresol-purple-agar was
measured with a pH meter (pH 320, WTW GmbH Weilheim, Germany) connected to an
antimony micro-electrode and to a reference calomel-electrode. Measured potential
differences were back-transformed to pH using the sigmoidal calibration curve.
Separately, roots located within 8 cm or more than 8 cm away from the NH4+-Depot or
corresponding zone were harvested, washed, scanned and root length and architecture
analyzed using WinRhizo Pro V. 2009c (Regent Instruments Inc., Canada). To measure the
number of rhizoplane-dwelling fluorescent Pseudomonads per unit volume of substrate in the
NH4+ depot or corresponding zone in NO3
--Mixed treatments, 0.5 – 1.5 g of fresh root sample
were thoroughly washed with sterile deionized water (autoclaved 121° C for 20 min.), shaken
with 50 ml of sterile ice-cooled 0.1 % proteose peptone and 10 sterile glass beads at 250 rpm
for 15 min using autoclaved 250 ml Erlenmeyer flasks. After shaking, flasks were cooled on
ice, 5 ml extracts were serially 10-fold diluted with 0.1 % proteose peptone, plated on
selective Kings B medium containing 45 mg Novobiocin l-1 and 45 mg Penicillin l-1
(Sugimoto et al., 1990), and incubated 23 h. at 30 °C. The number of colonies were counted
and the colonization rate per gram fresh root was calculated. Using colonization rate and
weight of fresh roots per unit substrate volume around the fertilizer depot zone (or
corresponding zone for NO3- treatments), we calculated the colonization rate per unit substrate
volume.

6: Improving fertilizer-depot exploitation by PGPM
116
Shoot and root biomass were harvested and dried (60 °C 48 h.). Shoot N and P concentrations
were measured.
Field experiments
6.3.2.1 2014
Maize (Zea mays L. var Colisee) was grown on soil with moderate Nmin and available P levels
at the research station of the University of Hohenheim, Ihinger Hof, Renningen, Germany
(48°44'42.3"N 8°55'26.7"E; 475 m above sea level; 688 mm av. annual rainfall; 8.8 °C mean
annual daily temperature). Soil properties were Haplic luvisol, 24-28 % clay, 67-72 % silt, 4-5
% sand, pH (CaCl2) 6.9, Corg, 1 %, Nmin, 38 kg ha-1; PCAL, 120 mg kg-1.There were 8
treatments (Table 6.1) arranged in a Latin rectangle design with 5 columns and 5 rows (there
were 17 other treatments as part of another study). After sugar beet harvest, the soil was
ploughed with a moldboard plough to 20 cm depth in autumn 2013. Plot area was 45 m² (4.5
m x 10 m) and contained 6 maize rows (75 cm inter-row distance). Data was collected only
from the central four core rows (2 – 5). The first and last 1 m length of each plot and rows 1
and 6 were excluded as plot boarders.
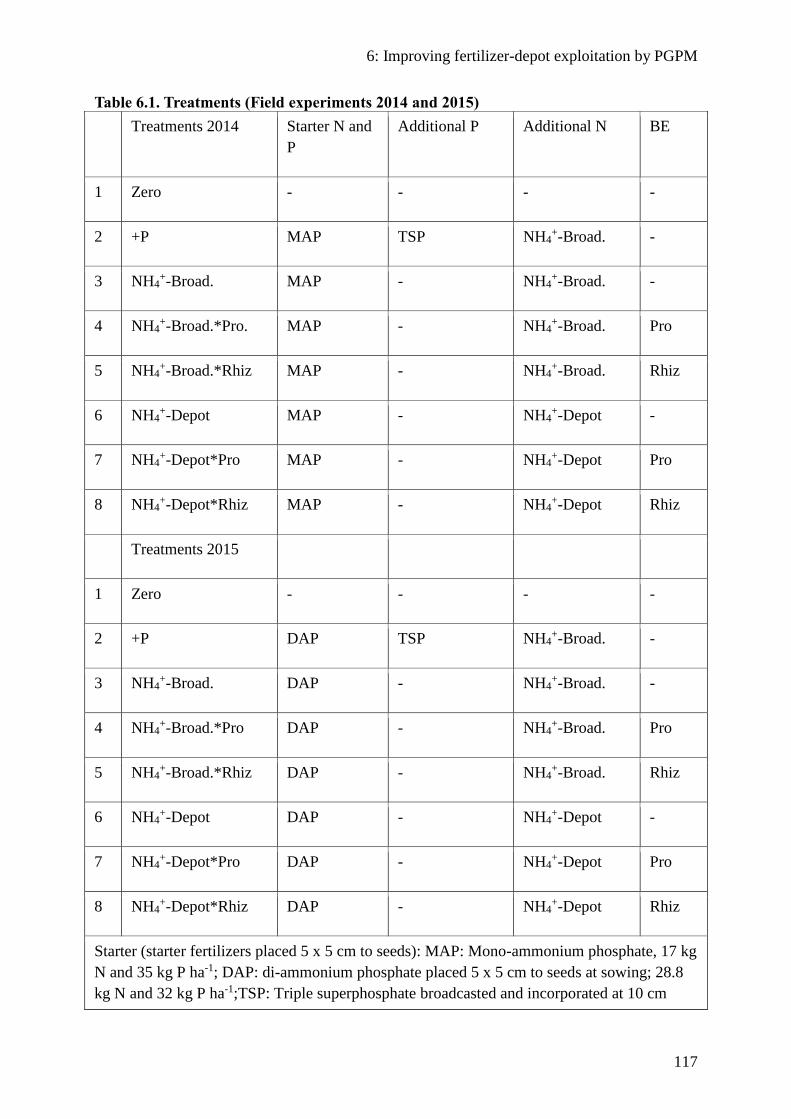
6: Improving fertilizer-depot exploitation by PGPM
117
Table 6.1. Treatments (Field experiments 2014 and 2015)
Treatments 2014 Starter N and
P
Additional P Additional N BE
1 Zero - - - -
2 +P MAP TSP NH4+-Broad. -
3 NH4+-Broad. MAP - NH4
+-Broad. -
4 NH4+-Broad.*Pro. MAP - NH4
+-Broad. Pro
5 NH4+-Broad.*Rhiz MAP - NH4
+-Broad. Rhiz
6 NH4+-Depot MAP - NH4
+-Depot -
7 NH4+-Depot*Pro MAP - NH4
+-Depot Pro
8 NH4+-Depot*Rhiz MAP - NH4
+-Depot Rhiz
Treatments 2015
1 Zero - - - -
2 +P DAP TSP NH4+-Broad. -
3 NH4+-Broad. DAP - NH4
+-Broad. -
4 NH4+-Broad.*Pro DAP - NH4
+-Broad. Pro
5 NH4+-Broad.*Rhiz DAP - NH4
+-Broad. Rhiz
6 NH4+-Depot DAP - NH4
+-Depot -
7 NH4+-Depot*Pro DAP - NH4
+-Depot Pro
8 NH4+-Depot*Rhiz DAP - NH4
+-Depot Rhiz
Starter (starter fertilizers placed 5 x 5 cm to seeds): MAP: Mono-ammonium phosphate, 17 kg
N and 35 kg P ha-1; DAP: di-ammonium phosphate placed 5 x 5 cm to seeds at sowing; 28.8
kg N and 32 kg P ha-1;TSP: Triple superphosphate broadcasted and incorporated at 10 cm

6: Improving fertilizer-depot exploitation by PGPM
118
depth before sowing; 2014, 133 kg; 2015,130 kg P ha-1; NH4+-Broad.: Stabilized (NH4)2SO4
broadcasted over the canopy, 2014,135 kg N; 2015 100 kg N ha-1 ; NH4+-Depot: Stabilized
concentrated (NH4)2SO4 solution in water placed as a depot at 10 cm soil depth; 2014,135 kg
N; 2015 100 kg N ha-1; Pro: Pseudomonas sp. DSMZ 13134.; Rhiz: Bacillus
amyloliquefaciens FZB42, 1 x 10⁶ CFU g-1 soil DM.; BE application: 2014,
Broadcast/incorporation 1 x 10⁶ CFU g-1 soil DM; 2015 , Placement of a band of BE-treated
pumice stones in the sowing row; 0.13 x 10⁶ CFU g-1 soil DM
Fertilizer type, application methods and rates were as follows (Table 6.1): 1.) MAP: Mono-
ammonium phosphate (12 % NH4-N, 22 % P) (Krista™ MAP, Yara GmbH, Germany); 17 kg
N and 35 kg P ha-1. MAP, was placed as “starter” fertilizer on 21 May. “Starter” fertilizer
placement was performed at 5 cm to both sides of and 5 cm below the seeding zone with the
assistance of GPS and additional on-site positioning tools; 2.) TSP: Triple superphosphate (20
% P) hand-broadcasted (20 May 2014) and incorporated at 10 cm depth the following day
before sowing; 133 kg P ha-1; 3.) NH4+-Broad.: Stabilized (NH4)2SO4 (21 % NH4-N, 24 % S)
broadcasted over the canopy at 5-6 leaf stage (24-25 June), (NovaTec® Solub 21, Compo
Expert, Münster, Germany); 135 kg N ha-1; 4.) NH4+-Depot: Concentrated stabilized
(NH4)2SO4 (21 % NH4-N, 24 % S) in water (64 g N l-1) placed at 10 cm depth midway
between rows 1 – 2, 3 – 4 and 5 – 6 at 5-6 leaf stage (24-25 June); 135 kg N ha-1.
The bio-effectors applied included Pro (already described) and Rhiz, Bacillus
amyloliquefaciens FZB42 (2.5 x 10¹⁰ spores g-1), a commercially available product in liquid
formulation containing spores and other additives (Rhizovital FZB42, ABiTEP GmbH,
Berlin Germany). The producer recommended application rates are 100 – 500 ml ha-1 for
seed-treatment and 1000 – 2000 ml ha-1 for soil application by drenching or spraying. These
rates are commensurate with 1.7 – 8.3 x 10⁶ spores kg-1 soil DM (for seed treatment) and 1.7
– 3.4 x 10⁷ spores kg-1 soil DM (for soil treatment), assuming a treated soil depth of 10 cm
and a bulk density of 1.5 g cm-3.

6: Improving fertilizer-depot exploitation by PGPM
119
Like Pro, Rhiz was also applied at a rate of 1 x 10⁹ Spores kg-1 soil DM as recommended by
project management. To apply bio-effectors, stock suspensions were freshly prepared, diluted
on field site and applied on the soil surface on the same day. Bio-effectors were applied one
day before sowing (20 May) and again at 2-4 leaf stage (17 June). For the first application of
Pro, 1 kg of Proradix (6.6 x 10¹⁰ CFUs g-1) was suspended in about 18 l Cl-free water to
produce 20 l Pro stock suspension with a concentration of 6.75 x 10¹² CFU l-1. 2 l of stock
were diluted with Cl-free water to 24 l, applied using a watering can over the soil surface and
incorporated to 10 cm depth (Soil bulk density 1.5 g cm-3) just before sowing on 21 May. The
total quantity of Pro inoculum used in the second application (2-4 leaf stage, 17 June) was
reduced as a means to reduce costs while maintaining the CFU density of 1 x 10⁹ CFU kg-1
soil DM in the crop row. In order to achieve this, the inoculum was sprayed only over the
maize row to drench the soil beneath (about 10 cm width) instead of over the entire plot area.
For this, a dilute Pro stock was prepared (9.0 x 10¹¹ CFU l-1) from which 2 l were diluted with
Cl-free water to 24 l and applied using a watering can.
For the first application of Rhiz, 5.4 kg of Rhizovital FZB42 (2.5 x 10¹⁰ spores g-1) were
suspended in about 14.6 l Cl-free water to produce 20 l of Rhiz stock suspension with a
concentration of 6.75 x 10¹² spores l-1. Like Pro, Rhiz was applied at a rate of 1 x 10⁹ CFU kg-
1 soil DM. The second application of Rhiz was also performed at 2-4 leaf stage (17 June). 2 l
of Rhiz stock (9.0 x 10¹¹ CFU l-1) were further diluted with Cl-free water to 24 l and applied
over the maize row.
Using a pneumatic plot drill and positioning tools (GPS and on-site correction devices), plots
were seeded at the pre-defined rows with untreated maize at the rate of 9 – 10 seeds m-2 on 21
May. Top dressing of (NH4)2SO4 at 5-6 leaf stage (24-25 June) resulted in leaf injury if
fertilizer was trapped on the leaf surface. Plants later fully recovered. Concentrated stabilized
(NH4)2SO4 solution placed at 10 cm depth as a depot showed no signs of injury to the plants.

6: Improving fertilizer-depot exploitation by PGPM
120
Plant emergence 16 days after sowing (DAS; number of emerged plants along 2 m row length
x 4), number of 2-leaf stage plants 16 DAS, BBCH 12 (measured similarly to emergence) and
plant height (23 and 78 DAS; 10 successive plants row-1 x 4) where measured for the controls:
Zero, NH4+-Broad. and +P. At 35 and 53 DAS (1 and 19 days after placement of NH4
+-
fertilizer depot respectively), soil samples 0 – 30 cm depth were collected from the midway
point between rows 1 – 2, 3 –4 and 5 – 6 (NH4+-Depot zone or corresponding soil zone for
non- NH4+-Depot treatments). Nmin concentrations in samples were measured. SPAD (43 and
79 DAS; average of 4 measurements leaf-1 x 5 successive plants row-1 x 4), ear-leaf N and P
concentrations (79 DAS; 4 ear-leaf samples row-1 x 4) were measured. For treatments NH4+-
Broad.*Pro and NH4+-Depot*Pro at 81 DAS (47 days after placement of depot), soil core
samples (30 cm L, 5 cm Ø) were collected; four samples were collected from the NH4+-Depot
zone (or corresponding soil zone for NH4+-Broad. treatment) at midway point between rows 1
– 2, 3 –4 or 5 – 6 and four from the non-Depot zone, between rows 2 – 3 or 4 – 5. Soil
samples were washed, roots were collected, scanned and analyzed (WinRhizo Pro). Grain was
harvested on 8 Nov. (172 DAS).
6.3.2.2 2015
Maize (Zea mays L. var Colisee) was grown on soil at another site in Ihinger Hof research
station. Like 2014, this site had moderate Nmin and available P levels. Soil properties included:
Haplic luvisol, clay loam, silty loam, pH 7.0, Nmin, 61 kg ha-1, PCAL, 110 mg kg-1.There were 8
treatments (Table 6.1) arranged in a completely randomized block design with 5 blocks (10
additional treatments were part of another study). Plot area was 58.5 m² (4.5 m x 13 m) with 6
maize rows (75 cm inter-row distance). Like in 2014, plot boarders were excluded during data
collection.

6: Improving fertilizer-depot exploitation by PGPM
121
Fertilizer types, application methods and rates included (Table 6.1): 1.) DAP: starter fertilizer
as di-ammonium phosphate placed 5 x 5 cm to seeds at sowing (13 May); 28.8 kg N and 32
kg P ha-1; 2.) TSP: Triple superphosphate broadcasted by hand and incorporated at 10 cm
depth before sowing (11 May); 130 kg P ha-1; 3.) NH4+-Broad.: Stabilized (NH4)2SO4
broadcasted and incorporated 10 cm deep before sowing (11 May); 100 kg N ha-1; 4.) NH4+-
Depot: Concentrated solution of stabilized (NH4)2SO4 in water (62.7 g N l-1) placed as a depot
at 10 cm depth midway between rows 1 – 2, 3 – 4 and 4 – 5 (4 – 5 leaf stage, 18 June); 100 kg
N ha-1.
Bio-effectors included Pro and Rhiz, each placed as a band of BE-treated pumice stones
(Table 6.1). To treat pumice stones (Rotocell 0.3 – 1.5, density 320 kg m-3, ROTEC GmbH &
Co. KG, Mülheim-Kärlich, Germany ) with BE, Cl-free water suspensions of Proradix (6.6 x
1010 CFUs g-1) and Rhizovital FZB42 (2.5 x 10¹⁰spores g-1) were each prepared to a
concentration of 2 x 10¹² CFUs l-1 or spores l-1. Each suspension was evenly applied using a
pressurized hand pump sprayer at the rate of 0.23 l kg-1 pumice stones, which were spread on
a plastic sheet (0.47 x 10¹² CFUs or spores kg-1 pumice stones). Pumice stones were then
turned over several times to homogenize inoculum absorption, air-dried at room temperature
and applied on the field on the same day. Application was done by placement in 5-10 cm deep
furrows cut in the sowing row. The application rate was 32 g pumice stones m-1 furrow (100
ml pumice stones m-1 furrow). Furrows were covered with soil and the entire plot was tilled
with a rototiller to10 cm depth. The final inoculum density in soil within the sowing row was
1 x 10⁹ CFU kg-1 soil DM (15 kg soil DM m-1 furrow; 10 cm row width and 10 cm row depth,
soil bulk density 1.5 g cm-3), which was about ten times higher the inoculum density (10 cm
depth) if the inoculum was evenly applied over the entire plot area (0.13 x 10⁹ CFU kg-1).
On 12 May, plots were sown at the rate of 9 – 10 seeds m-2 as in 2014. For treatment NH4+-
Depot only, soil samples 0 – 30 cm depth were collected from the midway point between
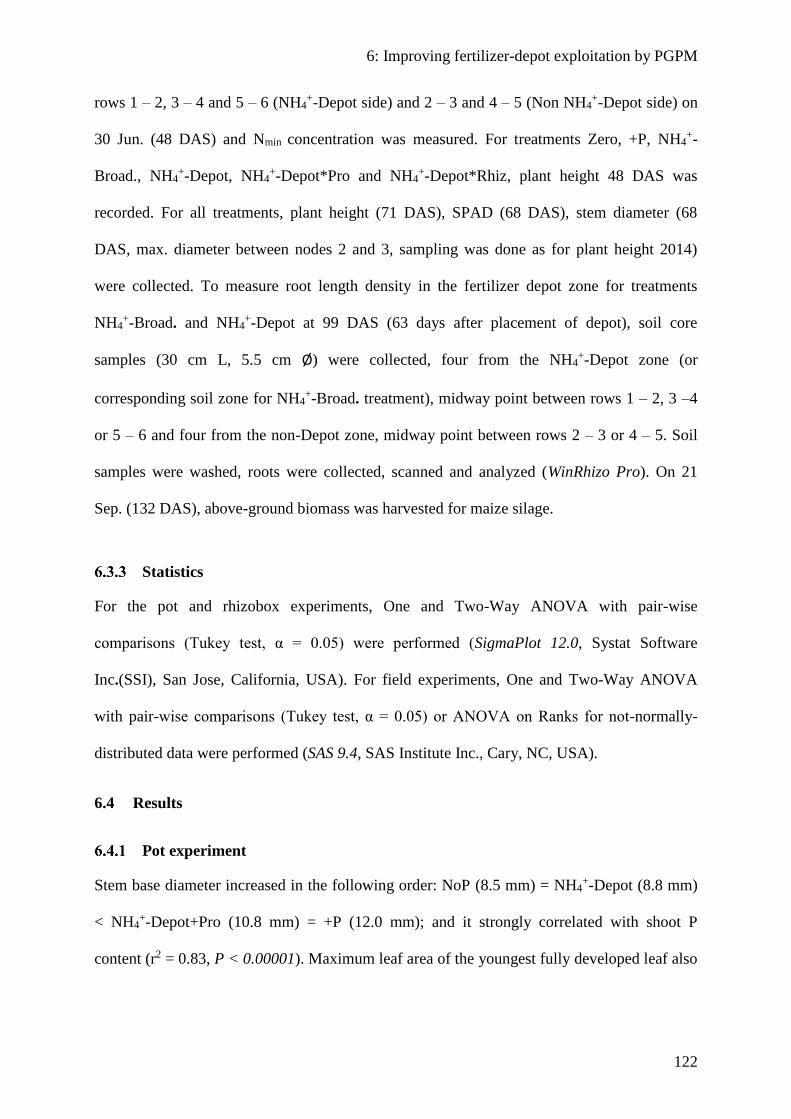
6: Improving fertilizer-depot exploitation by PGPM
122
rows 1 – 2, 3 – 4 and 5 – 6 (NH4+-Depot side) and 2 – 3 and 4 – 5 (Non NH4
+-Depot side) on
30 Jun. (48 DAS) and Nmin concentration was measured. For treatments Zero, +P, NH4+-
Broad., NH4+-Depot, NH4
+-Depot*Pro and NH4+-Depot*Rhiz, plant height 48 DAS was
recorded. For all treatments, plant height (71 DAS), SPAD (68 DAS), stem diameter (68
DAS, max. diameter between nodes 2 and 3, sampling was done as for plant height 2014)
were collected. To measure root length density in the fertilizer depot zone for treatments
NH4+-Broad. and NH4
+-Depot at 99 DAS (63 days after placement of depot), soil core
samples (30 cm L, 5.5 cm Ø) were collected, four from the NH4+-Depot zone (or
corresponding soil zone for NH4+-Broad. treatment), midway point between rows 1 – 2, 3 –4
or 5 – 6 and four from the non-Depot zone, midway point between rows 2 – 3 or 4 – 5. Soil
samples were washed, roots were collected, scanned and analyzed (WinRhizo Pro). On 21
Sep. (132 DAS), above-ground biomass was harvested for maize silage.
Statistics
For the pot and rhizobox experiments, One and Two-Way ANOVA with pair-wise
comparisons (Tukey test, α = 0.05) were performed (SigmaPlot 12.0, Systat Software
Inc.(SSI), San Jose, California, USA). For field experiments, One and Two-Way ANOVA
with pair-wise comparisons (Tukey test, α = 0.05) or ANOVA on Ranks for not-normally-
distributed data were performed (SAS 9.4, SAS Institute Inc., Cary, NC, USA).
6.4 Results
Pot experiment
Stem base diameter increased in the following order: NoP (8.5 mm) = NH4+-Depot (8.8 mm)
< NH4+-Depot+Pro (10.8 mm) = +P (12.0 mm); and it strongly correlated with shoot P
content (r2 = 0.83, P < 0.00001). Maximum leaf area of the youngest fully developed leaf also
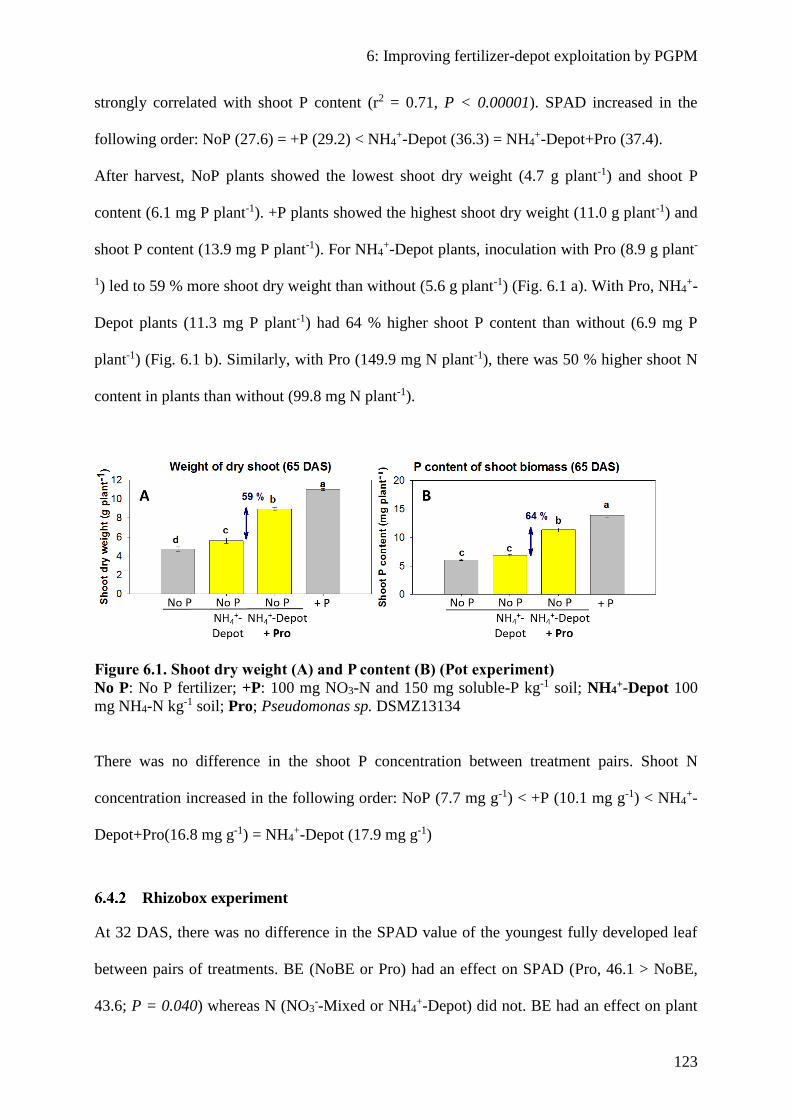
6: Improving fertilizer-depot exploitation by PGPM
123
strongly correlated with shoot P content (r2 = 0.71, P < 0.00001). SPAD increased in the
following order: NoP (27.6) = +P (29.2) < NH4+-Depot (36.3) = NH4
+-Depot+Pro (37.4).
After harvest, NoP plants showed the lowest shoot dry weight (4.7 g plant-1) and shoot P
content (6.1 mg P plant-1). +P plants showed the highest shoot dry weight (11.0 g plant-1) and
shoot P content (13.9 mg P plant-1). For NH4+-Depot plants, inoculation with Pro (8.9 g plant-
1) led to 59 % more shoot dry weight than without (5.6 g plant-1) (Fig. 6.1 a). With Pro, NH4+-
Depot plants (11.3 mg P plant-1) had 64 % higher shoot P content than without (6.9 mg P
plant-1) (Fig. 6.1 b). Similarly, with Pro (149.9 mg N plant-1), there was 50 % higher shoot N
content in plants than without (99.8 mg N plant-1).
Figure 6.1. Shoot dry weight (A) and P content (B) (Pot experiment)
No P: No P fertilizer; +P: 100 mg NO3-N and 150 mg soluble-P kg-1 soil; NH4+-Depot 100
mg NH4-N kg-1 soil; Pro; Pseudomonas sp. DSMZ13134
There was no difference in the shoot P concentration between treatment pairs. Shoot N
concentration increased in the following order: NoP (7.7 mg g-1) < +P (10.1 mg g-1) < NH4+-
Depot+Pro(16.8 mg g-1) = NH4+-Depot (17.9 mg g-1)
Rhizobox experiment
At 32 DAS, there was no difference in the SPAD value of the youngest fully developed leaf
between pairs of treatments. BE (NoBE or Pro) had an effect on SPAD (Pro, 46.1 > NoBE,
43.6; P = 0.040) whereas N (NO3--Mixed or NH4
+-Depot) did not. BE had an effect on plant
6: Improving fertilizer-depot exploitation by PGPM
124
height (NoBE, 86.6 cm > Pro, 82.3 cm; P = 0.012) whereas N did not. Furthermore, N had an
effect on stem diameter (NO3--Mixed, 11.6 mm > NH4
+-Depot, 9.8 mm; P = 0.008) whereas
BE did not. Stem diameter was not statistically different between treatment pairs.
At 55 DAS, there was higher root length density (RLD) in the fertilizer depot zone in
treatment NH4+-Depot compared to the corresponding soil zone in treatment NO3
--Mixed
(Fig. 6.2 a). N had a strong effect on RLD within these zones (NH4+-Depot, 10.2 cm cm-3 >
NO3--Mixed, 6.3 cm cm-3; P <0.001) and BE did not. RLD in the remaining substrate volume
of the rhizobox was affected by N (NO3--Mixed, 4.85 cm cm-3 > NH4
+-Depot, 4.28 cm cm-3; P
= 0.04) (Fig. 6.2 b)and by BE (NoBE, 4.88 cm cm-3 > Pro, 4.26 cm cm-3; P = 0.03), without
any N * BE interaction.
Figure 6.2. Root length density within (A) or outside (B) the NH4+-Depot or
corresponding soil zone (Rhizobox)
NO3--Mixed, Ca(NO3)2 homogenously mixed in substrate; NH4
+-Depot, stabilized
(NH4)2SO4 placed in substrate as a depot; BE, bio-effector; NoBE, no bio-effector; Pro,
Pseudomonas sp. DSMZ 13134. Different letters between N-levels show a significant N-
effect, *** P< 0.001 (Two-Way ANOVA,Tukey test, α = 0.05). There was no BE-effect
within the NH4+-Depot zone. For RLD outside the zone, NO3
--Mixed was higher than NH4+-
Depot (P = 0.04) and NoBE was higher than Pro (P = 0.03)
Rhizosphere pH was lower in the NH4+ depot zone (NH4
+-Depot) than in the corresponding
soil zone with homogenous NO3- supply (NO3
--Mixed) (Fig. 6.3 a) and only slightly lower for
measurements in outer zones (Fig. 6.3 b). Rhizosphere acidification in the fertilizer depot

6: Improving fertilizer-depot exploitation by PGPM
125
zone could be qualitatively confirmed by yellow coloration in Bromocresol-purple pH-
indicator agar along roots growing in the NH4+-Depot zone (Fig. 6.3 c). Root colonization by
fluorescent Pseudomonas sp. around the fertilizer depot zone in treatment NH4+-Depot was
higher than that of the corresponding soil zone in treatment NO3--Mixed (Fig. 6.4).
Figure 6.3. Root surface pH within (A, C) or outside (B) the NH4+-Depot or
corresponding soil zone (Rhizobox)
NO3--Mixed, Ca(NO3)2 homogenously mixed in substrate; NH4
+-Depot, stabilized
(NH4)2SO4 placed in substrate as a depot; BE, bio-effector; NoBE, no bio-effector; Pro,
Pseudomonas sp. DSMZ 13134
Figure 6.4. Root colonization by fluorescent Pseudomonas sp. within the NH4+-Depot or
corresponding soil zone (Rhizobox)
NO3--Mixed, Ca(NO3)2 homogenously mixed in substrate; NH4
+-Depot, stabilized
(NH4)2SO4 placed in substrate as a depot; BE, bio-effector; NoBE, no bio-effector; Pro,
Pseudomonas sp. DSMZ 13134, (t-test, P = 0.045)
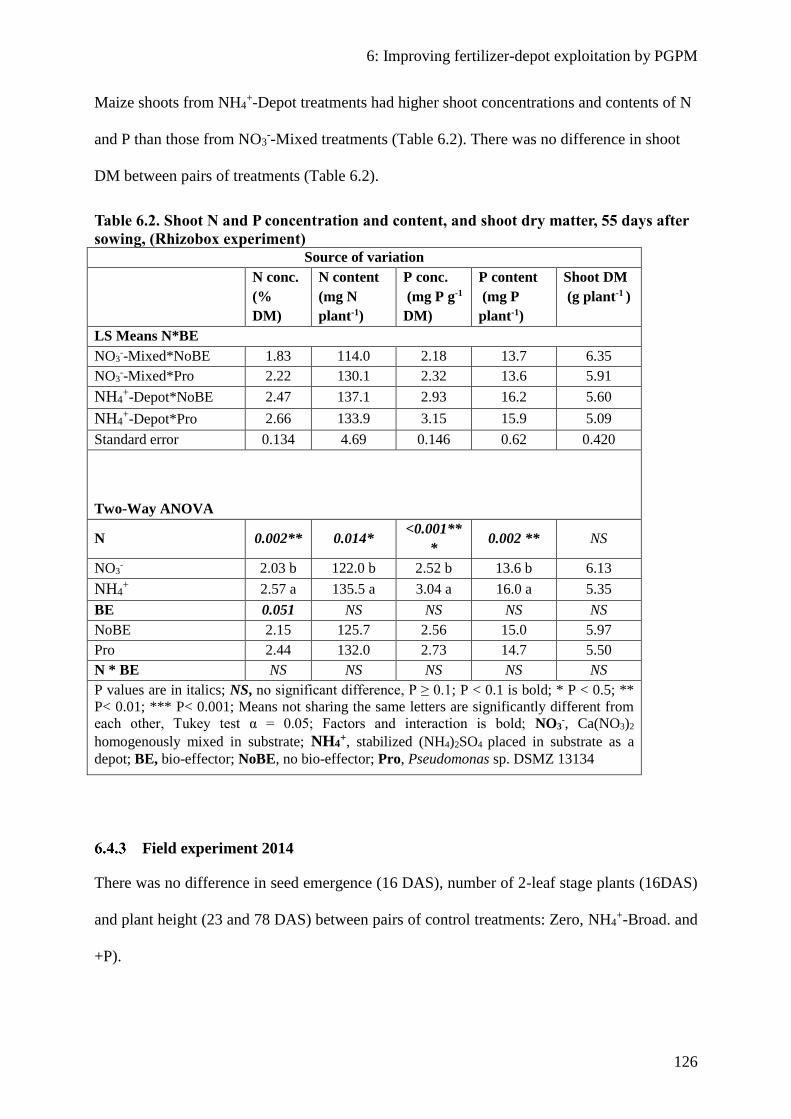
6: Improving fertilizer-depot exploitation by PGPM
126
Maize shoots from NH4+-Depot treatments had higher shoot concentrations and contents of N
and P than those from NO3--Mixed treatments (Table 6.2). There was no difference in shoot
DM between pairs of treatments (Table 6.2).
Table 6.2. Shoot N and P concentration and content, and shoot dry matter, 55 days after
sowing, (Rhizobox experiment)
Source of variation
N conc.
(%
DM)
N content
(mg N
plant-1)
P conc.
(mg P g-1
DM)
P content
(mg P
plant-1)
Shoot DM
(g plant-1 )
LS Means N*BE
NO3--Mixed*NoBE 1.83 114.0 2.18 13.7 6.35
NO3--Mixed*Pro 2.22 130.1 2.32 13.6 5.91
NH4+-Depot*NoBE 2.47 137.1 2.93 16.2 5.60
NH4+-Depot*Pro 2.66 133.9 3.15 15.9 5.09
Standard error 0.134 4.69 0.146 0.62 0.420
Two-Way ANOVA
N 0.002** 0.014* <0.001**
* 0.002 ** NS
NO3- 2.03 b 122.0 b 2.52 b 13.6 b 6.13
NH4+ 2.57 a 135.5 a 3.04 a 16.0 a 5.35
BE 0.051 NS NS NS NS
NoBE 2.15 125.7 2.56 15.0 5.97
Pro 2.44 132.0 2.73 14.7 5.50
N * BE NS NS NS NS NS
P values are in italics; NS, no significant difference, P ≥ 0.1; P < 0.1 is bold; * P < 0.5; **
P< 0.01; *** P< 0.001; Means not sharing the same letters are significantly different from
each other, Tukey test α = 0.05; Factors and interaction is bold; NO3-, Ca(NO3)2
homogenously mixed in substrate; NH4+, stabilized (NH4)2SO4 placed in substrate as a
depot; BE, bio-effector; NoBE, no bio-effector; Pro, Pseudomonas sp. DSMZ 13134
Field experiment 2014
There was no difference in seed emergence (16 DAS), number of 2-leaf stage plants (16DAS)
and plant height (23 and 78 DAS) between pairs of control treatments: Zero, NH4+-Broad. and
+P).

6: Improving fertilizer-depot exploitation by PGPM
127
One day after main N fertilization (35 DAS), soil NH4-N concentration at 0 – 30 cm depth
(fertilizer depot zone or corresponding zone) for treatment NH4+-Depot (304 kg NH4-N ha-1)
was higher than that for NH4+-Broad. (36 kg NH4-N ha-1) and that for Zero (2.5 kg NH4-N ha-
1). After 19 days (53 DAS), NH4-N concentrations had reduced: NH4+-Depot (204 kg NH4-N
ha-1), NH4+-Broad. (14.9 kg NH4-N ha-1) and Zero (2.15 kg NH4-N ha-1).
At 43 DAS, there was no difference in the SPAD value of the youngest fully developed leaf
of plants between pairs of treatments: Zero (31.0), NH4+-Broad. (39.5), and NH4
+-Depot
(38.2). By 79 DAS, ear-leaf SPAD value for treatment Zero (50.8) was less than that for
treatments NH4+-Depot (56.9), NH4
+-Depot*Pro (56.3), NH4+-Depot*Rhiz (57.7), NH4
+-
Broad. (58.3) and +P (57.3) (P<0.012). N-fertilizer application method had an effect on ear-
leaf P concentration (79 DAS) (Broad. > Depot; P < 0.0001, Table 6.3) whereas BE did not.
Ear-leaf P concentration for treatment +P (4.90 mg P g-1 DM) was higher than that for other
treatments. Zero had the lowest concentration (2.37 mg P g-1 DM), which was not different
from that of NH4+-Depot (3.31 mg P g-1 DM), NH4
+-Depot*Pro (3.40 mg P g-1 DM) or NH4+-
Depot*Rhiz (3.17 mg P g-1 DM). Similarly, N-fertilizer application method had an effect on
ear-leaf N concentration (79 DAS) (Broad > Depot; P = 0.0029, Table 6.3) whereas BE did
not. The concentration for Zero (2.52 %) was lower than that for each of the other treatments
(P ≤ 0.0485), among which ear-leaf N concentrations were not different between pairs.
At 81 DAS, N-fertilizer application method (P < 0.001) and BE (P = 0.005) positively
affected root length density (RLD) with a significant interaction between both factors (P =
0.003). RLD was doubled in soil on the sides of maize rows with a fertilizer depot (midway
point between rows 1 – 2, 3 – 4 and 5 – 6) in comparison to those sides without (midway
point between rows 2 – 3 and 4 – 5). RLD in the fertilizer-depot-zone was higher with Pro
than without (Fig. 6.5 a).

6: Improving fertilizer-depot exploitation by PGPM
128
N-fertilizer application method (despite NH4+-Depot – 7.69 Mg ha-1 being 7.4% higher than
that of NH4+-Broad– 7.16 Mg ha-1) and BE had no statistically significant effect on grain yield
(Table 6.3). As expected, Zero produced the lowest grain yield (6.31 Mg ha-1). Only NH4+-
Depot*NoBE (8.45 Mg ha-1) led to higher grain yields than Zero (P =0.0086).
Table 6.3. NH4+-application and bio-effector effects on Ear-leaf N and P, and grain yield
(Field experiment 2014)
Ear-leaf N conc.
(%)
Ear-leaf P conc.
(mg g-1)
Grain
(Mg ha-1)
LS Means NH4*BE
NH4+-Broad. 3.28 4.17 7.23
NH4+-Broad.*Pro 3.25 4.16 7.23
NH4+-Broad.*Rhiz 3.15 4.06 7.05
NH4+-Depot 3.02 3.31 8.35
NH4+-Depot*Pro 3.02 3.4 7.41
NH4+-Depot*Rhiz 2.91 3.17 7.36
Standard error 0.09 0.17 0.45
Two-Way ANOVA
NH4 application tech. 0.0029** <0.0001*** NS
NH4+-Broad. 3.22 ± 0.05 a 4.13 ± 0.09 a 7.16 ± 0.28
NH4+-Depot 2.99 ± 0.05 b 3.29 ± 0.09 b 7.69 ± 0.29
BE NS NS NS
NoBE 3.15 ± 0.06 3.74 ± 0.12 7.74 ± 0.34
Pro 3.14 ± 0.06 3.78 ± 0.12 7.35 ± 0.34
Rhiz 3.03 ± 0.06 3.61 ± 0.12 7.19 ± 0.34
P values are in italics; NS, no significant difference, P ≥ 0.1
; P < 0.1 is bold; * P < 0.5; ** P< 0.01; *** P< 0.001; Means ± standard errors not
sharing the same letters are significantly different from each other, Tukey test α =
0.05; NH4+-Broad.: starter fertilizer as mono-ammonium phosphate (MAP) followed
by broadcasting and incorporation stabilized (NH4)2SO4 over the canopy; NH4+-
Depot: Starter MAP and subsurface placement of concentrated stabilized (NH4)2SO4
solution in water at 10 cm soil depth; BE, bio-effector; NoBE, no bio-effector; Pro:
Pseudomonas sp. DSMZ 13134; Rhiz: Bacillus amyloliquefaciens FZB42; Ear-leaf
N and P (79 DAS, BBCH 61-75) and grain yield (172 DAS, BBCH 89-99)

6: Improving fertilizer-depot exploitation by PGPM
129
Field experiment 2015
There was severe soil compaction (> 15 cm depth) in many parts of the field site that led to
placement of starter fertilizer and the NH4+- fertilizer depot often at a shallower depth than
intended. Soil compaction also coincided with extreme drought and high temperatures in the
summer months which caused NH4+- fertilizer depots to be pulled up to the soil surface
forming a salt crust at several areas.
12 days after placement of fertilizer depots in treatment NH4+-Depot (48 DAS), soil NH4-N
concentration at 0 – 30 cm depth fertilizer depot zones (midway point between rows 1 – 2, 3 –
4 and 5 – 6; 337 kg NH4-N ha-1) was higher than that for zones without fertilizer depot
(midway point between rows 2 – 3 and 4 – 5; 1.8 kg NH4-N ha-1, P < 0.001).
At 48 DAS, plant heights were statistically similar for NH4+-Depot with or without BE (NH4
+-
Depot, 93 cm; NH4+-Depot*Pro, 95 cm; NH4
+-Depot*Rhiz, 93 cm). Only +P (107 cm) and
NH4+-Broad. (101 cm) plants were taller than Zero plants (83 cm, P ≤ 0.0476). At 71 DAS,
N-fertilizer application method affected plant height (Broad. > Depot, P = 0.0071) whereas
BE did not (Table 6.4). Only +P (235 cm), NH4+-Broad. (229 cm), and NH4
+-Broad.* Rhiz
(236 cm) plants were taller than Zero plants (210 cm, P ≤ 0.0485).

6: Improving fertilizer-depot exploitation by PGPM
130
Table 6.4. Sources of variation (Two-Way ANOVA, Field experiment 2015)
SPAD
68 DAS
Stem Ø 68
DAS
(mm)
Height 71
DAS (cm)
Biomass
F.M.
(Mg ha-1)
Biomass
D.M. (Mg
ha-1)
NH4+
-Broad.
-Depot
0.0087
53.5 a
52.1 b
0.0011
24.7 a
23.4 b
0.0071
230.8 a
222.7 b
0.0264
55.1 a
52.1 b
N.S.
19.6
18.6
BE_Band
-NoBE
-Pro
-Rhiz
N.S.
52.8
52.4
53.2
N.S.
24.0
23.9
24.2
N.S.
224.3
226.4
229.5
0.0635
51.9
55.6
53.2
0.0364
18.8 b
20.3 a
18.3 b
NH4 *
BE_Band
N.S. N.S. N.S. NS N.S.
DAS, days after sowing; Height, plant height; SPAD, estimate of leaf N
concentration; Stem Ø, stem diameter; P values are in italics; NS, no significant
difference, P ≥ 0.1; P < 0.1 is bold; Means not sharing the same letters are
significantly different from each other, Tukey test α = 0.05; NH4+-Broad.: starter
fertilizer as di-ammonium phosphate (DAP) followed by broadcasting and
incorporation stabilized (NH4)2SO4 before sowing; NH4+-Depot: Starter DAP and
subsurface placement of concentrated stabilized (NH4)2SO4 solution in water at 10
cm soil depth at 4 – 5 leaf stage; BE, bio-effector; Pro: Pseudomonas sp. DSMZ
13134; Rhiz: Bacillus amyloliquefaciens FZB42; Above-ground biomass (BBCH
85-87)
At 68 DAS, N-fertilizer application method had an effect on SPAD for the youngest fully
developed leaf (Broad. > Depot, P = 0.0087) whereas BE did not (Table 6.4). SPAD values
for all other treatments were higher than that for Zero (49, P ≤ 0.0336). At 68 DAS similarly,
N-fertilizer application method had an effect on stem diameter (Broad. > Depot; P = 0.0011)
whereas BE did not (Table 6.4). Stem diameter for +P (24.4 mm), NH4+-Broad. (24.6 mm),
NH4+-Broad.*Pro (24.8 mm) and NH4
+-Broad.*Rhiz (24.7 mm) only, were higher than that of
Zero (22.4 mm, P ≤ 0.0207).

6: Improving fertilizer-depot exploitation by PGPM
131
Like in 2014 furthermore, N-fertilizer depot positively affected root length density (RLD) (P
< 0.001). However, unlike in 2014, Pro had no effect. RLD doubled in soil in the sides of
maize rows with fertilizer depot (midway point between rows 1 – 2, 3 – 4 and 5 – 6) in
comparison to sides of maize rows without fertilizer depot (midway point between rows 2 – 3
and 4 – 5) (Fig. 6.5 b).
Figure 6.5. Root growth (A) and density (B) in NH4+-Depot and non-Depot row-sides
(Field 2014 and 2015)
NH4+-Depot: Side of maize row with concentrated stabilized (NH4)2SO4 solution placed as a
depot at 10 cm depth; No depot: Other side of maize row without an NH4+ fertilizer depot;
BE, bio-effector; NoBE, no bio-effector; Pro, Pseudomonas sp. DSMZ 13134. Different
letters between BE-levels show a significant BE-effect, ** P < 0.01 (Two-Way ANOVA,
Tukey test, α = 0.05). There was no BE-effect in 2015. There was strong NH4+-Depot-effect
on RLD in both 2014 (P< 0.001) and 2015 (P< 0.001)

6: Improving fertilizer-depot exploitation by PGPM
132
N-fertilizer application method affected fresh above-ground biomass yield (Broadcast >
Depot, P=0.03) whereas BE had only a marginal effect (Pro > NoBE, P=0.06) (Table 6.4).
Inoculation of Pro showed a tendency to produce about 4.5 % higher fresh biomass than Rhiz
(P = 0.15). Fresh above-ground biomass of Zero (46.0 Mg ha-1) was less than that for +P
(55.0 Mg ha-1), NH4+-Broad.*Pro (56.6 Mg ha-1), NH4
+-Broad.*Rhiz (56.5 Mg ha-1), and
NH4+-Depot*Pro (54.6 Mg ha-1) (P < 0.0293).
N-fertilizer application method had no effect on dry above-ground biomass whereas BE had
an effect (P=0.0364). Banding of Pro below the seed row led to higher dry shoot biomass
than banding of Rhiz or without BE inoculation (Table 6.4). Pro led 10.9 % (P = 0.035)
higher dry biomass than Rhiz. Dry above-ground biomass for treatments +P (20.2 Mg ha-1),
NH4+-Broad.*Pro (20.1 Mg ha-1) and NH4
+-Depot*Pro (20.5 Mg ha-1) were higher than that
for Zero (16.8 Mg ha-1, P < 0.0245).
6.5 Discussion
In the pot experiment, inoculation of Pseudomonas strongly improved shoot P content. This
was likely a result of improved plant P-acquisition from soil P pools that were previously not
plant-available. Strong response of maize growth to inoculated Pseudomonas may have been
possible due to high root colonization by Pseudomonas which could result from high
inoculation rates and inoculation directly on the seed, seeding-hole and fertilizer depot. If N is
not limiting, optimal P supply enables plants to establish large leaf areas, which increases
photosynthesis and growth rate, thus, resulting in more dry-biomass production than under P
limitation (Grant et al., 2001).
In the rhizobox experiment, higher root length density (RLD) in soil around the fertilizer
depot in comparison to that in soil distant from the depot or in soil with homogenous supply
of NO3-, was due to high concentrations of root-growth stimulating NH4
+ present within the
depot. NH4+ is known to strongly stimulate lateral root initiation and elongation at the site of
6: Improving fertilizer-depot exploitation by PGPM
133
contact with roots (Jing et al., 2010; Anghinoni and Barber, 1990; Drew, 1975; Jing et al.,
2012). However, the set-up of the rhizobox experiment did not make it possible to attribute
the increase in RLD around the localized N-depot between localized N supply by placement
and N supply as NH4+ differentially. Increased N-depot RLD could only be attributed to both.
In our natural soil-based substrate without any water-tight barriers against mass flow and
diffusion of N-sources like NO3- or CO(NH2)2, localized N supply could only be possible by
localized placement of stabilized NH4+. NH4
+ was stabilized with the nitrification inhibitor
DMPP and further, by using a highly concentrated and toxic NH4+ solution, which also
inhibits oxidation of NH4+ by soil microorganisms (Shaviv, 1988). Improved establishment of
Pseudomonas in the fertilizer depot zone was due to increased root density in the depot-zone,
which was likely associated with high levels of nutrients for rhizobacteria released as organic
compounds in root exudates (Lugtenberg and Kamilova, 2009). Shoot P and N content were
mainly influenced by N fertilizer form. Inoculation of Pseudomonas led only to a marginal
increase in shoot N concentration. Rhizosphere acidification induced by NH4+-nutrition (Jing
et al., 2010) is known to enhance solubility of sparingly soluble calcium phosphates in soil,
which also build up after application of water-soluble phosphates on neutral to alkaline soils
(Lu et al., 1987; Moody et al., 1995). Furthermore, soil acidification inhibits NH3
volatilization from urea or NH4+ fertilizers placed in soil (Ma et al., 2013).
In the pot and rhizobox experiments, improved plant growth was associated with marked
increase in shoot P content without change in shoot P concentration. Shoot P concentration
stayed the same or increased marginally. An explanation could be that on the low P soils,
plant P status was already in the critical range for deficiency with a threshold concentration of
0.25 – 0.4% (Barry and Miller, 1989). Under these conditions, any surplus in P supply and P
uptake is immediately utilized for biomass production leading to dilution of P concentrations,
which then restores the initial critical P concentrations. This suggests that positive PGPM

6: Improving fertilizer-depot exploitation by PGPM
134
effects on plant growth may be more achievable on soils with moderate fertility than on very
poor or highly fertile soils.
Under field conditions, placement of NH4+ fertilizer as a subsurface depot sustained high
NH4+ concentrations within the depot-zone that stimulated intense depot-zone root growth.
Sustained high concentrations of NH4+ within the depot was attributable on the one hand, to
NH4+-stabilization effect of the nitrification-inhibitor (Zerulla et al., 2001) and on the other, to
high, toxic NH4+ concentrations in the depot. In 2014, root density in the fertilizer depot-zone
was higher with inoculation of Pseudomonas than without, indicating a potential for
inoculated PGPMs to enhance root exploitation of subsurface N-fertilizer depots.
Unlike in the rhizobox experiment, N fertilization by subsurface placement of NH4+ as a depot
did not improve shoot N and P status under field conditions. A reason could be that the
fertilizer depot was closer to the maize seed in the rhizobox and pot experiments (5 x 5 cm)
than in the field experiments (38 x 5 cm). Therefore, despite root growth within the fertilizer
depot under field conditions at later growth stages, the distance between the depot and maize
plants may have limited N acquisition from the depot. Therefore, it may be recommended that
subsurface fertilizer depots should be placed as close to seeds as possible (5 x 5 cm) as long
as fertilizer toxicity effects on seeds or young plants can be avoided. For this purpose,
fertilizer placement in subsurface soil should be done at sowing or soon after to avoid
mechanical damage to deeper and broader growing roots of plants at later growth stages.
Although field soil had moderate levels of plant-available P, additional P fertilization led to
improved shoot P status (2014). However, this did not lead to improved grain yield (2014) or
improved yield of above-ground biomass (2015), suggesting that P was not the most limiting
nutrient in the field sites. In 2014, placement of NH4+ as a depot led marginally to higher
grain yield than broadcast and incorporation of NH4+ whereas application of PGPM did not
affect grain yield. A reason for the weak effect of the fertilizer depot could be the moderate

6: Improving fertilizer-depot exploitation by PGPM
135
initial Nmin level of the field soil. Furthermore, soil Nmin likely increased later in season as soil
organic matter mineralization by soil microorganisms probably increased in the warm summer
months. This explanation is supported by the high yield recorded for the unfertilized control
treatment.
In the field in 2015, NH4+-fertilizer application by broadcast and incorporation led to higher
yield in fresh above-ground biomass than by placement as a subsurface depot. One reason
could be that plants supplied with N by broadcast and incorporation before sowing were able
to acquire more N during critical early growth stages than those supplied with N by placement
of a subsurface N-depot at 5 – 6 leaf stage, more than one month after sowing. Another reason
could be that severe drought that followed placement of fertilizer as a subsurface depot
inhibited N acquisition. Firstly, there was insufficient moisture for optimal N uptake from the
fertilizer depot, and secondly, rapid water loss from the soil caused fertilizer depot salts to be
pulled up from the soil to the surface forming unavailable salt crusts.
In 2014, inoculation of Pseudomonas did not increase maize grain yield. It may be attributed
to PGPM application technique as well as to absence of severe environmental stress factors.
Application of a large quantity of inoculum (on hectare basis) as a suspension of viable cells
in water by broadcast and incorporation may have been unfavorable for inoculum survival and
propagation due to exposure to the biotic and abiotic environment.
In 2015, inoculation of Pseudomonas as a below-seed band led to higher dry above-ground
biomass than inoculation with Bacillus amyloliquefaciens or without inoculation of PGPM.
This yield increase associated with Pseudomonas was not linked to improved root density in
the fertilizer depot or improved leaf N status. Maize growth-promotion effect of inoculated
Pseudomonas seemed to have depended on the one hand, on high Pseudomonas
concentrations present in the immediate surrounding of maize seeds due to placement of
inoculum as a below-seed band, producing a high critical PGPM density at the root-zone

6: Improving fertilizer-depot exploitation by PGPM
136
required for optimal PGPM effects on plant growth (van Veen et al., 1997; Lugtenberg and
Kamilova, 2009). On the other hand, it may have depended on favorable protective micro-
environments for inoculum survival and propagation provided by pore-spaces in pumice
stones used as carrier (van Veen et al., 1997). Given extended drought and high temperatures
on the field in 2015, plant growth-promotion by Pseudomonas may have occurred via
induction of resistance to the prevalent abiotic stress factors. Pseudomonas are producers of
the enzyme 1-aminocyclopropane-1-carboxylate (ACC)-deaminase, which utilizes ACC, the
precursor of ethylene thereby lowering plant ethylene levels and stimulating resistance to heat
and drought stress (Glick, 2005; Naveed et al., 2008; Shaharoona et al., 2006; Zahir et al.,
2006).
Protective pore spaces in the pumice stone carrier employed in 2015 may have also
functioned at the same time as a slow-release tool for viable cells to be progressively supplied
to plant roots. Additionally, nutrients for PGPM provided in the inoculum product (skimmed
milk for Pseudomonas) may have been protected within the pore spaces from utilization by
other non-target soil microorganisms. Therefore, with pumice stones as carrier, Pseudomonas
cells may have been able to safely multiply within the protected niche of pore spaces. It is
important to note that, with respect to low inoculation rates in the field experiment, the
amount skimmed milk powder present in the Pseudomonas inoculum formulation had no
direct plant fertilization significance. Due to smaller amounts of inocula required for PGPM
application as a below-seed band, high quantities of inoculum and associated high costs for
application by broadcast and incorporation can be avoided.
Because PGPM effects on plant growth largely depends on viability of inoculated cells in soil
(van Veen et al., 1997; Lugtenberg and Kamilova, 2009), it may be worthwhile to also test
non-microbial bio-effectors with root growth-promoting properties in combination with
placement of subsurface fertilizer depots. In this context, such non-microbial bio-effectors

6: Improving fertilizer-depot exploitation by PGPM
137
may be particularly effective under conditions where PGPM activity is inhibited by
unfavorable environmental conditions. Seaweed extracts with proven protective activity
against abiotic stresses (Sangha et al., 2014) could be promising candidates.
Growth promotion effects of tested inoculated Pseudomonas on maize seemed also to have
been determined by soil type and soil fertility level (especially for P). PGPM growth-
promotion effect on maize was higher on low-P grassland soil (Pot) or low-P loess subsoil
(Rhizobox) than on silty loam field soil with moderate levels of plant-available P.
Similarly to PGPM plant growth-promotion effects, growth-promotion effects of subsurface
placed fertilizer depends on plant nutrient status, which in turn depends on initial soil fertility
level or initial plant nutrient supply (Grant et al., 2001; Buah et al., 2000; Borges and
Mallarino, 2001).
6.6 Conclusions
We hypothesized that: (1) (2) Marked rhizosphere acidification occurs within and around a
“rhizosphere hotspot” formed by placement of an NH4+-depot in soil. (3) Survival and
colonization of inoculated PGPMs is higher in the “rhizosphere hotspot” than in comparable
soil zones with respect to plant position supplied homogeneously with NO3- fertilizer. (4)
Inoculated and established PGPMs further promote root development around the NH4+-depot
zone. (5) Consequently, NH4+-depot fertilization combined with inoculated PGPMs will result
in higher nutrient uptake and higher yields than NH4+-depot fertilization without PGPMs.
Placement NH4+-fertilizer as a subsurface depot stimulated the formation of “rhizosphere
hotspots” with intense root growth. Marked rhizosphere acidification within and around an
NH4+-induced “rhizosphere hotspots” led to improved plant P and N uptake. Combination of
fertilizer placement in subsurface soil with inoculation of the PGPM Pseudomonas sp. DSMZ
13134 in soil led to improved plant growth-promotion effects under greenhouse and field
conditions, however, with low reproducibility. Reproducible results may be achieved through

6: Improving fertilizer-depot exploitation by PGPM
138
optimization of PGPM inoculation techniques to enhance their survival in often hostile
environmental conditions in field soil and through improvement of subsurface fertilizer
placement to ensure optimal nutrient availability to target crop plants. PGPM application
techniques involving stable dry spore formulations or viable cells in drought-resistant
protective capsules or alginate may be promising options.

6: Improving fertilizer-depot exploitation by PGPM
139
6.7 References
Anghinoni, I., Barber, S. A. (1990): Predicting the effect of ammonium placement on nitrogen
uptake by corn. Agron J, 82(1):135–138.
Arshad, M., Waqas, R. (2011): Novel bacteria possessing ACC-deaminase enzyme enhances the
water use efficiency in field crops. Int Post J Sci Technol 1 (1): 2.
Barber, S. A. (1984): Soil nutrient bioavailability. A mechanistic approach. Wiley, New York
U.S.A.
Barea, J. M., Toro, M., Orozco, M. O., Campos, E., Azcon, R. (2002): The application of isotopic
(32P and 15N) dilution techniques to evaluate the interactive effect of phosphate-
solubilizing rhizobacteria, mycorrhizal fungi and Rhizobium to improve the agronomic
efficiency of rock phosphate for legume crops. Nutr Cycl Agroecosys 63:35–42.
Barry, D. A. J., Miller, M. H. (1989): Phosphorus Nutritional Requirement of Maize Seedlings for
Maximum Yield. Agron J 81(1):95–99.
Blackshaw, R. E., Semach, G., Janzen, H. H. (2002): Weed Science Society of America - Fertilizer
application method affects nitrogen uptake in weeds and wheat. Weed Sci 50(5):634–641.
Bonkowski, M., Cheng, W., Griffiths, B. S., Alphei, J., Scheu, S. (2000): Microbial-faunal
interactions in the rhizosphere and effects on plant growth. Eur J Soil Biol (36):135–147.
Borges, R., Mallarino, A. P. (2001): Deep Banding Phosphorus and Potassium Fertilizers for Corn
Managed with Ridge Tillage. Soil Sci Soc Am. J 65:376–384.
Buah, S., Polito, T. A., Killorn, R. (2000): No‐tillage corn response to placement of fertilizer
nitrogen, phosphorus, and potassium. Commun Soil Sci Plant Anal 31(19-20):3121–3133.
Cooke, G. W. (1954): Recent advances in fertilizer placement. II.—Fertilizer placement in
england. J Sci Food Agric 5(9):429–440.
Drew, M. C. (1975): Comparison of the effects of a localised supply of phosphate, nitrate,
ammonium and potassium on the growth of the seminal root system, and the shoot, in
barley. New Phytol 75(3):479–490.
Dutta, D., Bandyopadhyay, P. (2009): Performance of chickpea (Cicer arietinum L.) to application
of phosphorus and bio-fertilizer in laterite soil. Arch Agron Soil Sci 55(2):147–155.
Ferris, H., Venette, R. C., van der Meulen, H., Lau, S. S. (1998): Nitrogen mineralization by
bacterial-feeding nematodes: verification and measurement. Plant Soil 203:159–171.
Frey-Klett P., Garbaye J., Tarkka M. (2007): The mycorrhiza helper bacteria revisited. New
Phytol 176(1):22–36.
Fröhlich, A., Buddrus-Schiemann, K., Durner, J., Hartmann, A., Rad, U. von (2012): Response
of barley to root colonization by Pseudomonas sp. DSMZ 13134 under laboratory,
greenhouse, and field conditions. J Plant Interact 7(1):1–9.
Gericke, S., Kurmies, B. (1952): Colorimetrische Bestimmung der Phosphorsäure mit Vanadat-
Molybdat. Z Anal Chem 137(1):15-22.
Ghorbani, R., Wilcockson, S., Koocheki, A., Leifert, C. (2008): Soil management for sustainable
crop disease control: a review. Environ Chem Lett 6(3):149–162.

6: Improving fertilizer-depot exploitation by PGPM
140
Glick, B. R. (2005): Modulation of plant ethylene levels by the bacterial enzyme ACC
deaminase. FEMS Microbiol Lett 251(1):1–7.
Grant, C. A., Flaten, D. N., Tomasiewicz, D. J., Sheppard, S. C. (2001): The importance of early
season phosphorus nutrition. Can J Plant Sci 81(2):211–224.
Halpern, M., Bar-Tal, A., Ofek, M., Minz, D., Muller, T., Yermiyahu, U. (2015): Chapter Two -
The use of biostimulants for enhancing nutrient uptake. Adv Agron 130:141–174.
Häussling, M., Leisen, E., Marschner, H., Römheld, V. (1985): An improved method for non-
destructive measurements of the ph at the root-soil interface (Rhizosphere). J Plant
Physiol 117(4):371–375.
Hawkesford, M., Horst, W., Kichey, T., Lambers, H., Schjoerring, J., Møller, I. S., White, P.
(2012): Functions of macronutrients. In: Marschner P., editor. Marschner's Mineral
Nutrition of Higher Plants, 3rd ed., Academic Pr, United States of America; 135–178.
Jiang, Y., Wu, Y., Xu, W., Cheng, Y., Chen, J., Xu, L., Hu, F., Li, H. (2012): IAA-producing
bacteria and bacterial-feeding nematodes promote Arabidopsis thaliana root growth in
natural soil. Eur J Soil Biol 52:20–26.
Jing, J., Rui, Y., Zhang, F., Rengel, Z., Shen, J. (2010): Localized application of phosphorus and
ammonium improves growth of maize seedlings by stimulating root proliferation and
rhizosphere acidification. Field Crop Res 119(2-3):355–364.
Jing, J., Zhang, F., Rengel, Z., Shen, J. (2012): Localized fertilization with P plus N elicits an
ammonium-dependent enhancement of maize root growth and nutrient uptake. Field Crop
Res 133:176–185.
Linquist, B. A., Adviento-Borbe, M. A., Pittelkow, C. M., van Kessel, C., van Groenigen, K. J.
(2012): Fertilizer management practices and greenhouse gas emissions from rice systems:
A quantitative review and analysis. Field Crop Res 135:10–21.
Lu, D. Q., Chien, H. S., Henao, J., Sompongse, D. (1987): Evaluation of short-term efficiency of
diammonium phosphate versus urea plus single superphosphate on a calcareous soil.
Agron J 79(5):896–900.
Lugtenberg, B., Kamilova, F. (2009): Plant-Growth-Promoting Rhizobacteria. Annu Rev
Microbiol 63(1):541–556.
Ma, B. L., Wu, T. Y., Tremblay, N., Deen, W., McLaughlin, N. B., Morrison, M. J., Stewart, G.
(2010): On-farm assessment of the amount and timing of nitrogen fertilizer on ammonia
volatilization. Agron J 102(1):134–144.
Mao, X., Hu, F., Griffiths, B., Li, H. (2006): Bacterial-feeding nematodes enhance root growth of
tomato seedlings. Soil Biol Biochem 38(7):1615–1622.
Ma, Q., Zhang, F., Rengel, Z., Shen, J. (2013): Localized application of NH4 +-N plus P at the
seedling and later growth stages enhances nutrient uptake and maize yield by inducing
lateral root proliferation. Plant Soil 372(1-2):65-80.
Marschner, H., Römheld, V. (1983): In vivo measurement of root-induced ph changes at the soil-
root interface: effect of plant species and nitrogen source. Z Pflanzenphysiol 111(3):241–
251.
Mauricio, R. (2005): Mycorrhiza helper bacteria: a promising model for the genomic analysis of
fungal–bacterial interactions. New Phytol 168:1–4.

6: Improving fertilizer-depot exploitation by PGPM
141
Mohite, B. (2013): Isolation and characterization of indole acetic acid (IAA) producing bacteria
from rhizospheric soil and its effect on plant growth. J Soil Sci Plant Nutr 13:638–649.
Moody, P. W., Edwards, D. G., Bell, L. C. (1995): Effect of banded fertilizers on soil solution
composition and short-term root-growth .2. Mono-ammonium and di-ammonium
phosphates. Soil Res 33(4):689–707.
Nash, P. R., Motavalli, P. P., Nelson, K. A. (2012): Nitrous oxide emissions from claypan soils
due to nitrogen fertilizer source and tillage/fertilizer placement practices. Soil Sci Soc Am
J 76(3):983–993.
Naveed M., Khalid M., Jones D. L., Ahmad R., Zahir Z.A. (2008): Relative efficacy of
Pseudomonas spp., containing ACC-Deaminase for improving growth and yield of maize
(Zea mays L.) in the presence of organic fertilizer. Pak J Bot 40:1243–1251.
Neumann, G., Römheld, V. (2012): Rhizosphere chemistry in relation to plant nutrition. In:
Marschner P., editor. Marschner's Mineral Nutrition of Higher Plants, 3rd ed., Academic
Pr, United States of America; 347–360.
Nieder, R., Benbi, D., Scherer, H. (2011): Fixation and defixation of ammonium in soils: a
review. Biol Fert Soils 47(1):1–14.
Nkebiwe, P. M., Weinmann, M., Bar-Tal, A., Müller, T. (2016): Fertilizer placement to improve
crop nutrient acquisition and yield: A review and meta-analysis. Field Crops Research
196, 389–401.
Petersen, J. (2005): Competition between weeds and spring wheat for 15N-labelled nitrogen
applied in pig slurry. Weed Res 45:103–113.
Reith, J. W. S. (1954): Recent advances in fertilizer placement. I. Fertilizer placement for swedes
and turnips in Scotland. J Sci Food Agric 5(9):421–428.
Richardson, A., Barea, J.-M., McNeill, A., Prigent-Combaret, C. (2009): Acquisition of
phosphorus and nitrogen in the rhizosphere and plant growth promotion by
microorganisms. Plant Soil 321(1-2):305-339.
Robinson, D. (1994): The responses of plants to non-uniform supplies of nutrients. New Phytol
127(4):635–674.
Ruidisch, M., Bartsch, S., Kettering, J., Huwe, B., Frei, S. (2013): The effect of fertilizer best
management practices on nitrate leaching in a plastic mulched ridge cultivation system.
Agr Ecosyst Environ 169:21–32.
Sangha, J. S., Kelloway, S., Critchley, A. T., Prithiviraj, B. (2014): Seaweeds (macroalgae) and
their extracts as contributors of plant productivity and quality: the current status of our
understanding. Sea Plants 71:189–219.
Schaller, G., Fischer, W. R. (1985): pH-Änderungen in der Rhizosphäre von Mais- und
Erdnußwurzeln. Z Pflanzenernaehr Bodenk 148(3):306–320.
Shaharoona B., Arshad M., Zahir Z. A., Khalid A. (2006): Performance of Pseudomonas spp.
containing ACC-deaminase for improving growth and yield of maize (Zea mays L.) in the
presence of nitrogenous fertilizer. Soil Biol Biochem 38(9):2971–2975.
Shakir, M. A., Bano, A., Arshad, M. (2012): PGPR with ACC deaminase confer drought
tolerance wheat. Soil Environ 31(1):108–112.

6: Improving fertilizer-depot exploitation by PGPM
142
Sharma, S. H. S., Lyons, G., McRoberts, C., McCall, D., Carmichael, E., Andrews, F., Swan, R.,
McCormack, R., Mellon, R. (2012): Biostimulant activity of brown seaweed species from
Strangford Lough: compositional analyses of polysaccharides and bioassay of extracts
using mung bean (Vigno mungo L.) and pak choi (Brassica rapa chinensis L.). J Appl
Phycol 24(5):1081–1091.
Shaviv, A. (1988): Control of nitrification rate by increasing ammonium concentration. Fert Res
17(2):177-188.
Sommer, K. (2005): CULTAN-Düngung: physiologisch, ökologisch, ökonomisch optimiertes
Düngungsverfahren für Ackerkulturen, Grünland, Gemüse, Zierpflanzen und Obstgehölze.
Verlag Th. Mann, Gelsenkirchen-Buer, Germany; 2005.
Sugimoto, E. E., Hoitink, H. A. J., Tuovinen, O. H. (1990): Enumeration of oligotrophic
rhizosphere pseudomonads with diluted and selective media formulations. Biol Fertil Soils
9(3):226-230.
van Veen, J. A., van Overbeek, L. S., van Elsas, J. D. (1997): Fate and Activity of
Microorganisms Introduced into Soil. Microbiol Mol Biol R 61(2):121–135.
Weinmann M, Römheld V. (2012): Resource preservation by application of bioeffectors in
european crop production (research project proposal): European Community's Seventh
Framework Programme (FP7/2007-2013) under grant agreement n° 312117
(BIOFECTOR). University of Hohenheim, 2012. www.biofector.org, 10.02.2016
Yang, J., Kloepper, J. W., Ryu, C.-M. (2009): Rhizosphere bacteria help plants tolerate abiotic
stress. Trends Plant Sci 14(1):1–4.
Yusran, Y., Safrizal, S., Weinmann, M., Neumann, G., Müller, T., Römheld, V. (2007): Improved
mycorrhisation in tomato by soil inoculation with Pseudomonas sp. proradix®. In:
Tielkes, E., Editor. Utilisation of Diversity in Land Use Systems: Sustainable and Organic
Approaches to Meet Human Needs. Book of Abstracts, Cuvillier Verlag, Göttingen,
Germany 513–514.
Zahir Z. A., Ghani U., Naveed M., Nadeem S. M., Asghar H. N. (2009): Comparative
effectiveness of Pseudomonas and Serratia sp. containing ACC-deaminase for improving
growth and yield of wheat (Triticum aestivum L.) under salt-stressed conditions. Arch
Microbiol 191(5):415–424.
Zerulla, W., Barth, T., Dressel, J., Erhardt, K., Horchler von Locquenghien, K., Pasda, G.,
Rädle, M., Wissemeier, A. (2001): 3,4-Dimethylpyrazole phosphate (DMPP) - a new
nitrification inhibitor for agriculture and horticulture. Biol Fert Soils 34(2):79–84.

7: Improving plant P-acquisition from sparingly soluble inorganic P by PGPM
143
7 Mobilization of sparingly –soluble soil P and alternative P-fertilizers by bio-effectors
7.1 Screening bio-effectors for ability to mobilize soil-P for improved maize growth
Dr. Brigitta Tóth, a visiting post-doc researcher, contributed by up to15% in the workload for
the experiment described in this section.
Address: Institute of Crop Science, Debrecen University, Debrecen 4002 Hungary
Email: [email protected]
Background and objectives
Several microbial bio-effectors (BEs) are commercially available and many more are being
isolated, characterized, tested, produced and marketed. However, the benefits of BEs
promised by the producers – improvement of crop performance through mechanisms such P-
mobilization, improved root growth and vitality, induction of local and systemic
resistance/tolerance to biotic and abiotic stresses - are sometimes not realized even in
greenhouse conditions (Schenck zu Schweinsberg-Mickan and Müller 2009) and remain
frequently unachieved in field conditions (Lugtenberg and Kamilova 2009). In addition to
other factors that determine and influence BE effectiveness, compatibility between BE strain
and plant variety is an important factor. This has been shown for effective root colonization
specifically in Zea mays L. var Mo17 by the BE strain Trichoderma harzianum T-22
(Harman et al. 2004; Harman 2006). The objectives of this experiment were: 1.) to screen
various commercially available and novel microbial BEs for their ability to improve plant P
acquisition from sparingly-available soil pools and therefore, promote plant growth. 2.) to
investigate differences in performance for four selected strains of Trichoderma harzianum in
pair-wise combinations with two varieties of Zea mays L.

7: Improving plant P-acquisition from sparingly soluble inorganic P by PGPM
144
Hypotheses
• BE inoculated in a growth substrate with low available-P levels improves P acquisition
and growth of maize plants via mobilization of moderately labile soil-P and/or improved
root growth for spatial P acquisition.
• Growth response of maize to Trichoderma harzianum inoculated in the substrate is
affected by both T. harzianum strain and maize variety.
Methodology
Maize (Zea mays L.) was grown in 1 L pots (7 cm Ø, 25 cm height) containing a substrate
composed of two parts(v/v) low-P loam soil (sieved 5 mm Ø, 713 g FM pot-1; pHCaCl2 6.9;
PCAL 35 mg P kg-1: KCAL 180.5 mg K kg-1) that was obtained from Kleinhohhenheim, an
organic farming research station of the University of Hohenheim (N 48° 44' 7.65", E 9° 12'
4.72"). 1 part quartz sand (0.6-1.2 mm Ø) was added per pot (620 g DM pot-1). NO3- was
chosen because it is commonly used by farmers (e.g. calcium ammonium nitrate) and maize
was chosen as a test-crop because of its weak ability to mobilize soil P and its sensitivity to
low soil plant-available P levels. Fertilization included: 100 mg NO3-N kg -1 dry soil as
Ca(NO3)2; and 150 mg P as soluble (Ca(H2PO4)2 (Only for the positive P control, +P).
Moisture was set to 18 % (60% max. WHC). Approximately 1400 g substrate was filled in
each pot. Tested BEs included: Trichoderma harzianum WG (Trichoderma-WG, WG
Prophyta GmbH, Germany, now acquired by Bayer Crops Science), Trichoderma harzianum
OmG-08 (Tichoderma OmG-08, OmG08, Anhalt University of Applied Science, Germany-
HS Anhalt); Trichoderma harzianum T50 (Vitalin T50, T50, Vitalin GmbH, Germany);
Trichoderma harzianum -T22 (Trianum-P, T-22, Koppert, Netherlands); Penicillium sp. PK
112 (Biological Fertilizer DC, BFDC, Prophyta GmbH/Bayer Crops Science); Pseudomonas
sp. DSMZ 13134 (Proradix®, Pro, Sourcon Padena, Germany); Bacillus amyloliquefaciens
FZB42, Rhizovital®, Rhiz.; Bacillus simplex R41 (cold-adapted strain), B.s.R41; Bacillus

7: Improving plant P-acquisition from sparingly soluble inorganic P by PGPM
145
atrophaeus, B.atr.; Bacillus spec, B.spec. (the last four BEs obtained from ABiTEP GmbH,
Berlin, Germany); and three BE consortia – Phylazonit, Phyl, (comprising: Azotobacter
chrococcum, Bacillus megaterium); Bactofil, Bact, (comprising: Azospirillum brasilense,
Azotobacter vinerólandii, B. megaterium, Bacillus polymyxa, Pseudomonas fluorescens,
Sterptomyces albus) and MegaNit, Meg, (comprising: A. chroccoccum, Azospirillum ssp., B.
megaterium, Bacillus subtilis) (BE consortia were obtained from Corvinus University of
Budapest, Hungary).
The first set of treatments was comprised of two factorial combinations of four T. harzianum
strains and two Zea mays L. varieties: Colisee (KWS Saat SE, Germany) and Maxxis
(R.A.G.T Saaten Deutschland GmbH, Germany). The second set of treatments included the
remaining nine BEs tested on Zea mays L. var. Maxxis. There were two non-inoculated
controls: one without (NoBE) and one with added soluble P and wihout BE (NoBE+P).
Each BE was suspended in 2.5 mM CaSO4 to a concentration of 1 x 10¹⁰ spores or CFU’s L-1.
20 ml of each suspension was pipetted directly on the surface of the substrate after seeding (2
x 108 spores or CFUs pot-1). Phylazonit, Bactofil and Meganit were each diluted in 2.5 mM
CaSO4 and applied (also 20 ml pot-1) at the rate of 1 ml kg-1 soil. Control pots receive 20 ml
2.5 mM CaSO4.
There were five replicates per treatment arranged in a completely randomized design.
Greenhouse conditions were: day/night length: 16 h/8 h; av. daytime light intensity: 428 µmol
m-2s-1 (ALMEMO 239-3, AHLBORN); av. daily air temperature, 24°C (Min. 17.3 °C, Max
28.6 °C) and av. daily relative humidity, 31% (Min. 19.1%, Max. 43.9 (Voltcraft, DL-141
TH). Plants were grown for 30 days (24 May - 25 June 2013).

7: Improving plant P-acquisition from sparingly soluble inorganic P by PGPM
146
Results
There was an interaction between T. harzianum strain and maize variety only for shoot P
concentration (Table 7.1). The best performing pairs were T50*Colisee and
T.OmG08*Maxxis. With Colisee, the decreasing order of performance of T. harzianum
strains was: T50 > T.-22 > WG>OmG08, whereas with Maxxis it was: OmG08 > T-22 > T50
>WG. Shoot P content for Maxxis was higher than that for Colisee. T50 led to the highest
shoot P content whereas WG led to the lowest. Root length density for WG was less than that
for other T. harzianum strains.
Table 7.1. Source of variation and Least square means (Two-way ANOVA, ns P>0.1)
T.
harzia-
num
strain:
WG OmG0
8
T50 T-22 Maize
variety
Colisee Maxxis T. harzianum
strain*Maize
variety
Shoot
DM (g
plant-1)
0.037 1.43 1.54 1.53 1.37 0.046 1.51 a 1.42 b ns
Shoot P
conc.
(mg P
g-1)
<0.001 1.53 1.63 1.72 1.74 0.018 1.61 1.70 0.001
Shoot P
content
(mg P
plant-1
<0.001 2.12 c 2.47 ab 2.62 a 2.38 bc ns 2.41 2.40 0.081
Root
DM (g
plant-1)
ns 0.76 0.76 0.71 0.74 ns 0.76 0.73 ns
Root
length
density
(cm
cm-3)
<0.001 14.1 c 20.5 a 24.3 a 19.5 a <0.001 16.4 b 22.9 a ns
With the maize variety Maxxis, BEs did not lead to increased shoot biomass, shoot P content
or root length density (Fig. 7.1). T. harzianum WG showed a tendency to reduce shoot P
content and concentration, and root length density.
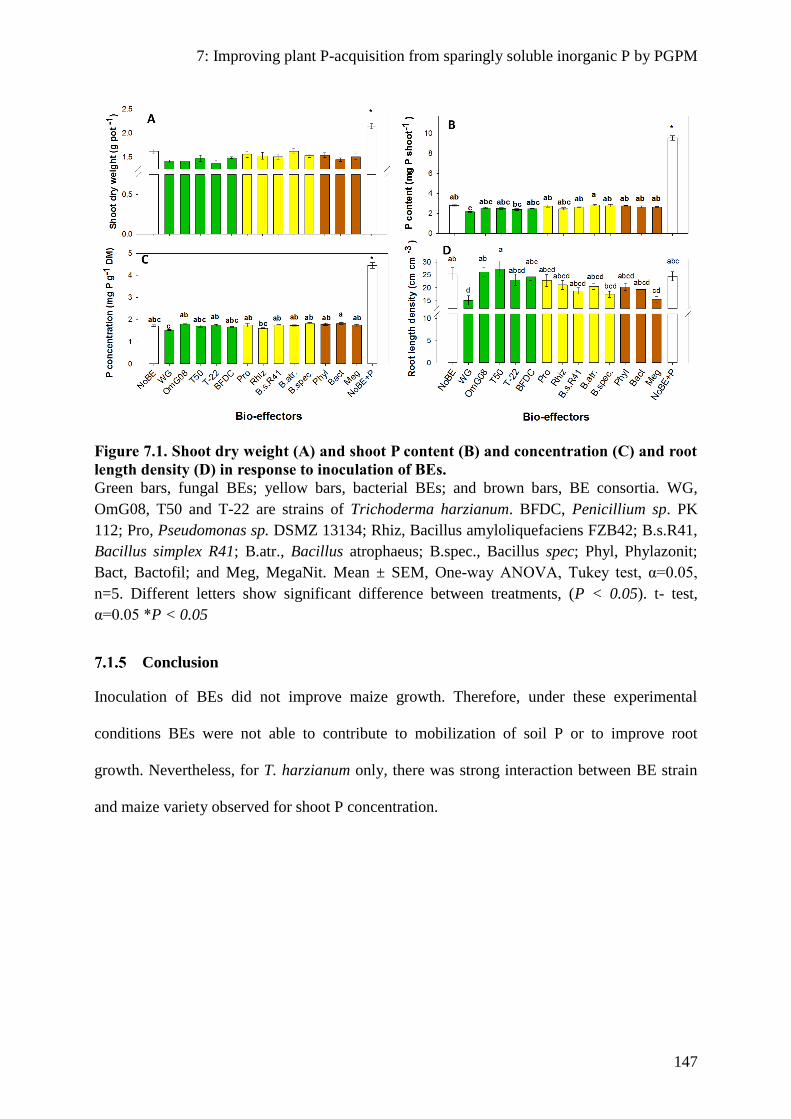
7: Improving plant P-acquisition from sparingly soluble inorganic P by PGPM
147
Figure 7.1. Shoot dry weight (A) and shoot P content (B) and concentration (C) and root
length density (D) in response to inoculation of BEs.
Green bars, fungal BEs; yellow bars, bacterial BEs; and brown bars, BE consortia. WG,
OmG08, T50 and T-22 are strains of Trichoderma harzianum. BFDC, Penicillium sp. PK
112; Pro, Pseudomonas sp. DSMZ 13134; Rhiz, Bacillus amyloliquefaciens FZB42; B.s.R41,
Bacillus simplex R41; B.atr., Bacillus atrophaeus; B.spec., Bacillus spec; Phyl, Phylazonit;
Bact, Bactofil; and Meg, MegaNit. Mean ± SEM, One-way ANOVA, Tukey test, α=0.05,
n=5. Different letters show significant difference between treatments, (P < 0.05). t- test,
α=0.05 *P < 0.05
Conclusion
Inoculation of BEs did not improve maize growth. Therefore, under these experimental
conditions BEs were not able to contribute to mobilization of soil P or to improve root
growth. Nevertheless, for T. harzianum only, there was strong interaction between BE strain
and maize variety observed for shoot P concentration.

7: Improving plant P-acquisition from sparingly soluble inorganic P by PGPM
148
7.2 Growth-promoting effects of Pseudomonas sp. DSMZ 13134 on maize plants upon
homogenous or placed application of soluble N and sparingly available P-fertilizer
Background and objectives
As discussed in section 3.1, for nutrients with very poor mobility in soil such as H2PO4-
/HPO42-, NH4
+ or alternative P-fertilizers with poor solubility in soil (like rock phosphate,
apatite-rich sewage sludge ash or struvite), placement of fertilizers in the sowing row under
field conditions may be more effective to improve plant nutrient acquisition than conventional
broadcast and incorporation in the entire plough layer. If placed root-attracting NH4+ persists
in soil (stabilization of NH4+ by nitrification inhibitors or by use of high NH4
+ concentrations
to inhibit microbial nitrification), intense localized root growth is induced in the soil volume
around the fertilizer-depot, thereby enhancing root-exploitation of nutrients in the soil
volume. In comparison to field conditions, fertilizer placement in pots is less effective to
create localized nutrient supply because with time, N originating from placed NH4+ diffuses
into the entire restricted pot soil volume (with or without nitrification) and roots also naturally
growth into the entire soil volume. However, for sparingly-soluble P fertilizers with even less
mobility in soil than NH4+, placement as a concentration point in potted soil may result in
more effective localized P supply even though it may not further improve P uptake when
optimum root density in the concentrated P fertilizer depot is reached.
Therefore, we hypothesized that placing P-fertilizers in a concentrated point results in less P
uptake and less biomass production than homogenous mixing of P in total soil volume in pots.
The objectives of this experiment were: 1.) to induce intense localized root-growth by
placement of a concentrated NH4+-fertilizer depot. 2.) to investigate the ability of the
promising BE Pseudomonas sp. DSMZ 13134 to improve P acquisition and shoot biomass
production in maize plants under limited supply of P or supply of a mixture of sparingly
soluble inorganic and organic P (rock phosphate enriched manure). 3.) to study the effect of

7: Improving plant P-acquisition from sparingly soluble inorganic P by PGPM
149
applying P and N-fertilizers (Placed NH4+ or homogenous NO3
-) in different fractions of total
substrate volume on plant growth and shoot nutrient status.
Hypotheses
• Placement of a fertilizer depot based on NH4+ or NH4
+ combined with sparingly available
P-fertilizer stimulates dense rooting around the depot (formation of rhizosphere hotspots).
• Placed NH4+-depot and BE enhance P acquisition and biomass production more than
homogenously applied NO3- with or without BE.
• Application of sparingly available P-fertilizer in a large soil volume leads to higher P
uptake and shoot biomass production than placement in a restricted concentrated depot.
Methodology:
Maize (Zea mays L. var Colisee) was grown in PVC pots (10 cm Ø, 20 cm H, 1.57 l)
containing a substrate comprised of two parts (w/w) low-P loam soil from a long-term
unfertilized grassland (pHCACl2 7.1; PCAL, 21.6 mg P kg-1; KCAL, 251.9 mg K kg-1; Corg, 2.4%;
Ntotal, 0.24%) and one part quartz sand (0.6-1.2 mm Ø). Moisture content was 22 % (75 %
max. WHC). 1900 g of substrate was filled in each pot. Nutrients applied per kg dry soil
included:150 mg K (K2SO4); 50 mg Mg (MgSO4); 100 mg N: as Ca(NO3)2 homogenously
applied in the substrate (NO3- -Mixed treatments or positive P control treatment, +P) or as
(NH4)2SO4 placed in a concentrated depot 5 X 5 cm to the seed (NH4+-Depot); 150 mg P: as
Rock phosphate (RP)-enriched manure: 75 mg RP-P + 75 mg Manure-P) or as soluble
Ca(H2PO4)2 for the positive P control treatment, +P). RP and manure were chosen as rich
inorganic and organic P fertilizers accepted in most farming systems including organic
farming. Pseudomonas sp. DSMZ 13134 was inoculated at the rate 1 x 10¹¹ CFUs kg-1soil pot-
1 (5 x 10¹⁰ CFUs applied to directly on the fertilizer depot and the remaining 5 x 10¹⁰ CFUs
drenched in the seeding hole at sowing). Day/night time was 14/10 hrs. There were four

7: Improving plant P-acquisition from sparingly soluble inorganic P by PGPM
150
replicates arranged in completely randomized design. Root-zone temperature was controlled
using a cooling system set to 20± 2 °C.
Proradix®, the commercial formulation of Pseudomonas sp. DSMZ 13134 (Pro), contains
freeze-dried cells in skimmed milk powder as a nutrient additive for BE propagation after
inoculation in soil. Therefore, high inoculation rates especially in pot experiments with small
volumes of growth substrate may result in a meaningful input of organic nutrients and thus, a
priming effect. Total N and P input by Pro inoculation at the rate 1 x 10¹¹ CFUs kg-1soil
was:111.6 mg N and 23 mg P kg-1soil. Mature sheep manure (2 yrs. old) was used. Total N
input via manure at the rate of 75 mg Manure-P kg-1soil was 163.5 mg N kg-1soil (12 g
manure kg-1soil ≈ 16 tons manure ha-1, 10 cm depth, 1.3 g cm-3 bulk density).Treatments
included: Zero, no additional N or P fertilizer, No BE; NH4+-Depot, (NH4)2SO4 placed as a
concentrated depot (with or without Pro); NH4+/P-Depot, (NH4)2SO4 and RP-enriched
manure placed as a concentrated depot (with or without Pro); NO3--Mixed/P-Depot,
Ca(NO3)2 mixed homogenously in the entire soil and RP-enriched manure placed as a
concentrated depot (with or without Pro); NH4+-Depot/P-Mixed, (NH4)2SO4 placed as a
concentrated depot and RP-enriched manure mixed homogenously in the entire soil (with or
without Pro); NH4+-Depot/ P-Mixed10cm_Pro, (NH4)2SO4 placed as a concentrated depot
and RP-enriched manure homogenously mixed only in the top 10 cm soil layer (with Pro);
and +P, Ca(NO3)2 and Ca(H2PO4)2 mixed homogenously in soil.
Results:
Placement of NH4+-Depot or NH4
+/P-Depot induced dense localized rooting around the depot
(Fig.7.2). For NH4+-Depot without P-fertilization, Pro increased shoot biomass production by
59 % shoot P content by 64% and N content by 50 % (Fig. 7.3) than with applied P-fertilizer
irrespective of application method. With P-fertilizer, BE led to increases (at times marginal)

7: Improving plant P-acquisition from sparingly soluble inorganic P by PGPM
151
in shoot P concentration and shoot P and N content. Placement of NH4+ and RP-enriched
manure led to higher shoot biomass and shoot P content than homogenous application of NO3-
combined with placed RP-enriched manure. Mixing the RP-enriched manure homogenously
in the entire soil volume led to higher shoot biomass and shoot P content than placing it in a
concentrated depot or homogenous mixing only in the top 10 cm soil layer, irrespective of E
(Fig. 7.3 A and C).
Figure 7.2. Densely rooted rhizosphere hotspot around a fertilizer depot ((NH4+/RP -
enriched manure depot).
Figure 7.3. Shoot biomass (A), shoot P concentration (B), P content (C) and N content
(D).
Zero, no N or P, no BE; NH4+-Depot, placed (NH4)2SO4 depot; NO3
--Mixed, Ca(NO3)2
mixed; P-Depot, placed RP-enriched manure depot; P-Mixed, RP-enriched manure
homogenously applied; P-Mixed10cm, RP-enriched manure homogenously applied to top 10

7: Improving plant P-acquisition from sparingly soluble inorganic P by PGPM
152
cm; Pro, Pseudomonas sp. DSMZ 13134; +P, Ca(NO3)2 and Ca(H2PO4)2 homogenously
applied.

7: Improving plant P-acquisition from sparingly soluble inorganic P by PGPM
153
Conclusion:
Placement of a fertilizer depot based on NH4+ or NH4
+ and RP-enriched manure induced
dense localized rooting around the depot. BE improved shoot P status and shoot biomass
when plant-available P was limiting. Homogenous application of RP-enriched manure in the
entire substrate volume led to improved shoot growth and shoot P status in comparison to
placement in a spatially restricted concentrated depot or to homogenous application only in
the top 10 cm soil layer. When P-fertilizer was placed in a concentrated depot, placed NH4+ or
homogenously applied NO3- had similar effects on maize growth.

7: Improving plant P-acquisition from sparingly soluble inorganic P by PGPM
154
7.3 Microbial bio-effectors for the mobilization of calcium phosphates in the
rhizosphere
Original title: “Mikrobielle Bioeffektoren zur Mobilisierung von Calciumphosphaten in der
Rhizosphäre”
Thesis for a Bachelor of Science degree by: Ms. Mira Kuhlmann,
Email: [email protected]
Address: Leinenweberstraße 65, 70567 Stuttgart.
Date of submission: 12.09.2014
Background and objectives
In vitro BE-culture experiments on solid media showed that several selected BEs readily
solubilize sparingly soluble Ca3(PO4), (Ca-P) (results shown in section, 5). The aim of this
experiment was investigated the ability of selected BEs to solubilize rock phosphate (RP)
and/or increase root growth to contribute directly to improved P nutrition of maize plants
supplied with RP. Plants were grown in a highly P buffering alkaline soil with low plant-
available P. Instead of NH4+, NO3
- was chosen to avoid additional improvement of RP
solubility by rhizosphere acidification resulting from proton release as roots take up NH4+.
Hypothesis
BEs that readily solubilized Ca-P in vitro can directly contribute to improved shoot growth
and shoot P status of maize plants supplied with RP via improved RP solubility and/or
improved root growth.
Methodology:
A pot experiment was conducted on a low-P C-horizon subsoil with high P sorption capacity
(PCAL, 5 mg kg-1; Ptotal, 332 mg kg-1; pHCaCl2, 7.6; Corg, < 0.3%; Ntotal 0.02 %; CaCO3, 23 %).
The substrate was made of up 80 % soil and 20% quartz sand (0.6-1.2 mm Ø) (w/w). The soil
was fertilized by homogenous application of (kg-1 soil DM): 100 mg N, (Ca(NO3)2); 150 mg
P(rock phosphate, 7.6 % P described in section 5 or Ca(H2PO4)2) for the positive P control);
7: Improving plant P-acquisition from sparingly soluble inorganic P by PGPM
155
150 mg K (K2SO4); 50 mg Mg, (MgSO4); 20 µmol Fe, (Sequestrene138, 6 % Fe); 2.6 mg Zn,
(ZnSO4); 1 mg Cu (CuSO4); and 18% moisture (60 % max. WHC). Each pot was filled with
2.9 kg of substrate. Tested bio-effectors included Pseudomonas sp. DSMZ 13134, Proradix®
(Pro: 1x 10⁹ CFU kg-1 soil), Penicillium sp. PK 112, Biological Fertilizer OD (BFOD, 1x 10⁸
spores kg-1 soil), Paenibacillus mucilaginosus (Paeni, 1x 10⁹ spores kg-1 soil) and Vitalin
SP11, (SP11, 20 ml of 0.2% suspension kg-1 soil). Vitalin SP11 comprises: Bacillus subtilis,
Pseudomonas sp., Streptomyces spp., natural humic acids und extracts of the seaweed
Ascophyllum nodosum. BEs were suspended in 2.5 mM CaSO4, maize seeds (Zea mays L. var
Colisee) were treated with BE suspensions, sown and then 20 ml BE suspension was
inoculated in the seeding hole. There were six replicates per treatment arranged in completely
randomized design. Plants were grown for 41 days (Daylight was16 hrs., 25-30°C and night 8
hrs., 18-20 °C). Pots were weighed daily and water lost was replenished with distilled water.
Results:
Inoculation of BEs led to lower or a tendency of lower shoot biomass (Fig. 7.4 A) , shoot P
content (Fig. 7.4 B), root dry matter Fig. 7.4 C) and total root length per pot (Fig. 7.4 D) than
without BEs.

7: Improving plant P-acquisition from sparingly soluble inorganic P by PGPM
156
Figure 7.4. Shoot dry matter (A) and shoot P content (B), root dry matter (C) and total
root length (D)
Zero, RP and no BE; +P, Ca(H2PO4)2 and no BE; Pro, RP and Pseudomonas sp. DSMZ
13134; SP11, RP and Vitalin SP11; BFOC= RP and Penicillium sp. PK 112; Paeni, RP and
Paenibacillus mucilaginosus. One-way ANOVA, Tukey test α=0.05. Different letters show
significant difference (P<0.05).
Conclusion:
In disagreement with the hypothesis, BEs negatively affected plant P nutrient status and shoot
growth. Possible explanations for the growth-inhibiting effect of tested BEs on maize are,
competition for soil P and other nutrients between BEs and maize plants as well as utilization
of organic C and N compounds released as maize root-exudate by BEs without any positive
contribution in turn by BEs to promote P nutrition or growth of maize plants (parasitism).

7: Improving plant P-acquisition from sparingly soluble inorganic P by PGPM
157
7.4 Influence of P-solubilizing microorganisms on P acquisition from rock phosphate
by maize
Original title: Einfluss P-lösender Mikroorganismen auf das Rohphosphat-
aneignungsvermögen von Mais
Thesis for a Master of Science degree by: Ms. Nicole Probst,
Email: [email protected]
Address: Filderbahnstraße 46, 70794 Filderstadt.
Date of submission: 24.04.2015
Background and objectives
Given the negative effects of tested BEs on shoot biomass production and shoot P status of
maize grown on a highly P sorbing soil (reported in section 7.3 above), this experiment had
the objective to investigate whether addition of organic C and N nutrients during watering
could cover BE nutrient requirements thereby, reducing any competition for nutrients between
BEs and plant roots while increasing BE activity for RP solubilization.
Additionally, BE effect on P acquisition from RP by maize plants was investigated on a
substrate with reduced P sorption capacity. P sorption capacity of a soil is the ability of the
soil to convert soluble available orthophosphates (HPO42-/H2PO4
-) to less soluble and less
available P forms by reactions such as adsorption onto charged mineral or organic surfaces
and precipitation. Therefore P sorption capacity of a soil is influenced by its pH, thus contents
of exchangeable Ca, Fe and Al; clay type and content; and organic matter content (Hansen et
al. 2002). The loess subsoil used contained 23% CaCO3, which at pHCaCl2 7.6 implied high
concentrations of exchangeable Ca were present. Low clay and organic matter contents,
implied CaCO3 content was the main determining factor for P sorption capacity, which could
be reduced by simply diluting the loess subsoil with quartz sand.

7: Improving plant P-acquisition from sparingly soluble inorganic P by PGPM
158
Hypotheses
• Addition glucose and glycine to soil during watering alleviates negative competitive/
parasitic effects of soil-inoculated BEs on growth and P acquisition of maize plants
supplied with rock phosphate in an alkaline P-sorbing substrate.
• BE-solubilization of RP with improved P nutrition of maize plants is enhanced in a
substrate with low P sorption capacity.
Methodology:
The first pot experiment conducted was a repetition of the pot experiment in section 7.3 with
daily watering of pots performed with a solution containing 5.0 mM glucose and 2.5 mM
glycine instead of distilled water. The second pot experiment was different from the first in
that a substrate with lower P-sorption capacity was utilized. This substrate was prepared by
increasing the proportion of quartz sand from 20 to 70% and adding only 30% low-P soil
(described in 7.2.3). Inoculation procedure for BE was the same as described in section 7.3.3.
Residual P concentrations in rhizosphere soil from treatments Zero, Pro and +P from the
second experiment were measured by sequentially extracting 2 g air dried rhizosphere soil
with 30 ml of 0.5 M NaCl/TEA (TEA, triethylamine) with the pH of the extractant adjusted
from 10.8 to 7 using 2 N HCl (available P fraction) (Tambunan et al. 1993). After
centrifugation and decanting of the supernatant, the remaining soil was extracted with 30 ml 1
M NaOH (moderately labile organic and inorganic P bound to amorphous hydroxides of Fe
and Al) and finally, with 30 ml 1 M H2SO4 (residual non-labile P). The H2SO4 extract was
filtered and the inorganic P concentration was analyzed using the molybdate-blue method
(Murphy and Riley, 1962). pHCaCl2 of rhizosphere soil was also measured.

7: Improving plant P-acquisition from sparingly soluble inorganic P by PGPM
159
Results:
In the first experiment, watering with glucose and glycine did not alleviate negative BE
effects on maize growth. The same negative BE effects on maize shoot growth, shoot P
content, root biomass and total root length per pot observed in the experiment described in
section 7.3.4 were replicated.
Although the second experiment was characterized by a general reduction in shoot biomass,
shoot P content, root biomass and total root length in all treatments in comparison to the first
experiment, inoculation of BE showed a significant increase (or a tendency) in all four
measure variables in comparison to the non-inoculated control (Fig.7.5)
Figure 7.5. Shoot dry matter (A) and shoot P content (B), root dry matter (C) and total
root length (D)
Zero, RP and no BE; Pro, RP and Pseudomonas sp. DSMZ 13134; SP11, RP and Vitalin
SP11; BFOC= RP and Penicillium sp. PK 112; Paeni, RP and Paenibacillus mucilaginosus;.
+P, Ca(H2PO4)2 and no BE; One-way ANOVA, Tukey test α=0.05. Different letters show
significant difference (P<0.05). Different bold red letters show significant difference between
the non-inoculated control and Pro (t-test, α=0.05)

7: Improving plant P-acquisition from sparingly soluble inorganic P by PGPM
160
Residual P concentrations in rhizosphere soil samples from the second experiment were: Zero,
159; Pro, 156; +P, 62 mg P kg-1 soil. Given 70% sand content of the substrate and the
resulting loose texture, it is likely that rhizosphere soil was not satisfactorily sampled with
samples containing more bulk soil than tallowed. pHCaCl2 of rhizosphere soil from treatment
+P (7.1) was slightly lower those from the other treatments (7.3).
Conclusion:
Addition of glucose and glycine did not result in positive BE effects on maize growth and P
status of shoots. However, after reducing the P sorption capacity of the substrate by increasing
the fraction of sand, all tested BEs increased (or showed a tendency to increase) total root
length, root and shoot biomass, shoot P content despite overall reduction in all measured
variables if compared to plant performance on the highly P sorbing substrate. The likely
mechanism for improved plant growth was improved P uptake via enhanced root growth for
more effective exploitation of the substrate. Nevertheless, this could not be fully confirmed
because there was no reduction in the concentration of residual rhizosphere P for the best
performing BE variant (Pseudomonas sp. DSMZ 13134) in comparison to the non-inoculated
control partly due to sampling errors for rhizosphere soil. Despite no reduction in the pH of
rhizosphere soil upon inoculation with BEs, improved solubility of RP via release of chelating
low molecular weight compounds by BEs may occur.

7: Improving plant P-acquisition from sparingly soluble inorganic P by PGPM
161
7.5 N-form dependent solubilization of rock-phosphate in maize inoculated with
microbial bio-effectors
Thesis for a Master of Science degree by: Mr. Isaac Kwadwo Mpanga,
Address: Linkenstrasse 8, 70599 Stuttgart.
Email: [email protected]
Date of submission: 14.12.2015
Background and objectives
The first part of this study was based on the second experiment described in section 7.4
above. Its aim was to investigate whether addition of CaCO3 as a means to re-increase the P
sorption capacity of a low-P sorbing substrate (70% sand and 30% low-P soil) supplied with
rock phosphate (RP) could nullify the beneficial effects of the best performing BE
Pseudomonas sp. DSMZ 13134 on improving maize growth and shoot P status. Furthermore,
the effect of N-form (NH4++DMPP vs. NO3
-) was investigated because both soil
microorganisms as well as plant roots acidify their growth medium by proton exudation upon
transport of NH4+ into cells, with the consequence of improved solubility of RP (or vice versa,
reduced RP solubility due to an increase in the pH of the medium upon co-transport of NO3-
and H+ into cells).
A second pot experiment was conducted to screen selected promising BEs under NH4+ supply
to a neutral clay-loam top soil on improving P acquisition of maize from RP. The clay-loam
soil, which was more realistic for natural BE/Plant root interaction than the C-horizon subsoil
with high P sorption capacity (used sections 7.3 and 7.4), was obtained from a cultivated
arable organic farm land.

7: Improving plant P-acquisition from sparingly soluble inorganic P by PGPM
162
Hypotheses
• Addition of CaCO3 to a low P sorbing substrate increases P sorption capacity, thereby
abolishing positive effects of Pseudomonas sp. DSMZ 13134 (Pro) on P acquisition of
maize plants from RP.
• Negative effects of added CaCO3 on BE-assisted maize P-acquisition from RP can be
neutralized by N fertilization with NH4+ or worsened by supply of NO3
-.
• Growth-promotion of RP-fed maize plants by Pseudomonas sp. DSMZ 13134 (Pro) is
stronger under N fertilization with NH4+ than with NO3
-.
• With N supply as NH4+, selected BEs promote growth and P nutrition of maize plants
fertilized with RP.
Methodology:
In the first pot experiment, the same basic substrate (70% sand and 30% low-P soil) and basic
fertilization as described in 7.3 above was used. Treatments included a factorial combination
of 2 BE levels (No Be; Pro) x 2 PO43--buffering levels in the substrate (0% CaCO3; 25%
CaCO3) x 2 N-fertilizer forms (NO3-:100% NO3-N as Ca(NO3)2; or NH4
++DMPP: 80% NH4-
N as stabilized (NH4)2SO4+DMPP and 20% NO3-N as Ca(NO3)2). Additionally, there was a
negative P control with NO3- and without RP (-P), a positive P control with NO3
- and soluble
Ca(H2PO4)2 (+P), and a control to re-test BE effects under high substrate P sorption
(+CACO3; CC), N supply as NO3-, Pro and watering of pots with a solution of glucose and
glycine as previously tested (section 7.3). The same inoculation procedure for Pseudomonas
sp. DSMZ 13134 (Pro) described in section 7.2 was used.
In the second pot experiment, the substrate was composed of 70 % clay-loam soil (pHCaCl2
6.8; PCAL 20 mg P kg-1 soil) and 30 % quartz sand. CaCO3 was not utilized. Basic fertilization
was (kg-1 soil DM): 150 mg N, (as (NH4)2SO4+DMPP or Ca(NO3)2 (for the positive P control,

7: Improving plant P-acquisition from sparingly soluble inorganic P by PGPM
163
+P); 100 mg P(RP or Ca(H2PO4)2 (for +P); and 150 mg K (K2SO4). In addition to a non-
inoculated control, seven BEs tested under P supply as RP and N supply as NH4+ included:
Pseudomonas sp. DSMZ 13134 (Pro); Vitalin SP11 (SP11), Penicillium sp. PK 112 (BFOD),
Paenibacillus mucilaginosus (Paeni), Bacillus amyloliquefaciens FZB42 Rhizovital42®
(Rhiz); Trichoderma. harzianum T22 (T-22); and CombiFectorA: (ComA: T. harzianum
OMG08, Pseudomonas fluorescens, Bacillus subtilis). Furthermore, the best performing BE
Pro was test with RP under N supply as NO3- to replicate previous results on N-form effects.
Two more control treatments included: one without BE and without any fertilizer (Zero); and
a positive P control without BE (+P), but with supply of 100 mg N kg-1 (Ca(NO3)2), 100 mg P
kg-1 P(Ca(H2PO4)2). There were five replicates in both experiments arranged in completely
randomized design.
Results:
Once more, watering with a solution of glucose and glycine did not affect shoot and root dry
matter, shoot P concentration and content in maize plants inoculated with Pro and supplied
with NO3-, RP and CaCO3 (P>0.05). The Factor BE affected shoot DM, CaCO3 affected shoot
DM and shoot P content; whereas N-fertilizer form affected all measured variables (Table 7.2
and 7.3 ). For the variable shoot P content, N-form and CaCO3 content significantly interacted
with each other. NH4+ improved shoot P concentration and shoot P content in the absence of
added CaCO3 whereas NO3- effect on shoot P concentration and shoot P content was not
influenced by addition of CaCO3.

7: Improving plant P-acquisition from sparingly soluble inorganic P by PGPM
164
Table 7.2. Source of variation (Three-way ANOVA) (ns P>0.1) BE N-form CaCO3 BE*N-form N-form*CaCO3 BE*N-form*CaCO3
Shoot DM 0.017 <0.001 0.045 ns ns ns
Shoot P
concentration
ns 0.001 ns ns 0.081 ns
Shoot P
content
ns <0.001 0.027 ns 0.040 ns
Root DM 0.069 0.001 0.052 ns ns ns
Table 7.3. Least square means (Three-way ANOVA) BE N-form CaCO3
NoBE Pro NO3- NH4
+ 25% 0%
Shoot DM (g
plant-1)
2.8 b 3.3 a 2.5 b 3.5 a 2.8 b 3.2 a
Shoot P conc.
(mg P g-1)
1.5 1.5 1.4 b 1.6 a 1.5 1.5
Shoot P
content (mg P
plant-1)
4.2 4.7 3.5 b 5.4 a 4.1 b 4.8 a
Root DM (g
plant-1)
0.49 0.60 0.45 b 0.64 a 0.49 0.60
In the second pot experiment, difference in the effects NH4+ in comparison to NO3
- on plant P
acquisition and biomass production under inoculated Pro and supply of RP could be
replicated once more. Least square means for measured variables were: Shoot DM (g plant-1:
NH4+, 9.8 a; NO3
-, 6.8 b; P<0.001); Shoot P content (mg P plant-1: NH4+, 22.2 a; NO3
-, 17.6 b;
P=0.007); Shoot P conc. (mg P g-1: NH4+, 2.3 a; NO3
-, 2.6 b; P=0.005); Root DM (g plant-1:
NH4+, 1.6 a; NO3
-, 1.2 b; P=0.007).
Inoculation of all BEs except T-22 and BFOD resulted in higher shoot dry matter, and lower
shoot P concentration (biomass dilution effect) than the non-inoculated control (Fig. 7.6).

7: Improving plant P-acquisition from sparingly soluble inorganic P by PGPM
165
Figure 7.6. Effect of BEs on shoot dry matter (A), shoot P content (B) and P
concentration (C) and root dry matter (D).
T-22, Trichoderma. harzianum T22; Pro, Pseudomonas sp. DSMZ 13134; Rhiz, Bacillus
amyloliquefaciens FZB42; Paeni, Paenibacillus mucilaginosus; BFOD, Penicillium sp. PK
112; SP11; Vitalin SP11 (Bacillus subtilis, Pseudomonas sp., Streptomyces spp., natural
humic acids und extracts of the seaweed); and ComA, CombiFectorA: (: T. harzianum
OMG08, Pseudomonas fluorescens, Bacillus subtilis); Zero, non-inoculated and unfertilized
control; +P, non-inoculated but positive P control. One way ANOVA, mean ± SEM, n = 5,
Holm-Sidak test, α = 0.05, * shows significant difference between BE treatment and the non-
inoculated control, P<0.05(NoBE)
Conclusion
If the P sorption capacity of a poor P-sorbing substrate is increased by adding CaCO3, the
positive effects of Pseudomonas sp. DSMZ 13134 on P acquisition and growth of maize
plants supplied with RP are nullified. Supplying N as NH4+ contributes to mitigate the
negative effects of CaCO3 addition on maize growth whereas supply of N as NO3- does not.
With N supply as NH4+ and P supply as RP, tested BEs containing a single bacterium strain
contributed to increased maize shoot biomass whereas tested BEs with a single fungus strain
did not. BE consortia containing both fungi and bacteria performed well.

7: Improving plant P-acquisition from sparingly soluble inorganic P by PGPM
166
7.6 Preliminary title: Effects of BE and N-form on P nutrition and growth of maize
plants supplied with different sparingly soluble inorganic/recycled P fertilizers.
This work is part of an ongoing thesis for a Master of Science degree by: Ms. Shikta Kar
(2016)
Email: [email protected]
Adress: Stuttgarter Str. 28, 73760, Ostfildern.
Background and objectives
Previous experiments (sections 7.3 – 7.5) have shown that low substrate P-sorption, N supply
as NH4+ and inoculation of bacterial BEs or BE consortia containing both bacteria and fungi
promote P acquisition and growth of maize plants supplied with RP. The objective of this
experiment was to investigate the ability of the most promising pair of BEs (Pro and ComA)
to improved P acquisition of maize plants from native moderate- to non-labile soil P pools,
RP, and two sparingly soluble recycled P-fertilizers. Once more, the effect of N-form (NH4+
vs. NO3-) was investigated for Pro under P supply as RP.
Hypotheses
• Pseudomonas sp. DSMZ 13134 (Pro) improves shoot biomass and shoot P content of
maize plants supplied with RP when N is fertilized as NH4+ and does not when N is
supplied as NO3-.
• With N fertilized as NH4+, Pro and ComA (CombiFectorA) each improve P acquisition of
maize plants from recalcitrant soil pools, or applied sparingly soluble, RP, sewage sludge
ash (SSA) or struvite, thereby improving shoot growth and shoot P status.
Methodology:
Tested P-fertilizers included: rock phosphate (RP, 7.6 % P), sewage sludge ash (SSA, 10.34
% P) and struvite (STR 19.5 % P). Like in the second experiment in section 7.5 above, the

7: Improving plant P-acquisition from sparingly soluble inorganic P by PGPM
167
substrate was composed of 70 % clay-loam soil (pHCaCl2 6.8; PCAL 20 mg P kg-1 soil) and 30
% quartz sand (w/w). With N supplied as stabilized NH4+ (100 mg NH4-N kg-1 as
(NH4)2SO4+DMPP), treatments were comprised of factorial combinations of two BE levels
(Pro, Pseudomonas sp. DSMZ 13134; and ComA, CombiFectorA: (: T. harzianum OMG08,
Pseudomonas fluorescens, Bacillus subtilis)) and four P-fertilizer levels (NoP, RP, STR, SSA
each at the rate100 mg P kg-1). Controls included: one treatment with neither P-fertilizer nor
BE (Zero); one with NO3- (Ca(NO3)2), RP and Pro (Pro_NO3
-, _RP) and a positive P control
(+P) with 150 mg N kg-1 (Ca(NO3)2) and 100 mg P kg-1 (soluble Ca(H2PO4)2). There were
five replicates per treatment arranged in a completely randomized design.
Results
With NH4+, Pro led to 46% higher shoot dry matter (15.2 g plant-1) than with NO3
- (10.4 g
plant-1) for maize plants supplied with RP. For control treatments arranged in the order: Zero,
Pro_NO3-_RP and +P, shoot dry matter (g plant-1) was: 8.8; 10.4 and 14.1; root length density
(cm cm-3) was: 3.8, 2.8 and 4.0; shoot P content (mg plant-1): 16.0, 25.5, 31.2 respectively.
Factors BE and P-fertilizer significantly affected shoot dry matter and shoot P content (with a
tendency of interaction) whereas root length density was affected only by the factor P-
fertilizer (Table. 7.4).
Table 7.4. Two-way ANOVA for factors BE and P-fertilizer (ns P >0.1) Shoot DM Shoot P
content
Root length
density
Source of
Variation
DF P P P
P-fertilizer 3 <0.001 <0.001 0.003
BE 2 0.025 <0.001 ns
P-form x BE 6 0.051 0.063 ns
With struvite, plants attained the level of shoot DM, shoot P content and root length density as
plants belonging to the positive P control treatment irrespective of inoculation with BE. Pro
enhanced (or showed a tendency to enhance) shoot DM and shoot P content under no

7: Improving plant P-acquisition from sparingly soluble inorganic P by PGPM
168
additional P or supply of RP whereas ComA seemed to improve shoot DM for all P-forms
except STR (Fig. 7.7)
Figure 7.7. Effect of treatments with NH4+, BEs and P-fertilizers on shoot DM (A), Shoot
P content (B), root DM (C) and root length density (D).
Different letters show significant different between treatment pairs (One way ANOVA, mean
± SEM, n = 5, Tukey test, α = 0.05), * shows significant difference between BE treatment and
corresponding non-inoculated control (t test, α = 0.05, * P<0.05, **P<0.01). Numbers above
bars show % comparison to the +P control. NoBE, no bio-effector; Pro, Pseudomonas sp.
DSMZ 13134; and ComA, CombiFectorA (T. harzianum OMG08, Pseudomonas fluorescens,
Bacillus subtilis); RP, rock phosphate; STR, struvite; SSA, sewage sludge ash.
Conclusions:
Once again, results showed that Pseudomonas sp. DSMZ 13134 (Pro) improves growth of
maize supplied with RP when N is fertilized as NH4+ and not as NO3
-. With NH4+, Proradix
improved shoot biomass production with P supplied as RP and led to increased shoot P
contents with STR, whereas ComA led to improved RLD under SSA. P acquisition by maize
plants from struvite is effective without BE. Only marginal increases could be achieved by
application of Pro and no growth-promotion by ComA.

7: Improving plant P-acquisition from sparingly soluble inorganic P by PGPM
169
7.7 BE-assisted P nutrition of spring wheat supplied with rock phosphate and placed
NH4+
Mr. Niklas Käfer (M Sc. student at the Faculty of Agriculture, University of Hohenheim)
contributed by up to 15 % to the work reported in this section. He was the only participant in
a Humboldt-Reloaded project during summer semester 2015. The project was entitled
“Improving phosphorous (P)-nutrition of crop plants with alternative P fertilizers and bio-
effectors”. It involved a pot experiment conducted at the Institute of Crop Science, department
of Fertilization and Soil Matter Dynamics (340 i).
Email: [email protected]
Background and objectives
So far previous experiments have demonstrated positive effects of selected BEs on P
acquisition from sparingly soluble P-fertilizers when N is supplied in the form of NH4+ only
in cultures with maize (Zea mays L.). The response of other crop species to substrate-
inoculated BEs under supply of NH4+ and RP is unknown. The objective of this project was to
investigate BE effects under N supply as NH4+ on growth and P acquisition from RP in a
spring wheat culture (Triticum aestivum L). Spring wheat is interesting as a different test crop
species because it is a more effective soil P mobilizer than maize (e.g. secretions of chelating
substances like siderophores in root exudates for nutrient mobilization) and less sensitive to
low P availability than maize. Given knowledge from previous tests with maize, the effect of
Proradix on spring wheat under different N-forms (NH4+/NO3
-) was also studied.

7: Improving plant P-acquisition from sparingly soluble inorganic P by PGPM
170
Hypotheses
• Like with maize plants, Pseudomonas sp. DSMZ 13134 improves P acquisition and
growth of spring wheat supplied with RP when N is fertilized as NH4+ and not when N
is supplied as NO3-.
• Under N supply as NH4+, BEs improve P acquisition and growth of spring wheat
plants fertilized with RP.
Methodology:
Spring wheat (Triticum aestivum L. Schirocco, KWS, Germany) was grown in 5 L pots each
containing 5.7 kg substrate. The substrate was composed of 70 % low-P silt loam luvisol
(Barvendorf, Lake of Constance, Germany, pHCaCL2 6.4, PCAL 7mg kg-1; PNaHCO3 8 mg kg-1;
PTotal 218 mg kg-1; Corg 2.8 %) and 30 % quartz sand (w/w). Moisture content was 24 % (70 %
max. WHC). K and Mg were sufficiently supplied (150 mg K (K2SO4); 50 mg Mg, (MgSO4)
kg-1 soil). BE levels tested included: NoBE, no bio-effector; Pro, Pseudomonas sp. DSMZ
13134; Rhiz, Bacillus amyloliquefaciens FZB42; Paeni, Paenibacillus mucilagenosus (each
at the rate 1x10⁹ CFUs or Spores kg-1); and T-22, Trichoderma. harzianum T22 (at the rate
1x10⁸ spores kg-1). BE suspensions in 2.5 mM CaSO4 were inoculated at these rates three
times at 0, 24 and 34 days after sowing (DAS). P was supplied as RP (150 mg P kg-1 soil).
There were two sets of treatments:
I. Factorial combination of 2 BE levels (NoBE; Pro) x 2 N levels (150 mg NO3-N kg-1
mixed homogenously in the whole substrate as (Ca(NO3)2); 150 mg NH4-N kg-1 as
stabilized (NH4)2SO4+DMPP placed by point injections at 10 cm depth);
II. Placed stabilized ((NH4)2SO4+DMPP) at the rate 150 mg NH4-N kg-1 in combination with
five BE levels: NoBE, Pro, Rhiz, T-22, Paeni

7: Improving plant P-acquisition from sparingly soluble inorganic P by PGPM
171
N-fertilization was split to three events: 50 mg N kg-1 before sowing (homogenously mixed in
the substrate at 0 DAS), 50 mg N kg-1 at 24 DAS and 50 mg N kg-1 at 42 DAS placed by point
injection at 10 cm depth.
There were five pots per treatment arranged in a randomized block design. Plants were grown
in the greenhouse and temporarily moved outdoors during good weather. The growth period
lasted from 02. Jun – 04. Sep. 2015. Mean daily temperature was: 24°C (min: 8 °C, Max: 51
°C, - indoors) and daylight intensity ranged from 400-1200 μmol photons m-2 s –1 for lower
intensity with indoor lamps to bright sunlight outdoors on a sunny day.
Results:
In most measured variables especially concentrations and contents of nutrients in biomass,
NH4+ led to higher values than NO3
- and Proradix also led to higher values than without BE
(Table 7.5). N-form strongly interacted with BE for grain Ca concentration and content, and
straw Cu content (P<0.05), weakly interacted for grain DM (P=0.052) and number of grains
per pot (P=0.061).
Table 7.5. Relative effect (%) of NH4+ to NO3
- and Pro to NoBE on shoot, straw and grain
dry matter, and contents and concentrations of different nutrients at booting and
senescence growth stages in shoot, straw and grain.
Effect of NH4+ relative to NO3
- (%) Effect of Proradix relative to NoBE (%)
Booting stage
Shoot DM: +10% ns
Shoot concentrations: +28% P, +5% N, +25%
Zn, +18% Cu, -24% Ca, -5% Mn
Shoot contents: +41% P, +39% Zn, +29% Cu
Shoot DM: +19%
Shoot concentrations: +3% K
Shoot contents: +23% P, +19% N, +23%
K, +21% Mg, +20% Mn, +21% Cu
Senescence stage
Root DM: +19% ns
Straw DM: +6% ns
Grain DM: +3% ns
Nr. grains: -17%
TGW: +21%
Grain concentrations: +47% P, +11% N, +8%
K, +12% Mg, -36% (Ca), +46% Zn, +15% Mn,
+9% Cu
Grain contents: +61% P, +26% N, +26% K,
+22% Mg, +62% Zn, +25% Mn, +27% Cu
Root DM: +16% ns
Straw DM: +12% ns
Grain DM: +21%
Nr. grains: +21%
TGW: ns
Grain concentrations: ns
Grain contents: +20% P, +17% Zn,
+14% (Ca)
Straw concentrations: +17% Mn, -7% N

7: Improving plant P-acquisition from sparingly soluble inorganic P by PGPM
172
Straw concentrations: +79% P, +63Zn, +15%
Cu
Straw contents: +112% P, +14% N, +81% Zn,
+27% (Cu)
Straw contents: +26%Mn
Two-way ANOVA (Factors: N-form and BE), tukey-test, α = 0.05. Values for nutrient
concentrations and contents are shown only for significant effects (P<0.05), (ns, P≥0.05).
Reductions in relative effects are shown in red. TGW, thousand grain weight. Brackets ( )
show variables with significant BE*N-form interaction.
At booting and the senescence stages, each BE improved or showed a tendency to improve
shoot biomass (Fig.7.8).
Figure 7.8. Effect of BE on shoot biomass production at the booting stage (A), straw
biomass (B) and grain yield (C) at senescence stage.
t-test with NoBE, α = 0.05; ns P≥0.05, * P<0.05. NoBE, no bio-effector; Pro, Pseudomonas
sp. DSMZ 13134; Rhiz, Bacillus amyloliquefaciens FZB42; Paeni, Paenibacillus
mucilagenosus); and T-22, Trichoderma harzianum T22

7: Improving plant P-acquisition from sparingly soluble inorganic P by PGPM
173
Inoculation of BEs improved or tended to improve shoot P and N content at the booting stage,
and root DM, number of grains and grain Ca content at the senescence stage (Table. 7.6).
Table 7.6. Effect of BE on shoot N and P content (Booting stage) and root biomass, grain
and straw characteristics
Variable NoBE Pro Rhiz T-22 Paeni
Booting stage
Shoot P (mg plant
-1
) 2.59 3.53* 2.90 3.24 2.92
Shoot N (mg plant
-1
) 34.0 43.3* 39.7 39.5 39.5
Senescence stage
Root DM (g pot-1
) 1.23 1.74 1.60 1.35 1.64
Nr. of grains 332 453** 442* 422* 460**
TGW 33.7 33.8 32.6 33.9 31.9
Straw P (mg pot-1
) 23.6 19.9 14.5** 19.1 14.7**
Grain Ca (mg pot-1
) 5.53 7.73** 7.4* 6.7 7.62**
t-test with NoBE, α = 0.05; ns P≥0.05, * P<0.05, **P<0.01
Conclusion:
Like with maize plants, Pseudomonas sp. DSMZ 1314 improves P nutrition and growth of
spring wheat when N is supplied as NH4+ more than when N is fertilized as NO3
-. With NH4+,
each inoculated BE enhanced or tended to enhance growth of spring wheat plants, with the
best performing BEs being Pseudomonas sp. DSMZ 1314 and Paenibacillus mucilagenosus.
In comparison to previous experiments, Trichoderma harzianum T22 seemed to be more
growth-promoting in spring wheat cultures than in maize cultures. Improvement of nutrient
status and yield of wheat plants may be explained by enhanced chemical mobilization/
solubilization of nutrients in the rhizosphere as well as by improved root growth for more
effective interception of soil nutrients.

7: Improving plant P-acquisition from sparingly soluble inorganic P by PGPM
174
7.8 References
Hansen, N. C., Daniel, T. C., Sharpley, A. N., Lemunyon, J. L. (2002): The fate and transport of
phosphorus in agricultural systems. J. Soil Water Conserv. 57, 408–417.
Harman, G. E. (2006): Overview of mechanisms and uses of Trichoderma spp. Phytopathology
96, 190–194.
Harman, G. E., Petzoldt, R., Comis, A., Chen, J. (2004): interactions between Trichoderma
harzianum Strain T22 and Maize Inbred Line Mo17 and effects of these interactions on
diseases caused by Pythium ultimum and Colletotrichum graminicola. Phytopathology 94,
147–153.
Lugtenberg, B., Kamilova, F. (2009): Plant-Growth-Promoting Rhizobacteria. Annu. Rev.
Microbiol. 63, 541–556.
Murphy, J., Riley, J. P. (1962): A modified single solution method for the determination of
phosphate in natural waters. Anal. Chim. Acta. 27, 31–36.
Schenck zu Schweinsberg-Mickan, M., Müller, T. (2009): Impact of effective microorganisms and
other biofertilizers on soil microbial characteristics, organic-matter decomposition, and
plant growth. J. Plant Nutr. Soil Sci. 172, 704–712.
Tambunan, D., Hedley, M. J., Bolan, N. S., Turner, M. A. (1993): A comparison of sequential
extraction procedures for measuring phosphate rock residues in soils. Fert. Res. 35, 183–
191.

8: General discussion and conclusion
175
8 General discussion and conclusion
8.1 Meta-analysis on fertilizer placement
Through the literature review, we identified various techniques for fertilizer placement in soil.
The most effective techniques were band and “knife” placement. Subsurface fertilizer
placement at a depth of more than 10 cm led to higher relative placement effects on measured
variables than placement at 5-10 cm depth or to placement on surface soil. In light of these
findings and those from other field studies (Ma et al. 2009; Singh et al. 2005), it should be
recommended to farmers who employ fertilizer placement to consider deep subsurface
placement to improve the efficiency of fertilizers. However, the cost for additional
mechanical energy and possibly new machinery required for deep subsurface fertilizer
placement should be considered. With increasing frequency of extreme drought events (Parry
et al., 2004) or particularly in climate regions where topsoil rapidly dry up on hot days, deep
subsurface fertilizer placement may be economically advantageous in the long-term despite
initial expenses for machinery. The problem of drought could be seen in our field studies. Due
to extreme drought during the crop season in 2015, yield of maize silage from fertilizer
placement was -5.8% that of broadcast/incorporation. In 2014, characterized by normal
rainfall, grain yield from placement was +7.4 % that of broadcast/incorporation.
The most effective fertilizer formulations for subsurface placement were CO(NH2)2 combined
with PO43-, NH4
+ combined PO43- or liquid manure. There was no benefit on crop
performance from placing PO43- fertilizers when not combined with a suitable N-fertilizer. A
recently conducted meta-analysis on placement of PO43- fertilizers under field conditions (247
published and unpublished studies including “grey” literature) concluded that placement led
to lower yields than broadcast, especially for no-till systems (IPNI, 2016). The effectiveness
of placing a combination of NH4+ and PO4
3- in subsurface soil by banding to enhance P
uptake and yield was already described in early studies on fertilizer placement with maize
8: General discussion and conclusion
176
(Zea mays L.) (Miller and Ohlrogge, 1958). Additionally, Miller and Ohlrogge (1958)
observed than when NH4+ was placed 7-10 cm away from PO4
3- fertilizer, marginal
improvement in P uptake occurred only in low-P soils. This so called “improved root feeding
power of banded P” when combined with NH4+ was not affected by soil P status. Therefore, it
was attributed to favorable chemical changes caused by NH4+ supply or “increase in relative
root sorption surfaces in the banded volume”. Today both explanations of Miller and
Ohlrogge (1958) have been confirmed and fully described. In our rhizobox experiment
(Section 6.4.2), we could show considerable rhizosphere acidification effect of NH4+ nutrition
of roots, which likely promoted the solubility of sparingly soluble calcium phosphates formed
in the alkaline CaCO3–rich substrate after addition of soluble PO43- fertilizer. In addition,
intense localized root growth at the NH4+-depot increased the total surface area of roots for
nutrient uptake which led to improved shoot N and P concentrations and contents for maize.
Furthermore, NH4+ may act a more potent nutrient signal than PO4
3-for the attraction of roots
towards a fertilizer band made of both NH4+ and PO4
3-(chemotropism). This is likely because
NH4+ is more mobile in soil than PO4
3-. The consequence is improved uptake of both N and P
from the band by crop plants. Consequently, we recommend farmers to place PO43- fertilizers
in subsurface soil only in combination with a suitable N-fertilizer like NH4+ or CO(NH2)2.
8.2 Induced rhizosphere hotspots as a “home” for inoculated microbial BEs
We were able to repeatedly show that subsurface placement of a concentrated stabilized
NH4+-depot induced the formation of localized zones of intense root growth around fertilizer
depots (rhizosphere hotspots). High NH4+ concentrations (64 g l-1) coupled with the presence
of DMPP effectively reduced biological nitrification of NH4+ as shown in rhizobox and field
experiments. The effect of placing NH4+ especially at high concentrations on the induction of
intense localized root growth has been previously observed and described in soil systems
under greenhouse and field conditions (Jing et al. 2012; Sommer 2005). Through induced

8: General discussion and conclusion
177
intense localized root-growth, well-rooted soil areas can be targeted for the application of
sparingly available fertilizers as well as PGPMs that improve plant-nutrient availability.
Nevertheless, without good overall root growth, intense localized root growth alone may not
sufficiently cover plant need for nutrients and water. Therefore, the use of fertilizer placement
to spatially control the rhizosphere is regarded as a tool to accompany other measures such as
ploughing that promote overall root-growth of crops.
Several beneficial effects of fertilizer placement in comparison to fertilizer application by
broadcast suggest that in the future, fertilizer placement will become widely adopted. Through
targeting crop plants with nutrients by subsurface fertilizer placement, crops are given the
advantage to grow faster than weeds (Blackshaw et al., 2002; Légère et al., 2013). Through
fertilizer placement in subsurface soil, fixation and/or immobilization of nutrients by various
ions and/or soil microorganisms could be reduced; NH3 volatilization and runoff losses N and
P could be lessened; nitrate leaching and nitrous oxide emission could be lowered; and higher
fertilizer use efficiencies and crop performance is achievable (Linquist et al., 2012; Ma et al.,
2010; Nash et al., 2012; Ruidisch et al., 2013).
On nutrient agar, several microbial BEs showed considerable tolerance to high concentrations
of NH4+ irrespective of the presence of DMPP. This suggested that NH4
+-rich rhizosphere
hotspots around NH4+-depots in soil could be areas for effective root colonization by the
PGPMs. This proposal could be confirmed after culturing root extracts on selective media for
fluorescent Pseudomonads after Pseudomonas sp. DSMZ 13134 (Proradix ®) was inoculated
in soil around NH4+-depots. Another study confirmed improved root colonization of maize by
a rifampicin-tolerant strain of Bacillus amyloliquefaciens FZB42 after it was also inoculated
in soil around an NH4+-depot (Mohammad et al., 2016, unpublished master thesis). Although
these results are promising, more specific analysis of PGPM root-colonization rates by
molecular techniques like qPCR with selective primers will be of additional value.

8: General discussion and conclusion
178
Furthermore, spatial control of the rhizosphere for establishment of inoculated PGPMs should
be tested further under field conditions.
8.3 P-solubilizing BEs and potential to contribute to improved plant P-acquisition
Several microbial BEs tested positively to solubilize sparingly soluble Ca-P and RP via
acidification of growth media. The fungal BE Trichoderma harzianum T-22 that tested
negative was still capable of solubilizing Ca-P, RP and sewage sludge ash, however,
solubilized P was directly utilized for the growth of the fungus. This suggests that P-
solubilizing effects of some PGPMs may only contribute to plant P uptake during turnover of
microbial biomass in later growth stages. Consequently, it may be important to investigate
medium- and long-term effects of soil inoculated PGPMs on plant nutrient acquisition and
growth. This could be done in pot experiments by growing a series of crops in the same
substrate as well as through rotations in the field.
In our field experiments, tested PGPMs could not contribute to improved P nutrition of maize
plants primarily because in both years, the field site had optimal concentrations of plant-
available P. The positive effect of Pseudomonas sp. DSMZ 13134 (Proradix ®) on maize
silage yield in 2015 may be attributed to PGPM-induced tolerance to prevalent heat and
drought stress in 2015 and not a direct consequence of PGPM-assisted plant P-uptake.
Increase in maize silage yield in 2015 may have also been the result of different interacting
PGPM effects including root growth stimulation or root disease suppression. A current
challenge with the regulation of the commercialization of microbial BEs is the requirement
for them to be registered in one of various categories such bio-fertilizer, bio-stimulant, bio-
control or bio-pesticide. This regulation is redundant because in reality, PGPMs promote plant
growth via a combination of mechanisms. For example, Pseudomonas sp. DSMZ 13134
(Proradix ®), which tested as a good P-solubilizing and root-growth stimulating PGPM under

8: General discussion and conclusion
179
low pressure of soil pathogens, is actually registered as a bio-control agent against various
soil-borne fungal pathogens in potato production.
In pot experiments, several BEs especially bacterial BEs and consortia BE products
containing both bacteria and fungi effectively improved P nutrition of maize and wheat
supplied with sparingly soluble P fertilizers or without added P. Improved root growth and
possible enhanced solubilization of sparingly soluble P-fertilizers (via acidification and
release of chelating organic acids) were main mechanisms of action. The positive BE effect
on P nutrition of maize occurred only on low P-sorbing substrates especially when N was
supplied as stabilized NH4++DMPP and not when N was supplied as NO3
-. The use of
consortia of PGPMs has the advantage that PGPMs that are best adapted to the specific biotic
and abiotic condition in soil survive and colonize roots whereas those that do not gradually
die and disappear. In this way, crop roots and soil determine which PGPM in the consortium
survives and interacts with roots and other soil microorganisms and which do not.
Furthermore, through consortia BE products, plant growth can be improved through a variety
of pathways by different PGPMs at the same time.
In the medium- and long-term, more greenhouse and field experiments are required to
confirm the effectiveness of combining fertilizer placement and the inoculation of PGPMs to
improve crop nutrient acquisition and yield. For such field studies however, a field site with a
low available P level is required. This highlights the fact that arable soils in Germany are
generally well supplied with P (84 % of tested arable land samples from 2007-2013 in Baden-
Württemberg had optimum plant-available P level or higher, class “C - E”) likely due to
decades of adequate or more-than-required P fertilization. On the contrary, grasslands are
frequently insufficiently supplied with P (only 50% of tested grassland samples from 2007-
2013 in Baden-Württemberg had optimum plant-available P level or higher, class “C - E”))
(LTZ Augustenberg, 2013). This shows that grasslands in Baden-Württemberg are in more

8: General discussion and conclusion
180
need for improved mobilization of sparingly available soil P pools for fodder production than
arable lands. This creates an opportunity to test P-solubilizing PGPMs by inoculating them in
grassland soil, which usually has higher root density for the establishment of inoculated
PGPMs than arable land that is regularly ploughed and often left free of plants.
8.4 Conclusion
Through this work, it could be shown for the first time that fertilizer placement leads to
improved crop nutrient acquisition and higher yield than conventional fertilizer application by
broadcast. This research has shown that the combination of placed NH4+-based fertilizers and
inoculation of soil with P-solubilizing microorganisms may be a new strategy for improving
nutrient acquisition by plants. Inoculation of PGPMs in an NH4+-fertilized substrate improves
P acquisition of crop plants not only from sparingly available soil pools but also from
sparingly soluble P fertilizers such as sewage sludge ash that is recycled from sewage
treatment. In P-limited systems, improved P nutrition during early growth-stages ensures
improved biomass production and yield.

8: General discussion and conclusion
181
8.5 References
Blackshaw, R. E., Semach, G., Janzen, H. H. (2002): Fertilizer application method affects
nitrogen uptake in weeds and wheat. Weed Sci. 50, 634–641.
IPNI, (2016): Meta-analysis of phosphorus fertilizer placement and tillage interaction for corn
and soybean in the U.S., 2015 Annual Interpretive Summary, International Plant
Nutrition Institute, IPNI-2014-USA-4RM09. Study was funded by the 4R Research
Fund of the North American 4R nutrient stewardship. Obtained from
http://research.ipni.net/page/RNAP-6561 on 22.10.2016
Jing, J., Zhang, F., Rengel, Z., Shen, J. (2012): Localized fertilization with P plus N elicits an
ammonium-dependent enhancement of maize root growth and nutrient uptake. Field
Crop. Res. 133, 176–185.
Légère, A., Shirtliffe, S. J., Vanasse, A., Gulden, R. H. (2013): Extreme grain-based cropping
systems: when herbicide-free weed management meets conservation tillage in northern
climates. Weed Technol. 27, 204–211.
Linquist, B. A., Adviento-Borbe, M. A., Pittelkow, C. M., van Kessel, C., van Groenigen, K. J.
(2012): Fertilizer management practices and greenhouse gas emissions from rice
systems: A quantitative review and analysis. Field Crop. Res.135, 10–21.
LTZ Augustenberg, (2013): Grundnährstoffversorgung in Baden-Württemberg. Jahresbericht
2013. Landwirtschaftliches Technologiezentrum Augustenberg. Dowönaloaded from
http://www.ltz-bw.de/pb/,Lde/1930632 on 25 October 2016.
Ma, B. L., Wu, T. Y., Tremblay, N., Deen, W., McLaughlin, N. B., Morrison, M. J., Stewart, G.
(2010): On-farm assessment of the amount and timing of nitrogen fertilizer on
ammonia volatilization. Agron J 102(1):134–144.
Ma, Q., Rengel, Z., Rose, T. (2009): The effectiveness of deep placement of fertilisers is
determined by crop species and edaphic conditions in Mediterranean-type
environments: a review. Aust. J. Soil Res. 47, 19–32.
Nash, P. R., Motavalli, P. P., Nelson, K. A. (2012): Nitrous oxide emissions from claypan
soils due to nitrogen fertilizer source and tillage/fertilizer placement practices. Soil Sci.
Soc. Am. J. 76, 983–993.
Miller, M. H., Ohlrogge, A. J. (1958): Principles of nutrient uptake from fertilizer bands 1.
Effect of placement of nitrogen fertilizer on the uptake of band-placed phosphorus at
different soil phosphorus levels1. Agron. J. 50, 95–97.
Parry, M. L., Rosenzweig, C., Iglesias, A., Livermore, M., Fischer, G. (2004): Effects of
climate change on global food production under SRES emissions and socio-economic
scenarios. Climate Change 14, 53–67.
Ruidisch, M., Bartsch, S., Kettering, J., Huwe, B., Frei, S. (2013): The effect of fertilizer best
management practices on nitrate leaching in a plastic mulched ridge cultivation system.
Agr. Ecosyst. Environ. 169, 21–32.
Singh, D. K., Sale, P. W. G., Routley, R. R. (2005): Increasing phosphorus supply in
subsurface soil in northern Australia: Rationale for deep placement and the effects with
various crops. Plant Soil 269, 35–44.

8: General discussion and conclusion
182
Sommer, K. (2005): CULTAN-Düngung: physiologisch, ökologisch, ökonomisch optimiertes
Düngungsverfahren für Ackerkulturen, Grünland, Gemüse, Zierpflanzen und
Obstgehölze. Verlag Th. Mann, Gelsenkirchen-Buer, Germany.

9: List of publications and presentations
183
9 List of publications and presentations
9.1 Peer-reviewed publications
Nkebiwe, P. M., Weinmann, M., Bar-Tal, A., Müller, T. (2016): Fertilizer placement to
improve crop nutrient acquisition and yield: A review and meta-analysis. Field Crops
Research 196, 389–401 DOI: http://dx.doi.org/10.1016/j.fcr.2016.07.018
Nkebiwe, P. M., Weinmann, M., Müller, T. (2016): Improving fertilizer-depot exploitation and
maize growth by inoculation with plant growth-promoting bacteria: from lab to field.
Chemical and Biological Technologies in Agriculture 3 (1):15 DOI:
http://dx.doi.org/10.1186/s40538-016-0065-5
Nkebiwe, P. M., Neumann G. Müller, T. (2017). Densely rooted rhizosphere hotspots induced
around subsurface NH4+-fertilizer depots: a home for soil PGPMs? Chemical and
Biological Technologies in Agriculture DOI: 10.1186/s40538-017-0111-y
9.2 Conference proceedings
Nkebiwe, P. M., Weinmann, M., Weber, N., Neumann, G., & Müller, T. (2015): Placement of
Pseudomonas sp. DSMZ13134 around NH4+-based fertilizer depots in maize stimulates
root exploitation of the fertilizer depot in soil. DBGPrints Repository (Publications of
the German Soil Science Society). Proceedings from annual conference of the German
Soil Science Society, "Unsere Böden - Unser Leben", 5.-10.09.2015, Münich,
Germany
9.3 Oral Presentations (15-25 minutes)
Nkebiwe, P. M., Weinmann, M., Bar-Tal, A., Müller, T. (2016): P and N placement for
improved nutrient acquisition and yield: A meta-analysis. 8th International
Phosphorus Workshop (IPW8). Theme: Phosphorus 2020 – Challenges for Synthesis,
Agriculture, and Ecosystems. 12 – 16 September 2016, Science Campus, Phosphorus
Research, Rostock, Germany
Nkebiwe, P. M., Weinmann, M., Bar-Tal, A., Müller, T. (2016): P and N placement for
improved nutrient acquisition and yield: A meta-analysis. Plant Nutrition 2016,
International Conference of the German Society for Plant Nutrition – DGP (Annual
Meeting. Theme: Resource efficiency: from model plants to crops and crop systems. 28
– 30 September 2016, University of Hohenheim, Stuttgart, Germany
9.4 Poster Presentations
Nkebiwe P. M., Käfer N., Neumann G., Müller T., (2016): BE-assisted P nutrition of wheat
supplied with rock phosphate and placed NH4+. 5th General Assembly Meeting,
Biofector Project. (EC Seventh Framework Programme (FP7/2007-2013) under grant
agreement n° 312117). 21- 23 September 2016, Czech University of Life
Sciences,Prague, Czech Republic
Nkebiwe, P. M., Weinmann, M., Weber, N., Neumann, G., & Müller, T. (2015): Placement of
Pseudomonas sp. PRORADIX around NH4+-based fertilizer depots in maize
stimulates root exploitation of the fertilizer depot in soil. International symposium
miCROPe 2015, Theme: Microbe-assisted crop production – opportunities, challenges

9: List of publications and presentations
184
and needs. 23- 25 November 2015, Schlosschönbrunn, Vienna, Austria (4 min. poster
talk and poster presentation)
Nkebiwe P. M., Weinmann M., Bar-Tal A., Müller T., (2015): Fertilizer placement to
improve crop nutrient acquisition and yield: a meta-analysis. 4th General Assembly
Meeting, Biofector Project. (EC Seventh Framework Programme (FP7/2007-2013)
under grant agreement n° 312117). 30 September – 02 October 2015, Danubius-Hotel-
Flamenco, Budapest, Hungary
Nkebiwe P. M., Weber N. F., Weinmann M., Müller T., Neumann G., (2015): NH4+ placement
and BE application technique affect root-growth in fertilizer depots and root-
colonization by BE in field-grown maize. 4th General Assembly Meeting, Biofector
Project. (EC Seventh Framework Programme (FP7/2007-2013) under grant
agreement n° 312117). 30 September – 02 October 2015, Danubius-Hotel-Flamenco,
Budapest, Hungary
Nkebiwe P. M., Weinmann M., Weber N. F., Neumann G., Müller T., (2015): Placement of
Pseudomonas sp. around NH4+-based fertilizer depots in maize culture stimulates
root exploitation of the fertilizer depot. Plant Nutrition 2015, International
Conference of the German Society for Plant Nutrition – DGP (Annual Meeting).
Theme: “Boden, Nährstoffe, Wasser – Forschung für die nachhaltige und effiziente
Nutzung von Ressourcen”. 17 – 18 September 2015, Georg-August-Universität,
Göttingen, Germany (3rd Poster prize)
Nkebiwe, P. M., Weinmann, M., Weber, N., Neumann, G., & Müller, T. (2015): Placement of
Pseudomonas sp. PRORADIX around NH4+-based fertilizer depots in maize
stimulates root exploitation of the fertilizer depot in soil. Annual conference of the
German Soil Science Society, "Unsere Böden - Unser Leben", 5.-10 September 2015,
Münich, Germany
Nkebiwe P. M., Weinmann M., Weber N. F., Neumann G., Müller T., (2015): Placement of
Proradix around NH4+-based fertilizer depots in maize culture stimulates root
exploitation of the fertilizer depot. Rhizosphere4 conference. Theme: Stretching the
interface of life. 21-25 June 2015, Maastricht Exposition and Congress Centre
Maastricht, the Netherlands
Nkebiwe P. M., Weinmann M., Weber N. F., Neumann G., Müller T., (2015): Placement of
Proradix (BE 2) around NH4+-based fertilizer depots in maize culture stimulates.
3rd General Assembly Meeting, Biofector Project. (EC Seventh Framework
Programme (FP7/2007-2013) under grant agreement n° 312117). 08 - 10 October
2014, Hotel Cocumella, Sorrento, Italy
Nkebiwe P. M., Weinmann M., Neumann G., Müller T. (2014): Stimulation of localized root
growth by enhanced establishment of placed Plant Growth-Promoting
Microorganisms (PGPMs) in soil? Plant Nutrition 2014, International Conference of
the German Society for Plant Nutrition – DGP (Annual Meeting). Theme: From Basic
Understanding to Better Crops. 10 – 12 September 2014, Martin Luther University,
Halle (Saale), Germany

10: Acknowledgments
185
10 Acknowledgments
I would first offer my deepest gratitude to Prof. Dr. Torsten Müller. His kind, continuous
support and guidance from the beginning of my graduate education at the University of
Hohenheim until this day have made it possible for me to realize my dream and complete this
dissertation. He encouraged me to delve into research areas that were new to me knowing that
they will add much value to my work. He gave me feedback and guidance on a regular basis
regarding the progress of my work while allowing enough flexibility for me to initiate, design
and run my experiments.
I also give my biggest thanks to Prof. Dr. Günter Neumann for his support and guidance
during my entire doctoral study. I am very grateful for the regular meetings with him and
Prof. Müller to share with them the results of my experiments, a proposal for the next steps
and in turn receive the suggestions for improvement.
A big thank you goes to Prof. Dr. Uwe Ludewig, Dr. Markus Weinmann, Dr. Asher Bar-Tal
(ARO, Israel), Dr. Reiner Ruser, Dr. Rudolf Schulz, Nino Weber, Ivan Guzman and Dr.
Tobias Hartmann for their support, advice and tips to improve various aspects of my research.
A big thank you to Frau Helen Ochott, Frau Charlotte Haake, Frau Elke Dachtler, Herr
Heinrich Bremer (Fertilization and Soil Matter Dynamics, 340 i) for their invaluable and
friendly support especially during laboratory work.
Also, I say thank you to the technical staff at Ihinger Hof research station (301), fellow
undergraduate, graduate and doctoral students in the BIOFECTOR project and student
assistants (HiWis) for their reliable support and for a fruitful and enjoyable cooperation.
Very special thanks go to Minea, my dear wife for her continuous support and to our beautiful
baby daughter Lindi, whose smile eased out the strain during the final phase of my Ph.D.
work. More special thanks go to my parents, my brothers, my sisters, my in-laws, my close

10: Acknowledgments
186
friends, the Bahá'í community of Stuttgart, to my aunts, uncles and cousins in Cameroon and
around the world.
Finally, I thank the European Commission for funding this research. European Community's
Seventh Framework Programme (FP7/2007-2013) under grant agreement n° 312117
(BIOFECTOR).

10: Acknowledgments
187

11: Curriculum Vitae
188
11 Curriculum Vitae
▪ Personal information
Name Peteh Mehdi Nkebiwe
Home address Riedgrasweg 99,
70599 Stuttgart
Tel. 0711 – 16 01 26 79
Mobile: 0172 – 69 49 130
E-Mail: [email protected]
Date and place of birth 05 October 1982, Buea, Cameroon
Family status married, daughter
Nationality German
▪ Education
Doctoral Studies Fertilization and Soil Matter Dynamics (340i),
09.2012 – present University of Hohenheim
Dissertation: “Fertilizer placement and the potential for
its combination with bio-effectors to improve crop
nutrient acquisition and yield”
(Sept. 2012 – Nov. 2016)
Graduate Education Master of Science: Organic
09.2009 – 07.2012 Food Chain Management
Universität Hohenheim
Cumulative grade, very good (GPA, 3.6)
Undergraduate Education Bachelor of Science: Microbiology
10.2001 – 10.2004 Minor: Medical Laboratory Technology
University of Buea, Cameroon
Cumulative grade, good (GPA, 2.79)
Secondary Education
09.1999 – 07.2001 Advanced Level General Certificate of Education:
Biology, Chemistry, Physics, Mathematics and
Mechanics, Further Mathematics.
Bilingual Grammar School Molyko, Buea, Cameroon
09.1994 – 07.1999 Ordinary Level General Certificate of Education:
Biology, Human Biology, Chemistry, Physics,
Mathematics, Economics, Geography, English, French.

11: Curriculum Vitae
189
Bilingual Grammar School Molyko, Buea, Cameroon
▪ Other Education
07.2007 – 11.2008 Distance learing:
Chartered Institute of Marketing
Professional Diploma modules:
• Marketing Planning
• Marketing Research and Information
Cambridge Marketing College,
Swavesey, CamsCambs, CB24 4AA, U.K.
▪ Computer skills
Very good SAS / Microsoft Office Softwares / Meta-win
SigmaPlot
Good R / Oracle Production Database
▪ Languages
Mothertongue: English
Advanced: German / French / Batié
Elementary: Hebrew
Affiliations
Deutsche Bodenkundliche Gesellschaft
Deutsche Gesellschaft für Pflanzenernährung
▪ Professional and volunteer work
02.2009 – 08.2009 Office assistant (voluntary)
• Correspondence / Registration / Receptionist
Bosch Baha’i School: a Conference and Retreat Center,
Santa Cruz, CA., U.S.A.
12.2006 – 12.2008 Assistant Coordinator/Purchaser
• Coordination and leadership of four-person customer
service team / Management of purchases / Job
training
Food Services Department (FSD)
Baha’i World Center, Haifa, Israel
12.2004 – 12.2006 Customer service assistant
• Customer service, Point-of-Sale
FSD, Baha’i World Center, Haifa, Israel
10.2001 – 10.2002 Personal initiative (Two-person team)

11: Curriculum Vitae
190
Start-up and operation of a small commercial poultry
farm
Buea, Cameroon
Stuttgart, 26 October 2016
Peteh Mehdi Nkebiwe

12: Eidesstattliche Versicherung
191
12 Eidesstattliche Versicherung
Eidesstattliche Versicherung gemäß § 8 Absatz 2 der Promotionsordnung der
Universität Hohenheim zum Dr.sc.agr.
1. Bei der eingereichten Dissertation zum Thema
Fertilizer placement and the potential for its combination with bio-effectors to improve
crop nutrient acquisition and yield
handelt es sich um meine eigenständig erbrachte Leistung.
2. Ich habe nur die angegebenen Quellen und Hilfsmittel benutzt und mich keiner
unzulässigen Hilfe Dritter bedient. Insbesondere habe ich wörtlich oder sinngemäß aus
anderen Werken übernommene Inhalte als solche kenntlich gemacht.
3. Ich habe nicht die Hilfe einer kommerziellen Promotionsvermittlung oder -beratung in
Anspruch genommen.
4. Die Bedeutung der eidesstattlichen Versicherung und der strafrechtlichen Folgen einer
unrichtigen oder unvollständigen eidesstattlichen Versicherung sind mir bekannt.
Die Richtigkeit der vorstehenden Erklärung bestätige ich. Ich versichere an Eides Statt, dass
ich nach bestem Wissen die reine Wahrheit erklärt und nichts verschwiegen habe.
Stuttgart, 26 Oktober 2016 Peteh Mehdi Nkebiwe
___________________________________________________________________________
Ort und Datum Unterschrift