Embed Size (px)
Citation preview

Fertility in the highly developed countries: continuing postponement
and regional diversity
Vienna Institute of Demography (Austrian Academy of Sciences), Wittgenstein Centre for Demography and Global Human Capital
Tomáš Sobotka
VIII Congress of the Latin American Population Association (ALAP), Puebla, 25 October 2018 (Plenary Session 3)

Background: the diversity of low fertility
Highly developed countries & broader regions: contrasts in low fertility trends and their underlying factors
• The “Great divergence” in fertility? (Billari 2018)• The near-universal sub-replacement fertility• Continuing influence of delayed parenthood on period fertility
trends
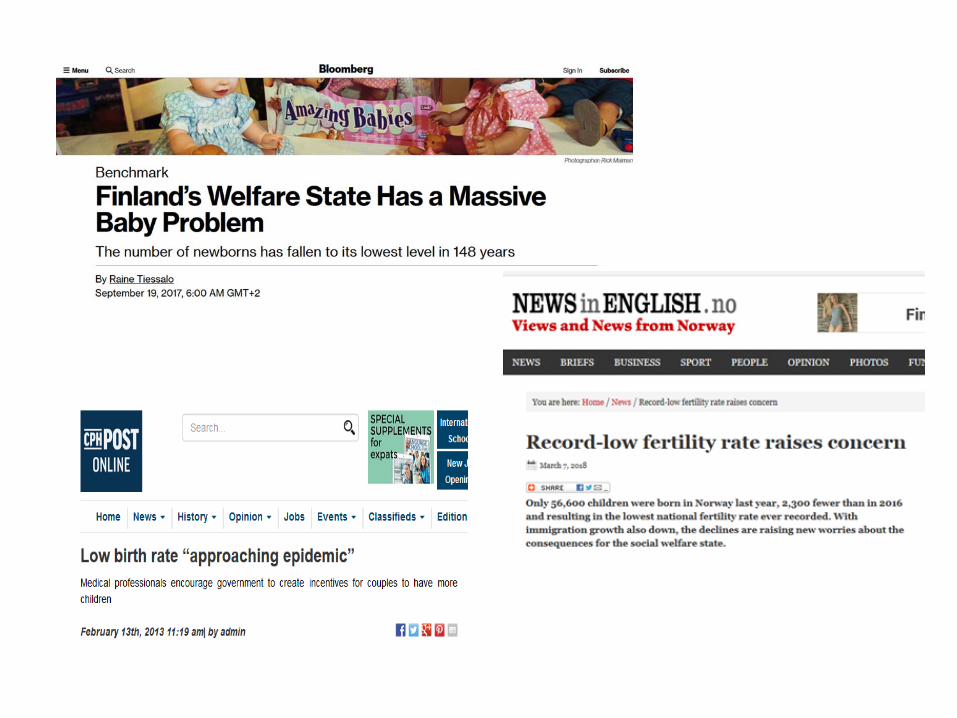
Some alarming reactions to persistent low fertility

Policy concerns: the global rise of pronatalismNumber of countries that aim to increase their fertility rate, out of 50 developed low-fertility countries globally
05
101520253035404550
1976 1980 1984 1988 1992 1996 2000 2004 2008 2012 2016
UN World Population Policies Database, 1976-2015

Agenda
Fertility in rich countries: Towards a “bifurcation”? Fertility trends after the economic recession: surprising regional
contrasts The continuing shift to delayed childbearing Unstable period fertility vs. stable preferences The contribution of migrants to births & fertility rates Changing education gradients? Discussion: main surprises and uncertain future
Focus: highly developed low-fertility countries and regions: Europe, North America, East Asia, Australia, New Zealand with some insights on China
Fertility in rich countries: Towards a “bifurcation”?
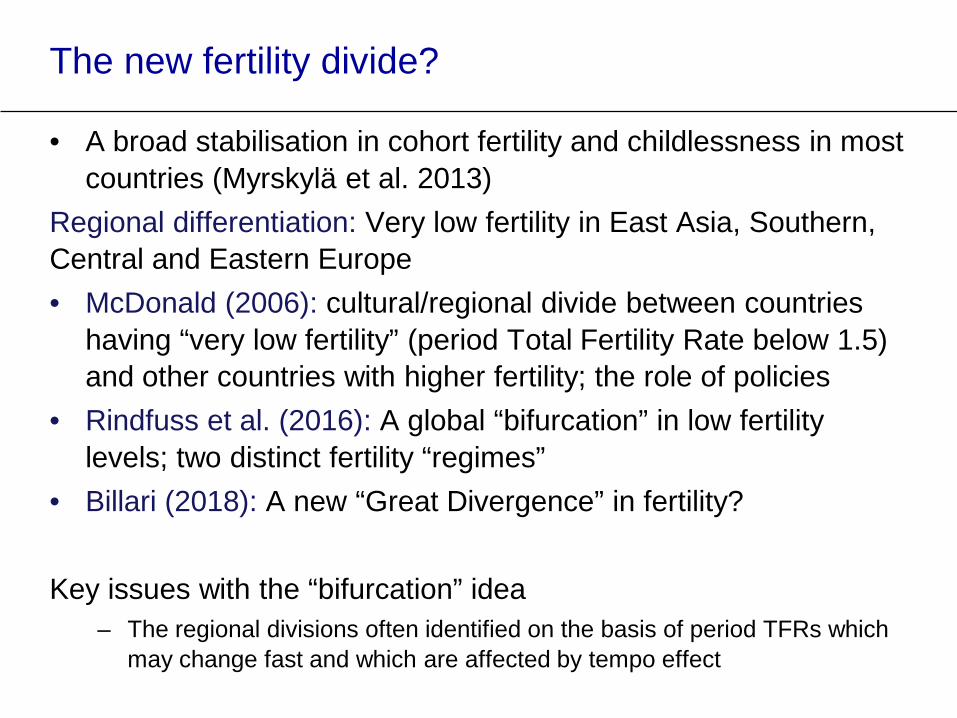
The new fertility divide?
• A broad stabilisation in cohort fertility and childlessness in most countries (Myrskylä et al. 2013)
Regional differentiation: Very low fertility in East Asia, Southern, Central and Eastern Europe• McDonald (2006): cultural/regional divide between countries
having “very low fertility” (period Total Fertility Rate below 1.5) and other countries with higher fertility; the role of policies
• Rindfuss et al. (2016): A global “bifurcation” in low fertility levels; two distinct fertility “regimes”
• Billari (2018): A new “Great Divergence” in fertility?
Key issues with the “bifurcation” idea– The regional divisions often identified on the basis of period TFRs which
may change fast and which are affected by tempo effect

Period TFR (2010-15) and completed cohort fertility; women born 1974
Sources: Sobotka / Figure 31 in State of the World Population Report 2018 (UNFPA); period TFR data for China estimated (Basten et al. 2014). Completed Cohort Fertility: WIC (2016), Human Fertility Database (2018). Data for China: 1% Population Sample Survey of 2015.
1.371.45
1.57
1.42 1.44
1.911.85 1.85 1.91
1.50 1.531.61
1.491.58
1.951.91
2.17
2.02
1.00
1.20
1.40
1.60
1.80
2.00
2.20
Fert
ility
rate
(chi
ldre
n pe
r wom
an)
Total fertility rate (2010-15)
Completed cohort fertility(women born 1974)

Cohort fertility trends: Not so easy to spot the divideCompleted fertility (children per woman), selected countries, women born 1940-1975
Sources: Sobotka (JBS, 2017); data based on Human Fertility Database, Council of Europe (2006), CFE database, national statistical offices, Census data, and own computations and projections
1.00
1.20
1.40
1.60
1.80
2.00
2.20
2.40
2.60
2.80
3.00
1940 1945 1950 1955 1960 1965 1970
Com
plet
ed co
hort
fert
ility
France
Germany
Italy
Japan
Poland
Romania
Russia
Spain
United Kingdom
United States
Netherlands

Period fertility rates: the end of the „Great divide“?
Source: UNFPA SWOP 2018; European Demographic Datasheet 2018
Period TFR, European regions, US and Korea, 1980-2016 or 2017
1.00
1.25
1.50
1.75
2.00
2.25
2.50
1990 1995 2000 2005 2010 2015
Southern Europe
Western Europe
Germany, Austria,SwitzerlandNordic countries
Central-Eastern Europe
South-Eastern Europe
Eastern Europe
EU-28
United States
Republic of Korea

Source: Human Fertility Database, Council of Europe 2006, Eurostat, national statistical offices
Contrasting period fertility trends in Europe,1980-2017
1.00
1.20
1.40
1.60
1.80
2.00
2.20
Belgium
Norway
Finland
Iceland
Sweden
EU
UK
Ireland
0.7 cm

Source: Human Fertility Database, Council of Europe 2006, Eurostat, national statistical offices
Contrasting period fertility trends in Europe,1980-2017
1.00
1.20
1.40
1.60
1.80
2.00
2.20
Belgium
Norway
Finland
Iceland
Sweden
EU
UK
Ireland
1.00
1.20
1.40
1.60
1.80
2.00
2.20
2005
2007
2009
2011
2013
2015
2017
Russia
Czechia
Hungary
EU
Germany
Austria

A continuing shift to delayed childbearing

What explains the unexpected fertility declines after the economic recession?
Was the decline in TFR driven mainly by the shift in fertility timing?
A renewed postponement of childbearing: continuing trend post-recession; probably also a “squeeze” in fertility of lower-educated women• Fertility declines especially strong among young women < age 25• Fertility decline also among migrant and lower-educated women• Continuing economic instability & precarious jobs among lower-
qualified women?• Later onset of dating and sexual activity? (Twenge 2017 for the US,
NIPSSR / Japanese National Fertility Survey 2015)

Falling fertility among teenage & young adult women
Source: Eurostat (2018), Human Fertility Database (2018)
Cumulative age-specific fertility rates at ages 15-24, selected countries, 2000-2016
0.00
0.10
0.20
0.30
0.40
0.50
0.60
0.70
0.80
0.90
United States
United Kingdom
Norway
France
European Union
Germany
Switzerland
Ireland

Early childbearing out of fashion
Source: UNFPA SWOP 2018; European Demographic Datasheet 2018
Births per 1,000 women aged 15-19, 1980-2015
17
49
25 26
20
49
27
6
25
1410 8
26
16
0
10
20
30
40
50
601980−1985
1990−1995
2000-2005
2010−2015

The continuing postponement of first births
Source: UNFPA SWOP 2018; European Demographic Datasheet 2018
Mean age at first birth, selected European countries, South Korea and the US, 1970-2016
20
22
24
26
28
30
3219
70
1974
1978
1982
1986
1990
1994
1998
2002
2006
2010
2014
Mea
n ag
e at
firs
t birt
h
United States
Netherlands
Austria
Russia
Spain
Czechia
Republic ofKorea

Unstable fertility, stable preferences?

Instability in period fertility trends
Modern contraception allows couples to react to changing period conditions, economic and labour market trends, family policies, expanding education and other factors
Planned or intended births can be – to some extent –flexibly “postponed”, “advanced” or “given up”
Tempo effects still drive ups and down in period fertility Period TFRs can also show remarkable increases Cohort fertility shows much more stability

Stability in fertility ideals and preferencesIdeal family size in Europe: mean % distribution across analysed countries
Source: Sobotka, T. and E. Beaujouan. 2014. Two Is best? The persistence of a two‐child family ideal in Europe. Population and Development Review, 40(3), pp.391-419.

Japan: a wide “gap” between ideal/desired FS and period TFR
Data source:
Japanese National Fertility Surveys
(Highlights of the results for Married couples/Singles, National Institute of Population and Social Security Research, September 2016)

Family size distribution, women born 1974 (in %)
Source: State of the World Population 2018, Figure 32

Childlessness rankings and change: East Asia and Southern Europe jumping up (top 6 and bottom 6 countries)
5.55.65.86.26.26.5
17.817.918.419.019.0
20.7
0 10 20 30
MoldovaSouth Korea
BelarusCzech Republic
RussiaBulgaria
FinlandCanada
GermanySingapore
United KingdomSwitzerland
Women born in 1960
9.79.89.910.010.4
11.5
20.420.720.9
23.123.2
28.2
0 10 20 30
LithuaniaCzech Republic
BulgariaBelarus
RussiaEstonia
FinlandSpain
ItalyGermany
SingaporeJapan
Women born in 1972
Data: 46 low-fertility countries; based on Cohort Fertility and Education (CFE) database (www.cfe-database.org) and Human Fertility Database (HFD)
• Fastest increases in childlessness: Japan, Korea, Spain, Taiwan, Italy

Does migration make a difference: Trends in migrant women’s fertility in
Europe
Source: Sobotka, T. 2018. “Migrant Fertility in Europe: Accelerated Decline During the Recession Period?“, presented at the European Population Conference, Brussels, June 2018

TFR by migration status, 2014 (2013)
Notes: Data for Germany, Switzerland and Greece by citizenshipSources: Eurostat (2017), own computations and national statistical offices
1.00
1.50
2.00
2.50
3.00Foreign-bornNative-bornTotal
Western Europe Nordic countries
German-speaking
Southern Europe
CentralEurope

Share of births to foreign-born mothers & net effect of migrant fertility on the TFR, 2013
Source: European Fertility Datasheet 2015; www.fertilitydatasheet.org

Education and fertility: shifting relationship

Diminishing education differentials in fertility?
What factors could drive the diminishing or reversing fertility gradient?• Higher gender equality, the second stage of the “gender revolution”
(Goldscheider et al. 2015; Esping Andersen and Billari 2015)• Changing patterns of union formation dual earner couples; high
earning potential among women new advantage (Van Bavel 2012, 2017)
• Higher educated women more “empowered” (information, knowledge, abilities) to act on their family plans (Lutz 2017; Testa 2017)
• Declining selectivity of the better educated• Unstable labour market and social status disadvantage of the lower
educated women (more remain without a partner & kids), disappearing jobs for the middle-educated (Adsera 2017)
• Evidence for fertility convergence for the Nordic countries (Jalovaaraet al. 2018), Belgium, possibly, US (Hazan & Zoabi 2015)

Continuing wide diversity in education gradients across countries: women born 1930-1970
Source: T Sobotka, É Beaujouan, and Z Brzozowska. 2018. “Reversals, diminishing differentials, or stable patterns? Long-term trends in educational gradients in fertility across the developed countries.” Paper presented at EPC Conference, Brussels, June 2018

Continuing wide diversity in education gradients across countries

Continuing wide diversity in education gradients across countries

Discussion

Main trends & surprises• East Asia (followed by Southern Europe) a new “hotspot” of very low
fertility across education groups
• “Ultra-low fertility” in East Asia: high & rising childlessness and non-marriage and absence of significant immigration
• South Korean TFR of 1.05 in 2017 (0.83 in Seoul) lowest globally despite increasing spending on families & pronatalist policies
• Period fertility instability (both ups and downs) during the time of economic recovery past 2012
• Surprising continuation in period TFR declines in higher fertility regions contrasting with the broad stabilisation in cohort fertility
• Changes in regional rankings; temporary convergence?
• Renewed falls in young age fertility in most countries, continuing postponement fertility at young ages becoming marginal
• Contrasting trends in the shift away from marriage

Shifting childbearing away from marriage: contrasting trends
Source: UNFPA SWOP 2018;
Percentage of births outside marriage,1970-2016
0
10
20
30
40
50
60
1970 1975 1980 1985 1990 1995 2000 2005 2010 2015
European Union
United States
Russia
Japan
France
Spain
Sweden

Why do countries and regions differ?Selected factors discussed in the literature
• The incomplete “gender revolution”
• Economic and labour market instability
• Precarious position of young adults: unstable employment, low incomes, unaffordable housing (especially in Southern Europe and among lower-educated)
• Family policies, cost of children
• Work-family conflict

Why do countries and regions differ?Selected factors discussed in the literature
• The incomplete “gender revolution”
• Economic and labour market instability
• Precarious position of young adults: unstable employment, low incomes, unaffordable housing (especially in Southern Europe and among lower-educated)
• Family policies, cost of children
• Work-family conflicts
Factors that need to be be explored more
• The multifaceted effects of internet and technological change
• The role of new values, pressures, norms and standards related to parenthood

iGEN: New technologies changing future partnerships and fertility?
Generation born 1995+• Abrupt change in values, attitudes, behaviour
since around 2011-12 • Growing up slowly• Spending up to 6 hours/day on smartphones &
social media• Fewer having sex, fewer in relationship, fewer
prioritize marriage and family, socialization often online
• Obsessed with safety and security: Fragile, insecure, not ready for adult responsibilities
• Complementary evidence for Japan (2015 National Fertility Survey)

Parenthood: Never has been so
complicated?