Embed Size (px)
Citation preview
Sylvie DubucUPTAP workshop, Leeds, 23-25 of March 2009
Fertility, ethnicity and religion: recent trends in the UK
General project
Demographic characteristics by ethnic and religious groups
& projections
with D. Coleman (co-I)
Why fertility estimates by ethnic and religious groups?
how ethnicity and religion may impact on fertility?social and cultural composition of the UK population,changes and future expectationsTo develop plausible fertility assumptions for population projection models
No direct methods available
Fertility, ethnicity and religion: recent trends in the UK
Ethnic groups show differences in fertility
For the UK, fertility rates by ethnic groups up to 2001 need to create / update existing rates, inter-censuses rates
Religious affiliation may support childbearing (norms supporting childbearing, rejecting contraception/abortion)
No estimates available by religious groups for the UK Few reports on fertility estimates by religion (e.g. for Austria (Goujon et al.2005,), for Europe (Kaufman, 2007)
Introduction
Here LFS data (2001-2006) is used togetherwith the Own Child Method to producefertility estimates by ethnic and religiousgroups from 1987 to 2006 at national level.
Ethnic and religious groupof the mother only2001 census definitions (LFS 2001 to 2006)
Introduction
Outline
The OCM and method refinements
TFR trends and ASFRs patterns by ethnic groups, 1987-2006.Is there convergence between ethnic groups?
UK born and foreign born, impact on fertility.Does country of up-bringing impact on reproductive
behaviour?
TFR by religious groups.Does religion matter?
Introduction
Own Child Method
LFS data, household survey, yearlySurveys pooled across yearsMatching children to mothers within household Allowing reverse survival calculations
15 years estimates (14 prior to the survey)
Berthoud, 2001; Coleman and Smith,2005
UK total fertility 1961 - 2006, from own-child method and vital registration
1.00
1.50
2.00
2.50
3.00
3.5019
61
1963
1965
1967
1969
1971
1973
1975
1977
1979
1981
1983
1985
1987
1989
1991
1993
1995
1997
1999
2001
2003
2005
UK total fertility own-childUK total fertility vital registration
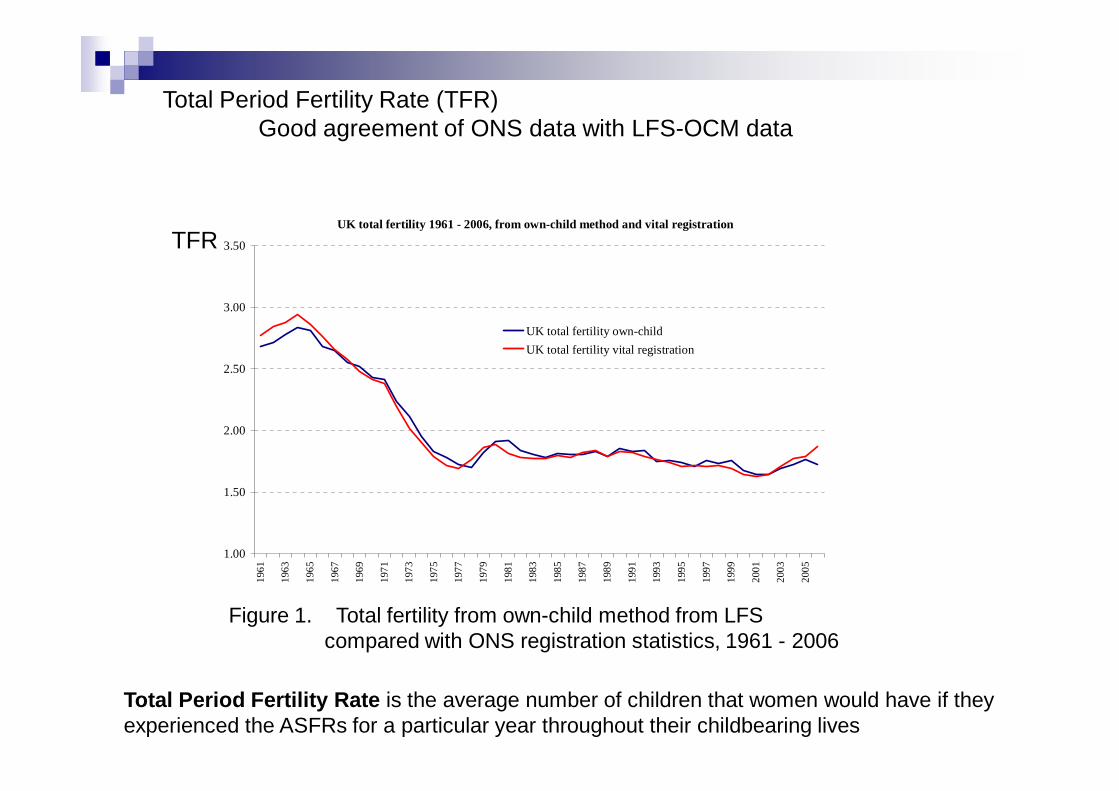
Figure 1. Total fertility from own-child method from LFS compared with ONS registration statistics, 1961 - 2006
Total Period Fertility Rate (TFR)Good agreement of ONS data with LFS-OCM data
Total Period Fertility Rate is the average number of children that women would have if they experienced the ASFRs for a particular year throughout their childbearing lives
TFR
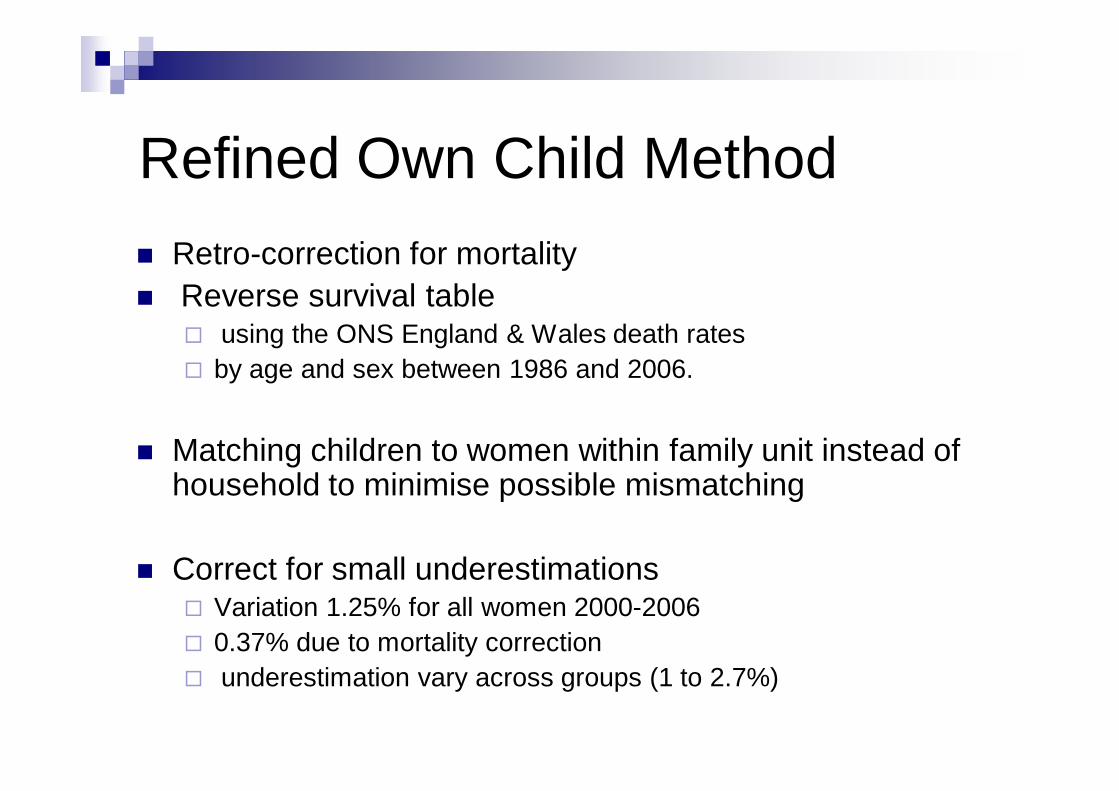
Refined Own Child Method Retro-correction for mortalityReverse survival table
using the ONS England & Wales death ratesby age and sex between 1986 and 2006.
Matching children to women within family unit instead of household to minimise possible mismatching
Correct for small underestimationsVariation 1.25% for all women 2000-20060.37% due to mortality correctionunderestimation vary across groups (1 to 2.7%)
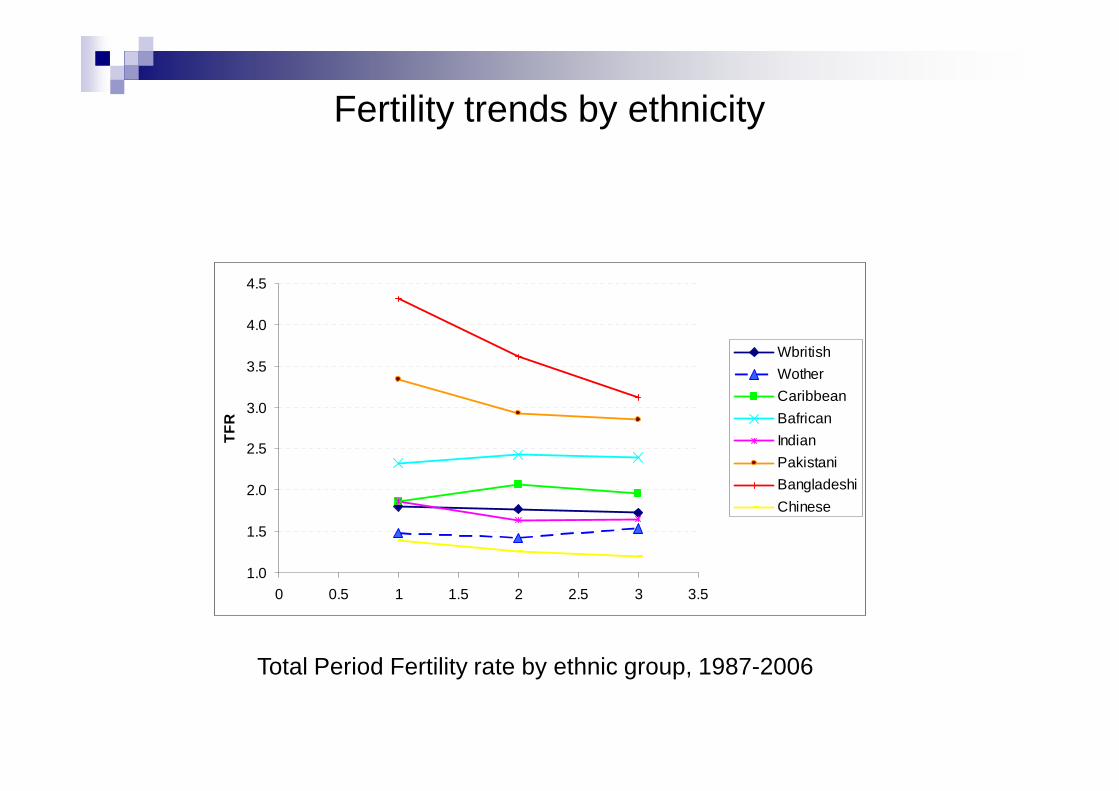
Total Period Fertility rate by ethnic group, 1987-2006
Fertility trends by ethnicity
1.0
1.5
2.0
2.5
3.0
3.5
4.0
4.5
0 0.5 1 1.5 2 2.5 3 3.5
TFR
WbritishWotherCaribbeanBafricanIndianPakistaniBangladeshiChinese
1987-2006 ALL UK TFR: 1.78
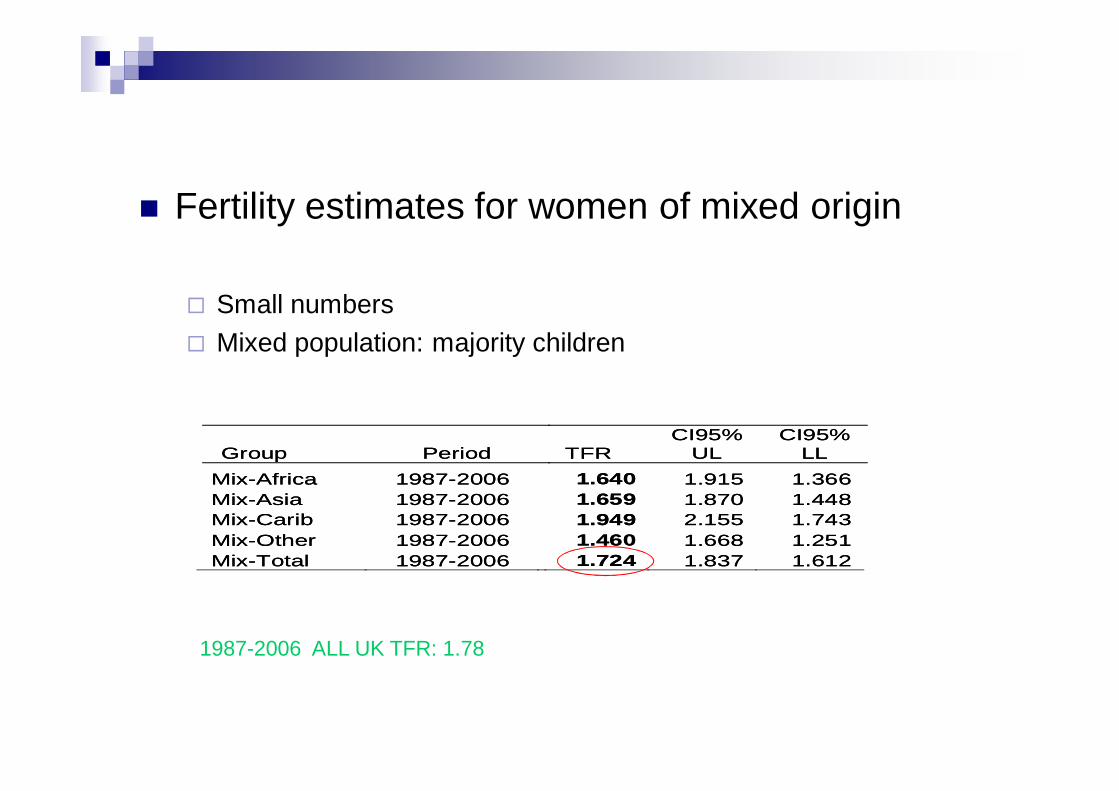
Fertility estimates for women of mixed origin
Small numbersMixed population: majority children
Group Period TFR CI95%
UL CI95%
LL Group Period TFR CI95%
UL CI95%
LL Mix-Africa 1987-2006 Mix-Asia 1987-2006 Mix-Carib 1987-2006 Mix-Other 1987-2006 Mix-Total 1987-2006
1.640 1.915 1.3661.659 1.870 1.4481.949 2.155 1.7431.460 1.668 1.2511.724 1.837 1.612
Mix-Africa 1987-2006 Mix-Asia 1987-2006 Mix-Carib 1987-2006 Mix-Other 1987-2006 Mix-Total 1987-2006
1.640 1.915 1.3661.659 1.870 1.4481.949 2.155 1.7431.460 1.668 1.2511.724 1.837 1.612
WBritish
0
20
40
60
80
100
120
Birt
hs p
er 1
,000
wom
en
15-1925-29
20-2430-34
35-3940-44
45-49Age group of mothers
WBritish
0
20
40
60
80
100
120
Birt
hs p
er 1
,000
wom
en
15-1925-29
20-2430-34
35-3940-44
45-4915-19
25-2920-24
30-3435-39
40-4445-49
Age group of mothers
WOther
0
20
40
60
80
100
120
Birt
hs p
er 1
,000
wom
en
15-1925-29
20-2430-34
35-3940-44
45-49 Age group of mothers
WOther
0
20
40
60
80
100
120
Birt
hs p
er 1
,000
wom
en
15-1925-29
20-2430-34
35-3940-44
45-4915-19
25-2920-24
30-3435-39
40-4445-49 Age group of mothers
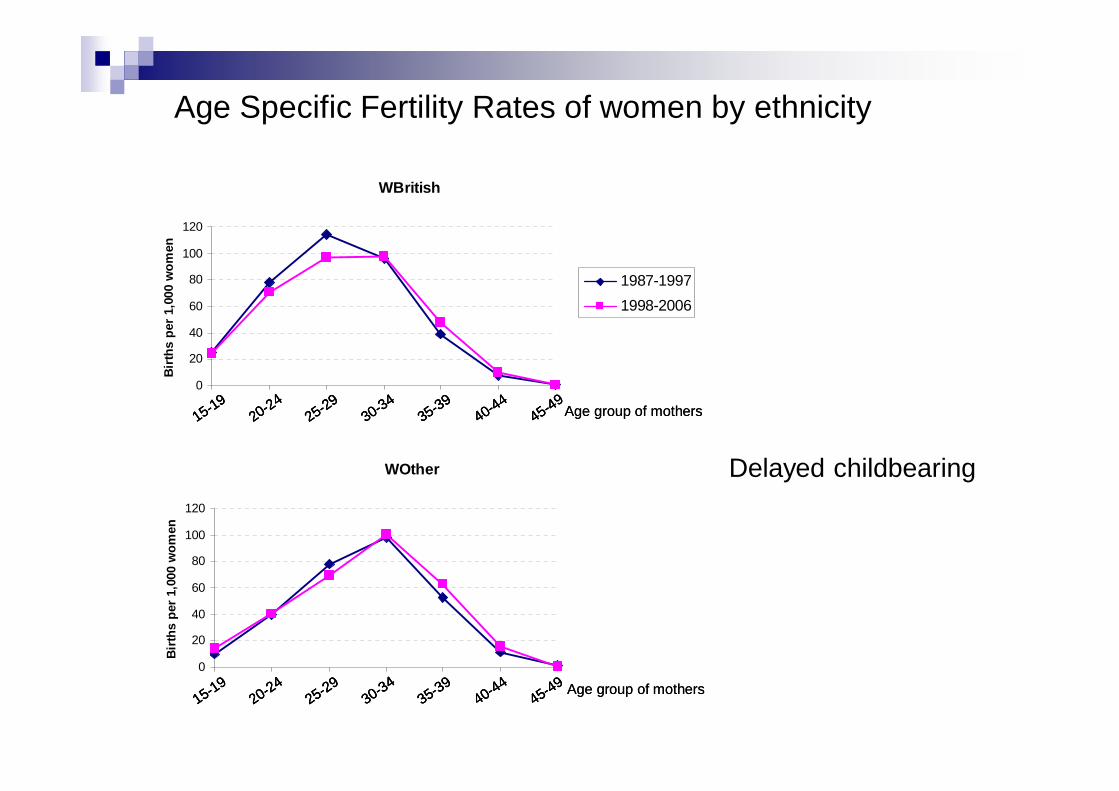
Delayed childbearing
Age Specific Fertility Rates of women by ethnicity
1987-19971998-2006

White other UK-born versus foreign born
White Other foreign-born women
0
20
40
60
80
100
120
Birt
hs p
er 1
,000
wom
en
White Other UK-born women
0
20
40
60
80
100
120
Birt
hs p
er 1
,000
wom
en
1987-19971998-2006
immigration and
delayed childbearing
(2/3 in 2002-2006)
15-1925-29
20-2430-34
35-3940-44
45-49Age group of mothers15-19
25-2920-24
30-3435-39
40-4445-49
15-1925-29
20-2430-34
35-3940-44
45-49Age group of mothers
15-1925-29
20-2430-34
35-3940-44
45-49Age group of mothers15-19
25-2920-24
30-3435-39
40-4445-49
15-1925-29
20-2430-34
35-3940-44
45-49Age group of mothers
Indian
0
20
40
60
80
100
120
140
Birt
hs p
er 1
,000
wom
en
15-1925-29
20-2430-34
35-3940-44
45-49Age group of mothers
Indian
0
20
40
60
80
100
120
140
Birt
hs p
er 1
,000
wom
en
15-1925-29
20-2430-34
35-3940-44
45-4915-19
25-2920-24
30-3435-39
40-4445-49Age group of mothers
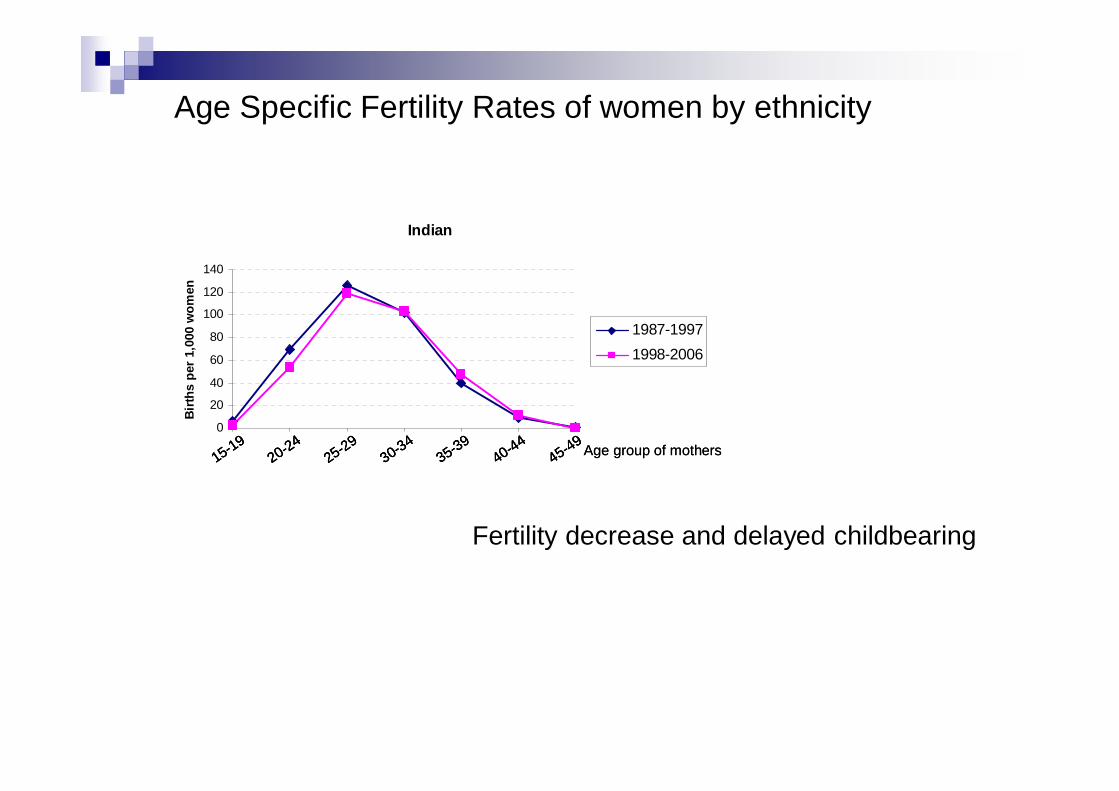
Fertility decrease and delayed childbearing
1987-19971998-2006
Age Specific Fertility Rates of women by ethnicity

Bangladeshi
020406080
100120140160180200220240
Birt
hs p
er 1
,000
wom
en
15-1925-29
20-2430-34
35-3940-44
45-49 Age group of mothers
Bangladeshi
020406080
100120140160180200220240
Birt
hs p
er 1
,000
wom
en
15-1925-29
20-2430-34
35-3940-44
45-4915-19
25-2920-24
30-3435-39
40-4445-49 Age group of mothers
Pakistani
020406080
100120140160180200220
Birt
hs p
er 1
,000
wom
en
15-1925-29
20-2430-34
35-3940-44
45-49Age group of mothers
Pakistani
020406080
100120140160180200220
Birt
hs p
er 1
,000
wom
en
15-1925-29
20-2430-34
35-3940-44
45-4915-19
25-2920-24
30-3435-39
40-4445-49Age group of mothers
Fall in fertilityat all ages
Age Specific Fertility Rates of women by ethnicity

UK-born Indian women: 5 years ASFRs
0
20
40
60
80
100
120
1987-19971998-2006
Age group of mothers
Birt
hs p
er 1
,000
wom
en
Delayed fertility of the Indian UK-born…
Indian
0
20
40
60
80
100
120
140
Bir
ths
per 1
,000
wom
en
15-1925-29
20-2430-34
35-3940-44
45-49Age group of mothers
Indian
0
20
40
60
80
100
120
140
Bir
ths
per 1
,000
wom
en
15-1925-29
20-2430-34
35-3940-44
45-4915-19
25-2920-24
30-3435-39
40-4445-49Age group of mothers
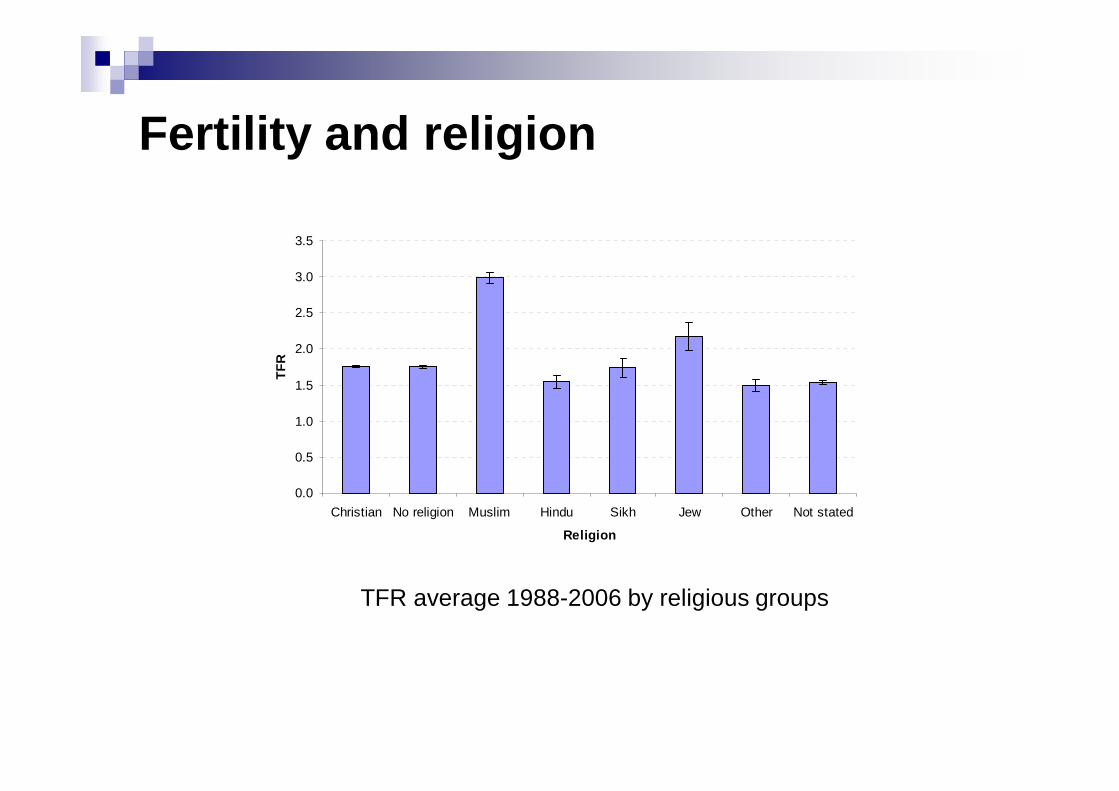
Fertility and religion
0.0
0.5
1.0
1.5
2.0
2.5
3.0
3.5
Christian No religion Muslim Hindu Sikh Jew Other Not stated
Religion
TFR
TFR average 1988-2006 by religious groups
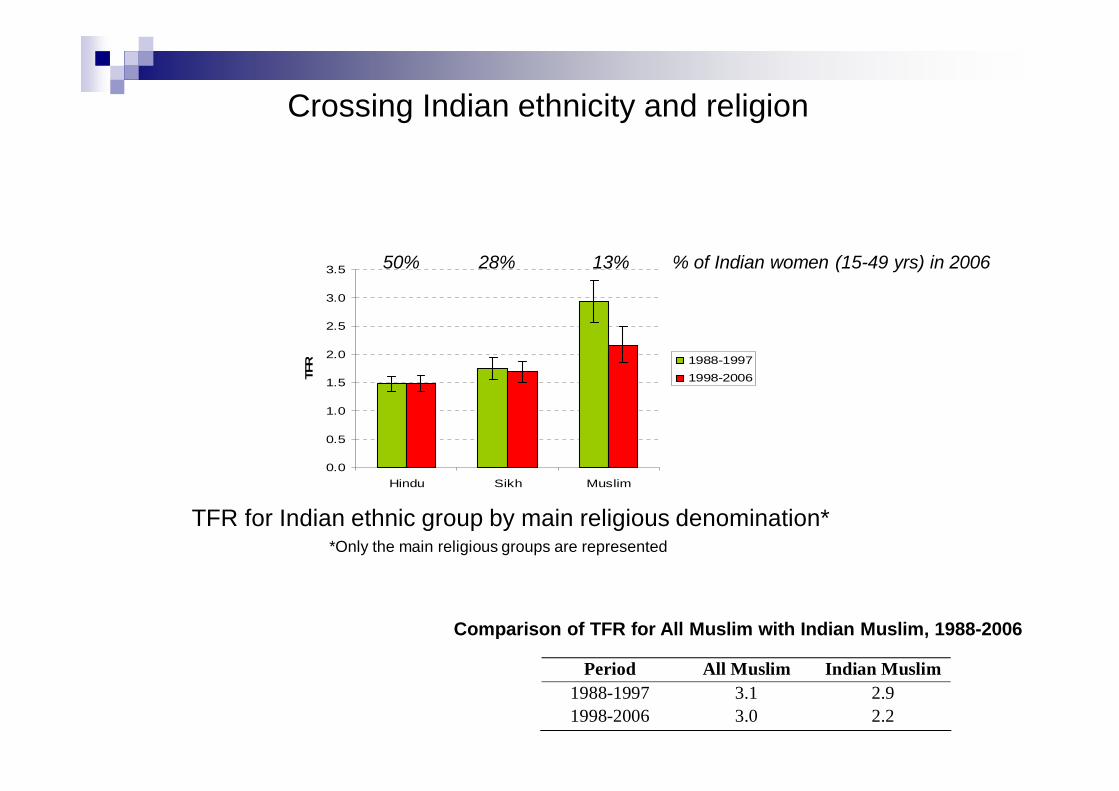
TFR for Indian ethnic group by main religious denomination**Only the main religious groups are represented
Period All Muslim Indian Muslim 1988-1997 3.1 2.9 1998-2006 3.0 2.2
Comparison of TFR for All Muslim with Indian Muslim, 1988-2006
0.0
0.5
1.0
1.5
2.0
2.5
3.0
3.5
Hindu Sikh Muslim
TFR 1988-1997
1998-2006
50% 28% 13% % of Indian women (15-49 yrs) in 2006
Crossing Indian ethnicity and religion
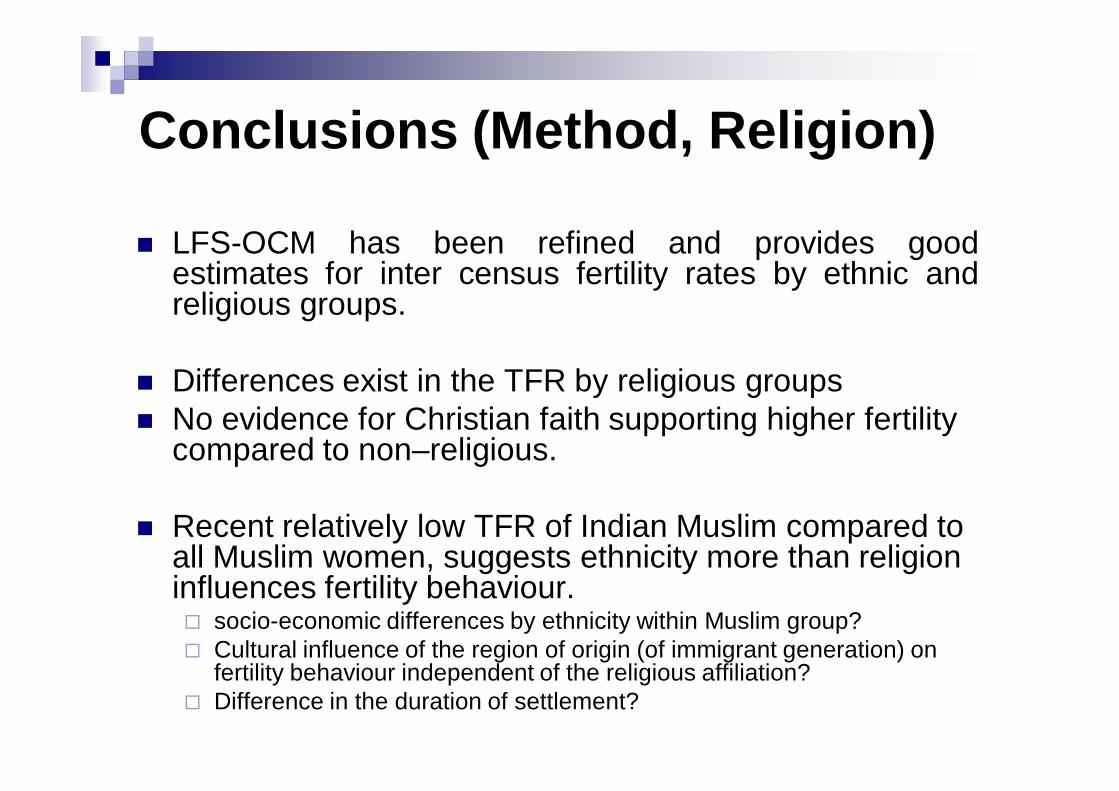
Conclusions (Method, Religion)
LFS-OCM has been refined and provides goodestimates for inter census fertility rates by ethnic andreligious groups.
Differences exist in the TFR by religious groupsNo evidence for Christian faith supporting higher fertility compared to non–religious.
Recent relatively low TFR of Indian Muslim compared to all Muslim women, suggests ethnicity more than religion influences fertility behaviour.
socio-economic differences by ethnicity within Muslim group?Cultural influence of the region of origin (of immigrant generation) on fertility behaviour independent of the religious affiliation?Difference in the duration of settlement?
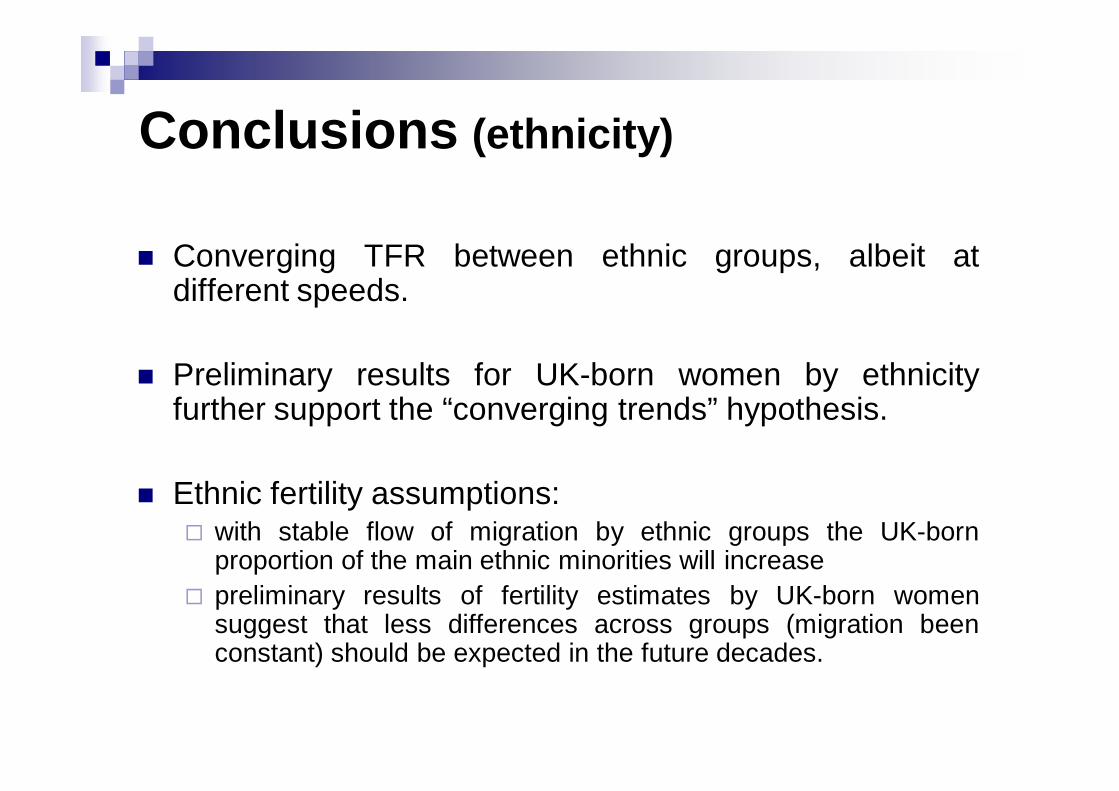
Conclusions (ethnicity)
Converging TFR between ethnic groups, albeit atdifferent speeds.
Preliminary results for UK-born women by ethnicityfurther support the “converging trends” hypothesis.
Ethnic fertility assumptions: with stable flow of migration by ethnic groups the UK-bornproportion of the main ethnic minorities will increasepreliminary results of fertility estimates by UK-born womensuggest that less differences across groups (migration beenconstant) should be expected in the future decades.
Finalise the fertility estimates by ethnicity & by religious denominationsExplore other sources
Other components of population projection modelsBase population by sub-group Mortality Estimation of migration flows by ethnic groups
Run projections
Ongoing and future work