Embed Size (px)
Citation preview
fåJëáíì=`ÜÉãáÅ~ä=pí~Äáäáò~íáçå=çÑ=jÉí~äë=~åÇ=o~ÇáçåìÅäáÇÉë=íÜêçìÖÜ=båÜ~åÅÉÇ=^å~ÉêçÄáÅ=
oÉÇìÅíáîÉ=mêÉÅáéáí~íáçåW=
_ÉåÅÜJpÅ~äÉ=qÉëíë=rëáåÖ=p~ãéäÉë=Ñêçã=íÜÉ=cÉêå~äÇ=båîáêçåãÉåí~ä=j~å~ÖÉãÉåí=mêçàÉÅíI=`áåÅáåå~íáI=lÜáç=
cáå~ä=qÉÅÜåáÅ~ä=oÉéçêí=
tçêâ=ÅçåÇìÅíÉÇ=lÅíçÄÉê=OMMN=íÜêçìÖÜ=^ìÖìëí=OMMP=
mêáåÅáé~ä=^ìíÜçêë=`ÜêáëíçéÜÉê=`K=iìíÉë=^åÖÉä~=cêáòòÉääI=md==qçÇÇ=^K=qÜçêåíçå=
g~ãÉë=jK=e~êêáåÖíçå=
^ìÖìëí=OMMP=
pìÄãáííÉÇ=ìåÇÉê=`çåíê~Åí=@=abJ^`OSJMNkqQNPMQ=íçW=
oáÅÜ~êÇ=mK=_ìëÜ=rKpK=aÉé~êíãÉåí=çÑ=båÉêÖó=
k~íáçå~ä=båÉêÖó=qÉÅÜåçäçÖó=i~Äçê~íçêó=SOS=`çÅÜê~åë=jáää=oç~Ç=máííëÄìêÖÜI=m^=NROPS=
mêáãÉ=`çåíê~Åíçê=^o`^afp=dCjI=fåÅK=
QVNR=mêçëéÉÅíìë=aêáîÉI=pìáíÉ=c=aìêÜ~ãI=kçêíÜ=`~êçäáå~=OTTNP=
qÉä=VNV=RQQ=QRPR=c~ñ=VNV=RQQ=RSVM=
táíÜ=j~íÉêá~äë=C=`ÜÉãáëíêó=i~Äçê~íçêóI=fåÅK=El~â=oáÇÖÉI=qÉååÉëëÉÉF=
båîáêçJqÉëí=i~Äçê~íçêáÉëI=ii`=E`~ëéÉêI=tóçãáåÖF=båÉêÖó=i~Äçê~íçêáÉëI=fåÅK=E`~ëéÉêI=tóçãáåÖF=

= =i
aáëÅä~áãÉê=
This report was prepared as an account of work sponsored by an agency of the United States Government. Neither the United States Government nor any agency thereof, nor any of their employees, makes any warranty, express or implied, or assumes any legal liability or responsibility for the accuracy, completeness, or usefulness of any information, apparatus, product, or process disclosed, or represents that its use would not infringe privately owned rights. Reference herein to any specific commercial product, process, or service by trade name, trademark, manufacturer, or otherwise does not necessarily constitute or imply its endorsement, recommendation, or favoring by the United States Government or any agency thereof. The views and opinions of authors expressed herein do not necessarily state or reflect those of the United States Government or any agency thereof.
= =ii
^Äëíê~Åí=
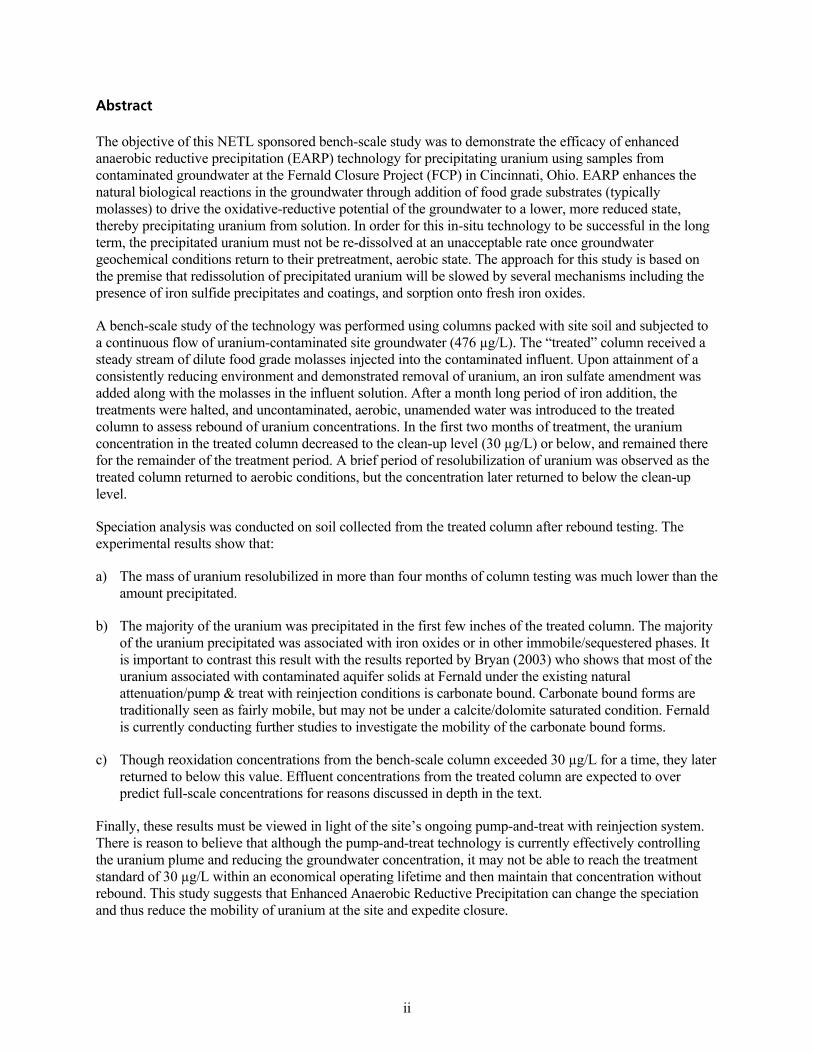
The objective of this NETL sponsored bench-scale study was to demonstrate the efficacy of enhanced anaerobic reductive precipitation (EARP) technology for precipitating uranium using samples from contaminated groundwater at the Fernald Closure Project (FCP) in Cincinnati, Ohio. EARP enhances the natural biological reactions in the groundwater through addition of food grade substrates (typically molasses) to drive the oxidative-reductive potential of the groundwater to a lower, more reduced state, thereby precipitating uranium from solution. In order for this in-situ technology to be successful in the long term, the precipitated uranium must not be re-dissolved at an unacceptable rate once groundwater geochemical conditions return to their pretreatment, aerobic state. The approach for this study is based on the premise that redissolution of precipitated uranium will be slowed by several mechanisms including the presence of iron sulfide precipitates and coatings, and sorption onto fresh iron oxides.
A bench-scale study of the technology was performed using columns packed with site soil and subjected to a continuous flow of uranium-contaminated site groundwater (476 µg/L). The “treated” column received a steady stream of dilute food grade molasses injected into the contaminated influent. Upon attainment of a consistently reducing environment and demonstrated removal of uranium, an iron sulfate amendment was added along with the molasses in the influent solution. After a month long period of iron addition, the treatments were halted, and uncontaminated, aerobic, unamended water was introduced to the treated column to assess rebound of uranium concentrations. In the first two months of treatment, the uranium concentration in the treated column decreased to the clean-up level (30 µg/L) or below, and remained there for the remainder of the treatment period. A brief period of resolubilization of uranium was observed as the treated column returned to aerobic conditions, but the concentration later returned to below the clean-up level.
Speciation analysis was conducted on soil collected from the treated column after rebound testing. The experimental results show that:
a) The mass of uranium resolubilized in more than four months of column testing was much lower than the amount precipitated.
b) The majority of the uranium was precipitated in the first few inches of the treated column. The majority of the uranium precipitated was associated with iron oxides or in other immobile/sequestered phases. It is important to contrast this result with the results reported by Bryan (2003) who shows that most of the uranium associated with contaminated aquifer solids at Fernald under the existing natural attenuation/pump & treat with reinjection conditions is carbonate bound. Carbonate bound forms are traditionally seen as fairly mobile, but may not be under a calcite/dolomite saturated condition. Fernald is currently conducting further studies to investigate the mobility of the carbonate bound forms.
c) Though reoxidation concentrations from the bench-scale column exceeded 30 µg/L for a time, they later returned to below this value. Effluent concentrations from the treated column are expected to over predict full-scale concentrations for reasons discussed in depth in the text.
Finally, these results must be viewed in light of the site’s ongoing pump-and-treat with reinjection system. There is reason to believe that although the pump-and-treat technology is currently effectively controlling the uranium plume and reducing the groundwater concentration, it may not be able to reach the treatment standard of 30 µg/L within an economical operating lifetime and then maintain that concentration without rebound. This study suggests that Enhanced Anaerobic Reductive Precipitation can change the speciation and thus reduce the mobility of uranium at the site and expedite closure.

= =iii
^ÅâåçïäÉÇÖÉãÉåíë=
The authors would like to acknowledge the support of numerous persons, without whom this work would not have been possible. The staff of Fluor Fernald, including Ken Broberg, Karen Voisard, Bill Hertel, Rich Abitz, and Larry Stebbins, has been very instrumental in this work, providing background information about the site, oversight and field sampling. The staff of Materials and Chemistry Laboratory, Dr. William Bostick, Jack Hall, and Barry Stephenson, contributed the important speciation portion of the work and also provided valuable comments on uranium geochemistry. The staff of Energy Laboratories, including Tracy DeWitt and Roger Garling, provided an important service in hosting the majority of the bench testing work.
The majority of the hands-on work was conducted with great diligence and skill by Pegi Jacobs. Dr. James A. Saunders of Auburn University, a pioneer in the use of iron for the in-situ precipitation of metals, made important contributions to the report in that area.
Other ARCADIS staff members who contributed to this project included:
David Liles who helped design and oversee the column testing
Greg Page, PE, who provided a careful review of this report as well as information about the field scale uranium precipitation work he is leading
Dr. Suthan Suthersan who invented the EARP technology and guides all of its applications worldwide for ARCADIS
Carl Singer and Van Sands who supported the project’s financial management
Rus Hames who edited this report
= =iv
q~ÄäÉ=çÑ=`çåíÉåíë=
aáëÅä~áãÉê KKKKKKKKKKKKKKKKKKKKKKKKKKKKKKKKKKKKKKKKKKKKKKKKKKKKKKKKKKKKKKKKKKKKKKKKKKKKKKKKKKKKKKKKKKKKKKKKKKKKKKKKKKKKKKKKKKKKKKKKKKKKKKKKKKKKKKKKKKK á
^Äëíê~ÅíKKKKKKKKKKKKKKKKKKKKKKKKKKKKKKKKKKKKKKKKKKKKKKKKKKKKKKKKKKKKKKKKKKKKKKKKKKKKKKKKKKKKKKKKKKKKKKKKKKKKKKKKKKKKKKKKKKKKKKKKKKKKKKKKKKKKKKKKKKKKKK áá
^ÅâåçïäÉÇÖÉãÉåíëKKKKKKKKKKKKKKKKKKKKKKKKKKKKKKKKKKKKKKKKKKKKKKKKKKKKKKKKKKKKKKKKKKKKKKKKKKKKKKKKKKKKKKKKKKKKKKKKKKKKKKKKKKKKKKKKKKKKKKKKK ááá
q~ÄäÉ=çÑ=`çåíÉåíë KKKKKKKKKKKKKKKKKKKKKKKKKKKKKKKKKKKKKKKKKKKKKKKKKKKKKKKKKKKKKKKKKKKKKKKKKKKKKKKKKKKKKKKKKKKKKKKKKKKKKKKKKKKKKKKKKKKKKKKKKKKK áî
iáëí=çÑ=q~ÄäÉë KKKKKKKKKKKKKKKKKKKKKKKKKKKKKKKKKKKKKKKKKKKKKKKKKKKKKKKKKKKKKKKKKKKKKKKKKKKKKKKKKKKKKKKKKKKKKKKKKKKKKKKKKKKKKKKKKKKKKKKKKKKKKKKKKKKKK î
iáëí=çÑ=cáÖìêÉë KKKKKKKKKKKKKKKKKKKKKKKKKKKKKKKKKKKKKKKKKKKKKKKKKKKKKKKKKKKKKKKKKKKKKKKKKKKKKKKKKKKKKKKKKKKKKKKKKKKKKKKKKKKKKKKKKKKKKKKKKKKKKKKKKKK îá
iáëí=çÑ=^ééÉåÇáÅÉë KKKKKKKKKKKKKKKKKKKKKKKKKKKKKKKKKKKKKKKKKKKKKKKKKKKKKKKKKKKKKKKKKKKKKKKKKKKKKKKKKKKKKKKKKKKKKKKKKKKKKKKKKKKKKKKKKKKKKKKKKK îáá
bñÉÅìíáîÉ=pìãã~êó KKKKKKKKKKKKKKKKKKKKKKKKKKKKKKKKKKKKKKKKKKKKKKKKKKKKKKKKKKKKKKKKKKKKKKKKKKKKKKKKKKKKKKKKKKKKKKKKKKKKKKKKKKKKKKKKKKKKKKKKKK N
NK fåíêçÇìÅíáçåKKKKKKKKKKKKKKKKKKKKKKKKKKKKKKKKKKKKKKKKKKKKKKKKKKKKKKKKKKKKKKKKKKKKKKKKKKKKKKKKKKKKKKKKKKKKKKKKKKKKKKKKKKKKKKKKKKKKKKKKKKKKK Q
NKN rê~åáìã=mêÉÅáéáí~íáçå KKKKKKKKKKKKKKKKKKKKKKKKKKKKKKKKKKKKKKKKKKKKKKKKKKKKKKKKKKKKKKKKKKKKKKKKKKKKKKKKKKKKKKKKKKKKKKKKKKKKKKKKKKKKKKKKKKKKKKKKKKKKKKKKKK T
NKO mêÉÅáéáí~íÉ=içåÖÉîáíó=Ó=bñéÉêáÉåÅÉ=~åÇ=iáíÉê~íìêÉ=oÉîáÉïKKKKKKKKKKKKKKKKKKKKKKKKKKKKKKKKKKKKKKKKKKKKKKKKKKKKKKKKKKKKKKKKKKKKKKK V
NKOKN ^o`^afpÛ=~åÇ=líÜÉêëÛ=bñéÉêáÉåÅÉ KKKKKKKKKKKKKKKKKKKKKKKKKKKKKKKKKKKKKKKKKKKKKKKKKKKKKKKKKKKKKKKKKKKKKKKKKKKKKKKKKKKKKKKKKKKKKKKKKKK V
NKOKO jÉÅÜ~åáëãë=çÑ=mêÉÅáéáí~íÉ=içåÖÉîáíóKKKKKKKKKKKKKKKKKKKKKKKKKKKKKKKKKKKKKKKKKKKKKKKKKKKKKKKKKKKKKKKKKKKKKKKKKKKKKKKKKKKKKKKKKKKK NM
NKOKP oÉÖìä~íçêó=^ÅÅÉéí~åÅÉ=çÑ=b^om KKKKKKKKKKKKKKKKKKKKKKKKKKKKKKKKKKKKKKKKKKKKKKKKKKKKKKKKKKKKKKKKKKKKKKKKKKKKKKKKKKKKKKKKKKKKKKKKKKKK NT
NKP lÄàÉÅíáîÉë KKKKKKKKKKKKKKKKKKKKKKKKKKKKKKKKKKKKKKKKKKKKKKKKKKKKKKKKKKKKKKKKKKKKKKKKKKKKKKKKKKKKKKKKKKKKKKKKKKKKKKKKKKKKKKKKKKKKKKKKKKKKKKKKKKKKKKKKKKKKKKKKKKKK NT
NKPKN pìÅÅÉëë=`êáíÉêá~W=kçåJpáíÉ=péÉÅáÑáÅKKKKKKKKKKKKKKKKKKKKKKKKKKKKKKKKKKKKKKKKKKKKKKKKKKKKKKKKKKKKKKKKKKKKKKKKKKKKKKKKKKKKKKKKKKKKKKKKKK NU
NKPKO nì~åíáí~íáîÉ=páíÉ=péÉÅáÑáÅ=lÄàÉÅíáîÉëKKKKKKKKKKKKKKKKKKKKKKKKKKKKKKKKKKKKKKKKKKKKKKKKKKKKKKKKKKKKKKKKKKKKKKKKKKKKKKKKKKKKKKKKKKKKK NV
NKQ páíÉ=_~ÅâÖêçìåÇKKKKKKKKKKKKKKKKKKKKKKKKKKKKKKKKKKKKKKKKKKKKKKKKKKKKKKKKKKKKKKKKKKKKKKKKKKKKKKKKKKKKKKKKKKKKKKKKKKKKKKKKKKKKKKKKKKKKKKKKKKKKKKKKKKKKKKKKKK NV
NKQKN dÉçäçÖó=~åÇ=eóÇêçÖÉçäçÖóKKKKKKKKKKKKKKKKKKKKKKKKKKKKKKKKKKKKKKKKKKKKKKKKKKKKKKKKKKKKKKKKKKKKKKKKKKKKKKKKKKKKKKKKKKKKKKKKKKKKKKKKKKK NV
NKQKO mêÉîáçìë=fåîÉëíáÖ~íáçåë KKKKKKKKKKKKKKKKKKKKKKKKKKKKKKKKKKKKKKKKKKKKKKKKKKKKKKKKKKKKKKKKKKKKKKKKKKKKKKKKKKKKKKKKKKKKKKKKKKKKKKKKKKKKKKKKKKK OO
NKQKP b^om=qÉÅÜåçäçÖó=^ééäáÅ~Äáäáíó=íç=cÉêå~äÇ=páíÉ KKKKKKKKKKKKKKKKKKKKKKKKKKKKKKKKKKKKKKKKKKKKKKKKKKKKKKKKKKKKKKKKKKKKKKKKKKKK OV
NKQKQ b^om=~ë=~=mçíÉåíá~ä=pìééäÉãÉåí=íç=íÜÉ=bñáëíáåÖ=mìãéJ~åÇJíêÉ~í=póëíÉã=~í=cÉêå~äÇKKKKKKKKKKKKKKK OV
OK bñéÉêáãÉåí~ä KKKKKKKKKKKKKKKKKKKKKKKKKKKKKKKKKKKKKKKKKKKKKKKKKKKKKKKKKKKKKKKKKKKKKKKKKKKKKKKKKKKKKKKKKKKKKKKKKKKKKKKKKKKKKKKKKKKKKKKKK PP
OKN cáÉäÇ=p~ãéäÉ=`çääÉÅíáçå KKKKKKKKKKKKKKKKKKKKKKKKKKKKKKKKKKKKKKKKKKKKKKKKKKKKKKKKKKKKKKKKKKKKKKKKKKKKKKKKKKKKKKKKKKKKKKKKKKKKKKKKKKKKKKKKKKKKKKKKKKKKKK PP
OKO `çêÉ=`çåîÉêëáçåI=pçáä=eçãçÖÉåáò~íáçå=~åÇ=oÉé~ÅâáåÖKKKKKKKKKKKKKKKKKKKKKKKKKKKKKKKKKKKKKKKKKKKKKKKKKKKKKKKKKKKKKKKKKKKKKKKKKK PP
OKP `çäìãå=pÉíJìé=~åÇ=aÉëáÖå KKKKKKKKKKKKKKKKKKKKKKKKKKKKKKKKKKKKKKKKKKKKKKKKKKKKKKKKKKKKKKKKKKKKKKKKKKKKKKKKKKKKKKKKKKKKKKKKKKKKKKKKKKKKKKKKKKKKKKKK PS
= =v
OKQ `çäìãå=léÉê~íáçå KKKKKKKKKKKKKKKKKKKKKKKKKKKKKKKKKKKKKKKKKKKKKKKKKKKKKKKKKKKKKKKKKKKKKKKKKKKKKKKKKKKKKKKKKKKKKKKKKKKKKKKKKKKKKKKKKKKKKKKKKKKKKKKKKKKKKK PV
OKR léÉê~íáçå~ä=bîÉåíë=ÇìêáåÖ=`çäìãå=qÉëíáåÖ KKKKKKKKKKKKKKKKKKKKKKKKKKKKKKKKKKKKKKKKKKKKKKKKKKKKKKKKKKKKKKKKKKKKKKKKKKKKKKKKKKKKKKKKKKKKK QN
OKS alLlom=jÉ~ëìêÉãÉåí=jÉíÜçÇçäçÖó KKKKKKKKKKKKKKKKKKKKKKKKKKKKKKKKKKKKKKKKKKKKKKKKKKKKKKKKKKKKKKKKKKKKKKKKKKKKKKKKKKKKKKKKKKKKKKKKKKKKKKK QO
OKT péÉÅá~íáçå=jÉíÜçÇë KKKKKKKKKKKKKKKKKKKKKKKKKKKKKKKKKKKKKKKKKKKKKKKKKKKKKKKKKKKKKKKKKKKKKKKKKKKKKKKKKKKKKKKKKKKKKKKKKKKKKKKKKKKKKKKKKKKKKKKKKKKKKKKKKKKK QQ
PK oÉëìäíë=~åÇ=aáëÅìëëáçåKKKKKKKKKKKKKKKKKKKKKKKKKKKKKKKKKKKKKKKKKKKKKKKKKKKKKKKKKKKKKKKKKKKKKKKKKKKKKKKKKKKKKKKKKKKKKKKKKKKKKKKKKK QR
PKN _áçÖÉçÅÜÉãáëíêó=oÉëìäíëKKKKKKKKKKKKKKKKKKKKKKKKKKKKKKKKKKKKKKKKKKKKKKKKKKKKKKKKKKKKKKKKKKKKKKKKKKKKKKKKKKKKKKKKKKKKKKKKKKKKKKKKKKKKKKKKKKKKKKKKKKKKK QR
PKNKN fåÑäìÉåí=dêçìåÇï~íÉê KKKKKKKKKKKKKKKKKKKKKKKKKKKKKKKKKKKKKKKKKKKKKKKKKKKKKKKKKKKKKKKKKKKKKKKKKKKKKKKKKKKKKKKKKKKKKKKKKKKKKKKKKKKKKKKKKKKK QR
PKNKO bÑÑäìÉåí=t~íÉê=Ó=qêÉ~íãÉåí=mÜ~ëÉKKKKKKKKKKKKKKKKKKKKKKKKKKKKKKKKKKKKKKKKKKKKKKKKKKKKKKKKKKKKKKKKKKKKKKKKKKKKKKKKKKKKKKKKKKKKKKKK RO
PKNKP bÑÑäìÉåí=t~íÉê=Ó=fêçå=mêÉÅáéáí~íáçå=mÜ~ëÉ KKKKKKKKKKKKKKKKKKKKKKKKKKKKKKKKKKKKKKKKKKKKKKKKKKKKKKKKKKKKKKKKKKKKKKKKKKKKKKKKKKKK RT
PKNKQ bÑÑäìÉåí=t~íÉê=Ó=oÉÄçìåÇ=mÜ~ëÉ KKKKKKKKKKKKKKKKKKKKKKKKKKKKKKKKKKKKKKKKKKKKKKKKKKKKKKKKKKKKKKKKKKKKKKKKKKKKKKKKKKKKKKKKKKKKKKKKKK RV
PKNKR pçáäë=Ó=oÉÄçìåÇ=mÜ~ëÉ KKKKKKKKKKKKKKKKKKKKKKKKKKKKKKKKKKKKKKKKKKKKKKKKKKKKKKKKKKKKKKKKKKKKKKKKKKKKKKKKKKKKKKKKKKKKKKKKKKKKKKKKKKKKKKKKKKKK RV
PKO rê~åáìã=oÉëìäíë KKKKKKKKKKKKKKKKKKKKKKKKKKKKKKKKKKKKKKKKKKKKKKKKKKKKKKKKKKKKKKKKKKKKKKKKKKKKKKKKKKKKKKKKKKKKKKKKKKKKKKKKKKKKKKKKKKKKKKKKKKKKKKKKKKKKKKKKKK RV
PKOKN aáëëçäîÉÇ=mÜ~ëÉ=rê~åáìã=qêÉåÇë KKKKKKKKKKKKKKKKKKKKKKKKKKKKKKKKKKKKKKKKKKKKKKKKKKKKKKKKKKKKKKKKKKKKKKKKKKKKKKKKKKKKKKKKKKKKKKKKKKK RV
PKOKO pçäáÇ=mÜ~ëÉ=rê~åáìã=j~ëë=~åÇ=j~ëë=_~ä~åÅÉ KKKKKKKKKKKKKKKKKKKKKKKKKKKKKKKKKKKKKKKKKKKKKKKKKKKKKKKKKKKKKKKKKKKKKKKKKKKKKK SP
PKP líÜÉê=jÉí~äë=oÉëìäíëKKKKKKKKKKKKKKKKKKKKKKKKKKKKKKKKKKKKKKKKKKKKKKKKKKKKKKKKKKKKKKKKKKKKKKKKKKKKKKKKKKKKKKKKKKKKKKKKKKKKKKKKKKKKKKKKKKKKKKKKKKKKKKKKKKK SS
PKQ péÉÅá~íáçå=oÉëìäíë KKKKKKKKKKKKKKKKKKKKKKKKKKKKKKKKKKKKKKKKKKKKKKKKKKKKKKKKKKKKKKKKKKKKKKKKKKKKKKKKKKKKKKKKKKKKKKKKKKKKKKKKKKKKKKKKKKKKKKKKKKKKKKKKKKKKKKK ST
PKR aáëÅìëëáçå=çÑ=pÉèìÉåíá~ä=bñíê~Åíáçå=oÉëìäíëKKKKKKKKKKKKKKKKKKKKKKKKKKKKKKKKKKKKKKKKKKKKKKKKKKKKKKKKKKKKKKKKKKKKKKKKKKKKKKKKKKKKKKKKKKKKKK TM
PKS a~í~=sÉêáÑáÅ~íáçåKKKKKKKKKKKKKKKKKKKKKKKKKKKKKKKKKKKKKKKKKKKKKKKKKKKKKKKKKKKKKKKKKKKKKKKKKKKKKKKKKKKKKKKKKKKKKKKKKKKKKKKKKKKKKKKKKKKKKKKKKKKKKKKKKKKKKKKKK TN
QK `çåÅäìëáçåëKKKKKKKKKKKKKKKKKKKKKKKKKKKKKKKKKKKKKKKKKKKKKKKKKKKKKKKKKKKKKKKKKKKKKKKKKKKKKKKKKKKKKKKKKKKKKKKKKKKKKKKKKKKKKKKKKKKKKKKKKKKK TP
QKN _ÉåÅÜ=pÅ~äÉ=píìÇó=`çåÅäìëáçåë KKKKKKKKKKKKKKKKKKKKKKKKKKKKKKKKKKKKKKKKKKKKKKKKKKKKKKKKKKKKKKKKKKKKKKKKKKKKKKKKKKKKKKKKKKKKKKKKKKKKKKKKKKKKKKKKKK TP
QKO fãéäáÅ~íáçåë=Ñçê=cìääJpÅ~äÉ=páíÉ=oÉãÉÇá~íáçå KKKKKKKKKKKKKKKKKKKKKKKKKKKKKKKKKKKKKKKKKKKKKKKKKKKKKKKKKKKKKKKKKKKKKKKKKKKKKKKKKKKKKKKKKKKK TS
RK oÉÑÉêÉåÅÉëKKKKKKKKKKKKKKKKKKKKKKKKKKKKKKKKKKKKKKKKKKKKKKKKKKKKKKKKKKKKKKKKKKKKKKKKKKKKKKKKKKKKKKKKKKKKKKKKKKKKKKKKKKKKKKKKKKKKKKKKKKKKKK TT
=
iáëí=çÑ=q~ÄäÉë=
q~ÄäÉ=NK=qÉãéçê~ä=qêÉåÇë=áå=rê~åáìã=`çåÅÉåíê~íáçåë=~í=tÉääë=SOQMU=~åÇ=SOQPPKKKKKKKKKKKKKKKKKKKKKKKKKKKKKKKKKKKKKKKKKKKKKKKKKKKKKKK OV
q~ÄäÉ=OK=fåáíá~ä=pçáä=^å~äóëÉëKKKKKKKKKKKKKKKKKKKKKKKKKKKKKKKKKKKKKKKKKKKKKKKKKKKKKKKKKKKKKKKKKKKKKKKKKKKKKKKKKKKKKKKKKKKKKKKKKKKKKKKKKKKKKKKKKKKKKKKKKKKKKKKKKKKKKKKKKKKKKKK PR
q~ÄäÉ=PK=`çäìãå=m~ÅâáåÖ=a~í~ KKKKKKKKKKKKKKKKKKKKKKKKKKKKKKKKKKKKKKKKKKKKKKKKKKKKKKKKKKKKKKKKKKKKKKKKKKKKKKKKKKKKKKKKKKKKKKKKKKKKKKKKKKKKKKKKKKKKKKKKKKKKKKKKKKKKKKKKKK PR
q~ÄäÉ=QK=^å~äóíáÅ~ä=jÉíÜçÇë=Ñçê=fåáíá~ä=t~íÉê=p~ãéäÉëKKKKKKKKKKKKKKKKKKKKKKKKKKKKKKKKKKKKKKKKKKKKKKKKKKKKKKKKKKKKKKKKKKKKKKKKKKKKKKKKKKKKKKKKKKKKKKKKKKK PR
q~ÄäÉ=RK=mÜ~ëÉë=çÑ=íÜÉ=`çäìãå=píìÇóKKKKKKKKKKKKKKKKKKKKKKKKKKKKKKKKKKKKKKKKKKKKKKKKKKKKKKKKKKKKKKKKKKKKKKKKKKKKKKKKKKKKKKKKKKKKKKKKKKKKKKKKKKKKKKKKKKKKKKKKKKKKKKKK PU
= =vi
q~ÄäÉ=SK=_~Åâ=mêÉëëìêÉ=áå=`çäìãåëI=a~óë=NVU=íÜçìÖÜ=ONS KKKKKKKKKKKKKKKKKKKKKKKKKKKKKKKKKKKKKKKKKKKKKKKKKKKKKKKKKKKKKKKKKKKKKKKKKKKKKKKKKKKKKKKKKKKKKK PU
q~ÄäÉ=TK=^å~äóíáÅ~ä=jÉíÜçÇë=Ñçê=bÑÑäìÉåí=t~íÉê=p~ãéäÉëKKKKKKKKKKKKKKKKKKKKKKKKKKKKKKKKKKKKKKKKKKKKKKKKKKKKKKKKKKKKKKKKKKKKKKKKKKKKKKKKKKKKKKKKKKKKKKK QM
q~ÄäÉ=UK=fåáíá~ä=^å~äóëÉë=çÑ=`çãéçëáíÉÇ=dêçìåÇï~íÉêI=pçáäI=~åÇ=jçä~ëëÉëKKKKKKKKKKKKKKKKKKKKKKKKKKKKKKKKKKKKKKKKKKKKKKKKKKKKKKKKKKKKKKKKKKK QR
q~ÄäÉ=VK=pìãã~êó=çÑ=^å~äóíáÅ~ä=a~í~=Ñçê=t~íÉê=p~ãéäÉë=Ñêçã=`çäìãå=qÉëíë=EÅçåíáåìÉÇ=çå=åÉñí=é~ÖÉëF KKKKKKKKKKKKKKKK QT
q~ÄäÉ=NNK=fåÑäìÉåí=~åÇ=bÑÑäìÉåí=rê~åáìã=`çåÅÉåíê~íáçåë KKKKKKKKKKKKKKKKKKKKKKKKKKKKKKKKKKKKKKKKKKKKKKKKKKKKKKKKKKKKKKKKKKKKKKKKKKKKKKKKKKKKKKKKKKKKKK RV
q~ÄäÉ=NOK=`~äÅìä~íáçå=çÑ=rê~åáìã=j~ëë=áå=bÑÑäìÉåí=çÑ=qêÉ~íÉÇ=`çäìãåKKKKKKKKKKKKKKKKKKKKKKKKKKKKKKKKKKKKKKKKKKKKKKKKKKKKKKKKKKKKKKKKKKKKKKKK SR
q~ÄäÉ=NPK=`~äÅìä~íáçå=çÑ=rê~åáìã=fåéìí=íç=íÜÉ=qêÉ~íÉÇ=`çäìãå=ÇìêáåÖ=qÉëíáåÖ KKKKKKKKKKKKKKKKKKKKKKKKKKKKKKKKKKKKKKKKKKKKKKKKKKKKKKKKK SS
q~ÄäÉ=NQK=jÉí~äë=oÉëìäíë=Ñçê=cÉêå~äÇ=páíÉ=pçáä=p~ãéäÉëKKKKKKKKKKKKKKKKKKKKKKKKKKKKKKKKKKKKKKKKKKKKKKKKKKKKKKKKKKKKKKKKKKKKKKKKKKKKKKKKKKKKKKKKKKKKKKKKKKKK SS
q~ÄäÉ=NRK=jÉí~äë=oÉëìäíë=Ñçê=`çäìãå=bÑÑäìÉåí=p~ãéäÉëKKKKKKKKKKKKKKKKKKKKKKKKKKKKKKKKKKKKKKKKKKKKKKKKKKKKKKKKKKKKKKKKKKKKKKKKKKKKKKKKKKKKKKKKKKKKKKKKKKK ST
q~ÄäÉ=NSK=pÉèìÉåíá~ä=bñíê~Åíáçå=çÑ=rê~åáìã=Ñêçã=cÉêå~äÇ=pçáäë=EY=NMJãÉëÜ=pçäáÇëFKKKKKKKKKKKKKKKKKKKKKKKKKKKKKKKKKKKKKKKKKKKKKKKKKKKKK SU
=
iáëí=çÑ=cáÖìêÉë=
cáÖìêÉ=NK=ríáäáò~íáçå=çÑ=`~êÄçÜóÇê~íÉë=áå=fowKKKKKKKKKKKKKKKKKKKKKKKKKKKKKKKKKKKKKKKKKKKKKKKKKKKKKKKKKKKKKKKKKKKKKKKKKKKKKKKKKKKKKKKKKKKKKKKKKKKKKKKKKKKKKKKKKKKKK R
cáÖìêÉ=OK=bÜJée=aá~Öê~ã=Ñçê=rê~åáìãKKKKKKKKKKKKKKKKKKKKKKKKKKKKKKKKKKKKKKKKKKKKKKKKKKKKKKKKKKKKKKKKKKKKKKKKKKKKKKKKKKKKKKKKKKKKKKKKKKKKKKKKKKKKKKKKKKKKKKKKKKKKKKKK U
cáÖìêÉ=PW=bêïáå=qk=cáÉäÇ=pÅ~äÉ=píìÇóI=rê~åáìãKKKKKKKKKKKKKKKKKKKKKKKKKKKKKKKKKKKKKKKKKKKKKKKKKKKKKKKKKKKKKKKKKKKKKKKKKKKKKKKKKKKKKKKKKKKKKKKKKKKKKKKKKKKKKKKK NN
cáÖìêÉ=QK=_ÉÇêçÅâ=qçéçÖê~éÜáÅ=j~é KKKKKKKKKKKKKKKKKKKKKKKKKKKKKKKKKKKKKKKKKKKKKKKKKKKKKKKKKKKKKKKKKKKKKKKKKKKKKKKKKKKKKKKKKKKKKKKKKKKKKKKKKKKKKKKKKKKKKKKKKKKKKKKK OM
cáÖìêÉ=RK=fÇÉ~äáòÉÇ=`êçëë=pÉÅíáçå KKKKKKKKKKKKKKKKKKKKKKKKKKKKKKKKKKKKKKKKKKKKKKKKKKKKKKKKKKKKKKKKKKKKKKKKKKKKKKKKKKKKKKKKKKKKKKKKKKKKKKKKKKKKKKKKKKKKKKKKKKKKKKKKKKKKKKK ON
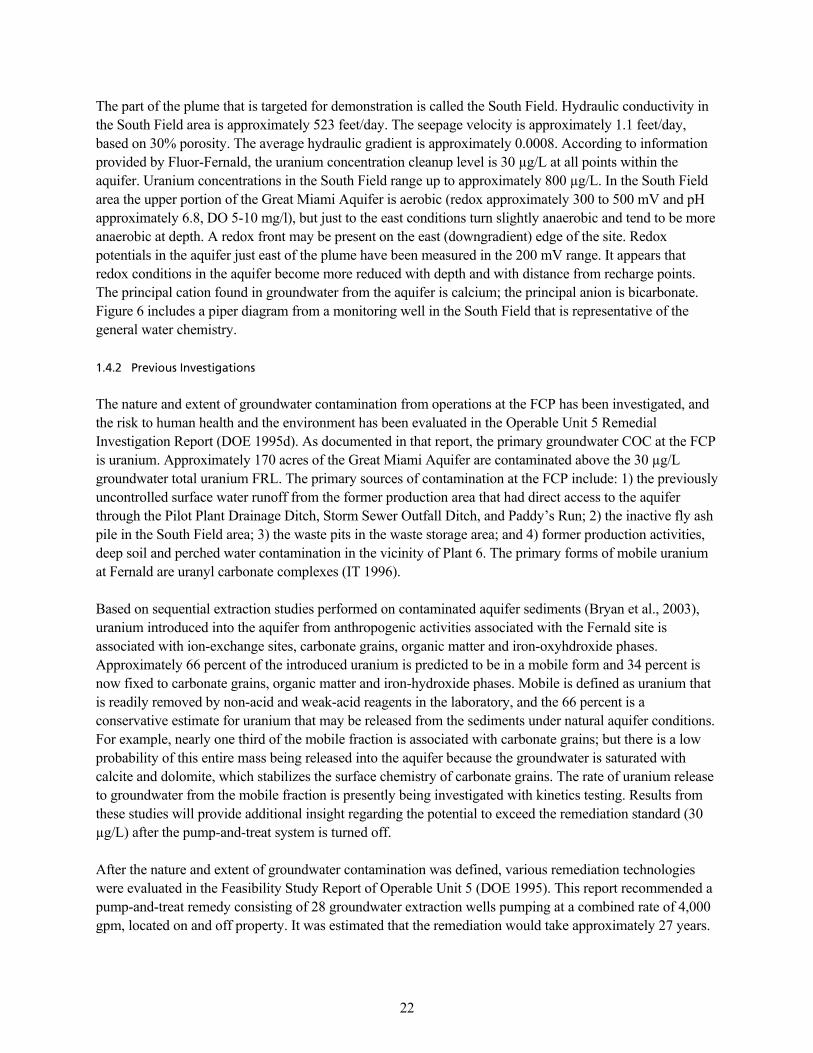
cáÖìêÉ=SW=máéÉê=aá~Öê~ã KKKKKKKKKKKKKKKKKKKKKKKKKKKKKKKKKKKKKKKKKKKKKKKKKKKKKKKKKKKKKKKKKKKKKKKKKKKKKKKKKKKKKKKKKKKKKKKKKKKKKKKKKKKKKKKKKKKKKKKKKKKKKKKKKKKKKKKKKKKKKKKKKKKKK OP
cáÖìêÉ=TK=içÅ~íáçå=çÑ=mìãé=~åÇ=qêÉ~í=póëíÉã KKKKKKKKKKKKKKKKKKKKKKKKKKKKKKKKKKKKKKKKKKKKKKKKKKKKKKKKKKKKKKKKKKKKKKKKKKKKKKKKKKKKKKKKKKKKKKKKKKKKKKKKKKKKKKKKK OR
cáÖìêÉ=UK=j~é=çÑ=rê~åáìã=mäìãÉKKKKKKKKKKKKKKKKKKKKKKKKKKKKKKKKKKKKKKKKKKKKKKKKKKKKKKKKKKKKKKKKKKKKKKKKKKKKKKKKKKKKKKKKKKKKKKKKKKKKKKKKKKKKKKKKKKKKKKKKKKKKKKKKKKKKKK OS
cáÖìêÉ=VK=`êçëë=pÉÅíáçå=çÑ=rê~åáìã=mäìãÉ KKKKKKKKKKKKKKKKKKKKKKKKKKKKKKKKKKKKKKKKKKKKKKKKKKKKKKKKKKKKKKKKKKKKKKKKKKKKKKKKKKKKKKKKKKKKKKKKKKKKKKKKKKKKKKKKKKKKKKK OT
cáÖìêÉ=NMK=qÉãéçê~ä=qêÉåÇ=Ñçê=íÜÉ=rê~åáìã=`çåÅÉåíê~íáçåë=~í=tÉääë=SOQMU=~åÇ=SOQPP KKKKKKKKKKKKKKKKKKKKKKKKKKKKKKKKKKKKKKKKKKKK OU
cáÖìêÉ=NNK=tÉää=içÅ~íáçåëKKKKKKKKKKKKKKKKKKKKKKKKKKKKKKKKKKKKKKKKKKKKKKKKKKKKKKKKKKKKKKKKKKKKKKKKKKKKKKKKKKKKKKKKKKKKKKKKKKKKKKKKKKKKKKKKKKKKKKKKKKKKKKKKKKKKKKKKKKKKKKKKKKK PQ
cáÖìêÉ=NOK=bñéÉêáãÉåí~ä=`çäìãå=fåáíá~ä=pÉí=réKKKKKKKKKKKKKKKKKKKKKKKKKKKKKKKKKKKKKKKKKKKKKKKKKKKKKKKKKKKKKKKKKKKKKKKKKKKKKKKKKKKKKKKKKKKKKKKKKKKKKKKKKKKKKKKK PT
cáÖìêÉ=NPK=`çäìãå=aÉëáÖå=jçÇáÑáÅ~íáçå=~ÑíÉê=a~ó=PMPKKKKKKKKKKKKKKKKKKKKKKKKKKKKKKKKKKKKKKKKKKKKKKKKKKKKKKKKKKKKKKKKKKKKKKKKKKKKKKKKKKKKKKKKKKKKKKKKKKK QP
cáÖìêÉ=NQK=lom=áå=`çäìãå=bñéÉêáãÉåí KKKKKKKKKKKKKKKKKKKKKKKKKKKKKKKKKKKKKKKKKKKKKKKKKKKKKKKKKKKKKKKKKKKKKKKKKKKKKKKKKKKKKKKKKKKKKKKKKKKKKKKKKKKKKKKKKKKKKKKKKKKKK RP
cáÖìêÉ=NRK=ql`=`çåÅÉåíê~íáçåë=áå=`çäìãå=bñéÉêáãÉåí KKKKKKKKKKKKKKKKKKKKKKKKKKKKKKKKKKKKKKKKKKKKKKKKKKKKKKKKKKKKKKKKKKKKKKKKKKKKKKKKKKKKKKKKKKKKKKKKKK RQ
cáÖìêÉ=NSK=ée=áå=`çäìãå=bñéÉêáãÉåíKKKKKKKKKKKKKKKKKKKKKKKKKKKKKKKKKKKKKKKKKKKKKKKKKKKKKKKKKKKKKKKKKKKKKKKKKKKKKKKKKKKKKKKKKKKKKKKKKKKKKKKKKKKKKKKKKKKKKKKKKKKKKKKK RR
cáÖìêÉ=NTK=al=áå=`çäìãå=bñéÉêáãÉåíKKKKKKKKKKKKKKKKKKKKKKKKKKKKKKKKKKKKKKKKKKKKKKKKKKKKKKKKKKKKKKKKKKKKKKKKKKKKKKKKKKKKKKKKKKKKKKKKKKKKKKKKKKKKKKKKKKKKKKKKKKKKKKK RS
cáÖìêÉ=NUK=fêçå=áå=qêÉ~íÉÇ=`çäìãå=bÑÑäìÉåí KKKKKKKKKKKKKKKKKKKKKKKKKKKKKKKKKKKKKKKKKKKKKKKKKKKKKKKKKKKKKKKKKKKKKKKKKKKKKKKKKKKKKKKKKKKKKKKKKKKKKKKKKKKKKKKKKKKKK RU
cáÖìêÉ=NVK=oÉëìäíë=çÑ=rê~åáìã=qê~ÅâáåÖKKKKKKKKKKKKKKKKKKKKKKKKKKKKKKKKKKKKKKKKKKKKKKKKKKKKKKKKKKKKKKKKKKKKKKKKKKKKKKKKKKKKKKKKKKKKKKKKKKKKKKKKKKKKKKKKKKKKKKKKKKKK SN
= =vii
cáÖìêÉ=OMK=rê~åáìã=`çåÅÉåíê~íáçåë=få=`çäìãå=bñéÉêáãÉåíKKKKKKKKKKKKKKKKKKKKKKKKKKKKKKKKKKKKKKKKKKKKKKKKKKKKKKKKKKKKKKKKKKKKKKKKKKKKKKKKKKKKKKKKKKK SO
cáÖìêÉ=ONK=rê~åáìã=`çåíÉåí=áå=qêÉ~íÉÇ=pçáä=`çäìãåKKKKKKKKKKKKKKKKKKKKKKKKKKKKKKKKKKKKKKKKKKKKKKKKKKKKKKKKKKKKKKKKKKKKKKKKKKKKKKKKKKKKKKKKKKKKKKKKKKKKKK SQ
cáÖìêÉ=OOK=rê~åáìã=é~êíáíáçåáåÖ=áå=ë~ãéäÉ=MPJMNUVI=~ë=Éëíáã~íÉÇ=Äó=f`mJjp=~åÇ=f`mJlbp=EêÉéçêíáåÖ=äáãáí=Z=Q=µÖLÖFSV
=
iáëí=çÑ=^ééÉåÇáÅÉë=
^= péÉÅá~íáçå=^å~äóëáë=
_= pçáä=_çêáåÖ=içÖ=Ñçê=jçåáíçêáåÖ=tÉää=PPOSQ=
`= mÜçíçÖê~éÜë==
a= rê~åáìã=mêÉÅáéáí~íáçå=~åÇ=aÉëçêéíáçå=j~ëë=`~äÅìä~íáçå
= =1
bñÉÅìíáîÉ=pìãã~êó=
The objective of this NETL sponsored bench-scale study was to demonstrate the efficacy of ARCADIS’ enhanced anaerobic reductive precipitation (EARP) technology for precipitating uranium from contaminated groundwater in the South Field Plume at the Fernald Closure Project (FCP) in Cincinnati, Ohio. EARP enhances the natural biological reactions in the groundwater through addition of food grade organic carbon substrates (electron donors, typically molasses) to drive the oxidative-reductive potential of the groundwater to a lower, more reduced state. As the aquifer becomes anaerobic, many dissolved metals in the groundwater precipitate out and typically will not redissolve into the groundwater under natural aquifer conditions.
However, the longevity of uranium precipitate is a complex issue, as discussed at length in Sections 1.1 and 1.2. In order for this in-situ technology to be successful in the long term, the precipitated uranium must not be re-dissolved at an unacceptable rate once groundwater geochemical conditions return to their pretreatment state (which is often aerobic and near-neutral pH). The potential for uranium remobilization will be controlled not only by the kinetics of the uranium oxidation reaction but also by preferential oxidation of other reduced compounds, preferential consumption of oxidants by sulfide minerals, sorption of desorbed uranium to freshly formed amorphous iron oxides and sorption of desorbed uranium to iron sulfide minerals.
The approach for this study is based on the premise that when EARP technology is implemented, uranium is reduced around the same time that the structural iron (ferric iron in the aquifer solids) is reduced. As the system becomes more reducing and sulfide is formed from the molasses, the iron released during the initial phases of reduction reacts with the sulfide produced during bacterial sulfate reduction and precipitates. This leads to a residual coating of FeS minerals, elemental sulfur and likely some stored organic carbon in the form of biomass. When EARP is being used for precipitation of certain metals, supplemental iron sulfate is sometimes added during treatment if the soluble iron observed during treatment is relatively low, as it was in this system. The amount of iron sulfide formed during the sulfate reduction process can be adjusted to provide a redox buffer to stabilize the reduced uranium precipitate by maintaining reduced conditions and by providing an iron source as oxidizing conditions are reestablished over time.
The Fernald test site has a dissolved uranium plume that occurs in a 52-m (170-ft) thick unconfined sand and gravel aquifer. The unit is a regionally extensive, sole-source aquifer with a local hydraulic conductivity of approximately 0.18 cm/s (523 feet/day), and a calculated seepage velocity of approximately 3.9 cm/s (1.1 feet/day). The part of the plume that is targeted for demonstration is called the South Field. Uranium concentrations in the South Field range up to approximately 800 µg/L, as compared to the Maximum Contaminant Level (MCL) of 30 µg/L. The South Field upper portion of the Great Miami Aquifer is aerobic (redox approximately 300 to 500 mV, DO 5 to 10 mg/l, and pH approximately 6.8), but just to the east conditions turn slightly anaerobic and tend to be more anaerobic at depth.
ARCADIS tested the technology’s effectiveness for the Fernald case through a bench-scale study utilizing a column system. Two duplicate columns were packed with site soil from core samples containing the natural organisms from the site. Uranium-contaminated site groundwater was pumped through each column in an upflow mode. One column was chosen as the “treated” column and received a steady stream of dilute food grade molasses injected into the contaminated influent. The second column was a control column that did not receive any molasses or other treatment. The molasses acts as an electron donor and carbon source that enhances the biological reactions in the column. As the reactions progress, the dissolved oxygen in the column is consumed, creating an anaerobic, reducing environment. Upon attainment of a consistently reducing environment and demonstrated removal of uranium, an iron sulfate amendment was added along
= =2
with the molasses in a now uncontaminated influent solution. After a month long period of iron addition, the treatments were halted, and uncontaminated, aerobic, unamended water was introduced to the treated column to assess the potential for rebound of uranium concentrations. During the final months of the experiment a second extension column was used “downgradient” from the treated column to assess the role of freshly reprecipitated iron minerals in adsorbing desorbed uranium.
The uranium concentration in the groundwater used as the column influents measured 496 µg/L prior to the initiation of the study. Over the course of about two months, the uranium concentration in the treated column decreased to concentrations at or below the clean-up level, and remained below the MCL for the remainder of the treatment period. The untreated column exhibited some natural attenuation (up to 46%) but continued to show effluent levels of uranium well above the clean-up level. Some resolubilization of uranium was observed as the treated column returned to aerobic conditions. The concentration exceeded the MCL at the outlet of the treated column briefly but later returned to below the clean-up level.
Results of the speciation analyses of soil collected from the treated column after EARP treatment and a period of rebound testing indicate that: (1) concentrations of total sulfur and environmentally accessible iron increased after treatment; (2) sulfide species (e.g., pyrite) were persistent under oxic conditions; (3) soil levels of uranium were significantly increased in the treated soil, over the “as-received” condition; and (4) in sequential extraction procedures, uranium in the soil was predominately (>50%) associated with the relatively immobile “oxide” soil fraction. In contrast, recently reported results of another study (Bryan 2003) indicate that most of the uranium in Fernald soils under the prevailing pump-and-treat with reinjection remedy is in carbonate-associated phases. Carbonate bound forms are traditionally seen as fairly mobile, but may not be under the calcite/dolomite saturated conditions present at Fernald. There are a variety of chemical forms that are included in the carbonate-bound fraction (the buffered acetic acid extract in Bryan’s study). Fernald is currently conducting further kinetic studies to investigate the mobility of the carbonate bound forms.
Taken together the experimental results presented here show that:
a) The mass of uranium resolubilized in more than four months of column testing was much lower than the amount precipitated.
b) The majority of the uranium was precipitated in the first few inches of the treated column. The majority of the uranium precipitated was associated with iron oxides or other immobile/sequestered phases. It is important to contrast this result with the results reported by Bryan (2003) who shows that most of the uranium associated with contaminated aquifer solids at Fernald under the existing natural attenuation/pump & treat with reinjection remedy is carbonate-bound and thus potentially more mobile.
c) The uranium that was resolubilized as conditions became more aerobic was readsorbed as it proceded downgradient, likely on the fresh iron oxyhydroxides produced.
d) The net effect of these processes can achieve groundwater concentrations below 30 µg/L.
Finally, these results must be viewed in light of the site’s ongoing pump-and-treat with reinjection system that is reducing the dissolved phase concentration of uranium in many areas of the site. Kd, a thermodynamic quantity that describes the equilibrium distribution between the solid and mobile phase, is the key parameter governs the operation of that system. Many Kds measured at the site are substantially above the Kd used as typical in previous modeling efforts. Thus, there is reason to believe that though the pump-and-treat technology is currently effectively controlling the uranium plume and reducing the groundwater concentration, it may not be able to reach the treatment standard of 30 µg/L within an

= =3
economical operating lifetime and then maintain that concentration without rebound. The results of this study suggest that Enhanced Anaerobic Reductive Precipitation can change the speciation and thus reduce the mobility of uranium at the site and expedite closure.
= =4
NK fåíêçÇìÅíáçå=
In-situ Reactive Zone (IRZ) technology, and more specifically, Enhanced Anaerobic Reductive Precipitation (EARP) technology, is used for the precipitation of selected dissolved metals and dissolved radionuclides including those of interest to DOE in groundwater. ARCADIS has been successfully exploiting molasses, whey, high fructose corn syrup (HFCS), and other food grade carbohydrate additives as electron donors since 1995 through the application of its IRZ technology (IRZ Technology includes a variety of specific approaches to particular classes of pollutants including Enhanced Reductive Dechlorination (ERD) for chlorinated aliphatic hydrocarbons and EARP for metals and radionuclides. ERD and EARP can also be implemented simultaneously.) Since the initial pilot-scale evaluation in 1995, ARCADIS has been retained to implement IRZ as either a field-pilot evaluation or at full-scale at more than 170 contaminated sites in 27 states and in 5 foreign countries, in a variety of geologies and with a variety of remedial objectives. Detailed discussions of the technology are available in an IRZ technology protocol document (Suthersan et al., 2002b) and numerous other publications (e.g., Suthersan, 2002a; Lutes et al., 2003).
The IRZ technology relies on enhancing biologically mediated reactions by supplying an energy substrate or electron donor to the groundwater system and driving the groundwater oxidation-reduction potential (ORP) to a lower, more strongly reduced state. This is accomplished by amending the groundwater system with an electron donor in the form of an aqueous solution of a food-grade soluble carbohydrate, such as molasses, cheese whey, or HFCS. Molasses and cheese whey are cost-effective and innocuous amendments that have been accepted by many state and federal regulatory agencies.
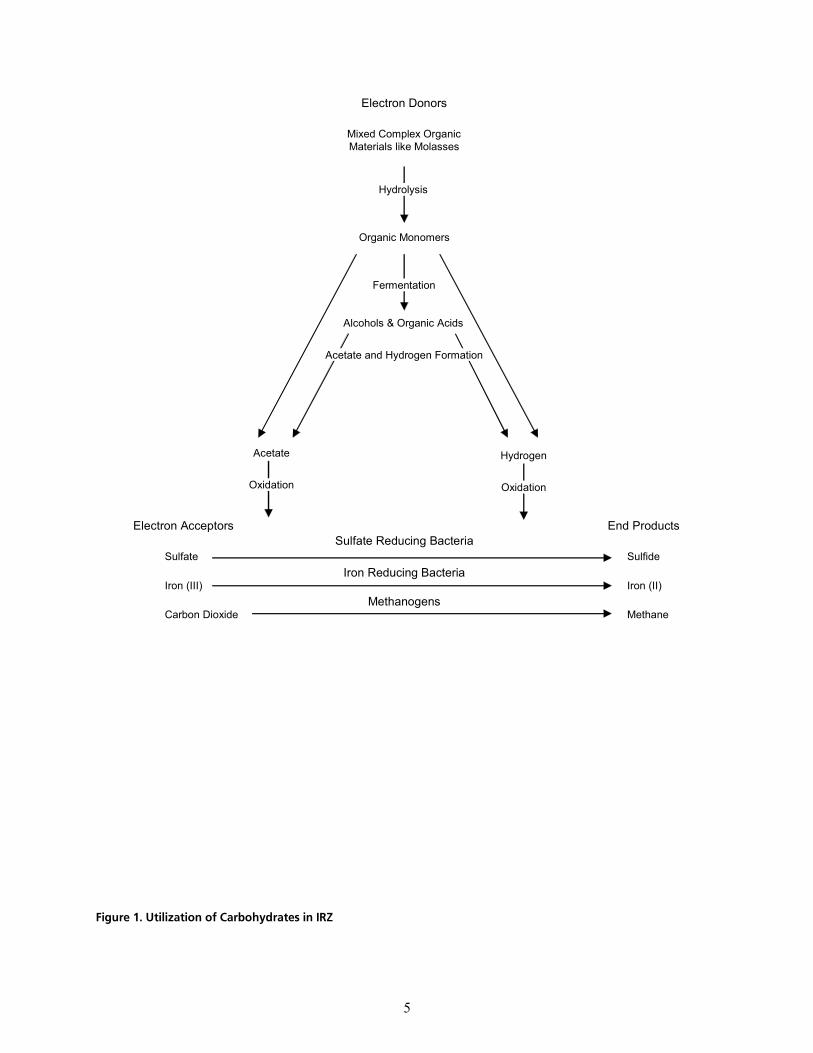
Indigenous heterotrophic microorganisms readily degrade the electron donor aerobically in the presence of dissolved oxygen (DO). This metabolic degradation process utilizes available DO contained in groundwater, as well as other electron acceptors such as nitrate, iron, and manganese, and as a result, drives the system to a more anaerobic and reduced state. The bacterial community present in the aquifer prior to electron donor addition adapts to the changed biogeochemical aquifer conditions (Zehnder and Stumm, 1989). In the enhanced subsurface environment, the bacterial population adjusts; facultative species begin to use alternative electron acceptors in the absence of oxygen, and populations of functionally and obligately anaerobic species increase in size. A bacterial community capable of fermenting carbohydrate molecules found in molasses or cheese whey develops. Fermentation end products like volatile fatty acids, alcohols, and hydrogen are generated as the endpoints of carbohydrate fermentation. Figure 1 shows the utilization of an injected carbohydrate and provides its chemical fate during microbiological processing in an IRZ.
Hydrolysis and fermentation of carbohydrate ultimately result in the production of acetate and hydrogen, which serve as the most desirable sources of energy for bacteria using sulfate and carbon dioxide (CO2) as electron acceptors. Methanogens use CO2 as an electron acceptor and are the most noted metabolic group of obligately anaerobic bacteria responsible for reductive dechlorination, which is the transformation of volatile organic compounds (VOCs) into less chlorinated intermediates and finally to ethene, CO2, and water.
The microorganisms using sulfate as a terminal electron acceptor are called sulfate-reducing bacteria (SRB). SRBs are widespread in aquatic and terrestrial environments such as waterlogged soils that become anaerobic due to active microbial respiration processes (Brock and Madigan, 1988). SRBs produce aqueous sulfide as a byproduct of their metabolism. The precipitation of certain metals/radionuclides (mercury,
= =5
Electron Donors
Mixed Complex Organic Materials like Molasses
Organic Monomers
Fermentation
Alcohols & Organic Acids
Acetate and Hydrogen Formation
Acetate Hydrogen
Oxidation Oxidation
Electron Acceptors End Products
Sulfate
Iron (III)
Carbon Dioxide
Sulfide
Iron (II)
Methane
Sulfate Reducing Bacteria
Iron Reducing Bacteria
Methanogens
Hydrolysis
cáÖìêÉ=NK=ríáäáò~íáçå=çÑ=`~êÄçÜóÇê~íÉë=áå=fow=
= =6
cadmium, lead, zinc, arsenic, uranium) as insoluble complexes within the contaminated aquifer is a consequence of the production of aqueous sulfide. Other dissolved metal species, like chromium, precipitate chemically in the reduced anoxic environment created by bacterial consumption of dissolved oxygen. Regardless of whether metal/radionuclide precipitation occurs as a result of the creation of an anaerobic aquifer or as a result of a chemical reaction with biologically produced sulfide, the solubility of the resulting metal/radionuclide must be evaluated over varying pH and ORP conditions. This solubility investigation is imperative to insure that the metal/radionuclide will not re-dissolve if the aquifer’s pH or ORP condition is altered in the future following the remedial action.
The compounds for which this technology has been successfully applied for full scale in-situ treatment include organics such as trichloroethene (TCE), dichloroethene (DCE), vinyl chloride (VC), carbon tetrachloride (CT), chloroform (CF), chlorinated propanes, pentachlorophenol (PCP), and pesticides; and metals and radionuclides such as hexavalent chromium (Cr+6), copper (Cu), nickel (Ni), lead (Pb), cadmium (Cd), zinc (Zn), mercury (Hg), selenium (Se), and uranium (U).
The mechanism of this process for metals precipitation is well understood. Following creation of the necessary reducing conditions in the groundwater, two reactions generally occur that will reduce the mobility of the metals. First, any dissolved metals present in higher oxidation states (for example, Cr+6) will be reduced (in the case of chromium, to trivalent chromium [Cr+3]). Second, the dissolved metals (in the more reduced forms) will react with reduced anions present in groundwater such as oxides, carbonates, and sulfides. Mechanisms for precipitation of individual metals have been described in detail elsewhere (Lloyd and Macaskie, 2000; Liles et al., 2001; Suthersan, 2002a; and ARCADIS, 2002).
An important feature of the EARP technology is its irreversibility for most metals. Over the natural pH range encountered in the groundwater system at the most contaminated sites; these heavy metal precipitates have extremely low thermodynamic and kinetic solubilities. This results in a very low probability that the precipitates, once formed, and allowed to age under reduced conditions, will re-dissolve into the groundwater under natural conditions. Only under extreme changes to the pH or redox conditions in the groundwater would the precipitate be expected to resolubilize to any significant extent. These conditions would generally include either very low or very high pH (less than 4 or higher than 10), or a strongly oxidizing environment (such as that caused by the continuous injection of oxidizing chemicals such as hydrogen peroxide or ozone). These conditions would not be present under any natural scenario. Once the desired aquifer microbiology has been attained, carefully timed subsequent additions of the electron donor amendment are utilized to support the altered aquifer microbiology until remediation of the contaminants present is complete. The IRZ performance following carbohydrate enhancement is measured by monitoring for the target contaminants and relative concentrations of degradation products, as well as other indicator parameters in groundwater such as DO, ORP, and changes in concentrations of electron acceptors within the treatment area.
In the particular case of uranium, the issue of resolubilization is less straightforward. The longevity of uranium precipitates is discussed at length in Section 1.2.
If the target metal/radionuclide at a given site naturally and/or purposely precipitates as a sulfide mineral, it is important to monitor the formation and stability of sulfide in the reactive zone over time. The potential for sulfide formation relies on four factors within the reactive zone. These four factors are important IRZ operation parameters and are summarized below:
= =7
a) SRBs are anaerobic and typically operate under negative redox conditions (-150 to –200 mV).
b) SRBs require available sulfate, or in some cases can use elemental sulfur. Sulfate is provided as a normal component of the molasses that is added to form the IRZ, and can also be injected as an iron sulfate or other sulfate solution.
c) SRBs require an acceptable electron donor to perform the metabolic reaction from which they derive their energy. Acceptable electron donors for SRBs include fatty acids, organic acids, alcohols, and hydrogen (Brock and Madigan, 1988). Suitable SRB substrates are a product of bacterial fermentation of the molasses that is injected into the treatment zone (see Figure 1).
d) The concentration of other naturally occurring dissolved metal ions that may compete with the contaminant(s) for sulfide is an important factor that affects the total mass of sulfide required to attain regulatory requirements for contaminant concentration(s). The most important naturally occurring metallic elements in this category are iron and manganese. Both dissolved and solid phase iron (II and III) and manganese (III and IV) have the potential to compete with metallic contaminants for sulfide. Thus, the engineered IRZ must provide sufficient sulfide to meet the total system’s demands for iron sulfide and to account for the potential reaction of aqueous sulfide with aquifer solids containing oxidized iron and manganese, in addition to the requirements for sulfide to precipitate the other metal contaminants. However, the presence of iron can also be a benefit to EARP since iron sulfides are significant sinks for many metal and metalloid contaminants, leading to coprecipitation of these metals and their incorporation into iron sulfides, principally pyrite. This process is similar to those often used in ex-situ water treatment.
NKN rê~åáìã=mêÉÅáéáí~íáçå=
Uranium is a naturally occurring radionuclide that is naturally available as 238U, the most abundant isotope, plus 235U. Minor quantities of 234U are present as a decay product of 238U.
Under ordinary aerobic conditions, uranium exists in the +6 oxidation state. In the absence of carbon, the uranyl (UO2
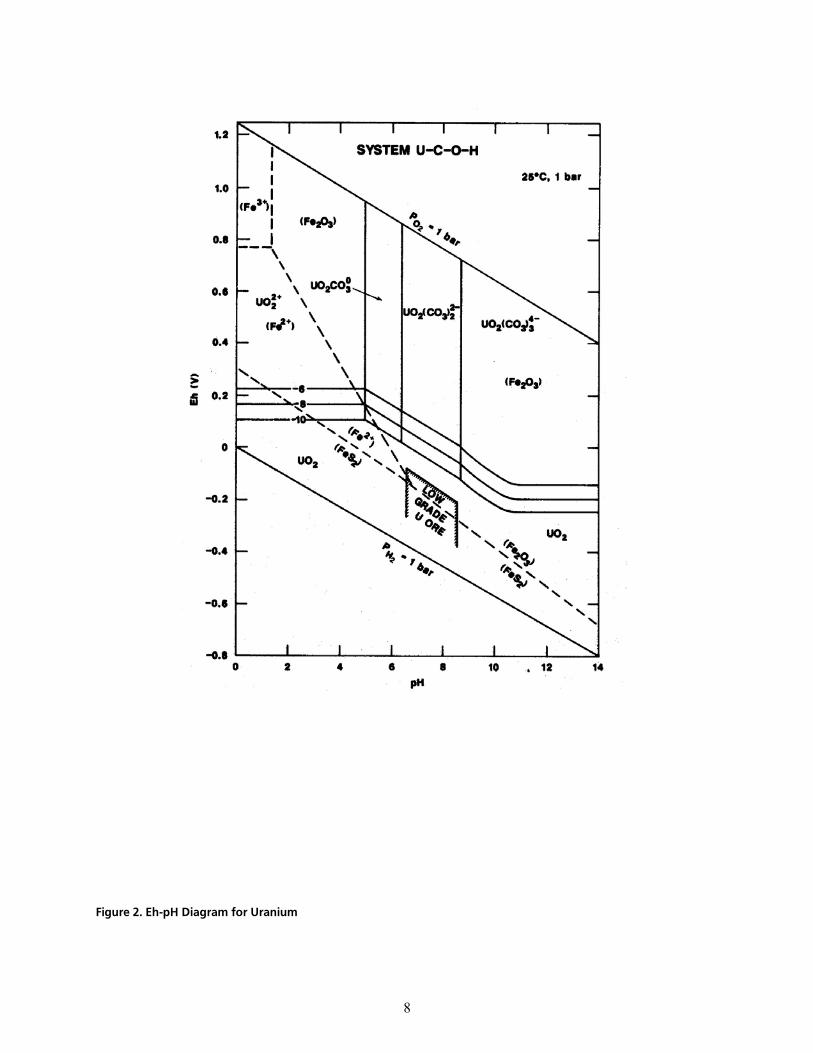
+2) ion is found in acid to slightly basic conditions. Under strongly basic conditions, the mixed oxidation state complex U3O8 exists. In the presence of carbon, the uranyl ion exists only under clearly acidic conditions. Above a pH of about 5, carbonates prevail. The solid uranyl carbonate exists over a fairly narrow pH range of 5 to 6 with uranyl carbonate anions existing from near neutral to strongly basic conditions. Throughout this range, uranium remains in the +6 oxidation state. An Eh-pH diagram for uranium is provided as Figure 2.
As EARP begins to decrease the redox potential, the mixed oxide, U3O8, is established over a fairly narrow Eh-pH range. As the process continues and the system becomes reductive, uranium is reduced to the +4 oxidation state and the solid oxide, UO2 (uraninite), is the stable species. In the presence of naturally occurring iron and reduced sulfur, coprecipitation will occur with pyrite (FeS2). UO2 is the naturally occurring mineral uraninite. This is the pure uranium mineral found in pitchblende. In this form, it has remained in a solid phase over geological timescales (because of its low solubility), and for this reason it can be expected to remain stable in most subsurface conditions. As discussed above, in the +4 oxidation state, uranium normally precipitates as UO2. Some evidence for the sorption of UO2 at sulfide mineral surfaces exists (Wersin et al., 1992, Wersin et all 1994).
= =8
cáÖìêÉ=OK=bÜJée=aá~Öê~ã=Ñçê=rê~åáìã=
= =9
When silicon (Si) is a significant species, either with or without carbon, the Eh-pH diagram is significantly changed. However, there is an immobile mineral form, coffinite (USiO4), which has a large stability field under reducing, acidic to neutral conditions, suggesting that the EARP process can be effective in treating uranium in the presence of Si as well.
Uranium precipitation and its efficacy as a remedial alternative has been the subject of several recent laboratory research programs. Work by Chang et al. (2001) and A. Abdelouas et al. (2000) shows two mechanisms (chemical and biological) for the reduction of soluble uranium and its precipitation as the mineral uraninite. In the first, an indirect chemical mechanism accounts for uranium removal from solution. In this process, as the IRZ technology begins to decrease the system redox conditions, the mixed oxide U3O8 is established over a fairly narrow Eh-pH range. As the process continues and the system becomes more reduced, uranium is reduced to the +4 oxidation state and the solid oxide UO2 is formed. The second mechanism is directly mediated by microorganisms, as described by Lovley et al. (1992), Abdelouas et al. (1998, 1999, 2000), and Chang et al. (2001). These authors describe the biological reduction of U+6 to U+4 by SRB and other related bacteria and the subsequent precipitation of U+4 as uraninite. In addition, the work of Abdelouas et al. and Suzuki et al. (2003) contributes a better understanding of the distribution of uranium reducing bacteria, which is favorable for the applicability of this technology since they find that these bacteria are widespread or even ubiquitous. Senko et al. (2002) predicts on thermodynamic grounds that uranium reduction will occur under conditions more reducing than are required to reduce nitrate, but less reducing than are required for sulfate reduction. Ganesh (1997) summarizes the effects of various organic and inorganic ligands on the rate of the biological reduction process. Although one case was found where a particular pure culture was unable to reduce a particular uranium organic ligand complex, in general this process proceeded over useable time lines (tens of hours) for almost all cultures and organic complexes studied.
More fundamental work has also been done to examine the details of the biological reduction of uranium by particular organisms. For example, Payne (2002) examined the role of various proteins in the biological reduction of uranium by Desulfovibrio desulfuricans with hydrogen, lactate or pyruvate as electron donors. Holmes (2002) discusses the relative role of iron reducing and sulfate reducing organisms in the direct reduction of uranium. They also report reduction of uranium with acetate as the electron donor. They emphasize the role of Geobacteracae in the reduction of uranium. Suzuki et al. (2003) show that when an electron donor is added to uranium-containing wastes that SRB and Clostridia are both stimulated and contribute to uranium reduction.
NKO mêÉÅáéáí~íÉ=içåÖÉîáíó=Ó=bñéÉêáÉåÅÉ=~åÇ=iáíÉê~íìêÉ=oÉîáÉï=
NKOKN ^o`^afpÛ=~åÇ=líÜÉêëÛ=bñéÉêáÉåÅÉ=
ARCADIS conducted a laboratory evaluation in 1997 of uranium precipitation in the presence of sulfate reduction for the Department of Energy-Office of Environmental Management. This laboratory study concluded that uranium was precipitated as UO2. More recent laboratory studies by other researchers have concluded that uranium precipitates in the presence of sulfide as uranium sulfide or is utilized as a terminal electron acceptor and thus reduced from the soluble U+6 to the insoluble U+4 (Chang et al., 2001). In the +4 oxidation state, uranium precipitates as UO2. Some evidence for the partial reduction and sorption of UO2
+2 to sulfide mineral surfaces exists (Wersin, 1992, 1994).
= =10
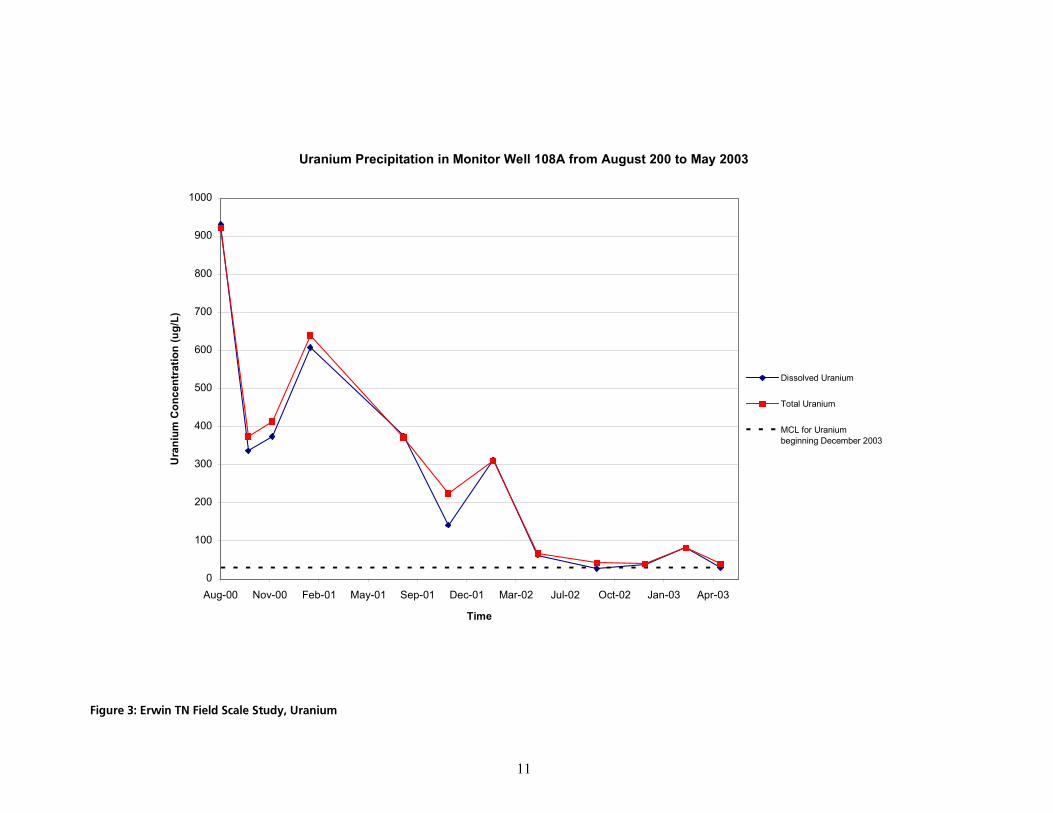
Currently, ARCADIS possesses medium-term field experience with the application of its IRZ technology for the precipitation of dissolved uranium. Two field scale projects have been undertaken. The first, the Sweetwater project, was performed at the Kennecott Sweetwater Uranium Mine near Rawlins, WY. In this project, uranium was reduced in a pit lake containing 1.3 billion gallons. Selenium was also removed from solution by microbial reduction. Approximately 1.2 million pounds of organic carbon was added to the lake to create reduced conditions within the water column in October 1999. Results from the first two years of this project are summarized in Harrington (2002) and the website: http://www.wma-minelife.com/recaward/recframe.htm. The second ARCADIS uranium precipitation field-scale project is being performed on a commercial basis for a government contractor facility in Erwin, Tennessee known as the NFS site (see http://www.epa.gov/epaoswer/hazwaste/ ca/success/r4s_nucl.pdf for more information). The results of this study demonstrating uranium precipitation are shown in Figure 3. A successful field pilot study was conducted and ARCADIS is currently implementing a full-scale treatment system. The implementation of the IRZ remedy at the NFS site is cooperatively overseen by USEPA, Region 4 and the Tennessee Department of Environment & Conservation (TDEC). USEPA Region 4 and TDEC contacts are available upon request). The NFS field pilot project was conducted from August 2000 through January 2001. Full-scale operation was initiated in August 2002 with 17 injection wells. Eight months into the full-scale project, monitoring wells 6 to 9 m (20 to 30 ft) from injection wells exhibited reductions in total and dissolved uranium of approximately 80 to 85%, with some areas having attained the MCL for uranium. Successful bench-scale results from a biological reduction process with some similarities to EARP have been published for uranium precipitation from various Western U.S. groundwaters (Abdelouas et al., 1998; Abdelouas et al., 2000). These authors were able to reduce uranium concentrations to below treatment standards. The process used in these studies was similar to EARP in that it relied on a naturally occurring mixed culture. It differed in that the substrate was pure ethanol rather than the complex food grade substrates ARCADIS prefers to employ. Furthermore, a trimetaphosphate addition was used as a nutrient, which ARCADIS does not normally find to be necessary. Finally, the ethanol dose was kept low, based on stoichiometry of the uranium. ARCADIS finds that the best results are achieved when greater-than-stoichiometric doses are employed to allow for the numerous inevitable side reactions and formation of biomass. Abdelouas’ results confirm that the precipitated product, at least in their system, is uraninite, albeit in their system, a calcium-containing solid solution of uraninite. Starting concentrations of uranium as high as 235 mg/l and as low as 0.250 mg/l were successfully treated.
NKOKO jÉÅÜ~åáëãë=çÑ=mêÉÅáéáí~íÉ=içåÖÉîáíó=
In order for this in-situ technology to be successful in the long term, the precipitated uranium must not be re-dissolved at an unacceptable rate once groundwater geochemical conditions return to their pretreatment state (which is often aerobic and near-neutral pH). The potential for uranium remobilization will be controlled not only by the kinetics of the uranium oxidation reaction but by many more factors including preferential oxidation of other reduced compounds, preferential consumption of oxidants by sulfide minerals, sorption of uranium to fresh amorphous iron oxides and sorption of uranium to iron sulfide minerals.
NKOKOKN páòÉI=pÉèìÉåÅÉ=~åÇ=jáåÉê~äçÖó=çÑ=oÉ~ÅíáîÉ=wçåÉ=cçêã~íáçå=
If DOE, and the U.S. and Ohio EPAs, agree to proceed to a full-scale demonstration at Fernald, ARCADIS envisions creating a large reduced zone (possibly 1000’ along the groundwater flow direction, several thousand feet perpendicular to the direction of flow and 50’ or thicker). When the EARP technology is
= =11
Uranium Precipitation in Monitor Well 108A from August 200 to May 2003
0
100
200
300
400
500
600
700
800
900
1000
Aug-00 Nov-00 Feb-01 May-01 Sep-01 Dec-01 Mar-02 Jul-02 Oct-02 Jan-03 Apr-03
Time
Ura
nium
Con
cent
ratio
n (u
g/L)
Dissolved Uranium
Total Uranium
MCL for Uraniumbeginning December 2003
cáÖìêÉ=PW=bêïáå=qk=cáÉäÇ=pÅ~äÉ=píìÇóI=rê~åáìã
= =12
implemented, uranium is reduced around the same time the structural iron (ferric iron in the aquifer solids) is reduced. In other words, initially as the conditions become slightly reducing, uranium precipitates due to reduction, and iron is initially made soluble (as dissolved ferrous iron) (Lovley, 1992 and Senko et al., 2002). As the system becomes more reducing and sulfide is formed from the oxidation of the molasses and the reduction of sulfate, the iron sulfide precipitates. This leads to a residual coating of FeS minerals, elemental sulfur (as the sulfide reacts with the structural iron that even the bacteria don't reduce or other oxidized components, elemental S can be formed) and likely some stored organic carbon in the form of biomass. When EARP is used for precipitation of certain metals, supplemental iron sulfate (Saunders 1998) is sometimes added during treatment if the soluble iron observed during treatment is relatively low, as it was in this system. Therefore, for the final month of active precipitation in this bench test, 50 mg/l Fe as FeSO4 plus molasses in site groundwater was fed into the treated column (note that the use of ferrous iron in groundwater remediation systems is relatively common – i.e., many Fenton’s reagent applications).
Thus the fully reduced zone is expected to contain a variety of reduced compounds after treatment, including:
Iron sulfides (ranging from amorphous FeS to pyrite)
Elemental sulfur
Residual reduced organic carbon either incorporated in cellular biomass or contained in microbial storage products such as exopolysaccharides
Reduced uranium compounds (UO2 and potentially US2)
Potentially a variety of other reduced sulfur, manganese, iron, and trace mineral compounds
In this zone, the reoxidation of uranium will be controlled by the interface of oxygen with uranium, and the available oxygen will be controlled by its reactions with all of the stored, reduced compounds that have been emplaced in the aquifer by the treatment process. See for example a discussion of the role of both mackinawite and biomass in redox buffering in Abdelouas et al., 1999.
NKOKOKO oÉä~íáîÉ=oÉçñáÇ~íáçå=o~íÉë=çÑ=íÜÉ=s~êáçìë=péÉÅáÉë=mêÉëÉåí=áå=íÜÉ=oÉ~ÅíáîÉ=wçåÉ=
The literature shows that, irrespective of which mechanism is responsible for uraninite precipitation, in the presence of available iron and sulfur (usually in the form of sulfate), iron sulfide minerals such as pyrite (FeS2) and mackinawite (FeS0.9) are likely to be precipitated at the same time and in close proximity to the uraninite. These iron sulfide minerals protect the uraninite from re-oxidation (Abdelouas et al., 1999).
In relative terms, expressed in molar ratios of uranium to all of the other reduced compounds stored in the aquifer, the potential oxidation of uranium will be very low compared to the potential oxidation of iron, sulfur and other reduced species. If the aquifer materials were exposed to oxygen, FeS would be expected to oxidize as rapidly, if not more rapidly, than would UO2 and consume the oxygen prior to reaction with the uranium. Because UO2 would be precipitated first, the FeS precipitate would be laid down over the top of the UO2 as a FeS coating, exposing FeS to the oxygen in the groundwater before the uranium-containing precipitates. (This is true either in a source area treatment configuration or in a plume wide treatment
= =13
configuration. However, in a barrier configuration [such as at a property boundary], there would be a more complex layering of iron sulfides and uranium precipitates). The relative amount of iron sulfide that needs to be deposited for this purpose after the uranium has been precipitated can be designed for the full-scale system on the basis of the calculated oxygen flux potential over the period of time that uranium stability must be insured and the target maximum flux of uranium to groundwater.
Use of molasses as the carbon source (electron donor) would be expected to increase the amount of iron sulfide precipitated. The literature reveals that commercially important uraninite deposits are often found to contain significant quantities of sulfide as well. Gross describes ore samples that “had a yellow oxidized coating ¼ to ½ inch thick rimming a black interior of unoxidized pitchblende and sulfides.” Abdelouas et al. (1999) reviews several studies of natural uranium ore deposits and states that pyrite oxidation is the protective reaction at the Pocos de Caldas mine in Brazil. The protection is provided by siderite (FeCO3) and ferrihydrite (Fe(OH)3) at the uranium deposit at Oklo (Gabon). Levanthal and Santos (1981) show a very strong correlation of uranium and sulfide content in the roll front deposits at the Highland Uranium Mine. (Uranium roll front deposits are natural analogues for the uranium and sulfide systems we propose for treatment of the Fernald plume.) Levanthal and Santos indicate that sulfide in the aquifer matrix is the key component that preserves insoluble uranium oxides in their insoluble form. Guilbert and Park (1986) call these deposits “kinetically stable,” where the reduced sulfur acts to control uranium solubility. In uranium ore geology terms, we are proposing to create a “regionally reduced” host aquifer at Fernald. Moyes et al. (2000) show that uranium will sorb onto the surfaces of iron sulfide minerals (mackinawite) and become reduced with the concomitant oxidation of the iron on the sulfide mineral edges. The reductive reaction immobilizes the uranium, with greater than 99% reduction and removal of uranium from solution. Moyes et al. state “in effect, uranium is quantitatively removed from solution at all concentrations” that they tested, up to 5 mM uranium, by reaction with iron sulfides.
Abdelouas et al. (1999) verifies that this protective mechanism minimizes the flux of uranium from the re-dissolution of biologically precipitated uranium in column experiments using groundwater and bedrock from a Tuba City, Arizona site. Their column experiments differ from those conducted by ARCADIS using Fernald materials in several ways:
They use ethanol as the carbon source with trimetaphosphate as a supplemental nutrient.
They appear to be operating the columns in a static mode during the precipitation portion of the test and then in a flow-through mode with oxidized groundwater subsequently. Thus, they observe a flushing out of biomass and attached uranium in the initial pore volume following the introduction of the oxygenated water.
However, their experiments verify that small masses of uraninite (corresponding to groundwater concentrations of uranium “on the order of a few milligrams per liter or less”) are protected from reoxidation and thus dissolution at a level greater than groundwater protection standards for a simulated time of several hundred years. Note that at many DOE sites, for example Fernald, the concentration of uranium in groundwater requiring remediation is even less than this - a fraction of a milligram per liter.
The results of Senko et al. (2002) suggest that the reduced uranium can be reoxidized and remobilized, especially in the presence of nitrate. However, the conditions studied by Senko were already highly reducing
= =14
before the addition of mobile uranium and electron donor. This would make the coprecipitation of iron with the uranium less likely if additional iron, sulfate, and electron donor are not provided.
Thus, we believe that in most instances, though the slow re-dissolution of uraninite will occur, the presence of iron sulfide minerals that are precipitated in close proximity to uraninite will act as a chemical barrier to prevent reoxidation of the uraninite. Indeed, Brock and Madigan (1988) provide a table of sulfide minerals listed in order of increasing resistance to oxidation which displays FeS as the most oxidizable sulfide mineral listed. FeS is likely to be produced during the implementation of the IRZ technology at sites where iron is naturally available. The implementation of the IRZ technology is likely to both increase concentrations of soluble ferrous iron due to the negative redox, slightly acidic conditions that it induces and to provide free sulfide for reaction with the ferrous iron in solution through the action of stimulated populations of SRB. The precipitation of FeS along with uraninite is likely to occur within the stoichiometric constraints of ferrous iron and sulfide availability. Once the FeS is precipitated in close proximity to precipitated uraninite, experimental bench scale and observational field evidence suggests it will shelter uraninite from re-oxidation (Abdelouas 2000). The length of time that precipitated FeS will shelter uraninite is stoichiometrically dependent on the amount of dissolved oxygen that groundwater flow exposes the FeS to over time, making the longevity of uranium precipitated as uraninite a site-specific phenomenon that should be investigated further for each site. Note, however, that the existence of natural commercial uraninite deposits suggest that uraninite is reasonably stable over geologic time scales of millions of years (Abdelouas 2000 and papers sited therein). Abdelouas has also conducted an acceleration test discussed above and shown “that mackinawite can protect uraninite for hundreds of years” (Abdelouas 1999). In other words, as long as mackinawite and other sulfide minerals are present they will kinetically preferentially consume oxygen and nitrate and prevent significant uranium resolubilization1.
Thus a relevant reaction process is the ability of sulfide-containing aquifers to prevent nitrate from being mobile in groundwater, a process that has been studied in some detail. Pauwels et al. (1998) show that denitrification can occur relatively rapidly - in a sulfide-containing aquifer - with half-lives of nitrate in that environment of 50 to 200 hours. Hartog et al. (2001) show that pyrite oxidation is equally important as bulk organic matter as a reductant for nitrate. They documented the formation of ferric hydroxides, which can form as a coating over the pyrite minerals and slow their oxidation. Morse (1992) showed that the formation of the ferric oxide coating over the pyrite minerals can reduce the reactivity of the sulfide, leaving a stable iron oxide-coated pyrite that resists further oxidation.
The significance of these studies for our purpose is that:
1) Pyrite and other iron sulfides can act as an electron donor in the reduction of nitrate and oxygen, consuming these potential oxidants and preventing uranium exposure.
1 Since carbonate levels can have an influence on this geochemistry it is useful to compare the alkalinity of the Abdelouas’ (1999) water samples to that at Fernald. The contaminated water they used had an alkalinity of 572 mg/l, while the uncontaminated water they used to test resolubilization had an alkalinity of 88 mg/l. We have measured alkalinities in the range of 150-250 mg/l in the contaminated groundwater column influent obtained from well 62433 and an alkalinity of 176 mg/l for the uncontaminated water from well 2096. These observations are broadly consistent with bicarbonate and carbonate concentrations previously measured in Fernald groundwater.
= =15
2) In buffered groundwater the product of this oxidation is the formation of fresh amorphous ferric oxides, which will scavenge uranium.
3) The rapidity of the reaction indicates that the redox front will stay relatively sharp (a distance of a few feet parallel to the flow direction is expected in the Fernald environment), limiting the potential migration of uranium further into the reduced zone.
4) The sulfide in these studies was very old, with age correlating to sulfide’s crystal size and general resistance to oxidative attack. In the remediation of Fernald groundwater, the pyrite produced by IRZ will, by reason of its young age, be more reactive with oxygen and nitrate.
5) Because the formation of pyrite will occur subsequent to the precipitation of uranium under remediation conditions at Fernald, the results of Morse (1992) and Hartog et al. (2001) would indicate that a substantial fraction of the uranium would not be exposed to oxidation for many years, even in portions of the aquifer where the solution redox potential has become highly oxidizing.
6) Hartog and Morse indicate that an oxidized Fe oxide/hydroxide layer forms over the top of the FeS, making the residual oxidation of the FeS much slower. By extension, we would expect the uranium, which is even deeper in the mineral matrix, to be even less exposed.
In a field test of another reductive metals precipitation technology, the injection of dithionite at Hanford (summarized in Fruchter et al. 2000) only reduced structural iron in the aquifer matrix and did not lead to the formation of iron sulfide compounds. Anoxic groundwater has been maintained for 3.5 years (DO has remained at 0.00 mg/L). Calculations and field measurements, based on flux of saturated DO through the treated zone, indicate a consumption rate of reduced iron compounds of approximately 4 to 6 feet per year. The approach we propose, in contrast, will deposit more than an order of magnitude greater amount of iron sulfide and other reduced compounds uniformly throughout the treatment zone. Thus a consumption rate of iron sulfide and other reduced compounds on the upgradient side of the reactive zone could by extension be expected to be in the range of less than 1 foot per year in the proposed treatment zone at Fernald.
It is also possible to envision oxidative water infiltration downward onto the upper part of the reactive zone causing a similar gradual reoxidation of the reduced zone. However given the existence of a silty clay layer above the targeted treatment zone we anticipate that this process would be slower than the reoxidation on the upgradient side of the reactive zone. Thus, since the Great Miami Aquifer is relatively thick, and any full scale system would likely be to require a thick reactive zone, we believe that the reoxidation processes on the upgradient edge of the reduced zone would be more important than those on the upper surface of the reactive zone.
To summarize, there are four reasons, discussed here, why FeS species will be reoxidized before the uranium species:
a) Physical position (iron sulfides tend to coat over the uranium species during precipitation)
b) Relative mass/number of moles (an excess of reduced iron species over reduced uranium species)
= =16
c) Kinetics (i.e., that reaction with the iron sulfides is faster than with the uranium even given a hypothetically equivalent number of moles) and
d) Thermodynamics/electrochemical series (that the sulfide in the FeS species begins re-oxidizing at a lower (more reduced) potential than the uranium does).
NKOKOKP mêçÅÉëëÉë=íÜ~í=`çåíêçä=íÜÉ=jçÄáäáíó=çÑ=oÉçñáÇáòÉÇ=rê~åáìã=
Finally, it is important to realize that for the EARP technology to meet regulatory standards, it need not prevent any resolubilization for all time. Rather, it should limit resolubilization to a slow enough rate (flux) that the groundwater concentrations downgradient will remain below regulatory standards.
Simply because uranium will eventually be slowly reoxidized does not imply that it will be mobile over distances relevant to the protection of environmental receptors. As discussed in the work plan (ARCADIS, 2002), the iron that first oxidizes (on the upgradient fringe of the reducing zone) will form amorphous, ferric oxide surfaces that will be important for controlling the concentration of dissolved uranium. At the Stråssa mine, uranium concentrations are controlled by biogenic ferric oxides. In this system, uranium strongly partitions with the iron oxide solid phase, leading to dissolved uranium concentrations between 10 and 15 µg/L (7-11 pCi/L), with uranium content in the solid phase in the 20 to 80 mg/kg range (Ferris et al., 2000). As Martin and Kempton (2000) point out, the ferric oxides thus formed in-situ will preferentially be placed in the high conductivity zones in the aquifer. In their column experiments, the ferric oxides delayed breakthrough of metals with similar sorption behavior as uranium between 8 and 30 times. The oxidation of iron sulfides by oxygen in the aquifer will lead to secondary ferric iron phases that will sorb uranium, maintaining the low uranium concentrations in-situ as this reaction front moves. Since the hypothetical Fernald reduced zone will extend for perhaps 1000’ parallel to the flow direction, and contains a large mass of reduced compounds (reductive poise) for a long period of years, even centuries after active treatment ceases, the upgradient edge of the reduced zone will be gradually reoxidizing while the center and downgradient portion of the reduced zone will remain reduced.
Lack et al. (2002) have shown that fresh amorphous Fe(III) oxide is a very strong sorbent for a variety of metals including uranium. This amorphous Fe (III) oxide is “a precursor of many natural forms of crystalline Fe (III) oxides” that adsorbs or incorporates into its structure many trace metals. They write that “selective anaerobic bio-oxidation of Fe (II)…may be an effective means of capping off and completing the attenuation of heavy metals and radionuclides (HMR) in a reducing environment, allowing the system to naturally revert to an oxic state while preventing remobilization of previously reduced and isolated HMR...by precipitating Fe (III)(hydr) oxides over immobilized HMR in-situ, forming an insoluble barrier that crystallizes with time...adsorbing any leached HMR locally.”
Any uranium that mobilizes past the ferric iron front located on the upgradient side of the reactive zone will be controlled by several additional factors. The remaining reduced zone of the downgradient side of the oxidation front will contain a large amount of reactive sulfides, materials that also prevent uranium mobility by providing sorption surfaces (Abdelouas et al., 1998 and 2000; Shepherd Miller, 2000; Moyes et al., 2000).
= =17
NKOKOKQ mêçÅÉëëÉë=íÜ~í=^ÑÑÉÅí=rê~åáìã=oÉëçäìÄáäáò~íáçå=~åÇ=lñáÇ~íáçå=Ó=`çåÅäìëáçå=
Thus it is not necessary to prevent all oxidation of uranium to prevent its mobilization because of the potential for both iron oxide and hydroxide (in aerobic environments) and iron sulfide and organic matter (in reduced environments) to remove uranium from solution. The concentration of uranium measured at some downgradient point will be a factor of the overall rate of uranium dissolution, adsorption, and re-precipitation through the treatment zone. Post-precipitation concentrations of uranium in the presence of iron oxide, hydroxide, and iron sulfides have been shown in the works cited to be substantially lower than the regulatory standard of 30 µg/L. By ensuring that sufficient iron and sulfide are placed in the system during remediation, reoxidation of uranium can be prevented for centuries. When it does occur, it will occur in very localized portions of the reactive zone and the uranium will largely be readsorbed. Thus mobilization will occur at a slow enough rate (flux) that the groundwater concentrations downgradient will remain below regulatory standards.
NKOKP oÉÖìä~íçêó=^ÅÅÉéí~åÅÉ=çÑ=b^om=
EARP has been accepted by regulators in numerous states and EPA regions under the CERCLA and RCRA programs for other metals, most commonly chromium. The authors and their coworkers have applied the technology in 13 states and two foreign countries. Applications have included at least 13 sites for chromium removal and eight separate sites for other metals (cadmium, lead, mercury, nickel, zinc, uranium). As discussed previously, EPA has published the first EARP field application for uranium as a RCRA success story. We believe there are several reasons why this technology as applied to uranium is environmentally beneficial and sustainable:
a) The concentrations of uranium in soil after this precipitation process will in many cases not add markedly to the naturally occurring concentration. Note that the naturally occurring concentration of uranium in the earths crust averages 2.7 mg/kg (CRC) and in granites is up to 15 ppm (Merian, 1991).
b) Analogous processes have been frequently accepted for non-radionuclide metals, since essentially they are returning the metals to their natural state - as ores.
c) There are likely to be no cost-effective and technically practical remedial alternatives.
NKP lÄàÉÅíáîÉë=
The primary objective of the bench-scale testing portion of this project is to confirm the efficacy of ARCADIS’ IRZ/EARP technology for precipitating uranium in a stable form from contaminated groundwater from the South Field Plume at Fernald. This testing would also provide evidence of the applicability of EARP to problems at numerous DOE sites.
In addition, there are two secondary objectives associated with the bench-scale portion of this project. Foremost, is our intention that the bench-scale testing provides information that can be used to confirm engineering criteria for optimal IRZ scale-up at this site. Information from the bench-scale testing, such as the molasses dosing concentrations required to achieve anaerobic conditions and the retention time within the test column that is required for optimal precipitation of target contaminants, will permit optimization of IRZ scale-up if the project is transitioned to the field pilot stage.
= =18
Lastly, the soil was subjected to chemical speciation before and after the laboratory scale EARP treatment. Chemical speciation refers to identification of the molecular form or chemical composition of a constituent of interest as it may exist under a specified set of environmental conditions. Speciation refers primarily to a solid phase analysis method used to identify the host mineral or amorphous compound that contains a target element, but it can also refer to determination of the redox state and coordination chemistry of a metal in solution.
Currently, the literature is somewhat contradictory with regard to the form in which uranium precipitates. Lovley et al. (1992) provides evidence that uranium serves as an alternate electron acceptor and is thus reduced from U+6 to U+4 and precipitated as UO2 (uraninite or pitchblende). In addition, ARCADIS and Chang et al. (2001) believe that the formation of uranium sulfide minerals during IRZ application is also feasible. It should be noted that most studies of uranium mineral formation were performed in pure culture with defined media, where field reduction of uranium with many potential microenvironments may allow several uranium forms to precipitate, particularly UO2 and US2.
The bench-scale study included speciation of precipitated uranium compounds at the end of the treatment period. It is a secondary goal of this project to determine whether dissolved uranium is precipitated as an oxide or sulfide, or whether both compounds are precipitated during bench-scale simulation of IRZ treatment. Once the predominant precipitated compound is known, its fate under natural aquifer pH and Eh conditions can be confirmed more conclusively. In addition, it is hoped that the size of individual particles of precipitated contaminants can be determined so as to permit an evaluation of the potential for colloidal transport subsequent to precipitation. A more thorough discussion of speciation analyses can be found in Appendix A.
NKPKN pìÅÅÉëë=`êáíÉêá~W=kçåJpáíÉ=péÉÅáÑáÅ=
Success, either of bench-scale or full-scale testing, is defined as the permanent immobilization of the radionuclide of interest such that the rate of any dissolution reactions under any reasonably foreseeable environmental condition, (i.e., pH 4-9 and ORP –400 to +400 mV) will be such that the maximum ground water concentration of a long-lived radionuclide or hazardous metal concentration at a sentinel well or receptor well will be <30% of the established or proposed regulatory limit for that constituent and <10% of the pretreatment value.
For long-lived radionuclides such as uranium, (which has a half-life of >245,000 years for all common isotopes [IEER]), an additional objective is to evaluate whether EARP, taking into account expected precipitation/reprecipitation rates, can be an effective supplement or alternative to conventional approaches (such as pump-and-treat) in reaching rapid, cost-effective closure. Success in this objective will require that this degree of treatment be achieved at a cost projected (on a life-cycle, net present value basis) at 50% or less of the cost of competing or conventional remedial approaches (i.e., pump-and-treat).
In order to achieve this ultimate success, the following alterations of the biogeochemical conditions in-situ will typically need to be induced and maintained during the active treatment phase of an EARP application.
pH - > 4.5 s.u. in the injection wells; > 5.0 s.u. in the monitoring wells
DO - < 1.0 mg/L in both monitoring and injection wells
= =19
ORP - > -400 mV and < -250 mV in the injection wells; < -200 mV in the monitoring wells. For demonstration sites where reducing environments are identified in the groundwater prior to initiation of reagent injections, a target goal of lowering the ORP by 200 mV in the injection wells and 100 mV in the monitoring wells will be employed
TOC - > 500 mg/L and < 5,000 mg/L in the injection wells and > 50 mg/L in the monitoring wells
Conductance – order of magnitude increase in the injection wells; 20 to 50 % increase in monitoring wells
In order to demonstrate success, sufficient time must be allowed after the cessation of carbon source injection to allow the carbon to be consumed, and the Eh, pH, DO, and conductivity to either revert to pretreatment values or to stabilize at a value that does not change even with further oxygen recharge. Only if the radionuclides or hazardous metals remain stable under those conditions can the technology be deemed to be completely successful.
NKPKO nì~åíáí~íáîÉ=páíÉ=péÉÅáÑáÅ=lÄàÉÅíáîÉë=
The quantitative dissolved phase treatment goal for uranium at the Fernald site is 30 µg/L. Ideally, this demonstration would show that a somewhat lower dissolved phase concentration could be achieved to provide some margin of safety. Achieving this treatment goal would require, for example, approximately 95% reduction in the groundwater uranium concentration as measured at well #62433 and 80% reduction at well #62408.
NKQ páíÉ=_~ÅâÖêçìåÇ=
NKQKN dÉçäçÖó=~åÇ=eóÇêçÖÉçäçÖó=
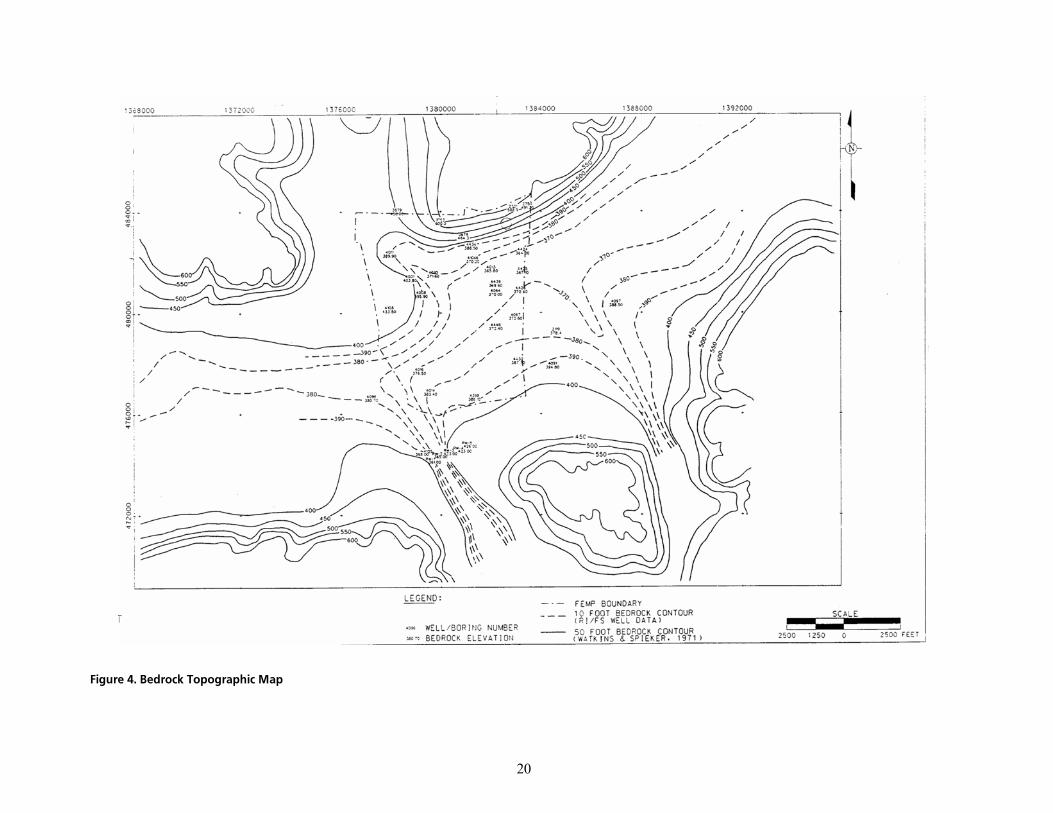
The Fernald Closure Project (FCP) is situated over the New Haven Trough, a large buried valley filled with glacial sand and gravel outwash deposits (braided stream depositional environment) with an axis running northeast-southwest. Figure 4 is a bedrock topographic map that defines the valley floor. The floor walls of the New Haven Trough consist of Ordovician age shale and limestone. During the Pleistocene, the New Haven trough was carved into the shale and limestone bedrock, filled with sand and gravel, and capped by a layer of Wisconsin age clay-rich glacial overburden. The sand and gravel forms the matrix of the regionally extensive Great Miami Aquifer.
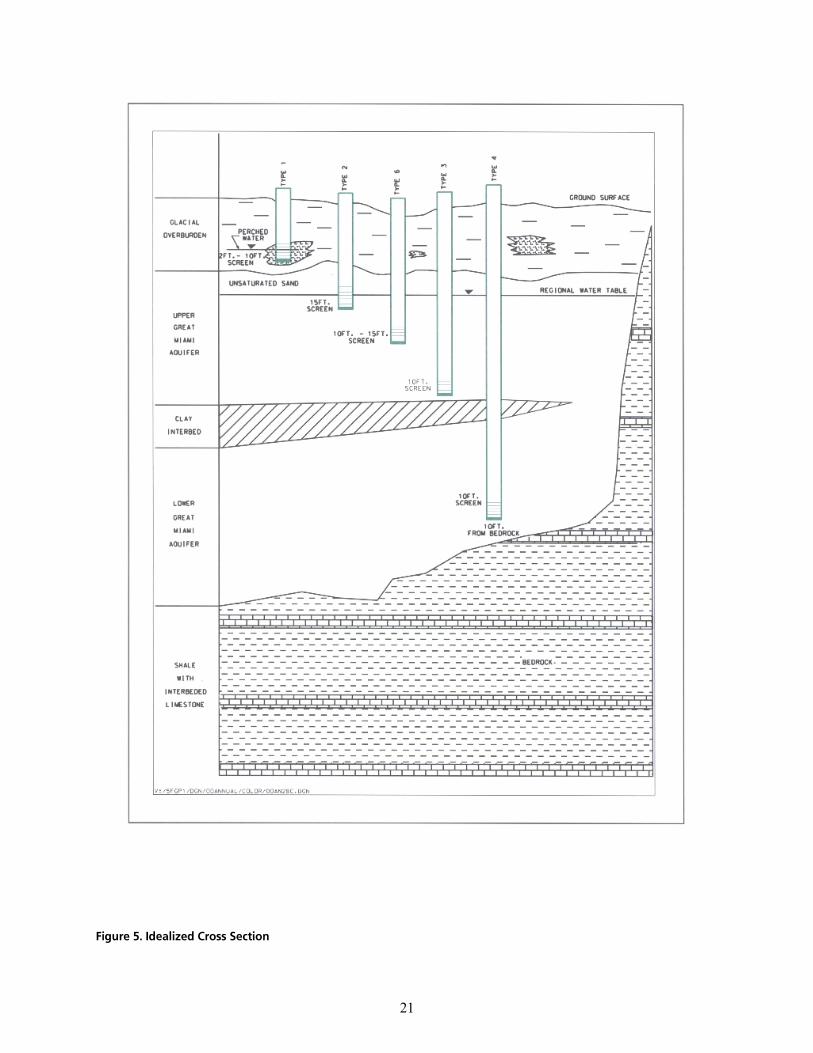
The Great Miami Aquifer is unconfined, anisotropic, and heterogeneous and has been federally designated a sole-source aquifer by the U.S. EPA. As recorded from core collected during the drilling of Monitoring Well 4398, the lithology consists of approximately 24 feet of silty clay and approximately 167 feet of sand and gravel. This general sequence is confirmed by the recent soil boring for Monitoring Well 33264 (Appendix B), from which soil samples were collected for the bench-scale study. The sand and gravel forms the aquifer matrix. The silty clay lies on top of the aquifer. Bedrock is approximately 191 feet below the ground surface. An idealized cross section is provided as Figure 5.
= =20
cáÖìêÉ=QK=_ÉÇêçÅâ=qçéçÖê~éÜáÅ=j~é=
= =21
cáÖìêÉ=RK=fÇÉ~äáòÉÇ=`êçëë=pÉÅíáçå
= =22
The part of the plume that is targeted for demonstration is called the South Field. Hydraulic conductivity in the South Field area is approximately 523 feet/day. The seepage velocity is approximately 1.1 feet/day, based on 30% porosity. The average hydraulic gradient is approximately 0.0008. According to information provided by Fluor-Fernald, the uranium concentration cleanup level is 30 µg/L at all points within the aquifer. Uranium concentrations in the South Field range up to approximately 800 µg/L. In the South Field area the upper portion of the Great Miami Aquifer is aerobic (redox approximately 300 to 500 mV and pH approximately 6.8, DO 5-10 mg/l), but just to the east conditions turn slightly anaerobic and tend to be more anaerobic at depth. A redox front may be present on the east (downgradient) edge of the site. Redox potentials in the aquifer just east of the plume have been measured in the 200 mV range. It appears that redox conditions in the aquifer become more reduced with depth and with distance from recharge points. The principal cation found in groundwater from the aquifer is calcium; the principal anion is bicarbonate. Figure 6 includes a piper diagram from a monitoring well in the South Field that is representative of the general water chemistry.
NKQKO mêÉîáçìë=fåîÉëíáÖ~íáçåë=
The nature and extent of groundwater contamination from operations at the FCP has been investigated, and the risk to human health and the environment has been evaluated in the Operable Unit 5 Remedial Investigation Report (DOE 1995d). As documented in that report, the primary groundwater COC at the FCP is uranium. Approximately 170 acres of the Great Miami Aquifer are contaminated above the 30 µg/L groundwater total uranium FRL. The primary sources of contamination at the FCP include: 1) the previously uncontrolled surface water runoff from the former production area that had direct access to the aquifer through the Pilot Plant Drainage Ditch, Storm Sewer Outfall Ditch, and Paddy’s Run; 2) the inactive fly ash pile in the South Field area; 3) the waste pits in the waste storage area; and 4) former production activities, deep soil and perched water contamination in the vicinity of Plant 6. The primary forms of mobile uranium at Fernald are uranyl carbonate complexes (IT 1996).
Based on sequential extraction studies performed on contaminated aquifer sediments (Bryan et al., 2003), uranium introduced into the aquifer from anthropogenic activities associated with the Fernald site is associated with ion-exchange sites, carbonate grains, organic matter and iron-oxyhdroxide phases. Approximately 66 percent of the introduced uranium is predicted to be in a mobile form and 34 percent is now fixed to carbonate grains, organic matter and iron-hydroxide phases. Mobile is defined as uranium that is readily removed by non-acid and weak-acid reagents in the laboratory, and the 66 percent is a conservative estimate for uranium that may be released from the sediments under natural aquifer conditions. For example, nearly one third of the mobile fraction is associated with carbonate grains; but there is a low probability of this entire mass being released into the aquifer because the groundwater is saturated with calcite and dolomite, which stabilizes the surface chemistry of carbonate grains. The rate of uranium release to groundwater from the mobile fraction is presently being investigated with kinetics testing. Results from these studies will provide additional insight regarding the potential to exceed the remediation standard (30 µg/L) after the pump-and-treat system is turned off.
After the nature and extent of groundwater contamination was defined, various remediation technologies were evaluated in the Feasibility Study Report of Operable Unit 5 (DOE 1995). This report recommended a pump-and-treat remedy consisting of 28 groundwater extraction wells pumping at a combined rate of 4,000 gpm, located on and off property. It was estimated that the remediation would take approximately 27 years.
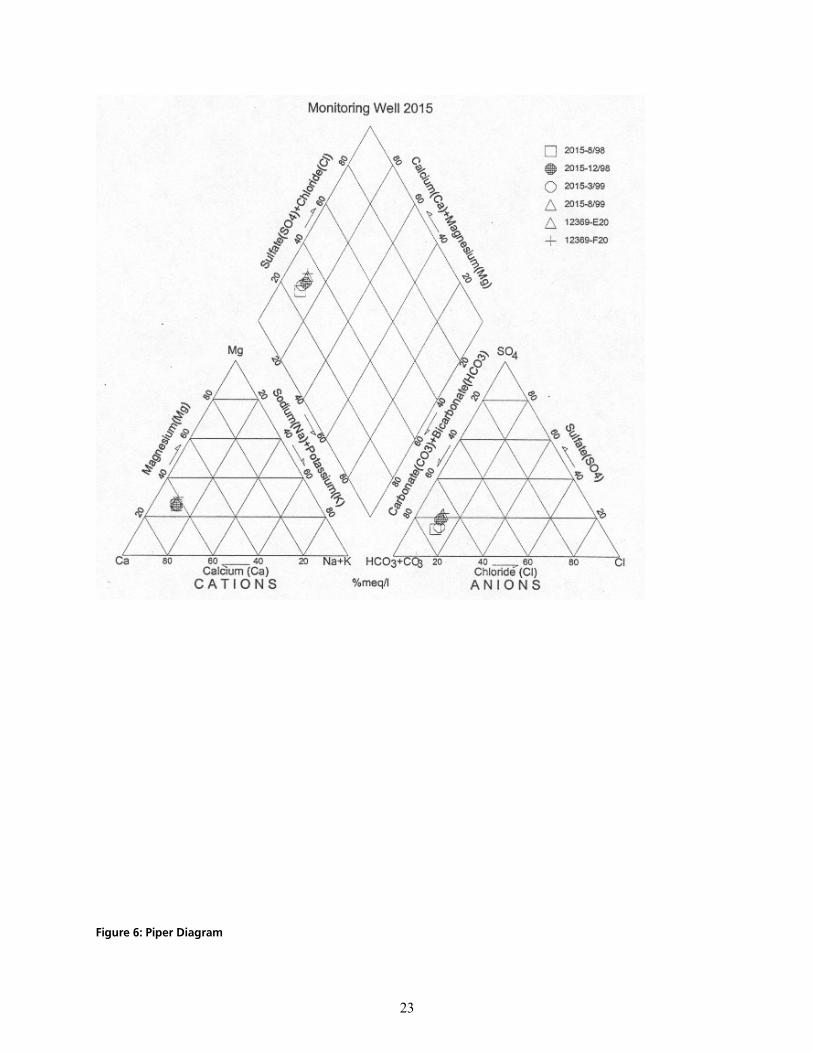
= =23
cáÖìêÉ=SW=máéÉê=aá~Öê~ã==

= =24
The groundwater remediation strategy focuses primarily on the removal of uranium, but also has been designed to limit the further expansion of the plume, achieve removal of all targeted contaminants to concentrations below designated FRLs, and prevent undesirable groundwater drawdown impacts beyond the FCP property.
Following the first remedy design presented in the Feasibility Study, an enhanced aquifer remediation design that included re-injection was presented in the Baseline Remedial Strategy Report, Remedial Design for Aquifer Restoration (DOE, 1997). Groundwater modeling studies conducted in support of the enhanced groundwater remedy suggested that with the early installation of additional extraction wells and the use of reinjection technology, the length of the remedy could potentially be reduced to 10 years. Achieving the 10-year time period also relied on the successful completion of source removals and other site activities. Although groundwater modeling showed that reinjection expedited the cleanup, the technology was unproven at the FCP. A decision was made to tie a demonstration of the technology into the remedy design presented in the Baseline Remedial Strategy Report. If successful, the impact to the remedy would be immediate.
System components for the enhanced remedy design were operational by September 1998. The system included five reinjection wells operating as part of a reinjection demonstration. The system had a pumping rate of 3,500 gpm and an injection rate of 1,000 gpm. The groundwater reinjection demonstration was conducted at the FCP for one year (September 2, 1998 to September 2, 1999). The ensuing demonstration report (DOE, 2000c) was issued to EPA and OEPA in May 2000. The test report details the demonstration and recommends its incorporation into the FCP’s aquifer restoration strategy.
The current aquifer remediation system evolved from the 10-year aquifer remedy design presented in the Baseline Remedial Strategy report. Additional characterization and monitoring efforts in the Waste Storage and South Field Areas have resulted in additional extraction and re-injection wells. Changes to the aquifer remedy design in the Waste Storage and Plant 6 Areas were based on findings and groundwater modeling results presented in the Conceptual Design for Remediation of the Great Miami Aquifer in the Waste Storage and Plant 6 Areas (DOE, 2000). In 2002, three extraction wells began operating in the Waste Storage Area. Changes to the South Field Design are presented in the Design for Remediation for the Great Miami Aquifer, South Field Phase (II) Module (DOE, 2002). A diagram showing the location of the pump-and-treat system is provided as Figure 7.
A map of the uranium plume is provided in Figure 8. The primary sources of contamination that contributed to the plume in the specific area of interest for a possible demonstration include previously uncontrolled surface water runoff from the former production area that had direct access to the aquifer through the Storm Sewer Outfall Ditch and Paddy’s Run. A uranium concentration cross-section in the area of interest is provided in Figure 9. A temporal trend for the uranium concentration at wells 62408 and 62433 near the target area is provided as Figure 10 and Table 1. Uranium concentrations in these wells are stable or increasing.
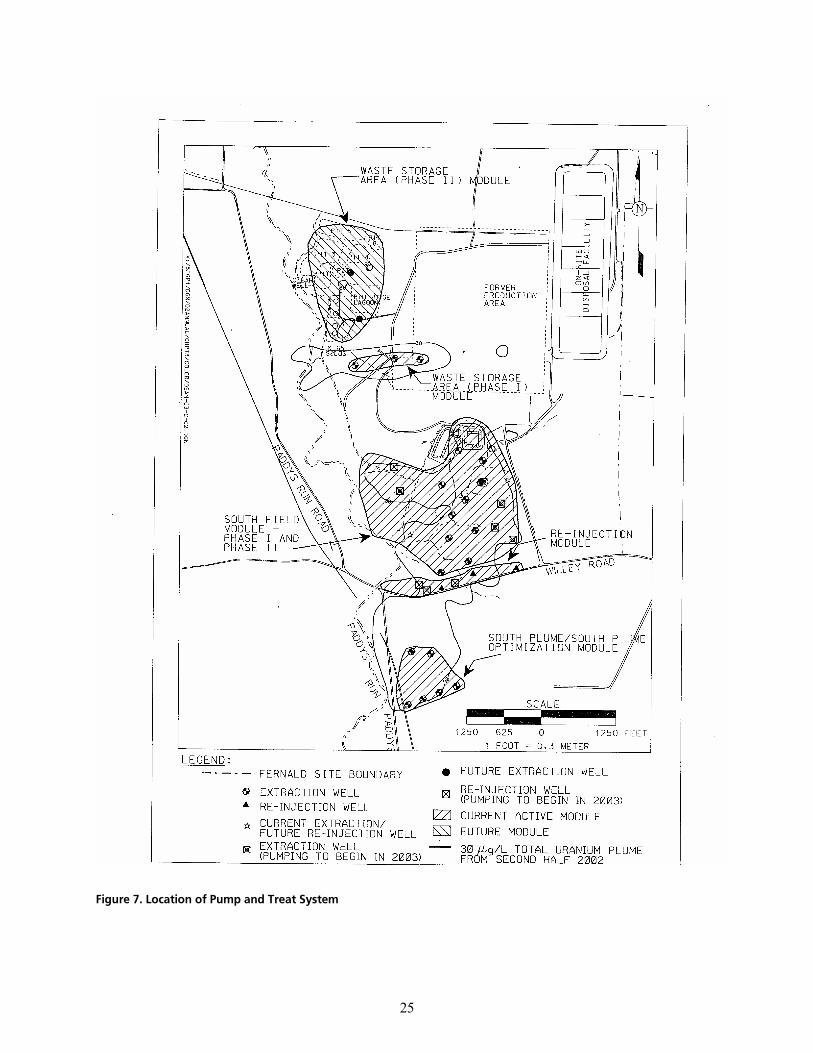
= =25
cáÖìêÉ=TK=içÅ~íáçå=çÑ=mìãé=~åÇ=qêÉ~í=póëíÉã=
= =26
cáÖìêÉ=UK=j~é=çÑ=rê~åáìã=mäìãÉ=
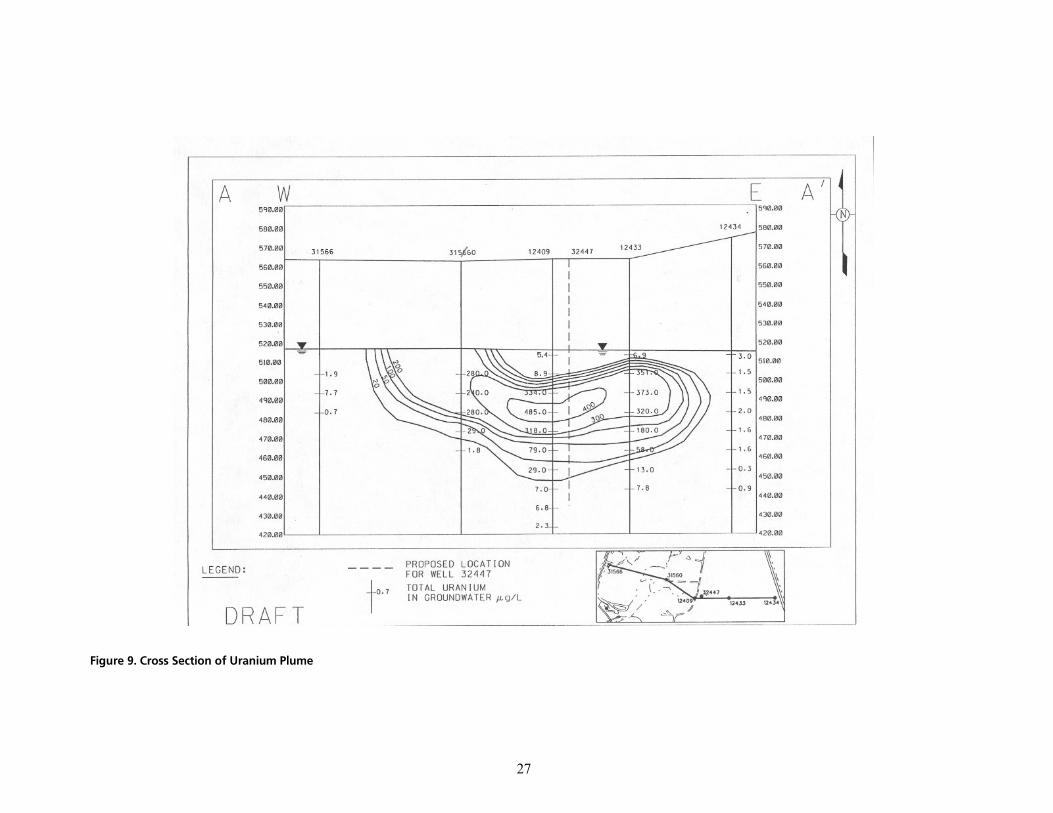
= =27
=
cáÖìêÉ=VK=`êçëë=pÉÅíáçå=çÑ=rê~åáìã=mäìãÉ=
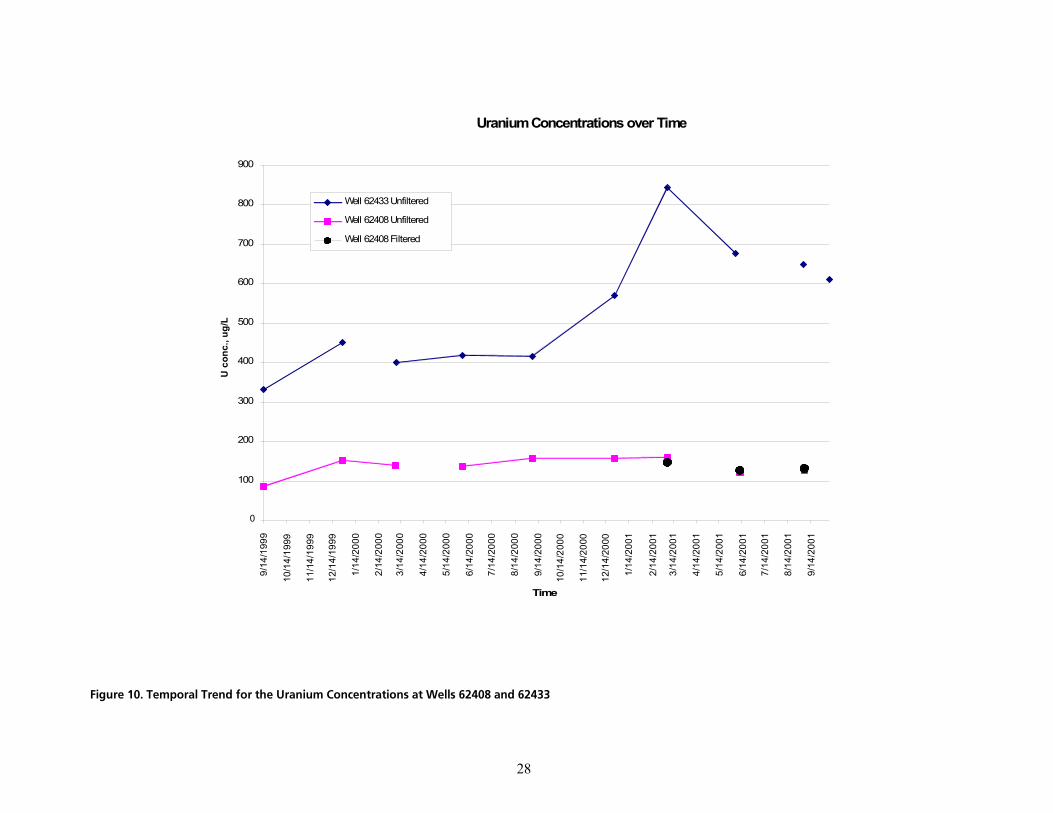
= =28
Uranium Concentrations over Time
0
100
200
300
400
500
600
700
800
900
9/14
/199
9
10/1
4/19
99
11/1
4/19
99
12/1
4/19
99
1/14
/200
0
2/14
/200
0
3/14
/200
0
4/14
/200
0
5/14
/200
0
6/14
/200
0
7/14
/200
0
8/14
/200
0
9/14
/200
0
10/1
4/20
00
11/1
4/20
00
12/1
4/20
00
1/14
/200
1
2/14
/200
1
3/14
/200
1
4/14
/200
1
5/14
/200
1
6/14
/200
1
7/14
/200
1
8/14
/200
1
9/14
/200
1
Time
U c
onc.
, ug/
L
Well 62433 Unfiltered
Well 62408 Unfiltered
Well 62408 Filtered
cáÖìêÉ=NMK=qÉãéçê~ä=qêÉåÇ=Ñçê=íÜÉ=rê~åáìã=`çåÅÉåíê~íáçåë=~í=tÉääë=SOQMU=~åÇ=SOQPP=
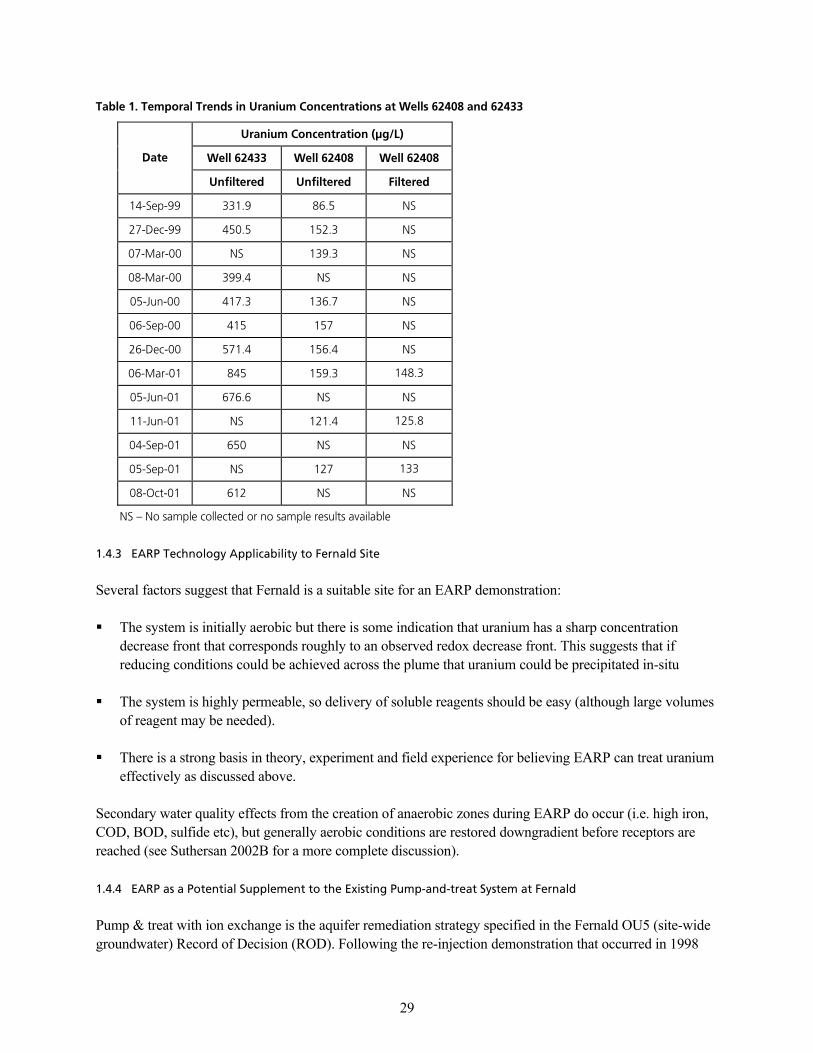
= =29
q~ÄäÉ=NK=qÉãéçê~ä=qêÉåÇë=áå=rê~åáìã=`çåÅÉåíê~íáçåë=~í=tÉääë=SOQMU=~åÇ=SOQPP==
rê~åáìã=`çåÅÉåíê~íáçå=E”ÖLiF=
tÉää=SOQPP= tÉää=SOQMU= tÉää=SOQMU=a~íÉ=
råÑáäíÉêÉÇ= råÑáäíÉêÉÇ= cáäíÉêÉÇ=
NQJpÉéJVV= PPNKV= USKR= kp=
OTJaÉÅJVV= QRMKR= NROKP= kp=
MTJj~êJMM= kp= NPVKP= kp=
MUJj~êJMM= PVVKQ= kp= kp=
MRJgìåJMM= QNTKP= NPSKT= kp=
MSJpÉéJMM= QNR= NRT= kp=
OSJaÉÅJMM= RTNKQ= NRSKQ= kp=
MSJj~êJMN= UQR= NRVKP= NQUKP=
MRJgìåJMN= STSKS= kp= kp=
NNJgìåJMN= kp= NONKQ= NORKU=
MQJpÉéJMN= SRM= kp= kp=
MRJpÉéJMN= kp= NOT= NPP=
MUJlÅíJMN= SNO= kp= kp=
= kp=Ó=kç=ë~ãéäÉ=ÅçääÉÅíÉÇ=çê=åç=ë~ãéäÉ=êÉëìäíë=~î~áä~ÄäÉ=
NKQKP b^om=qÉÅÜåçäçÖó=^ééäáÅ~Äáäáíó=íç=cÉêå~äÇ=páíÉ=
Several factors suggest that Fernald is a suitable site for an EARP demonstration:
The system is initially aerobic but there is some indication that uranium has a sharp concentration decrease front that corresponds roughly to an observed redox decrease front. This suggests that if reducing conditions could be achieved across the plume that uranium could be precipitated in-situ
The system is highly permeable, so delivery of soluble reagents should be easy (although large volumes of reagent may be needed).
There is a strong basis in theory, experiment and field experience for believing EARP can treat uranium effectively as discussed above.
Secondary water quality effects from the creation of anaerobic zones during EARP do occur (i.e. high iron, COD, BOD, sulfide etc), but generally aerobic conditions are restored downgradient before receptors are reached (see Suthersan 2002B for a more complete discussion).
NKQKQ b^om=~ë=~=mçíÉåíá~ä=pìééäÉãÉåí=íç=íÜÉ=bñáëíáåÖ=mìãéJ~åÇJíêÉ~í=póëíÉã=~í=cÉêå~äÇ=
Pump & treat with ion exchange is the aquifer remediation strategy specified in the Fernald OU5 (site-wide groundwater) Record of Decision (ROD). Following the re-injection demonstration that occurred in 1998
= =30
and 1999 the remedy was modified to incorporate re-injection technology of treated groundwater. Any additional remedy modifications would require the approval of the EPAs and concurrence by all stakeholders.
The OU5 Feasibility Study (OU5 FS) discusses baseline conditions and assumptions used in the flow and transport model to evaluate remedial alternatives. Table F.7-3 of the OU5 FS lists 16,000 lbs of uranium as the total mass initially present in the Great Miami Aquifer groundwater model. Modeling predictions summarized in Table 5-2 of the Baseline Remedial Strategy Report (BRSR) show removal of approximately 5,255 lbs to achieve a concentration based cleanup level of 20 µg/L. Subsequent to modeling completed in the BRSR, the uranium FRL was raised to 30 µg/L (due to promulgation of an EPA primary drinking water standard) and additional modeling was done to support the Waste Storage Area, and South Field Phase II Remediation Module Designs. Post BRSR modeling predicts that approximately 5,675 lbs or uranium will be removed to achieve a concentration-based cleanup of 30 µg/L.
From 1993 through the end of 2001, the pump-and-treat system has successfully removed 3200 lbs of uranium by extracting 9.5 billion gallons of water to reduce average groundwater concentrations from 300 µg/L to 150 µg/L. As of the end of 2002, 11,812 million gallons of water have been pumped and 4,448 lbs of uranium removed. The 30 µg/L uranium plume at the end of 2002 was approximately 176 acres in size. Assuming an average thickness of 40 feet and a porosity of 30% yields a pore volume of approximately 668 million gallons. Dividing 11,812 million gallons by 668 million gallons shows that an equivalent of 18 pore volumes has been pumped to date. Clearly, this system has been beneficial to human health and the environment in that it has both contained the spread of the plume and reduced the groundwater concentration measurably.
There is however uncertainty regarding the predicted length of operation of this system, which is based on general industry knowledge that pump-and-treat operations are not always predictable. Even though groundwater modeling predicts cleanup by a particular time, we are aware that modeling is at best a simplification of the real system, and therefore, cleanup time predictions are subject to some error.
Most aquifer systems are not homogenous and isotropic. Industry knowledge is clear that pump-and-treat systems flush high permeability areas of the aquifer better than less permeable areas. Similar variations also exist in adsorption properties of the contaminant on the aquifer media; the contaminant will bind more strongly to some portions of the aquifer with the distribution of adsorption properties different than the hydraulic conductivity. For these and other reasons, concentrations in the dissolved phase typically rebound after the pumping wells are turned off.
Groundwater modeling for the Waste Storage Area and South Field Phase II Module designs predicts that from 2003 to 2011, another 19,500 million gallons of water will be pumped from the aquifer to achieve concentration based cleanup goals. This is equivalent to approximately 29 pore volumes with the total amount of water predicted to be removed equivalent to approximately 47 pore volumes. The most important parameter impacting this estimate is the distribution coefficient or Kd value, describing the distribution of U between groundwater and aquifer solids. A Kd value of 17.8 L/kg was used in the model to represent desorption dominant conditions. Site specific Kd values are summarized in attachment F.8.IV of the OU5 FS reports in the GMA. Kd values of 30 samples ranged from 7.0 L/kg to 1307 L/kg with a geometric average of 64.65 L/kg. Linear regression of the total uranium concentration of the leachate versus the total uranium concentration of the sediment (minus background in the sediment) yields a slope of 17.8. However, this
= =31
same attachment documents that Kd values greater than 100 for desorption processes are quite common in this aquifer, constituting 10 of the 30 valid measurements made. If these higher Kd values are grouped in particular areas of the site, as appears likely based on this limited dataset, then there is a significant risk that a portion of the site will require many times longer than predicted by the model to remediate to 30 µg/L (since time of required additional operations varies proportionate to the Kd). These zones of higher Kd will also cause the model to under-predict remedial time. The discrepancies in model predictions will not be apparent in short term simulations, but will increase over time as concentrations in wells located in higher Kd materials will only slowly decline.
This high Kd effect is complex, since if the Kd is sufficiently high, the total concentration of U is modest, the concentration of uranium in the dissolved phase will be less than 30 ppb. However, in a situation with moderately high Kds and substantial total uranium concentrations, the equilibrium value would be >30 ppb and pump-and-treat would require a long period to reach closure.
It has been observed that uranium concentrations in western areas of the plume have come down faster than eastern areas, which may in part be a result of the excavation of certain source areas. Fernald has gathered a very large dataset of concentration vs. time during the period of pump-and-treat operation. Some of these plots (i.e., well 3925, 31567, 31550, 31560, 32761) document steep decreases in uranium concentrations which either have reached or appear likely to reach the treatment standard soon. Other wells however appear to show increasing concentrations of uranium (i.e., well 3926, these trends are, in some cases, explainable since extraction wells were intentionally installed ahead of the plume). Still other wells show trends that appeared to have reached an asymptote above 30 µg/L (a point at which further pumping is not significantly reducing concentration, for example wells 32308, 32309, 31560, 31561, 32446). These data provide further evidence that the higher Kd materials are grouped spatially.
The July 2002 Performance Management Plan for Fernald (DOE 2002) appears to regard the site groundwater as essentially a solved problem. It assumes that the pump-and-treat with reinjection (for flushing) remedy underway is sufficient to completely and rapidly resolve the problem, reducing the "27 year aquifer remediation to 10 years". The system has been operating since 1995 and has since been expanded. The current system pumps at a continuous rate of approximately 2900 gpm and removes about 800 lbs of uranium per year. The performance management plan calls for the entire treatment infrastructure to be in place by 2006 but recognizes that operation will continue beyond closure.
The January 2003 Long Term Stewardship Plan for Fernald (DOE 2003), especially Section 2.3, deals with OU-5 and briefly discusses alternatives to the current P&T: "the OU-5 ROD also committed to a continual evaluation of remediation technologies to allow for the improvement of the remedy with new technologies....the enhanced remedy includes additional extraction wells and the reinjection of treated groundwater".
Section 2.4.3 of the Long Term Stewardship Plan further goes on to state, “Operation of some portions of the groundwater extraction system will continue into long-term stewardship. Groundwater remediation and monitoring will continue until the FRL of 30 µg/L for uranium has been achieved…It is currently planned that the AWWT (Advanced Wastewater Treatment) facility will remain in place until a time when DOE is certain that groundwater treatment is no longer necessary."

= =32
Fluor Fernald is currently preparing a groundwater strategy report for DOE, which will evaluate a number of options for expediting remediation. Rebound tests of the pump-and-treat system have not been planned or carried out yet. However, some of the wells have been turned off for routine maintenance. When these wells are turned back on, concentration increases have been noted. Also, Extraction Well and Monitoring Well uranium concentration increases have been observed concurrent with water level increases in the aquifer. These field observations are expected behavior for a pump-and-treat system operating in an area with heterogeneous particle sizes and Kds.
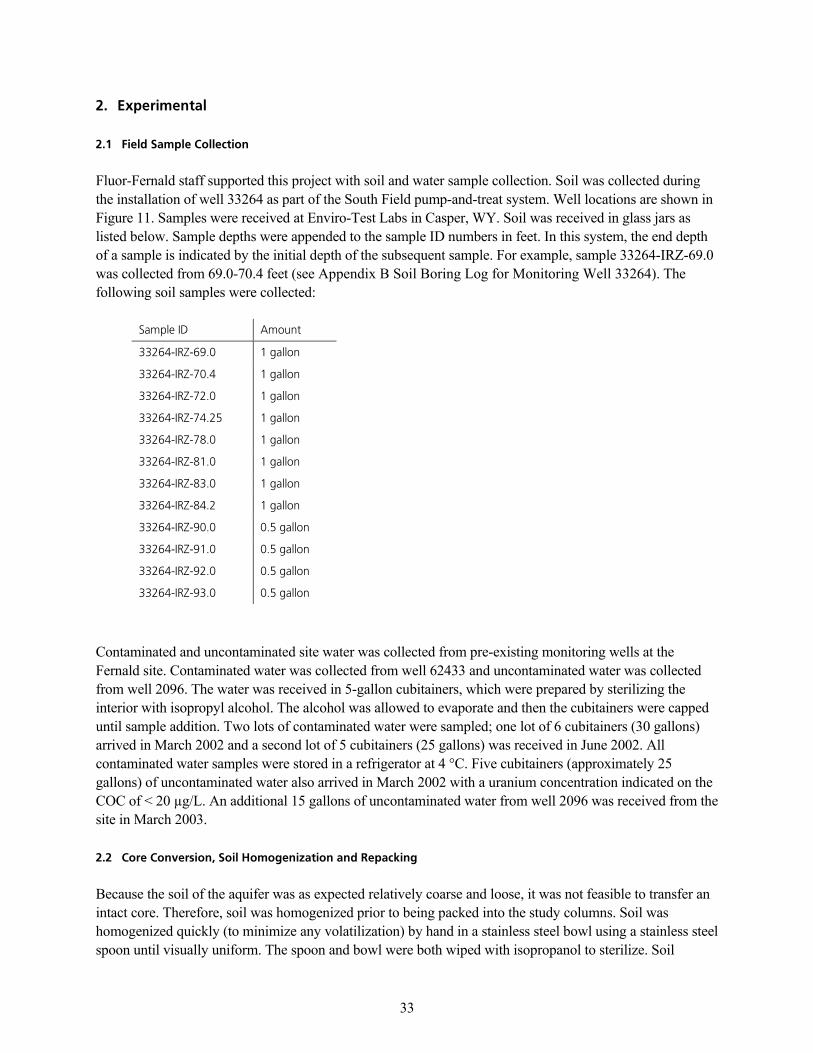
= =33
OK bñéÉêáãÉåí~ä=
OKN cáÉäÇ=p~ãéäÉ=`çääÉÅíáçå=
Fluor-Fernald staff supported this project with soil and water sample collection. Soil was collected during the installation of well 33264 as part of the South Field pump-and-treat system. Well locations are shown in Figure 11. Samples were received at Enviro-Test Labs in Casper, WY. Soil was received in glass jars as listed below. Sample depths were appended to the sample ID numbers in feet. In this system, the end depth of a sample is indicated by the initial depth of the subsequent sample. For example, sample 33264-IRZ-69.0 was collected from 69.0-70.4 feet (see Appendix B Soil Boring Log for Monitoring Well 33264). The following soil samples were collected:
p~ãéäÉ=fa= ^ãçìåí=
PPOSQJfowJSVKM= N=Ö~ääçå=
PPOSQJfowJTMKQ= N=Ö~ääçå=
PPOSQJfowJTOKM= N=Ö~ääçå=
PPOSQJfowJTQKOR= N=Ö~ääçå=
PPOSQJfowJTUKM= N=Ö~ääçå=
PPOSQJfowJUNKM= N=Ö~ääçå=
PPOSQJfowJUPKM= N=Ö~ääçå=
PPOSQJfowJUQKO= N=Ö~ääçå=
PPOSQJfowJVMKM= MKR=Ö~ääçå=
PPOSQJfowJVNKM= MKR=Ö~ääçå=
PPOSQJfowJVOKM= MKR=Ö~ääçå=
PPOSQJfowJVPKM= MKR=Ö~ääçå=
Contaminated and uncontaminated site water was collected from pre-existing monitoring wells at the Fernald site. Contaminated water was collected from well 62433 and uncontaminated water was collected from well 2096. The water was received in 5-gallon cubitainers, which were prepared by sterilizing the interior with isopropyl alcohol. The alcohol was allowed to evaporate and then the cubitainers were capped until sample addition. Two lots of contaminated water were sampled; one lot of 6 cubitainers (30 gallons) arrived in March 2002 and a second lot of 5 cubitainers (25 gallons) was received in June 2002. All contaminated water samples were stored in a refrigerator at 4 °C. Five cubitainers (approximately 25 gallons) of uncontaminated water also arrived in March 2002 with a uranium concentration indicated on the COC of < 20 µg/L. An additional 15 gallons of uncontaminated water from well 2096 was received from the site in March 2003.
OKO `çêÉ=`çåîÉêëáçåI=pçáä=eçãçÖÉåáò~íáçå=~åÇ=oÉé~ÅâáåÖ=
Because the soil of the aquifer was as expected relatively coarse and loose, it was not feasible to transfer an intact core. Therefore, soil was homogenized prior to being packed into the study columns. Soil was homogenized quickly (to minimize any volatilization) by hand in a stainless steel bowl using a stainless steel spoon until visually uniform. The spoon and bowl were both wiped with isopropanol to sterilize. Soil
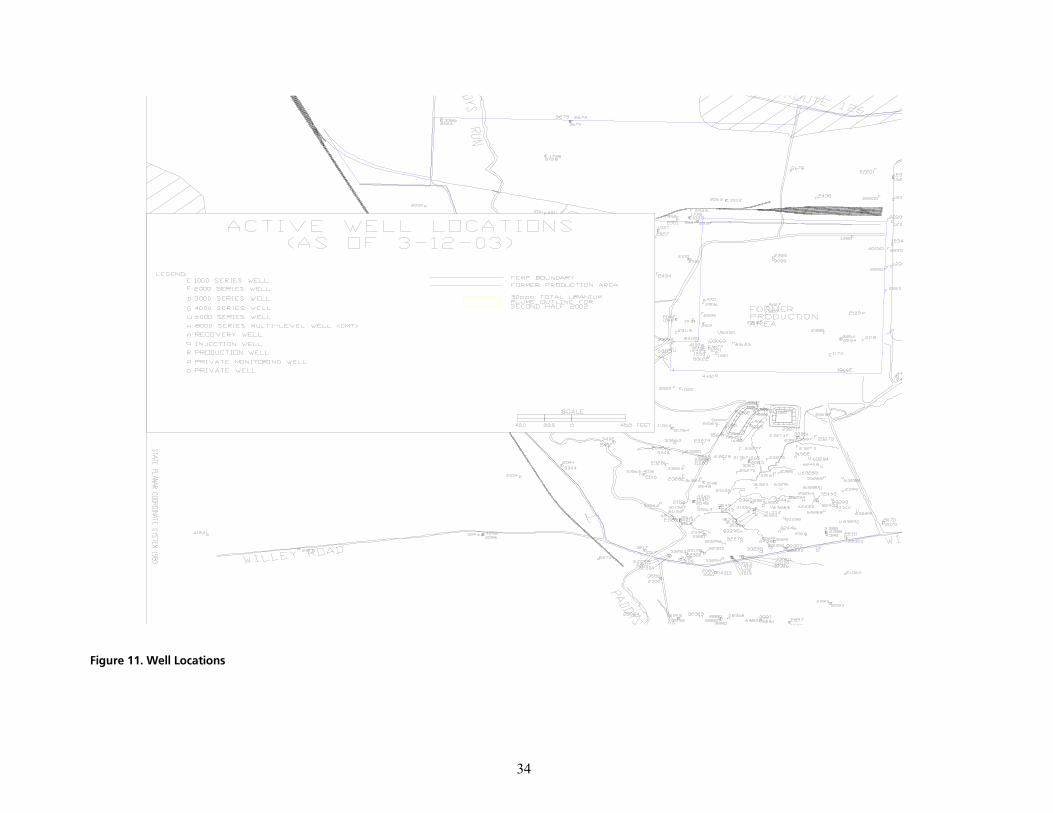
= =34
cáÖìêÉ=NNK=tÉää=içÅ~íáçåë=
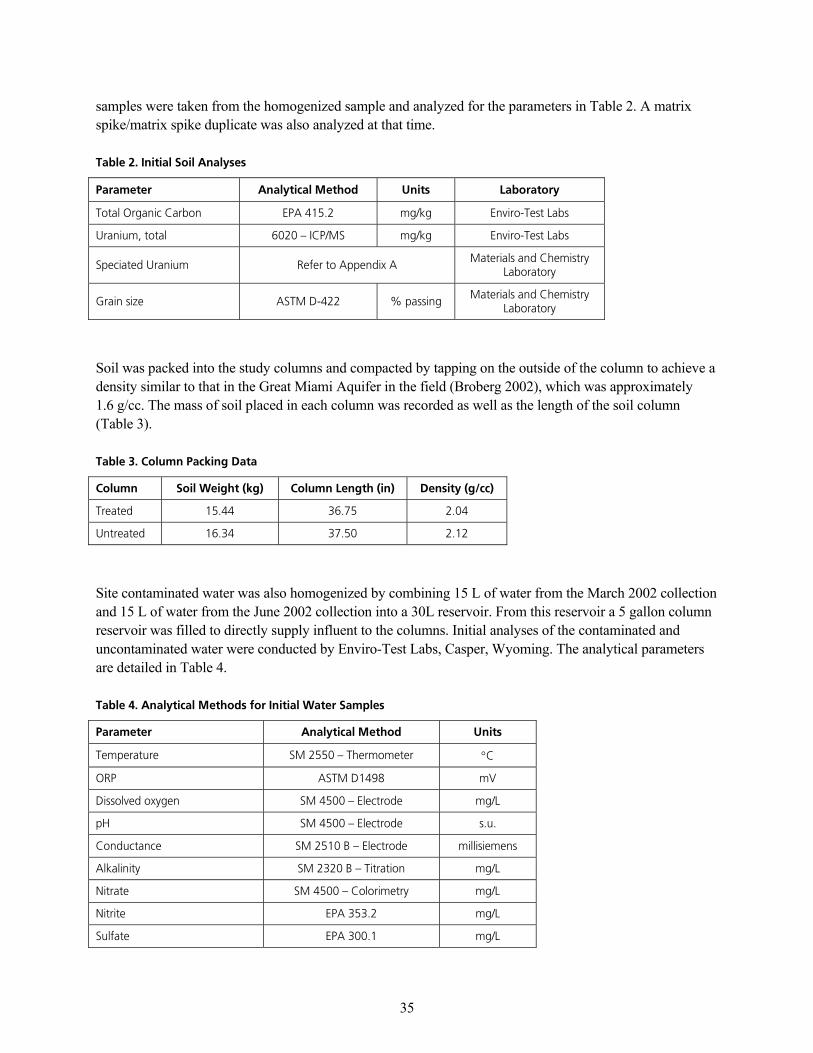
= =35
samples were taken from the homogenized sample and analyzed for the parameters in Table 2. A matrix spike/matrix spike duplicate was also analyzed at that time.
q~ÄäÉ=OK=fåáíá~ä=pçáä=^å~äóëÉë=
m~ê~ãÉíÉê= ^å~äóíáÅ~ä=jÉíÜçÇ= råáíë= i~Äçê~íçêó=
qçí~ä=lêÖ~åáÅ=`~êÄçå= bm^=QNRKO= ãÖLâÖ= båîáêçJqÉëí=i~Äë=
rê~åáìãI=íçí~ä= SMOM=Ó=f`mLjp= ãÖLâÖ= båîáêçJqÉëí=i~Äë=
péÉÅá~íÉÇ=rê~åáìã= oÉÑÉê=íç=^ééÉåÇáñ=^= j~íÉêá~äë=~åÇ=`ÜÉãáëíêó=i~Äçê~íçêó=
dê~áå=ëáòÉ= ^pqj=aJQOO= B=é~ëëáåÖ= j~íÉêá~äë=~åÇ=`ÜÉãáëíêó=i~Äçê~íçêó=
Soil was packed into the study columns and compacted by tapping on the outside of the column to achieve a density similar to that in the Great Miami Aquifer in the field (Broberg 2002), which was approximately 1.6 g/cc. The mass of soil placed in each column was recorded as well as the length of the soil column (Table 3).
q~ÄäÉ=PK=`çäìãå=m~ÅâáåÖ=a~í~=
`çäìãå= pçáä=tÉáÖÜí=EâÖF= `çäìãå=iÉåÖíÜ=EáåF= aÉåëáíó=EÖLÅÅF=
qêÉ~íÉÇ= NRKQQ= PSKTR= OKMQ=
råíêÉ~íÉÇ= NSKPQ= PTKRM= OKNO=
Site contaminated water was also homogenized by combining 15 L of water from the March 2002 collection and 15 L of water from the June 2002 collection into a 30L reservoir. From this reservoir a 5 gallon column reservoir was filled to directly supply influent to the columns. Initial analyses of the contaminated and uncontaminated water were conducted by Enviro-Test Labs, Casper, Wyoming. The analytical parameters are detailed in Table 4.
q~ÄäÉ=QK=^å~äóíáÅ~ä=jÉíÜçÇë=Ñçê=fåáíá~ä=t~íÉê=p~ãéäÉë=
m~ê~ãÉíÉê= ^å~äóíáÅ~ä=jÉíÜçÇ= råáíë=
qÉãéÉê~íìêÉ= pj=ORRM=Ó=qÜÉêãçãÉíÉê= °`=
lom= ^pqj=aNQVU= ãs=
aáëëçäîÉÇ=çñóÖÉå= pj=QRMM=Ó=bäÉÅíêçÇÉ= ãÖLi=
ée= pj=QRMM=Ó=bäÉÅíêçÇÉ= ëKìK=
`çåÇìÅí~åÅÉ= pj=ORNM=_=Ó=bäÉÅíêçÇÉ= ãáääáëáÉãÉåë=
^äâ~äáåáíó= pj=OPOM=_=Ó=qáíê~íáçå= ãÖLi=
káíê~íÉ= pj=QRMM=Ó=`çäçêáãÉíêó= ãÖLi=
káíêáíÉ= bm^=PRPKO= ãÖLi=
pìäÑ~íÉ= bm^=PMMKN= ãÖLi=
= =36
`ÜäçêáÇÉ= bm^=PMMKN=Ó=f`= ãÖLi=
`ÜÉãáÅ~ä=lñóÖÉå=aÉã~åÇ= pj=ROOM=a=J=jáÅêç=`çäçêáãÉíêó= ãÖLi=
_áçÅÜÉãáÅ~ä=lñóÖÉå=aÉã~åÇ= pj=RONM=_=Ó=bäÉÅíêçÇÉ= ãÖLi=
qçí~ä=lêÖ~åáÅ=`~êÄçå= ptUQS=VMSM= ãÖLi=
aáëëçäîÉÇ=lêÖ~åáÅ=`~êÄçå= aáëëçäîÉÇ=lêÖ~åáÅ=`~êÄçå= ãÖLi=
^ããçåá~= pj=QRMM= ãÖLi=
pìäÑáÇÉ= pj=QRMM=Ó=bäÉÅíêçÇÉ= ãÖLi=
qçí~ä=fêçå= pj=PNOR=Ó=f`mLjp= µÖLi=
qçí~ä=j~åÖ~åÉëÉ= pj=PNOR=Ó=f`mLjp= µÖLi=
aáëëçäîÉÇ=fêçå= ptUQS=SMOM= µÖLi=
aáëëçäîÉÇ=j~åÖ~åÉëÉ= ptUQS=SMOM= µÖLi=
aáëëçäîÉÇ=rê~åáìã== pj=PNOR=Ó=f`mLjp= µÖLi=
_êçãáÇÉ= bm^=PMMKN=J=f`= ãÖLi=
OKP `çäìãå=pÉíJìé=~åÇ=aÉëáÖå=
Two columns were constructed for the bench-scale tests, one for treatment, and the second as an untreated control. The intent was to operate the treatment column in four phases:
Initially without treatment to establish flow
Followed by a treatment phase of several months (molasses addition)
Followed by a one-month iron addition phase (molasses and iron sulfate addition)
Followed by a rebound phase in which uncontaminated aerobic water was introduced.
Table 5 summarizes the testing phases.
The experimental design (see Figure 12 and Appendix C for photographs) consisted mainly of two acrylic columns with an inner diameter of 4 inches and a wall thickness of ¾ inches. End caps made of ¾-inch thick acrylic were sealed to the column using methylene chloride as a solvent welding agent. The columns were loaded with a layer of sterilized glass wool just inside of the bottom end cap in order to prevent particulate from exiting the column. A 2-3" layer of clean, uncontaminated sand was placed on top of the glass wool and then the homogenized soil was added. The treatment column contained a soil column measuring 36.75" while the control, or untreated, column contained a soil column measuring 37.50". The volume of the soil columns was calculated to be 462 in3 in the treated column and 471 in3 in the control column. The tops of the soil columns were covered by another sand and glass wool layer. Photographs of the set up are shown in Appendix C.
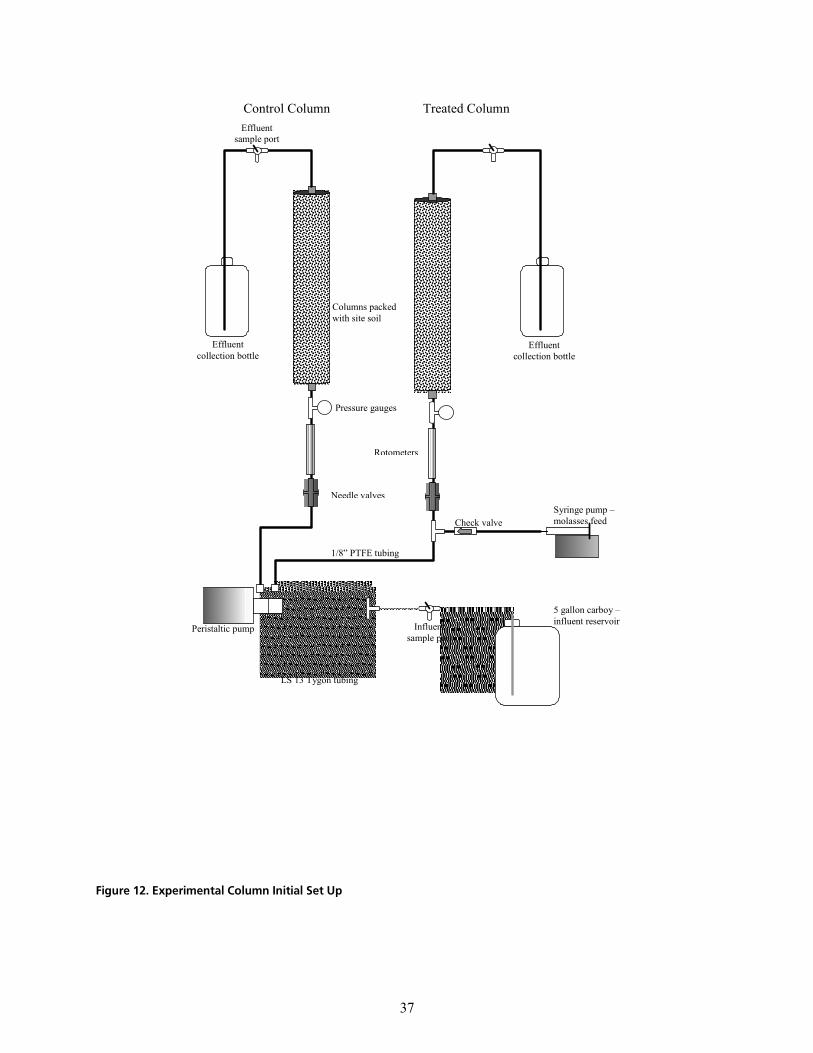
= =37
Control Column Treated Column
5 gallon carboy – influent reservoir
Syringe pump – molasses feed
Influent sample port
Peristaltic pump
LS 13 Tygon tubing
1/8” PTFE tubing
Check valve
Needle valves
Rotometers
Pressure gauges
Columns packed with site soil
Effluent sample port
Effluent collection bottle
Effluent collection bottle
cáÖìêÉ=NOK=bñéÉêáãÉåí~ä=`çäìãå=fåáíá~ä=pÉí=ré=
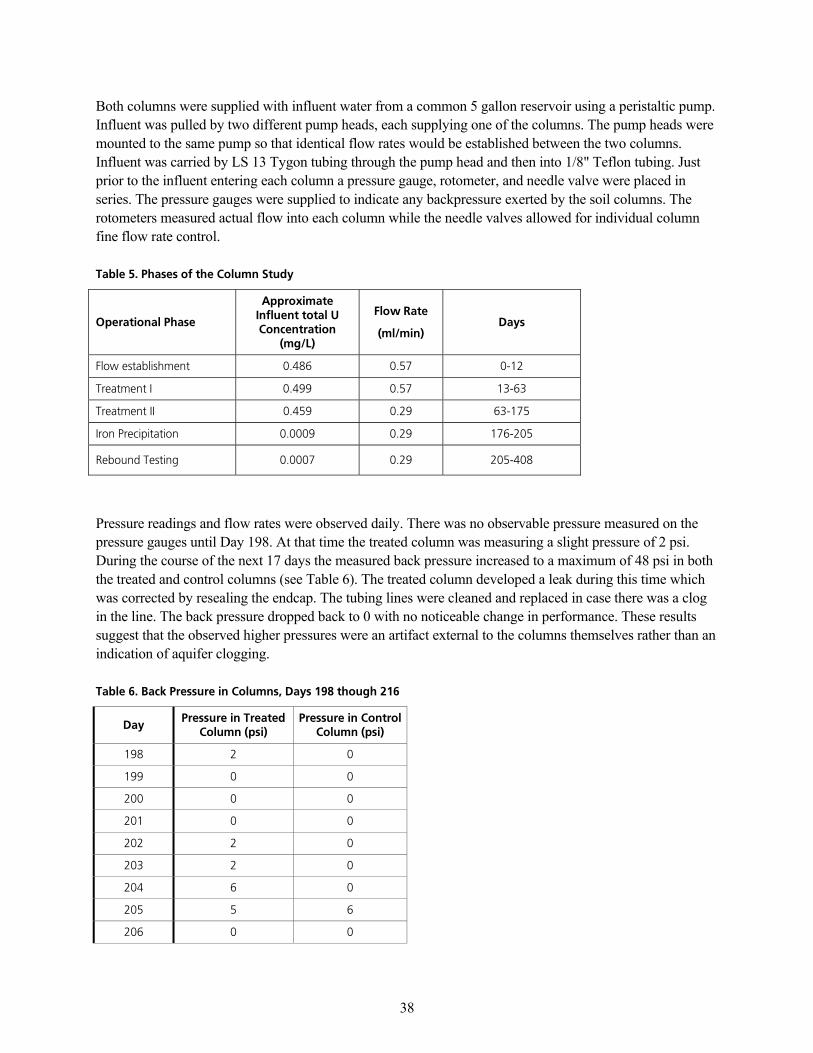
= =38
Both columns were supplied with influent water from a common 5 gallon reservoir using a peristaltic pump. Influent was pulled by two different pump heads, each supplying one of the columns. The pump heads were mounted to the same pump so that identical flow rates would be established between the two columns. Influent was carried by LS 13 Tygon tubing through the pump head and then into 1/8" Teflon tubing. Just prior to the influent entering each column a pressure gauge, rotometer, and needle valve were placed in series. The pressure gauges were supplied to indicate any backpressure exerted by the soil columns. The rotometers measured actual flow into each column while the needle valves allowed for individual column fine flow rate control.
q~ÄäÉ=RK=mÜ~ëÉë=çÑ=íÜÉ=`çäìãå=píìÇó=
léÉê~íáçå~ä=mÜ~ëÉ=
^ééêçñáã~íÉ=fåÑäìÉåí=íçí~ä=r=`çåÅÉåíê~íáçå=
EãÖLiF=
cäçï=o~íÉ=
EãäLãáåF=a~óë=
cäçï=Éëí~ÄäáëÜãÉåí= MKQUS= MKRT= MJNO==
qêÉ~íãÉåí=f= MKQVV= MKRT= NPJSP=
qêÉ~íãÉåí=ff= MKQRV= MKOV= SPJNTR=
fêçå=mêÉÅáéáí~íáçå= MKMMMV== MKOV= NTSJOMR=
oÉÄçìåÇ=qÉëíáåÖ= MKMMMT== MKOV= OMRJQMU=
Pressure readings and flow rates were observed daily. There was no observable pressure measured on the pressure gauges until Day 198. At that time the treated column was measuring a slight pressure of 2 psi. During the course of the next 17 days the measured back pressure increased to a maximum of 48 psi in both the treated and control columns (see Table 6). The treated column developed a leak during this time which was corrected by resealing the endcap. The tubing lines were cleaned and replaced in case there was a clog in the line. The back pressure dropped back to 0 with no noticeable change in performance. These results suggest that the observed higher pressures were an artifact external to the columns themselves rather than an indication of aquifer clogging.
q~ÄäÉ=SK=_~Åâ=mêÉëëìêÉ=áå=`çäìãåëI=a~óë=NVU=íÜçìÖÜ=ONS=
a~ó=mêÉëëìêÉ=áå=qêÉ~íÉÇ=
`çäìãå=EéëáF=mêÉëëìêÉ=áå=`çåíêçä=
`çäìãå=EéëáF=
NVU= O= M=
NVV= M= M=
OMM= M= M=
OMN= M= M=
OMO= O= M=
OMP= O= M=
OMQ= S= M=
OMR= R= S=
OMS= M= M=
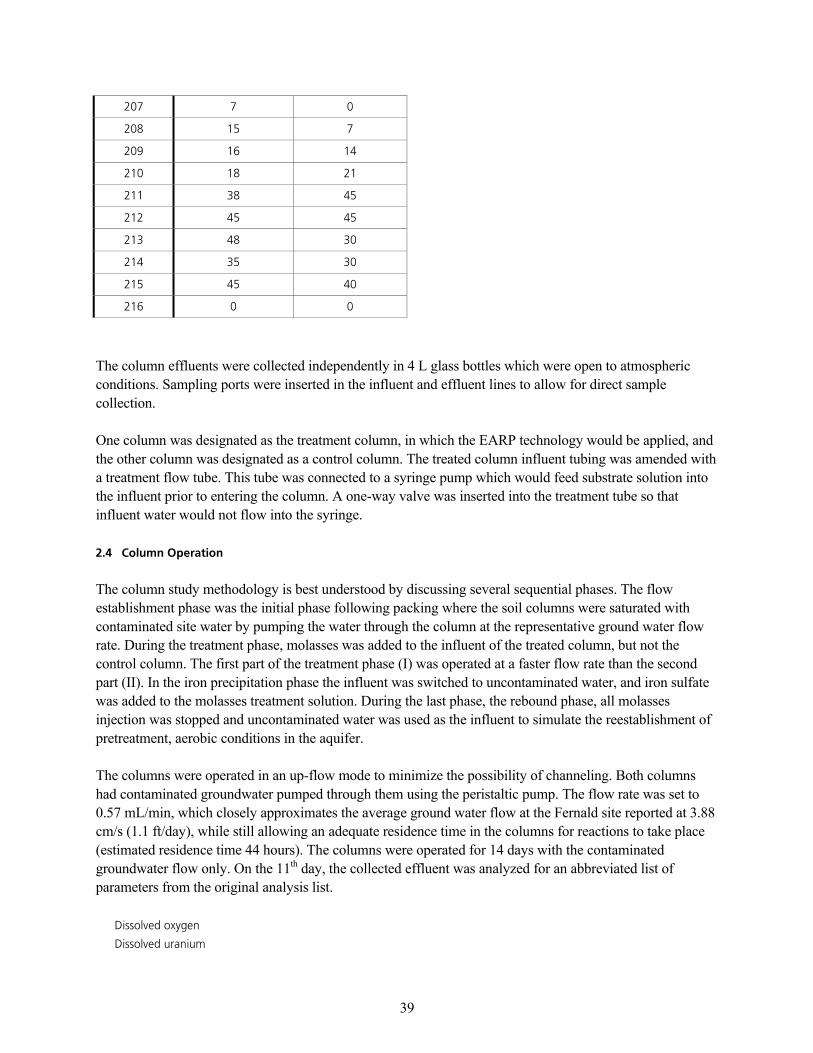
= =39
OMT= T= M=
OMU= NR= T=
OMV= NS= NQ=
ONM= NU= ON=
ONN= PU= QR=
ONO= QR= QR=
ONP= QU= PM=
ONQ= PR= PM=
ONR= QR= QM=
ONS= M= M=
The column effluents were collected independently in 4 L glass bottles which were open to atmospheric conditions. Sampling ports were inserted in the influent and effluent lines to allow for direct sample collection.
One column was designated as the treatment column, in which the EARP technology would be applied, and the other column was designated as a control column. The treated column influent tubing was amended with a treatment flow tube. This tube was connected to a syringe pump which would feed substrate solution into the influent prior to entering the column. A one-way valve was inserted into the treatment tube so that influent water would not flow into the syringe.
OKQ `çäìãå=léÉê~íáçå=
The column study methodology is best understood by discussing several sequential phases. The flow establishment phase was the initial phase following packing where the soil columns were saturated with contaminated site water by pumping the water through the column at the representative ground water flow rate. During the treatment phase, molasses was added to the influent of the treated column, but not the control column. The first part of the treatment phase (I) was operated at a faster flow rate than the second part (II). In the iron precipitation phase the influent was switched to uncontaminated water, and iron sulfate was added to the molasses treatment solution. During the last phase, the rebound phase, all molasses injection was stopped and uncontaminated water was used as the influent to simulate the reestablishment of pretreatment, aerobic conditions in the aquifer.
The columns were operated in an up-flow mode to minimize the possibility of channeling. Both columns had contaminated groundwater pumped through them using the peristaltic pump. The flow rate was set to 0.57 mL/min, which closely approximates the average ground water flow at the Fernald site reported at 3.88 cm/s (1.1 ft/day), while still allowing an adequate residence time in the columns for reactions to take place (estimated residence time 44 hours). The columns were operated for 14 days with the contaminated groundwater flow only. On the 11th day, the collected effluent was analyzed for an abbreviated list of parameters from the original analysis list.
aáëëçäîÉÇ=çñóÖÉå=
aáëëçäîÉÇ=ìê~åáìã=
= =40
_êçãáÇÉ=
pìäÑáÇÉ=
`çåÇìÅíáîáíó=
lom=
qÉãéÉê~íìêÉ=
ql`=
me= =
After the 13 days of initial groundwater flow, treatment solution began being injected into the influent flow of the "treated" column only. The treatment solution was added to the groundwater flow immediately prior to entering the column using a syringe pump. The treatment solution consisted of a Blackstrap molasses solution (Golden Barrel brand, Good Food, Inc.) which was introduced at a concentration typical of that achieved in downgradient IRZ monitoring wells (total organic carbon concentration of ~200 mg/L). The second column was an unamended control that did not receive the treatment solution.
The treatment solution was prepared by dissolving 95 mL of molasses into 2 L of deionized water. A TOC analysis on the molasses, as received, indicated a TOC of 310,000 mg/L. The calculated TOC concentration of the prepared molasses solution was 14,250 mg/L. The prepared solution was pumped into the influent through a syringe pump at 8 µL/min (1.4% of the total influent flow rate). Dilution by the influent resulted in a TOC concentration of 199.5 mg/L as the influent entered the column. This is a typical concentration observed at monitoring wells in well functioning full-scale IRZ systems (Suthersan et al., 2002b).
Effluent sampling occurred at various intervals determined by previous results and progress along the experimental timeline. Sampling was conducted by collecting the effluent that had accumulated in the effluent bottles. For time sensitive analytes, such as ORP and sulfide, samples were collected directly into analysis vessels through a sample port in the effluent tubing. Analytical methods and reporting limits are located in Table 7 (as reported by Energy Labs). Full effluent vessels were collected and held at 4 °C for the entirety of the study.
q~ÄäÉ=TK=^å~äóíáÅ~ä=jÉíÜçÇë=Ñçê=bÑÑäìÉåí=t~íÉê=p~ãéäÉë=
^å~äóëáë= jÉíÜçÇ= oi= råáíë=
^äâ~äáåáíóI=qçí~ä=~ë=`~`lP= ^OPOM=_= NKM= ãÖLi=
^ããçåá~Jk= ^QRMMJkeP=d= MKMR= ãÖLi=
_laI=RJa~ó= ^RONM=_= O= ãÖLi=
_êçãáÇÉ= bPMMKM= MKOM= ãÖLi=
`ÜÉãáÅ~ä=lñáÇ~íáçå=aÉã~åÇ= e^`e=UMMM= NKM= ãÖLi=
`ÜäçêáÇÉ= ^OPOM=_= NM= ãÖLi=
`çåÇìÅíáîáíó= ^ORNM=_= NKM= ìãÜçëLÅã=
aáëëçäîÉÇ=lêÖ~åáÅ=`~êÄçå= ^RPNM=`= MKRM= ãÖLi=
aáëëçäîÉÇ=lñóÖÉå= ^QRMMJl=d= NKMM= ãÖLi=
bíÜ~åÉ= ptUMNRj= MKMMP= ãÖLi=
bíÜÉåÉ= ptUMNRj= MKMMP= ãÖLi=
fêçåI=ÇáëëçäîÉÇ= ptSMNM_= PM= µÖLi=
= =41
^å~äóëáë= jÉíÜçÇ= oi= råáíë=
fêçåI=íçí~ä= ptSMNM_= PM= µÖLi=
j~åÖ~åÉëÉI=ÇáëëçäîÉÇ= ptSMNM_= NM= µÖLi=
j~åÖ~åÉëÉI=íçí~ä= ptSMNM_= NM= µÖLi=
jÉíÜ~åÉ= ptUMNRj= MKMMMO= ãÖLi=
káíê~íÉJk= bPRPKO= MKNM= ãÖLi=
káíêáíÉJk= ^QRMMJklO=_= MKNM= ãÖLi=
lñáÇ~íáçåJoÉÇìÅíáçå=mçíÉåíá~ä= ^ORUM=_= JJJ= ãs=
ée= ^OPOM=_= MKMNM= ëKìK=
pìäÑ~íÉ= ptSMNM_= NKM= ãÖLi=
pìäÑáÇÉ= bPTSKN= N= ãÖLi=
pìäÑìêI=íçí~ä= bOMMKT= NKM= ãÖLi=
qÉãéÉê~íìêÉ= bNTMKN= JJJ= °`=
qçí~ä=lêÖ~åáÅ=`~êÄçåI=äáèìáÇ= ^RPNM=`= MKRM= ãÖLi=
qçí~ä=lêÖ~åáÅ=`~êÄçåI=ëçäáÇ= bQNRKO= OMM= ãÖLâÖ=
rê~åáìãI=ÇáëëçäîÉÇ= ptSMOM= MKMMMP= ãÖLi=
rê~åáìãI=íçí~ä= ptSMOM= MKMMMP= ãÖLi=
OKR léÉê~íáçå~ä=bîÉåíë=ÇìêáåÖ=`çäìãå=qÉëíáåÖ=
Day 1: Begin flow establishment phase
Day 13: Begin treatment phase
Day 26: The host lab for the study was shut down due to unrelated business changes and therefore the project had to be moved to a new lab that could handle radioactive materials. The columns, water, soil, and all other materials were moved a short distance across town to Energy Laboratories, also in Casper, Wyoming, and reconnected there. Columns were carefully transported so that no water in the columns escaped and the orientation of the columns was preserved. The column flow was off for approximately 1.5 hours. Upon reconnection the influent flow and molasses treatments were restarted.
Day 63: The flow rate for the columns was reduced from 0.57 ml/min to 0.29 ml/min to allow for a longer contact time with the soil in the column (increased from 44 to 87 hours).
Day 101: DO samples had previously been collected from the effluent collection containers. The DO sample collection procedure was changed such that samples were collected prior to analysis into a 300 mL ground glass narrow mouth bottle and then analyzed for DO immediately (see Section 2.6).
Day 140-149: The syringe pump used to inject the treatment solution malfunctioned. Only 35 mL of treatment was administered during the course of these ten days. The pump was repaired and restarted without further incident on Day 150.
= =42
Day 176: This marked the conclusion of the treatment phase and the beginning of the iron precipitation phase. The source of influent water was changed from contaminated to uncontaminated water. Additionally, the molasses treatment solution was modified to include iron sulfate. A dose of 18.5 g of iron (II) sulfate heptahydrate was added to each new preparation of the molasses solution, resulting in a 50 mg/L concentration of iron in the column influent.
Day 205: This date marked the end of the iron precipitation phase and the beginning of the rebound phase of the study. Iron-amended molasses flow was stopped and the uncontaminated influent was pumped in without any treatment solution added.
Day 224: The untreated/control column was turned off since there was no useful role for a control once treatment had ceased.
Day 304: Column design was modified to include an extension column on the treated column (depicted in Figure 13) to allow more space and reaction time for uranium mobility control by fresh Fe+3 oxides (see Section 1.2.2.3 for more background on this process). To prepare this extension column, the soil was removed from the former control column and the column was cleaned with deionized water. The acrylic column was then repacked with homogenized site soil that had been stored since the initial column packing (since the system was generally aerobic these soils had been stored without any extraordinary precautions to exclude oxygen). The column was packed at 0.42 kg of soil per inch of column, just as the treated column had been. The column was saturated with uncontaminated site water and capped at the end with a rubber boot cap and band clamp. The rubber cap had been modified with an effluent port, similar to the effluent port on the acrylic endcaps.
Day 338: The treated column was temporarily disconnected from the system. A 1" core sample was taken by forcing a steel tube through the length of the column. An initial sample collected through the middle of the column yielded only 18" of soil because the tube was blocked by gravel size particles in the end. Another attempt collected the whole length of the column though the sample was collected along the side wall of the column. The holes in the column left by soil sampling were filled with a solid acrylic rod and operation of the column was resumed. Once the soil sample was collected, 3 oversize particles between 3/4" - 1" were excluded from the sample (since uranium is generally associated with the fines and thus these would be likely to make the speciation analyses difficult). The oversize particles appeared at 5" from the effluent end, 29 1/2" and 32 1/2". The core samples were analyzed for total uranium at 5 different places along the length and subsamples were sent to Materials and Chemistry Labs for uranium speciation. Photographs of this core are included in Appendix C.
OKS alLlom=jÉ~ëìêÉãÉåí=jÉíÜçÇçäçÖó=
DO measurements were taken with a DO probe according to standard methods 5210B. Originally, DO samples were taken from the effluent collection bottles, which were compositing column effluent over several days to collect sufficient volume for the full suite of planned analyses. This allowed the samples to pick up oxygen from the atmosphere while sitting in an open container for several days while the samples collected. On Day 101, three DO samples were collected using different methods to determine if this sample collection procedure was indeed biasing the results. One sample was collected and tested from the effluent collection bottle as per the previous method (Sample 1). One sample was collected in a closed vial, held in the closed vial one day (25.5 hours), and then analyzed (Sample 2). The last sample was collected overnight
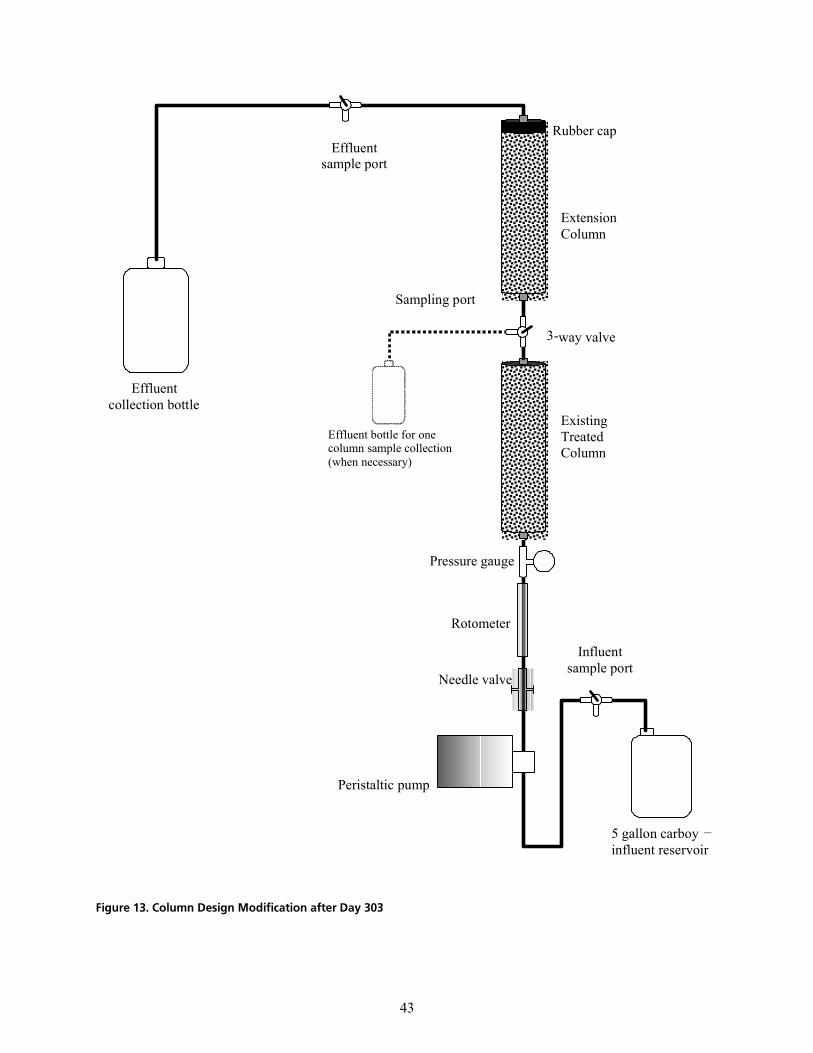
= =43
5 gallon carboy – influent reservoir
Influent sample port
Peristaltic pump
Needle valve
Rotometer
Pressure gauge
Existing Treated Column
Effluent sample port
Effluent collection bottle
Extension Column
3-way valve
Rubber cap
Sampling port
Effluent bottle for one column sample collection (when necessary)
cáÖìêÉ=NPK=`çäìãå=aÉëáÖå=jçÇáÑáÅ~íáçå=~ÑíÉê=a~ó=PMP=
= =44
and then analyzed as soon as sufficient volume for DO analysis only was attained (Sample 3). A method blank of deionized water was also prepared and analyzed. Results for the samples were as follows:
p~ãéäÉ= al=EãÖLiF=
p~ãéäÉ=N= SKOV=
p~ãéäÉ=O= NKTQ=
p~ãéäÉ=P= NKMR=
jÉíÜçÇ=_ä~åâ= OKVP=
The results of this experiment indicated that the compositing procedure biased the DO measurements. Thereafter, DO was collected in a closed vial and then analyzed immediately upon collection.
On Day 205 a sample of column water was drawn out of the column at the influent port. The influent line was disconnected from the column end cap and ~20 mL of water was withdrawn using a syringe. That aliquot was discarded because this water had just entered the column but had not had a chance to be altered by the column environment. An additional 40 mL was then withdrawn from the influent port. That 40 ml sample was analyzed for DO and found to be non-detectable. (The detection limit for the method is 1.0 mg/L). From this point forward, DO samples were collected both from the effluent into a vial, as mentioned, but also from the influent port following this procedure. These data are reported as DO (effluent) and DO (influent). The influent port samples typically contained 3-4 mg/L less DO than the effluent samples, which is likely attributable to these differing methods of collection.
The samples collected for DO measurement were also used to test for ORP. Since ORP is a probe method, the ORP of a sample was taken at the same time as the DO. The changes in the sampling procedures for DO samples also concurrently changed the way ORP samples were collected.
OKT péÉÅá~íáçå=jÉíÜçÇë=
Metals species were analyzed in three soil samples - in the homogenized, untreated Fernald soil, and in two soil samples collected from the column on the 338th day of column operation (132 days into the rebound testing phase using aerobic water). The nature of these soils was examined with a variety of techniques including sieve based particle size separation, X-ray diffraction (XRD), X-ray fluorescence (XRF), X-ray photoelectron spectroscopy (XPS) and multiple extraction. The multiple extraction methodology was based on the method of Phillips and Chapple (1995), which in turn was adapted from the method of Tessier (1979). Full details of these procedures are presented in Appendix A.
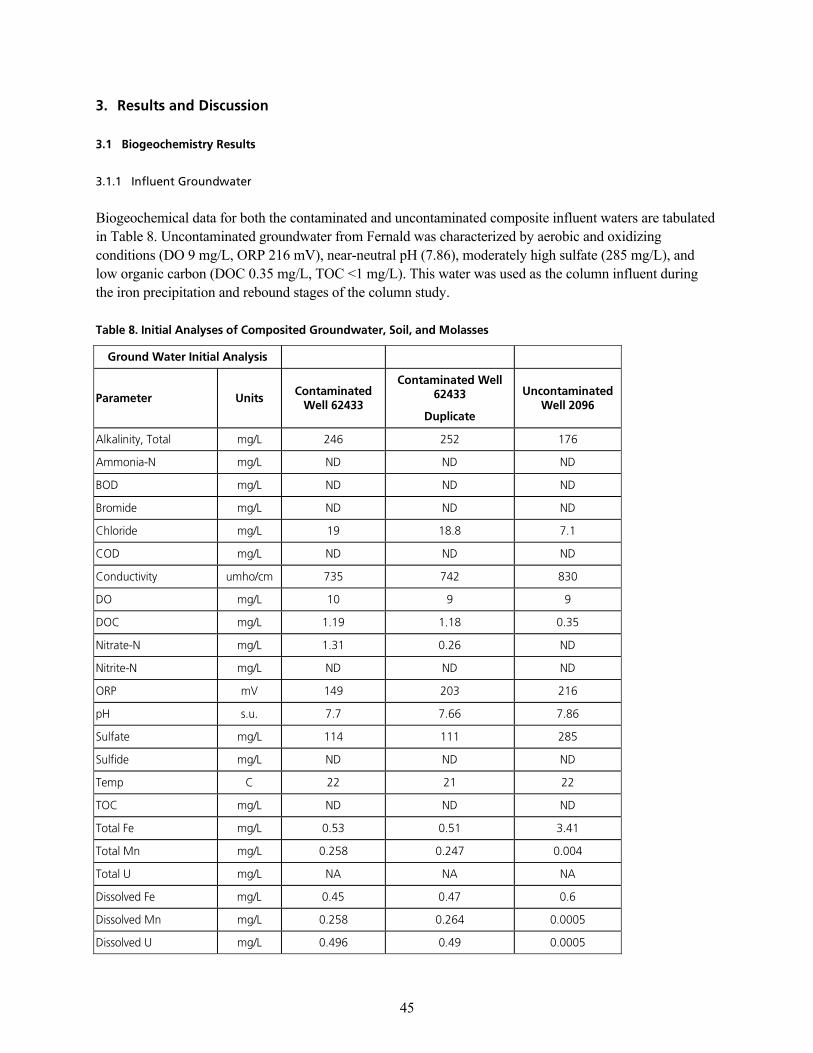
= =45
PK oÉëìäíë=~åÇ=aáëÅìëëáçå=
PKN _áçÖÉçÅÜÉãáëíêó=oÉëìäíë=
PKNKN fåÑäìÉåí=dêçìåÇï~íÉê=
Biogeochemical data for both the contaminated and uncontaminated composite influent waters are tabulated in Table 8. Uncontaminated groundwater from Fernald was characterized by aerobic and oxidizing conditions (DO 9 mg/L, ORP 216 mV), near-neutral pH (7.86), moderately high sulfate (285 mg/L), and low organic carbon (DOC 0.35 mg/L, TOC <1 mg/L). This water was used as the column influent during the iron precipitation and rebound stages of the column study.
q~ÄäÉ=UK=fåáíá~ä=^å~äóëÉë=çÑ=`çãéçëáíÉÇ=dêçìåÇï~íÉêI=pçáäI=~åÇ=jçä~ëëÉë=
dêçìåÇ=t~íÉê=fåáíá~ä=^å~äóëáë= = = =
m~ê~ãÉíÉê= råáíë=`çåí~ãáå~íÉÇ=tÉää=SOQPP=
`çåí~ãáå~íÉÇ=tÉää=SOQPP=
aìéäáÅ~íÉ=
råÅçåí~ãáå~íÉÇ=tÉää=OMVS=
^äâ~äáåáíóI=qçí~ä== ãÖLi= OQS= ORO= NTS=
^ããçåá~Jk= ãÖLi= ka= ka= ka=
_la= ãÖLi= ka= ka= ka=
_êçãáÇÉ= ãÖLi= ka= ka= ka=
`ÜäçêáÇÉ= ãÖLi= NV= NUKU= TKN=
`la= ãÖLi= ka= ka= ka=
`çåÇìÅíáîáíó= ìãÜçLÅã= TPR= TQO= UPM=
al= ãÖLi= NM= V= V=
al`= ãÖLi= NKNV= NKNU= MKPR=
káíê~íÉJk= ãÖLi= NKPN= MKOS= ka=
káíêáíÉJk= ãÖLi= ka= ka= ka=
lom= ãs= NQV= OMP= ONS=
ée= ëKìK= TKT= TKSS= TKUS=
pìäÑ~íÉ= ãÖLi= NNQ= NNN= OUR=
pìäÑáÇÉ= ãÖLi= ka= ka= ka=
qÉãé= `= OO= ON= OO=
ql`= ãÖLi= ka= ka= ka=
qçí~ä=cÉ= ãÖLi= MKRP= MKRN= PKQN=
qçí~ä=jå= ãÖLi= MKORU= MKOQT= MKMMQ=
qçí~ä=r= ãÖLi= k^= k^= k^=
aáëëçäîÉÇ=cÉ= ãÖLi= MKQR= MKQT= MKS=
aáëëçäîÉÇ=jå= ãÖLi= MKORU= MKOSQ= MKMMMR=
aáëëçäîÉÇ=r= ãÖLi= MKQVS= MKQV= MKMMMR=
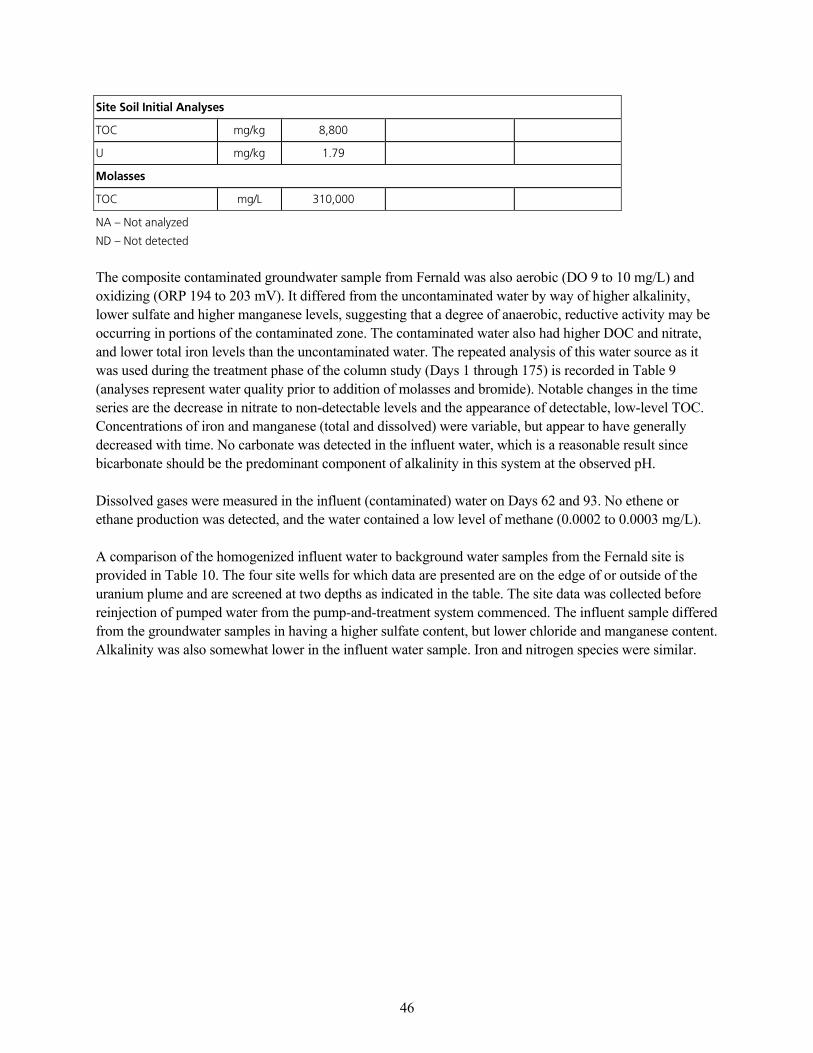
= =46
páíÉ=pçáä=fåáíá~ä=^å~äóëÉë=
ql`= ãÖLâÖ= UIUMM= = =
r= ãÖLâÖ= NKTV= = =
jçä~ëëÉë=
ql`= ãÖLi= PNMIMMM= = =
k^=Ó=kçí=~å~äóòÉÇ=
ka=Ó=kçí=ÇÉíÉÅíÉÇ
The composite contaminated groundwater sample from Fernald was also aerobic (DO 9 to 10 mg/L) and oxidizing (ORP 194 to 203 mV). It differed from the uncontaminated water by way of higher alkalinity, lower sulfate and higher manganese levels, suggesting that a degree of anaerobic, reductive activity may be occurring in portions of the contaminated zone. The contaminated water also had higher DOC and nitrate, and lower total iron levels than the uncontaminated water. The repeated analysis of this water source as it was used during the treatment phase of the column study (Days 1 through 175) is recorded in Table 9 (analyses represent water quality prior to addition of molasses and bromide). Notable changes in the time series are the decrease in nitrate to non-detectable levels and the appearance of detectable, low-level TOC. Concentrations of iron and manganese (total and dissolved) were variable, but appear to have generally decreased with time. No carbonate was detected in the influent water, which is a reasonable result since bicarbonate should be the predominant component of alkalinity in this system at the observed pH.
Dissolved gases were measured in the influent (contaminated) water on Days 62 and 93. No ethene or ethane production was detected, and the water contained a low level of methane (0.0002 to 0.0003 mg/L).
A comparison of the homogenized influent water to background water samples from the Fernald site is provided in Table 10. The four site wells for which data are presented are on the edge of or outside of the uranium plume and are screened at two depths as indicated in the table. The site data was collected before reinjection of pumped water from the pump-and-treatment system commenced. The influent sample differed from the groundwater samples in having a higher sulfate content, but lower chloride and manganese content. Alkalinity was also somewhat lower in the influent water sample. Iron and nitrogen species were similar.
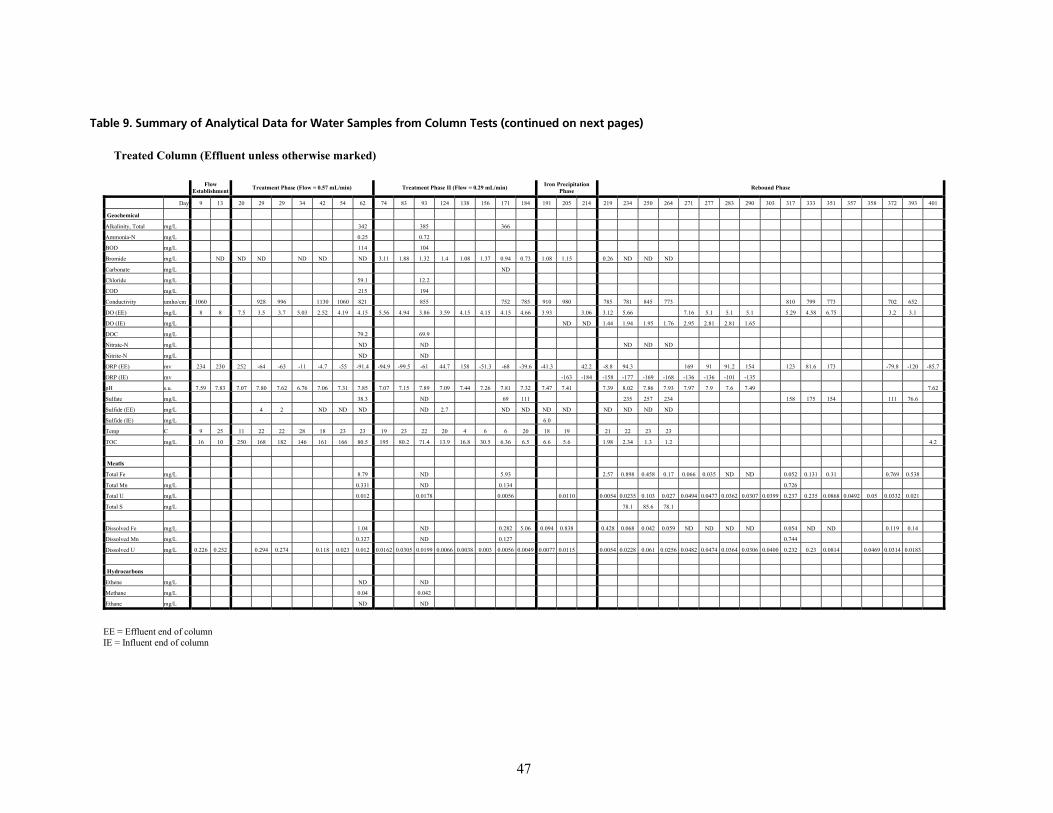
= =47
q~ÄäÉ=VK=pìãã~êó=çÑ=^å~äóíáÅ~ä=a~í~=Ñçê=t~íÉê=p~ãéäÉë=Ñêçã=`çäìãå=qÉëíë=EÅçåíáåìÉÇ=çå=åÉñí=é~ÖÉëF=
Treated Column (Effluent unless otherwise marked)
EE = Effluent end of column IE = Influent end of column
Flow
Establishment Treatment Phase (Flow = 0.57 mL/min) Treatment Phase II (Flow = 0.29 mL/min) Iron Precipitation Phase Rebound Phase
Day 9 13 20 29 29 34 42 54 62 74 83 93 124 138 156 171 184 191 205 214 219 234 250 264 271 277 283 290 303 317 333 351 357 358 372 393 401
Geochemical
Alkalinity, Total mg/L 342 385 366
Ammonia-N mg/L 0.25 0.72
BOD mg/L 114 104
Bromide mg/L ND ND ND ND ND ND 3.11 1.88 1.32 1.4 1.08 1.37 0.94 0.73 1.08 1.15 0.26 ND ND ND
Carbonate mg/L ND
Chloride mg/L 59.1 12.2
COD mg/L 215 194
Conductivity umho/cm 1060 928 996 1130 1060 821 855 752 785 910 980 785 781 845 773 810 799 773 702 652
DO (EE) mg/L 8 8 7.5 3.5 3.7 5.03 2.52 4.19 4.15 5.56 4.94 3.86 3.59 4.15 4.15 4.15 4.66 3.93 3.06 3.12 5.66 7.16 5.1 5.1 5.1 5.29 4.58 6.75 3.2 3.1
DO (IE) mg/L ND ND 1.44 1.94 1.95 1.76 2.95 2.81 2.81 1.65
DOC mg/L 79.2 69.9
Nitrate-N mg/L ND ND ND ND ND
Nitrite-N mg/L ND ND
ORP (EE) mv 234 230 252 -64 -63 -11 -4.7 -55 -91.4 -94.9 -99.5 -61 44.7 158 -51.3 -68 -39.6 -41.3 42.2 -8.8 94.3 169 91 91.2 154 123 81.6 173 -79.8 -120 -85.7
ORP (IE) mv -163 -184 -158 -177 -169 -168 -136 -136 -101 -135
pH s.u. 7.59 7.83 7.07 7.80 7.62 6.76 7.06 7.31 7.85 7.07 7.15 7.89 7.09 7.44 7.26 7.81 7.32 7.47 7.41 7.39 8.02 7.86 7.93 7.97 7.9 7.6 7.49 7.62
Sulfate mg/L 38.3 ND 69 111 235 257 234 158 175 154 111 76.6
Sulfide (EE) mg/L 4 2 ND ND ND ND 2.7 ND ND ND ND ND ND ND ND
Sulfide (IE) mg/L 6.0
Temp C 9 25 11 22 22 28 18 23 23 19 23 22 20 4 6 6 20 18 19 21 22 23 23
TOC mg/L 16 10 250 168 182 146 161 166 80.5 195 80.2 71.4 13.9 16.8 30.5 6.36 6.5 6.6 5.6 1.98 2.34 1.3 1.2 4.2
Meatls
Total Fe mg/L 8.79 ND 5.93 2.57 0.898 0.458 0.17 0.066 0.035 ND ND 0.052 0.131 0.31 0.769 0.538
Total Mn mg/L 0.331 ND 0.134 0.726
Total U mg/L 0.012 0.0178 0.0056 0.0110 0.0054 0.0235 0.103 0.027 0.0494 0.0477 0.0362 0.0307 0.0399 0.237 0.235 0.0868 0.0492 0.05 0.0332 0.021
Total S mg/L 78.1 85.6 78.1
Dissolved Fe mg/L 1.04 ND 0.282 5.06 0.094 0.838 0.428 0.068 0.042 0.059 ND ND ND ND 0.054 ND ND 0.119 0.14
Dissolved Mn mg/L 0.327 ND 0.127 0.744
Dissolved U mg/L 0.226 0.252 0.294 0.274 0.118 0.023 0.012 0.0162 0.0305 0.0199 0.0066 0.0038 0.003 0.0056 0.0049 0.0077 0.0115 0.0054 0.0228 0.061 0.0256 0.0482 0.0474 0.0364 0.0306 0.0400 0.232 0.23 0.0814 0.0469 0.0314 0.0183
Hydrocarbons
Ethene mg/L ND ND
Methane mg/L 0.04 0.042
Ethane mg/L ND ND
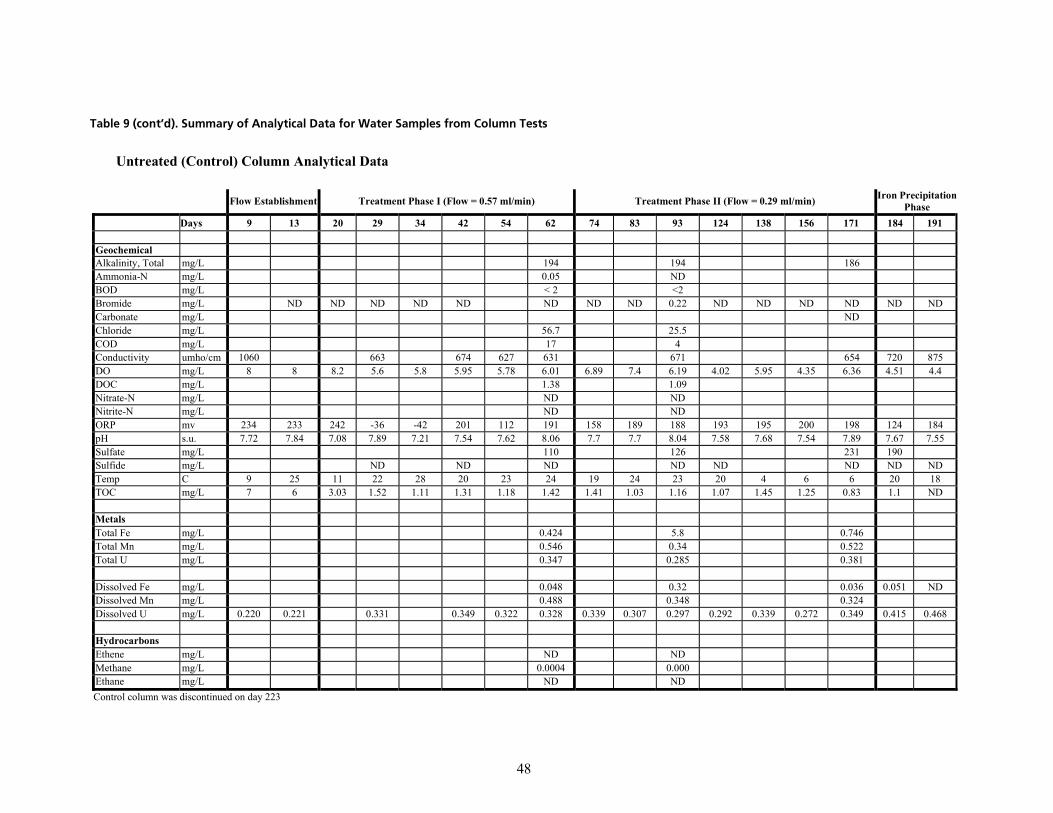
= =48
q~ÄäÉ=V=EÅçåíÛÇFK=pìãã~êó=çÑ=^å~äóíáÅ~ä=a~í~=Ñçê=t~íÉê=p~ãéäÉë=Ñêçã=`çäìãå=qÉëíë=
Untreated (Control) Column Analytical Data
Flow Establishment Treatment Phase I (Flow = 0.57 ml/min) Treatment Phase II (Flow = 0.29 ml/min) Iron Precipitation Phase
Days 9 13 20 29 34 42 54 62 74 83 93 124 138 156 171 184 191
Geochemical Alkalinity, Total mg/L 194 194 186 Ammonia-N mg/L 0.05 ND BOD mg/L < 2 <2 Bromide mg/L ND ND ND ND ND ND ND ND 0.22 ND ND ND ND ND ND Carbonate mg/L ND Chloride mg/L 56.7 25.5 COD mg/L 17 4 Conductivity umho/cm 1060 663 674 627 631 671 654 720 875 DO mg/L 8 8 8.2 5.6 5.8 5.95 5.78 6.01 6.89 7.4 6.19 4.02 5.95 4.35 6.36 4.51 4.4 DOC mg/L 1.38 1.09 Nitrate-N mg/L ND ND Nitrite-N mg/L ND ND ORP mv 234 233 242 -36 -42 201 112 191 158 189 188 193 195 200 198 124 184 pH s.u. 7.72 7.84 7.08 7.89 7.21 7.54 7.62 8.06 7.7 7.7 8.04 7.58 7.68 7.54 7.89 7.67 7.55 Sulfate mg/L 110 126 231 190 Sulfide mg/L ND ND ND ND ND ND ND ND Temp C 9 25 11 22 28 20 23 24 19 24 23 20 4 6 6 20 18 TOC mg/L 7 6 3.03 1.52 1.11 1.31 1.18 1.42 1.41 1.03 1.16 1.07 1.45 1.25 0.83 1.1 ND
Metals Total Fe mg/L 0.424 5.8 0.746 Total Mn mg/L 0.546 0.34 0.522 Total U mg/L 0.347 0.285 0.381
Dissolved Fe mg/L 0.048 0.32 0.036 0.051 ND Dissolved Mn mg/L 0.488 0.348 0.324 Dissolved U mg/L 0.220 0.221 0.331 0.349 0.322 0.328 0.339 0.307 0.297 0.292 0.339 0.272 0.349 0.415 0.468
Hydrocarbons Ethene mg/L ND ND Methane mg/L 0.0004 0.000 Ethane mg/L ND ND Control column was discontinued on day 223
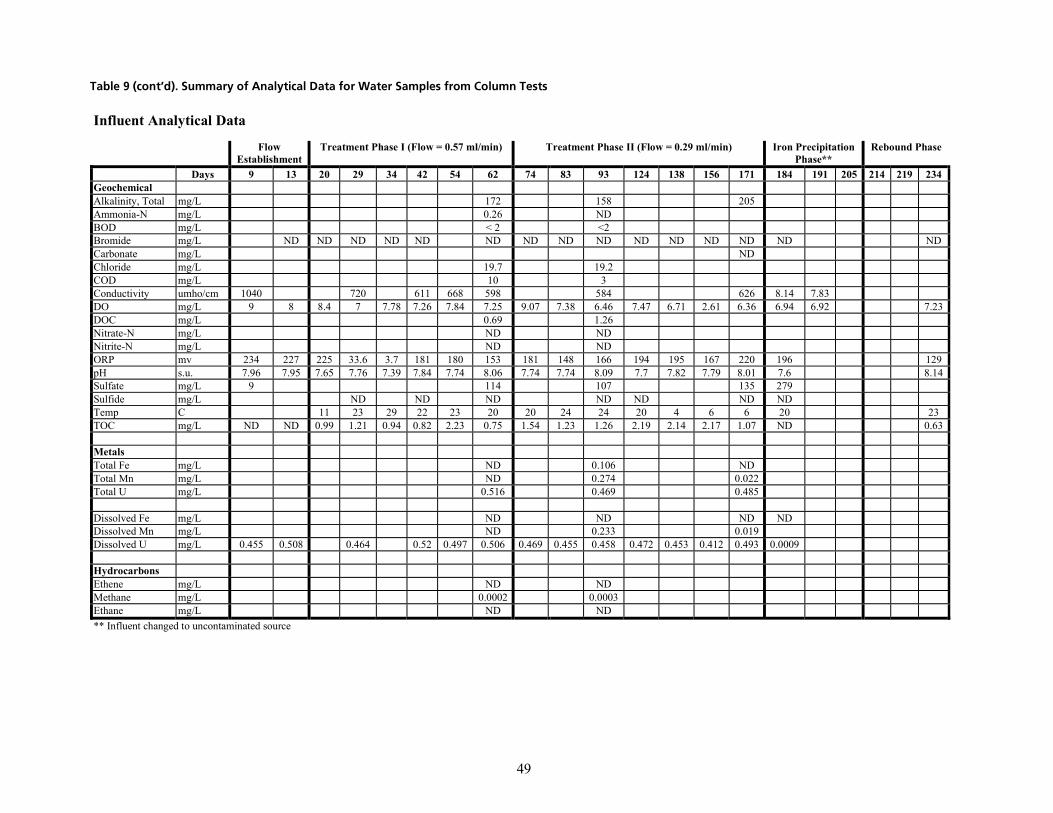
= =49
q~ÄäÉ=V=EÅçåíÛÇFK=pìãã~êó=çÑ=^å~äóíáÅ~ä=a~í~=Ñçê=t~íÉê=p~ãéäÉë=Ñêçã=`çäìãå=qÉëíë=
Influent Analytical Data Flow
Establishment Treatment Phase I (Flow = 0.57 ml/min) Treatment Phase II (Flow = 0.29 ml/min) Iron Precipitation
Phase** Rebound Phase
Days 9 13 20 29 34 42 54 62 74 83 93 124 138 156 171 184 191 205 214 219 234 Geochemical Alkalinity, Total mg/L 172 158 205 Ammonia-N mg/L 0.26 ND BOD mg/L < 2 <2 Bromide mg/L ND ND ND ND ND ND ND ND ND ND ND ND ND ND ND Carbonate mg/L ND Chloride mg/L 19.7 19.2 COD mg/L 10 3 Conductivity umho/cm 1040 720 611 668 598 584 626 8.14 7.83 DO mg/L 9 8 8.4 7 7.78 7.26 7.84 7.25 9.07 7.38 6.46 7.47 6.71 2.61 6.36 6.94 6.92 7.23DOC mg/L 0.69 1.26 Nitrate-N mg/L ND ND Nitrite-N mg/L ND ND ORP mv 234 227 225 33.6 3.7 181 180 153 181 148 166 194 195 167 220 196 129 pH s.u. 7.96 7.95 7.65 7.76 7.39 7.84 7.74 8.06 7.74 7.74 8.09 7.7 7.82 7.79 8.01 7.6 8.14Sulfate mg/L 9 114 107 135 279 Sulfide mg/L ND ND ND ND ND ND ND Temp C 11 23 29 22 23 20 20 24 24 20 4 6 6 20 23 TOC mg/L ND ND 0.99 1.21 0.94 0.82 2.23 0.75 1.54 1.23 1.26 2.19 2.14 2.17 1.07 ND 0.63
Metals Total Fe mg/L ND 0.106 ND Total Mn mg/L ND 0.274 0.022 Total U mg/L 0.516 0.469 0.485
Dissolved Fe mg/L ND ND ND ND Dissolved Mn mg/L ND 0.233 0.019 Dissolved U mg/L 0.455 0.508 0.464 0.52 0.497 0.506 0.469 0.455 0.458 0.472 0.453 0.412 0.493 0.0009
Hydrocarbons Ethene mg/L ND ND Methane mg/L 0.0002 0.0003 Ethane mg/L ND ND ** Influent changed to uncontaminated source
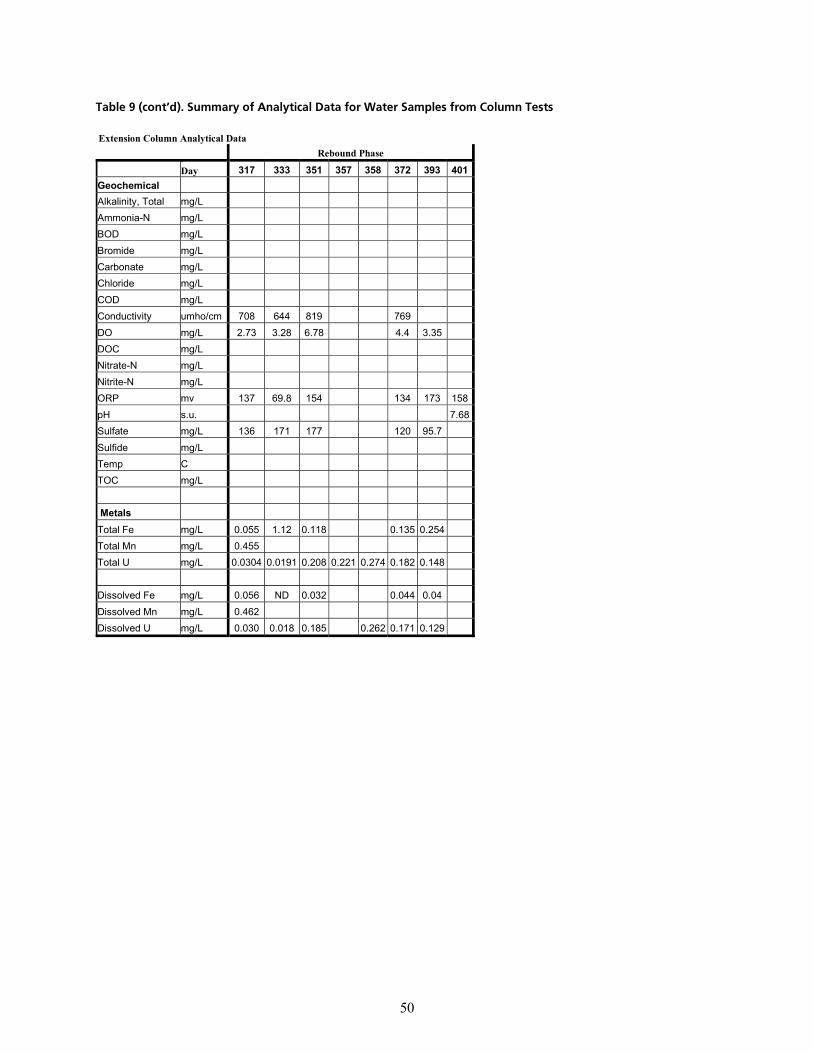
= =50
q~ÄäÉ=V=EÅçåíÛÇFK=pìãã~êó=çÑ=^å~äóíáÅ~ä=a~í~=Ñçê=t~íÉê=p~ãéäÉë=Ñêçã=`çäìãå=qÉëíë=
Extension Column Analytical Data Rebound Phase
Day 317 333 351 357 358 372 393 401Geochemical Alkalinity, Total mg/L Ammonia-N mg/L BOD mg/L Bromide mg/L Carbonate mg/L Chloride mg/L COD mg/L Conductivity umho/cm 708 644 819 769 DO mg/L 2.73 3.28 6.78 4.4 3.35 DOC mg/L Nitrate-N mg/L Nitrite-N mg/L ORP mv 137 69.8 154 134 173 158pH s.u. 7.68Sulfate mg/L 136 171 177 120 95.7 Sulfide mg/L Temp C TOC mg/L Metals Total Fe mg/L 0.055 1.12 0.118 0.135 0.254 Total Mn mg/L 0.455 Total U mg/L 0.0304 0.0191 0.208 0.221 0.274 0.182 0.148 Dissolved Fe mg/L 0.056 ND 0.032 0.044 0.04 Dissolved Mn mg/L 0.462 Dissolved U mg/L 0.030 0.018 0.185 0.262 0.171 0.129
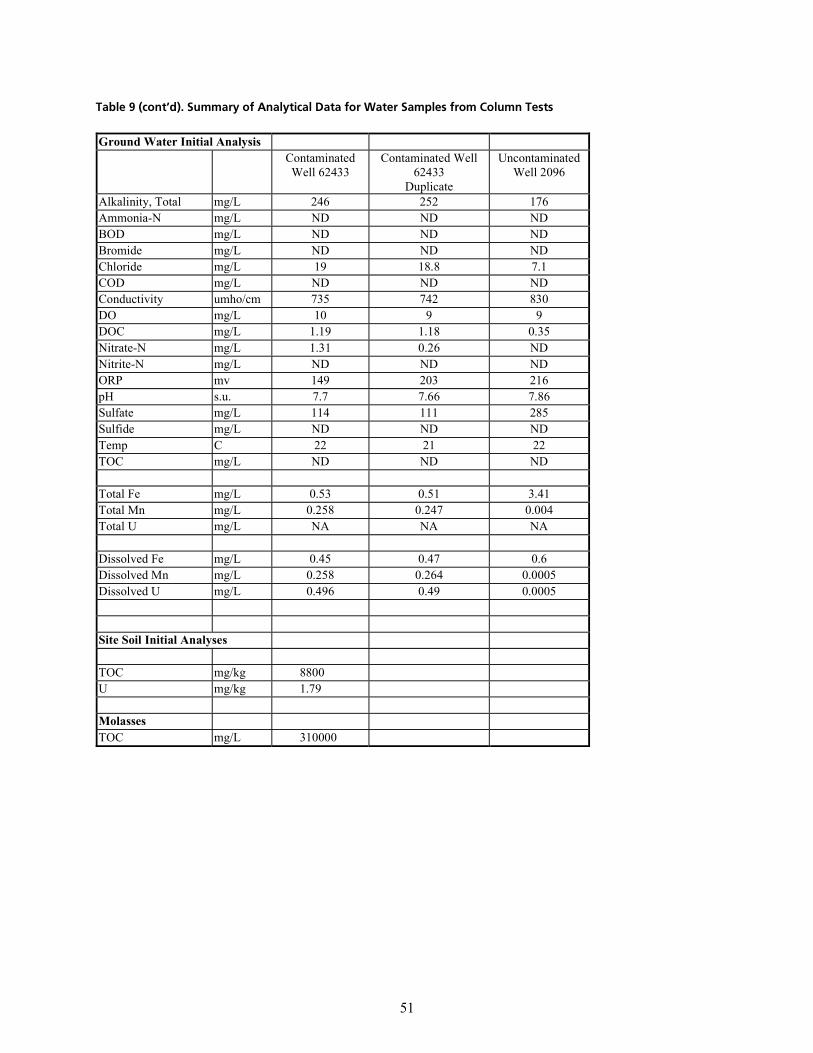
= =51
q~ÄäÉ=V=EÅçåíÛÇFK=pìãã~êó=çÑ=^å~äóíáÅ~ä=a~í~=Ñçê=t~íÉê=p~ãéäÉë=Ñêçã=`çäìãå=qÉëíë=
Ground Water Initial Analysis Contaminated
Well 62433 Contaminated Well
62433 Duplicate
Uncontaminated Well 2096
Alkalinity, Total mg/L 246 252 176 Ammonia-N mg/L ND ND ND BOD mg/L ND ND ND Bromide mg/L ND ND ND Chloride mg/L 19 18.8 7.1 COD mg/L ND ND ND Conductivity umho/cm 735 742 830 DO mg/L 10 9 9 DOC mg/L 1.19 1.18 0.35 Nitrate-N mg/L 1.31 0.26 ND Nitrite-N mg/L ND ND ND ORP mv 149 203 216 pH s.u. 7.7 7.66 7.86 Sulfate mg/L 114 111 285 Sulfide mg/L ND ND ND Temp C 22 21 22 TOC mg/L ND ND ND
Total Fe mg/L 0.53 0.51 3.41 Total Mn mg/L 0.258 0.247 0.004 Total U mg/L NA NA NA
Dissolved Fe mg/L 0.45 0.47 0.6 Dissolved Mn mg/L 0.258 0.264 0.0005 Dissolved U mg/L 0.496 0.49 0.0005
Site Soil Initial Analyses
TOC mg/kg 8800 U mg/kg 1.79
Molasses TOC mg/L 310000
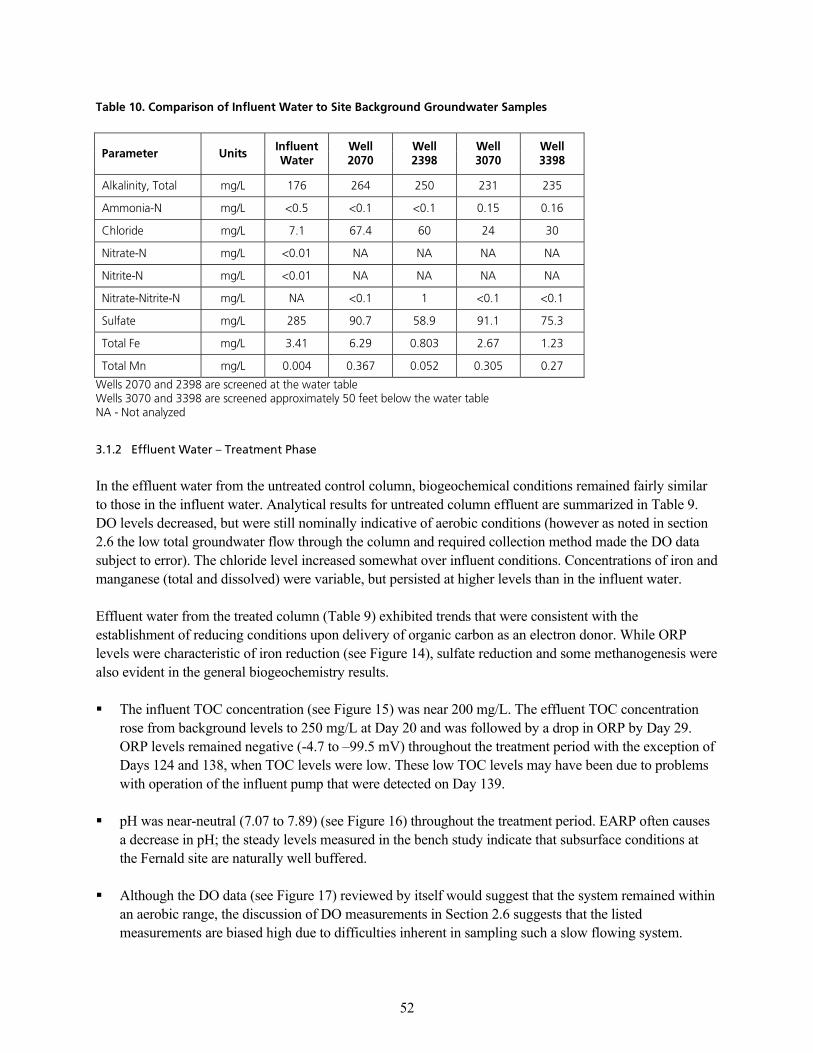
= =52
q~ÄäÉ=NMK=`çãé~êáëçå=çÑ=fåÑäìÉåí=t~íÉê=íç=páíÉ=_~ÅâÖêçìåÇ=dêçìåÇï~íÉê=p~ãéäÉë=
m~ê~ãÉíÉê= råáíë=fåÑäìÉåí=t~íÉê=
tÉää=OMTM=
tÉää=OPVU=
tÉää=PMTM=
tÉää=PPVU=
^äâ~äáåáíóI=qçí~ä== ãÖLi= NTS= OSQ= ORM= OPN= OPR=
^ããçåá~Jk= ãÖLi= YMKR= YMKN= YMKN= MKNR= MKNS=
`ÜäçêáÇÉ= ãÖLi= TKN= STKQ= SM= OQ= PM=
káíê~íÉJk= ãÖLi= YMKMN= k^= k^= k^= k^=
káíêáíÉJk= ãÖLi= YMKMN= k^= k^= k^= k^=
káíê~íÉJkáíêáíÉJk= ãÖLi= k^= YMKN= N= YMKN= YMKN=
pìäÑ~íÉ= ãÖLi= OUR= VMKT= RUKV= VNKN= TRKP=
qçí~ä=cÉ= ãÖLi= PKQN= SKOV= MKUMP= OKST= NKOP=
qçí~ä=jå= ãÖLi= MKMMQ= MKPST= MKMRO= MKPMR= MKOT=
tÉääë=OMTM=~åÇ=OPVU=~êÉ=ëÅêÉÉåÉÇ=~í=íÜÉ=ï~íÉê=í~ÄäÉ=tÉääë=PMTM=~åÇ=PPVU=~êÉ=ëÅêÉÉåÉÇ=~ééêçñáã~íÉäó=RM=ÑÉÉí=ÄÉäçï=íÜÉ=ï~íÉê=í~ÄäÉ=k^=J=kçí=~å~äóòÉÇ=
PKNKO bÑÑäìÉåí=t~íÉê=Ó=qêÉ~íãÉåí=mÜ~ëÉ=
In the effluent water from the untreated control column, biogeochemical conditions remained fairly similar to those in the influent water. Analytical results for untreated column effluent are summarized in Table 9. DO levels decreased, but were still nominally indicative of aerobic conditions (however as noted in section 2.6 the low total groundwater flow through the column and required collection method made the DO data subject to error). The chloride level increased somewhat over influent conditions. Concentrations of iron and manganese (total and dissolved) were variable, but persisted at higher levels than in the influent water.
Effluent water from the treated column (Table 9) exhibited trends that were consistent with the establishment of reducing conditions upon delivery of organic carbon as an electron donor. While ORP levels were characteristic of iron reduction (see Figure 14), sulfate reduction and some methanogenesis were also evident in the general biogeochemistry results.
The influent TOC concentration (see Figure 15) was near 200 mg/L. The effluent TOC concentration rose from background levels to 250 mg/L at Day 20 and was followed by a drop in ORP by Day 29. ORP levels remained negative (-4.7 to –99.5 mV) throughout the treatment period with the exception of Days 124 and 138, when TOC levels were low. These low TOC levels may have been due to problems with operation of the influent pump that were detected on Day 139.
pH was near-neutral (7.07 to 7.89) (see Figure 16) throughout the treatment period. EARP often causes a decrease in pH; the steady levels measured in the bench study indicate that subsurface conditions at the Fernald site are naturally well buffered.
Although the DO data (see Figure 17) reviewed by itself would suggest that the system remained within an aerobic range, the discussion of DO measurements in Section 2.6 suggests that the listed measurements are biased high due to difficulties inherent in sampling such a slow flowing system.
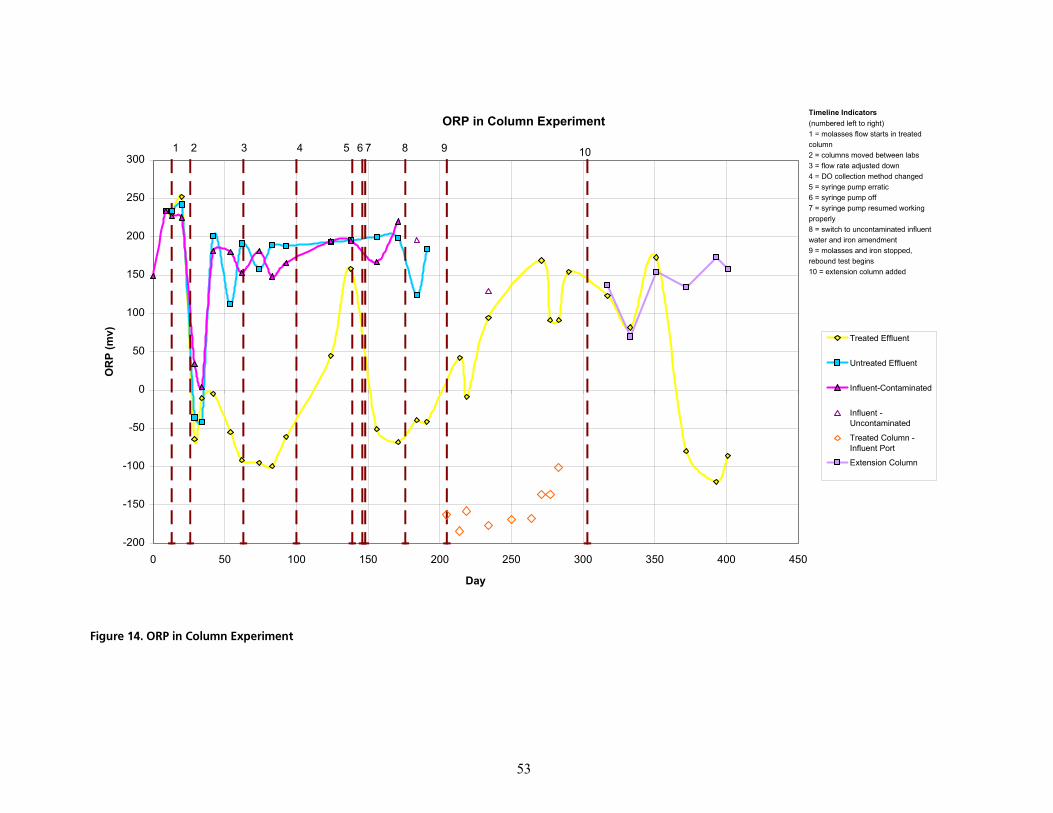
= =53
ORP in Column Experiment
-200
-150
-100
-50
0
50
100
150
200
250
300
0 50 100 150 200 250 300 350 400 450
Day
OR
P (m
v) Treated Effluent
Untreated Effluent
Influent-Contaminated
Influent -Uncontaminated
Treated Column -Influent Port
Extension Column
1 5432 876 9 10
Timeline Indicators (numbered left to right)1 = molasses flow starts in treated column2 = columns moved between labs3 = flow rate adjusted down4 = DO collection method changed5 = syringe pump erratic6 = syringe pump off7 = syringe pump resumed working properly8 = switch to uncontaminated influent water and iron amendment9 = molasses and iron stopped, rebound test begins10 = extension column added
cáÖìêÉ=NQK=lom=áå=`çäìãå=bñéÉêáãÉåí=
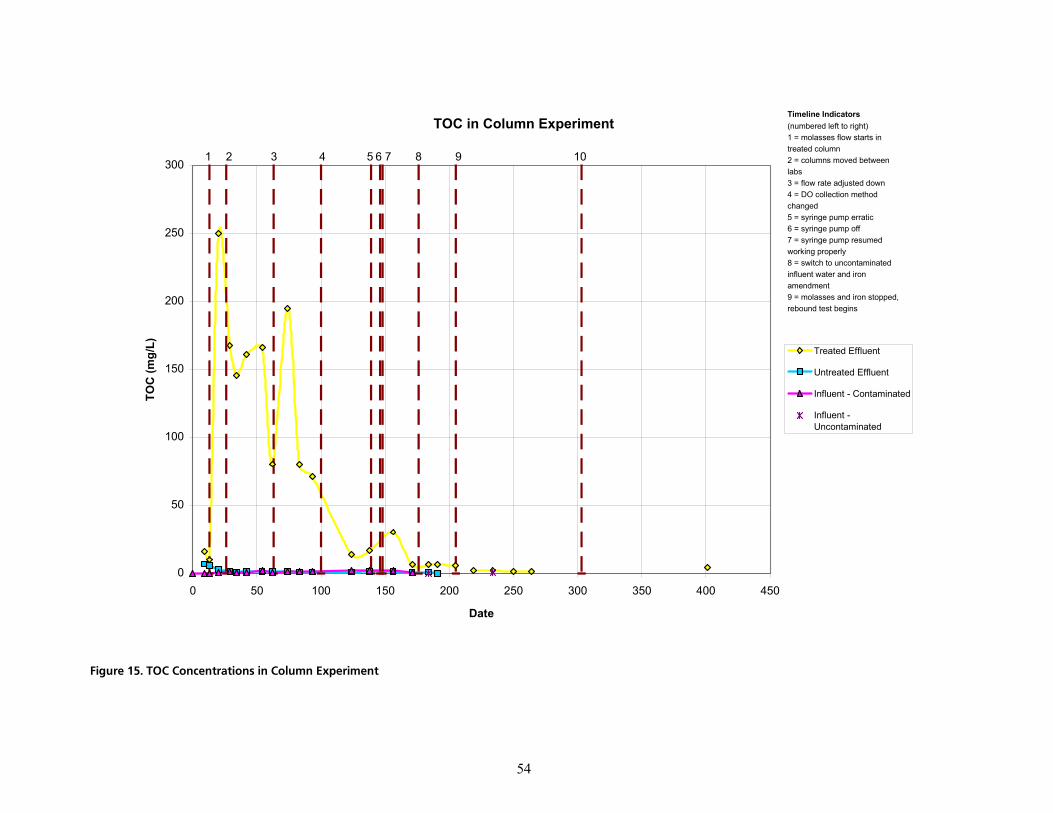
= =54
TOC in Column Experiment
0
50
100
150
200
250
300
0 50 100 150 200 250 300 350 400 450
Date
TOC
(mg/
L) Treated Effluent
Untreated Effluent
Influent - Contaminated
Influent -Uncontaminated
1 5432 86 7 9 10
Timeline Indicators (numbered left to right)1 = molasses flow starts in treated column2 = columns moved between labs3 = flow rate adjusted down4 = DO collection method changed5 = syringe pump erratic6 = syringe pump off7 = syringe pump resumed working properly8 = switch to uncontaminated influent water and iron amendment9 = molasses and iron stopped, rebound test begins
cáÖìêÉ=NRK=ql`=`çåÅÉåíê~íáçåë=áå=`çäìãå=bñéÉêáãÉåí=
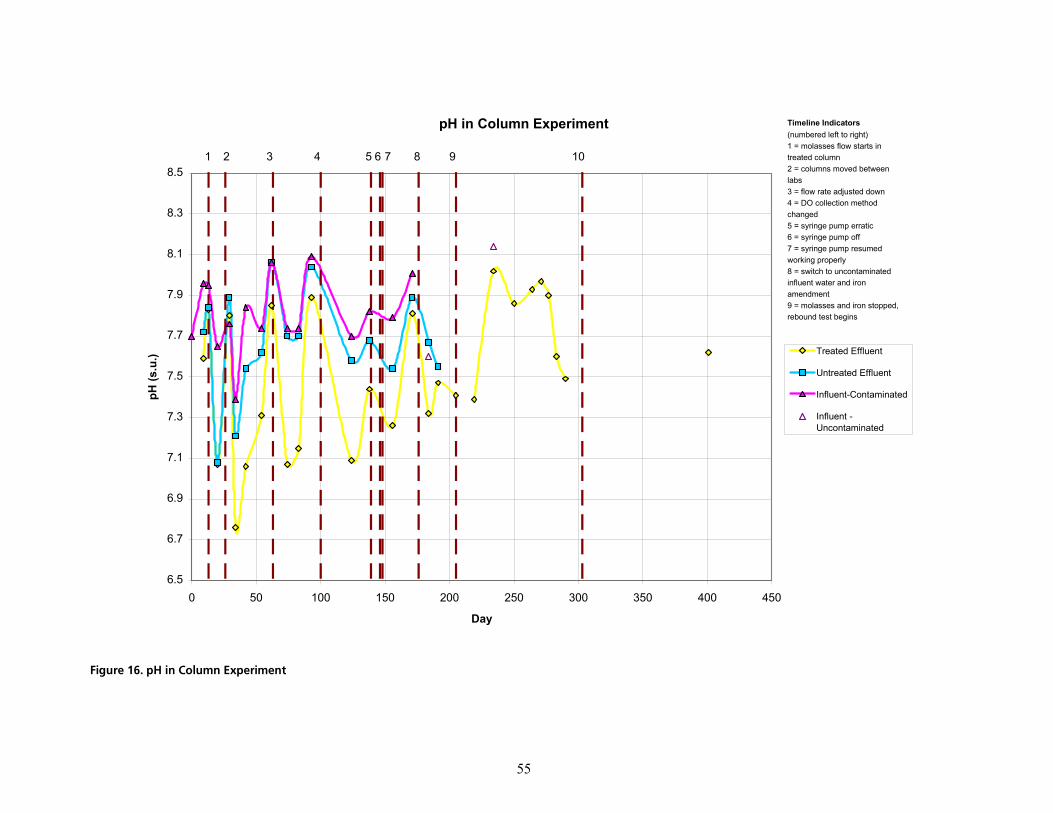
= =55
pH in Column Experiment
6.5
6.7
6.9
7.1
7.3
7.5
7.7
7.9
8.1
8.3
8.5
0 50 100 150 200 250 300 350 400 450
Day
pH (s
.u.) Treated Effluent
Untreated Effluent
Influent-Contaminated
Influent -Uncontaminated
1 5432 876 9 10
Timeline Indicators (numbered left to right)1 = molasses flow starts in treated column2 = columns moved between labs3 = flow rate adjusted down4 = DO collection method changed5 = syringe pump erratic6 = syringe pump off7 = syringe pump resumed working properly8 = switch to uncontaminated influent water and iron amendment9 = molasses and iron stopped, rebound test begins
cáÖìêÉ=NSK=ée=áå=`çäìãå=bñéÉêáãÉåí=
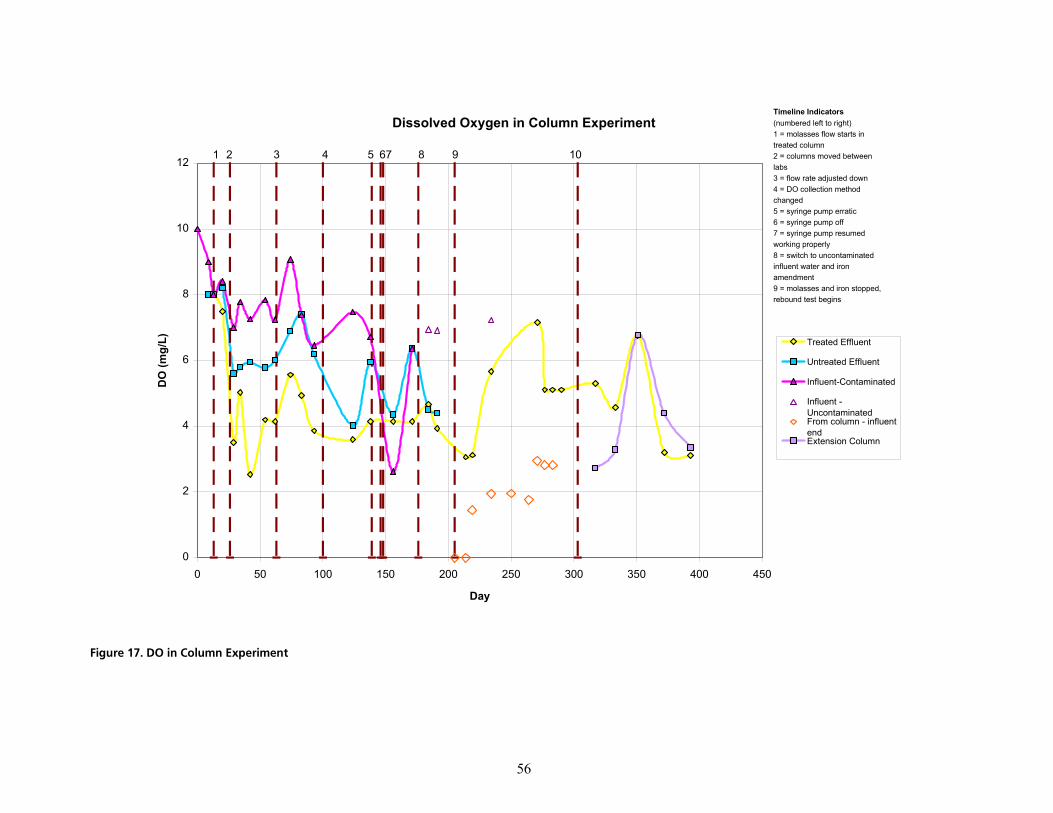
= =56
Dissolved Oxygen in Column Experiment
0
2
4
6
8
10
12
0 50 100 150 200 250 300 350 400 450
Day
DO
(mg/
L) Treated Effluent
Untreated Effluent
Influent-Contaminated
Influent -UncontaminatedFrom column - influentendExtension Column
1 5432 876 9 10
Timeline Indicators (numbered left to right)1 = molasses flow starts in treated column2 = columns moved between labs3 = flow rate adjusted down4 = DO collection method changed5 = syringe pump erratic6 = syringe pump off7 = syringe pump resumed working properly8 = switch to uncontaminated influent water and iron amendment9 = molasses and iron stopped, rebound test begins
cáÖìêÉ=NTK=al=áå=`çäìãå=bñéÉêáãÉåí=
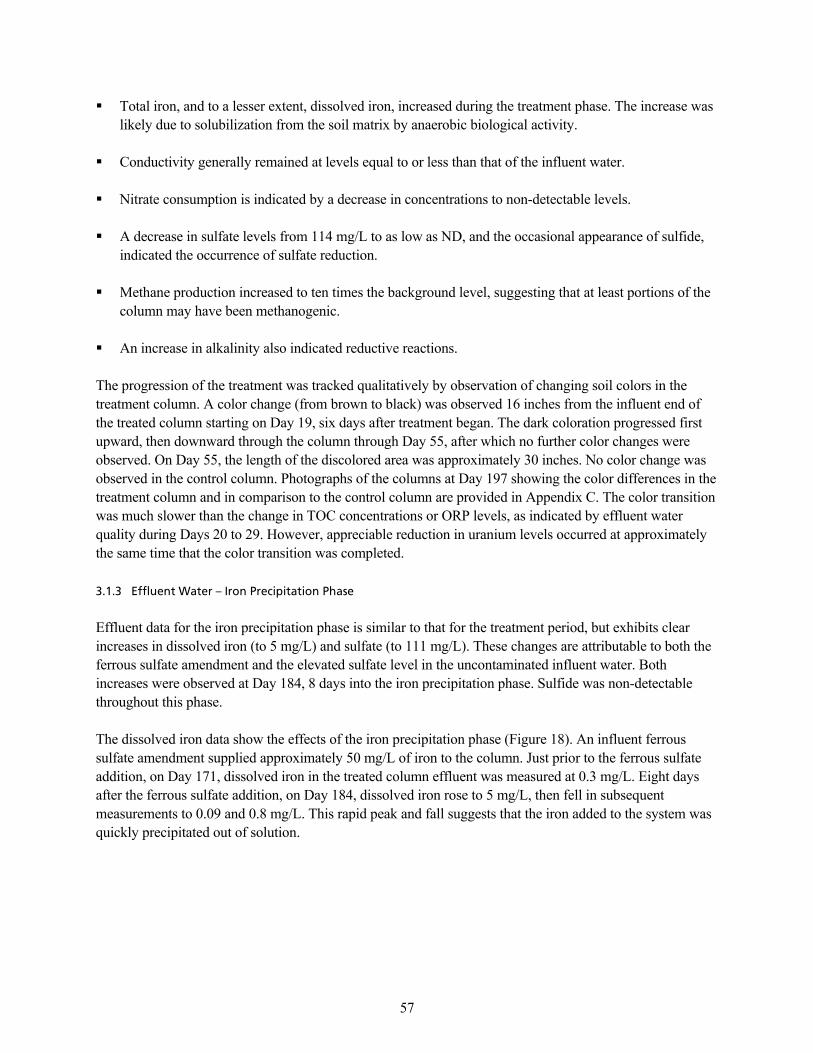
= =57
Total iron, and to a lesser extent, dissolved iron, increased during the treatment phase. The increase was likely due to solubilization from the soil matrix by anaerobic biological activity.
Conductivity generally remained at levels equal to or less than that of the influent water.
Nitrate consumption is indicated by a decrease in concentrations to non-detectable levels.
A decrease in sulfate levels from 114 mg/L to as low as ND, and the occasional appearance of sulfide, indicated the occurrence of sulfate reduction.
Methane production increased to ten times the background level, suggesting that at least portions of the column may have been methanogenic.
An increase in alkalinity also indicated reductive reactions.
The progression of the treatment was tracked qualitatively by observation of changing soil colors in the treatment column. A color change (from brown to black) was observed 16 inches from the influent end of the treated column starting on Day 19, six days after treatment began. The dark coloration progressed first upward, then downward through the column through Day 55, after which no further color changes were observed. On Day 55, the length of the discolored area was approximately 30 inches. No color change was observed in the control column. Photographs of the columns at Day 197 showing the color differences in the treatment column and in comparison to the control column are provided in Appendix C. The color transition was much slower than the change in TOC concentrations or ORP levels, as indicated by effluent water quality during Days 20 to 29. However, appreciable reduction in uranium levels occurred at approximately the same time that the color transition was completed.
PKNKP bÑÑäìÉåí=t~íÉê=Ó=fêçå=mêÉÅáéáí~íáçå=mÜ~ëÉ=
Effluent data for the iron precipitation phase is similar to that for the treatment period, but exhibits clear increases in dissolved iron (to 5 mg/L) and sulfate (to 111 mg/L). These changes are attributable to both the ferrous sulfate amendment and the elevated sulfate level in the uncontaminated influent water. Both increases were observed at Day 184, 8 days into the iron precipitation phase. Sulfide was non-detectable throughout this phase.
The dissolved iron data show the effects of the iron precipitation phase (Figure 18). An influent ferrous sulfate amendment supplied approximately 50 mg/L of iron to the column. Just prior to the ferrous sulfate addition, on Day 171, dissolved iron in the treated column effluent was measured at 0.3 mg/L. Eight days after the ferrous sulfate addition, on Day 184, dissolved iron rose to 5 mg/L, then fell in subsequent measurements to 0.09 and 0.8 mg/L. This rapid peak and fall suggests that the iron added to the system was quickly precipitated out of solution.
= =58
Iron in Treated Column Effluent
0
1
2
3
4
5
6
7
8
9
0 50 100 150 200 250 300 350 400 450
Day
Tota
l Fe,
mg/
L
Total Iron
Dissolved Iron
1 2 5 6 743 8 9 10
Timeline Indicators (numbered left to right)1 = molasses flow starts in treated column2 = columns moved between labs3 = flow rate adjusted down4 = DO collection method changed5 = syringe pump erratic6 = syringe pump off7 = syringe pump resumed working properly8 = switch to uncontaminated influent water and iron amendment9 = molasses and iron stopped, rebound test begins10 = extension column added
cáÖìêÉ=NUK=fêçå=áå=qêÉ~íÉÇ=`çäìãå=bÑÑäìÉåí
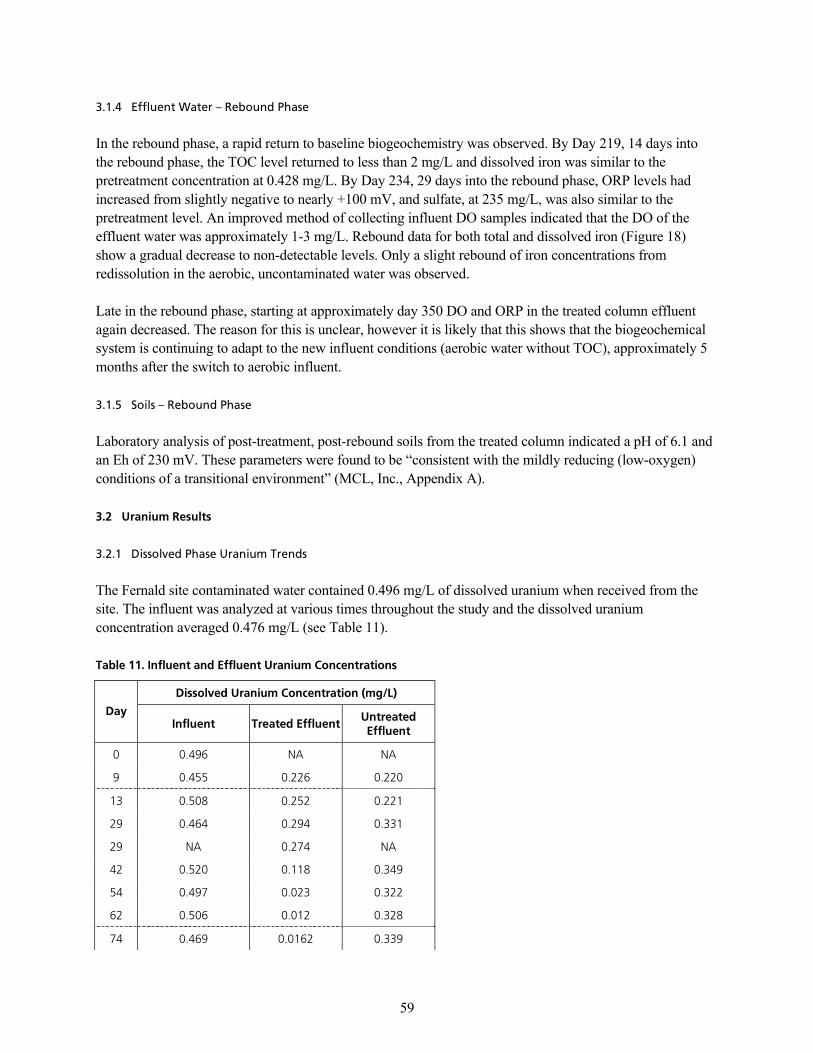
= =59
PKNKQ bÑÑäìÉåí=t~íÉê=Ó=oÉÄçìåÇ=mÜ~ëÉ=
In the rebound phase, a rapid return to baseline biogeochemistry was observed. By Day 219, 14 days into the rebound phase, the TOC level returned to less than 2 mg/L and dissolved iron was similar to the pretreatment concentration at 0.428 mg/L. By Day 234, 29 days into the rebound phase, ORP levels had increased from slightly negative to nearly +100 mV, and sulfate, at 235 mg/L, was also similar to the pretreatment level. An improved method of collecting influent DO samples indicated that the DO of the effluent water was approximately 1-3 mg/L. Rebound data for both total and dissolved iron (Figure 18) show a gradual decrease to non-detectable levels. Only a slight rebound of iron concentrations from redissolution in the aerobic, uncontaminated water was observed.
Late in the rebound phase, starting at approximately day 350 DO and ORP in the treated column effluent again decreased. The reason for this is unclear, however it is likely that this shows that the biogeochemical system is continuing to adapt to the new influent conditions (aerobic water without TOC), approximately 5 months after the switch to aerobic influent.
PKNKR pçáäë=Ó=oÉÄçìåÇ=mÜ~ëÉ=
Laboratory analysis of post-treatment, post-rebound soils from the treated column indicated a pH of 6.1 and an Eh of 230 mV. These parameters were found to be “consistent with the mildly reducing (low-oxygen) conditions of a transitional environment” (MCL, Inc., Appendix A).
PKO rê~åáìã=oÉëìäíë=
PKOKN aáëëçäîÉÇ=mÜ~ëÉ=rê~åáìã=qêÉåÇë==
The Fernald site contaminated water contained 0.496 mg/L of dissolved uranium when received from the site. The influent was analyzed at various times throughout the study and the dissolved uranium concentration averaged 0.476 mg/L (see Table 11).
q~ÄäÉ=NNK=fåÑäìÉåí=~åÇ=bÑÑäìÉåí=rê~åáìã=`çåÅÉåíê~íáçåë=
aáëëçäîÉÇ=rê~åáìã=`çåÅÉåíê~íáçå=EãÖLiF=
a~ó=fåÑäìÉåí= qêÉ~íÉÇ=bÑÑäìÉåí råíêÉ~íÉÇ=
bÑÑäìÉåí=
M= MKQVS= k^= k^=
V= MKQRR= MKOOS= MKOOM=
NP= MKRMU= MKORO= MKOON=
OV= MKQSQ= MKOVQ= MKPPN=
OV= k^= MKOTQ= k^=
QO= MKROM= MKNNU= MKPQV=
RQ= MKQVT= MKMOP= MKPOO=
SO= MKRMS= MKMNO= MKPOU=
TQ= MKQSV= MKMNSO= MKPPV=
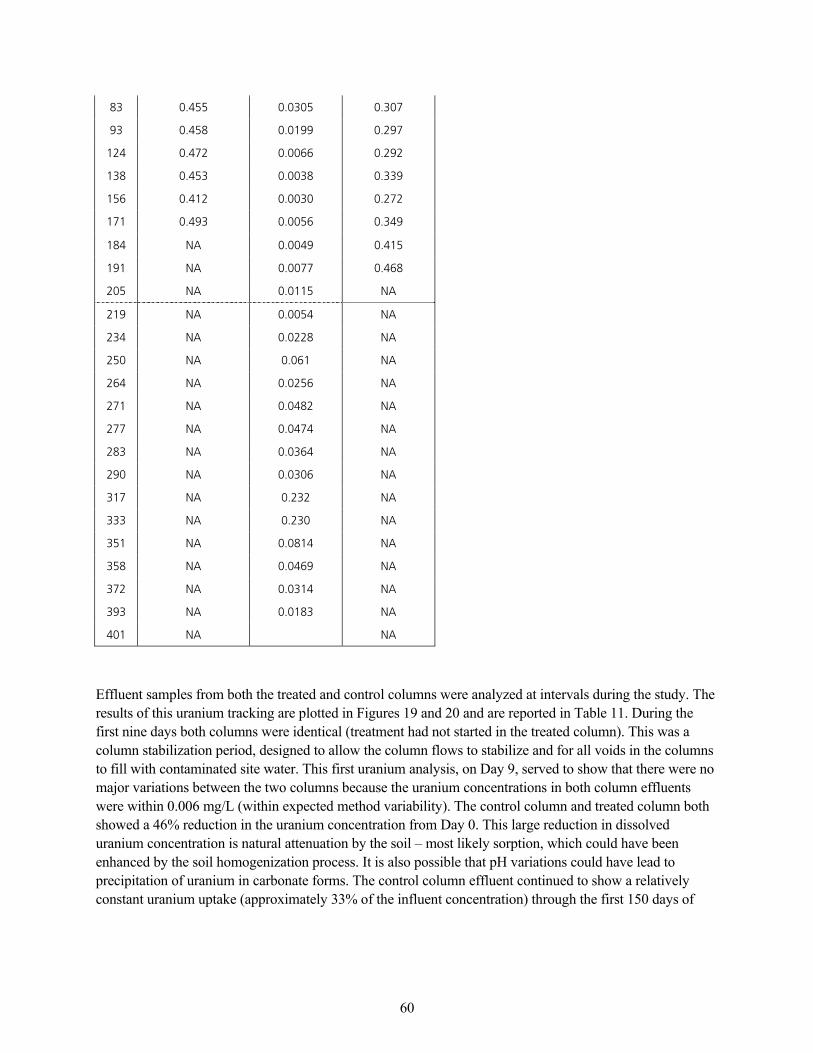
= =60
UP= MKQRR= MKMPMR= MKPMT=
VP= MKQRU= MKMNVV= MKOVT=
NOQ= MKQTO= MKMMSS= MKOVO=
NPU= MKQRP= MKMMPU= MKPPV=
NRS= MKQNO= MKMMPM= MKOTO=
NTN= MKQVP= MKMMRS= MKPQV=
NUQ= k^= MKMMQV= MKQNR=
NVN= k^= MKMMTT= MKQSU=
OMR= k^= MKMNNR= k^=
ONV= k^= MKMMRQ= k^=
OPQ= k^= MKMOOU= k^=
ORM= k^= MKMSN= k^=
OSQ= k^= MKMORS= k^=
OTN= k^= MKMQUO= k^=
OTT= k^= MKMQTQ= k^=
OUP= k^= MKMPSQ= k^=
OVM= k^= MKMPMS= k^=
PNT= k^= MKOPO= k^=
PPP= k^= MKOPM= k^=
PRN= k^= MKMUNQ= k^=
PRU= k^= MKMQSV= k^=
PTO= k^= MKMPNQ= k^=
PVP= k^= MKMNUP= k^=
QMN= k^= = k^=
Effluent samples from both the treated and control columns were analyzed at intervals during the study. The results of this uranium tracking are plotted in Figures 19 and 20 and are reported in Table 11. During the first nine days both columns were identical (treatment had not started in the treated column). This was a column stabilization period, designed to allow the column flows to stabilize and for all voids in the columns to fill with contaminated site water. This first uranium analysis, on Day 9, served to show that there were no major variations between the two columns because the uranium concentrations in both column effluents were within 0.006 mg/L (within expected method variability). The control column and treated column both showed a 46% reduction in the uranium concentration from Day 0. This large reduction in dissolved uranium concentration is natural attenuation by the soil – most likely sorption, which could have been enhanced by the soil homogenization process. It is also possible that pH variations could have lead to precipitation of uranium in carbonate forms. The control column effluent continued to show a relatively constant uranium uptake (approximately 33% of the influent concentration) through the first 150 days of
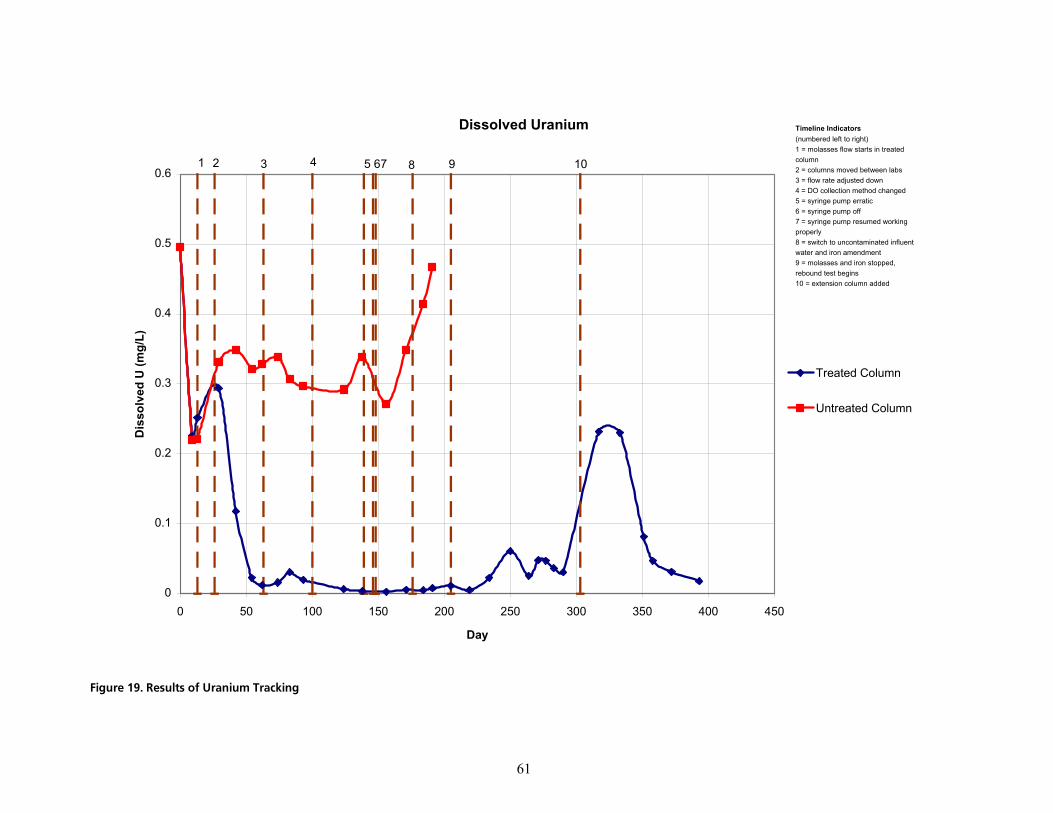
= =61
Dissolved Uranium
0
0.1
0.2
0.3
0.4
0.5
0.6
0 50 100 150 200 250 300 350 400 450
Day
Dis
solv
ed U
(mg/
L)
Treated Column
Untreated Column
1 2 85 6743
Timeline Indicators (numbered left to right)1 = molasses flow starts in treated column2 = columns moved between labs3 = flow rate adjusted down4 = DO collection method changed5 = syringe pump erratic6 = syringe pump off7 = syringe pump resumed working properly8 = switch to uncontaminated influent water and iron amendment9 = molasses and iron stopped, rebound test begins10 = extension column added
9 10
cáÖìêÉ=NVK=oÉëìäíë=çÑ=rê~åáìã=qê~ÅâáåÖ=
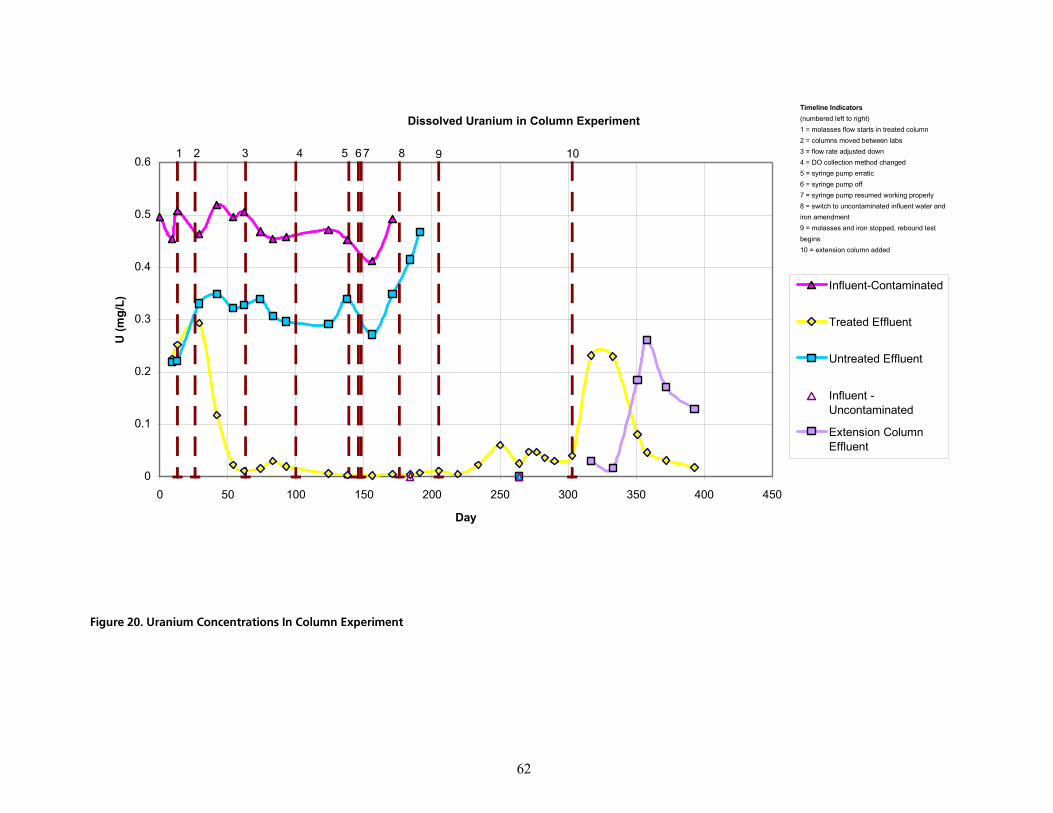
= =62
Dissolved Uranium in Column Experiment
0
0.1
0.2
0.3
0.4
0.5
0.6
0 50 100 150 200 250 300 350 400 450
Day
U (m
g/L)
Influent-Contaminated
Treated Effluent
Untreated Effluent
Influent -Uncontaminated
Extension ColumnEffluent
1 5432 876 9 10
Timeline Indicators (numbered left to right)1 = molasses flow starts in treated column2 = columns moved between labs3 = flow rate adjusted down4 = DO collection method changed5 = syringe pump erratic6 = syringe pump off7 = syringe pump resumed working properly8 = switch to uncontaminated influent water and iron amendment9 = molasses and iron stopped, rebound test begins10 = extension column added
=
cáÖìêÉ=OMK=rê~åáìã=`çåÅÉåíê~íáçåë=få=`çäìãå=bñéÉêáãÉåí=
= =63
operation. After about 150 days the control column effluent began to show increased dissolved uranium concentrations as the natural sorption of the dissolved uranium decreased and the control effluent and influent uranium concentrations converged.
Molasses treatment began in the treated column on Day 9 but significant differences between the treated and control column did not appear until sometime between Day 39 and Day 42, when the uranium concentration was observed to be 0.231 mg/L lower in the treated column. Lag times in treatment are typically experienced in IRZ systems due to the time required for the establishment of anaerobic conditions (Suthersan et al., 2002b). Around Day 62 the treated column stabilized at a low uranium effluent concentration. For the remainder of the treatment phase, from Day 62 to Day 177, the effluent from the treated column contained an average of 0.012 mg/L of dissolved uranium. The data collected during the iron precipitation phase (Day 177 to 205) is not substantially different from the treatment period (three data points averaging 0.008 mg/l). On Day 205 the molasses treatment ended and the rebound phase with only uncontaminated site water flowing through the treated soil began. After two weeks of uncontaminated influent, the treated column effluent was still relatively stable. By Day 234 the dissolved uranium in the effluent had risen to twice the average effluent concentration observed during the treatment phase. From Day 234 to Day 290 the effluent contained an average of 0.040 mg/L dissolved uranium. At the next analysis on Day 317 and the subsequent analysis on Day 333, the uranium levels had risen to more than 5 times the treatment phase average, and well above the 30 µg/L treatment standard. However these values were still substantially below the treatment phase influent concentrations. Between day 333 and 351 concentrations in the treated column effluent began to decline again and continued to decline through three more sampling rounds until again reaching treatment standards at day 393.
Data from the extension column test modification is only available starting on day 317 (approximately two weeks after the extension column was installed). This limited dataset seems to show that the brief “desorption slug” that exited the treated column also traveled through the extension column. Since the extension column modification to the experimental design occurred after the majority of the iron exited from the treatment column little iron oxyhydroxide was available for sorption. Further, the residence time in the extension column may have been insufficient to substantially attenuate the uranium.
PKOKO pçäáÇ=mÜ~ëÉ=rê~åáìã=j~ëë=~åÇ=j~ëë=_~ä~åÅÉ=
Since the column test had been operated for much longer than the originally planned 4-6 month study duration and the due date of our DOE report was fast approaching (despite the granting of one time extension), it was necessary to obtain the solid phase samples for speciation on Day 337 to meet project deadlines. However the plan was modified to allow these samples to be obtained while still continuing with the rebound testing. Thus on Day 337, a 1" core of soil the length of the treated column was collected for speciation. Five sections along the length of the soil sample (at intervals defined in Appendix A) were analyzed for total uranium. The uranium results are plotted in Figure 21. As expected, the uranium concentrations are higher in the soil closest to the influent end of the column. The uranium concentrations decrease exponentially with the soil's distance from the influent end. The uranium concentrations were converted from mg/kg to mg/inch based on the packing density of the soil in the treated column at set up (0.42 kg/in in the treated column, weight expressed on an as received moisture content basis). An exponential curve was fitted to the data with an R2 value of 0.9945. The curve was of the equation y=0.4184e0.0837x, where x = the distance in inches from the influent end of the column. Integration of the
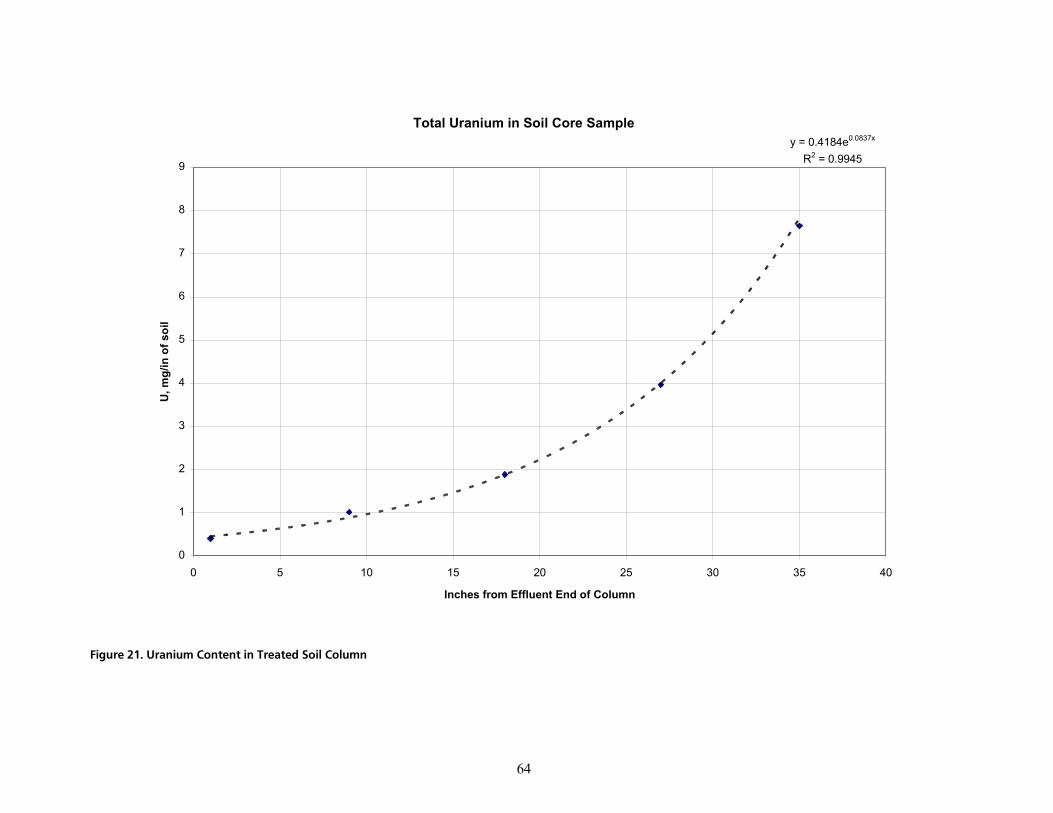
= =64
Total Uranium in Soil Core Sampley = 0.4184e0.0837x
R2 = 0.9945
0
1
2
3
4
5
6
7
8
9
0 5 10 15 20 25 30 35 40
Inches from Effluent End of Column
U, m
g/in
of s
oil
cáÖìêÉ=ONK=rê~åáìã=`çåíÉåí=áå=qêÉ~íÉÇ=pçáä=`çäìãå=
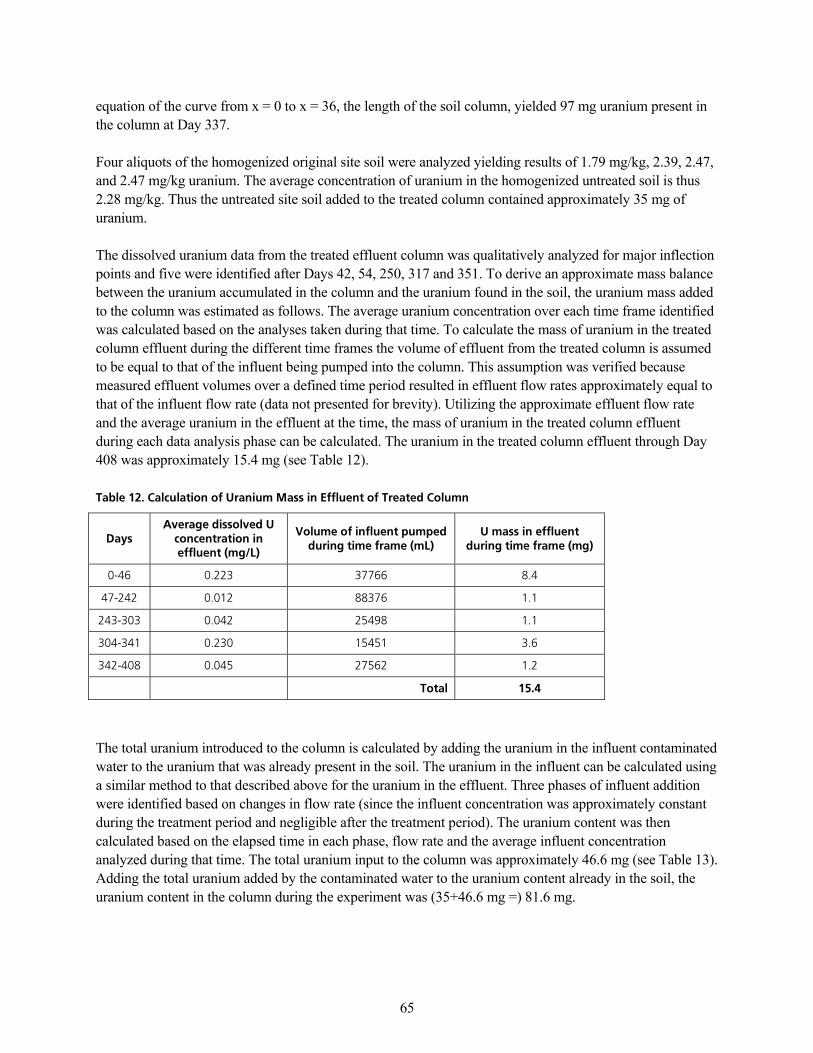
= =65
equation of the curve from x = 0 to x = 36, the length of the soil column, yielded 97 mg uranium present in the column at Day 337.
Four aliquots of the homogenized original site soil were analyzed yielding results of 1.79 mg/kg, 2.39, 2.47, and 2.47 mg/kg uranium. The average concentration of uranium in the homogenized untreated soil is thus 2.28 mg/kg. Thus the untreated site soil added to the treated column contained approximately 35 mg of uranium.
The dissolved uranium data from the treated effluent column was qualitatively analyzed for major inflection points and five were identified after Days 42, 54, 250, 317 and 351. To derive an approximate mass balance between the uranium accumulated in the column and the uranium found in the soil, the uranium mass added to the column was estimated as follows. The average uranium concentration over each time frame identified was calculated based on the analyses taken during that time. To calculate the mass of uranium in the treated column effluent during the different time frames the volume of effluent from the treated column is assumed to be equal to that of the influent being pumped into the column. This assumption was verified because measured effluent volumes over a defined time period resulted in effluent flow rates approximately equal to that of the influent flow rate (data not presented for brevity). Utilizing the approximate effluent flow rate and the average uranium in the effluent at the time, the mass of uranium in the treated column effluent during each data analysis phase can be calculated. The uranium in the treated column effluent through Day 408 was approximately 15.4 mg (see Table 12).
q~ÄäÉ=NOK=`~äÅìä~íáçå=çÑ=rê~åáìã=j~ëë=áå=bÑÑäìÉåí=çÑ=qêÉ~íÉÇ=`çäìãå=
a~óë=^îÉê~ÖÉ=ÇáëëçäîÉÇ=r=ÅçåÅÉåíê~íáçå=áå=ÉÑÑäìÉåí=EãÖLiF=
sçäìãÉ=çÑ=áåÑäìÉåí=éìãéÉÇ=ÇìêáåÖ=íáãÉ=Ñê~ãÉ=EãiF=
r=ã~ëë=áå=ÉÑÑäìÉåí=ÇìêáåÖ=íáãÉ=Ñê~ãÉ=EãÖF=
MJQS= MKOOP= PTTSS= UKQ=
QTJOQO= MKMNO= UUPTS= NKN=
OQPJPMP= MKMQO= ORQVU= NKN=
PMQJPQN= MKOPM= NRQRN= PKS=
PQOJQMU= MKMQR= OTRSO= NKO=
= = qçí~ä= NRKQ=
The total uranium introduced to the column is calculated by adding the uranium in the influent contaminated water to the uranium that was already present in the soil. The uranium in the influent can be calculated using a similar method to that described above for the uranium in the effluent. Three phases of influent addition were identified based on changes in flow rate (since the influent concentration was approximately constant during the treatment period and negligible after the treatment period). The uranium content was then calculated based on the elapsed time in each phase, flow rate and the average influent concentration analyzed during that time. The total uranium input to the column was approximately 46.6 mg (see Table 13). Adding the total uranium added by the contaminated water to the uranium content already in the soil, the uranium content in the column during the experiment was (35+46.6 mg =) 81.6 mg.
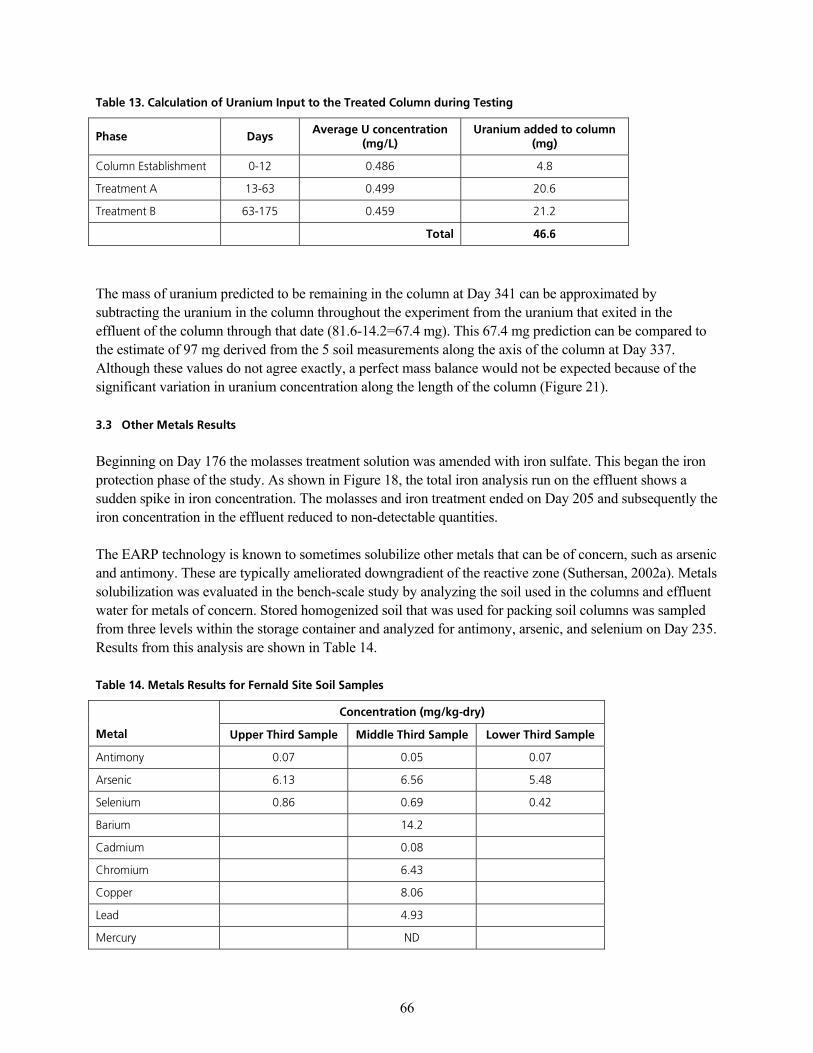
= =66
q~ÄäÉ=NPK=`~äÅìä~íáçå=çÑ=rê~åáìã=fåéìí=íç=íÜÉ=qêÉ~íÉÇ=`çäìãå=ÇìêáåÖ=qÉëíáåÖ=
mÜ~ëÉ= a~óë=^îÉê~ÖÉ=r=ÅçåÅÉåíê~íáçå=
EãÖLiF=rê~åáìã=~ÇÇÉÇ=íç=Åçäìãå=
EãÖF=
`çäìãå=bëí~ÄäáëÜãÉåí= MJNO= MKQUS= QKU=
qêÉ~íãÉåí=^= NPJSP= MKQVV= OMKS=
qêÉ~íãÉåí=_= SPJNTR= MKQRV= ONKO=
= = qçí~ä= QSKS=
The mass of uranium predicted to be remaining in the column at Day 341 can be approximated by subtracting the uranium in the column throughout the experiment from the uranium that exited in the effluent of the column through that date (81.6-14.2=67.4 mg). This 67.4 mg prediction can be compared to the estimate of 97 mg derived from the 5 soil measurements along the axis of the column at Day 337. Although these values do not agree exactly, a perfect mass balance would not be expected because of the significant variation in uranium concentration along the length of the column (Figure 21).
PKP líÜÉê=jÉí~äë=oÉëìäíë=
Beginning on Day 176 the molasses treatment solution was amended with iron sulfate. This began the iron protection phase of the study. As shown in Figure 18, the total iron analysis run on the effluent shows a sudden spike in iron concentration. The molasses and iron treatment ended on Day 205 and subsequently the iron concentration in the effluent reduced to non-detectable quantities.
The EARP technology is known to sometimes solubilize other metals that can be of concern, such as arsenic and antimony. These are typically ameliorated downgradient of the reactive zone (Suthersan, 2002a). Metals solubilization was evaluated in the bench-scale study by analyzing the soil used in the columns and effluent water for metals of concern. Stored homogenized soil that was used for packing soil columns was sampled from three levels within the storage container and analyzed for antimony, arsenic, and selenium on Day 235. Results from this analysis are shown in Table 14.
q~ÄäÉ=NQK=jÉí~äë=oÉëìäíë=Ñçê=cÉêå~äÇ=páíÉ=pçáä=p~ãéäÉë==
`çåÅÉåíê~íáçå=EãÖLâÖJÇêóF==
jÉí~ä== rééÉê=qÜáêÇ=p~ãéäÉ= jáÇÇäÉ=qÜáêÇ=p~ãéäÉ= içïÉê=qÜáêÇ=p~ãéäÉ=
^åíáãçåó= MKMT= MKMR= MKMT=
^êëÉåáÅ= SKNP= SKRS= RKQU=
pÉäÉåáìã= MKUS= MKSV= MKQO=
_~êáìã= = NQKO= =
`~Çãáìã= = MKMU= =
`Üêçãáìã= = SKQP= =
`çééÉê= = UKMS= =
iÉ~Ç= = QKVP= =
jÉêÅìêó= = ka= =
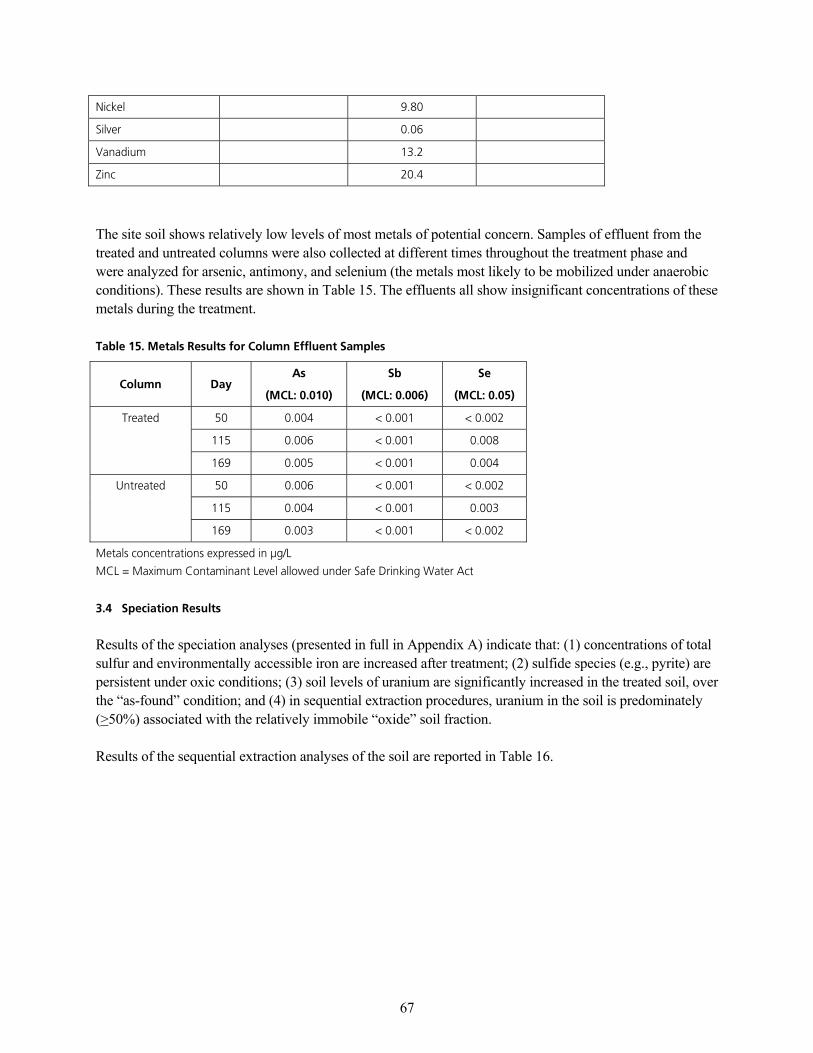
= =67
káÅâÉä= = VKUM= =
páäîÉê= = MKMS= =
s~å~Çáìã= = NPKO= =
wáåÅ= = OMKQ= =
The site soil shows relatively low levels of most metals of potential concern. Samples of effluent from the treated and untreated columns were also collected at different times throughout the treatment phase and were analyzed for arsenic, antimony, and selenium (the metals most likely to be mobilized under anaerobic conditions). These results are shown in Table 15. The effluents all show insignificant concentrations of these metals during the treatment.
q~ÄäÉ=NRK=jÉí~äë=oÉëìäíë=Ñçê=`çäìãå=bÑÑäìÉåí=p~ãéäÉë=
`çäìãå= a~ó=^ë=
Ej`iW=MKMNMF=
pÄ=
Ej`iW=MKMMSF=
pÉ=
Ej`iW=MKMRF=
qêÉ~íÉÇ= RM= MKMMQ= Y=MKMMN= Y=MKMMO=
= NNR= MKMMS= Y=MKMMN= MKMMU=
= NSV= MKMMR= Y=MKMMN= MKMMQ=
råíêÉ~íÉÇ= RM= MKMMS= Y=MKMMN= Y=MKMMO=
= NNR= MKMMQ= Y=MKMMN= MKMMP=
= NSV= MKMMP= Y=MKMMN= Y=MKMMO=
jÉí~äë=ÅçåÅÉåíê~íáçåë=ÉñéêÉëëÉÇ=áå=”ÖLi=
j`i=Z=j~ñáãìã=`çåí~ãáå~åí=iÉîÉä=~ääçïÉÇ=ìåÇÉê=p~ÑÉ=aêáåâáåÖ=t~íÉê=^Åí=
PKQ péÉÅá~íáçå=oÉëìäíë=
Results of the speciation analyses (presented in full in Appendix A) indicate that: (1) concentrations of total sulfur and environmentally accessible iron are increased after treatment; (2) sulfide species (e.g., pyrite) are persistent under oxic conditions; (3) soil levels of uranium are significantly increased in the treated soil, over the “as-found” condition; and (4) in sequential extraction procedures, uranium in the soil is predominately (>50%) associated with the relatively immobile “oxide” soil fraction.
Results of the sequential extraction analyses of the soil are reported in Table 16.
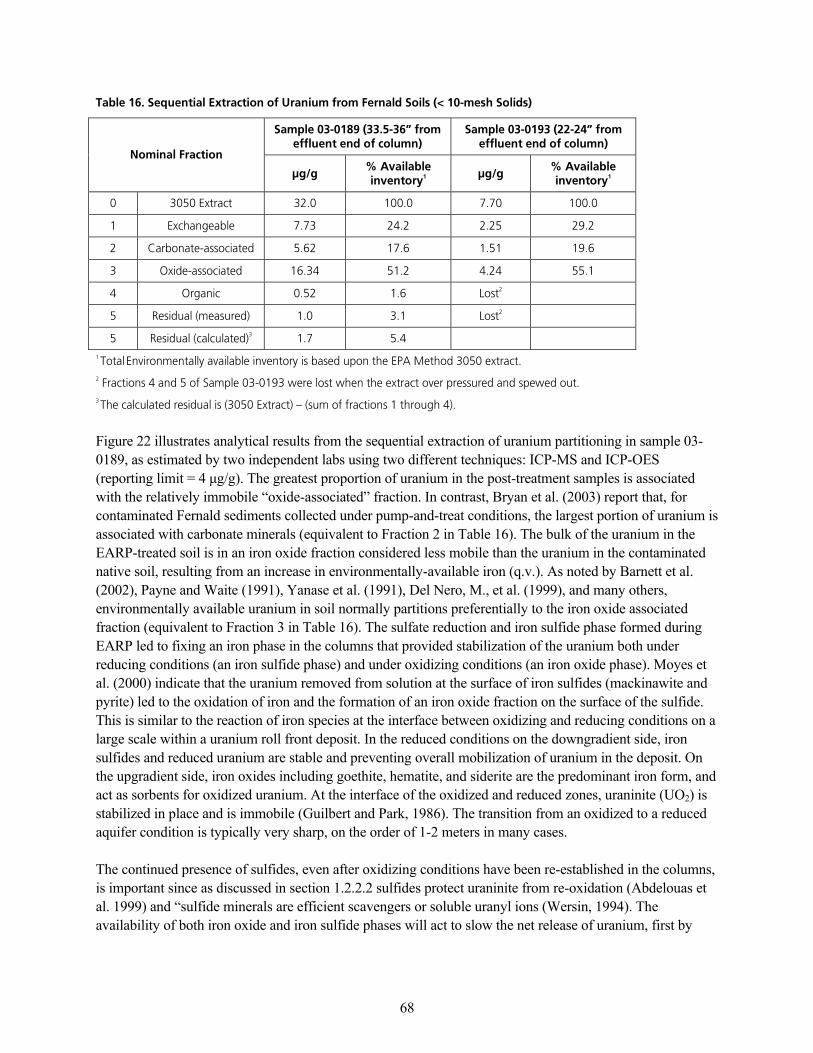
= =68
q~ÄäÉ=NSK=pÉèìÉåíá~ä=bñíê~Åíáçå=çÑ=rê~åáìã=Ñêçã=cÉêå~äÇ=pçáäë=EY=NMJãÉëÜ=pçäáÇëF=
p~ãéäÉ=MPJMNUV=EPPKRJPSÒ=Ñêçã=ÉÑÑäìÉåí=ÉåÇ=çÑ=ÅçäìãåF=
p~ãéäÉ=MPJMNVP=EOOJOQÒ=Ñêçã=ÉÑÑäìÉåí=ÉåÇ=çÑ=ÅçäìãåF=
kçãáå~ä=cê~Åíáçå=
”ÖLÖ=B=^î~áä~ÄäÉ=áåîÉåíçêóN= �”ÖLÖ=
B=^î~áä~ÄäÉ=áåîÉåíçêóN=
M= PMRM=bñíê~Åí= POKM= NMMKM= TKTM= NMMKM=
N= bñÅÜ~åÖÉ~ÄäÉ= TKTP= OQKO= OKOR= OVKO=
O= `~êÄçå~íÉJ~ëëçÅá~íÉÇ= RKSO= NTKS= NKRN= NVKS=
P= lñáÇÉJ~ëëçÅá~íÉÇ= NSKPQ= RNKO= QKOQ= RRKN=
Q= lêÖ~åáÅ= MKRO= NKS= içëíO= =
R= oÉëáÇì~ä=EãÉ~ëìêÉÇF= NKM= PKN= içëíO= =
R= oÉëáÇì~ä=EÅ~äÅìä~íÉÇFP= NKT= RKQ= = =N=qçí~ä=båîáêçåãÉåí~ääó=~î~áä~ÄäÉ=áåîÉåíçêó=áë=Ä~ëÉÇ=ìéçå=íÜÉ=bm^=jÉíÜçÇ=PMRM=Éñíê~ÅíK=O=cê~Åíáçåë=Q=~åÇ=R=çÑ=p~ãéäÉ=MPJMNVP=ïÉêÉ=äçëí=ïÜÉå=íÜÉ=Éñíê~Åí=çîÉê=éêÉëëìêÉÇ=~åÇ=ëéÉïÉÇ=çìíK=P=qÜÉ=Å~äÅìä~íÉÇ=êÉëáÇì~ä=áë=EPMRM=bñíê~ÅíF=Ó=Eëìã=çÑ=Ñê~Åíáçåë=N=íÜêçìÖÜ=QFK=
Figure 22 illustrates analytical results from the sequential extraction of uranium partitioning in sample 03-0189, as estimated by two independent labs using two different techniques: ICP-MS and ICP-OES (reporting limit = 4 µg/g). The greatest proportion of uranium in the post-treatment samples is associated with the relatively immobile “oxide-associated” fraction. In contrast, Bryan et al. (2003) report that, for contaminated Fernald sediments collected under pump-and-treat conditions, the largest portion of uranium is associated with carbonate minerals (equivalent to Fraction 2 in Table 16). The bulk of the uranium in the EARP-treated soil is in an iron oxide fraction considered less mobile than the uranium in the contaminated native soil, resulting from an increase in environmentally-available iron (q.v.). As noted by Barnett et al. (2002), Payne and Waite (1991), Yanase et al. (1991), Del Nero, M., et al. (1999), and many others, environmentally available uranium in soil normally partitions preferentially to the iron oxide associated fraction (equivalent to Fraction 3 in Table 16). The sulfate reduction and iron sulfide phase formed during EARP led to fixing an iron phase in the columns that provided stabilization of the uranium both under reducing conditions (an iron sulfide phase) and under oxidizing conditions (an iron oxide phase). Moyes et al. (2000) indicate that the uranium removed from solution at the surface of iron sulfides (mackinawite and pyrite) led to the oxidation of iron and the formation of an iron oxide fraction on the surface of the sulfide. This is similar to the reaction of iron species at the interface between oxidizing and reducing conditions on a large scale within a uranium roll front deposit. In the reduced conditions on the downgradient side, iron sulfides and reduced uranium are stable and preventing overall mobilization of uranium in the deposit. On the upgradient side, iron oxides including goethite, hematite, and siderite are the predominant iron form, and act as sorbents for oxidized uranium. At the interface of the oxidized and reduced zones, uraninite (UO2) is stabilized in place and is immobile (Guilbert and Park, 1986). The transition from an oxidized to a reduced aquifer condition is typically very sharp, on the order of 1-2 meters in many cases.
The continued presence of sulfides, even after oxidizing conditions have been re-established in the columns, is important since as discussed in section 1.2.2.2 sulfides protect uraninite from re-oxidation (Abdelouas et al. 1999) and “sulfide minerals are efficient scavengers or soluble uranyl ions (Wersin, 1994). The availability of both iron oxide and iron sulfide phases will act to slow the net release of uranium, first by
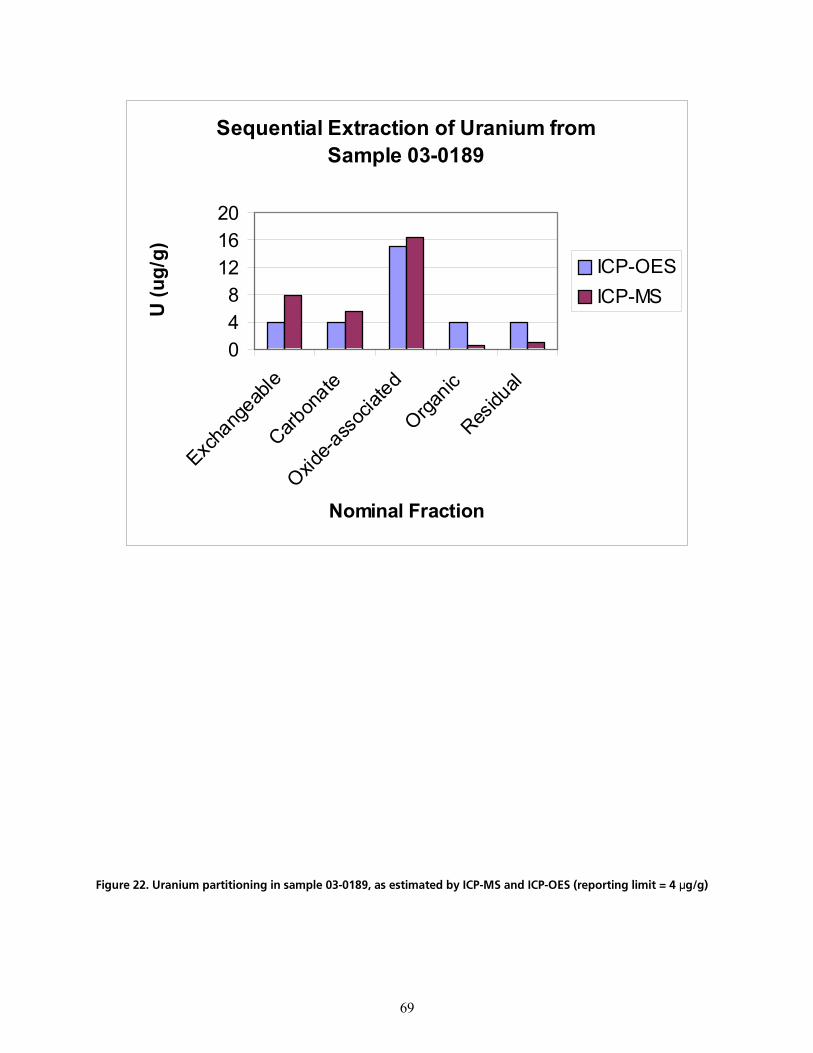
= =69
Sequential Extraction of Uranium from Sample 03-0189
048
121620
Excha
ngeab
le
Carbon
ate
Oxide-a
ssoc
iated
Organic
Residu
al
Nominal Fraction
U (u
g/g) ICP-OES
ICP-MS
cáÖìêÉ=OOK=rê~åáìã=é~êíáíáçåáåÖ=áå=ë~ãéäÉ=MPJMNUVI=~ë=Éëíáã~íÉÇ=Äó=f`mJjp=~åÇ=f`mJlbp=EêÉéçêíáåÖ=äáãáí=Z=Q=µÖLÖF=

= =70
slowing the oxidation of the reduced uranium species, and then by providing an environmentally accessible iron phase to maintain low uranium concentrations in-situ.
It is critical to understand that the sequential extraction results discussed here represent column materials that have been re-oxidized for 133 days by groundwater saturated with dissolved oxygen. It is likely that at the beginning of the re-oxidation phase of the columns that the vast majority of the uranium had been associated with a reduced iron sulfide phase, and that during the reoxidation period the uranium had been oxidized and re-reduced on iron sulfide phases. The kinetics of this reoxidation are affected by a very complex interplay of a large number of factors, including crystal size of the UO2 formed during the reducing conditions of the first 200 days of column operation, the crystallinity of the iron sulfides formed during particularly the last 30 days of column operation prior to the reoxidation stage, and the formation of hydrous iron oxides and progressively crystalline iron oxides. Thus, it is of limited use to directly extrapolate the concentrations of uranium, iron, or sulfide formed in these columns to field scale because the average duration of reduced uranium minerals formed in a field scale application will be on the order of at least decades, if not centuries, prior to their first exposure to oxidizing groundwater. Under these conditions, uranium remobilization will be more kinetically similar to the uranium mobilization (very slow) that occurs in groundwater in a uranium roll front deposit.
A portion of the post treatment sample was sieved using 120-mesh screen to select material <125-µm (“fines” fraction). This size range represents only ~ 0.6 wt% of the as-received sample. This size distribution suggests that although uranium is preferentially associated with the fines, there is unlikely to be a significant mass of extremely fine, colloidal range material (i.e., below 5 microns) in these samples.
PKR aáëÅìëëáçå=çÑ=pÉèìÉåíá~ä=bñíê~Åíáçå=oÉëìäíë=
The April 2003 Selective Sequential Extraction Analysis Report (Bryan 2003) provides useful information on the speciation of uranium in the current system. This data reflects the combined effects of natural attenuation processes and pump-and-treat with reinjection. Results from an eight stage sequential extraction process and particle size fractionation show:
“Whole-rock uranium concentrations in the shallow uncontaminated samples averaged 1.4 ppm….in the uncontaminated sample the largest fraction of uranium about 40% remained in the residual non reactive mineral phases” – in other words the largest fraction of the uranium could not be extracted in the first 7 steps of the sequential extraction. They go on to say “only a tiny fraction of the uranium was present in readily-exchangeable form”
“samples from the contaminant plume had higher uranium concentrations with a maximum of 5.9 ppm…for most of the contaminated sediments, a significant fraction of the total uranium present was released in the competing cation and anion washes. This uranium is present as uranyl in fixed-charge clay interlayer sites, and as outer-sphere sorbed species on mineral surfaces….The uranium released in the competing cation and anion washes clearly labile.” Elsewhere the same report states that “in the contaminated sediments the largest fraction of the uranium is associated with carbonate minerals. Much of this is present on the mineral surface and is labile. However, some of the uranium associated with carbonates, perhaps as much as half….may be sequestered in the mineral structure. The amount of uranium associated with amorphous and crystalline iron oxides is minor. The fraction associated with
= =71
amorphous iron oxyhydroxides appears to be sequestered while that associated with crystalline oxyhydroxides is labile.”
The different types of iron with which uranium is associated at Fernald under natural attenuation and pump-and-treat conditions are detailed in the report: “virtually all of the uranium associated with crystalline Fe (III) oxides/oxyhydroxides is surface-bound, and is part of the mobile uranium fraction. The sorption sites on the crystalline iron oxides are unlikely to differ from those on the amorphous materials…..the uranium fraction associated with the amorphous oxide must be sequestered and is not part of the mobile faction. While ferrihydrite is easily and rapidly precipitated, recrystallization into crystalline iron oxides/oxyhydroxides is kinetically much slower. Apparently, ferrihydrate has precipitated over the time interval since the uranium plume formed, but no significant conversion to crystalline iron oxides/oxyhydroxides has occurred.” This is in agreement with IT’s 1996 report on reinjection which discusses how the extraction and reinjection of groundwater at Fernald can lead to the precipitation of iron hydroxide both in the treatment system and in-situ.
The report goes on to say that: “Although little uranium is bound to organic material in the bulk sediment samples, fragments of wood isolated from the sediment contain high concentrations of uranium. Wood in the aquifer probably concentrates uranium through microbially-mediated reduction and precipitation; the importance of this process in sequestering uranium is difficult to evaluate, because the abundance of wood in the aquifer is unknown.”
Thus, the sequential extraction and other speciation results reported for the post EARP samples (section 3.4) substantially differ from the results under pump & treat/reinjection/natural attenuation conditions. EARP appears to alter the speciation from carbonate associated forms to iron oxide- and iron sulfide-associated forms. Carbonate bound forms are traditionally seen as fairly mobile, but may not be under a calcite/dolomite saturated condition. Fernald is currently conducting further kinetics studies to investigate the mobility of the carbonate bound forms. Iron oxide and iron sulfide associated forms are generally seen as relatively immobile.
The longer duration of reduced conditions prior to reoxidation of the aquifer under field-scale conditions can be expected to allow uranium to mobilize, react with iron oxides formed in the oxidized front and resorb to those iron oxides. Any uranium not resorbed in this way will be carried by groundwater into the reduced, downgradient side of the treated aquifer, and will react with the iron sulfides contained in the reduced aquifer materials, and quantitatively reprecipitate on the surface of the iron sulfides, and reform UO2 and other reduced uranium mineral forms. The EARP mechanism is synergistic with the natural attenuation processes that appear to already be occurring at the eastern edge of the site, and even within the plume as Uranium is sorbed to wood fragments in the aquifer matrix (Bryan 2003).
PKS a~í~=sÉêáÑáÅ~íáçå=
Verification of laboratory data from Enviro-Test Laboratories (Casper, Wyoming) and Energy Laboratories (Casper, Wyoming) was performed. The verification included a check for detections in laboratory blanks and checks of laboratory duplicates, matrix spike and matrix spike duplicate results for compliance with specified limits as reported by the laboratories. The following issues, none of which appeared to have a significant effect on data quality, were noted:

= =72
A laboratory blank analyzed with June 25, 2002 soil samples contained 0.0005 mg/Kg uranium. The laboratory (Enviro-Test) attributed the detection to trace metals grade acid used to digest samples. The soil sample associated with this QA test contained 1.79 mg/Kg uranium.
A matrix spike and matrix spike duplicate pair associated with water samples collected August 9, 2002 fell below the acceptable range for recovery of bromide (82.1 and 86.5% recovery compared to acceptable limits of 90 to 110%). This was recognized by the laboratory (Energy Laboratories) with a notation that since the RPD and LCS/LCSD were acceptable, no reanalysis was necessary.
A method blank analyzed with April 15, 2003 water samples contained 0.00630 mg/L iron (Energy Laboratories). No iron was detected in the associated water samples at a detection limit of 0.030 mg/L.
A method blank analyzed with May 14, 2003 water samples contained 0.000089 mg/L manganese (Energy Laboratories). Manganese detections in the associated water samples ranged from 0.455 to 0.462 mg/L at a detection limit of 0.001 mg/L.
= =73
QK `çåÅäìëáçåë=
QKN _ÉåÅÜ=pÅ~äÉ=píìÇó=`çåÅäìëáçåë=
Taken together, the liquid phase effluent results, solid phase total uranium results, and the solid phase speciation results show that the EARP technology was able to rapidly precipitate almost all of the Uranium in the influent groundwater. This result was expected and is consistent with numerous published bench scale results and our full-scale experience as discussed in Sections 1.1 and 1.2.
The more controversial question in the literature is whether the uranium precipitates, once formed, will be stable. We extensively discuss this based on the mining literature, bench scale testing literature and biogeochemical theory in section 1.2 of this report. We show there that reduced minerals such as iron sulfide can preferentially consume oxidants and protect uranium from reoxidation. That section also concludes that it is not necessary to prevent all oxidation of uranium to prevent its mobilization because of the potential for both iron oxide and hydroxide (in aerobic environments) and iron sulfide and organic matter (in reduced environments) to remove uranium from solution. Thus the concentration of uranium measured at some downgradient point will be a factor of the overall rate of uranium dissolution and re-precipitation through the treatment zone (and the redox recovery zone on the downgradient side of the treatment zone). In a properly designed field scale system we propose that by ensuring that sufficient quantity of iron and sulfide are placed in the system during remediation, and that treatment is continued for a sufficient time, reoxidation of uranium can be prevented for centuries. When it does occur, it will occur in very localized portions of the reactive zone and the uranium will largely be readsorbed in the environmentally available iron placed during the initial treatment phase. Thus mobilization will occur at a slow enough rate (flux) that the groundwater concentrations downgradient will remain below regulatory standards. Since the bench scale system is necessarily much smaller and one dimensional, unlike the real world system, it may be beneficial to demonstrate this through a pilot test or three-dimensional flow and geochemical model before completion of design of a full-scale system. Based on the results of this bench-scale study, we also feel that a higher ratio of iron addition to uranium to be treated would be beneficial and would not significantly impact the economics.
In this regard the experimental results of these tests show that:
a) The mass of uranium resolubilized in more than four months of column testing is much lower than the amount precipitated (see Appendix D for a Quantitative Discussion).
b) The majority of the uranium was precipitated in the first few inches of the treated column. The majority of the uranium precipitated was associated with iron oxides or in other immobile/sequestered phases. It is important to contrast this result with the results reported by Bryan (2003) who shows that most of the uranium associated with contaminated aquifer solids at Fernald under the existing natural attenuation/pump & treat with reinjection conditions is carbonate bound. Carbonate bound forms are traditionally seen as fairly mobile, but may not be under a calcite/dolomite saturated condition. Fernald is currently conducting further studies to investigate the mobility of the carbonate bound forms. Iron oxide and iron sulfide associated forms are generally seen as relatively immobile.
= =74
c) A limited portion of the precipitated uranium was resolubilized as conditions became more aerobic. Effluent concentrations from the treated column eventually returned to levels below the clean-up level, while leaving substantial uranium mass bound.
In summary we believe that the desorption “slugs,” visible in figure 20, are a result of the desorption of the minority of the uranium still present in exchangeable forms after treatment (see also figure 22). Since these “exchangeable” forms are a small percentage of the total uranium mass after treatment, it thus is logical that the mass desorbed is substantially less than the mass sorbed. It is also reasonable to expect that once those exchangeable forms have been released that the flux from the treatment zone will be substantially lower.
It is important to carefully evaluate how well any bench scale experiment mimics the projected conditions of a full-scale system in space and time. Although this column test was operated for more than a year the length of the anaerobic treatment and aerobic rebound phases of the experiment were still substantially shorter than would be experienced at full scale. Although active introduction of substrate at full scale would probably occur for only one to three years, as discussed in section 1.2 the rate of reoxidation would be slow and thus the anaerobic minerals would have time to age and crystallize. Specifically a practical full scale system would need to ensure that contaminants were immobilized for a long period of time – although shorter than the half life of uranium, a system design life of a thousand years is probably reasonable given our uncertain knowledge about the rate of technology change and societal change over such long periods. Obviously a bench scale test of that length would be impractical during the course of technology selection for any site. But laboratory results that show the relative rates and extent of completion of processes ongoing in the system can be used to predict the performance of the system over long time periods. The laboratory results obtained here show that uranium is biologically precipitated at this site in a number of chemical forms. Some of these forms can be resolubilized, but the majority of the uranium mass is associated with iron sulfides (during the initial column operation) and iron oxides (during the reoxidation stage of column operation) forms in which it is not expected to be soluble. Moreover the uranium that is desorbed from the reactive zone is expected to be readsorbed before reaching receptors. This literature based conclusion is stated in section 1.2.2.3: “the oxidation of iron sulfides by oxygen in the aquifer will lead to secondary ferric iron phases that will sorb uranium, maintaining the low uranium concentrations in-situ as this reaction front moves”.
A column study also differs from a field scale system in its size. In this instance the column was 4” in diameter and approximately 36” long, containing 15.4 kg of soil. As discussed in Section 1.4.4, the 30 µg/L Fernald uranium plume at the end of 2002 was approximately 176 acres in size. Assuming an average thickness of 40 feet and a porosity of 30% yields a pore volume of approximately 668 million gallons. The scale up factor involved in treating the whole plume is approximately 1 billion fold. Even treatment of small “hot spots” with EARP would involve a scale up of more than 1 million fold. The performance of such a large system is likely to differ substantially from a small scale system in the following ways:
In a full-scale system, the length of the reduced reactive zone perpendicular to the flow path formed would be measured in hundreds of feet. As we discuss in section 1.2.2.2, the consumption rate of iron sulfide and other reduced compounds as the leading edge of the reduced reactive zone was reoxidized could be expected to be on the order of 1 ft per year. Even in the bench scale column study reduced compounds such as pyrite were present near the influent end of the column, even after 120 days of treatment with oxic water. Thus, the spatial and time dimensions of scale up are intimately connected – the reoxidation process at full scale would be expected to proceed very gradually over the course of
= =75
centuries. Thus during most of the reoxidation period at full scale a reductive, adsorptive zone would be present downgradient of the reoxidizing area.
Furthermore the distance to sensitive receptors at Fernald (such as the Great Miami River to the east) is likely to be one thousand feet or more. This would provide a large area for oxidized iron to reprecipitate as sorptive iron oxyhydroxides. Though substantial sorption/reprecipitation was not demonstrated in our short extension column, the control column data and the current distribution of uranium at this site (note previous discussion of redox front) together show that some natural attenuation of uranium occurs at Fernald. The introduction of a large mass of iron during the EARP application would enhance this natural attenuation. The design iron dose would likely be higher than that used in the bench-scale study to provide sufficient iron for precipitation as iron sulfides and iron oxyhydroxide reprecipitation surfaces for any uranium that is mobilized.
Achieving uniform reagent delivery is more difficult in full-scale systems due to the heterogeneity of the geologic material. However ARCADIS has experience in forming reducing zones through substrate addition at more than 140 sites. Therefore we have developed design and implementation strategies to deal with a variety of matrices (see Suthersan et al., 2002b). Based on our initial review we believe that the Fernald matrix will not be particularly difficult, although the substantial aquifer thickness means that any treatment technology (whether in-situ or ex-situ) may involve higher capital/installation costs but long-term costs will be lower using IRZ/EARP.
• The performance of any groundwater remedy should consider the effect of fluctuating water levels that may in the future saturate portions of the vadose zone. Future water table fluctuations within the range of water table levels that can be reasonably expected to occur during the period of active remediation (which we assume for either EARP or pump-and-treat to be 3 to 20 years) should be addressed by the EARP system. Even if the area of interest is only saturated for a modest time period during the operation of the remedial system. The bench scale results reported here suggest that only a period of months is required to achieve reduced conditions and remove uranium through EARP.
Future water table fluctuations to levels above the range of water table levels that can be reasonably expected to be observed at any time during the period of active remediation (which we assume for either EARP or pump-and-treat to be 3 to 20 years) would not be well handled by any active groundwater remedial system including pump & treat system, post-shut-down, since by definition it would no longer be operated. The response of an EARP system to such fluctuations would depend on hydrogeology. Should the newly saturated zone be either vertically or horizontally upgradient of the body of area influenced by the EARP process (with receptors downgradient), the EARP system would provide some protection, since control would likely be provided by iron sulfide minerals in the reduced zone and relatively fresh iron oxyhydroxide minerals in the redox recovery zone downgradient. However EARP would not provide protection from such future fluctuations when the zone influenced does not lie between the newly wetted zone and receptors.
Finally, this large scale up factor is a major reason why we generally caution against reliance on bench-scale testing for full-scale design of in-situ reactive zone systems and generally suggest the performance of a field

= =76
calibration test. Given the large size of this site and that existing models have been developed, it may also be useful in this case to conduct coupled geochemical and 3D flow models to help design a full scale system.
QKO fãéäáÅ~íáçåë=Ñçê=cìääJpÅ~äÉ=páíÉ=oÉãÉÇá~íáçå=
Finally, these results must be viewed in light of the ongoing pump-and-treat with reinjection system that is reducing the dissolved phase concentration of uranium in many areas of the site. Section 1.4.4 discusses the performance of the existing pump-and-treat with reinjection system at Fernald and highlights Kd as the key parameter governing the operation of that system. Kd is a thermodynamic quantity which describes the equilibrium distribution between the solid and mobile phase. In this instance the mobile phase (groundwater) is what can potentially transmit a risk to a receptor, and thus is the regulated parameter. The mobile phase is also the key component of the pump-and-treat remedial system. Thus high Kds are a two edged sword:
Moderately high Kds for substantial total concentrations of uranium could be expected yield very long treatment times in pump-and-treat systems
However, if Kd can be controlled to be sufficiently high, the equilibrium concentration in the mobile phase will pass the standard, indicating that the risk has been sufficiently managed.
Kd can be "controlled" in at least two ways:
By using pump-and-treat to exhaust the uranium bound to low and moderate Kd sites
By using a in-situ reactive zone process to alter the speciation of the uranium such that the Kd becomes much higher
As discussed in Section 1.4.4, there is reason to believe that though the pump-and-treat technology is currently effectively controlling the uranium plume and reducing the groundwater concentration, it may not be able to reach the treatment standard of 30 µg/L within an economical operating lifetime (and then maintain that concentration without rebound) in some areas of the site. The results of this study suggest that Enhanced Anaerobic Reductive Precipitation can reduce the mobility of uranium at the site and thus expedite closure. The EARP mechanism is synergistic with the natural attenuation processes that appear to be already occurring at the site.
= =77
RK oÉÑÉêÉåÅÉë=
Abdelouas, A. et al., Oxidative Dissolution of Uraninite Precipitated on Navajo Sandstone, Journal of Contaminant Hydrology, 1999, 36, 353-75.
Abdelouas, A. et al., Reduction of U(VI) to U(IV) by Indigenous Bacteria in Contaminated Groundwater; Journal of Contaminant Hydrology 1998, 35, 217-33.
Abdelouas, A., W. Lutze, W. Gong, E. H. Nuttall, B. A. Strietelmeier, and B. J. Travis, “Biological Reduction of Uranium in Groundwater and Subsurface Soil,” The Science of the Total Environment, 250 p. 21-35, 2000.
ARCADIS G&M, Inc., Revised Test Plan Containing Sampling and Analysis Plan; In-situ Chemical Stabilization of Metals and Radionuclides through Enhanced Anaerobic Reductive Precipitation: for Bench-Scale Testing using Samples from the Fernald Environmental Management Project, Cincinnati, OH; December 5, 2002.
Barnett, M.O. “U(VI) Adsorption to Heterogeneous Subsurface Media: Application of a Surface Complex Model” Environmental Science and Technology 2002, 36, 937-42.
Broberg, Ken, Fluor Fernald, personal communication to C.C. Lutes ARCADIS June 26, 2002.
Brock, T.D. and M.T. Madigan, Biology of Microorganisms, Prentice Hall, Englewood Cliffs, New Jersey, 07632, p. 635 and p. 711, 1988.
Bryan, C.R. et al. “Selective Sequential Extraction Analysis of Uranium in Great Miami Aquifer Sediment Samples, Fernald DOE site, Ohio, Sandia National Labs, SAND2003-1092P, April 2003.
Chang, Y-J., A. D. Peacock, P. E. Long, J. R. Stephen, J. P. McKinley, S. J. MacNaughton, A. K. M. Anwar Hussain, A. M. Saxton, and D. C. White, “Diversity and Characterization of Sulfate-Reducing Bacteria in Groundwater at a Uranium Mill Tailings Site,” Applied and Environmental Microbiology Vol. 67, No. 7, p. 3149-3160, 2001.
Chemical Rubber Company (CRC) “Handbook of Chemistry and Physics, 68th Ed p F-139.
Del Nero, M., et al. (1999), “Sorption/Desorption Processes of Uranium in Clayey Samples of the Bangombe Natural Reactor Zone, Gabon,” Radiochim. Acta, 87, 135-149.
DOE, January 2003. Long Term Stewardship Plan for Fernald http://www.fernald.gov/Future/PDFs/Fernald%20LTS.pdf
DOE, July 2002 Performance Management Plan for Fernald, Predecisional draft; http://www.fernald.gov/NewsUpdate/fpmp.htm.
Ferris, F., R. Hallberg, B. Lyven, and K. Pedersen. 2000. Retention of strontium, cesium, lead, and uranium by bacterial iron oxides from a subterranean environment. Applied Geochemistry, vol. 15, 1035-1042.
= =78
Fruchter, J., C. Cole, M. Williams, V. Vermeul, J. Amonette, J. Szecsody, J. Istok, and M. Humphrey. 2000. Creation of a Subsurface Permeable Treatment Zone for Aqueous Chromate Contamination Using In-situ Redox Manipulation. Ground Water Monitoring and Remediation, Vol. 20, 66-77.
Ganesh, R. Reduction of Hexavalent Uranium from Organic Complexes by Sulfate and Iron Reducing Bacteria, Applied and Environmental Microbiology, Nov 1997 p 4385-4391, Vol. 63, No. 11, 1997.
Guilbert, J., and C. Park. 1986. The Geology of Ore Deposits. WH Freeman and Co, New York.
Harrington, J.M. 2002. In-Situ Treatment of Metals in Mine Workings and Materials. Tailings and Mine Waste ’02. Swets and Zeitlinger B.V., Lisse, The Netherlands, p 251-261.
Hartog, N., J. Griffioen, P. Van Bergen, and C. Van Der Weijden. 2001. Determining the reactivity of reduced components in Dutch aquifer sediments. Impacts of Human Activity on Groundwater Dynamics, IAHS Publication No. 269, 2001.
Institute for Energy and Environmental Research (IEER) “Uranium: Its Uses and Hazards,” http://www.ieer.org/fctsheet/uranium.html.
IT Corporation “Geochemical Analysis and Modeling of Waters Injected into the Great Miami Aquifer: Fernald Environmental Management Project, April 1996.
Lack, J.G. et al., Applied and Environmental Microbiology, p 2704-2710; Vol. 68, No. 6, June 2002.
Leventhal, J and E. Santos. 1981. Relative importance of organic carbon and sulfide sulfur in a Wyoming roll-type uranium deposit. Open File Report (US Geological Survey) 81-580.
Liles, D.S., C.C. Lutes, G. Page and S. Suthersan, In-situ Chemical Stabilization of Metals and Radionuclides through Enhanced Anaerobic Reductive Precipitation: Application of a Commercial Technology to DOE Needs. Presented at NETL Industry Partnership for Environmental Science and Technology Conference, Morgantown, WV, 2001.
Lloyd, J.R. and L.E. Macaskie, 2000. Bioremediation of Radionuclide-Containing Wastewaters. In Environmental Microbe-Metal Interactions, ASM Press, Washington DC, D.R. Lovley, Ed.
Lovley, D.R., and E. J. P. Phillips. “Reduction of Uranium by Desulfovibrio desulfuricans”. Applied and Environmental Microbiology Vol. 58, No. 3. p. 850-856. 1992.
Lutes, C.C., A. Frizzell, J.S. Burdick, and P. Rowland. 2003. Enhanced CAH Bioremediation with Soluble Carbohydrates (Molasses, Corn Syrup and Whey): Case Study, Protocol, Current State of Practice and Federal Applications. Presented at the 2003 AFCEE Technology Transfer Conference, San Antonio TX; extended abstract published in proceedings.
Martin, T., and H. Kempton. 2000. In-situ Stabilization of Metal-Contaminated Groundwater by Hydrous Ferric Oxide: An Experimental and Modeling Investigation. Environmental Science and Technology, vol. 34, 3229-3234.
= =79
Merian, Ernest, Ed., 1991. “Metals and their Compounds in the Environment: Occurrence, Analysis and Biological Relevance,” VCH Publishers Weinhelm, Chapter II.33.
Morse, J. 1992. Oxidation kinetics of sedimentary pyrite in seawater. Geochimica et Cosmochimica Acta, vol. 55, 3665-3667.
Moyes, L., R. Parkman, J. Charnock, D. Vaughn, F. Livens, C. Hughes, and A. Braithwaite. 2000. Uranium uptake from aqueous solution by interaction with Geothite, Lepidocrocite, Muscovite, and Mackinawite: An X-Ray Adsorption Spectroscopy Study. Environmental Science and Technology, 34: 1062-1068.
Pauwels, H., W. Kloppmann, J. Foucher, A. Martelat, and V. Fritsche. 1998. Field tracer test for denitrification in a pyrite-bearing schist aquifer. Applied Geochemistry, vol. 13, 767-778.
Payne, Rayford B. Applied and Environmental Microbiology, June 2002, p. 3129-3132.
Payne, T.E.; Waite, T.D. (1991), “Surface Complexation Modeling of Uranium Sorption Data Obtained by Isotope Exchange Techniques,” Radiochim. Acta, 52/53, 487-493.
Phillips, I.; Chapple, L. (1995), “Assessment of a Heavy Metals-Contaminated Site Using Sequential Extraction, TCLP, and Risk Assessment Techniques,” J. Soil Contam., 4, 311-325.
Saunders, J.A. US Patent #5,833,855, issued 11/10/98.
Senko, J.M. et al., “In-situ Evidence for Uranium Immobilization and Remobilization,” ES&T 2002, 35, 1491-6.
Suthersan, S.S. Natural and Enhanced Remediation Systems, CRC Press, 2002a, pp. 183-195.
Suthersan, S.S., C.C. Lutes, P.L. Palmer, F. Lenzo, F.C. Payne, D.S. Liles, J. Burdick. December 2002. FINAL: Technical Protocol for Using Soluble Carbohydrates to Enhance Reductive Dechlorination of Chlorinated Aliphatic Hydrocarbons. Submitted to AFCEE and ESTCP; December 19, 2002b.
Suzuki, Y., S. Kelley, K. Kemmer, and J. Banfield. 2003. Microbial populations stimulated for hexavalent uranium reduction in uranium mine sediment. Applied and Environmental Microbiology, 69: 1337-1346.
Tessler, A.; Campbell, P.G.C.; Bisson, M. (1979), “Sequential Extraction Procedure for the Speciation of Particulate Trace Metals,” Anal. Chem., 51, 844-851.
Wersin et al., "Abstracts of Papers," American Chemical Society National Meeting, 203GEOC, 1992.
Wersin, P. et al. “Interaction between aqueous uranium (VI) and sulfide minerals: Spectroscopic Evidence for Sorption and Reduction” Geochemica et Cosmochimica Acta Vol 58 No 13, Pp 2829-34, 1994.
Yanase, N., et al. (1991), “Uranium Distribution in Mineral Phases of Rock by Sequential Extraction Procedure,” Radiochim. Acta, 52/53, 387-393.

= =80
Zehnder, A., and W. Stumm. 1989. Geochemistry and Biogeochemistry of Anaerobic Habitats. In: Anaerobic Microbiology, 2nd Ed. A. Zehnder, Ed.
=

Appendix A
Speciation Analysis
Materials and Chemistry Laboratory, Inc. East Tennessee Technology Park, Building K-1006
2010 Highway 58, Suite 1000 Oak Ridge, Tennessee 37830-1702
Telephone: (865) 576-4138 Fax: (865) 576-8558 www.MCL-inc.com
June 24, 2003 Mr. Chris Lutes Arcadis G&M, Inc. 4915 Prospectus Drive, Suite F Durham, North Carolina 27713 Fax: (919) 544-5690 Certificate of Analysis MCLinc Project #: AGM001200 – Rev. 1 1. Executive Summary Materials and Chemistry Laboratory, Inc. (MCLinc) received samples of Fernald soil, used in soil column testing under the aegis of Arcadis G&M, Inc. The soil samples represent “as-received” soil, and soil removed from columns used to demonstrate the treatment efficacy of In-Situ Reactive Zone (IRZ) technology, also known as Enhanced Anaerobic Reductive Precipitation (EARP), for in-situ stabilization of uranium. The objectives of the soil testing were to demonstrate that trace levels of soluble uranium in Fernald site groundwater could be removed by anaerobic microbial reduction and/or incorporation into soil iron mineral phases (sulfides and/or oxyhydroxides). The post-treatment soil column samples received at MCLinc had been subjected to exposure to aerated water, in an attempt to determine whether uranium binding to soil minerals would be significantly reversible. Uranium is detected in the treated soil, but the low levels present preclude direct determination of its valence state by instrumental methods. Therefore, instrumental methods were applied to sulfur, iron, and manganese, since these species are believed to control the redox poise and metal contaminant binding properties of the soil. Results are presented that indicate: (1) concentrations of total sulfur and environmentally accessible iron are increased after treatment; (2) sulfide species (e.g., pyrite) are persistent under oxic conditions; (3) soil levels of uranium are significantly increased in the treated soil, over the “as-found” condition; and (4) in sequential extraction procedures, uranium in the soil is predominately (>50%) associated with the relatively immobile “oxide” soil fraction.
Materials and Chemistry Laboratory, Inc. Project #AGM001200-Rev.1
June 24, 2003 Page 2 of 24
2. Sample Receipt and Preparation 2.1 As-Received Soil Samples Three tubs of wet homogenized Fernald site soil were received at MCLinc, in good condition on 6/28/2002, under Chain of Custody (7639) from Enviro-Test Laboratories, Casper WY. The soil samples were given the MCLinc internal sample number 02-0608. The soil samples were from well 33264 and were a homogenization of samples collected from 69' - 93' at the well. 2.2 Post EARP Treatment Soil Column Samples Samples from a decommissioned soil column were received at MCLinc, in good condition on 6/10/2003, under Chain of Custody from Energy Laboratories. The samples, contained in 20-cc amber glass Septa-vials packed on ice, had been collected on 6/4/2003. Upon receipt, they were assigned MCLinc internal sample identification codes, as shown in Table 1. Table 1. Sample Identification
MCLinc Sample ID Customer Sample ID Other Label Information 03-0189 #13 33.5-36 in.; 44.26 g 03-0190 #12 30.5-33.5 in.; 44.35 g 03-0191 #11 26-29.5 in.; 46.58 g 03-0192 #10 24-26 in.; 42.73 g 03-0193 #9 22-24 in.; 33.1 g
The samples were wet soil, removed from a treated column core. Information from Mr. Todd Thornton of Arcadis-GM indicates that the length data given in Table 1 represent distances measured from the effluent end of the column, and that Sample 03-0189 (33.5 to 36 inches from effluent) is taken near the water influent end. Preliminary information from Energy Laboratories indicates that loading of uranium (U) is greatest near the column influent end, and decreases along the progression toward the column effluent end. In order to assess the “as-received” condition of the soil column samples, Sample #10 (MCLinc 03-0192) was opened within a nitrogen-purged glove bag, containing calibrated Oxidation-Reduction Potential (ORP) and pH electrodes. The sample was filled to the top of the container with damp drained “mud” (minimal headspace and little or no free liquid), but the response of the sensors in physical contact with the sample were: T = 12.1 oC; Eh ~ + 0.23 V (corrected to SHE); and pH ~ 6.1. By comparison to Figure 2.10-13 in Bodek et al. (1988) [adapted from Langmuir (1971)], this set of parameters is consistent with the mildly reducing (low-oxygen) conditions of a transitional environment. Thus, although the once-anoxic samples had been exposed to aerated water before sampling, there may have been sufficient residual organic matter and viable microorganisms to control the in-situ redox potential, possibly by consuming appreciable oxygen from the limited headspace within the sample vial during the ~ 6-d between sampling and receipt. From thermodynamic considerations (Pourbaix, 1974; Bodek et al., 1988; Manahan,
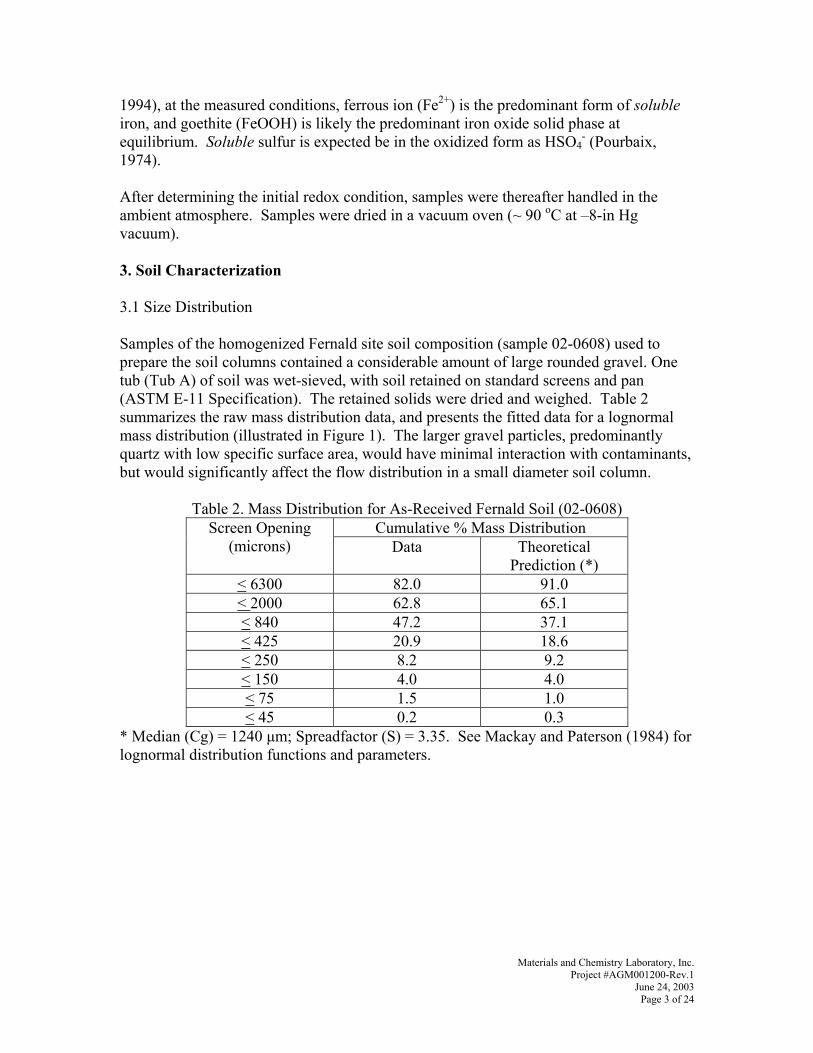
Materials and Chemistry Laboratory, Inc. Project #AGM001200-Rev.1
June 24, 2003 Page 3 of 24
1994), at the measured conditions, ferrous ion (Fe2+) is the predominant form of soluble iron, and goethite (FeOOH) is likely the predominant iron oxide solid phase at equilibrium. Soluble sulfur is expected be in the oxidized form as HSO4
- (Pourbaix, 1974). After determining the initial redox condition, samples were thereafter handled in the ambient atmosphere. Samples were dried in a vacuum oven (~ 90 oC at –8-in Hg vacuum). 3. Soil Characterization 3.1 Size Distribution Samples of the homogenized Fernald site soil composition (sample 02-0608) used to prepare the soil columns contained a considerable amount of large rounded gravel. One tub (Tub A) of soil was wet-sieved, with soil retained on standard screens and pan (ASTM E-11 Specification). The retained solids were dried and weighed. Table 2 summarizes the raw mass distribution data, and presents the fitted data for a lognormal mass distribution (illustrated in Figure 1). The larger gravel particles, predominantly quartz with low specific surface area, would have minimal interaction with contaminants, but would significantly affect the flow distribution in a small diameter soil column.
Table 2. Mass Distribution for As-Received Fernald Soil (02-0608) Cumulative % Mass Distribution Screen Opening
(microns) Data Theoretical Prediction (*)
< 6300 82.0 91.0 < 2000 62.8 65.1 < 840 47.2 37.1 < 425 20.9 18.6 < 250 8.2 9.2 < 150 4.0 4.0 < 75 1.5 1.0 < 45 0.2 0.3
* Median (Cg) = 1240 µm; Spreadfactor (S) = 3.35. See Mackay and Paterson (1984) for lognormal distribution functions and parameters.
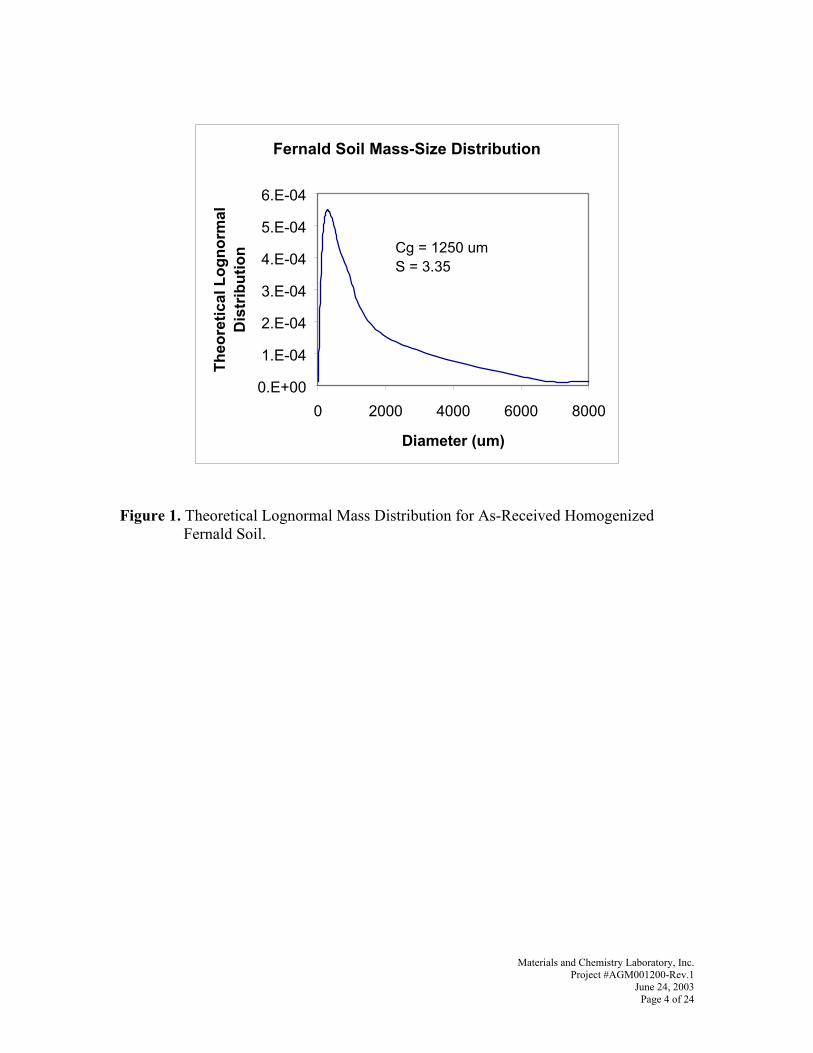
Materials and Chemistry Laboratory, Inc. Project #AGM001200-Rev.1
June 24, 2003 Page 4 of 24
Figure 1. Theoretical Lognormal Mass Distribution for As-Received Homogenized Fernald Soil.
Fernald Soil Mass-Size Distribution
0.E+00
1.E-04
2.E-04
3.E-04
4.E-04
5.E-04
6.E-04
0 2000 4000 6000 8000
Diameter (um)
Theo
retic
al L
ogno
rmal
D
istr
ibut
ion Cg = 1250 um
S = 3.35
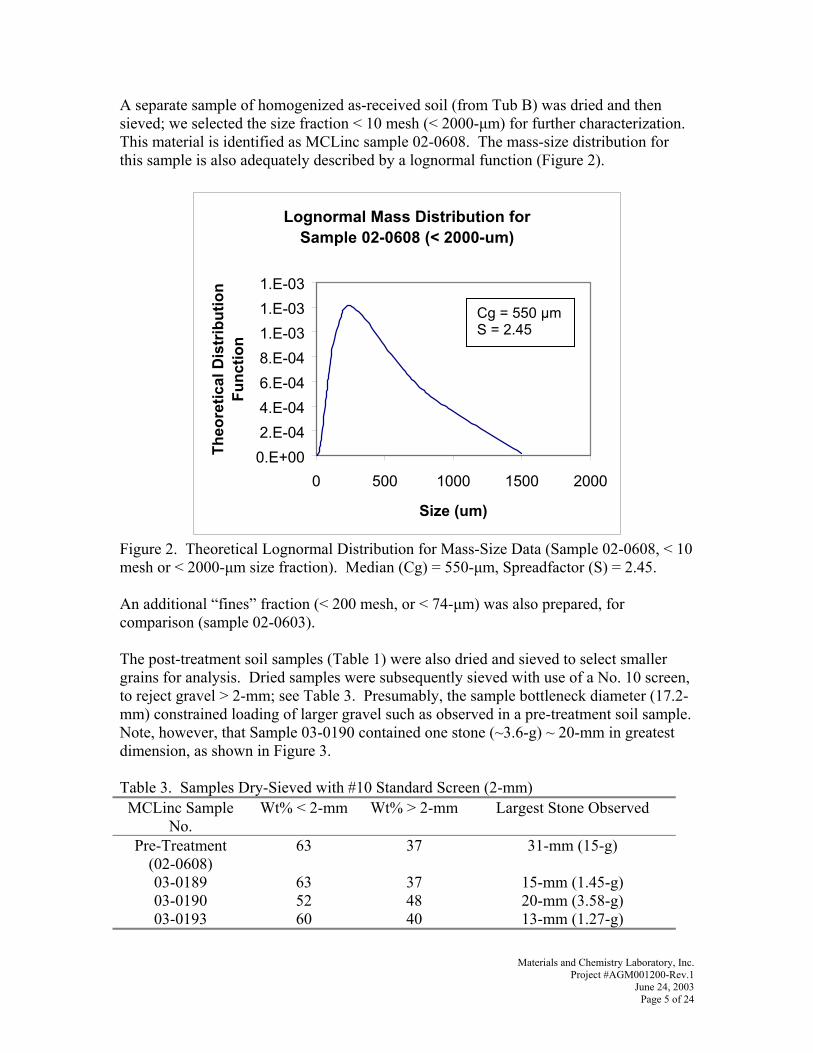
Materials and Chemistry Laboratory, Inc. Project #AGM001200-Rev.1
June 24, 2003 Page 5 of 24
A separate sample of homogenized as-received soil (from Tub B) was dried and then sieved; we selected the size fraction < 10 mesh (< 2000-µm) for further characterization. This material is identified as MCLinc sample 02-0608. The mass-size distribution for this sample is also adequately described by a lognormal function (Figure 2).
Figure 2. Theoretical Lognormal Distribution for Mass-Size Data (Sample 02-0608, < 10 mesh or < 2000-µm size fraction). Median (Cg) = 550-µm, Spreadfactor (S) = 2.45. An additional “fines” fraction (< 200 mesh, or < 74-µm) was also prepared, for comparison (sample 02-0603). The post-treatment soil samples (Table 1) were also dried and sieved to select smaller grains for analysis. Dried samples were subsequently sieved with use of a No. 10 screen, to reject gravel > 2-mm; see Table 3. Presumably, the sample bottleneck diameter (17.2-mm) constrained loading of larger gravel such as observed in a pre-treatment soil sample. Note, however, that Sample 03-0190 contained one stone (~3.6-g) ~ 20-mm in greatest dimension, as shown in Figure 3. Table 3. Samples Dry-Sieved with #10 Standard Screen (2-mm) MCLinc Sample
No. Wt% < 2-mm Wt% > 2-mm Largest Stone Observed
Pre-Treatment
(02-0608) 63 37 31-mm (15-g)
03-0189 63 37 15-mm (1.45-g) 03-0190 52 48 20-mm (3.58-g) 03-0193 60 40 13-mm (1.27-g)
Lognormal Mass Distribution for Sample 02-0608 (< 2000-um)
0.E+002.E-044.E-046.E-048.E-041.E-031.E-031.E-03
0 500 1000 1500 2000
Size (um)
Theo
retic
al D
istr
ibut
ion
Func
tion
Cg = 550 µmS = 2.45
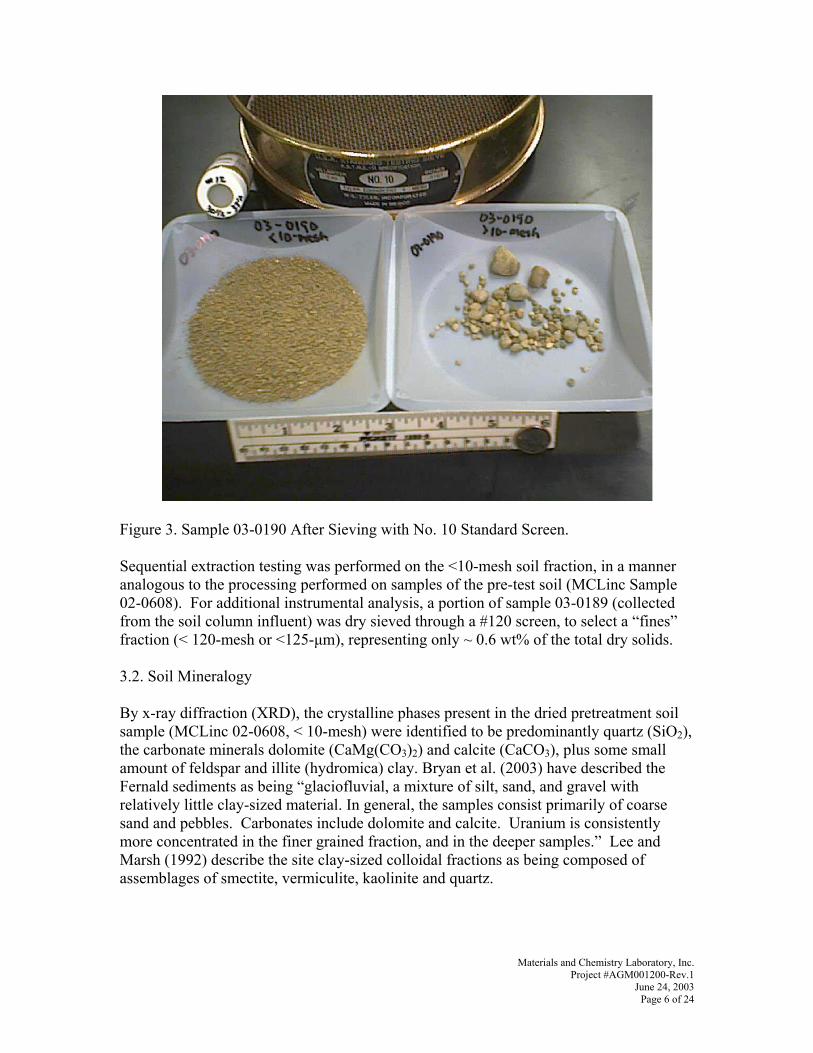
Materials and Chemistry Laboratory, Inc. Project #AGM001200-Rev.1
June 24, 2003 Page 6 of 24
Figure 3. Sample 03-0190 After Sieving with No. 10 Standard Screen. Sequential extraction testing was performed on the <10-mesh soil fraction, in a manner analogous to the processing performed on samples of the pre-test soil (MCLinc Sample 02-0608). For additional instrumental analysis, a portion of sample 03-0189 (collected from the soil column influent) was dry sieved through a #120 screen, to select a “fines” fraction (< 120-mesh or <125-µm), representing only ~ 0.6 wt% of the total dry solids. 3.2. Soil Mineralogy By x-ray diffraction (XRD), the crystalline phases present in the dried pretreatment soil sample (MCLinc 02-0608, < 10-mesh) were identified to be predominantly quartz (SiO2), the carbonate minerals dolomite (CaMg(CO3)2) and calcite (CaCO3), plus some small amount of feldspar and illite (hydromica) clay. Bryan et al. (2003) have described the Fernald sediments as being “glaciofluvial, a mixture of silt, sand, and gravel with relatively little clay-sized material. In general, the samples consist primarily of coarse sand and pebbles. Carbonates include dolomite and calcite. Uranium is consistently more concentrated in the finer grained fraction, and in the deeper samples.” Lee and Marsh (1992) describe the site clay-sized colloidal fractions as being composed of assemblages of smectite, vermiculite, kaolinite and quartz.
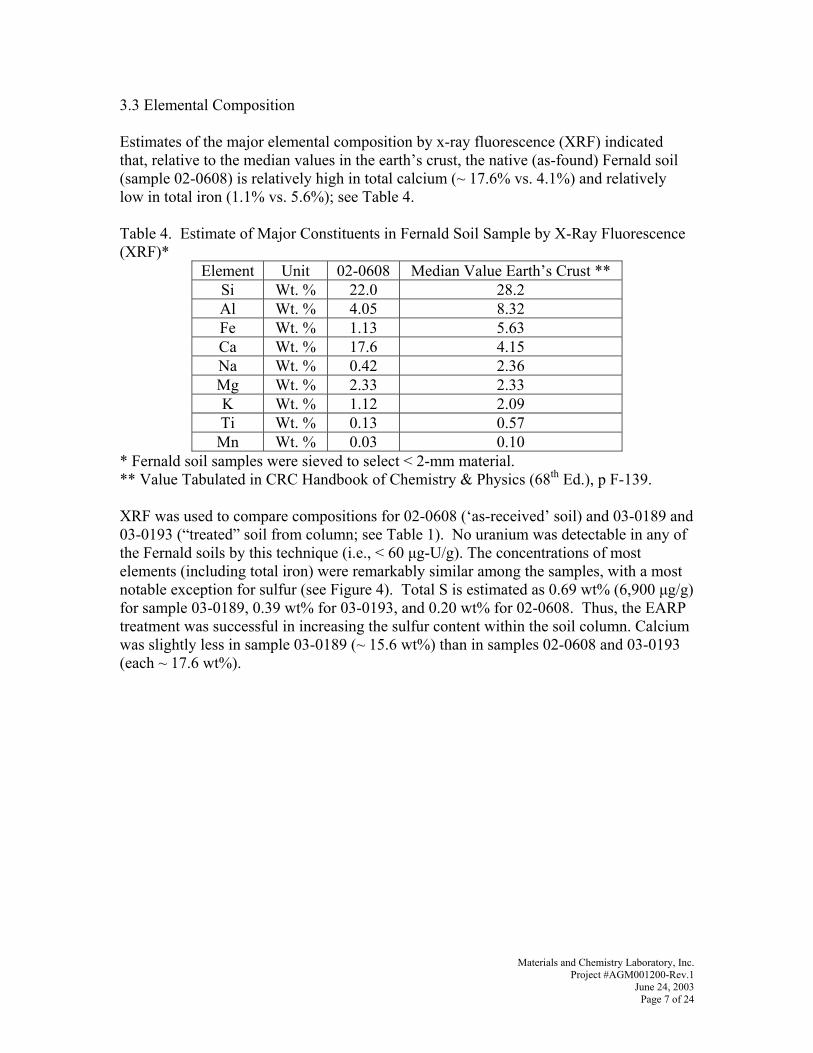
Materials and Chemistry Laboratory, Inc. Project #AGM001200-Rev.1
June 24, 2003 Page 7 of 24
3.3 Elemental Composition Estimates of the major elemental composition by x-ray fluorescence (XRF) indicated that, relative to the median values in the earth’s crust, the native (as-found) Fernald soil (sample 02-0608) is relatively high in total calcium (~ 17.6% vs. 4.1%) and relatively low in total iron (1.1% vs. 5.6%); see Table 4. Table 4. Estimate of Major Constituents in Fernald Soil Sample by X-Ray Fluorescence (XRF)*
Element Unit 02-0608 Median Value Earth’s Crust ** Si Wt. % 22.0 28.2 Al Wt. % 4.05 8.32 Fe Wt. % 1.13 5.63 Ca Wt. % 17.6 4.15 Na Wt. % 0.42 2.36 Mg Wt. % 2.33 2.33 K Wt. % 1.12 2.09 Ti Wt. % 0.13 0.57 Mn Wt. % 0.03 0.10
* Fernald soil samples were sieved to select < 2-mm material. ** Value Tabulated in CRC Handbook of Chemistry & Physics (68th Ed.), p F-139. XRF was used to compare compositions for 02-0608 (‘as-received’ soil) and 03-0189 and 03-0193 (“treated” soil from column; see Table 1). No uranium was detectable in any of the Fernald soils by this technique (i.e., < 60 µg-U/g). The concentrations of most elements (including total iron) were remarkably similar among the samples, with a most notable exception for sulfur (see Figure 4). Total S is estimated as 0.69 wt% (6,900 µg/g) for sample 03-0189, 0.39 wt% for 03-0193, and 0.20 wt% for 02-0608. Thus, the EARP treatment was successful in increasing the sulfur content within the soil column. Calcium was slightly less in sample 03-0189 (~ 15.6 wt%) than in samples 02-0608 and 03-0193 (each ~ 17.6 wt%).
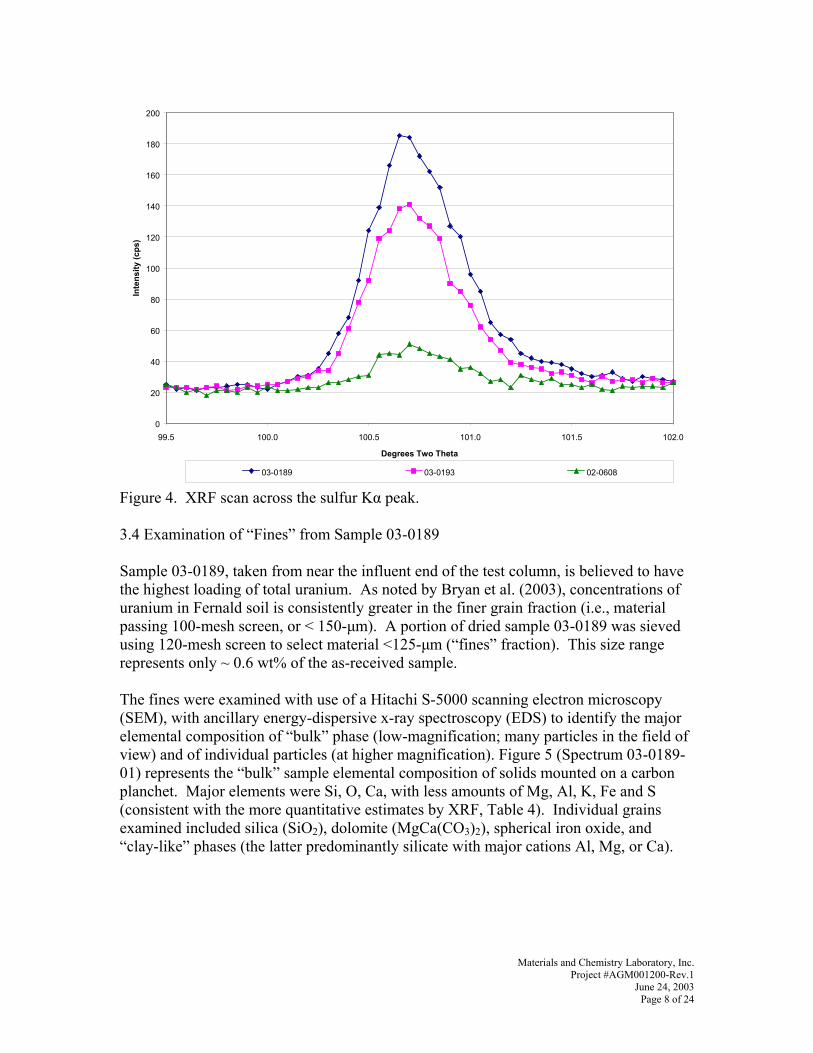
Materials and Chemistry Laboratory, Inc. Project #AGM001200-Rev.1
June 24, 2003 Page 8 of 24
0
20
40
60
80
100
120
140
160
180
200
99.5 100.0 100.5 101.0 101.5 102.0
Degrees Two Theta
Inte
nsity
(cps
)
03-0189 03-0193 02-0608
Figure 4. XRF scan across the sulfur Kα peak. 3.4 Examination of “Fines” from Sample 03-0189 Sample 03-0189, taken from near the influent end of the test column, is believed to have the highest loading of total uranium. As noted by Bryan et al. (2003), concentrations of uranium in Fernald soil is consistently greater in the finer grain fraction (i.e., material passing 100-mesh screen, or < 150-µm). A portion of dried sample 03-0189 was sieved using 120-mesh screen to select material <125-µm (“fines” fraction). This size range represents only ~ 0.6 wt% of the as-received sample. The fines were examined with use of a Hitachi S-5000 scanning electron microscopy (SEM), with ancillary energy-dispersive x-ray spectroscopy (EDS) to identify the major elemental composition of “bulk” phase (low-magnification; many particles in the field of view) and of individual particles (at higher magnification). Figure 5 (Spectrum 03-0189-01) represents the “bulk” sample elemental composition of solids mounted on a carbon planchet. Major elements were Si, O, Ca, with less amounts of Mg, Al, K, Fe and S (consistent with the more quantitative estimates by XRF, Table 4). Individual grains examined included silica (SiO2), dolomite (MgCa(CO3)2), spherical iron oxide, and “clay-like” phases (the latter predominantly silicate with major cations Al, Mg, or Ca).
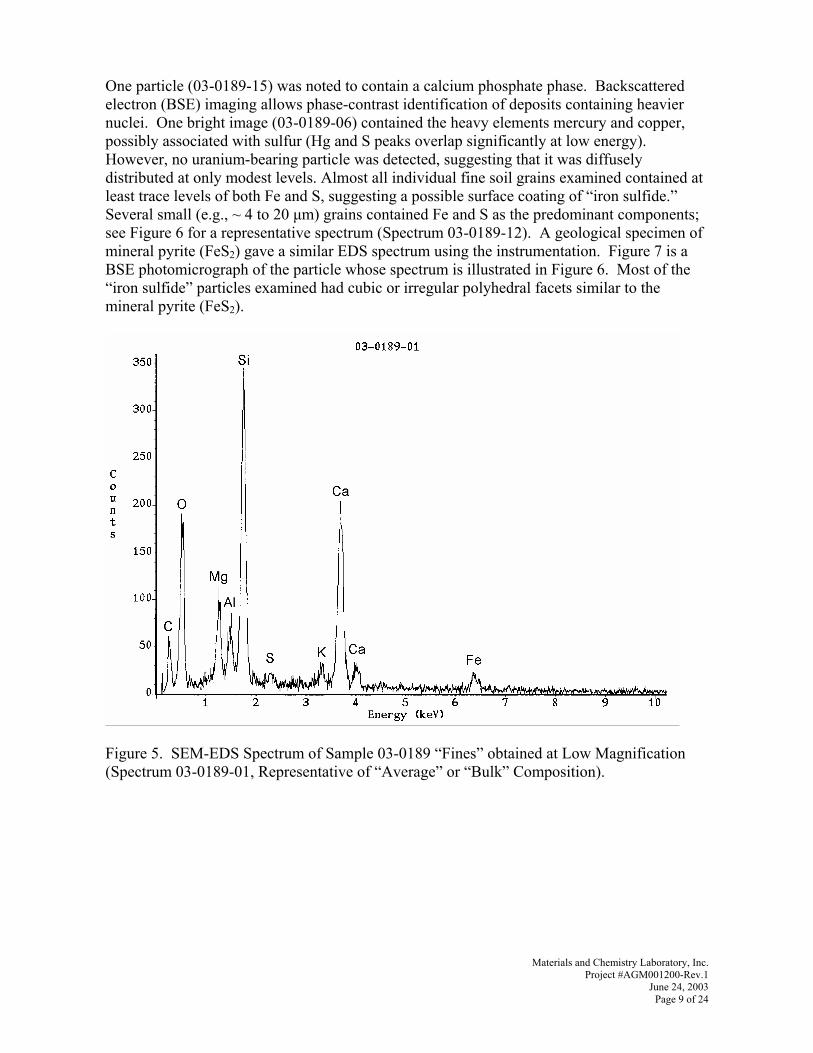
Materials and Chemistry Laboratory, Inc. Project #AGM001200-Rev.1
June 24, 2003 Page 9 of 24
One particle (03-0189-15) was noted to contain a calcium phosphate phase. Backscattered electron (BSE) imaging allows phase-contrast identification of deposits containing heavier nuclei. One bright image (03-0189-06) contained the heavy elements mercury and copper, possibly associated with sulfur (Hg and S peaks overlap significantly at low energy). However, no uranium-bearing particle was detected, suggesting that it was diffusely distributed at only modest levels. Almost all individual fine soil grains examined contained at least trace levels of both Fe and S, suggesting a possible surface coating of “iron sulfide.” Several small (e.g., ~ 4 to 20 µm) grains contained Fe and S as the predominant components; see Figure 6 for a representative spectrum (Spectrum 03-0189-12). A geological specimen of mineral pyrite (FeS2) gave a similar EDS spectrum using the instrumentation. Figure 7 is a BSE photomicrograph of the particle whose spectrum is illustrated in Figure 6. Most of the “iron sulfide” particles examined had cubic or irregular polyhedral facets similar to the mineral pyrite (FeS2).
Figure 5. SEM-EDS Spectrum of Sample 03-0189 “Fines” obtained at Low Magnification (Spectrum 03-0189-01, Representative of “Average” or “Bulk” Composition).
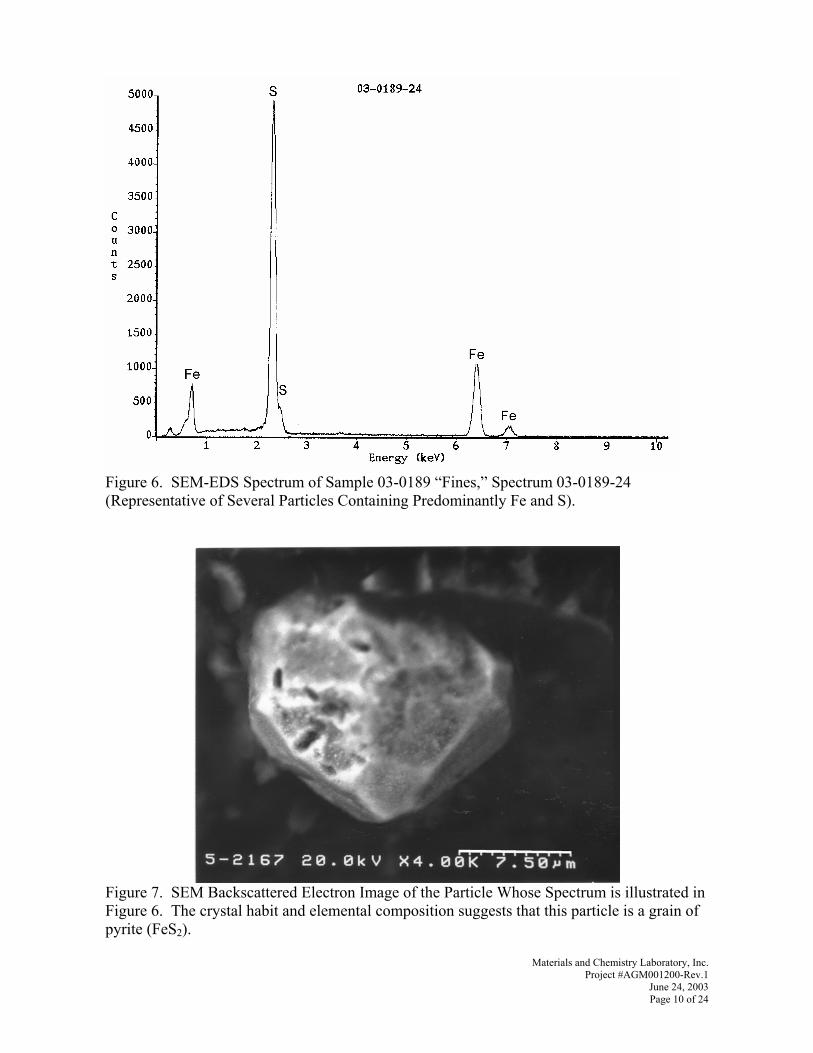
Materials and Chemistry Laboratory, Inc. Project #AGM001200-Rev.1
June 24, 2003 Page 10 of 24
Figure 6. SEM-EDS Spectrum of Sample 03-0189 “Fines,” Spectrum 03-0189-24 (Representative of Several Particles Containing Predominantly Fe and S).
Figure 7. SEM Backscattered Electron Image of the Particle Whose Spectrum is illustrated in Figure 6. The crystal habit and elemental composition suggests that this particle is a grain of pyrite (FeS2).
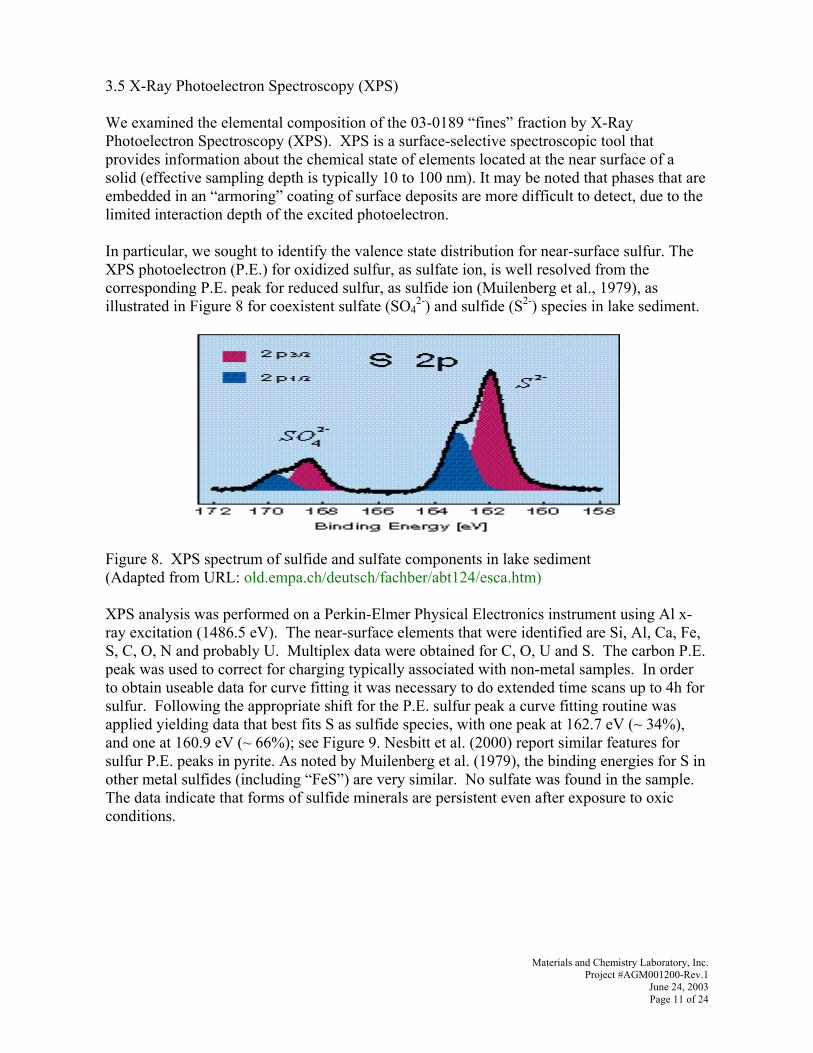
Materials and Chemistry Laboratory, Inc. Project #AGM001200-Rev.1
June 24, 2003 Page 11 of 24
3.5 X-Ray Photoelectron Spectroscopy (XPS) We examined the elemental composition of the 03-0189 “fines” fraction by X-Ray Photoelectron Spectroscopy (XPS). XPS is a surface-selective spectroscopic tool that provides information about the chemical state of elements located at the near surface of a solid (effective sampling depth is typically 10 to 100 nm). It may be noted that phases that are embedded in an “armoring” coating of surface deposits are more difficult to detect, due to the limited interaction depth of the excited photoelectron. In particular, we sought to identify the valence state distribution for near-surface sulfur. The XPS photoelectron (P.E.) for oxidized sulfur, as sulfate ion, is well resolved from the corresponding P.E. peak for reduced sulfur, as sulfide ion (Muilenberg et al., 1979), as illustrated in Figure 8 for coexistent sulfate (SO4
2-) and sulfide (S2-) species in lake sediment.
Figure 8. XPS spectrum of sulfide and sulfate components in lake sediment (Adapted from URL: old.empa.ch/deutsch/fachber/abt124/esca.htm) XPS analysis was performed on a Perkin-Elmer Physical Electronics instrument using Al x-ray excitation (1486.5 eV). The near-surface elements that were identified are Si, Al, Ca, Fe, S, C, O, N and probably U. Multiplex data were obtained for C, O, U and S. The carbon P.E. peak was used to correct for charging typically associated with non-metal samples. In order to obtain useable data for curve fitting it was necessary to do extended time scans up to 4h for sulfur. Following the appropriate shift for the P.E. sulfur peak a curve fitting routine was applied yielding data that best fits S as sulfide species, with one peak at 162.7 eV (~ 34%), and one at 160.9 eV (~ 66%); see Figure 9. Nesbitt et al. (2000) report similar features for sulfur P.E. peaks in pyrite. As noted by Muilenberg et al. (1979), the binding energies for S in other metal sulfides (including “FeS”) are very similar. No sulfate was found in the sample. The data indicate that forms of sulfide minerals are persistent even after exposure to oxic conditions.
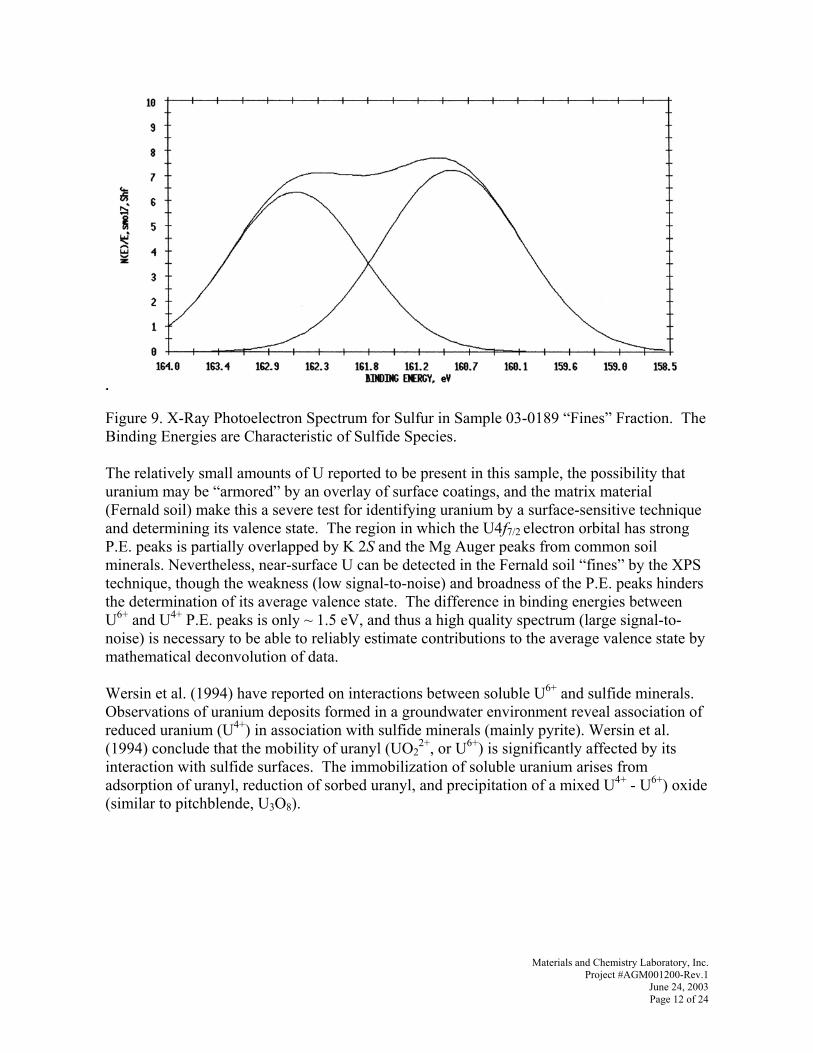
Materials and Chemistry Laboratory, Inc. Project #AGM001200-Rev.1
June 24, 2003 Page 12 of 24
Figure 9. X-Ray Photoelectron Spectrum for Sulfur in Sample 03-0189 “Fines” Fraction. The Binding Energies are Characteristic of Sulfide Species. The relatively small amounts of U reported to be present in this sample, the possibility that uranium may be “armored” by an overlay of surface coatings, and the matrix material (Fernald soil) make this a severe test for identifying uranium by a surface-sensitive technique and determining its valence state. The region in which the U4f7/2 electron orbital has strong P.E. peaks is partially overlapped by K 2S and the Mg Auger peaks from common soil minerals. Nevertheless, near-surface U can be detected in the Fernald soil “fines” by the XPS technique, though the weakness (low signal-to-noise) and broadness of the P.E. peaks hinders the determination of its average valence state. The difference in binding energies between U6+ and U4+ P.E. peaks is only ~ 1.5 eV, and thus a high quality spectrum (large signal-to-noise) is necessary to be able to reliably estimate contributions to the average valence state by mathematical deconvolution of data. Wersin et al. (1994) have reported on interactions between soluble U6+ and sulfide minerals. Observations of uranium deposits formed in a groundwater environment reveal association of reduced uranium (U4+) in association with sulfide minerals (mainly pyrite). Wersin et al. (1994) conclude that the mobility of uranyl (UO2
2+, or U6+) is significantly affected by its interaction with sulfide surfaces. The immobilization of soluble uranium arises from adsorption of uranyl, reduction of sorbed uranyl, and precipitation of a mixed U4+ - U6+) oxide (similar to pitchblende, U3O8).

Materials and Chemistry Laboratory, Inc. Project #AGM001200-Rev.1
June 24, 2003 Page 13 of 24
4. Selective Extraction Of Metal Contaminants In Soil Column Composites 4.1 Introduction Knowing more about the nature of the interaction between a contaminant and the local geochemistry provides an insight to the potential mobility of the contaminant and may help identify possible means for its remediation. There have been many (nominally) selective extraction schemes, performed individually or in a defined sequence, intended to help define the manner in which select metals are bound to soil matrix. These methods recognize that total soil metal inventory is of limited use in understanding bioavailability or metal mobility, and that it is useful to estimate the amount of metal present in different solid-phase forms. Many recent studies published in the technical literature have used a selected sequence of extractions from the soil matrix, with each successive lixivant solution increasing in its aggressiveness. The results of these sequential extractions (or “fractionation”) often allow a comparison of how tenaciously different metal contaminants partition to different soil and sediment compositions. The partitioning of contaminants to different geochemical fractions is related to the contaminant speciation (or chemical form), as well as other physiochemical factors (Loyland et al., 2000). Metals deemed least mobile in soil have a relatively small proportion of the total associated with the most readily accessible (or “exchangeable”) fraction whilst having the greatest proportion associated with the most refractory (or “residual”) fraction. Metals in the residual fraction are typically locked up within refractory crystalline mineral phases, and are not readily accessible to leach into the environment except on a geological time scale. The environmentally available fraction for many contaminants of interest is principally associated with the dominant Fe or Mn oxide phases, which are frequently present in soil and sediments as surface coatings. Despite the fact that it is very difficult to estimate sorption site densities in heterogeneous systems (von Gunten & Beneš, 1995), some published studies have used only the nominally selective extraction of ”amorphous” oxide phases, and analyzed the extract for Fe, Mn, and select trace metals in order to predict the geologic and biological availability of the trace metals of interest. For model studies of uranium associations with “amorphous” iron oxides, see, e.g., Payne and Waite, 1991; Del Nero et al., 1999; and Barnett et al, 2002. While these sequential extraction procedures cannot be used to identify the actual chemical or physical form of a given metal in soil (true “speciation”), they are useful in categorizing the metal partitioning into several operationally defined geochemical fractions (McLean and Bledsoe, 1992). However, there has been recent criticism of the various sequential extraction procedures (McLean and Bledsoe, 1992; von Gunten & Beneš, 1995; Scheckel et al., 2003). The methods are not entirely specific for a geological fraction of the soil and the lixivant used may also remove metals associated with other fractions. Also, the extractions may significantly change the properties (e.g., surface charge) of insoluble components of the sample, and alter the oxidation state of various components. Re-adsorption of the extracted metals to the remaining solid phase of the soil may occur leading to artificially low concentrations of the metal being associated with that fraction. Therefore the sequentially extracted fractions are only operationally defined through the extraction process and may or may not represent chemical species (Scheinost et al., 2002).
Materials and Chemistry Laboratory, Inc. Project #AGM001200-Rev.1
June 24, 2003 Page 14 of 24
McLean and Bledsoe (1992) have reviewed many of the various sequential extraction protocols that have been proposed. Chemical and methodological variations in the sequential extraction protocol make a comparison of results obtained by different methods and different authors difficult. The sequence of extractions originally recommended by Tessler et al. (1979), substantially equivalent to the modified recommendations of Phillips and Chapple (1995), appears to be the best documented and most frequently used protocol for estimating the partitioning of trace toxic metals in soil, and this protocol is used in the present study. The extraction procedures used for defined fractions are described below. (Note that the amount of metal liberated by a given lixivant is referenced back to the original soil mass taken, in order to estimate the equivalent metal content for that fraction as mg/kg). 4.2 Methods In this investigation, we have generally adapted the protocols recommended by Phillips and Chapple (1995). A sample of soil (~ 2-5 g) is contacted sequentially with a series of lixivant solutions of increasing aggressiveness for the extraction of bound metals. After each extraction step, the aqueous phase is separated by centrifugation (with use of IEC Centra MP4 centrifuge operated at 4,000 rpm for at least 8 min.). The decanted aqueous phase is filtered at 0.45-µm. In between each extraction step, the sample is resuspended in a small amount of deionized water, to wash away the preponderance of lixivant. The filtered extraction lixivant and wash solution are combined, digested with acid and peroxide (to destroy any interfering organic compounds), made up to a defined final volume and analyzed by inductively-coupled plasma with optical emission spectroscopy (ICP-OES). The residual solid phase from each extraction step is then resuspended in the next lixivant solution. The sequence of extractions is briefly described below.
• Fraction #1, “Exchangeable”, is estimated by contacting approximately 2-5 g of blended air-dried soil with 40 mL of 1 mol/L (95 g/L) MgCl2 solution (pH 7), by continuously shaking for 1-h at room temperature.
• Fraction #2, “Carbonate-bound”, is estimated by adding 40 mL of 1 mol/L (82 g/L) sodium acetate solution, adjusted to pH 8.2, to the soil residue. The solids are resuspended in the lixivant, and contact the phases contacted by continuous shaking for 6 h at room temperature.
• Fraction #3, “Oxide-Associated” or “Reducible,” is estimated by adding 40 mL hydroxylamine reagent (prepared by adding, per liter final volume of reagent, 0.04 mole (2.78 g) NH2OH•HCl and 250 mL acetic acid (balance demineralized water)). The container is capped. In order to gas pressure developed in the vessel when it is heated, the cap is punctured with a hypodermic sharp, and the cap and top of the vessel is wrapped in parafilm® (American National Can, Greenwich, CT). The film-wrapped vessel and contents are placed in a water bath maintained at 96 + 3 C for about 6 h, with occasional agitation of the bottle and contents.
Materials and Chemistry Laboratory, Inc. Project #AGM001200-Rev.1
June 24, 2003 Page 15 of 24
• Fraction #4, “Organic-bound” or “Oxidizable,” is estimated by extraction with ~ 12 mL of 0.02 mol/L HNO3 + 15 mL of acid peroxide solution (30 % (v/v) H2O2, with pH adjusted to 2). The solids are resuspended in this solution, and the slurry heated to ~ 85 + 2 C for 2 h with occasional shaking. The container and contents are allowed to cool to room temperature. Next, add ~ 20 mL of a solution containing 3.2 mol/L (247 g/L) ammonium acetate in 20% (v/v) HNO3, and the bottle and contents are shaken continuously for 0.5 h at room temperature.
• Fraction #5, “Residual.” In our protocol, the “Residual” fraction is operationally defined as the mass balance difference between the sums of metal recovered by the sequential extractions (Fractions 1-4, described above) and the “environmentally-assessable” metal inventory of the original material. The latter inventory is determined using a separate aliquot of the original soil sample, after aggressive strong acid and peroxide digestion as described in USEPA Method 3050.
For the column study samples, we performed the extractions in sturdy polycarbonate Oak Ridge centrifuge tubes, with gasketed screw cap lids. However, the slow decomposition of dolomite at pH 2 (Step #4, above) caused CO2 over-pressurization of sample 03-0193, which was subsequently lost. 4.3 Total Environmentally Accessible Metal Inventory As noted by Tessler et al. (1978), metals in the residual fraction are not released into solution phase over a reasonable time span under the conditions normally encountered in nature. Aggressive and hazardous media such as high temperature alkali fusion or strong acid plus hydrogen fluoride are sometime used in an attempt to digest the “residual” fraction, i.e., the insoluble residue remaining after the first four extraction steps. For safety reasons similar to those presented by Scheckel et al. (2003), we have instead opted for determination of the “environmentally accessible” metal inventory, using the EPA Method 3050 extraction procedure. This method does not completely digest all residual components of the soil matrix; for Standard Reference Material NIST 2711 (contaminated Montana soil), reported Method 3050 leach recoveries are relatively low (< 30%) for highly refractory matrix elements such as Si and Al (Gao and Silox, 1993), but analytical recoveries are relatively high (>75%) for most toxic metals in this material. We have used the EPA 3050 methodology to estimate the inventory of potentially mobile metal in the soil sample before sequential extraction, as summarized in Table 5 (detection by ICP-OES, unless otherwise noted).
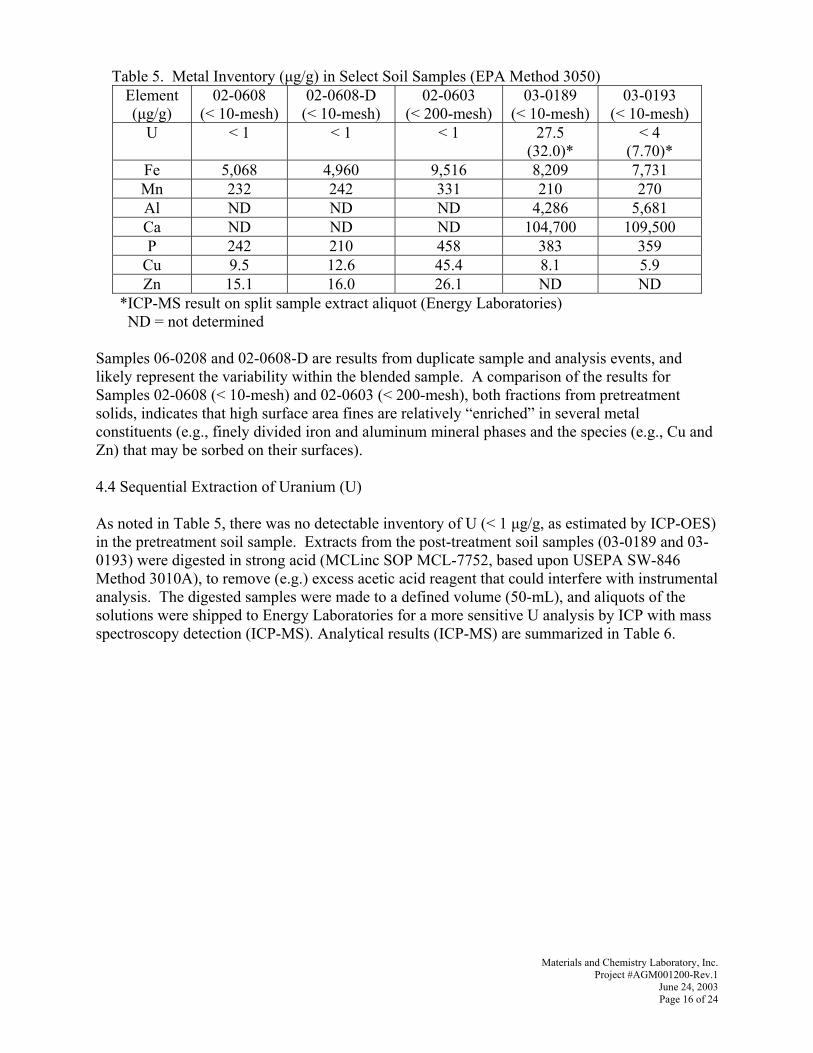
Materials and Chemistry Laboratory, Inc. Project #AGM001200-Rev.1
June 24, 2003 Page 16 of 24
Table 5. Metal Inventory (µg/g) in Select Soil Samples (EPA Method 3050) Element (µg/g)
02-0608 (< 10-mesh)
02-0608-D (< 10-mesh)
02-0603 (< 200-mesh)
03-0189 (< 10-mesh)
03-0193 (< 10-mesh)
U < 1 < 1 < 1 27.5 (32.0)*
< 4 (7.70)*
Fe 5,068 4,960 9,516 8,209 7,731 Mn 232 242 331 210 270 Al ND ND ND 4,286 5,681 Ca ND ND ND 104,700 109,500 P 242 210 458 383 359
Cu 9.5 12.6 45.4 8.1 5.9 Zn 15.1 16.0 26.1 ND ND
*ICP-MS result on split sample extract aliquot (Energy Laboratories) ND = not determined
Samples 06-0208 and 02-0608-D are results from duplicate sample and analysis events, and likely represent the variability within the blended sample. A comparison of the results for Samples 02-0608 (< 10-mesh) and 02-0603 (< 200-mesh), both fractions from pretreatment solids, indicates that high surface area fines are relatively “enriched” in several metal constituents (e.g., finely divided iron and aluminum mineral phases and the species (e.g., Cu and Zn) that may be sorbed on their surfaces). 4.4 Sequential Extraction of Uranium (U) As noted in Table 5, there was no detectable inventory of U (< 1 µg/g, as estimated by ICP-OES) in the pretreatment soil sample. Extracts from the post-treatment soil samples (03-0189 and 03-0193) were digested in strong acid (MCLinc SOP MCL-7752, based upon USEPA SW-846 Method 3010A), to remove (e.g.) excess acetic acid reagent that could interfere with instrumental analysis. The digested samples were made to a defined volume (50-mL), and aliquots of the solutions were shipped to Energy Laboratories for a more sensitive U analysis by ICP with mass spectroscopy detection (ICP-MS). Analytical results (ICP-MS) are summarized in Table 6.
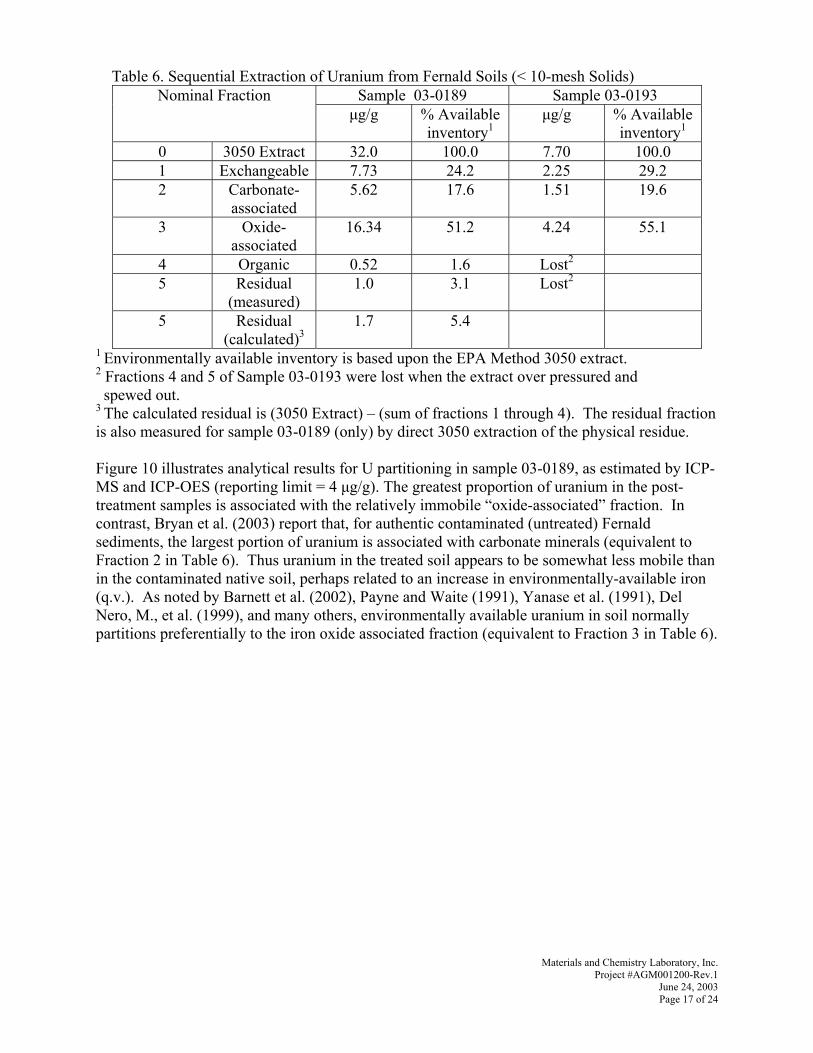
Materials and Chemistry Laboratory, Inc. Project #AGM001200-Rev.1
June 24, 2003 Page 17 of 24
Table 6. Sequential Extraction of Uranium from Fernald Soils (< 10-mesh Solids) Sample 03-0189 Sample 03-0193 Nominal Fraction
µg/g % Available inventory1
µg/g % Available inventory1
0 3050 Extract 32.0 100.0 7.70 100.0 1 Exchangeable 7.73 24.2 2.25 29.2 2 Carbonate-
associated 5.62 17.6 1.51 19.6
3 Oxide-associated
16.34 51.2 4.24 55.1
4 Organic 0.52 1.6 Lost2 5 Residual
(measured) 1.0 3.1 Lost2
5 Residual (calculated)3
1.7 5.4
1 Environmentally available inventory is based upon the EPA Method 3050 extract. 2 Fractions 4 and 5 of Sample 03-0193 were lost when the extract over pressured and spewed out. 3 The calculated residual is (3050 Extract) – (sum of fractions 1 through 4). The residual fraction is also measured for sample 03-0189 (only) by direct 3050 extraction of the physical residue. Figure 10 illustrates analytical results for U partitioning in sample 03-0189, as estimated by ICP-MS and ICP-OES (reporting limit = 4 µg/g). The greatest proportion of uranium in the post-treatment samples is associated with the relatively immobile “oxide-associated” fraction. In contrast, Bryan et al. (2003) report that, for authentic contaminated (untreated) Fernald sediments, the largest portion of uranium is associated with carbonate minerals (equivalent to Fraction 2 in Table 6). Thus uranium in the treated soil appears to be somewhat less mobile than in the contaminated native soil, perhaps related to an increase in environmentally-available iron (q.v.). As noted by Barnett et al. (2002), Payne and Waite (1991), Yanase et al. (1991), Del Nero, M., et al. (1999), and many others, environmentally available uranium in soil normally partitions preferentially to the iron oxide associated fraction (equivalent to Fraction 3 in Table 6).
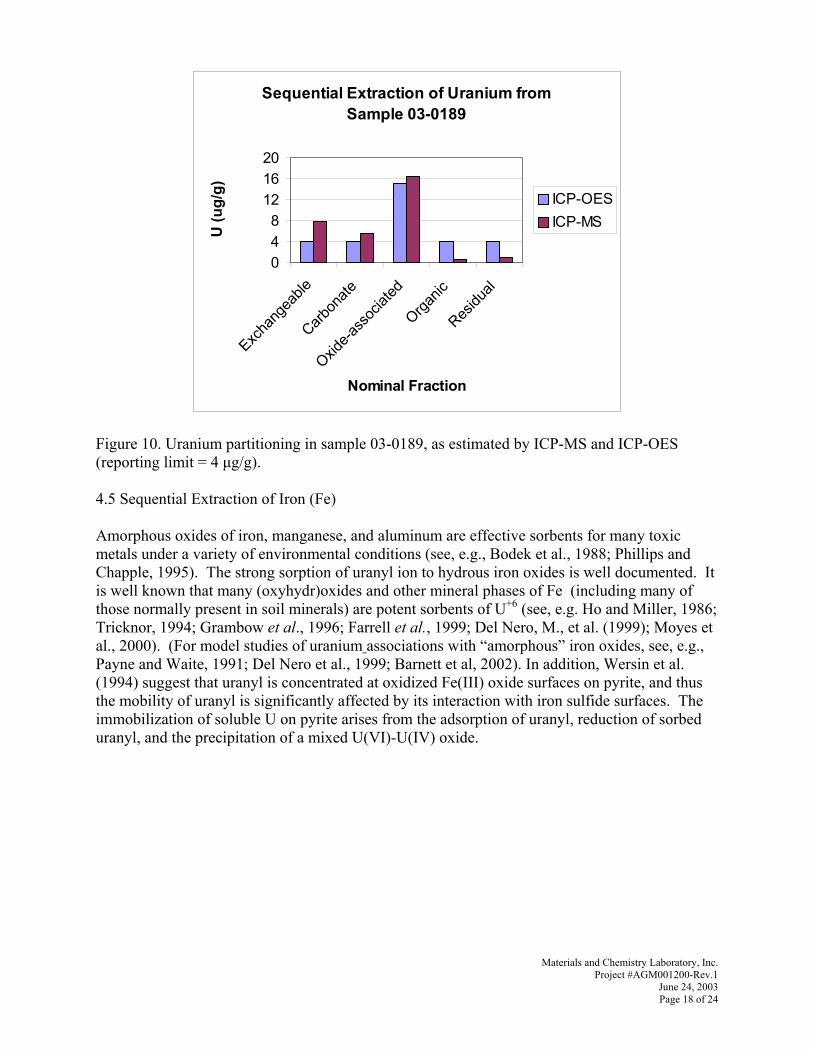
Materials and Chemistry Laboratory, Inc. Project #AGM001200-Rev.1
June 24, 2003 Page 18 of 24
Figure 10. Uranium partitioning in sample 03-0189, as estimated by ICP-MS and ICP-OES (reporting limit = 4 µg/g). 4.5 Sequential Extraction of Iron (Fe) Amorphous oxides of iron, manganese, and aluminum are effective sorbents for many toxic metals under a variety of environmental conditions (see, e.g., Bodek et al., 1988; Phillips and Chapple, 1995). The strong sorption of uranyl ion to hydrous iron oxides is well documented. It is well known that many (oxyhydr)oxides and other mineral phases of Fe (including many of those normally present in soil minerals) are potent sorbents of U+6 (see, e.g. Ho and Miller, 1986; Tricknor, 1994; Grambow et al., 1996; Farrell et al., 1999; Del Nero, M., et al. (1999); Moyes et al., 2000). (For model studies of uranium associations with “amorphous” iron oxides, see, e.g., Payne and Waite, 1991; Del Nero et al., 1999; Barnett et al, 2002). In addition, Wersin et al. (1994) suggest that uranyl is concentrated at oxidized Fe(III) oxide surfaces on pyrite, and thus the mobility of uranyl is significantly affected by its interaction with iron sulfide surfaces. The immobilization of soluble U on pyrite arises from the adsorption of uranyl, reduction of sorbed uranyl, and the precipitation of a mixed U(VI)-U(IV) oxide.
Sequential Extraction of Uranium from Sample 03-0189
048
121620
Excha
ngea
ble
Carbon
ate
Oxide-a
ssoc
iated
Organic
Residu
al
Nominal Fraction
U (u
g/g) ICP-OES
ICP-MS
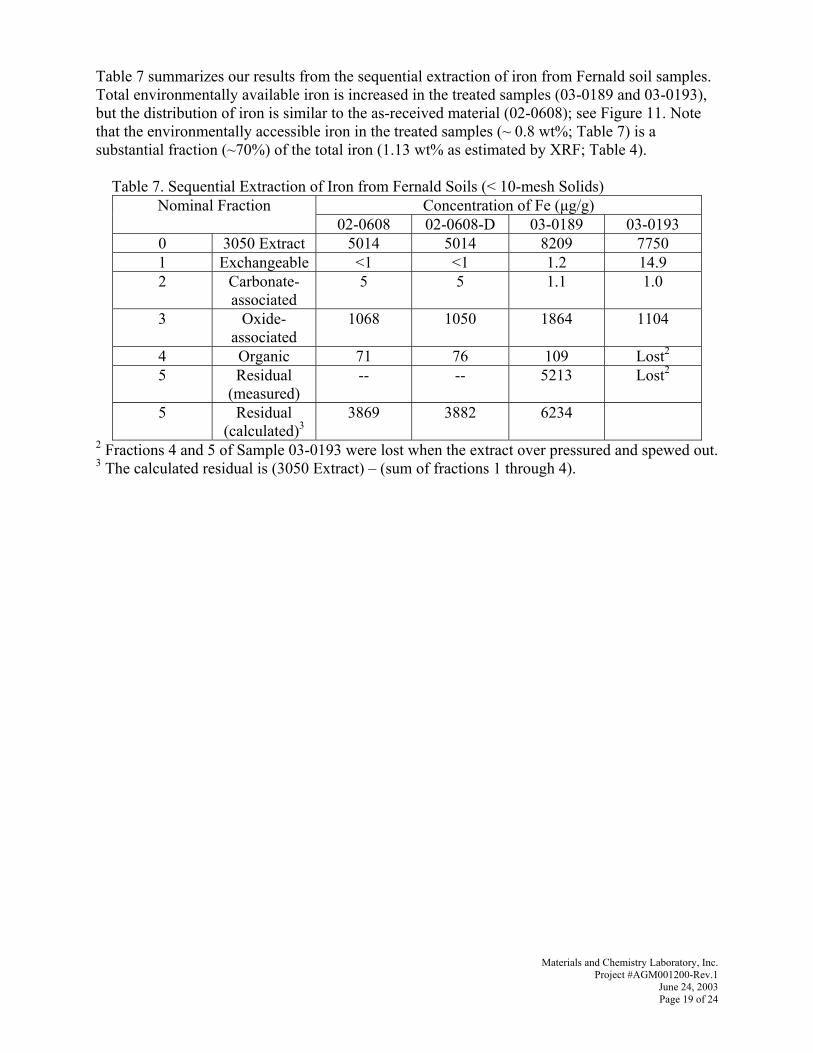
Materials and Chemistry Laboratory, Inc. Project #AGM001200-Rev.1
June 24, 2003 Page 19 of 24
Table 7 summarizes our results from the sequential extraction of iron from Fernald soil samples. Total environmentally available iron is increased in the treated samples (03-0189 and 03-0193), but the distribution of iron is similar to the as-received material (02-0608); see Figure 11. Note that the environmentally accessible iron in the treated samples (~ 0.8 wt%; Table 7) is a substantial fraction (~70%) of the total iron (1.13 wt% as estimated by XRF; Table 4). Table 7. Sequential Extraction of Iron from Fernald Soils (< 10-mesh Solids)
Concentration of Fe (µg/g) Nominal Fraction 02-0608 02-0608-D 03-0189 03-0193
0 3050 Extract 5014 5014 8209 7750 1 Exchangeable <1 <1 1.2 14.9 2 Carbonate-
associated 5 5 1.1 1.0
3 Oxide-associated
1068 1050 1864 1104
4 Organic 71 76 109 Lost2 5 Residual
(measured) -- -- 5213 Lost2
5 Residual (calculated)3
3869 3882 6234
2 Fractions 4 and 5 of Sample 03-0193 were lost when the extract over pressured and spewed out. 3 The calculated residual is (3050 Extract) – (sum of fractions 1 through 4).
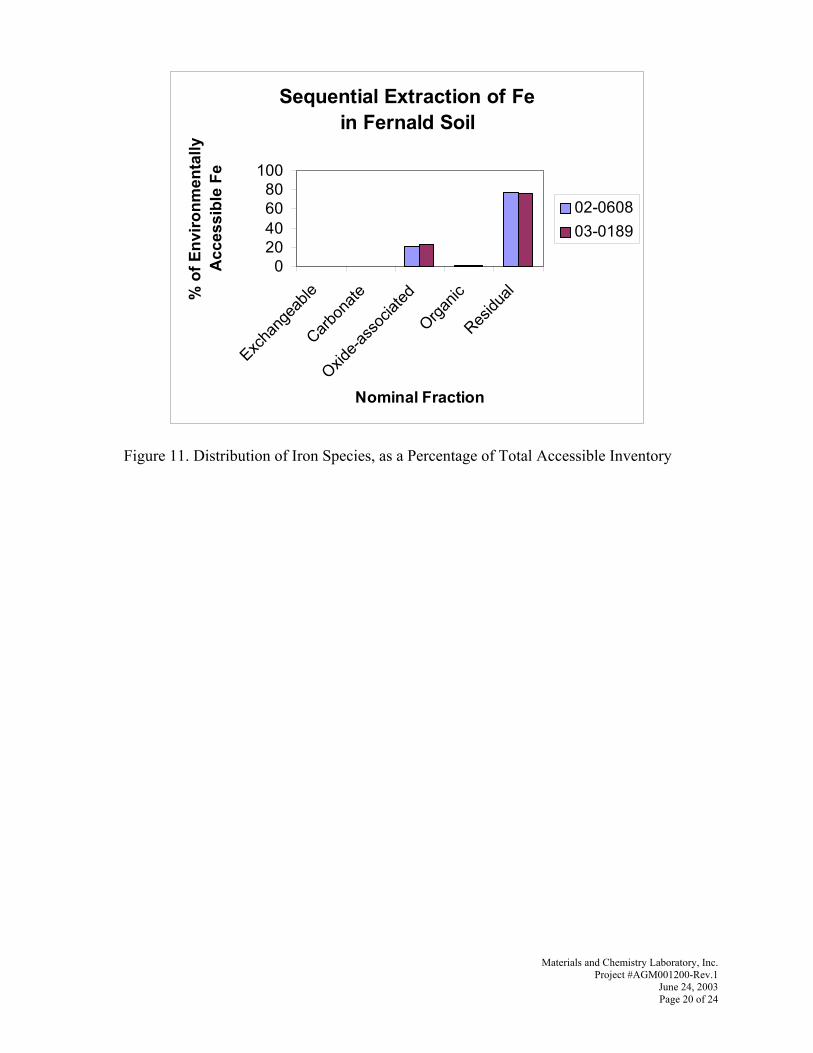
Materials and Chemistry Laboratory, Inc. Project #AGM001200-Rev.1
June 24, 2003 Page 20 of 24
Figure 11. Distribution of Iron Species, as a Percentage of Total Accessible Inventory
Sequential Extraction of Fe in Fernald Soil
020406080
100
Excha
ngea
ble
Carbon
ate
Oxide-a
ssoc
iated
Organic
Residu
al
Nominal Fraction
% o
f Env
ironm
enta
lly
Acc
essi
ble
Fe02-060803-0189
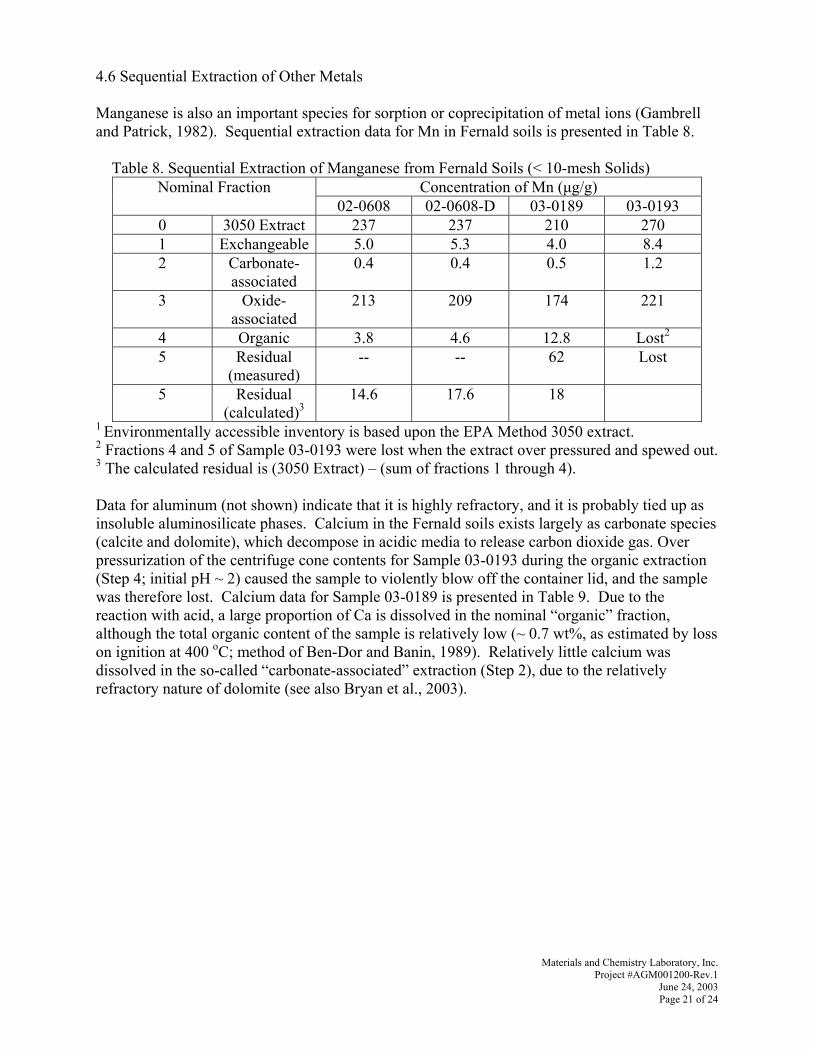
Materials and Chemistry Laboratory, Inc. Project #AGM001200-Rev.1
June 24, 2003 Page 21 of 24
4.6 Sequential Extraction of Other Metals Manganese is also an important species for sorption or coprecipitation of metal ions (Gambrell and Patrick, 1982). Sequential extraction data for Mn in Fernald soils is presented in Table 8. Table 8. Sequential Extraction of Manganese from Fernald Soils (< 10-mesh Solids)
Concentration of Mn (µg/g) Nominal Fraction 02-0608 02-0608-D 03-0189 03-0193
0 3050 Extract 237 237 210 270 1 Exchangeable 5.0 5.3 4.0 8.4 2 Carbonate-
associated 0.4 0.4 0.5 1.2
3 Oxide-associated
213 209 174 221
4 Organic 3.8 4.6 12.8 Lost2 5 Residual
(measured) -- -- 62 Lost
5 Residual (calculated)3
14.6 17.6 18
1 Environmentally accessible inventory is based upon the EPA Method 3050 extract. 2 Fractions 4 and 5 of Sample 03-0193 were lost when the extract over pressured and spewed out. 3 The calculated residual is (3050 Extract) – (sum of fractions 1 through 4). Data for aluminum (not shown) indicate that it is highly refractory, and it is probably tied up as insoluble aluminosilicate phases. Calcium in the Fernald soils exists largely as carbonate species (calcite and dolomite), which decompose in acidic media to release carbon dioxide gas. Over pressurization of the centrifuge cone contents for Sample 03-0193 during the organic extraction (Step 4; initial pH ~ 2) caused the sample to violently blow off the container lid, and the sample was therefore lost. Calcium data for Sample 03-0189 is presented in Table 9. Due to the reaction with acid, a large proportion of Ca is dissolved in the nominal “organic” fraction, although the total organic content of the sample is relatively low (~ 0.7 wt%, as estimated by loss on ignition at 400 oC; method of Ben-Dor and Banin, 1989). Relatively little calcium was dissolved in the so-called “carbonate-associated” extraction (Step 2), due to the relatively refractory nature of dolomite (see also Bryan et al., 2003).
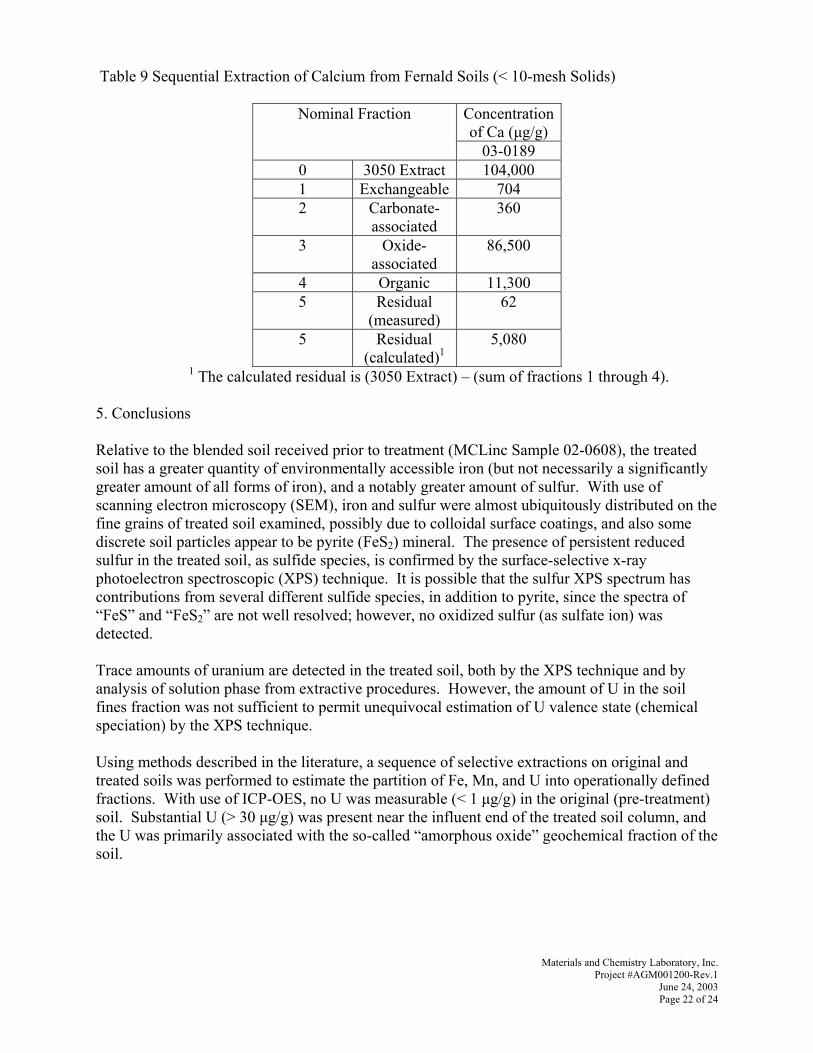
Materials and Chemistry Laboratory, Inc. Project #AGM001200-Rev.1
June 24, 2003 Page 22 of 24
Table 9 Sequential Extraction of Calcium from Fernald Soils (< 10-mesh Solids)
Concentration of Ca (µg/g)
Nominal Fraction
03-0189 0 3050 Extract 104,000 1 Exchangeable 704 2 Carbonate-
associated 360
3 Oxide-associated
86,500
4 Organic 11,300 5 Residual
(measured) 62
5 Residual (calculated)1
5,080
1 The calculated residual is (3050 Extract) – (sum of fractions 1 through 4). 5. Conclusions Relative to the blended soil received prior to treatment (MCLinc Sample 02-0608), the treated soil has a greater quantity of environmentally accessible iron (but not necessarily a significantly greater amount of all forms of iron), and a notably greater amount of sulfur. With use of scanning electron microscopy (SEM), iron and sulfur were almost ubiquitously distributed on the fine grains of treated soil examined, possibly due to colloidal surface coatings, and also some discrete soil particles appear to be pyrite (FeS2) mineral. The presence of persistent reduced sulfur in the treated soil, as sulfide species, is confirmed by the surface-selective x-ray photoelectron spectroscopic (XPS) technique. It is possible that the sulfur XPS spectrum has contributions from several different sulfide species, in addition to pyrite, since the spectra of “FeS” and “FeS2” are not well resolved; however, no oxidized sulfur (as sulfate ion) was detected. Trace amounts of uranium are detected in the treated soil, both by the XPS technique and by analysis of solution phase from extractive procedures. However, the amount of U in the soil fines fraction was not sufficient to permit unequivocal estimation of U valence state (chemical speciation) by the XPS technique. Using methods described in the literature, a sequence of selective extractions on original and treated soils was performed to estimate the partition of Fe, Mn, and U into operationally defined fractions. With use of ICP-OES, no U was measurable (< 1 µg/g) in the original (pre-treatment) soil. Substantial U (> 30 µg/g) was present near the influent end of the treated soil column, and the U was primarily associated with the so-called “amorphous oxide” geochemical fraction of the soil.
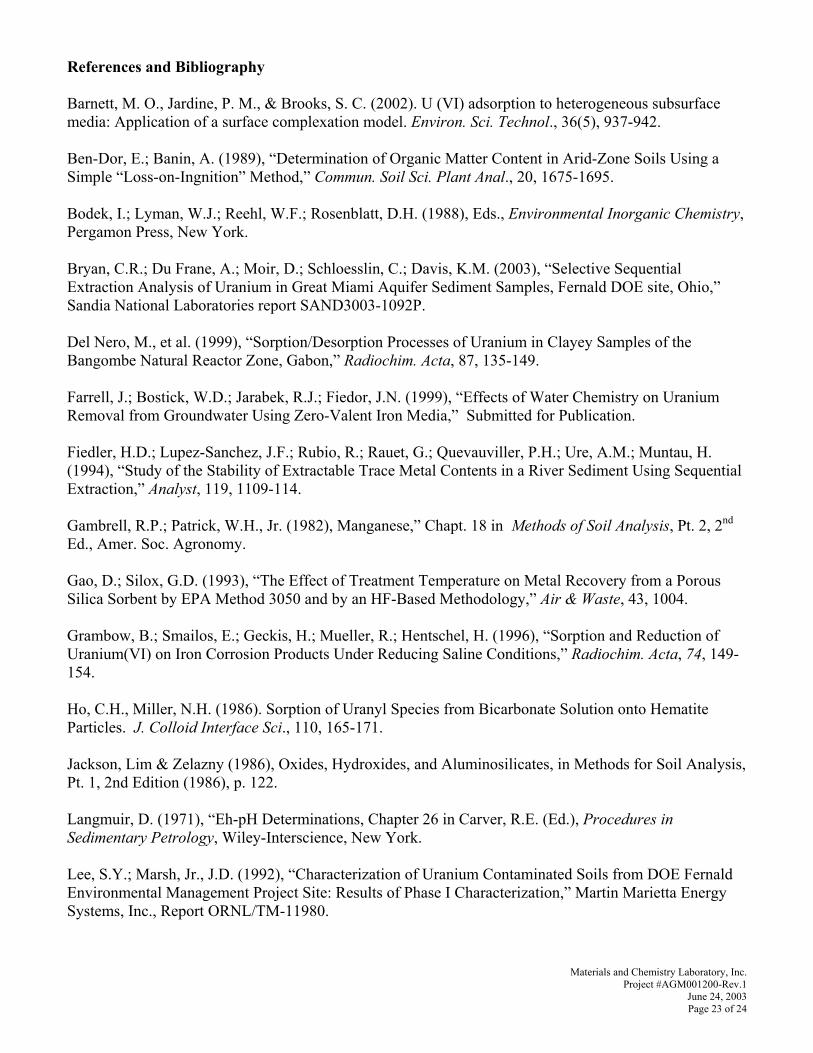
Materials and Chemistry Laboratory, Inc. Project #AGM001200-Rev.1
June 24, 2003 Page 23 of 24
References and Bibliography Barnett, M. O., Jardine, P. M., & Brooks, S. C. (2002). U (VI) adsorption to heterogeneous subsurface media: Application of a surface complexation model. Environ. Sci. Technol., 36(5), 937-942. Ben-Dor, E.; Banin, A. (1989), “Determination of Organic Matter Content in Arid-Zone Soils Using a Simple “Loss-on-Ingnition” Method,” Commun. Soil Sci. Plant Anal., 20, 1675-1695. Bodek, I.; Lyman, W.J.; Reehl, W.F.; Rosenblatt, D.H. (1988), Eds., Environmental Inorganic Chemistry, Pergamon Press, New York. Bryan, C.R.; Du Frane, A.; Moir, D.; Schloesslin, C.; Davis, K.M. (2003), “Selective Sequential Extraction Analysis of Uranium in Great Miami Aquifer Sediment Samples, Fernald DOE site, Ohio,” Sandia National Laboratories report SAND3003-1092P. Del Nero, M., et al. (1999), “Sorption/Desorption Processes of Uranium in Clayey Samples of the Bangombe Natural Reactor Zone, Gabon,” Radiochim. Acta, 87, 135-149. Farrell, J.; Bostick, W.D.; Jarabek, R.J.; Fiedor, J.N. (1999), “Effects of Water Chemistry on Uranium Removal from Groundwater Using Zero-Valent Iron Media,” Submitted for Publication. Fiedler, H.D.; Lupez-Sanchez, J.F.; Rubio, R.; Rauet, G.; Quevauviller, P.H.; Ure, A.M.; Muntau, H. (1994), “Study of the Stability of Extractable Trace Metal Contents in a River Sediment Using Sequential Extraction,” Analyst, 119, 1109-114. Gambrell, R.P.; Patrick, W.H., Jr. (1982), Manganese,” Chapt. 18 in Methods of Soil Analysis, Pt. 2, 2nd Ed., Amer. Soc. Agronomy. Gao, D.; Silox, G.D. (1993), “The Effect of Treatment Temperature on Metal Recovery from a Porous Silica Sorbent by EPA Method 3050 and by an HF-Based Methodology,” Air & Waste, 43, 1004. Grambow, B.; Smailos, E.; Geckis, H.; Mueller, R.; Hentschel, H. (1996), “Sorption and Reduction of Uranium(VI) on Iron Corrosion Products Under Reducing Saline Conditions,” Radiochim. Acta, 74, 149-154. Ho, C.H., Miller, N.H. (1986). Sorption of Uranyl Species from Bicarbonate Solution onto Hematite Particles. J. Colloid Interface Sci., 110, 165-171. Jackson, Lim & Zelazny (1986), Oxides, Hydroxides, and Aluminosilicates, in Methods for Soil Analysis, Pt. 1, 2nd Edition (1986), p. 122. Langmuir, D. (1971), “Eh-pH Determinations, Chapter 26 in Carver, R.E. (Ed.), Procedures in Sedimentary Petrology, Wiley-Interscience, New York. Lee, S.Y.; Marsh, Jr., J.D. (1992), “Characterization of Uranium Contaminated Soils from DOE Fernald Environmental Management Project Site: Results of Phase I Characterization,” Martin Marietta Energy Systems, Inc., Report ORNL/TM-11980.
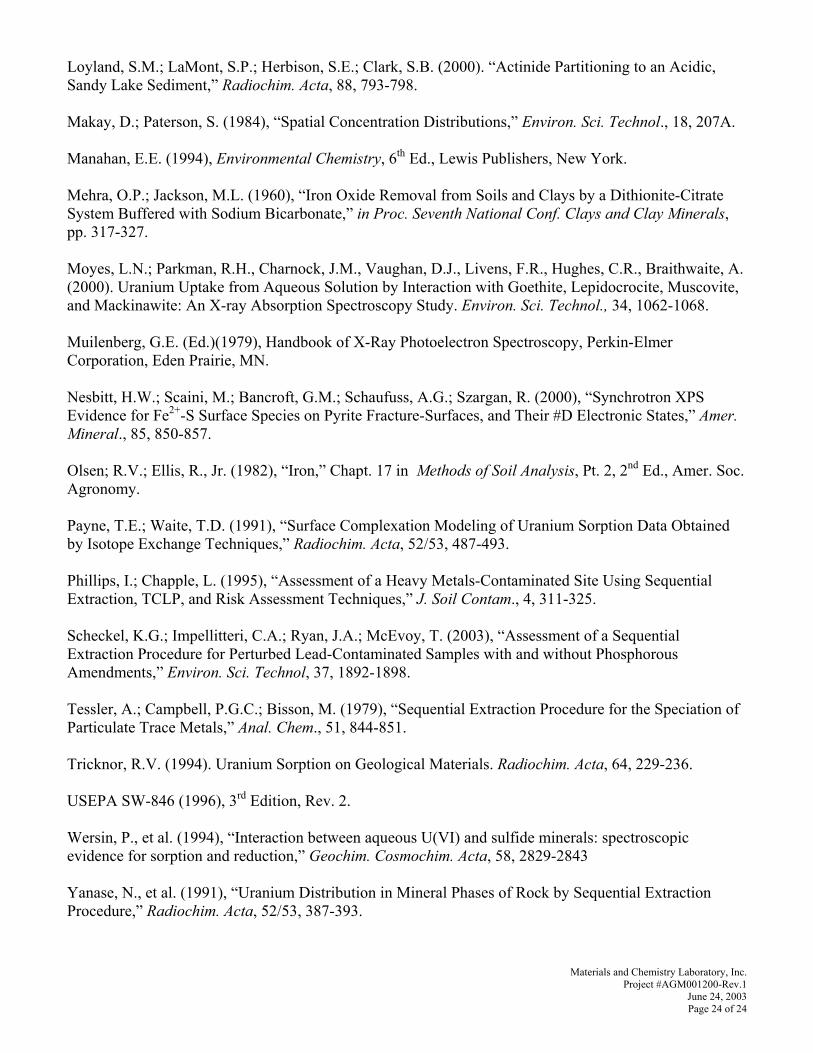
Materials and Chemistry Laboratory, Inc. Project #AGM001200-Rev.1
June 24, 2003 Page 24 of 24
Loyland, S.M.; LaMont, S.P.; Herbison, S.E.; Clark, S.B. (2000). “Actinide Partitioning to an Acidic, Sandy Lake Sediment,” Radiochim. Acta, 88, 793-798. Makay, D.; Paterson, S. (1984), “Spatial Concentration Distributions,” Environ. Sci. Technol., 18, 207A. Manahan, E.E. (1994), Environmental Chemistry, 6th Ed., Lewis Publishers, New York. Mehra, O.P.; Jackson, M.L. (1960), “Iron Oxide Removal from Soils and Clays by a Dithionite-Citrate System Buffered with Sodium Bicarbonate,” in Proc. Seventh National Conf. Clays and Clay Minerals, pp. 317-327. Moyes, L.N.; Parkman, R.H., Charnock, J.M., Vaughan, D.J., Livens, F.R., Hughes, C.R., Braithwaite, A. (2000). Uranium Uptake from Aqueous Solution by Interaction with Goethite, Lepidocrocite, Muscovite, and Mackinawite: An X-ray Absorption Spectroscopy Study. Environ. Sci. Technol., 34, 1062-1068. Muilenberg, G.E. (Ed.)(1979), Handbook of X-Ray Photoelectron Spectroscopy, Perkin-Elmer Corporation, Eden Prairie, MN. Nesbitt, H.W.; Scaini, M.; Bancroft, G.M.; Schaufuss, A.G.; Szargan, R. (2000), “Synchrotron XPS Evidence for Fe2+-S Surface Species on Pyrite Fracture-Surfaces, and Their #D Electronic States,” Amer. Mineral., 85, 850-857. Olsen; R.V.; Ellis, R., Jr. (1982), “Iron,” Chapt. 17 in Methods of Soil Analysis, Pt. 2, 2nd Ed., Amer. Soc. Agronomy. Payne, T.E.; Waite, T.D. (1991), “Surface Complexation Modeling of Uranium Sorption Data Obtained by Isotope Exchange Techniques,” Radiochim. Acta, 52/53, 487-493. Phillips, I.; Chapple, L. (1995), “Assessment of a Heavy Metals-Contaminated Site Using Sequential Extraction, TCLP, and Risk Assessment Techniques,” J. Soil Contam., 4, 311-325. Scheckel, K.G.; Impellitteri, C.A.; Ryan, J.A.; McEvoy, T. (2003), “Assessment of a Sequential Extraction Procedure for Perturbed Lead-Contaminated Samples with and without Phosphorous Amendments,” Environ. Sci. Technol, 37, 1892-1898. Tessler, A.; Campbell, P.G.C.; Bisson, M. (1979), “Sequential Extraction Procedure for the Speciation of Particulate Trace Metals,” Anal. Chem., 51, 844-851. Tricknor, R.V. (1994). Uranium Sorption on Geological Materials. Radiochim. Acta, 64, 229-236. USEPA SW-846 (1996), 3rd Edition, Rev. 2. Wersin, P., et al. (1994), “Interaction between aqueous U(VI) and sulfide minerals: spectroscopic evidence for sorption and reduction,” Geochim. Cosmochim. Acta, 58, 2829-2843 Yanase, N., et al. (1991), “Uranium Distribution in Mineral Phases of Rock by Sequential Extraction Procedure,” Radiochim. Acta, 52/53, 387-393.

Appendix B
Soil Boring Log for Monitoring Well 33264
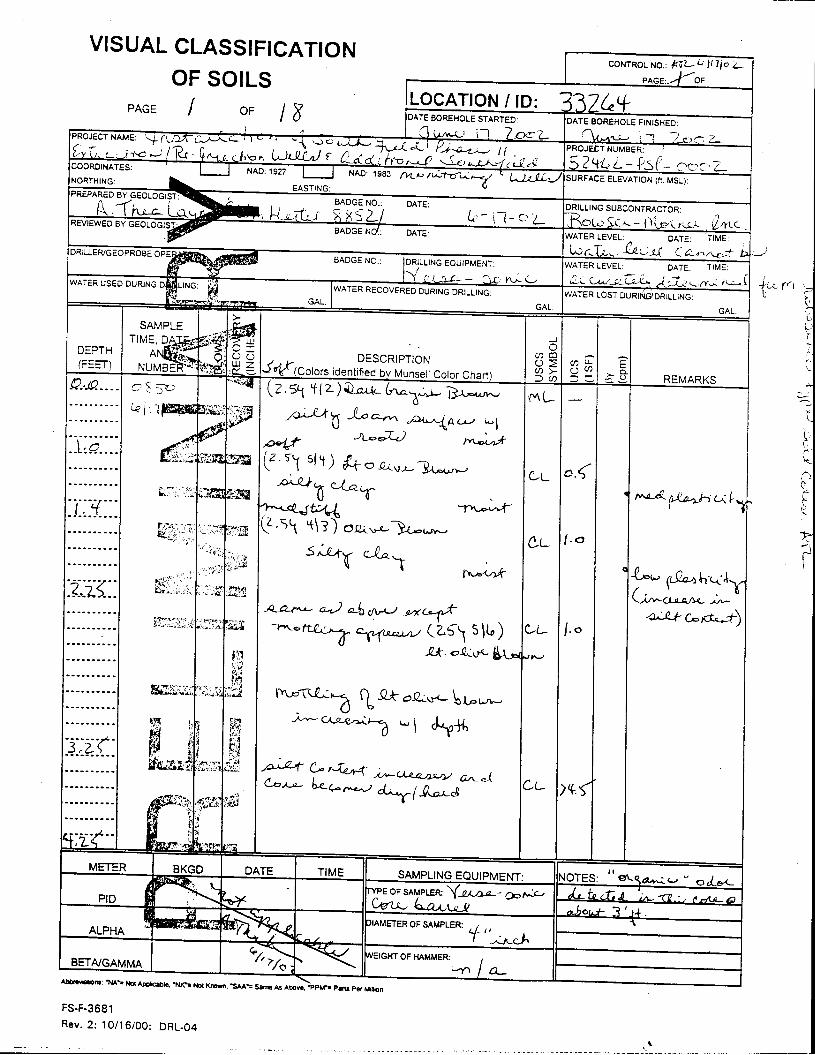
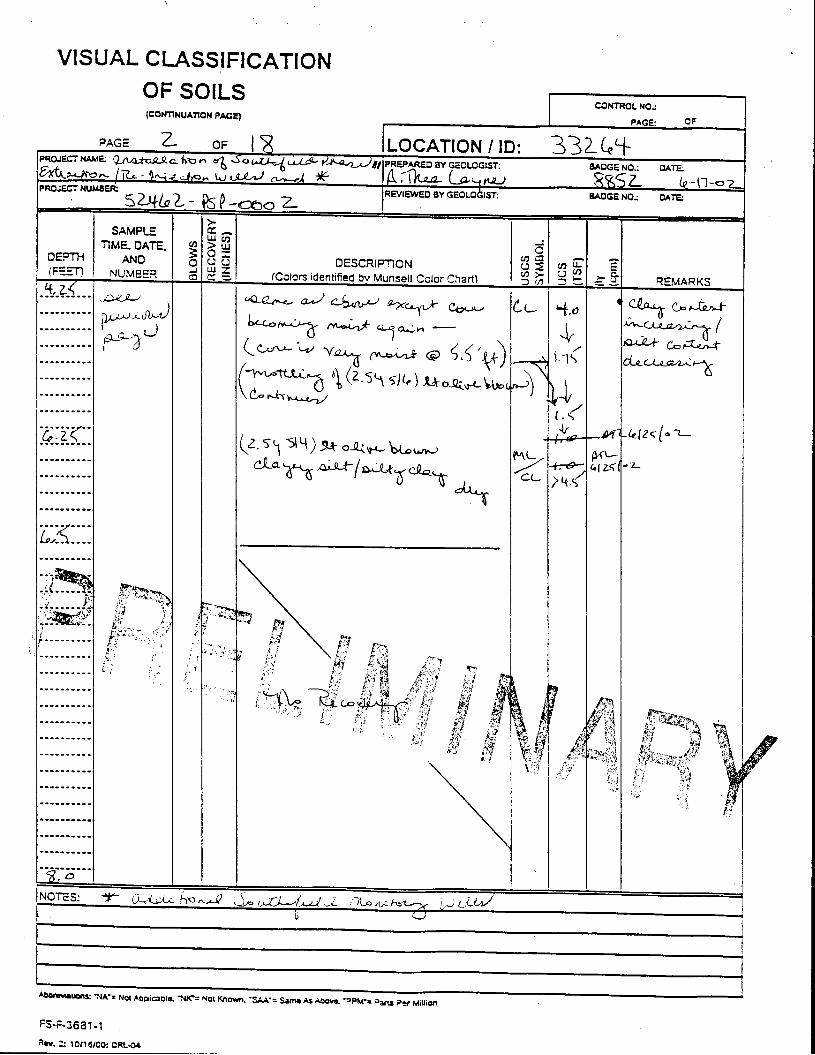
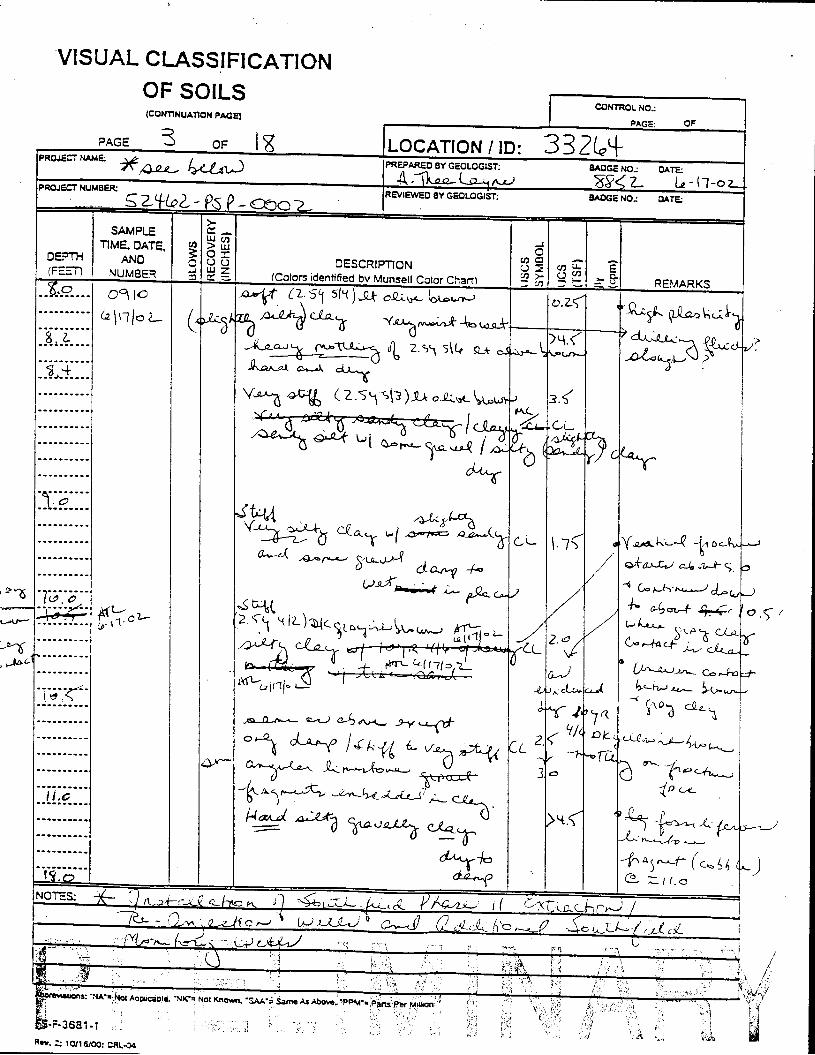
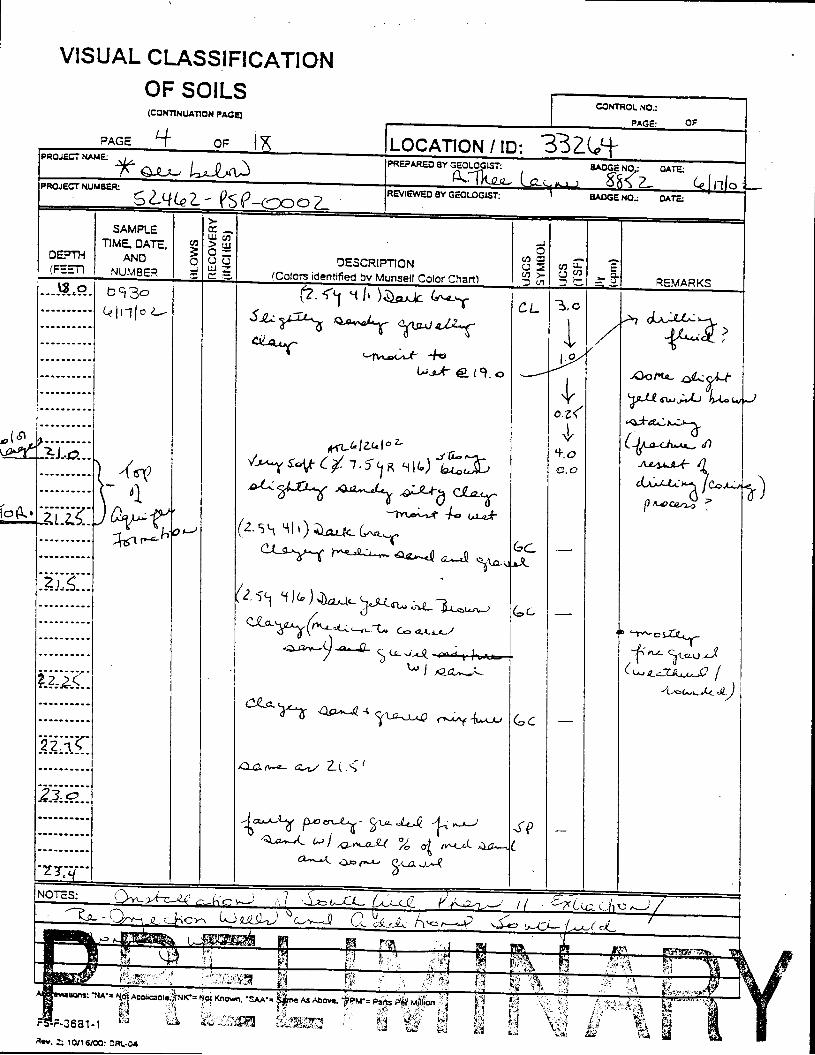
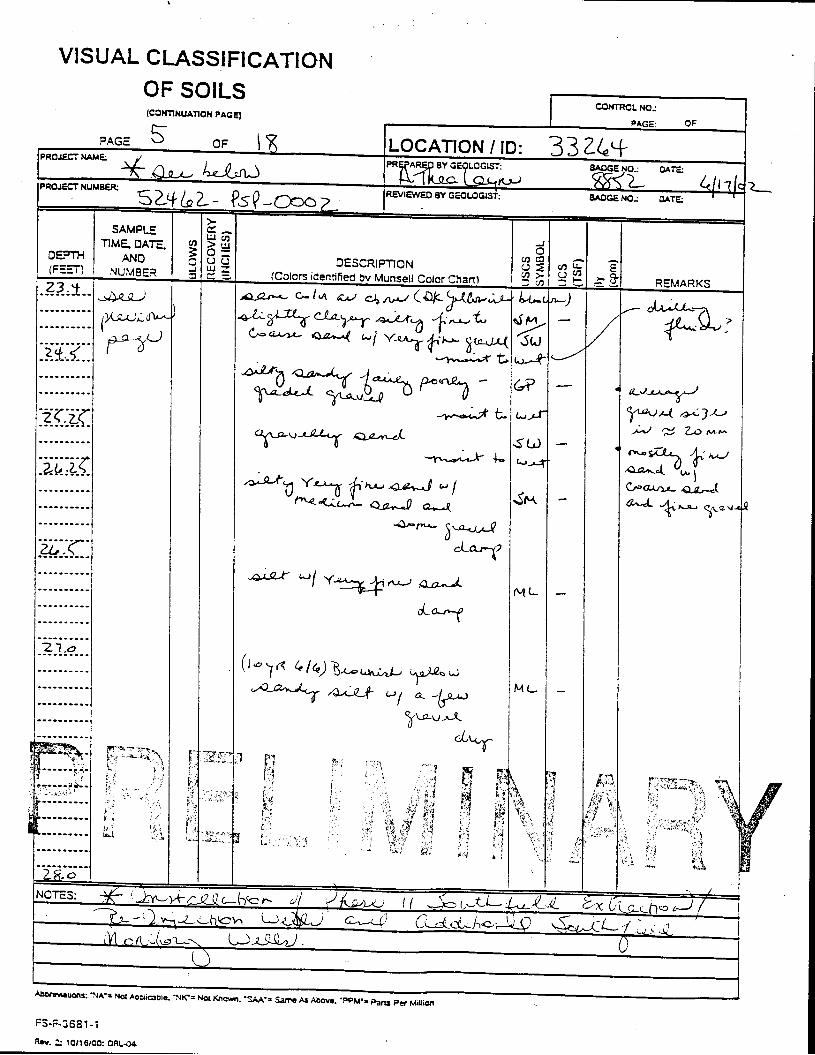
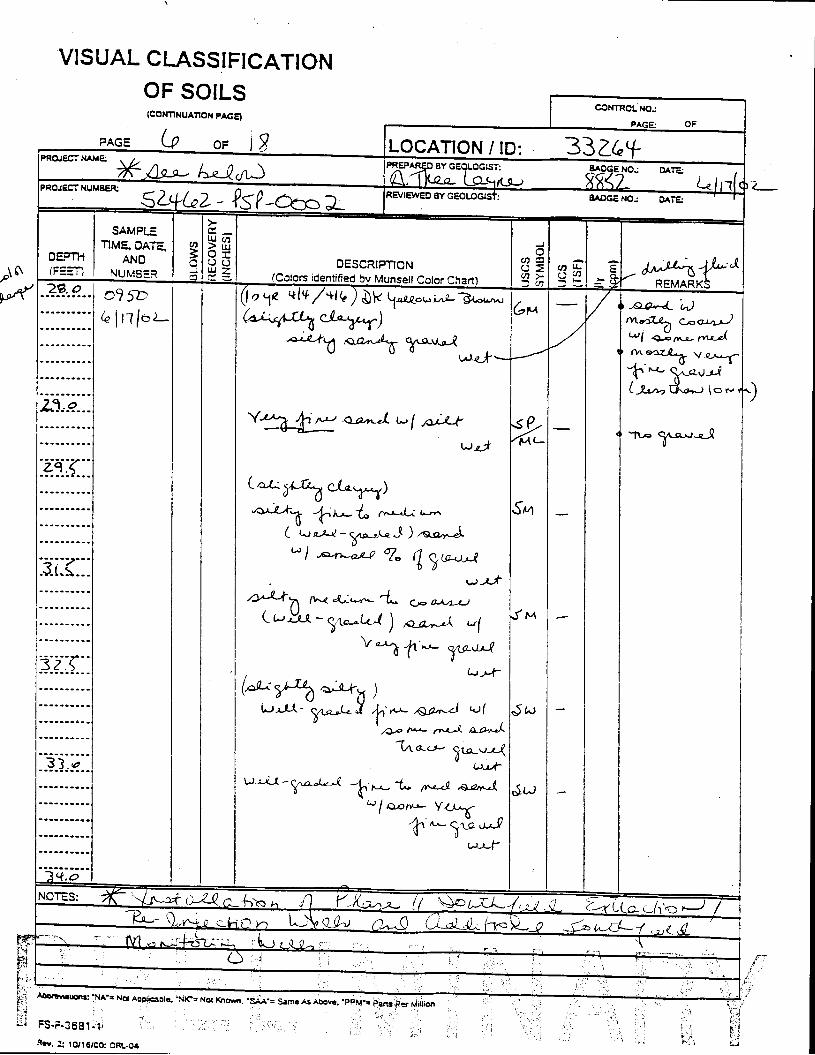
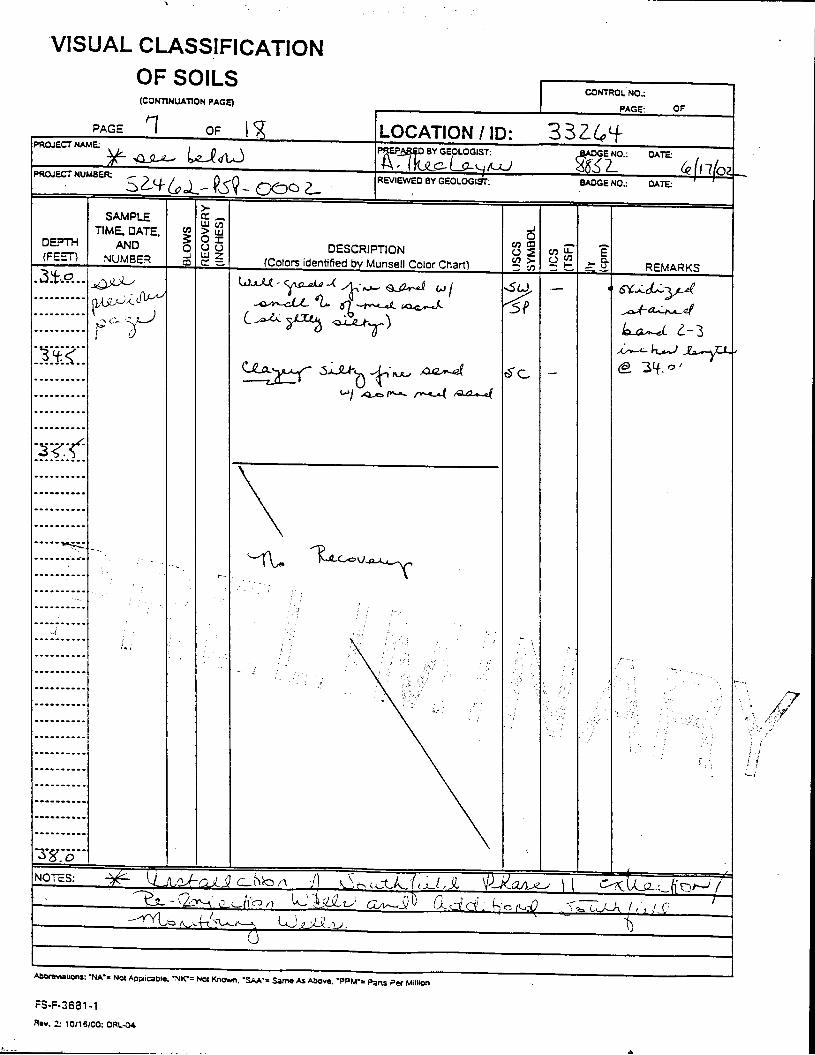
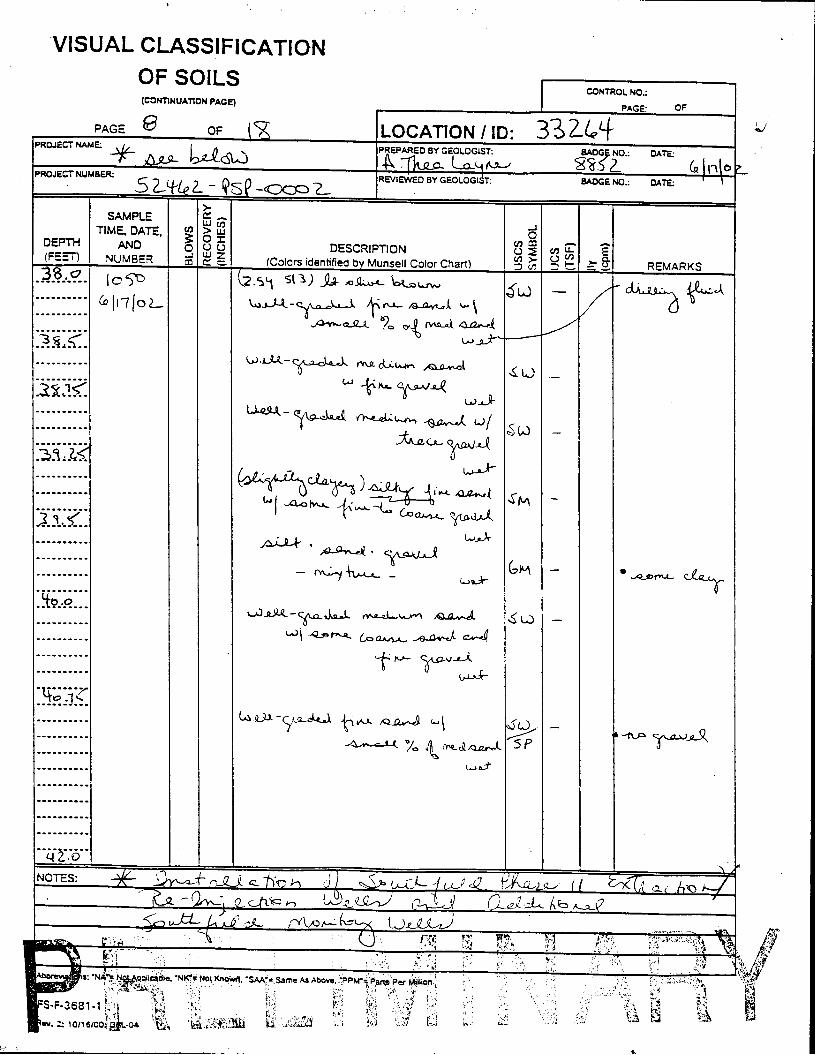
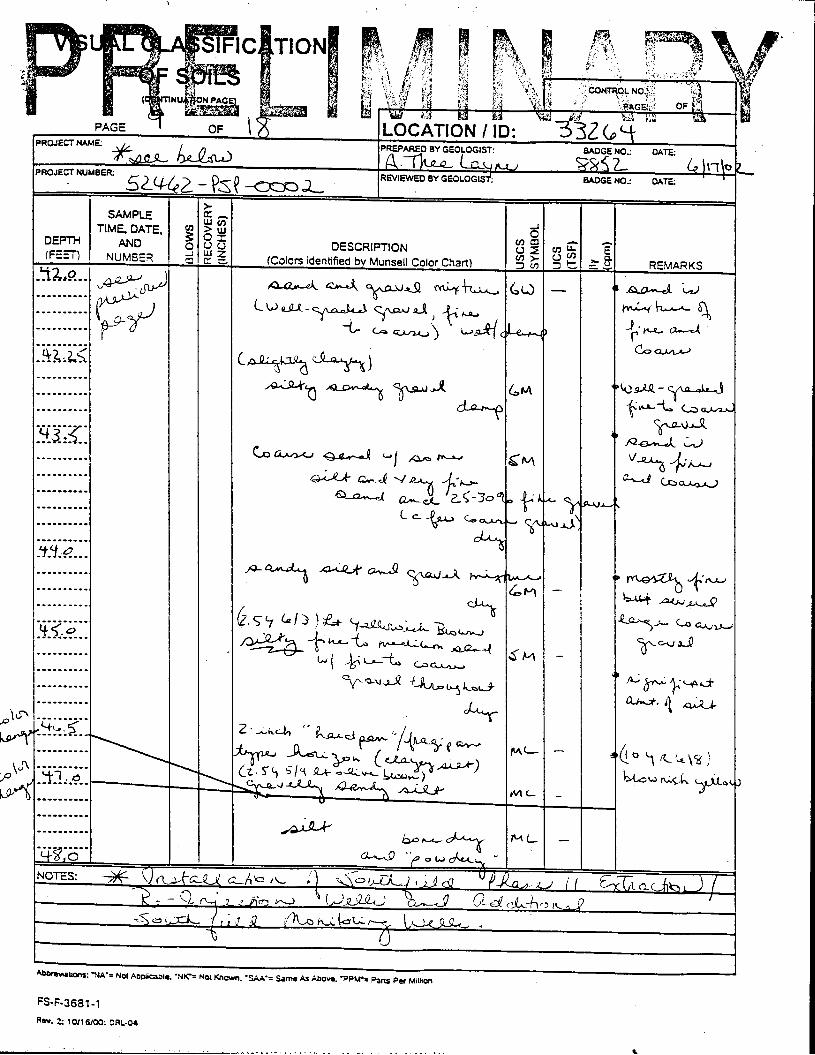
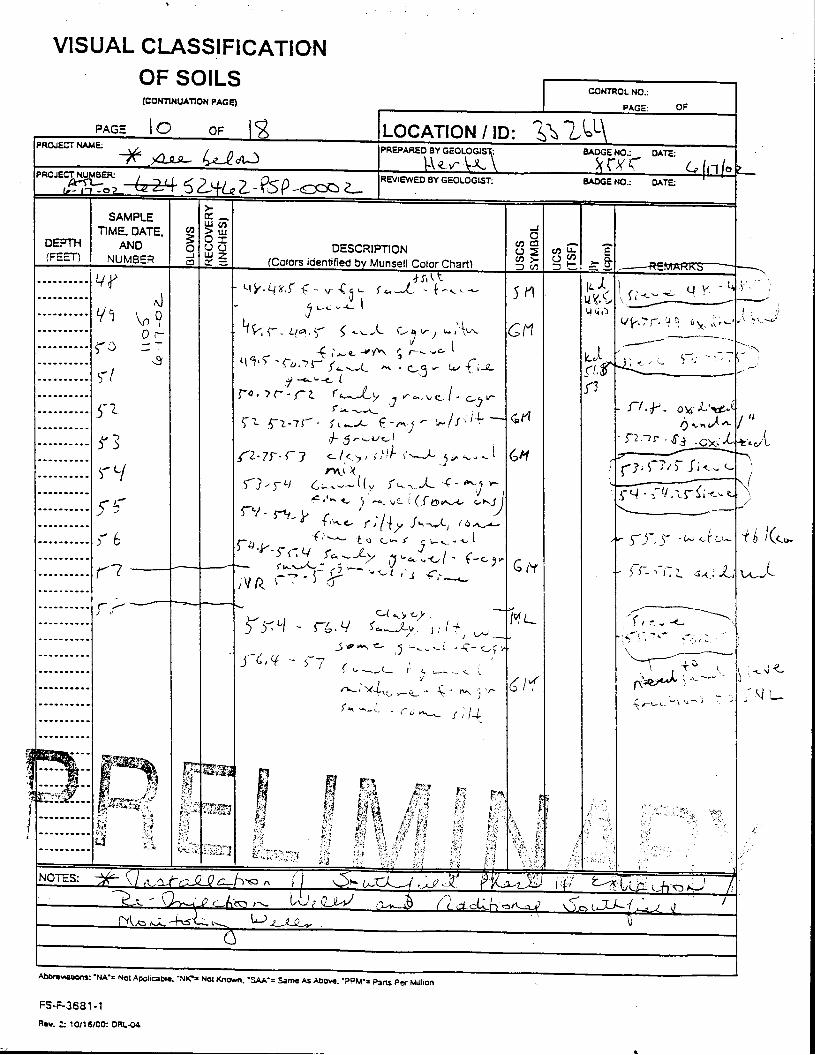
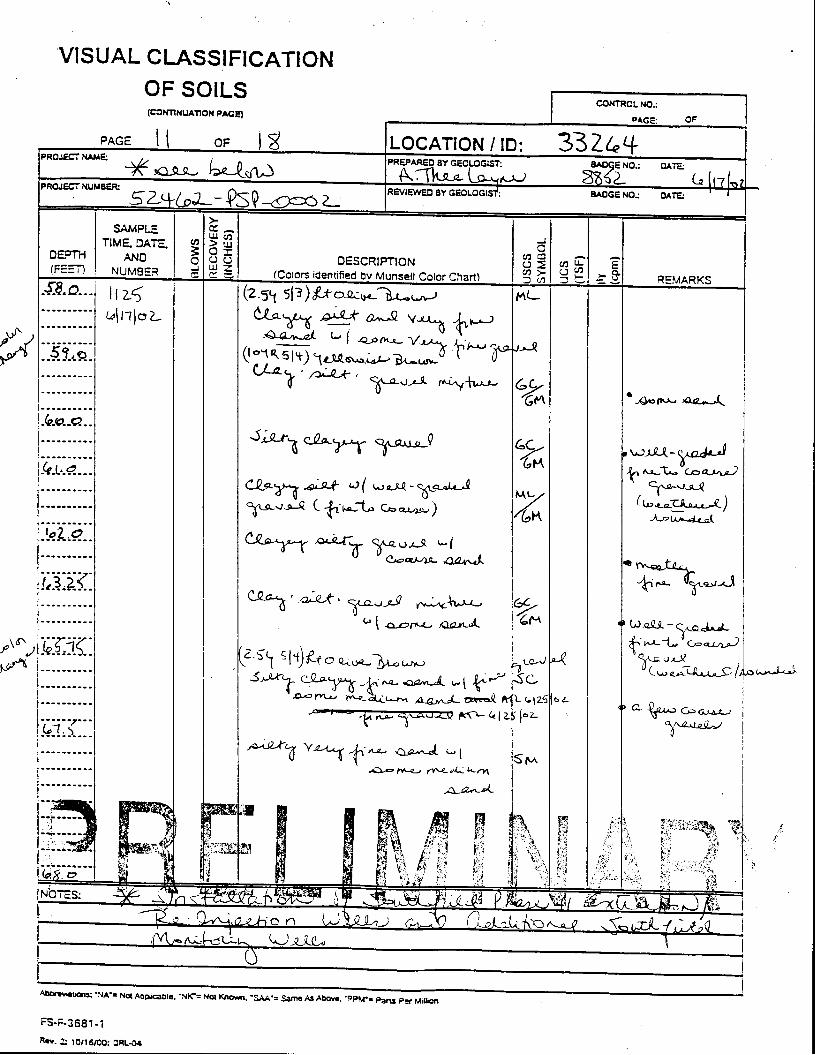
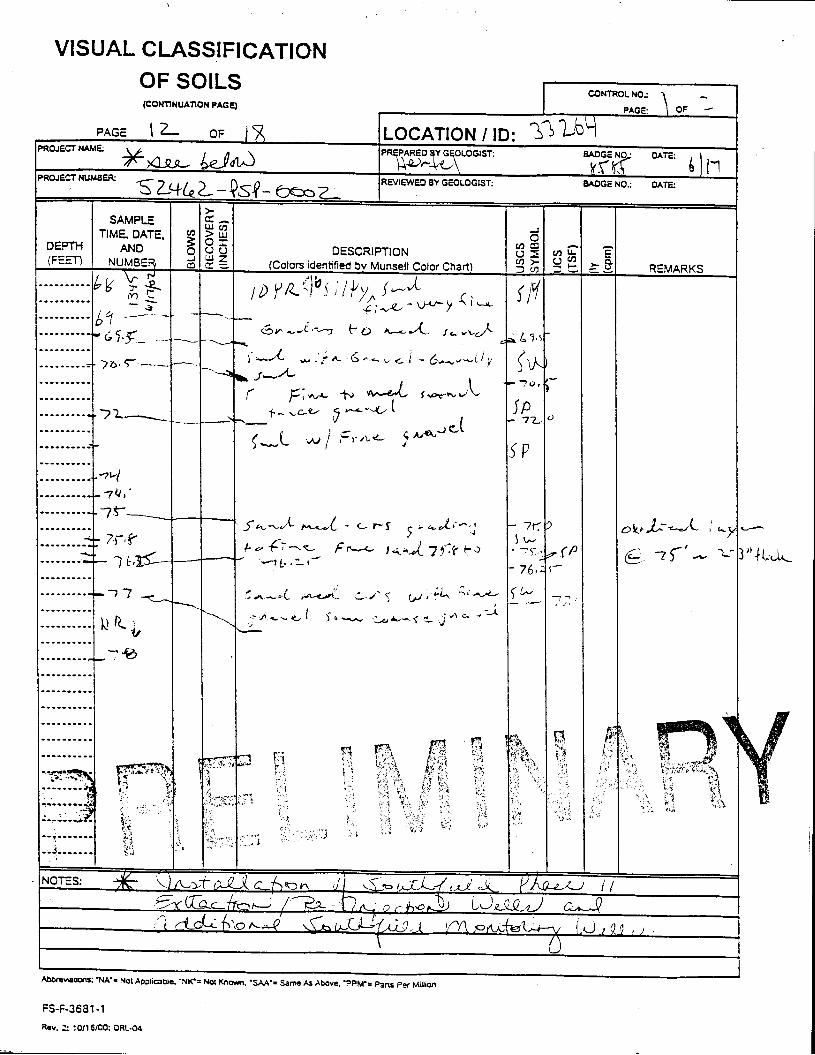
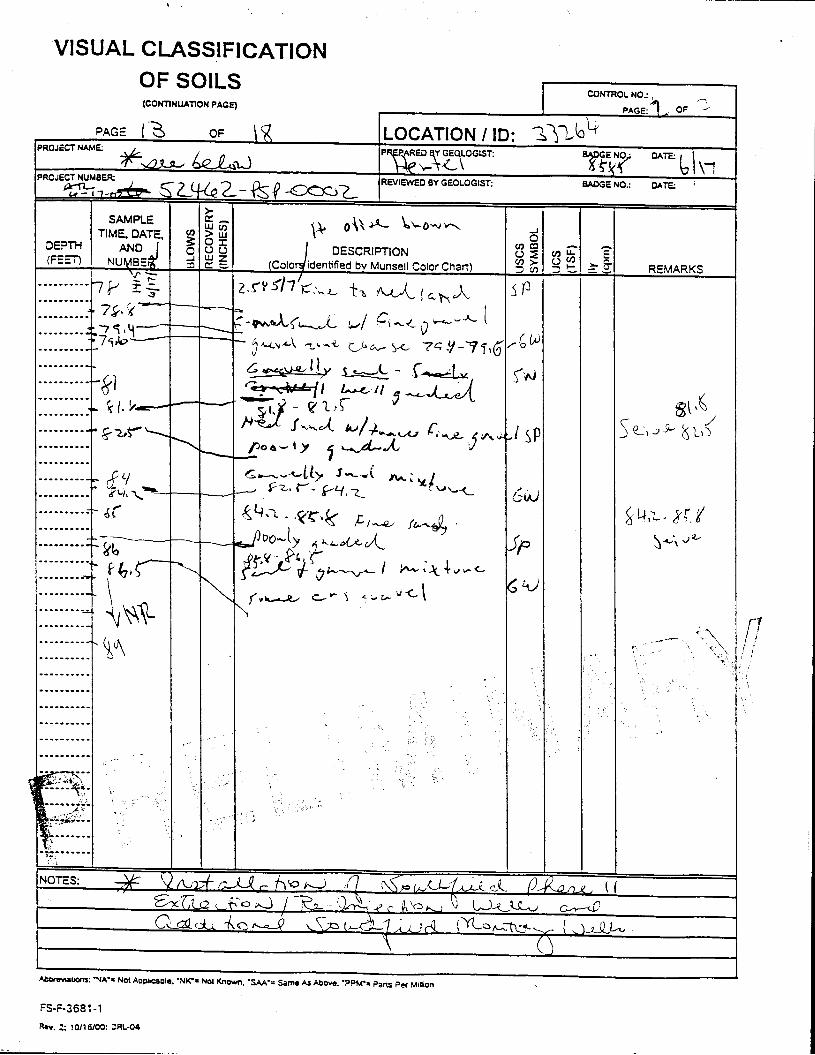
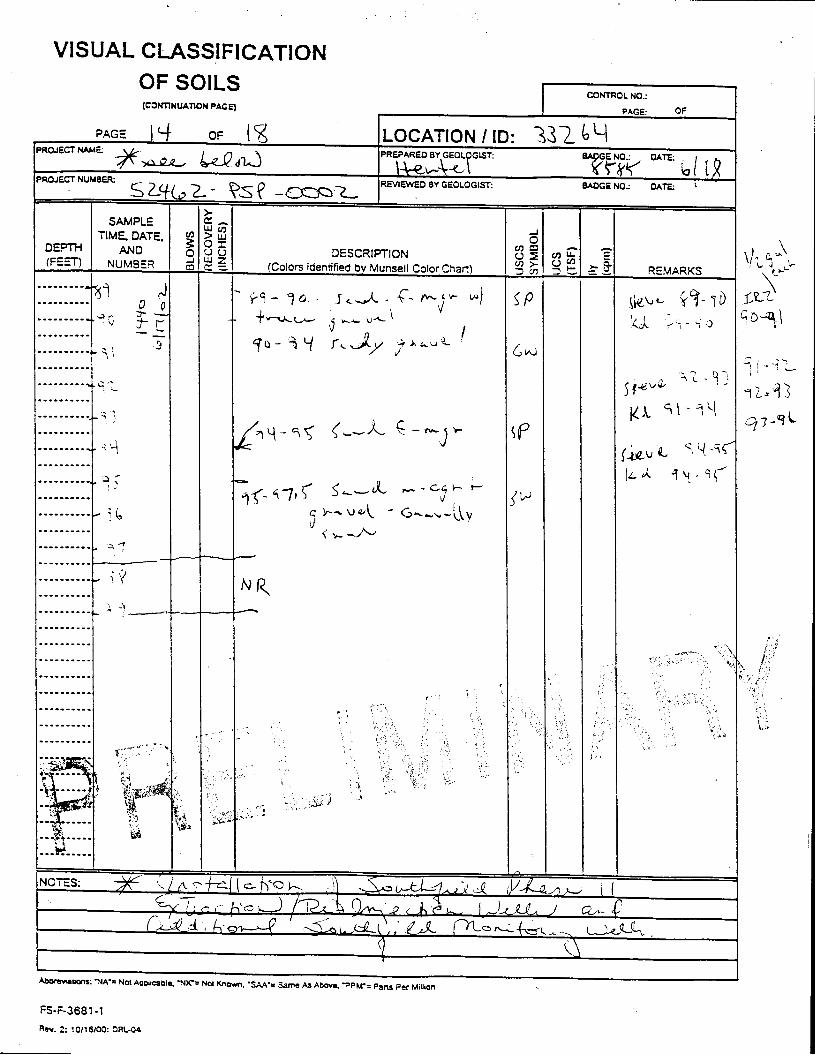
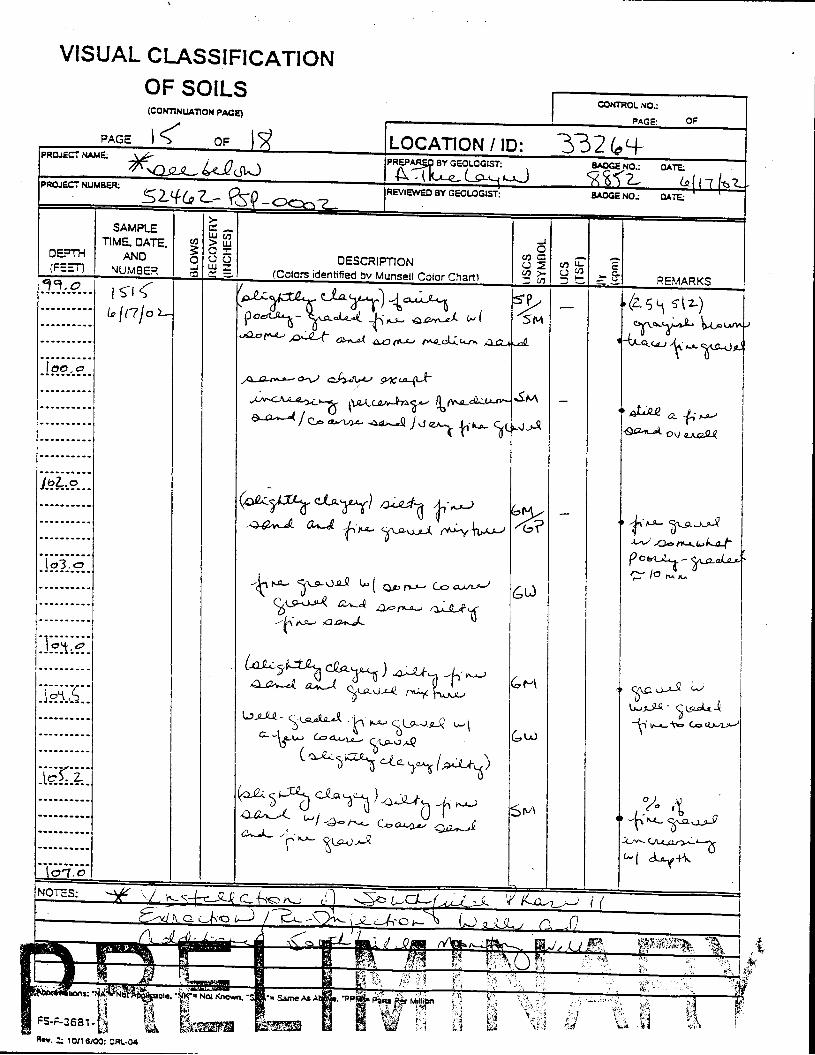
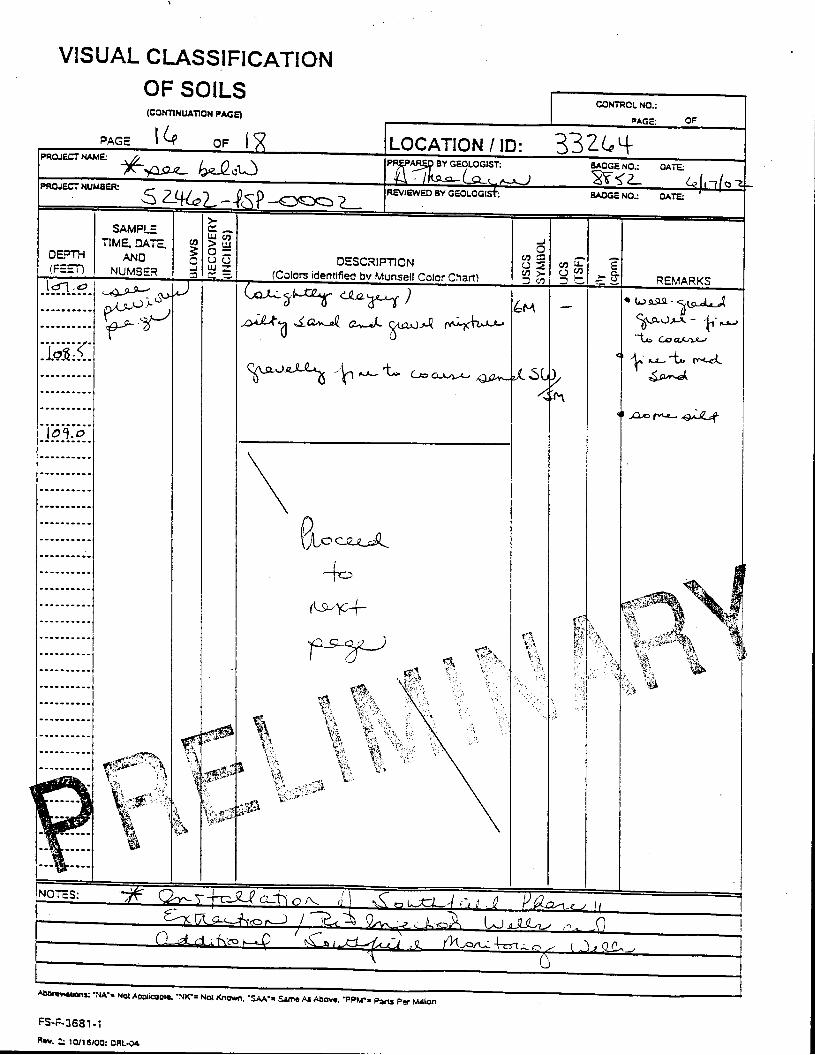
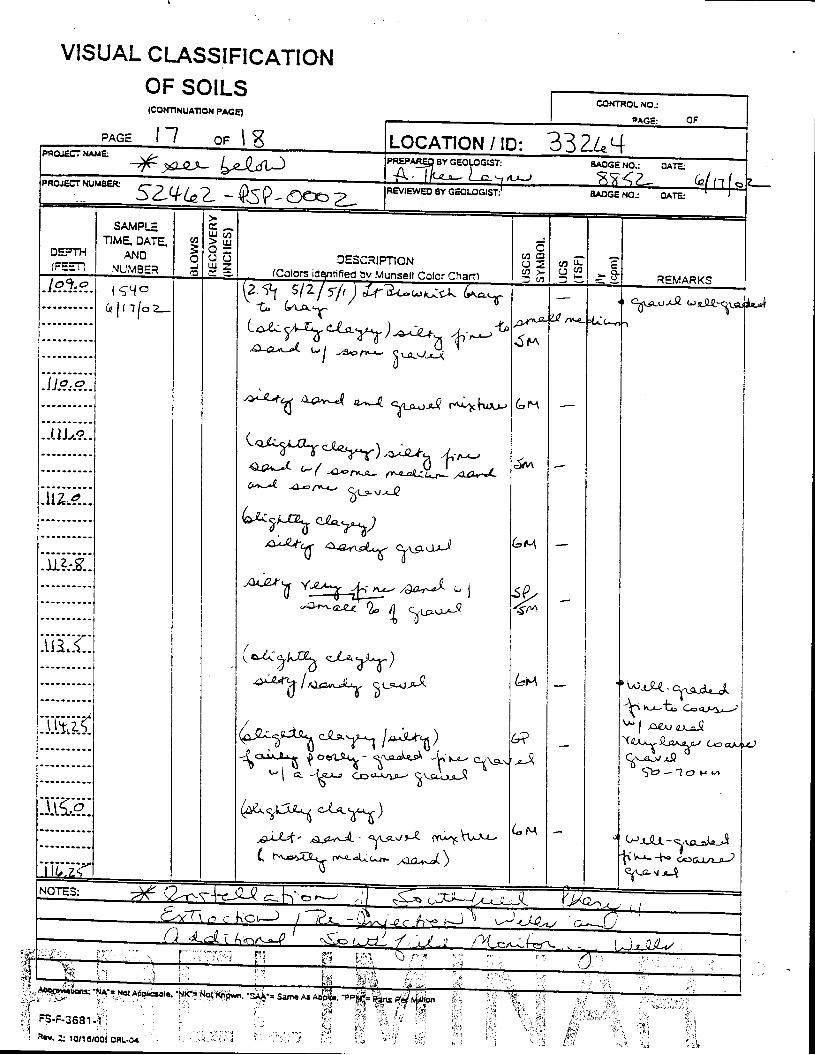
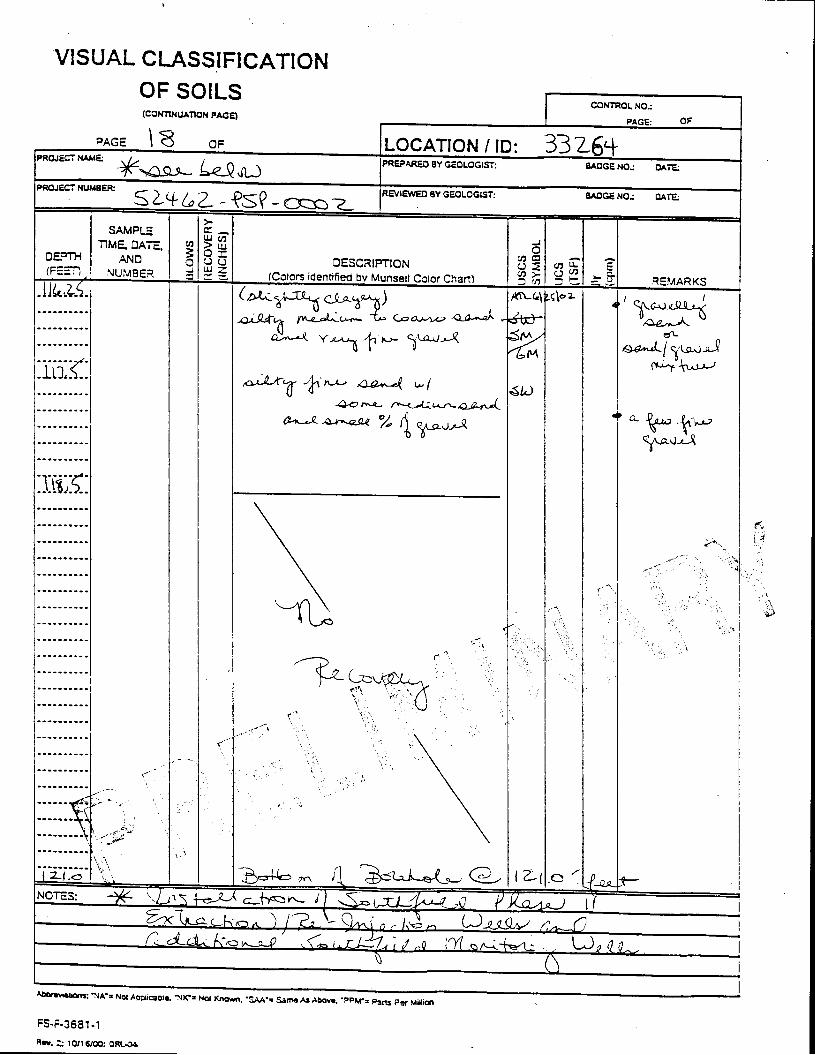

Appendix C
Photographs
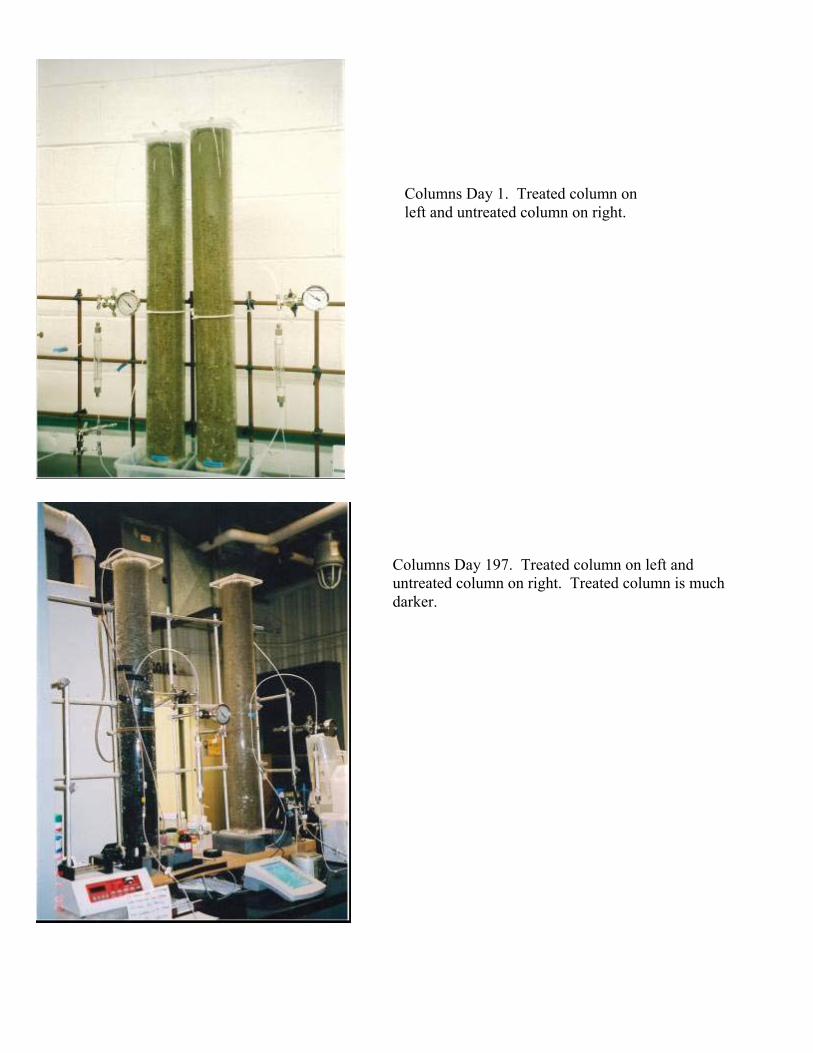
Columns Day 1. Treated column on left and untreated column on right.
Columns Day 197. Treated column on left and untreated column on right. Treated column is much darker.
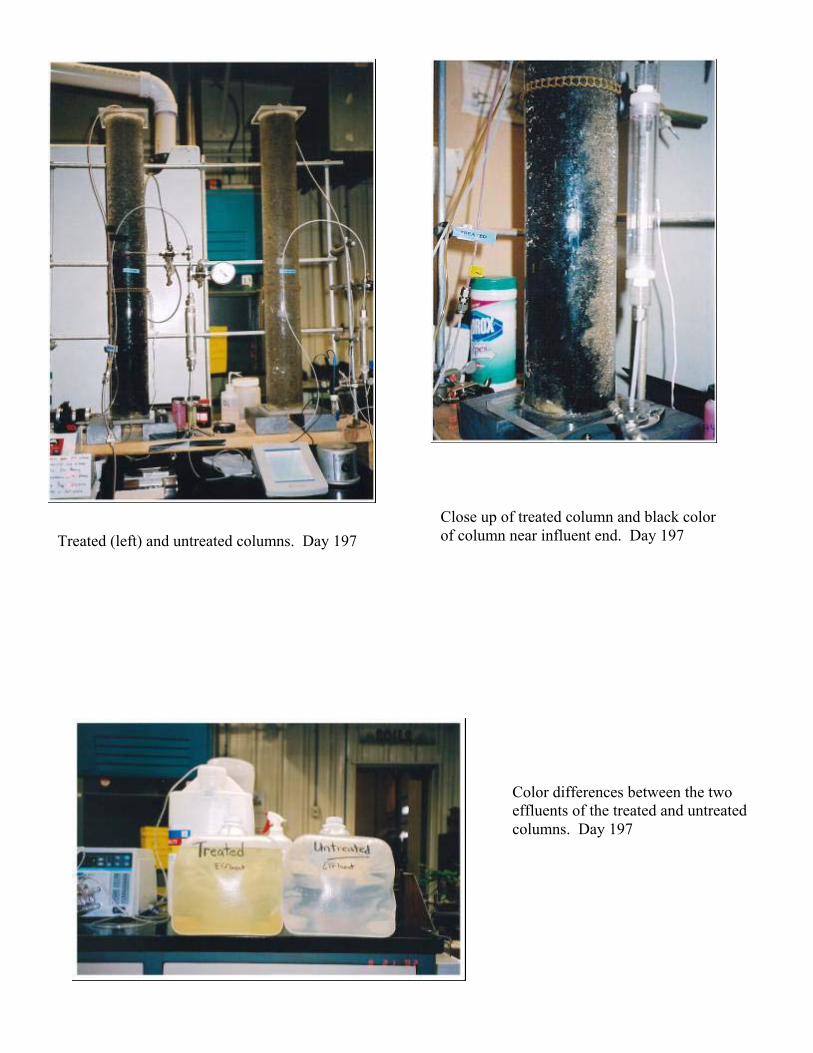
Treated (left) and untreated columns. Day 197 Close up of treated column and black color of column near influent end. Day 197
Color differences between the two effluents of the treated and untreated columns. Day 197

Core Samples from Column, Collected on Day 338
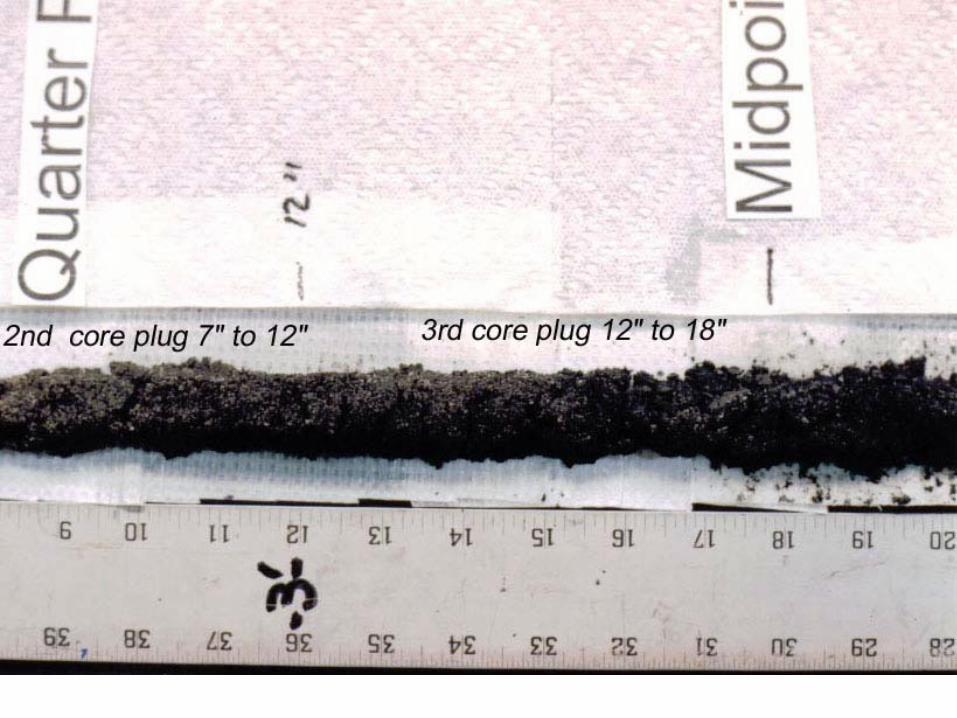
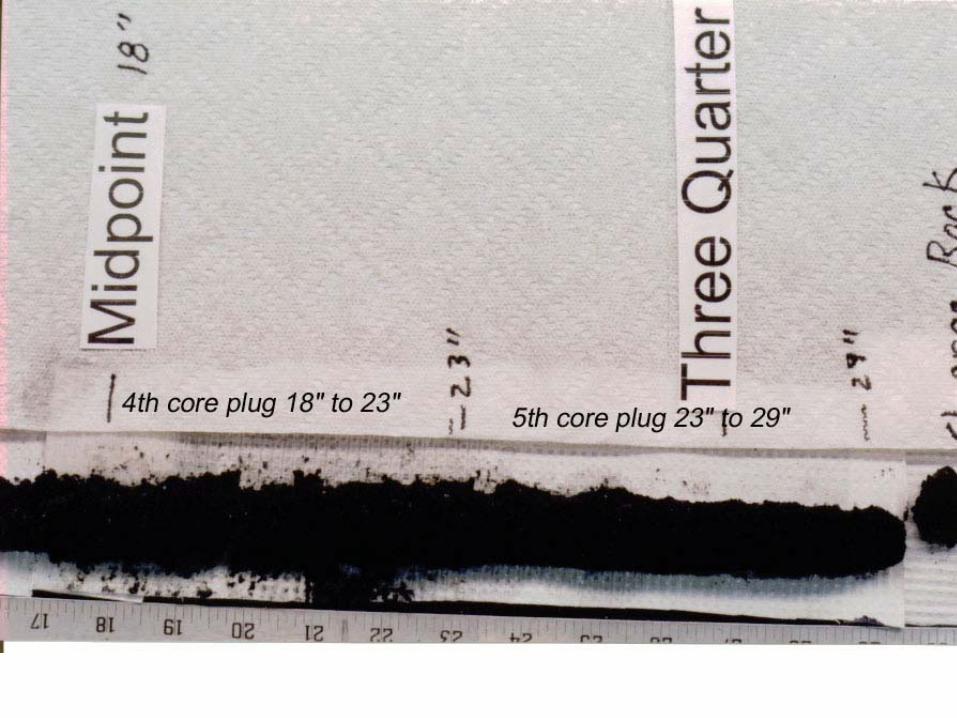
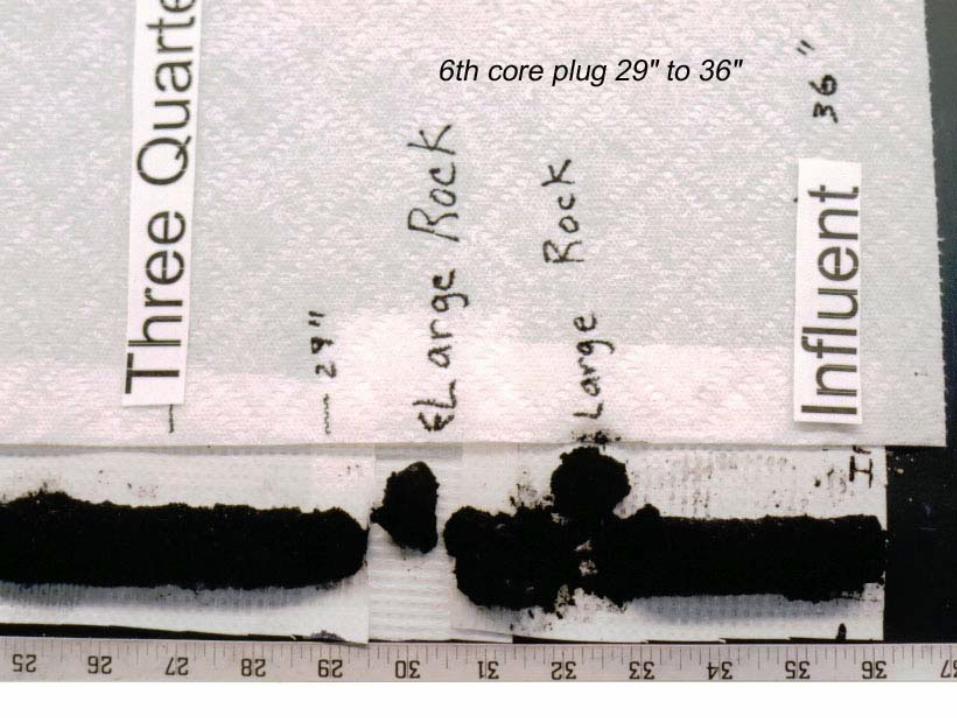
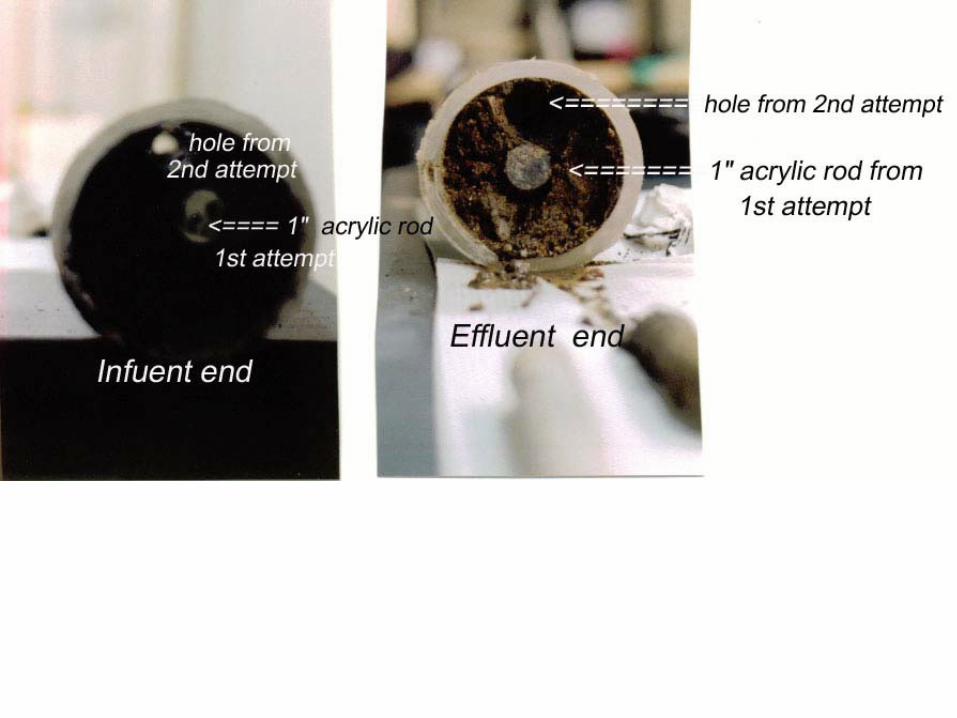
Appendix D
Uranium Precipitation and Desorption Mass Calculation
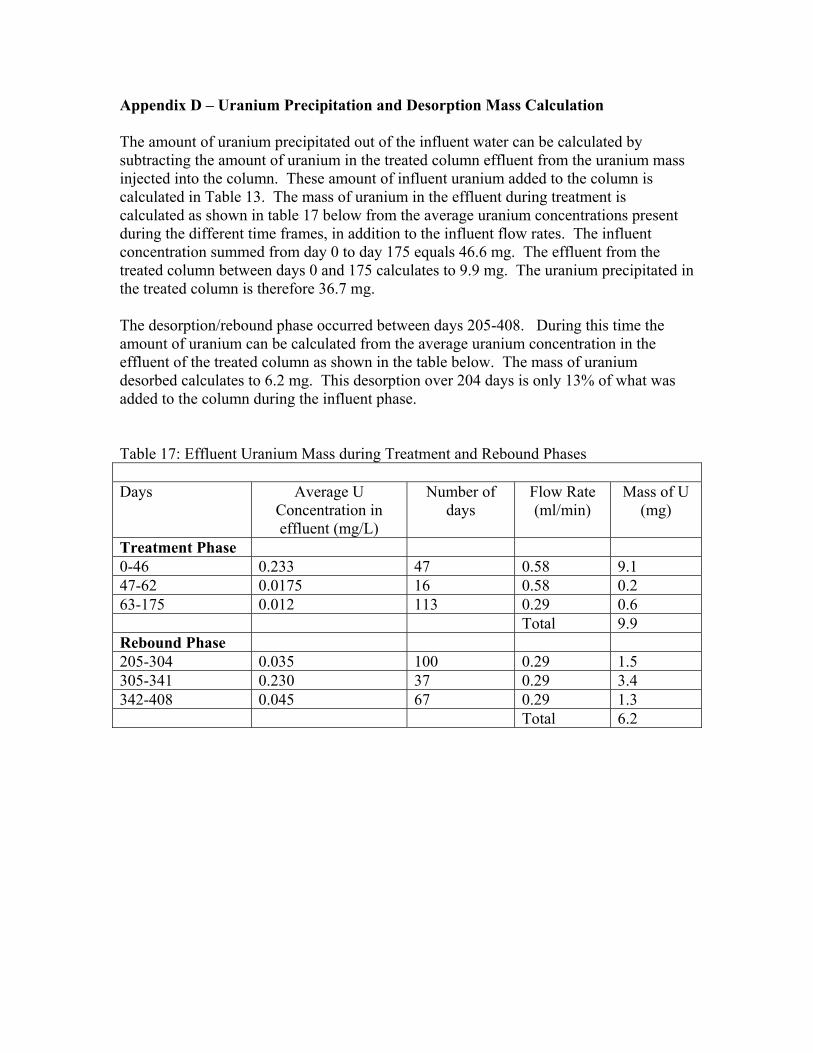
Appendix D – Uranium Precipitation and Desorption Mass Calculation The amount of uranium precipitated out of the influent water can be calculated by subtracting the amount of uranium in the treated column effluent from the uranium mass injected into the column. These amount of influent uranium added to the column is calculated in Table 13. The mass of uranium in the effluent during treatment is calculated as shown in table 17 below from the average uranium concentrations present during the different time frames, in addition to the influent flow rates. The influent concentration summed from day 0 to day 175 equals 46.6 mg. The effluent from the treated column between days 0 and 175 calculates to 9.9 mg. The uranium precipitated in the treated column is therefore 36.7 mg. The desorption/rebound phase occurred between days 205-408. During this time the amount of uranium can be calculated from the average uranium concentration in the effluent of the treated column as shown in the table below. The mass of uranium desorbed calculates to 6.2 mg. This desorption over 204 days is only 13% of what was added to the column during the influent phase. Table 17: Effluent Uranium Mass during Treatment and Rebound Phases Days Average U
Concentration in effluent (mg/L)
Number of days
Flow Rate (ml/min)
Mass of U (mg)
Treatment Phase 0-46 0.233 47 0.58 9.1 47-62 0.0175 16 0.58 0.2 63-175 0.012 113 0.29 0.6 Total 9.9 Rebound Phase 205-304 0.035 100 0.29 1.5 305-341 0.230 37 0.29 3.4 342-408 0.045 67 0.29 1.3 Total 6.2