Embed Size (px)
Citation preview
FERMENTATION STUDIES ON CLOSTRIDIUM ACETOBUTYLICUM
by ,
ANDRE van der WESTHUIZEN
Submitted in partial fulfilment of the requirements for
APRIL 1982
the degree of M. Sc.
in the Faculty of Science
University of Cape Town
Rondebosch
'; ', ('
I ! '.,I.;~ .,_(
' .>'-'· ~\·'.· , - :~ ~:~; ,:~ ·::Lh~ cc:~(i;OJ~~. 'I
----- -c- - - ~ ~- -- r.:-- ---:::--'.-1
ACKNOWLEDGEMENTS
I wish to thank my supervisors, Professor David R Woods
and Dr Dave T Jones, for their encouragement, enthusiasm
and guidance throughout this project. I would also like
to thank my colleagues in the anaerobe unit for their
support and technical assistance.
Thanks are also of fer.ed to my wife Sharon, for her
patience and willing- support throughout this project, and
to Winsome Jones for her help in preparing this
manuscript and Genevieve Wilson for typing it.
I wish to acknowledge the research bursary awarded to me
by Sentrachem Limited, South Africa.
Abstract
Chapter I
Chapter II
Chapter III
Chapter IV
Chapter V
Appendix A
Appendix B
Bibliography
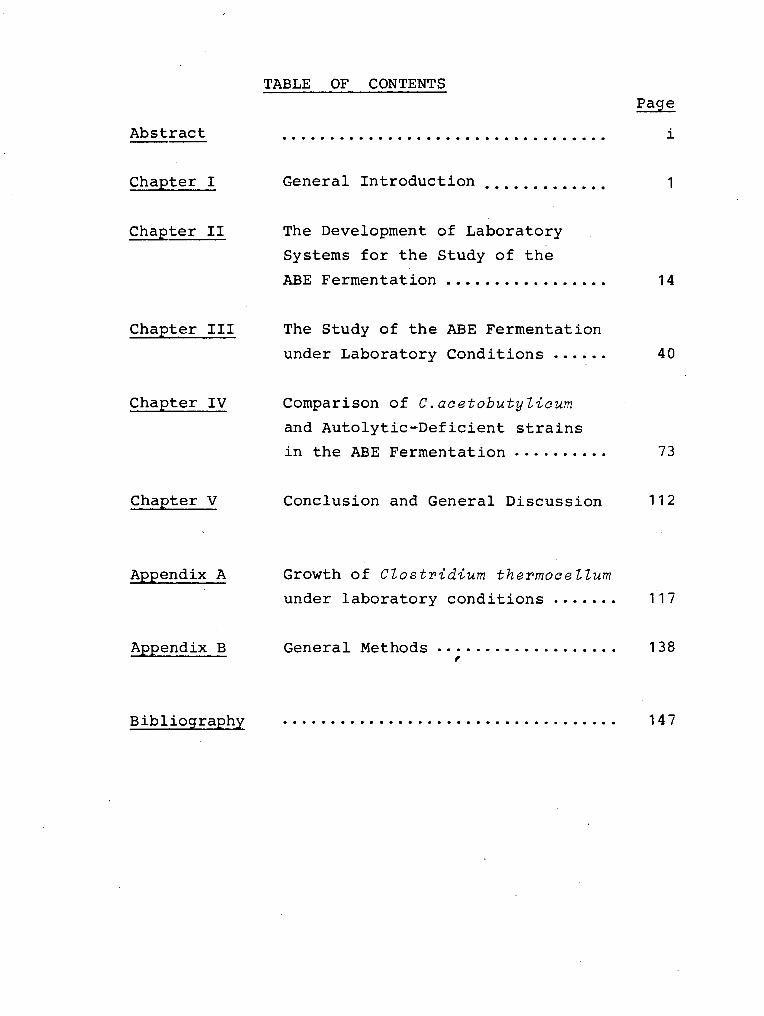
TABLE OF CONTENTS
General Introduction .........•...
The Development of Laboratory
Systems for the Study of the
i
1
ABE Fermentation . . . . . . . . . . . . . . . . . 14
The Study of the ABE Fermentation
under Laboratory Conditions
Comparison of C.aaetobutyliaum
and Autolytic-Def icient strains
in the ABE Fermentation
Conclusion and General Discussion
Growth of Clostridium thermoceZZum
40
73
112
under laboratory conditions....... 117
General Methods . . . . . . . . . . . . . . . ~ . . . 138 r
................................... 147
\
i
ABSTRACT
The initial aim of this work was to develop a laboratory
system for the study of the ABE fermentation under
laboratory conditions. The development of defined and
simple laboratory inoculation and build-up procedures for
the ABE process was investigated. A defined spore
preparation in distilled water gave solvent yields
comparable to the yields obtained in the commercial ABE
process. A laboratory inoculation procedure was developed
which avoided the lengthy culture build-up procedures
presently utilised. An investigation into solvent
production by Clostridium acetobutylicum in clostridial
basal medium (CBM) , reinforced clostridial medium (RCM) ,
Leung and Robson media was undertaken with the aim of
developing a partially d.ef ined laboratory medium which
produced solvent yields comparable to the molasses
fermentation medium (MFM) . The solvent y~elds obtained in
the partially defined laboratory media were substantially
lower than those obtained in MFM. It became apparent that
the initial aim of trying to identify and manipulate a few
key factors to give better solvent yields would not be
easily attained. Both the solvent levels and the overall
pattern of cell development were markedly different in the
various laboratory systems. In view of these differences,
a more detailed investigation of the growth patterns,
morphological and physiological changes were undertaken.
The second part of the study deals with the physiology of the
ABE fermentation. In particular the relationship between
ii
physiological, cell growth, cell morphology changes
and solvent production was investigated. The different
solvent levels produced by C.acetobutylicum P262 in
MFM and CBM were associated with the different patterns
of cell developments which were observed in the two
systems. The appearance of solvents in the two systems
coincided with the appearance of the first phase bright
clostridial forms during late exponential growth. In
the CBM system the phase bright cells were 50 to 70% of
the total cell population compared with 70 to 90% in MFM.
Studies on the morphological changes in the ABE
fermentation system suggested that the clostridial forms
' in C.acetobutylc{um were involved in the conversion of
acetate and butyrate to acetone and butanol. This was
confirmed by the isolation of sporulation mutants which
either failed to form clostridial forms and produced no
solvents or formed reduced numbers of clostridial forms and
produced intermediate levels of solvent.
The third part of this study involved a comparison of
C.acetobutylicum P262 and autolytic-deficient strains in
the ABE fermentation. Autolytic-deficient mutants were
isolated after mutagenesis and lacked substantial levels
of autolytic enzyme(s) and grew in long chains. One of
these mutants was highly pleiotropic. The pleiotropic
characteristics include reduced cell free and cell bound
autolysin levels, growth at increased glucose levels and
an increased tolerance to butanol. The effect of butanol
on the clostridial forms was determined and a relationship
iii
between butanol toxicity and clostridial degeneration
was shown. Clostridial forms from the autolytic-deficient
mutant Zyt1 were not induced to degenerate by concentrations
of butanol which increase the rate of degeneration of
C.aoetobutylioum P262 clostridial forms. It is suggested
that the Zyt1 clostridial forms are more resistant to
butanol-induced degeneration and one of the effects of butanol
is the induction of autolysis and degeneration of
C.aoetobutyZioum P262 clostridial forms. Initial fermentation
studies have indicated that the mutant may be useful in
producing higher solvent yields.
Growth of CZostridium thermooeZZum under laboratory
conditions was also investigated. These studies were
undertaken to develop the techniques necessary for future
physiological and genetic investigations on C.thermooeZZum.
These results have been included as an appendix.
1 . 1
1. 1.1
1
CHAPTER I
GENERAL INTRODUCTION
FERMENTATION TECHNOLOGY AND ANAEROBES
There has been renewed interest in biotechnology which
involves the use of living organisms or their components
in industrial processes. The food processing, chemical
and pharmaceutical industries are the three major users
6f fermentation biotechnology today, the food industry
being the first to exploit microorganisms to produce
alcoholic beverages and fermented foods. A number of
factors have been identified in a recent review on
fermentation technology (Impacts of Applied Genetics,
1981) which may influence the introduction of fermentation
processes to replace present chemical synthetic processes.
These include:
1 • Abundance of a potentially useful raw material;
2. Scarcity of an established product;
3. Discovery of a new product;
4. Environmental concerns;
5. Scarcity of currently used materials.
Each of these factors has tended to accelerate the
application of fermentation. Our present dependence on
petroleum in particular has increased interest in microbial
fermentations for chemical and fuel production. An
important requirement for the production of petrochemicals
and fuels by microbial fermentation is the availability of
abundant fermentable substrates. Although abundant but
2
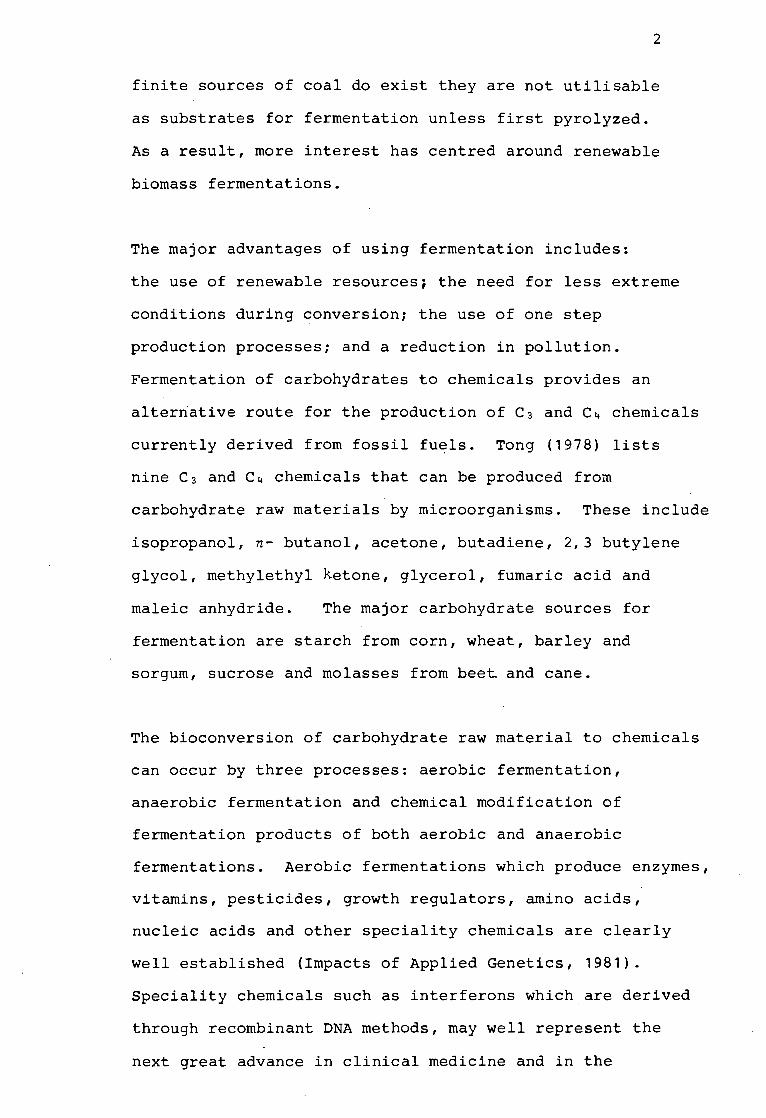
finite sources of coal do exist they are not utilisable
as substrates for fermentation unless first pyrolyzed.
As a result, more interest has centred around renewable
biomass fermentations.
The major advantages of using fermentation includes:
the use of renewable resources; the need for less extreme
conditions during conversion; the use of one step
production processes; and a reduction in pollution.
Fermentation of carbohydrates to chemicals provides an
alterriative route for the production of C3 and C 4 chemicals
currently derived from fossil fuels. Tong (1978) lists
nine C 3 and C4 chemicals that can be produced from
carbohydrate raw materials by microorganisms. These include
isopropanol, n- butanol, acetone, butadiene, 2,3 butylene
glycol, methylethyl ketone, glycerol, fumaric acid and
maleic anhydride. The major carbohydrate sources for
fermentation are starch from corn, wheat, barley and
sorgum, sucrose and molasses from beet and cane.
The bioconversion of carbohydrate raw material to chemicals
can occur by three processes: aerobic fermentation,
anaerobic fermentation and chemical modification of
fermentation products of both aerobic and anaerobic
fermentations. Aerobic fermentations which produce enzymes,
vitamins, pesticides, growth regulators, amino acids,
nucleic acids and other speciality chemicals are clearly
well established (Impacts of Applied Genetics, 1981).
Speciality chemicals such as interferons which are derived
through recombinant DNA methods, may well represent the
next great advance in clinical medicine and in the
3
pharmaceutical industry (Aharonwitz and Cohen, 1981).
Of the nine chemical products mentioned by Tong (1978),
2,3 butylene, glycerol and fumaric acid are aerobic
fermentation chemicals. These processes involve
relatively high exothermic reactions and are thus energy
intensive requiring refrigerant cooling, aeration and
agitation. Anaerobic fermentations produce organic acids,
methane and solvents and are the industry's area of
greatest current growth. Already 40% of the ethanol
manufactured in the United States is produced in this way.
(Impacts in Applied Genetics, 1981).
Chemical modification of the fermentation products of
both aerobic and anaerobic fermentations has rarely been
used to date on a ccmnercial scale (eg. conversion of ethanol
to butadiene).
In anaerobic fermentations the microorganisms recover less
energy per unit of carbon substrate utilized than in aerobic
fermentations. There is a tendency in these fermentations
for carbon substrates to undergo only partial decomposition,
so that various organic acids and amines accumulate in the
growth medium; these products can present problems in pH
maintenance of the fermentation. As a result of the
incomplete utilization of substrate and low cellular-energy
yields these fermentations of ten require more carbon
substrate to be decomposed for the growth and maintenance
of the microbial cell. This phenomenon can be beneficial
to fermentation yields in that a greater passage of substrate
carbon through the metabolic pathways results in a high
4
substrate to product conversion.
There have been fewer industrial fermentations developed
for anaerobic microorganisms than for aerobic microorganisms.
In part this is because there was relatively little known
about the spectrum of anaerobic bacteria that may be of
importance in biofuel and biochemical production. In the
past, lack of interest and technological problems associated
with pure culture growth of anaerobes prevented more detailed
investigation of species' diversity and metabolism. The
effect of air on anaerobic bacteria that are not able to
catabolize oxygen is quite varied (Morris and O'Brien, 1971). Oxygen
is lethal to certain anaerobes (eg. Methanosarcina species),
inhibits the metabolism of CZostridium species and has no
effect on LactobaciZZus species. Today cultural techniques
(Hungate, 1966; Daniels and Zeikus, 1975~ Edwards and
McBride, 1975; Balch and Wolfe, 1976) and the use of the
anaerobic glove box have resulted in the growth of the most
oxygen-sensitive bacteria. Oxygen transfer is a process
limiting step with aerobes which are therefore not ideal
organisms for large scale fermentations.
The most interesting species for biotechnology include
cellulose and starch fermenters, thermophiles and acid tolerant
anaerobes. The genus CZostridium forms a major group of
the anaerobes and a number of CZostridium strains are of
particular interest. CZostridium thermoceZZum is of
interest because it produces extracellular cellulases (Ng
et al., 1977; Gomez, 1980). The use of C.thermoceZZum in
the production of ethanol from biomass is reviewed in
5
Appendix A. Clostridium thermohydrosulfuricum is of
interest due to the high ethanol yields (1.95 mole ethanol/
mole glucose) (Zeikus, 1980; Zeikus et al., 1980).
Clostridium acetobutylicum ferments starches, hexoses and
pentoses to butanol, acetone and ethanol (Spivey, 1978).
Clostridium butylicum ferments hexoses or starch and
produces largely butanol and smaller quantities of isopro=
panol.
The first step in the development of a novel fermentation
system is finding a sui~able organism. Until recently
this selection was confined to organisms already producing '
the required product. However,through genetic manipulation
strains can be engineered and microorganisms can be made to
produce substances beyond their natural capacities.
Although the majority of cloning experiments at the present
time have utilised Escherichia coli as the host vector, this
host is not particularly suited to the large scale
production Gf enzymes, proteins or chemical feedstocks
C.acetobutylicum, on the other hand, has potential fer large
scale fermentations and may be useful for the exploitation
of genetic engineering (Allcock, 1981 ) • Features which make
it suitable for fermentation include:
1. The organism is non-toxic and non-pathogenic.
2. Being an anaerobe, it is suitable for large scale
fermentations as no expensive aeration system is
required.
3. The organism is non-exacting nutritionally and can
utilise a number of different cheap substrates.
4. The organism shows rapid growth under industrial
conditions.
5.
6.
7.
8.
6
The organism forms spores and is easily maintained
as a spore suspension.
The organism has a long hist9ry as a fermentation
organism in the acetone-butanol-ethanol (ABE)
process.
As extracellular proteins are produced during
growth, the appropriate genes that influence
excretion of products are present.
Finally, a single strain could be used for a
variety of fermentations provided that the develop=
ment of a genetic system allowed the introduction
of useful foreign genes into the strain.
1.1.2. THE ABE FERMENTATION
The ABE fermentation has a long history as an industrial
fermentation process. Normal butanol was discovered as a
regularly occurring constituent of fossil oil by Wurtz in
1852 (Prescott and Dunn, 1940). Bacterial production of
butanol was first studied by Pasteur in 1861 (Ross, 1961).
He was studying a butyric acid organism and identified
butanol as one of the products formed. The early history
of the ABE process has been reviewed by Prescott and Dunn
(1940). From 1876 to 1884 Fitz investigated the fermentation
process of Basaillus butyliaus. The bacterium was a spore
former producing butanol, butyric acid and small quantities
of ethanol. Between 1887 and 1897 various butanol
producing fermentations involving different bacterial strains
were investigated. Among them Beijernick described a species
named by him Granulobaater butyliaum. (Granulobacter was the
7
term applied to microorganisms that demonstrated a blue
colour with iodine and showed a distinct swelling of the
cell at sporulation). Winogradsky in 1902 reported on
CZostridium pasteurianum and described it as a butyric
acid producer. Acetone was first discovered as a
·fermentation product by Schardinger in 1905 when studying
the fermentation of BaaiZZus maraerans.
The need for synthetic rubber supplied the impetus which
resulted in the first successful commercial process
(Artzberger et al., 1920; Gabriel, 1928; Kelly, 1936).
Synthetic rubber was obtained through polymerization of
isoprene and butadiene and those compounds were best
prepared from isoamyl alcohol and butanol respectively.
Fernbach and Weizmann in 1911, (Prescott and Dunn, 1940),
who were working on the above process discovered bacteria
that fermented potato starch yielding acetone, ethanol and
butanol. In 1912 Weizmann continued research on the
fermentation and isolated an organism producing four times the
amount of acetone than previous isolates. This organism was
able to ferment starches other than potato starch and was
named BasaiZZus granuZobaater peatinovorum. During 1913 and
1914 factories were established for the production of solvents
by fermentation. With the outbreak of World War I in 1914,
the production of acetone was of interest to England for the
manufacture of cordite (Mccutchan and Hickey, 1954). However
the· demands for acetone could not be met using potatoes as
the raw material. Consequently all the factories were replaced
with the Weizmann strain which used maize as the raw material.
At the end of the war there was no further demand for acetone
production and as butanol had never been much in demand
many factories closed down. Shortly after the
end of the war, E I Du Pont de Nemours and Company
developed nitrocellulose lacquers for the automobile
industry, and it was found that butyl acetate was the
solvent of choice for this coating system (Walton and
Martin, 1979). In order to supply the butanol for
8
conversion to butyl acetate the ABE fermentation was
reestablished. After the Weizmann patent had expired in
1936, new ABE plants were built in Philadelphia, Pensylvania,
Baltimore, Maryland, Puerto Rico and Japan. The industry
was founded in Germiston, South Africa in 1944 and is still
viable today despite the closure of many factories overseas.
Many early attempts were made to produce acetone and butanol
by the fermentation of molasses which was a cheaper substrate
than corn or maize. However, it was not until 1938 that
organisms were isolated capable of utilizing diluted
molasses as a feedstock, and a molasses based process was
developed (Monick, 1968; Walton and Martin, 1979). From
1926-1930 McCoy et al. undertook a study of the acetorie
butyl organism and suggested Clostridium acetobutylicum as
a suitable name for the Weizmann strain.
Cummins and Johnson (1971) analysed cell wall sugar
composition, DNA homology and nutritional requirements of
the genus Clostridium to determine if they could be used as
a more accurate means of classifying the butyric acid
producing. bacteria than the criteria used by McCoy et al.
(1926 and 1930). They determined that C.butyridum strains
could be divided into two main groups. Group I included
strains containing glucose as the only cell wall sugar, and
9
growth occurred in mineral salts glucose medium supplemented
with biotin. The addition of amino acids improved growth.
Group II included strains containing both glucose and
galactose as cell wall sugars. In this group growth did not
occur in a minimal salts glucose medium supplemented with
amino acids and vitamins unless yeast extract was present.
Several other clostridial strains could be classified in one
of the two groups and it was suggested that group I be known
as Clostridium butyriaum and the second group as Clostridium
beijerinckii. Some strains, e.g. Clostridium fallax,
C.acetobutylicum, Clostridium aurantibutyriaum, C.pasteurianum
and Clostridium tyrobutyricum did not belong to either group
and therefore the species C.acetobutylicum was retained.
Industrial production of acetone and butanol via fermentation
has not been significant for the past 20 years due to the
superior economic position of petrochemical based processes
(Lonz and Moreira, 1980). However the demand for butanol and
acetone from biomass fermentation has increased because of
the high costs of petroleum based feedstocks. Butanol in
particular is used in a number of industrial processes,
ranging from the production of lacquers to extraction of
antibiotics from media, and as an intermediate for the
synthesis of butyl acetate, butyl acrylate (Rose, 1961;
Compere and Griffith, 1979). There is substantial requirement
for butanol as a co-agent in tertiary oil recovery systems
(Compere and Griffith, 1979). Butanol may have a possible
use in extending fuel supplies by mixing butanol with
gasoline forming gasohol (Lonz and Moreira, 1980).
The production of acetone and butanol by C.acetobutylicum
follows a rather complex mechanism which leads to a
number of end products namely carbon dioxide, water,
hydrogen, acetic acid and butyric acid in addition to
acetone, ethanol and butanol (Doelle, 1975; Stanier
10
et aZ., 1976). Lonz and Moreira (1980) did an analysis
comparing the energy of combustion of glucose with the
energy of combustion of the fermentation products using
available product yield data (Doelle, 1975). In spite of
the large number of products formed during the ABE
fermentation, it is interesting to note that 97% of the
energy content of the glucose fermented is recovered in the
chemicals produced during the fermentation. The fractional
energy recovery in the ABE fermentation is shown in Table 1.2
(Lonz and Moreira, 1980). A similar analysis for yeast
alcohol fermentation shows that 98% of the energy present in
glucose is conserved in the ethanol produced during the
fermentation. This concentration of chemical energy in a
single compound is a distinct advantage for the ethanol
fermentation ·relative to the ABE process. As seen in Table 2.1,
butanol accounts for only 55.1% of the total energy recovered;
this means that applications must be developed for the
remaining fermentation products, especially hydrogen and
acetone (Lonz and Moreira, 1980).
Lonz and Moreira (1980) reported in an economic evaluation
of the ABE fermentation that the economics of producing
these solvents by fermentation of high quality molasses was
unattractive when current prices of petroleum based
commodities were used in the calculation. The total
production costs were found to be slightly higher than the
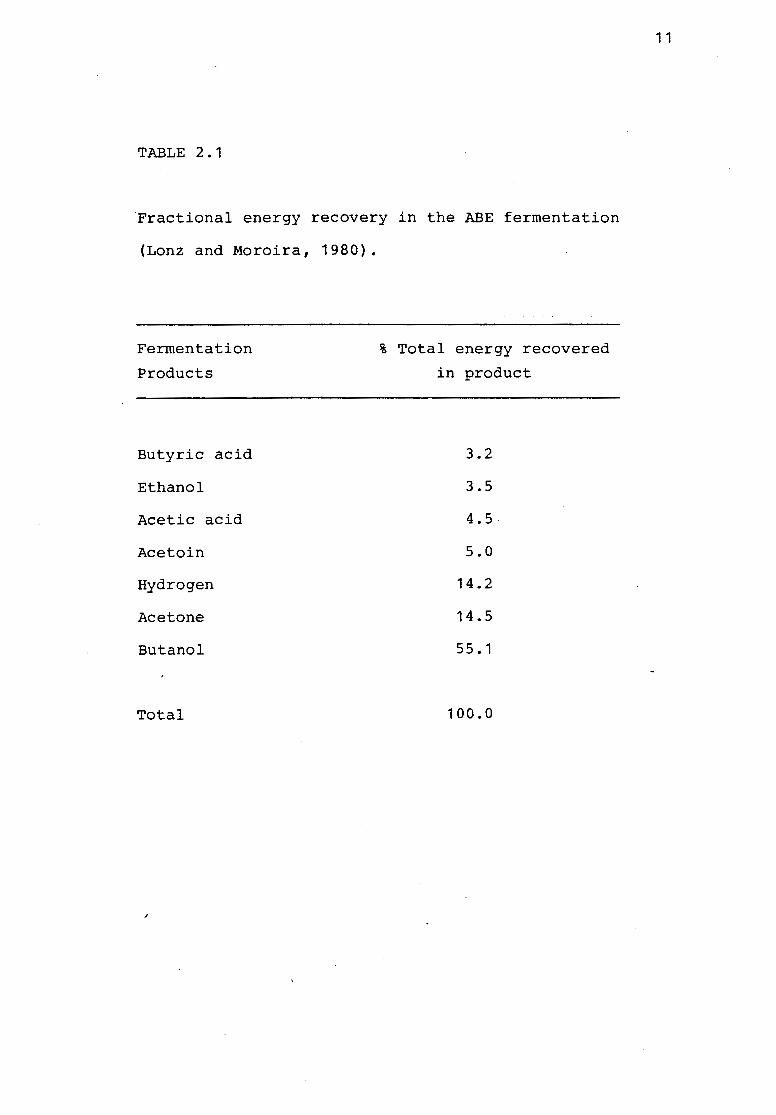
TABLE 2.1
Fractional energy recovery in the ABE fermentation
(Lonz and Moroira, 1980).
Fermentation
Products
Butyric acid
Ethanol
Acetic acid
Acetoin
Hydrogen
Acetone
Butanol
Total
% Total energy recovered
in product
3.2
3.5
4.5
5.0
14.2
14.5
55. 1
100.0
1 1
12
total annual income even when all the fermentation by
products were taken into account. This was mainly due to
the high costs of molasses feedstocks.
Most of the acetone and butanol made by fermentation has
been from one of the followlng carbohydrate sources:
corn, black-strap molasses or high test molasses. Other
common sources of carbohydrates such as wheat, rice, horse
chestnuts, Jerusalem artichokes (Wendland et aZ., 1941),
and beet molasses can also be readily used (Walton and
Martin, 1979). However when the fermentation process is
considered as a possible replacement for those based on hydro=
carbon feedstocks, carbohydrates derived from sources now
considered to be waste products should be investigated.
These include hydrolyzed wood (Leonard et aZ., 1947;
Sjolander et aZ., 1938), hydrolyzed corn cobs (Dunning and
Lathrop, 1945; Langlykke et aZ., 1948), hydrolyzed cabbage
(Prescott and Dunn, 1940), whey (Lonz and Moroira, 1980),
sulphite_liquor (Wiley et aZ., 1941) and hydrol, a by-
product from the manufacture of glucose (Walton and Martin,
1979).
Lonz and Moreira (1980) also evaluated the fermentation
process utilizing liquid whey waste as a feedstock. The
study showed that whey waste could be economically attractive
and suggested that other low grade, or waste-type feedstocks
should be further investigated. The utilization of waste
type materials.is plagued by two fundamental problems; they
are not usually available in concentrated forms and may have
a seasonal character.
13
Although economically attractive when based on waste-type
materials, the ABE fermentation has a number of drawbacks
which must be addressed before any attempts of commercial
production is made. The major problem is the very low
level of solvents produced ih the final fermentation broth.
With current technology such levels are only about 1.9%
(w/v) (Ryder, 1958; Hastings, 1978). This results
in the need for large size vessels for fermentation and an
energy-intensive distillation recovery process for solvents.
Additional difficulties with the fermentation include the
need for strict anaerobic conditions, delicate culture
maintenance and propagation, and a tendency for infection
by bacteriophages (Douglas, 1975) and lactobacilli (Thaysen,
1921; Fred et al., 1926). If improved upon however, the
acetone-butanol fermentation has the potential of becoming
a major source of highly valuable chemicals and fuels in
future years.
This study was undertaken with the view of further
characterising the ABE fermentation under laboratory
conditions and improving the fermentation.

14
CHAPTER II
THE DEVELOPMENT OF LABORATORY SYSTEMS FOR THE STUDY OF
THE ABE FERMENTATION
The development of defined and.simple
laboratory inoculation and build-up
procedures for the ABE process was
investigated. A defined spore prepara=
tion in distilled water gave the same
solvent yields as the factory spore/
soil preparation. A laboratory
inoculation procedure was developed
which obviated the lengthy factory build
up procedure. The solvent yields obtained
in the partially defined laboratory media
were substantially lower than those
obtained in MFM.
2.1 INTRODUCTION
In order to study solvent production by C.acetobutylicum
it was necessary to obtain reliable laboratory systems
involving small culture volumes which produced solvent
levels comparable to those obtained under factory conditions.
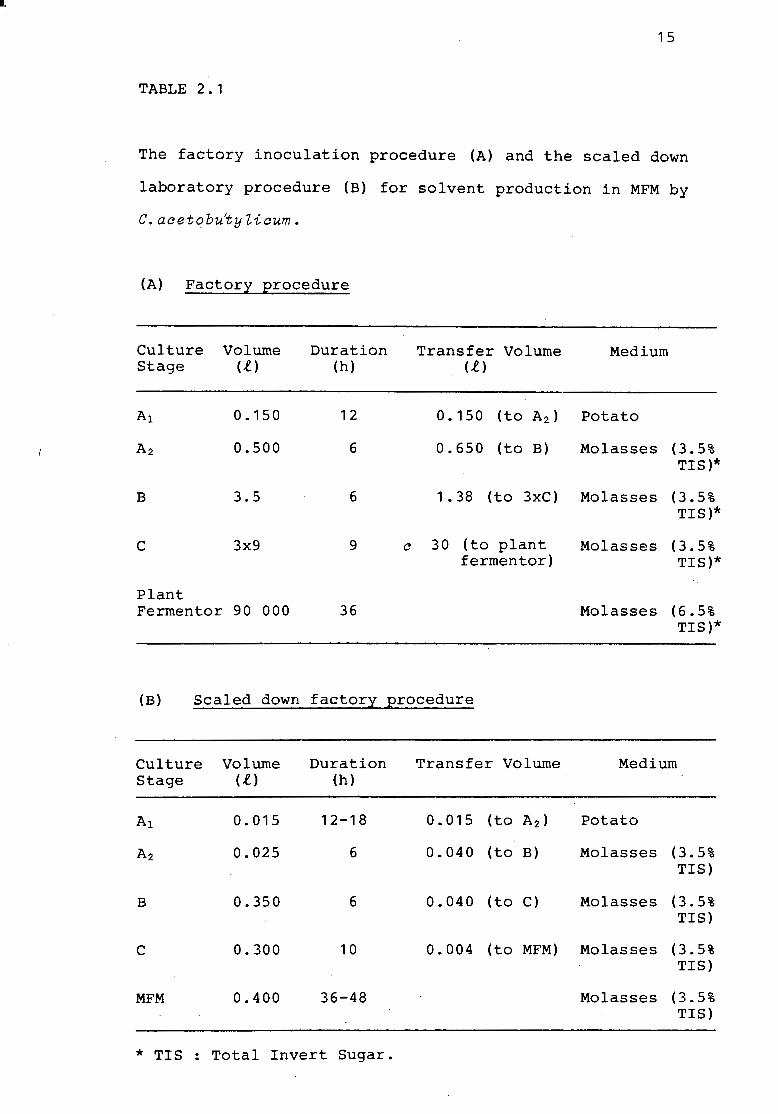
The industrial fermentation process (Table 2.1A) is a
lengthy process and consists of 4 inoculum build-up stages,
A1 , A2 , Band C stages. An initial scaling down of the
factory procedure was reported by Barber (1977), and
van der Westhuizen (1978), Barber et al., (1979) and Webster
(1980), and fermentations were carried out in either 400 or
1 330 ml of molasses fermentation medium (MFM). Barber (1977)
15
TABLE 2. 1
The factory inoculation procedure (A) and the scaled down
laboratory procedure (B) for solvent production in MFM by
C.aaetobu~yZiaum.
(A) Factory procedure
Culture Volume Duration Transfer Volume Medium Stage (l) (h) (.l)
Ai 0.150 12 0.150 (to A2) Potato
A2 0.500 6 0.650 (to B) Molasses (3.5% TIS)*
B 3.5 6 1. 38 (to 3xC) Molasses (3.5% TIS)*
c 3x9 9 c 30 (to plant Molasses (3.5% fermentor) TIS)*
Plant Fermentor 90 000 36 Molasses (6. 5%
TIS)*
(B) Scaled down factory procedure
Culture Volume Duration Transfer Volume Medium Stage ( .t) (h)
Ai 0.015 12-18 0.015 (to A2) Potato
A2 0.025 6 0.040 (to B) Molasses (3.5% TIS)
B 0.350 6 0.040 (to C) Molasses (3.5% TIS)
c 0.300 10 0.004 (to MFM) Molasses (3.5% TIS)
MFM 0.400 36-48 Molasses (3.5% TIS)
* TIS Total Invert Sugar.
16
found that the build-up stages could not be omitted from
the fermentation without adversely affecting the solvent
production. Her results were similar to those of Beech
(1953) who, using C.aeetobutylicum in a corn mash
fermentation, determined the effect of varying the number of
build-up stages (from 2 to 12 h) on solvent production.
There was a decrease in the solvent/production with decreasing
number of transfers.
In the industrial production of acetone and butanol by
C.aeetobutylicum, the spores are maintained on sterile soil
and germinated by heat shocking in liquid medium. Heat
shock selection has been used to select cultures which give
better fermentation yields (Ryden, 1955). Weizmann
advocated heat treating a culture 100 to 150 times in order
to improve its fermenting ability (Prescott and Dunn, 1940).
In a study of six different strains of C.acetobutylicum
(Weizmann, 1945), Weyer and Rettger (1927) showed that
storage of spores for a period of over 6 months decreased
their ability to produce solvents. The cultures could be
"rejuvinated" by alternate pasteurization and subculturing.
It was thought that pasteurization destroyed the vegetative
forms and the weaker spores, and that the most prodigous
producers of solvents are those cultures whose spores are
in general the most heat resistant (Prescott and Dunn, 1940).
Curran and Evans, (1945), were the first to recognise that
some spore suspensions germinated more rapidly following
sublethal heating (heat shocking). The term "germination"
applied to a bacterial spore describes the rapid and irrevers=
able process whereby the spore loses its typical dormant and
resistant properties. The resulting cell is metabolically
17
active, heat labile , non refractory and stainable but
is nevertheless distinct from a typical vegetative cell
(Campbell, 1957; Keynan and Holvorsen, 1965).
Ungerminated spores appear phase bright whereas germinated
spores are often swollen (Steinberg et al., 1969) and phase
dark (Pulvertoft and Hayes, 1951).
In clostridia the germination requirements are complex
(Holland et al., 1969; Rowley and Feeherry, 1970) and the
spores are unable to germinate in distilled water or
physiological saline solutions.
Germination and outgrowth are entirely distinct processes.
This has been demonstrated by differences in metabolic and
in nutritional requirements (Demain and Newkirk, 1960).
Spores for example will germinate in the presence of
compounds which inhibit protein synthesis and nucleic acid
synthesis in outgrowt,h cells (Keyman and Halvorson, 1965).
In general defined media for the growth of vegetative cells
are satisfactory for outgrowth (Halvorson et al., 1966;
Gould, 1971). In the genus Baaillus (Steinberg et al., 1969)
the transition from spore to active growth occurs in three
distinct phases: (1) activation, a period in which those
mechanisms responsible for initiating germination are
potentiated; (2) germination, a stage characterized by
degradative reactions which break the dormant state; and
(3) outgrowth, a stage which is dependent on the commencement
of biosynthetic activity and which covers the period of·
development after germination until the first cell division.
Abou-Zeid et al.,(1980) compared different carbohydrates in
18
the ABE fermentation. Molasses was the most suitable
carbon source for the production of acetone, butanol and
ethanol. The suitabilities of the different carbon sources
were arranged in descending order according to their
efficiency of prcduction of acetone and butanol as follows:
molasses > flour > fructose > glucose > pure flour >
soluble starch > maltose > sucrose > mannose > lactose >
stillage > glycerol > citric acid. Molasses is a complex
substrate (Dekker, 1957; MacGillvray and Matic, 1970) and
in order to study the factors affecting solvent production
' it is essential to have a chemically defined medium which
produced high solvent yields.
In 1940, Oxford et al., employed a synthetic medium for
studies on the nutritional requirements of C.acetobutylioum.
'
Their st?dies, along with those of Rubbo et al. (1941) and
Porter (1946) indicated that biotin and p-amino benzoic acid
(paba) were essential factors for growth of C.aoetobutylicum.
Oxford et al- (1940) observed that there was no strict
correlation between growth and fermentation and postulated
that the presence of other factors may be required for normal
solvent production to take place following normal growth.
Rubbo et al. (1941) investigated the ability of
C.acetobutylicum to ferment a synthetic glucose medium
containing paba and found that normal levels of butanol were
found but that acetone prod~ction was suppressed. A factor
was isolated from yeast and was found to restore acetone yields.
Davies and Stephenson (1941) demonstrated that L-asparagine was
essential for acetone production by C.acetobutylicum in
19
in glucose but not in starch containing media. Davies and
Stephenson (1941) also reported that higher yields were
obtained with maize meal than with 2% glucose and yeast
extract medium. Frequently yields were very low (acid
fermentations) and in order to convert an acid fermentation
to a "normal" fermentation the addition of several growth
supplements present in liver, maize and yeast extract
were required. C.aaetobutyliaum has been studied during
batch cultivation in Clostridial Basal Medium (CBM) ,
containing glucose, casein hydrolosate, vitamins and salts
(O'Brien and Morris, 1971). They found that acetate and
butyrate, but not butanol and acetone, are produced during
exponential growth of C.aaetobutyliaum, the products formed
during stationary growth were not assayed. In a pH
controlled batch fermentation of C.aaetobutyliaum ATCC strain
824 solvent yields of >20 gl- 1 have been obtained by Leung
(1980) in a 10% glucose basal medium.
This chapter describes the development of inoculation and
build up procedures for laboratory studies and the effect of
spore activation on germination and solvent production. The
solvent yields of different culture media for laboratory
fermentation systems were compared with MFM.
20
2.2 MATERIALS AND METHODS
2. 2. 1 BACTERIAL STRAINS
The C.acetobutyZicum P262 spores were supplied by National
Chemical Products Limited (NCP), Germiston, South Africa.
Spores were maintained on sterile soil at room temperature
or in distilled water at 4°C.
2.2.2 MEDIA
All media used are listed in Appendix B. The A2 molasses
medium was used for the A2 , B and C sta~es of the fermentation.
The bacterium was grown in the molasses fermentat~on media
(MFM) of Barber et aZ. (1979), modified CZostridium basal
medium (O'Brien and Morris, 1971), (CBM) reinforced clostridial
media (Difeo) (RCM).
Leung Medium (Leung, 1980) and Robson medium (Robson, 1981).
2.2.3 DISTILLED WATER SPORE PREPARATION
Distilled water spore suspensions were prepared from
sporulating colonies on CBM plates. The spores were washed
several times in distilled water, and finally resuspended in
distilled water.
2.2.4 HEAT ACTIVATION OF SPORES (HEAT SHOCKING)
The spore suspension was diluted (1/600) and 0.5 ml was
placed in a Bijou bottle and heated in a water bath at 70-75°C
2.2.5
21
for 2 min before cooling in ice for 45 s. The heat
activated spore suspension (10 µl) was added to 10 ml .
CBM in a Hungate tube under stringent anaerobic conditions
in the anaerobic glove box (Forma Scientific, Ohio).
The cultures were incubated at 37°C until they reached an
absorbance of O.ft-0.5 at 600 nm (10 8 -10 9 cells ml- 1 ).
A 0.1% inoculum was used to inoculate the various
experimental media.
FERMENTATION PROCEDURE
All media used were placed in the anaerobic glove box,
after autoclaving at 121°C for 20 min, for 12-18h before
inoculating. Cultures incubated under stringent anaerobic
conditions were incubated at 34°C in the anaerobic glove
box. Cultures incubated aerobically were first incubated
under anaerobic conditions for 2-6h at 34°C before being
incubated aerobically.
2.2.5.1. Fermenter
A Gallenkamp (London) modular fermenter with a working volume
of 200 to 800 ml was used. The medium was agitated at a
100 rpm during the fermentations. The pH of the culture
was controlled above 5.0 by means of a pH control module with
2 M NaOH. The temperature was maintained at 34°C by a
temperature control module which regulated the flow of hot
or cold water through an immersion coil located inside the
fermenter. During the start up of the fermentation mixed
gas consisting of 12% C02 , 80% N and 5% H2 (Air Products
Limited, South Africa) was sparged into the fermenter to
22
maintain anaerobiosis. The sparging was terminated once
the culture was observed to be growing. After· this time,
sufficient gas (C02 + H2 ) was produced to provide a
reduced environment for the culture.
2.2.6 PHYSICAL MEASUREMENTS
2.2.6.1. E!!
The pH of the samples were determined using the Orion
Research Digital ionanalyzer/501.
2. 2. 6.2. Ti tr a table acid
Titratable acids were determined by titration of 10 ml
supernatant fractions plus 50 m~ distilled water with 0.02 N
NaOH to pH 7.0. The titratable acidity was expressed as acid
equivalents (in g) l- 1 •
2.2.6.3. Analysis of Solvents
Aqueous samples ( 1 µ!) of the. fermentation medium were injected
into a Hewlett-Packard 5830A Chromatograph equipped with a
flame ionization detector. The quantitative evaluation of
the peaks was performed auto.matically by the automatic
integrator using n-propanol as an internal standard. A
calibration mixture (Appendix B) comprising acetone, ethanol
and n-butanol, n-propanol as internal standard.
A 1.84m stainless steel column with a· 3.18 mm outside diameter,
was packed under negative pressure with chromsorb W/AW

23
(80-100 mesh) coated with 15% carbowax 20 M. New columns
were conditioned at 90°C for 24 h with a flow of 60 ml
min- 1 N2 to remove volatile impurities. Analysis of
solvents was achieved under the following conditions:
column temperature, 250°C; detector temperature, 250°C;
N2 (carr.:ier gas) flow rate 30 ml min- 1; H2 flow rate, 40 ml
min- 1 ; air flow rate 500 ml min- 1 •
2.2.7. Microscopic Methods
A Zeiss photomicroscope fitted with phase contrast and
interference contrast optics was used. Ungerminated spores
appeared phase bright and germinated spores phase dark
(Gould, 1971). Differential microscopic counts allowed the
percentage germination in the spore suspension to be assayed.
The sequence of events following heat activation of
C.acetobutylicum P262 spores was monitored. A drop of heat
activated spore suspension on a coverslip was placed onto a
pad of CBM agar (a 1mm thick) in a germination chamber slide.
The edge of the coverslip was sealed with clear varnish.
All manipulaitons were carried out under stringent anaerobic
conditions. The sealed slide remained anaerobic and could be
incubated at 37°C in the air.
24
2.3 RESULTS
2.3.1 THE DEVELOPMENT OF INOCULATION PROCEDURES FOR
LABORATORY STUDIES.
2.3.1.1. SE_ore preparation
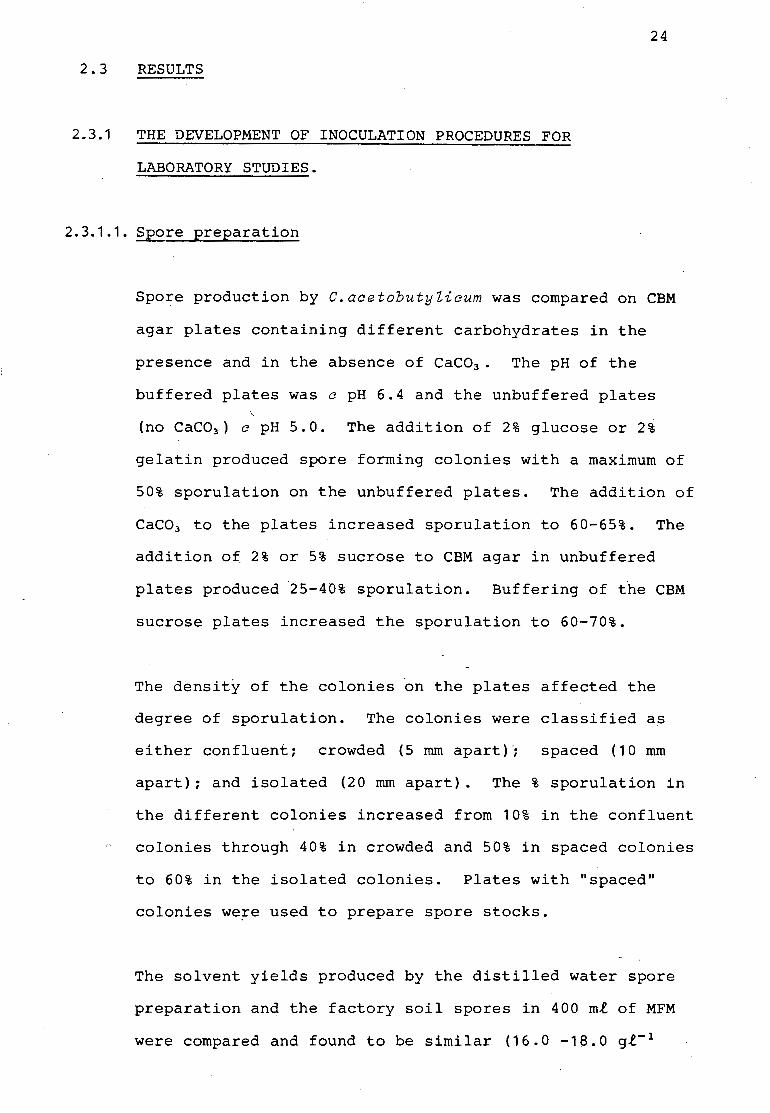
Spore production by C.aoetobutyZi~um was compared on CBM
agar plates containing different carbohydrates in the
presence and in the absence of CaC03 • The pH of the
buffered plates was o pH 6.4 and the unbuffered plates \.
(no CaC03 ) c pH 5.0. The addition of 2% glucose or 2%
gelatin produced spore forming colonies with a maximum of
50% sporulation on the unbuffered plates. The addition of
CaC03 to the plates increased sporulation to 60-65%. The
addition of 2% or 5% sucrose to CBM agar in unbuffered
plates produced 25-40% sporulation. Buffering of the CBM
sucrose plates increased the sporulation to 60-70%.
The density of the colonies on the plates affected the
degree of sporulation. The colonies were classified as
either confluent; crowded (5 mm apart)·; spaced ( 10 mm
apart); and isolated (20 mm apart). The% sporulation in
the different colonies increased from 10% in the confluent
colonies through 40% in crowded and 50% in spaced colonies
to 60% in the isolated colonies. Plates with "spaced"
colonies were used to prepare spore stocks.
The solvent yields produced by the distilled water spore
preparation and the factory soil spores in 400 ml of MFM
were compared and found to be similar (16.0 -18.0 gl- 1
25
after 48 h). The laboratory spore stocks maintained in
distilled water at 4°C were viable for up to 36 months
and reproducible solvent levels of 16-18 gl- 1 were obtained
in MFM (48 h).
2.3.1.2. Spore activation and germination
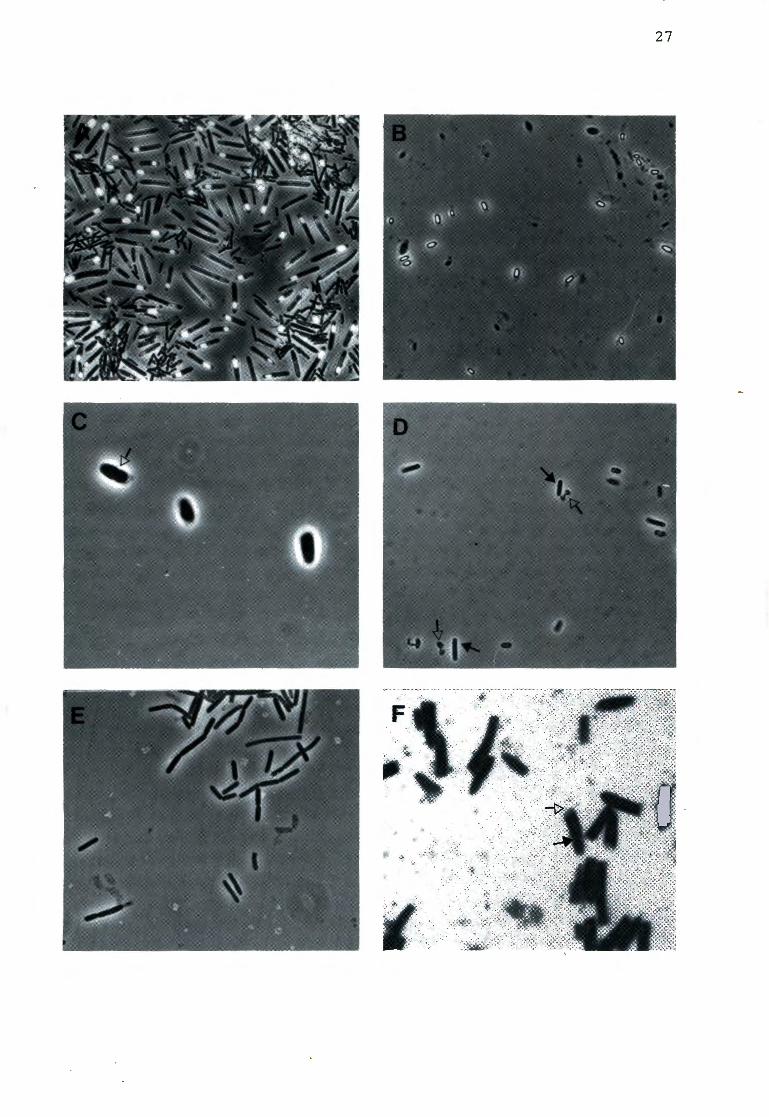
Germination studies carried out in CBM indicated that
c 95% of the spores in heat shocked cultures become
constricted (Fig 2.1C) which was indicative of germination
occurring. Approximately 55% of the constricted spores
underwent outgrowth (Fig 2.1D) to produce motile vegetative
cells (Fig 2.1E). In spore cultures which were not heated
<10% of the spores germinated. It took c 30min for heat
activated spores to change from phase dark spores (Fig 2.1B)
to phase grey spores. Within 1.5 h the majority of the
spores had germinated and were phase dark, swollen and
constricted (Fig 2.1C). The spores ruptured along the
constriction and outgrowth occurred (Fig 2.1D) leading to
the production of phase dark motile rods (Fig 2.1E). The
appearance of the first vegetative cells occurred c 2 h
after the heat activation step.
The effect of different cooling procedures following heat
activation of spores on solvent production in MFM (400 ml)
was compared. The heat activated spores were either cooled
·in an ice/ethanol bath or under running tap water for 45 s.
The final solvent yields after 48 h were 16.812 gt- 1 and
16.774 gt- 1 for spores cooled in ice/ethanol and running
tap water respectively.
Figure 2.1
Photomicrographs of C.acetobutylicum
P262 sporulation events (A-D) and
different cytological stages (E-F) .
(A) Sporulating rods with phase bright
spores from CBM sucrose plates.
(B) Distilled water, phase bright
spore preparations. (C) Phase dark
spores 1 h after heat activation; ( ~)
spore constricted. (D) Spores 2 h after
heat activation: (~ f remains of spore;
( +) newly emerged motile vegetative rod.
(E) Actively growing motile vegetative
phase dark rods. (F) Iodine stained
clostridial forms showing granulose
accumulation <+) and unstained
forespore ( ~) •
26
27
28
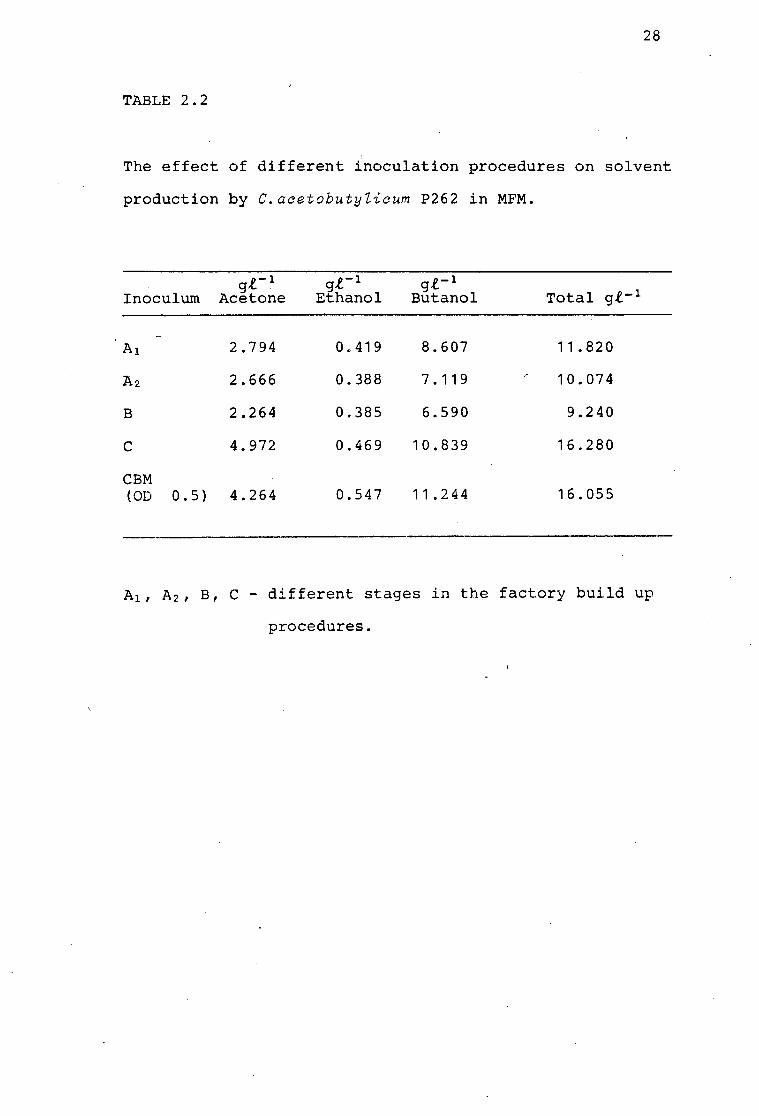
TABLE 2.2
The effect of different inoculation procedures on solvent
production by C.aaetobutylieum P262 in MFM.
Inoculum gl-1
Acetone gl-1
Ethanol g,t-1
Butanol Total g.t- 1
'A1 2.794 0.419 8.607 11. 82 0
Az 2.666 0.388 7.119 10.074
B 2.264 0.385 6.590 9.240
c 4.972 0.469 10.839 16.280
CBM (OD 0.5) 4.264 0.547 11.244 16.055
A1 , A2 , B, C - different stages in the factory build up
procedures.
29
2.3.1.3 .. Simplification of inoculation procedures for laboratory
studies
The factory build up stages A1, A2 , or B were not suitable
as inocula, as the solvent yields after 48 h in MFM were
<12 gt- 1 (Table 2.2). The C stage inoculum produced
<16.0 gt- 1 solvents in MFM after 48 h (Table 2.2).
Fermentation without the factory build up stages could be
carried out successfully using exponential, actively motile
cells grown in CBM (Table 2.2). Optimum transfer of the
CBM grown inoculurn to MFM was at an absorbance between
0.4-0.5 (c 10 8 cells rnl- 1 ). At this stage the cells are
actively motile phase dark (Fig 2.1E) and strongly Gram
positive.
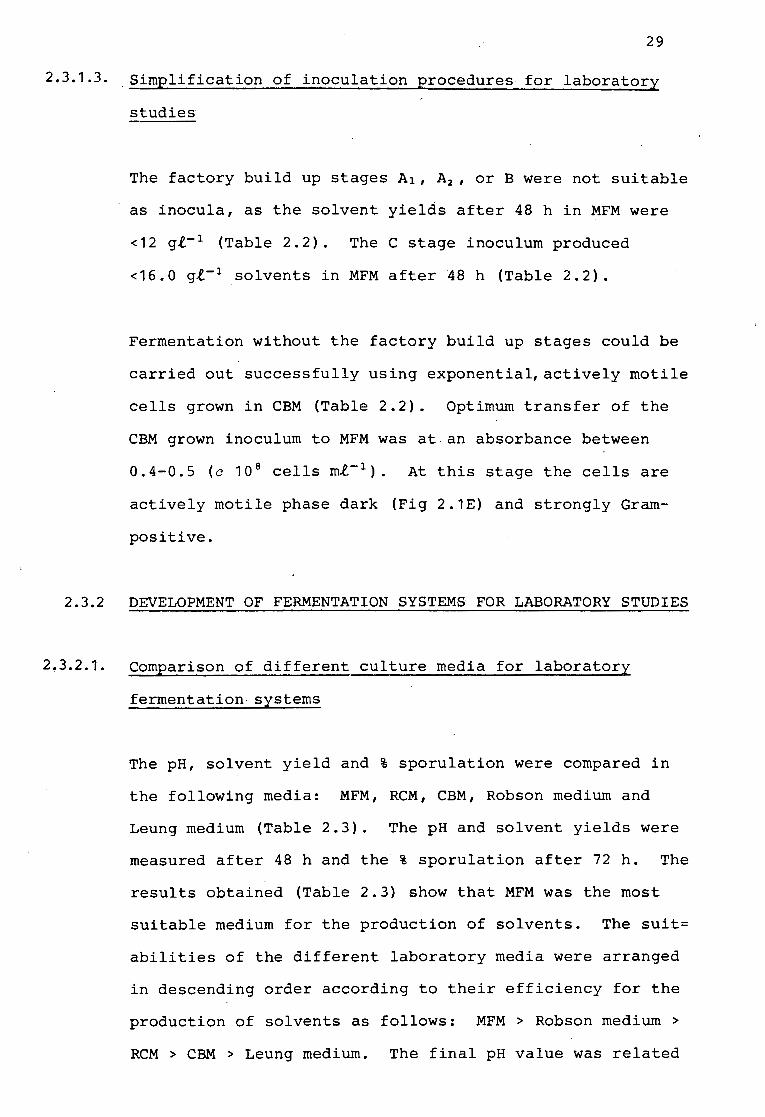
2.3.2 DEVELOPMENT OF FERMENTATION SYSTEMS FOR LABORATORY STUDIES
2~3.2.1. Comparison of different culture media for laboratory
fermentation· systems
The pH, solvent yield and % sporulation were compared in
the following media: MFM, RCM, CBM, Robson medium and
Leung medium (Table 2.3). The pH and solvent yields were
measured after 48 h and the % sporulation after 72 h. The
results obtained (Table 2.3) show that MFM was the most
suitable medium for the production of solvents. The suit=
abilities of the different laboratory media were arranged
in descending order according to their efficiency for the
production of solvents as follows: MFM > Robson medium >
RCM > CBM > Leung medium. The final pH value was related
30
TABLE 2.3
Comparison of different culture media for laboratory-
fermentation systems.
Media pH (Oh) pH (48h) Solvents % Sporulation g.e.- 1 (48h) (72h)
MFM (6.5% 6.2 5.9 16-18 < 5 TIS)
Robson Medium (6% glucose) 6.6 5.8 13-15 < 5
RCM ( 6 % glucose) 5.9 5.2 8-10 20-30
CBM (6% glucose) 6.5 4.8 7-8 20-30
Leung Medium (6% glucose) 6.6 4.7 7-8 20-30
2.3.3
31
to solvent yields: the greater the solvent yields the
higher the final pH. There was also a correlation between
solvent yields and sporulation. High solvent yields were
associated with low sporulation levels.
FACTORS EFFECTING FERMENTATION UNDER LABORATORY CONDITIONS
Solvent yields between 16-18 gl- 1 were·obtained in batch
fermentations of MFM in flask cultures. It was unnecessary
to use a laboratory fermenter to control the pH levels in MFM.
The effect of different volumes of MFM on solvent production
by C.acetobutyZiaum P262 was compared under aerobic and
stringent anaerobic conditions (Table 2.4). C.aaetobutyZiaum
P262 did not grow in less than 100 ml of MFM under aerobic
conditions, while growth occurred in 10 ml of MFM under
anaerobic conditions. The volume of MFM affected the final
solvent yields. The optimum volume of MFM was dependent on
the culture vessel size and conditions of incubation.
Under aerobic conditions 400 ml of MFM were required in a
500 ml ~lask in order to obtain a 17.0 gl- 1 solvents compared
with 800 ml of MFM in a 1l flask to obtain 17.0 gl- 1 under
the same conditions. Under stringent anaerobic conditions
300-400 ml of MFM were required to produce optimum solvent
levels in 500 ml and 1 l flasks. The solvent yields were
slightly higher in the 500 ml container (19.193 gl- 1)
compared with fermentations carried out in 1 l flasks
(18.863 gl- 1) under stringent anaerobic conditions.

TABLE 2.4
The effect of culture volume on solvent production in
MFM by C.aaetobutylicum under aerobic and stringent
anaerobic conditions.
Media Volume (ml)
Container Volume (ml)
Aerobic Total Solvent
gl-1
10 Hungate (15 ml) NG a
25 500 NG
50 500 NG
100 500 12.501
200 500 14.703
300 500 14.979
400 500 17.301
400 1 000 16.488
800 1 000 17.225
a NG No Growth
Anaerobic Total Solvent
gl-1
7.026
13.904
14.119
17.421
18.762
19.224
19.193
18.863
18.865
32
2.3.3.1.
33
The final solvent yields produced in 400 ml of MFM were
compared at 34°C and 37°C under stringent anaerobic
conditions. The solvent yields were consistently higher
at 34°C, 19.193 gl- 1 compared to 18.737 gl- 1 at 37°c.
When the fermentation of C.aaetobutyliaum in MFM was left
undisturbed (i.e. no mixing) for 48 h the majority of the
fermentations produced less than 16 gt- 1 solvents. The
effect of intermittent and continuous agitation of the MFM
cultures were compared under aerobic and stringent anaerobic
conditions. Continuous mixing of the MFM culture during the
fermentation had an adverse effect on the growth and solvent
production. Continuous mixing under· stringent anaerobic
conditions produced a 10 h lag in solvent production, while
continuous mixing under aerobic conditions inhibited growth.
Intermittent mixing at intervals ranging from 1 to 12 h under
aerobic and anaerobic conditions resulted in optimal solvent
production (17-18 gl- 1). The solvent yields~were consistently
higher under anaerobic conditions, 18.762 gl- 1, compared with
17.189 gl- 1 under aerobic incubation.
pH Control
Solvent production and pH were compared in MFM and in Leung
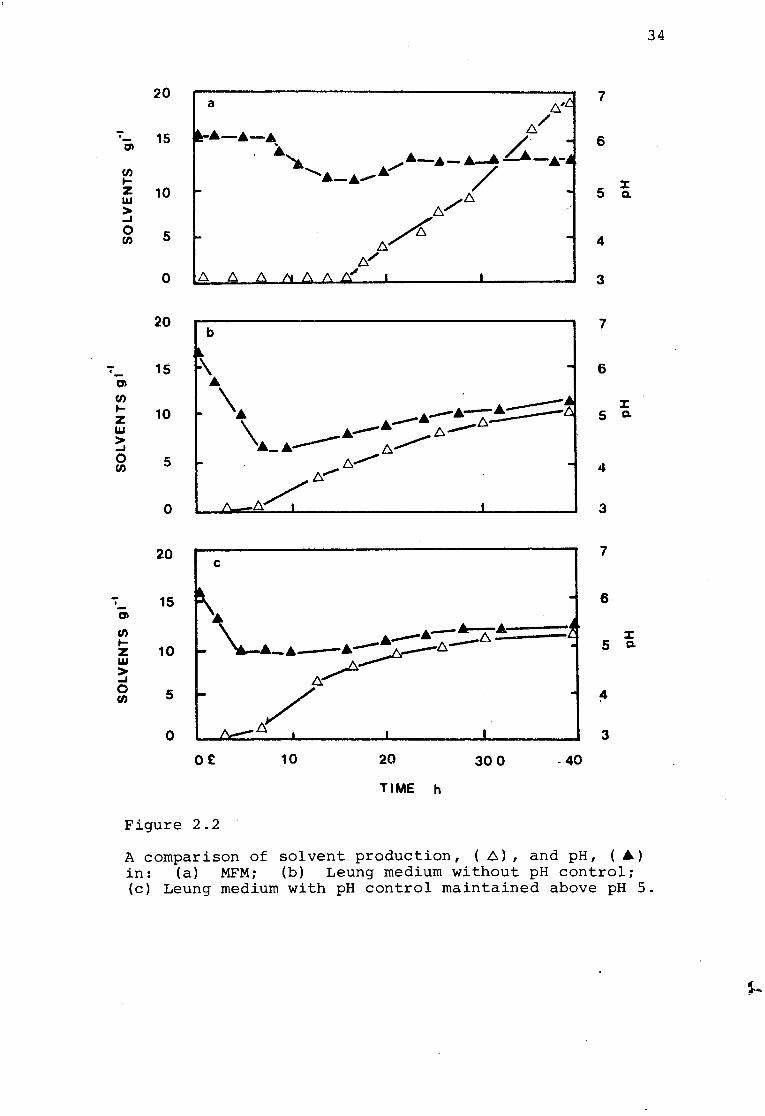
medium with and without pH control (Fig. 2.2). In MFM
(Fig. 2.2a) the period between 7 to 18 h was associated
with a gradual decrease in pH from pH 6.0 to a 5.1. Solvents
were detected after 18 h which was associated with the break
in the pH. The solvent levels increased between 18 to 36 h
before plateauing at a 19 gl- 1• During the production of
en 1-z w > ..J 0 en
OI
en 1-z w :; 0 en
OI.
en 1-z w :; 0 en
20
15
10
5
0
20 b
15
10
5
0
20 c
15
10
5
0
0£
Figure 2.2
10 20 300 .40
TIME h
7
6
5 ~
4
3
7
6
::c 5 Q.
4
3
7
6
::c 5 Q.
3
34
A comparison of sol vent production, ( ..6.) , and pH, ( .A) in: (a) MFM; (b) Leung medium without pH control; (c) Leung medium with pH control maintained above pH 5.
35
solvents the pH increased to a pH 5.8. In Leung medium
(Fig. 2.2b), without pH control, there was a sharp
d~crease in pH from a pH 6.2 to a pH 4·.5. Solvents were
detected after 7 h and correlated with the break in the
pH. The final solvent yield and pH after 40 h were a
10 g£- 1 and pH 5.4.respectively. If the pH of the culture
was controlled above pH 5.0 by the addition of 2 N, NaOH,
solvents were detected after 7 h (Fig. 2.2c). The final
solvent yields and pH were a 10.4 g£- 1 and pH 5.4
respectively.
36
2.4 DISCUSSION
The inoculation procedure for the ABE fermentation has
been simplified for laboratory use. The C.aoetobutyZiaum
P262 spores for general laboratory use were prepared from
sporulating colonies on CBM plates. The spores were
resuspended in distilled water and maintained at 4°C.
The factory soil I spore system and the clean spore system
produced normal solvent yields in MFM. The clean spore
system has the advantage in that it enables microscopic
examination to check for contamination, facilitates germination and
activation studies, and allows the spore suspension to be diluted accurately.
The clean spores were viable and produced normal solvent
yields in MFM over a period of 36 months. This finding
differs from Weyer and Rettger (1927). In a study of six
different strains of C.aoetobutylicum, Weyer and Rettger
(1927) showed that storage of spores, in soil, for six months
reduced their ability to produce solvents.
The heat activation of spores prior to inoculation was
necessary to obtain good solvent yields. Ryden (1958)
suggested that spores subjected to heat activation (shocking)
kills the weaker spores and produces a better fermentation.
The improved fermentation may also be due to the fact that
the heat activation produces a synchronised culture. The
sequence of events following heat activation of C.acetobutyZioum
spores are similar to the sequence found for the genus Bacillus
(Steinberg et aZ., 1969). The sequence of events occurring
after heat activation of C.aaetobutyZioum spores are
37
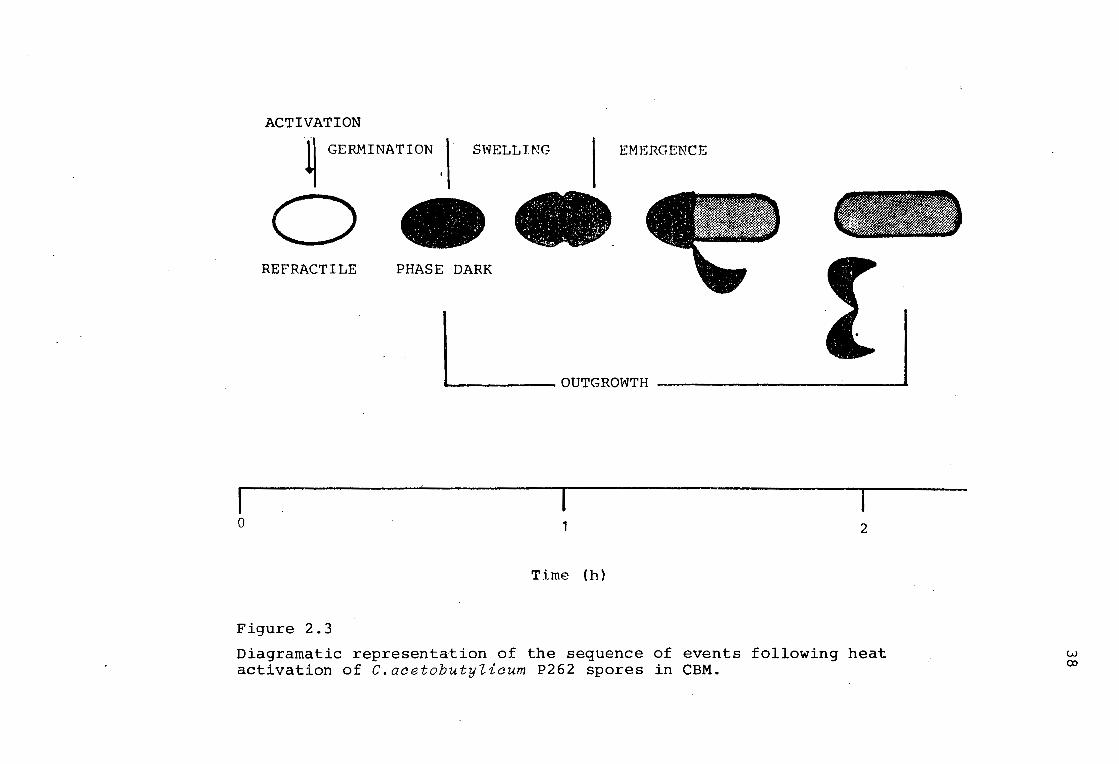
diagramatically illustrated in Fig. 2.3.
The factory build up stages were not necessary to obtain
normal solvent yields in MFM. The laboratory fermentation
procedure adapted for routine laboratory use, consists of
a 12-18 h CBM C.aoetobutytioum culture in which the cells
are actively motile. The inoculation system developed
was reliable and gave reproducible results.
The solvent yields obtained in the fermentation of molasses
under laboratory conditions corresponds with the yields
produced at the N.C.P. factory. Under factory fermentation
conditions solvents are produced in the ratio 6:3:1;
n-butanol; acetone; ethanol. The laboratory fermentation
produced approximately the same ratios of butanol and acetone
as in the factory, but the ethanol levels were lower. The
fermentations were carried out in simple culture vessels
and it was not ne?essary to use laboratory fermentors. The
disadvantage of the system was that small volumes, less than
400 ml, can not be used to obtain optimum solvent yields in
MFM. Anaerobic facilities and mixing once every 12 h was
required for 400 ml cultures to obtain optimum solvent yields.
An investigation into the solvent production by C.aoetobutytioum
in CBM, RCM, Leung and Robson media was undertaken with the
aim of developing a partially defined laboratory medium which
produced solvent yields comparable to MFM. The finai solvent
yields obtained in the laboratory media were substantially lower
than those obtained in MFM. The most successful of the
laboratory media used was Robson medium which produced
ACTIVATION
~ GERMINATION' I SWELLING I EMERGENCE
oe• REFRACT ILE PHASE DARK
0 1 2
Time (h)
Figure 2.3
Diagramatic representation of the sequence of events following heat activation of C.acetobutylicum P262 spores in CBM.
w CX>
39
c 14 gt- 1 compared with c 18 gt- 1 obtained in MFM.
Davies and Stephenson (1941) found that when solvent yields
were low the pH of the medium was high. In MFM the decrease
in pH was gradual and did not decrease below pH 5.0. However
in the other media tested the pH decreased rapidly to a pH
below 5. Leung (1980) utilizing C.acetobutyliaum ATCC 824
in Leung medium containing 10% (w/v) glucose (pH controlled
above pH 5), obtained a 20 gt- 1 after 24 h fermentations.
Under the same culture conditions C.acetobutylicum P262
produced less than 10 gt- 1 solvent after 48 h.
It became apparent that the initial aim of trying to identify
and ma.nipulate a few key factors to give better solvent
yields would not be easily obtained. Not only did the solvent
levels differ but the overall pattern of cell development
appeared to be markedly different in the various laboratory
systems. In view of these differences, a more detailed
investigation of the growth patterns, morphological and
physiological changes were necessary.
CHAPTER III
THE STUDY OF THE ABE FERMENTATION UNDER LABORATORY
CONDITIONS
Studies on the morphological changes in
the ABE fermentation system suggested that
the clostridial stages in C.acetobutylcium
were involved in the conversion of acetate
and butyrate to acetone and butanol.
This was supported by the isolation of
sporulation mutants. The different solvent
levels produced by C.acetobutylicum in MFM
and CBM appear to be associated with the
different patterns of cell development which
were observed in the two systems.
3.1 INTRODUCTION
Based on the information available in the literature
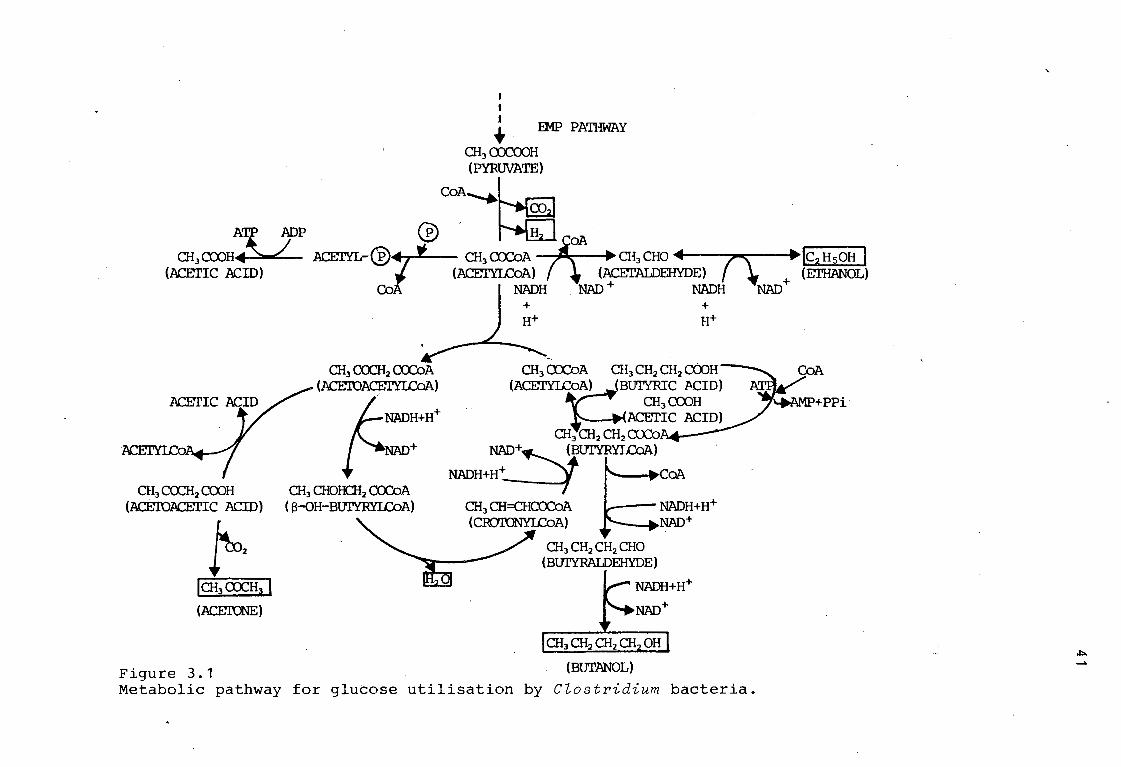
40
(Doelle, 1975; Stanier et al., 1976; Gottschalk, 1978),
the most probable metabolic reactions occurring during
glucose utilisation by Clostridium organisms are shown
in Fig. 3.1. Initially glucose is metabolized via the
Ebden-Meyerhof-Parnas (EMP) pathway with the formation of
pyruvate which is then broken down to acetyl-CoA with
the release of carbon dioxide and hydrogen. Acetyl-CoA
itself plays a central roll in the metabolism of the
Clostridium bacteria by serving as a precursor to ethanol,
acetate and all the fermentation solvents. Saccharolytic
clostridia ferment glucose to butyric acid in preference
to acetate as the latter is a stronger acid. From an
energetics point of view the production of acetate as a
I I I + . EMP PA'IBWAY
Cl:I3CXXX()H (PYRWATE)
CoA......_.Lrm, MI Af'P ®. ~all
O:I3ccott+s-L-- ACET.lL-®tr CH,ax:oA~CH,CHo • (\ •(c,H,OH I (ACEI'IC ACID) (ACE:I'YLCoA) / ~ (~CEI'AIDEHYDE) (EI'HANOL)
Co NAOH NAO + NAOH NAO+
CH3 COCH2 CCOH (ACE'ro.ACETIC ACID)
fn· lrn3ani3 I (ACEIDNE)
Figure 3 .1
O:I3Cl:IOHCH2 COCDA ( 8-0H-BUI'YRYI.CoA)
Cl:I3CH2 CH2 CHO (BUI'YRALDEHYDE)
(BUTANOL)
NADH+H+
NAO+
+ tt+
Metabolic pathway for glucose utilisation by CZostridium bacteria.
42
sole end product would not be satisfactory since it
becomes more difficult to reoxidize the NADH as the pH
drops towards the acid region. The clostridia have
developed a similar cyclic mechanism to that found in
the propionibacterium which brings about the formation
of butyric acid. Two acetyl-CoA molecules undergo a
combination to form acetoacetyl CoA initiating the cyclic
mechanism that leads to the production of butyric acid.
A number of saccharolytic clostridia, which normally
ferment carbohydrates to butyric acid, are able to
change their systems, favouring the production of acetone,
and concurrently converting the butyrate already
produced to butanol. This new system comes into operation
as soon as the butyrate production has lowered the pH of
the medium to c pH 4.0, at which time a new enzyme system
is activated leading to the formation of acetone and \
butanol. In this system, acetoacetyl CoA is diverted from
the normal cyclic mechanism and is utilised via a transferase
system fgr the production of acetoacetate which is then
decarboxylated to acetone. The diversion of the original
cyclic system to form acetone stops further production of
but yr ic acid. As a result of the interuption of the cycle
two steps creating NAD+ are,eliminated and consequently
the clostridia must find alternative reducing reactions
for NAD+ regeneration (i.e. the production of butanol).
This involves three consecutive reactions where butyryl-CoA )
and butyraldehyde are formed as intermediate compounds.
The last reaction in. the cycle is reversed and the enzyme
CoA-transf erase transfers the co-enzyme (CoA) from the
acetyl group to the butyl group. The acetate formed is used
43
for the regeneration of acetyl-CoA in the production of
acetone. Butyryl-CoA may be formed by an alternative
pathway if there is a deficiency in the amount of acetyl
CoA available. ATP and enzyme CoA are required for the
process. The reduction of butyryl-CoA to butyraldehyde
is catalysed by the same aldehyde dehydrogenase that
reduces acetyl-CoA to acetaldehyde, the final reduction
to butanol is carried out by the NAD-linked alcohol
dehydrogenase. This production in butanol occurs after
the change to the production of acetone has taken place.
The pathway to ethanol production differs from that in
yeast, where ethanol is produced from pyruvate which is
converted by a decarboxylase to acetaldehyde and carbon
dioxide, the acetaldehyde being reduced by a NAD-linked
reaction to ethanol. C.acetobutylicum forms acetyl-CoA
from pyruvate which is converted by the enzyme aldehyde
dehydrogenase to acetaldehyde which in turn is converted by
NAO-dependent alcohol dehydrogenase to form ethanol. It is
known that the final solvent ratios obtained are a function
of the Clostridium utilised (Beech, 1952). Most of the
bacteria that have been used in the commercial ABE
fermentation give a mixture composed of a 65% butanol, 30%
acetone and 5%·ethanol (Rose, 1961).
The biochemistry and physiology (Prescott and Dunn, 1940;
Walton and Martin, 1979) associated with solvent
production in the ABE process have been well documented.
However, little has been reported about the relationship
44
between the morphological changes and solvent production
in the ABE process. This chapter describes the
morphological changes which occur during the ABE
fermentation and the isolation of C.aeetobutyZiaum
sporulation mutants which can be used to elucidate the
relationship between morphology, growth and solvent
production.
45
3.2 MATERIALS AND METHODS
3.2.1. BACTERIAL STRAINS
As described in 2.2.1.
3.2.2. MEDIA
All media used are listed in Appendix B.
3.2.3. GENERAL METHODS.
The fermentation methods, heat shocking and inoculation
procedures outlined in Chapter II were used unless
stated otherwise.
3.2.4. GROWTH MEASUREMENTS
Cell growth in laboratory media was monitored turbidometrically
at 600 nm in a Corning Colorimeter. Total bacterial counts
were carried out using a Thoma counting chamber (Webb,
England) and a Zeiss photornicroscope fitted with phase
contrast and interference contrast optics. Viable counts
were carried out by diluting the cells into fresh CBM and
plating onto CBM plates under stringent anaerobic conditions.
3.2.5. MORPHOLOGY
Clostridial stage counts and spore counts were carried out
microscopically using the Thoma counting chamber. Cells
46
were investigated for the presence of capsules by
negative staining with Indian ink, for granulose by
staining with iodine and forespore formation by the
methods of Smith and Ellner (1957) and Hoeniger and
Headley (1968). The Gram reaction of the bacterium was
determined by the method described by Cruikshank et al.,
(1969). The % motility on a wet slide mount was
calculated by a differential count of motile and non-
motile cells in a given microscopic field.
3.2.6. CHEMICAL ANALYSIS
Titratable acids, pH and solvent analyses were carried out
as described in 2.2.6.
3.2. 7. CELL FREE AUTOLYSIN ASSAY
The autolysin was assayed by the well method (Mayr-Harting
et al., 1972) in 10-ml CBM plates containing 1% (w/v) agar
and seeded with a 0.8 ml suspension of C.acetobutylicum
indicator strain (Webster et al., 1981). A series of two
fold dilutions of the test culture supernatants (centrifuged
at 10 000 rpm for 10 min at 4°C) were made in 0.01 M sodium
acetate buffer, pH 4.5 and 25 µl of each dilution was added
to separate wells. The indicator strain suspension (00 600
0.5-0.7) in sterile distilled water was prepared from an
overnight plate of the C.acetobutylicum indicator strain.
The plates were incubated at 37°C in Gas Pack (B
Dickinson and Co.) jars. The activity of the cell free
autolysin in arbitrary units (AU) was defined as the
I
47
reciprical of the highest dilution which gave a detectable
zone of inhibition.
3.2.8. ISOLATION OF SPORULATION MUTANTS
Exponential phase CBM cultures (5 x 10 7 cell ml- 1 ) of
C.acetobutyZicum P262 were treated with ethyl methane
sulfonate (EMS) (2.5% v/v) for 20 min at 37°C to obtain
10% survival. The washed cells were resuspended in CBM
and incubated for 18 h before diluting and plating onto CBM
agar containing rifampin {100 ~g ml- 1). Spontaneous
rifampin resistant mutants were selected on gradient plates
containing rifampin. Rifampin-resistant colonies were
examined to determine whether they were also defective
in sporulation. Granulose mutants were isolated by the
method of Mackay and Morris (1971). The EMS treated cells
were washed and diluted to give discrete colonies when
plated onto CBM agar and incubated for 18 h. The colonies
-were then exposed to I 2 vapour for 1 min. The granulose
positive colonies turned blue black while the granulose
negative colonies remained a creamy white colour.
3. 3 . ·RESULTS
3.3.1. STUDY OF THE ABE FERMENTATION IN MOLASSES MEDIUM
3.3.1.1. GROWTH AND PHYSIOLOGICAL CHANGES
( The total and viable cell counts, titratable acid concentration,
\ pH and solvent production were monitored in MFM (Fig. 3.2a
1·6
':"
a, 1·2
UJ ,_ z UJ o·a _, <( > 5 0·4 0 LU
0
20
":'__ 15. 01
~ Z:10 w
~ 5
0
-:_ 109 E a: ~ho8 :E :::::> z 7 ..J 10 ..J w ()
-. 106
'* UJ100 _, _, ~ 00 -' <( b 60 I-
~ 40 z Q 20 t; <(
ff 0
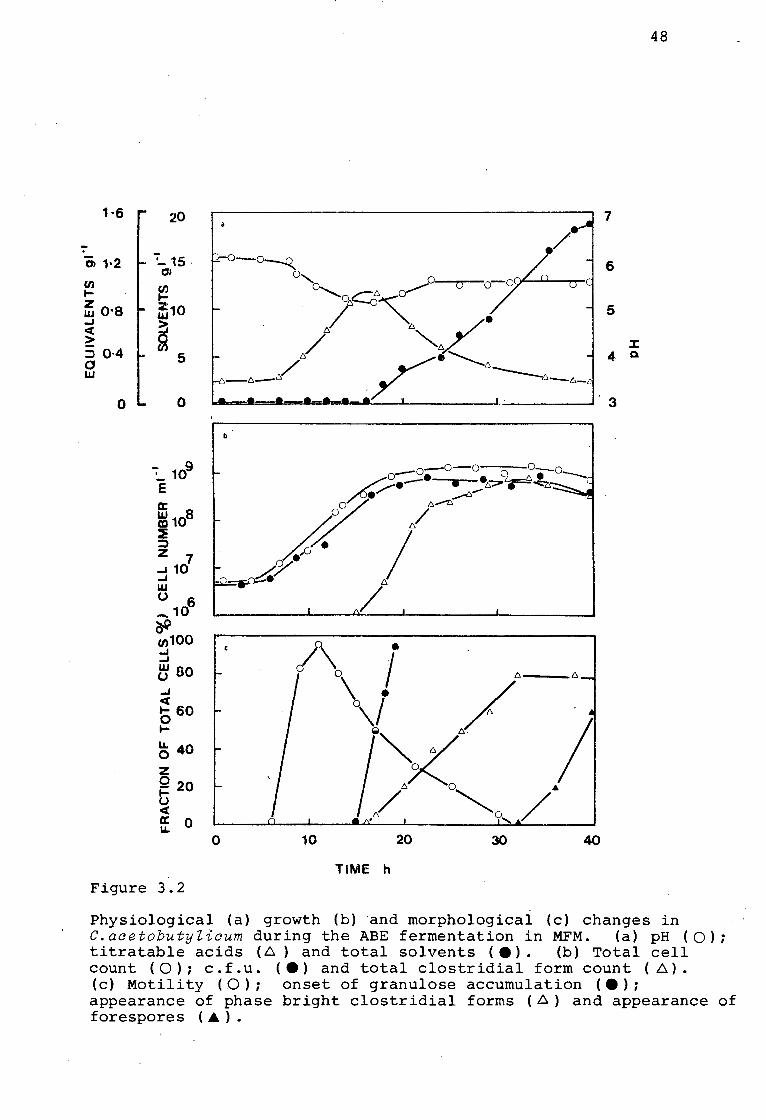
Figure 3.2
48
7
~-o~ ~ 6 0, ,,...,...-o o-o
q,C5~ 5
/ ' /" / "'6 :c li ................ 4 Q.
.. -~ ./" "-----~, 3
I ...
/ 0 10 20 30 40
TIME h
Physiological (a) growth (b) and morphological (c) changes in C. acetobutyZicum during the ABE fermentation in MFM. (a) pH ( O); titratable acids (.6 ) and total solvents ( e). (b) Total cell count ( 0) ; c. f. u. ( •) and total clostridial form count ( .6) • (c) Motility ( 0); onset of granulose accumulation ( e); appearance of phase bright clostridial forms (.6) and appearance of forespores (A ) .
49
and 3.2b). Exponential phase cells in CBM were diluted
10-~ fold to give an initial cell concentration of
between 10 5 to 10 6 cells m.e.- 1 .in the MFM. Cultures
inoculated in this way were characterised by a short
lag period of c 5 h. During the exponential growth phase
(between 4-8 h) the doubling time in the culture was
c 90 min. From 8 to 12 h the doubling time began to
increase and from 18 to 20 h no further increase in cell
number occurred. During the exponential growth phase,
the titrable acidity increased rapidly to a maximum after
13-18 h. This increase in titratable acid corresponded to
a decrease in the pH from pH 6.8 to pH 5.1. After 18 h
the quantity of titratable acid decreased. Coincidental with
the drop in the level of titratable acids there was an increase in
neutral solvents and the pH increased to c pH 5 .. 7. Solvents -were only
detected after c 18h when the cultures were entering the stationary
growth phase. Solvent production correlated with a change
in cellular morphology and the appearance of clostridial
forms (Fig. 3.2a and b). ~he final solvent yield varied
between 16 and 18 g.e.- 1• The ratio of the solvents
produced were c 6:3:1; n-Butanol (11.858 gl- 1): Acetone
(5.519 gl- 1 ): Ethanol (0.514 gl- 1 ). The solvent levels
increased between 18 to 36 h before plateauing. During
this 12 h period the majority of the vegetative rods were
converted to clostridial forms.
3.3.1.2. MORPHOLOGICAL CHANGES
Following inoculation into MFM the cells appeared as elongated
rods which developed septa and resulted in the formation of
long chains of phase dark, strongly Gram-positive cells with
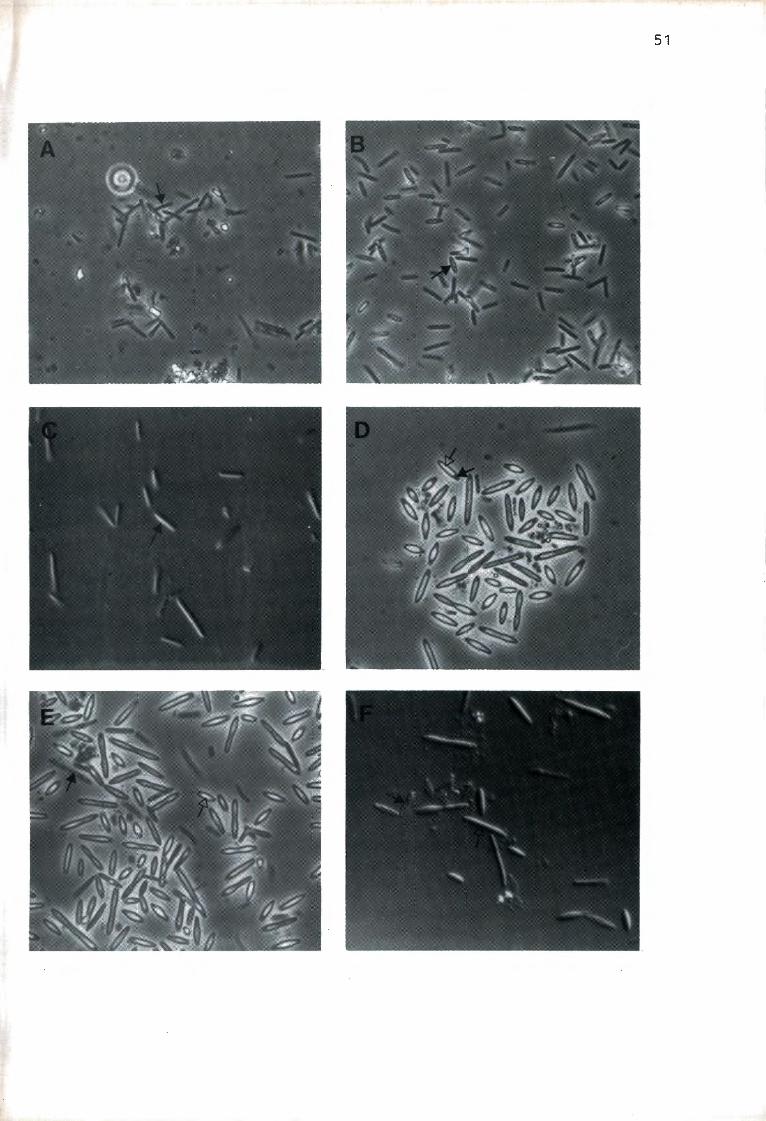
Figure 3.3
Cytological changes in C.acetobutyliaum
P262 during the fermentation in MFM. (A)
(6h) Actively growing phase dark rods ( t) (400 x). (B) (18h) Phase grey rods ( t) (400 x). (C), (18h) Interference contrast
optics of phase grey rods ( +) (400 x).
(D) (33h) Phase bright clostridial ( ~) forms with phase dark ( t) (600 x). (E)
(38h) Phase bright clostridial forms ( ~)
and degenerating cells ( t) (600 x). (F)
(38h) Interference optics of phase bright
clostridial forms(~) and degenerating
cells (t ) .
50
51
Figure 3.4
Cytological changes in C.ac e t obutyZ i cum
P262 during the ABE fermentation in MFM.
(A) (48h) Phase bright clostridial forms
( Lf') and phase dark degenerating clostridial
forms ( t ) ( 4 0 0 x) . ( B) ( 6 0 h) Majority of
cells hav e degenerated ( t) and were phase
dark. Few phase bright clostridia ( ~) with
no forespores (600 x). (C) (60h) Inter=
f erence contrast optics of degenerating cells
( t) (600 x). (D) (48 h) Negatively stained
culture showing how the cells clump together.
(E) (20h) Negatively stained culture showing
thin capsule (~) associated vegetative cells
( t). (F) (36h) Negative stained culture
during peak of clostridial formation showing
thick capsule ( t ) .
52
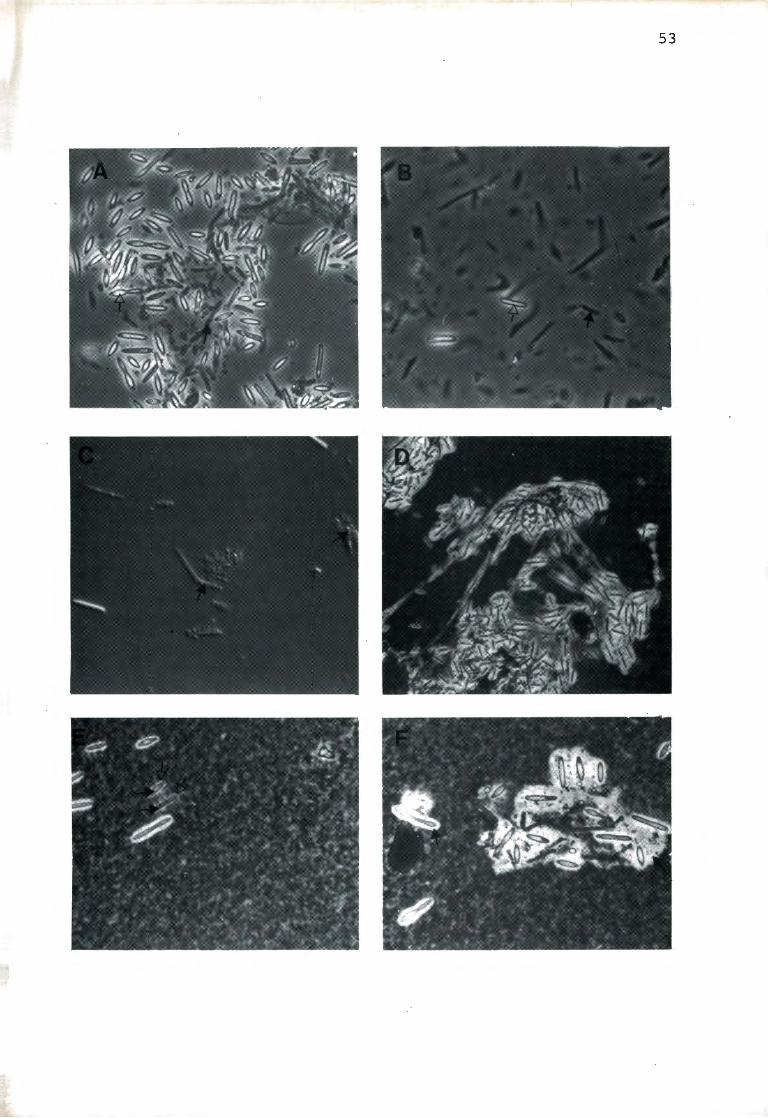
53
sporadic and sluggish motility. About 6 h after
inoculation the chains began to break up resulting in
54
a mixture of individual rods and pairs which were highly
motile (Fig. 3.3A). The peak in the number of motile
cells occurred at 12 h (Fig. 3.2c). At this stage the
growth rate was at its maximum and the rods were actively
dividing. Cessation of active growth between 18 and 22 h
correlated with the decrease in motility and at 22 h
the majority of the cells were non-motile and the rest were
sluggishly motile (Fig. 3.2c).
From 15 to 18 h the phase dark cells became p h ase grey with a
granular appearance (Fig. 3.3B), and under interference
contrast have a smooth appearance (Fig. 3.3C). Between
30 and 36 h the majority of the cells were phase bright and
swollen and formed the characteristic "cigar-shaped"
clostridial forms (Fig. 3.3D). A small minority of the
cells (<10%) which did not form clostridial forms became
Gram-negative and underwent degenerative changes. From
36 to 40 h the clostridial forms started degenerating
(Fig 3.2b). The degenerating cells were phase dark (Fig.3.3E)
and had a "rough" appearance under interference contrast
optics (Fig. 3.3F). After 48 h the majority of the cells
were phase bright clostridial forms (Fig. 3.4A) ~ however
after 60 h there were less than 10% phase bright clostridial
forms present and the majority of the cells were phase _ dark
(Fig. 3.4B). The phase dark cells have a "rough", ill-
defined outline under
(Fig. 3. 4C) .
interference contrast optics
55
Granulose accumulation within the cells was first
detected 1 to 2 h before the pH breakpoint (Fig. 3.2c) as
small isolated phase bright granules (Fig. 3.3B) which
stained a brownish-purple with iodine. Within 2 h
granulose accumulation could be detected in over 90%
of the cells (Fig 3.2c) which stained a uniform deep purple
with iodine (Fig 2.1F). This accumulation of granulose
was associated with the change from vegetative cells to the
typical swollen cigar shaped clostridial forms. Another
cytological change which was associated with the conversion
of vegetative rods into clostridial forms was the production
of a clearly defined extracellular capsule. From 16 to 18 h
very faint capsules were associated with bacteria which were
still in the vegetative form (Fig 3.4E), during this stage
the capsule thickness varies. At the peak of clostridial
formation the capsules were well-formed and were two to three
times the thickness of the width of the clostridial forms
(Fig 3.4F). The encapsulated clostridial forms stick
together and form clumps which rise and fall in the media
because of the gas associated with these clumps (Fig. 3.4D).
In the factory fermentations which are usually stopped after
36 h, spores were not normally observed. In laboratory
fermentations which were allowed to continue for 60 h, less
than 5% sporulation occurred. The sporulation was low even
though the forespores developed in the clostridial forms
between 30-35 h (Fig 3.2c and Fig. 3.3D). The forespores
did not develop into mature phase bright spores but degenerated
before sporulation occurred.
3.3.1.3. RELATIONSHIP BETWEEN SOLVENT PRODUCTION, AUTOLYSIN
PRODUCTION AND CLOSTRIDIAL FORM DEGENERATION
56
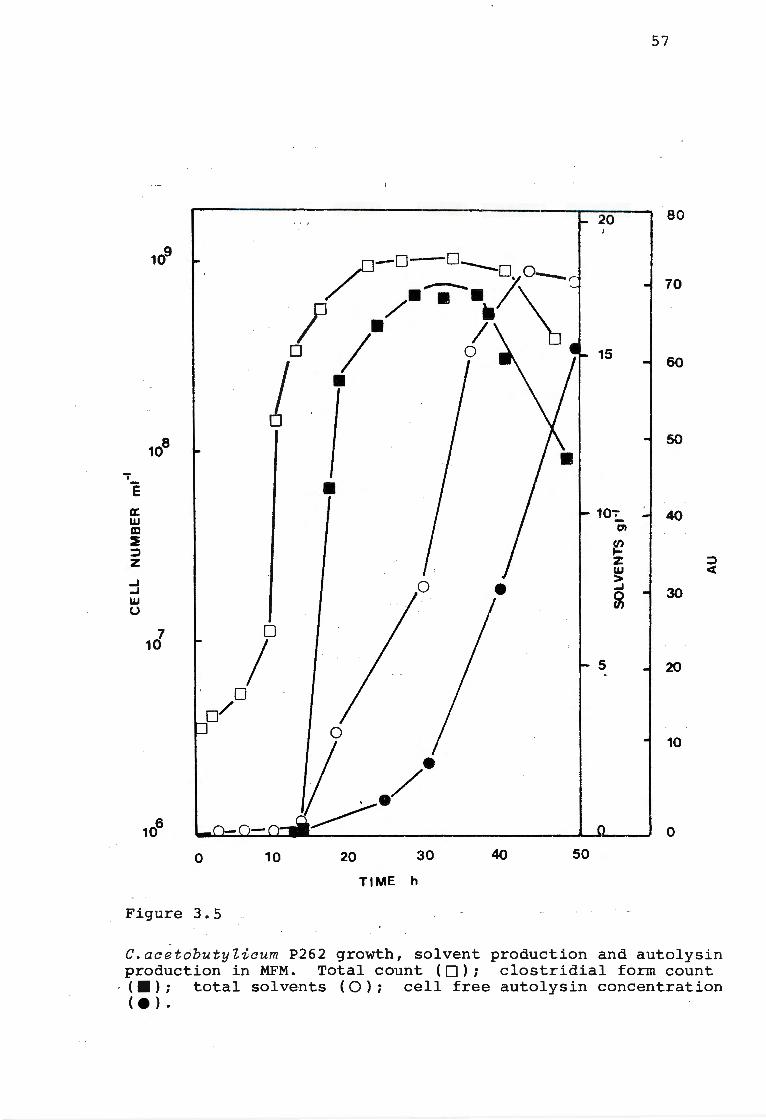
The production of autolysin by C.acetobutylicum P262 in
MFM is shown in Fig. 3.5. Low levels of autolysin were
detected after 24 h. The concentration of autolysin
increased between 24 and 50 h. The increase in the titre
of autolysin coincided with the end of exponential growth
phase. This increase in autolysin also coincided with a
decrease in the total count and the clostridial form
count, due to cell lysis. Once cell lysis commenced,
there was no further increase in the solvent concentration
which plateaued at 45 h.
3.3 . 2. ABE FERMENTATION IN THE LABORATORY MEDIUM CBM
3.3.2.1. GROWTH AND PHYSIOLOGICAL CHANGES
The same growth and physiological changes monitored in MFM
were observed in CBM (6% glucose) (Fig. 3.6 a and b).
Growth was measured turbidometrically as well as by viable
and total counts. CBM fermentations were characterised by
having no lag period. The rate of cell growth and the
initial decrease in pH was more rapid in the CBM cultures
than in MFM cultures. During exponential growth the doubling
time was c 40 min compared with 90 min in MFM cultures.
From 10-12 h there was a peak in the total number of
bacteria (Fig 3.6b) compared with a peak in absorbance
readings (600 nm) at c 14 h (Fig 3.6a). 'lbe viable count, colony
forming units (c.f.u.) coincided with the total bacterial count for the
57
20 80
109 /°-o-o ---o 0 / . .-. 7\ 70
l . J o / o 15
60 I . 0
108 so
.. E • a: 10:_ 40 w a:i OI
:E (/')
=> .... z z => w < ...J > • ...J ...J
~ 30 w u
7 0 10 I 5 20
D o/
10
0
0 10 20 30 40 50
TIME h
Figure 3.5
C. acetobutylicum P262 growth, solvent production and autolysin production in MFM. Total count ( D); clostridial form count ( •) ; total sol vents ( O ) ; cell free autolysin concentration (. ) .
58
0·6 20 5 1·0 7
- ~-\- I O·B 0·2 ~ 15 \, /."'-. ! 6
Cl l . E ._ x~ o~ c
o·a z 10 0 5 J:
w d . _. ·-· 0 Q. > I f;fl -·--·--·- 0•4 CD ..J • cl' 0 0
__ ....... 0·4 "' 5 I J --·-·- 0 4
/ ! ·-·-·-· 0·2
lit ,/' /
0 0 . -· 0 3
io9 b cro-o-o-~0~0--000
- a~·e:. 't:; I y •e:. .e:. _ e:..e:, E 1cP 0 'e:.
~ ' C:. er -~~ 0 - D -t ~ e-• O'u~- ~(j io: .o .... UJ
. 1 · / ' 0 ·~-···-CD 10
7 Cf \ ,..e D · ll -
~ I A ./ I :::> z ..J 1cf _.
I / w u
105
100 I c OU
I \ "' ..J 80 _, w u
0 1'~· _,
60 C( ._ 0 ._ ~ 40
ifo)• \ ~ . 0 z 0 20 ._ u C(
0 a: ~
0 10 20 30
TIME h
Figure 3.6
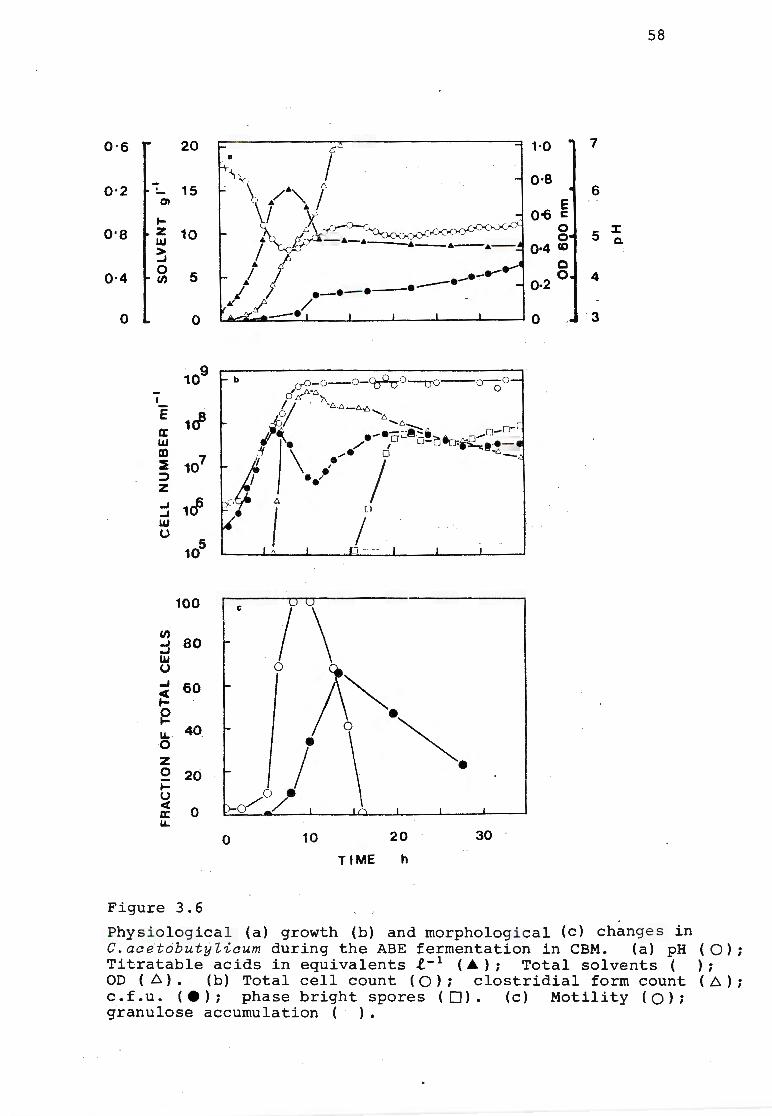
Phy siological (a) growth (b) and morphological (c) c hanges in C. acetobutyZicum during the ABE fermentation in CBM. (a) pH ( O) ; Titratable acids in equ i valents l- 1 (A); Total solvents ( ) ; OD ( b. ) • (b) Total cell count ( O) ; clostridial form count ( b. ) ; c.f.u. (e); phase bright spores (0). (c) Motility (Q); granulose accumulation ( ) .
59
first 6-8 h after which there was a decrease in the
number of c.f .u. up to 11-12 h when the c.f .u. increased
and plateaued at c 20 h. This decrease in viability was
associated with the peak in titratable acids (Fig 3.6a and b).
The period between 0-8 h was associated with the production
of titratable acids and a decrease in the pH from c pH 6.5
to c pH 4.5. Low levels of solvent were detected from
8-10 h when the cultures were entering the stationary growth
phase. Solvent production in CBM, as in MFM correlated with
a change in cellular morphology and the appearance of phase
bright clostridial forms (Fig 3.6b). The solvent y ield
obtained varied between 5-8 gl- 1• The ratio of the solvents
obtained were c 5:1:<1; n-Butanol (5.054 gl- 1): Acetone
(1.374 gl- 1): Ethanol (0.217 gl- 1
). During the formation
of solvents the titratable acids decreased slightly and the
pH increased to pH 4.5. The break in the pH was not as
marked as in the MFM system.
3.3.2.2. MORPHOLOGICAL CHANGES
After inoculation in CBM the short dark rods elongated
(Fig. 3.7A) and resulted in the formation of long chains,
which were strongly Gram-positive with sporadic motility.
About 2 h (compared _with 6 h in MFM). After inoculation
the chains broke up and the cells were actively motile.
At this stage the growth rate was at its maximum. As in
MFM a reduction in the growth rate after 8-10 h (c 20 in
MFM) correlated with a decrease in motility. After 15 h
none of the cells were motile (Fig 3.6c).

Figure 3.7
Cytological changes in C.acetobutylicum
during the ABE fermentation in CBM cont=
aining 5% glucose. (A) ( 2h) Elongated,
actively growing phase dark vegetative
rods (t) (160 x). (B) (Sh) Phase grey
vegetative rods ( +) (400 x). (C) (10h)
Phase grey rods (t) and degenerative,
phase dark rods (f) (400 x). (D) (12h)
Phase bright cells ( f) with phase dark
forespore ( t) (400 x). (E) (15h) Phase
bright cells (f) and degenerating cells
( .+) (400 x). (F) (24h) Sporulating
cells showing phase bright spore ( t ) and
phase dark spore mother cell (f) (400 x).
60
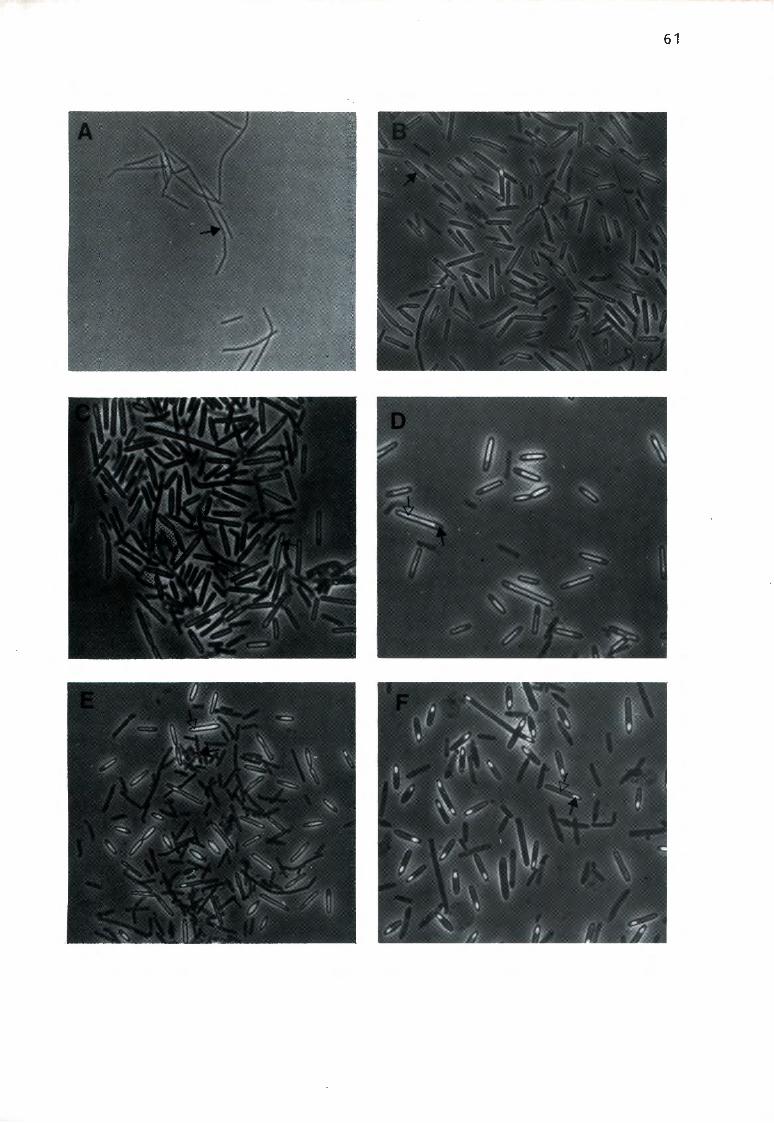
61
62
Between 6-10 h after inoculation the cells changed from
phase dark to phase grey (Fig 3.7B). A small proportion
of the vegetative cells degenerated and became Gram-
negative and had a phase dark granular appearance (Fig 3.7C).
The phase bright clostridial forms in CBM were long and thin
and did not have the characteristic "ci~ar-shaped"
appearance (Fig 3.7D). Phase dark forespores (Fig. 3.7D)
appeared after 12 h.
Granulose accumulation within the cell occurred at the pH
breakpoint (Fig 3.6c) and was correlated with the appearance
of phase bright cells. Capsule formation was not as well
defined in the CBM s y stem as in the MFM s y stem.
In the CBM system developmental sequences leading to the
production of mature free spores could be followed and the
stages of spore development could be identified. The stages
were similar to those reported for other bacilli and
clostridial strains (Murrel, 1967; Kay and Warren, 1968;
Fitz-James and Young, 1969;
Mackey a n d Morris, 1971).
Wal ker, 19 70;
The stages include
stage II cells which showed septum formation and forespore
engulfment. Stage III cells contained phase dark forespores
(Fig 3.7D). Stage V cells were characterised by the
appearance of phase bright forespores and at the same time
the spore mother cell appeared phase dark (Fig. 3.7F).
A proportion of the stage II/III cells (c 20%) underwent
degeneration and did not form mature spores (Fig. 3.7E).
3.3.3. THE USE OF DEVELOPMENTAL STAGE MUTANTS TO STUDY THE
RELATIONSHIP BETWEEN GROWTH, MORPHOLOGICAL STAGES
63
AND SOLVENT PRODUCTION
3.3.3.1. ISOLATION AND CHARACTERISATION OF MUTANTS
Two groups of mutants were obtained after treatment of
the C. a c etobutyli c um P262 strain with EMS (Table 3.1).
These mutants were characterised in CBM. The first group
of mutants were blocked before stage II and were unable
to produce phase bright swollen clostridial forms. These
mutants were designated as c lo s mutants and remained as
vegetative rods which were unable to synthesize granulose
and did not produce capsules or forespore septa. The
clos mutants which were obtained from rifampin plates
(clos 1 and c lo s2 ) were resistant to rifampin and were
presumably RNA polymerase mutants. The clo s mutants which
were isolated as granulose negative mutants (cl o s3 and
clos 4) were rifampin sensitive and were presumably mutants
in the granulose biosynthetic pathway.
The second group of mutan ts which were blocked after stage II,
were able to accumulate granulose and produced typical
clostridial forms surrounded by a capsule but were totally
or partially blocked in the production of mature spores
(Table 3.1). These mutants were designated as s po mutants
and were either asporogenous (spo 1 and spo 2) or
oligosporogenous (s po 3 and s po 4) mutants depending on
whether their ability to produce mature spores was completely
or partially blocked.
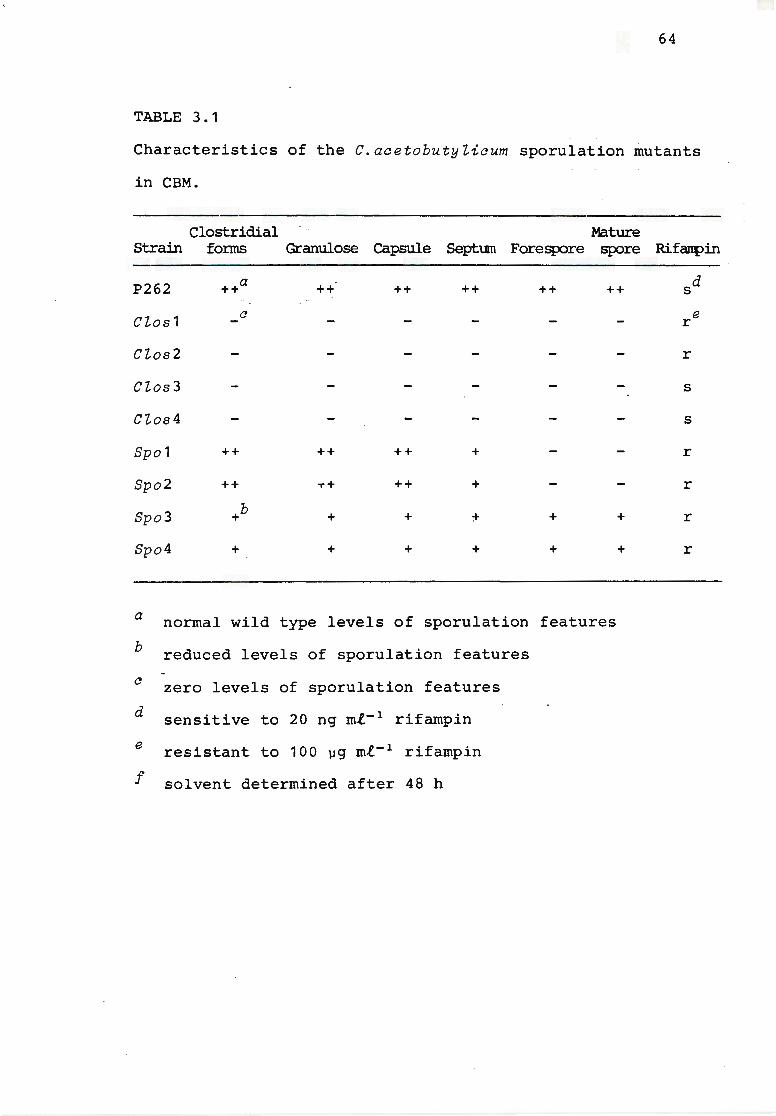
64
TABLE 3. 1
Characteristics of the C.acet obutyZicum sporulation mutants
in CBM.
Clostridial Mature Strain f onns Granulose Capsule Septum Fore spore spore
P262 ++a ++ ++ ++ ++ ++
CZos1 c
CZos2
CZos3
CZos4
Spo 1 ++ ++ ++ +
Spo2 ++ ... + ++ +
Spo 3 +b + + :+- + +
Spo4 + + + + + +
a normal wild type levels of sporulation features
b
c
d
e
f
reduced levels of sporulation features
zero levels of sporulation features
sensitive to 20 ng m1- 1 rifampin
resistant to 100 µg m1- 1 rifampin
solvent determined after 48 h
Rifanpin
sd
e r
r
s
s
r
r
r
r
65
In all the c Zo s and s po mutants, except for the cZos2
mutant, the growth rate vegetative cell development and
final cell concentrations were similar to that of
C.ac etobutyZ i cum P262. The cZos2 mutant grew more
slowly and produced a lower final cell concentration.
The characteristics of the C.aa e tobutyZ i c um P262
sporulation mutants were similar in MFM and CBM except that
the spo 3 and s po 4 mutants produced no phase bright mature
spores in MFM.
3.3.3.2. SOLVENT PRODUCTION BY SPORULATION MUTANTS
The solvent production of the 8 sporulation mutan ts and
C. acetobuty Zicum P262 were compared in MFM. In all
experiments the MFM was inoculated with exponential cells
growing in CBM. C. acetobuty Zi c um P262 produced the same
levels of solvent in MFM when inoculated with exponential
CBM cultures which were initially inoculated with heat
activated spores or Beef Liver Medium stock cultures of
C. acetobutylicum P262 (Fig 3.8). The four clos mutants
which were unable to form clostridial stages did not
produce solvents. The two asporogenous spo mutants which
produced clostridial forms at the same frequency as the
C. acetobutyZicum P262 but were unable to sporulate,
produced similar amounts of solvent to C. acetobutylicum
P262. The two oligosporogenous sp o mutants which formed
low numbers of clostridial stages and spores produced
intermediate levels of solvents.
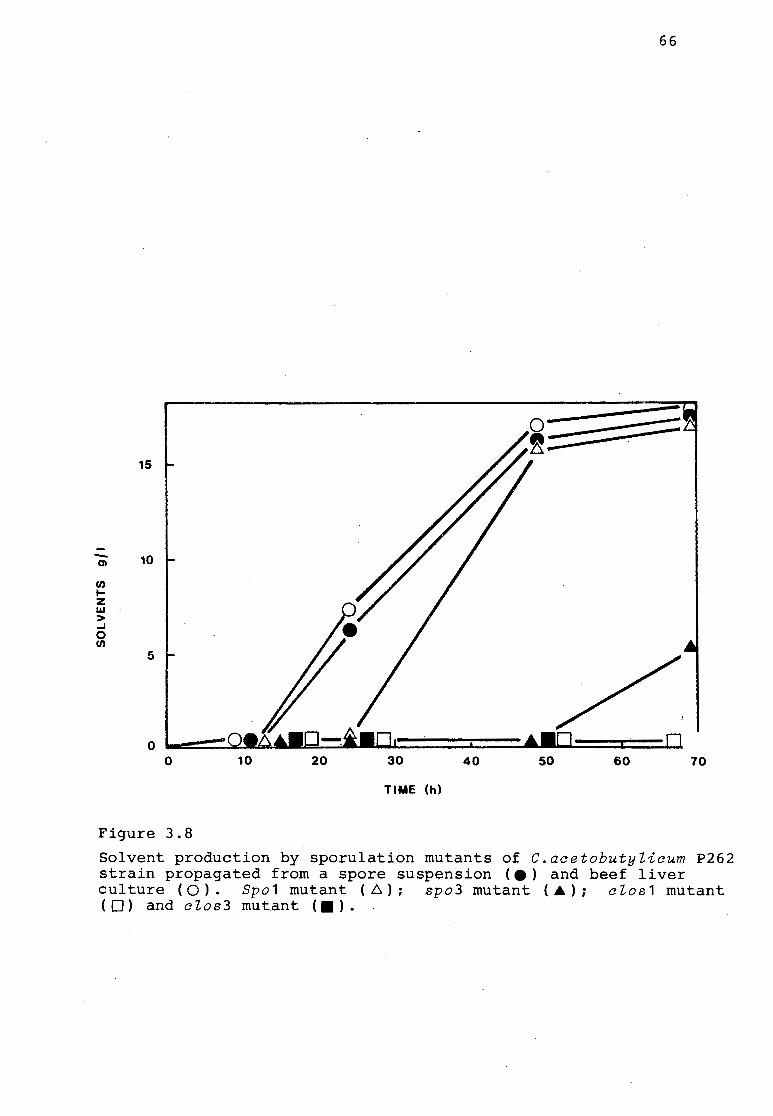
66
15
-- 10 DI
f/) t-z LI.I > ..J 0 en
5
0 0 10 20 30 40 50 60 70
TIME (h)
Figure 3.8
Solvent production by sporulation mutants of C.acetobutylicum P262 strain propagated from a spore suspension <•> and beef liver culture ( O ) . Spo 1 mutant ( D,.) ; spo3 mutant (A. ) ; c los 1 mutant ( O) and clos3 mutant ( •).
3. 4 '
67
DISCUSSION
The results obtained from monitoring the various growth
and physiological changes in the laboratory scale
fermentation of molasses correlated well with the results
obtained from the factory fermentation (Spivey, 1978).
Initial studies on the physiology of the ABE fermentation
were carried out by Speakman (1920) and Peterson and Fred
(1932). Three physiological phases similar to those
proposed by Speakman (1920) could be distinguished in the
laboratory fermentations.
The first phase was associated with exponential growth
and the accumulation of titratable acids and a decrease in
the pH. The bacteria reproduce rapidly during this period.
Gas production begins almost irrunediately, but is not
visible until after several hours have elapsed (Speakman,
1920).
During the second phase the fermentation enters the pH
"break-point" after which the pH begins to increase again
and the titratable acidity drops as the acids are converted
to the corresponding solvents. Different hypotheses
have been proposed for tne process of solvent formation
from the acids. The addition of acetic acid increased
acetone yields but did not effect butanol production.
(Prescott and Dunn, 1940). Similarly the· addition of
butyric acid only increased butanol production (Prescott
and Dunn, 1940). Bernhaeur and Kushner in 1953 e
(Nakmanovich and Shcheblykina,1960) showed that the
efficiency of conversion was dependent on the activity of
68
the C.acetobutyZicum used. Bernhaeur and Kurshner (1953)
do not define what is meant by an active culture,
presumably it is an actively growing culture. They
showed that an active culture would convert 97%. of the
acetic acid while weak cultures would only convert 30%
to acetone. Speakman (1920) and Peterson and Fred (1932)
showed that the ratio of acetic acid and butyric acid
varies during this period. Butyric acid disappears from
the fermentation much more rapidly than acetic acid and
accounts for the production of greater proportions of butanol
than acetone (Reiley et aZ., 1920).
The break in the pH could also be utilised to mark the
change over between the early (active growth) and late
(zero growth) stages in the fermentation process.
The final phase of the ABE fermentation is less distinct.
According. to Speakman (1920) the third phase was associated
with a decrease in solvent production and an increase in
titratable acid. In the factory fermentation the
total titratable acidsreach a peak at c 18 h then decreases
slightly (Spivey, 1978). However, in the laboratory
fermentation of molasses, the titratable acid decreases
to c zero in the medium. These differences may be due to
the buffers produced by the hydrolysis of corn or other
proteins (Speakman, 1920) in corn fermentations and the
pH regulation with ammonia under factory· conditions.
In the industrial fermentation of molasses it was necessary
to maintain a pH of 5.0 to 6.2, and preferably of 5.5 to
69
5.85 for optimum solvent production (Mccutchan and
Hickey, 1954). In the factory liquid ammonia is fed
into the vessels as a nitrogen source and a means of pH
control {Spivey, 1978). In addition to ammonia, calcium
carbonate is also utilised. Under laboratory conditions
pH regulation with ammonia was unnecessary as solvent
levels similar to those produced in the factory were
obtained.
The rate of cell growth and the initial decrease in the
1 pH of the medium was found to occur faster in CBM than in
MFM. This rapid increase in titratable acids may be a
critical factor in the low solvent yields obtained in CBM.
The different solvent levels produced by C.acetobutylicum
P262 in MFM and CBM appear to be associated with the
different patterns of cell development which are observed
in the two systems. The appearance of solvents in the
two systems coincided with the appearance of the first
phase bright clostridial forms during the late exponential
growth. In the CBM system the phase bright cells make up 50
to 70% of the total cell population compared with 70 to 90%
in MFM. The clostridial forms in CBM do not form the
characteristic "cigar shaped" clostrid~al forms associated
with good solvent production in MFM (Spivey, 1978). I
One of the most obvious differences between the two systems
was the lack of mature spore formation in the MFM system
in spite of the high proportion of clostridial forms
produced, which are sporulation intermediates {Gunsalus
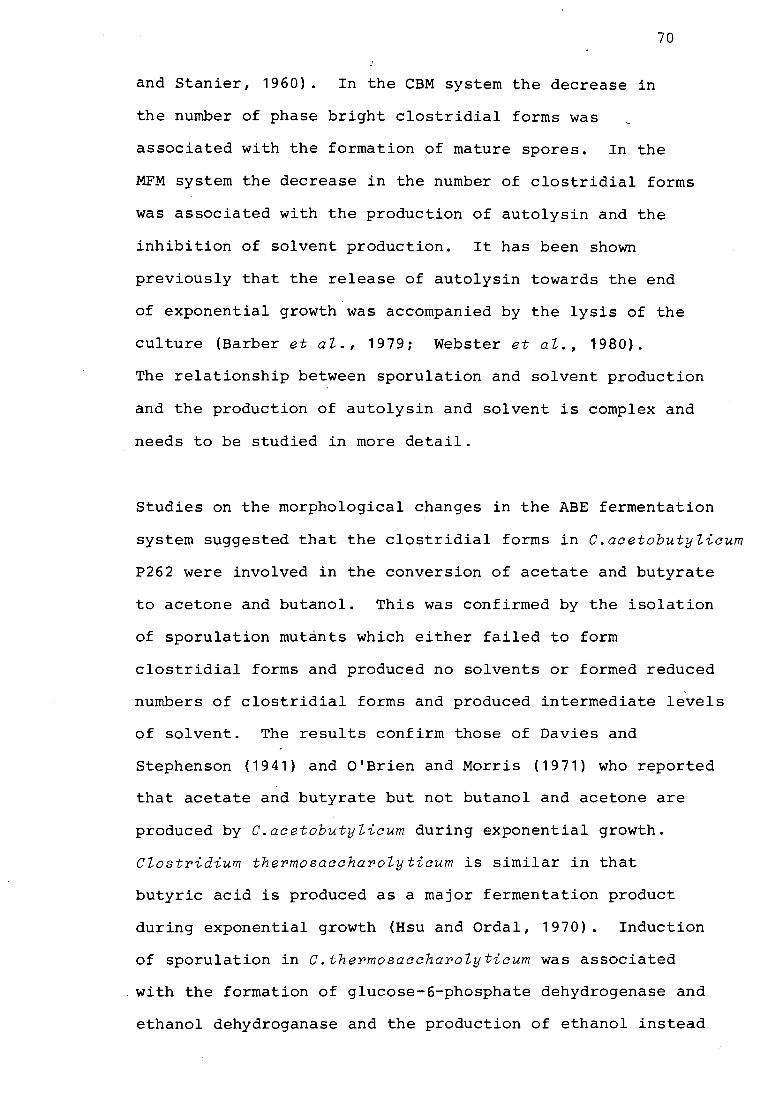
70
and Stanier, 1960). In the CBM system the decrease in
the number of phase bright clostridial forms was
associated with the formation of mature spores. In the
MFM system the decrease in the number of clostridial forms
was associated with the production of autolysin and the
inhibition of solvent production. It has been shown
previously that the release of autolysin towards the end
of exponential growth was accompanied by the lysis of the
culture (Barber et aZ., 1979; Webster et aZ., 1980).
The relationship between sporulation and solvent production
and the production of autolysin and solvent is complex and
needs to be studied in more detail.
Studies on the morphological changes in the ABE fermentation
system suggested that the clostridial forms in C.acetobutyZicum
P262 were involved in the conversion of acetate and butyrate
to acetone and butanol. This was confirmed by the isolation
of sporulation mutants which either failed to form
clostridial forms and produced no solvents or formed reduced
numbers of clostridial forms and produced intermediate levels
of solvent. The results confirm those of Davies and
Stephenson (1941) and O'Brien and Morris (1971) who reported
that acetate and butyrate but not butanol and acetone are
produced by C.acetobutyZicum during exponential growth.
CZostridium thermosaccharoZyticum is similar in that
butyric acid is produced as a major fermentation product
during exponential growth (Hsu and Ordal, 1970). Induction
of sporulation in C.thermosaccharoZyticum was associated
, with the formation of glucose-6-phosphate dehydrogenase and
ethanol dehydroganase and the production of ethanol instead
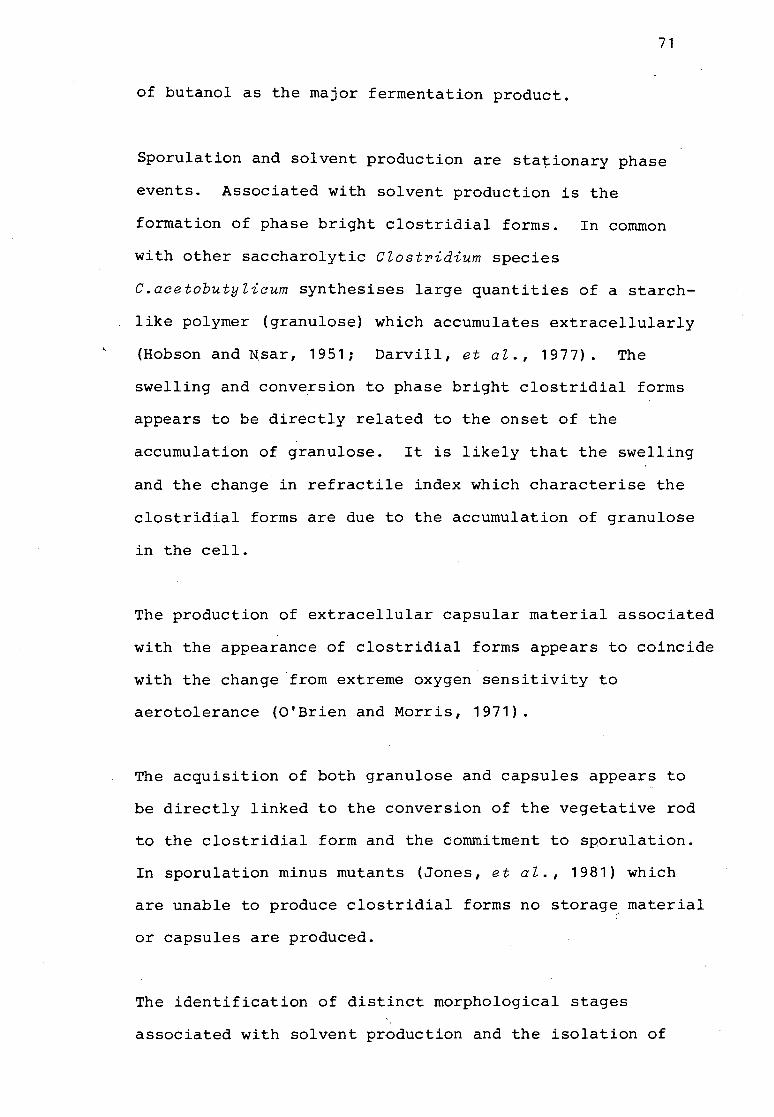
71
of butanol as the major fermentation product.
Sporulation and solvent production are stationary phase
events. Associated with solvent production is the
formation of phase bright clostridial forms. In common
with other saccharolytic CZostridium species
C.acetobutyZicum synthesises large quantities of a starch
like polymer (granulose) which accumulates extracellularly
(Hobson and N,sar, 1951; Darvill, et aZ., 1977). The
swelling and conversion to phase bright clostridial forms
appears to be directly related to the onset of the
accumulation of granulose. It is likely that the swelling
and the change in ref ractile index which characterise the
clostridial forms are due to the accumulation of granulose
in the cell.
The production of extracellular capsular material associated
with the appearance of clostridial forms appears to coincide
with the change 'from extreme oxygen sensitivity to
aerotolerance (O'Brien and Morris, 1971).
The acquisition of both granulose and capsules appears to
be directly linked to the conversion of the vegetative rod
to the clostridial form and the commitment to sporulation.
In sporulation minus mutants (Jones, et aZ., 1981) which
are unable to produce clostridial forms no storag~ material
or capsules are produced.
The identification of distinct morphological stages
associated with solvent production and the isolation of
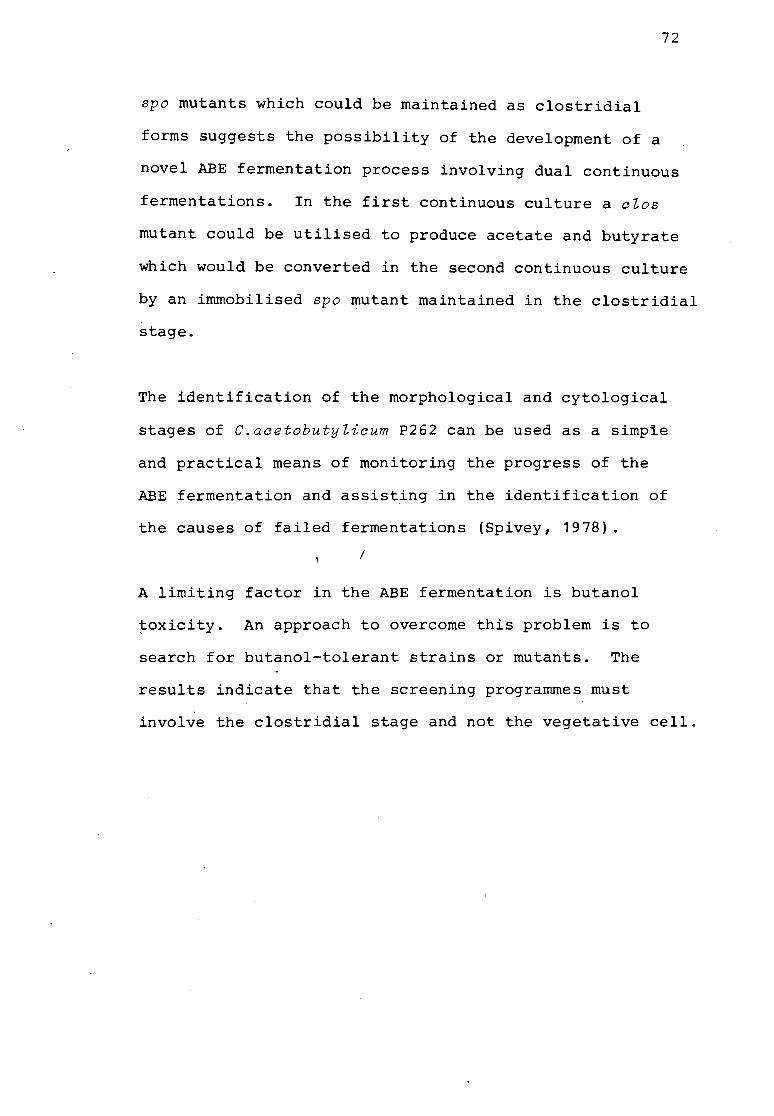
72
spo mutants which could be maintained as clostridial
forms suggests the possibility of the development of a
novel ABE fermentation process involving dual continuous
fermentations. In the first continuous culture a olos
mutant could be utilised to produce acetate and butyrate
which would be converted in the second continuous culture
by an immobilised spo mutant maintained in the clostridial
stage.
The identification of the morphological and cytological
stages of C.aoetobutylicum P262 can be used as a simpie
and practical means of monitoring the progress of the
ABE fermentation and assisting in the identification of
the causes of failed fermentations (Spivey, 1978).
I
A limiting factor in the ABE fermentation is butanol
~oxicity. An approach to overcome this problem is to
search for butanol-tolerant strains or mutants. The
results indicate that the screening programmes must
involve the clostridial stage and not the vegetative cell.
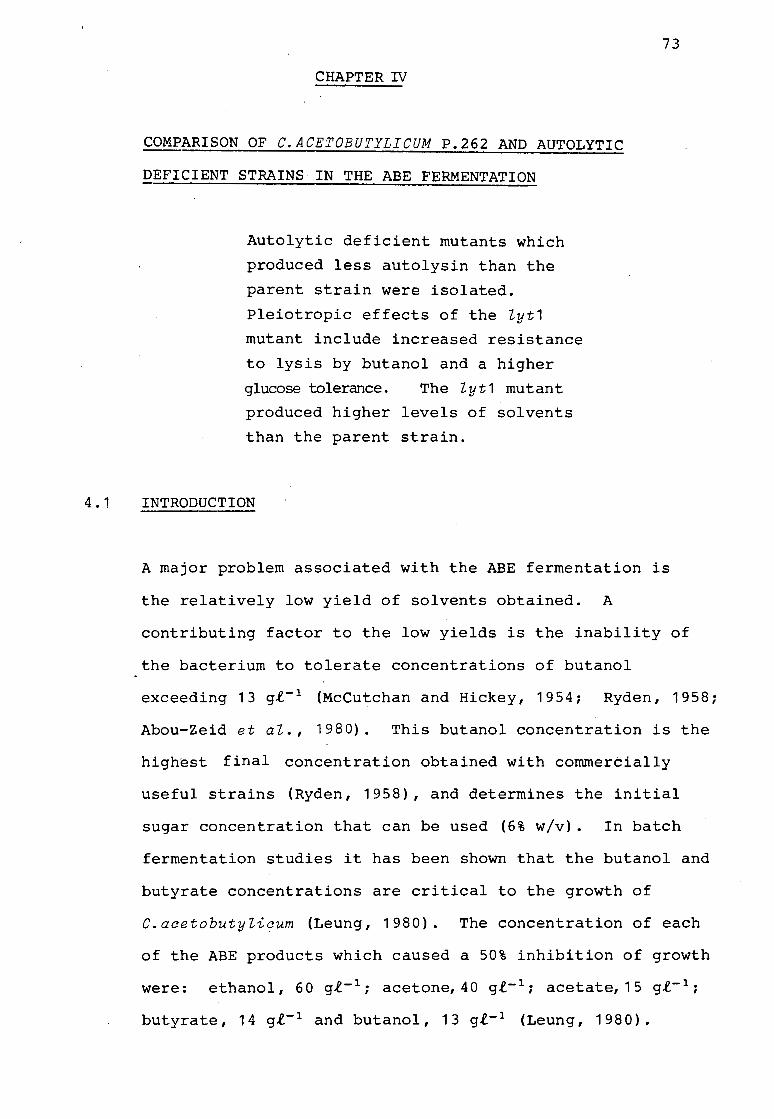
CHAPTER IV
COMPARISON OF C.ACETOBUTYLICUM P.262 AND AUTOLYTIC
DEFICIENT STRAINS IN THE ABE FERMENTATION
Autolytic deficient mutants which
produced less autolysin than the
parent strain were isolated.
Pleiotropic effects of the Zyt1
mutant include increased resistance
to lysis by butanol and a higher
glucose tolerance. The Zyt1 mutant
produced higher levels of solvents
than the parent strain.
4.1 INTRODUCTION
73
A major problem associated with the ABE fermentation is
the relatively low yield of solvents obtained. A
contributing factor to the low yields is the inability of
the bacterium to tolerate concentrations of butanol
exceeding 13 g!- 1 (Mccutchan and Hickey, 1954; Ryden, 1958;
Abou-Zeid et aZ., 1980). This butanol concentration is the
highest final concentration obtained with commercially
useful strains (Ryden, 1958), and determines the initial
sugar concentration that can be used (6% w/v). In batch
fermentation studies it has been shown that the butanol and
butyrate concentrations are critical to the growth of
C.aoetobutyZioum (Leung, 1980). The concentration of each
of the ABE products which caused a 50% inhibition of growth
were: ethanol, 60 g!- 1 ; acetone, 40 g!- 1; acetate, 15 gt- 1
;
butyrate, 14 g!- 1 and butanol, 13 gt- 1 (Leung, 1980).
74
Alcohols and other lipophylic agents interact directly
with the membrane lipid bilayer (Sheetz and Singer, 1974).
Lypophilic agents either fluidise or increase the
membrane's internal viscosity depending on-the site at
which these molecules partition and interact (Sheez and
Singer, 1974). This change in the degree of fluidity of
the membrane is induced by the direct insertion of
lypophilic agents into cellular membranes. Benzyl alcohol
(Hubbel et al., 1970; Paterson et al., 1972), as well as
ethanol and other alcohols (Grisham and Barnett, 1973;
Hui and Barton, 1973) have been shown to directly affect
membrane fluidity. The presence of alcohols in rich
growth media results in considerable changes in fatty acid I
composition of Escherichia coli K-12 (Ingram, 1976). The
degree of this variation in fatty acid composition is
strongly dependent upon alcohol concentration. The alcohol
concentration required to cause a given change in fatty acid
composition is inversely related to chain length, as is
toxicity (Ingram, 1976).
These changes in fatty acid composition in E.coli K-12 in
the presence of alcohol represents an adaptive membrane
alteration compensating for the direct physiochemical
interaction of alcohols with the membrane. Similar adaptive
responses of membrane lipids are proposed as a possible
biochemical basis for tolerance to alcohol and related
lypophilic agents (Ingram, 1976). Attempts have been made,
notably by Ryden (1958), to find a way of overcoming the toxic
effect of butanol in batch culture fermentations of
C.acetobutylicum. Selection of mutants (Ryden, 1958) after
75
ultraviolet irradiation and adaptation of cultures have
proved unsuccessful. Higher levels of butanol 14.4 gl- 1
(~compared with 13.0 gl- 1) were obtained when large
numbers of bacteria in their most active state were used
as inocula (Ryden, 1958). Jerusalemskii (1958) grew
C.acetobutyZicum in continuous cultivation in the presence
of increasing amounts of butanol. At first the culture
withstood only 8 gl- 1 butanol; after 21 days in the
presence of 6 gl- 1 butanol it withstood up to 10 gl- 1
butanol. After 200 days the bacteria were able to withstand
25 gl- 1 of butanol. Jerusalemskii (1958) found that this
resistance was transferred through the spores to further
generations. It is likely that during continuous cultivation
a certain selection took place and that mutant strain(s)
tolerating a high butanol concentration outgrew the wild type
strain.
Continuous cultivation of C.acetobutyZicumisapossible means
whereby the butanol toxicity can be overcome by employing
high dilution rates. A continuous ABE fermentation was
patented as long ago as 1932 (Wheeler and Goodale, 1932).
It was known that high solvent yielding strains of
c.acetobutyZicum were unstable and lost their ability to
produce large quantities of solvent when repeatedly
transferred at 24 h intervals. Consequently continuous
cultivation of these strains did not seem possible. This
was achieved in 1958 and Finn and Nowrey (1959) demonstrated
that a strain of CZostridium saccharoacetobutyZicum showed
less tendency to degenerate when held in exponential growth
76
in continuous propagation than when serially transferred
at 24 h intervals. Dyr et al. (1958), working in Prague,
have been able to show that strains of C.acetobutylicum
can be induced to retain.. their characteristics throughout
repeated vegetative transfer. The Czech workers have
successfully carried out continuous ABE fermentations on a
laboratory scale, using both one-stage and multi-stage
systems. The toxicity of butanol to C.acetobutylicum has
been overcome in this continuous process by employing high
dilution rates, so that the toxic end products in the
culture medium are kept as low as possible. If the increased
productivity from a given fermentation volume and the
increased ratio of butanol to acetone claimed in the literature
(Dyr et al. 1958) using continuous cultivation of
C.acetobutyliaum can be verified, it would show a significant
improvement in the economics of the fermentation process.
The in situ removal of butanol from the medium using
activated charcoal and/or corn oil can increase the final
butanol concentration to 25.8 gl- 1 (Hongo and Nagata, 1958)
and 19.0 gl- 1 (Leung, 1980).
C.aaetobutylicum P262 produces an autolysin(s) in the
industrial fermentation (Barber~ et al., 1979). The autolysin
was similar to a bacteriocin (Webster, et al., 1981), and the
similarity between bacteriocins and lytic agents has been
described by Tagg et al. (1976). Autolysins are defined
as enzymes that are capable of hydrolysing the cell walls
of the producer strain and in particular the peptidoglycan

77
layer. Bacterial cell walls may contain between 5 and 90%
peptidoglycan, and the rest is made up of proteins,
lipoproteins, polysaccharides, lipopolysaccharides and
polyolphosphate polymers such_as teichoic acid (Stolp and
Sta~r, 1965; Ghuysen, 1968; Ro~ers, 1979). The peotido
glycan layer of the cell wall provides the rigidity, shape
and osmotic stability for the cell. When autolysins are
permitted to act, cells lose their osmotic protection
and autolyse. Although there are exceptions, autolysins are
generally over-produced whenever the metabolism of .the cell
is disturbed drastically. Sudden removal of oxygen from
aerated exponential phase cultures of Bacillus subtilis
causes lysis (Kaufman and Bower, 1958). Autolysins may also
be induced by a sharp decrease in temperature of aerated
growing bacteria, or by exposure of psychrophilic bacteria
to temperatures above optimum. In some bacterial species,
autolysinsmay be induced by the addition of univalent
cations to bacterial c~ltures (Ogata and Hongo, 1973 and 1974;
Hebeler and Young, 1976) and autolysis can be demonstrated
by resuspending cells in buffers such as sodium acetate and
phosphate buffer (Higgins et al., j970; -Kawata and Takuni,
1971; Coyette and Shockman, 1973).
C.aaetobutyliaum P262 has been shown to produce cell bound
autolytic activity (Allcock, 1981 ) and cell free autolytic
activity (Webster et al., 1981). The autolytic activity
of C.aaetobutyliaum P262 has been studied mainly in CBM
and the factory fermentation medium, MFM. The pattern of
autolytic activity differs in these two systems. It was
shown by Webster et al., (1981) that high titres of cell free
78
autolysin (4156 arbitrary units (AU)) were produced by
C.acetobutylioum in MFM. In contrast low titres (<SAU)
of autolysin were obtained in CBM (Webster et al., 1981).
Cell free autolytic activity (256AU) could be induced in
CBM by .5% (v/v) molasses medium or 15% sucrose (Webster,
1980).
The autolysis of C.acetobutylioum P262 (grown in CBM)
in sodium phosphate buffer is similar to that in
Streptococcus faecalis (Pooley and Shockman, 1970) and
Lactobacillus acidophilus (Coyette and Ghuysen, 1970)
in that the ability of the cells to autolyse decreases
sharply when the cultures enter the stationary growth phase
(Allcock, 1981 ). The autolysis of C.aoetobutylicum P262
in sodium phosphate buffer was the method used to assay
cell bound autolytic activity (Allcock, 1981 ). Cell free
autolysin activity could be detected in the sodium phosphate
autolysate of C.acetobutylicum P262. In MFM, the release
of cell free autolysin was associated with the onset of the
stationary growth phase (Webster, 1980).
In common with a number of bacteria (Ghuysen and Shockman,
1973; Rogers, 1979; Rogers et al., 1980) the C.aoetobutylicum
strain produces latent and active forms of autolysin.
Proteases are able to activate the enzyme(s). !so-electric
focussing and PAGE of cell free and cell bound autolysates
of C.acetobutylioum P262 cultures have indicated the
presence of two autolytic enzymes of different iso-electric

79
points (Allcock, 1981). These proteins band closely
together on gel electrophoresis at a position corresponding
to a molecular weight of 28 000.
The production and release of an extracellular autolysin
by C.aoetobutylioum in molasses medium has important
implications for the industrial production of solvents.
High titres of autolysin were always obtained at the end
of exponential growth when solvent levels were maximal
(Barber et al., 1979). It has been suggested that the
inhibition of autolytic activity at the stage when solvent
production is maximal may result in increased solvent
yields. The isolation and characterisation of autolytic
de£icient mutants (Zyt) is important in order to establish
the function(s) of the autolysin, and to determine the
correlation between autolysin activity, solvent production
and sporulation.
80
4.2 MATERIALS AND METHODS
4.2.1. Bacterial strains. As described in 2.2.1.
4.2.3. General methods.
The fermentation methods, heat shocking and inoculation
procedures outlined in Chapter II were used unless stated
otherwise.
4.2.4. Growth measurements.
Turbidometric readings and total bacterial counts described
in 3.2.4. and the clostridial form count described in 3.2.5.
were utilised.
4.2.5. Physical measurements.
Titratable acid, pH and solvent analysis were carried out
as described in 2.2.6.
4.2.6. Cell free autolysin assay.
The cell free autolysin was assayed by the well method
described in 3.2.8.
4.2.7. Cellular autolysis activity.
Mid-exponential phase cells (5 to 10 ml) were cooled on ice,
harvested by membrane filtration, washed twice with 10 ml
cold double distilled deionized water and resuspended in

81
4 to 6 ml of 0.64 M sodium phosphate buffer, pH 6.3.
Cellular autolysis at 37°C was monitored turbidometrically.
One unit of cellular autolysis is defined as the loss of
0.001 OD units h- 1• In order to compare the autolysis of
different samples, results are expressed in units of
autolysin per 0.1 optical density of cell suspension. One
unit is then equivalent to a loss of 1% of the initial
turbidity h- 1 •
4.2.8. Amylase activity
The reagents used are listed in Appendix B. Samples were
centrifuged at 10 000 rpm at 4 °C and 1 ml samples of the
su:pematants were added to 10 ml of 1% soluble starch solution at 55°C.
'Ihe sarrples were shaken and the enzyme reaction stopped by placing 1 ml
of the reaction mixture into 10 ml N/10-HCl. One ml of this solution was
• mixed with 10 ml of iodine solution and allowed to stand
for 2 min before the OD was determined at 660 nm. The units
of amylase activity was determined from the following
equation:
a - amylase activity = D - D1 x 100 x n D 10
Where D = optical density obtained without enzyme
D1 = optical density obtained for the sample.
n = dilution.
One a - amylase unit was defined as that activity which
causes a 1% drop in ODGGo of a 1% soluble starch solution
held at 55°C for 1 min.
82
4.2.9. Isolation of Autolytic-deficient mutants
Mutants deficient in autolytic activity were isolated
from exponential-phase CBM cultures (5 x 10 7 cells ml- 1 )
of C.aaetobutyliaum P262 treated with ethyl methane
suifonate (EMS) (2.5% v/v) for 20 min at 37°C to obtain
10% survival. The washed cells were resuspended in the
minimal salt medium and incubated for 18 h before
diluting and plating onto CBM plates overlayed with 5 ml
CBM containing autoclaved exponential phase
C.aaetobutyliaum P262 cells. The plates were incubated
at 37°C for 18 h. Colonies which produced small or no
zones of lysis in the overlay were selected and tested
for cellular autolytic activity.
4.2.10. Effect of Sugar concentration
The sugar tolerance of C.aaetobutyliaum P262 and the lyt1
mutant was determined by monitoring bacterial growth (OD)
in CBM containing different concentrations of glucose
and sucrose.
The effect of adding sucrose, glucose or starch to MFM
(TIS 6.5%) on solvent production by C.aaetobutyliaum P262
and the lyt1 mutant strain were compared. The effect of
increasing the initial TIS on solvent production by
C.aaetobutyliaum P262 and the lyt1 mutant w~s also
investigated. The percentage TIS was determined by N.C.P.
using the modified Lane and Eynon method (Mann and Saunders,
1967). The percentage conversion of TIS to solvents was
83
used as a measure of the efficiency of the fermentation.
Percentage conversion was calculated as follows:
% Conversion = Solvent yield % (w/v) X 100
TIS % (w/v) 1
4.2.11. Effect of solvents on growth, cellular autolysis and
clostridial degeneration
4.2.11.1. Effect on growth
Oxygen free solutions of butanol and acetone were prepared
by placing the prewarmed solvents (60°C) under stringent
anaerobic conditions in the anaerobic glove box for 48 h.
The effect of acetone and butanol on growth of C.acetobutylicum
P262 and the lyt1 strain were compared. Hungate tubes
containing 8 ml of CBM broth at 1.25 times its normal
concentration and pre-equilibrated at 34°C was inoculated
with 1 ml of an exponential phase CBM culture. The cultures
were incubated for 0.5 to 1.0 h before being challenged with
oxygen free acetone or butanol. The volume was made up to
10 ml with oxygen free distilled water. Oxygen free
distilled water (1 ml) was used with control cultures.
The OD 600 was measured as a function of time.
4.2.11.2. Effect on cellular autolysis
Samples were prepared as in 4.2.7. The cells were
resuspended in 0.04 M sodium phosphate buffer, pH 6.3
containing varying concentrations of acetone and butanol.
Cellular autolysis was monitored turbidometrically as in
4.2.7.
84
4.2.11.3. Effect on clostridial degeneration.
Different volumes of oxygen free butanol were added to
400 ml MFM cultures of C.acetobutylicum P262 and the lyt1
mutant at 28-36 h. Samples were assayed for clostridial
forms (3.2.5) and for total solvents before and after the
addition of butanol.
85
4.3 RESULTS
4.3.1~ The isolation and characterisation of autolytic-deficient
mutants
Autolytic-def ici·ent mutants, which did not produce or
produced decreased halos of lysis on C.acetobutylicum P262
indicator plates,were isolated after EMS treatment of
C.acetobutylicum P262. Cellular autolysis of the autolytic
mutants (Zyt) was reduced and the mutants Zyt1 and Zyt8
showed the least autolytic activity (Table 4.1). The
growth rates of all the autolytic mutants were similar to
that of C.acetobutyZicum P262 in CBM. The morphology of the I
mutants was altered 'and in CBM the vegetative cells formed
long chains. This effect was most pronounced in the Zyt1
and Zyt8 mutants. All the Zyt mutants were motile. The
Zyt1 and Zyt2 mutants produced clostridial forms in MFM
similar in shape and size to the clostridial forms produced
by C.acetobutyZicum P262. Clostrldial forms produced by
the Zyt8 mutant in MFM were 2 to 3 times the length of the
C.acetobutyZicum P262 clostridial forms. The Zyt9 and Zyt10
·mutants produced a mixture of long and short clostridial
forms. The clostridial forms produced by the Zyt4 and Zyt5
mutants were not well formed and were phase grey.
The amount of solvent produced in MFM by the different
autolytic mutants was compared (Table 4.2). The mutants
Zyt1 and Zyt10 produced the highest solvent levels. After
48 h fermentation the Zyt1 mutant produced 18.351 gl- 1 and
the Zyt10 mutant produced 19.752 gL- 1• When the
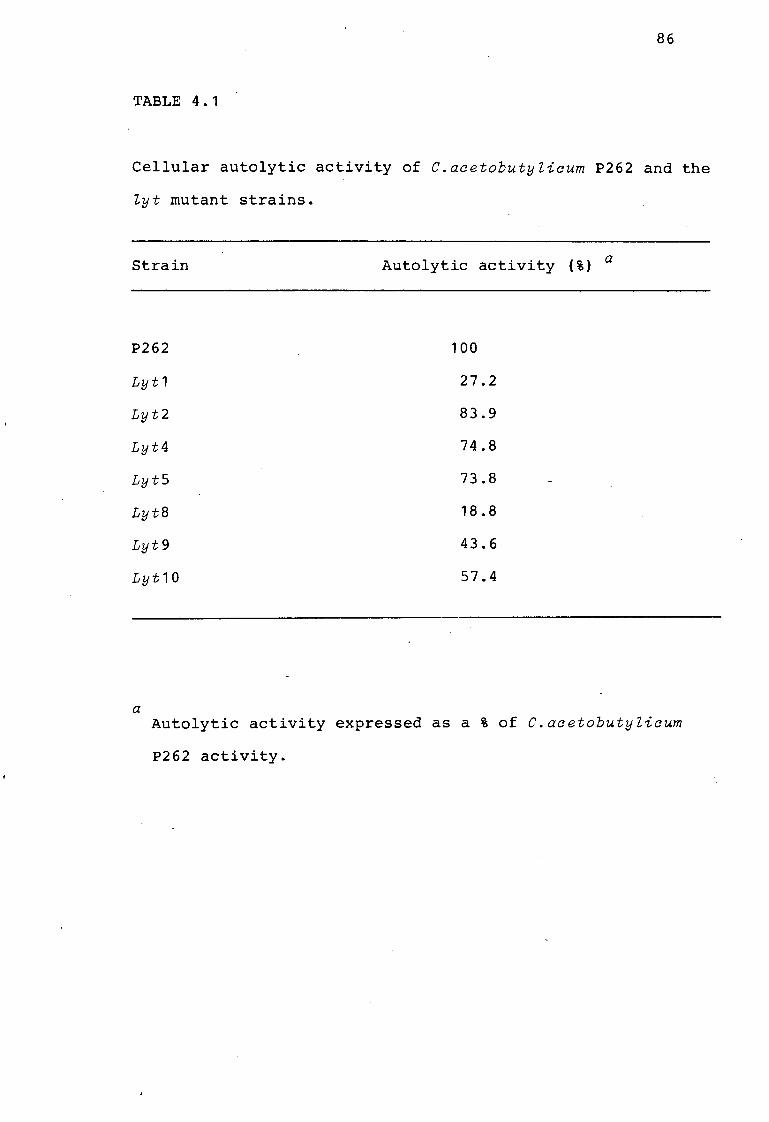
86
TABLE 4.1
Cellular autolytic activity of C.acetobutylicum P262 and the
lyt mutant strains.
Strain Autolytic activity (%) a
P262 100
Lyt1 27.2
Lyt2 83.9
Lyt4 74.8
Lyt5 73.8
Lyt8 18.8
Lyt9 43.6
Lyt10 57.4
a Autolytic activity expressed as a % of C.acetobutylicum
P262 activity.
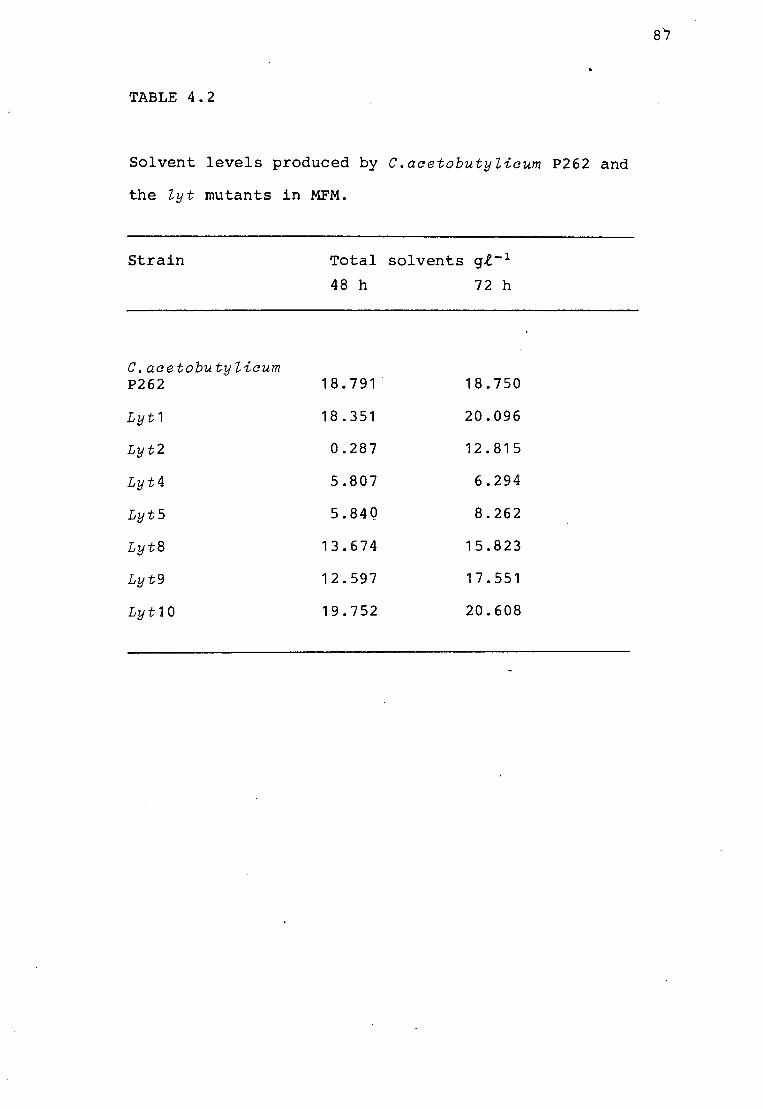
TABLE 4.2
Solvent levels produced by C.acetobutylicum P262 and
the lyt mutants in MFM.
Strain
C.acetobutylicum P262
Lyt1
Lyt2
Lyt4
Lyt5
Lyt8
Lyt9
Lyt10
Total solvents gl- 1
48 h 72 h
18.791 18.750
18.351 20.096
0.287 12.815
5.807 6.294
5.84Q 8.262
13.674 15.823
12.597 17.551
19.752 20.608
87
88
fermentations were continued for 72 h both the Zyt1 and
Zyt10 mutants produced a 20 gt- 1 of solvents. The Zyt2,
Zyt4, Zyt5 and Zyt8 mutants produced solvent levels lower
than that produced by C.aaetobutylicum P262. The Zyt1
mutant was chosen for further analysis.
4.3.2. Amylase production by C.acetobutylicum P262 and the Zyt1
strain
The levels of amylase produced by C.acetobutylicum P262 and
the Zyt1 mutant were compared in MFM supplemented with 2%
(w/v) starch. C.acetobutylicum P262 produced 48.6 units of
amylase act.ivity compared with 73.7 units of amylase
activity produced by the Zyt1 mutant over 48 h.
4.3.3. Autolytic activity of C.acetobutylicum P262 and the Zyt1
strain
The cell free autolysin produced in MFM by C.acetobutylicum
P262 under stringent anaerobic conditions varied between 64
and 2048 AU in 48 h fermentations. The Zyt1 mutant
produced cell free autolysin levels of < 8 AU over 48 h.
The effect of sucrose induction on the production of cell
free autolysin by C.acetobutylicum and the Zyt1 mutant in
CBM was compared (Table 4.3). C.acetobutylicum P262 showed
an increase in the cell free autolytic activity as the
concentration of sucrose was increased. No cell free
autblysin was detected for the Zyt1 mutant. The addition
of sucrose, up' to 3% (w/v), did not increase the autolysin
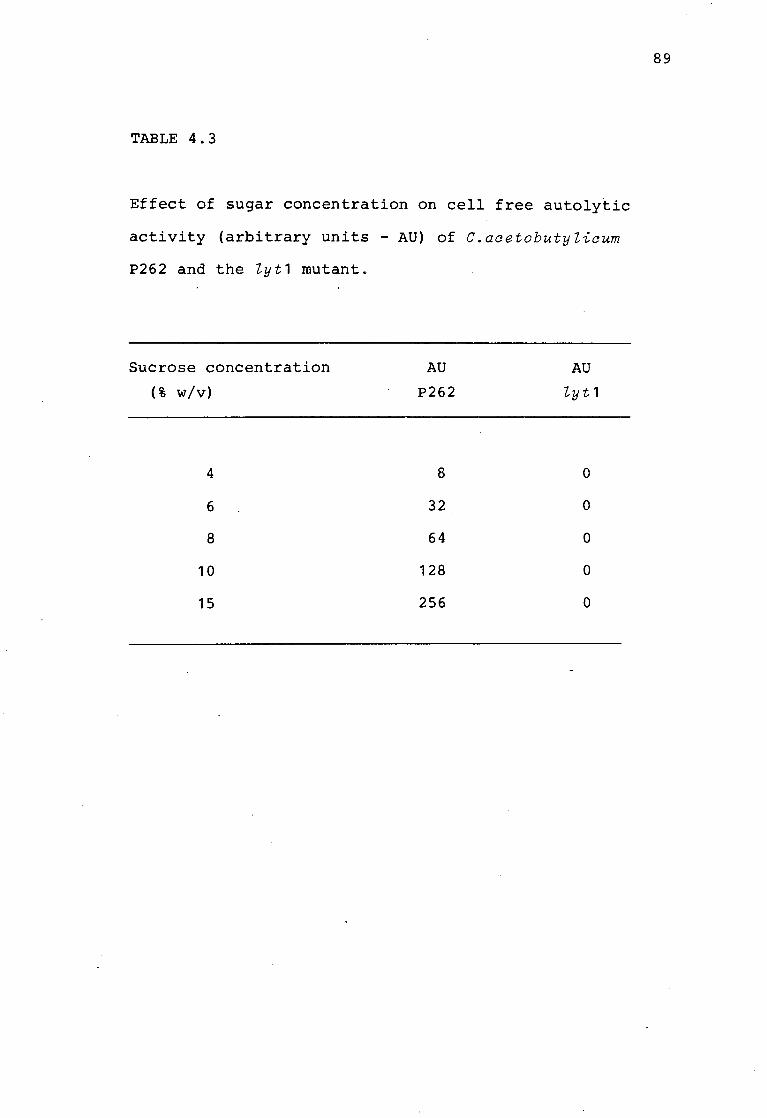
TABLE 4.3
Effect of sugar concentration on cell free autolytic
activity (arbitrary units - AU) of C.aaetobutyliaum
P262 and the Zyt1 mutant.
Sucrose concentration
(% w/v)
4
6
8
10
15
AU
P262
8
32
64
128
256
AU
Zyt 1
0
0
0
0
0
89
titres produced by C.acetobutylicum P262 or the Zyt1
mutant in MFM.
90
Cellular autolysis of the Zyt1 mutant strain was markedly
reduced when compared with C.acetobutylicum P262.
Exponential phase Zyt1 cells showed between 46 and 80 units
of autolytic activity compared with 118 to 256 units of
autolytic activity shown by C.acetobutylicum P262.
4.3.4. Cell degeneration of C.acetobutylicum P262 and the Zyt1
strain.
The autolysis of exponential phase and stationary phase
cells (clostridial forms) of C.acetobutylicum P262 and the
Zyt1 strain in sodium phosphate buffer were compared
(Fig. 4.1). A marked decrease in optical density was
detected when exponential phase cells of C.acetobutylicum
P262 were resuspended in the sodium phosphate buffer. The
autolysates of mid-exponential cells of the C.acetobutylicum
P262 strain and the Zyt1 mutant strain obtained after 60 min
in the sodium phosphate buffer were assayed for cell free
autolysin by the well plate technique. The autolysate from
C.acetobutylicum P262 had a titre of 512 AU. No zones of
inhibition were produced by the Zyt1 mutant autolysate.
Stationary phase cells showed a small decrease in optical
density, 0.2 OD units in 1 h for the C.acetobutylicum P262
strain and 0.1 OD units in 1 h for the Zyt1 strain.
The total number of bacteria and the proportion of phase
bright clostridial forms produced by C.acetobutylicum P226 and
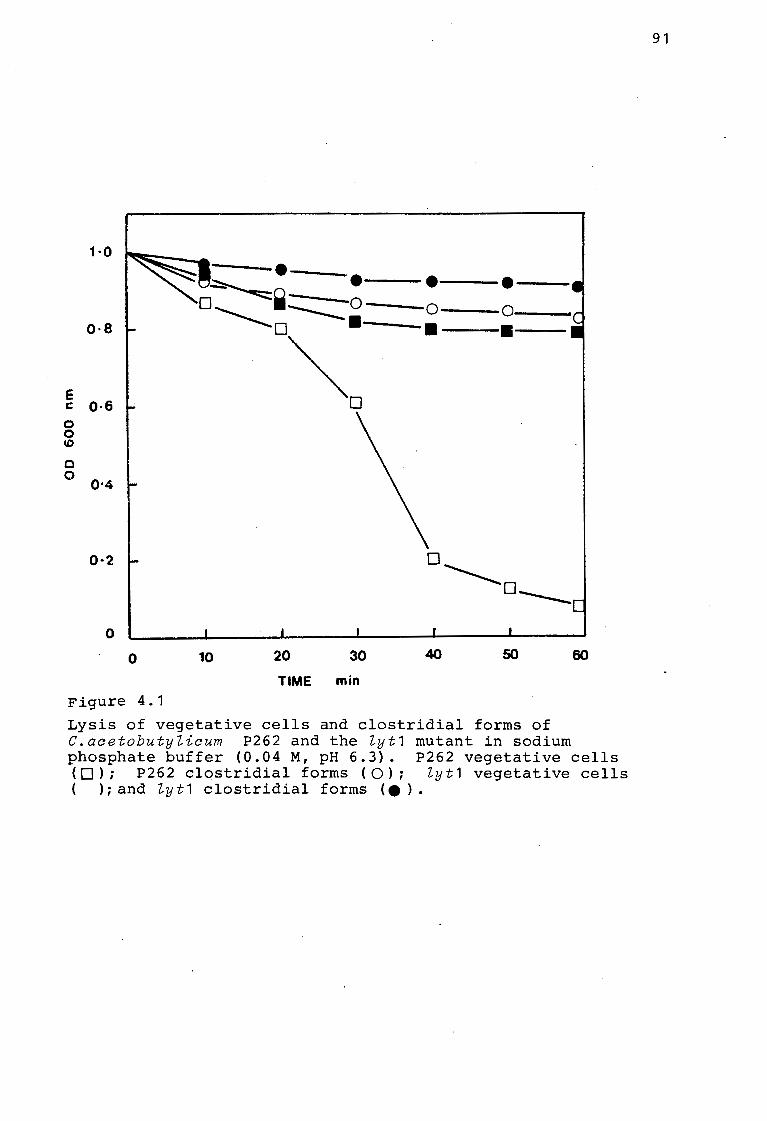
1 ·0
0·8
E c 0·6 0 0 co
0 0
0·4
0·2
0
0
Figure 4.1
• ~- . D~------::o
0 •
~D
10 20 30
TIME min
• • 0 0
• •
o~ 0----40 50 60
Lysis of vegetative cells and clostridial forms of C.aaetobutyliaum P262 and the lyt1 mutant in sodium phosphate buffer (0.04 M, pH 6.3). P262 vegetative cells ( O); P262 clostridial forms ( O); lyt1 vegetative cells ( ); and lyt1 clostridial forms (e).
91
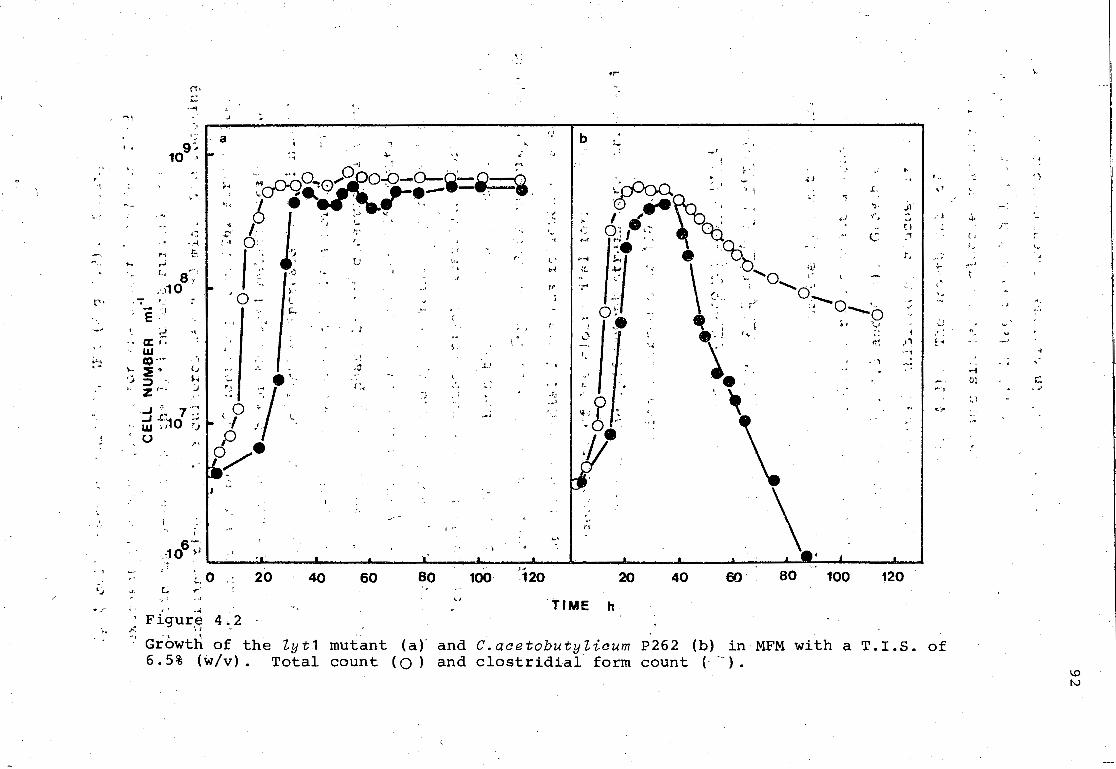
. -~
....
(''
. . ~.1-\ .~
',i
•·.r
-, ...
·~
~'
CT• ;;. .....
' -.· ~ ' g:.
10
.. ,
I'
·'
... .l./ a
--i .... .., '
. ~v~ ~..: . J>-•-•-•-=---1 .•
~~ ·;,,.__r;;-,o ... ~0,.000-0-o-~~orl:: ··· l • .. .
0 1 .. :-· " '• . : ~ • I t ~ ,_, , ,.. .... ~ . . ~ :~ {-• O~ ( ~ ·--. -I
r---i E . 'j •. ~ J ~
I .. : ~ u 'h l' j.,.i ':'"l
!:, 8 .. ~ .. , .•.. . " .•· • ..-i -· * ' "' . ., - .J
,J J.· . . ·.110 ' . -
- I
: 0-· I_ -·• II'
E· j;..
~ a:,. UJ ,
·- ~-=- (~ ~ =· / .-.• '·-1:;; :::> : ~ ;; ·:1· '· z .-. .' - ., . . _, ' 7 ·:: (_ 0 ;. ,_
_, J:~10 ;-: l .' .. , UJ ,, . ., p ' 0 ,.. •
.. uo/
..,.,..,, ,. ....
I
:106-;) ~ ,.
!.~ :...o .,.·
20 40
.. I
,. ·- 1 ' .• I
' .\1 .i .. t ' ' .. ... ~< .,
. , ·•.: ~··· -·
f ""
. \
,,,, 60 80 100 120
.....
b __,
. . '
' ' t· ~
-~j
~~~_--: 'l
I , \ 'i)().( . o;,•,:- • -Yet. '· •• ; '. \ . i "'
-;
<f~~
,L
~
't; ..
c
..
.Jl
•' ti _ ....
L
·"
·-· I ;_:_. .y-- • ·_. - t> ..... _ :=_ - • ....... ...., ' . ~ . ._ o, ·' -" ~ . : ' ' o-.. ' . ·. ' ' . ? " o--o ·r . , . , . " ':
Q; .. ; . I ;;
.~~ -1-~ i ·~·:_! '" . . .. ,
.. '-'
I
'" -~ '\!
~
..) \~ -· . -. . .. . ' - '' .. . ' .. '~ - . ' ti•:, \ . ~
20 40 so· 80 100 120
··' ; . ' ·"" TIME h ' Figure 4. 2
A ',,,
I ,,
J
·-,, "' .:._; . !'.~
~-,
11f;.:,•
... ' - ·' - ~ Growth of the Zyt1 mutant (a)' and C.aoetobutyliaum P262 (b) in MFM with a T.I.S. of 6. 5% (w/v) • Total count ( O ) and clostridial form count (- ~-) .
. \.
* (
'. , ..
n
..... o: :.,!
..
;~··
. ;
'"
t)
-
'-
" c: .. ~
l.O N
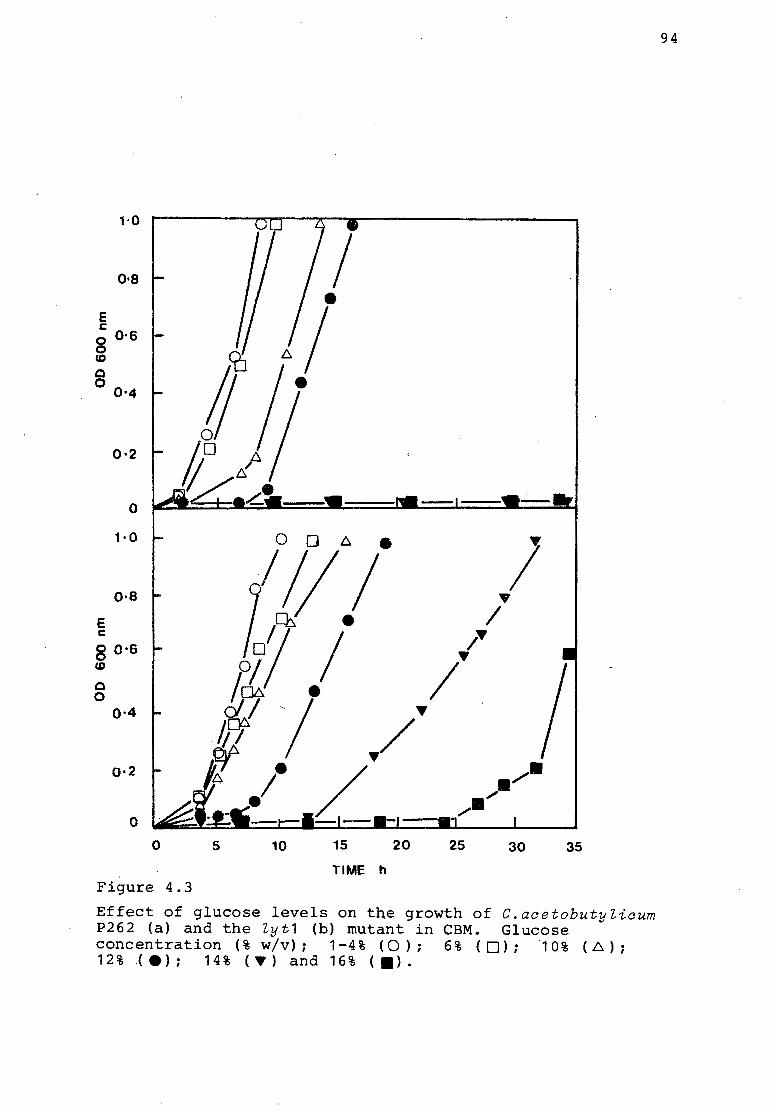
1·0
0·8 I • E c
0·6 8 CD
8 0·4
I 0·2
0
1 ·0 0 0 D. • l 0·8 v
E I c
ti! I /" 8 O·G 'Y CD
I c 0
0·4 61/ j 'Y
.~o/ / ~ 'Y ......... 0·2
/,A .l / ..... • ....... 0
0 5 10 15 20 25 30 35
TIME h Figure 4.3
Effect of glucose levels on the growth of C.acetobutylicum P262 (a) and the lyt1 (b) mutant in CBM. Glucose concentration(% w/v); 1-4% (0); 6% (0); 10% (D.); 1 2 % .( e ) ; 1 4 % ( 'Y ) and 16 % ( •) •
94
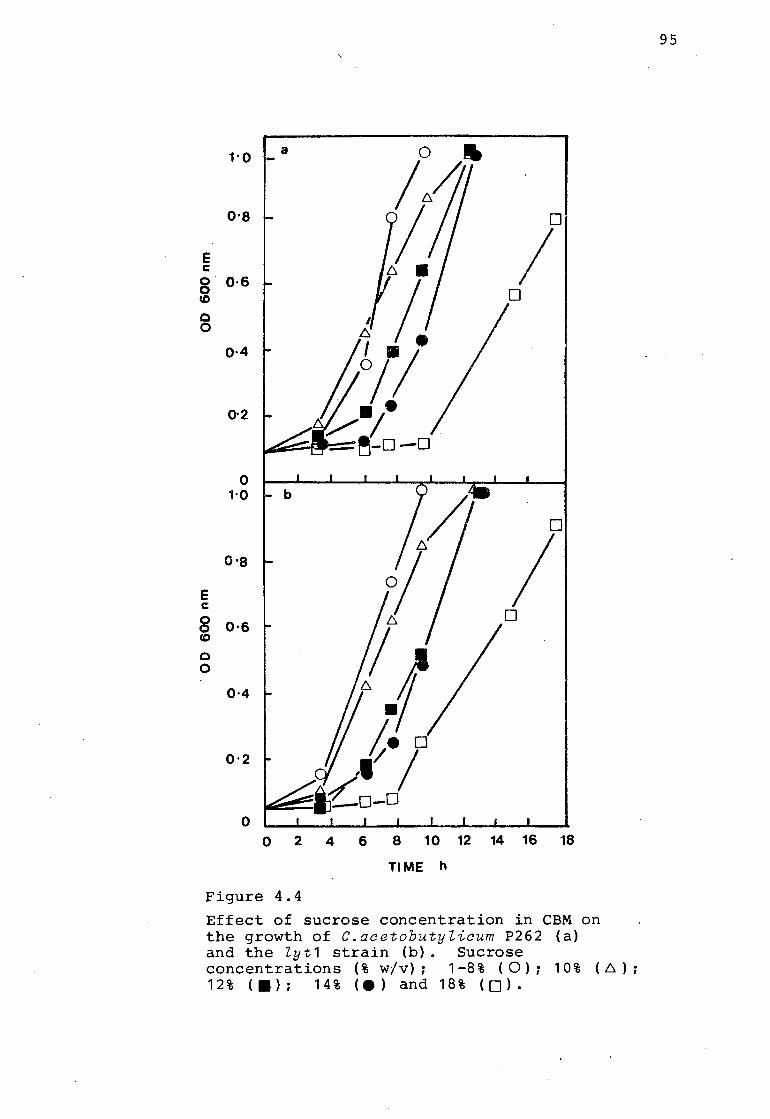
E c
0 0 CD
c 0
E c
8 CD
c 0
a 1·0 -
0·8
0·6
0·4
0·2
0 1·0 b
O·a
0·6
0·4
0·2
0
D
I D
0
I D
0 2 4 6 8 10 12 14 16 18
TIME h
Figure 4.4
Effect of sucrose concentration in CBM on the growth of C.acetobutyZicum P262 (a) and the Zyt1 strain (b) . Sucrose concentrations (% w/v); 1-8% ( 0); 10% ( 6.); 12 % ( • ) ; 1 4 % ( e ) and 18 % ( D ) .
95
96
12% respectively. The lyt1 mutant grew in CMB containing
16% glucose. The rate of growth of the Zyt1 mutant
decreased at glucose concentrations greater than 10%.
Associated with the decrease in growth rate was a lag in
growth varying from 7.5 h at 12% glucose to 27 h at 16%
glucose. The C.acetobutylicum P262 strain and the Zyt1
mutant strain grew in sucrose concentrations up to 18% (w/v)
(Fig. 4. 4) •
The production of solvents, titratable acids and the pH
were compared in MFM (6.5% TIS) (Fig. 4.5). The production
of titratable acids and the pH profile of the Zyt1 mutant
were similar to the C.acetobutylicum P262 strain. The peak
in titratable acid and the pH break point occurred between
15-18 h. The break in pH coincided with the onset of
solvent production in C.acetobutylicum P262 and the Zyt1
mutant. The solvent levels in the C.acetobutylicum P262
culture increased from c 15 to 36 h before plateauing at a
solvent level of 18 g£~ 1 • In the Zyt1 mutant strain the
solvent level increased rapidly from 15-40 h after which
the rate of solvent production decreased and plateaued.
The solvent concentration at 60 h was c 20 gl- 1•
The effect of ~ncreasing the TIS concentration in the MFM
on solvent production by C.acetobutylicum P262 and the Zyt1
mutant was compared after 48 h and 72 h (Fig. 4.6). There
was an increase in the solvent yields at 7.5% TIS from
17.105 to 17.784 gl- 1 and 18.289 to 19.044 gl- 1 for
C.acetobutylicum P262 and the Zyt1 mutant respectively.
Increasing the TIS to 8.5 and 9.5% decreased the amount of
'\
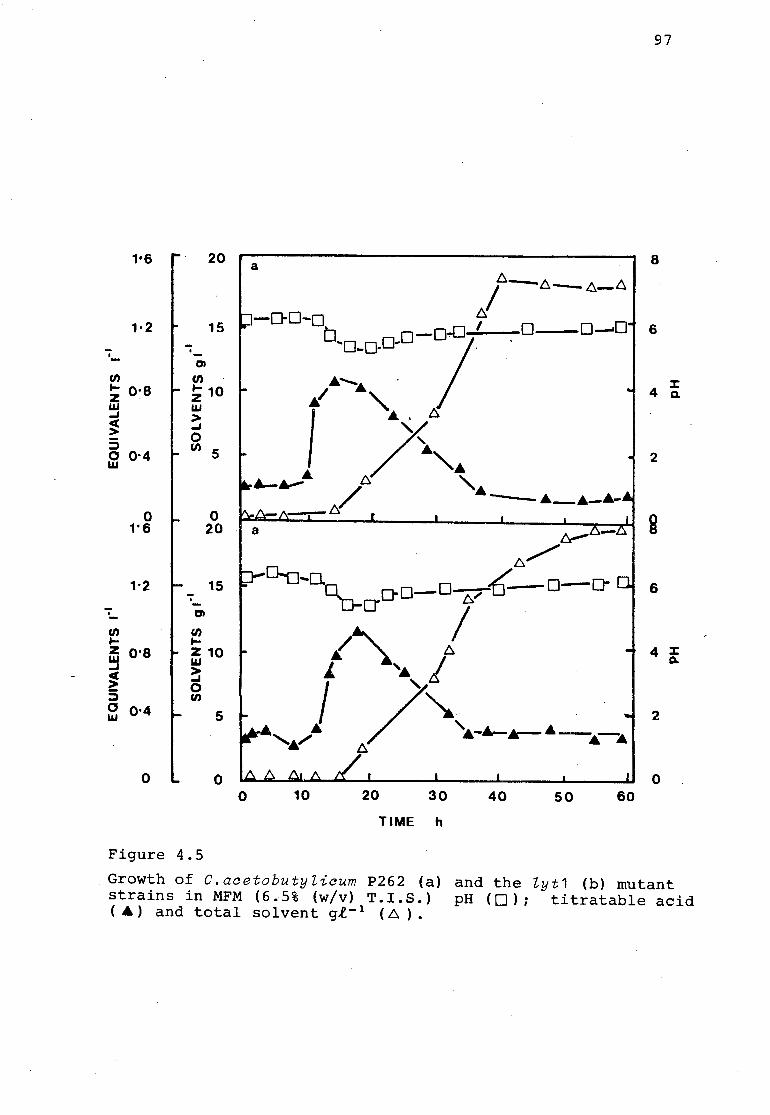
1·2
·-(/)
; o·e w -' ~ ::::> 0 0•4 w
(/) ...
0 1'6
z o·a ~ ~ ::::> 0 0•4 w
0
20
15
·-CJ)
(/)
~ 10 w > -' 0 Cl) 5
-OI
(/) ...
0 20
15
z 10 w ~ 0 Cl)
5
0
Figure 4.5
a
0 10 20 30 40 50
TIME h
60
97
8
6
2
6
4 l: c.
2
0
Growth of C.aaetobutylicum P262 (a) and the lyt1 (b) mutant strains in MFM (6.5% (w/v) T.I.S.) pH (0); titratable acid (A.) and total solvent g£- 1 ( .6. ) •
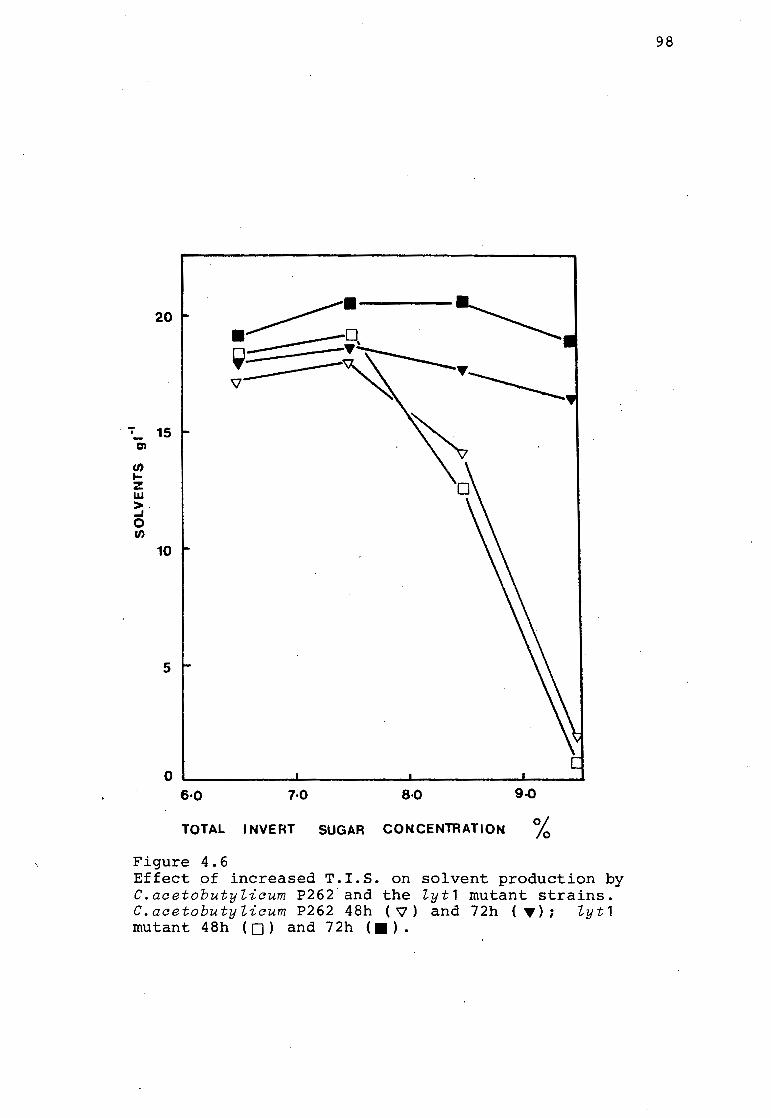
20
"';' 15 en
(/) 1-z w >. ~ 0 (/)
10
5
6·0 7·0 8·0 9-0
TOTAL INVERT SUGAR CONCENTRATION % Figure 4.6 Effect of increased T.I.S. on solvent production by C.acetobutylicum P262.and the lyt1 mutant strains. C.acetobutylicum P262 48h (\7) and 72h ( •); lyt1 mutant 48h ( D) and 72h ( •) •
98
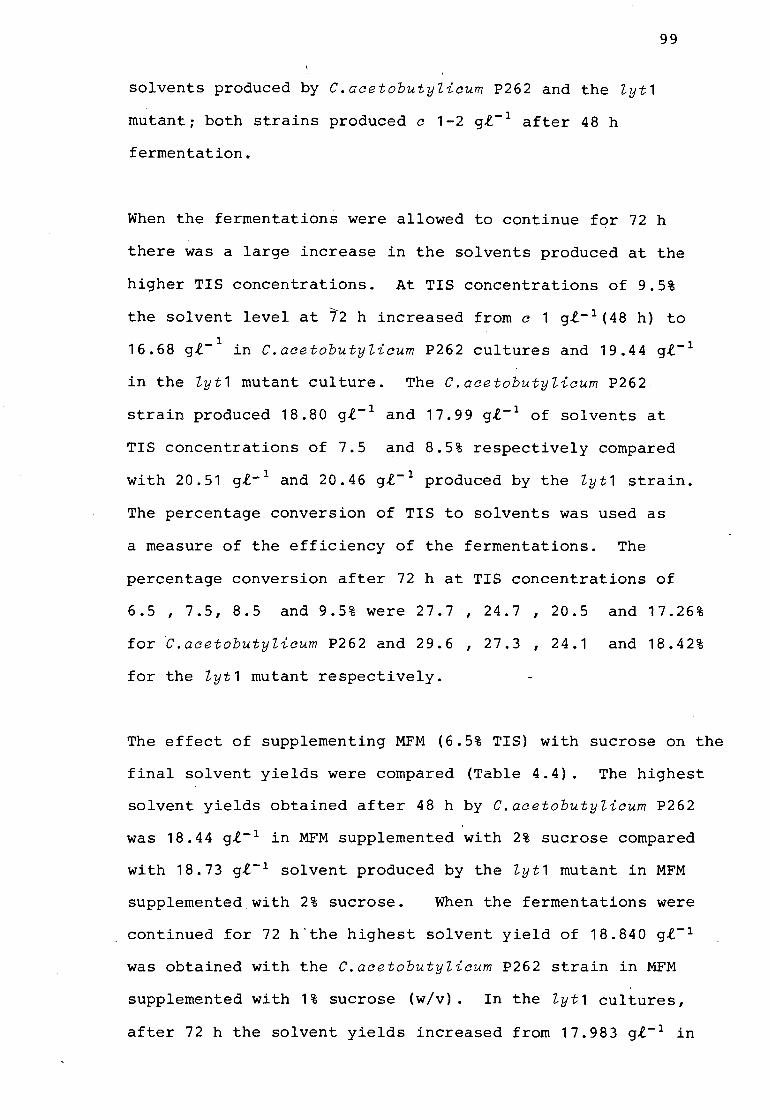
solvents produced by C.acetobutyZicum P262 and the Zyt1
mutant; both strains produced c 1-2 gl- 1 after 48 h
fermentation.
99
When the fermentations were allowed to continue for 72 h
there was a large increase in the solvents produced at the
higher TIS concentrations. At TIS concentrations of 9.5%
the solvent level at 72 h increased from c 1 gl- 1 (48 h) to
1 16.68 gl- in C.acetobutyZicum P262 cultures and 19.44 gl- 1
in the Zyt1 mutant culture. The C.acetobutyZicum P262
strain produced 18.80 gl- 1 and 17.99 gl- 1 of solvents at
TIS concentrations of 7.5 and 8.5% respectively compared
with 20.51 gl- 1 and 20.46 gl- 1 produced by the Zyt1 strain.
The percentage conversion of TIS to solvents was used as
a measure of the efficiency of the fermentations. The
percentage conversion after 72 h at TIS concentrations of
6.5 , 7.5, 8.5 and 9.5% were 27.7 , 24.7 , 20.5 and 17.26%
for C.acetobutyZicum P262 and 29.6 , 27.3 , 24.1 and 18.42%
for the Zyt1 mutant respectively.
The effect of supplementing MFM (6.5% TIS) with sucrose on the
final solvent yields were compared (Table 4.4). The highest
solvent yields obtained after 48 h by C.acetobutyZicum P262
was 18.44 gl- 1 in MFM supplemented with 2% sucrose compared
with 18.73 gl- 1 solvent produced by the Zyt1 mutant in MFM
supplemented.with 2% sucrose. When the fermentations were
continued for 72 h'the highest solvent yield of 18.840 gl- 1
was obtained with the C.acetobutyZicum P262 strain in MFM
supplemented with 1% sucrose (w/v). In the Zyt1 cultures,
after 72 h the solvent yields increased from 17.983 gl- 1 in
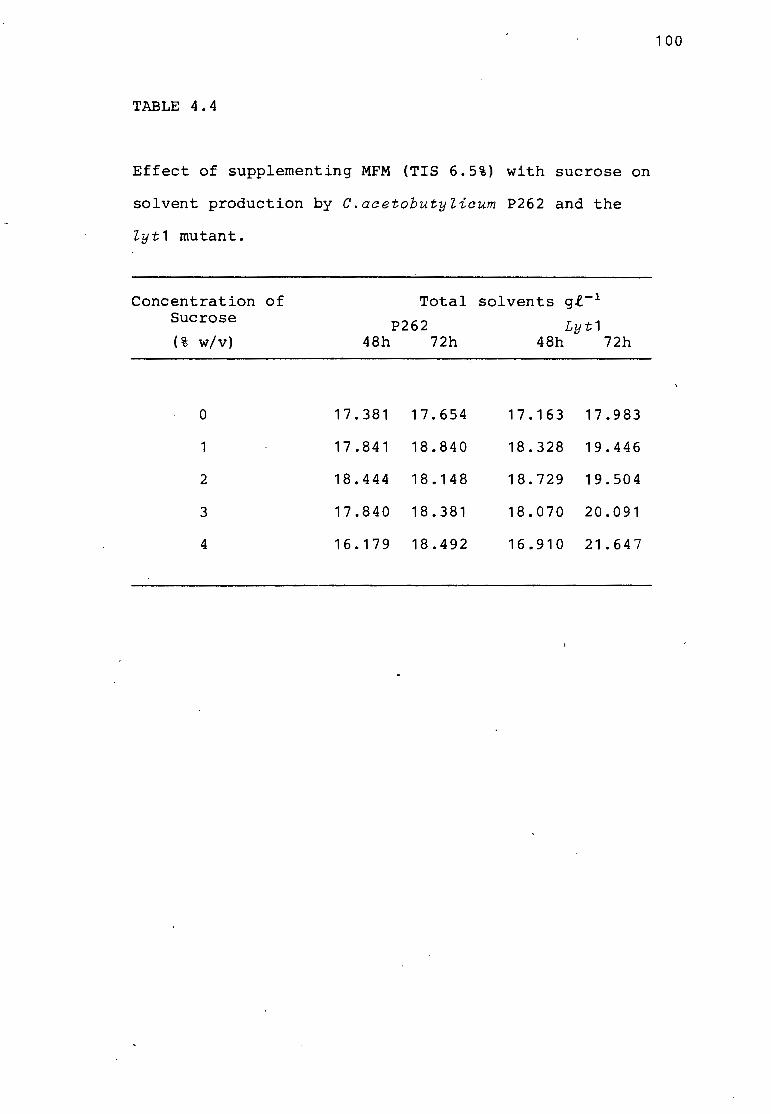
TABLE 4.4
Effect of supplementing MFM (TIS 6.5%) with sucrose on
solvent production by C.acetobutyZicum P262 and the
Z y t 1 mutant .
Concentration of Sucrose
( % w/v)
0
1
2
3
4
Total solvents gl- 1
P262 48h 72h
17.381 17.654
17.841 18.840
18.444 18.148
17.840 18.381
16.179 18.492
Lyt1 48h 72h
17.163 17.983
18.328 19.446
18.729 19.504
18.070 20.091
16.910 21.647
100
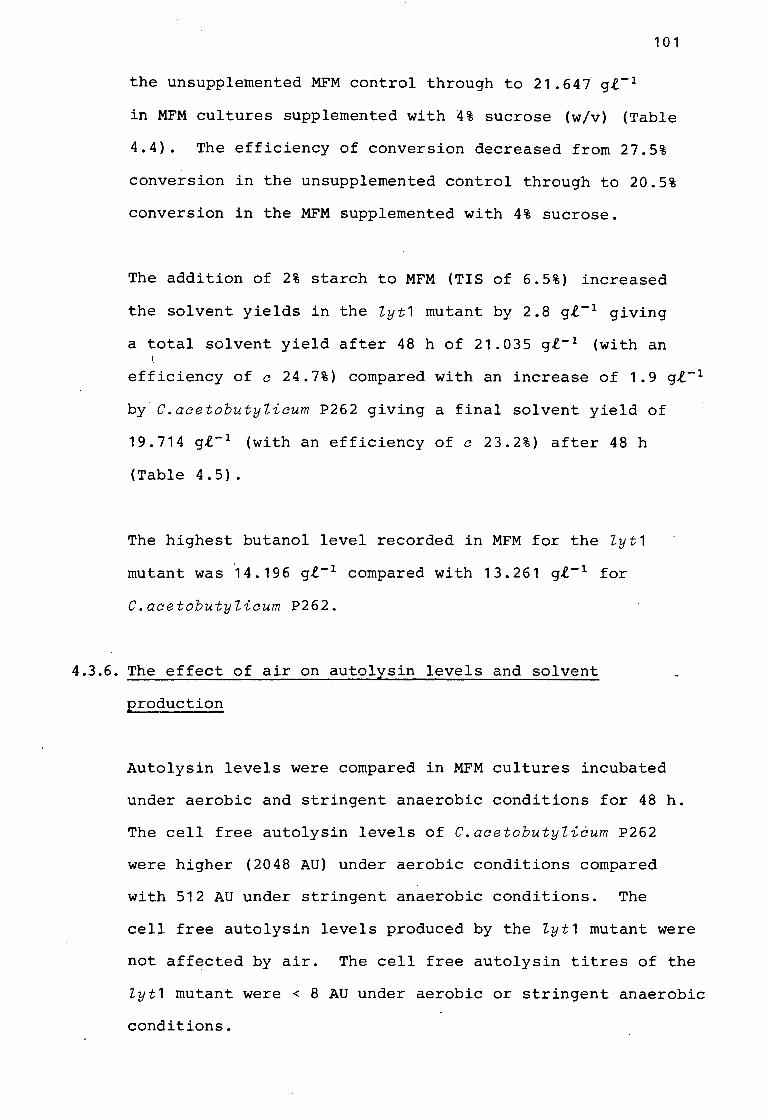
101
the unsupplemented MFM control through to 21.647. gl- 1
in MFM cultures supplemented with 4% sucrose (w/v) (Table
4.4). The efficiency of conversion decreased from 27.5%
conversion in the unsupplemented control through to 20.5%
conversion in the MFM supplemented with 4% sucrose.
The addition of 2% starch to MFM (TIS of 6.5%) increased
the solvent yields in the Zyt1 mutant by 2.8 gl- 1 giving
a total solvent yield after 48 h of 21.035 gl- 1 (with an ~
efficiency of c 24.7%) compared with an increase of 1.9 gl- 1
by C.acetobutylicum P262 giving a final solvent yield of
19.714 gl- 1 (with an efficiency of c 23.2%) after 48 h
(Tab 1 e 4 . 5 ) .
The highest butanol level recorded in MFM for the Zyt1
mutant was '14.196 gl- 1 compared with 13.261 gl- 1 for
C.acetobutylicum P262.
4.3.6. The effect of air on autolysin levels and solvent
production
Autolysin levels were compared in MFM cultures incubated
under aerobic and stringent anaerobic conditions for 48 h.
The cell free autolysin levels of C.acetobutylicum P262
were higher (2048 AU) under aerobic conditions compared
with 512 AU under stringent anaerobic conditions. The
cell free autolysin levels produced by the Zyt1 mutant were
not affected by air. The cell free autolysin titres of the
Zyt1 mutant were < 8 AU under aerobic or stringent anaerobic
conditions.
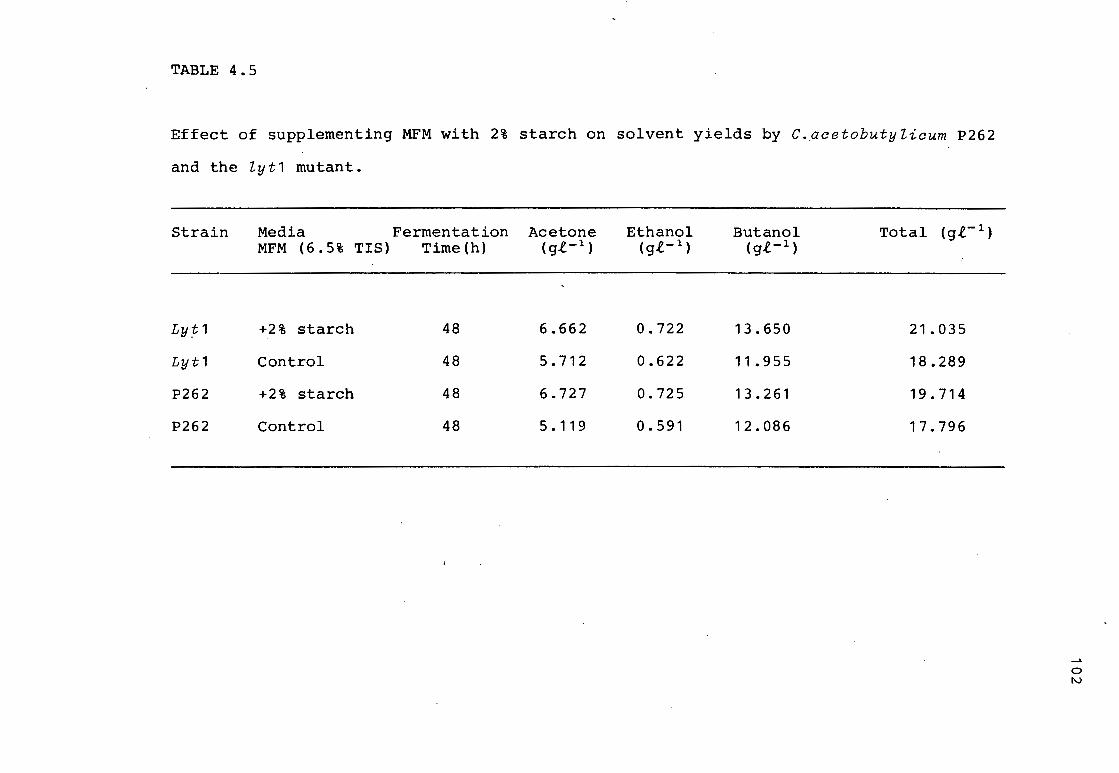
TABLE 4.5
Effect of supplementing MFM with 2% starch on solvent yields by C.acetobutylicum P262
and the lyt1 mutant.
Strain
Ly"j;1
Lyt1
P262
P262
Media Fermentation MFM (6.5% TIS) Time(h)
+2% starch 48
Control 48
+2% starch 48
Control 48
Acetone (g,t:-l)
6.662
5.712
6.727
5.119
Ethanol ( gl-l)
0.722
0.622
0.725
0.591
Butanol (gl-l)
13.650
11.955
13.261
12.086
21.035
18.289
19.714
17.796
0 IV
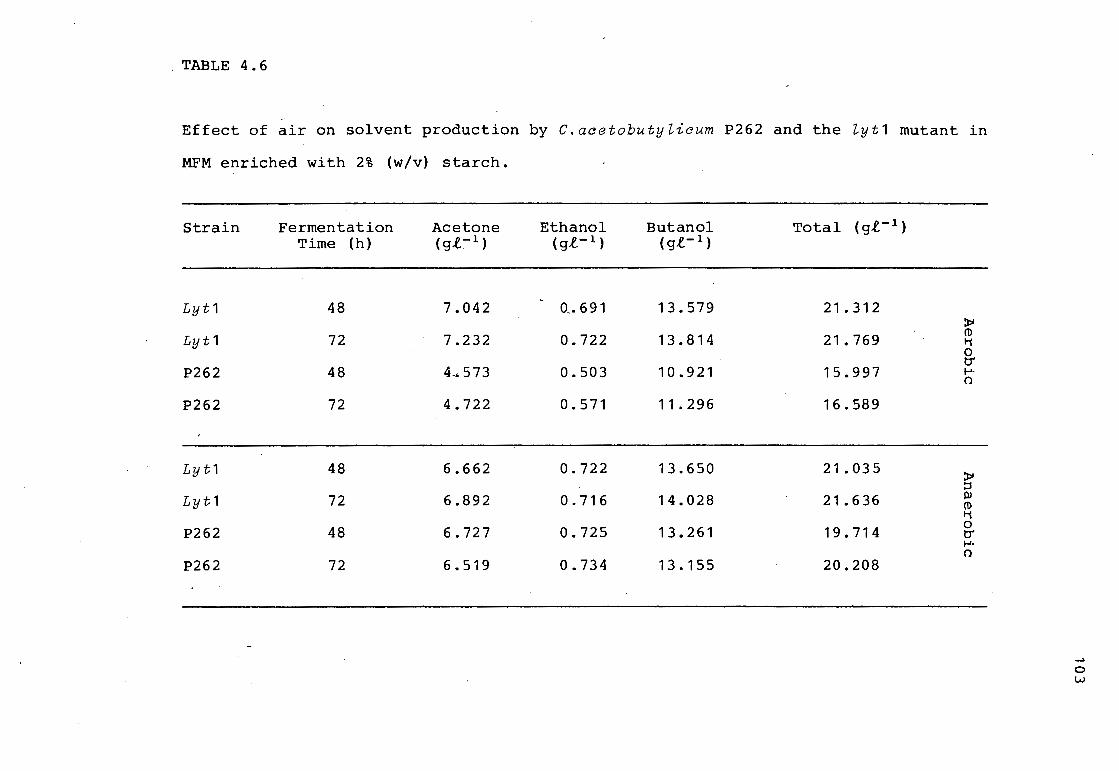
. TABLE 4. 6
Effect of air on solvent production by C.acetobutylicum P262 and the Zyt1 mutant in
MFM enriched with 2% (w/v) starch.
Strain
Lyt1
Lyt1
P262
P262
Lyt1
Lyt1
P262
P262
Fermentation Time (h)
48
72
48
72
48
72
48
72
Acetone (g.f.:-1)
7.042
7.232
4 .. 573
4.722
6.662
6.892
6.727
6.519
Ethanol (g.f.-1)
0,. 691
0.722
0.503
0.571
0.722
0.716
0.725
0.734
Butanol (g.f.-1)
13.579
13.814
10.921
11.296
13.650
14.028
13.261
13. 155
Total ( g.e.- 1 )
21.312
21.769
15.997
16.589
21.035
21.636
19.714
20.208
:i:oi CD Ii 0 tr I-'· ()
:i:oi ::s Ill CD Ii 0 tr I-'· ()
0 w
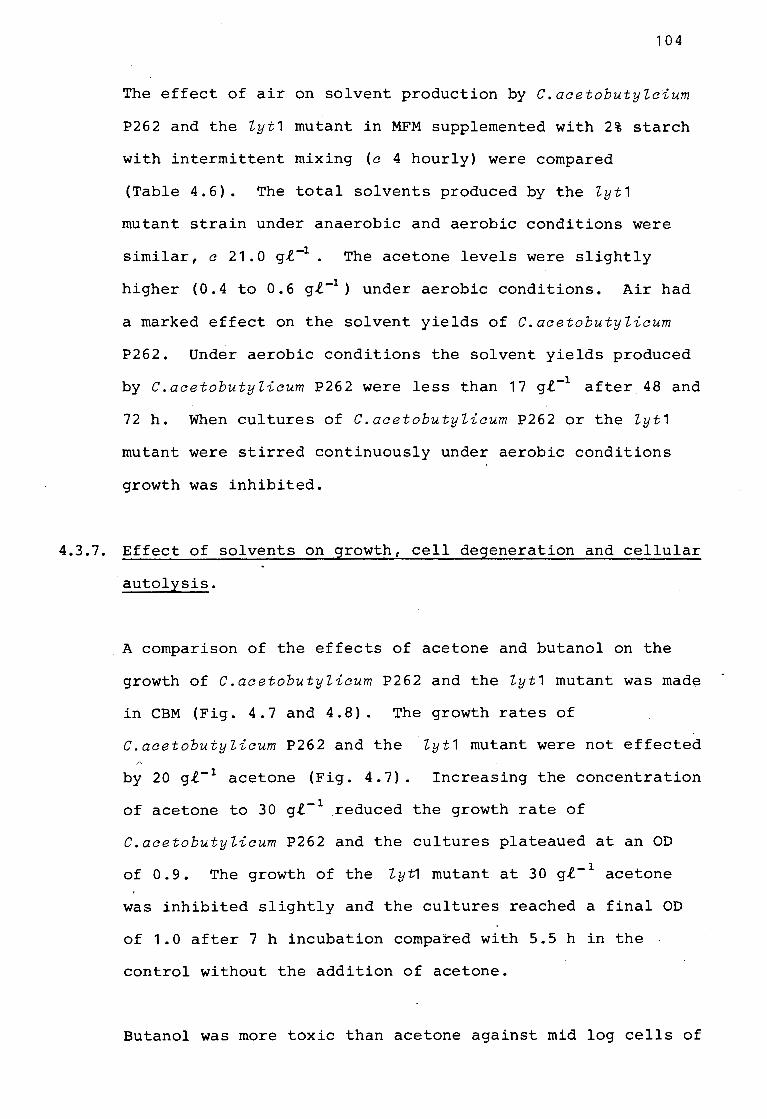
104
The effect of air on solvent production by C.acetobutylcium
P262 and the lyt1 mutant in MFM supplemented with 2% starch
with intermittent mixing (c 4 hourly) were compared
(Table 4.6). The total solvents produced by the lyt1
mutant strain under anaerobic and aerobic conditions were
similar, c 21.0 g£-1• The acetone levels were slightly
higher (0.4 to 0.6 g£-1) under aerobic conditions. Air had
a marked effect on the solvent yields of C.acetobutylicum
P262. Under aerobic conditions the solvent yields produced
by C.acetobutylicum P262 were less than 17 g£-1 after 48 and
72 h. When cultures of C.acetobutylicum P262 or the lyt1
mutant were stirred continuously under aerobic conditions
growth was inhibited.
4.3.7. Effect of solvents on growth, cell degeneration and cellular
autolysis.
A comparison of the effects of acetone and butanol on the
growth of C.acetobutylicum P262 and the lyt1 mutant was made
in CBM (Fig. 4.7 and 4.8). The growth rates of
C.acetobutylicum P262 and the lyt1 mutant were not effected
by 20 g£- 1 acetone (Fig. 4.7). Increasing the concentration
of acetone to 30 g£- 1 reduced the growth rate of
C.acetobutylicum P262 and the cultures plateaued at an OD
of 0.9. The growth of the ly~ mutant at 30 g£- 1 acetone
was inhibited slightly and the cultures reached a final OD
of 1.0 after 7 h incubation compared with 5.5 h in the
control without the addition of acetone.
Butanol was more toxic than acetone against mid log cells of
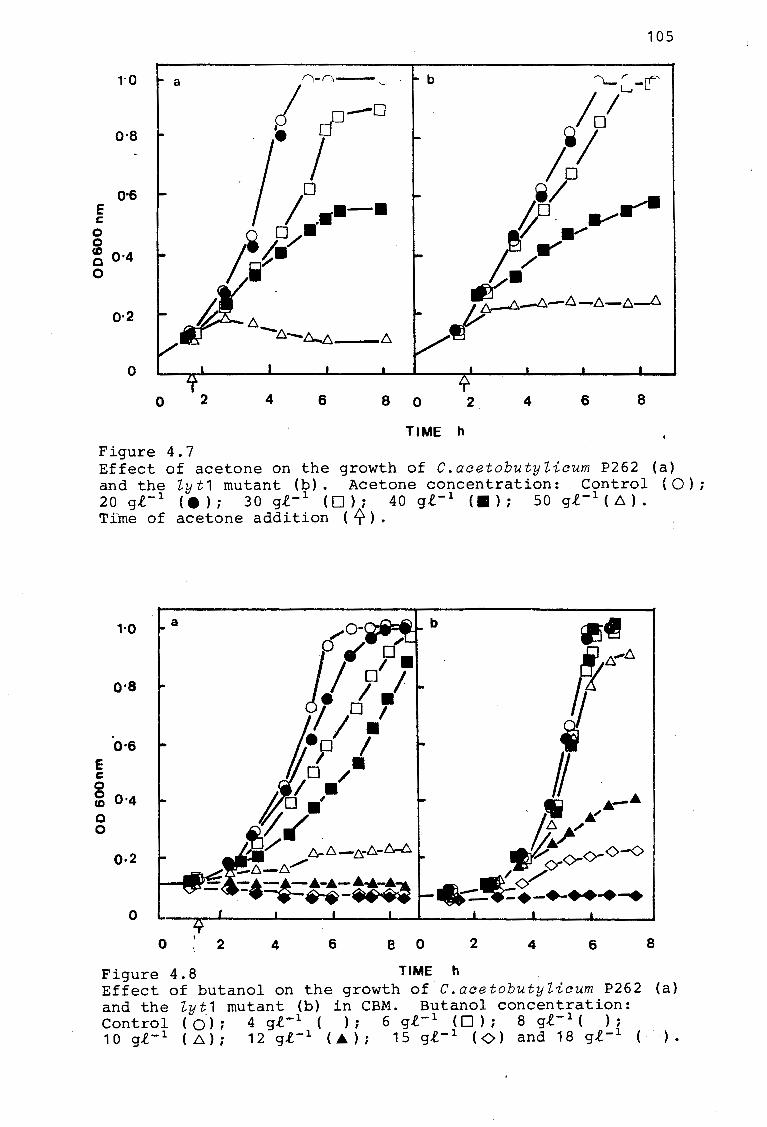
E c
0 0
o·s
o·s
~ 0·4 0
0·2
0
0
Figure 4.7
105
2 4 6 8 0 2_ 4 6 8
TIME h
Effect of acetone on the growth of C.acetobutyZicum P262 (a) and the Zy t 1 mutant (b) . Acetone concentration: Control ( 0) ; 20 g.t- 1
(•); 30 g.t- 1 (0); 40 g.e- 1 (•); 50 g.t- 1
( 6.). Time of acetone addition ( Lf-) •
E c 0
1·0
o·e
0·6
~ 0·4 0 0
0·2
0
0 2 4 6 e o 2 4 6 8
Figure 4. 8 TIME h Effect of butanol on the growth of-C.acetobutyZicum P262 (a) and the Zyt1 mutant (b) in CBM. Butanol concentration: Control ( Q) ; 4 g,e- 1 ( ) ; 6 g.e.- 1
( D ) ; 8 g.e.- 1 ( ) ;
10 g.e.- 1 ( ~); 12 gl- 1 (A.); 15 gl- 1 ((>) and 18 gl- 1 ·).
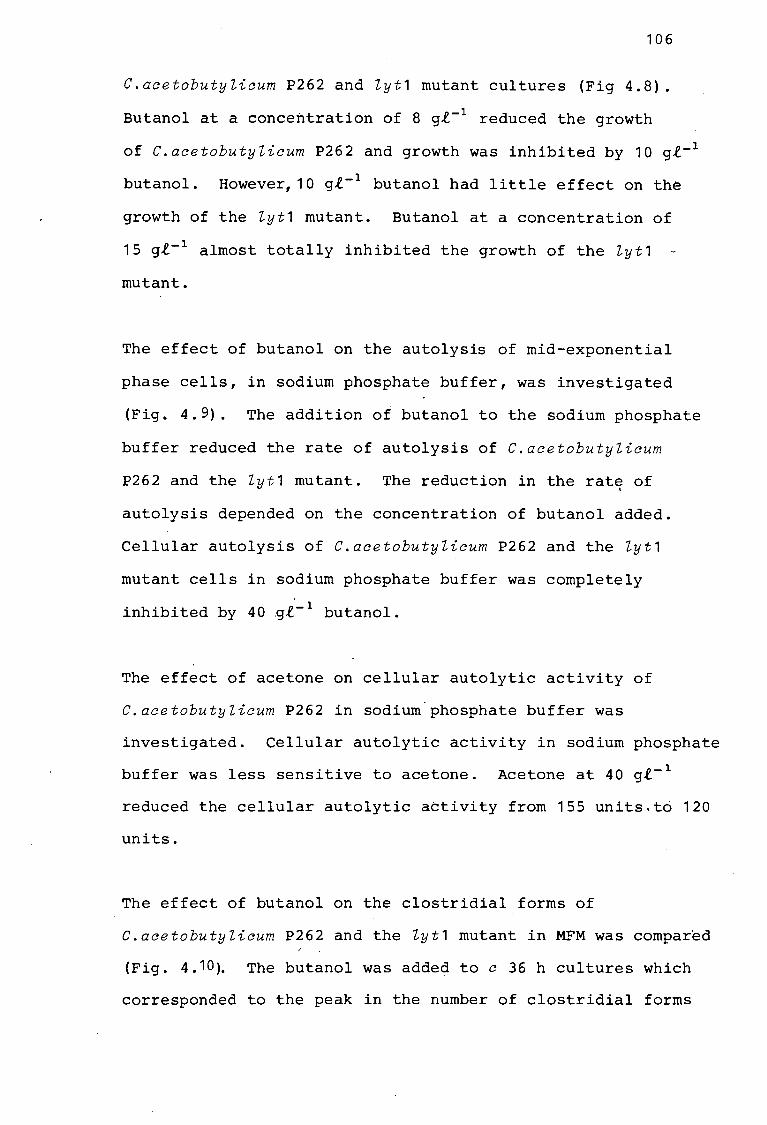
106
C.acetobutylicum P262 and lyt1 mutant cultures (Fig 4.8).
Butanol at a concentration of 8 g.e.- 1 reduced the growth
of C.acetobutylicum P262 and growth was inhibited by 10 gl- 1
butanol. However, 10 g.e.- 1 butanol had little effect on the
growth of the Zyt1 mutant. Butanol at a concentration of
15 g.e.- 1 almost totally inhibited the growth of the Zyt1
mutant.
The effect of butanol on the autolysis of mid-exponential
phase cells, in sodium phosphate buffer, was investigated
(Fig. 4.9). The addition of butanol to the sodium phosphate
buffer reduced the rate of autolysis of C.acetobutylicum
P262 and the lyt1 mutant. The reduction in the rate of '
autolysis depended on the concentration of butanol added.
Cellular autolysis of C.acetobutylicum P262 and the lyt1
mutant cells in sodium phosphate buffer was completely
inhibited by 40 g,e.'- 1 butanol.
The effect of acetone on cellular autolytic activity of
C.acetobutylicum P262 in sodium.phosphate buffer was
investigated. Cellular autolytic activity in sodium phosphate
buffer was less sensitive to acetone. Acetone at 40 gl- 1
reduced the cellular autolytic activity from 155 units.to 120
units.
The effect of butanol on the clostridial forms of
C.acetobutylicum P262 and the lyt1 mutant in MFM was compared
(Fig. 4.10). The butanol was added to c 36 h cultures which
corresponded to the peak in the number of clostridial forms
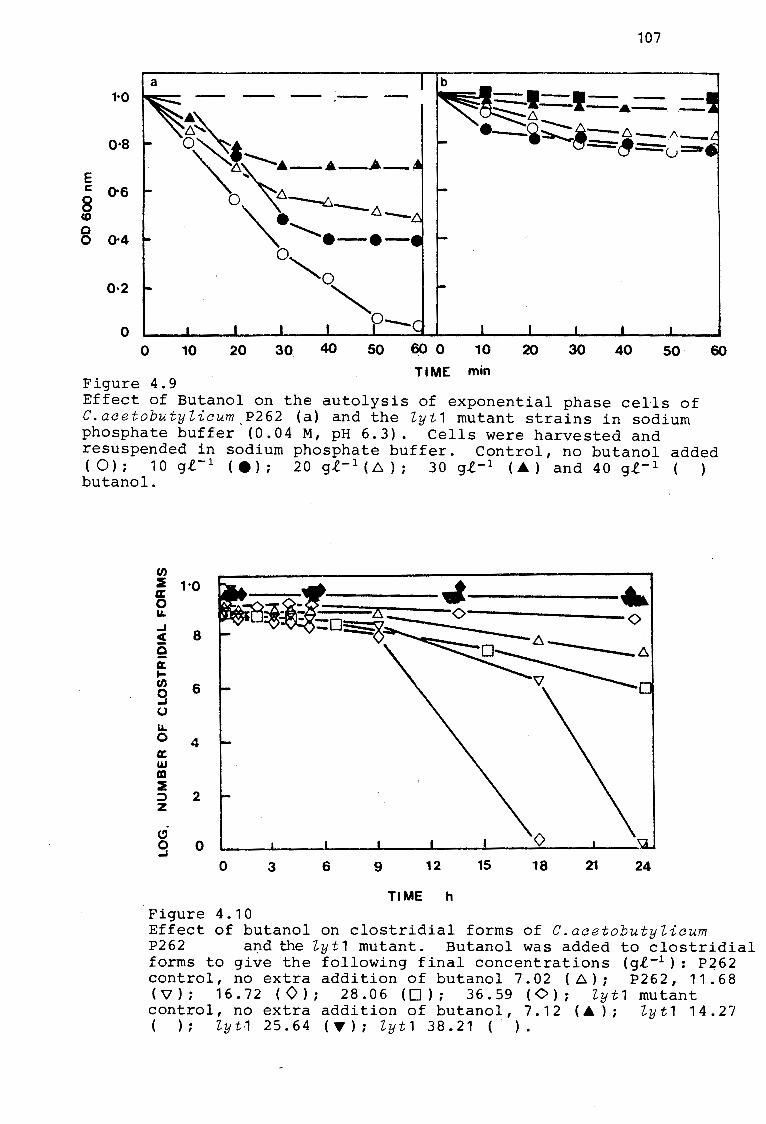
107
a 1·0
0·8
E c 0-6 8 co Q 0 0·4
0·2
0 0 10 20 30 40 50 ~ 0 10 20 30 40 50 60
TIME min Figure 4.9 Effect of Butanol on the autolysis of exponential phase cells of C.acetobutyZicum.P262 (a) and the Zyt1 mutant strains in sodium phosphate buffer (0.04 M, pH 6.3). Cells were harvested and resuspended in sodium phosphate buffer. Control, no butanol added ( 0 ) ; 1 0 g ,e.- 1
( e ) ; 2 0 g .e.- 1 ( .6 ) ; 3 0 g .e. - 1 ( .A ) and 4 0 g ,e.- 1 (
butanol.
en :e 1·0 « 0 LL. ..J s e ct .....
"' 9 0 LL. 0 a: w m :e ::> z
" 0 _,
8
6
4
2
0 0
Figure 4.10
-----·
3 6 9 12 15 18 21 24
TIME h
Effect of butanol on clostridial forms of C.acetobutyZicum P262 a~d the Zyt1 mutant. Butanol was added to clostridial forms to give the following final concentrations (g,f.-1 ): P262 control, no extra addition of butanol 7. 02 ( .6); P262, 11. 68 ( 'l ) ; 1 6 . 7 2 ( 0 ) ; 2 8 . 0 6 ( D ) ; 3 6 . 5 9 ( <> ) ; Z y t 1 mutant control, no extra addition of butanol, 7.12 (.A); Zyt1 14.27 ( ); Zyt·1 25.64 (T); Zyt1 38.21 ( ).
108
produced by C.acetobuty"licum P262 and the "lyt1 mutant.
The normal level of butanol produced by C.acetobuty"licum
P262 and the "lyt1 mutant in MFM at 36 h was c 7 gl- 1 •
In C.acetobuty"licum P262 without the addition of extraneous
butanol the peak in phase bright clostridial forms was
followed by a period of degeneration (Fig. 4.2). The phase
bright clostridial forms became phase dark and granulated
and had an irregular outline. The addition of butanol to
the C.acetobutylicum P262 cultures to give a final butanol
concentration of 11.68 gl- 1 and 16.72 g£- 1 increased the
rate of clostridial degeneration (Fig. 4.10). The addition
of 18.52 gl- 1 of butanol (final butanol concentration of
25.64 gl- 1 ) to the Zyt1 mutant had no effect· on the clostridial
forms. However the addition of butanol to C.acetobutylicum
P262 cultures, giving a final concentration of butanol of
36.59 gl- 1 inhibited clostridial form degeneration.
109
DISCUSSION
The Zyt1 mutant is similar to the majority of autolytic
deficient mutants ( Ghuysen and Shockman, 1973; Rogers, 1979;
Rogers et aZ., 1980) which have been described in that they
all possess reduced but detectable levels of autolytic
activity and from long chains of cells (Tomasz, 1968;
Pooley et aZ., 1972). The autolytic-deficient mutant,· Zyt1
is pleitropic in that it produces less autolysin than the
parent strain and it has an altered cell wall (Allcock, 1981).
The autolytic activity of C.acetobutyZicum P262 was induced
by air when grown in MFM. Air had no effect on the low
levels of autolysin produced by the Zyt1 strain.
The Zyt1 mutant differs from mutants of S.faecuim with
reduced autolytic activity which show reduced growth and
yields in complete media (Shungu et aZ., 1979). The growth
rates of the Zyt1 mutant are similar to C.r.icetobutyZicum
P262 in minimal rredium, (Allcock, 1981) and in CMB.
Autolysis of C.acetobutyZicum P262 in sodium phosphate
buffer is similar to the autolysis of S. faecaZis (Pooley
and Slockman, 1970) and LactobaciZZus acidophiZZus
(Coyette and Ghuysen, 1970) in that the ability of the cells
to autolyze decreases when cultures enter the stationary
growth phase. Little or no autolysis occurred when
C.acetobutyZicum P262 or Zyt1 mutant clostridial forms were
resuspended in phosphate buffer.

11 0
In previous studies the clostridial forms of C.acetobutylicum
were responsible for the conversion of acids to neutral
solvents and sporulation mutants which were unable to form
clostridial stages did not produce solvents (Chapter III;
Jones et al., 1981). In the ABE process butanol toxicity
will be most important and apparent during the stationary
growth phase when clostridial forms predominate. Therefore
the effect of butanol on the clostridial forms was determined
and it could be concluded that there is a relationship
between butanol toxicity and clostridial degeneration.
Clostridial forms from the lyt1 mutant were not induced to
degenerate by concentrations of butanol which increased the
rate of degeneration of C.acetobutylicum P262 clostridial forms.
It is suggested that the lyt1 cl~stridial fonns are rrore resistant to
butanol induced degeneration and that one of the effects of butanol
concentrations betw=en 7 - 16 gt-1 is the induction of autolysis and
degeneration of C.acetobutylicwn P262. The concentrations of butanol
which induce degeneration of clostridial fonns were within the concentration
ranges obtained in the facto:ry fennentations. High concentrations of
butanol had the reverse effect and prevented degeneration. However these
high concentrations would not be produced by C.acetobutylicwn P262 as it
would have degenerated before these levels were obtained.
The complete inhibition of solvent production after c 39 h
observed with C.acetobutylicum P262 in MFM suggests that a
threshold level is reached which results in the inhibition of
further solvent production. The gradual decrease in solvent
production obtained with the Zyt1 mutant suggests that solvent
production in this strain is not subject to inhibition by the
same mechanism.
Although not important as regards solvent production and
111
butanol toxicity, it is significant that vegetative cells
of the Zyt1 mutant were also more resistant to butanol
than C.acetobutyZicum P262 cells. The mechanism of
increased resistance of the Z.yt1 vegetative cells is
unclear since butanol did not induce or increase autolysis
of the vegetative cells. Nevertheless the increased butanol
tolerance shown by the Zyt1 vegetative cells supports our
conclusion that there is a relationship between butanol
tolerance ~nd autolytic activity.
Although the Zyt1 clostridial forms do not degenerate and
remain phase bright and look healthy in the presence of
concentrations of butanol between 0 and 35 gl- 1 the
physiological state of the clostridial forms at the higher
butanol concentrations has not been determined. Nevertheless
this pleiotropic Zyt1 mutant is butanol tolerant and its
potential to produce higher solvent levels should be
investigated.
112
CHAPTER V
CONCLUSION AND GENERAL DISCUSSION
The molasses laboratory scale fermentation systems which
were developed were found to produce approximately the
same levels of solvents but slightly less ethanol than
the yields obtained at the N.C.P. factory. Three main
types of culture systems are currently employed in the
genetic, molecular biology and fermentation studies being
carried out on Clostridium acetobutylicum. There are:
factory type fermentation media, eg. MFM; complete complex
laboratory media,eg. CBM (O'Brien and Morris, 1971);
chemically defined media, eg. minimal medium (Long et al.,
1981). Although there are many advantages in carrying out
such studies in a "clean" laboratory medium such as CBM,
.a major drawback is that the final solvent yields obtained
are substantially lower than those obtained in a factory
type fermentation. Initial attempts to increase solvent
levels in laboratory media by manipulation of physical,
chemical and nutritional factors has met with limited success.
In the initial studies the level of solvent produced was the
main criterion used to monitor the effect of the manipulations.
Further studies showed that the relationship of the various
factors is complex and it became apparent that the initial
aim of trying to identify and manipulate a few key factors
to give better solvent yields would not easily be obtained.
Later studies showed that not only do the solvent levels
differ but the overall patterns of growth and cell development
are markedly different in the various laboratory systems
which have been compared. In view of t~e observed differences,
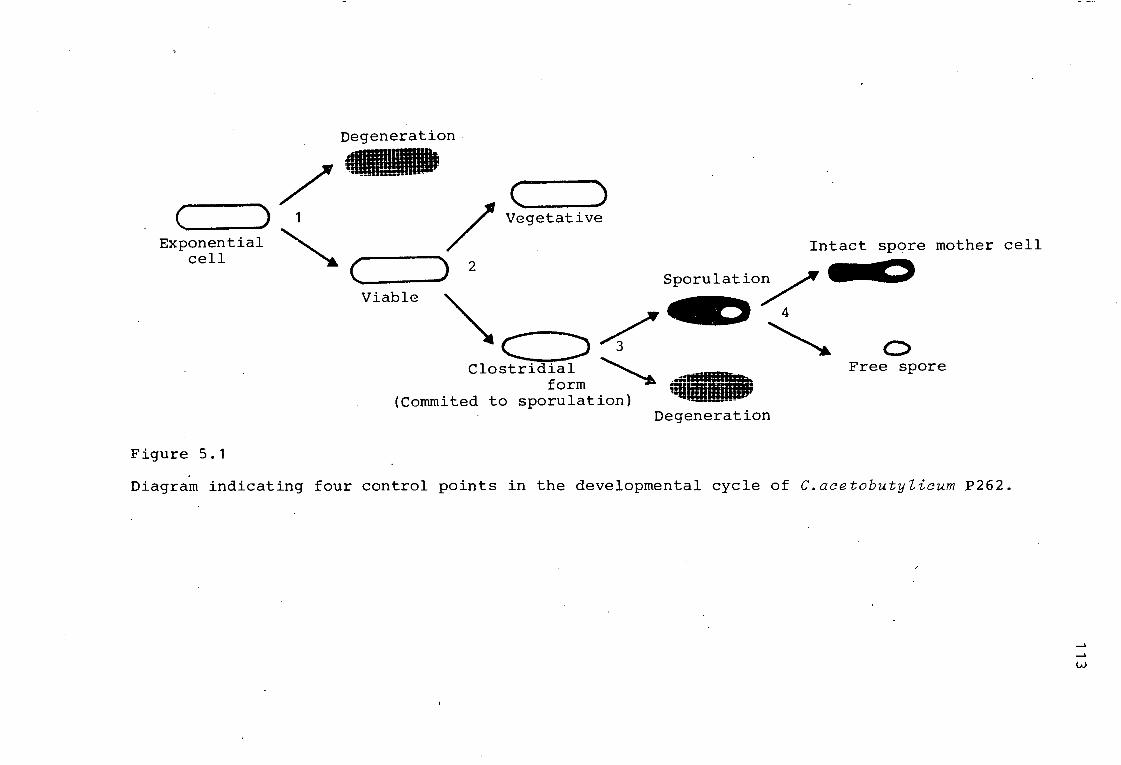
( ) Exponential
cell
Figure 5 .1
Degeneration.
( ) Vegetative
Intact spore mother cell
( Viable
0 Clostridial ~ Free spore
form • (Cornrnited to sporulation) ·~ -
Degeneration
Diagram indicating four control points in the developmental cycle of C.acetobutylicum P262.

1 1 4
more detailed investigations of the growth pattern and
the morphological and physiological changes were undertaken
in the MFM and CBM systems.
Studies 9n the morphological changes in the ABE fermentation
system suggested that the clostridial forms in
C.acetobutyZicum P262 were involved in the conversion of
acetate and butyrate to acetone and butanol. This was
confirmed by the isolation of sporulation mutants which
either failed to form clostridial stages and produced no
solvents or formed reduced numbers of clostridial forms
and intermediate levels of solvent.
These studies have lead to the identification of four
probable control points in the developmental stages of the
culture during the fermentation process (Fig. 5.1). The
first control point determines whether the exponential cells
undergo degenerative changes or remain viable. The second
control point determines whether the cells remain as
vegetative cells or become committed to sporulation, i.e. form
clostridial forms which are sporulation intermediates .
(Gunsalus and Stanier, 1960). The third control point
determines whether the clostridial forms complete sporulation
or undergo degenerative changes. Long et aZ. (1981) have
shown the induction of sporulation of C.acetobutyZicum P262
following exposure to air. The induction of cell free
autolysin by air in MFM has been demonstrated for
C.acetobutyZicum P262. Whether or not this autolytic activity
is associated with the sporulation process needs to be
determined. The fourth control point is the release of the
mature spore from the spore mother cell.
11 5
Degenerative changes in the cell population of
C.acetobutylicum may occur at two distinct stages in the
fermentation process. The relationship between these two
stages is not known. Two autolytic systems have been
identified (Allcock et al., 1981bi Allcock, 1981). The relationship
between the autolytic systems and the degenerative changes
has not been determined. Autolytic activity may also be
induced experimentally in actively growing vegetative rods
which results in the production of protoplasts (Allcock
et al., 1981a).
Autolytic deficient mutants were isolated after mutagenesis
and lacked substantial levels of autolytic enzymes and grew
in long chains. One of these mutants was highly pleiotropic
and four phenotypic characteristics were affected. These
include reduced cell free and cell bound autolysin levels,
an altered cell wall which was more resistant to its own and
C.acetobutylicum P262 autolysin (Allcock et al., 1981b), growth
at increased glucose levels and an increased tolerance to
butanol. Initial fermentation studies have indicated that
the mutant may be useful in producing higher solvent yields.
The future of the ABE fermentation is likely to depend on
the ability of the organism to produce higher solvent
concentrations (Ryden, 1958; Spivey, 1979). The recovery of
2% solvents by distillation requires considerable expenditure
of energy. The economic production of solvents would
obviously be more easily obtained if some means of increasing
solvent yields could be developed. The Zyt1 mutant or other
butanol resistant strains may be potentially important in
1 1 6
increasing the solvent yields obtained because of the
inability of the bacterium to tolerate concentrations of
butanol exceeding 13 gl- 1• The potential of continuous
cultures for the production of solvent has yet to be
exploited and coupled with the continuous removal of
solvent by, for example reverse osmosis or absorption on
active carbon, continuous cultures may enable much higher
sugar concentrations to be used with a consequent increase
in productivity.
Finally it should be noted that the development of a genetic
system in C.aaetobutylieum (Allcock, 1981) enables this
industrial microorganism to be manipulated utilising
recombinant DNA techniques. This development and the
demonstration that C.aaetobutylicum P262 produces cellobiase
and carboxymethyl cellulase enzyme (Allcock and Woods, 1981)
enhances its potential in the emerging field of biotechnology.
0
APPENDIX A 1 1 7
GROWTH OF CLOSTRIDIUM THERMOCELLUM UNDER LABORATORY CONDITIONS
A.1. INTRODUCTION
The energy crisis in the world today is, to a large
extent, a consequence of the need for vast quantities
of liquid fuels. These liquid fuels are derived mostly
from petroleum. In order to lessen our dependence on
petroleum it is necessary to both increase conservation
of energy and to develop alternatives and, preferably,
renewable energy resources.
Ethanol can be mixed with gasoline to obtain "gasohol"
a motor fuel as good as gasoline. Ethanol can be produced
from ethylene derived from hydrocarbons or fermented by
fermentation of sugars derived from plant matter. Sugars
derived from two classes of plant material, starch and
cellulose, can be fermented and distilled into ethanol.
The most commonly proposed approach for the conversion of
plant materials to ethanol is a two step process, where in
the first step the polymeric material is hydrolyzed either
by chemical or by enzymatic treatment and the second step,
the product of hydrolysis (reducing sugars) are then
subjected to fermentation to ethanol by the yeast
Saccharomyces cerevisiae (Gomez, 1980).
Cellulose is the most abundant biopolymer on earth and
exists as a highly ordered crystalline structure composed
of glucose moities linked by 81-4 bonds (Cowling, 1975).
Renewed interests in both basic and applied studies of
ethanol production from cellulose bioconversion has arisen
because of the abundance of cellulosic substrates in
biomass derived residues (Wilke, 1975; Zeikus, 1980).
Most microbial cellulases are comprised of three
118
components which when purified have readily distinguishable
activities (Reese, 1975). These include the following:
1. Endo-S-1,4-glucanases that act randomly on crystaline
cellulose and are assayed using carboxymethyl-cellulose as
substrate; 2. exo-S-1,4 glucanases that are either
glucohydrolases or cellohydrolases that act on the non
reducing end of the cellulose chain that are assayed using
a variety of crystalline celluloses as substrates (e.g.
filter paper); 3. Cellobiase or S-glucosidase, which
cleaves cellobiose into glucose. The components act
synergistically (Wood, 1975) to effectively solubilize
crystalline cellulose.
Anaerobic micro-org~nisms capable of degrading cellulose
to useful products have not received the same attention in
recent years as their aerobic counterparts. Considerable
research efforts have been devoted to systems using cellulase
enzymes produced predominantly by aerobic, mesophillis fungi
(Mandells and Weber, 1969; Mandells et al., 1974).
Nevertheless effective utilization of cellulosic biomass,
via these processes, has yet to become a reality.
c c
Evidence suggests that cellulolytic activity is common among
thermophiles (Stutzenberger et al., 1970; Cooney and
Ackerman, 1975; Cooney and Wise, 1975; Romanelli et al.,
1975).
119
Thermophillic anaerobic, cellulolytic bacteria have been
isolated by Mc Bee (1948, 1950), and Lee and Blackburn
(1975). At present CZostridium thermoceZZum is the only
taxonomically recognised therrnophillic anaerobic species
(Buchanan and Gibbons, 1974)) although other clearly
distinct bacteria probably exist (Lee and Blackburn, 1975).
An approach to achieve conversion of cellulose to
fermentable sugars and the fermentation of these sugars to
ethanol in a single step by using C.thermoceZlum has been
proposed by Wang et al., (1976-1980) • Since C. thermocellum
is an anaerobic micro-organism, the catabolic products from
cellulose are alcohol and organic acids (Weimer and Zeikus,
1977) .. Thus the conversion of cellulose to alcohol. could be
achieved in a single step.
The advantages and disadvantages of C.thermocellum as an
organism for the utilization of cellulose are listed in
Table 1. Preliminary purification studies have suggested
that C.thermocellum cellulase is a complex, but the
mechanism of action of individual components have not been
described (Ait et ai., 1979). The supernatant cellulase of
C.thermocellum differs ~ignificantly from that of the mould
Trichoderma viridae in both the types of activities present
and tbeir specific activities. C.thermocellum supernatant
cellulase, unlike that of T.viridae lacks cellobiase activity
(Ng et al., 1977)~ C.thermoceZlum contains both endo- and
exo-glucanase activities but the ratio of endoglucanase to
exoglucanase is greater in C.thermocelZum than in
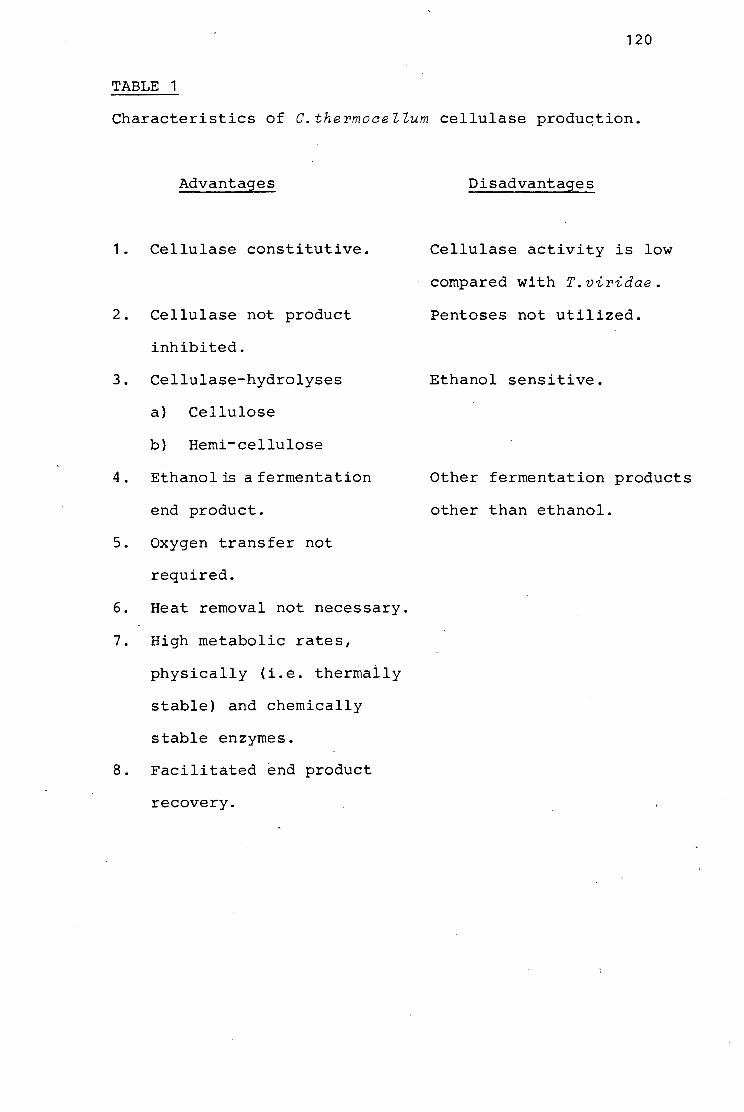
I
120
TABLE 1
Characteristics of C.thermoceZZum cellulase produqtion.
Advantages
1. Cellulase constitutive.
2. Cellulase not product
inhibited.
3. Cellulase-hydrolyses
a) Cellulose
b) Berni-cellulose
4. Ethanol is a fermentation
end product.
5. Oxygen transfer not
required.
6. Heat removal not necessary.
7. High metabolic rates,
physically (i.e. thermaily
stable) and chemically
stable enzymes.
8. Facilitated end product
recovery.
Disadvantages
Cellulase activity is low
compared with T.viridae.
Pentoses not utilized.
Ethanol sensitive.
Other fermentation products
other than ethanol.
I
121
T.viridae (Ng. et al. 1979 ; Shinmyo and Garcia-
Martinez, 1979). Filter paper activity is significantly
higher in T.viridae hypercellulase mutants than in strains
of C.thermocellum (Ng and Zeikus, 1979). However, the
criteria of cellulase activity, moles of reducing sugar
equivalents per unit time produced from a crystaline
cellulose, may not be adequate to apply to C.thermocellum.
Results have indicated that the cellulase of C.thermocellum
produces oligosaccharides in addition to glucose and
cellobiose from cellulose (Gomez, 1980). This characteristic
will result in an underestimate of the ability of
C.thermocellum cellulase to solubilize cellulose. This
accumulation of soluble reducing sugar appears to have no
effect on the activity of the C.thermocellum cellulases
(Gordon et al. , 19 7 9) .
The ability of C.thermocellum to utilise glucose as the
sole carbon source has been the subject of debate in the
literature (McBee, 194~, 1950; Patni and Alexander, 1971;
Ng et al., 1977; Zeikus et al., 1980). Gomez and Hernadez
(1980) have shown that C.thermocellum is able to utilise
glucose as the sole carbon source after an extended lag
phase (12 to 30 h). After cultures were repeatedly grown
on glucose this lag disappeared. Cultures which were not
adapted to grow on glucose were unable to transport glucose,
while glucose adapted cells transported glucose (Gomez and
Hernadez, 1980).
A disadvantage that C.thermocellum presents .is its inability
to ferment 5-carbon sugars. Several strains of
C.thermocellum have been described that actively ferment
122
cellulose and cellobiose but not pentoses to ethanol
(Ng et al., 1977; Garcia-Martinez et al., 1980; Lamed
and Zeikus, 1980). Cellulose substrates are composed of
approximately 50% cellulose, 25% hemicellulose and 25%
lignins. Although C.thermocellum will degrade hemicellu=
loses, the resulting 5-carbon sugars accumulate in the
fermentation broth (Gordon et al., 1979). Clearly this
is a problem that has to be overcome, since this would
result in 25% of the substrate not being converted to
ethanol. A means of overcoming this problem, other than
via genetic manipulation of C.thermocellum, is to utilise
a second microorganism which can utilise these sugars.
The natural decomposition of cellulose by thermophillic
bacteria is a symbiotic process (Enebo, 1949, 1951),
indicating that co-culture studies are of importance
(Wang et al., 1979; Ng et al., 1981). Co-culturing
C.thermocellum and Clostridium thermohydrosulfuricum, a non
cellulolytic thermophile, (Ng et al., 1981) have increased
the ethanol production rate three-fold.
The bioconversion of cellulose to ethanol by C.thermocellum
is limited by the strong inhibition that the fermentation
end-product exerts on the growth of the bact~ria (Herrero
and Gomez, 1980a). Ethanol at concentrations of 5g per litre
decreases the growth rate by 50%. An ethanol resistant
C.thermocellum strain C9 has been derived from the wild type
strain which is capable of growing at ethanol concentrations
of 25gl- 1 (Herrero and Gomez, 1980b). Wang et al., (1979)
using ethanol ressitant strains of C.thermocellum and
C.thermosaccharolyticum have obtained 40gl- 1 of ethanol
from cellulose fermentations.
123
Johnson et al., (1981) have developed a chemically defined
medium for C.thermooeZZum. The growth factors required
are biotin, pyridoximine, vitamin B12 and p-amino-benzoic
acid.
Chemical and fuel production from·thermophillic anaerobic
fermentations of biomass provides a promising approach for
the use of renewable resources.
Allcock and Woods (1981) have shown that C.acetobutyZioum
possesses an inducible carboxymethyl cellulase and cellobiase
but no activity on crystalline cellulose could be demonstrated.
The cellulase required for crystalline cellulose degradation
could be inserted by genetic manipulation (Eveleigh and
Montecourt, 1979). C.thermooeZZum has the genes necessary
for crystalline cellulase activity and could be the source
of these genes. These studies were undertaken in order
to be able to work with C.thermooeZZum prior to genetic
manipulation studies.
124
A.2 MATERIALS AND METHODS
A.2.1. Organism C.thermoaellum ATCC 27405, a thermophillic
obligatory anaerobic Gram negative bacterium a O. 6-0. 7 µm by
4.0-5.0 µm.
A.2.2. Anaerobic methods. The anaerobic culture technique
of Hungate (1969) as modified by Bryant (1972) were used
throughout the investigation. Hungate anaerobic culture
tubes were used for small culture volumes (10 mi) and
500 ml Erlenmeyer flasks converted for anaerobic use
(Daniels and Zeikus, 1975) were used for 250 to 300 ml
cultures.
A.2.3. Growth of organism. C.thermoaellum was grown in biotin
enriched Clostridiurn Medium 3 (Cl-'3) (Weimer and Zeikus, 1977), which
contained g.e- 1 cellulose 9.72; Yeast extract, 2.0 (Difeo);
(NH4) 2 S04, 1.3; KH 2 P04, 1.5; K2 HP04 3H2 0 2.9;
MgC! 2 6H 2 0, 2.9; MgC! 2 6H 2 0 1.0; CaC! 2 , 0.15; resazurin
0.002; FeS0 4 , 0.0125; Biotin, 2x10- 6 ; the pH was adjusted
to 7.5 with 1N NaOH prior to dispensing 9.6 ml of the medium
into Hungate tubes under constant vigqrous gassing with N2 •
Then 0.4 ml of a solution containing cysteine hydrochloride
(1.25%) and Na 2 S 9H 2 0 (1.25%) was added to each tube. The
tubes were sealed and autoclaved for 15 min at 105 kPa.
Larger volumes of CM3 were autoclaved before reduction.
After sterilisation the flasks were gassed under N2 , stoppered
and reduced. Cellobiose was prepared by replacihg cellulose
with filter sterilised cellobiose. The following cellulosic
substrates were utilised; avicel, microcrystalline cellulose
(FMC Corporation, Food and Pharmaceutical Products, Philadelphia)
I
a-cellulose (Sigma Chemical Co.); Whatman CC41
cellulose.
125
Growth was measured as optical density (OD) at 600 nm
in a Corning Colorimeter 525. Cultures that contained
cellulose were blended in a vortex mixer and allowed to
stand upright for 2 h prior to taking OD readings.
Cultures that contained cellobiose wer~ measured
immediately after blending.
Stock cultures of C.thermocellum for daily use were
maintained by subculturing biweekly into fresh CM3 medium.
The cultures were grown for 48 h at.60°C and stored at 4°C.
Since the strain did not utilise glucose, contamination
checks were performed in CM3 that contained glucose rather
than cellulose. Turbidity and gas production after 72 h
were taken as evidence for contamination.
Stock cultures were also maintained in chopped meat
carbohydrate medium (appendix B), grown for 48 hat 60°C
and stored in the dark at room temperature.
A.2.4. Sugar analyses.
D-glucose in the medium was determined by the colourimetric
assay for D-glucose with glucose oxidase (Merkotest
Diagnostic Kit Catalogue No. 3393). Total reducing sugars
were calculated according to the dihitrosalycilic (DNS)
method (Miller, 1959).
126
A.2.5.Measurement of cellulolytic activity.
The carboxyrnethyl cellulase activity (CMCase) assay
described by Gordon et aZ., (1979) and the filter paper
assay described by Mandels et aZ., (1976) were used.
One unit of activity was defined as the quantity of
enzyme required to catalyse the formation of 1 µmole of
reducing sugar m£- 1 min- 1•
127
A. 3 RESULTS
A.3.1. Characteristics of growth on cellulose.
Initial evidence of fermentation was a fluffing of the
cellulose and the release of descrete gas bubbles. A
yellow pigment which bound tightly to the cellulose was r
produced. As the.fermentation became more vigorous, the
cellulose was gradually solubilized and the liquid phase
became turbid due to cell growth. No yellow pigment was
formed when C.thermocellum was propagated on cellobiose
media. Shaking the cultures decreased growth on cellulose
but had no effect on cellobiose grown cultures. Microscopic
examination indicated that the organism associated tightly
with the cellulose fibres.
A.3.1.1. Transfer of growth factors from meat broth.
Inocula from meat broth cultures of C.thermocellum grew
better in CM3 cellobiose and CM3 avicel than CM3 inocula
(Fig. A1). The growth rate was fasteF and the final
absorbance was greater in CM3 cellobiose medium. Serial
transfer of C.thermocellum in CM3 decreased its growth.
After 4 transfers into fresh media no growh occurred
(Fig. A2). The addition of 0.5 ml of fresh uninoculated
meat broth supernatant replaced the growth factors lost
through serial transfer (Fig. A2).
The effect of ·adding biotin, thiamine and p-aminobenzoic
acid to CM3 on the growh of C.thermocellum was determined.
f The addition of thiamine and p-arninobenzoic acid on their
own or in combination had no effect on the growth of
C.thermocellum. The addition of biotin at 2 µg/l- 1 was
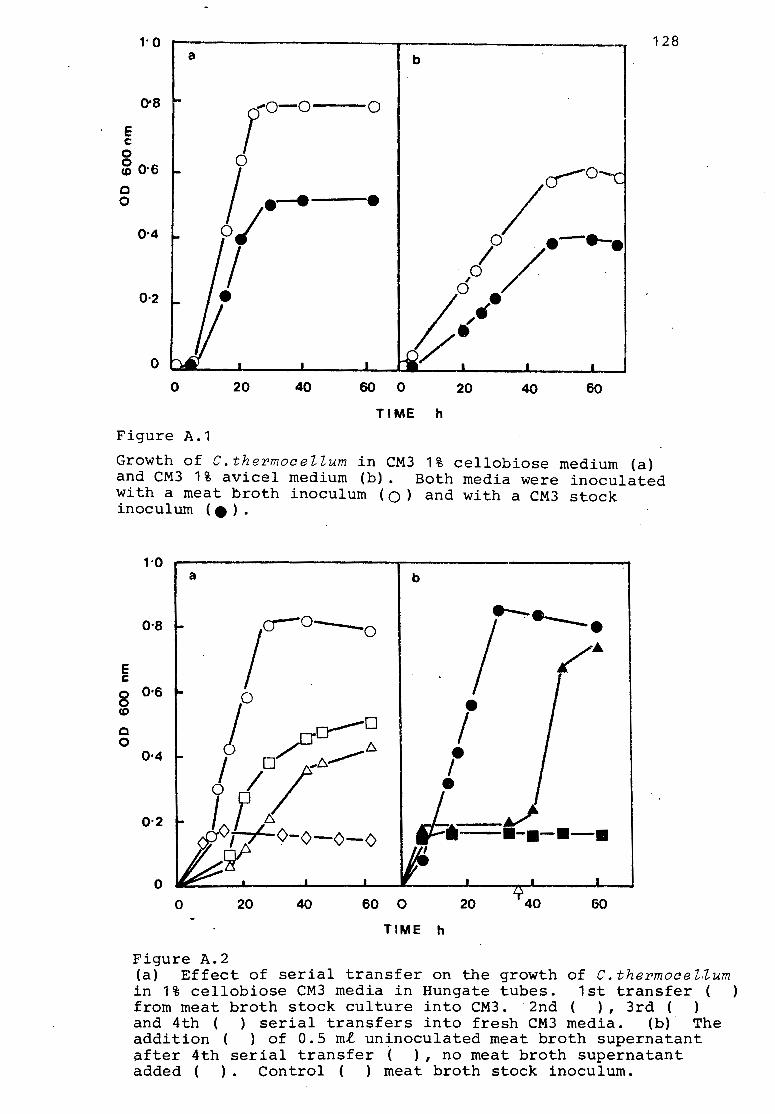
1· 0 a
0'8
b l 128
E c
0 0 co 0·6
r-o--o ! ·---· o/
cr--o c 0
0·4
0·2 I •
/ lo/ .• -._. 0 '
lo•
/ . • y 0
0 20 40 60 0 20 40 60
TIME h
Figure A .1
Growth of C.thermoceZZum in CM3 1% cellobiose medium (a) and CM3 1% avicel medium (b). Both media were inoculated with a meat broth inoculum (Q) and with a CM3 stock inoculum ( e ) .
E c 0 0 co c 0
1·0 a b
0·8 /cr-o- /._._. / ..
0·6 0 • I j a--o /CT 6
0·4 I o ,6~ ,. 0 // •
0·2 I I ti J. #gl 0-0-0-0 I
0 0 20 40 60 0 20 40 60
TIME h
Figure A.2 (a) Effect of serial transfer on the growth of C.thermoceZZum in 1% cellobiose CM3 media in Hungate tubes. 1st transfer ( ) from meat broth stock culture into CM3. 2nd ( ) , 3rd ( ) and 4th ( ) serial transfers into fresh CM3 media. (b) The addition ( ) of 0.5 ml uninoculated meat broth supernatant after 4th serial transfer ( ) , no meat broth supernatant added ( ) • Control ( ) meat broth stock inoculum.
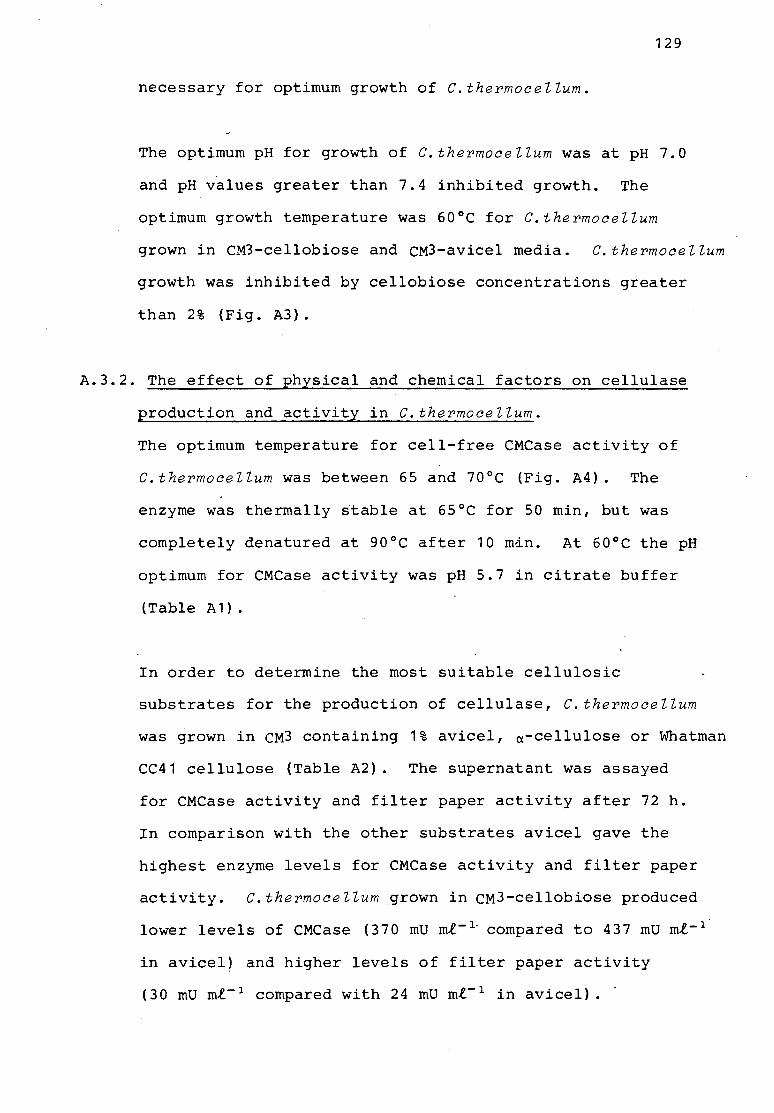
129
necessary for optimum growth of C.thermoceZZum.
The optimum pH for growth of C.thermoceZZum was at pH 7.0
and pH values greater than 7.4 inhibited growth. The
optimum growth temperature was 60°C for C.thermoceZZum
grown in CM3-cellobiose and CM3-avicel media. C.thermoceZZum
growth was inhibited by cellobiose concentrations greater
than 2% (Fig. A3).
A.3.2. The effect of physical and chemical factors on cellulase
production and activity in C.thermoceZZum.
The optimum temperature for cell-free CMCase activity of
C.thermoceZZum was between 65 and 70°C (Fig. A4). The
enzyme was thermally stable at 65°C for 50 min, but was
completely denatured at 90°C after 10 m~n. At 60°C the pH
optimum for CMCase activity was pH 5.7 in citrate buffer
(Table A1).
In order to determine the most suitable cellulosic
substrates for the production of cellulase, C.thermoceZZum
was grown in CM3 containing 1% avicel, a-cellulose or Whatman
CC41 cellulose (Table A2). The supernatant was assayed
for CMCase activity and filter paper activity after 72 h.
In comparison with the other substrates avicel gave the
highest enzyme levels for CMCase activity and filter paper
activity. C.thermoceZZum grown in CM3-cellobiose produced
lower levels of CMCase (370 mu m.e- 1· compared to 437 mu m.e- 1
in avicel) and higher levels of filter paper activity
(30 mu m.e- 1 compared with 24 mu m.e- 1 in avicel). -
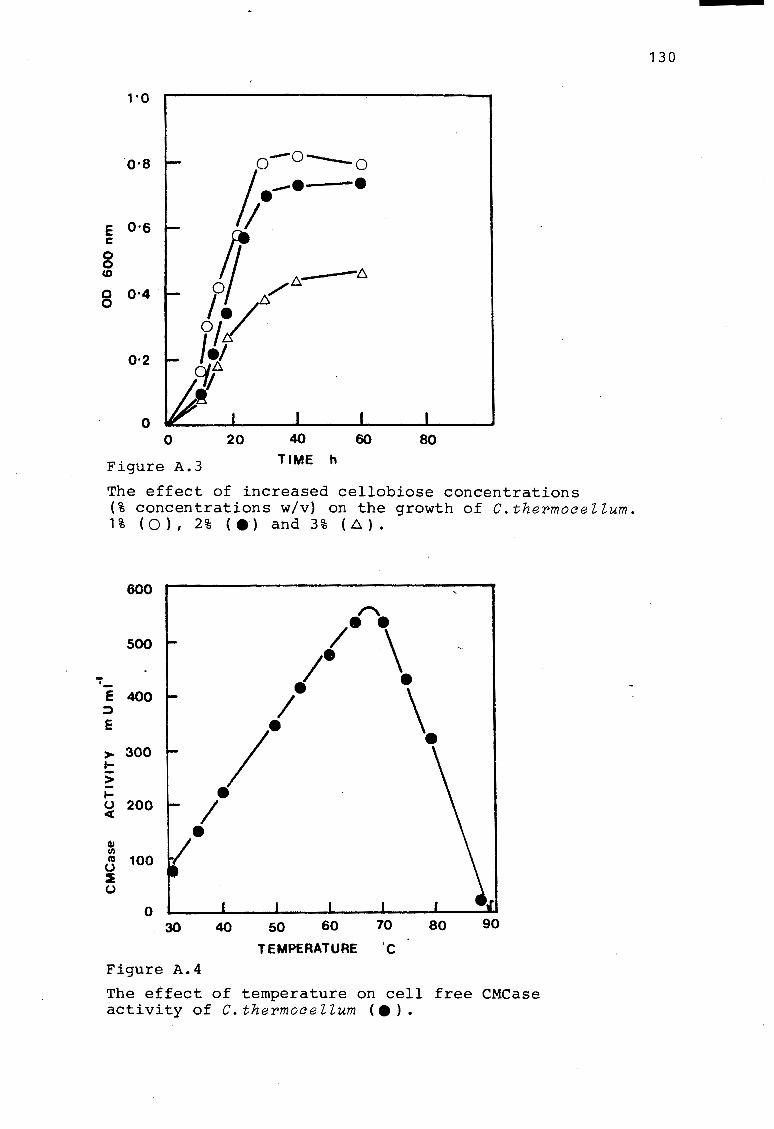
1 ·o
o·8
E 0·6 c 0 0 CD
c 0•4. 0
0·2
0
o-0 ---o t·-· . Ii 6-o/ / I~ r 0// .
/.1 ~D.
0
Figure A.3
20 40
TIME h 60 80
The effect of increased cellobiose concentrations (%concentrations w/v) on the growth of C.thermocellum. 1% (0), 2% (e) and 3% (D.).
600
500
·-E 400 ::> E
> 300 I-
> l-o 200 <(
Cll C/l ~ 100 0 :I 0
0 30
/""'\ / ..
;- \ • •
1' \. • I •
40 50 60
TEMPERATURE
70
·c 80
Figure A.4
90
The effect of temperature on cell free CMCase activity of C. thermoce l lum ( e ) .
130
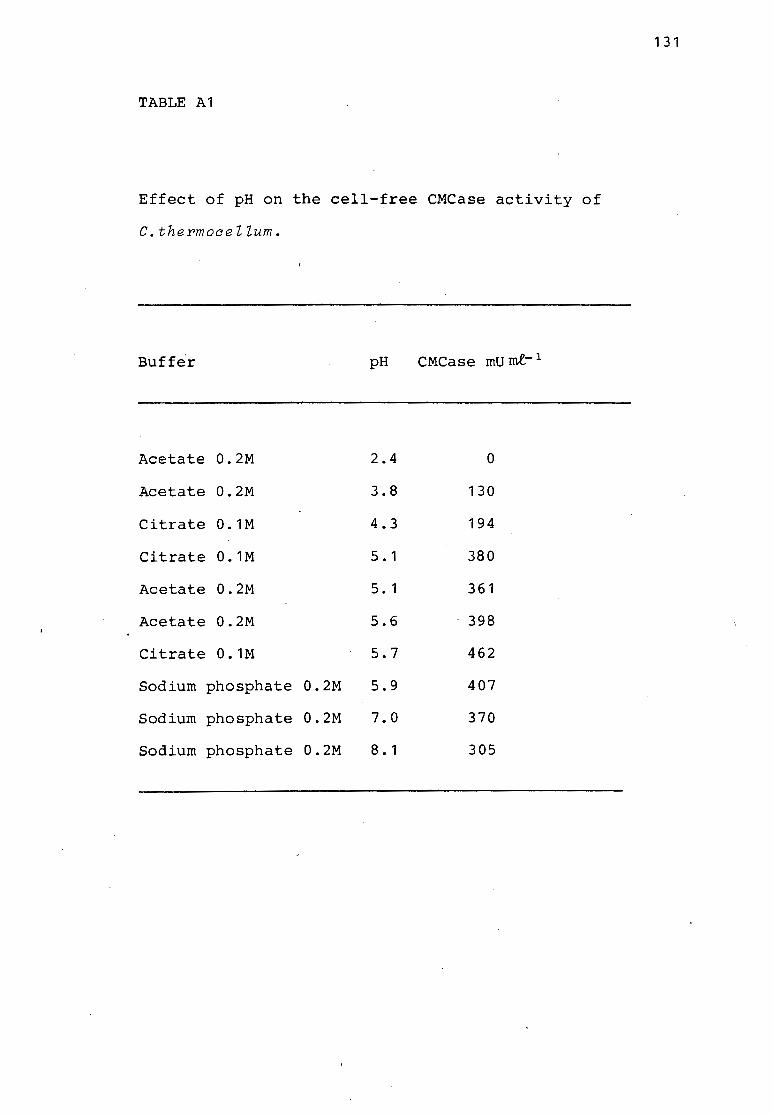
TABLE A1
Effect of pH on the cell-free CMCase activity of
C. the rmoce Z Zurn.
Buffer pH CMCase mU mt- 1
Acetate 0. 2M 2.4 0
Acetate 0. 2M 3.8 130
Citrate 0. 1M 4.3 194
Citrate 0 .1M 5. 1 380
Acetate 0.2M 5. 1 361
Acetate 0.2M 5.6 398
Citrate 0 .1M 5.7 462
Sodium phosphate 0.2M 5.9 407
Sodium phosphate 0.2M 7.0 370
Sodium phosphate 0.2M 8. 1 305
131
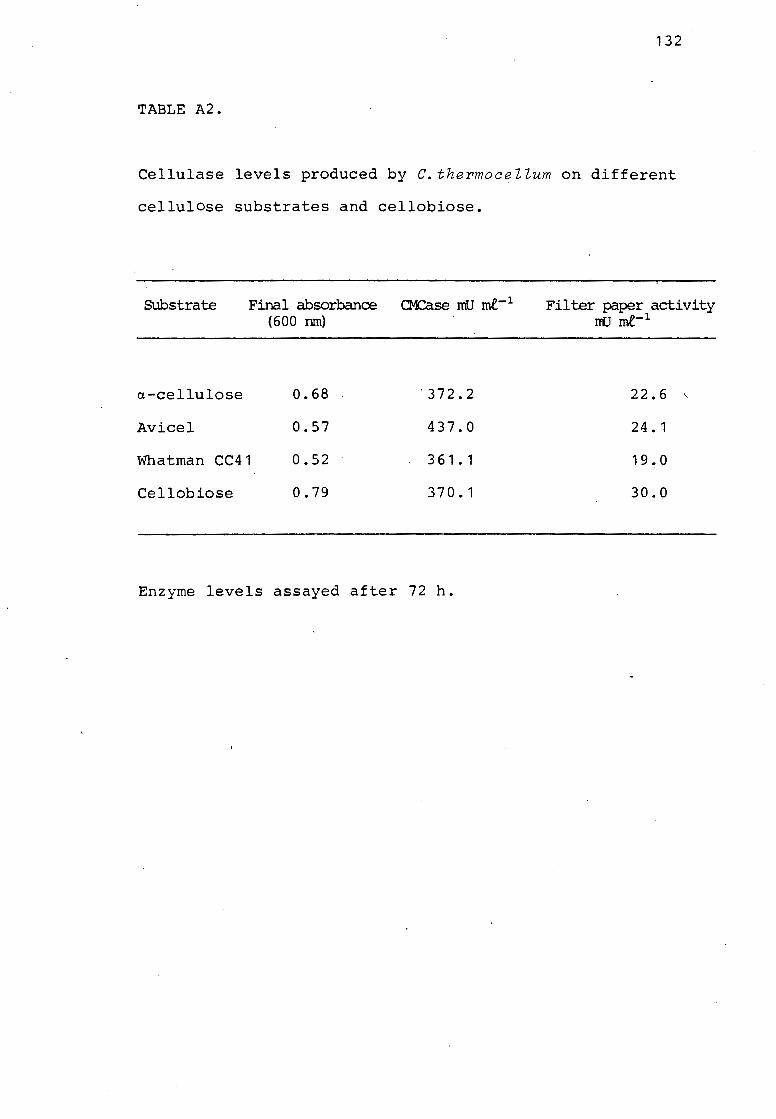
132
TABLE A2.
Cellulase levels produced by C.thermocellum on different
cellulose substrates and cellobiose.
Substrate Final absorbance CM:ase rnI.J me-1 (600 nm)
a-cellulose 0.68 372.2
Avicel 0.57 437.0
Whatman CC41 0.52 361.1
Cellobiose 0.79 370.1
Enzyme levels assayed after 72 h.
Filter paper activity mJ me-1
2 2. 6 '
24.1
19.0
30.0
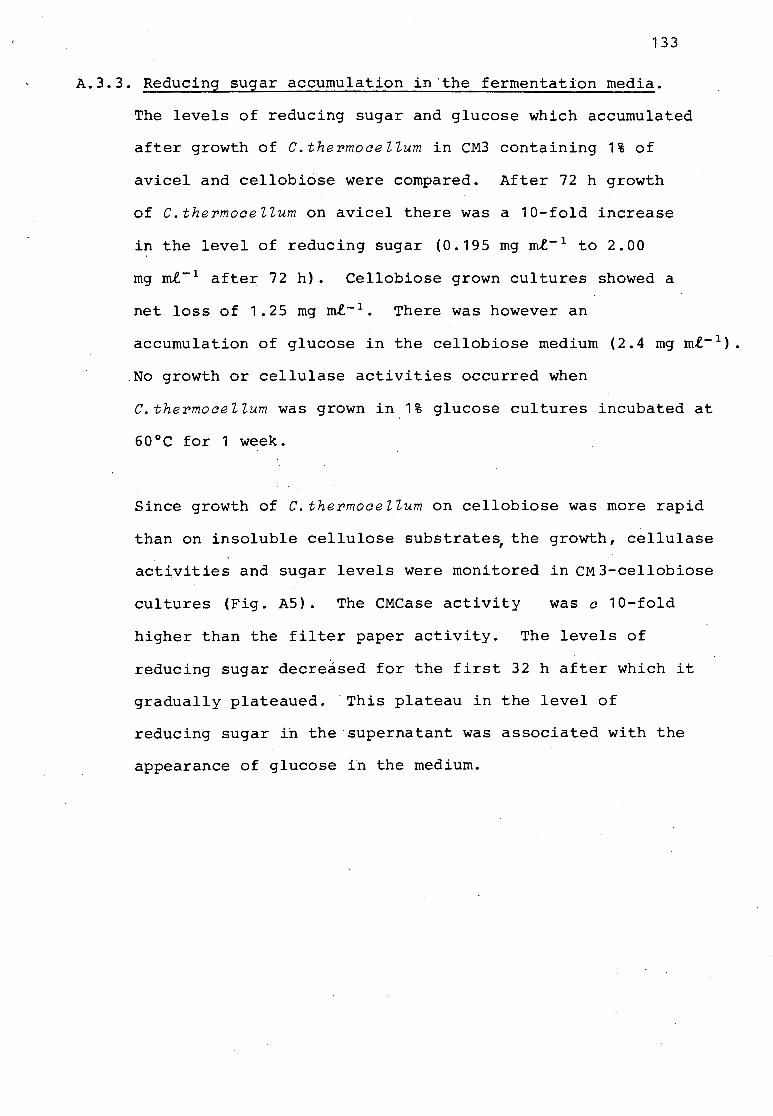
133
A.3.3. Reducing sugar accumulation in the fermentation media.
The levels of reducing sugar and glucose which accumulated
after growth of C.thermoaellum in CM3 containing 1% of
avicel and cellobiose were compared. After 72 h growth
of C.thermoaellum on avicel there was a 10-fold increase
in the level of reducing sugar (0.195 mg ml- 1 to 2.00
mg rnl- 1 after 72 h). Cellobiose grown cultures showed a
net loss of 1.25 mg rnl- 1• There was however an
accumulation of glucose in the cellobiose medium (2.4 mg ml- 1).
No growth or cellulase activities occurred when
C.thermoaellum was grown in 1% glucose cultures incubated at
60°C for 1 week.
Since growth of C.thermoaellum on cellobiose was more rapid
than on insoluble cellulose substrate~ the growth, cellulase
activities and sugar levels were monitored in CM3-cellobiose
cultures (Fig. AS). The CMCase activity was c 10-fold
higher than the filter paper activity. The levels of
reducing sugar decre~sed for the first 32 h after which it
gradually plateaued. -This plateau in the level of
reducing sugar ih the supernatant was associated with the
appearance of glucose in the medium.
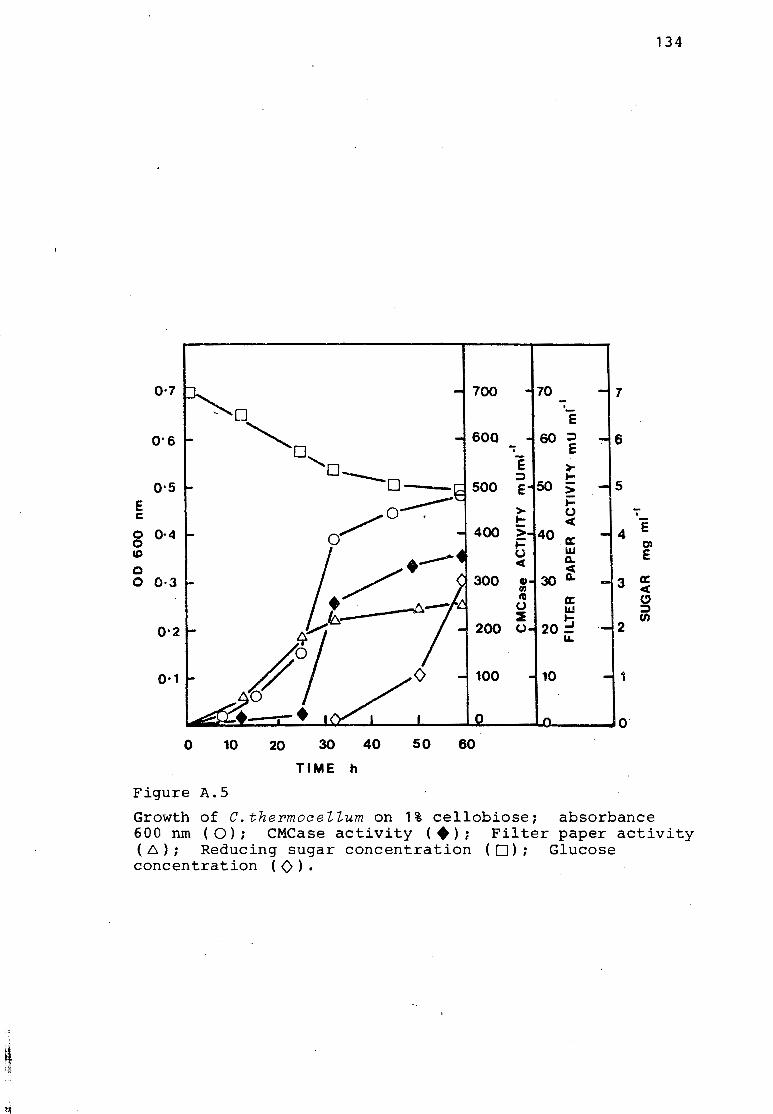
134
0·7 h 700 70 -t 7
~D ·-E 0'6 t- ~o 600 60 ::::> -16
'": E
'o e > ---0 ::::> ....
-15 o·s 500 E 50 > E ----- j:: c /0. > 0 + '~ t: < 0 0·4 400 > 40. a: 0 a
~ co L.LI I .- < Q. c < 0 0·3 / 300
., 30 Q.
J: a:
UJ < .,, a: CJ ·--------6--- 0 11..1 ::i
r/6: 200 ~ .... UJ
0•2 t- (,) 20 ::::!
"" 0·1 ... /'l A ~100 -110 -I 1
~o .... • HZ:: I I Is.! 10 ,0.
0 10 20 30 40 so 60
TIME h
Figure A.5
Growth of C.thermocellum on 1% cellobiose; absorbance 600 nm (0); CMCase activity (.) i Filter paper activity ( 6. ) ; Reducing sugar concentration ( 0) ; Glucose concentration ( 0) .
~l ~ ~~
'i
135
A.3.4. Discussion.
C.thermocellum was successfully grown at 60°C and methods
for the maintenance of the strain using meat broth medium
have been developed.
Biotin had to be added to the CM 3 medium developed by
~ Weimer and Zeikus (1977) before successful serial transfer
could be accomplished. The biotin requirement was necessary
for growth in cellobiose and cellulose media. Growth
beyond a single transfer could not be obtained if biotin was
omitted from the medium. Similar .results by Johnson et al.,
(1981) found that biotin and vitamin BG were required for
growth of C.thermocellum in their chemically defined minimal
medium.
The cellulolytic and physiological properties of C. therrnoceUum
tested were similar to those found by other workers
(Ng et al., 1977; Gordon et al., 1979; Johnson et al., 1981;
Ng et al., 1981). ~rowth of C.thermocellum on cellulose and
cellobiose resulted in the production of extracellular
cellulase, which was thermally stable at 70°C. The highest
cellulase yields were obtained on avicel. The temperature
and pH optima for CMCase activity were 70°C ,and 5.7
respectively.
The accumulation of reducing sugar during the fermentation of
cellulose was detected. This was not a new observation as in
1913 Pringheim working with enriched cultures demonstrated
the accumulation of reducing sugar in a fermentation which
consisted of glucose and cellobiose. This accumulation of
136
reducing sugar was also noted by Woodman and Stewart (1928),
Peterson et al., (1930) and Tetrault (1930). The
accumulation of reducing sugar, mainly glucose and cellobiose,
in pure cultures of C. thermoce l lum was also reported by G:>rdon
et al. (1979). This accumulation of glucose and cellobiose
also occurred in the fermentation of cellulose by a cellulolytic
member .of the Bacteroidaceae family, isolated from sewage
sludge (Saddler and Khan, 1979).
C.thermocellum accumulated glucose when grown on both
cellulose and cellobiose. The accumulation of glucose in
cellobiose cultures has not been reported previously. There
have been conflicting reports on the ability of C.thermocellum
to utilise glucose as the sole carbon source (see
introduction). Gomez and Hernadez (1980) have shown that
C.thermocellum is able to utilise glucose as the sole carbon
source after an extended lag phase (12 to 30 h). We have
been unable to repeat these findings. No extracellular
cellobiase activity has been found in C.thermocellum
fermentations (Reese, 1956). This suggests that cellodextrins
are readily transported into cells before being degraded by
the cellulases. This proposal is supported by the
demonstration of intracellular cellodextrin phosphorylase
in C.thermocellum by Alexander (1960, 1972a, 1972b). The
cellobiase activity has been purified from the "periplasmic
space" of C. thermocellum (Ait et al., 1979). Thus, the
accumulation of glucose during growth was not likely to be
due to extracellular conversion of cellobiose to glucose.
This was not tested and the possibility of membrane bound
activity should be taken into consideration. The accumulation
of glucose in the medium could be a means of accommodating
137
accompanying symbiotic bacteria (Imsenecki, 1940; Enebo, 1951).
There is a possibility that if this glucose is due to
efflux from C.thermoceZZum it may be advantageous energetically
to C.thermoceZlum, as in the efflux of S-galactosidase
products from Escherichia coli {Huber et al., 1976). They
suggest that the efflux of glucose which is excreted by
_proton linked permeases (Henderson et aZ., 1977) drives the
uptake of lactose which is energised by other transport
systems acting in the opposite direction (Flagg and Wilson, 1978)
In E.coli the glucose could re-enter the cell and become
phosphorylated by the phosphoenolpyruvate-phosphotransf erase
system (Fraenkel et al., 1964). This system could apply to
C.thermocelZum although there is no direct evidence, except
the accumulation of glucose.
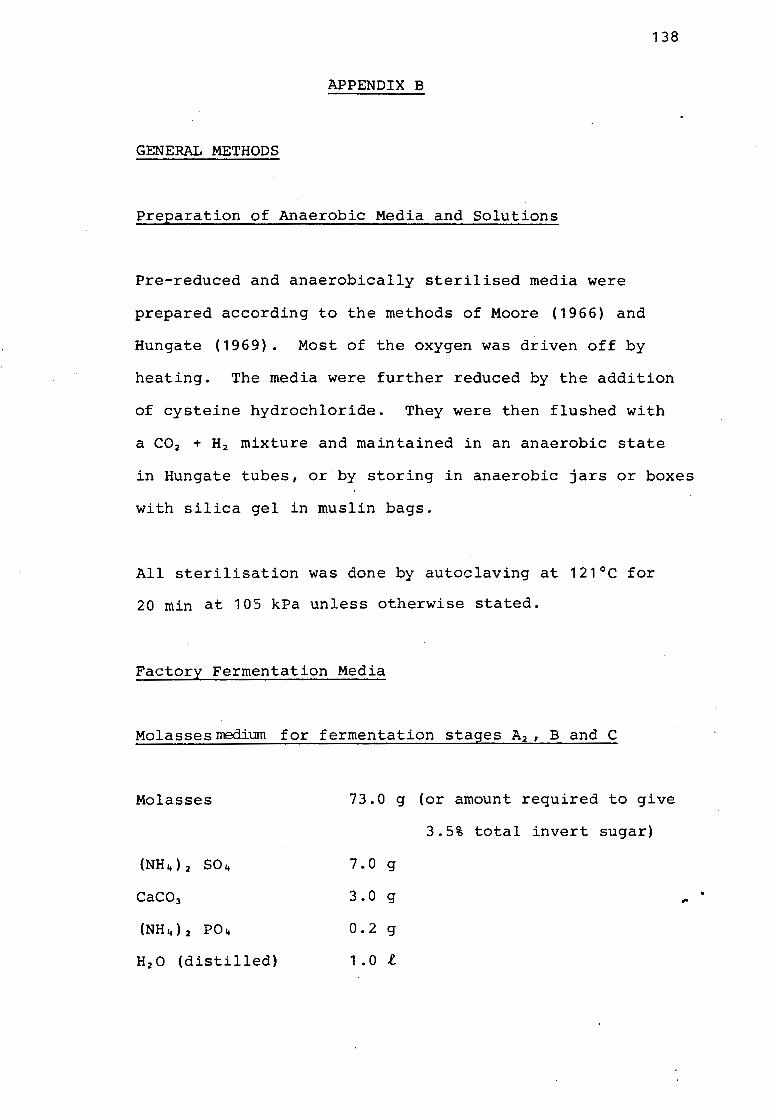
138
APPENDIX B
GENERAL METHODS
Preparation of Anaerobic Media and Solutions
Pre-reduced and anaerobically sterilised media were
prepared according to the methods of Moore (1966) and
Hungate (1969). Most of the oxygen was driven off by
heating. The media were further reduced by the addition
of cysteine hydrochloride. They were then flushed with
a C0 2 + H2 mixture and maintained in an anaerobic state
in Hungate tubes, or by storing in anaerobic jars or boxes
with silica gel in muslin bags.
All sterilisation was done by autoclaving at 121°C for
20 min at 105 kPa unless otherwise stated.
Factory Fermentation Media
Molasses medium for fermentation stages A2 , B and C
Molasses
(NH4)2 S04
CaC03
(NH4)2 P04
H2 0 (distilled)
73.0 g (or amount required to give
3.5% total invert sugar)
7.0 g
3.0 g
0.2 g
1. 0 .e.
,. .•
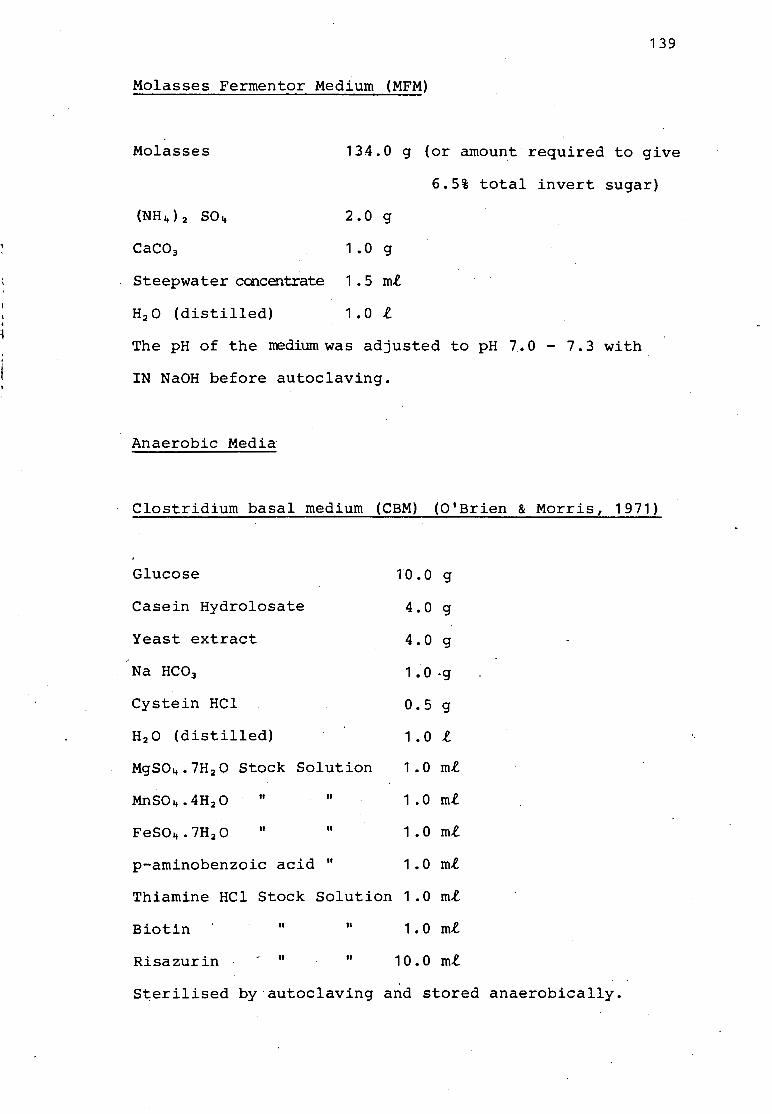
139
Molasses Fermentor Medium (MFM)
Molasses 134.0 g (or amount required to give
6.5% total invert sugar)
(NH1+) 2 S04
CaC03
Steepwa ter concentrate
H2 0 (distilled)
2.0 g
1. 0 g
1 • 5 ml
1. 0 l
The pH of the medium was adjusted to pH 7. 0 - 7. 3 with
IN NaOH before autoclaving.
Anaerobic Media
Clostridium basal medium (CBM) (O'Brien & Morris, 1971)
Glucose
Casein Hydrolosate
Yeast extract
Na HC03
Cystein HCl
H2 0 (distilled)
MgS04 .7H 2 0 Stock Solution
MnS04. 4H 2 0
FeS04.7H 2 0
II
II
II
II
p-aminobenzoic acid 11
10.0 g
4.0 g
4.0 g
1 • 0 -g
0.5 g
1. 0 l
1 • 0 ml
1 • 0 ml
1 • O ml
1 • 0 ml
Thiamine HCl Stock Solution 1 .0 ml
Biotin 11 11 1 . 0 ml
Risazurin 11 11 10.0 ml
Sterilised by autoclaving and stored anaerobically.
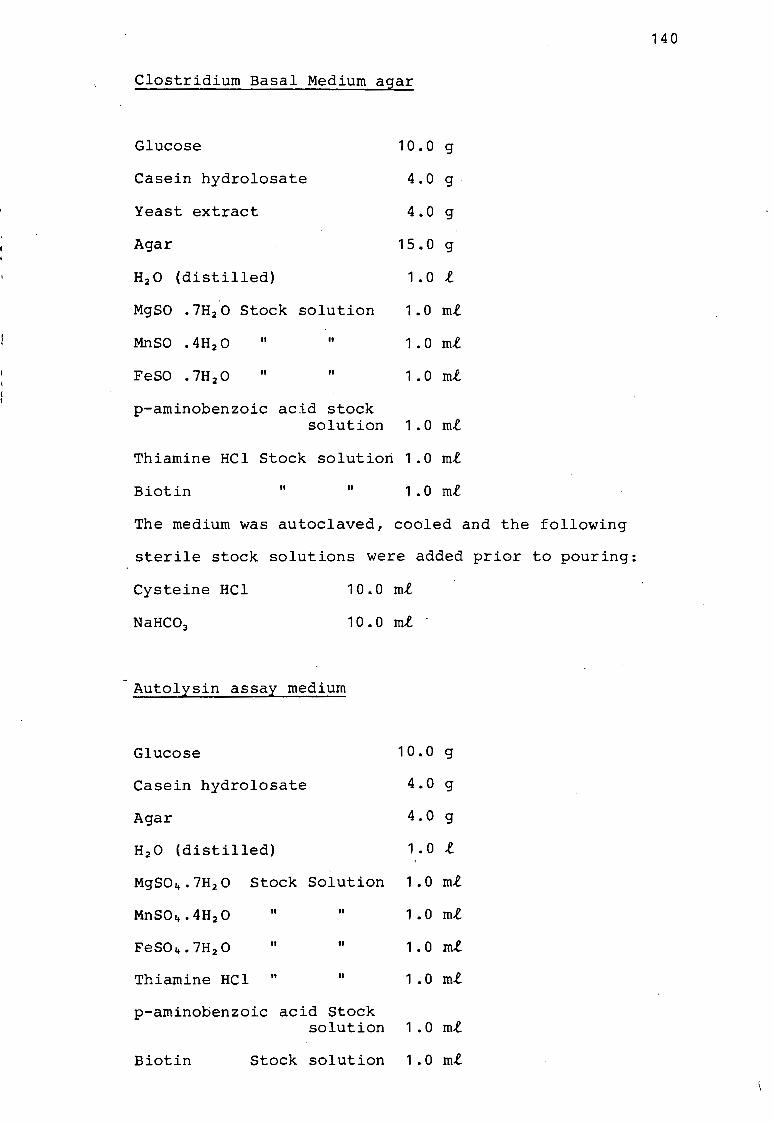
Clostridium Basal Medium agar
Glucose 10.0 g
Casein hydrolosate 4.0 g
Yeast extract 4.0 g
Agar 15.0 g
H2 0 (distilled) 1.0 l
MgSO .7H2 0 Stock solution 1.0 ml
MnSO .4H 2 0 II II 1 • O ml
II II 1 • 0 ml
p-aminobenzoic acid stock solution 1 • 0 m.t
Thiamine HCl Stock solution 1 .0 ml
Biotin II II 1 • 0 ml
The medium was autoclaved,_ cooled and the following
sterile stock solution~ were added prior to pouring:
Cysteine HCl 10.0 ml
10.0 ml
Autolysin assay medium
Glucose
Casein hydrolosate
Agar
H2 0 (distilled)
10.0 g
4.0 g
4.0 g
1. 0 l
MgS0 4 .7H2 0 Stock Solution 1.0 ml
II II 1 • 0 ml
FeS04.7H 2 0 II II 1. O ml
Thiamine HCl II II 1 .O ml
p-aminobenzoic acid Stock solution 1.0 ml
Biotin Stock solution 1.0 ml
140
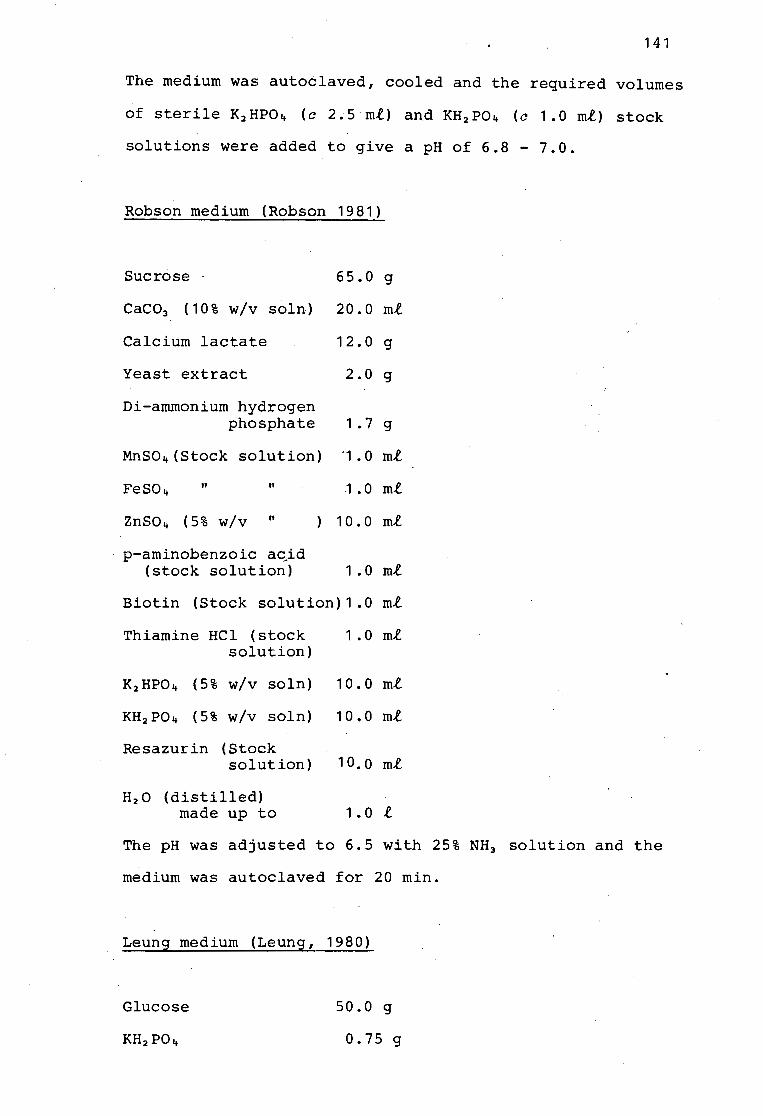
141
The medium was autoclaved, cooled and the required volumes
of sterile K2 HP04 (a 2.5 ml) and KH 2 P04 (a 1.0 ml) stock
solutions were added to give a pH of 6.8 - 7.0.
Robson medium (Robson 1981)
Sucrose 65.0 g
CaC03 ( 10 % w/v soln) 20.0 ml
Calcium lactate 12.0 g
Yeast extract 2.0 g
Di-ammonium hydrogen phosphate 1 • 7 g
MnS04(Stock solution) '1. 0 ml
FeS04 II II 1 . 0 ml
ZnS04 (5% w/v II 10.0 ml
p-aminobenzoic a~id (stock solution) 1 . 0 ml
Biotin (Stock solution)1 .o ml
Thiamine HCl (stock 1 • 0 ml solution)
K2 HP04 (5% w/v soln) 10.0 ml
KH 2 P04 (5% w/v soln) 10.0 ml
Resazurin (Stock solution) 1o.0 ml
H2 0 (distilled) made up to 1.0 l
The pH was adjusted to 6.5 with 25%
medium was autoclaved for 20 min.
Leung medium (Leung, 1980)
Glucose 50.0 g
0.75 g
NH 3 solution and the

K2 HPO 0.75 g
Mg SO 0.20 g
NaCl 1.00 g
Asparagine . H2 0 0.50 g
Cysteine hydrochloride 0.50 g
FeS04.7H 2 0 0.01 g
MnS04.3H20 0.01 g
Yeast extract 15.00 g
Resazurin (stock solution) 1. 0 ml
H20 (distilled) 1. 0 l
The pH was adjusted to 6.5 with 1N NaOH
autoclaving.
Chopped beef meat carbohydrate medium
(C.thermocellum stock cultures)
Ground beef (fat free)
H2 0 (distilled)
1N NaOH
500.0 g
1.0 l
25.0 ml
prior to
Lean beef or horse meat was used. Fat and connective
142
tissue were removed before grinding. Meat was mixed with
water and NaOH and brought to the boil, stirring. It was
cooled to room temperature, the fat skimmed off the surface
and filtered, both meat particles and filtrate were
retained. Sufficient distilled water was added to filtrate I
to restore original 1 l volume. To this filtrate was added:
Peptone
Yeast extract
Glucose
30.0 g
5.0 g
5.0 g
4.0 g
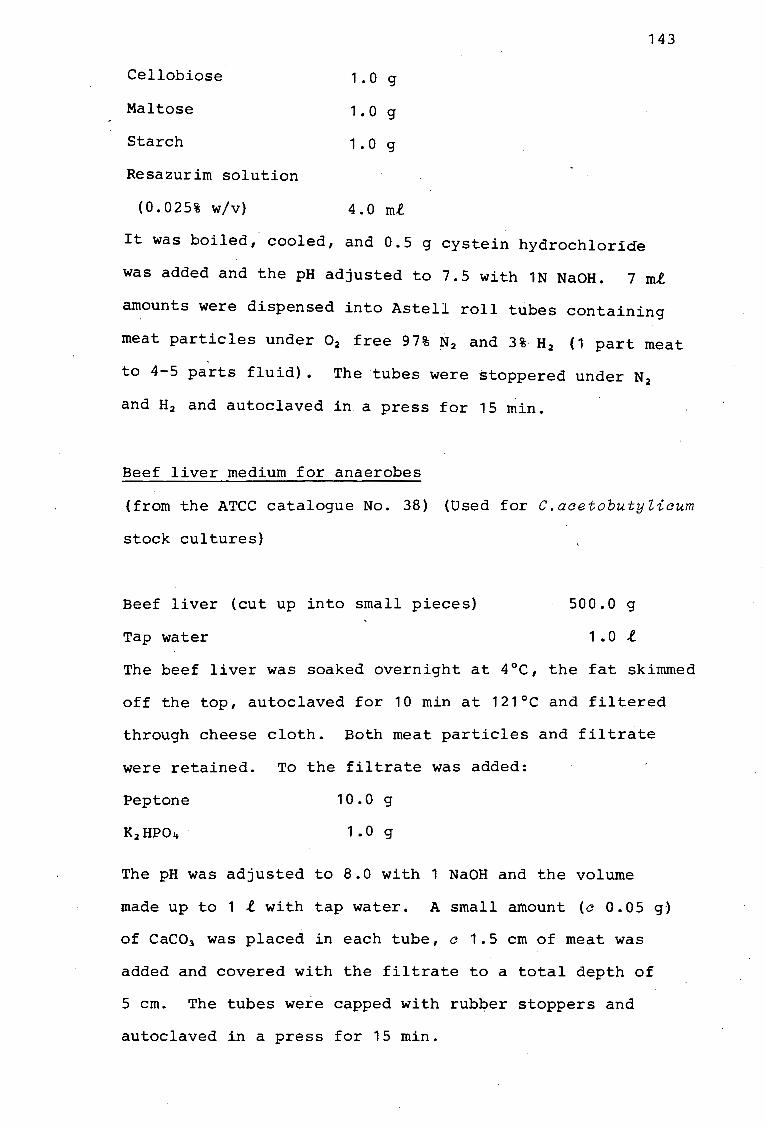
Cellobiose
Maltose
Starch
Resazurim solution
(0.025% w/v)
1. 0 g
1. 0 g
1. 0 g
4. 0 ml
143
It was boiled, cooled, and 0.5 g cystein hydrochloride
was added and the pH adjusted to 7.5 with 1N NaOH. 7 ml
amounts were dispensed into Astell roll tubes containing
meat particles under 0 2 free 97% N2 and 3% H2 (1 part meat '
to 4-5 parts fluid) • The tubes were stoppered under N2
and H2 and autoclaved in a press for 15 min.
Beef liver medium for anaerobes
(from the ATCC catalogue No. 38) (Used for C.acetobutyZicum
stock cultures)
Beef liver (cut up into small pieces)
Tap water
500.0 g
1 .o l
The beef liver was soaked overnight at 4°C, the fat skimmed
off the top, autoclaved for 10 min at 121°C and filtered
through cheese cloth. Both meat particles and filtrate
were retained. To the filtrate was added:
Peptone 10.0 g
K 2 HP04 1.0 g
The pH was adjusted to 8.0 with 1 NaOH and the volume
made up to 1 £.with tap water. A small arnount (a 0.05 g)
of CaC0 3 was placed in each tube, c 1.5 cm of meat was
added and covered with the filtrate to a total depth of
5 cm. The tubes were capped with rubber stoppers and
autoclaved in a press for 15 min.
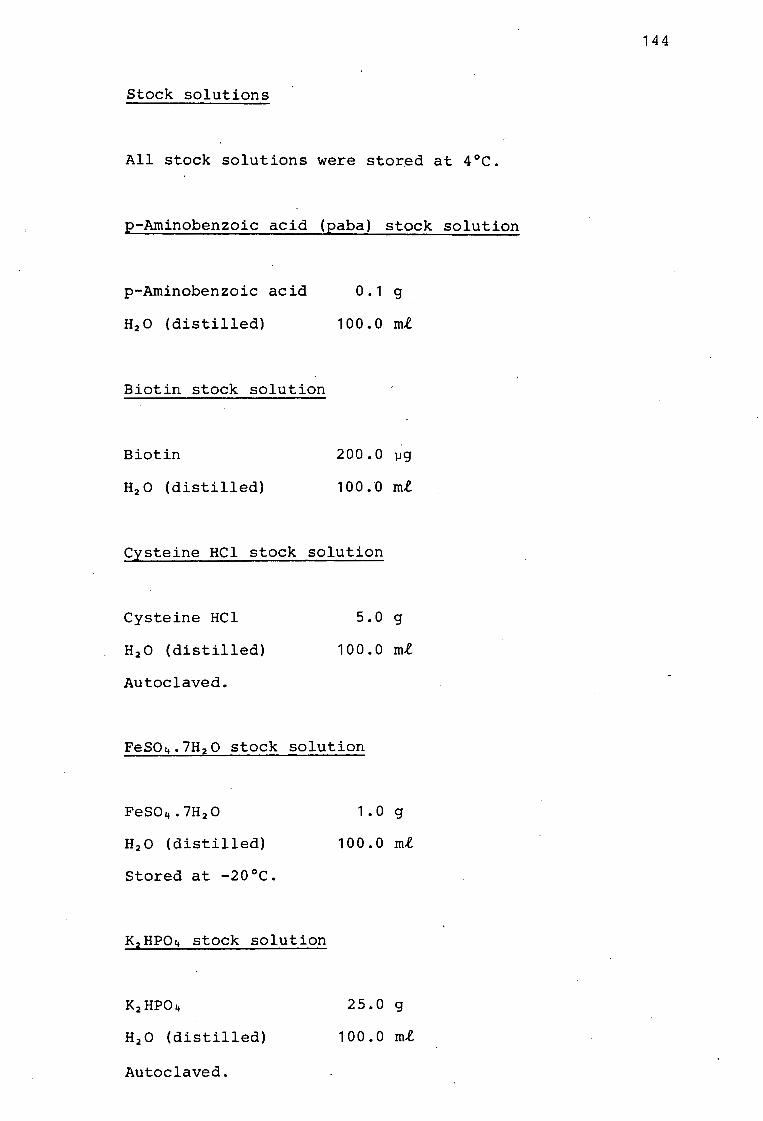
Stock solutions
All stock solutions were stored at 4°C.
p-Arninobenzoic acid (paba) stock solution
p-Arninobenzoic acid
H2 0 (distilled)
Biotin stock solution
Biotin
H2 0 (distilled)
0.1 g
100.0 ml
200.0 µg
100.0 ml
Cysteine HCl stock solution
Cysteine HCl
H2 0 (distilled)
Autoclaved.
FeS04.7H 2 0
H2 0 (distilled)
Stored at -20°C.
K2 HP04 stock solution
K2 HP04
H2 0 (distilled)
Autoclaved.
5.0 g
100.0 ml
1. 0 g
100.0 ml
25.0 g
100.0 ml
144
KH 2 P_04
H2 0 (distilled)
Autoclaved.
12.5 g
100.0 m£
Resazurin stock solution
Resazurin
H2 0 (distilled)
20. 0 mg
100.0 m£
Sodium bicarbonate stock solution
NaHC0 3
H2 0 (distilled)
Autoclaved.
10.0 g
100.0 m£
Thiamine hydrochloride stock solution
Thiamine HCl
H2 0 (distilled)
0. 1 g
100.0 m£
REAGENTS FOR AMYLASE ASSAY
1% Starch solution
145
1 g of soluble starch .(Merck) was weighed into a 100 m£
Erlenmeyer flask, and 20 m£ of distilled H2 0 was added
with shaking. Then 5 ml of 2N NaOH was added to obtain
146
a completely dispersed solution. The mixture was heated
for 3 min in boiling water, 25 ml of distilled H2 0
added and the solution was cooled under running tap water.
5 ml of 2N CH 3 COOH (acetic acid) was added to neutralise
the mixture, and the pH was adjusted to 5.5 by addition
of· 0.1N CH 3 COOH or 1N CH 3 COOH. It was made up to 100 ml
with distilled H2 0. This starch solution contained 0.1N
CH 3 COOH - CH 3 COONa buffer.
Iodine solution
I2
KI
H2 0 (distilled)
0.5 g
5.0 g
100.0 ml
The concentrated .iodine solution was stored in a dark bottle
at 4°C. A 1/100 dilution was made up of the concentrated
stock when required.
Calibration mixture for GC analysis
The solvents were added separately into a 100 ml volumetric
flask containing 20 ml of distilled H2 0 and weighed to
4 decimal places. The stock solution contained the
following solvents:
Acetone
Ethanol
Butanol
Propanol
7.8202
0.7360
7.9443
.7.8274
gl-1
g-.e.-1
g.e.-1
g.e.-1
The calibration mixture was stored in sealed containers.
at 4°C.
BIBLIOGRAPHY
ABOU-ZEID, A.A., M. FOUAD, and M. YASSEIN. 1980. Microbiological Production of Acetone-Butanol by Clostridium acetobutylicum. Zbl. Bakt. Abt. II. 133: 125-134.
AHRONOWITZ, Y. and G. COHEN. 1981. Production of Pharmaceuticals. 140-152.
The Microbial Sci. Arn. 245:
AIT, N., N. CREUZET, and P. FARGET. 1979. Partial Purification of Cellulase from Clostridium thermocellum. J. Gen. Microbiol. 113: 399-402.
ALEXANDER, J.K. 1960. Characterization of Cellobiose Phosphorylase. J. Bacteriol. 81: 903-905.
147
ALEXANDER, J.K. 1972a. Cellobiose phosphorylase from Clostridium thermocellum. In Methods in Enzymology, p. 944-948. V. Ginsburg, ed., Vol. 28. New York, Academic Press.
ALEXANDER, J.K. 1972b. Cellodextrin phosphorylase from Clostridium thermocellum. In Methods in Enzymology, p. 948-953. V. Ginsburg, ed., Vol. 28. New York, Academic Press.
ALLCOCK, E.R. 1981. G~netic studies on Clostridium acetobutylicum. Ph.D. thesis. University of Cape Town, Rondebosch.
ALLCOCKi E.R., S.J. REIO, D.T. JONES, and D.R. WOODS. 1981a. Protoplast formation and regeneration in Clostridium acetobutylicum. Appl-Environ. Microbiol. (In press).
ALLCOCK, E.R., S.J. REID, D.T. JONES, and D.R. WOODS. 1981b. Autolytic activity and an autolytic-deficient mutant of Clostridium acetobutylicum. Appl. Environ. Microbiol. 42: 929-935.
ALLCOCK, E.R. and D.R. WOODS. 1981. Carboxymethyl cellulase and cellobiase production by Clostridium acetobutylicum in an industrial fermentation medium. Appl. Environ. Microbiol. 41: 539-541.
ARZBERGER, C.F., W.H. PETERSON, and E.B. FRED. Factors that influence acetone production Bacillus aaetoethyliaum. J. Biol. Chem. 465-479.
1920. by 44:
148
BALCH, W.E., and R.S. WOLFE. 1976. New approach to the cultivation of Methanogenic Bacteria: 2-mercaptoethanesulfonic acid (HS-CoM)-dependent growth of Methonobaaterium ruminantium in a pressurized atmosphere. Appl. Environ. Microbiol. 32: 781-792.
BARBER, J.M. 1977. Studies on the fermentation of molasses by Clostridium aaetobutyliaum. M.Sc. thesis. Rhodes University, Grahamstown, South Africa.
BARBER, J.M., F.T. ROBB, J.R. WEBSTER, and D.R. WOODS. 1979. Bacteriocin production by Clostridium aaetobutyliaum in an industrial fermentation process. Appl. Environ. Microbiol. 37: 433-437.
BEESCH, S.C. Sugars.
1952. Acetone-Butanol Fermentation of Ind. Eng. Chem. i_!: 1677-1682.
BEESCH,. s.c. 1953. A microbiological progress report. Acetone-Butanol fermentation of starches. ~· Microbiol. 1: 85-95.
BRYANT, M.P. 1972. Commentary on the Hungate technique for culture of anaerobic bacteria. Amer. J. Clin. Nutr. 25: 1324-1328.
BUCHANAN, R.E., and N.E. GIBBONS (ed). 1974. Bergey's Manual of Determinative Bacteriology, 8th ed. The Williams and Wilkins Co., Baltimore.
CAMPBELL, L.L. Jr. 1957. Bacterial Spore Germination -definitions and methods of study. p. 33-41. In Spores,H.O. Halverson (ed). American Institute of Biological Sciences, Washington, D.C.
COMPERE, A.L., and W.L. GRIFFITH. 1979. Evaluation of substrates for Butanol Production. Developments In Industrial Microbiology. Proceedings of the 35th Gen. Meeting of the Society of Industrial Microbiology. Aug. 1978. Ch. 48, Vol. 20, p. 509-517. Arlington, Virginia.
149
COONEY, C.L., and R.A. ACKERMAN. 1975. Thermophillic anaerobe digestion of cellulosic waste •. Europ. J. Appl. Microbial. 2: 65-72.
COONEY, C.L., and D.L. WISE. 1975. Thermophillic anaerobic digestion of solid waste for fuel and gas production. Biotechnol. Bioeng. 17: 1119-1135.
COWLING, E.B. 1975. Physical and chemical constraints in the hydrolysis of cellulose and Lignocellulosic materials. In Cellulose as a Chemical and Energy Resource. p. 16 3-181 . C.R. Wilke, (ed.) Biotechnol. Bioeng. Symp. 5. Interscience Publication. New York.
COYETTE, J., and J.M. GHUYSEN. 1970. Wall autolysin of Lactobacillus acidophilus strain 63. AM Gasser. Biochemistry!= .2952-2956 •
•
COYETTE, J., and G.D. SHOCKMAN. 1973. Some properties of ·the autolytic N-acetylmuramidase of Lactobacillus acidophilus. J. Bacterial. 114: 34-41.
CRUICKSHANK, R., J.P. DUGUID, and R.H.A. SWAIN (ed). 1969. In Medical Microbiology. A Guide to the laboratory _d_i_a_.g~n_o_s_1_· s.,.-a_n_d __ c_o_n_t_r,_o_l.,...,_o---=-f_I_n_f...,e:-cc,_..t...,.i_o_n • 11 th ed • Exs. Livingstone Limited. Edinburgh and London.
CUMMINS, S.C., and J.L. JOHNSON. 1971. Taxonomy of the Clostridia: Wall composition and DNA homologies in Clostridium butyricum and other butyric-producing Clostridia. J. Gen. Microbial. 67: 33-46.
CURRAN, H.R. and F.R. EVANS. 1945. Heat activation inducing germination in the spores of thermotolerant and thermophilic aerobic bacteria. J. Bacterial. 49: 335-346.
DANIELS, L., and J.G. ZEIKUS. 1975. Improved culture flask for obligate anaerobes. Appl. Environ. Microbial. 29: 710.
DARVILL, A.G., M.A. HALL, J •. P. The intracellular reserve Clostridium pasteurianum. 947-953.
FISH, and J.G. MORRIS. polysaccharide of
Can. J. Microbial. 23:
•
DAVIES, R., and M. STEPHENSON. 19 41 . Studies on the acetone-butyl alcohol fermentation. I. Nutritional and other factors involved in the preparation of active suspensions of Clostricium aaetobutylicum (Weizmann). Biochern. J. 35: 1320-1331.
150
DEKKER, D.K. 1957. The Composition of South African Final Molasses. South African Sugar Technologists' Association. 31st Annual Congress, Durban. 25-29 March 1957. Proceedings.
DEMAIN., A.L., and J.F. NEWKIRK. 1960. Dissociation of spore germination from outgrowth by use of auxotrophic mutants of Bacillus subtilis. J. Bacteriol. 79: 783-786.
DOELLE, H.W. (ed) p. 574-667.
1975. Bacterial Metabolism. 2nd ed. Academic Press, New York.
DUNNING, J.W., and E.C. LATHROP. of Agricultural Residues.
1945. The Saccharification Ind. Eng. Chern. 37: 24-29.
DOUGLAS, J. (ed) 1975. Bacteriophages. Chapman and Hall, London.
DYR. J., J. PROTIVA, AND R. PROWS. cultivation of Microorganisms. 210.
1958. Continuous (Prague symposium)
EDWARDS, T.H., and B.C. MC BRIDE. 1975. New method for the Isolation and Identification of Methanogenic Bacteria. Appl. Microbiol. ~: 540-545.
ENEBO, L. 1949. Symbiosis in Thermophilic Cellulose Fermentation. Nature, 163: 805-807.
ENEBO, L. 1951. On Three Bacteria Connected with Therrnophilic Cellulose Fermentation. Physiol. Plant. 4: 652-666.
EVELEIGH, D.E., and B.S. MONTENECOURT. yields of extracellular enzymes. 25: 58-70.
1979. Increasing Adv. Appl. Microbiol.
FINN, R.K., and J.E. NOWREY. 1959. A note on the stibility of Clostridia when held in continuous culture. Appl. Microbiol. 7: 29-32.
FITZ-JAMES, P., and E. YOUNG. 1969. Morphology of sporulation. In The Bacterial Spore, p. 39-72, G.W. Gould and A. Hurst (ed.) Academic Press, London.
151
FLAGG, J.L.,and T.H. WILSON. 1978. A novel type of coupling between proline and galactoside transport in Esaheriahia aoli. Membr. Biochem. 1: 61-72.
FRAENKEL, D.G., F.FALCOZ-KELLY, and B.L. HORECKER. 1964. The utilization of glucose-6-phosphate by glucokinaseless and wild type strains of Esaheriahia aoli. Proc. Natl. Acad. Sci. U.S.A. 52: 1207-1223.
FRED, E.B., W.H. PETERSON, and M. MULVANIA. 1926. The effect of Lactic Acid Bacteria on the AcetoneBu tyl Alcohol Fermentation. J. Bacteriol. 11: 323-343.
GABRIEL, C .• L. 1928. Butanol fermentation process. Ind. Eng. Chem. 20: 1063-1067.
GARCIA-MARTINEZ, D.V., A. SHINMYO, A. MADIA, and A.L. DEMAIN. 1980. Studies on cellulase production by Clostridium thermoaellum. Eur. J. Appl. Microbiol. Biotechnol. 9: 189-197.
GHUYSEN, J.M., and G.D. peptidoglycan. In Vol. I. p.37-130. New York.
SHOCKMAN. 1973. Biosynthesis of Bacterial membranes and walls, L. Leive (ed.) Marcel Dekker,
GOMEZ, R.F. 1980. Prospect of conversion of cellulosic biomass to ethanol by thermophilic clostridia. Progress Report submitted to the u.s~ Department of Energy under Contract No. EG-77-5-02-4198. (No.3926).
GOMEZ, R.F., and P. HERNADEZ. 1980. Glucose utilization by Clostridium thermoaellum. Proc. 6th International Fermentation Symposium.
GORDON, J., M. JIMINEZ, C.L. COONEY, and D.I.C. WANG. 1979. Sugar accumulation during enzyme hydrolysis and fermentation of Cellulose. Biochemical Engineering: Renewable Resources. AichE Symposium Series. 74: 91-97.

152
GOTTSCHALK, G. 1978. In Bacterial Metabolism. New York, Springer-Verlag, New York Inc.
GOVLD, G.W. 1971. Methods for Studying Bacterial Spores. Ch.VI, 326-381. In Methods in Microbiology Vol.GA. J.R. Norris, and D.W. Ribbons (ed). Academic Press. London and New York.
GRISHAM, C .M., and R.E. BARNETT. 1973. The role ·of lipid-. phase transitions in the regulation of the (sodium and
, potassium) adenosine triphosphate. Biochemistry. 12: 2635-2637.
GUNSALUS, I.e., and R.Y. STANIER (ed). 1960. In The Bacteria. Vol. I: p. 211-215. Academic Press, New York and London.
HALVORSON, H.O., J.C. VARY, and W. STEINBERG. 1966. Developmental changes during the formation and breaking of the dormant state in bacteria. In Annual Review of Microbiology, Vol. 20, 169-188. C.E. Clifton, s. Roffer and M.P. Starr (ed). Annual Reviews. Inc. Palo Alto, California, U.S.A.
HASTINGS, J.J.H. 1978. Acetone-Butyl Alcohol Fermentation. In Economic Microbiology, Vol. 2, p. 31-45. A.H. Rose (ed). Academic Press, N~w York and London.
HEBELER, B.H., and F.E. YOUNG. 1976. Mechanism of autolysis of Neisseria gonorrhoeae. J. Bacteriol. 126: 504-512.
HENDERSON, P.J.F., R.A. GIDDENS; and M.C. JONES-MORTIMER. 1977. Transport:of Galactose, Glucose and their molecular analogues by Escherichia coli K12. Biochem~ J. 162: 309-320.
HERRERO, A.A. and R.F. GOMEZ. 1980a. Inhibition of Clostridium thermocellum by fermentation products and related compounds. Proc. 6th International Fermentation
~-
HERRERO, A.A., and R.F. GOMEZ. 1980b. Development of Ethanor Tolerance in Clostridium thermocellum: Effect of growth temperature. Appl. Environ. Microbiol. 40: 571-577.
HIGGINS, M.L., H.M. POOLEY, and G.D. SHOCKMAN. 1970. Site of initiation of cellular autolysis in Streptococcus faecalis as seen by electron microscopy. J. Bacteriol. 103: 504-512.
153
HOBSON, P.N., and H. NASR. 1951. An amylopectin-type polysaccharide synthesised from sucrose by Clostridium butyriaum. J. Chem. Soc. 2: 1855-1857.
HOENIGER, J.F.M., and C.L. HEADLEY. 1968. Cytology of spore germination in Clostridium peatinovorum. J. Bacteriol. 96: 1835-1847.
HOLLAND, D.B., A.M. BARKER, and J. WOLFE. 1969. Factors eff~cting germination of clostridia. In Spores, Vol. IV. LL. Campbell (ed). American Society for Microbiology. Bethesda, Maryland.
HONGO, M., and K. NAGATA. 1958. Nippon Nogei Kagaku Kaishi 32, 585-594, 679-689, 758-770 and 855-858. Chem. Abstr. 55 19126 -(1961).
HSU, E., and E.S. ORDAL. 1970. Comparative metabolism of vegetative and sporulating cultures of Clostridium thermosaaaharolyfiaum. J. Bacteriol. 102: 369-376.
HUBBEL, W.L., J.C. METCALFE, S.M. METCALFE, and H.M. MC CONNEL. 1970. The interaction of small molecules with spin-labelled erythrocyte membranes. Biochem. Biophys. Acta. 219: 415-427.
HUBER, R.E., G. KURZ, and K. WALLENFELS .· 1976. A quantification of the factors which effect the hydrolase and transgolactosylase activities of S-galactosidase (Esaheriaia aoli) on lactose. Biochemistry, 15: 1994-2001.
HUI, F.K., and P.G. BARTON. 1973. Mesomorphic behaviour of some phospholipids with aliphatic alcohols and other nonionic substances. Biochim. Biophys. ACTA. 296: 510-517.
HUNGATE, R.E. 1966. The Rumen and its microbes. Academic Press, New York.
HUNGATE, R.E. 1969. A roll tube method for cultivation of strict anaerobes. In Methods in Microbiology, Vol. 3B, p. 117-132. J.R. Norris and D.W. Ribbons (ed). Academic Press, New York and London.
IMPACTS OF APPLIED GENETICS. 1981. In Impacts of Applied Genetics, Microorganisms, Plants and Animals. Congress of the United States, Office of Technology Assessment, U.S. Government Printing Office, Washington DC, 20402.
IMSENECKI, A.A. 1940. Microbiology of the Anaerobic Decomposition of Cellulose IV. Fermentation of C7llul~se ~y Thermophilic Bacteria (In Russian). Microbiolgiya, 9: 233-238.
INGRAM, L.O. -1976. Adaptation of membrane lipids to alcohols. J. Bacteriol. 125: 670-678.
154
JERUSALEMSKII, N.D. 1958. Continuous Culture of Microorganisms (Prague Symposium) 62.
JOHNSON, E.A., A. MADIA, and A.L. DEMAIN. 1981. Chemically defined minimal medium for growth of the anaerobic cellulolytic thermophile Clostridium thermocellum. Appl. Environ. Microbiol. 41: 1060-1062.
JONES, D.T., A. VAN DER WESTHUIZEN, S. LONG, E.R. ALLCOCK, S.J. REID, and D.R. WOODS. 1981. Solvent production and morphological changes in Clostridium acetobutylicum. Appl. Environ. Microbiol. (In.press)
KAUFMANN, W., and K. BAUER. 1958. Some studies on the mechanism of aerobic autolysis of Bacillus subtilis. J. Gen. Microbiol. 18: 11-12.
KAWATA, T., and K. TAKUMI. 1971. Autolytic enzyme system of Clostridium botulinum 1. Partial purification ~nd characterisation of an autlysin of Clostridium botulinum type A. Japan J. Microbiol. 15: 1-10.
KAY, D., and S.C. WARREN. 1968. Sporulation in Bacillus subtilis morphological changes. Biochem J. 109: 819-824.
KELLY, F.C. 1936. One thing leads to another. Houghton Mifflin Company, Boston.
KEYNAN, A., and H. HALVORSON. 1965. Transformation of a dormant spore into a vegetative cell. In Spores III, p. 174-179. L. Campbell, and H.O. Halvorson (ed). American Socie.ty for Microbiology. Ann Arbor, Mich.
LANGLYKKE, A.F., J.M. VAN LANEN, and D.R. FRASER. 1948. Butyl alcohol from Xylose Saccharif ication Liquors from Corn cobs. Ind. Eng. Chem. 40: 1716-1719.
155
LAMED, R.J., and J.G. ZEIKUS. 1980. Ethanol production by thermophilic bacteria: relationship between fermentation product yields of and catabolic enzyme activation in CZostridium thermoceZZum and Thermoanaerobium brockii. J. Bacteriol. 144: 569-578.
LEE, B.H., and H. BLACKBURN. 1975. Cellulase production by a thermophilic CZostridium species. Appl. Microbiol. 30: 346-353.
LEONARD,· R.H., W.H. PETERSON, and G.T. RITTER. 1947. Butanol-acetone fermentation of wood sugar. Ind. Eng. Chem. 39: 1443-1445.
LEUNG, J. 1980. Extractive Fermentation to produce inhibitory products: Acetone-Butanol Fermentation by CZostridium acetobutyZicum. Annual Progress Report for period July 1, 1979 through June 30, 1980. Department of Nutrition and Food Science. M.I.T. Cambridge.
LONG, S., D.T. JONES, and D.R. WOODS. 1981. The effect of Oxygen on Sporulation in CZostridium acetobutyZicum. (Submitted) .
LONZ, T.G., and A.R. MOROIRA. 1980. Economic Evaluation of the Acetone-Butanol Fermentation. Ind. Eng. Chem. Res. Div. 19: 478-483.
MACGILLIVRAY, A.W., and M. MATIC. 1970. Composition of South African Molasses. Proceedings of the South African Sugar Technologists' Association. p. 1-10.
MACKEY, B.M., and J.G. MORRIS. 1971. Ultrastructural changes during sporulation of CZostridium pasteurianum. J. Gen. Microbiol. 66: 1-13.
MANDELS, M., R. ANDREOTTI, and ·c. ROCHE. 1976. Measurement of Saccharifying cellulase. Biotechnol. Bioeng. Symp. ~: 21-33.
MANDELLS, M., L. HONTZ, and J. NYSTROM. 1974. Enzymatic Hydrolysis of Waste Cellulose. Biotech. Bioeng. 16: 1471-1478.
MANDELS, M., and J. WEBER. 1969. The production of Cellulases. In Cellulases and Their Application, R.F. Gould (ed), p. 391. Adv. Chem. Series, American Chemical Society Pub., Washington DC.
156
MANN, F.G. and B.C. SAUNDERS (ed). 1967. Practical Organic Chemistry, 4th ed. p.512. Longmans, London.
MAYR-HARTING, A., A.J. HEDGES, and R.c.w. BERKLEY. 1972. Methods for studying bacteriocins. In Methods in Microbiology. Vol. 7A, p.330-333. J.R. Norris and D.W. Ribbons (ed). Academic Press, New York and London.
MC BEE, R.H. 1948. The culture and physiology of a thermophilic cellulose-fermenting bacterium. J. Bacteriol. 56: 653-663.
MC BEE, R.H. 1950. The anaerobic thermophilic cellulolytic bacteria. Bacteriol. Rev. 14: 51-63.
MC COY, E., E.B. FRED. W.H. PETERSON, and E.G. HASTING. 1926. A cultural study of the Acetone Butyl Alcohol organism. J. Infectious Diseases, 39: 457-483.
MC COY, E., E.B. FRED., W.H. 1930. A cultural study acid forming bacteria. 118-137.
PETERSON,· and E.G. HASTING. of certain anaerobic Butyric J. Infectious Diseases, 46:
MCCUTCHAN, W.N., and R.J. HICKEY. 1954. The butanol acetone fermentations. In Industrial Fermentations Vol.I, p. 347-388. L.A. Underkoffer and R.J. Hickey (ed). Chemical Publishing, New York.
MILLER, G.L. 1959. Use of dinitrosalicyclic acid reagent for the determination of reducing sugars. Anal. Chem. 31: 426-428.
MONICK, J.A. 1968. Alcohols, Their Chemistry, Properties ·and Manufacture. Reinhold Publishing Corp., New York.
MOORE, W.E.C. 1966. Techniques for routine culture of fastidious anaerobes. Int. J. Syst. Bacteriol. 16: 173-190.
MORRIS, J.G., and R.W. O'BRIEN. 1971. Oxygen and clostridia a review. In Spore research p.1-38. A.N. Barker, G.W. Gould and J. Wolf (ed). Academic Press, New York and London.
157
MURRELL, W.G. 1967. The biochemistry of the bacterial endospore. In Advances in Microbial Physiology, Vol.I, p. 133-251. A.H. Rose and J.F. Wilkinson (ed). Academic Press, London.
NAKHMANOVICH, B.M., and N.A. SHCHEBLYKINA. 1960. Fermentation of calcium salts of acetic and butyric acids by CZostridium acetobutyZicum. Mikrobiologiya, ±2.= 67-72.
NG, T.K., A. BEN-BASSAT, and J.G. ZEIKUS. 1981. Ethanol Production by Thermophilic Bacteria: Fermentation of cellulosic substrates by co-cultures of CZostridium thermoceZZum CZostridium thermohydrosuZfuricum. Appl. Environ. Microbiol. 41: 1337-1343.
NG, T.K., P.J. WEIMER, and J.G. Z~IKUS. 1977. Cellulolytic and physiological properties of CZostridium thermoceZZum., Arch. Microbiol. 114: 1-7.
NG, T.K., and J.G. ZEIKUS. 1979. Abstr. Ann. Meet. Am. Soc. Microbiol. 08, p. 198.
O'BRIEN, R.W. and J.G. MORRIS. 1971. Oxygen and the Growth and Metabolism of CZostridium acetobutyZicum. J. Gen. Microbiol. 68: 307-318.
OGATA, S., and M. HONGO. CZostridium species: by univalent cations. 251-264.
1973. Bacterial lysis of Lysis of CZostridium species J. Gen. Appl. Microbiol. 19:
OGATA, S., and M. HONGO. 1974. Lysis induced by sodium ion and its relationship to lytic enzyme systems in CZostridium saccharoperbutyZacetonicum. J. Gen. Microbiol. 81: 315-323.
OXFORD, A.E., J.O. LAMPEN, and W.H. PETERSON. 1940. Growth factor and other nutritional requirements of the acetone butanol organism CZostridium acetobutyZicum. Biochem. J. 34: 1588-1597.
PATERSON, S.J., K.W. BUTLER, P. HUANG, J. LABELLE, I.C.P. SMITH, and H. SCHNEIDER. 1972. The effects of alcohols on lipid bilayers: A spin label study. Biochim. Biophys. Acta. 206: 597-602.
158
PATNI, N.J., and J.K. ALEXANDER. 1971. Catabolisrn of Fructose and Mannitol in CZostridium thermoaeZZum: Presence of phosphoenolpyruvate: Fructose 1-phosphate kinase, phosphoenolpyruvate: rnannitol phosphotrans= ferase, and rnannitol 1-phosphate dehydrogenase in cell extracts. J. Bacteriol. 105: 226-231.
PETERSON, W.H., S.W. SCOTT, and W.S. THOMPSON. 1930. Uber den aus starke und Cellulose durch gewisse Bakterien gebildeten reduzierenden Zucker. Biochern. z. 219: 1-6.
PETERSON, W.H., and E.B. FRED. 1932. Butyl-Acetone Fermentation of Corn Meal. Ind. Eng. Chern. 24: 237-240.
POOLEY, H.M., and G.D. SHOCKMAN. 1970. Relationship between the location of autolysin, cell wall synthesis, and the development of resistance to cellular autolysin in Streptocoacus faeaaZis after inhibition of protein synthesis. J. Bacteriol. 103: 457-466.
POOLEY, H.M., G.D.SHOCKMAN, M.L. HIGGINS, and J. PORRESJUAN. 1972. Some properties of two autolyticdefective mutants of Streptoaoccus faecaZis ATCC 9790. J. Bacteriol. 74: 48-59.
PRESCOTT, S.C., and C.G. DUNN (ed). 1940. The Acetone Butanol fermentation. In Industrial Microbiology, p. 250-284. McGraw Hill, New York and London.
PRINGHEIM, H. 1913. Uber die Vergarung de Zellulose durch therrnophile Bakterien. Zent. Bakt. Parasitenk. II, 38: 513-516.
PUL VERTAFT, R. J. V. , and J. A. HAYNES_. 19 51 • Ade nos ine and Spore Gerrnina tion Phase-Contrast Studies. J. Ge.n. Microbiol. 5: 657-663.
REESE, E.T. 1956. A microbiological progress report. Enzymatic hydrolysis of cellulose. Appl. Microbiol. 4: 39-45.
REESE, E.T. 1975. Summary statement on the Enzyme System~ In Cellulose as a Chemical and Energy Resource, p.77-80. C.R. Wilke (ed). Biotechnol. Bioeng. Syrop. 5. Interscience Publication, New York.
159
REILLEY, J., W.J. HICKBOTTOM, F.R. HENLEY, and A.C. THAYSEN. 1920. The products of the "acetone: n-Butyl Alcohol" Fermentation of Carbohydrate material with special reference to some of the intermediate substances produced. Biochem. Jour. 14: 229-251.
ROBSON, P. 1981. Private communications.
ROGERS, H.J. 1979. The function of bacterial autolysis. In Microbial Polysaccharides and Polysaccharases, p.237-268. R.C.W. Berkeley, G.W. Gooday and D.C. Ellwood (ed). Academic Press, New York and London.
ROGERS, H.J., H.R. PERKINS, and J.B. WARD (ed). 1980. The bacterial autolysins. In Microbial cell walls artd Membranes, p. 437-460. Chapman and Hall, London.
ROMANELLI, R.A., C.W. HOUSTON, and J.M. BARNETT. 1975. Studies on the thermophilic cellulytic fungi. Appl. Microbial. 30. 276-281.
ROSE, A.H. 1961. Acetone-butanol fermentation. In Industrial Microbiology, Vol. 3, p. 71-80. Interscience Publishers, New York.
ROSS, D. 1961. The Acetone-Butanol Fermentation. Prog. Indust. Micro. 3: 73-85.
ROWLEY, D.B., and F. FEEHERRY. 1970. Conditions affecting germination of CZostridium botulinum 62A spores in a chemically defined medium. J. Bacterial. 104: 1151-1157.
RUBBO, S.D., M. MAXWELL, R.A. FAIRBRIDGE, and J.M. GILLESPIE. 1941. The bacteriology, growth factor requirements and fermentation reactions of CZostridium aoetobutylioum (Weizmann). Aust. J. Exp. Biol. Med Sci. 19:185-198.
RYDEN, R. 1958. Development of Anaerobic Fermentation Processes: Acetone and Butanol. In Biochemical Engineering, p. 125-148. R. Steel (ed). Heywood, London.
SADDLER, S.M., and A.W. KAHN. 1979. Cellulose degradation by a new isolate from sewage sludge, a member of the Baoteroidaoeae family. Can. J. Microbial. 25: 1427-1432.

SHEETZ, M.P., and S.J. SINGER. 1974. Biological membranes as bilayer couplers. A molecular mechanism of' drug-erythrocyte interactions. Proc. Natl. Acad. Sci. U.S.A. 71: 4457-4461.
SHINMYO, A., D.V. GARCIA-MARTINES, and A.L. DEMAIN.
160
1979. Studies on the extracellular cellulolytic enzyme complex produced by CZostridium thermoaeZZum. J. Appl. Biochern. 1: 202-209.
SHUNGU, D.L., J.B. CORNETT, and G.D. SHOCKMAN. 1979. Morphological and physiological study of autolytic-defective Streptoaoeaus faeaium strains. J. Bacteriol. 142: 741-746.
SJOLANDER, A., F.LANGLYKKE, and W.H. PETERSON. 1938. Butyl alcohol fermentation of wood sugar. Indust. Eng. Chern. 30: 1251-1255.
SMITH, A.G., and P.D. ELLNER. 1957. Cytological observations on the sporulation process of CZostridium perfringens. J. Bacterial. 73: 1-7.
SPEAKMAN, H.B. 1920. The Biochemistry of the Acetone and Butyl Alcohol Fermentation of Starch by BaaiZZus granuZobaater peatinovorum. J. Biol. Chern. 41: 319-343.
SPIVEY, M.J. 1978. Fermentation.
The Acetone/Butanol/Ethanol Proc. Biochern. 13: 2-5.
STANIER, R.Y., E.A. ADELBERG, and J. INGRAM (ed). 1976. The Microbial World, 4th Ed., Prentice-Hall, Englawood, N.J.
STEINBERG, W., J. IDRISS, S. RODENBERG, and H.O. HALVORSON. 1969. Developmental changes accompanying the breaking of the dormant state in bacteria. In Dormancy and Survival. Symposia of the Society for Experimental Biology. Number XXIII. p.11-19. Cambridge University Press, London.
STOLP, H., and M.P. STARR. 1965. Bacteriolysis. Ann. Rev. Microbiol. 19: 79-104.
STUTZENBERGER, F.J., A.J. KAUFMAN, and R.D. LOSSIN. 1970. Cellulolytic activity in municipal waste composting. Can. J. Microbiol. 16: 553-560.
TAGG, J.R., S. DAJANI, and L.W. WANNAMAKER. 1976. Bacteriocins of Gram-positive bacteria. Bacteriol. Rev. 40: 722-756.
TETRAULT, P.A. 1930. The fermentation of cellulose at high temperatures. Zentralbl~ Bakteriol. Parasitehkd. II. 81: 28-45.
161
THAYSEN, A.C. 1921. Bacteriology of the Process for Acetone and Butyl Alcohol Manufacture. J. Indst. Brewing, 27: 529-542.
TOMASZ, A. 1968. Biological consequences of the replace= ment of choline by ethanolamine in the cell wall of Pneumococcus: Chain formation, loss 'of transformability and loss of autolysin. Proc. Natl. Acad. Sci. U.S.A. 59: 86-93.
TONG, G.E. 1978. Fermentation routes to C 3 and c~ chemicals. Chem. Eng. Prog. ]i: 70-74.
VAN DER WESTHUIZEN, A. 1978. Amylase of CZostridium acetobutyZicum. Honours Thesis. Rhodes University, Grahamstown, South Africa.
WALKER, D. 1970. germination.
Cytology of spore formation and J. Appl. Bacteriol. 33: 1-12.
WALTON, M.T., and J.L. MARTIN. 1979. Production of Butanol and Acetone by Fermentation. In Microbial Technology, Vol.19, p.189-210. H.J. Peppler and D. Perlman {ed). Microbial Process, 2nd Ed. Academic Press, Inc. New York, London.
WANG, D.I.C., I. BIOCIC, H.Y. FANG, and J.D. WANG. 1979. Direct microbiological conversion of cellulose biomass to ethanol. In Proceedings of 3rd Annual Biomass Energy Systems Conference. p.61-67. National Technical Information Service, Springfield, Va.
WANG, D. I .C., C .L. COONEY-, A .L. DEMAIN, R. F. GOMEZ, and A.J. SINSKEY. 1976-1980. Degradation of Cellulosic Biomass and its subsequent utilizations for the production of Chemical Feedstocks. Progress Reports submitted .to the U.S. Department of Energy under Contract No. EG-77-S-02-4198.
WEBSTER, J.R. 1980. Studies on an autolysin produced by CZostridium acetobutyZicum. M.Sc. Thesis. Rhodes University, Grahamstown, Sou~h Africa.
1 2 JUL 1982
WEBSTER, J.R., S.J. REID, D.T. JONES, and D.R. WOODS. 1981. Purification and characterisation of an autolysin from Clostridium acetobutylicum. Appl. Environ. Microbiol. 41: 371-374.
162
WEIMER, P.J., and J.G. ZEIKUS. 1977. Fermentation of Cellulose and cellobiose by CZostridium thermoaeiium in the absence and presence of Methanobacterium thermoautotrophicum. Appl. Environ. Microbiol. 33: 289-297.
WEIZMANN, C. 1945. U.S. Patent, 2, 377, 197.
WENDLAND, R.T., E.I. FULMER, and L.A. UNDERKOFLER. 1941. Butyl-Acetonic Fermentation of Artichokes. Ind. Eng. Chern. 33: 1O78-1081.
WEYER, E.R., and L.F. RETTGER. 1927. A comparative study of six different strains of organism commonly concerned in large scale production of Butyl alcohol and acetone by the biological process. J. Bacteriol. 14: 399-424.
WHEELER, M.C. and C.D. GOODALE. 1932. U.S. Pat.ent, 1, 875, 536.
WILKE, G.R. 1975. Cellulose as a chemical and energy resource. Biotechnol. Bioeng. Syrnp. 5: 345-357.
WILEY, A.J., M.J. JOHNSON, E. MC COY, and W.H. PETERSON. 1941. Acetone-Butyl Alcohol Fermentation of Waste Sulfite Liquor. Ind. Eng. Chern. 35: 606-610.
WOODMAN, H.E., and J. STEWART. 1928. The transformation of cellulose into glucose by the agency of cellulosespli tting bacteria. J. Agri. Sci. 18: 713-723.
WOOD, T.M. 1975. Properties and Mode of Action of Cellulases. In Cellulose as a Chemical and Energy Resource. p. 111-137. C.R. Wilke (ed). Biotechnol. Bioeng. Syrnp. 5: Interscience Publication, New York.
ZEIKUS, J.G. 1980. Chemical and fuel production by anaerobic bacteria. Ann. Rev. Microbiol. 34: 423-464.
ZEIKUS, J.G., A. BEN-BASSAT, and P.W. HEGGE. 1980. Microbiology of Methanogenesis in thermal, volcanic environments. J. Bacterial. 143: 432-440.


![Genome-Wide Analysis of Cell Type-Specific Gene ...aoh/Saujetetal.pdf · also the case for key genes involved in the spore morphogenesis [16,17,20]. In Clostridium acetobutylicum](https://img.pdfslide.us/doc/110x75/5e87518797913649b022fe05/genome-wide-analysis-of-cell-type-specific-gene-aoh-also-the-case-for-key.jpg)