Embed Size (px)
DESCRIPTION
t
Citation preview
Foodservice Equipment Reports ©2014 1
How Big U.S Chains And
Institutions Purchase Equipment
And Select Suppliers
By Robin Ashton, Publisher,
Beth Lorenzini, Editor-In-Chief
Foodservice Equipment Reports
Hotelex, Shanghai, P.R. of China
31 March, 2014
Foodservice Equipment Reports ©2014
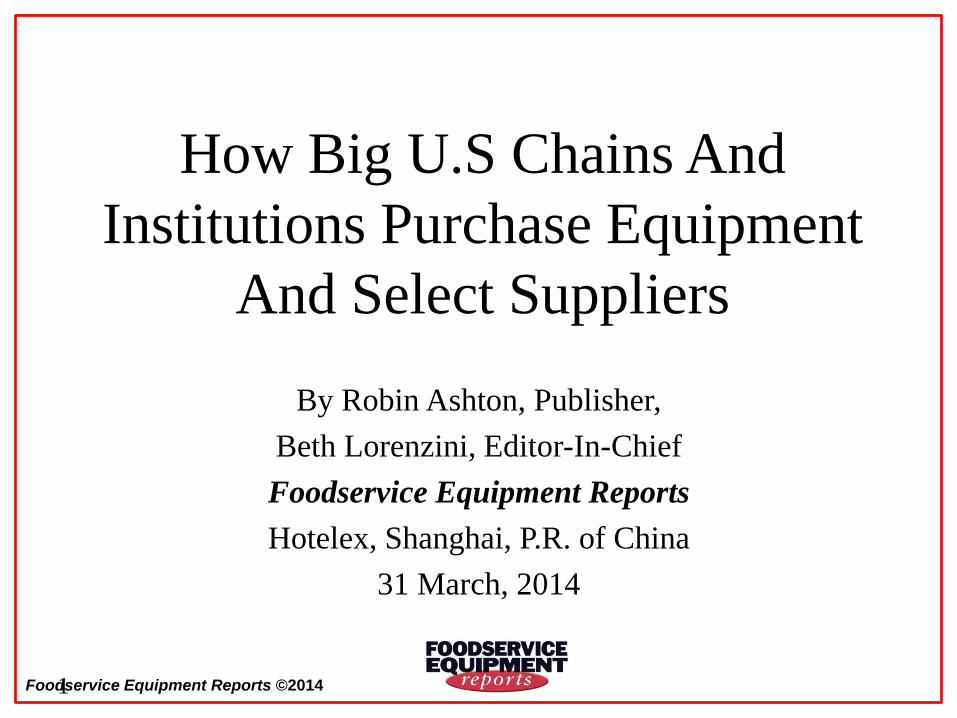
Researching How Multiunit Operators
Buy E&S And Choose Suppliers • Big chain, institutional and other multiunit foodservice
operators rule the U.S. and global markets.
• They continue to grow and gain market share everywhere.
• In the U.S. market, they clearly purchase a majority of all
new equipment and supplies.
• As multiunit operators, they have unique needs and much
more complex specification and purchasing processes.
• To better understand these needs, processes and the
criteria they use to evaluate and choose E&S suppliers,
FER undertook exclusive new research.
Foodservice Equipment Reports ©2014
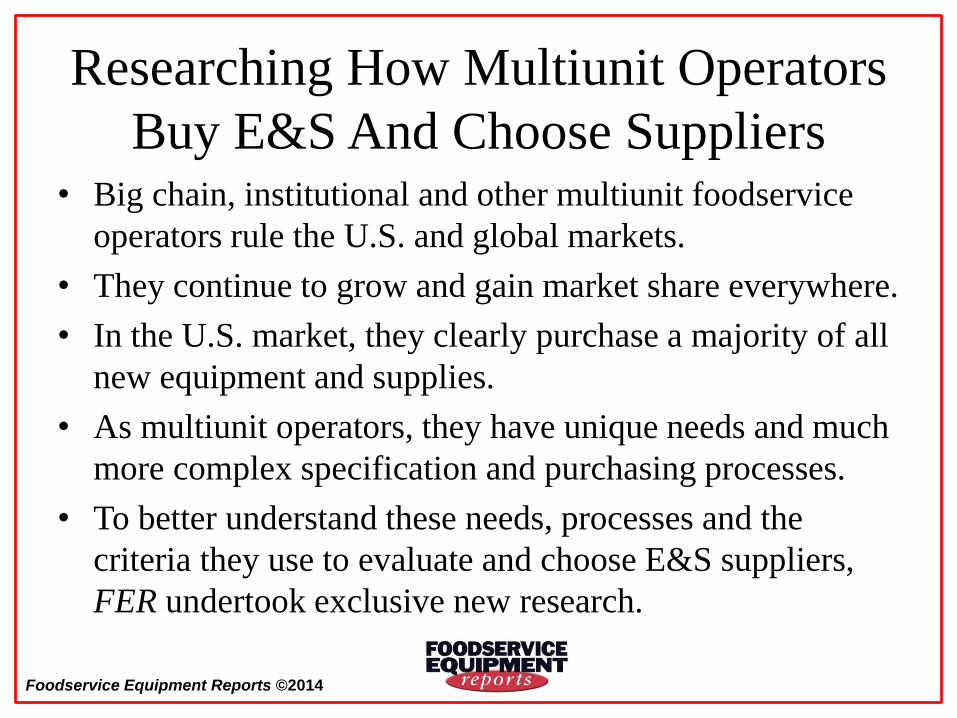
Researching How Multiunit Operators
Buy E&S And Choose Suppliers • During the past year, FER surveyed first chain and other
commercial operators, then large institutional operators;
FER’s exclusively multiunit operator circ. lists were used.
• The 16-question surveys, specific to commercial and
noncommercial segments, were e-mailed using Survey
Monkey research software.
• The questionnaires probed which functions are involved in
spec and purchase decisions, outside influences with input,
and criteria used in supplier and brand selection.
• We received 99 complete commercial surveys and 124
complete noncommercial surveys.
Foodservice Equipment Reports ©2014
Researching How Multiunit Operators
Buy E&S And Choose Suppliers • The research is not designed to be statistically accurate, but to
serve as a guide to how these large organizations evaluate and
select E&S products and specific suppliers.
• We, of course, found that there is a great deal of diversity in
criteria and procedures in these complex organizations.
• Few operators organize their E&S spec and purchasing
operations exactly the same.
• But there are commonalities that the research reveals.
• Some of it may surprise you; it did us.
• But before we dig into the research, let’s do an overview of the
structure and typical spec processes in the U.S.
Foodservice Equipment Reports ©2014
U.S. Foodservice & Equipment Markets
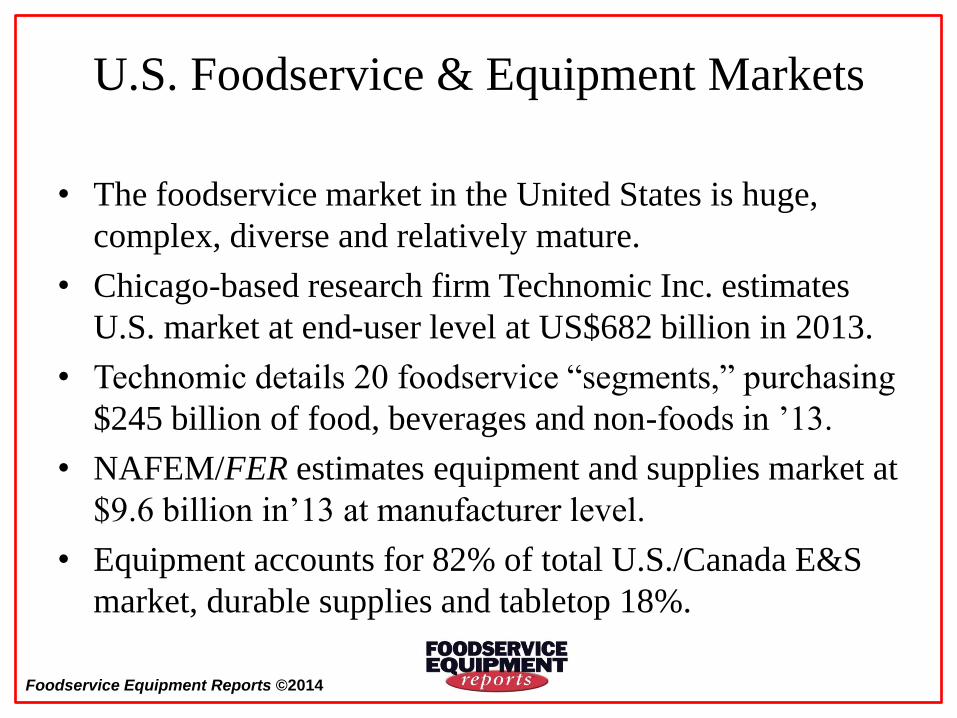
• The foodservice market in the United States is huge,
complex, diverse and relatively mature.
• Chicago-based research firm Technomic Inc. estimates
U.S. market at end-user level at US$682 billion in 2013.
• Technomic details 20 foodservice “segments,” purchasing
$245 billion of food, beverages and non-foods in ’13.
• NAFEM/FER estimates equipment and supplies market at
$9.6 billion in’13 at manufacturer level.
• Equipment accounts for 82% of total U.S./Canada E&S
market, durable supplies and tabletop 18%.
Foodservice Equipment Reports ©2014
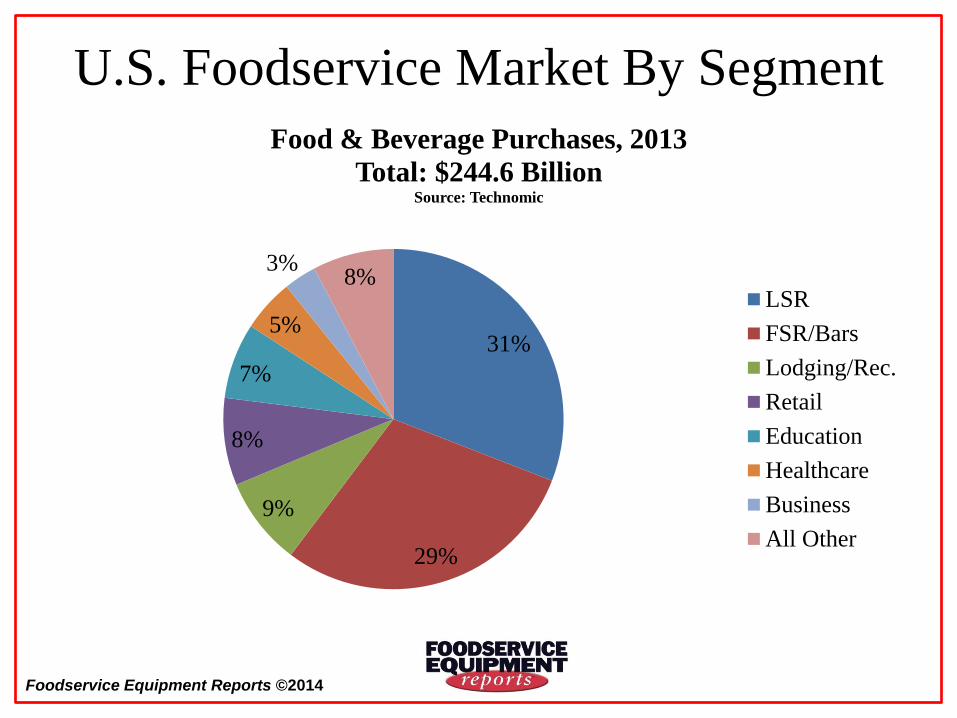
U.S. Foodservice Market By Segment
31%
29%
9%
8%
7%
5%
3% 8%
Food & Beverage Purchases, 2013
Total: $244.6 Billion Source: Technomic
LSR
FSR/Bars
Lodging/Rec.
Retail
Education
Healthcare
Business
All Other
Foodservice Equipment Reports ©2014
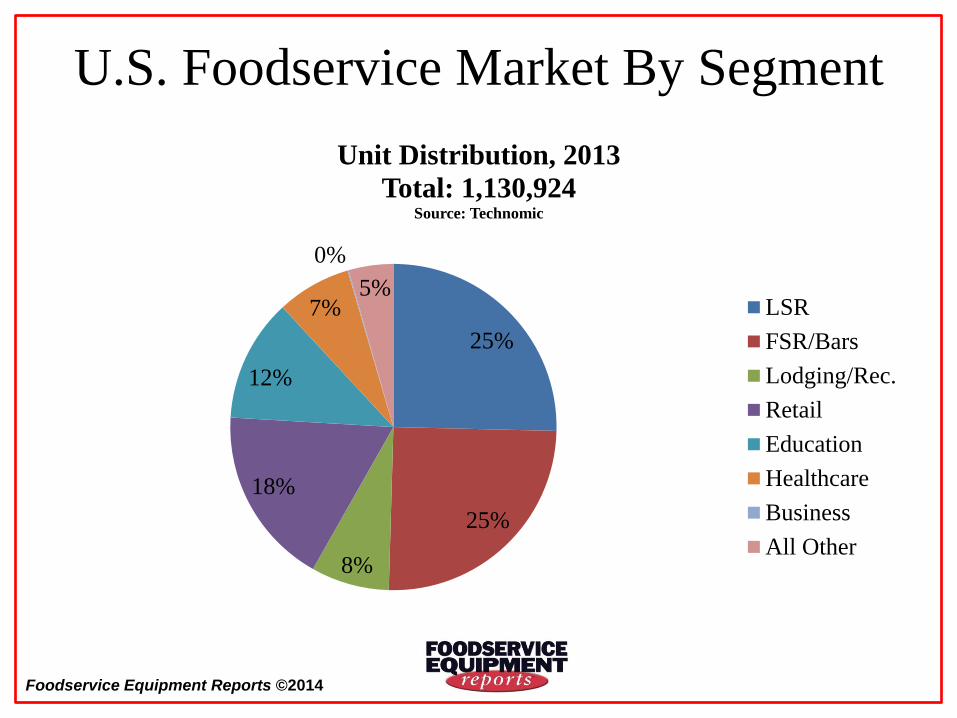
U.S. Foodservice Market By Segment
25%
25%
8%
18%
12%
7%
0%
5%
Unit Distribution, 2013
Total: 1,130,924 Source: Technomic
LSR
FSR/Bars
Lodging/Rec.
Retail
Education
Healthcare
Business
All Other
Foodservice Equipment Reports ©2014
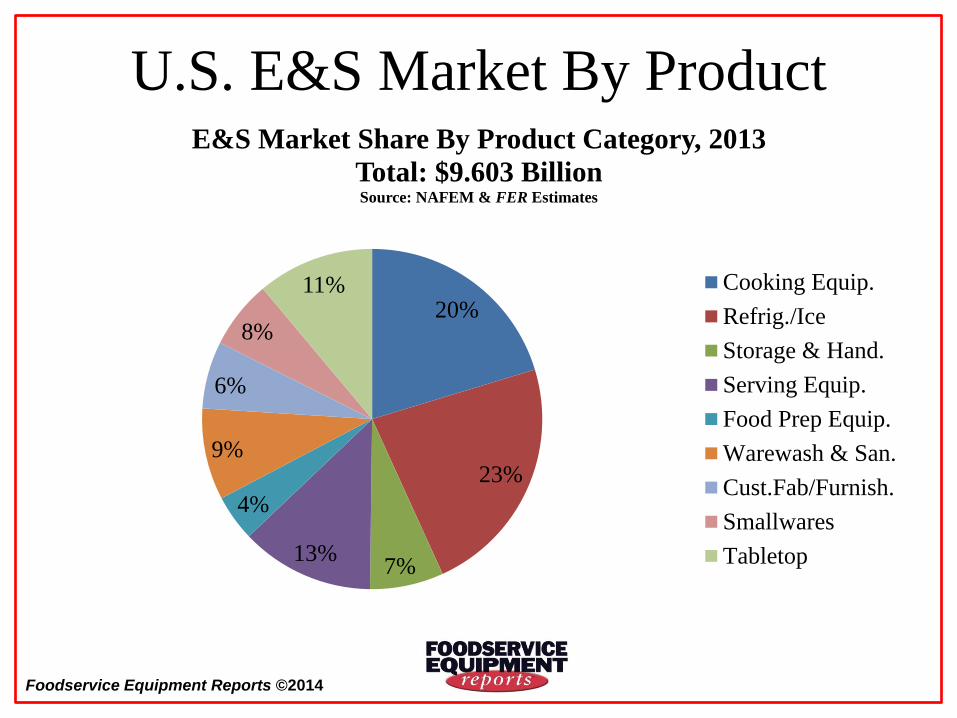
U.S. E&S Market By Product
20%
23%
7% 13%
4%
9%
6%
8%
11%
E&S Market Share By Product Category, 2013
Total: $9.603 Billion Source: NAFEM & FER Estimates
Cooking Equip.
Refrig./Ice
Storage & Hand.
Serving Equip.
Food Prep Equip.
Warewash & San.
Cust.Fab/Furnish.
Smallwares
Tabletop
Foodservice Equipment Reports ©2014
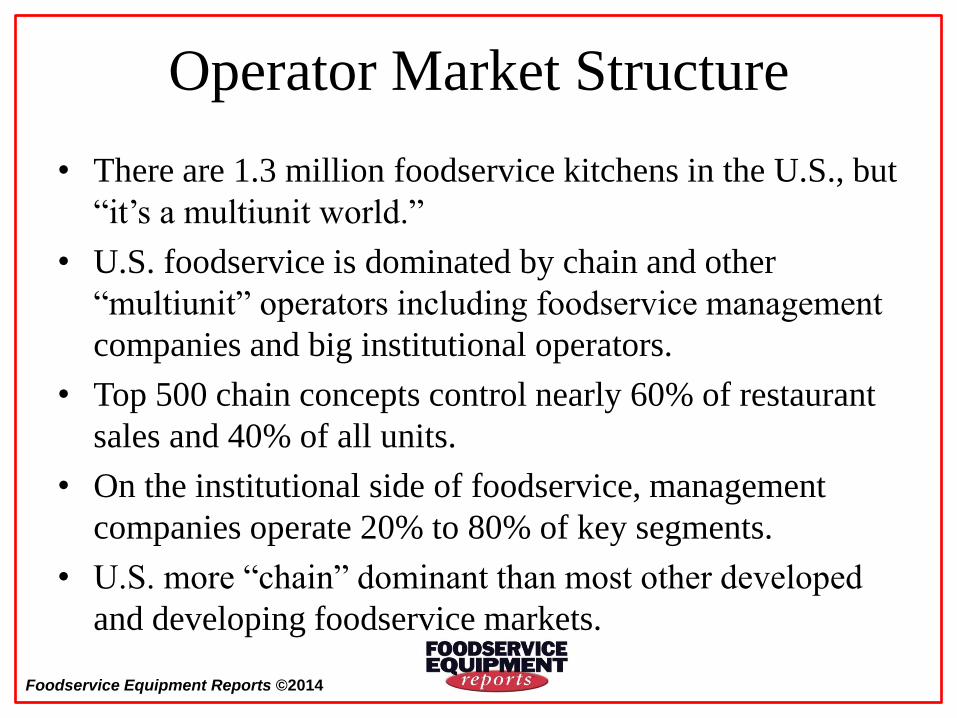
Operator Market Structure
• There are 1.3 million foodservice kitchens in the U.S., but
“it’s a multiunit world.”
• U.S. foodservice is dominated by chain and other
“multiunit” operators including foodservice management
companies and big institutional operators.
• Top 500 chain concepts control nearly 60% of restaurant
sales and 40% of all units.
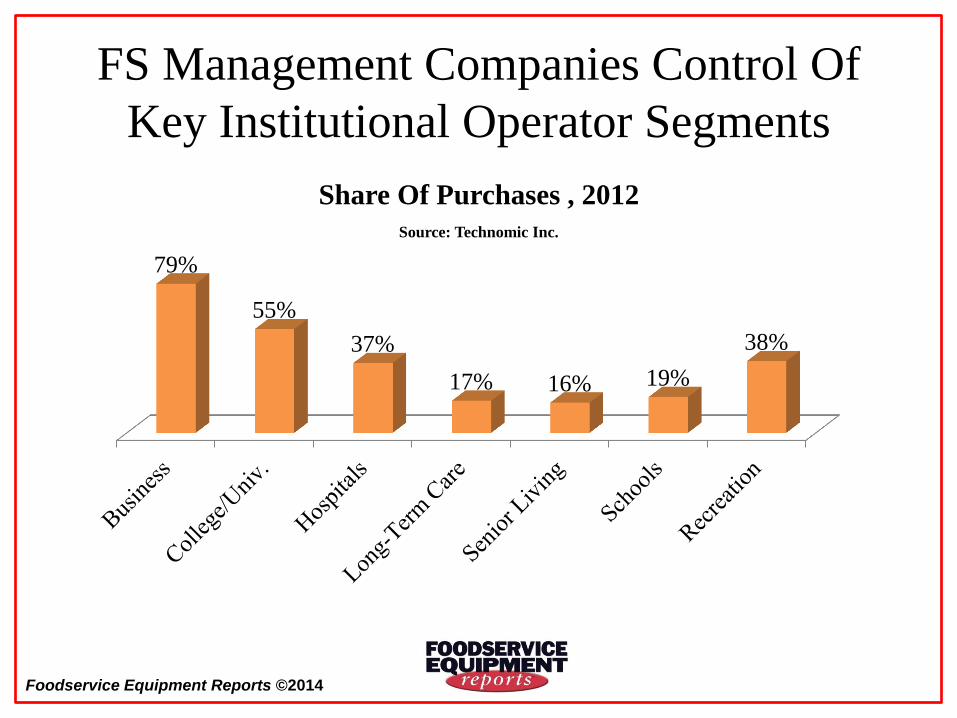
• On the institutional side of foodservice, management
companies operate 20% to 80% of key segments.
• U.S. more “chain” dominant than most other developed
and developing foodservice markets.
Foodservice Equipment Reports ©2014
Top 500 Chains’ Market Share 2012
58%
42%
Share Of Restaurant Sales
Total: $435 Billion, 2012 Source: Technomic Inc.
Top 500
Rest of
Industry
41%
59%
Share of Restaurant Units
Total: 518,533, 2012 Source: Technomic Inc.
Top 500
Rest of
Industry
Foodservice Equipment Reports ©2014
FS Management Companies Control Of
Key Institutional Operator Segments
79%
55%
37%
17% 16% 19%
38%
Share Of Purchases , 2012
Source: Technomic Inc.
Foodservice Equipment Reports ©2014
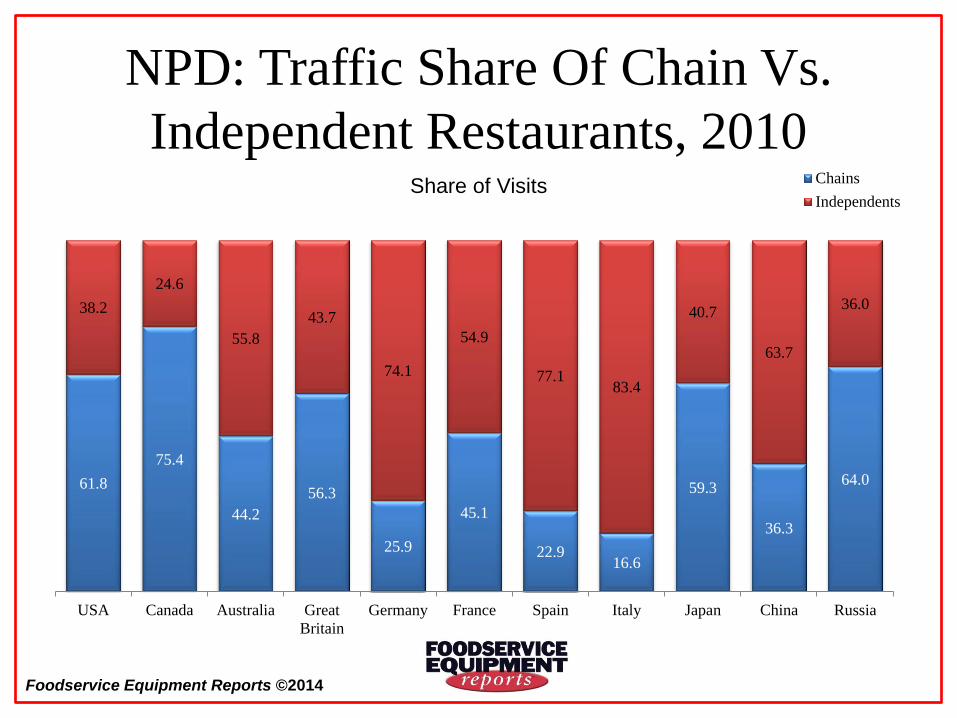
NPD: Traffic Share Of Chain Vs.
Independent Restaurants, 2010
61.8
75.4
44.2
56.3
25.9
45.1
22.9 16.6
59.3
36.3
64.0
38.2
24.6
55.8
43.7
74.1
54.9
77.1 83.4
40.7
63.7
36.0
USA Canada Australia Great
Britain
Germany France Spain Italy Japan China Russia
Chains
IndependentsShare of Visits
Foodservice Equipment Reports ©2014
Operator Market Structure
• Chain domination is especially pronounced in the giant
limited-service restaurant segment.
• Technomic Top 500 LSR chains control 83% of industry
sales and 65% of units
• In the burger category, Top 500 brands control 95% of
sales and 87.5% of units.
• According to NPD Group CREST data, quick-service
concepts account for 79% of all restaurant visits.
• Major chains (those with 500+ units) controlled 64% of
all visits in 2013, a number that has grown, says NPD.
Foodservice Equipment Reports ©2014
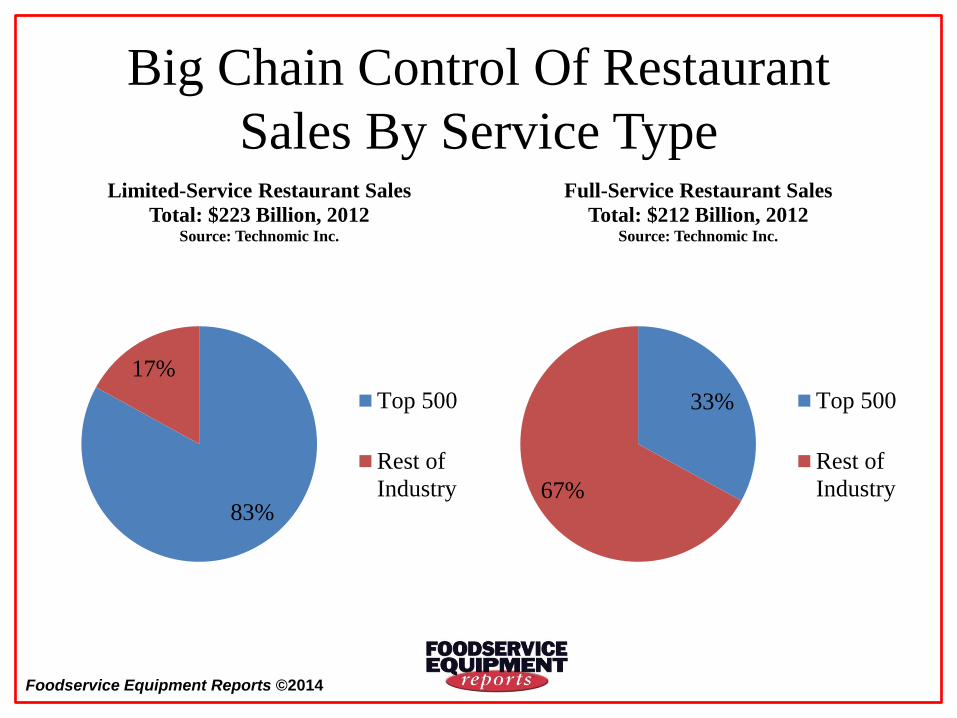
Big Chain Control Of Restaurant
Sales By Service Type
83%
17%
Limited-Service Restaurant Sales
Total: $223 Billion, 2012 Source: Technomic Inc.
Top 500
Rest of
Industry
33%
67%
Full-Service Restaurant Sales
Total: $212 Billion, 2012 Source: Technomic Inc.
Top 500
Rest of
Industry
Foodservice Equipment Reports ©2014
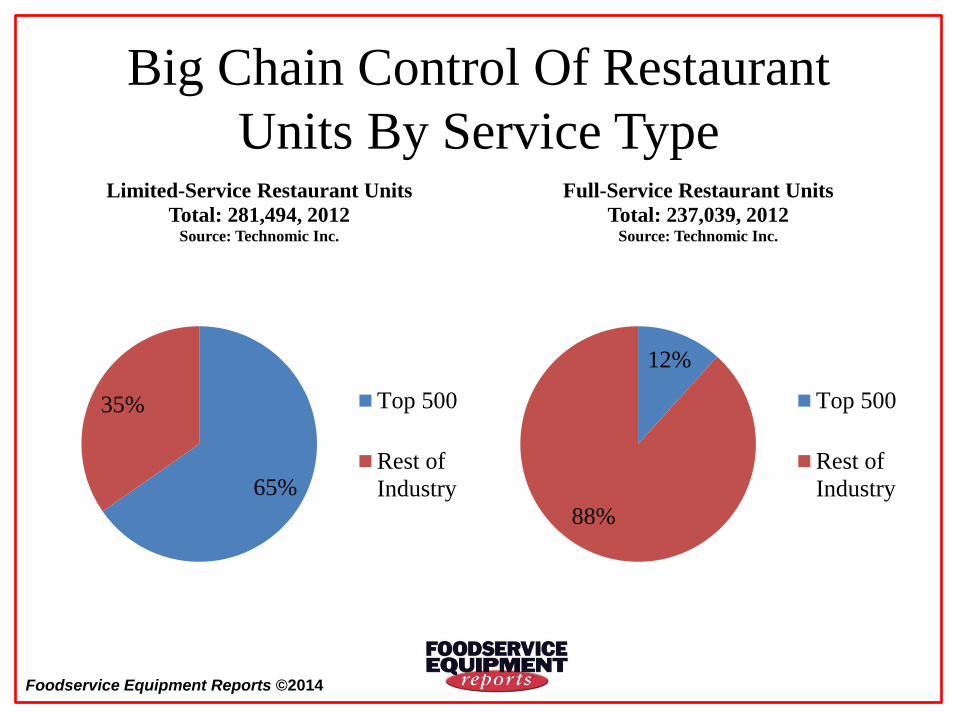
Big Chain Control Of Restaurant
Units By Service Type
65%
35%
Limited-Service Restaurant Units
Total: 281,494, 2012 Source: Technomic Inc.
Top 500
Rest of
Industry
12%
88%
Full-Service Restaurant Units
Total: 237,039, 2012 Source: Technomic Inc.
Top 500
Rest of
Industry
Foodservice Equipment Reports ©2014
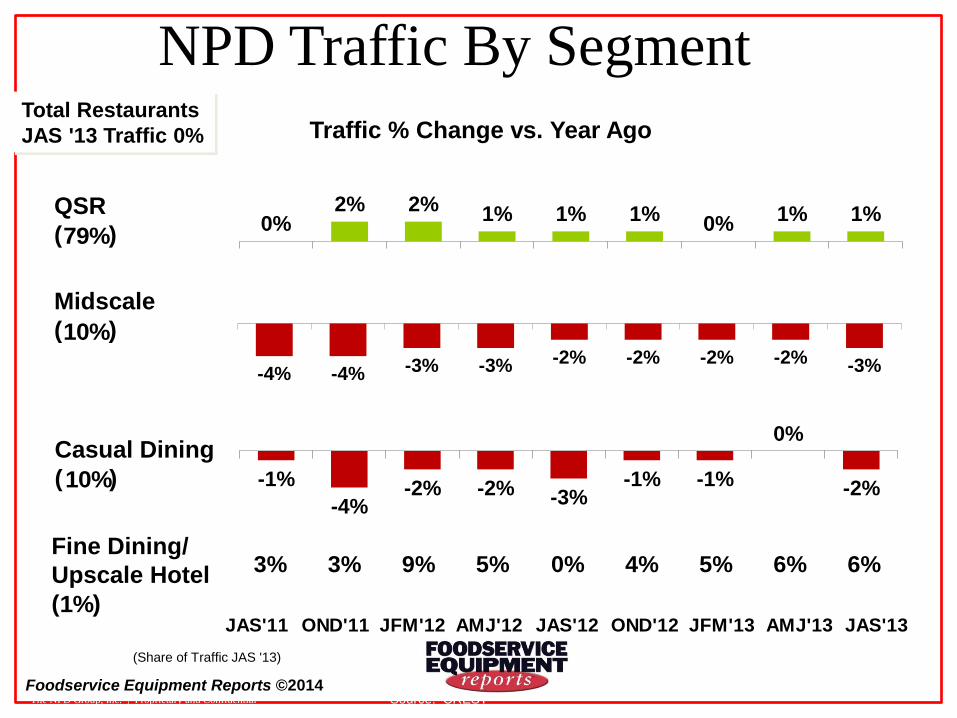
NPD Traffic By Segment
-4% -4% -3% -3% -2% -2% -2% -2% -3%
0% 2% 2% 1% 1% 1% 0% 1% 1%
-1%
-4% -2% -2% -3%
-1% -1%
0%
-2%
Traffic % Change vs. Year Ago
QSR
( )
Midscale
( )
Casual Dining
( )
Fine Dining/
Upscale Hotel
( )
(Share of Traffic JAS '13)
79%
10%
10%
1%
3% 3% 9% 5% 0% 4% 5% 6% 6%
JAS'11 OND'11 JFM'12 AMJ'12 JAS'12 OND'12 JFM'13 AMJ'13 JAS'13
Total Restaurants
JAS '13 Traffic 0%
The NPD Group, Inc. | Proprietary and Confidential Source: CREST
Foodservice Equipment Reports ©2014
Major Chain Traffic Share, NPD
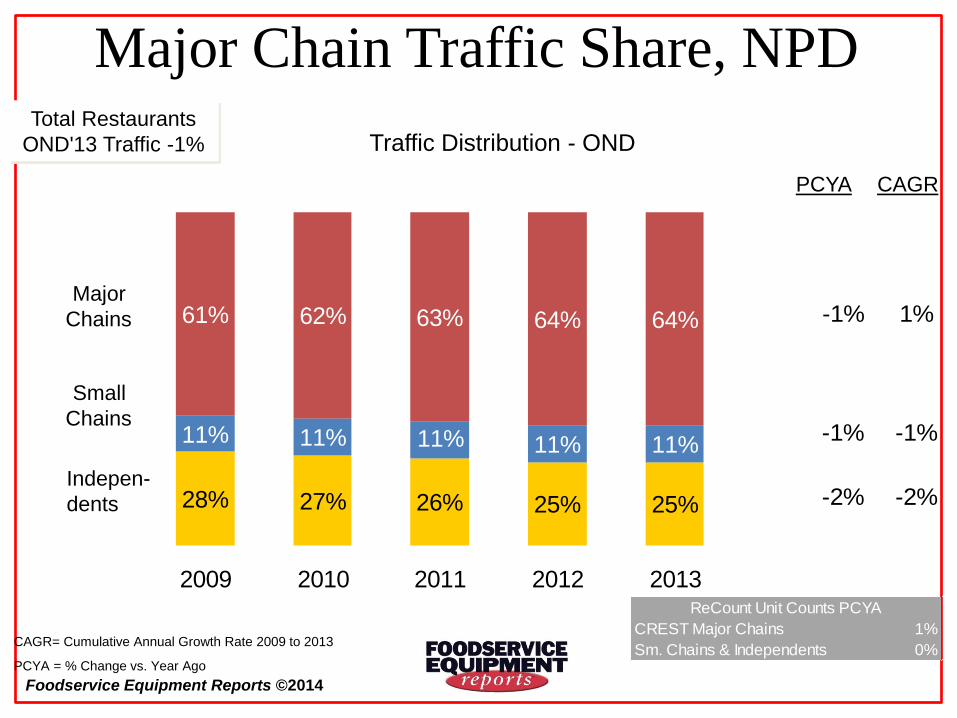
Foodservice Equipment Reports ©2014
62% 63% 64% 64%
11% 11% 11%
28% 27% 26% 25% 25%
61%
11%11%
2009 2010 2011 2012 2013
Major Chain Traffic Share, NPD
PCYA = % Change vs. Year Ago
Traffic Distribution - OND
Major
Chains
Small
Chains
Indepen-
dents
PCYA CAGR
1%-1%
-1%-1%
-2%-2%
CAGR= Cumulative Annual Growth Rate 2009 to 2013
Total Restaurants
OND'13 Traffic -1%
CREST Major Chains 1%
Sm. Chains & Independents 0%
ReCount Unit Counts PCYA
18 Source: CREST / ReCount
Foodservice Equipment Reports ©2014
U.S. Foodservice & E&S Market Realities
• A few thousand organizations—chains, FS mgmt.
companies, big institutions—are keys to U.S. market.
• They not only control a majority of operator sales, but
account for an estimated 70-75% of new E&S purchases.
• They don’t purchase E&S like independent operators.
• They are the most brand sensitive and have complex
specification, evaluation and distribution processes.
• This is particularly true of the big QSR brands, but is also
true of other chains and big institutions.
• Which is why FER researched those processes.
Foodservice Equipment Reports ©2014
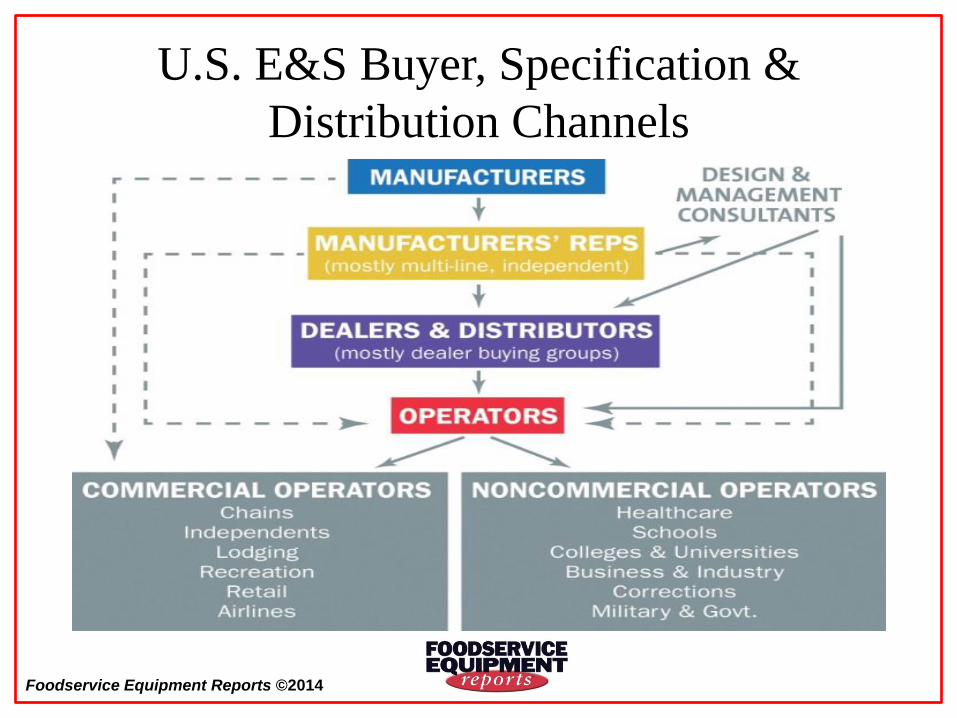
U.S. E&S Buyer, Specification &
Distribution Channels
• The paths and influences in big operator E&S buying,
specifying and logistics decisions are multi-faceted.
• The “normal” path is OEM manufacturer to independent
multi-line sales rep to dealer to operator.
• Big institutional operators usually also employ an
independent design or concept consultant
• Many chain and big institutional operators generally
follow these “normal” paths and channels.
• But there are also many side paths, “direct” relationships
and other outside influences.
Foodservice Equipment Reports ©2014
U.S. E&S Buyer, Specification &
Distribution Channels
Foodservice Equipment Reports ©2014
How Chains Purchase Equipment:
Overview • U.S. restaurants chains come in all sizes, service and
menu types and ownership structures.
• These differences influence, if not dictate, how they
evaluate equipment, select suppliers and purchase E&S.
• As we’ve seen, specification and distribution are very
complex, with multiple influences and channels.
• Generally, larger chains deal more directly with the OEM
manufacturers and their sales reps; a semi-custom world.
• The larger the chain, the more “specialists” influence
equipment selection and purchase procedures.
Foodservice Equipment Reports ©2014
How Chains Purchase Equipment:
Overview
• Quick-service giants are usually franchised, while
full-service chains often own all or most of their units.
• Franchised systems have another layer of buyers, the
franchisees themselves.
• Many franchised systems have purchasing co-operatives
that are jointly owned by the company and franchisees.
• Quick-service equipment packages are more custom,
often designed by company R&D engineers and OEMs.
• Full-service chains generally have larger kitchens and use
more “standard” equipment items.
Foodservice Equipment Reports ©2014
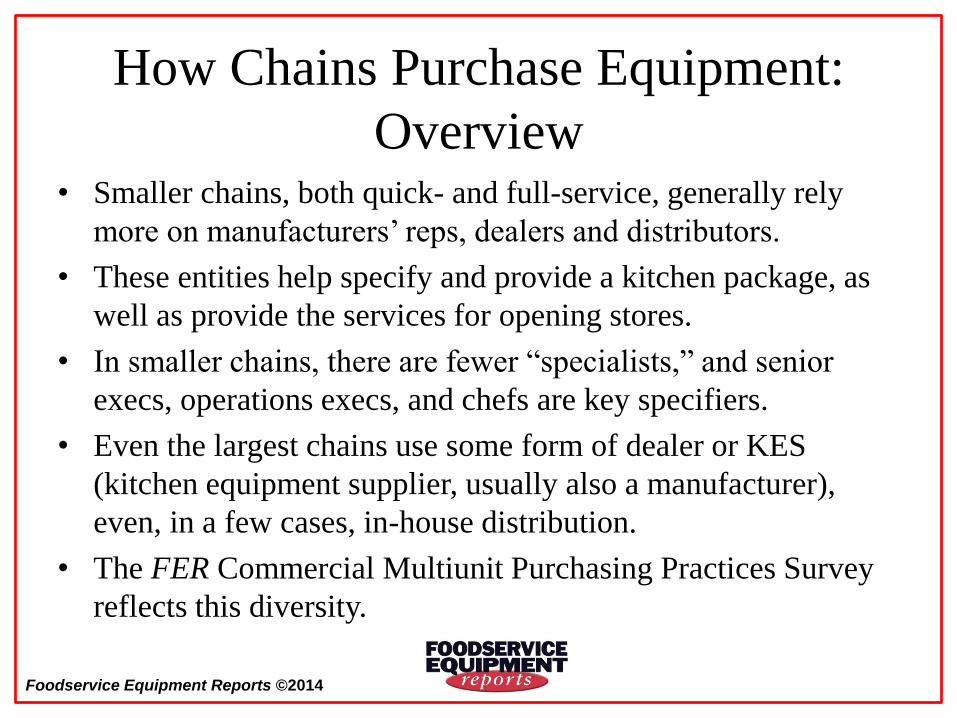
How Chains Purchase Equipment:
Overview • Smaller chains, both quick- and full-service, generally rely
more on manufacturers’ reps, dealers and distributors.
• These entities help specify and provide a kitchen package, as
well as provide the services for opening stores.
• In smaller chains, there are fewer “specialists,” and senior
execs, operations execs, and chefs are key specifiers.
• Even the largest chains use some form of dealer or KES
(kitchen equipment supplier, usually also a manufacturer),
even, in a few cases, in-house distribution.
• The FER Commercial Multiunit Purchasing Practices Survey
reflects this diversity.
Foodservice Equipment Reports ©2014
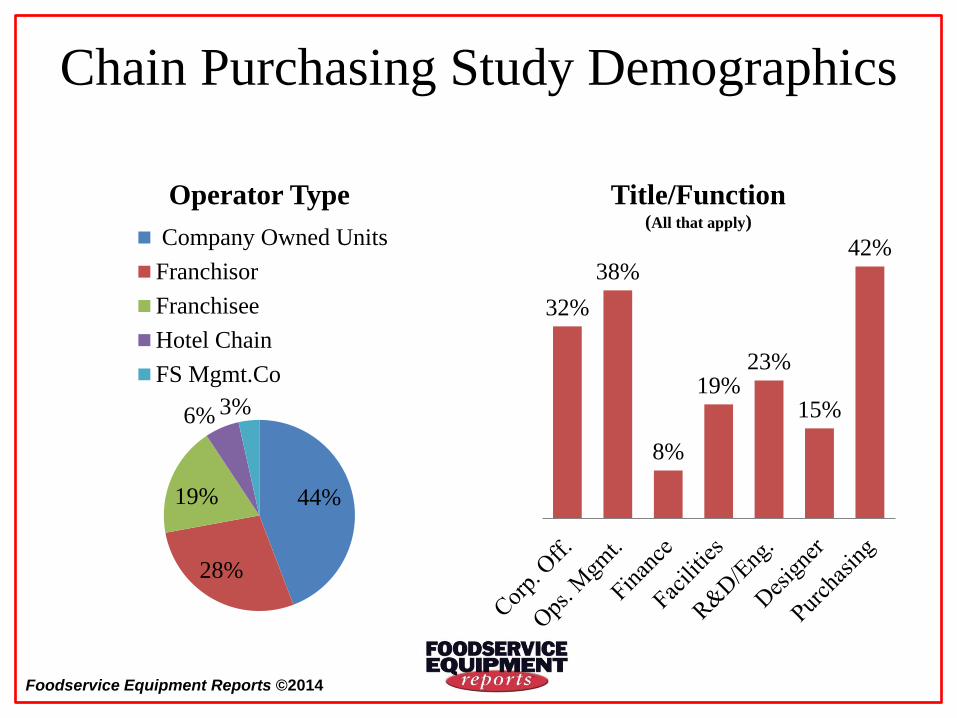
Chain Purchasing Study Demographics
44%
28%
19%
6% 3%
Operator Type
Company Owned Units
Franchisor
Franchisee
Hotel Chain
FS Mgmt.Co
32%
38%
8%
19% 23%
15%
42%
Title/Function (All that apply)
Foodservice Equipment Reports ©2014
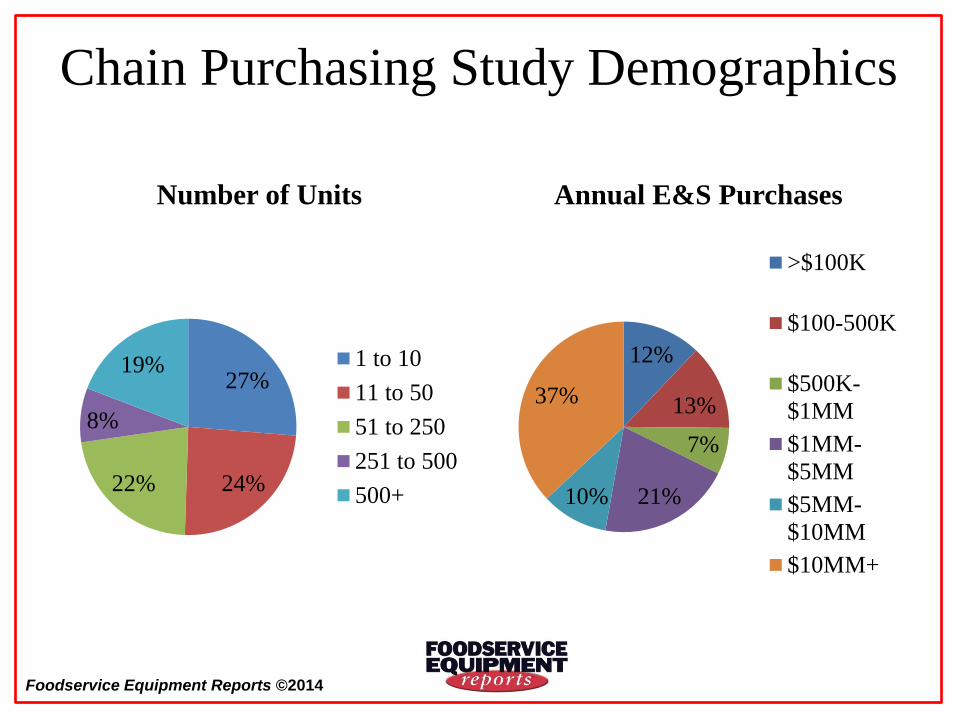
Chain Purchasing Study Demographics
27%
24% 22%
8%
19%
Number of Units
1 to 10
11 to 50
51 to 250
251 to 500
500+
12%
13%
7%
21% 10%
37%
Annual E&S Purchases
>$100K
$100-500K
$500K-
$1MM
$1MM-
$5MM
$5MM-
$10MM
$10MM+
Foodservice Equipment Reports ©2014 27
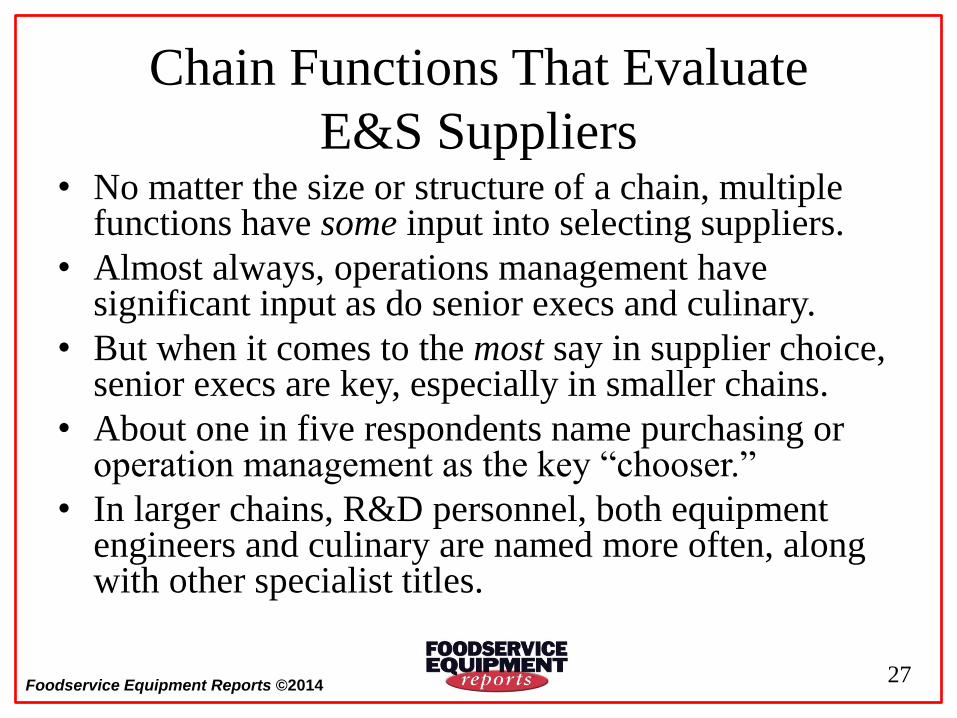
Chain Functions That Evaluate
E&S Suppliers • No matter the size or structure of a chain, multiple
functions have some input into selecting suppliers.
• Almost always, operations management have significant input as do senior execs and culinary.
• But when it comes to the most say in supplier choice, senior execs are key, especially in smaller chains.
• About one in five respondents name purchasing or operation management as the key “chooser.”
• In larger chains, R&D personnel, both equipment engineers and culinary are named more often, along with other specialist titles.
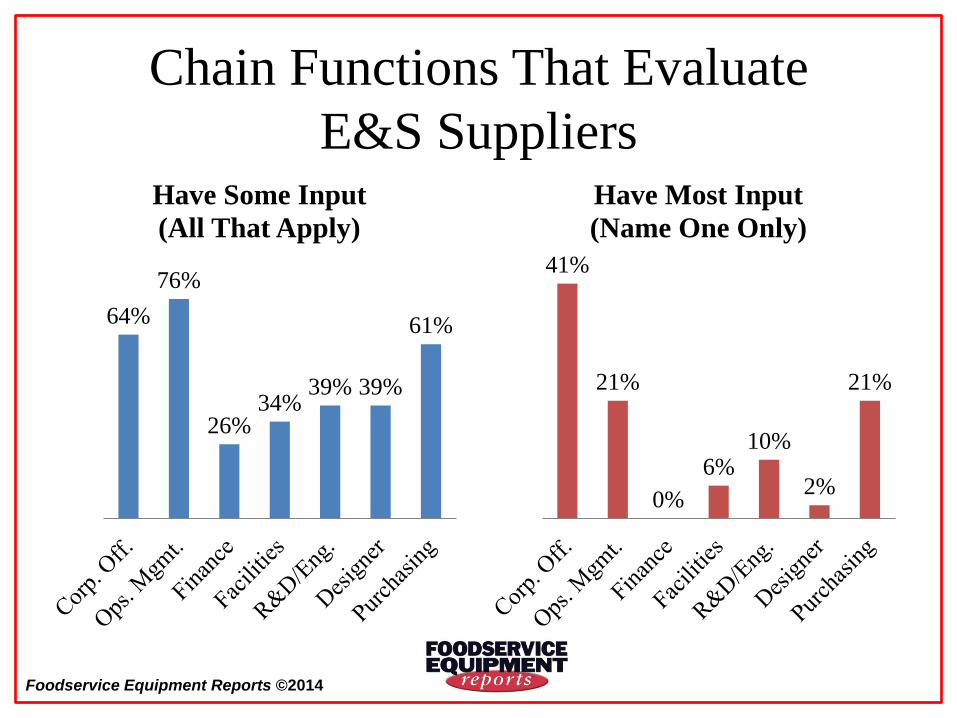
Foodservice Equipment Reports ©2014
Chain Functions That Evaluate
E&S Suppliers
64%
76%
26% 34%
39% 39%
61%
Have Some Input
(All That Apply)
41%
21%
0%
6% 10%
2%
21%
Have Most Input
(Name One Only)
Foodservice Equipment Reports ©2014
Outside Influences On Chain
E&S Supplier Choices • Outside distribution and purchasing partners, designers,
architects and food suppliers can also have spec inputs.
• Affiliated purchasing co-ops or distributors, and
dealer/KES partners are mentioned the most often.
• Food suppliers have more input than one might expect,
perhaps because of their role in new menu items.
• Architects and general contractors and culinary
consultants have the least role.
• Most surprising are percent of respondent who say none
of these functions have a role in choosing E&S suppliers.
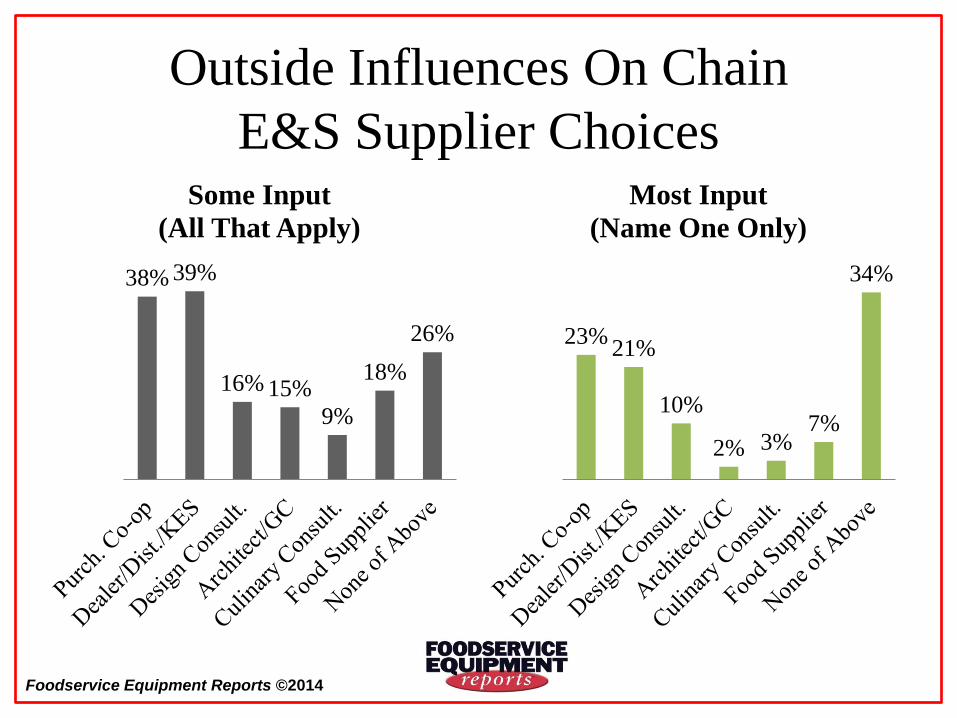
Foodservice Equipment Reports ©2014
Outside Influences On Chain
E&S Supplier Choices
38% 39%
16% 15%
9%
18%
26%
Some Input
(All That Apply)
23% 21%
10%
2% 3% 7%
34%
Most Input
(Name One Only)
Foodservice Equipment Reports ©2014
Sources Chain Buyers Use To
ID And Evaluate E&S Suppliers • Chain spec/buyers tap into many sources when looking
for and evaluating E&S products and suppliers.
• Dealers, consultants, trade magazines and shows, even
food suppliers enter into the mix.
• But when asked to name the sources they depend on
most, existing suppliers and mfrs. reps are dominant.
• Recommendations from other operators, “word of mouth”
is also a very significant and important influence.
• Dealers, trade magazines and consultants are still factors.
• It’s significant how much chains rely on existing OEMs.
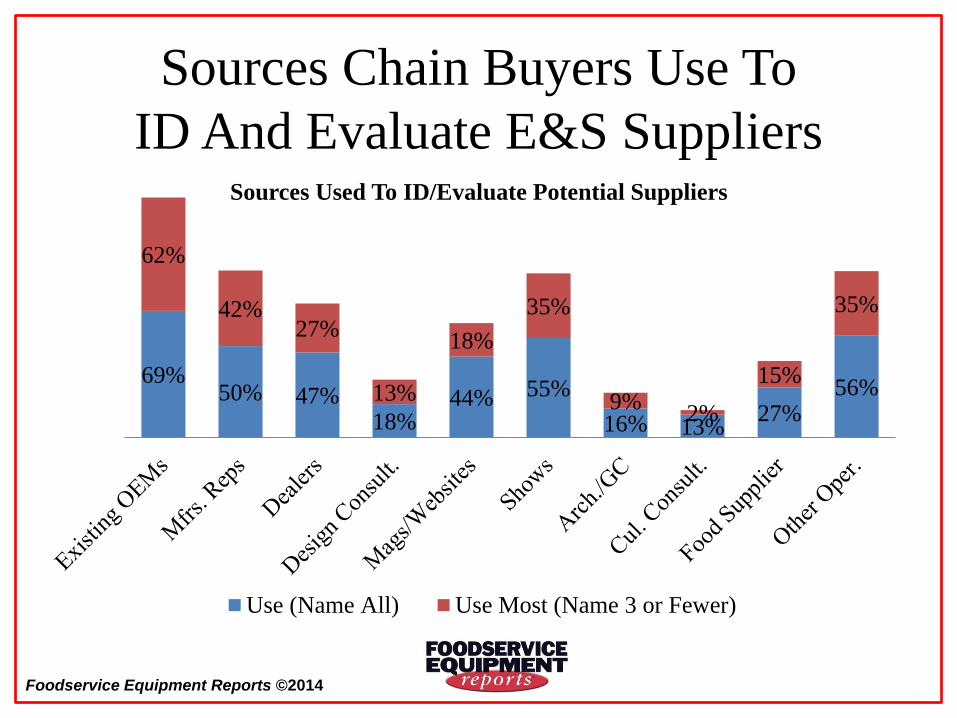
Foodservice Equipment Reports ©2014
Sources Chain Buyers Use To
ID And Evaluate E&S Suppliers
69% 50% 47%
18% 44% 55%
16% 13% 27%
56%
62%
42% 27%
13%
18%
35%
9% 2%
15%
35%
Sources Used To ID/Evaluate Potential Suppliers
Use (Name All) Use Most (Name 3 or Fewer)
Foodservice Equipment Reports ©2014
Criteria Influencing Chain Buyers
Choice of E&S Products/Suppliers • Many different criteria are involved in chain buyers E&S
product and supplier choices.
• Labor savings, ease of use, energy efficiency, both initial and
lifecycle cost, speed and previous experience with the supplier
are all named by more than 50% of buyers.
• But the most critical criteria is clearly the product’s and
supplier’s impact on food and menu product quality.
• Ease of use, initial cost and labor savings are the next most
commonly mentioned criteria.
• Unique technology, water savings and availability are cited by
the fewest respondents as important.
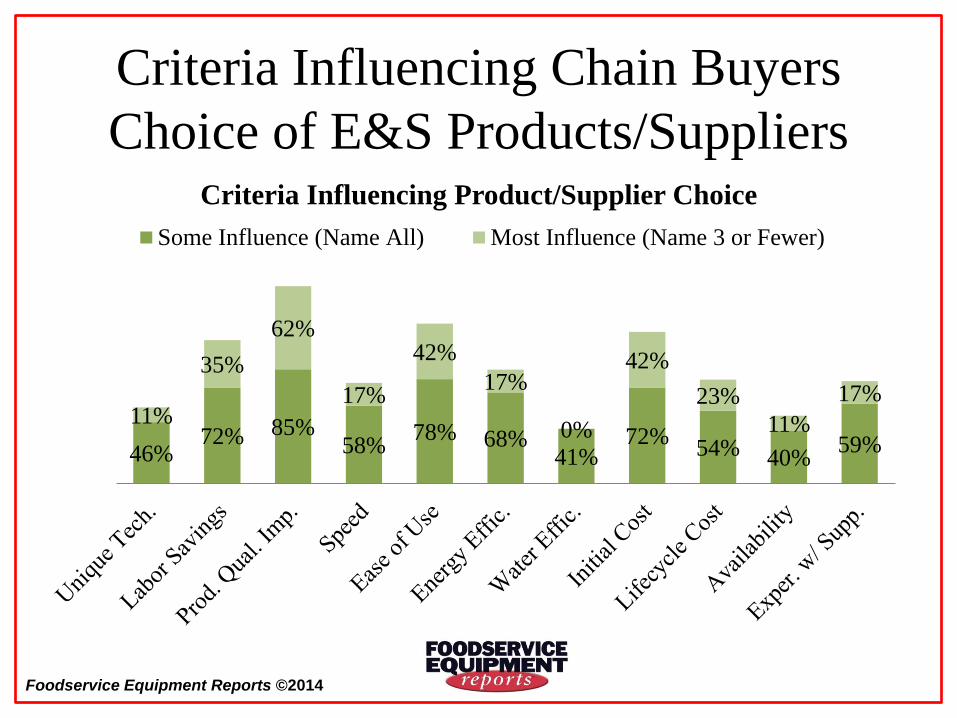
Foodservice Equipment Reports ©2014
Criteria Influencing Chain Buyers
Choice of E&S Products/Suppliers
46% 72% 85%
58% 78% 68%
41% 72%
54% 40% 59%
11%
35%
62%
17%
42%
17%
0%
42%
23%
11%
17%
Criteria Influencing Product/Supplier Choice
Some Influence (Name All) Most Influence (Name 3 or Fewer)
Foodservice Equipment Reports ©2014
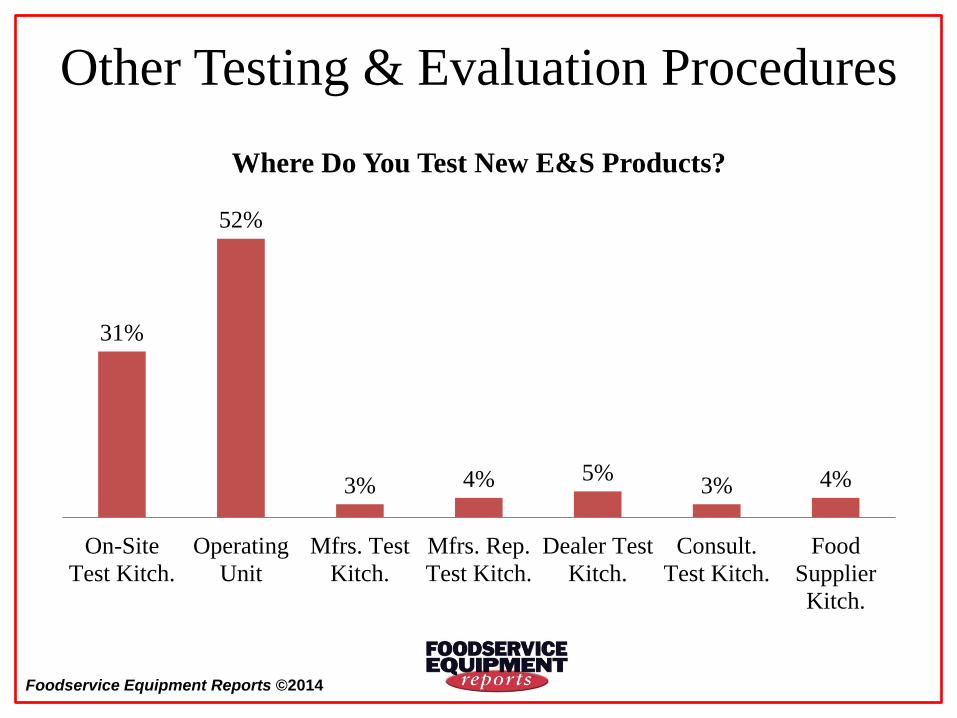
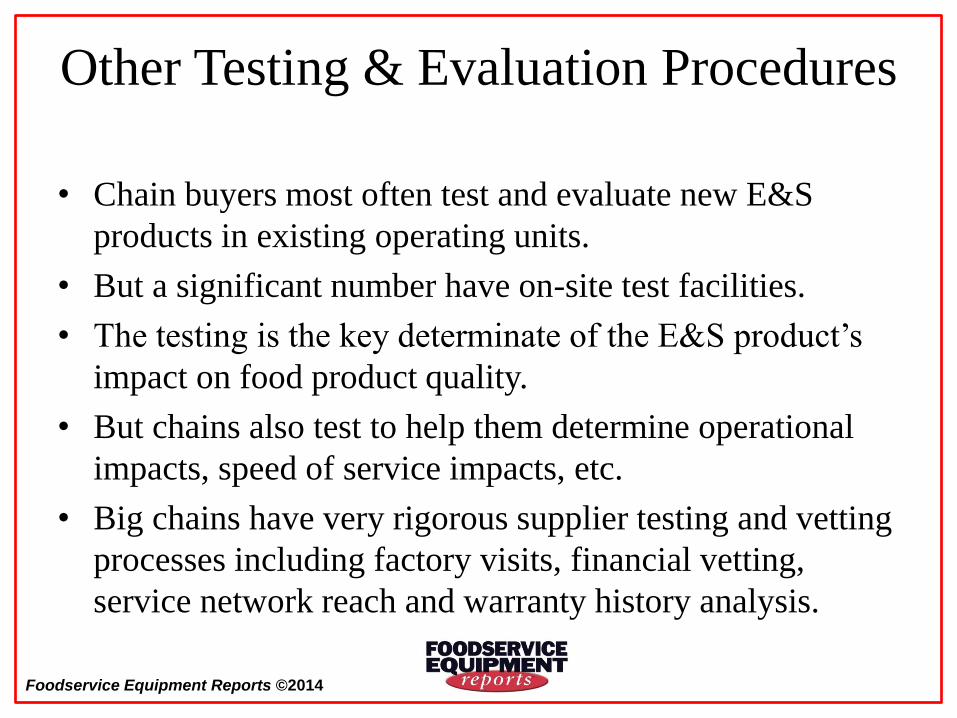
Other Testing & Evaluation Procedures
31%
52%
3% 4% 5% 3% 4%
On-Site
Test Kitch.
Operating
Unit
Mfrs. Test
Kitch.
Mfrs. Rep.
Test Kitch.
Dealer Test
Kitch.
Consult.
Test Kitch.
Food
Supplier
Kitch.
Where Do You Test New E&S Products?
Foodservice Equipment Reports ©2014
Other Testing & Evaluation Procedures
• Chain buyers most often test and evaluate new E&S
products in existing operating units.
• But a significant number have on-site test facilities.
• The testing is the key determinate of the E&S product’s
impact on food product quality.
• But chains also test to help them determine operational
impacts, speed of service impacts, etc.
• Big chains have very rigorous supplier testing and vetting
processes including factory visits, financial vetting,
service network reach and warranty history analysis.
Foodservice Equipment Reports ©2014
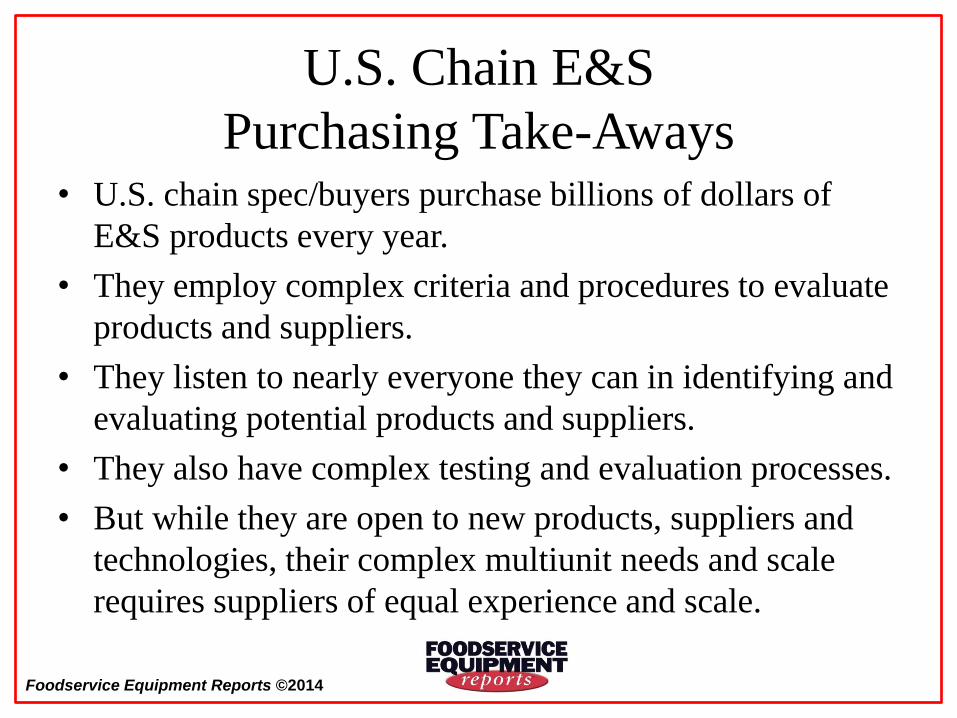
U.S. Chain E&S
Purchasing Take-Aways • U.S. chain spec/buyers purchase billions of dollars of
E&S products every year.
• They employ complex criteria and procedures to evaluate
products and suppliers.
• They listen to nearly everyone they can in identifying and
evaluating potential products and suppliers.
• They also have complex testing and evaluation processes.
• But while they are open to new products, suppliers and
technologies, their complex multiunit needs and scale
requires suppliers of equal experience and scale.
Foodservice Equipment Reports ©2014
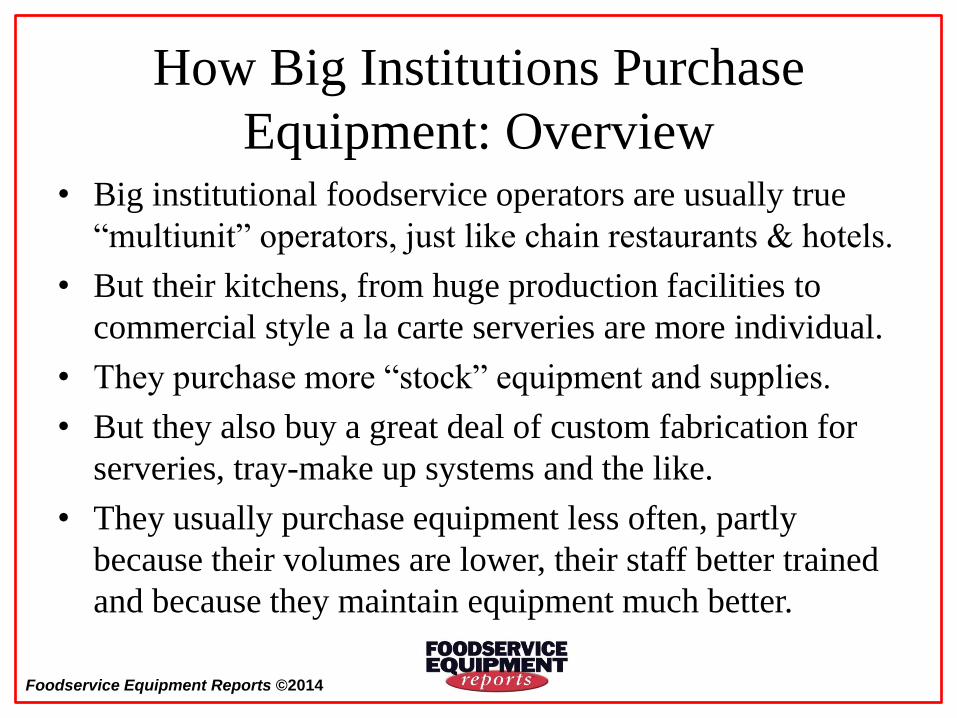
How Big Institutions Purchase
Equipment: Overview • Big institutional foodservice operators are usually true
“multiunit” operators, just like chain restaurants & hotels.
• But their kitchens, from huge production facilities to
commercial style a la carte serveries are more individual.
• They purchase more “stock” equipment and supplies.
• But they also buy a great deal of custom fabrication for
serveries, tray-make up systems and the like.
• They usually purchase equipment less often, partly
because their volumes are lower, their staff better trained
and because they maintain equipment much better.
Foodservice Equipment Reports ©2014
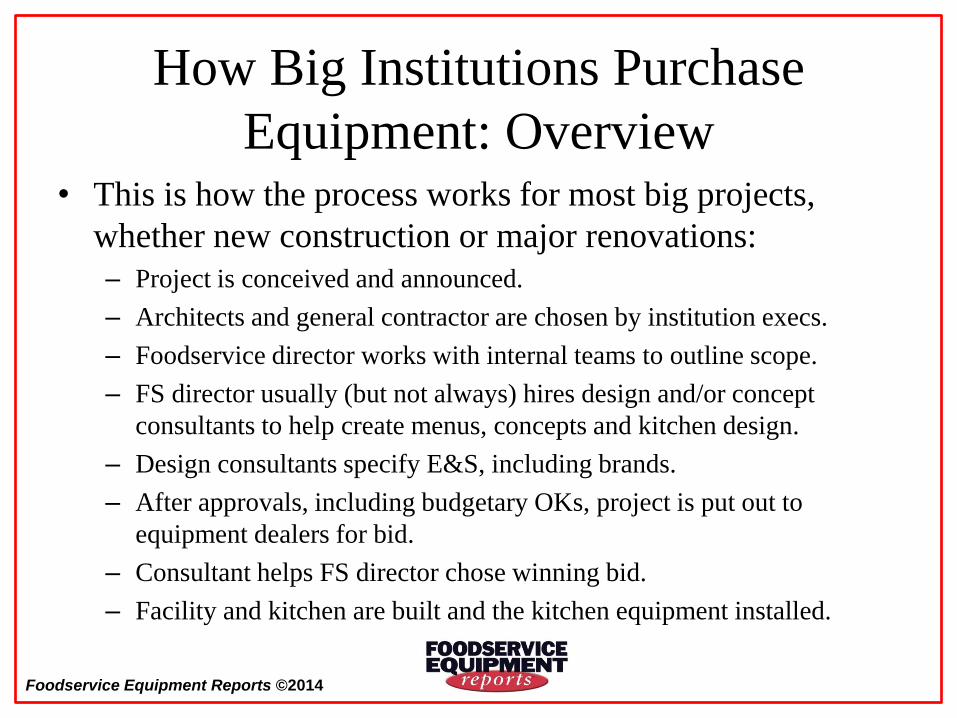
How Big Institutions Purchase
Equipment: Overview • This is how the process works for most big projects,
whether new construction or major renovations:
– Project is conceived and announced.
– Architects and general contractor are chosen by institution execs.
– Foodservice director works with internal teams to outline scope.
– FS director usually (but not always) hires design and/or concept
consultants to help create menus, concepts and kitchen design.
– Design consultants specify E&S, including brands.
– After approvals, including budgetary OKs, project is put out to
equipment dealers for bid.
– Consultant helps FS director chose winning bid.
– Facility and kitchen are built and the kitchen equipment installed.
Foodservice Equipment Reports ©2014
How Big Institutions Purchase
Equipment: Overview • But in fact there is a lot more complication and back and
forth than the “normal” process entails.
• The architect/GCs sometimes select the foodservice
consultant without the foodservice director’s input.
• Lots of “prime specs” are broken for monetary reasons,
both budgetary and to help the dealers make some money.
• Since most dealers belong to buying groups, back-end
rebates help offset traditionally low bid-work margins
• Normal replacement is more dealer-based, but beyond an
item or two still usually requires a bid process.
Foodservice Equipment Reports ©2014
How Big Institutions Purchase
Equipment: Overview • Because of the size of the projects—equipment packages run
into the millions—OEMs and their reps “sit” on the
foodservice directors, consultants, dealers and others involved.
• In the noncommercial world, the foodservice director is clearly
the key specifier.
• They often have a great deal of E&S brand knowledge and
opinions, based on experience.
• The opinions of culinary staff are listened to very closely.
• And because many institutions have dedicated facilities
personnel, they have good data on maintenance and reliability.
Foodservice Equipment Reports ©2014
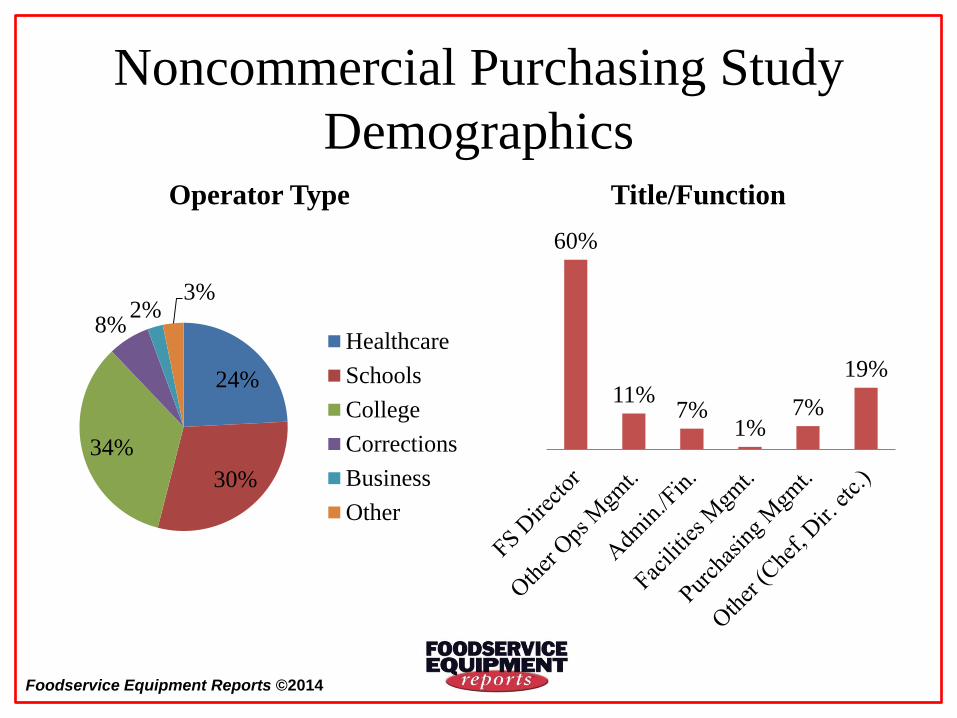
Noncommercial Purchasing Study
Demographics
24%
30%
34%
8% 2%
3%
Operator Type
Healthcare
Schools
College
Corrections
Business
Other
60%
11% 7%
1% 7%
19%
Title/Function
Foodservice Equipment Reports ©2014
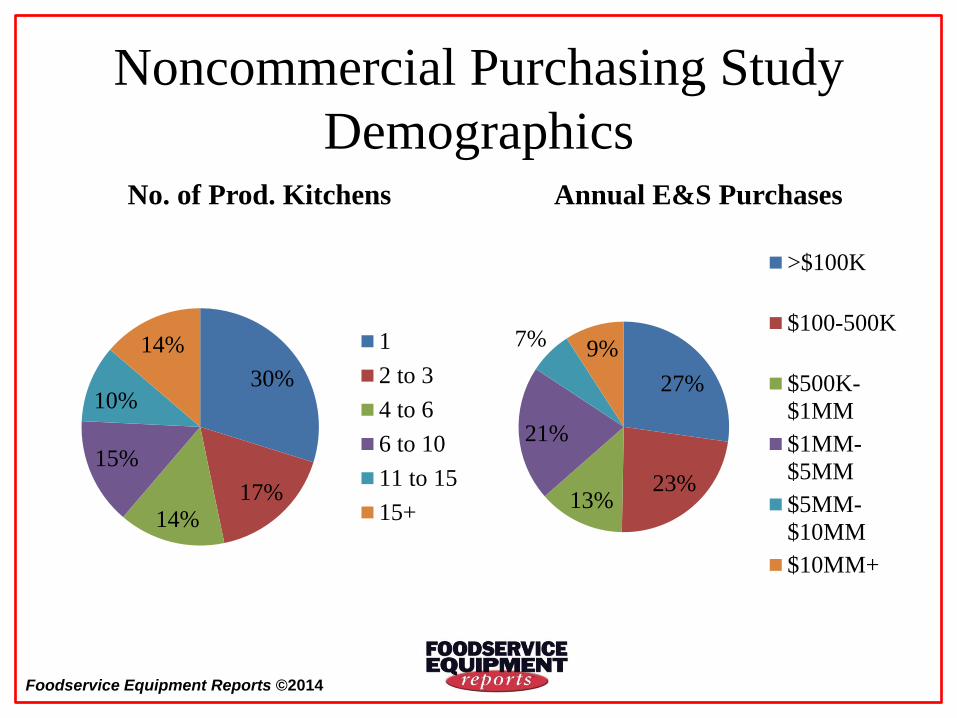
Noncommercial Purchasing Study
Demographics
30%
17% 14%
15%
10%
14%
No. of Prod. Kitchens
1
2 to 3
4 to 6
6 to 10
11 to 15
15+
27%
23% 13%
21%
7% 9%
Annual E&S Purchases
>$100K
$100-500K
$500K-
$1MM
$1MM-
$5MM
$5MM-
$10MM
$10MM+
Foodservice Equipment Reports ©2014
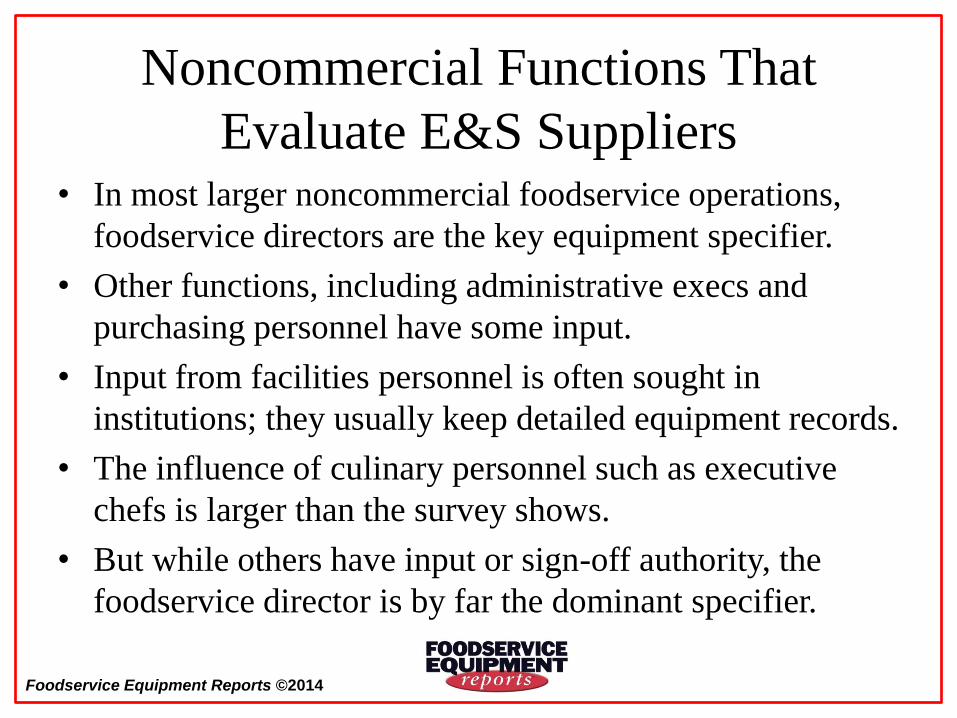
Noncommercial Functions That
Evaluate E&S Suppliers • In most larger noncommercial foodservice operations,
foodservice directors are the key equipment specifier.
• Other functions, including administrative execs and
purchasing personnel have some input.
• Input from facilities personnel is often sought in
institutions; they usually keep detailed equipment records.
• The influence of culinary personnel such as executive
chefs is larger than the survey shows.
• But while others have input or sign-off authority, the
foodservice director is by far the dominant specifier.
Foodservice Equipment Reports ©2014
Noncommercial Functions That
Evaluate E&S Suppliers
90%
53% 44%
52% 48%
7%
Have Some Input
(All That Apply) 63%
9% 12% 4%
11% 2%
Have Most Input
(Name One Only)
Foodservice Equipment Reports ©2014
Outside Influences On Noncommercial
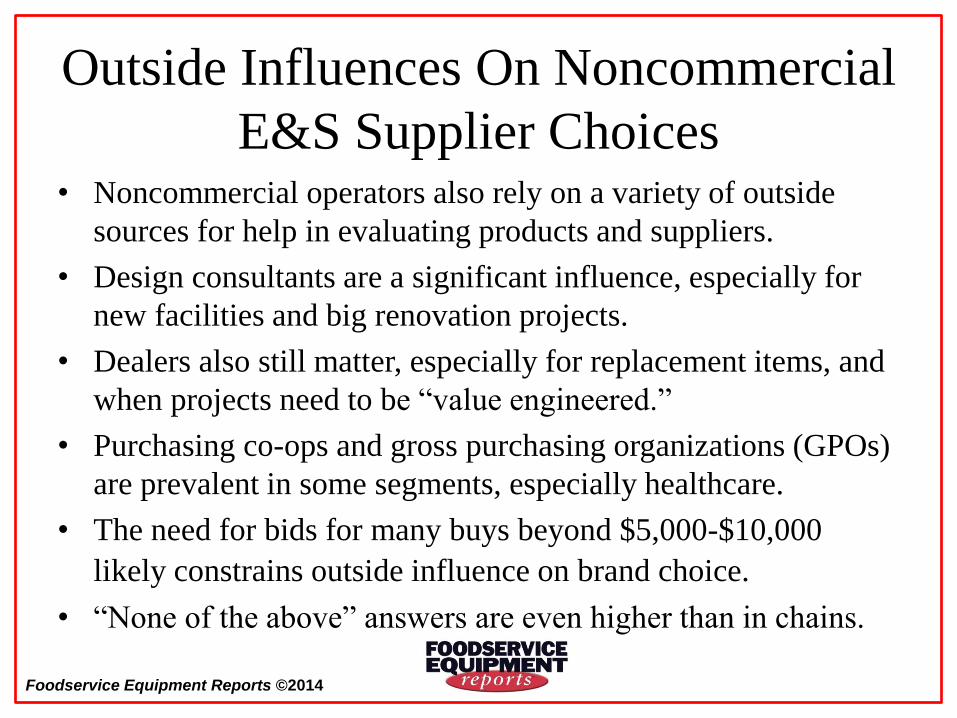
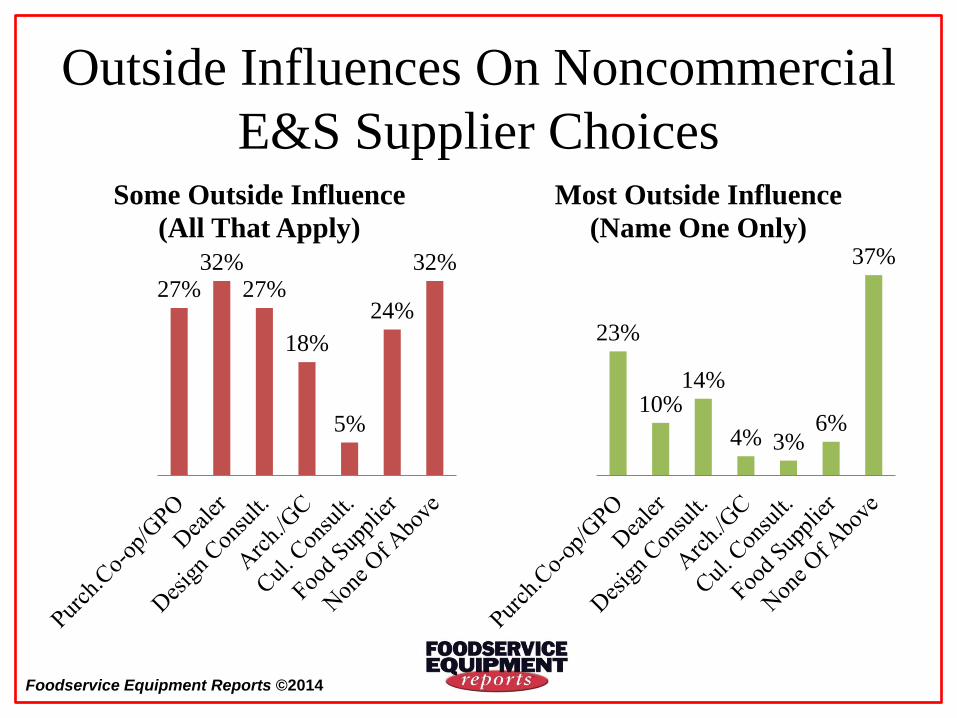
E&S Supplier Choices • Noncommercial operators also rely on a variety of outside
sources for help in evaluating products and suppliers.
• Design consultants are a significant influence, especially for
new facilities and big renovation projects.
• Dealers also still matter, especially for replacement items, and
when projects need to be “value engineered.”
• Purchasing co-ops and gross purchasing organizations (GPOs)
are prevalent in some segments, especially healthcare.
• The need for bids for many buys beyond $5,000-$10,000
likely constrains outside influence on brand choice.
• “None of the above” answers are even higher than in chains.
Foodservice Equipment Reports ©2014
Outside Influences On Noncommercial
E&S Supplier Choices
27% 32%
27%
18%
5%
24%
32%
Some Outside Influence
(All That Apply)
23%
10% 14%
4% 3% 6%
37%
Most Outside Influence
(Name One Only)
Foodservice Equipment Reports ©2014
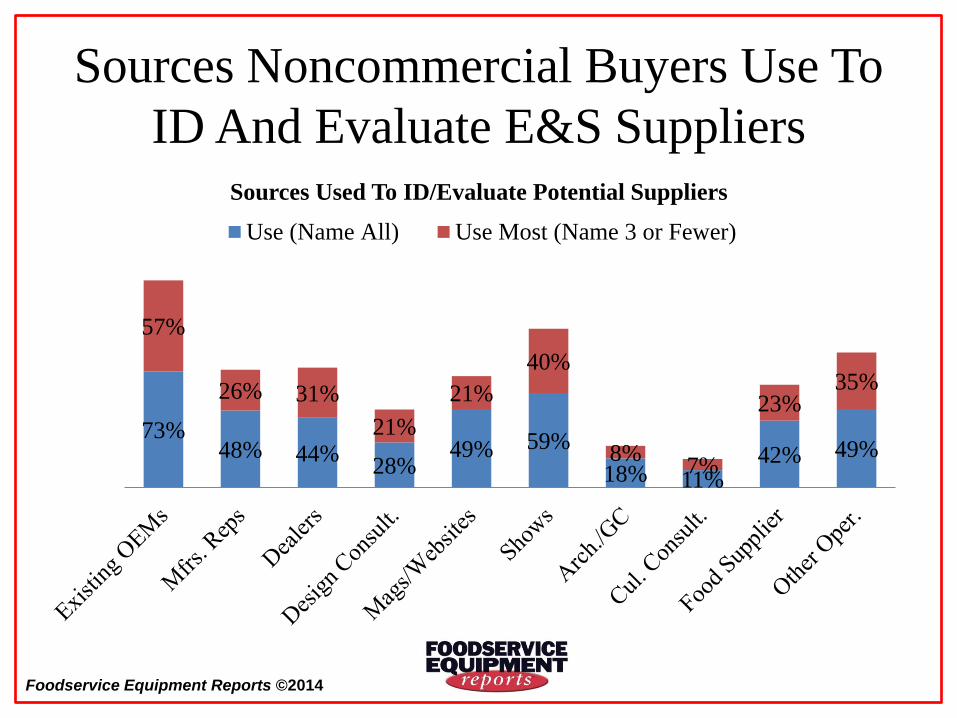
Sources Noncommercial Buyers Use To
ID And Evaluate E&S Suppliers
• Noncommercial operators also use a wide variety of
sources to identify E&S products and suppliers.
• Dealers, trade media, consultants and food suppliers are a
source for nearly half of all survey respondents at times.
• And their mentions when the choices are limited to three
or fewer remain quite high.
• But as we saw on the chain side, OEM suppliers and their
reps are the most commonly noted sources of info.
• Trade shows are very important to this audience, as are
recommendations from other operators.
Foodservice Equipment Reports ©2014
Sources Noncommercial Buyers Use To
ID And Evaluate E&S Suppliers
73% 48% 44%
28% 49% 59%
18% 11% 42% 49%
57%
26% 31%
21%
21%
40%
8% 7%
23% 35%
Sources Used To ID/Evaluate Potential Suppliers
Use (Name All) Use Most (Name 3 or Fewer)
Foodservice Equipment Reports ©2014
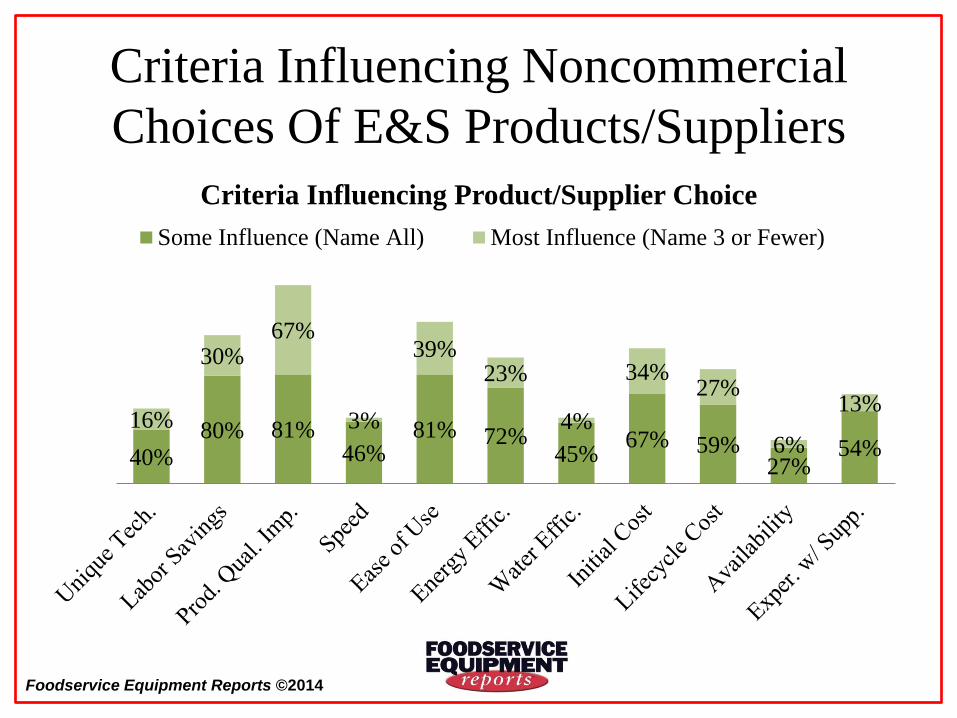
Criteria Influencing Noncommercial
Choices Of E&S Products/Suppliers
• The impact on product quality and labor savings and ease
of use issues are again the critical criteria in E&S choices.
• Initial cost is still a very important criteria, but somewhat
less so than with chain buyers.
• Lifecycle cost, on the other hand, is more important.
• Both energy efficiency and water efficiency rank higher
as criteria among noncommercial buyers.
• Energy efficiency is the fourth highest ranked criteria
having some influence.
• Speed and availability are cited least often.
Foodservice Equipment Reports ©2014
Criteria Influencing Noncommercial
Choices Of E&S Products/Suppliers
40% 80% 81%
46% 81% 72%
45% 67% 59%
27% 54%
16%
30% 67%
3%
39% 23%
4%
34% 27%
6%
13%
Criteria Influencing Product/Supplier Choice
Some Influence (Name All) Most Influence (Name 3 or Fewer)
Foodservice Equipment Reports ©2014
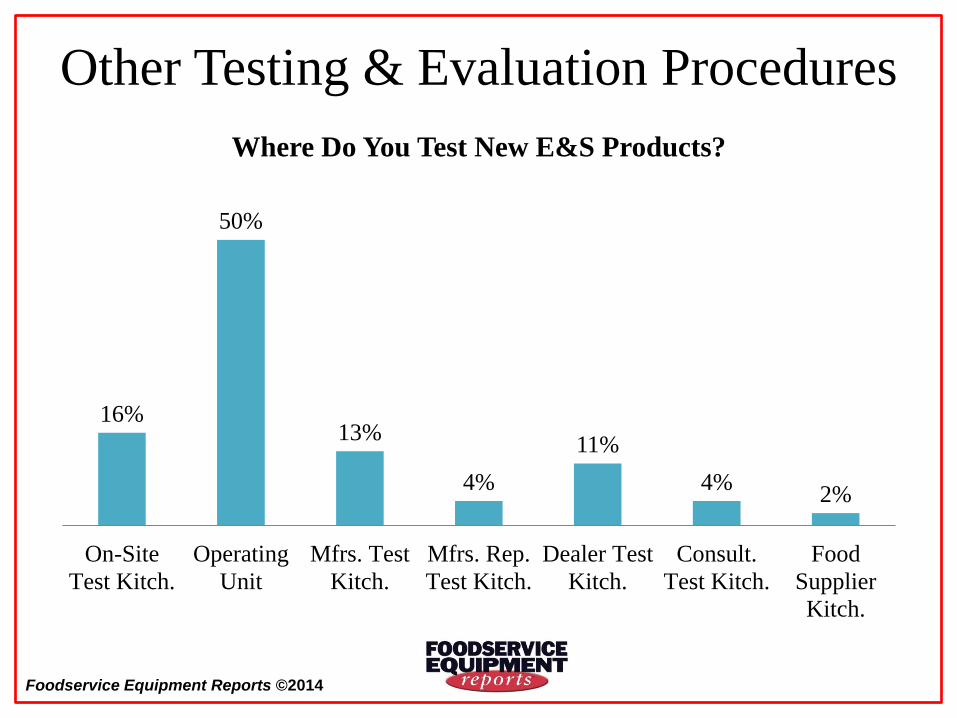
Other Testing & Evaluation Procedures
16%
50%
13%
4%
11%
4% 2%
On-Site
Test Kitch.
Operating
Unit
Mfrs. Test
Kitch.
Mfrs. Rep.
Test Kitch.
Dealer Test
Kitch.
Consult.
Test Kitch.
Food
Supplier
Kitch.
Where Do You Test New E&S Products?
Foodservice Equipment Reports ©2014
Other Testing & Evaluation Procedures
• Equipment testing and evaluation in noncommercial
operation most often takes place in an operating kitchen.
• But nearly one out of six operators has a test facility.
• And noncomm operators are more like to use a dealer or
manufacturers’ rep test kitchen than chain buyers.
• As in chains, the key criteria are checking impact on food
quality and labor and ease of use issues.
• Since institutional kitchens generally use more stock
equipment items with fewer pre-programed controls,
control interface issues loom large in testing.
Foodservice Equipment Reports ©2014
Noncommercial Operator E&S
Purchasing Take-Aways • “Beyond restaurants” segments account for as much a 40% of
the E&S market in the U.S.
• Big institutions are very big buyers of E&S, not just when they
build new facilities or renovate, but for replacement.
• They employ many of the same criteria and use many of the
same outside sources as big chain players.
• As with chains, while dealers, consultants and others are
important influences, the OEMs are again prime sources.
• Word of mouth recommendations from fellow operators is also
a very big influence on supplier and product choice.
• The foodservice director is queen (or king) of specifications.
Foodservice Equipment Reports ©2014
Closing Thoughts
• Breaking in to these large multiunit organizations as an
E&S supplier is difficult and complex. It can take years.
• But the value of such customers is so great, world-class
suppliers always find it worth the effort.
• Knowing the complexities and criteria makes it possible
to develop a plan of engagement.
• Remember each organization is unique.
• When we asked what one thing suppliers could do to
make the task of selecting then easier, they answered,
“Work harder to understand my operation.”
Foodservice Equipment Reports ©2014
Thank You
And
Good Luck!
Foodservice Equipment Reports ©2014
Acknowledgements & Sources
• This complete presentation is can be downloaded at
fermag.com/medialibrary/research.
• We thank Technomic Inc. for the generous sharing of their research.
More information on their extensive products and capabilities is at
technomic.com.
• We thank The NPD Group for allowing us use of their multi-faceted
research. More info is at npd.com.
• We want to thank Hotelex and UBM SinoExpo for their ongoing
support of the Foodservice Forum. Special thanks to Zoi Fan, Alex
Ni and Alvina Kwok.
• Not least, we thank our Forum sponsors: Greenfield World Trade,
Alto-Shaam, Scotsman/Ali Group, T&S Brass and Halton.


![Il-fer] ta’ grazzja [dida Il-fer] ta’ ]a[a [dida](https://img.pdfslide.us/doc/110x75/5697c0241a28abf838cd4ad1/il-fer-ta-grazzja-dida-il-fer-ta-aa-dida.jpg)
![FER, B. 3. Surrealismo, Mito e Psicanálise in FER, B Et Alli [1993]](https://img.pdfslide.us/doc/110x75/563dbb96550346aa9aae78df/fer-b-3-surrealismo-mito-e-psicanalise-in-fer-b-et-alli-1993.jpg)