Embed Size (px)
Citation preview

University of Calgary
PRISM: University of Calgary's Digital Repository
Cumming School of Medicine Cumming School of Medicine Research & Publications
2003-12-16
A new growth chart for preterm babies: Babson and
Benda's chart updated with recent data and a new
format
Fenton, Tanis R.
BioMed Central
Fenton, T. R. "A new growth chart for preterm babies: Babson and Benda's chart updated with
recent data and a new format". BMC Pediatrics 2003, 3:13 (16 December 2003).
http://hdl.handle.net/1880/47617
journal article
Downloaded from PRISM: https://prism.ucalgary.ca
BioMed CentralBMC Pediatrics
ss
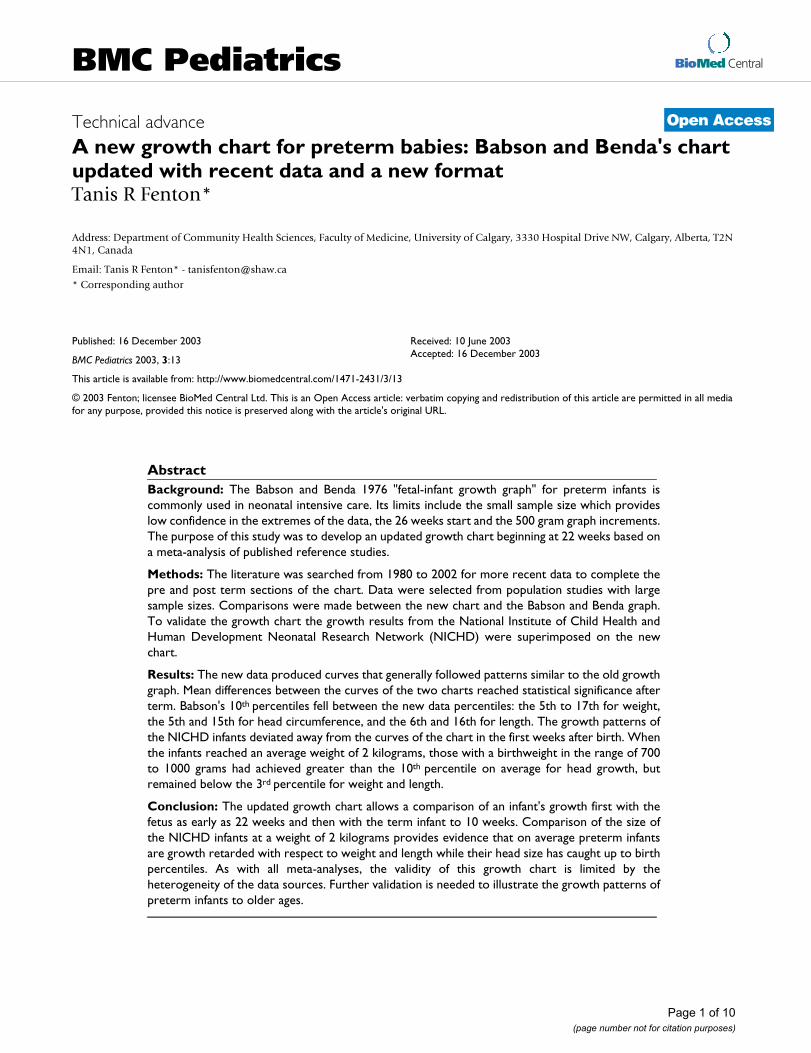
Open AcceTechnical advanceA new growth chart for preterm babies: Babson and Benda's chart updated with recent data and a new formatTanis R Fenton*Address: Department of Community Health Sciences, Faculty of Medicine, University of Calgary, 3330 Hospital Drive NW, Calgary, Alberta, T2N 4N1, Canada
Email: Tanis R Fenton* - [email protected]
* Corresponding author
AbstractBackground: The Babson and Benda 1976 "fetal-infant growth graph" for preterm infants iscommonly used in neonatal intensive care. Its limits include the small sample size which provideslow confidence in the extremes of the data, the 26 weeks start and the 500 gram graph increments.The purpose of this study was to develop an updated growth chart beginning at 22 weeks based ona meta-analysis of published reference studies.
Methods: The literature was searched from 1980 to 2002 for more recent data to complete thepre and post term sections of the chart. Data were selected from population studies with largesample sizes. Comparisons were made between the new chart and the Babson and Benda graph.To validate the growth chart the growth results from the National Institute of Child Health andHuman Development Neonatal Research Network (NICHD) were superimposed on the newchart.
Results: The new data produced curves that generally followed patterns similar to the old growthgraph. Mean differences between the curves of the two charts reached statistical significance afterterm. Babson's 10th percentiles fell between the new data percentiles: the 5th to 17th for weight,the 5th and 15th for head circumference, and the 6th and 16th for length. The growth patterns ofthe NICHD infants deviated away from the curves of the chart in the first weeks after birth. Whenthe infants reached an average weight of 2 kilograms, those with a birthweight in the range of 700to 1000 grams had achieved greater than the 10th percentile on average for head growth, butremained below the 3rd percentile for weight and length.
Conclusion: The updated growth chart allows a comparison of an infant's growth first with thefetus as early as 22 weeks and then with the term infant to 10 weeks. Comparison of the size ofthe NICHD infants at a weight of 2 kilograms provides evidence that on average preterm infantsare growth retarded with respect to weight and length while their head size has caught up to birthpercentiles. As with all meta-analyses, the validity of this growth chart is limited by theheterogeneity of the data sources. Further validation is needed to illustrate the growth patterns ofpreterm infants to older ages.
Published: 16 December 2003
BMC Pediatrics 2003, 3:13
Received: 10 June 2003Accepted: 16 December 2003
This article is available from: http://www.biomedcentral.com/1471-2431/3/13
© 2003 Fenton; licensee BioMed Central Ltd. This is an Open Access article: verbatim copying and redistribution of this article are permitted in all media for any purpose, provided this notice is preserved along with the article's original URL.
Page 1 of 10(page number not for citation purposes)
BMC Pediatrics 2003, 3 http://www.biomedcentral.com/1471-2431/3/13
BackgroundGrowth monitoring is a part of the medical and nutri-tional assessment of preterm infants. Growth charts pro-vide the basis for this assessment by providing acomparison to a reference which allows for a visual pic-ture of both the infant's achieved size and growth trajec-tory. Parents and health professionals like to knowwhether a preterm infant is able to maintain growth veloc-ity or achieve catch-up in growth compared to the fetusand the term infant. Intrauterine growth charts allow thiscomparison for infants before term. Babson and Benda(Babson) [1] extended an intrauterine chart past term ageby including a section based on the growth of infants bornat term. They published this chart in 1976 which theyreferred to as a "fetal-infant growth graph".
The growth chart developed by Babson is still recom-mended for use in Neonatal Intensive Care Units [2,3]. Ina recent survey of 118 neonatal health professionals, thegrowth chart used most frequently was that of Babson [1](50%), followed by that of Lubchenco, Hansman &, Boyd[4] (42%) and then by the one by Dancis [5] (18%)(unpublished data).
Although commonly used, Babson's growth chart has lim-itations. The X axis begins at 26 weeks of gestation thuslimiting its usefulness to plot younger preterm infantsfrom birth. The Y axis is made in 500 gram incrementswhich make precise plotting difficult. The sample size ofthe data behind Babson's chart was small. There were only45 infants in their sample that were 30 weeks or younger[6]. The data was 15 years old at the time of publicationand is now 40 years old.
The purpose of this project was to prepare an updatedfetal-infant Babson-type growth chart for use in neonatalintensive care units. This chart will allow a comparison forpreterm infants as young as 22 weeks of gestation, firstwith intrauterine and then with post term references.
MethodsLiterature review and selectionA search of the literature was conducted on three data-bases (Pub Med, the Cochrane Library, EMBASE from1980 to June 2002) using the subject headings: infant,(premature, very low birthweight), anthropometry,growth, birthweight, head, cephalometry, gestational age,newborn, and reference values. Articles selected includedsurveys of intrauterine and post term growth. Referencelists of relevant articles were searched.
To improve on the Babson graph, two types of data wereneeded: infant size measured at the time of birth for theintrauterine section and term infant measurements for thepost-term section. Population studies with large sample
sizes were preferred to improve generalizability. TheWorld Health Organization has recommended that gesta-tional age of infants be described as completed weeks [7],so data stated in this manner were favored. Numericaldata were preferred over graphic depiction to ensureaccuracy.
Intrauterine dataThree recent large population based [8-10] surveys ofbirthweight for various gestational ages were identified inthe literature search. These studies used statistical meth-ods to delete implausible birth weight-gestational agecombinations and then smoothed the birth weight curvesacross gestational age categories. The Canadian study byKramer et al [8] was selected for the intrauterine weightsection since their methods produced the most plausibledistribution of birth weights particularly for 28 through36 weeks. For example, the 50th and 90th percentiles for 32weeks in Alexander's corrected data were 2.2 and 3.2 kilo-grams (kg) respectively. The 50th and 90th percentiles for32 weeks in Kramer's corrected data were the more plausi-ble 1.9 and 2.3 kg, respectively. Kramer et al used a statis-tical method to correct for misclassification of terminfants incorrectly labeled as preterm. Table 1 lists detailsregarding the data sources used.
Two population based studies that met the a priori criteriaincluded head circumference and length, one from Swe-den by Niklasson et al [11] and one from Australia byBeeby et al [12]. A limitation with the Swedish survey wasthat it did not include data prior to 29 weeks, howeverboth were used since the Swedish study was based on alarge sample.
To develop the head circumference and length curves, thenumerical data from Niklasson [11] and Beeby [12] wereaveraged together using a weighted average based on totalsample size. Ideally the combining of these two datasources would have been done with the raw data to createone distribution for each gestational age, however thiswas not possible from the published data. Since the sam-ple sizes were very different (380,000 vs 30,000), theresulting weighted averages were predominantly influ-enced by the Swedish data. Therefore the head circumfer-ence and length curves are only Australian data prior to 30weeks and then predominately Swedish data after 30weeks.
There was remarkable consistency between the head andlength results from the Australian and Swedish studies.Between 31 and 33 weeks; the differences were less than0.3 centimeter (cm) for 50th percentiles and 0.4 cm for the10th and 90th percentile curves. The magnitudes of the dif-ferences were greater for data at 29 weeks and greater than36 weeks which may to be due to the way the Swedish
Page 2 of 10(page number not for citation purposes)
BMC Pediatrics 2003, 3 http://www.biomedcentral.com/1471-2431/3/13
data was reported. These data were expressed as a thirddegree polynomial function, so their curves were curveddownward at both ends. At the ends of the curves the dif-ferences increased to 0.4 cm at both ends of the curve forhead circumference and to 0.8 cm (29 weeks) and 1.0 cm(40 weeks) for length. (This problem was dealt with underSmoothing of the Curves.) The consistency in the mid sec-tions of the curves provides confidence regarding the com-bining of the results from these two studies.
Post 40 week dataIn selecting the term infant data for the post 40 weeks sec-tion of the fetal-infant chart the Center for Disease Con-trol (CDC) [13-15] data met the a priori criteria of beingbased on large samples and having a numerical versionavailable. The CDC Growth Data is a compilation ofgrowth surveys of American multiracial-ethnic breast andformula fed infants born between 1963 and 1994 [13].The data are mostly cross sectional, but include some lon-gitudinal measures.
Chart developmentThe data for both genders were averaged together for the3rd, 10th, 50th, 90th and 97th percentiles to create onegrowth chart. Separate gender charts were not producedsince the gender differences were considered not impor-tant enough to warrant separate charts. The sample sizesfor the birthweight data are very large, so significant differ-
ences between the genders could be seen for most ageseven when the differences were small and of minor prac-tical importance. Specifically, the differences between themale and female weights were statistically significant at allages above 23 weeks for the 50th percentile (beginningwith a difference of 32 grams) and above 24 weeks for the3rd percentile (beginning with a difference of 44 grams).None of the head and length or the CDC data werereported in a manner that permitted a statistical compari-son by gender.
The largest differences between the genders were confinedto late gestation and after term. Along the 3rd percentile,there was only one weight difference between the gendersthat was greater than 100 grams (40 weeks) and none ofthe head differences were greater than 0.4 cm. The differ-ences between the genders along the 10th percentile werelimited to greater than 36 weeks for weight differencesgreater than 100 grams and only 1 head difference wasgreater than 0.6 cm. Along the 50th percentile the only dif-ferences between the genders for weight more than 100grams were greater than 35 weeks and the only head dif-ferences greater than 0.4 cm were after term. For each ofthese three percentiles, only 1 length measure was greaterthan 1 cm and all of these were after term.
A large-scale grid was used to aid accuracy of plotting. Theincrements were 100 grams for weight, one cm for head
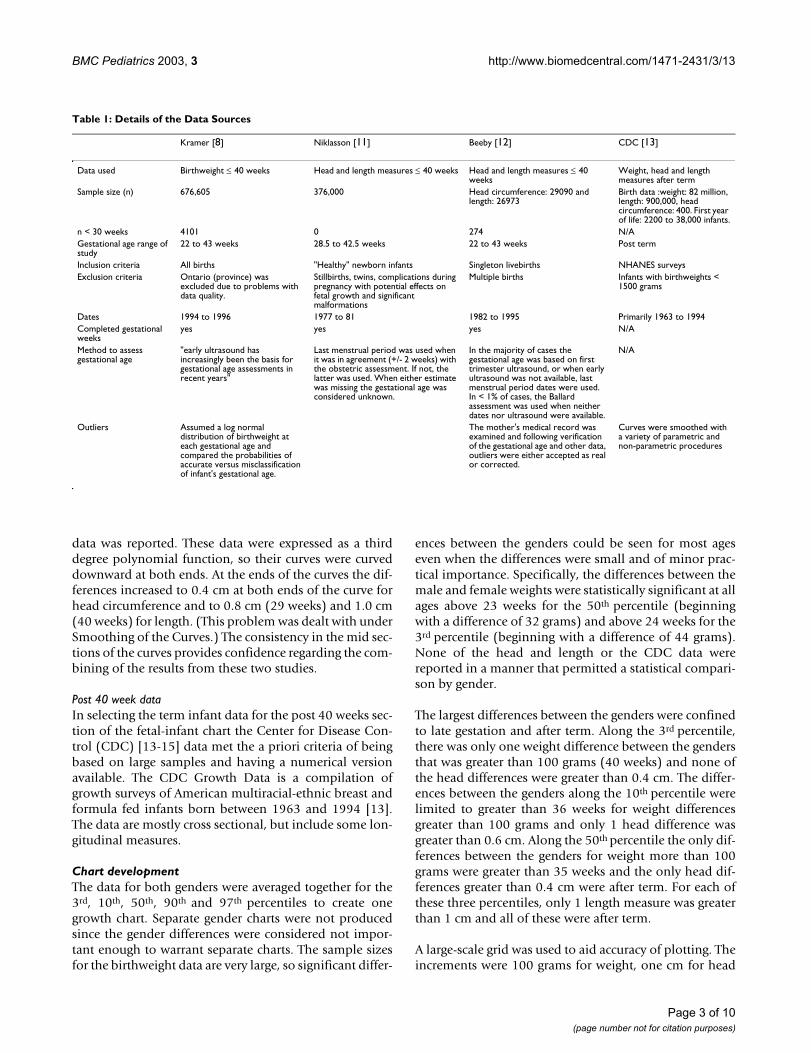
Table 1: Details of the Data Sources
Kramer [8] Niklasson [11] Beeby [12] CDC [13]
Data used Birthweight ≤ 40 weeks Head and length measures ≤ 40 weeks Head and length measures ≤ 40 weeks
Weight, head and length measures after term
Sample size (n) 676,605 376,000 Head circumference: 29090 and length: 26973
Birth data :weight: 82 million, length: 900,000, head circumference: 400. First year of life: 2200 to 38,000 infants.
n < 30 weeks 4101 0 274 N/AGestational age range of study
22 to 43 weeks 28.5 to 42.5 weeks 22 to 43 weeks Post term
Inclusion criteria All births "Healthy" newborn infants Singleton livebirths NHANES surveysExclusion criteria Ontario (province) was
excluded due to problems with data quality.
Stillbirths, twins, complications during pregnancy with potential effects on fetal growth and significant malformations
Multiple births Infants with birthweights < 1500 grams
Dates 1994 to 1996 1977 to 81 1982 to 1995 Primarily 1963 to 1994Completed gestational weeks
yes yes yes N/A
Method to assess gestational age
"early ultrasound has increasingly been the basis for gestational age assessments in recent years"
Last menstrual period was used when it was in agreement (+/- 2 weeks) with the obstetric assessment. If not, the latter was used. When either estimate was missing the gestational age was considered unknown.
In the majority of cases the gestational age was based on first trimester ultrasound, or when early ultrasound was not available, last menstrual period dates were used. In < 1% of cases, the Ballard assessment was used when neither dates nor ultrasound were available.
N/A
Outliers Assumed a log normal distribution of birthweight at each gestational age and compared the probabilities of accurate versus misclassification of infant's gestational age.
The mother's medical record was examined and following verification of the gestational age and other data, outliers were either accepted as real or corrected.
Curves were smoothed with a variety of parametric and non-parametric procedures
Page 3 of 10(page number not for citation purposes)
BMC Pediatrics 2003, 3 http://www.biomedcentral.com/1471-2431/3/13
circumference and length, and one-week intervals fortime. The chart was extended to 50 weeks since the major-ity of preterm infants are discharged home by this age.Spaces were made at the bottom of the chart to note thedate of measurements. The 3rd, 10th, 50th, 90th and 97thpercentile curves for weight, head circumference andlength were plotted on the grid. There were disjunctionsbetween the data sets at 40 weeks. For example, the CDC50th percentile for weight was 2% lower than the Kramervalue, while the 3rd percentile was 14% lower. The dis-junctions between the pre and post-term sections arelikely due to artifacts of the original data sets and theprocessing methods.
Smoothing of curvesTo produce a working chart, the disjunctions between thepre and post term sections needed to be smoothed. It wasdifficult to merge the pre- and post-term data sets at theirboundaries. The goal of the smoothing was to produce abridge between the pre-term and the post-term curveswithout the typical deceleration seen in intrauterinecurves just before term. Initial approaches to numericallysmooth the boundary produced obvious undesirableresults. Therefore manual methods were used to smooththe disjunction from the deceleration point of the pre-term curves to a point prior to the first measurement afterterm (at 2 months).
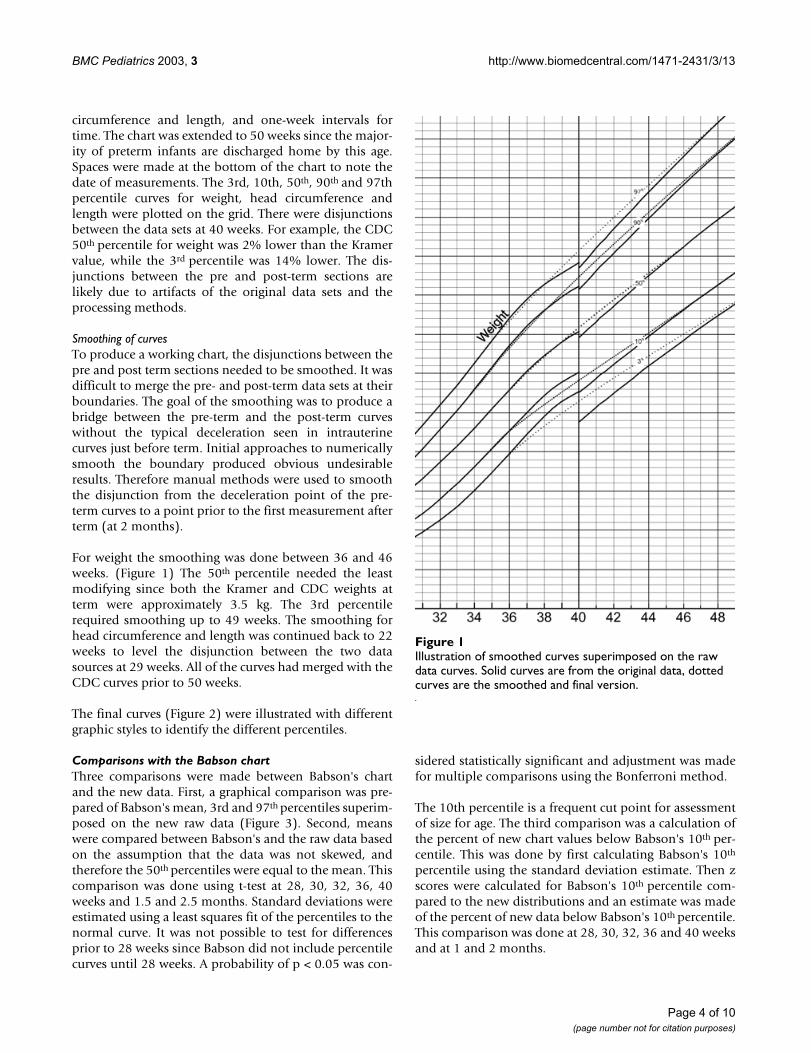
For weight the smoothing was done between 36 and 46weeks. (Figure 1) The 50th percentile needed the leastmodifying since both the Kramer and CDC weights atterm were approximately 3.5 kg. The 3rd percentilerequired smoothing up to 49 weeks. The smoothing forhead circumference and length was continued back to 22weeks to level the disjunction between the two datasources at 29 weeks. All of the curves had merged with theCDC curves prior to 50 weeks.
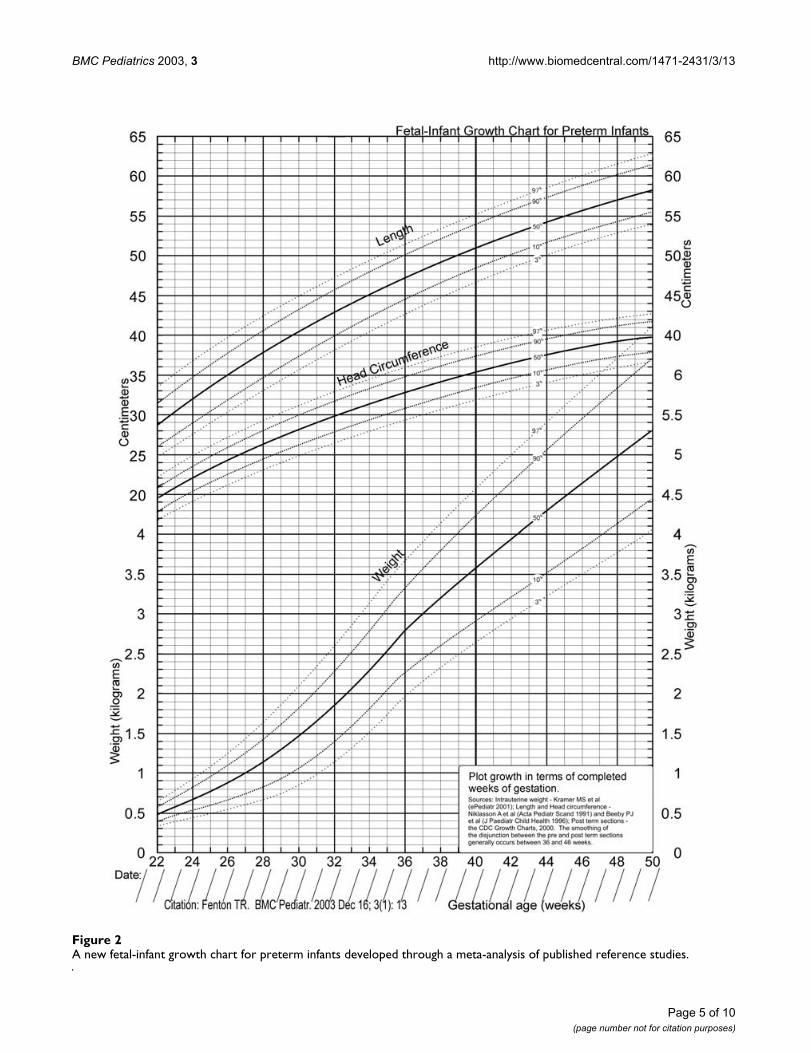
The final curves (Figure 2) were illustrated with differentgraphic styles to identify the different percentiles.
Comparisons with the Babson chartThree comparisons were made between Babson's chartand the new data. First, a graphical comparison was pre-pared of Babson's mean, 3rd and 97th percentiles superim-posed on the new raw data (Figure 3). Second, meanswere compared between Babson's and the raw data basedon the assumption that the data was not skewed, andtherefore the 50th percentiles were equal to the mean. Thiscomparison was done using t-test at 28, 30, 32, 36, 40weeks and 1.5 and 2.5 months. Standard deviations wereestimated using a least squares fit of the percentiles to thenormal curve. It was not possible to test for differencesprior to 28 weeks since Babson did not include percentilecurves until 28 weeks. A probability of p < 0.05 was con-
sidered statistically significant and adjustment was madefor multiple comparisons using the Bonferroni method.
The 10th percentile is a frequent cut point for assessmentof size for age. The third comparison was a calculation ofthe percent of new chart values below Babson's 10th per-centile. This was done by first calculating Babson's 10th
percentile using the standard deviation estimate. Then zscores were calculated for Babson's 10th percentile com-pared to the new distributions and an estimate was madeof the percent of new data below Babson's 10th percentile.This comparison was done at 28, 30, 32, 36 and 40 weeksand at 1 and 2 months.
Illustration of smoothed curves superimposed on the raw data curvesFigure 1Illustration of smoothed curves superimposed on the raw data curves. Solid curves are from the original data, dotted curves are the smoothed and final version.
Page 4 of 10(page number not for citation purposes)
BMC Pediatrics 2003, 3 http://www.biomedcentral.com/1471-2431/3/13
A new fetal-infant growth chart for preterm infants developed through a meta-analysis of published reference studiesFigure 2A new fetal-infant growth chart for preterm infants developed through a meta-analysis of published reference studies.
Page 5 of 10(page number not for citation purposes)
BMC Pediatrics 2003, 3 http://www.biomedcentral.com/1471-2431/3/13
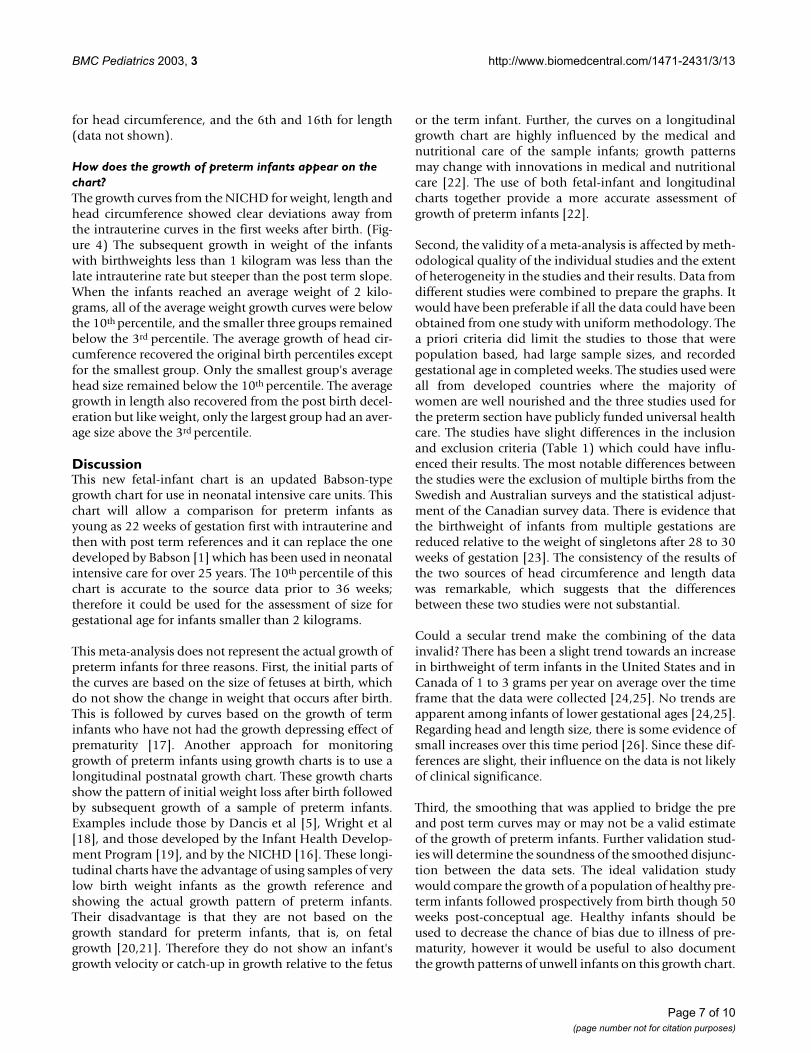
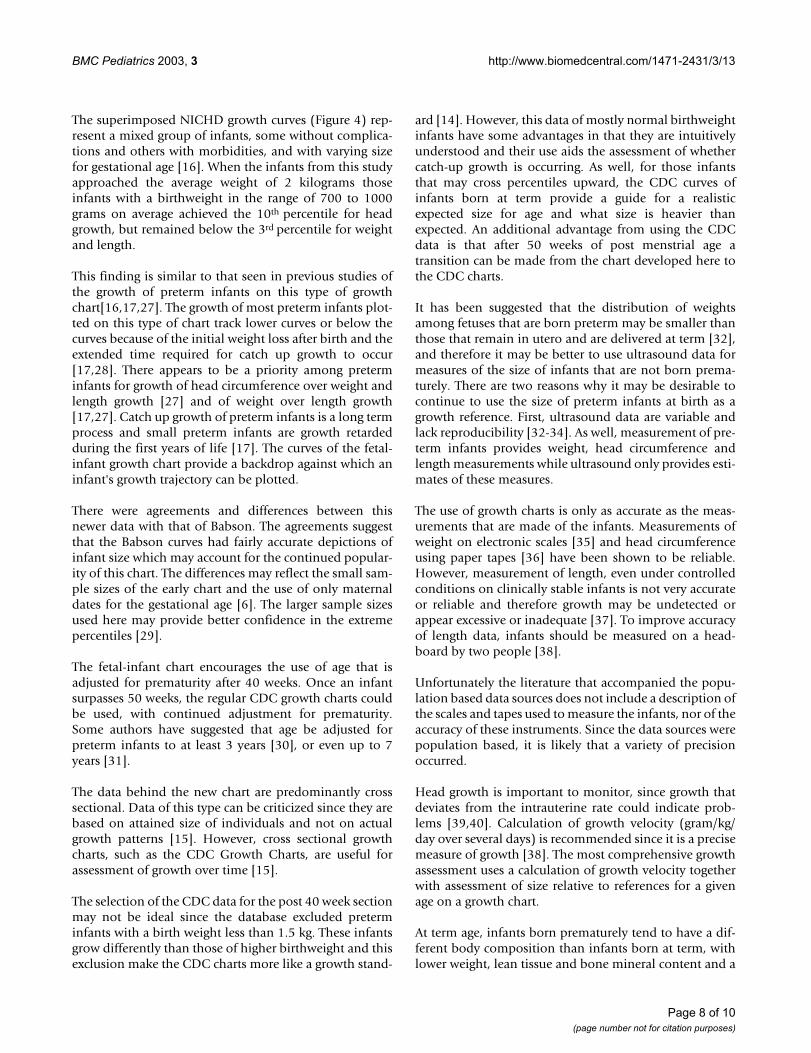
How does the growth of preterm infants appear on the chart?The data from the large multicenter cohort study done bythe National Institute of Child Health and Human Devel-opment Neonatal Research Network (NICHD) [16] weresuperimposed on the new growth chart (Figure 4). Thisstudy documented the growth patterns of 1660 very lowbirthweight infants born in 1994 and 1995. Infants withanomalies and those that did not survive were excludedfrom the study, but those with a variety of morbiditieswere included. For this comparison, the growth trends ofthe infants of average birthweights 550, 750, 950 and1450 were used.
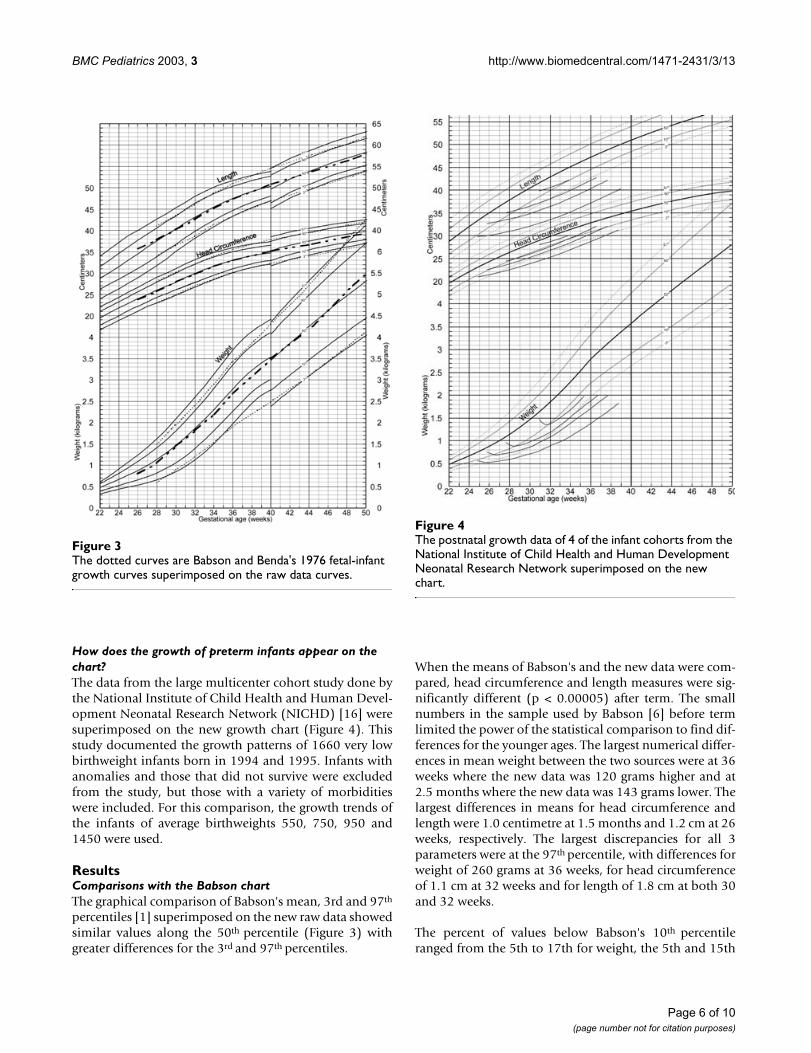
ResultsComparisons with the Babson chartThe graphical comparison of Babson's mean, 3rd and 97th
percentiles [1] superimposed on the new raw data showedsimilar values along the 50th percentile (Figure 3) withgreater differences for the 3rd and 97th percentiles.
When the means of Babson's and the new data were com-pared, head circumference and length measures were sig-nificantly different (p < 0.00005) after term. The smallnumbers in the sample used by Babson [6] before termlimited the power of the statistical comparison to find dif-ferences for the younger ages. The largest numerical differ-ences in mean weight between the two sources were at 36weeks where the new data was 120 grams higher and at2.5 months where the new data was 143 grams lower. Thelargest differences in means for head circumference andlength were 1.0 centimetre at 1.5 months and 1.2 cm at 26weeks, respectively. The largest discrepancies for all 3parameters were at the 97th percentile, with differences forweight of 260 grams at 36 weeks, for head circumferenceof 1.1 cm at 32 weeks and for length of 1.8 cm at both 30and 32 weeks.
The percent of values below Babson's 10th percentileranged from the 5th to 17th for weight, the 5th and 15th
The dotted curves are Babson and Benda's 1976 fetal-infant growth curves superimposed on the raw data curvesFigure 3The dotted curves are Babson and Benda's 1976 fetal-infant growth curves superimposed on the raw data curves.
The postnatal growth data of 4 of the infant cohorts from the National Institute of Child Health and Human Development Neonatal Research Network superimposed on the new chartFigure 4The postnatal growth data of 4 of the infant cohorts from the National Institute of Child Health and Human Development Neonatal Research Network superimposed on the new chart.
Page 6 of 10(page number not for citation purposes)
BMC Pediatrics 2003, 3 http://www.biomedcentral.com/1471-2431/3/13
for head circumference, and the 6th and 16th for length(data not shown).
How does the growth of preterm infants appear on the chart?The growth curves from the NICHD for weight, length andhead circumference showed clear deviations away fromthe intrauterine curves in the first weeks after birth. (Fig-ure 4) The subsequent growth in weight of the infantswith birthweights less than 1 kilogram was less than thelate intrauterine rate but steeper than the post term slope.When the infants reached an average weight of 2 kilo-grams, all of the average weight growth curves were belowthe 10th percentile, and the smaller three groups remainedbelow the 3rd percentile. The average growth of head cir-cumference recovered the original birth percentiles exceptfor the smallest group. Only the smallest group's averagehead size remained below the 10th percentile. The averagegrowth in length also recovered from the post birth decel-eration but like weight, only the largest group had an aver-age size above the 3rd percentile.
DiscussionThis new fetal-infant chart is an updated Babson-typegrowth chart for use in neonatal intensive care units. Thischart will allow a comparison for preterm infants asyoung as 22 weeks of gestation first with intrauterine andthen with post term references and it can replace the onedeveloped by Babson [1] which has been used in neonatalintensive care for over 25 years. The 10th percentile of thischart is accurate to the source data prior to 36 weeks;therefore it could be used for the assessment of size forgestational age for infants smaller than 2 kilograms.
This meta-analysis does not represent the actual growth ofpreterm infants for three reasons. First, the initial parts ofthe curves are based on the size of fetuses at birth, whichdo not show the change in weight that occurs after birth.This is followed by curves based on the growth of terminfants who have not had the growth depressing effect ofprematurity [17]. Another approach for monitoringgrowth of preterm infants using growth charts is to use alongitudinal postnatal growth chart. These growth chartsshow the pattern of initial weight loss after birth followedby subsequent growth of a sample of preterm infants.Examples include those by Dancis et al [5], Wright et al[18], and those developed by the Infant Health Develop-ment Program [19], and by the NICHD [16]. These longi-tudinal charts have the advantage of using samples of verylow birth weight infants as the growth reference andshowing the actual growth pattern of preterm infants.Their disadvantage is that they are not based on thegrowth standard for preterm infants, that is, on fetalgrowth [20,21]. Therefore they do not show an infant'sgrowth velocity or catch-up in growth relative to the fetus
or the term infant. Further, the curves on a longitudinalgrowth chart are highly influenced by the medical andnutritional care of the sample infants; growth patternsmay change with innovations in medical and nutritionalcare [22]. The use of both fetal-infant and longitudinalcharts together provide a more accurate assessment ofgrowth of preterm infants [22].
Second, the validity of a meta-analysis is affected by meth-odological quality of the individual studies and the extentof heterogeneity in the studies and their results. Data fromdifferent studies were combined to prepare the graphs. Itwould have been preferable if all the data could have beenobtained from one study with uniform methodology. Thea priori criteria did limit the studies to those that werepopulation based, had large sample sizes, and recordedgestational age in completed weeks. The studies used wereall from developed countries where the majority ofwomen are well nourished and the three studies used forthe preterm section have publicly funded universal healthcare. The studies have slight differences in the inclusionand exclusion criteria (Table 1) which could have influ-enced their results. The most notable differences betweenthe studies were the exclusion of multiple births from theSwedish and Australian surveys and the statistical adjust-ment of the Canadian survey data. There is evidence thatthe birthweight of infants from multiple gestations arereduced relative to the weight of singletons after 28 to 30weeks of gestation [23]. The consistency of the results ofthe two sources of head circumference and length datawas remarkable, which suggests that the differencesbetween these two studies were not substantial.
Could a secular trend make the combining of the datainvalid? There has been a slight trend towards an increasein birthweight of term infants in the United States and inCanada of 1 to 3 grams per year on average over the timeframe that the data were collected [24,25]. No trends areapparent among infants of lower gestational ages [24,25].Regarding head and length size, there is some evidence ofsmall increases over this time period [26]. Since these dif-ferences are slight, their influence on the data is not likelyof clinical significance.
Third, the smoothing that was applied to bridge the preand post term curves may or may not be a valid estimateof the growth of preterm infants. Further validation stud-ies will determine the soundness of the smoothed disjunc-tion between the data sets. The ideal validation studywould compare the growth of a population of healthy pre-term infants followed prospectively from birth though 50weeks post-conceptual age. Healthy infants should beused to decrease the chance of bias due to illness of pre-maturity, however it would be useful to also documentthe growth patterns of unwell infants on this growth chart.
Page 7 of 10(page number not for citation purposes)
BMC Pediatrics 2003, 3 http://www.biomedcentral.com/1471-2431/3/13
The superimposed NICHD growth curves (Figure 4) rep-resent a mixed group of infants, some without complica-tions and others with morbidities, and with varying sizefor gestational age [16]. When the infants from this studyapproached the average weight of 2 kilograms thoseinfants with a birthweight in the range of 700 to 1000grams on average achieved the 10th percentile for headgrowth, but remained below the 3rd percentile for weightand length.
This finding is similar to that seen in previous studies ofthe growth of preterm infants on this type of growthchart[16,17,27]. The growth of most preterm infants plot-ted on this type of chart track lower curves or below thecurves because of the initial weight loss after birth and theextended time required for catch up growth to occur[17,28]. There appears to be a priority among preterminfants for growth of head circumference over weight andlength growth [27] and of weight over length growth[17,27]. Catch up growth of preterm infants is a long termprocess and small preterm infants are growth retardedduring the first years of life [17]. The curves of the fetal-infant growth chart provide a backdrop against which aninfant's growth trajectory can be plotted.
There were agreements and differences between thisnewer data with that of Babson. The agreements suggestthat the Babson curves had fairly accurate depictions ofinfant size which may account for the continued popular-ity of this chart. The differences may reflect the small sam-ple sizes of the early chart and the use of only maternaldates for the gestational age [6]. The larger sample sizesused here may provide better confidence in the extremepercentiles [29].
The fetal-infant chart encourages the use of age that isadjusted for prematurity after 40 weeks. Once an infantsurpasses 50 weeks, the regular CDC growth charts couldbe used, with continued adjustment for prematurity.Some authors have suggested that age be adjusted forpreterm infants to at least 3 years [30], or even up to 7years [31].
The data behind the new chart are predominantly crosssectional. Data of this type can be criticized since they arebased on attained size of individuals and not on actualgrowth patterns [15]. However, cross sectional growthcharts, such as the CDC Growth Charts, are useful forassessment of growth over time [15].
The selection of the CDC data for the post 40 week sectionmay not be ideal since the database excluded preterminfants with a birth weight less than 1.5 kg. These infantsgrow differently than those of higher birthweight and thisexclusion make the CDC charts more like a growth stand-
ard [14]. However, this data of mostly normal birthweightinfants have some advantages in that they are intuitivelyunderstood and their use aids the assessment of whethercatch-up growth is occurring. As well, for those infantsthat may cross percentiles upward, the CDC curves ofinfants born at term provide a guide for a realisticexpected size for age and what size is heavier thanexpected. An additional advantage from using the CDCdata is that after 50 weeks of post menstrial age atransition can be made from the chart developed here tothe CDC charts.
It has been suggested that the distribution of weightsamong fetuses that are born preterm may be smaller thanthose that remain in utero and are delivered at term [32],and therefore it may be better to use ultrasound data formeasures of the size of infants that are not born prema-turely. There are two reasons why it may be desirable tocontinue to use the size of preterm infants at birth as agrowth reference. First, ultrasound data are variable andlack reproducibility [32-34]. As well, measurement of pre-term infants provides weight, head circumference andlength measurements while ultrasound only provides esti-mates of these measures.
The use of growth charts is only as accurate as the meas-urements that are made of the infants. Measurements ofweight on electronic scales [35] and head circumferenceusing paper tapes [36] have been shown to be reliable.However, measurement of length, even under controlledconditions on clinically stable infants is not very accurateor reliable and therefore growth may be undetected orappear excessive or inadequate [37]. To improve accuracyof length data, infants should be measured on a head-board by two people [38].
Unfortunately the literature that accompanied the popu-lation based data sources does not include a description ofthe scales and tapes used to measure the infants, nor of theaccuracy of these instruments. Since the data sources werepopulation based, it is likely that a variety of precisionoccurred.
Head growth is important to monitor, since growth thatdeviates from the intrauterine rate could indicate prob-lems [39,40]. Calculation of growth velocity (gram/kg/day over several days) is recommended since it is a precisemeasure of growth [38]. The most comprehensive growthassessment uses a calculation of growth velocity togetherwith assessment of size relative to references for a givenage on a growth chart.
At term age, infants born prematurely tend to have a dif-ferent body composition than infants born at term, withlower weight, lean tissue and bone mineral content and a
Page 8 of 10(page number not for citation purposes)
BMC Pediatrics 2003, 3 http://www.biomedcentral.com/1471-2431/3/13
higher percent body fat [41]. The optimum bodycomposition of the growing preterm infant is not knownnor easily measured. Current growth charts provide noassessment of body composition.
ConclusionsThis updated fetal-infant chart supports growth monitor-ing of preterm infants from as early as 22 weeks gesta-tional age to 10 weeks post term age. It allows acomparison of an infant's growth with first the fetus andthen the term infant and therefore allows an evaluation ofcatch up growth. Although Babson's "fetal-infant growthgraph" had reasonably accurate estimates along the 50th
percentile, the larger sample sizes and more accurate ges-tational age assignments used here may provide betterconfidence in the extreme percentiles. As with all meta-analyses, the validity of this growth chart is affected by themethodological quality of the data sources and the heter-ogeneity of their results.
Comparison of the growth of the NICHD infants atattained weight of 2 kilograms provides evidence that, onaverage, preterm infants are growth retarded with respectto weight and length while, except for the smallest infants,their average head size has caught up to birth percentiles.Further validation work is needed to illustrate the growthpatterns of preterm infants to older ages.
List of Abbreviationskilogram (kg)
centimeter (cm)
Center for Disease Control (CDC)
National Institute of Child Health and Human Develop-ment Neonatal Research Network (NICHD)
Competing interestsNone declared.
Authors' contributionsTF carried out the literature search, data selection, griddesign, chart development, statistical comparisons andmanuscript preparation.
AcknowledgementsThanks to: Pat Fenton for assistance with the computer graph preparations, Doug McMillan for scientific and editorial advice, Debbie McNeil for statis-tical advice and Sari Czink and Suzanne Tough for editorial assistance.
References1. Babson SG, Benda GI: Growth graphs for the clinical assess-
ment of infants of varying gestational age. J Pediatr 1976,89:814-820.
2. KF Catrine: Anthropometric Assessment. Nutritional Care forHigh Risk Newborns 3rdth edition. Edited by: Groh-Wargo S, ThompsonM and Hovasi-Cox J. Chicago, Precept Press; 2000.
3. DM Anderson: Nutrition for the low-birth-weight infant.Krause's Food,Nutrition and Diet Therapy 10thth edition. Edited by:Mahan LK and Escott-Stump S. Philadelphia, WB Saunders; 2000:231.
4. Lubchenco LO, Hansman C, Boyd E: Intrauterine growth inlength and head circumference as estimated from live birthsat gestational ages from 26 to 42 weeks. Pediatrics 1966,37:403-408.
5. Dancis J, O'Connell JR, Holt LE: A grid for recording the weightof premature infants. J Pediatr 1948, 33:570-572.
6. Usher R, McLean F: Intrauterine growth of live-born Caucasianinfants at sea level: standards obtained from measurementsin 7 dimensions of infants born between 25 and 44 weeks ofgestation. J Pediatr 1969, 74:901-910.
7. World Health Organization: Physical status: the use and inter-pretation of anthropometry. Report of a WHO ExpertCommittee. World Health Organ Tech Rep Ser 1995, 854:1-452.
8. Kramer MS, Platt RW, Wen SW, Joseph KS, Allen A, AbrahamowiczM, Blondel B, Breart G: A new and improved population-basedCanadian reference for birth weight for gestational age. Pedi-atrics 2001, 108:E35.
9. Alexander GR, Himes JH, Kaufman RB, Mor J, Kogan M: A UnitedStates national reference for fetal growth. Obstet Gynecol 1996,87:163-168.
10. Arbuckle TE, Wilkins R, Sherman GJ: Birth weight percentiles bygestational age in Canada. Obstet Gynecol 1993, 81:39-48.
11. Niklasson A, Ericson A, Fryer JG, Karlberg J, Lawrence C, Karlberg P:An update of the Swedish reference standards for weight,length and head circumference at birth for given gestationalage (1977-1981). Acta Paediatr Scand 1991, 80:756-762.
12. Beeby PJ, Bhutap T, Taylor LK: New South Wales population-based birthweight percentile charts. J Paediatr Child Health 1996,32:512-518.
13. RJ Kuczmarski, CL Ogden, Grummer-Strawn LM et al: CDC growthcharts: United States. Advance Data from vital and health statistics,no 314 Hyattsville, Maryland: National Center for Health Statistics. 2000;2000.
14. Ogden CL, Kuczmarski RJ, Flegal KM, Mei Z, Guo S, Wei R, Grum-mer-Strawn LM, Curtin LR, Roche AF, Johnson CL: Centers for Dis-ease Control and Prevention 2000 growth charts for theUnited States: improvements to the 1977 National Centerfor Health Statistics version. Pediatrics 2002, 109:45-60.
15. Kuczmarski RJ, Ogden CL, Guo SS, Grummer-Strawn LM, Flegal KM,Mei Z, Wei R, Curtin LR, Roche AF, Johnson CL: 2000 CDCGrowth Charts for the United States: methods anddevelopment. Vital Health Stat 11 2002:1-190.
16. Ehrenkranz RA, Younes N, Lemons JA, Fanaroff AA, Donovan EF,Wright LL, Katsikiotis V, Tyson JE, Oh W, Shankaran S, Bauer CR,Korones SB, Stoll BJ, Stevenson DK, Papile LA: Longitudinalgrowth of hospitalized very low birth weight infants. Pediatrics1999, 104:280-289.
17. Niklasson A, Engstrom E, Hard AL, Wikland KA, Hellstrom A:Growth in very preterm children: a longitudinal study. PediatrRes 2003, 54:899-905.
18. Wright K, Dawson JP, Fallis D, Vogt E, Lorch V: New postnatalgrowth grids for very low birth weight infants. Pediatrics 1993,91:922-926.
19. Guo SS, Roche AF, Chumlea WC, Casey PH, Moore WM: Growthin weight, recumbent length, and head circumference forpreterm low-birthweight infants during the first three yearsof life using gestation-adjusted ages. Early Hum Dev 1997,47:305-325.
20. Committee on Nutrition American Academy of Pediatrics: Nutri-tional Needs of Preterm Infants. Pediatric Nutrition Handbook ElkGrove Village Il; 1998.
21. Nutrition Committee Canadian Paediatric Society: Nutrient needsand feeding of premature infants. CMAJ 1995, 152:1765-1785.
22. AF Roche: Executive Summary of the Low Birth WeightWorkshop. US Department of Health and Social Services; Centers forDisease Control and Prevention; National Center for Health Statistics 1994.
23. Min SJ, Luke B, Gillespie B, Min L, Newman RB, Mauldin JG, WitterFR, Salman FA, O'sullivan MJ: Birth weight references for twins.Am J Obstet Gynecol 2000, 182:1250-1257.
Page 9 of 10(page number not for citation purposes)

BMC Pediatrics 2003, 3 http://www.biomedcentral.com/1471-2431/3/13
Publish with BioMed Central and every scientist can read your work free of charge
"BioMed Central will be the most significant development for disseminating the results of biomedical research in our lifetime."
Sir Paul Nurse, Cancer Research UK
Your research papers will be:
available free of charge to the entire biomedical community
peer reviewed and published immediately upon acceptance
cited in PubMed and archived on PubMed Central
yours — you keep the copyright
Submit your manuscript here:http://www.biomedcentral.com/info/publishing_adv.asp
BioMedcentral
24. Kramer MS, Morin I, Yang H, Platt RW, Usher R, McNamara H,Joseph KS, Wen SW: Why are babies getting bigger? Temporaltrends in fetal growth and its determinants. J Pediatr 2002,141:538-542.
25. Ananth CV, Wen SW: Trends in fetal growth among singletongestations in the United States and Canada, 1985 through1998. Semin Perinatol 2002, 26:260-267.
26. Fok TF, So HK, Wong E, Ng PC, Chang A, Lau J, Chow CB, Lee WH:Updated gestational age specific birth weight, crown-heellength, and head circumference of Chinese newborns. ArchDis Child Fetal Neonatal Ed 2003, 88:F229-F236.
27. Fenton TR, McMillan DD, Sauve RS: Nutrition and growth analy-sis of very low birth weight infants. Pediatrics 1990, 86:378-383.
28. Hack M, Weissman B, Borawski-Clark E: Catch-up growth duringchildhood among very low-birth-weight children. Arch PediatrAdolesc Med 1996, 150:1122-1129.
29. B Rosner: Estimation. Fundamentals of Biostatistics 5thth edition.Pacific Grove, CA, Duxbury; 2000.
30. Wang Z, Sauve RS: Assessment of postneonatal growth inVLBW infants: selection of growth references and ageadjustment for prematurity. Can J Public Health 1998, 89:109-114.
31. Elliman AM, Bryan EM, Elliman AD, Harvey DR: Gestational agecorrection for height in preterm children to seven years ofage. Acta Paediatr 1992, 81:836-839.
32. Bukowski R, Gahn D, Denning J, Saade G: Impairment of growthin fetuses destined to deliver preterm. Am J Obstet Gynecol 2001,185:463-467.
33. Mongelli M, Biswas A: Menstrual age-dependent systematicerror in sonographic fetal weight estimation: a mathemati-cal model. J Clin Ultrasound 2002, 30:139-144.
34. Chauhan SP, Charania SF, McLaren RA, Devoe LD, Ross EL, HendrixNW, Morrison JC: Ultrasonographic estimate of birth weightat 24 to 34 weeks: a multicenter study. Am J Obstet Gynecol 1998,179:909-916.
35. Engstrom JL, Kavanaugh K, Meier PP, Boles E, Hernandez J, WheelerD, Chuffo R: Reliability of in-bed weighing procedures for crit-ically ill infants. Neonatal Netw 1995, 14:27-33.
36. Sutter K, Engstrom JL, Johnson TS, Kavanaugh K, Ifft DL: Reliabilityof head circumference measurements in preterm infants.Pediatr Nurs 1997, 23:485-490.
37. Rosenberg SN, Verzo B, Engstrom JL, Kavanaugh K, Meier PP: Relia-bility of length measurements for preterm infants. NeonatalNetw 1992, 11:23-27.
38. Fomon SJ Nelson SE.: Size and growth. Fomon SJ.Nutrition of NormalInfants. St Louis, Mosby; 1993:49.
39. Hack M, Breslau N, Weissman B, Aram D, Klein N, Borawski E:Effect of very low birth weight and subnormal head size oncognitive abilities at school age. N Engl J Med 1991, 325:231-237.
40. Georgieff MK, Hoffman JS, Pereira GR, Bernbaum J, Hoffman-William-son M: Effect of neonatal caloric deprivation on head growthand 1-year developmental status in preterm infants. J Pediatr1985, 107:581-587.
41. Atkinson SA, Randall-Simpson J: Factors influencing body com-position of premature infants at term-adjusted age. Ann N YAcad Sci 2000, 904:393-399.
Pre-publication historyThe pre-publication history for this paper can be accessedhere:
http://www.biomedcentral.com/1471-2431/3/13/prepub
Page 10 of 10(page number not for citation purposes)