Embed Size (px)
Citation preview

UNIVERSITAT DE BARCELONA FACULTAT DE QUÍMICA
DEPARTAMENT D’ENGINYERIA QUÍMICA I METAL·LÚRGIA
Miguel Rodríguez Barcelona, April, 2003
Fenton and UV-vis based advanced oxidation
processes in wastewater treatment: Degradation, mineralization and biodegradability enhancement.
Programa de Doctorado de Ingeniería Química
Ambiental
Biennio 1998-2000
Memoria presentada por Miguel Rodríguez, Ingeniero Químico, para optar al
grado de Doctor en Ingeniería Química
Miguel Rodríguez
La presente Tesis ha sido realizada en el Departamento de Ingeniería Química
y Metalurgia de la Universidad de Barcelona, bajo la dirección del Dr.
Santiago Esplugas Vidal, quien autoriza su presentación:
Dr. Santiago Esplugas Vidal
Barcelona, Abril de 2002

Al Prof. Sergio Miranda, pilar fundamental en mi
transitar por la vida universitaria.

Por fortuna la vida está llena de momentos como estos.
Por ello, nunca abandones, siempre será mejor perseverar
y ver como al final todo llega, así como llega el sol cada
mañana.
Miguel

En honor a la verdad, el espacio para los agradecimientos podría ocupar un capítulo de esta tesis, y más que una exageración es una manera de expresar el haber tenido la fortuna de trabajar y compartir con tanta gente y de quienes siempre recibí ayuda, aprecio, amistad y solidaridad razones por las cuales estoy muy agradecido. Trataré sin embargo, en un buen ejercicio de síntesis. resumir sin dejar a nadie en el olvido. En primer lugar quiero agradecer al convenio ULA-CONICIT por el otorgamiento de la beca para la realización de este doctorado al igual que al DR. Santiago Esplugas, quien aceptó ser mi tutor y de quien he recibido amistad, confianza , conocimientos y toda su ayuda para llevar a feliz término esta tesis doctoral. Gracias por todo Santi. Toda ésta invalorable experiencia ha sido posible por el compartir diario con mucha gente de gran calidad humana. No puedo olvidar mis primeros días de trabajo con Andreas. Los dias interminables y continuos de trabajo con Vitaliy y ya cerca del final con Florian. To Dr. Gurol and her research’s group in San Diego State University, especially to Melissa, who always gave me her help to make easier the difficulty of having to speak in another language. Thanks a lot for every thing. En otras de mis andanzas en la búsqueda del conocimiento y de la experiencia requerida para asumir en el futuro con buena base la responsabilidad de seguir en el mundo de la investigación, tuve la oportunidad de compartir con el grupo del Dr. César Pulgarin, de la Escuela Politecnica Federal de Lausane, Suiza. De ellos solo puedo decir que se me metieron en el alma. Gracias Sandra, Víctor, Giovanna, Ricardo, Isabel, y por supuesto César, por toda la ayuda y la amistad que recibí de ustedes. Antes de finalizar todo este periplo, también tuve la oportunidad de compartir y aprender de los amigos de la Plataforma Solar de Almería. A Sixto, Julián, Julia, Wolfgang, Agustín, Sonia y Antonio, para todos mi agradecimiento. Ya habia advertido que seria largo, pero ya casi termino, solo que ahora viene un agradecimiento muy especial. Todo este andar de trabajo por estos centros de investigación, siempre tuvo como centro principal, la Universidad de Barcelona, y de ella, el Departamento de Ingeniería Química y Metalúrgica, donde por supuesto pasé la mayoria de estos 4 largos años. A todos sus profesores, gracias, y muy especialmente, Jaime Giménez, Carmen Sans, Carmen González, Esther Chamarro y David Curcó. También para el personal de este departamento de quien siempre he recibido el mejor de los tratos y debo resaltar de ellos al Sr. Antonio y al Sr. Somoza (quien ya lamentablemente no está entre

nosotros) personas que al inicio fueron de mucha ayuda y luego pasaron a ser mis amigos. Mi agradecimiento también a el resto de amigos que han estado todos estos años, y de alguna manera han contribuido para que los mismos sean mas llevaderos, me refiero a Marta, Esther, Alicia, Neus, Cristina, Nadia, Eva y Fares. En medio de tantos nombres y momentos especiales, hay alguien para quien cualquier cosa que diga podría resultar poco. Alguno de ustedes pueden imaginarse a quien me refiero, y no puede ser otra que a mi amiga del alma, a la que por espacio de todos estos años siempre ha estado y de la que nunca podré olvidarme. Han sido tantos momentos compartidos, tanto trabajo juntos, tantas conversaciones y también de alguna discusión, como es lógico, pero ella siempre estuvo allí. No puede ser otra que mi amiga Sandra. Para tí, lo mejor de mis sentimientos para agradadecer todo lo que has hecho por mí. Finalmente, hay gente que no ha estado en los laboratorios, pero si que han estado en mis dias, mis recuerdos y en mi vida diaria. Me refiero a mi familia, mi mamá, hermanas, sobrinos, quienes seguro habrian querido contribuir mas. Hay siempre sin embargo, alguién que se destaca, que da ese extra, que se entrega mas, y en este caso ha sido mi hermana Nina, a quien le agradezco infinitamente su amor, su compañía, su amistad y su solidaridad. Gracias por ser como eres. No puedo dejar de agradecer a dos amigos que fueron fundamentales para mi estancia en esta hermosa ciudad, ellos son Victor y Ana, para ustedes también mi agradecimiento. Quiero además agradecer a todos esos amigos que a pesar de la distancia, siempre han estado conmigo. A Miguel, Carmen, Luz, Carlos, J. Carlos, la flaca, Domingo, Cerrada, la familia Miranda y tantos otros, que no tendria espacio para nombralos. Finalmente, mi más sentido agradecimiento al país que me vio nacer y de él, a ese pequeño pueblo, El Tocuyo, donde crecieron mis sueños, hoy, uno de ellos se hace realidad. A todos, mil gracias.

Índex
i
Index 1.Introduction
1.1. The problematic of water contamination ...................................................... 3
1.2. Studied aqueous solutions ............................................................................... 8
1.2.1. Environmental problems caused by phenolic compounds .............................. 9
1.2.2. Environmental problems caused by nitro aromatic compounds ................. 11
1.2.3. Environmental problems caused by DCDE...................................................... 15
1.2.4. Environmental problems caused by textile wastewater .............................. 16
1.3. Methods for the removal of organic compounds in wastewater.................. 18
1.3.1. Incineration ......................................................................................................... 19
1.3.2. Air stripping…. ................................................................................................... 19
1.3.3. Adsorption of organic compound onto activated carbon................................ 20
1.3.4. Wet oxidation ...................................................................................................... 20
1.3.5. Electrochemical oxidation .................................................................................. 21
1.3.6. Photochemical processes .................................................................................... 22
1.3.7. Biological oxidation............................................................................................. 24
1.3.8. Chemical oxidation ............................................................................................. 24
1.3.8.1. UV-based processes................................................................................ 32
1.3.8.1.1. UV/O3 processes....................................................................... 32
1.3.8.1.2. UV/O3/H2O2 process................................................................. 33
1.3.8.1.3. Fe3+/UV-vis process ................................................................. 34
1.3.8.1.4. UV/TiO2 (Heterogeneous photocatalysis) ............................ 34
1.3.8.2. H2O2 –based processes ............................................................................ 35
1.3.8.2.1. H2O2/UV process ............................................................... 35
1.3.8.2.2. H2O2/O3 process ....................................................................... 36
1.3.8.2.3. Fenton and photo-Fenton reaction........................................... 36
1.3.9. AOPs combined with biological treatment ................................................ 38

Índex
ii
2. Objectives......................................................................................................... 43
3. Removal of nitrobenzene and phenol by Fenton process. Kinetic model
3.1. Introduction ................................................................................................................. 49
3.2. Experimental ...................................................................................................... 53
3.2.1. Reagents ............................................................................................................... 53
3.2.2. Experimental device and procedure (reactor A) ........................................ 53
3.2.3. Analytical determinations ........................................................................ 55
3.2.3.1. HPLC...................................................................................................... 55
3.2.3.2. pH ........................................................................................................... 56
3.2.4. Range of experimental variables for NB and phenol degradation.............. 56
3.3. Results and discussion for NB degradation
3.3.1. Intermediates in the degradation of NB............................................................ 59
3.3.2. Estimation of initial operating ratios in Fenton process............................. 62
3.3.3. Degradation of NB by Fenton reagent. Kinetic study................................. 62
3.3.4. Steady-state radical concentration............................................................ 64
3.3.5. Effect of H2O2 initial concentration........................................................... 66
3.3.6. Effect of Fe2+ initial concentration ............................................................ 67
3.3.7. Effect of NB initial concentration ............................................................. 69
3.3.8. Effect of O2 initial concentration .............................................................. 72
3.3.9. Effect of the temperature ......................................................................... 73
3.3.10. Rate equation for the degradation of NB ................................................ 75
3.4. Results and discussion for phenol degradation
3.4.1. Degradation of phenol by Fenton reagent. Kinetic study ............................... 76
3.4.2. Effect of H2O2 initial concentration .......................................................... 77
3.4.3. Effect of Fe2+ initial concentration .................................................................... 78
3.4.4. Effect of phenol initial concentration........................................................ 79
3.4.5. Effect of the temperature ................................................................................... 80

Índex
iii
3.4.6. Rate equation for the degradation of phenol.............................................. 82
4. UV-based processes for removal of NB and phenol. Photo-Fenton, UV/H2O2, and Fe3+/UV
4.1. Introduction ................................................................................................................. 87
4.2. Fundamental aspects of the processes under study ........................................ 88
4.2.1. Photo-Fenton process ......................................................................................... 88
4.2.2. H2O2/UV process.................................................................................................. 89
4.2.3. Fe3+/UV process ................................................................................................... 93
4.3. Solar radiation as source of light ...................................................................... 95
4.3.1. Solar collectors .................................................................................................... 98
4.3.1.1. Parabolic Trough Collectors ................................................................. 101
4.3.1.2. Compound Parabolic Collectors (CPCs) .............................................. 102
4.4. Experimental ...................................................................................................... 105
4.4.1. Reagents ............................................................................................................... 105
4.4.2. Experimental device and procedure.................................................................. 105
4.4.2.1. Tubular Reactor (reactor B).................................................................. 106
4.4.2.2. Annular Reactor (reactor C) ................................................................. 108
4.4.2.3. Solarbox (reactor D) .............................................................................. 109
4.4.2.4. Parabolic collector (reactor E) .............................................................. 111
4.4.2.5. CPC 1 (reactor F) .................................................................................. 112
4.4.2.6. CPC 2 (reactor G) .................................................................................. 113
4.4.3. Analytical determinations .................................................................................. 115
4.4.3.1. Actinometry ............................................................................................ 115
4.4.3.2. Total Organic Carbon (TOC) ................................................................ 115
4.4.3.3. HPLC...................................................................................................... 115
4.4.3.4. Hydrogen peroxide................................................................................. 116
4.4.3.5. pH measurement.................................................................................... 117
4.4.3.6. Evaluation of solar radiation ................................................................ 117

Índex
iv
4.5. Range of experimental variables for phenol and NB experiments................ 118
4.6. Results and discussion for phenol mineralization........................................... 124
4.6.1. Direct photolysis of phenol by means of artificial and solar radiation .......... 124
4.6.2. Photo-Fenton using artificial light..................................................................... 125
4.6.2.1. Effect of the use of Fe2+or Fe3+ in the photo-Fenton process.............. 126
4.6.2.2. Effect of H2O2 initial concentration...................................................... 128
4.6.2.3. Effect of O2 concentration ..................................................................... 130
4.6.3. Dark- Fenton combined with UV artificial radiation...................................... 131
4.6.4. Photo-Fenton using solar radiation ................................................................... 133
4.6.4.1. Photo-Fenton process in Reactor E ...................................................... 134
4.6.4.1.1 Effect of Fe3+ ............................................................................. 135
4.6.4.1.2. Effect of H2O2 ........................................................................... 135
4.6.4.2. Photo-Fenton process in the CPCs (reactors F and G) ....................... 137
4.6.4.3. Estimation of intrinsic kinetic constants for the photo-Fenton process in reactors D and G .................................................................. 142
4.6.5. H2O2/UV-vis process ........................................................................................... 145
4.6.5.1. H2O2/UV-vis process with artificial light .............................................. 145
4.6.5.2. H2O2/UV-vis process with solar light .................................................... 146
4.6.6. Fe3+/UV-vis process ............................................................................................. 150
4.6.6.1. Fe3+/UV-vis process with artificial light................................................ 150
4.6.6.2. Fe3+/UV-vis process with solar light...................................................... 151
4.6.7. Summary of results with phenol solutions........................................................ 153
4.7. Results and discussion for NB mineralization................................................. 154
4.7.1. Direct photolysis of NB by means of artificial and solar radiation ................ 155
4.7.2. Photo-Fenton process in presence of artificial light ........................................ 157
4.7.3. H2O2/UV-vis artificial and solar light process.................................................. 158
4.7.4. Fe3+/UV-vis artificial and solar light process.................................................... 160
4.7.5. Summary of results with NB solutions.............................................................. 162
4.8. Comparison of the results for phenol and NB mineralization....................... 162

Índex
v
4.8.1. Direct photolysis.................................................................................................. 163
4.8.2. Photo-Fenton ...................................................................................................... 164
5. Biodegradability enhancement of DCDE in aqueous solution by means of H2O2/UV process
5.1. Introduction ................................................................................................................. 169
5.2. Experimental ...................................................................................................... 170
5.2.1. Reagents ............................................................................................................... 170
5.2.2. Experimental device and procedure for chemical oxidation experiments .... 171
5.2.3. Biological reactors............................................................................................... 172
5.2.4. Biomass harvesting ............................................................................................. 174
5.2.5. Experimental device and procedure for inhibitory study ............................... 175
5.2.6. Experimental device and procedure for biodegradation experiments .......... 176
5.2.6.1. Short-term test........................................................................................ 177
5.2.6.2. Long-term test ........................................................................................ 178
5.2.6.3. Mid-term test .......................................................................................... 180
5.2.7. Analytical determinations .................................................................................. 181
5.2.7.1. DCDE concentration measurement ...................................................... 181
5.2.7.2. Hydrogen peroxide................................................................................. 182
5.2.7.3. Total organic carbon (TOC).................................................................. 183
5.2.7.4. Chemical oxygen demand (COD) ......................................................... 183
5.2.7.5. Total suspended solid (TSS) .................................................................. 183
5.3. Range of experimental variables for DCDE oxidation experiments............... 183
5.4. Results and discussion for DCDE chemical oxidation experiments ............... 184
5.4.1. Direct photolysis.................................................................................................. 184
5.4.2. Influence of H2O2 concentration........................................................................ 185
5.5. Results and discussion for inhibition test.............................................................. 188
5.5.1. Inhibition of DCDE solution .............................................................................. 189
5.5.2. Inhibition of preoxidized DCDE solutions........................................................ 190

Índex
vi
5.6. Results and discussion for biodegradation used test .......................................... 192
5.6.1. Short-term biodegradation test ......................................................................... 192
5.6.2. Long-term biodegradation test .......................................................................... 198
5.6.3. Mid-term biodegradation test ............................................................................ 202
6. Chemical and biological coupled system for the treatment of wastewater generated in textile activities
6.1. Introduction ................................................................................................................. 207
6.2. General strategy for the development of a coupled system .............................. 209
6.3. Experimental................................................................................................................ 211
6.3.1. Reagents ............................................................................................................... 211
6.3.2. Experimental device and procedure.................................................................. 212
6.3.2.1. Suntest simulator ................................................................................... 214
6.3.2.2. Coiled photochemical reactor............................................................... 214
6.3.2.3. Biological reactor................................................................................... 214
6.3.3. Analytical determinations .................................................................................. 215
6.3.3.1. Total organic carbon (TOC) .................................................................. 215
6.3.3.2. Chemical oxygen demand (COD).......................................................... 215
6.3.3.3. High performance liquid chromatography (HPLC) ............................ 215
6.3.3.4. Biological oxygen demand (BOD) ........................................................ 215
6.3.3.5. Zahn-Wellens biodegradability test....................................................... 217
6.3.3.6. Hydrogen peroxide................................................................................. 217
6.4. Results and discusion ................................................................................................. 218
6.4.1. Wastewater characterization ............................................................................. 218
6.4.1.1. Effluent 1................................................................................................ 218
6.4.1.2. Effluent 2................................................................................................ 219
6.4.1.3. Effluent 3................................................................................................ 221
6.4.2. Biodegradability assessment .............................................................................. 222
6.4.2.1. Biodegradability of effluent 1................................................................ 222

Índex
vii
6.4.2.2. Biodegradability of effluent 2................................................................ 223
6.4.2.3. Biodegradability of effluent 3................................................................ 224
6.4.3. Photo-Fenton process as pretreatment step ..................................................... 225
6.4.3.1. Effect of the initial Fe3+ concentration ................................................. 225
6.4.3.2. Effect of the initial H2O2 concentration ............................................... 227
6.4.3.3. Effect of the temperature....................................................................... 229
6.4.4. Biodegradability evolution of photo-treated solution...................................... 230
6.4.5. Causes for photo-treated solution biorecalcitrance......................................... 233
6.4.6. Photo-Fenton process as post-treatment step................................................... 236
7. Conclusions and Recommendations
7.1. Conclusions .................................................................................................................. 241
7.2. Recommendations ...................................................................................................... 244
8. Glossary ............................................................................................................ 249
9. Publications derived from this work ........................................................ 255
10. Bibliography .................................................................................................. 259
11. Appendix
11.1. Actinometric study ................................................................................................... 283
11.2. Experimental method .............................................................................................. 285
11.3. Analytical determinations ...................................................................................... 286
11.4. Actinometric results................................................................................................. 286
11.4.1. Reactor B (Tubular photo-reactor) ................................................................. 286
11.4.1.1. Flow rate of photons absorbed by NB and phenol in reactor B ........ 288
11.4.2. Reactor C (Annular photo-reactor) ................................................................ 286

Índex
viii
11.4.2.1. Flow rate of photons absorbed by NB and phenol in reactor C ........ 291
11.4.3. Reactor D (solarbox) ......................................................................................... 292
11.5. Reactor G (CPC-Almería) ...................................................................................... 294
Resumen ................................................................................................................ I

1. Introduction

1.1. The problematic of water contamination
3
1.1. The problematic of water contamination
One of the characteristics that best defines today’s society in what is understood as
developed countries is the production of waste products. There is practically no human
activity that does not produce waste products and in addition there is a direct relationship
between the standard of living in a society or country and the amount of waste products
produced. Approximately 23% of the world’s population live in developed countries,
consume 78% of the resources and produce 82% of the waste products (Blanco and
Malato, 1996). In addition, it has to be pointed out that the volume of residual waste
increases in an exceptional way with regards to a country’s level of industrialisation. At
present, there are some five million known substances registered, of which approximately
70,000 are widely used worldwide, and it is estimated that 1,000 new chemical substances
are added to the list each year.
The need for sustainable growth is countered by the reality of demographic growth.
Many countries are experiencing a period of non-sustainable growth, with very variable
macroeconomic achievements in the various countries. Even in the case where some
countries have achieved a beneficial macroeconomic progress, these achievements are not
reflected in the standard of living and quality of life of large sections of the population.
These large contrasts are reflected in the problems related to the rational management of
water, which cannot be dealt with in a unilateral way, but by many different procedures.
A recent publication (Schertenleib and Gujer, 2000) describes in a generic form the
problems that societies have had to face regarding water use as the society evolved. The
countries with sustainable development have, one by one, confronted the problems related
to biological contamination, with the levels of heavy metals, with the intensive use of
nutrients, and with organic contaminants at very low levels. Water disinfections, the
treatment of effluents before being discharged into water systems, the limitation and
substitution of nitrates and phosphates in products that are used on a massive scale, and the
development in analytical chemistry and in ecotoxicology are examples of some of the
“tools” used to combat these problems. The result of its own harmonic evolution is shown
in Figure 1.1. It must be noted that the time scale to resolve each problem as it arises, is
always shorter.

1. Introduction
4
1800 1850 1900 1950 20000.0
0.2
0.4
0.6
0.8
1.0
Year
Con
tam
inat
ion
grad
e
1800 1850 1900 1950 20000.0
0.2
0.4
0.6
0.8
1.0
Year
Con
tam
inat
ion
grad
e
Figure 1.1. Line graph of the evolution of contamination levels (on an arbitrary scale) of natural waters in countries with sustainable development. From left to right the lines represent municipal faecal waste drainage, industrial effluents, nutrients and micro-pollutants. The environmental problems increase until a solution is found and then decrease.
In contrast, countries with non-sustainable development are represented in Figure
1.2. There is no doubt that many developing countries can be included in this category, or
even in a more complicated situation with even more primitive stages of development. The
problems derived from the toxicological effects of organic compounds, which are active at
very low levels, must be resolved at the same time as water disinfection for rural
communities. It is clear that innovative procedures are needed to deal with this wide range
of problems, which vary notably in its application scale and the complexity of the
problems (Blesa, 2001).
Up until relatively recently, the discharging of waste in the environment was the
way of eliminating them, until the auto-purifying capacity of the environment was not
sufficient. The permitted levels have been vastly exceeded, causing such environmental
contamination that our natural resources cannot be used for certain uses and their
characteristics have been altered. The main problem stems from waste coming from
industry and agriculture, despite the fact that the population also plays an important role in
environmental contamination.

1.1. The problematic of water contamination
5
1800 1850 1900 1950 20000.0
0.2
0.4
0.6
0.8
1.0
Year
Con
tam
inat
ion
grad
e
1800 1850 1900 1950 20000.0
0.2
0.4
0.6
0.8
1.0
Year
Con
tam
inat
ion
grad
e
Figure 1.2. Line graph of the contamination levels (on an arbitrary scale) of the natural waters in non-sustainable developed countries. From left to right the lines represent municipal faecal waste drainage, industrial effluents, nutrients and micro-pollutants. The environmental problems increase without a solution being found to solve them.
Phenols, pesticides, fertilizers, detergents, and other chemical products are disposed
of directly into the environment, without being treated, via discharging, controlled or
uncontrolled and without a treatment strategy.
In this general context, is very clear that the strategy to continue in the search of
solutions to this problem that every day presents a sensitive growth, mainly in the
developing countries, it will be guided to two fundamental aspects:
- The development of appropriate methods for contaminated drinking, ground, and
surfaces waters, and mainly
- The development of appropriate methods for wastewaters containing toxic or
non-biodegradable compounds.
This thesis is focused in the second of the aspects. Dangerous and Toxic Waste is
defined as "those solid, semi-liquid, and liquid materials, as well as those gaseous
materials in recipients, which are the result of a process of production, transformation, use
or consumption which are destined to be abandoned and whose composition contains some
of the substances or materials that figure in the annex of Law 20/1986 of the 14th May,

1. Introduction
6
“Base for Dangerous and Toxic Residues”, or in the successive revisions by the EU
Committee, in such quantities or concentrations that represent a health risk to humans,
natural resources and the environment and that need a treatment process or special
elimination”. The European Union made out a list of dangerous compounds, considered as
contaminants, to which constantly new substances are added (“black list” of the E.U., see
Table 1.1).
Among the before mentioned waste products, the most worrying, from an
environmental point of view, are those so called non-biodegradable or persistent materials
because in the case of not receiving a specific treatment necessary for their destruction or
inertness, they can effect various sectors of the environment. From this, a series of very
diverse and irreversible damages can result, ranging from the deterioration or
disappearance of a determined environment to changes in the health of those individuals
who live in that environment.
A large part of this type of residual waste is generated in an aqueous solution and,
owing to its non-biodegradable nature, the biological treatment procedures (the most
commonly used) are not effective, and unless there is an additional specific treatment, they
end up being dumped in the environment. The presence of this type of pollutant in an
aqueous dissolution is especially problematic as the residual waste cannot be stored
indefinitely (as is the case with some solid waste) and it has the peculiarity that a small
volume of water is able to contaminate much greater volumes of water. It must also be
pointed out that a wide spectrum of compounds can transform themselves into potentially
dangerous substances during the drinking water treatment process, particularly by
chlorination, as is the case of the precursor compounds of the formation of chlorocarbons
(Marhaba and Washington, 1998).
In general, the techniques available for the treatment of residues are very diverse.
In some cases the residue is only made inert and it is later transferred to a controlled
discharge, where it is stored safely. Another possibility is to transport the residues to an
incineration plant. This process, in addition to needing a large consumption of energy to
finish the process, has the problem of releasing intermediate toxins from mineralization
into the atmosphere, which means that incineration is a cause for controversy. On the other
hand, incineration is very expensive and usually involves long transport distances of the
residues to a central installation (Steverson, 1991; Dempsey and Oppelt, 1993; Kakko et
al., 1995).

1.1. The problematic of water contamination
7
Table 1.1. Black list of chemicals substances selected by the E.U. (Harrinson, 1992)
Group Included substances
Chloride
Hydrocarbons
Aldrin, dieldrin, chlorobenzene, dichlorobenzene,
chloronaphthalene, chloroprene, chloropropene, chlorotoluene,
endosulfane, endrin, hexachlorobenzene, hexachlorobutadiene,
hexachlorocyclo-hexane, hexachloroethane, PCBs,
tetrachlorobenzene, trichlorobenzene.
Chlorophenol Monochlorophenol, 2,4-dichlorophenol, 2-amino-4-chlorophenol,
pentachlorophenol, 4-chloro-3-methylphenol, trichlorophenol.
Chloroanilines and
nitrobenzenes
Monochloroanilines, 1-chloro-2,4-dinitrobenzene, dichloroaniline,
4-chloro-2-nitrobenzene, chloronitrobenzene, chloronitrotoluene,
dichloronitrobenzene.
Policyclic Aromatic
Hydrocarbons Antracene, biphenyl, naphthalene, PAHs
Inorganic substances Arsenic and its compounds, cadmium and its compounds, mercury
and its compounds.
Solvents
Benzene, carbon tetrachloride, chloroform, dichloroethane,
dichloroethylene, dichloromethane, dichloropropane,
dichloropropanol, dichloropropene, ethylbenzene, toluene,
tetrachloroethylene, trichloroethane, trichloroethylene.
Other
Benzidine, chloroacetic acid, chloroethanol, dibromomethane,
dichlorobenzidine, dichloro-diisopropyl-ether, diethylamine,
dimethylamine, epichlorhydrine, isopropylbenzene,
tributylphosphate, trichlorotrifluoroethane, vinyl chloride, xilene.
Pesticides
Cyanide chloride, 2,4-dichlorophenoxyacetic acid and derivatives,
2,4,5-trichlorophenoxyacetic acid and derivatives, DDT, demeton,
dichloroprope, dichlorvos, dimethoate, disulfoton, phenitrothion,
phenthyon, linuron, malathion, MCPA, mecoprope, monolinuron,
omethoate, parathion, phoxime, propanyl, pirazone, simacine,
triazofos, trichlorofon, trifularin and derivatives.

1. Introduction
8
In the present work, it has been deepened in the treatment of organic compound in
aqueous solution by means of the use of advanced oxidation processes (AOP), in the
search of their elimination or transformation in more biodegradable compound.
The experimental work has been divided into four chapters. First part (chapter 3) is
focused on the kinetic study of Fenton process for what phenol has been taken as reference
(model compound widely studied) and an aromatic non-biodegradable compound, such as
nitrobenzene.
The second part (chapter 4) addresses to the optimisation of some treatment
processes as photo-Fenton, H2O2/UV and Fe3+/UV-vis using different sources of artificial
light and sunlight. The experimental work of this chapter was divided into two parts. In the
first one, experiments were performed at laboratory scale in University of Barcelona. In the
second one, experiments in pilot plant were made in EPFL (Ecole Politechnique Federale
de Lausanne, Switzerland) and at the Plataforma Solar de Almería, Spain.
Chapters 5 and 6 represent an application of the treatments methods used in chapter
4, in which their influence on the biodegradability of an organic chloride compound
(DCDE) and of waters coming from the textile industry was studied. For this final part of
the thesis, the experimental work was carried out in the University of San Diego (San
Diego, USA) and at the EPFL (Lausanne, Switzerland), respectively.
1.2. Studied aqueous solutions
In this general context of the environmental problems caused by different kinds of
pollutants, four different types of aqueous solutions containing organic compounds as
phenol, nitrobenzene, DCDE and waters coming from the textile industry have been taken
as model. The aim of the work was to make a deep study in the treatment of these
compounds in water solution by means of the use of chemical oxidation processes in order
to establish the best operating conditions to be applied.
Phenols have been widely used in many industrial processes, as synthesis
intermediates or as raw materials in the manufacturing of pesticides, insecticides, wood
preservatives, and so forth. Because of the great diversity of their origins, they have a great
ubiquity and can be found not only in industrial wastewaters but also in soils and surface

1.2. Studied solutions
9
and ground waters, as a consequence of their release in industrial effluents or improper
waste disposal practices and accidental leakages (Benitez et al., 1997).
Aromatic nitro compounds are commonly used in the manufacture of pesticides,
dyes and explosives, and are often detected in industrial effluents, in ambient freshwater, in
ambient environments and in the atmosphere (Lipczynska-Kochany, 1992). Moreover,
nitroaromatic hydrocarbons are naturally generated, as results of photochemical reactions
produced in the atmosphere (in countries like Germany, Japan, Switzerland and USA
nitrophenol and dinitrophenol have been detected in air and rain) (Alonso y del Pino, 1996
and reference herein).
Dichlorodiethylether (DCDE) is widely used in the US in the manufacture of
pesticides and pharmaceuticals, as a solvent and cleaning fluid, as a constituent of paints
and varnishes, and in the purifying of oils and gasoline (Toxnet, 2001).
Textile processing is one of the most important industries in the world and it
employs a variety of chemicals, depending on the nature of the raw material and product.
Some of these chemicals are different types of enzymes, detergents, dyes, acids, sodas and
salts. The discharge of wastewaters that contains high concentration of reactive dyes is a
well-known problem associated with dyestuff activities (Neppolian et al., 2001; Rodríguez
et al., 2002).
The presence of these compounds in industrial wastewater and the discharge of
textile waters, forces us to look for alternative processes to those well-known biological
treatments, to achieve its effective elimination of the residual waters.
1.2.1. Environmental problems caused by phenolic compounds
At present, a large part of the pollution in the public water system is caused by
industry (Blanco and Rodríguez, 1993). One particular case, which is important within
these industrial effluents, is that of phenols. The word “phenols” includes phenol, C6H5OH,
(taken as model compound in this study) and all its derivatives, i.e. those aromatic organic
compounds that contain one or various hydroxyl groups. Therefore, although phenol is the
compound that appears most frequently in liquid effluents, the presence of some of its
derivatives, to be precise, ortho, meta and p-cresol, contribute notably to the toxicity of the
effluents. Table 1.2 shows the physical properties of the four compounds: phenol, ortho,
meta and p-cresol (Ullmann's, 1991).

1. Introduction
10
Table 1.2. The physical properties of phenol, ortho, meta and p-cresol.
Properties o-cresol m-cresol p-cresol phenol
Melting point (oC) 30.90 11.5 34.8 41
Boiling point (oC) 191 202.7 201.9 182
Density 204d (solid) (g.cm-3) 1.047 - 1.034 1.071
Density 204d (liquid) (g.cm-3) 1.027 1.034 1.018 1.049
Density (vapor) (air = 1) 3.72 3.72 3.72 3.24
Vapor pressure (25oC) (Pa) 33.3 14.7 14.7 47
Vapor pressure (60oC) (Pa) 473 226 226 5300
Auto-inflammation Temp (oC) 559 559 559 715
Solubility (25oC) (%) 2.5 1.9 1.9 8.7
Molecular weight 108.14 108.14 108.14 94.11
The harmful characteristics of phenolic compounds lie in concentrations of parts
per billion (García et al., 1989), which are very inferior to toxic concentrations, and
contribute a disagreeable smell and taste to chlorinated water. Normally, the taste cannot
be detected in concentrations inferior of 0.1 to 0.01 ppb. Phenols are considered toxic for
some aquatic life forms in concentrations superior to 50 ppb and the ingestion of one gram
of phenol can have fatal consequences in humans. Its dangerousness lies in the effect that it
has on the nervous system of living beings. In addition, they have a high oxygen demand,
2.4 mg O2 per mg of phenol. Another additional effect is the capacity of phenols to
combine with existing chlorine in drinking water, giving rise to chlorophenols, compounds
that are even more toxic and difficult to eliminate.
Despite being high toxicity compounds, phenols have a wide range of uses:
- Plastics, resins and plasticizers: phenol in this type of industry is used above all
in the production of plastics and phenol-formaldehyde resins. In addition cresols
are used in the making of tricresyl phosphate, which is a plasticizer useful for
cellulose acetate, nitrocellulose, ethanethiol cellulose and vinyl plastics.
- Preserving agent for wood, disinfectants and insecticides: creosote oil, a
distillation obtained from the process of coal-making at high temperatures, is
used for preserving wood in addition to being a source of cresylic acid and
cresols used for disinfectants and insecticides.

1.2. Studied solutions
11
- Vegetable hormones and detergents: phenol is used directly in the production of
these types of compounds.
- Medicines: a clear example of a derivative of phenol is acetylsalicylic acid, a
compound from which aspirin is obtained.
- Dyes, photography and explosives: these industries have many uses for phenol
although the total consumption is not very high. Some aminophenols are used as
dyes and photographic developers. Trinitrophenol, for example, is used as a dye
and as an explosive.
In all these industries give rise to polluting phenolic effluents, which are much
higher than the toxic levels. Table 1.3 shows phenol concentrations coming from different
industries (García et al., 1989).
Table 1.3. Phenols content in industrial waste
Industry Concentration of phenols (mg.L-1)
Coal mining 1000-2000
Lignite transformation 10000-15000
Gas production 4000
High ovens 4000
Petrochemicals 50-700
Benzene factory 50
Pharmaceuticals 1000
Oil refining 2000-20000
1.2.2. Environmental problems caused by aromatic nitro compounds
Taking into account that aromatics nitro compounds constitute a threat to human
health and produce a public concern, several of them have been listed among the 130
priority pollutants given by the US EPA (United States Environmental Protection Agency)
in the federal Clean Water Act (CWA), e.g. nitrobenzene (EPA, 2002). Recently, the US
1. Introduction
12
EPA has also included them in a reduced list of drinking water contaminants to be
investigated in the period 2001-2005 (Hayward, 1999).
Aromatic nitro compounds are commonly used in industrial processes (manufacture
of pesticides, dyes and explosives) and as a consequence they appear as contaminants in
every kind of water (especially in surface waters) and industrial wastewaters. This
substances present a high toxicity, provoking serious health problems: blood dyscrasia,
eyes and skin irritations, they affect the central nervous system, etc. Several studies have
shown the presence of these substances in surface waters (Howard, 1989) and ground
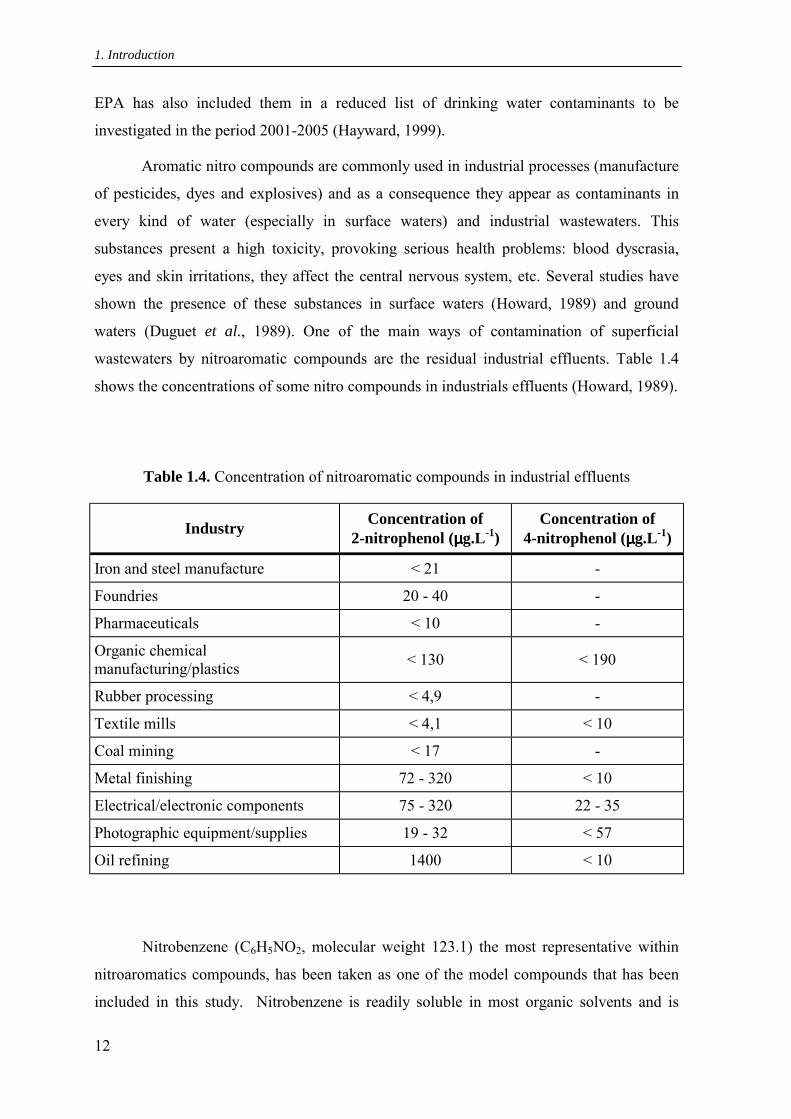
waters (Duguet et al., 1989). One of the main ways of contamination of superficial
wastewaters by nitroaromatic compounds are the residual industrial effluents. Table 1.4
shows the concentrations of some nitro compounds in industrials effluents (Howard, 1989).
Table 1.4. Concentration of nitroaromatic compounds in industrial effluents
Industry Concentration of 2-nitrophenol (µµµµg.L-1)
Concentration of 4-nitrophenol (µµµµg.L-1)
Iron and steel manufacture < 21 -
Foundries 20 - 40 -
Pharmaceuticals < 10 -
Organic chemical manufacturing/plastics < 130 < 190
Rubber processing < 4,9 -
Textile mills < 4,1 < 10
Coal mining < 17 -
Metal finishing 72 - 320 < 10
Electrical/electronic components 75 - 320 22 - 35
Photographic equipment/supplies 19 - 32 < 57
Oil refining 1400 < 10
Nitrobenzene (C6H5NO2, molecular weight 123.1) the most representative within
nitroaromatics compounds, has been taken as one of the model compounds that has been
included in this study. Nitrobenzene is readily soluble in most organic solvents and is

1.2. Studied solutions
13
completely miscible with diethyl ether and benzene. It is a good solvent for aluminum
chloride and is therefore used as solvent in Friedel-Craft reactions. It is only slightly
soluble in water (0.19% at 20ºC; 0.8% at 80ºC). Some other physical properties of
nitrobenzene are as follows (see Table 1.5).
Table 1.5. Physical properties of nitrobenzene (Ullmann’s, 1991)
Physical property Value
Melting point 5.85ºC
Boiling point at 101 kPa at 13 kPa at 0,13 kPa
210.9ºC 139.9ºC 53.1ºC
Density 1.5
4d (solid) 15.5
4d (tech. spec.) 25
4d
1.344 g.cm-3
1.208 - 1.211 g.cm-3
1.199 g.cm-3
Vapor pressure (20ºC) 0.15 mm Hg
Viscosity (15ºC) 2.17x10⁻² mPa.s
Surface tension (20ºC) 43.35 mN.m-1
Dielectric constant (20ºC) 35.97
Specific heat (30ºC) 1.418 J.g-1
Latent heat of fusion 94.1 J.g-1
Latent heat of vaporization 331 J.g-1
Flash point (closed cup) 88ºC
Nitrobenzene is released into the environment primarily from industrial uses but
can also be formed in the atmosphere by the nitration of benzene, a common air pollutant.
The largest sources of nitrobenzene release are from its manufacture and primary use as a
chemical intermediate in the synthesis of aniline. Smaller amounts are also released from
consumer products in which nitrobenzene is used as a solvent. The most familiar of these
are metal and shoe polishes.

1. Introduction
14
It can evaporate when exposed to air. Once in air, nitrobenzene breaks down to
other chemicals. It dissolves when mixed with water. Most releases of nitrobenzene to the
U.S. environment are to underground injection sites. In 1992, only a small percentage (6%)
of environmental releases of nitrobenzene was to air. It can also evaporate slowly from
water and soil exposed to air. Available information indicates that nitrobenzene is
moderately toxic to aquatic life. Nitrobenzene may be stored in plants, but is not expected
to accumulate in fish.
About the stability of nitrobenzene in water, it has been estimated that its half-life
varies from one day for natural channels, as it has been confirmed by works carried out by
Zoeteman (1980) in the Rhin river (Holland), and 3.8 days in an aerated lagoons (Davis et
al., 1983). Because it is a liquid that does not bind well to soil, nitrobenzene that makes its
way into the ground can move through the ground and enter groundwater. In surface
water, nitrobenzene was detected in only 0.4% of surface water stations and in 1.8% of
reporting stations on industrial wastewaters. In Table 1.6, those industries in whose
effluents nitrobenzene has been detected are indicated. Furthermore, the presence of
nitrobenzene in municipal wastewaters in a concentration between 20 and 100 µg.L-1 has
been detected.
Table 1.6. Concentration of nitrobenzene in different industrial effluents
Industry Average concentration (µµµµg.L-1)
Oil refining 7.7
Leather tanning 3.7
Nonferrous metals 47.7
Organics and plastics 3876.7
Pulp and paper 124.3
Auto and other laundries 40.4
Pesticides manufacture 16.3
Explosives 51.7
Organic chemicals 43.7
Inorganic chemicals 1995.3

1.2. Studied solutions
15
As it has been commented before, aromatic nitro compounds have been included in
the priority pollutants selected by the European union (see Table 1.1). Nevertheless, these
compounds have been little studied, paying more attention to those compounds in whose
composition halogens are present.
1.2.3. Environmental problems caused by DCDE
Dichlorodiethyl ether (C4H8Cl2O, molecular weight 143.01) is a colorless liquid
with chloroform-like odor that irritates the eyes and mucous membranes. It is occasionally
detected as a constituent of municipal wastewater and is found often in surface waters. It is
a chlorinated organic compound that has been used for decades in many industries
associated with the manufacturing of solvents, oil and gasoline, pharmaceuticals,
pesticides, textiles, paint and more.
In the petroleum industry is used as solvent and dewaxing agent. It is also used in
the manufacture of oils, fats, napfthalenes, greases, pectin, waxes, gums, tars, resins, soaps,
cellulose esters, varnish, lacquers, and finish removers. In the textile industry is used as
scouring, wetting, cleansing, penetrating agent, and as a solvent in the dry cleaning
industry.
In agriculture is used as soil fumigant, insecticide, and acaricide. Finally, in the
pharmaceutical industry, it is used as a reagent for chemical synthesis during the
manufacture of pharmaceuticals, rubber chemicals, resins, plasticizers and other chemicals
(Ullmans’s, 1991; Toxnet, 2001). Some physical properties of DCDE are shown in Table
1.7. It is low volatile and highly water-soluble. It travels quickly through groundwater
since it does not adsorb easily to sediment (Toxnet, 2001).
DCDE is obtained as a byproduct in the production of ethylene chlorohydrin, where
it collects in the distillation sump and is purified by vacuum distillation. DCDE is also
produced by reaction of ethylene chlorohydrin with sulfuric acid at 90-100 oC or by
saturation of an aqueous ethylene chlorohydrin solution with ethylene and chlorine below
85 oC. It is reactive, flammable, mutagenic and a probable carcinogen (NIOSH, 1995).
When heated to decomposition, DCDE emits toxic fumes (Toxnet, 2001). Bioaccumulation
in aquatic systems is low, and like many ethers, it is resistant to biodegradation (Toxnet,
2001). When water polluted with DCDE is intended for drinking purposes, a treatment
process must be implemented to prevent public exposure. In fact, if ethyl ether is present in

1. Introduction
16
the system, after chlorination, DCDE will be produced. Ingestion of contaminated water
and inhalation of contaminated air are the two most common routes of general population
exposure (Toxnet, 2001). A risk level of 0.3 μg per day has been set to minimize potential
carcinogenic effects (Genium, 1993). Animal experiments have demonstrated that
excessive levels of DCDE exposure can result in central nervous system depression, liver
and kidney damage, and death (NIOSH, 1995). Due to its toxic properties, DCDE is on the
Community Right to Know List and is regulated by the Resource Conservation and
Recovery Act (RCRA) as well as the Comprehensive Environmental Response,
Compensation, and Liability Act (CERCLA).
Table 1.7. Physical properties of DCDE (Ullmann’s 1991)
Physical property Value
Melting point -50oC
Boiling point at 760 mmHg
178ºC
Density 204d (liquid) 1.219
Vapor pressure (20ºC) 0.4 mm Hg
Viscosity (25oC) 2.065 mPa.s
Surface tension (25oC) 41.8 mN.m-1
1.2.4. Environmental problems caused by textile wastewater
Textile mills are major consumers of water and consequently one of the largest
groups of industries causing intense water pollution. The extensive use of chemicals and
water results in generation of large quantities of highly polluted wastewater. According to
the U.S. EPA, about 1 to 2 million gallons of wastewater per day are generated by average
dyeing facility in the US, reactive and direct dyeing generating most of the wastewater.
Around 109 kg and more than 10,000 different synthetic dyes and pigments are produced
annually worldwide and used extensively in dye and printing industries. Textile processing
employs a variety of chemical, depending on the nature of the raw material and products. It
is estimate that about 10 % are lost in industrial wastewater (Young and Yu, 1997). The

1.2. Studied solutions
17
wastewater generated by the different production steps (i.e. sizing of fibers, scouring,
desizing, bleaching, washing, mercerization, dyeing and finishing) has high pH and
temperature. It also contains high concentration of organic matter, non-biodegradable
matter, toxic substances, detergents and soaps, oil and grease, sulfide, sodas, and alkalinity.
In addition, the high salt conditions (typically up to 100 g L-1 sodium chloride) of the
reactive dyebaths result in high-salt wastewater, which further exacerbates both their
treatment and disposal. The fate of these chemicals varies, ranging from 100% retention on
the fabric to 100% discharge with the effluent. As a result, textile industry is confronted
with the challenge of both color removal (for aesthetic reasons) and effluent salt content
reduction. In addition, reactive dyes are highly water soluble and non-degradable under the
typical aerobic conditions found in conventional, biological treatment system Neppolian et
al., 2001; Rodriguez et al., 2002).
The contamination observed in textile wastewater is higher than the limits set by
the National Environmental Quality Standards (NEQS) for all important wastewater
parameters (see Table 1.8).
In general, the current practice in textile mills is to discharge the wastewater into
the local environment without any treatment. This wastewater causes serious impacts on
natural water bodies and land in the surrounding area. High values of COD and BOD,
presence of particulate matter and sediments, and oil and grease in the effluents causes
depletion of dissolved oxygen, which has an adverse effect on the marine ecological
system. Effluent from mills also contains chromium, chemicals; effluents are dark in color,
which increases the turbidity of water body. This in turn hampers the photosynthesis
process, causing alteration in the habitat. Besides, the improper handling of hazardous
chemical content in textile water has some serious impacts on the health and safety of
workers. Contact with chemical puts them the high risk bracket for contracting skin
diseases like chemical burns, irritation, ulcers, etc. and even respiratory problems (ETPI,
2003).

1. Introduction
18
Table 1.8. Characteristic of Process Wastewater from a Textile Processing Unit (ETPI, 2003)
Parameter Prevailing Range (mg.L-1) NEQS(mg.L-1)
BOD5 120 - 440 80
COD 300 - 1100 150
TDS 200 - 5000 3500
TSS 50 - 120 150
pH 8 - 11 6 - 10
oil and grease 11 - 45 10
Cr 0.5 - 2.5 1.0
1.3. Methods for the removal of organic compounds in wastewater
The treatments processes of different types of effluents to be used must guarantee
the elimination or recuperation of the pollutant in order to reach the strict authorized levels
for the discharge of these effluents. The levels of pollutants allowed in discharge waters,
are directly related with the type of present pollutant in the effluent.
In general, the elimination of organic pollutants in aqueous solution need one or
various basic treatment techniques (Weber and Smith, 1986; Chuang et al., 1992):
chemical oxidation, air desorption, liquid-liquid extraction, adsorption, inverse osmosis,
ultra-filtration and biological treatment. Depending on the present compound in solution
the methods to use can be destructive as for example, chemical oxidation, incineration or
degradation, which only allow the efficient elimination of the pollutant from an aqueous
form; and the non-destructive methods, among which is liquid-liquid extraction and
absorption, that allow the recuperation of the pollutant. On the other hand, the application
of one or other of the methods depends on the concentration of the effluent. It is necessary
to choose the most adequate method according to the characteristic of the concentration.
Once again, it has to be chosen between those techniques, which are useful for high
concentrations of pollutants, like incineration or some chemical oxidation methods, and
those techniques for low concentrations of pollutants, for example adsorption, membrane
techniques, and some chemical oxidation methods as well. The choice of one or other of

1.3. Methods for organic compounds removal
19
the methods basically depends on the cost of the process and other factors like the
concentration and volume flow of the effluent to be treated.
The most widely used treatment methods of organic compounds are described next.
1.3.1. Incineration
The incineration is an useful method for small quantities of wastewater with high
pollutant concentration. However, it presents the disadvantage of requiring big investments
and having high energy cost as well. The incinerators normally used for this process are
similar to those of sludge or industrial residues, and they can be horizontal, vertical or
fluidized bed. A fundamental economic aspect in the incineration of organic solutions is
the auxiliary fuel needed to maintain the combustion. The treatment of phenolic effluents
by means of this method has been reported (Lanouette, 1977). For NB, DCED no
references were found. In the case of textile activities, the incineration has been used in the
treatment of sludge from textile wastewater and the ash is landfilled (Masselli et al., 1970).
The incineration can be also used to minimize the textile wastewater quantity and after
other treatment processes could be applied.
1.3.2. Air stripping
Air stripping involves the transfer of volatile organics from liquid phase to the air
phase by greatly increasing the air/water contact area. Typical aeration methods include
packed towers, diffusers, trays, and spray aeration. It has the advantage that is more
established and more widely understood technology than chemical oxidation. It can be
accurately designed from theory and experience without the need for design tests. If air
emissions are not regulated, air stripping is by far the simplest and cheapest solution for the
removal of volatile compounds from water. The treatment of phenolic and nitro aromatic
effluents by means of air stripping has not been reported. In the case of NB solutions,
experiments to check the stripping effect demonstrate that the NB remains constant in
solution. Taking into account that the DCDE is a volatile compound, air stripping can be
thought as treatment method for this compound. However, air stripping has been used in
the treatment of trichloroethylene (TCE), dichloromethane (DCM), 1,2-dichloroethylene
(DCE), 1,2-dichloroethane (DCA), chlorobenzene (Cl-Bz), and dichloroethyl ether
(DCEE) and the results showed that they could be removed easily from water solutions
1. Introduction
20
except DCEE (Li et al., 2000). In the case of textile wastewater, air stripping used as
pretreatment resulted in high solvent removal (Kabdasli and Gurel, 2000).
1.3.3. Adsorption of organic compounds onto activated carbon
Carbon adsorption is an advanced wastewater treatment method used for the
removal of recalcitrant organic compounds as well as residual amounts of inorganic
compounds such as nitrogen, sulfides, and heavy metals. This is a separation method in
which the contaminant is transferred from a water phase, where it is dissolved, to the
surface of active carbon where is accumulated for its subsequent extraction or destruction.
The adsorption onto activated carbon is widely used for wastewater treatment. Thus, it is
used in the control of color and odors, in the removal of organic compounds or
trihalomethanes precursors, to remove chlorine and in general to remove toxic compounds.
The adsorption of nitrobenzene (NB) and phenol onto activated carbon has been
widely studied. Both (NB and phenol) showed to be well adsorbable compounds onto
activated carbon but in low concentration (Cañizares et al., 1999; Sacher et al., 2001).
This method has been also combined with other and a significant improvement has been
obtained (Cañizares et al., 1999). No reference about adsorption of DCDE by activated
carbon has been found. Many studies have been found in the literature regarding the
treatment of textile wastewater by means of activated carbon (Roy and Volesky, 1977; Lin
and Lai, 2000; Yeh et al., 2002). Most of them showed the high effectiveness of carbon
activated adsorption process in the reduction of COD (Chemical Oxidation Demand) and
color removal from textile wastewater.
1.3.4. Wet oxidation
In the wet oxidation processes, organic and inorganic compounds are oxidized in
aqueous phase, with oxygen or air, at high pressure and high temperature conditions. The
temperature depends on the nature of the compounds to degrade, however it oscillates
between 150 and 350ºC. Pressure goes from 20 to 200 bar. COD removal ranges from 75
to 90% (Li et al., 1991). The mechanism of wet oxidation has been deeply studied and
seems to take place by means of a free radical process. Among the compounds that have
been catalogued as readily oxidizable by means of wet oxidation are aliphatic, aliphatic
chlorides and aromatic, which do not contain halogenated functional groups, such as

1.3. Methods for organic compounds removal
21
phenols or anilines. Compounds contain halogen and nitro functional groups have been
found to be difficult to be degraded by this method (Scott, 1997). Experimental results
indicate that over 90% removal of phenol or phenolic compounds can be achieved in the
wet oxidation wastewater treatment. Besides activated sludge process combined with wet
oxidation, if appropriately operated, is capable of drastically reducing the COD
concentration of the high concentrated chemical wastewater to meet the safe discharge
requirement (Lin and Chuang, 1994). For DCDE and textile wastewater treatment by
means of wet oxidation process not reference were found.
1.3.5. Electrochemical oxidation
The use of electrochemical oxidation for the destruction of organic compounds in
water solutions has been tried on bench and pilot plant scale (Mieluch et al., 1975;
Boudenne et al., 1996; Brillas et al., 1998b), but is not used commercially because of its
high operating cost. One of the main advantages of the electrochemical processes is that
electrons are given or consumed within the electrodes, supplying a clean reactant, which
does not increase the number of chemical molecules involved in the process. Nevertheless,
they present some disadvantages, as:
- The electrochemical treatment is expensive in comparison with other processes
and the mechanism in water is rather complex
- The necessity of the effluent to be conductor, therefore in case that the stream to
be treated does not present a good conductivity a salt should be added
The electrochemical oxidation of organic compounds is thermodynamically favored
against the competitive reaction of oxygen production by oxidation of water. However, the
kinetics of oxidation of water is much faster than the kinetics of oxidation of the organic
compounds, among other reasons because of its higher concentration (Palau, 1998).
The mechanism of the electrochemical processes involves three stages:
electrocoagulation, electroflotation and electrooxidation. (Prousek, 1996):
--e +RH RH → (1.1)
+H+RH R− • → (1.2)
R + R R - R• • → (1.3)

1. Introduction
22
The anodic oxidation is generally considered to be a direct technique, involving the
direct transfer of an electron from the organic molecule to the electrode, thus generating a
cationic radical. In the direct way, the fate of the cationic radical, the pH and the nature of
the electrodes influence in a decisive manner on the formed products. The latter radical-
radical combinations have been frequently observed.
Few studies have been found in the literature regarding the electrochemical
oxidation of NB (Comminellis, 1994; Colucci et al., 1999) and none for the DCDE.
However, for phenol solutions many works recommend the use of this method for their
treatment (Lanouette, 1977; Smith, and Watkinson, 1981; Comninellis and Pulgarin, 1993;
Pulgarin et al., 1994). Many articles have been published about the application of
electrochemical process in industrial textile wastewater treatment as well. In many of them,
the efficiency of this method for color removal has been proven (Lin and Peng, 1994;
Vlyssides et al., 1999, 2000; Zappi et al., 2000; Gutierrez et al., 2001). It has been also
used in combination with coagulation to remove color, turbidity and COD (Lin and Cheng,
1997).
1.3.6. Photochemical processes
For the oxidation of organic pollutants, a series of researchers have proposed direct
photooxidation with ultraviolet light (Petersen et al., 1988). However, there are a number
of limitations for its use. The first one being that the organic compound to be eliminated
must absorb light in competition with other compounds of the effluent to be treated. The
second one is that the organic compounds generate a wide variety of photochemical
reactions that can produce products more complex for degradation. In addition, not all the
radiation emitted by the source of radiation is fully exploited, only the radiation absorbed
and only a part of this produces chemical changes which means that some reactions of
photodegradation have very slow kinetics.
The addition of energy as radiation to a chemical compound is the principle of the
photochemical processes. The molecules absorb this energy and reach excited states the
enough time to be able to carry out chemical reactions.
A large amount of studies (Legrini et al., 1993) dealt with the degradation of
chemicals in water using the Hg emission at 253.7 nm produced by low-pressure mercury
lamps. However, results showed that 253.7 nm irradiation alone could not be used as an

1.3. Methods for organic compounds removal
23
effective procedure for the removal of organics from water: it may be useful for the
degradation of substituted aromatic, however it is totally inefficient for effective removal
of chlorinated aliphatics. It should, however, be noted that low-pressure Hg lamps are quite
efficient for water disinfections purposes. Medium and high-pressure lamps, with a broader
emission spectrum, have been more frequently used for the degradation of contaminants.
Medium-pressure Hg lamps emit particularly strongly in the spectral region between 254
and 400 nm and are not only effective in generating hydroxyl radicals from e.g. hydrogen
peroxide or ozone, but also by causing electronic transitions in a large number of organic
molecules.
In the photochemical reactions, hydroxyl radicals may be generated by water
photolysis (Cervera and Esplugas, 1983):
h2H O H OHν • • → + (1.4)
Photolysis involves the interaction of light with molecules to bring about their dissociation
into fragments. This reaction is a poor source of radicals, and in the reaction medium large
quantity of reaction intermediates that absorb part of the radiation are generated, which
decreases considerably the photooxidation kinetics of the contaminants. That fact makes
the process valid only for effluents with low concentration of pollutants.
The photochemical treatment, although partially solving the problem of the
refractory compounds, has some negative aspects in its practical application, as the high
cost of UV radiation production. Furthermore, not all the emitted radiation is used, only the
absorbed radiation, and only a fraction of this radiation produces chemical changes. This
fact makes that some photodegradation reactions have a very low yields and slow kinetics.
To accelerate the process, other oxidants like hydrogen peroxide and/or ozone, metallic
salts or semiconductors like TiO2 can be added, giving rise to the so-called Advanced
Oxidation Processes. Instead of UV lamps, solar light could be used as radiation energy to
degrade some compounds.
No effect was observed during direct photolysis of NB with a 150-W mercury-
xenon lamp in the study carried out by (Lipczynska-Kochany, 1992). With regard to
phenol, DCDE, and textile wastewater no references were found.

1. Introduction
24
1.3.7. Biological oxidation
Biological treatment, generally by means of activated sludge (Wiesmann and
Putnaerglis, 1986; Givens et al., 1991), in adequate conditions (Wu et al., 1994) has
unquestionable advantages for the destruction of organic compounds. However, many
organic pollutants cannot be effectively eliminated by biological oxidation in the treatment
of municipal or residual waters nor natural waters (Bishop et al., 1968). Its application to
the treatment of effluents with phenols, nitro aromatic, ether aliphatic compounds and
textile waters is quite restricted because of the high toxicity inherent in these wastes, the
need to adjust the pH to an adequate value and add food and oxygen in adequate quantities
for the transforming microorganisms (González, 1993), as the viability of the process
depends fundamentally on the health and activity of the latter. There are two kinds of
processes in the biological treatment of biological compounds: aerobic and anaerobic
(Eckenfelder et al., 1989; Wang, 1992). The aerobic processes are used more because of
their efficiency and operational simplicity (Ruiz et al., 1992). In the case of phenol
solutions, for concentrations between 50 and 100 mg.L-1, aerobic treatment process has
been used successfully (Vian, 1982). NB has been found to be non-biodegradable at low
concentration (Urano and Kato, 1986; Kameya et al., 1995)!" For DCDE no reference was
found. In the case of textile wastewaters taking into account that they have a low
biodegradability, biological treatment combined with other treatments methods has been
tested. The results showed that it could be a good solution in the treatment of this type of
industrial wastewater (Pala, and Tokat, 2001). The coupled chemical and biological
treatment system will be described in details in section 1.3.10.
1.3.8. Chemical oxidation
Oxidation, by definition, is a process by which electrons are transferred from one
substance to another. This leads to a potential expressed in volts referred to a normalized
hydrogen electrode. From this, oxidation potentials of the different compounds are
obtained. Table 1.9 shows the potentials of the most commonly used oxidizers (Beltrán et
al., 1997; Munter et al., 2001).

1.3. Methods for organic compounds removal
25
Table 1.9. Oxidation power of selected oxidizing species
Oxidation species Oxidation power (V)
Fluorine 3.03
Hydroxyl radical 2.80
Atomic oxygen 2.42
Ozone 2.07
Hydrogen peroxide 1.77
Permanganate 1.67
Hypobromous acid 1.59
Chlorine dioxide 1.50
Hypochlorous acid 1.49
Hypoiodous acid 1.45
Chlorine 1.36
Bromide 1.09
Iodine 0.54
Chemical oxidation appears to be one of the solutions to be able to comply with the
legislation with respect to discharge in a determined receptor medium. It can also be
considered as an economically viable previous stage to a secondary treatment of biological
oxidation for the destruction of non-biodegradable compounds, which inhibit the process.
The optimization of the process (Akata and Gurol, 1992) arises in those conditions in
which non-biodegradable material is eliminated, but with a minimum amount of oxidizer.
That is to say, leading the oxidation to the formation of biodegradable compounds and not
those of CO2 and H2O. It can be said that it is an appropriate technique for small loads of
pollutants; load meaning the concentration of the pollutant multiplied by the volume of
flow of the effluent to be treated. This would otherwise become an expensive technique,
because of its large oxidizer consumption, and would have few possibilities in relation to
other more appropriate techniques for greater loads, as could be the selective absorption of
pollutants, when the concentration of the pollutant is high, or biological oxidation, for low
concentrations.

1. Introduction
26
In addition to the polluting load, for the chemical oxidation to be economically
profitable, it has to bear in mind the concentration of this in the effluent. This operation is
easier to apply in the destruction of compounds like phenol, nitrobenzene, DCDE, some
colorants and its derivatives for concentrations between 100 and 500 mg L-1. In the case of
higher concentrations, other operations come into play like selective absorption or
incineration, in the case that recuperation is not desired. For lower concentrations, there are
techniques like absorption and biological oxidation.
In general it can be said that chemical oxidation shows good prospects for use in
the elimination of non-biodegradable compounds in the following cases:
(a) For the treatment of high concentrations of the compound to be eliminated, without
the interference of other possible compounds. For example, when incineration is
not a viable alternative because the volume of flow of the effluent is great.
Optimization is obtained because the reactant is consumed in attacking the desired
compound. The existence of other compounds, which can oxidize, leads to a high
level of consumption of the reactant.
(b) As a pretreatment of currents, to reduce toxicity by avoiding causing problems of
inhibition in the biomass when being introduced in a biological treatment (activated
sludge). Intermediate levels of oxidation are aimed at, with a reduced consumption
of oxidizer, so that the effluent is in conditions to be biologically treated.
(c) As a final treatment for the adjustment of the effluent for the desired discharging
conditions.
A reference parameter in case of using chemical oxidation as treatment process is
the COD (see Fig.1.3). Only waters with relatively small COD contents (≤ 5 g.L-1) can be
suitably treated by means of these processes since higher COD contents would require the
consumption of too large amounts of expensive reactants. In those cases, it would be more
convenient to use wet oxidation or incineration: waste water with COD higher than 20
g.L-1 may undergo autothermic wet oxidation (Mishra et al., 1995).
The chemical oxidation processes can be divided in two classes:
- Classical Chemical Treatments
- Advanced Oxidation Processes (AOPs)

1.3. Methods for organic compounds removal
27
Figure 1.3. Suitability of water treatment technologies according to COD contents (Andreozzi et al., 1999)
Classical Chemical Treatments
Classical chemical treatments consist generally on the addition of an oxidant agent
to the water containing the contaminant to oxidize it. Among the most widely used it is
possible to emphasize (Chamarro et al., 1996):
- Chlorine: This is a good chemical oxidizer for water depuration because it
destroys microorganisms. It is a strong and cheap oxidant, very simple to feed
into the system and it is well known (Chamberlin and Griffin, 1952). Its main
disadvantages are its little selectivity, that high amounts of chlorine are required
and it usually produces carcinogenic organochloride by-products.
- Potassium permanganate: It has been an oxidizer extensively used in the
treatment of water for decades. It can be introduced into the system as a solid or
as a dissolution prepared on site. It is a strong but expensive oxidant, which
works properly in a wide pH range. One of the disadvantages of the use of
potassium permanganate as an oxidizer is the formation of magnesium dioxide
throughout oxidation, which precipitate and has to be eliminated afterward by
clarifying or filtration, both of which mean an extra cost.
COD g.L-1

1. Introduction
28
- Oxygen: The reaction of organic compounds with oxygen does not take place in
normal temperature and pressure conditions. Needed values of temperature and
pressure are high to increase the oxidizing character of the oxygen in the
reaction medium and to assure the liquid state of the effluent. It is a mild
oxidant that requires large investments in installations. However, its low
operating costs make the process attractive.
- Hydrogen peroxide: It is a multipurpose oxidant for many systems. It can be
applied directly or with a catalyst. The catalyst normally used is ferrous sulphate
(the so-called Fenton process, which will be presented below). Other iron salts
can be used as well. Other metals can also be used as catalyst, for example, Al3+,
Cu2+. Its basic advantages are:
- It is one of the cheapest oxidizers that is normally used in residual waters.
- It has high oxidizing power.
- It is easy to handle.
- It is water-soluble.
- It does not produce toxins or color in byproducts.
It can also been used in presence of ultraviolet radiation and the oxidation is
based on the generation of hydroxyl radicals that will be considered an advanced
oxidation process.
An option to the adding of hydrogen peroxide to the reaction medium is its
production on site. One production possibility is by electroreduction of the
oxygen dissolved in the reaction medium (Sudoh et al., 1986). This option is not
used very much, because it is expensive and increases the complexity of the
system.
- Ozone: It is a strong oxidant that presents the advantage of, as hydrogen
peroxide and oxygen, not introducing “strange ions” in the medium. Ozone is
effective in many applications, like the elimination of color, disinfection,
elimination of smell and taste, elimination of magnesium and organic
compounds (Sevener, 1990). In standard conditions of temperature and pressure
it has a low solubility in water and is unstable (Whitby, 1989). It has an average
life of a few minutes (Staehelin and Hoigné, 1982). Therefore, to have the

1.3. Methods for organic compounds removal
29
necessary quantity of ozone in the reaction medium a greater quantity has to be
used.
Among the most common oxidizing agents, it is only surpassed in oxidant power
by fluorine and hydroxyl radicals (see Table 1.9). Although included among the
classical chemical treatments, the ozonation of dissolved compounds in water
can constitute as well an AOP by itself, as hydroxyl radicals are generated from
the decomposition of ozone, which is catalyzed by the hydroxyl ion or initiated
by the presence of traces of other substances, like transition metal cations
(Staehelin and Hoigné, 1982). As the pH increases, so does the rate of
decomposition of ozone in water.
The major disadvantage of this oxidizer is that it has to be produced on site and
needs installation in an ozone production system in the place of use. Therefore,
the cost of this oxidizer is extremely high, and it must bear this in mind when
deciding the most appropriate oxidizer for a given system. In addition, as it is a
gas, a recuperation system has to be foreseen and that will make the obtaining
system even more expensive (Benitez et al., 1997).
Ozonation is used in many drinking water plants as a tertiary treatment and also
for the oxidation of organic pollutants of industrial (paper mill industry) or
agriculture (water polluted by pesticides) effluents. A lot of research has been
carried out to investigate the kinetics of the ozonation reaction of various
organic and inorganic compounds like carboxylic acids, phenols, amino acids,
organometallic compounds, etc (Hoigné and Bader, 1983 and references herein).
In the case of phenol, some studies have been made in order to establish a
kinetic model to predict the magnitude of gas-liquid reaction between ozone and
phenol. Contreras and co-workers (2001) studied the elimination of NB from
aquoes solution by means of ozonation and enhanced ozonation. In the case of
DCDE, the feasibility of enhancing biodegradability through the ozonation as
pre-oxidation treatment was studied. With regard to textile wastewaters the
ozonation has been found very efficient for decolorization of textile wastewaters
(Balcioglu and Arslan, 2001; Ciardelli et al., 2001; Sevimli and Kinaci, 2002).
The ozone treatment may be enhanced by the addition of hydrogen peroxide. For
this reason, a brief description of these combined systems will be presented.

1. Introduction
30
Advanced Oxidation Processes (AOPs)
AOPs were defined by Glaze and et al. (1987) as near ambient temperature and
pressure water treatment processes which involve the generation of highly reactive radicals
(specially hydroxyl radicals) in sufficient quantity to effect water purification. These
treatment processes are considered as very promising methods for the remediation of
contaminated ground, surface, and wastewaters containing non-biodegradable organic
pollutants. Hydroxyl radicals are extraordinarily reactive species that attack most of the
organic molecules. The kinetics of reaction is generally first order with respect to the
concentration of hydroxyl radicals and to the concentration of the species to be oxidized.
Rate constants are usually in the range of 108 – 1011 L.mol-1.s-1, whereas the concentration
of hydroxyl radicals lays between 10-10 and 10-12 mol.L-1, thus a pseudo-first order constant
between 1 and 10-4 s-1 is obtained (Glaze and Kang, 1989). As it can be seen from Table
1.9, hydroxyl radicals are more powerful oxidants than the chemical agents used in
traditional chemical processes.
Hydroxyl radicals are also characterized by a little selectivity of attack, attractive
feature for an oxidant to be used in wastewater treatment. Several and different organic
compounds are susceptible to be removed or degraded by means of hydroxyl radicals, as it
is shown in Table 1.10. Nevertheless, some of the simplest organic compounds, such as
acetic, maleic and oxalic acids, acetone or simple chloride derivatives as chloroform or
tetrachloroethane, cannot be attacked by OH radicals (Bigda, 1995). Depending upon the
nature of the organic species, two types of initial attacks are possible: the hydroxyl radical
can abstract a hydrogen atom to form water, as with alkanes or alcohols, or it can add to
the contaminant, as it is the case for olefins or aromatic compounds.
The attack by hydroxyl radical, in the presence of oxygen, initiates a complex
cascade of oxidative reactions leading to mineralization. As a rule of thumb, the rate of
destruction of a contaminant is approximately proportional to the rate constants for the
contaminant with the hydroxyl radical. From Table 1.11 it can be seen that chlorinated
alkenes treat most efficiently because the double bond is very susceptible to hydroxyl
attack. Saturated molecules as mentioned before, have smaller rate constants and therefore
are more difficult to oxidize.

1.3. Methods for organic compounds removal
31
Table 1.10. Oxidizable compouns by hydroxyl radicals (Bigda, 1995)
Compounds
Acids Formic, gluconic, lactic, malic, propionic, tartaric
Alcohols Benzyl, tert-butyl, ethanol, ethylene glycol, glycerol, isopropanol, methanol, propenediol
Aldehydes Acetaldehyde, benzaldehyde, formaldehyde, glyoxal, isobutyraldehyde, trichloroacetaldehyde
Aromatics Benzene, chlorobenzene, chlorophenol, creosote, dichlorophenol, hydroquinone, p-nitrophenol, phenol, toluene, trichlorophenol, xylene, trinitrotoluene
Amines Aniline, cyclic amines, diethylamine, dimethylformamide, EDTA, propanediamine, n-propylamine
Dyes Anthraquinone, diazo, monoazo
Ethers tetrahydrofuran
Ketones Dihydroxyacetone, methyl ethyl ketone
Table 1.11. Reaction rate constant (k, L mol-1 s-1)
Compounds OH••••
Chlorinated alkenes 109 to 1011
Phenols 109 to 1010
N-containing organics 108 to 1010
Aromatics 108 to 1010
Ketones 109 to 1010
Alcohols 108 to 109
Alkanes 106 to 109
The versatility of AOPs is also enhanced by the fact that they offer different ways
of HO• radicals production, thus allowing a better compliance with the specific treatment
requirements. It has to be taken into account, though, that a suitable application of AOPs to
wastewater treatment makes use of expensive reactants as hydrogen peroxide and/or ozone,

1. Introduction
32
and therefore they should not replace, whenever possible, the more economic treatments as
the biological degradation.
As hydroxyl radicals are so reactive and unstable, they must be continuously
produced by means of photochemical or chemical reactions. The main processes of
producing these radicals are described below. It is very difficult to make a classification of
the advanced oxidation processes, for the diverse combinations that are presented among
them. For this reason, they are presented in the way that has been considered more
appropriate.
1.3.8.1. UV-based processes
As it has been commented previously, the slow kinetics achieved by photochemical
reactions can be enhanced by the addition of hydrogen peroxide and/or ozone, metallic
salts or semiconductors. The UV/oxidizer system involves direct excitation of the substrate
due to the radiation with the subsequent oxidation reaction. Even so, there may be
synergism between the oxidizer and the ultraviolet radiation, which causes the global effect
to be different from the additive effect.
1.3.8.1.1. UV/O3 process
The UV/O3 system is an effective method for the oxidation and destruction of organic
compounds in water. Basically, aqueous systems saturated with ozone are irradiated with UV
light of 253.7 nm. The extinction coefficient of O3 at 253.7 nm is 3300 L.mol-1.cm-1, much
higher than that of H2O2 (18.6 L.mol-1.cm-1). The decay rate of ozone is about a factor of 1000
higher than that of H2O2 (Guittonneau et al., 1991).
The AOP with UV radiation and ozone is initiated by the photolysis of ozone. The
photodecomposition of ozone leads to two hydroxyl radicals, which do not act as they
recombine producing hydrogen peroxide (Peyton and Glaze, 1988):
h2 2 3 2H O + O 2 HO + Ov • → (1.5)
2 22 HO H O• → (1.6)
This system contains three components to produce OH radicals and/or to oxidize
the pollutant for subsequent reactions: UV radiation, ozone and hydrogen peroxide.

1.3. Methods for organic compounds removal
33
Therefore, the reaction mechanism of O3/H2O2 as well as the combination UV/H2O2 is of
importance. Considering that hydrogen peroxide photolysis is very slow compared with the
rate at which ozone is decomposed by HO2-, it seems that a neutral pH the second reaction
is the main pathway.
Several authors have studied the efficiency of this process with different aromatic
compounds. Gurol and Vatistas (1987) studied the photolytic ozonation of mixtures of
phenol, p-cresol, 2,3-xylenol and catechol at acidic and neutral pH. Guittoneau et al.
(1990) reported that the O3/UV process was found to be more efficient than the UV/H2O2
system for the degradation of p-chloronitrobenzene. Some articles have been found as well
in the literature regarding the degradation of NB by means of the O3/UV process. Beltrán
et al. (1998) have studied the effect of ozone feed rate, pH and hydroxyl radical scavengers
in the removal of NB by this combination. Besides, Contreras et al. (2001) have studied the
effect of pH and ozone in the oxidation of NB by this process. In the case of DCDE and
textile wastewaters no references were found.
1.3.8.1.2. UV/O3 /H2O2 process
The addition of H2O2 to the UV/O3 process accelerates decomposition of ozone
resulting in increased rate of HO• radicals generation. This is a very powerful method that
allows a considerable reduction of the TOC. This process is the combination of the binary
systems UV/O3 and O3/H2O2.
Mokrini et al. (1997) presented the degradation of phenol by means of this process
at different pHs, establishing the optimal H2O2 amount. A 40% of TOC reduction was
achieved by this method. Trapido et al. (2001) reported that the combination of ozone with
UV radiation and hydrogen peroxide was found to be more effective for the degradation of
nitrophenols than single ozonation or the binary combinations, increasing the reaction rate
and decreasing the ozone consumption when using low pH values. Contreras et al. (2001)
demonstrated that the addition of H2O2 to UV/O3 system slightly improves the rate of TOC
removal in solutions of nitrobenzene. With regards to DCDE and textile wastewaters no
articles have been found in the literature about the oxidation of these compounds by means
of this combined process.

1. Introduction
34
1.3.8.1.3. Fe3+ / UV-vis process
Among the AOPs, the iron photo-assisted system 3+Fe /UV-vis, without addition of
other electron acceptor than O2 from air, has received special attention as a potential
wastewater treatment process. The interesting point in such a system, compared to the
photo-Fenton process is that no addition of hydrogen peroxide is needed. The excitation of
[Fe(OH)(H2O)5]2+, the dominant monomeric species of aqueous ferric ion in acidic
solution, is known to yield HO• (eq. 1.7 similar to 1.17) with a quantum yield of 0.075 at
360 nm (Benkelberg and Warneck, 1995).
h2+ 2+Fe(OH) Fe + HOv • → (1.7)
where Fe(OH)2+ refers to [Fe(OH)(H2O)5]2+.
This electron transfers process has been efficiently used to study the degradation of
several organic pollutants in aqueous solution (Nansheng et al., 1996; Brand et al., 1997;
Catastini et al., 2001). Mazellier and Bolté (1999, 2001) used this process for the
degradation of 4- and 3-chlorophenol in aqueous solution. The process was found to be an
efficient photoinducer of these phenolic compounds. Regarding DCDE, NB, and textile
wastewaters, no references were found.
1.3.8.1.4. UV/TiO2 (Heterogeneous photocatalysis)
Over the last few years the tendency has been to carry out chemical oxidation in the
presence of a catalyst that serves as a generator of hydroxyl radicals, and, therefore, the
addition of an oxidizer in the medium is not necessary.
Heterogeneous photocatalytic process consists on utilizing the near UV radiation to
photoexcite a semiconductor catalyst in the presence of oxygen. Under these circumstances
oxidizing species, either bound hydroxyl radical or free holes, are generated. The process is
heterogeneous because there are two active phases, solid and liquid. This process can also
be carried out utilizing the near part of solar spectrum (wavelength shorter than 380 nm)
what transforms it into a good option to be used at big scale (Malato et al., 2002).
Many catalysts have been tested, although TiO2 in the anatase form seems to
possess the most interesting features, such as high stability, good performance and low cost
(Andreozzi et al., 1999). It presents the disadvantage of the catalyst separation from
solution, as well as the fouling of the catalyst by the organic matter.

1.3. Methods for organic compounds removal
35
Minero et al. (1994) studied the photocatalytic degradation of NB on TiO2 and
ZnO, reporting that complete mineralization with TiO2 was achieved. Mathew (1990) also
reported that more than 90% of NB mineralization was achieved with TiO2 and sunlight.
Phenolic compounds have been successfully degraded by photocatalytic process (Giménez
et al., 1996; Curcó et al., 1999b; Minero, C. et al., 1993). Regarding DCDE, no references
about the use of photocatalysis heterogeneous has been found. Few studies have been
found in the literature regarding the photocalytic oxidation of textile wastewaters
(Balcioglu and Arslan, 1999).
1.3.8.2. H2O2 -based processes
The most important advanced oxidation treatments based in the use of H2O2 are:
- H2O2/UV
- H2O2 /O3 process and
- Fenton and photo-Fenton process.
1.3.8.2.1. H2O2 /UV process
This AOP process is explained extensively in chapter 4. Briefly, the H2O2/UV
system involves the formation of HO· radicals by hydrogen peroxide photolysis and
subsequent propagation reactions. The mechanism most commonly accepted for the
photolysis of H2O2 is the cleavage of the molecule into hydroxyl radicals:
h2 2H O 2 HOv • → λ ≤ 400 nm (1.8)
It presents the advantage compared when working with ozone that it provides a cheap and
sure source of radicals, eliminating this way the problem of the handling of ozone. The
major drawback of this process is that if the solution presents a strong absorbance this can
compete with hydrogen peroxide for the radiation, thus cloudy waters or containing
compounds absorbing UV radiation can present problems at being treated by this method.
The effectiveness of the UV/H2O2 system in the treatment of aromatic compounds
such phenol and NB has been widely studied (e.g. García et al., 1989 and Lipczynska-
Kochany, 1992). However, in the case of DCDE, no reference was found. Alaton and
Balcioglu (2002) show the effectiveness of H2O2/UV system as pretreatment or in
combination with other advanced oxidation process in the treatment of textile wastewater.

1. Introduction
36
1.3.8.2.2. H2O2 /O3 process
Addition of hydrogen peroxide to ozone offers another way to accelerate the
decomposition of ozone, leading to the formation of OH radicals. Hydrogen peroxide in
aqueous solution is partially dissociated in the hydroperoxide anion (HO2-), which reacts with
ozone, decomposing this and giving rise to a series of chain reactions with the participation of
hydroxyl radicals.
In the global reaction two ozone molecules produce two hydroxyl radicals (Glaze and
Kang, 1989).
2 2 3 2H O + 2 O 2 HO + 3 O•→ (1.9)
As this system does not depend on the UV radiation transmission to activate the ozone or
hydrogen peroxide molecules, its greatest advantage is to be able to work with turbid
waters without problems.
Balcioglu and Arslan (2001) studied the efficiency of ozonation and O3/H2O2 of
reactive dyes and textile dye-bath wastewater. They found a considerable improvement in
COD and color removal rates at pH=11, which is normally the pH of textile wastewaters.
With regards to phenol, NB and DCDE no references were found.
1.3.8.2.3. Fenton and photo-Fenton reaction
The Fenton reaction was discovered by H.J.Fenton in 1894 (Fenton, 1894). Forty
years later the Haber-Weiss (1934) mechanism was postulated, which revealed that the
effective oxidative agent in the Fenton reaction was the hydroxyl radical. Since then, some
groups have tried to explain the whole mechanism (Walling, 1975; Sychev and Isak, 1995)
that will be treated in details in the next two chapters. The Fenton reaction can be outlined
as follows:
n+ (n+1)+ -2 2M + H O M + HO + HO•→
where M is a transition metal as Fe or Cu.
In the absence of light and complexing ligands other than water, the most accepted
mechanism of H2O2 decomposition in acid homogeneous aqueous solution, involves the
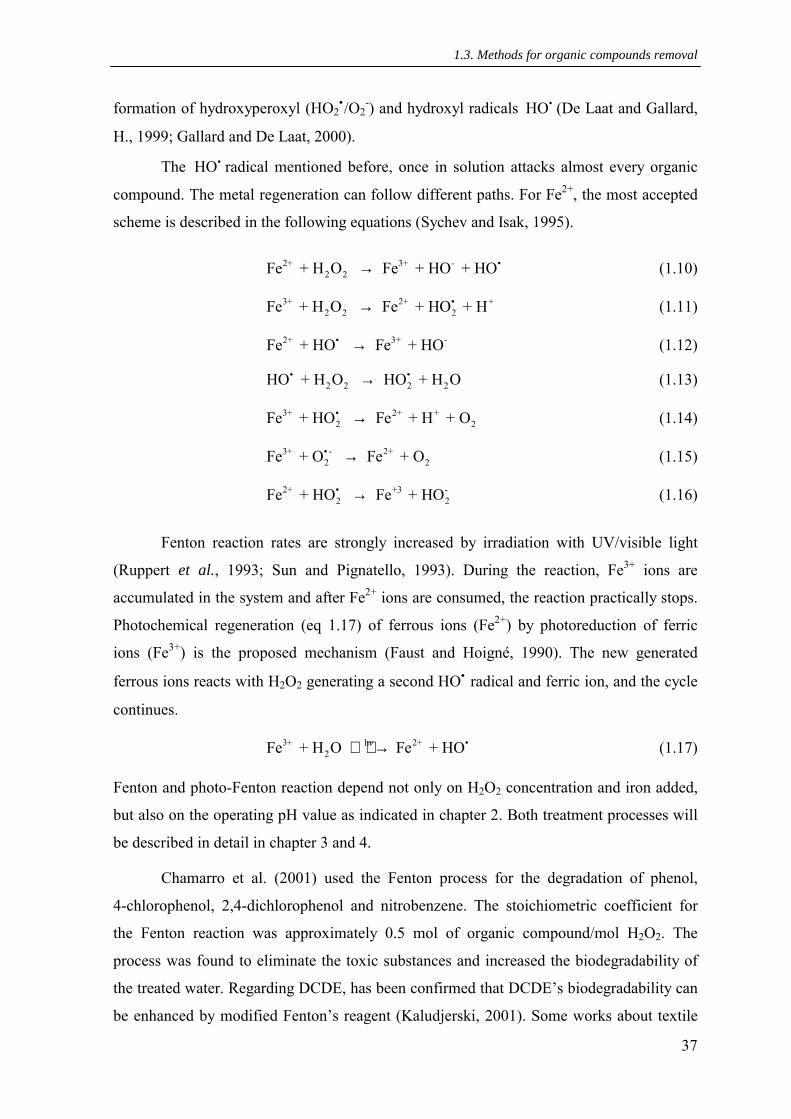
1.3. Methods for organic compounds removal
37
formation of hydroxyperoxyl (HO2•/O2
-) and hydroxyl radicals HO• (De Laat and Gallard,
H., 1999; Gallard and De Laat, 2000).
The HO• radical mentioned before, once in solution attacks almost every organic
compound. The metal regeneration can follow different paths. For Fe2+, the most accepted
scheme is described in the following equations (Sychev and Isak, 1995).
2+ 3+ -2 2Fe + H O Fe + HO + HO•→ (1.10)
3+ 2+ +2 2 2Fe + H O Fe + HO + H•→ (1.11)
2+ 3+ -Fe + HO Fe + HO• → (1.12)
2 2 2 2HO + H O HO + H O• •→ (1.13)
3+ 2+ +2 2Fe + HO Fe + H + O• → (1.14)
3+ - 2+2 2Fe + O Fe + O• → (1.15)
2+ +3 -2 2Fe + HO Fe + HO• → (1.16)
Fenton reaction rates are strongly increased by irradiation with UV/visible light
(Ruppert et al., 1993; Sun and Pignatello, 1993). During the reaction, Fe3+ ions are
accumulated in the system and after Fe2+ ions are consumed, the reaction practically stops.
Photochemical regeneration (eq 1.17) of ferrous ions (Fe2+) by photoreduction of ferric
ions (Fe3+) is the proposed mechanism (Faust and Hoigné, 1990). The new generated
ferrous ions reacts with H2O2 generating a second HO• radical and ferric ion, and the cycle
continues.
h3+ 2+2Fe + H O Fe + HOv • → (1.17)
Fenton and photo-Fenton reaction depend not only on H2O2 concentration and iron added,
but also on the operating pH value as indicated in chapter 2. Both treatment processes will
be described in detail in chapter 3 and 4.
Chamarro et al. (2001) used the Fenton process for the degradation of phenol,
4-chlorophenol, 2,4-dichlorophenol and nitrobenzene. The stoichiometric coefficient for
the Fenton reaction was approximately 0.5 mol of organic compound/mol H2O2. The
process was found to eliminate the toxic substances and increased the biodegradability of
the treated water. Regarding DCDE, has been confirmed that DCDE’s biodegradability can
be enhanced by modified Fenton’s reagent (Kaludjerski, 2001). Some works about textile

1. Introduction
38
waters treatment by means of Fenton and photo-Fenton process have been published. Most
of them showed their effectiveness for color removal and COD reduction (Balanosky et al.,
1999; Kang et al., 2000; Perez et al., 2002).
An improvement of photoassisted Fenton processes is the UV-vis/ferrioxalate/H2O2
system, which has been recently demonstrated to be more efficient than photo-Fenton for
the abatement of organic pollutants (Zepp et al., 1992; Safarzadeh-Amiri et al., 1996).
Recently, two new electrochemical procedures for the detoxification of acidic
waste waters, the so-called electro-Fenton and photoelectro-Fenton processes, where H2O2
is electrogenerated, have been developed and have shown their good efficiencies for the
mineralization of aniline (Brillas et al., 1998a), 4-chlorophenol (Brillas et al., 1998b) and
2,4-D (Brillas et al., 2000).
1.3.9. AOPs combined with biological treatments
Biological treatment of wastewater, groundwater, and aqueous hazardous wastes is
often the most economical alternative when compared with other treatment options. The
ability of a compound to undergo biological degradation is dependent on a variety of
factors, such as concentration, chemical structure and substituents of the target compound.
The pH or the presence of inhibitory compounds can also affect the biological degradation.
Although many organic molecules are readily degraded, many other synthetic and naturally
occurring organic molecules are biorecalcitrant (Adams et al., 1997).
Several chemical processes, which use oxidizing agents such as ozone, hydrogen
peroxide, etc. have been carried out to mineralize many synthetic organic chemicals.
However, costs associated with chemical oxidation alone can often be prohibitive for
wastewater treatment. A potentially viable solution is the integration of chemical and
biological treatment processes as an economical means for treating biorecalcitrant organic
chemicals in wastewater. The chemical process would be used as a pre-treatment in order
to increase the biodegradability of the wastewater (Parra et al., 2000, 2002; Sarria et al.,
2001). The oxidation of organic compounds in water with AOPs usually produces
oxygenated organic products and low molecular weight acids that are more biodegradable
(Gilbert, 1987; Heinzle et al., 1995; Marco et al., 1997; Ledakowicz, 1998). With the
AOPs, toxic compounds would be removed until no inhibition due to its toxicity was there
and/or non-biodegradable compounds turned into more biodegradable. This feature is

1.3. Methods for organic compounds removal
39
economically interesting, as investment and operating costs are much lower for a
biological process than a chemical one: investments costs for biological processes range
from 5 to 20 times less than chemical ones such as ozone or hydrogen peroxide, while
treatment costs range from 3 to 10 times less (Scott and Ollis, 1996; Marco et al., 1997).
In these combined processes, if we want to determine the variation of
biodegradability as a function of the chemical reaction conditions (time of pre-treatment,
concentration of the oxidizing agent, temperature, etc), a biodegradation test is required.
Methods for measuring biodegradability in these systems have been proposed by a number
of authors. BOD and BOD/COD or BOD/TOC are commonly used (Gilbert, 1987; Yu and
Hu, 1994; Marco et al., 1997; Chamarro et al., 2001). Other biodegradability measures
including substrate destruction, total organic carbon (TOC) evolution, oxygen uptake, EC50
toxicity measurements, cell growth counts and intracellular ATP levels also have been
used (Scott and Ollis, 1995; Pulgarin et al., 1999).
During the last decade, many studies focused in the use of advanced oxidation
processes as pre-treatment step have increased. In this sense, it is proper to cite that the
first coupled flow system was developed by Pulgarin et al. (1999). They showed the
effectiveness of a coupling photochemical and biological treatment process in the
mineralization of biorecalcitrant industrial pollutants (Pulgarin et al., 1999; Parra et al.,
2000; Sarria et al., 2001)
Alaton and Balcioglu (2002) reported that ozonation and H2O2/UV as pretreatment
of a textile wastewater were found to enhance the effectiveness of a subsequent biological
treatment. Hu and Yu (1994) also reported that pre-ozonation of chlorophenolic
compounds enhanced the effectiveness of a biological treatment. Lin and Peng (1994)
reported that the combination of coagulation, electrochemical oxidation and activated
sludge in the treatment of textile wastewater is highly competitive in comparison with the
conventional treatment practiced in the textile industry. Besides this, Pala and Tokat (2002)
outlined that due to the low biodegradability of the textile wastewaters and due to the not
very efficient performed of the biological treatment in the color removal, it should be
carried out in combination with activated carbon. No studies regarding the effect of Fenton
and photo-Fenton process on the biodegradability of NB, DCDE, and textile solutions have
been found in the literature.

2. Objectives


2. Objectives
43
Nowadays, in those industries with aqueous effluents in which the concentration of
recalcitrant organic compounds is important, an economical and technical solution has not
been found in most cases yet. For this reason, the search for solutions of this problem is an
interesting research topic.
Nitroaromatic, phenols, and chlorinated ethers constitute a risk to human health and
produce a public concern, thus several of them have been listed among the 130 priority
pollutants given by the US EPA in the Federal Clean Water Act (CWA), e.g. NB and
phenol (EPA, visited in 2002).
Among nitroaromatic compounds, the US EPA has recently included nitrobenzene
in a reduced list of drinking water contaminants to be investigated in the period 2001-2005
(Hayward, 1999). However, few articles have been found in the literature regarding the
treatment of this compound by means of AOPs (Advanced Oxidation Processes),
especially those based on the use of UV radiation and/or H2O2. Therefore an improved
AOPs study are necessary to provide future successfully treatment of water contaminated
with this compound. Moreover, taking into account that phenol is possibly the most widely
organic compound studied in AOPs it was decided to use as model and to be compared
with nitrobenzene treatment results. Regarding chlorinated ethers solvents, the 1996 Toxic
Release Inventory for California indicates that e.g. DCDE exists in the discharge of various
chemical and petrochemical companies in Southern California. Thus, the study of the
removal of DCDE by means of an AOP (in this case, UV/H2O2) was performed as part of a
project carried out in the Environmental Department of San Diego State University (CA,
USA) and supported by the Water Environment Research Foundation (USA).
On the other hand, textile industries are major consumers of water and
consequently one of the largest groups of industry causing intense waster pollution. The
wastewater generated by the different production steps (i.e. sizing of fibers, scouring,
desizing, bleaching, washing, mercerization, dyeing and finishing) contains high
concentration of non-biodegradable matter, toxic substances, detergents and soaps, oil and
grease, sulfide, sodas, and alkalinity. Following with the application of AOPs, the
treatment of a wastewater from a textile industry by means of photo-Fenton process was
carried out in the frame of a cooperation project between French Textile Institute and the
Ecole Politechnique de Lausanne (Switzerland).

2. Objectives
44
Accordingly, the general objective of this work was to study the effectiveness of
the AOPs cited above in the degradation and mineralization of those organic pollutants
(NB and phenol), as well as the influence of those processes in the biodegradability
enhancement of a wastewater, e.g. containing DCDE and from a textile industry. For this
latter objective, a general strategy focused on the application of a coupled chemical and
biological treatment has been established to enhance the global removal degree.
The AOPs selected to carry out this study were:
• Fenton and photo-Fenton process
• UV/H2O2 system
• Fe3+/UV-vis system
The work was divided in different sections with the following objectives:
!"To study the effect of the Fenton process on the degradation rate of NB and phenol.
The objective of this part was, after studying a wide range of experimental
conditions to understand the mechanisms to propose a general empirical kinetic
equation for the degradation of these compounds as a function of H2O2, Fe2+, O2,
temperature, and its initial concentration.
!"Following with the treatment of wastewaters containing NB and phenol, to study
the mineralization of these solutions by means of different UV-based AOPs.
Photo-Fenton, H2O2/UV, and Fe3+/UV processes were studied in order to find the
best experimental conditions for NB and phenol mineralization. Besides this, the
influence of different sources of light was studied making special emphasis in the
use of solar technology for water remediation. Kinetic intrinsic constants were
estimated to be used as tool for the scaling-up of photo-reactors.
!"To study the effect on the biodegradability enhancement of treated solutions of
DCDE by means of AOPs. The goal of the study was not to chemically oxidize all
organic matter to CO2 and H2O, but rather to convert DCDE into products that are
readily biodegradable in conventional biological treatment plants. This part was
carried out at the San Diego State University (CA, USA) and chosen AOP was
UV/H2O2. The inhibition respiration rate caused by DCDE and its oxidation

2. Objectives
45
byproducts was assessed by respirometric test by measuring the oxygen
consumption.
!"The development of a strategy to be applied in wastewater treatment, using as
example waters produced in textile activities. Effluents produced in a textile
industry located in the south of France were selected to evaluate a general strategy
for the treatment of the different generated wastewaters. The aim of this study was
to explore the possibility of using the photo-Fenton process as pre- or post-
treatment to enhance the global removal performance. This study was performed at
the EPFL in Lausanne (Switzerland) and in this case, the Zahn-Wellens test was
used to follow the biodegradability of treated solution.
To achieve the experimental objectives, the following variables were chosen to be
followed throughout the treatment:
- Concentration of target compounds
- pH
- Hydrogen peroxide concentration
- Total Organic Carbon (TOC)
- Chemical Oxygen Demand (COD)
- Biological Oxygen Demand (BOD)
- Oxygen consumption (Short-term and long-term respirometric test).

3. Removal of nitrobenzene and phenol by Fenton process.
Kinetic model


3.1. Introduction
49
3.1. Introduction
The oxidative decomposition and transformation of organic substrates by 2+
2 2H O / Fe (known as Fenton’s reagent) has been known for nearly a century (Fenton,
1894). This method has the advantage that hydrogen peroxide, used as oxidant, is cheaper
than other oxidants and it has also the advantage of using iron as catalyst. The iron is the
second most abundant metal and the fourth most abundant element on earth. In water it is
present as ferric or ferrous ions, which form complexes with water and hydroxyl ions
depending on pH and the temperature. Fig.3.1, shows the percentage of Fe2+ and the
species that appear together with it, in relation to the pH at 25oC and where is possible to
see that up to a pH level around 8, Fe2+ exists in solution.
Tot
al c
once
ntra
tion
(%)
Tot
al c
once
ntra
tion
(%)
Figure 3.1. Proportion of Fe2+ and the species in equilibrium with it at
25oC.
From this, it can be concluded that Fe2+ in the Fenton system will be in this form
and in solution. Fig.3.2 shows the concentration of Fe3+ in solution in relation to the pH at
25oC. This representation has been carried out for a pH of between 2 and 3.2 because this
is the solubility limit. As it can be observed, the solubility of Fe3+ is very high for a pH
lower than 2 and too small for a pH higher than 3.2. Therefore, in Fenton conditions the
Fe3+ will be in solution if pH is maintained < 3.2.
pH

3. Fenton process
50
pH
Solu
bilit
y of
Fe3+
(mgL
-1)
pHpH
Solu
bilit
y of
Fe3+
(mgL
-1)
Figure 3.2. Concentration of Fe3+ in solution in relation to the pH at 25oC.
In Fig. 3.3 it can be also seen the proportion of Fe3+ species that are in equilibrium
in relation to the pH ( Safarzadeh-Amiri et al., 1996)
pH
Tot
al c
once
ntra
tion
(%)
pH
Tot
al c
once
ntra
tion
(%)
Figure 3.3. Proportion of Fe3+ and the existing species in equilibrium with it at 25oC
From this figure, the low solubility of Fe3+ and all its species can be seen at pH 3.
At pH 3 the solubility of Fe3+ is around 4 mg.L-1. According to Eisenhauer (1964), in spite
of the low solubility of Fe3+ in presence of phenol in the reaction medium, ferric hydroxide
does not precipitate throughout oxidation because it is transformed into Fe2+ due to the
reaction of Fe3+ with some products of phenol oxidation. The commonly mentioned
disadvantage of the Fenton method is the necessity to work at low pH (normally below 4),

3.1. Introduction
51
because at higher pH ferric ions would begin to precipitate as hydroxide. In addition, by
this process the maximum mineralization reached is around 40-60 %.
Although the Fenton reagent has been known for more than a century and shown to
be a powerful oxidant, the mechanism of the Fenton reaction is still under intense and
controversial discussion. Generation of HO· radicals by the dark reaction of H2O2 with
ferrous salt has been the subject of numerous studies during the last decade (Arnold et al.,
1995; Pignatello and Day, 1996; Chen and Pignatello, 1997; Hislop and Bolton, 1999). The
oxidizing species generated in the Fenton’s reaction have been discussed by many
investigators but are still controversial (Walling, 1975; Stubbe and Kozarich, 1987;
Bossmann et al., 1998; MacFaul, 1998; Goldstein, 1999; Kremer, 1999). The recognition
of the HO· radical as the active intermediate is not yet universal and even doubts as to its
very existence in the system have been raised (Bossmann et al., 1998; Kremer, 1999).
Bossmann and co. (1998) outlined clearly that recent thermodynamic calculations have
demonstrated that outher-sphere electron-transfer reaction between Fe2+ and H2O2, as it is
rationalized by the classic mechanism proposed by Haber and Weiss, cannot take place,
because the formation of -2 2H O by intermediates is not favored. In contrast, the formation
of a hydrated Fe2+- H2O2 complex is thermodynamically favored. However, in the main
studies of the Fenton’s reagent, it is generally considered that the reaction between H2O2
and Fe2+ in acidic aqueous medium (pH ≤ 3) produces HO• radicals (eq.1.10) and can
involve the steps presented below (eqs. 1.10 - 1.14, 1.16, 1.6). The rate constants are
reported at 298 K for second-order reaction rate.
2+ 3+ -
2 2Fe + H O Fe + HO + HO•→ k1= 63 L.mol-1s-1 (Gallard, 2000) (1.10)
3+ 2+ +2 2Fe + H O Fe + H + HOO•→ k2= 0.002 L.mol-1s-1 (Pignatello, 1992) (1.11)
2+ 3+ -Fe + HO Fe + HO• → k3= 3x10⁸ L.mol-1s-1 (Haber, 1934) (1.12)
2 2 2HO + H O HOO + H O• •→ k4= 2.7x10⁷ L.mol-1s-1 (Butxon, 1988) (1.13)
2+ 3+ -2Fe + HO Fe + HOO• → k5= 1.2x10⁶ L.mol-1s-1 (Haber, 1934) (1.16)
3+ 2+ +2 2Fe + HO Fe + H + O• → k6= 2x10³ L.mol-1s-1 (Hardwick, 1957) (1.14)
2 22 HO H O• → k7= 5.2x10⁹ L.mol-1s-1 (Sehested, 1968) (1.6)

3. Fenton process
52
The hypothesis of Haber and Weiss (1934), that the Fenton reaction involves the
formation of •ΗΟ radicals has been proved by many techniques, including EPR
spectroscopy. Although a considerable number of investigators, using the EPR spin-
trapping technique, have found evidence for the formation of •ΗΟ radicals from Fenton’s
reagent (Dixon and Norman, 1964; Rosen et al., 2000), it has also been reported by others
(Rahhal and Richter, 1988) that this species is not the only oxidizing intermediate, but also
some type of high-valent iron-oxo intermediates (Groves and Watanabe, 1986; Kean et al.,
1987; Sychev and Isak, 1995; Bossmann et al., 1998; Kremer, 1999). Using EPR
spin-trapping, three types of oxidizing species (free HO·, bound HO·, and high-valence iron
species, which is probably a ferryl ion, (FeIV) were detected by Yamazaki and Piette,
1991). In the present work, the principal oxidant is assumed to be •ΗΟ radical, but others
such as iron-oxo species cannot be ruled out.
A number of studies on the degradation of NB in aerated aqueous solutions by the
Fenton’s reagent have been reported (Lipczynska-Kochany, 1991, 1992). However in a
system containing NB, H2O2, and Fe (II), the effects of temperature and initial
concentrations of these components and dissolved oxygen, on the degradation rate of NB,
have not been investigated in detail. In this context and taking into account that the NB is
one of the most representative nitroaromatic compound, which is present in several
wastewaters, a study on its chemical degradation by Fenton reagent was carried out.
Besides, phenol has been also selected because it is the most typical and common model
compound used in the application of different advanced oxidation processes as treatment
method (Sadana and Katzer, 1974; Hashimoto et al., 1979; Ohta et al., 1980; Gurol and
Vastistas, 1987; Kawaguchi, 1992; Serpone et al., 1992; Litvintsev et al., 1993; Lin and
Chuang, 1994; Kannan, 1995; Benitez et al., 1997; Vicente et al., 2002). Therefore, the
aim of this section was to determine some kinetic parameters in order to find a general
kinetic equation for NB and phenol degradation by dark Fenton process.

3.2. Experimental
53
3.2. Experimental
3.2.1. Reagents
In Table 3.1 all chemicals that were used in the experimentation are shown. All
were used as received.
Table 3.1. List of chemicals used
Compound Formula Vendor Purity Acetronitrile C2H3N Merck 99.8% Hydrogen peroxide H2O2 Merck 30 wt.%
Iron sulphate heptahydrate
FeSO4 · 7H2O Panreac 98%
m-nitrophenol C3H5NO2 Merck 99% Nitrobenzene C3H5NO2 Probus 99% Nitrogen N2 AlphaGas 99.99% o-nitrophenol C3H5NO2 Merck 99% Oxygen O2 AlphaGas 99.99% p-nitrophenol C3H5NO2 Merck 99% Phenol C6H6O Merck 99% Sodium hydrogen sulphite Na2S2O3 Panreac 40 w/v %
All solutions of NB, phenol, H2O2, and ferrous salt were prepared in millipore water
(18 µS cm-1) just before being used.
3.2.2. Experimental device and procedure (reactor A)
All experiments were conducted in a 1 L thermostated batch glass reactor (A)
(Fig. 3.4), equipped with a magnetic stirrer, in the absence of light, and under air pressure
about 1x10⁵ Pa ([O2]o = 0.27 mmol.L-1). Kinetic experiments of NB and phenol
degradation were initiated by adding a known amount of H2O2 into the reactor, which
contained the pollutant (NB or phenol) and FeSO4 in water solutions under vigorous
magnetic-stirring. The reactions were carried out in non-buffered conditions and pH values
for all experiments decreased during the reaction from 3.5 to 2.5. In this range, values of
the overall rate constants for the H2O2 decomposition by Fe2+ and Fe3+, and consequently
NB and phenol degradation rates, are relatively independents from pH within experimental

3. Fenton process
54
error (De Laat and Gallard, 1999; Hislop and Bolton, 1999). Samples were periodically
withdrawn during kinetic experiments, quenched with sodium hydrogen sulphite solution
40% w/v to avoid further reactions, and used for analysis.
Figure 3.4. Reactor A
Some experiments were carried out bubbling oxygen and nitrogen into the solution,
since 30 min before adding the corresponding amount of H2O2.
It is important to establish that the disappearance of NB and phenol in this batch
reactor proceeds by the Fenton reaction, i.e. to exclude the possibility of vaporization of
NB and phenol from water. In this sense, control experiments were carried out with
prolonged heating (2 h) at 318 K, without Fenton’s reagent. On the other hand, control
experiments were conducted for sparged sampled. These experiments showed that
absolutely no change is observed in NB and phenol initial concentration (HPLC analysis).

3.2. Experimental
55
3.2.3. Analytical determinations
3.2.3.1. HPLC
To study the degradation of nitrobenzene and phenol, it is necessary to determine
its concentration during time. The selected method has been the high performance liquid
chromatography in reverse phase.
The liquid chromatograph used consists of:
- Waters degasser.
- Controller Waters 600.
- Autosampler Waters 717.
- Oven for columns and temperature controller Waters
- Photodiode array detector Waters 996.
- Millenium software.
The column presented the following characteristics:
- Packing: SPHERISORB ODS2
- Particle size: 5 µm
- Length: 25 cm
- Inner diameter: 0.46 cm.
The mobile phase used was a mixture acetonitrile:water:phosphoric acid
(40:60:0.5%), isocratically delivered (constant composition and flow rate) by a pump at a
flow rate of 1 mL.min-1. The wavelength of the UV detector was selected from the
absorption spectra of nitrobenzene and phenol. Maximum absorption of nitrobenzene and
phenol were found to be 267.3 and 270 nm, respectively. Injected volume of each sample
was 10 µL. Temperature was set at 25ºC. Under these conditions, retention time for
nitrobenzene and phenol were 13.8 and 6 min, respectively. Integration was performed
from the peaks area and the calibration was done by means of nitrobenzene and phenol
standards.
Identification and quantification of some intermediates products from NB
degradation has been also carried out by this method using similar conditions (see Fig.
3.5). o-, m-, and p-nitrophenols were detected at 282, 277, and 321 nm, respectively.

3. Fenton process
56
Under these conditions, the retention times of the compounds were as follow (min): 7.5 (p-
nitrophenol), 7.8 (m-nitrophenol), 11.8 (o-nitrophenol).
p-N
itrop
heno
l
m-N
itrop
heno
l
o-N
itrop
heno
l Nitr
oben
zene
Figure 3.5. Chromatogram with some intermediates products identified after degradation of NB by Fenton process
3.2.3.2. pH
The pH measurements were carried out with a Crison GLP-22 pH-meter, calibrated
with two buffer solutions of pH 4 and 7. The analysis was performed on line.
3.2.4. Range of experimental variables for NB and phenol degradation
Several series of experiments of NB and phenol degradation by “Fenton-like”
reagent ([H2O2]o >> [Fe2+]o) were conducted by varying the temperature (278-318 K) and
the initial concentrations of H2O2, Fe2+, NB or phenol and dissolved oxygen (0-1.4
mmol.L-1 in case of NB). Table 3.2 and 3.3 summarizes the values of these operating
variables in a group of experiments for NB and phenol, respectively. The initial
concentration of NB was tested from 0.37 to 2.46 mmol.L-1. Hydrogen peroxide and 2+Fe concentration ranges were chosen addressing to reach the highest NB degradation

3.2. Experimental
57
percentage in a time interval from 5 to 120 min. The [H2O2]o/[NB]o, [H2O2]o/[Fe2+]o and
[NB]o/[Fe2+]o ratios varied from 2.1 to 32.3, 6.8 to 102.8 and 0.4 to 18.9, respectively.
Table. 3.2. Experimental conditions of the runs, first-order rate constants and initial oxidation rate of nitrobenzene
Exp No
[NB]o (mmol.L-1)
[H2O2]o
(mmol.L-1) [Fe2+]o
(mmol.L-1) T
(K) kobs x103
(s-1) RD x 106
(L.mol-1s-1) eq.3.4 eq.3.12
∆∆∆∆a
(%)
FN4 0.82 1.74 0.26 298 0.55 0.45 0.47 4.4 FN3 0.82 3.54 0.26 298 0.82 0.67 0.76 13.4 FN1 0.82 6.37 0.26 298 1.44 1.18 1.14 3.4 FN2 0.82 6.99 0.26 298 1.54 1.27 1.21 4.7 FN5 0.82 13.24 0.26 298 2.02 1.66 1.88 13.3 FN7 0.82 26.45 0.26 298 1.96 1.61 - - FN6 0.82 6.69 0.13 298 0.38 0.31 0.38 22.6 FN5 0.82 6.69 0.26 298 1.54 1.27 1.21 4.7 FN8 0.82 6.69 0.52 298 4.74 3.90 3.91 0.3 FN9 0.82 6.69 1.04 298 12.4 10.2 12.5 22.5 FN14 0.43 6.69 0.26 298 3.24 1.39 1.50 7.9 FN2 0.82 6.69 0.26 298 1.54 1.27 1.21 4.7 FN15 1.63 6.69 0.26 298 0.62 1.01 0.97 4.0 FN16 2.46 6.69 0.26 298 0.32 0.78 0.85 9.0 FN15b 0.82 6.69 0.26 298 1.72 1.41 1.21 14.2 FN1c 0.82 6.69 0.26 298 1.54 1.27 1.21 4.7 FN14d 0.82 6.69 0.26 298 1.51 1.51 1.21 2.4 FN12 0.82 6.69 0.26 278 0.20 0.16 0.21 31.3 FN10 0.82 6.69 0.26 288 0.66 0.54 0.53 1.9 FN2 0.82 6.69 0.26 298 1.54 1.27 1.21 4.7 FN11 0.82 6.69 0.26 308 3.18 2.61 2.65 1.5 FN13 0.82 6.69 0.26 318 5.03 4.13 5.52 33.7
[ ]D Da
D
R (eq 11) - R (eq 18) = x100
R (eq 11). ∆ .
bunder nitrogen-saturated conditions ([O2]o ≅ 0). cunder air-saturated conditions ([O2]o ≅ 0.27 mmol.L-1). dunder oxygen-saturated conditions ([O2]o ≅ 1.4 mmol.L-1).

3. Fenton process
58
Table 3.3. Experimental conditions of the runs, the pseudo-first-order rate constants and initial oxidation rate of phenol
Exp No
[Phenol]o (mmol.L-1)
[H2O2]o (mmol.L-1)
[Fe2+]o (mmol.L-1)
T (K)
kobs x103
(s-1)
RD x 106
(L.mol-1.s-1) eq.3.14 eq.3.13
∆∆∆∆a
(%)
FP1 1.06 2.45 0.054 298 1.40 1.41 1.69 19.9
FP4 1.06 1.07 0.054 298 0.71 0.75 0.71 5.3
FP5 1.06 5.34 0.054 298 4.53 4.82 3.68 23.7
FP6 1.06 10.67 0.054 298 6.17 6.56 7.46 13.7
FP1 1.06 2.45 0.054 298 1.40 1.41 1.69 19.9
FP2 1.06 2.45 0.132 298 3.96 4.12 4.00 2.9
FP3 1.06 2.45 0.261 298 6.52 6.68 7.73 15.7
FP5 1.06 2.45 0.054 298 1.53 1.63 1.67 1.8
FP10 2.10 2.45 0.054 298 1.35 2.84 3.19 12.3
FP11 0.53 2.45 0.054 298 7.33 3.89 4.27 9.8
FP12 FP13
3.37 1.13
2.45 2.45
0.054 0.054
298 298
0.79 2.98
2.67 2.88 3.39 3.63
7.9 7.1
FP7 1.06 2.45 0.054 298 1.53 1.54 1.69 9.7
FP8 1.06 2.45 0.054 303 2.75 2.76 2.11 26.3
FP9 1.06 2.45 0.054 318 6.68 6.93 5.88 15.2
FP14 1.06 2.45 0.054 288 1.38 1.40 1.65 19.0
[ ]D Da
D
R (eq 21) - R (eq 20) = x100
R (eq 11) ∆

3.3. Results and discussion for NB
59
In the same way that in the case of the experiments with NB, H2O2 and Fe2+
concentration ranges were chosen addressing to reach the highest phenol degradation
percentage in the range from 5 to 60 min. The [H2O2]o/[phenol]o, [H2O2]o/[Fe2+]o and
[phenol]o/[Fe2+]o, ratios varied from 1.0 to 10.1, 19.8 to 40.9 and 2.1 to 12.9, respectively.
The time of degradation for the phenol is sensibly smaller than the degradation time for
NB. This fact could be explained taking into account that the effectiveness of a given
treatment process depends strongly on the nature of the substrate, at least for organic
compounds. In the case of phenol, the OH is electro-donating substituent and therefore, the
electrophilic substitution by HO• radical is favored. By the contrary, in the case of NB, the
NO2 electron accepting substituents the electrophilic substitution by HO• radical is
unfavorable.
3.3. Results and discussion for NB degradation
3.3.1. Intermediates in the degradation of NB
To clarify the reaction pathways for NB after the dark Fenton reaction, the
identification of reaction products by HPLC was carried out (see Fig. 3.5). Identification
and quantification of nitrophenols as reaction intermediates suggests that the degradation
of NB by the Fenton process takes place by reaction with HO• radical, which is assumed
to be the main oxidant. Reaction of NB with HO· radicals to form HO• -NB adducts
(nitrohydroxy-cyclohexadienyl radicals) has a significantly high rate constant (eq.3.1).
HO + NB -, -, - HO -NB o m and p isomeric adducts• •→ (3.1)
k8= 3x10⁹ L.mol-1s-1 (Adams, 1965)
It is worth mentioning, that hydroxy-cyclohexadienyl radicals have been observed by UV
and EPR methods in the reaction of benzene with HO• radicals (Walling, 1975). When
the reaction is run in presence of oxygen, the HO• -NB adducts formed react preferably
with dissolved oxygen (Kunai et al., 1986; Bohn and Zetzsch, 1999), rather than
HO• / HOO• radicals or 2+ 3+Fe / Fe ions due to their very low steady-state concentration,
thus producing nitrophenols and HOO• radicals (reaction 3.2).

3. Fenton process
60
2-, -, - HO -NB + O -, -, -nitrophenols + HOOo m and p isomeric adducts o m and p• •→ (3.2)
In absence of oxygen, the HO.-NB adducts formed react preferably with 2+Fe or Fe3+
(Koltoff and Medalia, 1949) leading eventually to the formation of isomeric nitrophenols
as reaction intermediates. Fig. 3.6 shows an example to visualize the conversion of NB in
isomers of nitrophenols. In this figure is observed that a maximum of nitrophenol isomers
was reached during the first 10 minutes of reaction. Afterwards, these concentrations were
decreasing until total disappearance of these isomers. Something that is worthwhile to
highlight, is that in all the carried out experiments where these isomers were quantified,
their total elimination took place at the same time that the NB.
0123456789
0 5 10 15 20 25 30Time (min)
[NB
] x10
4 (mol
.L-1
)
0
0.5
1
1.52
2.5
3
3.5
4
[o-m
-p-n
itrop
heno
ls]x
105
(mol
.L-1
)
Figure 3.6. Formation and elimination of nitrophenol isomers in the degradation of NB by Fenton process. [NB]o = 0.82 mmol.L-1, [H2O2]o = 26.45 mmol.L-1, [ 2+Fe ]o = 0.26 mmol.L-1. (!) NB, (•) o-nitophenol, (♦ ) p-nitrophenol, (∆) m-nitrophenol.
When conversion of NB was 15-25% ratios of the o-, m-, and p-isomers were
1 : 1.2 - 3.8 : 1.4 - 2.7. At high conversion of NB (80-90%) ratios of the o-, m-, and p-
isomers were found to be 1 : 0.6 – 1.0 : 0.8 – 1.2. As it can be seen, formation of o-isomer
is increased at higher conversion of NB, which can be expected if the o-nitrophenol
degradation rate is lower than m- and p-isomers. In fact, it has been shown by Lipczynska-

3.3. Results and discussion for NB
61
Kochany (1991) that o-nitrophenol degradation rate is lower than that of p-nitrophenol.
Besides, it has been found that o-nitrophenol degradation rate is lower than that of m-
nitrophenol under the same experimental conditions.
Comparison of isomeric ratios can be used to verify if the HO• radical is the
attacking species in different chemical systems. The isomeric distribution of nitrophenols
formed during the degradation of NB by Fenton reagent, photolysis and radiolysis are
presented in Table 3.4. These ratios reflect the extent of the attack by the HO• radical at
different positions of the aromatic ring and go in agreement with the expected for a very
reactive homolytic reagent with some electrophilic character. As it can be seen in Table
3.4, the ratio of the o-, m-, and p-isomers is practically the same under the different
degradating methods. This fact supports the hypothesis of generation of HO• radicals in
the Fenton reaction. A mass balance within the NB converted and nitrophenols isomers
formed was also made in order to reinforce the idea about the generation of HO• radical
in the Fenton reaction. From this mass balance is proven that 30% of NB is converted in
nitrophenols isomers after 1 min of Fenton reaction (see Fig. 3.6). This can also be
corroborated in each one of the experiments presented in Table 3.2.
Table 3.4. The isomeric distribution of nitrophenols formed during the action of Fenton reagent, photolysis, and radiolysis on the aqueous solutions of nitrobenzene
Source of attacking species
Ratio of o-,m-, and p-isomers Reference
Fenton reagent a 1 : 1.3 – 2.8 : 1.4 – 2.7 This work Fenton reagent b 1 : 0.6 – 1.0 : 0.8 – 1.2 This work Fenton reagent 1 : 1.3 : 1.9 Norman and Radda, 1962 Fenton reagent 1 : 0.8 : 1.8 Loebl et al., 1949 Photolysis c 1 : 0.6 : 0.7 Lipczynska-Kochany and Bolton, 1992 Radiolysis pH= 2 1 : 0.9 : 1.0 Loebl et al., 1949 pH= 6 1 : 1.0 : 1.0 Loebl et al., 1949 Radiolysis (pH= 5.5) Air 1 : 0.6 : 0.7 Matthews and Sangster, 1967 Nitrogen 1 : 0.7 : 1.8 Matthews and Sangster, 1967
aconversion of NB (15-25%). bconversion of NB (80-90%). cin presence of H2O2.

3. Fenton process
62
3.3.2. Estimation of initial operating ratios in Fenton process
As it has been demonstrated in the previous section, HO! radical can be considered
as the main oxidant species in this process. In this sense, taking into account the
mechanisms proposed by Haber and Weiss described in section 3.1, initial operating
[compound]o/[H2O2]o, [compound]o/[Fe2+]o and [H2O2]o/[Fe2+] ratios were determined.
Hydroxyl radicals react with organic compounds according to eq. 3.1. However, it could
also participate in the competition reaction described by eqs.1.12, 1.13 and 1.6. Therefore,
it is very important to choose the adequate operating conditions in order to favor the
reaction between HO! with the organic compounds (eq. 3.1), avoiding those secondary
reactions, which would consume hydroxyl radicals. In the case of NB, under these
conditions and being eq. 3.1 the main way for the decay of HO! radicals in comparison
with eq. 1.13, i.e. (k8/k4)>10, the following molar ratio was obtained:
[NB]o/[H2O2]o>10 k4/k8 ⇒ [NB]o/[H2O2]o>0.016
In a same way it was obtained that,
[NB]o/[Fe2+]o>10 k3/k8 ⇒ [NB]o/[Fe2+]o>0.17
From these ratios, the values for [H2O2]/[Fe2+] > 11 were obtained. This means that
H2O2 will be in excess.
These ratios were considered to select the range of H2O2 and Fe2+ concentration
used in the experimental part (see section 3.2.4).
3.3.3. Degradation of NB by Fenton reagent. Kinetic study
The linear regression analysis of the data representing NB concentration versus
reaction time indicates that in a first approach, the oxidation reaction (3.1) can be described
by a pseudo-first-order kinetics with respect to NB concentration (eq. 3.3).
obso
[NB]Ln = -k t
[NB]
(3.3)
where kobs represents the pseudo-first-order rate constant. In this case, a plot of
Ln ([NB]/[NB]o) versus time in every experiment must lead to a straight line whose slope
is kobs. For example, Fig. 3.7 shows this plot for some experiments where the temperature
and initial concentration of H2O2, NB, and dissolved oxygen were fixed and

3.3. Results and discussion for NB
63
Fe2+concentration was varied. As it can be seen, points lie satisfactory in straight lines with
correlation coefficients greater than 0.92.
00.5
11.5
22.5
33.5
44.5
5
0 20 40 60
Time (min)
-Ln(
[NB]
/[NB]
o )
Figure 3.7. Effect of initial concentration of 2+Fe on the degradation of NB. First-order plots for NB degradation at pH ≅ 3.0 by Fenton reagent: [NB]o = 0.82 mmol.L-1, [H2O2]o = 6.99 mmol.L-1, [ 2+Fe ]o = (♦ ) 0.13 mmol.L-1, (!) 0.26 mmol.L-1, (!) 0.52 mmol.L-1, (!) 1.04 mmol.L-1, 298 K.
It is worth noting that the kobs values (Table 3.2) were calculated from experimental
data covering 76-99% removal of NB. In experiments carried out in duplicate, kobs varied
less than 10%. All these results support the pseudo-first-order kinetics.
Nitrobenzene degradation rates (RD) were calculated by eq. 3.4 (Table 3.2)
D obs o[ ]R =- =k [NB]d NBdt
(3.4)
Careful analysis of our reaction conditions for NB degradation taking into account
the reaction mechanism proposed by Walling (1975) for Fe2+ with H2O2 (eqs. 1.6, 1.10-
1.14 and 1.16), shows why it is a “Fenton-like” process. The rate constant for the reaction
of ferrous ions with H2O2 is high (k1 = 63 L.mol-1s-1 at 298 K) (De Laat and Gallard, 1999)
and therefore Fe2+ oxidizes to Fe3+ in a few seconds in excess of H2O2 (Table 3.2, 6.8 ≤

3. Fenton process
64
[H2O2]o/[Fe2+]o ≤ 102.8). If Fe2+ oxidation is a pseudo-first-order process, the time required
for the conversion of 99% of Fe2+ to Fe3+ can be calculated by eq. 3.5
991 2 2 o
100t = Ln k [H O ]
(3.5)
and was found to be 2.6 – 46 s. Therefore, the NB degradation by Fenton’s reagent
performed in this study (at 2 2 o[H O ] >> 2+o [Fe ] ) is simply a 3+Fe / 2 2H O catalyzed process.
The Fenton’s reagent with excess of H2O2 with respect to Fe2+ is known as a “Fenton-like”
reagent (Pignatello, 1992). It is worth noting that some publications describe the
degradation of NB by Fenton’s reagent (Lipczynska-Kochany, 1991, 1992) although they
were actually proceeding by a “Fenton-like” process.
3.3.4. Steady-state radical concentration
If a steady-state HO• radical concentration ([HO.]ss) is assumed, [HO.]ss value in
such system can be estimated by eq. 3.6
obsss
7
k[HO ] =
k• (3.6)
The steady-state HO• radical concentration occurs only when 2 2H O concentration is
relatively constant during the experiment. Furthermore, the [HO.]ss concentration is
governed by both its formation rate, dependent on 2 2H O and 2+o [Fe ] , and scavenging rate.
In this study, 2 2H O complete decomposition time (td) in the Fenton reaction could be
estimated by eq. 3.7 (assuming that [ 3+Fe ] ≅ 2+o [Fe ] and the limiting step for this process
is reaction 1.11.
d 2+d o
1t = (k [Fe ] )
(3.7)
where kd is the second-order rate constant for the overall rate of decomposition of
2 2 o[H O ] by 3+Fe , kd which was found to be equal to 0.47 L.mol-1s-1 at 298 K and pH 3.0
(De Laat and Gallard, 1999). Calculations by eq. 3.7 showed that the 2 2H O concentration
did not significantly change even up to complete degradation of NB, which can be

3.3. Results and discussion for NB
65
expected for a Fenton process. For example, for run FN5 2 2H O complete decomposition
time was found to be 136 min with the rate constant (kobs) determined within a 60 min
interval. In this case, the 2 2H O was decomposed less than 45%, i. e., more than 55% of
2 2H O is present in the solution after complete degradation of NB. It can be concluded that
the decrease in the 2 2H O initial concentration did not have a significant effect on the HO•
radical steady-state concentration. Furthermore, the linearity of the ( )oLn [NB]/[NB]
against time plot for all runs (e.g., Fig. 3.7), give evidence of a HO• radical steady-state
concentration. [HO.]ss values were calculated by eq. 3.13 and found to be very low (10-14
– 10-12 mol.L-1) which is in agreement to the data reported for the oxidation of antrazine
(~10-13 mol.L-1) by Fenton’s reagent Fe3+/H2O2 (Gallard and De Laat, 2000). [HO.]ss
values were calculated assuming that the rate production of HO• radicals in the Fenton
process (limiting step, reaction 1.11) is equal to the decay rate of the radicals by reaction
with NB (reaction 3.1).
The iron dynamics can be extremely complex in the Fenton reaction because of a
shift from 2+Fe to 3+Fe along with precipitation of the iron ions as amorphnous
oxyhydroxides. This iron speciation changes can affect the HO• radical generation
stoichiometry. As a result, these systems cannot be considered as being in steady-state.
Given that all the experiments were carried out at pH ≅ 3.0 and with [H2O2]o >> 2+o [Fe ] ,
no iron precipitates were observed.
Several references are available concerning 2 2H O loss and HO• production in the
reaction of 2 2H O with iron salts and oxides (Lin and Gurol, 1998; Lindsey and Tarr, 2000).
The formation of HO. radicals in pure water was studied using chemical probes (benzoic
acid and 1-propanol), finding linear increase with 2 2H O concentration (Lindsey and Tarr,
2000). In this study, the steady-state HO• radical concentration also showed a linear
dependence on the 2 2H O initial concentration (eq. 3.8),
-11 -13 ss 2 2 o[HO ] = 4.30x10 [H O ] + 1.48x10• (3.8)
with 2+Fe and NB constant concentrations at 298 K.

3. Fenton process
66
3.3.5. Effect of H2O2 initial concentration
Hydrogen peroxide is considered the limiting reagent in the Fenton process.
Therefore, its effect on the RD has been studied and can be observed in runs FN1-FN5 and
FN7, with Fe2+ and NB constant concentrations (Table 3.2, Fig. 3.8 and Fig.3.9). Initially,
it can be expected that as the molar ratio of H2O2 to pollutant is increased, more HO•
radicals are available to attack the aromatic structure and therefore the degradation reaction
rate should increase.
0123456789
0 20 40 60 80
Time (min)
[NB
]x10
4 (mol
.L-1
)
Figure 3.8. Effect of initial concentration of H2O2 on the degradation of NB by Fenton reagent: [NB]o= 0.82 mmol.L-1, [ 2+Fe ]o = 0.26 mmol.L-1, [H2O2] = (♦ ) 1.74 mmol.L-1, (!) 3.54 mmol.L-1, (∆) 6.37 mmol.L-1, (!) 6.99 mmol.L-1, (") 13.24 mmol.L-1, (•) 26.45, 298 K.
In the present case, this rate increment is obtained for H2O2 initial concentration in
the range 1.74 - 13.24 mmol.L-1 (the continuous line does not mean any fitting but only a
way of showing the tendency). However, higher H2O2 concentrations (H2O2 >
13.24 mmol.L-1, run FN7) lead to the saturation in the NB removal rate. It suggests that NB
degradation rate becomes insensitive to H2O2 concentration when H2O2 to NB molar ratio
is higher than 16 (Fig. 3.9).

3.3. Results and discussion for NB
67
0.0
0.4
0.8
1.2
1.6
2.0
0 5 10 15 20 25 30
[H2O2]o (mmol.L-1)
RD (x
106
mol
.L-1
s-1)
Figure 3.9. Effect of [H2O2]o on the degradation rate of NB. [NB]o = 0.82 mmol.L-1, 2+
o[Fe ] = 0.26 mmol.L-1, pH ≅ 3.0, 298 K.
At high H2O2 concentration it becomes the main way for HO• radical decay
according to reaction 3.4. Therefore, the effect of a high H2O2 concentration can be
attributed to the fact that it is competing with NB (eq.3.1) for HO• radicals (eq.1.13), thus
decreasing their steady-state concentration and NB oxidation rate.
Rate order for H2O2 ([H2O2]o < 13.24 mmol.L-1) was determined to be 0.68, from a
( )DLog R against Log [H2O2]o plot.
3.3.6. Effect of Fe2+ initial concentration
The Fe2+ effect is illustrated in Fig. 3.10, where the variation of NB concentration (in
mol.L-1) versus time is represented. As it can be seen in this figure, the initial concentration
of 2+Fe (runs FN2, FN6, FN8, and FN9 in Table 3.2) shows a significant influence on NB
degradation rate.
At constant H2O2 and NB concentrations, RD increases as does Fe2+ concentration
(see Fig. 3.10 and 3.11). Given that [H2O2] >> [Fe2+], the metallic ion is consumed during
the first seconds (2.6 - 46 s, see above) and leads to a fast production of HO• radicals and
consequently to a rapid NB degradation. After a few seconds, reaction 2 becomes the

3. Fenton process
68
limiting step, which regenerates Fe2+ ions. Hydroxyl radical formation from this reaction
becomes very slow and NB degradation is proceeding by “Fenton-like” reagent.
0
2
4
6
8
10
0 10 20 30 40 50 60Time (min)
[NB
]x10
4 (mol
.L-1
)
Figure 3.10. Effect of initial concentration of 2+Fe on the degradation of NB by Fenton reagent: [NB]o = 0.82 mmol.L-1, [H2O2]o = 6.99 mmol.L-1, [ 2+Fe ]o = (!) 0.13 mmol.L-1, (!) 0.26 mmol.L-1, (!) 0.52 mmol.L-1, (") 1.04 mmol.L-1, 298 K.
0
2
4
6
8
10
12
0 0.2 0.4 0.6 0.8 1 1.2
[Fe2+]o (mol.L-1)
RD (x
106 m
ol.L
-1 s
-1)
Figure 3.11. Effect of [ 2+Fe ]o on the degradation rate of NB. [NB]o = 0.82 mmol.L-1, 2 2 o[H O ] = 6.69 mmol.L-1, pH ≅ 3.0, 298 K.

3.3. Results and discussion for NB
69
The rate of 2 2H O decomposition by Fe3+ has been extensively studied. Many
kinetic models derived from hypothetical mechanisms have been tested (Barb et al., 1951;
Walling et al., 1974; Kremer and Stein, 1977; De Laat and Gallard, 1999; Gallard et al.,
1999; Gallard and De Laat, 2000).
Recently, De Laat et al. (1999) demonstrated that the rate of H2O2 decomposition
by 3+Fe could be very accurately predicted by a kinetic model which takes into account the
rapid formation and slower decomposition of 3+Fe -hydroperoxy
complexes 3+ +2( Fe (HO ) and 3+ +
2Fe (OH)(HO ) ) . For 5 < [H2O2]o/[Fe3+]o < 500, a
second-order kinetic law describes the H2O2decomposition initial rate (eq. 3.9)
3+2 2 od 2 2 o o
[H O ]- = k [H O ] [Fe ]
ddt
(3.9)
where kd is the second-order rate constant for the overall rate. The kd value was found to be
0.47 L.mol-1s-1 at 298 K and pH = 3.0 (De Laat and Gallard, 1999). Hydroxyl radicals
generation rate constant (eq. 1.10) is more than two orders of magnitude higher than the
rate constant of H2O2 decomposition by Fe3+. Therefore, after a few seconds the latter
reaction becomes the limiting step.
Rate order for Fe2+ ([Fe2+]o < 1.04 mmol.L-1) was determined to be 1.67, from a
Log (RD) against Log[Fe2+]o plot.
3.3.7. Effect of NB initial concentration
Nitrobenzene initial concentration effect can be observed in runs FN2 and
FN14-FN16, at H2O2 and Fe2+ constant concentrations (Table 3.2, Fig.3.12 and 3.13).
Degradation rate values showed non-linear dependence on NB initial concentration
(Fig. 3.13) and is somewhat decreased when its concentration is increased.
If it is assumed, that HO• radicals production rate is equal to their decay rate by
reaction with NB (eq.3.1), i.e., 3+d 2 2 o obs ok [Fe ][H O ] = k [NB] there must be a linear
dependence of kobs vs 1/[NB]o (eq. 3.10). In other words, kobs value will be inversely
proportional to the NB initial concentration while all other parameters are kept constant
(eq. 3.10).

3. Fenton process
70
0
5
10
15
20
25
30
0 10 20 30 40 50 60Time (min)
[NB
]x10
4 (mol
.L-1
)
Figure 3.12. Effect of NB initial concentration on the degradation of NB by Fenton reagent: [H2O2]o= 6.99mmol.L-1, [Fe2+]o = 0.26 mmol.L-1, [NB]o = (!) 2.46 mmol.L-1, (") 1.63 mmol.L-1, (♦ ) 0.82 mmol.L-1, (!) 0.43 mmol.L-1, 298 K.
0
0.2
0.4
0.6
0.8
1
1.2
1.4
1.6
0 0.5 1 1.5 2 2.5
[NB]o (mmol.L-1)
RD (x
106 m
ol.L
-1 s
-1)
Figure 3.13. Effect of [NB]o on the degradation rate of NB.
2+o[Fe ] = 0.26 mmol.L-1, 2 2 o[H O ] = 6.69 mmol.L-1, pH ≅ 3.0, 298 K.

3.3. Results and discussion for NB
71
3+
d 2 2 oobs
o
k [Fe ][H O ]k =
[NB] (3.10)
Figure 3.13 shows the regression analysis for eq. 17 giving a slope
(kd[Fe(III)][H2O2]o) of 1.5x10⁻⁶ mol.L-1s-1. Taking [Fe3+] ≅ [Fe2+]o = 0.26 mmol.L-1 and
[H2O2]o = 6.99 mmol.L-1 (Table 3.2) it was calculated kd = 0.83 (mol.L-1)-1 s-1 at 298 K. In
the previous work performed by De Laat and Gallard (1999) the second-order overall rate
constant for H2O2 decomposition was found to be 0.47 L.mol-1s-1 at 298 K and pH = 3.0
Rate order for NB was determined to be -0.32, from a Log (RD) against Log[NB]o
plot. Since kobs is inversely proportional to NB initial concentration (Fig. 3.14), this species
degradation rate should be concentration independent (eq. 3.10), i.e. NB degradation rate
order should be zero. The deviation from zero with such unusual order (-0.32) can arise as
a result of several successive steps of different stoichiometries interacting in the reaction of
H2O2 with Fe2+ in presence of NB.
0
0.5
1
1.5
2
2.5
3
3.5
0 0.5 1 1.5 2 2.51/[NB]o (mmol.L-1)-1
k obs
(x10
3 s-1
)
Figure 3.14. Plots kobs vs 1/[NB]o.[Fe+2]o = 0.26 mmol.L-1, [H2O2]o = 6.69 mmol.L-1, pH ≅ 3.0, 298 K.

3. Fenton process
72
3.3.8. Effect of O2 initial concentration
It has been observed that dissolved oxygen (0 < [O2]o < 1.4 mmol.L-1) has a very
weak effect on NB degradation rate (Table 3.2 and Fig. 3.15).
0
2
4
6
8
10
0 10 20 30 40 50 60Time (min)
[NB
]x10
4 (m
ol.L
-1)
Figure 3.15. Effect of [O2]o on the degradation of NB by Fenton reagent: [NB]o = 0.82 mmol.L-1, [H2O2]o = 6.99 mmol.L-1, [ 2+Fe ]o = 0.26 mmol.L-1, pH ≅ 3.0, 298K , (•) without bubling O2 , (!) bubling O2, (!) bubling N2
When oxygen is replaced by nitrogen, NB degradation rate suffers a decrease of
about 12%, which is close to the precision in the determination of kobs. With this slight
influence, the rate order for molecular oxygen will be zero. These data may indicate that
organic radicals R· and ROO· do not affect HO• radical steady-state concentration and
oxygen is probably not involved in the first step of NB oxidation mediated by hydroxyl
radical. Thus, the oxygen effect may not be apparent when observing NB loss by Fenton
process. It may be involved in subsequent steps, i.e., further reactions of the intermediate
organic radicals. For example, HO• -NB adducts reacts faster with oxygen than with HO•
or HOO• radicals producing nitrophenols by reaction (3.2) in presence of dissolved
oxygen. In absence of oxygen, the HO• -NB adducts or organic radicals resulting from
secondary reactions may either dimerize or react with Fe2+ or Fe3+ (Walling, 1975;
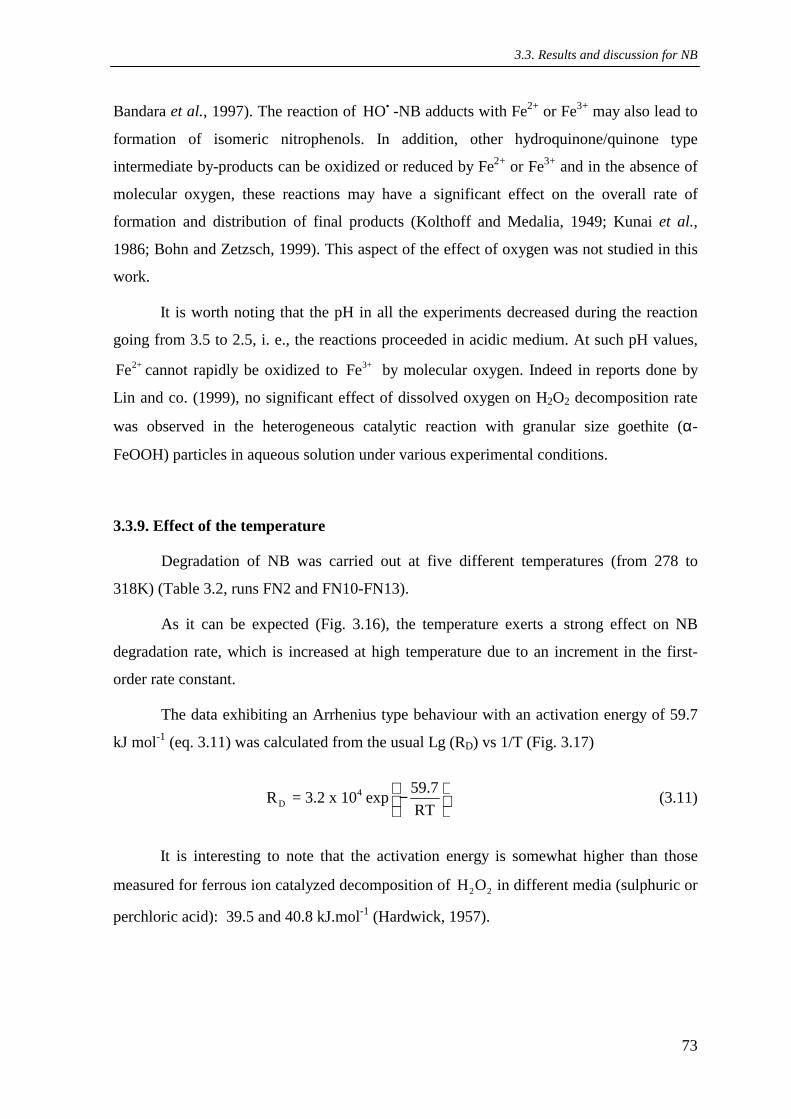
3.3. Results and discussion for NB
73
Bandara et al., 1997). The reaction of HO• -NB adducts with Fe2+ or Fe3+ may also lead to
formation of isomeric nitrophenols. In addition, other hydroquinone/quinone type
intermediate by-products can be oxidized or reduced by Fe2+ or Fe3+ and in the absence of
molecular oxygen, these reactions may have a significant effect on the overall rate of
formation and distribution of final products (Kolthoff and Medalia, 1949; Kunai et al.,
1986; Bohn and Zetzsch, 1999). This aspect of the effect of oxygen was not studied in this
work.
It is worth noting that the pH in all the experiments decreased during the reaction
going from 3.5 to 2.5, i. e., the reactions proceeded in acidic medium. At such pH values, 2+Fe cannot rapidly be oxidized to 3+Fe by molecular oxygen. Indeed in reports done by
Lin and co. (1999), no significant effect of dissolved oxygen on H2O2 decomposition rate
was observed in the heterogeneous catalytic reaction with granular size goethite (α-
FeOOH) particles in aqueous solution under various experimental conditions.
3.3.9. Effect of the temperature
Degradation of NB was carried out at five different temperatures (from 278 to
318K) (Table 3.2, runs FN2 and FN10-FN13).
As it can be expected (Fig. 3.16), the temperature exerts a strong effect on NB
degradation rate, which is increased at high temperature due to an increment in the first-
order rate constant.
The data exhibiting an Arrhenius type behaviour with an activation energy of 59.7
kJ mol-1 (eq. 3.11) was calculated from the usual Lg (RD) vs 1/T (Fig. 3.17)
4D
59.7R = 3.2 x 10 expRT
− (3.11)
It is interesting to note that the activation energy is somewhat higher than those
measured for ferrous ion catalyzed decomposition of 2 2 H O in different media (sulphuric or
perchloric acid): 39.5 and 40.8 kJ.mol-1 (Hardwick, 1957).

3. Fenton process
74
0
2
4
6
8
10
0 20 40 60 80 100 120Time (min)
[NB
]x10
4 (m
ol.L
-1)
Figure 3.16. Effect of the temperature on the degradation rate of NB by Fenton reagent: [H2O2]o = 6.99 mmol.L-1, [Fe2+]o = 0.26 mmol.L-1, (#) T = 278 K, (!) T = 288 K, (#) T = 298 Κ, (!) T= 308 K, (")T= 318 K.
-16
-15
-14
-13
-12
3.1 3.2 3.3 3.4 3.5 3.6
1/T (x103 K-1)
Ln R
D
Figure. 3.17. Plot of Ln RD vs 1/T for the degradation of NB. [NB]o = 0.82 mmol.L-1, 2+
o[Fe ] = 0.26 mmol.L-1, 2 2 o[H O ] = 6.69 mmol.L-1, pH ≅ 3.0.

3.3. Results and discussion for NB
75
3.3.10. Rate equation for the degradation of NB
Rate equation can be expressed in a simple way, as
a 2+ b c d (-Ea/RT)D 2 2 o o 2 oo
R = A [H O ] [Fe ] [NB] [O ] e
where Ea is NB degradation activation energy (59.7 kJmol-1). The exponents a = 0.68,
b = 1.67, c = -0.32, and d = 0 represent H2O2, Fe2+, NB, and molecular oxygen reaction
orders, respectively. The coefficient A can be calculated on the basis of experimental NB
degradation rate (eq 3.4, Table 3.2) at the determined temperature and H2O2, Fe2+ and NB
initial concentrations. This coefficient was determined to be 1.05x10¹¹, as an average value
from 19 experiments (Table 3.2). Giving all these parameters, the rate equation for NB
degradation under Fenton reagent becomes
11 0.68 2+ 1.67 -0.32 (-59.7/RT) D 2 2 o o oR =1.05 x 10 [H O ] [Fe ] [NB] e (3.12)
0
2
4
6
8
10
12
0 2 4 6 8 10 12 14
RDcalx106 (mol.L-1s-1)
RD
exp x1
06 (mol
.L-1
s-1)
Figure 3.18. Plot of the RD values determined by eq. 3.4 (RD
exp) and calculated by eq. 3.12 (RD
cal).
3. Fenton process
76
The degradation rates of NB calculated by eq. 3.12 are presented in Table 3.2
together with the experimental ones calculated by eq. 3.4. As shown in Table 3.2 and
Fig. 3.18 there is a good agreement between experimental and calculated degradation rates.
The plot of the initial rate of NB oxidation calculated by eq. 3.12 vs. the one determined
from experiment by eq. 3.4 gave a slope of 0.8. Thus, empirical eq. 3.12 may be used for
the prediction of NB degradation rate with sufficient precision (ca. 13.4%) under a wide
range of experimental conditions: pH ≅ 3.0; 278-318 K; 1.5 < [H2O2]o< 26.5 mmol.L-1;
0.04 < [Fe2+]o < 1.1 mmol.L-1; 0.3 < [NB]o < 3.5 mmol.L-1; 0 < [O2]o < 1.4 mmol.L-1.
3.4. Results and discussion for phenol degradation
3.4.1. Degradation of phenol by Fenton reagent. Kinetic studies
A kinetic study was also performed for phenol aqueous solution. However, in this
study some parameters that were considered in the case of NB were not studied. This is the
case of the effect of oxygen because a little influence in the case of NB was observed.
Besides this, some parameters were not studied as carefully as in the case of the
nitrobenzene, because the idea was only to compare the obtained results. It is important to
point out that in this section the details of the calculations are not presented because the
same procedure described in the previous section has been used.
The initial degradation rate for phenol can be described by a first-order kinetics
with respect to phenol concentration according to eq. 3.3, where obsk represents again the
pseudo-first-order rate constant. A plot of Ln ([Phenol]/[Phenol]o) versus time in every
experiment must lead to a straight line whose slope is kobs.
For example, Fig. 3.19 shows this plot for experiments where the temperature and
initial concentration of 2 2H O , +2Fe and dissolved oxygen were constants and phenol
concentration was varied. As it can be seen, points lie satisfactory in straight lines with
correlation coefficients greater than 0.95.
It is worth noting that the kobs values (Table 3.3) were calculated from experimental
data covering 50-99% removal of phenol.

3.4. Results and discussion for phenol
77
Figure 3.19. First-order plots for the oxidation of phenol: [Fe2+]o = 0.054 mmol.L-1, [H2O2]o = 5.33 mmol.L-1, [Phenol]o = (!) 0.53 mmol.L 1, (!) 1.14 mmol.L-1, ($) 2.10 mmol.L-1 , (#) 3.38 mmol.L-1, 298 K.
3.4.2. Effect of H2O2 initial concentration
A significant enhancement of degradation efficiency was verified when the H2O2
concentration was increased from 0 to 5.34 mmol.L-1 (Table 3.3 and Fig. 3.20). However,
at higher concentration ([H2O2]o > 5.34 mmol.L-1, run FP6 the degradation rate is
negatively affected. Values of phenol degradation rate as function of the initial H2O2
concentration are also show in Table 3.3.
Rate order for H2O2 ([H2O2]o < 5.34 was determined to be 1.02, from a Log (RD)
against [H2O2]o plot.
0.0
0.5
1.0
1.5
2.0
2.5
0 3 6 9 12 15
Time (min)
-Ln(
[phe
nol] t
/ [p
heno
l] o)

3. Fenton process
78
0.0
0.2
0.4
0.6
0.8
1.0
1.2
0 10 20 30 40 50 60Time (min)
[Phe
nol]x
103
(mol
.L-1
)
Figure 3.20. Effect of initial concentration of H2O2 on the degradation of phenol by Fenton reagent: [phenol]o= 1.06 mmol.L-1, [ 2+Fe ]o= 0.054 mmol.L-1, [H2O2]= (•) 1.06 mmol.L-1, (!) 2.45 mmol.L-1, (!) 5.34 mmol.L-1, (#) 10.67 mmol.L-1, 298 K.
3.4.3. Effect of Fe2+ initial concentration
The Fe2+ effect is shown in Fig.3.21, where the variation of phenol versus time is
represented. As it can be seen in this figure, the initial Fe2+ concentration (runs FP1-FP3 in
Table 3.3) showed a significant influence on the phenol degradation rate. Once again, after
a few seconds, reaction 1.11 becomes the limiting step, which generate Fe2+ions. Hydroxyl
radical formation from this reaction, becomes very slow and phenol degradation proceeded
by “Fenton-like” reagent.
Similar procedure was used to determine the rate order with respect to Fe2+ ([Fe2+]o
< 0.26 mmol.L-1) being its value equal to 0.96.

3.4. Results and discussion for phenol
79
0.0
0.2
0.4
0.6
0.8
1.0
1.2
0 10 20 30 40 50 60Time (min)
[Phe
nol]x
103
(mol
.L-1
)
Figure 3.21. Effect of initial concentration of 2+Fe on the degradation of phenol by Fenton reagent: [phenol]o = 1.06 mmol.L-1, [H2O2]o = 2.45 mmol.L-1, [ 2+Fe ]o = ($) 0.054 mmol.L-1, (!) 0.13 mmol.L-1, (!) 0.26 mmol.L-1, 298 K.
3.4.4. Effect of phenol initial concentration
Phenol concentration effect can be observed in runs (FP10-FP13) at 2 2H O and Fe2+
constant concentrations (Table 3.3 and Fig.3.22). Degradation rate value, showed non-
linear dependence on phenol initial concentration and is somewhat decreased when its
concentration is increased.
Rate order for phenol was determined to be -0.21, from a ( )DLog R against
Log[NB]o plot.

3. Fenton process
80
0.0
0.5
1.0
1.5
2.0
2.5
3.0
3.5
4.0
0 10 20 30 40 50 60Time (min)
[Phe
nol]x
103 (m
ol.L
-1)
Figure 3.22. Effect of initial concentration of phenol on the degradation of phenol by Fenton reagent: [H2O2]o = 2.45 mmol.L-1, [ 2+Fe ]o = 0.054 mmol.L-1, [phenol]o = (!) 3.38 mmol.L-1, (!) 2.10 mmol.L-1, (#) 1.14 mmol.L-1, (•) 0.53 mmol.L-1, 298 K.
3.4.5. Effect of the temperature
The degradation of phenol at three different temperatures runs FP7-FP10 and FP14
(288-318 K) was carried out. The temperature showed a strong effect on the degradation
rate of phenol (Table 3.3 and Fig. 3.23) and the data exhibiting an Arrhenius type behavior
with an activation energy of 47.7 kJ.mol-1 (eq. 3.11) was calculated from the usual Log
(RD) vs 1/T (Fig. 3.24).

3.4. Results and discussion for phenol
81
0.0
0.2
0.4
0.6
0.8
1.0
1.2
0 10 20 30 40 50 60Time (min)
[Phe
nol]x
103 (m
ol.L
-1)
Figure 3.23. Effect of the temperature on the degradation rate of phenol by Fenton reagent: [H2O2]o = 2.45 mmol.L-1, [Fe2+]o = 0.054 mmol.L-1, (♦ )[T]=288 K, (!) T= 298 K, (!)T= 303 K, (#)T= 318 K.
5.1
5.2
5.3
5.4
5.5
5.6
5.7
5.8
5.9
3.10 3.15 3.20 3.25 3.30 3.35 3.40
1/T (x103, K -1)
(-Log
RD)
Figure 3.24. Plot of -Log RD vs 1/T for the degradation of phenol. [Phenol]o = 1.02 mmol.L-1, [Fe2+]o = 0.054 mmol.L-1, [H2O2]o = 2.45 mmol.L-1.

3. Fenton process
82
It is interesting to note that the activation energy is comparable with those
measured for the reaction of ferrous ion catalyzed decomposition of H2O2 in different
medium (kJ.mol-1): 39.5 and 40.8 (Hardwick, 1957)
3.4.6. Rate equation for the degradation of phenol
The rate equation for the degradation of phenol has been developed in the same
way that the rate equation for NB. In this sense, the eq.3.12 for the degradation of phenol
is:
8 1.02 2+ 0.96 -0.21 (-47.7/RT) D 2 2 o o oR =5.78 x 10 [H O ] [Fe ] [phenol] e (3.13)
where Ea is phenol degradation activation energy (47.7 kJmol-1). The exponents a = 1.02,
b = 0.26, c = -0.21, represent H2O2, Fe2+, and phenol orders, respectively. The coefficient
A can be calculated on the basis of experimental phenol degradation rate that was
calculated by eq. 3.14 (Table 3.3) at the determined temperature and H2O2, Fe2+ and phenol
initial concentrations.
D obs od[phenol]R - k [phenol]
dt= = (3.14)
This coefficient was determined to be 5.78x10⁸, as an average value from 14 experiments
(Table 3.3).
The degradation rates of phenol calculated by eq. 3.13 are presented in Table 3.3
together with the experimental ones calculated by eq. 3.14. As shown in Table 3.3 and
Fig.3.25 there is a good agreement within a range of 2-24% (average error to be about
12%) experimental and calculated degradation rates. Besides this, the plot of initial rate of
the oxidation of phenol that was calculated by eq. 3.13 vs. the one determined from
experiments by eq.3.14 (Table 3.3 and Fig. 3.25) gave a slope of 1.004. This value
indicates on the possibility to make use of the eq.3.13 for the prediction of the initial
phenol oxidation rate by Fenton reagent under the planned experimental work.

3.4. Results and discussion for phenol
83
0123456789
0 2 4 6 8RD
calx106 (mol.L-1 s-1)
RD
exp x1
06 (m
ol.L
-1 s
-1)
Figure 3.25. Plots of the RD values determined by eq. 3.14 (RDexp) and
calculated by eq. 3.13 (RDcal)

4. UV-based processes for removal of NB and phenol.
Photo-Fenton, UV/H2O2, and Fe3+/UV


4.1. Introduction
87
4.1. Introduction
As commented in the Introduction chapter, the photo-Fenton and UV/H2O2 systems
are widely known AOPs and are in practical use (Stanislav and Sedlak, 1992; Ruppert et
al., 1993; Liao and Gurol, 1995; De Laat et al., 1999; Esplugas et al., 2002). More
recently, the homogeneous Fe3+/UV system has been also presented as an alternative
photochemical method for the treatment of organic pollutants (Mazellier and Bolté, 1997;
Catastini et al., 2002).
UV light-based processes have been successfully utilized for the destruction of
nitroaromatic and phenolic compounds in water (Lipczynska-Kochany, 1992; Lipczynska-
Kochany et al., 1995; Beltran et al., 1998; Benitez et al., 2000; Fernando et al., 2002).
However, a detailed study on the influence of the type of light has not yet been performed.
In this context, three different photochemical treatment processes (photo-Fenton,
H2O2/UV and Fe3+/UV) in homogeneous phase have been selected and a detailed study
was made to test their effectiveness in the treatment of phenol and NB in water solution.
Three sources of artificial UV/visible light in three different devices were tested.
Due to its low costs and keeping in mind its growing use in the photocalytic
processes of waters detoxifications (Malato et al., 2002), solar radiation was also tested
using a parabolic collector (PC) and two compound parabolic collectors (CPC). The major
part of the study using solar radiation has been made in a qualitative way, representing the
first steps in our laboratory in this area. All these reactors are described and shown in the
experimental section.
For the development of effective wastewater treatment methods, complete
mineralization of the pollutant to harmless end products ( 2CO + 2H O ) is important and,
taking into account that the degradation reaction for phenol and NB by photo-Fenton
process is very fast, monitoring of total organic carbon (TOC), one of the most important
parameters in wastewater analysis was made instead of following the concentration of
organic compounds under study.
The results obtained by each treatment method applied in this chapter are presented
in separated sections according to the source of light used. In this sense, the use of artificial
UV-visible light corresponds to the first part and the use of solar light to the second one.

4. UV - based processes
88
Finally, experiments presented in this chapter were carried out in three different
locations. All experiments at laboratory scale (reactors B, C, D and E), both with artificial
light and with solar light, were performed at the University of Barcelona. The experiments
at pilot plant scale were carried out at the Ecole Politechnique Federal de Lausanne
(Lausanne, Switzerland) and the Plataforma Solar de Almería (PSA) (Almería, Spain).
4.2. Fundamental aspects of the processes under study
4.2.1. Photo-Fenton process
The basic chemistry, as well as applications of Fe2+/H2O2 and Fe3+/H2O2 system for
hazardous waste treatment, have been already described in chapter 1 and 3. Briefly, other
details about this process will be described. Ferrous ion combined with hydrogen peroxide
(Fenton’s reagent) reacts stoichiometrically to give HO• according to:
2+ 3+ -2 2Fe H O Fe + OH + HO•+ → (1.10)
In the dark, the reaction is retarded after complete conversion of Fe2+ to Fe3+.
Nowadays, it is known that the oxidizing power of the Fenton system can be greatly
enhanced by irradiation with UV or UV-visible light (Pignatello, 1992; Legrini et al.,
1993; Pignatello and Sun, 1993; Ruppert et al., 1993). This effectiveness has been proven
with the total mineralization of many organic compounds in aqueous solution (Lipczynska-
Kochany, 1991; Pignatello and Sun, 1993). The reason for the positive effect of irradiation
on the degradation rate include the photo-reduction of Fe3+ to Fe2+ ions, which produce
new HO• radicals with H2O2 (eq. 1.11) according to the following mechanism
h3+ 2+ +
2Fe + H O Fe + HO + Hv • → (1.17)
h2 2H O 2HOv • → (λ < 400 nm) (1.8)
There are more equations (as shown in chapter 1 and 3) involved in the mechanism
of hydroxyl radical generation, but the above cited are the most significant. The main
compounds absorbing light in the Fenton system are ferric ion complexes, e.g.

4.2. Fundamental aspects
89
3+ - 2+[Fe (OH) ] and 3+ - 2+2[Fe (RCO ) ] , which produce additional +2Fe by following (eqs. 4.1
and 4.2) photo-induced, ligand-to-metal charge-transfer reactions (Sagawe et al., 2001)
3+ - 2+ 2+[Fe (OH) ] Fe + HO•→ (λ < ca. 450) (4.1) 3+ - 2+ 2+
2 2[Fe (RCO ) ] Fe + CO + R •→ (λ < ca. 500 nm) (4.2)
Additionally, eq.4.1 yields HO· radicals, while eq.4.2 results in a reduction of the
total organic carbon (TOC) content of the system due to the decarboxylation of organic-
acid intermediates. It is very important to note that both reactions form the ferrous ions
required for the Fenton reaction (eq.1.11). The overall degradation rate of organic
compounds is considerably increased in the photo-Fenton process, even at lower
concentration of iron salts present in the system (Chen and Pignatello, 1997). Although in
the photo-Fenton process, the energy requirement is reduced and it is highly effective in
the treatment of phenol and NB solutions, its application would not completely replace a
more economical treatment, such as biological degradation, when possible. Thus, the
photo-Fenton process as well as other oxidation processes could be used for pretreatment
of recalcitrant compounds in order to improve treatment efficiency and assure their
biocompatibility. For this pretreatment, sunlight may be applied, thereby reducing energy
costs and favoring the environment. As already mentioned in the case of dark-Fenton
process, the main disadvantage of the photo-Fenton method is the necessity to work at low
pH (normally below 4), because at higher pH ferric ions would begin to precipitate as
hydroxide. Furthermore, depending on the iron concentration used, it has to be removed
after the treatment in agreement with the regulation established for wastewater discharge.
The possibility to reuse the precipitate formed is still under study, therefore, is not
discarded their reuse in a future.
4.2.2. H2O2/UV process
Other way of generating hydroxyl radicals in the reaction medium and not impaired
by the pH is the photolysis of hydrogen peroxide with ultraviolet radiation. Thus, since the
sixties, numerous researchers have used the H2O2/UV process to oxidize various organic
substances in water. Recently, commercial units employing this process have been
developed for on-site oxidation of organic contaminants in groundwater. The success of

4. UV - based processes
90
this process has been generally attributed to the stoichiometric formation of hydroxyl
radicals (HO•) by photolytic decomposition of H2O2. Early investigations of hydrogen
peroxide photolysis (Hunt and Taube, 1952; Baxendale and Wilson, 1957; Volman and
Chen, 1959; Sehested et al., 1968) as well as a more recent study (Bielsky et al., 1985)
have indicated that the following radical chain reactions occur in hydrogen peroxide
solution in pure water with UV-light irradiation.
Initiation: ( primary photolysis of 2 2H O or -2HO )
h-2 2 2H O / HO 2HOv • → (4.3)
Propagation:
- -2 2 2 2 2 2H O / HO + HO HO /O + H O• •→ (4.4)
2 2 2 2 2HO + H O HO + H O + O• •→ (4.5)
Termination:
2 2HO + HO H O• • → (4.6)
- -2 2 2 2HO + HO / O H O/OH + O • • → (4.7)
- -2 2 2 2 2 2 2HO + HO / O H O / HO + O • • •→ (4.8)
The overall quantum yield ( )Tφ of hydrogen peroxide in this reaction chain is 1 at
the UV-light wavelength of 254 nm, while the primary quantum yield P( )φ of the primary
photolysis reaction of hydrogen peroxide (eq.4.3) at the same wavelength is 0.5.
There are two types of ultraviolet lamps on the market that produce efficiently this
photolytic decomposition. The main characteristic of these lamps is basically their band or
wavelength emission within the ultraviolet range. Fig. 4.1 shows different bands of the
electromagnetic spectra (Froelich, 1992), which indicates the position of ultraviolet
radiation and its types. This figure shows that these ultraviolet lamps emit wavelengths
between 100 and 400nm, and two types are usually used in this kind of systems (Legrini et
al., 1993). The polychromatic lamps emit a wavelength range of between 180 and 400nm,
and the monochromatic lamps emit at 254 nm.
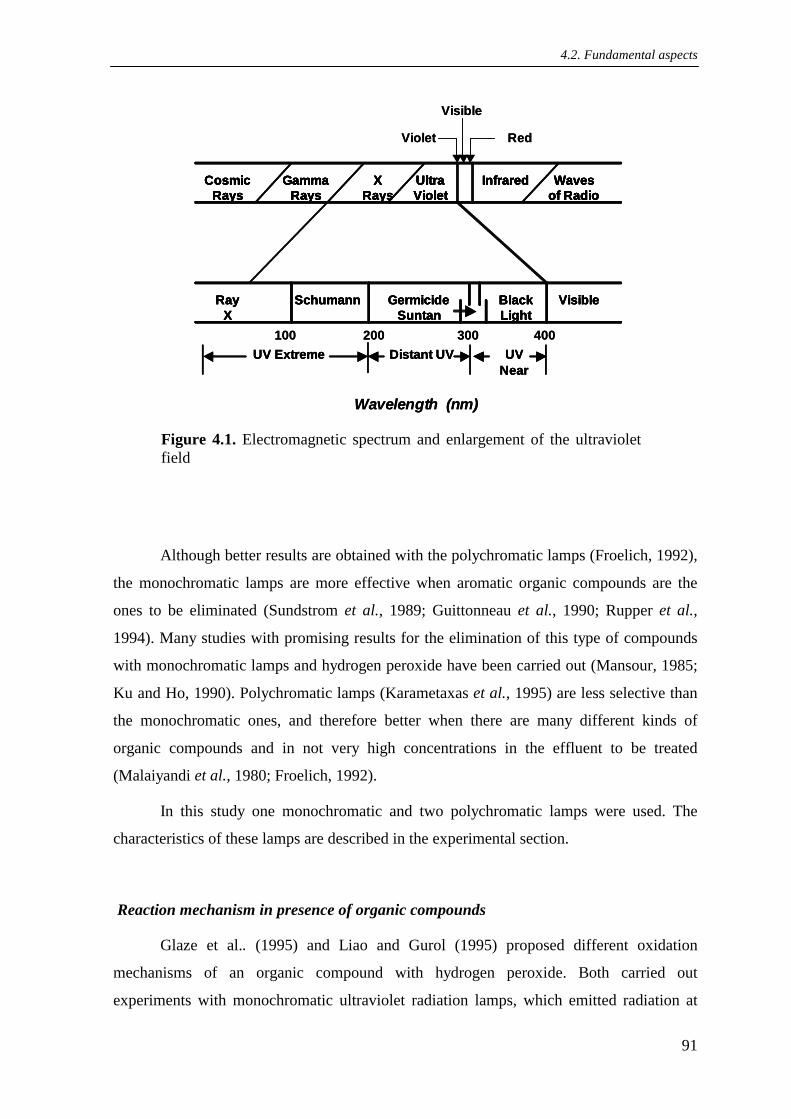
4.2. Fundamental aspects
91
100 200 300 400
CosmicRays
GammaRays
XRays
Ultra Violet
Infrared Wavesof Radio
RayX
Schumann GermicideSuntan
Black Light
Visible
UV Extreme UVNear
Distant UV
Wavelength (nm)
Violet Red
Visible
100 200 300 400
CosmicRays
GammaRays
XRays
Ultra Violet
Infrared Wavesof Radio
RayX
Schumann GermicideSuntan
Black Light
Visible
CosmicRays
GammaRays
XRays
Ultra Violet
Infrared Wavesof Radio
CosmicRays
GammaRays
XRays
Ultra Violet
Infrared Wavesof Radio
CosmicRays
GammaRays
XRays
Ultra Violet
Infrared Wavesof Radio
RayX
Schumann GermicideSuntan
Black Light
VisibleRayX
Schumann GermicideSuntan
Black Light
Visible
UV Extreme UVNear
Distant UV UV Extreme UVNear
Distant UV
Wavelength (nm)
Violet Red
Visible
Figure 4.1. Electromagnetic spectrum and enlargement of the ultraviolet field
Although better results are obtained with the polychromatic lamps (Froelich, 1992),
the monochromatic lamps are more effective when aromatic organic compounds are the
ones to be eliminated (Sundstrom et al., 1989; Guittonneau et al., 1990; Rupper et al.,
1994). Many studies with promising results for the elimination of this type of compounds
with monochromatic lamps and hydrogen peroxide have been carried out (Mansour, 1985;
Ku and Ho, 1990). Polychromatic lamps (Karametaxas et al., 1995) are less selective than
the monochromatic ones, and therefore better when there are many different kinds of
organic compounds and in not very high concentrations in the effluent to be treated
(Malaiyandi et al., 1980; Froelich, 1992).
In this study one monochromatic and two polychromatic lamps were used. The
characteristics of these lamps are described in the experimental section.
Reaction mechanism in presence of organic compounds
Glaze et al.. (1995) and Liao and Gurol (1995) proposed different oxidation
mechanisms of an organic compound with hydrogen peroxide. Both carried out
experiments with monochromatic ultraviolet radiation lamps, which emitted radiation at

4. UV - based processes
92
254 nm. According to Glaze, the photolysis of hydrogen peroxide is expressed in the
following way:
h2 2H O 2 HOv • → (1.8)
The splitting of hydrogen peroxide into hydroxyl radicals due to ultraviolet radiation can
be expressed as:
2 2
2 2H O o
d[H O ]- = I (1 exp( A ))
dt tφ − − (4.9)
where:
2 2H Oφ = the primary quantum yield for the photolysis of H2O2 with a value of 0.5 mol
H2O2. Einstein-1
Io = monochromatic ultraviolet incident radiation (Einteins.L-1.s-1)
At = total absorbance of the effluent
In the case of hydrogen peroxide, the absorbance can be expressed by the following
expression:
2 2t H O 2 2A 2.303 b [H O ]ε= (4.10)
where:
2 2H Oε = the absorbency of hydrogen peroxide at 254 nm, with a value of 19.6 L.mol-1cm-1 according to Liao, (1995)
b = the length of the optic way (cm)
Bearing in mind the aforementioned definitions, eq. 4.9 can be reordered giving
rise to the following (Liao and Gurol, 1995):
2 2
2 2H O o 2 2
d[H O ]- = (2.303 b I ) [H O ]
dtφ η
(4.11)
where,
H O 2 22 2
2 2
b[H O ]
H O 2 2
1-10 = 2.303 b [H O ]
e
ηε
−
(4.12)
For sufficiently low concentrations of hydrogen peroxide, the value η is
approximately 1, and therefore the decomposition of hydrogen peroxide by photolysis is
the following:

4.2. Fundamental aspects
93
2 2
2 2H O o 2 2
d[H O ]- = (2.303 b I ) [H O ]
dtφ ε
(4.13)
The aforementioned expression indicated the formation rate of hydroxyl radicals as
a consequence of the direct action of ultraviolet radiation. However, hydroxyl radicals are
susceptible to react with other species in solution, and of course, with the organic
compounds to be eliminated. Among the most representative reactions, it can be cited the
following (Guittonneau et al., 1990; Froelich, 1992; Liao and Gurol, 1995):
- +2 2 2 2HO + H O O + H O + H• •→ (4.14)
- - - +2 2HO + HO O + HO + H• •→ (4.15)
2 2 2HO + HO H O + O• • → (4.16)
- -2 2HO + O HO + O• → (4.17)
oxi.HO + RH RH• → (4.18)
- -2 2 2 2O + H O HO + HO + O• •→ (4.19)
2 2 2 2 2HO + HO H O + O• • → (4.20)
From these reactions and by means of complex mathematical expressions, Glaze
and co. calculated the concentration of the HO• and -2O • radicals and the species that form
part of the oxidation as reactant. In addition to Glaze et al. (1995), proposed a mechanism
to explain the oxidation of an organic compound in the presence of hydrogen peroxide.
4.2.3. Fe3+/UV process
Iron is one of the most abundant elements on earth. Many classes of iron metal,
compounds, and mixtures are extensively used in industrial production and daily life. It is
therefore important the development of environment-friendly iron catalyst with high
efficiency and less energy, which is one of the essential goals of Green Chemistry. In this
sense, the same as the case of the Fenton process, the iron photo-assisted system Fe3+/light,
without addition of other electron acceptor than O2 from air, has been received special
attention as a potential wastewater treatment process. Hydroxyl radicals formed upon

4. UV - based processes
94
excitation of 3+Fe alone can provide an efficient and less expensive treatment method in
comparison with photo-Fenton and 2 2H O /UV processes (Mazellier et al., 1997). For this
reason, the photo-oxidation of organic compounds in aqueous solutions containing
Fe3+- hydroxy complexes with UV-light radiation has been investigated extensively. At
acidic pH (2.5-5), Fe(OH)2+ is the dominant photoreactive species. The oxidant was
believed to be hydroxyl radical produced from the photolysis of Fe3+- OH complexes
(Faust and Hoigné, 1990), according to eq. (1.7):
h2+ 2+Fe(OH) Fe + HO v • → (1.7)
as the quantum yield of Fe(OH)2+ is much higher than the other species. Besides, there are
other reactions where HO• radicals can also be formed and 2+Fe is involved (Feng and
Nansheng, 2000)
2+ 3+ 2-
2Fe + O Fe + O→ (4.21)
2- +2 2 22O + 2H H O + O→ (4.22)
2+ 3+ -2 2Fe + H O Fe + HO + OH •→ (4.23)
Some interesting quantum yields for eq. 1.7 may be found in the bibliography. In
this context, useful quantum yields for hydroxyl radical production at wavelengths 313 nm
(φ = 0.14) and 365 nm (φ = 0.07) have been reported (Mazellier et al., 1997). According
to the reaction, hydroxyl radicals production will end when all the Fe3+extinguishes, and in
consequence, the simultaneous reoxidation of the Fe2+ formed in the reaction into Fe3+ by
an oxidant (i.e., oxygen better than hydrogen peroxide) confers an interesting catalytic
aspect to the process. A model to describe the reaction involved is shown in Fig. 4.2.
(Catastini et al., 2002).

4.3. Solar radiation
95
O2H
OH
OH
O2
Fe2+
Pollutant oxidation
H+H2O2
Fe(OH)2+
Feaq2+ +
O2hv
Pollutantoxidation
Fe2+
Fenton Reaction
+
hv
Figure 4.2. Model of iron photoassisted system
The case of using H2O2 as oxidant constitutes the typical Fenton process. The
disappearance extension may be enlarged because iron ions may give complexes with the
photodegradation compounds formed, which can be able to be degraded by the UV
radiation. The use of Fe3+ in presence of light represents an economical alternative in
comparison with the photo-Fenton process, which needs the use of H2O2.
4.3. Solar radiation as source of light
Solar radiation and in particular its ultraviolet component, is considered of interest
being the existence of ultraviolet radiation the key of some heterogeneous and
homogeneous photocatalytic processes, such as TiO2/UV and H2O2/Fe2+/UV-vis or
H2O2/Fe3+/UV-vis system (photo-Fenton). The use of solar light as source of radiation in
the photo-Fenton and Fe3+/UV-vis system has been studied, taking as reference the recent
development of solar technology in water detoxification by means of heterogeneous
photocalysis (TiO2/UV) (Bahnemann et al., 1994; Malato, 1999; Blanco and Malato,
2001). In this sense, this section describes the power of sunlight as source of energy, as
well as the basic factors related to the photocatalytic technology and its application. In
addition, it outlines the basic principles related to the solar spectrum and especially to the

4. UV - based processes
96
solar UV radiation since this part of the solar spectrum is the most important one for
driving chemical processes and the main features of the collectors used for wastewater
detoxification.
All the energy coming from that huge reactor, the Sun, from which the earth
receives 1.7x10¹⁴kW, means 1.5x10¹⁸ kWh per year, approximately 28000 times the
consumption of all the world in that period (Malato, 1999).
The radiation in the exterior of the atmosphere has a wavelength between 0.2µm
and 50µm, which is reduced in an interval between 0.3 µm and 3 µm when reaching the
surface, due to the absorption of part of it by different atmospheric components (ozone,
oxygen, carbon dioxide, aerosols, steam, clouds). The solar radiation that reaches the
ground level without being absorbed or scattered, is called direct radiation; the radiation,
which has been dispersed but reaches the ground level is called diffuse radiation and the
addition of both is called global radiation (see Fig.4.3). In general, the direct component of
global radiation in cloudy days is minimum and the diffuse component is maximum,
producing the opposite situation in clear days.
Figure 4.3. Direct and diffuse radiation
Fig. 4.34 shows the standard spectrum (ASTM, 1987a) of the direct solar radiation
on the ground level on a clear day, reflecting the substances, which absorb part of the
radiation and their absorption wavelength (Iqbal, 1983). The dotted line corresponds to the

4.3. Solar radiation
97
extraterrestrial radiation in the same interval of wavelength. It is clearly seen the scarce
part of the solar spectrum that can be used in the photochemical process under study but, as
the energy source is so cheap and abundant, even under these limitations it is interesting to
use it (Wilkins and Blake, 1994).
Extraterrestrial solar irradiance
Dir
ect N
orm
al Ir
radi
ance
, W m
-2µ µµµ m
-1
Wavelength, µµµµm
Extraterrestrial solar irradiance
Dir
ect N
orm
al Ir
radi
ance
, W m
-2µ µµµ m
-1
Wavelength, µµµµm
Figure 4.4. Effect of atmospheric components on solar spectrum
UV radiation is, as explained above, a very small part of the solar spectrum. The
measurements carried out have demonstrated that the UV part of the solar spectrum
represents between 3.5% and 8% of the total (Hulstrom et al., 1985), although this relation
can change for a determined location between cloudy and clear days. The percentage of
global UV radiation (direct + diffuse), with regard to the global, generally increases when
the atmospheric transmitivity decreases, due mainly to clouds, but also to aerosols and dust
(Mehos and Turchi, 1992). In fact, the average percentage of UV with respect to total
radiation on cloudy days is up to two percent points higher than values on clear days.
The two spectra shown in Fig. 4.5 correspond to the standard (ASTM, 1987b) for
the UV range of the solar spectrum. The smallest of them refers to direct UV (radiation
without scattering) and its value reaches 22 W m-2 between 300 and 400 nm, the biggest
corresponds to the global UV (direct + diffuse) and its value is 46 W m-2. These two values
give an idea of the energy coming from the sun that is available for the photochemical

4. UV - based processes
98
reactions that use UV-vis solar radiation just up to 520 nm. In any case, the UV radiation
values vary from one location to another, and obviously, at different hours of the day and
in different seasons, making necessary to know these data for any particular location in real
time.
Wavelength, nm
UVGLOBAL
UVDIRECT
Irra
dian
ce, W
m-2
nm-1
Wavelength, nm
UVGLOBAL
UVDIRECT
Irra
dian
ce, W
m-2
nm-1
Figure 4.5. Ultraviolet spectrum on the earth surface (standard ASTM)
4.3.1. Solar collectors
Traditionally, the different solar collector systems have been classified depending on
the concentration level attained with them (relationship between the collecting surface and
the surface where the final result is produced), which is directly related with the system
working temperature. According to this criteria, there are three type of collectors:
I. No concentration or low temperature, up to 150º C
II. Medium concentration or medium temperature, from 150º C to 400º C
III. High concentration and high temperature, over 400º C.
This classification is performed from a traditional point of view, considering only the
thermal efficiency of the solar collectors. However, what is important in photocatalysis is
not only the amount of radiation collected, but its wavelength.

4.3. Solar radiation
99
Non-concentrating solar collectors (Fig. 4.6) are static, without any solar tracking
device. They are usually a flat plate, in many cases aiming to the sun with a determined tilt,
depending on the geographic situation. Their main advantage is the reduced cost and, for
many applications, the collected radiation is sufficient.
Figure 4.6. Non-concentrating solar collectors for domestic heat water application.
Figure. 4.7. Medium-concentring solar collectors. PTC type (PSA, Spain)

4. UV - based processes
100
Medium concentration solar collectors concentrate the sunlight between 5 and 50
times. Parabolic Trough Collectors (PTC) and collectors with Fresnel lenses are within this
group. The first ones have a parabolic reflecting surface (Fig. 4.7), which concentrates the
radiation on a tubular receiver located in the focus of the parabola. They can be of one axis
tracking, either azimuth (East-West movement around one axis North-South oriented) or
elevation (North-South movement around one axis East-West oriented), or two tracking
axis (azimuth + elevation) as the Helioman collector shown in the next section.
High concentration collectors have a focal point instead of a linear one and are
based on a paraboloid with solar tracking. Parabolic dishes and solar furnaces are among
them (Fig. 4.8). Typical concentration ratios are in the range of 100 to 10000 requiring
optimal precision elements.
The specific hardward needed for solar photocatalitic applications has a lot in
common with those used for thermal applications. As a result, photocatalytic system and
reactors have followed conventional solar thermal collector designs, such as parabolic
troughs and non-concentrating collectors (Turchi and Ollis, 1990; Anderson et al., 1991;
Minero et al., 1993).
Figure 4.8. High concentrating solar collector. Parabolic dish solar collector (PSA, Spain)

4.3. Solar radiation
101
The first engineering-scale outdoor reactor for solar detoxification was developed
by Sandia National Laboratory (USA) at the end of the eighties. A parabolic-trough solar
thermal collector was simply modified by replacing the absorber/glazing-tube combination
with a Pyrex tube through which contaminated water could flow. Since then, many
different concepts with a wide variety of designs have been proposed and develop all over
the world, in a continuous effort to improve performance and to reduce the cost of solar
detoxification system (Malato et al., 2002).
One of the most important reactor-design issues is the decision between
concentrating or non-concentrating collector systems. Concentrating systems present the
advantage of much smaller reactor-tube area, which could mean a shorter circuit in which
to confine, control and handle the contaminate water to be treated. If concentrating
collector system has to be used, an improving alternative, from both economical and
engineering points of view, would be the use of high-quality ultraviolet-light-trasmitting
reactors.
4.3.1.1. Parabolic Trough Collectors
The first engineering-scale solar photochemical facility for water detoxification
was developed in 1989 by Sandia National Laboratories (USA) using one-axis PTC. The
second one was developed by Plataforma Solar de Almería (PSA), Spain in 1992 using
two-axis PTC (see Fig.4.9) Both facilities are considerably large pilot plants (hundreds of
square meters of collecting surface) and can be considered the first step toward the
industrialization of photochemical processes.
One-axis tracking PTC has been demonstrated to be the most economically
advantageous for solar thermal applications. However, two-axis tracking PTC are the
better suited for photocatalysis research purpose, since they allow the exact calculation of
the radiation hitting the photoreactor (Minero et al., 1996; Curco et al., 1996a; Malato,
1999). This feature permits comparison of experiments carried out in such large
photoreactors with those performed at laboratory-scale, where the calculation of incident
radiation is simple (Gimenez et al., 1996; Curco et al., 1996b). Nevertheless, concentrating
reactors have two important disadvantages compared to non-concentrating ones. The first
one is that they cannot concentrate (i.e use) diffuse solar radiation. This fact is irrelevant
for solar thermal applications because diffuse radiation is just a small fraction of the total

4. UV - based processes
102
solar radiation. However, this disadvantage becomes important in solar
TiO2-photocatalytic and photo-Fenton detoxification as it uses only the UV fraction of the
solar spectrum from which as much as 50 percent can be diffuse, since it is not absorbed by
water vapor (Romero et al., 1999). This percentage can be even higher in very humid
location or during cloudy or partly cloudy periods. In this sense, efficiency of non-
concentrating solar collectors can be noticeably higher, as they can take advantage of both
direct and diffuse UV radiation. The second disadvantage of concentrating collectors is
their complexity, cost and maintenance requirements. As a consequence of these
disadvantage, the present state-of-the art favors the use of non-concentrating reactors for
solar photocatalytic applications.
Figure 4.9. Two-axis tracking Parabolic Trough Collector (PTC)
4.3.1.2. Compound Parabolic Collectors (CPCs)
Compound parabolic collectors are a very interesting cross between through
concentrators and one-sun system and are one of the best options for solar phototocatalytic
applications. These collectors have been found to provide the best optics for low-
concentrating system. CPCs are static collectors with a reflective surface describing an

4.3. Solar radiation
103
involute around a cylindrical reactor tube; it can be designed with a CR=1 (or near one),
thus having the advantages of both PTCs and one-sun collectors (Curco et al., 1996a;
Gimenez et al., 1999).
Thanks to the reflector design, almost all the UV radiation arriving at the CPC
aperture area (not only direct, but also diffuse) can be collected being available for the
process in the reactor. The UV light reflected by the CPC is distributed around the back of
the tubular photreactor and as a result most of the reactor tube circumference is
illuminated. However, due to the ratio of CPC aperture to tube diameter, no single point on
the tube receives more than one sun of UV light. The incident light is then very similar to
that of a one-sun photoreactor and, as in the case of flat-plate collectors, maximum annual
efficiency is obtained at the same collector angle inclination as the local latitude (Blanco et
al., 2000). Performance is very close to that of the simple tubular photoreactor, but only
about 1/3 of the reactor tube material is required. As in a parabolic through, the water is
more easily piped and distributed than in many one-sun designs. All these factors
contribute to excellent CPC-collector performance in solar photocatalytic applications
(Malato et al., 1997; Blanco et al., 1999; Ajona and Vidal, 2000; Malato et al., 2000a,
2000b).
Figure 4.10. Detail of a collector CPC where the configuration of the tubes reactors is observed

4. UV - based processes
104
Compound parabolic concentrator reflectors are usually made of polished
aluminium and the structure can be a simple photoreactor support frame with connecting
tubing (Figure 4.10). Since this type of reflector is considerably less expensive than tubing,
their use is more cost-effective compared to deploying non-concentrating tubular
photoreactors that do not use reflectors. The advantages of using tubing for the active
photoreactors area is still preserved in CPCs.
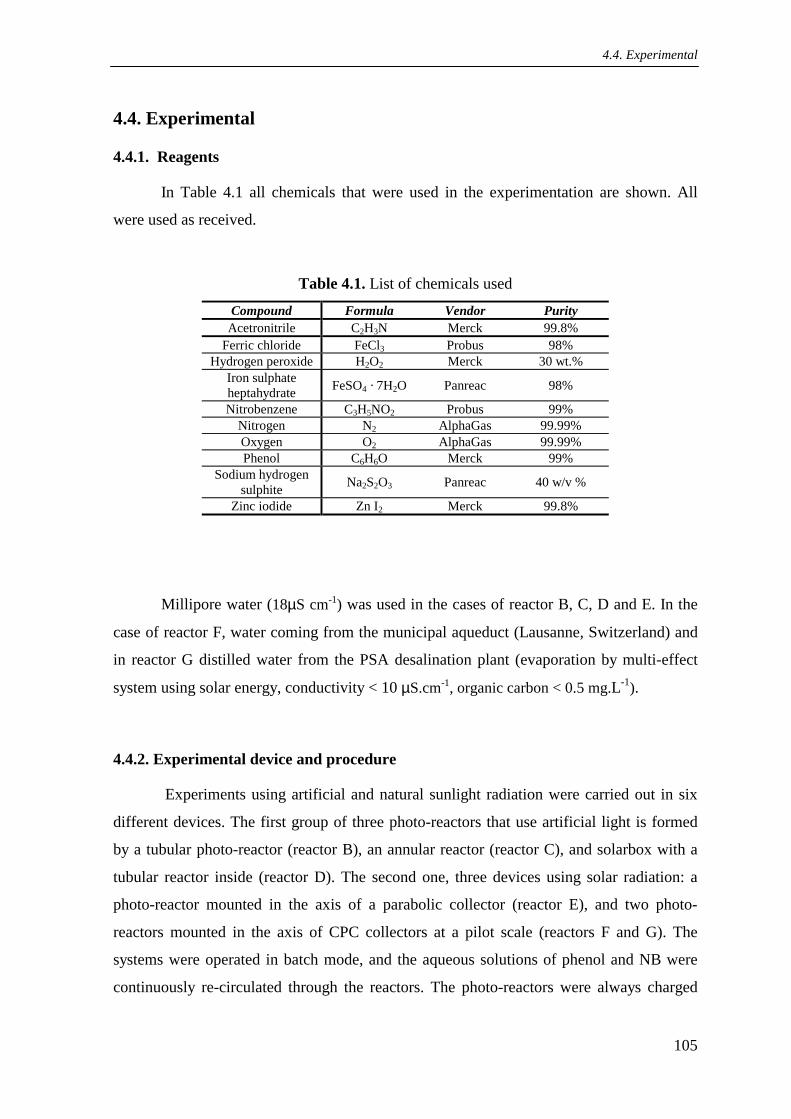
4.4. Experimental
105
4.4. Experimental
4.4.1. Reagents
In Table 4.1 all chemicals that were used in the experimentation are shown. All
were used as received.
Table 4.1. List of chemicals used Compound Formula Vendor Purity
Acetronitrile C2H3N Merck 99.8% Ferric chloride FeCl3 Probus 98%
Hydrogen peroxide H2O2 Merck 30 wt.% Iron sulphate heptahydrate FeSO4 · 7H2O Panreac 98%
Nitrobenzene C3H5NO2 Probus 99% Nitrogen N2 AlphaGas 99.99% Oxygen O2 AlphaGas 99.99% Phenol C6H6O Merck 99%
Sodium hydrogen sulphite Na2S2O3 Panreac 40 w/v %
Zinc iodide Zn I2 Merck 99.8%
Millipore water (18µS cm-1) was used in the cases of reactor B, C, D and E. In the
case of reactor F, water coming from the municipal aqueduct (Lausanne, Switzerland) and
in reactor G distilled water from the PSA desalination plant (evaporation by multi-effect
system using solar energy, conductivity < 10 µS.cm-1, organic carbon < 0.5 mg.L-1).
4.4.2. Experimental device and procedure
Experiments using artificial and natural sunlight radiation were carried out in six
different devices. The first group of three photo-reactors that use artificial light is formed
by a tubular photo-reactor (reactor B), an annular reactor (reactor C), and solarbox with a
tubular reactor inside (reactor D). The second one, three devices using solar radiation: a
photo-reactor mounted in the axis of a parabolic collector (reactor E), and two photo-
reactors mounted in the axis of CPC collectors at a pilot scale (reactors F and G). The
systems were operated in batch mode, and the aqueous solutions of phenol and NB were
continuously re-circulated through the reactors. The photo-reactors were always charged

4. UV - based processes
106
with aqueous solution of phenol or NB and sulfuric acid was added for adjustment of the
pH to the range between 2.7 and 3.0. With regard to photo-Fenton experiments, the
beginning of the experiment corresponded to the addition of hydrogen peroxide and
simultaneously start of irradiation. In the case of H2O2/UV and Fe3+/UV, the beginning of
the experiments corresponded to the start of irradiation. At various intervals, samples of
the reaction solution were withdrawn from the reactor during the mineralization
experiments. The samples were tested for H2O2 consumption and were used for TOC and
HPLC analysis after being quenched with sodium hydrogen sulphite solution, in order to
avoid further reactions.
4.4.2.1. Tubular Reactor (reactor B)
Experiments for the three treatment processes under study (see Table 4.2) were
conducted in a recirculating tubular photo-reactor, which is shown in Fig. 4.11 and
Fig. 4.12. The photo-reactor capacity is 5 L. It is equipped with four “germicides” low-
pressure mercury lamps, placed parallel to its axis. These lamps emit radiation basically at
253.7 nm and they are cooled by air. The nominal power is 15 W each one. The reaction
zone consists of a cylindrical quartz tube, 100 cm in longitude, with an exterior diameter of
2.2 cm and an interior diameter 1.85 cm. The reaction volume is 269 cm3. It is mounted
within a quartz tube with a longitude of 48 cm, exterior diameter of 5.4 cm and interior
diameter of 5.0 cm. Air circulates in the tubular space between the two tubes. The exit
zone was designed to maintain a constant level by means of a spillway. Before coming out
experiments, actinometry experiments based on the photochemical decomposition of oxalic
acid in the presence of uranyl ion (Volman and Seed, 1964; Heidt et al., 1979) were
performed to determine the flux of radiation entering the reactor. It was found that the flux
of radiation entering the reactor was 24.99 µEinstein.s-1 at 253.7 nm (see Appendix).
Because NB is highly absorbent at 253.7 nm (see Fig. 4.46), the 253.7 nm photon flow
absorbed per unit of reaction volume (sometimes defined as volumetric intensity) is 92.55
µEinstein.s-1L-1. Phenol is less absorbent than NB, but at 253.7 nm it absorbs lightly (see
Fig. 4.35). Therefore, the photon flow absorbed per unit of reaction volume at 253.7 in the
case of phenol is 69.70 µEinstein.s-1L-1.

4.4. Experimental
107
Charge
Discharge
cooling system (entry)
cooling system (exit)
recirculation
Pump
Tubular Reactor
Figure 4.11. Installation scheme of Reactor B
Figure 4.12. Reactor B
Lamps

4. UV - based processes
108
The reactor was always charged with 2.5 L of an aqueous NB or phenol solution.
All the experiments were carried out in a batch operation at room temperature, with a
recirculation flow rate of 100 L.h-1.
4.4.2.2. Annular Reactor (reactor C)
A number of experiments were conducted in a jacketed thermostated 1.5 L glass
photoreactor (see Fig. 4.13 and Fig. 4.14). It is equipped with a 4-W black (ARC-P04/23
04W, F4T5BLB Layrton) lamp, placed inside of the reactor. This lamp emits radiation
between 300-400 nm. Magnetic stirring was used to keep the solution homogeneously. The
temperature of the reactor was controlled by circulating water from an external
thermostatic bath (Haake C-40). All experiments were carried out at 25oC. Actinometric
experiments based on the photochemical decomposition of oxalic acid in the presence of
uranyl ion were also performed. It was found that the flux of radiation entering the reactor
was 0.83 µEinstein.s-1 at 360 nm (see Appendix). The photon flow absorbed per unit of
reaction volume at 360 nm are 0.37 µEinstein.s-1 L-1 and 0.11 µEinstein.s-1L-1 for NB and
phenol, respectively.
Recycle Wate
Thermostat
Injecting and Sample Port
pH Meter
Reactor Vessel
Magnetic Stir Bar
Stir Plate
Quartz Tube
Black Lamp
Figure 4.13. Installation scheme of Reactor C
Recycle Water
Thermostat

4.4. Experimental
109
Figure 4.14. Reactor C
4.4.2.3. Solarbox (reactor D)
A number of experiments were also carried out in a quartz tubular reactor inside of
a solarbox (see Fig. 4.15 and Fig. 4.16). The solarbox is a commercial solar simulator from
COFOMEGRA (Milano, Italy). The assembly is quite simple. The inner surface of the
solarbox is a parabolic reflector installed at the bottom and providing an effective
reflecting surface of 0.054 m2. This reflector concentrates the emitted radiation of the lamp
within the focus. The focus is localized at the center of the tubular reactor, through which
the solutions are led inside the solarbox. The quartz reactor is a cylinder providing a length
of 26 cm with an inner diameter of 2.1 cm and outer diameter of 2.5 cm. The reactor
volume is 90 cm3. The source of radiation is a 1500-W Xenon lamp (Philips, XOP 15-OF,
290 nm < λ < 560 nm). The 1.5 L volume is treated at a recirculation flow rate of
100 L.h-1. The reactor volume is 90 cm3 and the reactor temperature was controlled by
circulating water from a thermostatic bath (Haake C-40).
The photon flow entering the reactor and absorbed by the reaction medium within
the wavelength range 300 nm < λ < 400 has been calculated using a Microsoft Excel
spreadsheet and its value was 2.17x10⁻⁶ Einstein s-1 (see details in Appendix).

4. UV - based processes
110
VesselVess
Recycle Water
Thermostat
Injecting and Sampling Port
Vessel
SOLARBOX
Lamp TubularReactor
Lamp Reflector
Figure 4.15. Installation scheme of Reactor D
Figure 4.16. Reactor D

4.4. Experimental
111
4.4.2.4. Parabolic collector (reactor E)
This prototype was designed based on a parabolic concentrator (PTC) photoreactor.
This kind of medium-concentrating solar collector concentrates sunlight between 5 and 50
times, and usually requires continuous tracking of the sun’s movement (Blanco and
Malato, 1992). In our case, this was done manually. The solution goes through a tubular
reactor placed in the focus of a parabolic reflector. The cylindrical reactor strongly
resembles the reactor used in the Solarbox (see Fig. 4.17).
�������������������������������������������������������������������������������������������������������������������������������������������������
Injecting and Sampling
Port
Vessel Reactor
VesseVess
���������������������������������������������������������
Styropor- lid
Watertank
100l/min
����������������������������������������������������������������������������������������������������������������������������������������������������������������������������������������������������������������������������������������������������������������������������������������������������������������������������������������������������������������������������������������������������������������
Parabolic reflector
Reactor
platform
Figure 4.17. Installation scheme of Reactor E
It also has a length of 26 cm and a diameter of 2.1 cm. The dimensions of the
reflector are 32 cm x 54.5 cm (0.174 m2), whereby, for design reasons, only half of the
surface (0.087 m2) can be considered reflecting in so far as surface supplying the process
with photons. Again, the treated volume is 1.5 L at a recirculation flow rate of 100 L.h-1
and reactor volume is 90 cm3 ( Fig.4.17).
As with the Solarbox, a perfect parabolic form of the reflector surface was
assumed. Therefore, the same assumptions can be made: rays enter into the tube and are

4. UV - based processes
112
concentrated onto the focus. In all experiments performed in this reactor, the incident
radiation was not quantified.
4.4.2.5. CPC 1 (reactor F)
A Compound Parabolic Collector (CPC) installed at the Swiss Federal Institute of
Technology (EPFL) in Lausanne-Switzerland was used in order to test the technical
feasibility of this technology in the treatment of organic compound at field pilot scale
(Fig. 4.18). The configuration of CPC is the same one that of the reactor constructed at the
Plataforma Solar de Almería (PSA) (Malato et al., 2001). The CPC has 3 modules
(collector surface, 3.08 m2, photoreactor volume 22 L and total reactor volume 100 L)
whereas one module consists of 8 tubes (1.03 m2 each) connected in series and mounted on
a fixed platform 40o tilted (local latitude). The three modules are connected in series with
water directly flowing through them at 20 L min-1, leading finally to a recirculation tank. A
centrifugal pump then returns water to the collectors. At the beginning of the experiments,
with collectors covered, all the chemicals are added to the tank and mixed until
homogenization. The cover is then removed and samples are collected at predetermined
times.
Figure 4.18. Reactor F

4.4. Experimental
113
The incident solar radiation was measured by means of a global UV radiometer
(KIPP & ZONEN, model CUV3), mounted on a platform tilted 40o (same angle as the
CPC). The evaluation of this parameter is widely described in section 4.4.3.6.
4.4.2.6. CPC 2 (reactor G)
A Compound Parabolic Collector (CPC) installed at the Plataforma Solar de
Almería (PSA) has been also used (Fig. 4.19 and Fig. 4.20). The current CPC field
configuration consists of 4 modules (collector surface 5.93 m2, photoreactor volume 72 L,
photoreactor inner diameter 48 mm, total plant volume 190 L) connected in series and
mounted on a fixed platform inclined 37o (local latitude). The 4 modules are connected in
series as well with water directly flowing through them, leading finally to a recirculating
tank. A centrifugal pump then returns the water to the collectors. The water flows
(3.7 m3.h-1) directly from one module to the other and finally to a reservoir tank (52 L).
Figure 4.19. Reactor G
The piping and valves (87 L) between the reactor and the tank are black HDPE
(High Density Polyethylene), material chosen because it is strongly resistant to chemicals,
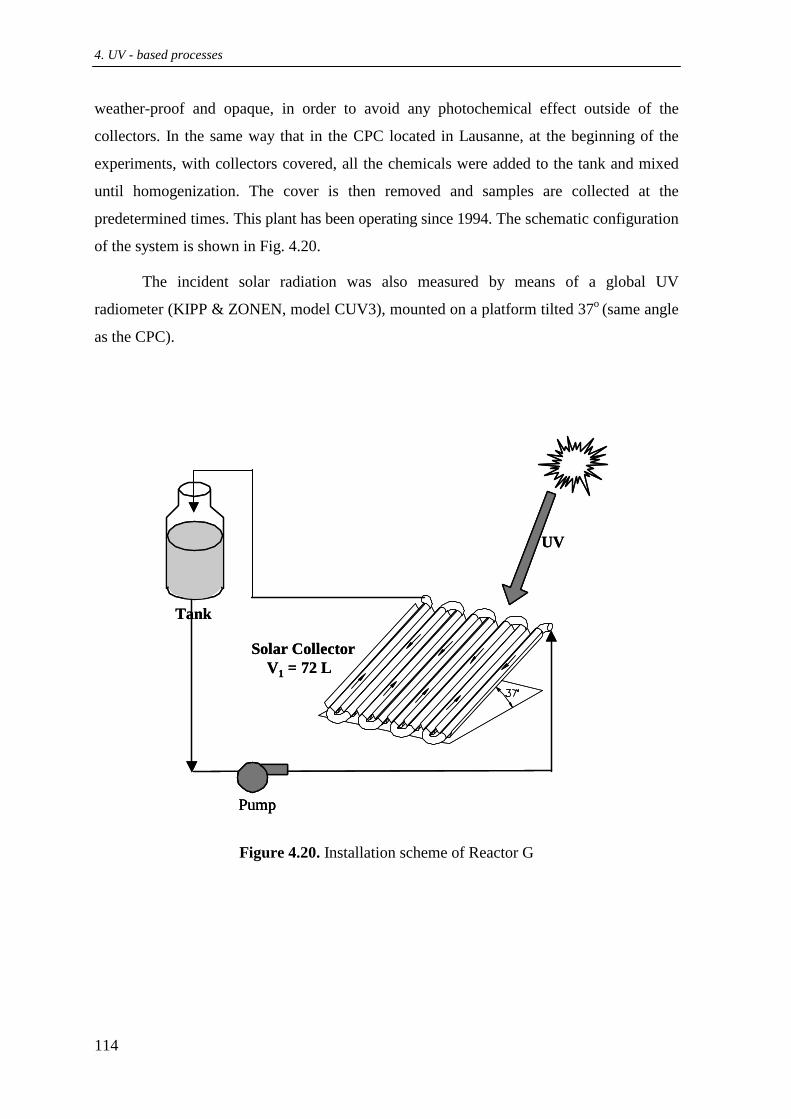
4. UV - based processes
114
weather-proof and opaque, in order to avoid any photochemical effect outside of the
collectors. In the same way that in the CPC located in Lausanne, at the beginning of the
experiments, with collectors covered, all the chemicals were added to the tank and mixed
until homogenization. The cover is then removed and samples are collected at the
predetermined times. This plant has been operating since 1994. The schematic configuration
of the system is shown in Fig. 4.20.
The incident solar radiation was also measured by means of a global UV
radiometer (KIPP & ZONEN, model CUV3), mounted on a platform tilted 37o (same angle
as the CPC).
Figure 4.20. Installation scheme of Reactor G
UV
Solar CollectorV1 = 72 L
Pump
Tank
UV
Solar CollectorV1 = 72 L
PumpPump
Tank

4.4. Experimental
115
4.4.3. Analytical determinations
4.4.3.1. Actinometry
This is a common method to determine the intensity of a radiation source. In the
present case, the actinometric system used is the photochemical decomposition of oxalic
acid in presence of uranyl nitrate (Volman and Seed, 1964; Heidt et al., 1979; Vicente and
Esplugas, 1983). The decomposition reaction of oxalic acid, in a pH range of between 3
and 7, and a conversion of oxalic acid lower than 20% is the following:
hv2 2+
2 2 2 2 2 2 (UO ) + H O (UO ) + CO + CO + H O+ → (4.24)
By the knowledge of the actinometer and the lamp characteristics, the radiation
intensity can be calculated. This method will be deeper presented in appendix.
4.4.3.2. Total Organic Carbon (TOC)
To determine the quantity of organically bound carbon, the organic molecules must
be broken down to single carbon units and converted to a single molecular form that can be
measured quantitatively. TOC methods utilize heat and oxygen, ultraviolet irradiation,
chemical oxidants, or combinations of these oxidants to convert organic carbon to carbon
dioxide (CO2).
In the present work, TOC has been determined by the combustion method and
analyzing the resultant CO2 with a Dohrmann DC-190 TOC analyzer for experiments
carried out in Barcelona University and a Shimadzu-5050A TOC analyzer for experiments
carried out in the EPFL and the PSA. Both instruments were equipped with an automatic
sample injector and they were calibrated with standard solutions (100 mgC.L-1 of
potassium hydrogen phthalate). Samples were acidified at pH lower than 3 and aerated
with oxygen to keep the solution free of atmospheric CO2.
4.4.3.3. HPLC
In some experiments carried out at laboratory scale in University of Barcelona ,
phenol and NB concentration was followed by means of HPLC, already described in
chapter 3.

4. UV - based processes
116
4.4.3.4. Hydrogen peroxide
Concentrations of H2O2 were determined and monitored by Merk Merkoquant,
Quantofix (Macherey-Nagel) peroxide analytical test strip and by iodimetric titration in the
case of the experiments performed in Almería according to the following procedure:
Prepare a starch solution by heating a few spatulas in a 250 mL Erlenmeyer flask. Put “x”
mL of sample (e.g. 25 mL) + 25 mL 0.2N KI + 20 mL 2N H2SO4 in a closed bottle. Add a
few drops of stark solution as an indicator. After 30 min titrated with 0.1N Na2S2O3 (24.82
g/L) ⇒ where “y” is the volume of consumed Na2S2O3. Concentration of hydrogen
peroxide would be calculated as follows:
H2O2 [mg/L] = 1700 * y/x
H2O2 [mol/L] = 1/20 * y/x
Remarks
The solution is pitch dark in most cases. Add the starch solution after the solution
has become noticeably brighter. After the addition the solution becomes blue black again
and is titrated till there is no color. If the flask stands for a while after the end point, the
solution will again darken since the iodide is reoxidized by air/oxygen.
Modifications and control checks of the initial method
Zinc iodide-starch solution ready for use has been utilized as indicator. 10 drops
have been added to the sample. The 30-minutes analysis has been performed in a closed
bottle and in the dark. 25 mL of sample have been always used. The sample has proceeded
from phenol photo-Fenton experiments diluted 1/100 or 1/25 as function of the hydrogen
peroxide concentration used in the experiment (20g.L-1 or 5 g.L-1). Few mL of 0.1N
Na2S2O3 are spent if this dilution is applied. This dilution factor has been applied to the
previous calculations.
In presence of Fe
The presence of iron could affect the determination of hydrogen peroxide. Different
tests were made with higher Fe concentration than the usual in the photo-Fenton
experiments (5 mmol.L-1 or 1 mmol.L-1 diluted 1/100 or 1/25, as function of the hydrogen
peroxide concentration).

4.4. Experimental
117
4.4.3.5. pH measurement
The pH measurements were carried out with a Crison GLP-22 pH-meter, calibrated
with two buffer solutions of pH 4 and 7. In all these experiments the analysis was not
performed on line, but after each sample withdrawal.
4.4.3.6. Evaluation of solar radiation
Solar radiation is an essential parameter for the correct evaluation of data obtained
from experiments in a solar water decontamination pilot plant. A global UV radiometer
(KIPP & ZONEN, model CUV3), mounted on a platform tilted 40o (same angle as the CPC
reactor located in Laussane, Switzerland) and 37o (same angle as the CPC reactor located
in Almería, Spain). The sensors provide data in terms of global and direct UV solar energy
power incident per unit area, WUV.m-2 (UVG-D,n) respectively. Solar-UV power varies
during experiments, especially when clouds are passing by. This gives an estimation of the
energy reaching any surface in the same position with regards to the sun. It may be
assumed that the average solar UV (300-400 nm) on a perfectly sunny day in June for 2
hours around noon is about 45 WUV.m-2.
With eq. 4.25, combination of data from several days experiments and their
comparison with other photocatalytic experiments are possible:
CPCG,nUV,n UV,n-1 n
TOT
AQ Q + t UV
V= ∆ (4.25)
where tn is the experimental time for each sample (min). UVG,n is the average UV during
nt∆ , CPCA is the collector surface, TOTV is the total plant volume and UV,nQ is the
accumulated energy (per unit of volume, kJ.L-1) incident on the reactor for each sample
taken during the experiment. For the CPC reactor located in Lausanne, CPCA = 3.08 m2 and
TOTV = 100 L. In the cases of CPC reactor located in the PSA, CPCA = 5.93 m2 and
TOTV = 190 L.
Consequently, when UV,nQ is used, the reaction rate could be expressed in terms of
mg per kJ of UV incident on the illuminated photoreactor surface.

4. UV - based processes
118
4.5. Range of experimental variables for phenol and NB experiments
Several series of the experiments of phenol and NB mineralization by
photo-Fenton, H2O2/UV-vis and Fe3+/UV-vis were carried out using different sources of
artificial and solar light. All experimental conditions are summarized in Tables 4.2, 4.3,
4.4, 4.5 and 4.6. Two initial concentration of phenol and NB were tested, 1.14 and 5.68
mmol.L-1. The effect of Fe2+, Fe3+ and H2O2 concentration was studied. The concentration
ranges were chosen addressing to reach the highest mineralization percentage. In this
sense, Fe2+ and Fe3+ concentration ranged between 0.054 and 2.15 mmol.L-1 and for
2 2H O concentration, between 5.33 and 106.7 mmol.L-1. Otherwise, the effect of oxygen on
the mineralization rate of phenol was studied using for these experiments only the reactor
B. The chosen environmental conditions for the realization of the experiments in reactor E
were only sunny days. In tables 4.3 and 4.6 the specific date and time of the day when each
experiment was made is shown. In table 4.4, the experimental conditions for the
experiments carried out in the CPC collector reactors are shown. CPC reactors were used
only for experiments with phenol as model compound. The working temperature in the
case of photo-reactors that use artificial light was around 25oC and in some cases it was
controlled by means of a thermostated bath. In the case of photo-reactors with solar
radiation the temperature was not controlled and a variation between 25 and 35oC was
observed. Regarding photo-Fenton and iron photo-assisted system (Fe3+/UV-vis), pH was
always adjusted close to 3 by means of sulfuric acid. For H2O2/UV-vis process, the pH
was not adjusted and the system evolved freely. Other specific experimental conditions are
also described in the experimental section.
It is important to point out that due to the extension of the experimental part, the
effect that all these parameters have on the selected processes were studied only with
phenol. Some of them, considering that their effect could be similar, were not studied for
NB.

4.5. Selection and range of experimental variables
119
Table 4.2. Experimental conditions of the runs for phenol experiments in photo-reactors with artificial light
Exp. No
Reactor used
[Phenol]o (mmol.L-1)
[H2O2]o (mmol.L-1)
Fe2+ / Fe3+ (mmol.L-1)
Process used
Ph1 Reactor B 1.14 5.33 0.054 DarkFenton+UV
Ph2
Ph3
Ph4
Ph5
Ph6
Ph7
Ph8
Ph9
Ph10
Ph11
Ph12
Ph13
Ph14
Ph15
Ph16
Ph17
Ph18
Ph19
Ph20
Ph21
Ph22
Ph23
Ph24
Ph25
Ph26
Ph27
Ph28
Reactor B
Reactor B
Reactor B
Reactor B
Reactor B
Reactor B
Reactor B
Reactor B
Reactor B
Reactor B
Reactor B
Reactor B
Reactor B
Reactor B
Reactor B
Reactor B
Reactor B
Reactor C
Reactor C
Reactor C
Reactor C
Reactor D
Reactor D
Reactor D
Reactor D
Reactor D
Reactor D
1.14
1.14
1.14
1.14
1.14
1.14
1.14
1.14
1.14
1.14
5.68
1.14
5.68
5.68
5.68
5.68
5.68
1.14
1.14
1.14
1.14
1.14
1.14
1.14
1.14
1.14
1.14
5.33
5.33
21.30
21.30
21.30
0.00
21.30
21.30
21.30
0.00
21.30
21.30
42.60
42.60
85.30
106.7
64.00
21.30
0.00
21.30
21.30
0.00
21.30
0.00
21.30
32.00
21.30
0.107
1.07
1.07
1.07
0.00
1.07
1.07
1.07
0.00
0.00
1.07
1.07
1.07
1.07
1.07
1.07
1.07
1.07
1.07
0.00
1.07
0.00
1.07
1.07
0.00
1.07
1.07
DarkFenton+UV
DarkFenton+UV
DarkFenton+UV
Fe2+/H2O2/UV
H2O2/UV
Fe3+/UV
DarkFenton+UV
Fe3+/H2O2/UV
H2O2/UV
UV
Fe3+/H2O2/UV
Fe3+/H2O2/UV+O2
Fe3+/H2O2/UV
Fe3+/H2O2/UV+O2
Fe3+/H2O2/UV
Fe3+/H2O2/UV
Fe3+/H2O2/UV
Fe3+/H2O2/UV
Fe3+/UV
H2O2/UV
Fe3+/H2O2
UV
Fe3+/H2O2/UV
Fe3+/UV
H2O2/UV
Fe3+/H2O2/UV
Fe2+/H2O2/UV

4. UV - based processes
120
Table 4.3. Experimental conditions of the runs for Phenol experiments in Reactor E using solar radiation
Exp. No
Date of Exp.
Time of radiation (h)
[H2O2]o (mmol.L-1)
Fe2+ / Fe3+ (mmol.L-1)
Process used
Ph29 06/08/01 3:00-6:00 0.00 0.00 UV
Ph30
Ph31
Ph32
Ph33
Ph34
Ph35
Ph36
Ph37
Ph38
Ph39
Ph40
Ph41
Ph42
Ph43
Ph44
Ph45
Ph46
Ph47
Ph48
Ph49
06/11/01
06/11/01
06/18/01
06/19/01
06/19/01
06/21/01
06/25/01
06/26/01
06/26/01
06/27/01
06/27/01
06/28/01
06/28/01
06/28/01
07/21/01
07/21/01
07/21/01
07/22/01
07/22/01
07/22/01
10:20-12:50
14:20-15:00
12:50-14:50
10:30-11:30
14:15-15:05
11:10-13:10
12:18-15:48
10:10-13:50
15:35-18:35
11:50-14:50
15:48-16:48
12:08-13:08
14:02-15:02
14:45-17:45
10:38-13:38
14:09-14:49
15:28-16:28
12:00-13:00
13:36-14:36
15:10-16:10
21.30
21.30
35.60
21.30
21.30
21.30
21.30
10.66
0.00
0.00
10.66
21.30
21.30
0.00
42.60
21.30
21.30
42.60
10.66
21.30
1.07
1.07
1.07
1.07
0.54
0.00
0.00
0.00
1.07
2.15
1.07
1.07
0.54
2.15
0.00
0.54
0.54
1.07
1.07
2.15
Fe2+/H2O2/UV
Fe2+/H2O2/UV
Fe2+/H2O2/UV
Fe2+/H2O2/UV
Fe2+/H2O2/UV
H2O2/UV
H2O2/UV
H2O2/UV
Fe3+/UV
Fe3+/UV
Fe2+/H2O2/UV
Fe3+/H2O2/UV
Fe3+/H2O2/UV
Fe3+/UV
H2O2/UV
Fe2+/H2O2/UV
Fe3+/H2O2/UV
Fe3+/H2O2/UV
Fe3+/H2O2/UV
Fe3+/H2O2/UV

4.5. Selection and range of experimental variables
121
Table 4.4. Experimental conditions of the runs for Phenol experiments in Reactors F and G using solar radiation
Exp. No
Date of Exp.
Time of radiation (h)
[H2O2]o (mmol.L-1)
Fe2+ / Fe3+ (mmol.L-1)
Process used
Ph50 07/17/01 10:00-15:15 21.30 0.00 H2O2/UV
Ph51
Ph52
Ph53
Ph54
Ph55
Ph56
Ph57
Ph58
Ph59
Ph60
Ph61
Ph62
Ph63
Ph64
Ph65
Ph66
07/21/01
07/22/01
07/23/01
07/24/01
07/25/01
07/26/01
07/30/01
07/31/01
08/01/01
08/03/01
08/05/01
08/07/01
08/11/01
10/23/02
10/24/02
10/28/02
10:45-16:45
11:30-16:30
11:15-16:15
11:00-16:00
11:15-16:15
11:00-16:00
11:15-13:45
11:00-14:00
10:00-11:30
11:00-13:00
11:00-13:00
11:00-13:00
11:00-13:00
10:00-1:00
10:00-1:00
10:00-1:00
21.30
42.60
0.00
0.00
0.00
0.00
21.30
42.60
21.30
21.30
21.30
54.41
73.53
21.30
21.30
21.30
0.00
0.00
1.07
0.54
0.54
1.07
0.54
0.54
1.07
1.07
0.54
1.07
1.07
1.07
0.54
0.27
H2O2/UV
H2O2/UV
Fe3+/UV
Fe3+/UV
Fe3+/UV
Fe3+/UV
Fe3+/H2O2/UV
Fe3+/H2O2/UV
Fe3+/H2O2/UV
Fe3+/H2O2/UV
Fe3+/H2O2
Fe3+/H2O2/UV
Fe3+/H2O2/UV
Fe3+/H2O2/UV
Fe3+/H2O2/UV
Fe3+/H2O2/UV

4. UV - based processes
122
Table 4.5. Experimental conditions of the runs for NB experiments in photo-reactors with artificial light
Exp. No
Reactor used
NB (mmol.L-1)
[H2O2]o (mmol.L-1)
Fe2+ / Fe3+ (mmol.L-1)
Process used
NB1
NB2
NB3
NB4
NB5
NB6
NB7
NB8
NB9
NB10
NB11
NB12
NB13
NB14
NB15
NB16
Reactor B
Reactor B
Reactor B
Reactor B
Reactor B
Reactor B
Reactor B
Reactor B
Reactor B
Reactor B
Reactor B
Reactor D
Reactor D
Reactor D
Reactor D
Reactor D
1.14
1.14
1.14
1.14
1.14
1.14
5.68
5.68
5.68
5.68
5.68
1.14
1.14
1.14
1.14
1.14
0.00
0.00
21.30
21.30
42.60
42.60
85.36
85.36
0.00
85.36
0.00
0.00
21.30
0.00
21.30
21.30
0.00
1.07
0.00
1.07
1.07
1.067
1.07
1.07
0.00
0.00
1.07
0.00
1.07
1.07
0.00
1.07
UV
Fe3+/UV
H2O2/UV
Fe3+/H2O2/UV
Fe3+/H2O2/UV
Fe2+/H2O2/UV
Fe3+/H2O2/UV
Fe3+/H2O2/UV+O2
UV
H2O2/UV
Fe3+/UV
UV
Fe3+/H2O2/UV
Fe3+/UV
H2O2/UV
Fe2+/H2O2/UV

4.5. Selection and range of experimental variables
123
Table 4.6. Experimental conditions of the runs for NB experiments in Reactor E using solar radiation
Exp. No
Date of Exp.
Time of radiation (h)
[H2O2]o (mmol.L-1)
Fe2+ / Fe3+ (mmol.L-1)
Process used
NB17
NB18
NB19
NB20
NB21
NB22
NB23
NB24
NB25
NB26
NB27
NB28
NB29
NB30
NB31
NB32
NB33
NB34
NB35
07/03/01
07/04/01
07/05/01
07/05/01
07/05/01
07/10/01
07/10/01
07/11/01
07/17/01
07/20/01
07/20/01
07/23/01
07/23/01
07/23/01
07/23/01
07/23/01
07/27/01
07/27/01
07/30/01
15:00-18:00
13:00-15:00
10:00-11:00
12:00-13:00
14:00-15:00
13:00-15:00
16:00-8:00
11:00-14:00
13:00-16:00
14:00-15:00
16:00-17:00
10:00-11:00
12:00-13:00
13:00-14:00
15:00-16:00
16:00-17:00
10:00-11:00
12:00-15:00
13:00-15:00
0.00
21.30
10.60
21.30
42.60
0.00
0.00
10.60
21.30
21.30
21.30
21.30
21.30
42.60
10.60
42.60
21.30
0.00
0.00
0.00
1.07
1.07
1.07
1.07
1.07
1.07
0.00
0.00
0.54
2.14
0.54
1.07
2.14
1.07
1.07
2.14
0.00
0.00
UV
Fe2+/H2O2/UV
Fe2+/H2O2/UV
Fe2+/H2O2/UV
Fe2+/H2O2/UV
Fe2+/UV
Fe3+/UV
H2O2/UV
H2O2/UV
Fe3+/UV
Fe2+/H2O2/UV
Fe3+/H2O2/UV
Fe3+/H2O2/UV
Fe3+/H2O2/UV
Fe3+/H2O2/UV
Fe3+/H2O2/UV
Fe2+/H2O2/UV
UV
UV
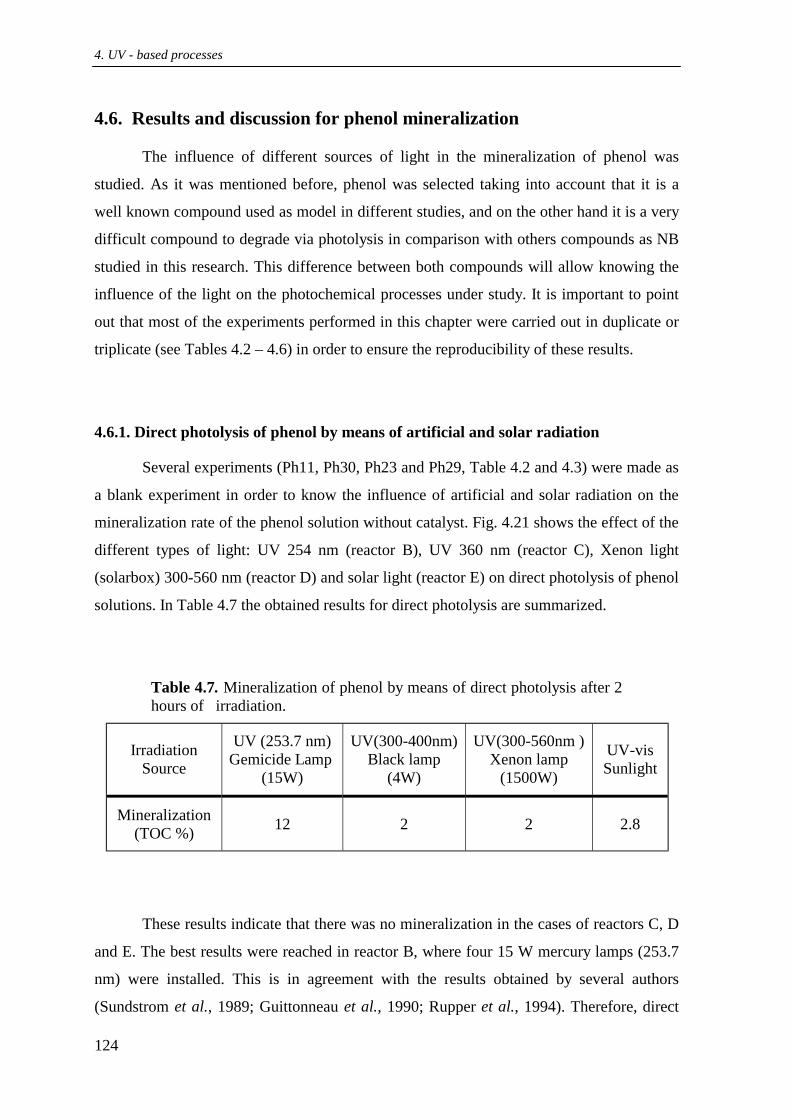
4. UV - based processes
124
4.6. Results and discussion for phenol mineralization
The influence of different sources of light in the mineralization of phenol was
studied. As it was mentioned before, phenol was selected taking into account that it is a
well known compound used as model in different studies, and on the other hand it is a very
difficult compound to degrade via photolysis in comparison with others compounds as NB
studied in this research. This difference between both compounds will allow knowing the
influence of the light on the photochemical processes under study. It is important to point
out that most of the experiments performed in this chapter were carried out in duplicate or
triplicate (see Tables 4.2 – 4.6) in order to ensure the reproducibility of these results.
4.6.1. Direct photolysis of phenol by means of artificial and solar radiation
Several experiments (Ph11, Ph30, Ph23 and Ph29, Table 4.2 and 4.3) were made as
a blank experiment in order to know the influence of artificial and solar radiation on the
mineralization rate of the phenol solution without catalyst. Fig. 4.21 shows the effect of the
different types of light: UV 254 nm (reactor B), UV 360 nm (reactor C), Xenon light
(solarbox) 300-560 nm (reactor D) and solar light (reactor E) on direct photolysis of phenol
solutions. In Table 4.7 the obtained results for direct photolysis are summarized.
Table 4.7. Mineralization of phenol by means of direct photolysis after 2 hours of irradiation.
Irradiation Source
UV (253.7 nm) Gemicide Lamp
(15W)
UV(300-400nm) Black lamp
(4W)
UV(300-560nm ) Xenon lamp
(1500W)
UV-vis Sunlight
Mineralization (TOC %) 12 2 2 2.8
These results indicate that there was no mineralization in the cases of reactors C, D
and E. The best results were reached in reactor B, where four 15 W mercury lamps (253.7
nm) were installed. This is in agreement with the results obtained by several authors
(Sundstrom et al., 1989; Guittonneau et al., 1990; Rupper et al., 1994). Therefore, direct

4.6. Results and discussion for phenol
125
photolysis of phenol solutions at the tested conditions is not a very effective method for
mineralization. In a same way it is not an effective method for its degradation, because the
yield obtained was also very low.
0
20
40
60
80
100
0 30 60 90 120Time (min)
TOC
(%)
Figure 4.21. Effect of direct photolysis on the mineralization of phenol. [phenol]o= 1.14 mmol.L-1 (!) Reactor D, (∆) Reactor E, (•) Reactor C, (♦ ) Reactor B.
4.6.2. Photo-Fenton using artificial light
The effectiveness of photo-Fenton process in the mineralization of aromatic organic
compounds in aqueous solutions is well-known (Lipczynska-Kochany, 1992; Li and
Comfort, 1998; Bauer et al., 1999). However, a complementary study, using three different
sources of artificial light has been made in order to check the effect of the radiation source
in this photocatalytic homogeneous process.
As it can be observed in Fig. 4.22, a very high degree of TOC reduction (more than
80 % in 1 hour irradiation) was obtained in reactors B and D. In reactor C, 60 % of TOC
was eliminated in 1 h (Table 4.2, Ph9, Ph14, and Ph24). These results are in agreement
with both the photon flux entering the reactor and the emitting wavelength in each case. In
this sense, the best results were achieved in reactor B, where 100 % of mineralization was

4. UV - based processes
126
obtained. This could also be explained by the effectiveness of the ultraviolet radiation (254
nm) in the photolysis of the H2O2 to produce hydroxyl radicals (see eq. 4.3). In the three
experiments performed in three different reactors (Fig. 4.22), the main part of the TOC
reduction takes place during the first 20 minutes when most of H2O2 is consumed,
producing most of the hydroxyl radicals.
0
20
40
60
80
100
0 10 20 30 40 50 60
Time (min)
TOC
(%)
Figure 4.22. Photo-Fenton mineralization of phenol using different sources of light. [phenol]o= 1.14 mmol.L-1, [Fe3+]o = 1.07 mmol.L-1, [H2O2]o = 21.30 mmol.L-1, T = 298 K.(•) Reactor C, (!) Reactor D, (!) Reactor B.
4.6.2.1. Effect of the use of Fe2+ or Fe3+ in the photo-Fenton process
In order to study the influence of the most important parameters in the photo
Fenton process, reactor B was chosen as model reactor, taking into account the previous
results and in order to reduce the number of experiments. Traditionally, the Fenton process
is carried out in presence of Fe2+ (FeSO4) as catalyst. However, the mineralization step
appears to be driven by Fe3+-catalyzed processes, especially in presence of light
(Pignatello, 1992). For this reason, preliminary experiments to know the influence of using 2+Fe or 3+Fe were carried out. As it can be seen in Fig. 4.23 (Ph5 and Ph9, Table 4.2) a
similar mineralization degree was obtained using both Fe2+ ( 4FeSO ) and Fe3+( 3FeCl ).

4.6. Results and discussion for phenol
127
0
20
40
60
80
100
0 10 20 30 40 50 60
Time (min)
TOC
(%)
Figure 4.23. Effect of Fe2+ and Fe3+ on the photo - Fenton mineralization of phenol in Reactor B. [phenol]o= 1.14 mmol.L-1, [H2O2] = 21.30 mmol.L-1, T = 298K. (!) [Fe2+] = 1.07 mmol.L-1, (!) [Fe3+] = 1.07 mmol.L-1.
Therefore, the use of one or another ion seems not to be important under the studied
conditions. Related to that, another aspect that should be considered is the anion of the
used salt. In this sense, the influence of different anions normally present in natural water
and wastewater has been widely studied (Pignatello, 1992; Lipczynska-Kochany et al.,
1995). These studies showed that -Cl , 24SO − , 2-
4HPO and -3HCO anions delayed the Fenton
reaction. This retard is attributed to their scavenging power of hydroxyl radicals. This
effect is particularly strong for bicarbonate and phosphate ions. Consequently, their
presence is unfavorable in Fenton reagent. However, the scavenging effect of phosphate
and bicarbonate anions on the degradation of organic pollutants by means of the Fenton
process may be somewhat reduced by the necessity of the application of this technique at
moderately low pH.
In light of the experimental results, where an important difference of the used iron
ion is not observed besides the fact that mineralization appears to be driven by
Fe3+-catalyzed processes, Fe3+ has been selected as catalyst to be used in most of the
photo-Fenton experiments.

4. UV - based processes
128
4.6.2.2. Effect of H2O2 initial concentration
In the photo-Fenton process the limiting reagent is H2O2. However, as it has been
demonstrated before in the dark-Fenton process, an excess of this reagent does not mean a
continuous increase in the mineralization and degradation rate of the treated solution. In
this sense, a series of experiments was also carried out in order to study the effect of initial
concentration of H2O2 on the mineralization rate of a phenol solution in reactor B.
The experimental data obtained for phenol mineralization can be fitted according to a
pseudo-first-order reaction (eq. 4.26):
o( ) ( )d TOC k TOCdt
− = (4.26)
where k is the first-order reaction rate constant (eq.4.27). The integration leads to
o
ln TOC ktTOC
− =
(4.27)
From the plot Ln(TOC/TOCo) versus t (time of irradiation), the first-order reaction
rate constant (the slope) was calculated and used to study the effect of different
concentration of 2 2H O and Fe3+.
As shown in Fig. 4.24 (Ph12, Ph14 and Ph16-Ph18, Table 4.2) a significant
enhancement of the mineralization efficiency was observed when the H2O2 concentration
was increased from 0 to 64.06 mmol.L-1 (the continuous line does not mean any fitting but
only a way of showing the tendency).

4.6. Results and discussion for phenol
129
0
0.005
0.01
0.015
0.02
0.025
0.03
0.035
0 30 60 90 120
H2O2 (mmol.L-1)
k obs
(min
-1)
Figure 4.24. The initial rate constant of photo-Fenton mineralization using different [H2O2] concentration in reactor B. [phenol]o= 5.69 mmol.L-1, [Fe3+] = 1.07 mmol.L-1, T = 298 K.
Above this H2O2 concentration, the oxidation rate seems to be negatively affected
by the increase of H2O2 up to106.7 mmol.L-1. This is probably due to both the auto-
decomposition of H2O2 into oxygen and water (eq.4.28) and the scavenging effect of
hydroxyl radicals by H2O2 (eq. 4.29) as follows:
2 2 2 22H O 2H O + O→ (4.28)
2 2 2HO + H O HOO + H O• •→ (4.29)
Excess of H2O2 will react with HO• competing with organic pollutants and
consequently reducing the efficiency of the treatment.
The percentage of mineralization is shown in Fig. 4.25. As it can be observed, the
mineralization reached above 64.06 mmol.L-1 of 2 2H O is smaller than the one achieved at
this concentration (Ph16 and Ph17, Table 4.2). Therefore, 64.06 mmol.L-1 seemed to be the
optimal concentration of H2O2 for mineralization of phenol at the experimental conditions.

4. UV - based processes
130
0
20
40
60
80
100
0 10 20 30 40 50 60
Time (min)
TOC
(%)
Figure 4.25. Photo-Fenton mineralization using different H2O2 concentrations. [phenol]o = 5.69 mmol.L-1, [ 3+Fe ] = 1.07 mmol.L-1, T = 298K. (♦ ) 2 2[H O ]= 21.30 mmol.L-1, (!) 2 2[H O ]= 42.6 mmol.L-1, (!) 2 2[H O ] = 106.7 mmol.L-1, (!) 2 2[H O ] = 85.3 mmol.L-1, (•) 2 2[H O ] = 64.0 mmol.L-1.
4.6.2.3. Effect of O2 concentration
The effect of bubbling oxygen into the reactor was also studied. It is important to
keep in mind that the reactor B, where all these experiments were performed, was open to
the atmosphere. Thus, it is not possible to know if the oxygen concentration during the
experiment provided by dissolved oxygen and by the decomposition of H2O2 is enough for
the mineralization of the compound. In this sense, several experiments were carried out
with and without bubbling oxygen through the solution using two different concentration
of phenol (1.07 and 5.69 mmol.L-1) at the same concentration of H2O2 , Fe3+ and room
temperature.
In Fig. 4.26 experiments Ph9, Ph13, Ph14 and Ph15 were represented. In the case
of experiment Ph9 (without bubbling O2) and Ph13 (bubbling O2), similar mineralization
degree was obtained. This means that oxygen concentration to reach 100 % of
mineralization at the working conditions (Ph9 and Ph13) was sufficient when phenol
concentration was low (1.07 mmol.L-1).

4.6. Results and discussion for phenol
131
0
20
40
60
80
100
0 10 20 30 40 50 60
Time (min)
TOC
(%)
Figure 4.26. Effect of bubbling 2O in the photo-Fenton mineralization of phenol. [Fe3+] = 1.07 mmol.L-1, T = 298K. (♦ ) Ph14, (•) Ph15, (!) Ph9, (!) Ph13.
However, in the case of experiments Ph14 (without bubbling O2) and Ph15
(bubbling O2) when phenol concentration was 5.69 mmol.L-1, the reached mineralization
degree was significantly different. In those cases, the percentage of TOC eliminated was
80 % and 24 %, respectively. These differences can be explained keeping in mind two
important elements. The first one is that the excess of oxygen in the reaction medium
avoids the auto-decomposition of H2O2 in 2H O and O2 according to eq. 4.28. It means that
more H2O2 can produce HO• through equation (1.8). The second one may be attributed to
the high concentration of phenol, needing more oxygen for its mineralization.
4.6.3. Dark-Fenton combined with UV artificial radiation
Some experiments (Ph1-Ph4 and Ph8, Table 4.2) were also carried out in reactor B,
where the Fenton reaction in the dark was followed by a period of irradiation. The aim of
these experiments was to compare them with the photo-Fenton process. In Fig. 4.27 the
combined experiment (dark + UV) and the photo-Fenton process are presented. The
reaction time in the dark was sufficiently long (60 min) in order to guarantee that all Fe2+

4. UV - based processes
132
was converted to 3+Fe . The maximum TOC reduction took place during the first 10 min.
Afterwards, a plateau was reached and after 60 min the irradiation was applied. The rate
constant of the second (illuminated) step was estimated in order to compare with the
photo-Fenton process and was 0.101 min-1. The initial rate constant for the photo-Fenton
process was 0.0798 min-1. An important difference is not observed even when the first step
of reaction was carried out in the dark in comparison to when the reaction took place in
presence of UV from the beginning. However, the final degree of mineralization was
higher when the photo-Fenton process was used since the beginning (100% in 60 minutes
of treatment), as the involved reactions in presence of light take place throughout all the
treatment time. These results confirm that the mineralization power of the Fenton system
is greatly enhanced by irradiation with UV. It is very important to note that in the
combined process a plateau was reached after 80% of mineralization and the reaction
began to advance very slowly, while the photo-Fenton process proceed until total
mineralization. Concluding, it is not worthy to carry out this process in two stages, but
taking profit of the synergistic use of the light from the beginning of the process.
0
20
40
60
80
100
0 20 40 60 80 100 120
Time (min)
TOC
(%)
Figure 4.27. Effect of irradiation on the photo-Fenton mineralization in Reactor B. [phenol]o = 1.14 mmol.L-1, [Fe3+] = 1.07 mmol.L-1, [H2O2] = 21.30 mmol.L-1, T = 298K.(!,!) Ph4, Ph8 (the irradiation period started after 60 min).(!) Ph5 (with irradiation from the beginning).
Dark-Fenton + UV
Photo-Fenton

4.6. Results and discussion for phenol
133
4.6.4. Photo-Fenton process using solar radiation
As it has been mentioned before en section 4.6.2, the photo-Fenton process was
very effective in the mineralization of many organic compounds in aqueous solution.
However, one problem of this treatment process is the electrical energy demand of UV-
lamps. In addition, the photo-reactor design at big scale is also expensive and difficult to
operate. Therefore, the total costs of a photo-Fenton process using artificial light are
usually high. In this context, the use of solar light would dramatically decrease the cost of
the process, thus, providing a major step towards industrials applications (Blanco et al.,
1999; Krutzler and Bauer, 1999). The use of solar light is possible for photocatalytic
processes, such as photo-Fenton and TiO2/UV.
nmWavelength,
-2-1
-2-1
W m
nmW
mnm
300 400 500 6000.0
0.2
0.4
0.6
0.8
1.0
1.2
0.0
0.2
0.4
0.6
0.8
1.0
1.2
Espectro solar
3+
TiO2
300 400 500 6000.0
0.2
0.4
0.6
0.8
1.0
1.2
0.0
0.2
0.4
0.6
0.8
1.0
1.2
Solar spectrum
Fe 3+ (0.25 mM)
O.D
nmWavelength,
-2-1
-2-1
W m
nmW
mnm
300 400 500 6000.0
0.2
0.4
0.6
0.8
1.0
1.2
0.0
0.2
0.4
0.6
0.8
1.0
1.2
Espectro solar
3+
TiO2
300 400 500 6000.0
0.2
0.4
0.6
0.8
1.0
1.2
0.0
0.2
0.4
0.6
0.8
1.0
1.2
Solar spectrum
Fe 3+ (0.25 mM)
O.D
Figure 4.28. PSA typical solar spectrum compared to the optical density (O.D., optical path length 1 cm) of a Fe2(SO4)3 solution (0.25 mmol.L-1 as Fe3+).
The sensitivity of photo-Fenton process to light up to wavelengths of 520 nm can be
observed in Fig 4.28. Light penetration is deep and the contact between pollutant and the
oxidizing agent is intimate, because of the homogeneous phase.
(0.25 mmol.L-1)
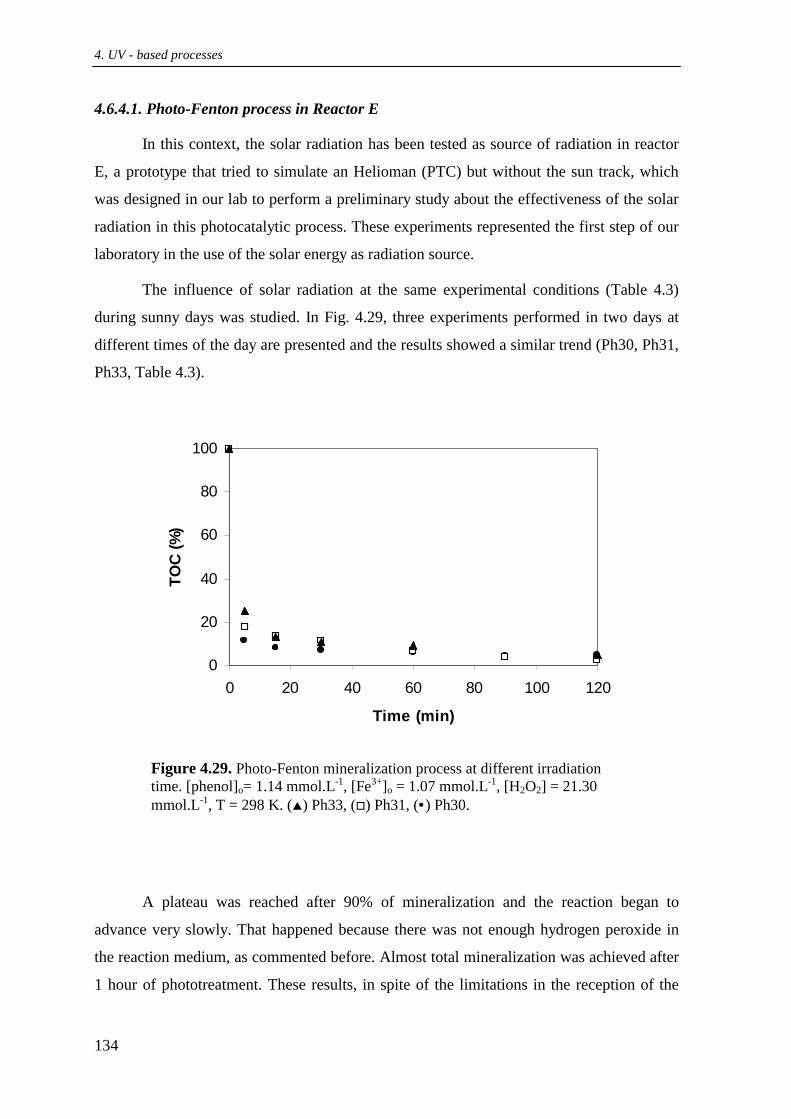
4. UV - based processes
134
4.6.4.1. Photo-Fenton process in Reactor E
In this context, the solar radiation has been tested as source of radiation in reactor
E, a prototype that tried to simulate an Helioman (PTC) but without the sun track, which
was designed in our lab to perform a preliminary study about the effectiveness of the solar
radiation in this photocatalytic process. These experiments represented the first step of our
laboratory in the use of the solar energy as radiation source.
The influence of solar radiation at the same experimental conditions (Table 4.3)
during sunny days was studied. In Fig. 4.29, three experiments performed in two days at
different times of the day are presented and the results showed a similar trend (Ph30, Ph31,
Ph33, Table 4.3).
0
20
40
60
80
100
0 20 40 60 80 100 120
Time (min)
TOC
(%)
Figure 4.29. Photo-Fenton mineralization process at different irradiation time. [phenol]o= 1.14 mmol.L-1, [Fe3+]o = 1.07 mmol.L-1, [H2O2] = 21.30 mmol.L-1, T = 298 K. (!) Ph33, (!) Ph31, (•) Ph30.
A plateau was reached after 90% of mineralization and the reaction began to
advance very slowly. That happened because there was not enough hydrogen peroxide in
the reaction medium, as commented before. Almost total mineralization was achieved after
1 hour of phototreatment. These results, in spite of the limitations in the reception of the

4.6. Results and discussion for phenol
135
radiation of the designed reactor, are a good qualitative demonstration of the effectiveness
of the solar light in the Fenton process.
The optimal concentration of Fe3+ and H2O2 are the key factor of this process and
need to be determined to find out the values at which maximum efficiency is obtained.
Therefore, H2O2 and Fe3+ concentrations were optimized for mineralization of phenol
solution using the reactor E. The experimental conditions determined in this reactor will be
used as reference to operate the CPCs. For this reason, and bearing in mind that it is a
laboratory scale prototype, the solar radiation was not quantified in these preliminary
experiments. Again, mineralization rate is described assuming a first-order kinetics, as
shown in section 4.6.2.2.
4.6.4.1.1. Effect of Fe3+
To further elucidate the role of Fe3+ concentration on the mineralization of the
phenol solution, a series of experiments, varying the concentration of iron and keeping
fixed the other parameters, were carried out. Fig. 4.30 (Ph41, Ph42, and Ph49, Table 4.3)
shows that a high mineralization rate was obtained with 3+Fe concentration in the range
(0.54-1.067 mmol.L-1). In all cases, this concentration of Fe3+ was selected to continue the
phototreatment during ca.60 min and reach around 95% of mineralization by using 21.3
mmol.L-1 of H2O2 concentration. According to these results, the iron concentration
recommended is around 0.5 mmol.L-1. This will contribute to a smaller formation of iron
precipitate, one of the main disadvantages of this process.
4.6.4.1.2. Effect of H2O2
As shown in Fig. 4.31 (Ph41, Ph47 and Ph48, Table 4.3) a significant enhancement
of mineralization efficiency was verified when the H2O2 concentration was increased from
0 to 21.22 mmol.L-1. Mineralization rate increased with H2O2 concentration, which is
explained by the effect of the additional produced HO• radicals. However, above a certain
concentration (21.30 mmol.L-1) the constant rate levels off and sometimes is negatively
affected (as it was the case of the example shown in section 4.6.2.2) by the progressive
increase of the hydrogen peroxide concentration. Therefore, an excess of H2O2 will react
with HO• competing with organic pollutants and consequently reducing the efficiency in

4. UV - based processes
136
the treatment. Again, the continuous line does not mean any fitting, but only a way of
pointing out the trend for the effect of Fe3+ and H2O2 in the mineralization of phenol.
0
0.02
0.04
0.06
0.08
0.1
0.12
0.14
0.16
0 0.5 1 1.5 2 2.5
Fe3+(mmol.L-1)
k obs
(min
-1)
Figure 4.30. The initial rate constant of photo-Fenton mineralization at different Fe3+ concentrations in reactor E. [phenol]o= 1.14 mmol.L-1, [H2O2] = 21.30 mmol.L-1
0
0.05
0.1
0.15
0.2
0.25
0 10 20 30 40 50
H2O2 (mmol.L-1)
k obs
(min
-1)
Figure 4.31. The initial rate constant of photo-Fenton mineralization at different [H2O2] concentration in reactor E. [phenol]o= 1.14 mmol.L-1, [Fe3+] = 1.07 mmol.L-1

4.6. Results and discussion for phenol
137
4.6.4.2. Photo-Fenton process in the CPCs (reactors F and G)
After setting the working conditions (Fe 3+ and H2O2 concentrations) with the lab-
scale parabolic collector (reactor E), some photo-Fenton experiments (Ph50-Ph56, Table
4.4) were also carried out using two CPC collectors at pilot scale, reactors F (100L) and G
(190L), located in Laussane (Switzerland) and in Almería (Spain), respectively. In those
cases, the radiation was quantified and the mineralization was related to the solar energy
consumed. In all the range of 3+Fe concentration tested in reactor E, H2O2 consumption was
very fast. Bearing in mind this fact, a lower concentration of Fe3+ (0.27 mmol.L-1) was also
tested in reactor G.
Firstly, results achieved with reactor G are presented. Fig. 4.32 shows the
mineralization achieved related to accumulate energy per unit of volume (Q) calculated
according to eq. 4.25 described in section 4.4.3.6. Although that a high mineralization rate
was obtained with 3+Fe concentration in the range under study (0.27-1.07 mmol.L-1), the
best results was reached when the minor 3+Fe concentration (0.27 mmol.L-1) was used. In
this case, the mineralization achieved was 100% in 2 hours. In the case of major
concentrations of Fe3+, keeping the H2O2 concentration constant, the mineralization
reached was 94 % and 98% in two hours for 1.07 and 0.54 mmol.L-1 of Fe3+, respectively.
In spite of also getting a high mineralization degree at these iron concentrations, the idea is
to use the smallest amount of iron in order to avoid problems with their necessary
elimination. The European Community directives allow 2 mg L-1 of iron in treated water to
be discharged directly into the environment and 20 mg L-1 to be discharged into municipal
biological treatment plant (EEC, 1992) . Nevertheless, iron could be reutilized after
precipitation like iron hydroxide. The recycling of iron sludge has not only the advantage
of avoiding its disposal but also of saving chemical cost for iron salt. Previous work
showed that the repeated use of iron sludge has no negative consequences on his catalytic
activity (Renner et al., 2000).
In Fig. 4.33 the initial rate constant of the treated phenol solution at different Fe3+
concentration is also shown.

4. UV - based processes
138
0
20
40
60
80
0 1 2 3 4 5 6 7
Q (kJ L-1)
TOC
(mg
L-1)
Figure 4.32. Photo-Fenton mineralization at different Fe3+ concentrations related to accumulated energy per unit volume. [phenol]o= 1.14 mmol.L-1, [H2O2] = 21.30 mmol.L-1.(•) [Fe3+] = 1.067 mmol.L-1, (!) [Fe3+] = 0.54 mmol.L-1, (!) [Fe3+ ]=0.27 mmol.L-1.
0
0.01
0.02
0.03
0.04
0.05
0.06
0.07
0 0.2 0.4 0.6 0.8 1 1.2
Fe3+(mM)
k obs
(min
-1)
Figure 4.33. The initial rate constant of photo-Fenton mineralization of phenol at different Fe3+ concentrations in reactor G. [phenol]o = 1.14 mmol.L-1, [H2O2] = 21.30 mmol.L-1
(mmol.L-1)

4.6. Results and discussion for phenol
139
As it can be seen in this figure, a significant enhancement of mineralization
efficiency was verified when the Fe3+concentration was increased from 0.27 to 0.54
mmol.L-1. Above this concentration, the mineralization rate is insensitive to this effect as
has been already shown in most of the cases under study.
The consumption of H2O2 in these experiments was followed using the iodimetric
titration method. As it can be observed in Fig. 4.34, the hydrogen peroxide consumed
depends on the Fe3+ concentration and it was present in solution until total mineralization
of the carbon content (see Fig. 4.35). In light of these results and those presented in Fig.
4.32, seems that with lower Fe3+ concentration (and then, lower hydroxyl radical
production), hydrogen peroxide is not consumed by reaction with those radicals but only
by reaction with iron and light. The idea is then to consume the peroxide slowly, obtaining
a higher mineralization.
0
20
40
60
80
100
0 20 40 60 80
Time(min)
H 2O
2 co
nsum
ed (%
)
Figure 4.34. Hydrogen peroxide consumed at different Fe3+ concentrations in reactor G. [phenol]o=1.14 mmol.L-1, [H2O2] = 21.30 mmol.L-1. (!) [Fe3+] = 1.067 mmol.L-1, (!) [Fe3+] = 0.54 mmol.L-1, (•) [Fe3+ ] = 0.27 mmol.L-1

4. UV - based processes
140
0
20
40
60
80
100
0 0.5 1 1.5 2 2.5 3
Q (kJ L-1)
TOC
(mg
L-1)
0
20
40
60
80
100
120
H 2O
2 con
sum
ed (%
)
Figure 4.35. Photo-Fenton mineralization and hydrogen peroxide consumed related to accumulated energy per unit volume. [phenol]o = 1.14 mmol.L-1, [Fe3+] = 0.27 mmol.L-1, [H2O2] = 21.30 mmol.L-1
Finally, a comparative study between both CPC reactors (G and F) has also been
made. This part of the study focuses on the comparison of performance of two CPC solar
collectors, with regard to the mineralization of phenol via photo-Fenton process. The same
experimental conditions (same concentration of H2O2 and two concentrations of Fe3+ (0.54
and 1.07 mmol.L-1)) were used in order to evaluate the efficiency of both solar reactors
(see Fig.4.36). A higher TOC reduction (94 and 98 %) is reached in the reactor G in
comparison with the 60% obtained in reactor F. This is an important fact to point up, as
using the same experimental conditions and apparently the same kind of reactors, different
experimental results were achieved showing a dissimilar efficiency. Several factors could
account for this difference. First of all, the recirculation flow rate is three times higher in
the case of reactor G than in reactor F, allowing a better mixing of the solution. Secondly,
the ratio of irradiated volume per total volume is 0.38 and 0.24 for reactors G and F,
respectively. Thus, the effectiveness would be higher for reactor G. And finally, the
presence of oxygen is determinant for mineralization of the target compounds, as was
already demonstrated in section 4.6.2.3. In this sense a high recirculation flow, besides
improving the mixing, allows a better oxygenation of the mixture in the tank and therefore

4.6. Results and discussion for phenol
141
the consumption of H2O2 product of its dissociation according to eq. 4.28 would be
avoided.
0
20
40
60
80
100
0 2 4 6 8 10
Q (kJ L-1)
TOC
(mg
L-1)
Figure 4.36. Evolution of mineralization rate as function of accumulated energy per unit volume in reactors F and G. [phenol]o=1.14 mmol.L-1, [H2O2] = 21.30 mmol.L-1. (!,!)[Fe3+] = 1.067 mmol.L-1, (!,") [Fe3+] = 0.54 mmol.L-1.
Thus, in reactor G the H2O2 consumption was slower and could be used for
hydroxyl radical production, therefore for phenol mineralization. As it can be seen in Fig.
4.36, reaction in system F seems to stop after a 60% of mineralization degree coinciding
with exhaustion of the hydrogen peroxide, while in reactor G the presence of hydrogen
peroxide was detected until total mineralization. These factors should be taken into account
when designing this type of reactors.
Fig. 4.37 shows the linear relation between –Ln(TOC/TOCo) and QUV for the
phenol mineralization in both reactors. In both cases, the kinetics of phenol mineralization
are of apparent first order, with rate constants equal to 4.40 and 0.58 L.kJ-1 for the CPC
located in Almería and the CPC located in Lausanne, respectively.

4. UV - based processes
142
CPC Almeria
CPC Lausanne
0
0.2
0.4
0.6
0.8
1
1.2
1.4
0 0.2 0.4 0.6 0.8 1 1.2
Q (kJ L-1)
-Ln(
TOC/
TOCo
)
Figure 4.37. Linear transform of the kinetic curves of phenol mineralization in CPC reactors. [phenol]o = 1.14 mmol.L-1, [H2O2] = 21.30 mmol.L-1. [Fe3+] = 1.067 mmol.L-1
4.6.4.3. Estimation of intrinsic kinetic constant for photo-Fenton process in reactors D
and G
The estimation of global experimental kinetic constants has been widely performed
in most of the photo-Fenton works by assuming a first order or second order kinetics.
However, in this work it is desired to estimate the individual contribution of both steps, the
dark and illuminated one, on the photo-Fenton system. The estimation of these constants
could be very helpful in the scale-up of these reactors. With this objective in mind, those
intrinsic constants were calculated in two scales: at lab scale in a solarbox (reactor D) and
at pilot plant in the CPC reactor (reactor G), to establish a comparison for this process at
different scale. The following assumptions were made:
- The mineralization kinetics follows a first order (eq. 4.30), being kexp the global
experimental kinetic constant:
TOCexp TOC
d(C ) = - k C
dt (4.30)

4.6. Results and discussion for phenol
143
- Hydroxyl radical production changes according to the two steps present in the
photo-Fenton process. In the dark step they will be produced by reaction (1.10)
described in chapter 1. On the contrary, in the reaction in presence of light the
HO• radicals are produced both by the reaction in the darkness and by reactions
in presence of light (see reactions 1.17 and 1.8). Thus, it is assumed that:
TOCtotal dark total TOC illuminated illuminated TOC
d(C )V = - k V C - k' V C
dt (4.31)
and dividing both sides by the total volume,
TOC illuminateddark illuminated TOC
total
d(C ) V = - k + k' C
dt V
(4.32)
In addition, illuminatedk (intrinsic kinetic constant of the illuminated step) could be
considered non-proportional to the photon flux absorbed per unit volume, in order to
extend its application to any system. Thus, eq. 4.32 can be rewritten as:
TOC abs illuminateddark illuminated TOC
illuminated total
d(C ) W V = - k + k C
dt V V
(4.33)
and
absexp dark illuminated
total
Wk = k + k
V (4.34)
being Wabs the absorbed radiation by the absorbing species in the reaction medium.
From eq. 4.34, killuminated can be calculated according to the following expression:
exp darkilluminated total
abs
k kk V
W−
= (4.35)
Taking into account the complexity in terms of reaction species during
photo-Fenton process, Wabs has been estimated by considering Fe3+ as the main absorbing
species in the reaction medium. It is important to point out that the studied compound
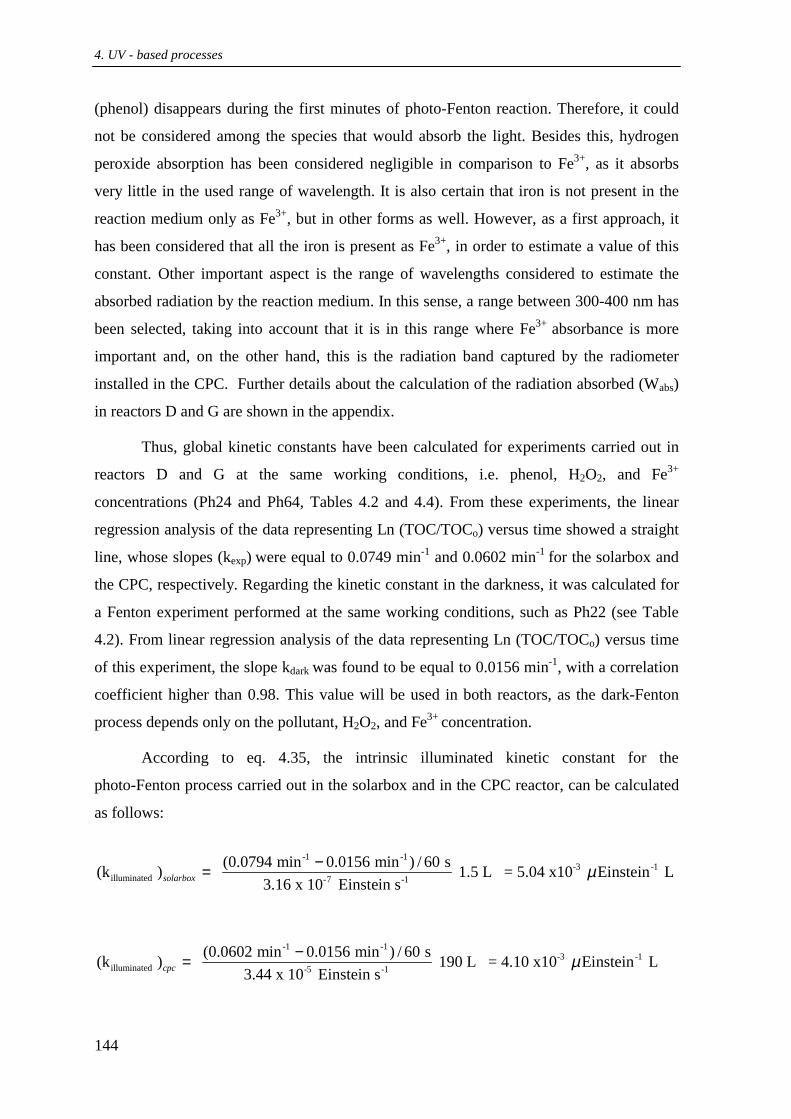
4. UV - based processes
144
(phenol) disappears during the first minutes of photo-Fenton reaction. Therefore, it could
not be considered among the species that would absorb the light. Besides this, hydrogen
peroxide absorption has been considered negligible in comparison to Fe3+, as it absorbs
very little in the used range of wavelength. It is also certain that iron is not present in the
reaction medium only as Fe3+, but in other forms as well. However, as a first approach, it
has been considered that all the iron is present as Fe3+, in order to estimate a value of this
constant. Other important aspect is the range of wavelengths considered to estimate the
absorbed radiation by the reaction medium. In this sense, a range between 300-400 nm has
been selected, taking into account that it is in this range where Fe3+ absorbance is more
important and, on the other hand, this is the radiation band captured by the radiometer
installed in the CPC. Further details about the calculation of the radiation absorbed (Wabs)
in reactors D and G are shown in the appendix.
Thus, global kinetic constants have been calculated for experiments carried out in
reactors D and G at the same working conditions, i.e. phenol, H2O2, and Fe3+
concentrations (Ph24 and Ph64, Tables 4.2 and 4.4). From these experiments, the linear
regression analysis of the data representing Ln (TOC/TOCo) versus time showed a straight
line, whose slopes (kexp) were equal to 0.0749 min-1 and 0.0602 min-1 for the solarbox and
the CPC, respectively. Regarding the kinetic constant in the darkness, it was calculated for
a Fenton experiment performed at the same working conditions, such as Ph22 (see Table
4.2). From linear regression analysis of the data representing Ln (TOC/TOCo) versus time
of this experiment, the slope kdark was found to be equal to 0.0156 min-1, with a correlation
coefficient higher than 0.98. This value will be used in both reactors, as the dark-Fenton
process depends only on the pollutant, H2O2, and Fe3+ concentration.
According to eq. 4.35, the intrinsic illuminated kinetic constant for the
photo-Fenton process carried out in the solarbox and in the CPC reactor, can be calculated
as follows:
-1 -1
-3 -1illuminated -7 -1
(0.0794 min 0.0156 min ) / 60 s(k ) 1.5 L = 5.04 x10 Einstein L3.16 x 10 Einstein ssolarbox µ−=
-1 -1-3 -1
illuminated -5 -1
(0.0602 min 0.0156 min ) / 60 s(k ) 190 L = 4.10 x10 Einstein L3.44 x 10 Einstein scpc µ−=

4.6. Results and discussion for phenol
145
In light of these results, taking into account that the values of intrinsic kinetic
constants calculated for both reactors are very similar (difference is smaller than 20%), it
may be deduced that the assumption that these constants are not proportional to the photon
flux absorbed per volume unit has been corroborated. The values of these intrinsic kinetic
constants are independent of the source of light and therefore they could be used in the
scaling-up of a photo-reactor.
4.6.5. H2O2/UV-vis process
4.6.5.1. H2O2/UV-vis process with artificial light
Some experiments (Table 4.2) were carried out in order to study the effectiveness
of the 2 2H O /UV system in presence of different sources of artificial light. As it has been
aforementioned in the fundamental aspects about this process, the hydrogen peroxide
absorbs very little at wavelengths longer than 300 nm and, although it increases steadily at
shorter wavelengths, its molar absorption coefficient at 254 nm is only 18.7 L mol-1 cm-1
(Carter et al., 2000). For this reason, a low-pressure monochromatic mercury lamp was
used for H2O2 photolysis. However, besides using a monochromatic lamp at 253.7 nm
(reactor B), two lamp were also used: a polychromatic black lamp emitting at 300-400 nm
installed in reactor C and a polychromatic lamp, 300-560 nm, installed in reactor D. As it
can be observed in Fig. 4.38 (Ph10, Ph19, and Ph26, Table 4.1) the high effectiveness of
UV radiation at 253.7 nm (reactor B) is confirmed, as 80% of mineralization was obtained
in two hours.
The degree of mineralization obtained in the cases of reactor C (300-400 nm) and
reactor D (300-560 nm) was 2 and 15 % in 2 hours respectively. These results confirm the
fact that the peroxide absorbs very weakly above 300 nm. It is important to take into
account that in spite of the low percentage (15%) of mineralization obtained when the
solarbox was used, the use of the solar light as radiation source is not completely
discarded, if one keeps in mind that the objective is sometimes only the degradation of the
primary compound. Thus, it could be used as pretreatment step.

4. UV - based processes
146
0
20
40
60
80
100
0 20 40 60 80 100 120
Time (min)
TOC
(%)
Figure 4.38. Effect of different irradiation sources on the mineralization of phenol by means H2O2/UV system. [phenol]o = 1.14 mmol.L-1, [Fe3+] = 1.07 mmol.L-1, [H2O2] = 21.30 mmol.L-1, T = 298 K. (!) Reactor C, (!) Reactor D, (•) Reactor B.
4.6.5.2. H2O2/UV-vis process with solar light
Taking into account the results obtained in the previous section when the solarbox
(reactor D) was used, some experiments (Table 4.3) were carried in reactor E in order to
study the effectiveness of the H2O2/UV-vis system in presence of natural solar light. In
spite of the weak hydrogen peroxide absorbance above 300 nm but considering that in the
reactor E quartz tube has been also used to avoid filtering the little existent solar radiation
in the range of 285-320 nm, a group of experiments at different H2O2 concentrations were
performed. In Fig.4.39 the absorption spectrum of H2O2 and the solar emission spectrum
(ASTM) are represented. Hydrogen peroxide absorption and the solar emission between
300-320 nm have been enlarged in order to be able to observe the H2O2 absorbance even
above 300 nm (see insert in Fig. 4.39).
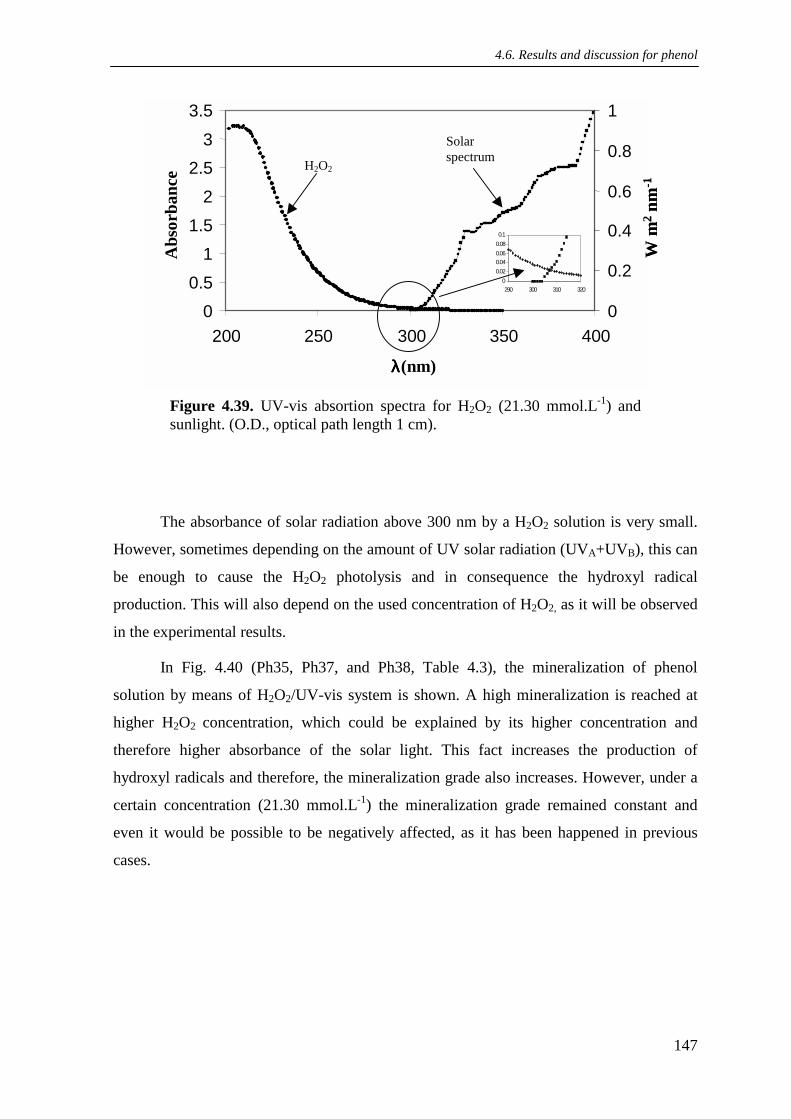
4.6. Results and discussion for phenol
147
00.5
11.5
22.5
33.5
200 250 300 350 400
λλλλ(nm)
Abs
orba
nce
0
0.2
0.4
0.6
0.8
1
W m
2nm
-1
00.020.040.060.080.1
290 300 310 320
00.5
11.5
22.5
33.5
200 250 300 350 400
λλλλ(nm)
Abs
orba
nce
0
0.2
0.4
0.6
0.8
1
W m
2nm
-1
00.020.040.060.080.1
290 300 310 320
Figure 4.39. UV-vis absortion spectra for H2O2 (21.30 mmol.L-1) and sunlight. (O.D., optical path length 1 cm).
The absorbance of solar radiation above 300 nm by a H2O2 solution is very small.
However, sometimes depending on the amount of UV solar radiation (UVA+UVB), this can
be enough to cause the H2O2 photolysis and in consequence the hydroxyl radical
production. This will also depend on the used concentration of H2O2, as it will be observed
in the experimental results.
In Fig. 4.40 (Ph35, Ph37, and Ph38, Table 4.3), the mineralization of phenol
solution by means of H2O2/UV-vis system is shown. A high mineralization is reached at
higher H2O2 concentration, which could be explained by its higher concentration and
therefore higher absorbance of the solar light. This fact increases the production of
hydroxyl radicals and therefore, the mineralization grade also increases. However, under a
certain concentration (21.30 mmol.L-1) the mineralization grade remained constant and
even it would be possible to be negatively affected, as it has been happened in previous
cases.
H2O2
Solar spectrum

4. UV - based processes
148
0
20
40
60
80
100
0 20 40 60 80 100 120
Time (min)
TOC
(%)
Figure 4.40. Effect of H2O2 concentration on the mineralization of phenol by means H2O2/UV-vis system. [phenol]o= 1.14 mmol.L-1, T = 298 K. (•) [H2O2] = 10.66 mmol.L-1, (!) [H2O2] = 21.30 mmol.L-1, (!) [H2O2] = 42.60 mmol.L-1
Although these results are very satisfactory, it is necessary to keep in mind that
probably better ones could be obtained in less time using iron as catalyst. In addition, it is
necessary to remember that this prototype of CP reactor has been made using quartz tube.
However, for industrial and pilot plant scale this kind of tube is not recommended because
its very expensive cost in comparison with Pyrex and PTFE (Teflon) tubes. The quartz
tube is also a type of tube of difficult handling and the easiness of breaking. In Fig. 4.41
UV-vis absorption spectra of quartz and Pyrex tube is shown. With these spectra it is most
clear to see the big influence of the material in this process. The tube of Pyrex almost
filters the whole radiation below 350 nm that is the range where H2O2 would absorb. This
can be confirmed with experiments performed in reactor F, with Pyrex tubes (see Table
4.4) in order to test this treatment method in the CPC solar collector. As it was expected,
Fig. 4.42 shows very poor mineralization rate (10%) in 5 hours of treatment. However, the
degradation rate of phenol was about 90%.

4.6. Results and discussion for phenol
149
λλλλ (nm)
Abs
orba
nce Pyrex
Quartz
200 300 400 500 nm
0.5
1.0
1.5
2.0
2.5
3.0
Figure 4.41. UV-vis absorption spectra of quartz and Pyrex tubes. (O.D., optical path length 1 cm)
0
20
40
60
80
100
0 50 100 150 200 250 300
Time (min)
TOC
(%)
0
20
40
60
80
100
C/C
o (%
)
Figure 4.42. Effect of solar irradiation on the mineralization and degradation of phenol by means H2O2/UV-vis system in reactor F [phenol]o = 1.14 mmol.L-1, [H2O2] = 21.30 mmol.L-1. (!) Mineralization (%), (! ) Degradation (%)

4. UV - based processes
150
Thus, even at unfavorable conditions, a high degradation rate was obtained. It is important
to stand out that this degradation is achieved when only 10 % of H2O2 was consumed. This
means that hydrogen peroxide photolysis did not happen and therefore this is the reason for
which those poor results were obtained.
4.6.6. Fe3+/UV-vis process
4.6.6.1. Fe3+/UV-vis process with artificial light
This process has been proposed as an alternative to the use of photo-Fenton
process, taking into account that hydroxyl radicals can be produced according to eq.1.18 in
a more economical way, since it is not necessary the use of H2O2. In this sense, some
experiments to study the influence of different sources of light in presence of Fe3+ in the
mineralization of phenol in aqueous solution were performed. Fig. 4.43 shows the effect
of the different types of light: UV 254 nm (reactor B), UV 360 nm (reactor C), and Xenon
light (solarbox) 300-560 nm (reactor D) on the mineralization of phenol solutions by
means of the Fe3+/UV-vis system. The experimental conditions correspond to experiments
Ph7, Ph20 and Ph28 (see Table 4.2).
50
60
70
80
90
100
0 20 40 60 80 100 120
Time (min)
TOC
(%)
Figure 4.43. Mineralization of phenol solution by means Fe3+/UV-vis artificial light process. [phenol]o = 1.14 mmol.L-1, [Fe3+] = 1.07 mmol.L-1, 298K. (•) Reactor C, (!) Reactor D, (!) Reactor B

4.6. Results and discussion for phenol
151
The degree of mineralization obtained was 0, 7 and 12 % in reactor D, C and B,
respectively, after 120 minutes of treatment. Results from experiments carried out in
reactor C could be considered surprising, taking into account that iron absorbs strongly in
this band of emission of the lamp used by this reactor where the iron absorbs strongly.
However, these results are in agreement with the photon-flux entering the reactor, which in
this case was smaller as the nominal power of the lamp was also lower (4W). On the
contrary, in the other reactors the mineralization reached was 7 and 12 % in reactor D and
B in two hours, respectively. This means that the Fe3+/UV-vis process is not very effective
if the objective is to obtain the mineralization of phenol solution at the tested conditions.
For this reason, the degradation of phenol was also followed by HPLC (Ph7) and 50 % of
phenol was eliminated in 2 hours. These values are comparable to those obtained by other
research groups with other organic compounds, mainly taking into account that the time of
treatment is relatively short (Brand et al., 1997; Mazellier and Bolte, 1997). This leaves
open the possibility to use this method when the objective is the elimination of the initial
compound in order e.g. to increase its biodegradability.
4.6.6.2. Fe3+/UV-vis process with solar light
Some experiments (Ph38, Ph39, and Ph43, Table 4.3) were carried out in order to
study the effectiveness of the Fe3+/UVvis system in reactor E using sunlight. When the
pollutant does not absorb the solar light, photo-induced degradation processes appear to be
of considerable interest. It is just the case of phenol, as it can be seen in Fig. 4.44. As
shown in this figure, phenol presents a UV absorption spectrum with a maximum at 270
nm. No absorption is present above 300 nm. It is worth noting that under this experimental
condition, no mineralization of phenol solution was observed when the irradiation was
carried out in the absence of Fe3+ (see section 4.6.1, direct photolysis).
In Fig. 4.45 (Ph38, and Ph39, Table 4.3) the mineralization of phenol solution at
different concentrations of Fe3+ are presented. The achieved mineralization was close to
10%. Although these results do not represent an important mineralization degree, they
come to confirm the higher effectiveness of the treatment process related to direct
photolysis. In these experiments the degradation rate of phenol was not followed.
However, taking as references the previous results it is possible to affirm that the
degradation of phenol should be close to 50 % in 2 hours (see section 4.6.6.1). For

4. UV - based processes
152
prolonged irradiation time, it could be expected to get a major mineralization and therefore
a higher degradation of phenol. In this figure it is also observed that for both Fe3+
concentration (1.067 and 2.16 mmol.L-1) the same mineralization rate was reached.
Figure 4.44. UV-vis absorption spectra of phenol (1.5 x 10⁻⁴ mol.L-1) and sunlight (O.D.=1 cm)
50
60
70
80
90
100
0 30 60 90 120 150 180
Time (min)
TOC
(%)
Figure 4.45. Mineralization of phenol solution by means Fe3+/UV-vis solar light process in reactor E. [phenol]o= 1.14 mmol.L-1, (!) [Fe3+] = 1.07 mmol.L-1, (!) [Fe3+] = 2.15 mmol.L-1
0
0.2
0.4
0.6
0.8
150 200 250 300 350 400
λλλλ (nm)
Abs
orba
nce
0
0.2
0.4
0.6
0.8
1
Wm
2 nm
-1
0
0.2
0.4
0.6
0.8
150 200 250 300 350 400
λλλλ (nm)
Abs
orba
nce
0
0.2
0.4
0.6
0.8
1
Wm
2 nm
-1
0
0.2
0.4
0.6
0.8
150 200 250 300 350 400
λλλλ (nm)
Abs
orba
nce
0
0.2
0.4
0.6
0.8
1
Wm
2 nm
-1
Phenol Solar spectrum

4.6. Results and discussion for phenol
153
4.6.7. Summary of results with phenol solutions
Due to the diversity of obtained results in previous sections, the more relevant of
them are presented in Table 4.8. The three studied processes and some experimental
conditions taking into account the used reactor are shown with a brief comment for each
one.
Table 4.8. Summary of phenol results
Process Reactor Source of light (nm)
Studied parameters
Maximum TOC removal
(%) Figures Comments
Direct photolysis
B C D E
254 300-400 300-520 Sunlight
Effect of incident light
12 Negligible Negligible Negligible
4.21
It is not recommended for phenol treatment
Photo Fenton
B C D E F G
254 300-400 300-520 Sunlight Sunlight Sunlight
Effect of incident light [H2O2],[Fe3+] [Fe2+], [O2]
100 80 60 100 60 98
4.22
4.29 4.32 4.36
It is a very effective treatment method. Sunlight represents a very good alternative source of light.
Photo Fenton
+ O2 B 254 Effect of O2
content 80 (bubbling O2) 24 (without O2)
4.26 A marked difference is observed when O2 is bubbling.
Fenton +
UV
B
254 Fenton
combined with UV
90
4.27
Photo-Fenton process could be carried out in two steps.
H2O2/UV
B C D E
254 300-400 300-520 Sunlight
Effect of incident light
[H2O2]
80 Negligible
15 90
4.38
4.40
Very efficient at UV (254). Good results with sunlight but using quartz tube.
Fe3+/UV
B C D E
254 300-400 300-520 Sunlight
Effect of incident light
[Fe3+]
12 Negligible
7 10
4.43
4.45
It is recommended for phenol degradation but no for mineralization.

4. UV - based processes
154
4.7. Results and discussion for NB mineralization
The influence of different sources of light in the mineralization of NB was also
studied. However, some parameters that have been widely studied for phenol
mineralization were not studied for NB, as it was considered that the effect that they have
on the mineralization rate of this compound should be the same. NB experiments were
performed with the fundamental objective of applying the processes (direct photolysis,
photo-Fenton, H2O2/UV and Fe3+) before described on another compound with a marked
difference in terms of light absorption. Taking into account that NB is an aromatic
compound that absorbs the light, results obtained by the combined processes used will be
shown in comparison with direct photolysis.
In Fig. 4.46 the absorption spectra of phenol and NB are shown. The peaks of NB
and phenol maximum absorption are reached at 263 and 273 nm, respectively. These
spectra have been carried out at the same concentration (15 mg.L-1) and the absorption
properties of these compounds are certainly different. Therefore, it is reasonable to
presume that their behavior in presence of light should be different.
0
2
4
6
8
10
12
14
150 200 250 300 350 400
Wavelength (nm)
Abs
orba
nce
Figure 4.46. UV absorption spectra of phenol and NB (1.5 x 10⁻⁴ mol.L-1) (O.D.=1 cm)
Nitrobenzene
Phenol

4.7. Results and discussion for NB
155
4.7.1. Direct photolysis of NB by means of artificial and solar radiation.
Several experiments (NB1, NB9, NB12, NB17, NB34, and NB35, Tables 4.5 and
4.6) to study the effectiveness of direct photolysis in the mineralization of NB were carried
out. Fig. 4.47 (NB1, NB12, and NB17) shows the effect of three different types of light:
UV 254 nm (reactor B), UV-vis 300-520 nm (reactor D) and solar light (reactor E).
0
20
40
60
80
100
0 20 40 60 80 100 120
Time (min)
TOC
(%)
Figure 4.47. Effect of direct photolysis on the mineralization of NB. [NB]o= 1.14 mmol.L-1. (!) Reactor B, (!) Reactor D, (•) Reactor E
By direct illumination of the aqueous solutions, organic radicals are generated for
the photolysis of the substrates. These radical intermediates are subsequently trapped by
dissolved molecular oxygen and lead, via peroxyl radicals (ROO·), to an enhancement of
the overall degradation process. Moreover, the absorption spectrum of the aqueous
solutions of NB extends into the lower-energetic UV region of the solar spectrum (UV-A,
see Fig. 4.46). Since the parameter µ (see appendix, Table A.6) is directly proportional to
the absorption characteristics, NB is able to perform a remarkable absorption of photons up
to 400 nm. It is obvious that even high wavelengths ( > 250 nm) contribute to the total
absorption of NB in a notable manner. Consequently, photoalteration processes of the NB
molecules can occur. This fact could help to explain the high effectiveness of direct

4. UV - based processes
156
photolysis in the mineralization of NB solutions. In Table 4.9 the obtained results for direct
photolysis are summarized.
Table 4.9. Mineralization of NB by means of direct photolysis after 2 hours of irradiation
Irradiation Source
UV (253.7 nm) Gemicide lamp
(15W)
UV(300-560nm) Xenon lamp
(1500W)
UV-vis Sunlight
Mineralization (TOC %) 54 60 73
The best results were reached in a parabolic collector (reactor E). As the
dimensions of the reactor used in the solarbox (reactor D) and in the solar experiments
(reactor E) are the same, and the radiation spectrum was similar, it is possible to compare
the results of the solarbox and the solar light. TOC reduction was greater in the solar
reactor, because the absorbed photon flow per unit of reaction volume was higher.
0
20
40
60
80
100
0 20 40 60 80 100 120
Time (min)
TOC
(%)
Figure 4.48. Effect of direct photolysis on the mineralization of NB in reactor E. [NB]o = 1.14 mmol.L-1. (!) NB 34, (∆) NB 35, (•) NB 17

4.7. Results and discussion for NB
157
In order to assure about these results, photolysis experiments in reactor E were
made in triplicate at different dates and different time of the day (NB 17, NB 34, and
NB 35, Table 4.6). Fig. 4.48 shows that the mineralization rate in all these cases had a
similar tendency. The mineralization degree achieved in these experiments was around 70
% in 2 hours. This fact would confirm that direct photolysis of NB by means of the use of
solar light is an effective method for its elimination from aqueous solution.
4.7.2. Photo-Fenton process in presence of artificial and sunlight
The effectiveness of the photo-Fenton as treatment process has been already shown.
As it can be observed in Fig. 4.49 a very high degree of TOC reduction (nearly 96%) is
obtained in the solar reactor in only 40 minutes of irradiation, when the initial
concentrations of Fe3+ and H2O2 were 1.067 mmol.L-1 and 21.3 mmol.L-1. For long
irradiation times, the best results were obtained when using sunlight, but the differences in
TOC reduction are very small when compared to UV radiation (254 nm). However,
especially at initial times, solar light (80% TOC reduction in 20 minutes) is more effective
than UV light (50% TOC reduction in 20 minutes). This behavior can be explained by the
fact that Fe3+ is converted to Fe(OH)2+ in aqueous solution. This complex absorbs notably
in the range above 300 nm, which leads to a remarkable production of hydroxyl radicals
according to eq. 1.18. In spite of the good obtained results when direct photolysis was
used, by means of the photo-Fenton process 100% of mineralization rate could be reach in
less than one hour. It has to be taken into account, though, that H2O2 needs to be used,
therefore increasing the treatment costs.
In the same way that in the case of phenol, the key parameters in the
photo-treatment of NB were determined. In this sense, optimum values for H2O2 and Fe3+
were found and they were 21.3 and 0.54 mmol.L-1, respectively. In the case of H2O2, the
mineralization rate was negatively affected by the progressive increase of H2O2 up to 21.3
mmol.L-1.

4. UV - based processes
158
0
20
40
60
80
100
0 20 40 60 80 100 120Time (min)
TOC
(%)
Figure 4.49. Photo-Fenton mineralization of NB using different sources of light. [NB]o = 1.14 mmol.L-1, [Fe3+]o = 1.07 mmol.L-1, [H2O2] = 21.30 mmol.L-1, (!) Reactor D, (•) Reactor B,(!) Reactor E
4.7.3. H2O2/UV-vis artificial and solar light process
Some experiments (NB3, NB10, NB15, NB24, and NB25, Tables 4.5 and 4.6) were
carried out in order to study the effectiveness of H2O2/UV-vis in presence of different
sources of light in the mineralization of NB in aqueous solution. In Fig. 4.50 the effect of
direct photolysis and H2O2/UV processes on the mineralization of NB are represented
(NB3 and NB1, Table 4.5).
Both experiments were made in reactor B with UV lamps at 253.7 nm. As it has
been already demonstrated, the H2O2/UV system at this wavelength showed a high
effectiveness in the mineralization of phenol solution. However, in the case of NB, the
obtained mineralization by means of this process is only 30 %, whereas by direct
photolysis it was higher than 50 %. This means that an inhibition effect took place by the
competition for the impacting photons between H2O2 and NB, that is a very strong light
absorbent. In this concrete case, it is very clear that the presence of H2O2 in the reaction
medium is unfavorable to the mineralization rate.

4.7. Results and discussion for NB
159
0
20
40
60
80
100
0 20 40 60 80 100 120
Time (min)
TOC
(%)
Figure 4.50. Effect of direct photolysis and H2O2-UV system on the mineralization rate of NB in reactor B. [NB]o= 1.14 mmol.L-1 [H2O2] = 21.30 mmol.L-1. (!) H2O2/UV system, (!) direct photolysis
0
20
40
60
80
100
0 20 40 60 80 100 120
Time (min)
TOC
(%)
Figure 4.51. Effect of direct photolysis and H2O2-UV-vis system on the mineralization rate of NB in reactor E. [NB]o= 1.14 mmol.L-1 [H2O2] = 21.30 mmol.L-1. (!) H2O2/UV system, (!) direct photolysis.
4. UV - based processes
160
This study was also made using solar light (see Fig. 4.51). Although hydrogen
peroxide does not show good absorption properties in the UV-vis range, total absorption is
remarkable due to the relatively high amounts of H2O2 in the solution, which results in a
kind of competition as it has already been pointed out in the previous case. Therefore, an
inhibition effect is also observed but in this case it showed to be more important in the first
reaction step. At the end, the mineralization rates of photolysis and H2O2-UV-vis system
achieved were similar.
4.7.4. Fe3+/UV-vis artificial and solar light process
Experiments were performed using artificial and sunlight in order to test the
effectiveness of iron photo-assisted process in the mineralization of NB in aqueous
solution (NB2, NB11, NB14, NB23, and NB26, Tables 4.5 and 4.6). In Fig. 4.52 the effect
of direct photolysis and Fe3+/UV processes on the mineralization of NB are represented
(NB1 and NB2, Table 4.5). Both experiments were carried out in reactor B with UV lamps
at 253.7 nm. The results indicated that within 2 h, the mineralization of NB was 30 and
56% by means of iron photo-assisted process and direct photolyis, respectively. This
means that the presence of iron in the medium acts as inhibitor of the reaction. These
results are not surprising since this process is recommended for the case of pollutants that
do not absorb the light, like phenol. As in the case of the UV/H2O2 system, an inhibition
effect took place by the competition for the impacting photons between Fe3+ and NB.
In the case of sunlight, this inhibition effect was much less important, as it can be
observed in Fig. 4.53.
These results come to confirm that the iron photo-assisted process works well in
presence of compounds that do not absorb the light, in such a way that is better to carry out
the treatment via direct photolysis.

4.7. Results and discussion for NB
161
0
20
40
60
80
100
0 20 40 60 80 100 120
Time (min)
TOC
(%)
Figure 4.52. Effect of direct photolysis and Fe3+/UV system on the mineralization rate of NB in reactor B. [NB]o = 1.14 mol.L 1 [Fe3+] = 1.07 mmol.L-1. (!) Fe3+/UV system, (!) direct photolysis
0
20
40
60
80
100
0 20 40 60 80 100 120
Time (min)
TOC
(%)
Figure 4.53. Effect of direct photolysis and Fe3+/UV-vis system on the mineralization rate of NB in reactor E. [NB]o= 1.14 mmol.L-1. [Fe3+] = 1.07 mmol.L-1. (!) Fe3+/UV system, (!) direct photolysis.

4. UV - based processes
162
4.7.5 Summary of results with NB solutions
In Table 4.10, the main experimental results for NB treatment by means direct
photolysis, photo-Fenton, H2O2/UV-vis, and Fe3+/UV-vis are summarized. All the studied
processes and some experimental conditions taking into account the used reactor are shown
making a brief comment for each one.
Table 4.10. Summary of NB results
Process Reactor Source of light (nm)
Studied parameters
Maximum TOC
removal (%) Figures Comments
Direct photolysis
B D E
254 300-520 Sunlight
Effect of incident light
54 60 70
4.47 It could be recommended for NB treatment.
Photo Fenton
B D E
254 300-520 Sunlight
Effect of incident light [H2O2],[Fe3+]
90 70 96
4.49 It is very effective. Sunlight is a very good alternative source of light.
H2O2/UV B E
254 Sunlight
Effect of incident light
[H2O2]
30 70
4.50 4.51
Good results with sunlight but using quartz tube.
Fe3+/UV B E
254 Sunlight
Effect of incident light
[Fe3+]
30 70
4.52 4.53
It is not recommended for NB treatment.
4.8.Comparison of the results for phenol and NB mineralization
In this section a comparison between the results obtained for mineralization of
phenol and NB in aqueous solution by means of direct photolysis and photo-Fenton is
presented. In order to avoid recurrences, H2O2/UV-vis and Fe3+/UV-vis were not compared
by considering that their differences would be marked by the light absorption properties of
each compound and the presence of donating/acceptor groups in each molecule, thus these
parameters are analyzed only in the cases of direct photolysis and photo-Fenton process. It

4.8. Comparison of results
163
is important to stand out that this comparison was made taking into account the treatment
process and the irradiation source used. In this sense, a group of experiments have been
selected to show clearly the influence of the treated compounds in the obtained results.
4.8.1. Direct photolysis
Fig. 4.54 shows the effect of three different types of light: UV 254 nm (reactor B),
UV-vis 300-520 nm (reactor D) and solar light (reactor E) in the mineralization rate of
phenol and NB.
0
20
40
60
80
100
0 20 40 60 80 100 120
Time (min)
TOC
(%)
Figure 4.54. Effect of direct photolysis on the mineralization of phenol and NB. [phenol] = 1.14 mmol.L-1, [NB]o= 1.14 mmol.L 1, [phenol] = (∆,!,◊); [NB] = (!,+,♦ ). (",!) Reactor E, (+,!) Reactor D, (◊,♦ ) Reactor B.
While for phenol the maximum mineralization degree for the different irradiation
sources used was 12 %, for NB it was 70%. This difference is closely related with what
already commented, i.e. the capacity of NB to absorb the light (see Fig. 4.54). Therefore, in
all the processes where the radiation is used, it is necessary to know the behavior of the
treated compounds in presence of light. That will give an idea of the contribution of direct
photolysis in the photochemical process selected as alternative in the treatment of organic
compounds.

4. UV - based processes
164
4.8.2. Photo-Fenton
As it has been commented before, this treatment process is very effective in the
treatment of organic compounds. In Fig. 4.55 the mineralization rates by means of photo-
Fenton process in reactor B (254 nm) are presented. In the case of phenol, total
mineralization (100%) was reached in 40 minutes and 90 % for NB in 1 h.
0
20
40
60
80
100
0 10 20 30 40 50 60
Time (min)
TOC
(%)
Figure 4.55. Photo-Fenton mineralization of phenol and NB in reactor B. [phenol] = 1.14 mmol.L-1, [NB]o = 1.14 mmol.L-1, [Fe3+]o = 1.07 mmol.L-1, [H2O2] = 21.30 mmol.L-1.[phenol] = ("); [NB] = (!)
The difference in the kinetics of mineralization of both compounds could be
explained taking into account that the main pathway of the degradation of organic
compounds is based on hydroxyl radical attack (generated by means of the photo-Fenton
process or by hydrolysis of hydrogen peroxide in presence of UV), which is an
electrophilic substitution. Therefore, the effectiveness of a given treatment process depends
strongly on the nature of the substrate. In this sense, as it has been already commented in
section 3.2.4, in the case of phenol the OH, electro-donating substituent, favors the
electrophilic substitution by HO• radical. On the contrary, in the case of NB, the presence
of NO2, electron-accepting substituent, is unfavorable for the eletrophilic substitution.
Thus, the HO• radicals produced by means of photo-Fenton process would attack more

4.8. Comparison of results
165
easily phenol than NB. Besides this, in presence of UV (254 nm) NB competes with H2O2
for the absorption of radiation, therefore the contribution of radicals by means of this
reaction would be smaller.
When sunlight was used, the difference in the kinetics of mineralization between
phenol and NB by means of photo-Fenton process was much smaller (see Fig. 4.56).
0
20
40
60
80
100
0 20 40 60 80 100 120
Time (min)
TOC
(%)
Figure 4.56. Photo-Fenton mineralization ofphenol and NB in reactor E. [phenol]= 1.14 mmol.L-1, [NB]o= 1.14 mmol.L-1, [Fe3+]o =1.07 mmol.L-1, [H2O2] = 21.99 mmol.L-1,[phenol] = (∆); [NB] = (!)
The weak H2O2 absorbance within the solar spectrum could account for this,
implying that there will not be competition of hydrogen peroxide with NB for the photons
entering the reactor and therefore, the direct photolysis of NB is favored. Furthermore, at
these wavelengths the improvement by the higher absorption of the iron present contributes
to a higher production of hydroxyl radicals, thus kinetics of both NB and phenol is faster in
presence of solar light than with 254-UV radiation.

5. Biodegradability enhancement of DCDE in aqueous
solution by means of H2O2 /UV process


5.1. Introduction
169
5.1. Introduction
As it has been already mentioned in the general introduction of this thesis, the
objective of this chapter is to examine the effectiveness of H2O2/UV system in the
biodegradability enhancement of dichlorodiethyl ether (DCDE). The fundaments about
H2O2/UV process were described extensively in chapter 4. DCDE is a non-biodegradable
compound (Lewis, 1991; Kaludjerski, 2001) widely used as a solvent throughout the
world, and it has been regulated in the USA as a “priority and toxic pollutant” due to its
mutagenicity and probable carcinogenecity at a risk level of 0.3 µgr.day-1 (Fisher, 2000).
The pre-oxidation of recalcitrant organic compounds combined with biological
oxidation is a real challenge in order to achieve a widely use of the advanced oxidation
processes that are normally limited by the high costs required for its application. In this
sense, all the studies directed in this field are of a lot of interest. For this reason, and
keeping in mind the effectiveness of the methods that have been used for the treatment of
organic compounds (phenol and NB) in chapter 4, the H2O2/UV process has been selected
as pre-oxidation method of DCDE.
The goal of the study was not to chemically oxidize all organic matter to CO2 and
H2O, but rather to convert DCDE into products that are readily biodegradable in
conventional biological treatment plants. Coupling chemical oxidation and biological
process may allow the removal of the target pollutants by using minimum amounts of
usually expensive chemical oxidants, followed by a relatively inexpensive, and often
already existing biological process, such as activated sludge (Scott and Ollis, 1995;
Pulgarin et al., 1999, Parra et al, 2000).
The biodegradability of untreated and treated solutions of recalcitrant compounds
has been traditionally measured by the Biological Oxygen Demand (BOD) in which a
fraction of the solution is diluted by distilled water, and then subjected to a five days test,
during which oxygen is consumed by the seed microorganisms. The extent of oxygen
uptake within this period was used to evaluate the biodegradability of the compound.
Obviously, possible toxicity of the parent compound or the oxidation intermediates to the
microorganisms could not be assessed properly because of extensive dilutions.
Furthermore, very few of the earlier studies provided rate information on the
biodegradation of the oxidation products. Hence, the need for development of a

5. Biodegradability enhancement of DCDE
170
methodology that can provide fundamental information and better insight into the process
of integrated chemical oxidation/biodegradation is clear.
This research attempted to provide this methodology first by oxidizing the model
chemical, DCDE, at various levels, and then subjecting the solutions preoxidized at
inhibition respiration test and different levels to three different biodegradability tests using
activated sludge culture.
The inhibition respiration rate caused by DCDE and its oxidation byproducts was
assessed by respirometric test by measuring the oxygen consumption described in
experimental section. The rate and extent of biodegradability of the oxidized DCDE
solutions was also assessed by short-term and long-term respirometric tests and/or carbon
dioxide production as a function of time. The extent of organic matter mineralization
during biodegradation was measured through a third test (mid-term) over a 6-hour period
by monitoring the COD and TOC of the test solutions. Furthermore, in this study, the
responses of acclimated and non-acclimated cultures to non-oxidized DCDE were
compared.
5.2. Experimental
5.2.1. Reagents
Table 5.1 shows all the reagents used in the experimentation. All were analytical
grade and were used as received.
Table 5.1. List of chemicals used
Compound Formula Vendor Purity Acetic acid CH3COOH J.T.Baker 99.6% Ammonium chloride NH4Cl Mallinckrodt 99.99%
Boric acid H3BO3 EM Science 99.5% Butyric acid C3H7COOH Alfa Aesar 99% Calcium chloride CaCl2 Aldrich 98% Catalase - Sigma 2,390 units/mg Dibasic potassium phosphate K2HPO4 J.T.Baker 100.4%
Dichlorodiethyl ether DCDE Sigma-Aldrich 99%
Ethanol C2H6OH Aldrich 99.5%

5.2. Experimental
171
Compound Formula Vendor Purity Ferric chloride FeCl3 Aldrich 97% Glucose C6H12O6 Aldrich 100% Glutamic acid, monosodium salt
C5H8NO4Na x H20 Acros 99%
Hydrogen peroxide H2O2 Aldrich 30 wt.% Magnesium sulfate MgSO4 Aldrich 99% Manganese sulfate monohydrate MnSO4 · H2O Aldrich 98%
Monobasic sodium phosphate NaH2PO4 Aldrich 99%
Monobasic potassium phosphate
KH2PO4 Acros 99%
Potassium chloride KCl Aldrich 99% Potassium dichromate K2Cr2O7 Mallinckrodt 99.9%
Potassium hydrogen phthalate
2-(HO2C) C6H4CO2K Mallinckrodt 99.95%
Propionic acid CH3CH2CO2H Alfa Aesar 99% Silver sulfate Ag2SO4 Mallinckrodt 99.95% Sodium hydroxide NaOH J.T. Baker 98.7% Sodium chloride NaCl Fisher 99.9% Sulfuric acid H2SO4 J.T. Baker 96.4% Zinc sulfate ZnSO4 J.T. Baker 100.7
5.2.2. Experimental device and procedure for chemical oxidation experiments
The UV/H2O2 oxidation studies were conducted in an installation based on a 4 L
quartz reaction vessel. The circulation of solution by using a peristaltic pump ensures the
mixing. The rate of circulation was set at 200 mL.min-1. The cylindrical quartz reaction
vessel (diameter of 140 mm and a height of 260 mm) was placed inside a Rayonet
Photochemical Reactor (see Fig. 5.1, reactor H), equipped with 8 low-pressure mercury
vapor UV (253.7 nm) lamps surrounding the reaction vessel. For each test, the reaction
vessel was filled with three liters of DCDE solution (200 mg.L-1), connected to the
circulating pump and exposed to UV light. Before the experiments were carried out,
actinometry experiments based on the photochemical decomposition of H2O2 were
performed. Decomposition of H2O2 was measured by gas chomatography at various
irradiation times to calculate the power of the lamps. The total flux of radiation entering to
the reactor was 5.37 x 10⁻⁶ µEinstein.s-1.

5. Biodegradability enhancement of DCDE
172
Figure 5.1. Reactor H
Samples from the reaction vessel were withdrawn for analysis utilizing the
three-way control valve on the Teflon circulation tubing. Catalase was used to quench any
remaining H2O2 prior to the biodegradability studies. Specific levels of oxidation were
achieved by determining the H2O2 addition and UV exposure time required to bring DCDE
down to the concentration that corresponded to the desired level of oxidation.
5.2.3. Biological reactors
Heterogeneous microbial populations used in this study were grown in the
laboratory in two 5 L stirrer tank reactors, both operated in semi-batch mode (see Fig. 5.2).
The original biomass was obtained from the return line of the activated sludge reactor
(RAS) in the North City Reclamation Plant, San Diego, CA. The mixed liquor suspended
solid concentration in the reactor (MLSS) was adjusted to and maintained at 3,200 mg.L-1.
The biomass was fed with a mixture of filtered primary effluent and chemical oxygen
demand (COD) supplement solution to adjust the strength of the feed to 1,500 mg.L-1 as
COD. The COD supplement solution was prepared using the modified recipe of Henze
(1992) and this solution contained per liter of distilled water:

5.2. Experimental
173
• 2.5 mL acetic acid
• 2.5 mL butyric acid
• 2.0 mL propionic acid
• 1.0 mL ethanol
• 3.75 g glucose
• 5.0 g glutamic acid monosodium salt
• 80 g dibasic potassium phosphate
• 40 g monobasic potassium phosphate
The primary effluent was collected once a week from the same plant, and the COD
supplement solution was prepared in the laboratory. The mixture of filtered primary
effluent and COD supplement solution was added to the reactors daily at a volume of 4
liters.
Figure 5.2. Biological reactors. B: Non-acclimated culture; A: Acclimated culture
Upon arrival at the San Diego State University (SDSU) laboratories, the primary
effluent was filtered through a high porosity filter paper and then through a glass-fiber
filter paper with a pore size of 0.45 μm. The filtrate was refrigerated to slow down the

5. Biodegradability enhancement of DCDE
174
biodegradation of the organic compounds. Prior to its use, the COD concentration of the
primary effluent was measured by the Closed Reflux, Colorimetric method (Standard
Methods, 1995). The strength of the feed was adjusted to 1,500 mg.L-1 as COD by mixing
a predetermined amount of primary effluent with the predetermined amount of the COD
supplement solution. Twice daily, 2 L of the supernatant were withdrawn from the
reactors to maintain the desired liquid and solid residence times. The operating parameters
of the reactors consisted of sludge residence time of 5 days, food to microorganisms ratio
(F/M ratio) of 0.375 day-1 and a hydraulic residence time (HRT) of 1.25 days. The reactors
were aerated with compressed air (1 Lmin-1), which maintained about 4 mg.L-1 of
dissolved oxygen at ambient temperature (22°C ± 2). Once a week, one liter from each
reactor was replaced by fresh RAS from the same plant in order to maintain a diverse
microbial community. Prior to experimentation, non-acclimated cultures were grown in
our laboratories for at least 2 weeks. Also, in order to acclimate the microorganisms, one
of the two reactors was fed with 0.4 mg.L-1 of DCDE in addition to the mixture of the
primary effluent and the COD supplement solution for at least 4 weeks before the
experiments were conducted.
5.2.4. Biomass harvesting
A standardized biomass harvesting protocol was used for each experiment. One
liter of the biomass was withdrawn from the reactors and the biomass was harvested by
centrifugation at 3,500 rpm for 15 minutes. Supernatant was discarded and the solids were
resuspended in one liter of mineral salt solution (MSS). Ten milliliters of the suspension
were filtered through a glass fiber filter; after the filter was dried for two hours at 105
degrees Celsius, suspended solid concentration was determined. The mineral salt solution
was used to avoid osmotic shock to the microorganisms and it contained per liter of
distilled water:
• 20 mg ammonium chloride
• 0.03 mg ammonium molybdate
• 0.06 mg boric acid
• 27.5 mg calcium chloride
• 86 mg dibasic potassium phosphate
• 217.5 mg monobasic potassium phosphate
5.2. Experimental
175
• 26.2 mg monobasic sodium phosphate
• 0.25 mg ferric chloride
• 22.5 mg magnesium sulfate
• 0.04 mg manganese sulfate
• 0.04 mg zinc sulfate
The biomass concentration was adjusted with MSS to yield 2000 mg.L-1 as MLSS.
5.2.5. Experimental device and procedure for inhibition study
A modified version of the Organization of Economic Cooperation (OECD) Method
209 (OECD, 1981) was used to monitor respiration rates and quantify inhibition caused by
DCDE and its oxidation byproducts. Six samples were poured into biological oxygen
demand (BOD) bottles and continuously stirred with Teflon- coated magnetic stir bars.
Dissolved oxygen (DO) probes (Orion, Model #97-08) were fitted securely with plastic
inserts through the openings of the BOD bottles so no air could enter or escape. The plastic
inserts came with the DO probe equipment and they are designed specifically to fit the DO
probe and a standard BOD bottle (see Fig 5.3). Cables from the DO probes led to a data
acquisition board (IO Tech, Model DynaRes-8U) that transferred data for dissolved oxygen
concentrations to a personal computer. Prior to each experiment, DO probes were
calibrated at their zero point and for air concentration (approximately 6.5 mg.L-1) using
designated dials on the probes.
The biomass concentration was adjusted to 2000 mg.L-1 as suspended solids with
MSS after harvesting and placed in 60 mL aliquots to each BOD bottle so that in the final
volume of 300 ml the concentration was consistent at 400 mg.L-1 as suspended solids. In
addition, in each experiment, one BOD bottle was used to measure the endogenous
respiration that means only biomass without any substrate. Two additional bottles were
used to measure the exogenous respiration using a biogenic substrate (acetate) and three
more to measure inhibited exogenous respiration (acetate plus inhibitor). The endogenous
respiration rate was calculated from the measurement of oxygen depletion over time by
activated sludge in its “resting state”. Since the microorganisms at this stage are without
food, they are not very active. Hence, their oxygen demand is minimal. The exogenous
respiration rate was calculated from the rate of oxygen depletion in the presence of a

5. Biodegradability enhancement of DCDE
176
readily biodegradable substance. Since the microorganisms are actively biodegrading the
substrate, their oxygen demand is high and the concentration of dissolved oxygen in a
closed system drops dramatically. In these studies, acetate was used as a readily
biodegradable substance. Lastly, inhibited exogenous respiration rate represents the
decrease in the rate of oxygen consumption over time in a system with microorganisms and
acetate in the presence of a potentially inhibitory compound or combination of compounds.
Figure 5.3. Dissolved Oxygen probes
To check the inhibition of DCDE four experiments were performed using solutions
with UV/H2O2–treated DCDE after 25, 50, 75 and 100% oxidation. The initial
concentration of DCDE solution prior to oxidation was approximately 200 mg.L-1 for all
experiments. The level of oxidation achieved was within 5% of the desired level. Test
samples were capped prior to the inhibition studies to avoid volatilization of DCDE. All
experiments were performed for acclimated and non-acclimated culture.
5.2.6. Experimental device and procedure for biodegradation experiments
As it has been already commented in the introduction, the biodegradation studies
were conducted by using three different tests, whose fundaments and its application form
are explained next.

5.2. Experimental
177
5.2.6.1. Short-term test.
The short-term biodegradation test involved the measurement of biomass
respiration rate by oxygen probes for a period of 30 minutes. This test was conducted
using DCDE over a wide concentration range while keeping the biomass concentration
constant at 400 mg L-1 as suspended solids. This concentration of microorganisms was
chosen to yield a significant oxygen decrease within 30 minutes of experimentation,
thereby allowing accurate measurement of respiration rates. A modification of the
(OECD) Method 209 (OECD, 1981) was also followed as the experimental protocol for the
short-term tests. The method was based on the measurement of endogenous and exogenous
respiration rates with dissolved oxygen (DO) probes. The experiments were conducted in
the same experimental devices used for inhibition test (see Fig. 5.3).
The short-term biodegradation tests were performed with both non-acclimated and
acclimated microorganisms. For this method the biomass concentration was also adjusted
to 2000 mg.L-1 as suspended solids with MSS after harvesting and placed in 60 mL
aliquots to each BOD bottle so that in the final volume of 300 mL the concentration was
consistent at 400 mg.L-1 as suspended solids. Samples of oxidized DCDE solutions were
then added to the BOD bottles in different dilutions and the volumes were made up to 300
mL with distilled water. Yeast extract (0.15 mg.L-1) was added to each BOD bottle before
starting the experiments to provide the necessary macronutrient for the microorganisms.
The oxidized solutions of DCDE and a non-oxidized DCDE solution containing 200
mg.L-1 of DCDE were tested in triplicate. The duration of the experiments were kept at 30
minutes in order to prevent further acclimation of microorganisms as well as prevent
complete depletion of oxygen. Using DO probes attached to a highly sensitive data
acquisition system allowed the collection of data at a very high speed: one data point per
second per bottle. The respiration rate of the microorganisms in each bottle was determined
by measuring the oxygen concentration as a function of time, and by calculating the
corresponding slopes using Microsoft Excel spreadsheet.
The endogenous rate of respiration of microorganisms was obtained by running a
control experiment with microorganisms alone. The net exogenous respiration rates for
DCDE solutions were obtained by subtracting the endogenous rate from the observed
exogenous respiration rates. The net exogenous respiration rates that are directly
proportional to the substrate removal rate were substituted in the Monod equation to

5. Biodegradability enhancement of DCDE
178
max
s
SdSdt S K
µµ ⋅
− = =+
(5.1)
determine the specific substrate removal rate constants:
Where,
µ = specific growth rate
µmax = maximum specific growth rate
S = substrate concentration
Ks = half-saturation constant
The constants, µmax and KS were determined through non-linear curve fitting. The
calculations of kinetic constants and statistical significance tests were performed by using
Sigma Plot software for the 95% confidence level. Comparison of the kinetic constants
obtained for the oxidized samples and the non-oxidized samples allowed the assessment of
the extent of improvement of biodegradation.
5.2.6.2. Long-term test
The long-term respirometric experiments were conducted over a period up to 14
days to obtain information on biodegradability and toxicity of the by-products of oxidation
and of the parent compound. These data allowed us to see if prolonged exposure would
prompt microorganisms to develop the necessary enzymes for degradation of DCDE
and/or the oxidation by-products, or would result in toxicity and killing of the
microorganisms.
A ten channel Micro Oxymax Respirometer (Columbus Instruments International
Corporation, Columbus, OH), equipped with oxygen and carbon dioxide sensors and a
computer interface, was used to assess the improvement in the biodegradability of DCDE
after 0, 25, 50, 75 and 100% oxidation of DCDE by H2O2/UV system (see Fig.5.4). The
respirometric technique involved placing the oxidized or non-oxidized solutions with
microbial inocula into sealed 250 mL bottles and continuously measuring oxygen
consumption and the production of carbon dioxide by the bacteria as they grow under
batch conditions while degrading the substrate.

5.2. Experimental
179
Figure 5.4. Micro Oxymax Respirometer
The respirometer was used for continuous measurement of oxygen and carbon
dioxide in the gas phase up to 14 days. The process involved automatic gas withdrawal
from the test chambers, which was pumped through the gas sensors and then returned to
the test chambers. The percent oxygen and carbon dioxide gas levels of the test chamber
environment were measured every 3 hours and the changes in the levels were used to
compute oxygen consumption and carbon dioxide production. Micro Oxymax software
stored the data obtained during the experimental period directly to a hard disc.
Respirometric studies were conducted with acclimated and non-acclimated cultures
of microorganisms harvested from the activated sludge reactors as before. The appropriate
amount of biomass was placed into the respirometer bottles to result in 400 mg.L-1 of
biomass as suspended solids along with the oxidized solutions diluted by 50%. The bottles
were capped and the experiments started. All the tests were run in duplicates.
The experiments included three levels of controls, each with duplicates: 1) Test
with no microorganisms (no mo), 2) Test with microorganisms and 100 mg.L-1 of non-
oxidized DCDE (no oxidation), and 3) Test with microorganisms alone (endogenous).

5. Biodegradability enhancement of DCDE
180
5.2.6.3. Mid-term test
These experiments were designed to present data in terms of degradation of the
biodegradable organic matter, as measured by the changes in TOC and COD content of the
solutions as a function of time. The total amount of oxidation by-products that were
biodegradable within 6 hours was then determined and compared among different
treatments. Six hours was used as the time span because 1) the rate of biodegradation as
measured by COD or TOC change leveled off beyond 6 hours, and 2) 6 hours is a typical
hydraulic residence time in wastewater treatment plants.
The amount of TOC and COD due to the parent compound (DCDE) was subtracted
from the total measured concentrations of TOC and COD, and the remaining amounts of
TOC and COD were attributed to the oxidation products. The theoretical chemical oxygen
demand of 1 mg of DCDE is 160/143 = 1.12 mg. Hence, the COD contributed by the
oxidation products, i.e., “the non-parent COD” was estimated as follows: npCOD = (Total
COD – 1.123CDCDE). Non-parent TOC for this purpose was defined as the TOC
contributed by the chemical oxidation products, and it was estimated by subtracting the
TOC attributable to DCDE from the total TOC, i.e., non-parent TOC = npTOC = total
TOC – 0.34CDCDE, where total TOC is the measured TOC value, CDCDE is the measured
concentration of DCDE, and 0.34 is the theoretical amount of TOC per mg of DCDE.
A different experimental system was set up to conduct the mid-term biodegradation
tests. These experiments were conducted in duplicates in 1-L glass bottles open to the
atmosphere (see Fig 5.5). Air was supplied with glass diffusers with a flow rate of
1.65 L.min-1. The concentration of microorganisms, measured as mixed liquor suspended
solids (MLSS), was adjusted to 400 mg.L-1, with dilution of all samples by 50% once
DCDE solution was added.
The mid-term experiments were performed using 100% oxidized DCDE by
H2O2/UV either acclimated or non-acclimated cultures. Over 24 hours, samples (20 mL)
were withdrawn every 1.5 hours, filtered directly into 20 mL vials through 0.2 µm pore
filter papers, and the filtrate immediately analyzed for DCDE concentration. The
remaining filtrate was acidified with H2SO4 and stored at 4°C. The measurements of
suspended solids, COD and TOC were performed within 24 hours.

5.2. Experimental
181
Figure 5.5. Experimental device for Mid-term test
5.2.7. Analytical determinations
In order to maintain accuracy and consistency during inhibition and toxicity
studies, standard analytical methods were established. Measurements of DCDE
concentration, detection of residual H2O2 and COD concentration were all critical factors.
These factors were carefully monitored by the following methods.
5.2.7.1. DCDE concentration measurement
In order to confirm that DCDE initial concentration was approximately 200 mg.L-1
prior to oxidation and to verify the degree of oxidation immediately after oxidation, a
Shimadzu gas chromatograph was used. The machine was equipped with a flame
ionization detector that was fueled by hydrogen and air. The aqueous samples were
analyzed immediately after collection by directly injection into a Nukol column (15 m x
0.53 mm with 0.5 mm film) that was obtained from Supelco (Bellefonte, PA). Helium was
used as carrier gas at a flow rate of 15 mL.min-1. The injector and detector were operated at

5. Biodegradability enhancement of DCDE
182
temperatures of 150ºC and 250ºC, respectively. The initial column temperature was 80ºC,
and it was increased to 200ºC at the rate of 5ºC min-1. Calibration prior to concentration
measurement was performed with DCDE samples ranging in concentration from 40 to
200 mg.L-1.
5.2.7.2. Hydrogen peroxide
Hydrogen peroxide concentration was measured using Titanium (IV) chloride
reagent for low concentration and the permanganate method for high concentration.
Titanium (IV) chloride method
The titanium (IV) chloride reagent was prepared by adding 10 mL of water-white
titanium (IV) chloride dropwise to 10 mL of 6N hydrochloric acid. Both of the
titanium chloride and the HCl were chilled on crushed ice for 30 min prior mixing.
The mixture was left standing on ice until complete dissolution of solids. The
mixture was then diluted to one liter with 6N HCL. This reagent was calibrated
against and H2O2 aliquot of known concentration prior to use. In the calibration
procedure, one-to five- milliliters of H2O2 aliquot were transferred to 10 mL
volumetric flasks and diluted to volume with the titanium (IV) chloride reagent.
The absorbance of the yellow peroxytitanium acid formed was then measured at
415 nm in 10-mm quartz cells against a blank of titanium (IV) chloride reagent.
Permanganate method
Measures of H2O2 in the stock solution and in the aliquout used to calibrate the
titanium (IV) chloride reagent was conducted by titration against potassium
permanganate. In this procedure, a working solution was prepared by adding 10 mL
of H2O2 stock solution (~ 30% H2O2) to 1 liter of distilled water. 25 mL of the
working solution was acidified with 10 mL of 1:5 sulfuric acid and titrated against
0.1 N potassium permanganate. The titration was repeated four times and the
concentration in the working and stock solutions were calculated accordingly:
- + 2+2 2 4 2 25 H O + 2 MnO + 6 H 5O + 2 Mn + 8 H O→

5.3. Selecting and range of experimental variables
183
5.2.7.3. Total organic carbon (TOC)
The total organic carbon (TOC) was measured in this case by direct injection of the
filtered samples into a using a Shimadzu 5000A, TOC analyzer with an ASI automatic
sample injector.
5.2.7.4. Chemical oxygen demand (COD)
The chemical oxygen demand (COD) of the samples was measured by the closed
reflux, colorimetric method according to the Standard Methods, 5220-D (1995).
5.2.7.5. Total suspended solids
Total suspended solids in samples were measured by the gravimetric method
(Standard Methods, 2540-D) (1995).
5.3. Range of experimental variables for DCDE oxidation experiments
DCDE solutions were prepared with Milli-Q water at 200 mg.L-1 with no pH
adjustment and using no carbonate. Hydrogen peroxide was added at the beginning of the
three experiments and the DCDE/H2O2 mol.L-1 ratios were 1.2, 0.75 and 0.65, respectively.
In other experiments hydrogen peroxide was added in a stepwise procedure, in order to
attain a slow reaction rate. For this procedure 0.97 mmol.L-1 of H2O2 was added every five
minutes. When it was added at the beginning, the reaction was very fast. The most
significant removal of DCDE occurred in a short period of time and it was function of H2O2
concentration. The remaining H2O2 concentration was measured by titanium (IV) chloride
method. Finally, pH and temperature were also monitored during the experiments.

5. Biodegradability enhancement of DCDE
184
5.4. Results and discussion for DCDE chemical oxidation experiments
Several experiments were performed to oxidize DCDE by means direct photolysis and
H2O2/UV systems. In these oxidation experiments the objective was to find the optimal
conditions of the process in order to obtain 25 %, 50 %, 75%, and 100% removal of DCDE
in a reasonable irradiation time.
5.4.1. Direct photolysis
First of all, direct photolysis experiments were performed to know the influence of
UV radiation in the oxidation of DCDE. Concentration of DCDE was monitored with
irradiation time. The results, indicate significant reduction in DCDE concentration. DCDE
concentration was reduced by 25 % after 60 minutes and by 55% after 120 minutes of
irradiation time (see Fig. 5.7).
0.0
0.2
0.4
0.6
0.8
1.0
0 20 40 60 80 100 120
Time (min)
[DCD
E]/[D
CDE]
o
Figure 5.7. Removal of DCDE by means of direct photolysis. [DCDE]o = 200 mg L-1. (!) 1 h irradiation time, (!) 2 h irradiation time
On the contrary, by monitoring Total Organic Carbon (TOC) during direct
photolysis experiments revealed that there was no significant change in total carbon
content of the solution as shown in Fig.5.8.

5.4. Results and discussion for DCDE
185
0.00
0.20
0.40
0.60
0.80
1.00
0 10 20 30 40 50 60Time (min)
[TO
C]/[T
OC]
o
Figure 5.8. TOC removal by means of direct photolysis [DCDE]o = 200 mg.L-1
Changes in pH and the temperature were also monitored during the experiments.
An increase of 5.3 degrees Celsius was observed in the case of temperature and a decrease
in the case of pH from 6 to 4. The temperature increase was attributed to the heating effect
of UV light in spite of the cooling system with air of reactor H. The pH change should be
probably to formation of some carboxylic acids.
5.4.2. Influence of H2O2 concentration
Experiments were conducted to determine the effect of H2O2 concentration in
presence of UV (254 nm) radiation in the oxidation of DCDE. Hydrogen peroxide was
added at the beginning of the experiments at DCDE/H2O2 molar ratios of 1.2, 0.75 and 0.65
(40, 65, 75 mg.L-1 H2O2 respectively). A high oxidation rate was reached at higher H2O2
concentration because the quantity of hydroxyl radicals production increased when
increasing the concentration of H2O2 (see Fig.5.9). However, as it has been already
demonstrated in chapter 4, above certain concentration of H2O2, this effect is considered
negligible and in some cases it could be negative. In this case above 65 mg.L-1of H2O2 the
oxidation rate is the same, indicating that 65 mg.L-1 was the optimal H2O2 concentration
under the experimental conditions. As it has been expected, very fast reaction rates were

5. Biodegradability enhancement of DCDE
186
observed with H2O2/UV system as shown in Fig.5.9 in comparison with direct photolysis
rate presented in Fig. 5.7. This shows that DCDE reacts with hydroxyl radicals faster than
it photolyzes.
0.0
0.2
0.4
0.6
0.8
1.0
0 20 40 60 80 100 120
Time (min)
[DCD
E]/D
CDE]
o
Figure 5.9. Removal of DCDE by means of H2O2/UV system. [DCDE]o = 200 mg.L-1.(") [H2O2] = 40 mg.L-1, (!) [H2O2] = 65 mg.L-1, (•) [H2O2] = 75 mg.L-1.
Considering that the presence of hydrogen peroxide concentration remained in
solution after oxidation process could affect the microorganisms, its concentration
determined by titanium (IV) chloride method was monitored and quantified. In Fig. 5.10,
H2O2 remaining versus time is shown.
These preliminary results showed that a very fast initial kinetic removal of DCDE
is obtained even lower H2O2 concentrations (see Fig. 5.10). For this reason, and taking into
account that the objective of this pre-oxidation step was to obtain different DCDE
oxidation levels (25, 50, 75 and 100%), additional experiments were necessary and H2O2
was added in a stepwise procedure in order to attain a slower reaction rate. For this
procedure 0.97 mmol.L-1 of H2O2 was added to the solution every five minutes. The lamps
were turn off before each adding. The largest drop in DCDE concentration occurred
initially, and the rate was directly proportional to the H2O2 concentration. This stepwise
procedure allowed us to oxidize DCDE by 25 %, 50 %, 75%, and 100% in a reasonable

5.4. Results and discussion for DCDE
187
irradiation time around 60 minutes. These results are presented in Fig. 5.11. The oxidation
grade in all the experiments was obtained within ± 5 %. All the experiments were
performed several times in order to check its reproducibility as it can be seen in the two
examples show in this figure. Therefore, DCDE solutions pre-oxidized at 25, 50, 75 and
100% has been used as model solutions in all biodegradability tests in this work.
0
1020
30
40
5060
70
80
0 20 40 60 80 100 120
Time (min)
H 2O
2 (m
g L-1
)
Figure 5.10. Hydrogen peroxide remaining after DCDE removal. [DCDE]o
= 200 mg.L-1. (•)[H2O2] = 75 mg.L-1,(!)[H2O2] = 65 mg.L-1(")[H2O2] = 40 mg.L-1.
0
0.2
0.4
0.6
0.8
1
0 10 20 30 40 50 60
Time (min)
[DCD
E]/[D
CDE]
o
Figure 5.11. Removal of DCDE by means of H2O2/UV system by stepwise H2O2 addition.[DCDE]o= 200 mg.L-1

5. Biodegradability enhancement of DCDE
188
5.5. Results and discussion for inhibition tests
In each inhibition study, six bottles were set up to measure three different
respiration rates. Bottle 1, containing only 400 mg.L-1 biomass exhibited the endogenous
respiration rate of activated sludge. Endogenous respiration rate is taken as the
measurement of oxygen depletion over time for activated sludge in its “resting state”. The
microorganisms are not very active because they have no food, or substrate, so their
oxygen demand is minimal. In bottles 2 and 3, 20 mg.L-1 acetate was added to 400 mg.L-1
biomass so exogenous respiration rate could be measured. Exogenous respiration rate is
measured by monitoring oxygen depletion of a system with microorganisms and a readily
biodegradable substance, such as acetate. Since the microorganisms are actively
biodegrading the substrate, their oxygen demand is high and the concentration of dissolved
oxygen in a closed system drops dramatically. Bottles 4, 5 and 6 contained 400 mg.L-1
biomass, 20 mg.L-1 acetate and the pre-oxidized solution to monitor inhibited exogenous
respiration rate. Inhibited exogenous respiration rate represents the decrease in oxygen
concentration over time for a system with microorganisms and a readily biodegradable
substance in the presence of a potentially inhibitory compound or combination of
compounds. Percent exogenous inhibition was found by comparing respiration rates. First,
endogenous respiration rate was subtracted from exogenous respiration rate to get net
exogenous respiration rate. Then, endogenous inhibition was subtracted from inhibited
exogenous respiration rate to get net inhibited exogenous respiration rate. These net values
were used in calculations in order to exclude the irrelevant activity of microorganisms in
their resting state. Finally, these two values were compared by subtracting net inhibited
exogenous from net exogenous respiration rate, and by dividing the difference by net
exogenous respiration rate and multiplying by 100. This gives percent exogenous
inhibition, meaning the degree to which the test solution inhibited the microorganisms
from biodegrading acetate. The following is a sample calculation referring to the
hypothetical slope values in Fig. 5.12.
average net exogenous respiration rate = [(0.18 + 0.22)/2] − 0.020 = 0.18
average net inhibited exogenous respiration rate = [(0.12 + 0.11 + 0.10)/3] − 0.020 = 0.09
average percent exogenous inhibition = [(0.18 − 0.09)/0.18] × 100 = 50% inhibition

5.5. Results and discussion for inhibition tests
189
Figure 5.12. Typical respiration rates represented as slopes
Obviously, for inhibited exogenous slopes that were steeper, or greater in value,
than exogenous slopes, percent inhibition was calculated as a negative value. This was
interpreted as no detectable inhibition. In such cases, the test solution was assumed to
provide a secondary substrate that increased the overall activity of the microorganisms.
5.5.1. Inhibition of DCDE solution
To check the inhibition of DCDE alone, four experiments were performed using
DCDE concentrations of 25, 50, 75 and 100 mg.L-1, activated sludge concentration of 400
mg.L-1 and acetate concentration of 20 mg.L-1. Respiration rates were monitored for 15 to
20 minutes. These experiments were performed for non-acclimated and acclimated
cultures. Table 5.1 and Fig. 5.13 show the inhibition measured when exposing activated
sludge cultures to various concentrations of DCDE.
In the concentration range studied, DCDE produced some inhibition at
concentrations higher than 50 mg.L-1. Although the extent of inhibition is small,
preoxidation by means of H2O2/UV has been performed in order to see if the oxidation
byproducts still have effects on activated sludge systems.
Bottle Slope (mg.L-1min-1) 1 0.02 6 0.12 5 0.11 4 0.10 2 0.18 3 0.22
0 1 2 3 4 5 6 7 8
0 2 4 6 8 10 12 14 16 18 20
Time (min)
Dis
solv
ed O
xyge
n
Con
cent
ratio
n (m
g L
-1)
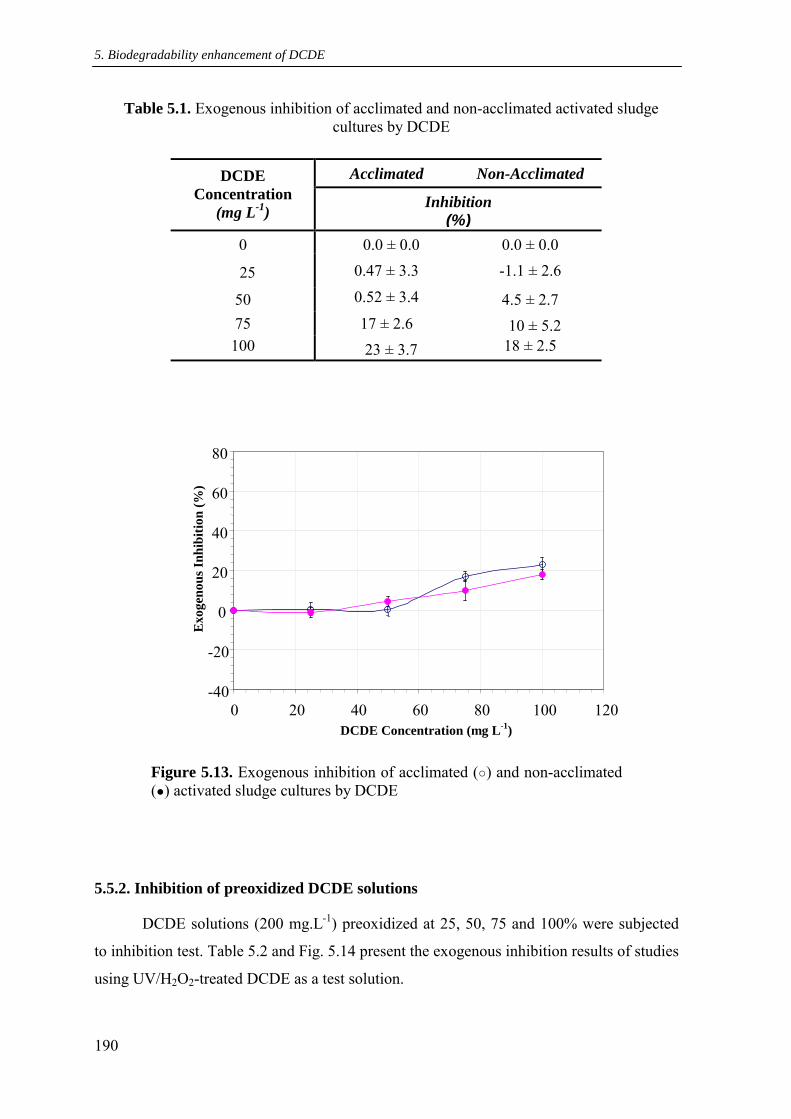
5. Biodegradability enhancement of DCDE
190
Table 5.1. Exogenous inhibition of acclimated and non-acclimated activated sludge cultures by DCDE
Acclimated Non-Acclimated DCDE
Concentration (mg L-1) Inhibition
(%) 0 0.0 ± 0.0 0.0 ± 0.0
25 0.47 ± 3.3 -1.1 ± 2.6
50 0.52 ± 3.4 4.5 ± 2.7 75 17 ± 2.6 10 ± 5.2 100 23 ± 3.7 18 ± 2.5
Figure 5.13. Exogenous inhibition of acclimated (○) and non-acclimated (●) activated sludge cultures by DCDE
5.5.2. Inhibition of preoxidized DCDE solutions
DCDE solutions (200 mg.L-1) preoxidized at 25, 50, 75 and 100% were subjected
to inhibition test. Table 5.2 and Fig. 5.14 present the exogenous inhibition results of studies
using UV/H2O2-treated DCDE as a test solution.
-40
-20
0
20
40
60
80
0 20 40 60 80 100 120 DCDE Concentration (mg L-1)
Exog
enou
s Inh
ibiti
on (%
)

5.5. Results and discussion for inhibition tests
191
The obtained results were very favorable for solutions oxidized with UV/H2O2. Not
only was little or no detectable inhibition, but also the oxidized solution served as
secondary substrate. Samples that contained both acetate and the test solution showed an
increase in oxygen consumption over the samples with acetate and no test solution. The
negative inhibition values indicated that not only was there no detectable inhibition but that
some of the DCDE byproducts were actually readily biodegradable. Besides, no significant
different was observed in the exogenous inhibition by using acclimated or non- acclimated
biomass.
Table 5.2. Exogenous inhibition of acclimated and non-acclimated activated sludge cultures by DCDE and its oxidation byproducts (after UV/H2O2 treatment)
Acclimated Non-Acclimated Percent Oxidation
(%) Inhibition (%)
25 ± 5 7.0 ± 4.7 -0.77 ± 1.6 50 ± 5 7.4 ± 3.9 6.6 ± 2.4 75 ± 5 -17 ± 4.2 -14 ± 6.2 100 ± 5 -25 ± 3.2 -23 ± 3.7
Figure 5.14. Exogenous inhibition of acclimated (Δ) and non-acclimated (▲) activated sludge cultures by DCDE and its oxidation byproducts.
-40
-20
0
20
40
60
80
0 20 40 60 80 100 Percent Oxidation (%)
Exog
enou
s Inh
ibiti
on (%
)

5. Biodegradability enhancement of DCDE
192
5.6. Results and discussion for biodegradation used tests
5.6.1. Short-term biodegradation test
!"#$#%&#'()#*+,$-#'#$./*01.+#0$2/'$2(3#$4#3#4,$/2$/%(05+(/*6$78$9:8$:78$;:$5*0$<77$
&#'.#*+$/%(05+(/*$/2$=>=?$@A$)#5*,$/2$H2O2BCD,A,+#)E$DCDE solutions preoxidized at
25, 50, 75 and 100% were subjected to short-term biodegradation experiments after
diluting with mineral salt solution and distilled water at different proportions. The
proportions were adjusted to results in a wide range of substrate. The net exogenous
respiration rate were measured and reported as a function of the DCDE concentration
remaining in solution after oxidation. !"#$ @(/0#F'505+(/*$ #%&#'()#*+,$ -#'#$ &#'2/')#0$
-(+"$5..4()5+#0$5*0$*/*G5..4()5+#0$.14+1'#,$/2$)(.'//'F5*(,),E$In each biodegradability
study, five bottles were set up to measure four different respiration rates. Bottle 1,
containing only 400 mg.L-1 biomass exhibited the endogenous respiration rate of activated
sludge. The microorganisms are not very active because they have no food, or substrate, so
their oxygen demand is minimal. In bottles 2 and 5, different concentrations of DCDE
according to oxidation grade of the pre-oxidized solution was added to 400 mg.L-1 biomass
so exogenous respiration rate could be measured.
As has been already mentioned in the experimental section, the respiration rate of
the microorganisms in each bottle was determined by measuring the oxygen concentration
as a function of time, and by calculating the corresponding slopes using Microsoft Excel
program. Fig. 5.15 shows typical raw data obtained for an experiment at different dilutions,
where time is in real minutes. The endogenous respiration rate of microorganisms was
obtained by running a control experiment with microorganisms alone. The net exogenous
respiration rates for DCDE solutions were obtained by subtracting the endogenous rate
from the observed exogenous respiration rates.
In Table 5.3 and 5.4, the experimental conditions (*$ +#'),$ /2$ =>=?$ /%(05+(/*$
&#'.#*+5F#$ 5*0$ +"#$ '#)5(*(*F$ ./*.#*+'5+(/*$ /2$ =>=?$ 5'#$ 4(,+#0$ +/F#+"#'$ -(+"$ +"#$ *#+$
#%/F#*/1,$ '#,&('5+(/*$ '5+#$ 5*0$ (+,$ ./''#,&/*0(*F$ ,+5*05'0$ 0#3(5+(/*,$ ,5)&4#,$ 2/'$
5..4()5+#0$5*0$*/*G5..4()5+#0$.14+1'#, respectively.

5.6. Results and discussion for biodegradation tests
193
min:s
12:30 15:00 17:30 20:00 22:30 25:00 27:30 30:00
mg/L
11
10
9
8
7
6
5
4
3
2
E$
Figure 5.15. Respiration rates of microorganisms with different dilutions of DCDE after 75% oxidation by H2O2/UV
$
Table 5.3. Oxidation by H2O2/UV of DCDE, Biodegradation by acclimated culture
H2O2/UV acclimated
% of oxidation
DCDE (mg L-1)
net exo. resp. (mg O2 L-1) St.Dev.
0 0.000 0.002 50 0.001 0.001 0% 100 0.000 0.001 0 0.000 0.000 25 0.042 0.005 50 0.065 0.006 75 0.077 0.001
25% ± 5
100 0.091 0.003 0 0.000 0.000 10 0.024 0.001 25 0.041 0.002 50 0.072 0.001
50% ± 5
75 0.086 0.002 0 0.000 0.000 5 0.031 0.003 10 0.046 0.012 25 0.106 0.005
75% ± 5
40 0.122 0.026 0 0.000 0.000
0.10 0.026 0.001 0.25 0.056 0.002 0.50 0.106 0.001
100% ± 5
0.75 0.137 0.004
endogenous
exogenous
10% dilution
25% dilution 50% dilution 75% dilution
Diss
olve
d ox
ygen
co
ncen
trat
ion
(mg
L-1)
Time (min)

5. Biodegradability enhancement of DCDE
194
Table 5.4. Oxidation by H2O2/UV of DCDE, Biodegradation by non-acclimated culture
H2O2/UV non acclimated
% of oxidation
DCDE (mg L-1)
net exo. resp. (mg O2 L-1) St.Dev.
0 0.000 0.009 25 0.001 0.001 50 0.002 0.002 75 0.003 0.001
0%
100 0.004 0.001 0 0.000 0.000 25 0.014 0.003 50 0.040 0.002 75 0.057 0.006
25% ± 5
100 0.069 0.003 0 0.000 0.001 10 0.024 0.002 25 0.052 0.006 50 0.104 0.013
50% ± 5
75 0.127 0.006 0 0.000 0.000 5 0.039 0.000 10 0.051 0.010 25 0.118 0.002
75% ± 5
40 0.139 0.002 0 0.000 0.000
0.10 0.039 0.006 0.25 0.090 0.012 0.50 0.121 0.015
100% ± 5
0.75 0.173 0.014
Fig.s 5.16 and 5.17 show the net exogenous respiration rates of DCDE treated
solutions for acclimated and non-acclimated culture with the abscissa presented in
remaining DCDE concentration. The results obtained in both cases clearly indicate that
while DCDE without oxidation exerts no oxygen demand at all, increasing levels of
oxidation produces dramatic improvement in oxygen consumption, obviously due to
formation of more biodegradable reaction products. It is also interesting to observe that
different levels of oxidation produce different maximum respiration rate for acclimated and

5.6. Results and discussion for biodegradation tests
195
non-acclimated culture. In fact for lower oxidation grade (25%), respiration rate of
acclimated culture was significant higher than non-acclimated culture.
Figure 5.16. Biodegradability of DCDE treated by H2O2 using acclimated culture, with x-axis as DCDE concentration.
Figure 5.17. Biodegradability of DCDE treated by H2O2 using non-acclimated culture, with x-axis as DCDE concentration.
DCDE concentration (mg L-1)
0 20 40 60 80 100 120
Net
Exo
geno
us R
espi
ratio
n, m
g O
2 L-1
min
-1
0.00 0.02 0.04 0.06 0.08 0.10 0.12 0.14 0.16 0.18 0.20
No oxidation 25 % 50 % 75 % 100 %
DCDE concentration (mg L-1)
0 10 20 30 40 50 60 70 80 90 100 110 120
Net
Exo
geno
us R
espi
ratio
n, m
g O
2 L-1
min
-1
0.00 0.02 0.04 0.06 0.08 0.10 0.12 0.14 0.16 0.18 0.20
No oxidation 25 % 50 % 75 % 100 %

5. Biodegradability enhancement of DCDE
196
When 50% and 70% of DCDE was oxidized, respiration rate of non-acclimated
culture was higher that acclimated one. It could be indicate that for higher pre-oxidation
grade, sewage sludge acclimatation would not be necessary in order to increase
biodegradability.
H2+#'$ 5.I*/-4#0F(*F$ +"#$ 3541#,$ /2$ '#,&('5+(/*$ '5+#,8$ (+$ "5,$ @##*$ &/,,(@4#$ +/$
.54.145+#$ I(*#+(.$ &5'5)#+#',$ /2$ J/*/0$ #K15+(/*$ +"5+$ -#'#$ 54'#50A$ 0#,.'(@#0$ (*$
#%&#'()#*+54$,#.+(/*E$L(*#+(.$&5'5)#+#',$5'#$,"/-*$(*$!5@4#,$:E:$5*0$:EME
Table 5.5. H2O2/UV non-acclimated culture. Kinetic parameters
(%) oxidation
DCDE (mg L-1)
net exo. resp
(mg O2 L-1) 1/DCDE 1/net
resp 1/µmax
(s) Ks/µmax µmax (s-1)
Ks (g.cm-3)
0 0.000 25 0.001 50 0.002 75 0.003
0%
100 0.004
0 0.000 25 0.014 0.04 69.6 50 0.040 0.02 24.9 75 0.057 0.01 17.2
25%
100 0.069 0.01 14.4
7.98 1898 0.125 200.4
0 0.000 10 0.024 0.10 41.6 25 0.052 0.04 19.1 50 0.104 0.02 9.55
50%
75 0.127 0.01 7.86
2.48 393.34 0.159 62.89
0 0.000 5 0.039 0.20 25.2 10 0.051 0.10 19.5 25 0.118 0.04 8.4
75%
40 0.139 0.02 7.2
5.42 106.13 0.175 18.63
0 0.000 0.10 0.039 10.00 25.2 0.25 0.090 4.00 11.1 0.50 0.121 2.00 8.2
100%
0.75 0.173 1.33 5.7
3.05 2197 0.195 0.43

5.6. Results and discussion for biodegradation tests
197
Table 5.6. H2O2/UV acclimated culture. Kinetic parameters
(%) oxidation
DCDE (mg L-1)
net exo. resp
(mg O2 L-1) 1/DCDE 1/net
resp 1/µmax
(s) Ks/µmax µmax (s-1)
Ks (g.cm-3)
0 0.000 50 0.001 0% 100 0.000
0 0.000 25 0.042 0.040 23.52 50 0.065 0.020 15.18 75 0.077 0.013 12.94
25%
100 0.091 0.010 10.95
7.09 410.63 0.114 48.85
0 0.000 10 0.024 0.100 41.61 25 0.041 0.040 19.61 50 0.072 0.020 13.86
50%
75 0.086 0.013 11.57
7.88 344.34 0.107 36.94
0 0.000 5 0.031 0.200 32.48 10 0.046 0.100 21.45 25 0.106 0.040 9.37
75%
40 0.122 0.025 8.19
4.87 142.55 0.154 22.08
0 0.000 0.10 0.026 10.00 37.63 0.25 0.056 4.000 17.70 0.50 0.106 2.000 9.36
100%
0.75 0.137 1.333 7.27
2.79 3.50 0.159 0.55
The net exogenous respiration rate for all levels of oxidation by H2O2/UV process
are significantly higher than the rate of non-oxidized DCDE, which is zero. This increase
in the respiration rate is clearly due to existence of biodegradable chemicals produced as
intermediates of DCDE oxidation by means of H2O2/UV system. In fact, at higher
percentage of DCDE oxidation, the values for Ks are smaller, what means that the organic
matter in solution is more biodegradable. For the same reason, qmax is higher when
increasing the oxidation grade. In addition, the kinetics for non-acclimated culture was
faster than acclimated one. That fact could be explained taking into account that in the case
of the non-acclimated culture, a higher diversity of microorganisms exists and therefore

5. Biodegradability enhancement of DCDE
198
major capacity to eliminate a complex substrate. On the contrary, the acclimated culture
produces a very specific biomass just for one of the components of the substrate (in our
case DCDE), diminishing its capacity for degrading different compounds.
5.6.2. Long-term biodegradation test
The long-term respirometric test described in the experimental section was also
followed to study the biodegradability of DCDE treated by H2O2 system to oxidize DCDE
by zero (no oxidation), 25, 50, 75 and 100%. The results of the long-term tests were
presented in terms of oxygen consumption and carbon dioxide formation and all of these
were performed by duplicate. The concentration of the biomass used in these studies was
400 mg.L-1. Raw data for DCDE pre-oxidize solution used for long-term respirometric test
for acclimated culture is shown in Table 5.7. The total volume of solution in each bottle
(250-mL size) was 50 mL. In Fig. 5.18, the decrease in oxygen concentration due to
consumption was presented in µg.L-1 on the y-axis as a function of time that is presented
on x-axis in units of hours for acclimated culture.
Table 5.7. Raw data for DCDE preoxidized solution used in long-term respirometer test for acclimate culture.
Percent
Oxidation (%)
DCDEo (mg L-1)
CODo (mg L-1)
0 212.8 260 25 ± 5 162.6 247 50 ± 5 114.9 223 75 ± 5 46.5 222 100 ± 5 5.6 185
For acclimated culture, within the first 120 hours, oxygen consumption for the
endogenous control was significantly lower than the oxygen consumption observed for
non-oxidized DCDE and the rest of pre-oxidized solution tested. This observation could
indicate that acclimated culture seemed to tolerate the presence of DCDE up to 100 mg.L-1.
However, after about 120 hours, oxygen consumption observed for non-oxidized DCDE

5.6. Results and discussion for biodegradation tests
199
and 24% pre-oxidized solution was lower than endogenous one. It could imply that the
toxicity of DCDE affected acclimated culture at longer period of exposition time.
Moreover, the oxygen consumption increased as the oxidation level increase resulting in an
overall oxygen consumption of about 11 mg.L-1 within 13 days for the two highly oxidized
samples. These results are confirmed by CO2 production, as shown in Fig. 5.19.
Figure 5.18. Oxygen consumption during long-term respirometric test for H2O2/UV-treated DCDE with acclimated culture
In Fig. 5.19, the decrease in oxygen concentration due to consumption and increase
in CO2 due to production is also shown for acclimated culture. The CO2 production for the
endogenous control was in this case lightly smaller in the firsts 120 hours in comparison
with CO2 production have observed for no oxidized DCDE. However, the no oxidized
DCDE solution exhibited reduced CO2 production after this initial period of time. On the
other hand, the biggest production in CO2 corresponds to the most oxidized samples. These
results are completely compatible with that obtained for he oxygen consumption of most
oxidized samples.
-14000
-12000
-10000
-8000
-6000
-4000
-2000
0
0 50 100 150 200 250 300 350 Time (h)
O2,
µ µµµ g L
-1
endogenous
no oxidation
24%
78%
46%
97%
no microorganisms

5. Biodegradability enhancement of DCDE
200
Figure 5.19. Oxygen consumption and carbon dioxide production during long-term respirometric test for H2O2/UV-treated DCDE with acclimated culture
Long-term biodegradation test was also performed with non-acclimated culture. In
Fig. 5.20, the decrease in oxygen concentration due to consumption was presented in µg
L-1 as a function of time. Raw data for DCDE pre-oxidize solution used for long-term
respirometric test for non-acclimated culture is shown in Table 5.8.
Table 5.8. Raw data for DCDE preoxidized solution used in long-term respirometer test for non-acclimated culture
Percent Oxidation
(%)
DCDEo (mg.L-1)
CODo (mg.L-1)
0 185.2 213 25 ± 5 142.5 216 50 ± 5 85.9 205 75 ± 5 36.7 193 100 ± 5 3.17 200
-13000
-8000
-3000
2000
7000
12000
0 50 100 150 200 250 300 Time (h)
O2,
CO
2, µ µµµ g
L-1
no microorganisms
97%
97%
endogenous
endogenous
no oxidation
46% 78%
78%
24%
no oxidation
24%
46%

5.6. Results and discussion for biodegradation tests
201
Figure 5.20. Oxygen consumption during long-term respirometer test for H2O2/UV-treated DCDE with non-acclimated culture.
In this case, similar profiles of oxygen consumption were obtained compared to
acclimated culture although the capability of the non-acclimated biomass to tolerate DCDE
presence is diminished. This effect is reflected in the lower oxygen consumption during the
first 120 hours of the experimentation. At higher reaction time toxicity effect of DCDE are
higher for non-acclimated culture since oxygen diminished significantly respect to
endogenous respiration. Again, the oxygen consumption increase when increasing the
oxidation rate, resulting in an overall oxygen consumption of about 13 mg.L-1 within 13
days for the two highly oxidized samples.
In Fig. 5.21, the decrease in oxygen concentration due to consumption and increase
in CO2 due to production is also show for acclimated culture. The CO2 production for the
endogenous control was in this case lightly higher in comparison with CO2 production has
observed for no oxidized DCDE. On the other hand, the highest production in CO2
corresponds to the most oxidized samples. These results are completely compatible with
that obtained for the oxygen consumption of most oxidized samples.
-14000
-12000
-10000
-8000
-6000
-4000
-2000
0
0 50 100 150 200 250 300 350 Time (h)
O2 , µ µµµ
g L
-1
no microorganisms
no oxidation
23%
53%
endogenous
95%
78%

5. Biodegradability enhancement of DCDE
202
Figure 5.21. Oxygen consumption and carbon dioxide production during long-term respirometric test for H2O2/UV-treated DCDE with non-acclimated culture.
Long-term biodegradation test shown the viability of H2O2/UV process for
enhancement of biodegradability of DCDE in aqueous solution.
5.6.3. Mid-term biodegradation test
The mid-term biodegradation experiments were conducted with DCDE solutions
preoxidized at 100%. This level of oxidation was chosen because of the higher rate of
respiration obtained with the short and long term tests. In fact, industry might need to
oxidize recalcitrant chemicals by 100%. Otherwise, the effluent stream could still contain
concentrations higher than is permitted by the law, especially since these recalcitrant
compounds are expected to pass through the treatment sequence without being removed.
During the first 6 hours, samples were withdrawn every 1.5 hours and analyzed for
COD and TOC concentrations.
The experimental results are presented in Tables 5.9 and 5.10 for duplicated during
a 24-hour period and acclimated and non-acclimated culture respectively.
-14000 -11000
-8000 -5000 -2000
1000 4000 7000
10000 13000
0 50 100 150 200 250 300 350 Time (h)
O2 ,
CO
2 , µ µµµ
g L
-1
no microorganisms
no oxidation
no oxidation endogenous
95%
95%
78%
23%
endogenous
78% 53%
53%
23%

5.6. Results and discussion for biodegradation tests
203
Table 5.9. Mid-term biodegradation experiments with acclimated culture for 100% oxidation of DCDE by means of UV/H2O2
Time (h)
COD1 (mg.L-1)
TCO1 (mg.L-1)
COD2 (mg.L-1)
TCO2 (mg.L-1)
COD average
TOC average
0.0 98.0 29.3 77.0 27.7 87.5 28.5 1.5 74.0 26.5 76.0 25.3 75.0 25.9 3.0 75.0 23.2 71.0 21.7 73.0 22.5 4.5 67.0 34.0 61.0 32.6 64.0 33.3 6.0 69.0 33.7 69.0 31.4 69.0 32.6 21.0 63.0 31.3 69.0 31.8 66.0 31.6 24.0 62.0 0.0 59.0 0.0 60.5 0
% removal 36.7 100 23.3 100 30.8 100
Table 5.10. Mid-term biodegradation experiments with non-acclimated culture for 100% oxidation of DCDE by means UV/H2O2 system.
Time (h)
COD1 (mg.L-1)
TCO1 (mg.L-1)
COD2 (mg.L-1)
TCO2 (mg.L-1)
COD average
TOC average
0.0 80.0 37.6 74.0 33.8 77 35.7 1.5 75.0 24.8 79.0 23.3 77 24.05 3.0 76.0 22.8 74.0 21.3 75 22.05 4.5 76.0 32.1 66.0 32.9 71 32.5 6.0 60.0 32.1 84.0 33.2 72 32.65 21.0 62.0 27.3 60.0 7.1 61 17.2 24.0 38.0 0.00 59.0 0.00 48.5 0.00
% removal 52.5 100 20.3 100 37.01 100
These results indicate that higher pre-oxidation of DCDE produce higher
concentration of intermediates compounds that are more readily biodegradable, and that
leads to the mineralization of larger fraction of organic matter. Although intermediates
were not follow, the results are agree with expectation that higher levels of chemical
oxidation would lead to formation of more oxygenated and smaller weight products, e.g.,
carboxylic acids that can easily be converted to CO2 by microorganisms (Ertas and Gurol,
2002, 2003).

5. Biodegradability enhancement of DCDE
204
Based on TOC removal values, it can be concluded that both cultures were capable
to oxidize 100% of organic matter content, which demonstrated that H2O2/UV process is
an optimal pre-treatment method for DCDE solutions.
From short, long, and mid-term biodegradation tests, sewage sludge process could
be integrate with advanced oxidation process (AOP) based on H2O2/UV to completely
mineralization of DCDE.

6. Chemical and biological coupled system for the
treatment of wastewaters generated in textile activities


6.1. Introduction
207
6.1. Introduction
As it has been commented in the introduction of this thesis, the aim of this chapter
is to explore the feasibility of combining the photo-Fenton process with biological
oxidation (chemical and biological coupled system) and the development of a general
strategy to be followed in industrial wastewater treatment. Among them, textile wastewater
was selected taking into account that these type of waters use to contain high organic
matter amount and the biological treatment is normally included in wastewater treatment
facilities. However the difficulties and even failures in biological plant operation make the
integration of chemical and biological processes specially recommended for this kind of
industry (Scott and Ollis, 1995). On the other hand, textile industry represents one of the
process in which water is used extensively and therefore textile effluents discharge creates
problems in terms of water quality protection. Moreover, the discharge of colored or
contaminated textile industry waste streams remains a contentious issue in many regions
throughout the world. Residual textile dyes, particularly those of the reactive type, are
invariably very difficult to remove with traditional methods. Although not normally,
directly toxic colored dye residues may shield the lowest depths of watercourses from
sunlight, inhibiting plant life, and other non-colored pollutants can present high oxygen
demands, both being a threat to a “living river”. For all of that, it is important to study the
application of an advanced oxidation process, such as photo-Fenton coupled with an
aerobic biological treatment for textile wastewater disposal
In order to develop this idea, effluents coming from a French textile industry were
studied at the laboratory facilities of Ecole Politechnique Federal de Laussane (EPFL),
(Switzerland).
Globally, the French textile finishing industry confronts not only low-cost textile
from Asia and the Mediterranean basin, but also the rise of new countries that have made
sizeable investments in order to develop a high quality industry (for example, western
Europe). This industry has lost more than 40 % of its manpower against 10 % of the other
manufacturing industries. Nevertheless, despite an unfavorable overall economic situation,
the specific field of textile finishing resists to the crisis, more particularly in going on with
a high level of export. It seems that the small companies offer more resistance than big
societies. The small companies (0 to 20 employees) from French textile finishing
represented up to 66 % of the whole sector in 1997 (that is to say 10 % of the manpower

6. Chemical and biological coupled system
208
and 10 % of the turnover). The investments engaged by those companies remain very low
(≈ 5 %), which shows the real necessity to find out suitable solutions well fitted with the
specific problems and financial capacities of these small companies.
Nowadays, in France, legal organizations tend to promote the implementation of
individual wastewater treatment plants rather than the connection to urban treatment
facilities. Fig. 6.1 shows the great possibility of expands for the proposed scheme in the
textile sector (source: Textile French Institute).
Inventory of the connection of textile companies
10%
48%
1%
15%
18%
8% direct connection to an urban station
pre-treatment before connection
wastewater treatment before connection
direct disposal to natural medium
pretreatment before disposal to naturalmediumwastewater treatment before disposal tonatural medium
Figure 6.1. Inventory of the connection of textile French companies
In this context, solutions based on advanced oxidation processes are being
investigated in order to propose an efficient process where costs are decreased as much as
possible, and of quick application on the industrial field.
Thus, this research was part of a cooperation project with the French Textile
Institute, which was interested in getting alternative and efficient methods for the
elimination of organic recalcitrant compounds present in the French textile industry
wastewaters. Effluents produced in a textile industry located in the south of France were
selected to evaluate a general strategy for the treatment of the different generated
wastewaters. The main objective was to find out the best operating conditions of the Photo-
Fenton (pre- or post-) treatment to enhance the global removal performance. Three
different wastewaters produced in this textile industry were studied. The main

6.2. General strategy
209
physicochemical characteristics are described in section 6.4.1. Regarding its provenance,
the origin of these wastewaters were:
- the outlet of an autoclave (Effluent 1).
- the mixed of different effluents produced in this industry (Effluent 2).
- the outlet of biological treatment plant (Effluent 3).
6.2. General strategy for the development of a coupled system
As it has been previously commented, coupling of photochemical and biological
processes is a good alternative to minimize the treatment cost of wastewater containing
biorecalcitrant and/or toxic pollutants. The chemical process could be used as pre-
treatment in order to increase the biodegradability of the wastewater or as a post-treatment
to remove the non-biodegradable compounds. In this sense, a general strategy is proposed
and developed in the EPFL (Pulgarin et al, 1999) for wastewater treatment (see Fig. 6.2).
First of all, due to the high cost of chemical treatments, biodegradability test should be
carried out since for biodegradable compounds classical biological treatments are, at
present, the cheapest and most environmentally compatible processes. From the test results
three situation could be obtained:
(a) the effluent is biodegradable.
(b) the effluent is partly biodegradable.
(c) the effluent is completely non-biodegradable.
Strategy for each situation is the following:
For case (a) biodegradable non-toxic effluent could be sent directly to centralized
biological treatment plant (green line, Fig. 6.2).
When the effluent is partly biodegradable (case b), it may be first treated by means of a
conventional biological process and chemical oxidation process could be used in a final
step to remove the biorecalcitrant part (blue line, Fig. 6.2).

6. Chemical and biological coupled system
210
Figure 6.2. Flow diagram of the strategy for the devolopment of a coupled system
Biodegradable ?
Toxic At low conc.
?
Biodeg . At low conc.
?
Toxic and / or Non - biodegradable
effluent
Biodegradable non - toxic effluent
Partly biodegradable
Biodegradable
Legislation Requeriments
Achieved ?
Specific biological treatment
Centralized biological treatment
Pre and Post
yes no
no yes
no
yes
no
yes
EFFLUENT
?
WASTEWATER
? ?
/ or -
-
?
Treatment AOPs
no
no
yes
no
partly yes
+ Partly biorecalcitrant
Biodegradable ?
Toxic At low conc.
?
. At low conc.
?
Toxic and / or Non - biodegradable
effluent
Biodegradable non - toxic effluent
Biodegradable
Legislation Requeriments
Achieved ?
Specific biological treatment
Centralized biological treatment
Pre and Post
yes no
no yes
no
yes
no
yes
?
? ?
/ or -
-
?
Treatment AOPs
no
yes
no
Partly biodegradable +
Partly biorecalcitrant

6.3. Experimental
211
For toxic or non-biodegradable effluents (case c), the chemical oxidation as pretreatment
process would increase the biodegradability and/or remove the toxicity of the wastewater.
In this case, the chemical pretreatment is meant to modify the structure of contaminants by
transforming them into less toxic and easily biodegradable intermediates, which allows the
subsequent biological degradation to be achieved in a shorter time and in a less expensive
way (red line, Fig. 6.2). The solution resulting from the phototreatment stage is considered
to be biologically compatible after the elimination of:
- the initial biorecalcitrant and/or toxic compounds,
- the inhibitory and/or non-biodegradable intermediates, and
- any chemical reagent (H2O2, O3 ….).
These requirements, together with information concerning the evolution of toxicity and
biodegradability of the pretreated solution, allow the determination of optimal operational
conditions, which corresponds to the best cost-efficiency compromise.
Finally, this strategy could be used as useful guide, as it proposes an easy way to
determine the most feasibility method for any industrial wastewater treatment. Next, this
strategy will be applied to the three effluents from the French industry presented before.
6.3. Experimental
6.3.1. Reagents
In Table 6.1 are shown all chemicals that were used in the experimentation. All
them were used as received.
Milli-Q water is used for the preparation of aqueous solutions or as a component of
the mobile phase (ammonium acetate-acetonitrile, HPLC grade) in HPLC analysis. For
photo-Fenton process, HCl was used to acidify the sample to be treated. The phototreated
solutions are neutralised by means of NaOH. Neutral pH of the solutions is maintained
during the biological tests by adjusting with HCl or NaOH.

6. Chemical and biological coupled system
212
Table 6.1. List of chemicals used
Compound Formula Vendor Ammonium chloride NH4Cl Fluka
Ammoniun acetate C2H5NH3 Fluka Acetronitrile Merck Boric acid H3BO3 Fluka Calcium chloride CaCl2· 2H2O Fluka Cobalt chloride hexahidrate CoCl2· 6H2O Merck
Cupper chloride dihidrate CuCl2· 2H2O Fluka
Diethylene glycol C4H10O3 Fluka Ferric chloride FeCl3 Aldrich Ferric chloride hexahidrate FeCl3 · 6H2O Fluka
Glucose C6H12O6 Aldrich Hydrochloric acid HCl Fluka Hydrogen peroxide H2O2 Aldrich Iron sulphate heptahydrate FeSO4 · 7H2O Merck
Magnesium sulfate heptahidrate MgSO4· 7 H2O Fluka
Monobasic potassium phosphate
K2HPO4 Fluka
Manganese chloride tetrahidrate
MnCl2 · 4H2O Fluka
Monobasic sodium phosphate NaH2PO4 Aldrich
Monobasic potassium phosphate
KH2PO4 Fluka
Niquel chloride hexahidrate NiCl2· 6H2O Aldrich
Potassium hydrogen phthalate
2-(HO2C) C6H4CO2K Merck
Sodium hydroxide NaOH Fluka Sodium molibdate Na2MoO4 Fluka Sulfuric acid H2SO4 Merck Zinc sulfate ZnSO4· 7H2O Fluka
6.3.2. Experimental device and procedure
The photo-Fenton experiments were performed by means of a suntest simulator
(shown in Fig. 6.3) and a coiled photochemical reactor installed in the coupled system with
a biological reactor (shown in Fig. 6.4).

6.3. Experimental
213
Figure 6.3. Reactor I (suntest simulator)
Figure 6.4. Scheme of the coupled photochemical-biological flow reactor

6. Chemical and biological coupled system
214
6.3.2.1. Suntest simulator
Several photo-Fenton experiments were performed using 40 mL Pyrex flask with
wavelength cut-off at λ = 290 nm placed into a Hanau Suntest Simulator (see Fig 6.2). The
radiation source employed is a xenon lamp where the total radiant flux (40 mW cm-2) was
measured with a YSI Corporation power meter. The lamp has a λ distribution with 0.5% of
the emitted photons have wavelengths shorter than 300 nm and 7% of the emitted photons
are in the range 300 and 400 nm. The photons emitted between 400 and 800 nm followed
the solar spectrum. The aqueous solutions were magnetically stirred throughout irradiation,
opened to air. Extreme care was taken to ensure uniform experimental conditions during
the degradation rate determination. Samples were taken periodically and the Total Organic
Carbon (TOC) was monitored after filtration with millipore filters (0.45 µm).
6.3.2.2. Coiled photochemical reactor
In the coiled photochemical reactor shown in Fig.6.4, the pollutant solution
circulates through an 8 mm-diameter glass coil of about 20 m long. A 400 W, 40 cm long,
medium-pressure Hg-lamp is positioned in such a way that its centre line passes through
the axis of the coiled reactor. The predominant radiation is at 366 nm with output
equivalent to ~15 W. The experiments are carried out at 30, 45 and 60oC to study the
influence of the temperature in the reaction rate. The pH was adjusted around 3 with HCl.
The pollutant solution, H2O2, and Fe3+ solutions are added at the beginning into the
mixing-vessel. The solution is in batch mode recirculated at 26 L h-1 through the
illuminated part of the reactor. In order to prepare the phototreated water for biological
treatment, the solution is neutralized and all the experiments were carried out until H2O2
was consumed.
!"#"$"#. Biological reactor
The Fixed Bed Reactor (FBR) shown on the right hand side of Fig.6.4 consists of a
1-L column containing biolite colonized by activated sludge coming from a municipal
wastewater treatment plant (Vidy, Lausanne, Switzerland). The pH is controlled and
adjusted at 7. The required nutrients N, P, K, and oligoelements for the bacterial activity
are also added. The aeration is about 150 L h-1 and the O2 concentration is measured by
6.3. Experimental
215
means of an O2 probe on the top of the column. This biological reactor was used as
supplementary test to measure the biodegradability of the effluent treated.
6.3.3. Analytical determinations
6.3.3.1 Total organic carbon (TOC)
A Shimadzu, 5050A TOC analyzer was used for TOC measurements. The
instrument was equipped with an ASI automatic sample injector and it uses potassium
hydrogen phthalate solution as calibration standard. Acidification and stripping before
analysis were sometimes necessary to keep the solutions free of atmospheric CO2.
6.3.3.2. Chemical oxygen demand (COD)
The COD is used as a measure of the oxygen equivalent of the organic matter
content of a sample that is susceptible to oxidation by a strong chemical oxidant. This
analysis is carried out via a Hach-2000 spectrophotometer using dichromate solution as the
oxidant in strong acid medium. Test solution (2 mL) is pipetted into the dichromate reagent
and digested at 150oC for two hours. Color is developed during the oxidation and measured
against a water blank using a Hach DR/890 colorimeter. The optical density for the change
of color of the dichromate solution was determined at λ = 430 nm.
6.3.3.3. High performance liquid chromatography (HPLC)
High performance liquid chromatography (HPLC) was carried out in a Varian 9065
unit provided with a Varian 9012 solvent delivery system, an automatic injector 9100, and
a Varian ProStar variable (200-400 nm) diode array detector 9065 Polychrom. A reverse
phase Spherisorb silica column ODS-2 and acetonitrile/amonium acetate as mobile phase
was used to run the chromatography in gradient mode. The rapidoprint signal was detected
at 258 nm with a retention time around 3.6 min.
6.3.3.4. Biological oxygen demand (BOD)
The BOD measures the oxygen required for the biochemical degradation of organic
material. This analysis is made by means of a Hg free WTW 2000 Oxytop unit

6. Chemical and biological coupled system
216
thermostated at 20oC. The pH of the samples are adjusted between 6.8 and 7.5 followed by
addition (20% v/v) of decanted sludge (inoculum) from the biological plant of Vidy
(Lausanne, Switzerland) and of nutrient substances (solutions A, B, and C) and trace
elements necessary for the bacterial activity.
Solution A:
• FeCl3.6H2O (0.5 g)
• HCl 1N (1 mL) in 100 mL of distilled water.
Solution B:
• MgSO4.7H2O (2.0 g)
• CaCl2 (2.5 g)
• NH4Cl (quantity depending of carbon concentration to degrade to have
always a molar ratio C/N of 20) in 500 mL of distilled water.
Solution C:
• Na2HPO4 (6.8 g)
• KH2PO4 (2.8 g) in 1000 mL of distilled water.
Solution A+B:
• 50 mL of solution A, 500 mL solution B in 1000 mL of distilled water.
Trace elements solution:
• FeSO4.7H2O (200 mg)
• ZnSO4.7H2O (10 mg)
• MnCl2.4H2O (3 mg)
• H3BO3 (30 mg)
• CoCl2.6H2O (20 mg)
• CuCl2.2H2O (1 mg)
• NiCl2.6H2O (2 mg)
• Na2MoO4.2H2O (3 mg), in 1000 mL of distilled water.
For each BOD determination, 20 mL.L-1of solution A+B, 50 mL.L-1 of C and
2 mL.L-1of trace elements are added for 400 mg C of the test solution.

6.3. Experimental
217
6.3.3.5. Zahn-Wellens biodegradability test
The Zahn-Wellens test was adapted in 1981 as OECD Guideline 302 B for
determining inherent biodegradability (OECD, 1981). A mixture containing the test
substance, mineral nutrients (the same as for BOD determination), and between 1-1.5 g L-1
of activated sludge in aqueous medium is agitated and aerated at 20-25oC in the dark or in
diffuse light for up to 28 days. Blank controls, containing activated sludge with a biogenic
substrate (diethylene glycol) and mineral nutrients but no test substance, are run in parallel.
Another control to check the stripping effect is also carried out in parallel only with the test
substance. The biodegradation process is monitored by determination of TOC. Biomass
coming from the biological activated sludge plant of Vidy (Lausanne, Switzerland) is
previously aerated for 24 hours and subsequently centrifuged. This test was performed in
the experimental device shown in Fig. 6.5.
Figure 6.5. Zahn-Wellens experimental device
6.3.3.6. Hydrogen peroxide
Concentrations of H2O2 were determined by the Merk Merckoquant® peroxide
analytical test strips and by permanganate titration.
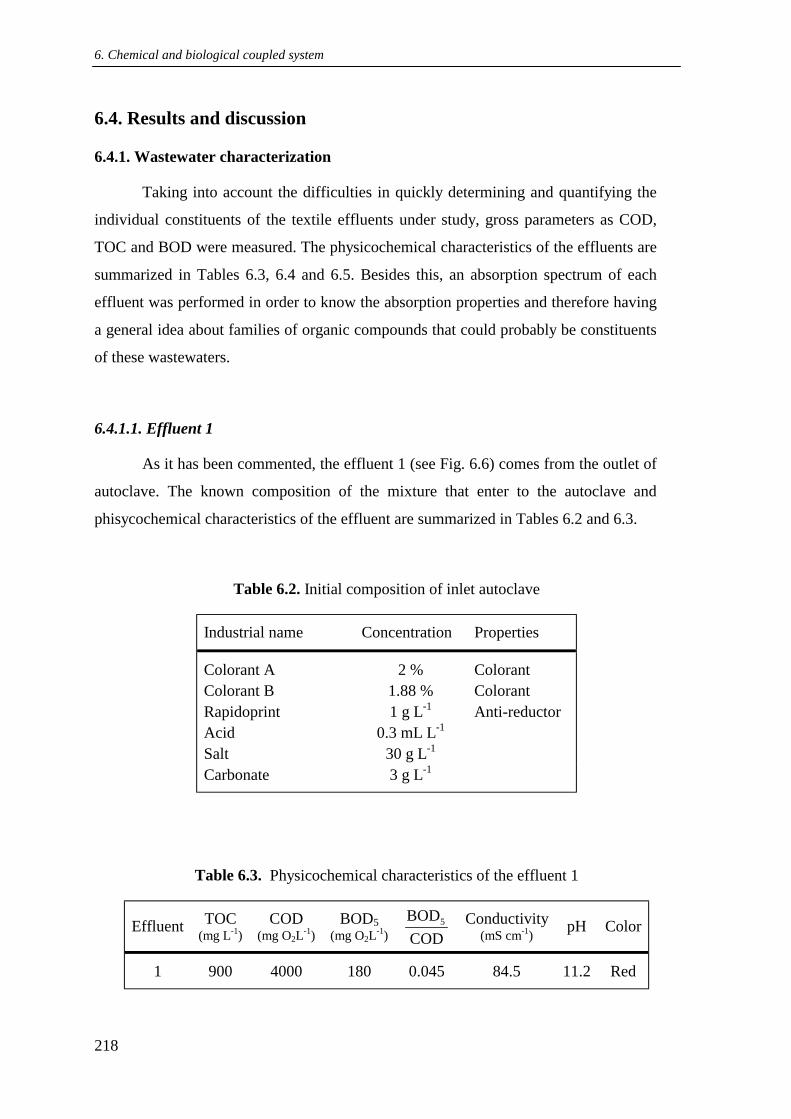
6. Chemical and biological coupled system
218
6.4. Results and discussion
6.4.1. Wastewater characterization
Taking into account the difficulties in quickly determining and quantifying the
individual constituents of the textile effluents under study, gross parameters as COD,
TOC and BOD were measured. The physicochemical characteristics of the effluents are
summarized in Tables 6.3, 6.4 and 6.5. Besides this, an absorption spectrum of each
effluent was performed in order to know the absorption properties and therefore having
a general idea about families of organic compounds that could probably be constituents
of these wastewaters.
6.4.1.1. Effluent 1
As it has been commented, the effluent 1 (see Fig. 6.6) comes from the outlet of
autoclave. The known composition of the mixture that enter to the autoclave and
phisycochemical characteristics of the effluent are summarized in Tables 6.2 and 6.3.
Table 6.2. Initial composition of inlet autoclave
Industrial name Concentration Properties
Colorant A 2 % Colorant Colorant B 1.88 % Colorant Rapidoprint 1 g L-1 Anti-reductor Acid 0.3 mL L-1 Salt 30 g L-1 Carbonate 3 g L-1
Table 6.3. Physicochemical characteristics of the effluent 1
Effluent TOC (mg L-1)
COD (mg O2L-1)
BOD5 (mg O2L-1)
5BODCOD
Conductivity (mS cm-1) pH Color
1 900 4000 180 0.045 84.5 11.2 Red

6.4. Results and discussion
219
This effluent exhibits low biological oxygen demand (BOD5), high chemical
oxygen demand (COD) and it is highly colored. The BOD5/COD ratio is 0.045, indicating
that this effluent is poorly biodegradable taking into account that values of this ratio higher
than 0.4 for municipal wastewater are considered as biologically compatible (Metcalf &
Eddy, 1995). In addition, this effluent has a high conductivity due the very high salt
concentration and it also shows a high alkalinity grade.
The UV-vis absorption spectrum of this wastewater is shown in Fig. 6.7. It presents
a maximum absorption band in the range of 250-340 nm. In this zone, the aromatics
compounds present a characteristic absorption band. The absorbance in the visible zone
(500-600 nm) is also important, which is characteristic of chromophores groups present in
the effluent.
Figure 6.6. Effluent 1 Figure 6.7. UV-vis spectra
6.4.1.2. Effluent 2
This effluent 2 (see Fig. 6.8) is the result of mixing all the wastewaters
produced in the plant, such as those produced in the plants processes like dying,
printing, bleaching, etc and those produced in activities like washing, washrooms and
laboratories. This mixed wastewater is finally sent to the biological treatment plant
placed in the same facilities. In table 6.4 the physicochemical characteristics of this
effluent are summarized.

6. Chemical and biological coupled system
220
Table 6.4. Physicochemical characteristics of the effluent 2
Effluent TOC (mg L-1)
COD (mg O2L-1)
BOD5 (mg O2L-1)
5BODCOD
Conductivity (mS cm-1) pH Color
2 460 1352 526 0.39 3.36 7.10 Green
This effluent exhibits high biological oxygen demand (BOD5), moderate COD and
lightly colored. The BOD5/COD ratio was 0.39, indicating that this effluent is potentially
biodegradable, as commented before.
The UV-vis absorption spectrum of this wastewater is also shown in Fig. 6.9.
Figure 6.8. Effluent 2 Figure 6.9. UV-vis spectrum
It presents an absorption band in the range of 250-340 nm. It could be indicative, as
was mentioned before, of the presence of aromatic compounds. In this case, the absorbance
in the visible zone is not important in spite of the presence of chromophore groups, as they
are present in very low concentration. For this reason they do not appear registered in the
spectrum.

6.4. Results and discussion
221
6.4.1.3. Effluent 3
As it has been commented, effluent 3 (Fig. 6.10) is the outlet of the biological
treatment plant. The physicochemical characteristics of this effluent are presented in
table 6.5
Table 6.5. Physicochemical characteristics of the effluent 3
Effluent TOC (mg L-1)
COD (mg O2L-1)
BOD5 (mg O2L-1)
5BODCOD
Conductivity (mS cm-1) pH Color
3 150 170 18 0.11 3.76 7.4 No color
This effluent exhibits very low biological oxygen demand (BOD5), low COD and
no color. The BOD5/COD ratio was 0.11, indicating that this effluent would be poorly
biodegradable. Even after biological treatment the TOC and DOC values are still rather
high.
The UV-vis absorption spectrum of this effluent is shown in Fig. 6.11.
Figure 6.10. Effluent 3 Figure 6.11. UV-vis spectrum
It presents a maximum absorption band in the range of 250-340 nm. This could
clearly indicate the presence of biorecalcitrant aromatic compounds, which is in agreement
with the relatively high TOC values.
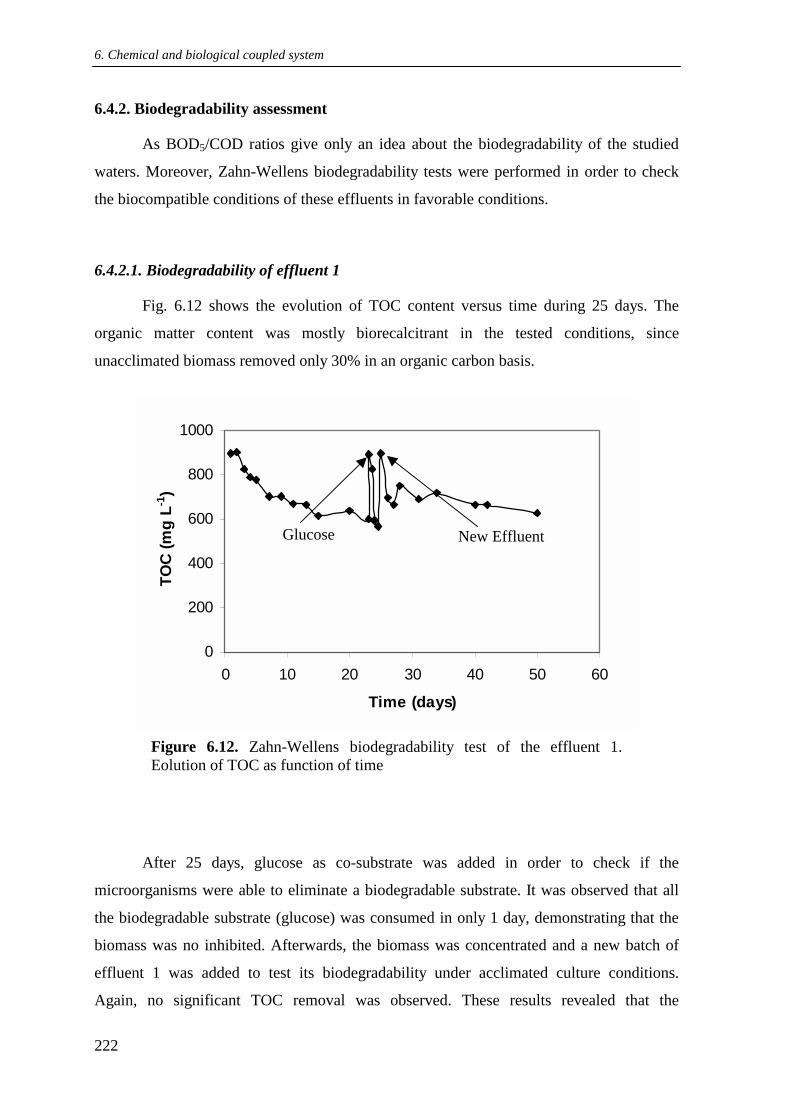
6. Chemical and biological coupled system
222
6.4.2. Biodegradability assessment
As BOD5/COD ratios give only an idea about the biodegradability of the studied
waters. Moreover, Zahn-Wellens biodegradability tests were performed in order to check
the biocompatible conditions of these effluents in favorable conditions.
6.4.2.1. Biodegradability of effluent 1
Fig. 6.12 shows the evolution of TOC content versus time during 25 days. The
organic matter content was mostly biorecalcitrant in the tested conditions, since
unacclimated biomass removed only 30% in an organic carbon basis.
0
200
400
600
800
1000
0 10 20 30 40 50 60
Time (days)
TOC
(mg
L-1)
Figure 6.12. Zahn-Wellens biodegradability test of the effluent 1. Eolution of TOC as function of time
After 25 days, glucose as co-substrate was added in order to check if the
microorganisms were able to eliminate a biodegradable substrate. It was observed that all
the biodegradable substrate (glucose) was consumed in only 1 day, demonstrating that the
biomass was no inhibited. Afterwards, the biomass was concentrated and a new batch of
effluent 1 was added to test its biodegradability under acclimated culture conditions.
Again, no significant TOC removal was observed. These results revealed that the
Glucose New Effluent

6.4. Results and discussion
223
biorecalcitrance of this effluent, under the tested conditions, is associated with the
structural stability of compounds towards microbiological attack but no with the toxicity of
the solution (Gulyas, 1997). Therefore, this effluent is considered non-biodegradable and
taking into account the proposed strategy it is recommended to be pretreated before
sending it to a biological treatment plant.
6.4.2.2. Biodegradability of effluent 2
Fig. 6.13 shows TOC content evolution with time for effluent 2 during 25 days
Zahn-Wellens test. Results show that organic matter is partially biodegradable since, after
a short acclimatation period, the biomass removed about 50 and 75% of initial TOC within
2 and 5 days, respectively.
0
100
200
300
400
500
0 5 10 15 20 25 30
Time (days)
TOC
(mg
L-1)
Figure 6.13. Zahn-Wellens biodegradability test of the effluent 2. Evolution of TOC as function of time
This effluent was classified as partly biodegradable because after 25 days 25% of
organic carbon content still remains in solution. Taking into account that effluent 2 is a
mixture of non-biodegradable effluents (e.g. effluent 1) and others mostly biodegradable
(e.g. washroom wastewaters), the biorecalcitrant part must be coming from the first type of

6. Chemical and biological coupled system
224
effluents. By considering results of Zahn-Wellens test (Fig. 6.13) and the general strategy
proposed for wastewater treatment, this effluent should be considered as a good candidate
to be treated by biological means. In fact, this is the procedure used by the textile plant
under study.
6.4.2.3. Biodegradability of effluent 3
Fig. 6.14 shows the evolution of TOC content versus time during 25 days for
effluent 3.
0
50
100
150
200
250
0 5 10 15 20 25 30
Time (min)
TOC
(mg
L-1)
Figure 6.14. Zahn-Wellens biodegradability test of the effluent 3. Evolution of TOC as function of time
As it can be observed, organic matter is mostly biorecalcitrant under the tested
conditions, since unacclimated bacteria only removed 40 % the organic carbon content
within 25 days. This result is in agreement with the previous one, by considering into that
in effluent 2 (the inlet to biological treatment plant) there was a significant biorecalcitrant
TOC content. Therefore, the outlet of the biological treatment plant (effluent 3) confirmed
this biorecalcitrance as well.
Thus, considering the proposed strategy, the effluent 3 should be post-treated by
chemical process before discharge it.

6.4. Results and discussion
225
6.4.3. Photo-Fenton process as pretreatment step
In this study, photo-Fenton process was selected as pretreatment in a coupled
chemical biological process for effluent 1. The main objective was to find out the optimal
operation conditions of the photo-Fenton reaction. For this purpose, photo-Fenton
experiments were carried out using the coiled reactor operated in batch mode. Bearing in
mind the high alkalinity of the effluent1 to be treated, the amount of hydrochloric acid used
to bring down the pH ca. 3 (optimal pH for photo-Fenton system) would be relatively high.
Furthermore, the amount of alkali needed to add before sending this effluent to a biological
treatment would be high as well. This fact should be considered in the total cost of the
treatment process. However, and considering the high concentration of carbonates present
in this effluent, the acidification would allow the removal of these scavenging ions,
permitting a better performance of the photo-Fenton system.
Temperature and both Fe3+ and H2O2 initial concentrations were optimised to
enhance the biodegradability of effluent 1 by means of this process. Mineralization degree
was monitored in order to determine the treatment duration. The biocompatibility of the
pretreated solution was studied after 40 and 70% of TOC removal and photo-Fenton
conditions were optimised to achieve these mineralization degrees in the lower possible
time. In the following experiments, the mineralization of the effluent is described assuming
a first order reaction already described in section 4.6.2.2 (eq. 4.26). From the
ln(TOC/TOCo) versus irradiation time plot, the first-order reaction rate constants (the
slope) have been calculated and used to study the effect of different Fe3+, H2O2,
concentrations and temperature.
6.4.3.1. Effect of the initial Fe3+ concentration
To further elucidate the role of Fe3+ concentration on the mineralization of the
effluent 1, a series of experiments varying the concentration of iron and keeping fixed the
other parameters (H2O2 and temperature) were carried out. Fig. 6.15 shows a plot of first-
order rate constant (k) as a function of Fe3+ concentration.
The best mineralization (k= 0.0067 min-1) was obtained for Fe3+ concentration of
1.43 mmol.L-1 at 60ºC and 150 mmol.L-1 of H2O2 concentration.

6. Chemical and biological coupled system
226
0
0.002
0.004
0.006
0.008
0 0.5 1 1.5 2
Fe 3+ (mM)
k (m
in-1
)
Figure 6.15. Initial rate constant of treated effluent by means of photo-Fenton process at different Fe3+ concentration. [H2O2] = 50 mmol.L-1, T = 60ºC
With this iron concentration, a 40% of mineralization was achieved after 120 min
of phototreatment, as shown in Fig. 6.16. From that figure it can also be observed that the
efficiency of the mineralization attains a plateau when the concentration of Fe3+ is between
1.43 and 1.8 mmol.L-1. This may be due to:
(a) the increase of a brown turbidity in the solution during the photo-treatment,
which hinders the absorption of the UV light required for the process.
(b) excessive formation of Fe2+ (eq. 1.18 and eq.1.12), which can compete with
the organic carbon for HO• radicals (eq. 1.11).
(c) H2O2 concentration can become the limiting factor of the oxidation-
reduction reaction (eq.1.12) when high concentration of Fe3+ is used.
(mmol.L-1)

6.4. Results and discussion
227
0
10
20
30
40
50
60
0 50 100 150 200 250 300
Time (min)
TOC
rem
oval
(%)
Figure 6.16. (%) TOC removal during the photo-Fenton treatment using different Fe3+ concentration.[H2O2] = 150 mmol.L-1, T = 60ºC. (!) [Fe3+] = 1.43 mmol.L-1, (!) [Fe3+] = 1.79 mmol.L-1 , (!) [Fe3+] = 1.07 mmol.L-1, (•) [Fe3+] = 0.36 mmol.L-1
6.4.3.2. Effect of the initial H2O2 concentration
Another important parameter to consider in the photo-Fenton oxidation is the
amount of H2O2 required to obtain the best efficiency in the treatment. In this sense,
several experiments were performed fixing the optimal Fe3+ concentration determined
before and the temperature of 60ºC (see section 6.4.3.3). As shown in Fig. 6.17, a
significant enhancement of the mineralization efficiency was observed when the H2O2
concentration was increased from 0 to 441 mmol.L-1.
Above this concentration, the oxidation rate is negatively affected by the
progressive increase of H2O2 up to 510 mmol.L-1. This is probably due to both the auto-
decomposition of H2O2 into oxygen and water (eq. 3.33), and the scavenging effect of
hydroxyl radicals by H2O2 (eq.3.34). This fact could be also observed in Fig. 6.18, where
the mineralization above 441 mmol.L-1 is practically the same.
At the light of these experiments, the optimal concentration at 60ºC for H2O2 and
Fe3+ were 1.43 and 441 mmol.L-1, respectively.

6. Chemical and biological coupled system
228
0
0.002
0.004
0.006
0.008
0.01
0 150 300 450 600 750
H2O2 (mM)
k (m
in-1
)
Figure 6.17. Initial rate constant of treated effluent by means of photo-Fenton process at different H2O2 concentration. [Fe3+ ] = 1.43 mmol.L-1, T = 60ºC
0
20
40
60
80
100
0 40 80 120 160 200
Time (min)
TOC
rem
oved
(%)
Figure 6.18. % TOC removal during the photo-Fenton treatment using different H2O2. [Fe3+]= 1.43 mmol.L-1, T = 60ºC. (•) [H2O2] = 588 mmol.L-1, (!) [H2O2] = 441 mmol.L-1, (!) [H2O2] = 294 mmol.L-1, (♦ ) [H2O2] = 147 mmol.L-1, (!) [H2O2] = 73 mmol.L-1
(mmol.L-1)

6.4. Results and discussion
229
6.4.3.3. Effect of the temperature
Normally, the photo-Fenton process is carried out at room temperature.
Nevertheless, considering that wastewaters coming from the textile industry have a
temperature between 60 and 90oC, it was considered very important to test the effect of the
temperature in the mineralization rate. Several experiments were performed at 30, 45, and
60ºC. As shown in Fig.6.19, a significant enhancement of the mineralization efficiency
was produced when the temperature was increased.
0
10
20
30
40
50
60
0 100 200 300 400 500
Time (min)
TOC
rem
oved
(%)
Figure 6.19. % TOC removal during the photo-Fenton treatment using different temperature. [Fe3+] = 1.43 mmol.L-1, [H2O2] = 147 mmol.L-1. (!) T = 60ºC, (!) T = 45ºC, (•) T= 30ºC
The treatment time necessary to achieve a 40% of mineralization was 7, 5 and 2
hours at 30, 45, and 60oC, respectively. It is also very important to make notice that the
final time of reaction is marked by the exhaustion of H2O2, one of the key elements for the
later study of biodegradability of the treated effluent.
In Fig.6.20 it is possible to observe that above 60oC a plateau is reached. From the
results, photo-Fenton pretreatment process could be carried out at outlet autoclave

6. Chemical and biological coupled system
230
temperature and better efficiency would be expected when comparing with the same
process at ambient temperature.
0
0.002
0.004
0.006
0.008
0.01
0 10 20 30 40 50 60 70
T (oC)
k (m
in-1
)
Figure 6.20. Initial rate constant of treated effluent by means of photo-Fenton process at different temperatures. [Fe3+] = 1.43 mmol.L-1, [H2O2] = 441 mmol.L-1
6.4.4. Biodegradability evolution of photo-treated solution
From the results presented before, it was decided to fix the following condition for
the pretreatment of effluent 1:
(a) for 40% of mineralization, [Fe3+] = 1.43 mmol.L-1, [H2O2] = 150 mmol.L-1,
T = 60ºC.
(b) for 70 % of mineralization, [Fe3+] = 1.43 mmol.L-1, [H2O2] = 441 mmol.L-1,
T = 60ºC.
In order to establish the biocompatibility after pre-treatment step, the
biodegradability was evaluated by the Zahn-Wellens test, using unacclimated municipal
sludge as initial inoculum. Fig. 6.21 illustrates TOC content evolution with time during
Zahn-Wellens test for 40 and 70% of mineralization. A control experiment using
diethylenglycol (400 mg.L-1) as biogenic substrate is also presented.

6.4. Results and discussion
231
0
150
300
450
600
750
0 5 10 15 20 25 30
Time (days)
TOC
(mg
L-1)
Glucose
Figure 6.21. Zahn-Wellens biodegradability test with non-acclimated biomass. Evolution of TOC as a function of time: (•) after 40 % of mineralization.(!) after 70 % of mineralization. (!) control with diethylenglycol
The figure shows that, for 40 % of mineralization, TOC removal efficiency is not
very significant, since only 50 % was removed within 28 days what means that the
pretreatment was not enough to produce an easily biodegradable solution. After 15 days,
glucose as co-substrate was added and the biomass response was positive, since all this
substrate was consumed very fast. This fact again allows confirms that the biorecalcitrance
of this treated effluent is due to the absence of enzymes able to degrade the remaining
organic matter and not its toxicity.
In the case of 70% of mineralization, TOC eliminated was only 30 % in 12 days. In
spite of showing a faster initial TOC removal rate than previous case, the amount of TOC
remaining in solution is still very important. This means that even a high mineralization
degree in the pretreatment step is not enough to produce easily biocompatible solutions.
In order to check the biomass conditions, a control experiment using
diethylenglycol (400 mg.L-1) was carried out. Diethylenglycol was degraded up to 90 %
within 6 days under the same conditions used to test the biodegradability of the pretreated
effluent, showing that the activity of activated sludge is appropriate (see Fig. 6.21).

6. Chemical and biological coupled system
232
To verify the results shown in Fig. 6.21, a supplementary experiment attempting
biodegradation of the effluent treated until 70% of mineralization was carried out in batch
mode with the FBR and the results are presented in Fig.6.22. As it is illustrated, 50 % of
TOC was removed within 12 days, although this test was carried out under more
theoretically favorable conditions than the ones used in the Zahn-Wellens test.
0
50
100
150
200
250
0 3 6 9 12 15
Time (days)
TOC
(mg
L-1
)
Figure 6.22. Biodegradability test of the phototreated effluent 1 after 70% of mineralization. Evolution of TOC in FBR as function of time
First of all, the concentration of available biomass was higher and secondly, fixed
biomass systems give better performance in industrial wastewater biological processes.
Even thought, the percentage of TOC removed was still very low, confirming the
biorecalcitrance of the effluent even after 70% of photo-mineralization.
To conclude this biodegradabilility revision and to discard a possible inhibitory
effect of high salt concentration present in the textile wastewater under study, the two
pretreated solutions was diluted two-fold and a new Zahn-Wellens test was done for both.
The results are presented in Fig. 6.23. The weak biodegradability observed confirms once
again that the biorecalcitrance is due to the absence of enzymes able to degrade the organic

6.4. Results and discussion
233
matter, as it was already observed, and not by the osmotic inhibiting effect that could be
produced by the high concentration of salts.
0
50
100
150
200
250
0 1 2 3 4 5 6 7
Time (days)
TOC
(mg
L-1
)
Figure 6.23. Zahn-Wellens biodegradability test of effluent 1 two-fold diluted after: (•) after 40% of mineralization; and (!) after 70% of mineralization. Evolution of TOC as a function of time using acclimated biomass
At the light of these results, it is clear that the coupled system proposed to apply in
the treatment of this effluent by means of photo-Fenton process cannot be feasible at the
tested conditions. Other AOPs, like, ozone, TiO2/UV, wet oxidation, etc, should be tested
in order to make the effluent more biocompatible.
6.4.5. Causes for photo-treated solution biorecalcitrance
In order to attempt an explanation for the strong biorecalcitrance of the
phototreated effluent, UV-vis spectroscopy and HPLC analysis have been made to identify
and to follow the evolution of the main organic substances contained in the effluent.

6. Chemical and biological coupled system
234
Fig. 6.24 shows that initial effluent presented two absorption bands at 280 and 530
nm. The band present in the visible zone (responsible of color) disappears after 40% of
mineralization. However, the absorption band at 250-280 nm is only partially eliminated.
200 300 400 500 600 nm
0 , 40 , 50 , 65 , 70
0.0 0.1 0.2 0.3 0.4 0.5 0.6 0.7 0.8 0.9 1.0 1.1 Abs
(a)
(b)
(c) (d)
(e)
Figure 6.24. UV-vis spectra of the effluent: (a) before photo-Fenton pretreatment, (b) after 40%, (c) after 50%, after 65%, and (e) after 70% of mineralization
This means that biorecalcitrant aromatic intermediates could still be present even
after 70% of photo-Fenton mineralization. These results may be used in a first
approximation to explain the very strong biorecalcitrance displayed by the treated textile
effluent.
Moreover, HPLC analyses were carried out and one compound present in the initial
effluent was identified and quantified. This compound is rapidoprint (see Table 6.2), which
is used in the textile industry as anti-reductor. Its biodegradability by means of
Zahn-Wellens test can be observed in Fig.6.25. The test shows that, even though TOC
removal reached 90% of initial TOC content, it took a long period of time (up to 28 days).
If it compare with time needed for the same removal of diethylene glycol (less than 6 days)
the effluent contained rapidoprint can be classified as low biodegradable.

6.4. Results and discussion
235
0
100
200
300
400
500
0 6 12 18 24 30
Time (days)
TOC
(mg
L-1)
Figure 6.25. Zahn-Wellens biodegradability test with non-acclimated biomass. Evolution of TOC as a function of time: (a) Rapidoprint solution. (b) control with diethylenglycol
0
200
400
600
800
1000
0 50 100 150 200
Time (min)
Conc
entra
tion
(mg
L-1
)
TOC
Rapidoprint
Figure 6.26. Concentration evolution (mg.L-1) during photo-Fenton treatment of: (a) TOC , and (b) rapidoprint. [Fe3+] = 1.43mmol.L-1, [H2O2] = 441mmol.L-1, T = 60ºC
(a)
(b)

6. Chemical and biological coupled system
236
Fig. 6.26 shows the evolution of TOC concentration in (a) rapidoprint solution and
(b) in effluent 1. When 95% of rapidoprint was eliminated, about 30% of the total TOC
still remained in solution, confirming that there was an important accumulation of
intermediates. Nevertheless, the biorecalcitrance cannot be attributed to the presence of the
biorecalcitrant rapridoprint, but to the present of aromatic compound as stated before.
6.4.6. Photo-Fenton process as post-treatment step
According to the proposed strategy, effluent 3 has been considered as potential
wastewater in which chemical the post-treatment step could be very useful. In this sense
several experiments by means of photo-Fenton process were carried out using a solar
simulator (reactor I) and the coiled photoreactor (reactor J), both described in the
experimental section 6.4.2.
In the following experiments, the mineralization of effluent 3 was also described
assuming a first order kinetic reaction already described in section 3.6.2.2 (eq. 3.31). Thus,
rate constants have been calculated and used to study the effect of different H2O2 initial
concentration for the same iron initial concentration at room temperature.
As shown in Fig. 6.27, maximum mineralization efficiency was reached when the
lowest H2O2 initial concentration (20.5 mmol.L-1) was used. Above this concentration, the
mineralization seems to be negatively affected by the progressive increase of H2O2. This
fact has been already commented in chapter 3.
The percentage of mineralization obtained is shown in Fig. 6.28. As it can be
observed, more than 80% of mineralization was reached in four hour of treatment. The use
of small amount of iron contributes to avoid problems with its necessary elimination.
Furthermore, as it has been commented before, the European Community directives allow
20 mg.L-1 of iron in treated wastewater to be discharge into municipal biological treatment
plant (EEC, 1992). Taking into account this directive, the resulted effluent from photo-
Fenton treatment could be sent directly to municipal collectors.
It is also important to stand out that the effectiveness of photo-Fenton process using
a solar simulator suggest the possibility of running the post treatment step with the direct
use of solar light. Therefore, it would make the biological-photochemical coupled system
proposed most attractive and less expensive.

6.4. Results and discussion
237
0
0.2
0.4
0.6
0.8
0 20 40 60 80
H2O2 (mM)
k (h
-1)
Figure 6.27. Initial rate constant of treated effluent by means of photo-Fenton process at different H2O2 concentration. [Fe3+] = 0.36 mmol.L-1, room temperature
0
20
40
60
80
100
0 2 4 6 8Time (h)
TOC
rem
oved
(%)
Figure 6.28. % TOC removal during the photo-Fenton treatment in reactor I using different H2O2. [Fe3+]= 0.36 mmol.L-1. (ο)[H2O2]= 20.6 mmol.L-1, (!)[H2O2] = 36.8 mmol.L-1. (!)[H2O2]= 73.5 mmol.L-1
Several experiments were also made in the coiled photoreactor (reactor J). As
shown in Fig. 6.29, once more, maximum mineralization efficiency was reached when the
lowest H2O2 concentration (2.2 mmol.L-1) was used.
(mmol.L-1)

6. Chemical and biological coupled system
238
In this case, close to 80% of mineralization was also obtained but in less time (3 h)
of treatment and using a smaller H2O2 concentration than the previous case.
0
0.004
0.008
0.012
0 5 10 15 20
H2O2 (mM)
k (m
in-1
)
Figure 6.29. Initial rate constant of treated effluent by means of photo-Fenton process at different H2O2 concentration. [Fe3+] = 0.36 mmol.L-1, T = room temperature
0
20
40
60
80
100
0 50 100 150 200
Time (min)
TOC
rem
oved
(%)
Figure 6.30. % TOC removal during the photo-Fenton treatment in reactor J using different H2O2. [Fe3+] = 0.36 mmol.L-1. (ο) [H2O2] = 20.6 mmol.L-1, (!) [H2O2] = 36.8 mmol.L-1. (!) [H2O2] = 73.5 mmol.L-1, (!) [H2O2] = 441 mmol.L-1, (♦ ) [H2O2] = 147 mmol.L-1
(mmol.L-1)

7. Conclusions and Recommendations


7.1. Conclusions
241
7.1. Conclusions
The results obtained in the study lead to the following conclusions:
(1) Fenton, photo-Fenton and UV/H2O2 processes happened to be appropriate methods
to efficiently remove nitrobenzene and phenol from aqueous solutions.
(2) Degradation rates of NB and phenol by means of Fenton process can be expressed as
a first-order reaction with respect to NB and phenol concentration. The operating
molar ratios of reactants concentration have been established as follow:
[Compound]o/[H2O2]> 0.016, [Compound]o/[Fe3+]o>0.17 and [H2O2]o/[Fe2+]o> 11.
This reaction rate becomes insensitive to 2 2 H O concentration when H2O2 to
compound molar ratio is higher than ca. 16 and 5 for NB and phenol, respectively.
(3) Although the chemistry of Fenton’s systems involves a rather complex mechanism,
an attempt has been made to fit experimental results to simplistic kinetic model and
empirical kinetic equation. Equations quantitatively predicting NB and phenol
degradation rate under a wide range of experimental conditions has been established
and its precision has been contrasted by comparing them with the experimental data.
Furthermore, our study provided additional insight into mechanistic and kinetic
factors controlling NB and phenol degradation rate in Fenton process.
(4) The identification and quantification of nitrophenols as reaction intermediates in the
treatment of NB by means of the Fenton process suggests that its degradation takes
place by reaction with HO. radical as the oxidant species. Kinetic results and the
comparison of initial products distribution under a wide range of experimental
conditions with other oxidation process support the presence of HO. radicals in this
system.
(5) Direct photolysis of NB under the tested conditions represented a good alternative in
the treatment of this compounds taking into account that e.g. 73 % of mineralization
was reached in 2 hours when solar radiation was used (with artificial light,
percentage of achieved mineralization was ca. 60 %). On the contrary, this method is

7. Conclusions and recommendations
242
not recommended for the treatment of phenol, as mineralization percentage was very
low and in some cases negligible. This different behavior in the studied compounds
is related to their absorbing properties.
(6) Photo-Fenton process was found to be the most effective method in the treatment of
phenol and NB in aqueous solution. Mineralization rate was faster in the case of
phenol, probably favored by the presence of electron-donating groups like HO. The
iron salts used as catalyst in this process could be Fe2+ or Fe3+, as the degree of
mineralization achieved for both species was similar.
(7) The use of solar radiation in the photo-Fenton process is a good alternative in the
treatment of phenol-polluted waters. By this process, complete mineralization of
these solutions was achieved. Besides this, the estimation of the intrinsic kinetic
constants performed for photo-Fenton process represented a significant advance to
better understand this process and the contribution of the light. As it was expected,
the constants obtained in both reactors (solarbox and CPC) are practically the same
since they depend neither on the radiation source nor on the geometry of the reactor.
Thus, lab scale data could be used for pilot plant scale calculations.
(8) The process H2O2/UV has also turned out to be a good treatment method for
mineralization of phenol and NB. The irradiation source presented a big influence in
this process. In this sense, UV 254 nm turned out to be more efficient in comparison
with polychromatic black lamp (300-400 nm) and xenon lamp (300- 560 nm). Some
interesting results were reached when solar radiation was used. For example, 90% of
mineralization was reached for phenol within 2 hours in a parabolic collector. In
spite of these results, this method is not recommended in presence of solar radiation
because the quartz tube used in the photo-reactor to perform these experiments is
very expensive and it is also a type of tube difficult to manage.
(9) Regarding Fe3+/UV-vis and although this process has been presented for some
authors as a real alternative in the treatment of organic compounds, the results
obtained for phenol and NB under the tested conditions were not satisfactory
regarding mineralization of the target compounds. However, it would be feasible to
7.1. Conclusions
243
be used when the objective is the degradation, being used as pretreatment step in
combination with other treatment methods, such as a biological process.
(10) The third studied compound, DCDE, was found to be non-biodegradable by the
activated sludge cultures maintained in the lab. The acclimatation of the cultures to
DCDE did not improve its biodegradability. Besides this, at concentrations lower
than 50 mg L-1, DCDE showed no significant exogenous inhibition to activated
sludge cultures
(11) The intermediates of DCDE produced by H2O2/UV system were significantly more
biodegradable than DCDE itself by both non-acclimated and acclimated to DCDE
cultures. From short, long, and mid-term biodegradation tests, this study
demonstrated the usefulness of the H2O2/UV system as pretreatment method to a
sewage sludge process for the complete mineralization of DCDE.
(12) With regard to the data provided by the different biodegradation tests, results of the
mid-term test would probably contribute mostly to the practical application of the
coupled process by allowing the prediction of expected organic matter removal.
Long-term tests, on the other hand, might predict the toxicity of the reaction
intermediates products on the biomass over extended periods of exposure. Short-term
test provides a rapid alternative method to the conventional 5-days BOD
biodegradability test.
(13) A strategy for the use of a chemical-biological coupled system has been applied to
three different effluents produced in textile industry. This strategy is considered a
very useful tool to be taken into account in such a type of treatment, offering a
general vision of the problem. As two of these effluents (effluent 1 and 3) were
found to be non-biodegradable, photo-Fenton process was used as pretreatment in the
case of effluent 1 and post-treatment in the case of effluent 3.
(13.1) Regarding effluent 1, the biorecalcitrance character was maintained even after
the photo-Fenton treatment. This fact was attributed to the absence of enzymes able
to degrade it and not to its toxicity, but showed that it is not always possible to
successfully apply a coupled chemical-biological system.

7. Conclusions and recommendations
244
(13.2) The post-treatment of effluent 3 by means of the photo-Fenton process showed
to be a good alternative prior to its discharge.
7.2. Recommendations
According to the obtained results, the following recommendations should be taken
into account in order to complete this research:
(1) Regarding the degradation of NB by means of Fenton process, the unknown
intermediates should be identified in order to establish a complete mechanism of
reaction. Besides, a more complete mathematical model could be developed to
validate the empirical one established from Arrhenius equation in the degradation of
NB and phenol.
(2) With regard to the scale-up of photo-reactors, although the estimation of intrinsic
kinetic constants performed represented a significant advance, more experiments
must be performed in order to corroborate the validity of the model proposed.
(3) About the enhancement of the biodegradability of DCDE solutions by means of
UV/H2O2 and taking into account that the acclimatation of the cultures to DCDE did
not improve its biodegradability, alternative approaches to ensure real acclimatation,
such as acclimatation with DCDE oxidation intermediates products rather than pure
DCDE should be carried out. In addition, toxicity studies as a complement to the
inhibition test is to be performed in order to assure the toxicity of DCDE.
(4) Concerning the use of combined chemical-biological process for the treatment of
textile wastewaters, toxicity tests should be carried out in order to determine
appropriately the toxicity of the treated effluent, taking into account that toxicity test
is a very important parameter in the general strategy proposed for wastewater
treatment. Besides, try to identify the organic compounds responsible for the

7.2. Recommendations
245
biorecalcitrance. Finally, other advanced oxidation processes could be applied in
order to study their efficiency in comparison with photo-Fenton process in the
biodegradability enhancement of the textile wastewater.

8. Glossary


8. Glossary
249
Symbols
Unit
A Arrhenius equation coefficient
At Total absorbance of the effluent
b Optic way cm
C Concentration mol.L-1
Co Initial concentration mol.L-1
d Inner diameter cm-1
Ea Activation energy kJ.mol-1
Fλ Source of photons factor
Io Ultraviolet incident radiation Einsteins.L-1.s-1
kdark First-order rate constant for Fenton-dark min-1
kd Second-order rate constant L.mol-1s-1
killuminated Intrinsic kinetic constant L.Einstein-1s-1
kobs Pseudo-first-order rate constant min-1
Ks Half-saturation constant in Monod gr.cm-3
noox Amount of initials mol mol
nox Amount of mol mol
Q Accumulate energy per unit of volume kJ.L-1
R Universal gas constant J.mol-1.K-1
RD Degradation rate L.mol-1s-2
Rox Intensive reaction rate mol.m-3s-1
S Concentration of substrate in Monod equation mol.L-1
td Decomposition time min
t99 Time required for 99% of conversion s
t Time min
T Temperature K, oC
V Volume L
Villuminated Volume of illuminated zone L
Wabs
We
Absorbed radiation
Photon flow entering to the reactor
µEinsteins s-1
µEinsteins s-1

8. Glossary
250
Greek alphabetic
Unit
φ Quantum yield mol. mol photón-1 =
mol.Einstein-1
εH2O2 The absorbency of hydrogen peroxide L.mol-1cm-1
λ Wavelength nm
µ Absorption; Specific growth rate cm-1, s-1
μmax Maximum specific growth rate s-1
η Fraction of light absorbed by H2O2
Abbreviations
Unit
AOP Advanced Oxidation Processes
BOD Biological Oxygen Demand mg O2.L-1
DCDE
COD
Dichlorodiethyl Ether
Chemical Oxygen Demand
mg O2.L-1
CPC Compound Parabolic Collector
FNX
FPX
HPLC
Experiments with NB by means of Fenton process
Experiments with phenol by means of Fenton process
High Performance Liquid Chromatography
MLSS
mo
Mixed Liquor Suspended Solid
Microorganisms
mg.L-1
MSS
N
NB
Mineral Salt Solution
Normal concentration
Nitrobenzene
eq.L-1
NBX
Experiments with phenol by means of UV-based
processes
PTC Parabolic Trough Collector
PhX
Experiments with phenol by means of UV-based
processes
RAS Activated Sludge Reactor

8. Glossary
251
TOC Total Organic Carbon mg C.L-1
UV Ultraviolet radiation
UVG Global Ultraviolet radiation

9. Publications derived from this work


9. Publications
255
9.1 Publications
Rodriguez, M., Timokhin, V., Contreras, S., Chamarro, E., and Esplugas, S. (2003) “Rate
equation for the degradation of nitrobenzene by Fenton-like reagent”, Advances in
Environmental Research, 7:583-595.
Rodriguez, M., Ben Abderrazik, N., Contreras, S., Chamarro, E., Gimenez, J. and
Esplugas, S. (2002) “ Iron (III) photooxidation of organic compounds in aqueous
solutions”, Appl. Cat. B-Environ., 37:131-137.
Rodriguez, M., Timokhin, V. N., Michl, F., Contreras, S., Gimenez, J. and Esplugas, S.
(2002) “ The influence of different irradiation sources on the treatment of
nitrobenzene”, Catalysis Today, 76:291-300.
Rodriguez, M., Sarria, V., Esplugas, S. and Pulgarin, C. (2002) “ Photo-Fenton treatment
of a biorecalcitrant wastewater generate in textile activities. Biodegradability
enhancement of the photo-treated solutions”, J. Photochem. Photobiol. A:Chemistry,
151:129:135.
Rodriguez, M., Kirchner A., Contreras, S., Chamarro, E. and Esplugas, S. (2000)
“Influence of H2O2 and Fe3+ in the photodegradation of nitrobenzene”, J. Photochem.
Photobiol. A:Chemistry, 133:123-127.
9.2. Communications
- 8th International Conference on Advanced Oxidation Technologies for Water and Air
Remediation (Toronto (Canada), November 17-21, 2002): “Photo-Fenton treatment
of a biorecalcitrant wastewater generate in textile activities. Biodegradability
enhancement of the photo-treated solutions”, oral presentation.
- 2nd European Meeting on Solar-chemistry and Photocatalysis: Environmental
Applications. (Saint-Avold (France), May 29-31, 2002): “Mineralization of
nitrobenzene in aqueous solution using sun light”, poster presentation.
9. Publications
256
- 2nd European Meeting on Solar-chemistry and Photocatalysis: Environmental
Applications. (Saint-Avold (France), May 29-31, 2002): “Limiting factors in
connect of a photochemical and biological system to treat wastewater coming from
the textile industry: A real case”, poster presentation.
- 2nd European Workshop on Water, Air and Soil Treatment by Advanced Oxidation
Technologies (Poitiers (France), February 28- March 2, 2001): “Dark and
phtoassited mineralization of phenol, aniline and nitrobenzene”, oral presentation.
- 5to Congreso de Fotoquímica, COFT-5 (Torremolinos (Málaga, España), Abril 1-4,
2001):” The photo-Fenton process reaction an effective photochemical process in
the treatment of phenol, nitrobenzene an aniline”, oral presentation.
- 2nd International Conference on Oxidation Technologies for Water and Wastewater
Treatment (Clausthal-Zellerfeld (Germany), May 29-31, 2000): “Iron (III)
photooxidation of aromatic compounds”, poster presentation.
- 2nd International Conference on Oxidation Technologies for Water and Wastewater
Treatment (Clausthal-Zellerfeld (Germany), May 29-31, 2000): “Kinetic of phenol
removal by Fenton’s reagent”, poster presentation.
- 8th Mediterranean Congress on Chemical Engineering (Barcelona (Spain), 10-12
November 1999): “Efficiency of the degradation of phenolic compounds by the
Fe3+/H2O2 process ”, poster presentation.
- 8th Mediterranean Congress on Chemical Engineering (Barcelona (Spain), 10-12
November 1999): “Removal of phenol in aqueous solution by Fenton reagent”,
poster presentation.
- 4to Congreso de Fotoquímica, COFT-4 (Gandía, (Valencia, España), Marzo 21-24,
1999): “Influence of H2O2 and Fe3+ in the photodegradation of nitrobenzene ”, oral
presentation.

10. Bibliography


10. Bibliography
259
Adams, C., Randall, A. and Byung, J. (1997) “Effects of ozonation on the biodegradability
of substituted phenols”, Wat. Res., 31: 2655-2663.
Ajona, J. and Vidal, A. (2000) “The use of CPC collectors for detoxification of
contaminated water: Design, construction and preliminary results”, Solar Energy, 68:
109-120.
Akata, A. and Gurol, M. (1992) “Photocatalytic oxidation process in the presence of
polymers”, Ozone Sci. & Eng., 14: 367-380.
Alaton, I. and Balcioglu, I. (2002) “The effect of pre-ozonation on the H2O2/UV treatment
of raw and biological pre-treated textile industry wastewater”, Water Sci. Technol.,
45: 297-304.
Alonso y del Pino, M. (1996) “ Aspectos fundamentals y practices de la aplicación de
sistemas de oznación en la eliminación de contaminantes nitroaromáticos del agua”,
Doctoral Thesis, Departamento de Ingeniería Química, Universidad de Extremadura.
Anderson, J., Link, H., Bohn, M. and Gupta, B. (1991) “Development of U.S. solar
detoxification technology: An introduction”, Solar En. Mat., 24: 538-549.
Andreozzi, R., Caprio, V., Insola, A. and Marotta, R. (1999) “Advanced Oxidation
Processes (AOP) for water purification and recovery”, Catalysis Today, 53: 51-59.
Arnold, S., Hickey, W. and Harris, R. (1995) “Degradation of atrazine by Fenton's reagent:
Condition optimization and product quantification”, Environ. Sci. Technol., 29:
2083-2089.
ASTM: American Society for Testing and Materials, (1987a) “Standards tables for
terrestrial direct normal solar spectral irradiance for air mass 1.5”, Designation:
E891-87.
ASTM: American Society for Testing and Materials, (1987b) “Standard Tables for
Terrestial Solar Spectral Irradiance at Air Mass 1.5 for a 37º Tilted Surface”,
Designation: E892-87.
Bahnemann, D., Cunningham, J., Fox, M., Pelizzetti, E., Serpone, N. (1994)
“Photocatalytic treatment of waters”, Aquatic and surface photochemistry. G. R.
Helz, R. G. Zepp,D. G. (eds.). Lewis Publishiers: 261-316.

10. Bibliography
260
Balanosky, E., Fernandez, J., Kiwi, J. and Lopez, A. (1999) “Degradation of membrane
concentrates of the textile industry by Fenton like reactions in iron-free solutions at
biocompatible pH values”, Water Sci. Technol., 40: 417-424.
Balcioglu, I. and Arslan, I. (1999) “Treatment of textile industry wastewater by enhanced
photocatalytic oxidation reaction”, Journal of Advanced Oxidation Technologies, 4:
189-195.
Balcioglu, I. and Arslan, I. (2001) “Partial oxidation of reactive dyestuffs and synthetic
textile dye-bath by the O3 and O3/H2O2 processes”, Water Sci. Technol. 43: 221-228.
Bandara, J., Nadtochenko, V., Kiwi, J. and Pulgarin, C. (1997) “Dynamics of oxidant
addition as a parameter in the modeling of dye mineralization (Orange-II) via
Advanced Oxidation Technologies”, Water. Sci.& Technol., 35: 87-93.
Barb, W., Baxendale, J., George, P. and Hargrave, K. (1951) “Reactions of ferrous and
ferric ions with hydrogen peroxide. Part I. The ferrous ion reaction”, Transacions of
the Faraday Society, 47: 462-500.
Bauer, R., Waldner, G., Fallmann, H., Hager, S., Klare, M., Krutzler, T., Malato, S. and
Maletzky, P. (1999) “The photo-fenton reaction and the TiO2/UV process for waste
water treatment - novel developments”, Catalysis Today, 53: 131-144.
Baxendale, J. and Wilson, J. (1957) “The photolysis of hydrogen peroxide at high light
intensities”, Transacions of the Faraday Society, 53: 344-356.
Beltran, F. J., Encinar, J. M. and Alonso, M. A. (1998) “Nitroaromatic hydrocarbon
ozonation in water. 2. Combined ozonation with hydrogen peroxide or UV
radiation”, Ind. Eng. Chem. Res., 37: 32-40.
Beltrán, F., González, M. and Alvarez, P. (1997) “Tratamiento de aguas mediante
oxidación avanzada (I): Procesos con ozono, radiación ultravioleta y combinación
ozono/radiación ultravioleta”, Ingenieria Química, 331: 161-168.
Benitez, F., Beltran, F., Acero, J. and Pinilla, M. (1997) “Ozonation of phenolic acids
present in wastewater from olive mills”, Ind. Eng. Chem. Res., 36: 638-644.
Benitez, F., Beltran-Heredia, J., Acero, J. and Rubio, F. (2000) “Contribution of free
radicals to chlorophenols decomposition by several advanced oxidation processes”,
Chemosphere, 41: 1271-1277.

10. Bibliography
261
Benkelberg, H. and Warneck, P. (1995) “Photodecomposition of iron (III) hydroxo and
sulfate complexes in aqueous solution. Wavelength dependence of OH and SO4-
quantum yields”, J. Phys. Chem., 99: 5214-5221.
Bielsky, B., Cabelli, D., Arudi, R. and Ross, A. (1985) “Reactivity of HO2/O2 radicals in
aqueous solution”, J.Phys.Chem., 14: 1041-1100.
Bigda, R. (1995) “Consider Fenton's chemistry for wastewater treatment”, Chem. Eng.
Progr., 91: 62-66.
Bishop, D., Stern, G., Fleischman, M. and Marshall, L. (1968) “Hydrogen peroxide
catalytic oxidation of refractory organics in municipal waste waters”, Ind. Eng.Chem.
Res., 1: 110-117.
Blanco, G. and Rodríguez, L. (1993) “Descontaminación de aguas residuales mediante
fotocatálisis solar”, Ingenieria Química, 286: 129-137.
Blanco, J. and Malato, S. (1992) Proceedings of the Sixth International Symposium on
Solar Termal Concentrating Technology, Mojacar, CIEMAT, Madrid.
Blanco, J. and Malato, S. (1996) “Tecnología de Fotocatálisis Solar.” Cuadernos
Monográficos 31. Instituto de Estudios Almerienses de la Diputación de Almería.
Almería ,España.
Blanco, J. and Malato, S. (2001) “Solar detoxification”, UNESCO. Natural Sciences,
World Solar Programme, 1996-2005, http://www.unesco.org/science/wsp).
Blanco, J., Malato, S., Fernandez, P., Vidal, A., Morales, A., Trincado, P., Oliveira, J.,
Minero, C., Musci, M., Casalle, C., Brunotte, M., Tratzky, S., Dischinger, N.,
Funken, K., Vincent, M., Collares-Pereira, M., Mendes, J. and Rangel, C. (2000)
“Compound parabolic concentrator technology development to commercial solar
detoxification applications”, Solar Energy, 67: 317-330.
Blanco, J., Malato, S., Milow, B., Maldonado, M. I., Fallmann, H., Krutzler, T. and Bauer,
R. (1999) “Techno-economical assessment of solar detoxification systems with
compound parabolic collectors”, J. Phys. IV (9): 259-264.
Blesa, M. (2001) “Introducción: Eliminación de contaminantes por fotocatálisis
heterogénea”. Usos de óxidos semiconductores y materiales relacionados para
aplicaciones medioambientales y ópticas, M.A. Blesa eds., Digital Grafic, xi-xiv, La
Plata, Argentina.

10. Bibliography
262
Bohn, B. and Zetzsch, C. (1999) “Gas-phase reaction of the OH-benzene adduct with O2:
reversibility and secondry formation of HO2”, Phys. Chem., 1: 5097-5109.
Bossmann, S., Oliveros, E., Gob, S., Siegwart, S., Dahlen, E., Payawan, L., Straub, M.,
Worner, M. and Braun, A. (1998) “New evidence against hydroxyl radicals as
reactiveintermediates in the thermal and photochemically enhanced Fenton
reactions”, J. Phys.Chem. 102: 5542-5550.
Boudenne, J., Cercleir, O., Galéa, J. and Van Der Vlist, E. (1996) “Electrochemical
oxidation of aqueous phenol at a carbon black slurry electrode”, Appl. Catal.
B:Environ., 143-185.
Brand, N., Mailhot, G. and Bolte, M. (1997) “Degradation and photodegradation
oftetraacetylethylenediamine (TAED) in the presence of Iron (III) in aqueous
solution”, Chemosphere, 84: 2637-2648.
Braun, A., Maurette, M. and Oliveros, E. (1986) “Technologie photochimique”,
Pestic.Sci., 10: 177-180.
Brillas, E., Calpe, J. and Casado, J. (2000) “Mineralization of 2,4-D by advanced
electrochemical oxidation processes”, Wat. Res, 34: 2253-2262.
Brillas, E., Mur, E., Sauleda, R., Sanchez, L., Peral, J., Domenech, X. and Casado, J.
(1998a) “Aniline mineralization by AOPs: anodic oxidation, photocatalysis, electro-
Fenton and photo-electro-Fenton processes”, Appl. Catal. B: Environ., 16: 31-42.
Brillas, E., Sauleda, R. and Casado, J. (1998b) “Degradation of 4-chlorophenol by anodic
oxidation, electro-Fenton, photoelectro-Fenton and peroxicoagulation processes”, J.
Electrochem. Soc., 145: 2253-2262.
Cañizares, P., Dominguez, J., Rodrigo, M., Villaseñor, J. and Rodriguez, J. (1999) “Effect
of the current intensity in the electrochemical oxidation of aqueous phenol wastes at
an activated carbon and steel anode”, Ind. Eng. Chem. Res., 38: 3779-3785.
Carter, S., Stefan, M., Bolton, J. and Amiri, A. (2000) “UV/H2O2 treatment of methyl ter-
buthyl ether in contaminated waters”, Environ. Sci.& Technol., 34: 659-662.
Catastini, C., Mohamed, S., Gilles, M. and Bolte, M. (2002) “Iron (III) aquacomplexes as
effective photocatalysts for the degradation of pesticides in homogeneous aqueous
solutions”, The Science of The Total Environment, 298: 219-228.

10. Bibliography
263
Catastini, C., Sarakha, M., Mailhot, G. and Bolte, M. (2001) “Direct and induced
phototransformation of sulfanilamide in aqueous solution. Joint meeting of the
Italian, French, and Swiss photochemistry groups, Lausanne, Switzerland.
Cervera, S. and Esplugas, S. (1983) “Obtención de hidrógeno mediante fotólisis del agua”,
Energía , 9: 103-107.
Chamarro, E., A., M. and Esplugas, S. (2001) “Use of Fenton reagent to inprove organic
chemical biodegradability”, Wat. Res., 35: 1047-1051.
Chamarro, E., Marco, A., Prado, J. and Esplugas, S. (1996) “Tratamiento de aguas y aguas
residuales mediante utilización de procesos de oxidación avanzada”, Química &
Industria, 1, 28-32.
Chamberlin, N. and Griffin, A. (1952) “Chemical oxidation of phenolic wastes with
chlorine”, Sewage and Industrial Wastes, 24: 750-756.
Chen, R. and Pignatello, J. (1997) “Role of quinone intermediates as electron shuttles in
Fenton and photoassisted Fenton oxidations of aromatic-compounds”, Environ. Sci.
Technol., 31: 2399-2406.
Chuang, T., Cheng, S. and Tong, S. (1992) “Removal and destruction of benzene, toluene
and xylene from wastewater by air stripping and catalytic oxidation”, Ind. Eng.
Chem. Res., 31: 2466-2472.
Ciardelli, G., Capannelli, G. and Bottino, A. (2001) “Ozone treatment of textile wastewater
for reuse”, Water Sci. & Technol., 44: 61-67.
Colucci, J., Montalvo, V., Hernandez, R. and Poullet, C. (1999) “Electrochemical
oxidation potential of photocatalyst reducing agents”, Electrochimica Acta, 44, 2507-
2514.
Comminellis, C. (1994) “Electrochemical oxidation of organic pollutants for waste water
treatment”, Studies on Environmental Science, 59.
Comninellis, C. and Pulgarin, C. (1993) “Electrochemical oxidation of phenol for waste-
water treatment using SnO2 anodes”, J. Appl. Electrochem., 23: 108-112.
Contreras, S., Rodríguez, M., Chamarro, E., Esplugas, S. and Casado, J. (2001) “Oxidation
of nitrobenzene by O3/UV: The influence of H2O2 and Fe(III). Experiences in a pilot
plant”, Water Sci. Technol., 44: 39-46.

10. Bibliography
264
Costa, J., Esplugas, S. and Parejo, C. (1975) “Reactores fotoquimicos”, Ingenieria
Química, 71: 37-48.
Curco, D., Malato, S., Blanco, J. and Gimenez, J. (1996a) “Photocatalysis and radiation
absorption in a solar plant”, Solar Energy, 44: 199-217.
Curco, D., Malato, S., Blanco, J., Gimenez, J. and Marco, P. (1996b) “Photocatalytic
degradation of phenol: comparison between pilot-plant-scale and laboratory results”.
Solar Energy, 56: 387-400.
Davis, M., Turley, J., Casserly, D. and Guthrie, R. (1983) “Partitioning of selected organic
pollutants in aquatic ecosystems”, Biodeterioration 5 Oxley Ta & Barry S. Eds., 176-
184.
De Laat, J. and Gallard, H. (1999) “Catalytic decomposition of hydrogen peroxide by
Fe(III) in homogeneous aqueous solution: mechanism and kinetic modeling”,
Environ. Sci. & Technol., 33: 2726-2732.
De Laat, J., Gallard, H. and Legube, B. (1999) “Comparative study of the oxidation of
atrazine and acetone by H2O2/UV, Fe(III)/UV, Fe(III)/H2O2/UV and Fe(II) or
Fe(III)/H2O2”, Chemosphere, 39: 2693-2706.
Dempsey, C. and Oppelt, E. (1993) “Incineration of hazardous waste: A critical review”,
Air and Waste, 43: 25-73.
Dixon, W. T. and Norman, R. (1964) “Electron spin resonance of oxidation. Part III. Some
alicyclic compounds”, J.Chem.Soc. 4850-4860.
Duguet, J., Anselme, C., Mazounie, P. and Mallevialle, J. (1989) “Application of combined
ozone-hydrogen peroxide for the removal of aromatic compounds from a ground
water”, Ozone Sci. & Eng., 12: 281-284.
Eckenfelder, W., Argaman, Y. and Miller, E. (1989) “Process selection criteria for the
biological treatment of industrial wastewaters”, Environmental Progress, 8: 40-45.
EEC. (1992) “List of Council Directives 76/4647”, Brussels, Belgium, European Economic
Community.
Eisenhauer, H. (1964) “ Oxidation of phenolic wastes: I.Oxidation with hydrogen peroxide
and a ferrous salt reagent”, J. Water Pollut. Control Fed., 36:1116-1128.
EPA “site”. www.scorecard.org. visited on Octuber 2002.

10. Bibliography
265
Ertas, T. and Gurol, M. (2002) “Oxidation of diethylene glycol by ozone and modified
Fenton”, Chemosphere, 47: 293-301.
Ertas, T. and Gurol, M. (2003) “Treatment of dichlorodiethyl ether by ozono, Fenton
reagent and H2O2/UV”, Submitted to Environ. Sci. &Technol.
Esplugas, S. (1981) “The elliptical photo-reactor”, Afinidad, 38: 315-318.
Esplugas, S. (1983) “Calculo de fotoreactores tubulares” Cuaderns d'enginyeria, 4: 115-
125.
Esplugas, S., Gimenez, J., Contreras, S., Pascual, E. and Rodriguez, M. (2002)
“Comparison of different advanced oxidation processes for phenol degradation”,
Wat. Res., 36: 1034-1042.
ETPI survey. http://www.etpi.org, visited in January 2003.
Faust, B. and Hoigne, J. (1990) “Photolysis of Fe(III) - hydroxy complexes as sources of
OH radicals in clouds, fog and rain”, Atmos. Environ, 24A: 79-89.
Feng, W. and Nansheng, D. (2000) “Photochemistry of hydrolytic iron (III) species and
photoinduced degradation of organic compounds. A minireview”, Chemosphere, 41:
1137-1147.
Fenton, H. (1894) “Oxidation of tartaric acid in presence of iron”, J. Chem. Soc. Trans.,
65: 899-910.
Fernando, S., Garcia , E., Luciano, C., Capparelli, A., Braun, A. and Oliveros, E. (2002)
“Degradation of nitroaromatic compounds by the UV-H2O2 process using
polychromatic radiation sources”, Photochem. Photobiol. Sci., 1: 520-525.
Fisher.www.sihersci.ca/msds.nsf/96cb2019dad1311a5256670001d92b9/(visited December
2000).
Froelich, E. (1992) “Advanced chemical oxidation of contaminated water using the perox-
pure oxidation system”, Water Pollut.Res.J. Canad., 27: 169-183.
Gallard, H. and De Laat, J. (2000) “Kinetic modelling of Fe(III)/H2O2 oxidation reactions
in dilute aqueous solution using atrazine as a model organic compound”, Wat. Res.,
34: 3107-3116.
10. Bibliography
266
Gallard, H., De Laat, J. and Legube, B. (1999) “Spectrophotometric study of the formation
of iron(III)-hydroperoxy complexes in homogeneus aqueous solutions”, Wat. Res.,
33: 2929-2936.
García, J., Diez, F. and Coca, J. (1989) “Métodos alternativos para el tratamiento de
efleuntes fenólicos industriales” , Ingenieria Química, 238: 151-158.
Genium, (1993) “Material safety data sheet No.571”, Genium Publishing Corporation
Schenectady, NY.
Gilbert, E. (1987) “Biodegradability of ozonation products as a function of COD and DOC
elimination by example of substituted aromatic substances”, Wat. Res., 21: 1273-
1278.
Gimenez, J., Curco, D. and Queral, M. A. (1999) “Photocatalytic treatment of phenol and
2,4-dichlorophenol in a solar plant in the way to scaling-up”, Catalysis Today, 54:
229-243.
Gimenez, J., Curco, D., Malato, S. and Blanco, J. (1996) “Photocatalysis and radiation
absorption in a solar plant”, Solar Energy Materials and Solar Cells, 44: 199-217.
Givens, S., Brown, E., Gelman, S., Grady, C. and Skedsvold, D. (1991). “Biological
process design and pilot testing for carbon oxidation, nitrification and denitrification
system”, Environmental Progress, 10: 133-146.
Glaze, W. and Chapin, D. (1987) “The chemistry of water treatment processes involving
ozone, hydrogen peroxide and ultraviolet radiation”, Ozone Sci. & Eng., 9: 335-342.
Glaze, W. and Kang, J. (1989) “Advanced oxidation processes. Test of a kinetic model for
the oxidation of organic compounds with ozone and hydrogen peroxide in a
semibatch reactor”, Ind. Eng. Chem. Res., 28: 1580-1587.
Glaze, W., Lay, Y., Kang, J. (1995) “ Advanced oxidation processes. A kinetic model for
the oxidation of 1,2-dibromo-3-chloropropane in water by the combination of
hydrogen peroxide and UV radiation”, Ind. Eng. Chem. Res., 34:2314-2323.
Goldstein, S. (1999) “Comments on the mechanism of the "Fenton-Like" reaction”, Am.
Chem. Soc., 32: 547-550.
González, V. (1993) “Estudios de biodegradabilidad de efluentes industriales”, Ingenieria
Química, 260: 97-101.

10. Bibliography
267
Groves, J. T. and Watanabe, Y. (1986) “Oxygen activation by metalloporhyrins related to
peroxidase and cytochromo P-450. Direct observation of the O-O bond cleavage
step”, J.Am.Chem.Soc., 108: 7834-7836.
Guittonneau, S., De Laat, J., Duguet, J. P., Bonnel, C. and Dore, M. (1990) “Oxidation of
parachloronitrobenzene in dilute Aqueous solution by O3 + UV and H2O2 + UV: A
comparative study”, Ozone Sci. & Eng., 12: 73-94.
Guittonneau, S., Glaze, W., Duguet, J. and Wable, O. (1991) “Characterization of natural
waters for potential to oxidize organic pollutants with ozone”, Proc. 10th Ozone
World Congress, Zürich, Switzerland.
Gulyas, H. (1997) “Processes for the removal of recalcitrant organics from industrial
wastewater”, Water Sci. Technol., 36: 9-16.
Gurol, M. and Vastistas, R. (1987) “Oxidation of phenol compounds by ozone and
ozone+UV radiation: a comparative study”, Wat. Res., 21: 895-900.
Gutierrez, M., Pepio, M., Crespi, M. and Mayor, N. (2001) “Control factors in the
electrochemical oxidation of reactive dyes”, Coloration Technology, 117: 356-361.
Haber, F. and Weiss, J. (1934) “The catalytic decomposition of hydrogen peroxide by iron
salts”, J. Proc. Roy. Soc. London A, 147: 332-351.
Hardwick, T. J. (1957) “The kinetics of the oxidation of ferrous ion by hydrogen peroxide
in the presence of dissolved hydrogen and carbon monoxide”, Can. J. Chem., 35:
437-443.
Harrinson, R. (1992) “Pollution: Causes, effects and control”, 2ª ed., The Royal Society of
Chemistry , Cambridge.
Hashimoto, S., Miyata, T. and Washino, M. (1979) “A liquid chromatographic study on the
radiolysis os phenol in aqueous solution”, Environ Sci.& Technol., 13: 71-79.
Hayward, K. (1999) “Drinking water contaminant hit-list for US EPA”, Water 21,
September-October, 4.
Heidt, L., Tregay, G. and Middleton, F. (1979) “Influence of the pH upon the photolysis
of the uranyl oxalate actinometer system”, J.Phys.Chem., 74: 1876-1882.

10. Bibliography
268
Heinzle, E., Stockinge, H., Stern, M., Fahmy, M. and Kut, O. (1995) “Combined
biological-chemical (ozone) treatment of wastewaters containing chloroguaiacols”,
J.Chem. Tech. Biotechnol., 62: 241-252.
Henze, M. (1992) “Characterization of wastewater for modeling of activated sludge
processes”, Water Sci. Technol., 25: 1-15.
Hislop, K. and Bolton, J. (1999) “The Photochemical generation of hydroxyl radicals in
the UV-vis/ferrioxalate/H2O2 system”, Environ. Sci. Technol., 33: 3119-31226.
Hoigné, J. and Bader H. (1983) “Rate constants of reaction of ozone with organic and
inorganic compounds in water. Part II. Dissociating organic compounds”, Wat. Res.,
17: 185-194.
Howard, P. (1989) “Handbook of environmental fate and exposure data for organic
chemical. Volume I Large production and priority pollutants”, Lewis Publishers,
Chelsea, Michigan (USA).
Hulstrom, R., Bird, R. and Riordan, C. (1985) “Spectral solar irradiance data sets for
selected terrestial conditions”, Solar Cells, 15: 365-391.
Hunt, J. and Taube, H. (1952) “Effect of temperature, pressure, acidity and solvent on an
aquo ion exchange reaction”, J.Am.Chem.Soc., 78: 1273-1279.
IFTH, French Textile Instituted-Habillement, www.ifth.org (visited on Octuber 2001).
Iqbal, M. (1983) “An introduction to solar radiation”, Canada, Academic Press.
Kabdasli, I. and Gurel, M. (2000) “Characterization and treatment of textile printing
wastewaters”, Environmental Technology, 21: 1147-1155.
Kakko, R., Christiansen, V., Mikkola, E., Kallonen, R., Smith-Hansen, L. and Jorgensen,
K. (1995) “Toxic combustion products of three pesticides”, J. Loss Prev. Process
Ind., 8: 127-132.
Kaludjerski, M. (2001) “Enhancement of biodegradability of dichlorodiethyl ether by pre-
oxidation”, Master of Science Thesis, San Diego State University ,CA, USA.
Kameya, T., Murayama, T., Kitano, M. and Urano, K. (1995) “Testing and classification
methods for the biodegradabilities of organic compounds under anaerobic
conditions”, The Science of The Total Environment, 170: 31-41.
10. Bibliography
269
Kang, S., Liao, C. and Po, S. (2000) “Decolorization of textile wastewater by photo-fenton
oxidation technology”, Chemosphere, 41: 1287-1294.
Kannan, N. (1995) “Removal of phenolic compounds by electroxidation method”, J.
Environ. Sci. Health, 30: 2185.
Karametaxas, G., Hung, S. and Sulzberger, B. (1995) “Photodegradtion of EDTA in the
presence of lepidocrite”, Environ. Sci.& Technol., 29: 2992-3000.
Kawaguchi, H. (1992) “Photooxidation of phenol in aqueous solution in the presence of
hydrogen peroxide”, Chemosphere, 24: 1707-1712.
Kean, R. T., Oertling, W. A. and Babcock, G. T. (1987) “Characterization of six-
coordinate ferryl protoheme by resonance raman and optical absorption
spectroscopy”, J.Am.Chem.Soc., 109: 2185-2185.
Kolthoff, I. and Medalia, A. (1949) “The reaction between ferrous Ion and peroxides. I.
Reaction with hydrogen peroxide in the absence of oxygen”, J. Am. Chem. Soc., 71:
3777-3783.
Kremer, M. (1999) “Mechanism of the Fenton reaction. Evidence for a new intermediate”,
Phys. Chem., 1: 3595-3607.
Kremer, M. and Stein, G. (1977) “Kinetics of the Fe3+ ion-H2O2 reaction: steady-state and
terminal-state analysis”, International Journal of Chemical Kinetics, IX: 179-184.
Krutzler, T. and Bauer, R. (1999) “Optimization of a photo-Fenton prototype reactor”,
Chemosphere, 38: 2517-2532.
Ku, Y. and Ho, S. (1990) “The effect of oxidants on UV destruction of chlorophenols”,
Environmental Progress, 9: 218-221.
Kunai, A., Hata, S., Ito, S. and Sasaki, K. (1986) “The role of oxygen in the hydroxylation
reaction of benzene with Fenton's reagent. O tracer study”, J. Am. Chem. Soc., 108:
6012-6016.
Lanouette, K. (1977) “Treatment of phenolic wastes”, Chem. Eng., 17: 99-106.
Ledakowicz, S. (1998) “Integrated processes of chemical and biological oxidation of
wastewaters”, Environ. Protect. Eng., 24: 35-47.
Legrini, O., Oliveros, E. and Braun, A. M. (1993) “Photochemical processes for water-
treatment”, Chem. Rev., 93: 671-698.
10. Bibliography
270
Lewis, R., Ed. (1991) “Hazardous Chemicals Desk Reference”, 2a ed.,Van Nostrand
Reinhold, New York. NY.
Li, K., Chang, S. and Yu, C. (2000) “Treatment of chlorohydrocarbon contaminated
groundwater by air stripping”. International Conference on Remediation of
Chlorinated and Recalcitrant Compounds, 2nd, Monterey, CA, United States, May
22-25 : 293-300.
Li, L., Peishi, C. and Earnest, F. (1991) “Generalized kinetic model for wet oxidation of
organic compounds”, AIChE J., 37: 1687-1697.
Li, Z. and Comfort, D. (1998) “Nitrotoluene destruction by UV-catalyzed Fenton
oxidation”, Chemosphere, 36: 1865-1865.
Liao, C. and Gurol, M. (1995) “Chemical oxidation by photolytic decomposition of
hydrogen peroxide”, Environ. Sci. & Technol., 29: 3007-3014.
Lin, S. and Chen, M. (1997) “Treatment of textile wastewater by chemical methods for
reuse”, Wat. Res., 31: 868-876.
Lin, S. and Chuang, T. (1994) “Combined treatment of phenolic wastewater by wet
air-oxidation”, Toxical. Environ. Chem., 44: 243-258.
Lin, S. and Gurol, M. (1998) “Catalytic decomposition of hydrogen peroxide on iron
oxide: Kinetics, mechanisms and implications”, Environ. Sci.& Technol., 32: 1417-
1423.
Lin, S. and Lai, C. (2000) “Kinetic characteristics of textile wastewater ozonation in
fluidized and fixed activated carbon beds”, Wat. Res., 34: 763-772.
Lin, S. and Peng, C. (1994) “Treatment of textile wastewater by electrochemical method”,
Wat. Res., 28: 277-282.
Lin, S., Lin, C. and Leu, H. (1999) “Operating characteristics and kinetic-studies of
surfactant wastewater treatment by Fenton oxidation”, Wat. Res., 33: 1735-1741.
Lindsey, M. E. and Tarr, M. A. (2000) “Quantification of hydroxyl radical during Fenton
oxidation following a single addition of iron and peroxide”, Chemosphere, 41: 409-
417.
Lipczynska-Kochany, E. (1991) “Degradation of aqueous nitrophenols and nitrobenzene
by means of the Fenton reaction”, Chemosphere, 22: 529-536.

10. Bibliography
271
Lipczynska-Kochany, E. (1992) “Degradation of nitrobenzene and nitrophenols by means
of advanced oxidation processes in a homogeneous phase: Photolysis in the presence
of hydrogen peroxide versus the Fenton reaction”, Chemosphere, 24: 1369-1380.
Lipczynska-Kochany, E. and Bolton, J. (1992) “Flash photolysis/high-performance liquid
chromatography method for studying the sequence of photochemical reactions:
Direct photolysis of phenol”, Environ. Sci.& Technol., 26:2524-2527.
Lipczynska-Kochany, E., Sprah, G. and Harms, S. (1995) “Influence of some groundwater
and surface waters constituents on the degradation of 4-Chlorophenol by the Fenton
reaction”, Chemosphere, 30: 9-20.
Litvintsev, I., Mitnik, Y. and Mikhailyuk, A. (1993) “Kinetics and mechanism of catalytic
hydroxylation of phenol by hydrogen peroxide. II. Modeling of the initial stage in the
presence of catalytic system Fe2+/pyrocathechol; Influence of initial reactants”,
Kinetics and Catalysis, 34: 73-77.
Loebl, H., Stein, G. and Weiss, J. (1949) “Hydroxylation of nitrobenzene”, J.Chem.Soc.,
2704-2709.
Macfaul (1998) “A radical account of "Oxigenated Fenton Chemistry"”, Acc. Chem. Res.,
31: 159-162.
Malaiyandi, M., Sadar, H. and Lee, P. (1980) “Removal of organic in water using
hydrogen peroxide in presence of ultraviolet light”, Wat. Res., 14: 1131-1135.
Malato, S. (1999) “Solar photocatalytic decomposition of pentachlorophenol dissolved in
water”, Editorial CIEMAT, Madrid, Spain.
Malato, S., Blanco, J., Richter, C. and Maldonado, M. (2000b) “Optimization of pre-
industrial solar photocatalytic mineralization of commercial pesticides Application to
pesticide container recycling”, Appl. Catal. B-Environ., 25: 31-38.
Malato, S., Blanco, J., Richter, C., Curco, D. and Gimenez, J. (1997) “Low-concentrating
CPC collectors for photocatalytic water detoxification: comparison with a medium
concentrating solar collector”, Water Sci. Technol., 35: 157-164.
Malato, S., Blanco, J., Richter, C., Fernandez, P. and Maldonado, M. (2000a) “Solar
photocatalytic mineralization of commercial pesticides: Oxamyl”, Solar Energy
Materials and Solar Cells, 64: 1-14.

10. Bibliography
272
Malato, S., Blanco, J., Vidal, A. and Richter, C. (2002) “Photocatalysis with solar energy
at a pilot-plant scale: An overview”, Appl. Catal. B:Environ., 37: 1-15.
Malato, S., Caceres, J., Agüera, A., Mezcua, M., Vial J. and Fernández-Alba, A. (2001)
“Degradation of imidacloprid in water by photo-Fenton and TiO2 photocatalysis at a
solar pilot plant: A comparative study”, Environ. Sci. & Technol., 35: 4359-4366.
Mansour, M. (1985) “Photolysis od aromatic compounds in water in the presence of
hydrogen peroxide”, Bull. Environ. Contam. Toxicol., 34: 89-95.
Marco, A., Esplugas, S. and Saum, G. (1997) “How and why to combine chemical and
biological processes for wastewater treatment”, Water Sci. Technol., 35: 321-327.
Marhaba, T. and Washington, M. (1998) “Drinking water disinfection and by-products:
History and current practice”, Advanced Environ. Res., 2: 103-115.
Masselli, J., Masselli, N. and Burford, M. (1970) “Simplifying textile waste pollution
surveys and treatment”, Proc. S. Water Resour. Pollut. Contr. Conf., 19: 37-48.
Matthews, R. (1990) “Purification of water with near-UV illuminated suspensions of
titanium dioxide”, Wat. Res., 24: 653-660.
Matthews, R. and Sangster, D. (1967) “Production of isomeric nitrophenols in radiolysis of
aqueous nitrobenzene solution”, J.Phys.Chem., 71: 4056-4062.
Mazellier, P. and Bolte, M. (1997) “Iron (III) promoted degradation of 2,6-dimethylphenol
in aqueous solution”, Chemosphere, 35: 2181-2192.
Mazellier, P., Bolte, M. (1999) “ Primary mechanism for the iron (III) photoinduced
degradation of 4-chlorophenol in aquoes solution”, New J. Chem., 133-135.
Mazellier, P., Bolte, M. (2001) “ 3-chlorophenol elimination upon excitation of dilute iron
(III) solution: evidence for the only involvement of Fe(OH)2+”, Chemosphere,
42:361-366.
Mazellier, P., Mailhot, G. and Bolte, M. (1997) “Photochemical behavior of the
Iron(III)/2,6-dimethylphenol system”, New J. Chem., 21: 389-397.
Mehos, M. and Turchi, C. (1992) “Measurement and analysis of near ultraviolet solar
radiation”, Solar Eng., 1: 51-55.

10. Bibliography
273
Metcalf & Eddy, Inc (1995) “ Wastewater engineering: treatment, disposal and reuse
(Spanish version)”, 3rd ed., McGraw-Hill, New York, USA.
Mieluch, J., Sadkowski, A., Wild, J. and Zoltowski, P. (1975) “Electrochemical oxidation
of phenol compound in aqueous solution”, Prezm. Chem., 54: 513.
Minero C., Pelizzetti E., Malato S., Blanco J. (1996) “Large solar plant photocatalytic
water decontamination: Effect of operational parameters”, Solar. Energy, 56:421-
428, .
Minero, C., Pelizzetti, C., Piccini, P. and Vinceti, M. (1994) “Photocatalyzed
transformation of nitrobenzene on TiO2 and ZnO”, Chemosphere, 28: 1229-1244.
Minero, C., Pelizzetti, E., Malato, S. and Blanco, J. (1993) “Large solar plant
photocatalytic water decontamination - degradation of pentachlorophenol”,
Chemosphere, 26: 2103-2119.
Mishra, V., Mahajani, V. and Joshi, J. (1995) “Wet air oxidation”, Ind. Eng. Chem. Res.,
34: 2-48.
Mokrini, A., Oussi, D. and Esplugas, S. (1997) “Oxidation of aromatic compounds with
UV radiation/ozone/hydrogen peroxide” , Water Sci. Technol., 35, 95-102.
Munter, R., Preis, S., Kallas, J., Trapido, M. and Veressinina, Y. (2001) “Advanced
oxidation processes (AOPs): Water treatment technology for the twenty-first
century”, Kemia-Kemi, 28: 354-362.
Nansheng, D., Tao, F. and Shizhong, T. (1996) “Photodegradation of dyes in aqueous
solutions containing Fe(III)--hydroxy complex I. Photodegradation kinetics”,
Chemosphere, 33: 547-557.
Neppolian, B., Sakthivel, S., Arabindoo, B., Palanichamy, M. and Murugesan, V. (2001)
“Kinetics of photocatalytic degradation of reactive yellow 17 dye in aqueous solution
using UV irradiation”, J Environ. Sci. Health Part A. Tox Hazard Subst. Environ.
Eng., 36: 203-213.
NIOSH, National Institude for Occupational Health and Safety (1985) “Registry of toxic
effects of chemical substances: Dichlorodiethyl Ether”, U.S. Department of Health and
Human Services, Cincinnati, OH.

10. Bibliography
274
Norman, R. and Radda, G. (1962) “Aromatic hydroxylation: The electrophilic character of
the hydroxyl radical, and its significance in biological hydroxylation”,
Proc.Chem.Soc., 138-149.
OECD. (1981), “Guidelines for Testing of chemicals”, Paris, France.
Ohta, H., Goto, S. and Teshima, H. (1980) “Liquid-phase oxidation of phenol in a rotating
catalytic basket reactor”, Ind. Eng. Chem. Fundam, 19: 180-185.
Ollis, D., Pelizzetti, E. and Serpone, N. (1989) “Heterogeneous photocatalysis in the
environment: Application to water purification. Photocatalysis: Fundamentals and
applications”, N. Serpone, E. Pelizzetti. New York, Wiley: 603-637
Pala, A. and Tokat, E. (2001) “Color removal from cotton textile industry wastewater in an
activated sludge system with various additives”, Wat. Res., 36: 2920-2925.
Palau, R. (1998) “Contribución al estudio de la eliminación de contaminantes acuosos
mediante reacciones electroquímicas - Degradación del herbicida MCPA”. Master
Experimental en Química, Dpto. Ingeniería Química y Metalurgia, Universitat de
Barcelona.
Parra, S., Malato, S. and Pulgarin, C. (2002) “ New integrated photocatalytic-biological
flow system using supported TiO2 and fixed bacteria foe the mineralization of
isoproturon”, Appl. Catal. B:Environ., 36: 131-144.
Parra, S., Sarria, V., Malato, S., Peringer, P. and Pulgarin, C. (2000) “Photochemical
versus coupled photochemical-biological flow system for the treatment of two
biorecalcitrant herbicides: metobromuron and isoproturon”, Appl. Catal. B:Environ.,
27: 153-168.
Perez, M., Torrades, F., Domenech, X. and Peral, J. (2002) “Fenton and photo-Fenton
oxidation of textile effluents”, Wat. Res., 36: 2703-2710.
Petersen, D., Watson, D. and Winterlin, W. (1988) “The destruction of groundwater
threatening pesticides using high intensity UV light”, J.Environ.Sci.Health,Part B,
23: 587-603.
Peyton, G. and Glaze, W. (1988) “Destruction of pollutants in water with ozone in
combination with ultraviolet radiation. 3. Photolysis of aqueous ozone”, Environ. Sci.
& Technol., 22: 761-767.

10. Bibliography
275
Pignatello, J. (1992) “Dark and photoassisted Fe3+ catalyzed degradation of chlorophenoxy
herbicides by hydrogen peroxide”, Environ. Sci. & Technol., 26: 944-951.
Pignatello, J. and Day, M. (1996) “Mineralization of methyl parathion insecticide in soil
by hydrogen peroxide activated with iron(III)-NTA or -HEIDA complexes”,
Hazardous Waste & Hazardous Materials, 13: 237-244.
Pignatello, J. and Sun, Y. (1993) “Photo-assisted mineralization of herbicide wastes by
ferric ion catalyzed hydrogen-peroxide”, ACS Symp. Ser., 518: 77-105.
Pulgarin, C., Adler, N., Peringer, P. and Comninellis, C. (1994). “Electrochemical
Detoxification of a 1,4-Benzoquinone Solution in Waste-Water Treatment”, Wat.
Res., 28: 887-893.
Pulgarin, C., Invernizzi, M., Parra, S., Sarria, V., Polania, R. and Peringer, P. (1999)
“Strategy for the coupling of photochemical and biological flow reactors useful in
mineralization of biorecalcitrant industrial pollutants”, Catalysis Today, 54: 341-352.
Rahhal, R. and Richter, H. (1988) “Reduction of hydrogen peroxide by the ferrous iron
chelate of diethylenetriamine-N,N,N',N",N"-pentaacetate”, J.Am.Chem.Soc., 110:
3126-3133.
Renner, T., Reichelt, A., Wurdack, O. and Specht, D. (2000) “Degradation of textile dye
water with Fenton process”, Proceedings of the 2nd International Conference,
CUTEC, Clausthal-Zellerfeld, Germany.
Rodriguez, C., Dominguez, A. and Sanroman, A. (2002) “Photocatalytic degradation of
dyes in aqueous solution operating in a fluidised bed reactor” , Chemosphere, 46: 83-
86.
Romero, M., Blanco, J., Sanchez, B., Vidal, A., Malato, S., Cardona, A. and Garcia, E.
(1999) “Solar photocatalytic degradation of water and air pollutants: Challenge and
perspectives”, Solar Energy, 66: 169-182.
Rosen, G., Tsai, P., Barth, E., Dorey, G., Casara, P., Spedding, M. and Halpern, H. (2000)
“A one-step synthesis of 2-(2-Pyridyl)-3H-indol-3-one N-Oxide: Is it and efficient
spin Trap for hydroxyl radical ?”, J. Org. Chem., 65: 4460-4463.
Roy, C. and Volesky, B. (1977) “Physicochemical treatment of textile wastewater using
activated carbon”, Canadian Textile Journal, 94: 47-60.

10. Bibliography
276
Ruiz, B., Prats, R. and Zoffmann, C. (1992) “Modelo real de flujo de una planta
depuradora de aguas residuales urbanas”, Ingenieria Química, 279: 53-56.
Rupper, G., Bauer, R. and Heisler, G. (1994) “UV-O3, UV-H2O2, UV-TiO2 and the photo-
Fenton reaction. Comparison of advanced oxidation processes for waste water
treatment”, Chemosphere, 28: 1447-1454.
Ruppert, G., Bauer, R. and Heisler, G. (1993) “The photo-Fenton reaction - an effective
photochemical wastewater treatment process”, J. Photochem. Photobiol. A, 73: 75-
78.
Sacher, F., Karrenbrock, F., Knepper, T. and Lindneri, K. (2001) “Adsorption studies of
organic compounds for the assessment of their relevancies for drinking water
production”, Vom Wasser , 96.
Sadana, A. and Katzer, J. (1974) “Catalytic oxidation of phenol in aqueous solution over
copper oxide”, Ind. Eng. Chem. Fundam, 13: 127-134.
Safarzadeh-Amiri, A., Bolton, J. and Cater, S. (1996) “Ferrioxalate-mediated solar
degradation of organic contaminants in water”, Solar Energy, 56: 439-443.
Sagawe, G., Lehnard, A., Lubber, M. and Bahnemann, D. (2001) “The Insulated Solar
Fenton Hybrid Process: Fundamental Investigations”, Helvetica Chimica Acta, 84:
3742-3759.
Sarria, V., Parra, S., Invernizzi, M., Péringer, P. and Pulgarin, C. (2001) “Photochemical-
biological treatment of a real industrial biorecalcitrant wastewater containing 5-
amino-6-methyl-2-benzimidazolone”, Water Sci. Technol., 44: 93-101.
Schertenleib, R. and Gujer,W. (2000) EAWAG News, 48: 3-5.
Scott, G. (1997) “Design, characterization and performance of a bench-scale continuous
wet oxidation system”, Chem. Oxidation. Technol., 6: 156-186.
Scott, J. and Ollis, D. (1995) “Integration of chemical and biological oxidation processes
for water treatment : Review and recommendations”, Environ. Progr., 14: 88-103.
Scott, J. P. and Ollis, D. F. (1996) “Engineering Models of Combined Chemical and
Biological Processes”, J. Environ. Eng., 122: 1110-1114.

10. Bibliography
277
Sehested, K., Rasmussen, O. and Fricke, H. (1968) “Rate constants of HO• with HO2, O2,
and H2O2 from hydrogen peroxide formation in pulse-irradiated oxygenated water”,
J.Phys.Chem., 72: 626-631.
Serpone, N., Terzian, R., Colarusso, P., Minero, C., Pelizzetti, E. and Hidaka, H. (1992)
“Sonochemical oxidation of phenol anf three of its intermediate products in aqueous
media : catechol, hydroquinone, and benzoquinone. Kinetic and mechanistic
aspects”, Research on Chemical Intermediates, 18: 183-202.
Sevener, M. (1990) “El O3: un plan de investigación de la oxidación de compuestos
sintéticos en el H2O”, Ingenieria Química, 250: 239-245.
Sevimli, M. and Kinaci, C. (2002) “Decolorization of textile wastewater by ozonation and
Fenton's process”, Water Sci.Technol., 45: 279-286.
Smith, D. S., V. and Watkinson, A. (1981) “Anodic oxidation of phenol for wastewater
treatment”, Can. J. Chem. Eng., 59: 52-59.
Staehelin, J. and Hoigné, J. (1982) “Decomposition of ozone in water: Rate of initiation by
hydroxide ions and hydrogen peroxide”, Environ. Sci.& Technol., 16: 676-681.
Standard Methods, APHA, AWWA and WEF, (1995), 19th, Edition, Washington, DC.
Stanislav, L. and Sedlak, P. (1992) “Photoinitiated reactions of hydrigen peroxide in the
liquid phase”, J. Photochem. and Photobiol. A., 68: 1-33.
Steverson, E. (1991) “Provoking a firestorm: Waste Incineration”, Environ. Sci. &
Technol., 25: 1419-1427.
Stubbe, J. and Kozarich, J. W. (1987) “Mechanisms of bleomycin-induced DNA
degradation”, Chem. Rev., 87: 1107-1136.
Sudoh, M., Kodera, T., Sakai, K., Zhang, J. and Koide, K. (1986) “Oxidative degradation
of aqueous phenol effluents with electrogenerated Fenton's reagent”,
J.Chem.Eng.Jap., 19: 513-518.
Sun, Y. and Pignatello, J. (1993). “Photochemical-reactions involved in the total
mineralization of 2,4-D by Fe3+/H2O2/UV”, Environ. Sci.& Technol., 27: 304-310.
Sundstrom, D., Weir, B. and Klei, H. (1989) “Destruction of aromatic pollutants by UV
light catalized oxidation with hydrogen peroxide”, Environmental Progress, 8: 6-11.
10. Bibliography
278
Sychev, A. Y. and Isak, V. G. (1995) “Iron compounds and the mechanisms of the
homogeneous catalysis of the activation of O2 and H2O2 and of the ativation of
organic substrates”, Russian Chemical Reviews, 64: 1105-1129.
Toxnet, “site”. http://www.toxnet.nlm.nih.gov.visited on December 2001.
Trapido, M., Veressinina, Y. and Kallas, J. (2001) “Degradation of aqueous nitrophenols
by ozone combined with UV-radiation and hydrogen peroxide”, Ozone Sci. & Eng.,
23: 333-342.
Turchi, C. S. and Ollis, D. F. (1990) “Photocatalytic degradation of organic water
contaminants: mechanisms involving hydroxyl radical attack”, J. Catal., 122: 178-
192.
Ullmann's (1991) “Encyclopedia of Industrial Chemistry”, 5ª ed., 415-419, VCH
Verlagsgesellschaft (Germany)
Urano, K. and Kato, Z. (1986) “Evaluation of boidegradation ranks of priority organic
compounds”, Journal of Hazardous Materials, 13: 147-149.
Vian, A., Miranda, F., Agudo, J. and Rodríguez, J. (1982) “Depuración de aguas residuales
mediante lodos activos: Aspectos cinéticos”, Ingenieria Química, 216:89-94.
Vicente, J., Rosal, R. and Diaz, M. (2002) “Noncatalytic oxidation of phenol in aqueous
solutions”, Ind. Eng. Chem. Res., 41: 46-51.
Vicente, M. and Esplugas, S. (1983) “Calibrado del fotoreactor anular”, Afinidad, 387:
453-457.
Vlyssides, A., Loizidou, M., Karlis, P. and Zorpas, A. (1999) “Textile dye wastewater
treatment with the use of an electrolysis system”, Hazardous and Industrial Wastes,
31: 147-156.
Vlyssides, A., Papaioannou, D., Loizidou, M., Karlis, P. and Zorpas, A. (2000) “Testing
an electrochemical method for tratment of textile dye wastewater”, Waste
Management, 20: 569-574.
Volman, D. and Chen, J. (1959) “The photochemical decomposition of hydrogen peroxide
in aqueous solution of allyl alchohol”, J.Am.Chem.Soc., 81: 4141-4144.
Volman, D. and Seed, J. (1964) “The photochemistry of uranyl oxalate”, J.Am.Chem.Soc.,
86: 331-335.

10. Bibliography
279
Walling, C. (1975) “Fenton's reagent revisited”, Acc. Chem. Res., 8: 125-131.
Walling, C., El-Taliawi, G. and Johnson, R. (1974) “Fenton's reagent IV. Structure and
reactivity relations in the reactions of hydroxyl radicals and the redox reactions of
radicals”, J. Am. Chem. Soc., 96: 133-139.
Wang, Y. (1992) “Effect of chemical oxidation on anaerobic biodegradation of model
phenolic compounds”, Wat. Environ.Res., 64.
Weber, R. and Smith, E. (1986) “Removing dissolved organic contaminants from water”,
Environ.Sci.&Technol., 20: 970-979.
Whitby, G. (1989) “The treatment of spa water with ozone produced by UV ligh”, Ozone
Sci. & Eng., 11: 313-324.
Wiesmann, U. and Putnaerglis, A. (1986) “Influence of oxygen concentration on substrate
degradation in activated sludge reactors”, Ger.Chem.Eng., 9: 284-291.
Wilkins, F. and Blake, D. (1994) “Use solar energy to drive chemical process”, Chem.
Eng. Prog., 6: 41-49.
Wu, J., Bewtra, J., Biswas, N. and Taylor, K. (1994) “Effect of H2O2 addition mode on
enzymatic removal of phenol from wastewater in the presence of polyethylene
glycol”, Can. J. Chem. Eng., 72: 881-886.
Yamazaki, I. and Piette, L. (1991) “EPR spin-trapping study on the oxidizing species
formed in the reaction of the ferrous ion with hydrogen peroxide”, J. Am. Chem.
Soc., 113: 7588-7593.
Yeh, R., Hung, Y., Liu, R., Chiu, H. and Thomas, A. (2002) “Textile wastewater treatment
with activated sludge and powdered activated carbon”, International Journal of
Environmental Studies, 59: 607-622.
Young, L. and Yu, J. (1997) “Ligninase-catalysed decolorization of synthetic dyes”, Water
Res., 31: 1187-1193.
Yu, Y. and Hu, S. (1994) “Preoxidation of chlorophenolic wastewaters for their subsequent
biological treatment”, Water Sci. Technol., 29: 313-320.
Zappi, G., Arbesman, S. and Weinberg, N. (2000) “Novel electrochemical system for the
destruction of organic contaminants”. Annual conference and exposition on water

10. Bibliography
280
quality and wastewater treatment, 73rd, Anaheim, CA, United State, Oct.14-18:
2966-2969.
Zepp, L., Faust, B. and Hoigné, J. (1992) “Hydroxyl radical formation in aqueous reactions
(pH 3-8) of iron(II) with hydrogen peroxide: the photo-Fenton reaction”, Environ.
Sci.& Technol., 26: 313-319.
Zoeteman, B., Harmsen, K., Linders, J., Morra, C. and Sloof, W. (1980) “Persistent
organic pollutants in river water and ground water of the Netherlands”,
Chemosphere, 9, 231-249.

11. Appendix: Estimation of absorbed radiation


11.1. Actinometric study
283
11.1. Actinometric study
Before carrying out the experiments with ultraviolet radiation, an actinometric
study was carried out in order to measure the photon flux entering to the reactor by the
different sources of radiation used. Among the various chemical actinometers, the
photochemical decomposition of aqueous solutions of oxalic acid in presence of uranyl
salts was chosen (Vicente and Esplugas, 1983; Braun et al., 1986).
For this reaction, it is possible to consider three competitive processes:
1) Photodecomposition of the oxalic acid yielding carbon monoxide and carbon
dioxide.
h2 2+
2 2 2 4 2 2 2(UO ) + H C O (UO ) + CO + CO + H Ov+ → (4.24)
2) Photodecomposition of the oxalic acid to formic acid and carbon dioxide.
h2 2+
2 2 2 4 2 2(UO ) + H C O (UO ) + CO + HCOOHv+ →
3) Redox reaction to 4+U and carbon dioxide.
The mechanism of this reaction is very complex according to the different products
obtained: CO, 2CO , HCOOH , 4+U , 2H O .
However, the main photo-reaction, by using a solution 0.01 mol.L-1 in uranyl and
0.05 in oxalic acid operating in the pH range between 3 and 7 and conversion up to 20%,
is the photodecomposition of the oxalic acid to carbon monoxide and carbon dioxide.
The development kinetic of this reaction may be divided in three steps:
• The first step is the activation of the uranyl ion by photon absorption
h2 * 2
2 2(UO ) (UO )v+ + →
• The second step is the reaction between the activated uranyl and the oxalic acid
yielding oxalic in excited state
* 2 * 2
2 2 4 2 2 2 4 2H C O + (UO ) (H C O ) + (UO )+ +→

11. Appendix
284
• The last step is the decomposition of the activated oxalic.
*
2 2 4 2 2(H C O ) CO + CO + H O→
Only the first step is a photochemical reaction, and throughout the process the
concentration of the compound that absorbs the radiation (uranyl ion) remains constant.
Meanwhile, the oxalic acid concentration follows a zero order kinetic.
Thus, the intensive reaction rate of oxalic acid, oxR (mol.m-3s-1) can be expressed
as:
ox abs,R W t λ λλ
φ= −∑ (11.1)
being,
λφ = quantum yield
abs,W λ = absorbed radiation
t = time
In addition, the oxalic mass balance in the reactor yields:
oxdCV Rdt
= (11.2)
where V is the volume of the reactor and C is the concentration of oxalic acid in the
reactor at the irradiation time. The boundary condition is:
ot = 0 C = C
oC being the initial concentration of oxalic acid.
Equation 11.2, with its limit condition shown above, has an easy solution because
it is possible to observe that the intensive reaction rate for oxalic decomposition does not
varies with oxalic concentration, its only a function of uranyl concentration that remains
constant (the absorbance of reacting medium and the quantum yield only depends on the
uranyl concentration) during the experiments. Integration of eq. 11.2 yields:
o abs,V (C C ) = - W t λ λλ
φ− ∑ (11.3)

11.2. Experimental method
285
This means that by plotting oxalic concentration versus irradiation time a straight
line must be obtained. However, in order to make calculation it is better to plot the amount
of oxalic acid in moles (n = V.C), versus the irradiation time (t). In the actinometric
experiments, irradiation times were adjusted so that the conversions of oxalic acid were
between 3% and 20% in every run. Smaller conversions introduce uncertainties in the zero-
order rate requirement, the possibility of bubble formation due to excessive formation of
CO and CO2, and the danger of reduction of 2+2UO .
11.2. Experimental method
The photo-reactor was filled with 0.05 mol.L-1 oxalic acid and 0.01 mol.L-1 uranyl
nitrate solutions. Lamp was turned on and samples were withdrawn at intervals of 2-5
minutes. For less powerful lamp the interval time should be longer.
In table 11.1 the characteristics of the actinometric reaction are show.
Table 11.1. Characteristics of the actinometric reaction
λλλλ (nm)
ΦΦΦΦλλλλ (mol Einstein-1 )
µµµµ (cm-1)
240-250 250-262
0.59 0.60
9.839 6.416
262-270 270-275
0.59 0.58
5.505 4.491
275-285 0.58 3.502
285-295 0.58 2.433
295-300 0.57 1.804
300-308 0.56 1.391
308-320 329-342 360-371
0.56 0.52 0.49
0.998 0.355 0.041
395-406 430-443 481-493
0.55 0.58 0.27
0.037 0.032 0.003

11. Appendix
286
Being these parameters : λ = wavelength (nm)
Φλ = quantum yield (mol Einstein-1)
µ = absorption coefficient (cm-1)
11.3. Analytical determinations
The analysis of oxalic acid in each sample was done by tritration using KMnO4 0.1
N and in acidic pH and a temperature of 80-90oC. The end point is easily to see by a color
change.
11.4. Actinometric results
Taking into account that the actinometric method to determine the photonic
emission was used in three reactors with different lamps, the results will be presented for
each one. The assumption to obtain the photon-flux entering to the reactor will be in
agreement with the reactor design and the kind of lamp used in each case.
11.4.1. Reactor B (Tubular photo-reactor)
As it has been mentioned before, in section 4.4.2.1, this reactor is equipped with
four “germicides” low-pressure mercury lamps. These lamps emit radiation basically at
253.7 nm. In Table 11.2 and 11.3 the actinometric data obtained for this reactor are
summarized.
Results of both actinometries are presented in Fig. 11.1, where the pertinent linear
fittings have been performed.

11.4. Actinometric results
287
Table 11.2. Actinometry 1. Reactor B.
Time (min) nH2C2O4 (mol) no H2C2O4 - nH2C2O4 (mol)
0 0.125 0
4 0.1209 0.0041
8 0.1197 0.0053
12 0.1150 0.0101
16 0.1126 0.0125
20 0.1114 0.0136
24 0.1102 0.0149
28 0.1066 0.0184
32 36 40
0.103 0.101 0.098
0.022 0.024 0.0267
Table 11.3. Actinometry 2. Reactor B.
Time (min) nH2C2O4 (mol) no H2C2O4 - nH2C2O4 (mol)
0 0.125 0 3 0.1209 0.0041
6 0.1197 0.0053
9 0.1150 0.0101
15 0.1126 0.0125
18 0.1114 0.0136
21 0.1102 0.0149
24 0.1066 0.0184
27 30
0.103 0.101
0.022 0.024

11. Appendix
288
y = 7.59E-04xR2 = 9.89E-01
y = 9.73E-04xR2 = 9.84E-01
0
0.005
0.01
0.015
0.02
0.025
0.03
0 5 10 15 20 25 30 35 40
Time (min)
n oxo - n
ox (m
ol)
Actinometry 1
Actinometry 2
Figure 11.1. Comparison of actinometries 1 and 2 in Reactor B.
As the lamps emits mainly in a unique wavelength, eq. 11.3 can be simplified as:
o
ox ox abs,n - n = - W tλ λφ (11.4)
The value of Φλ in the wavelength range of between 250-262 nm is 0.6 mol Einstein-1 (see
Table A.1). From Fig. 11.1, the slope of the graph is equal to :
slope = Φλ*Wabs,λ Therefore, Wabs,λ can be obtained.
Actinometry 1, (Wabs,λ)1 = 22.22 µEinteins s-1
Actinometry 2, (Wabs,λ)2 = 27.77 µEinteins s-1
Average value = 24.99 µEinteins s-1
11.4.1.1. Flow rate of photons absorbed by NB and phenol in reactor B
In order to describe the absorption properties of NB and phenol for direct phtolysis
experiments, the following equation based in the radial field was used (Costa et al., 1975;
Esplugas, 1981, 1983):

11.4. Actinometric results
289
1 exp( )abs
e
Wd
Wµ= − − (11.5)
being,
Wabs = the absorbed radiation by the compounds in the reaction medium (µEinstein.s-1)
We = the photon flow entering to the reactor (µEinstein.s-1)
µ = the absorbance (cm-1)
d = inner diameter of the reactor (cm)
To solve this equation, absorbance µ, which can be easily obtained from the
absorption spectrum of NB and phenol, must be calculated. Values for µ have been
inserted in Table 11.4. Thus, for 254 nm, the dependence between the energy flow entering
the reactor (We), which has been measured by the actinometry, and the absorbed energy
flow (Wabs) used for the mineralization process, can be calculated by means of equation
11.5. The resulting term allows the calculation of the absorbed energy flow at starting time.
The radiation flow in the reactor absorbed by NB and phenol at 254 nm was 24.99 and
18.82 µEinstein.s-1 respectively. These values correspond to the starting time when NB and
phenol concentration are maximum.
Table 11.4. Flow rate of photons absorbed by NB and phenol in reactor B
Compounds Wavelength (nm)
µµµµ (cm-1)
We (µEinstein.s-1) 1-exp(-µµµµd) Wabs
(µEinstein.s-1)
Nitrobenzene
Phenol
254
254
8.07
0.76
24.99
24.99
1
0.753
24.99
18.82
Taking into account the reactor volume, the flow of photons absorbed by unit of
reaction volume is 92.55 µEinstein.s-1 L-1. and 69.70 µEinstein.s-1L-1 for NB and phenol
respectively.

11. Appendix
290
11.4.2. Reactor C (Annular reactor)
This reactor has been already described in chapter 4, section 4.4.2.2. It is equipped
with one black lamp, which emits radiation between 300-400 nm. In Table 11.5 the
actinometric data obtained for this reactor are summarized.
Table 11.5. Actinometry Reactor C
Time (h) nH2C2O4 (mol) no H2C2O4 - nH2C2O4 (mol)
0
1
2
3
4
5
6
7
8
0.075
0.072
0.0705
0.0682
0.0667
0.0652
0.064
0.0626
0.0622
0
0.0028
0.004
0.0065
0.0079
0.0095
0.011
0.012
0.014
Results of the actinometry are presented in Fig 11.2, where the pertinent linear
fitting has been performed.
This black lamp emits radiation between 300-400 nm with a maximum at 360 nm.
In order to simplify the calculation, the photon flux for this lamp has been calculated
assuming that it emits basically at 360 nm. Therefore, in the same way that in previous
case, eq.11.3 can be simplified as eq. 11.4.
The value of Φλ in the range of between 360-371 nm is 0.49 mol Einstein-1 (see
Table 11.1). From Fig. 11.2, the slope of the graph is equal to :
slope = Φλ*Wabs,λ
Therefore, Wabs,λ can be obtained.
Actinometry 3, (Wabs,λ)1 = 0.83 µEinteins s-1.
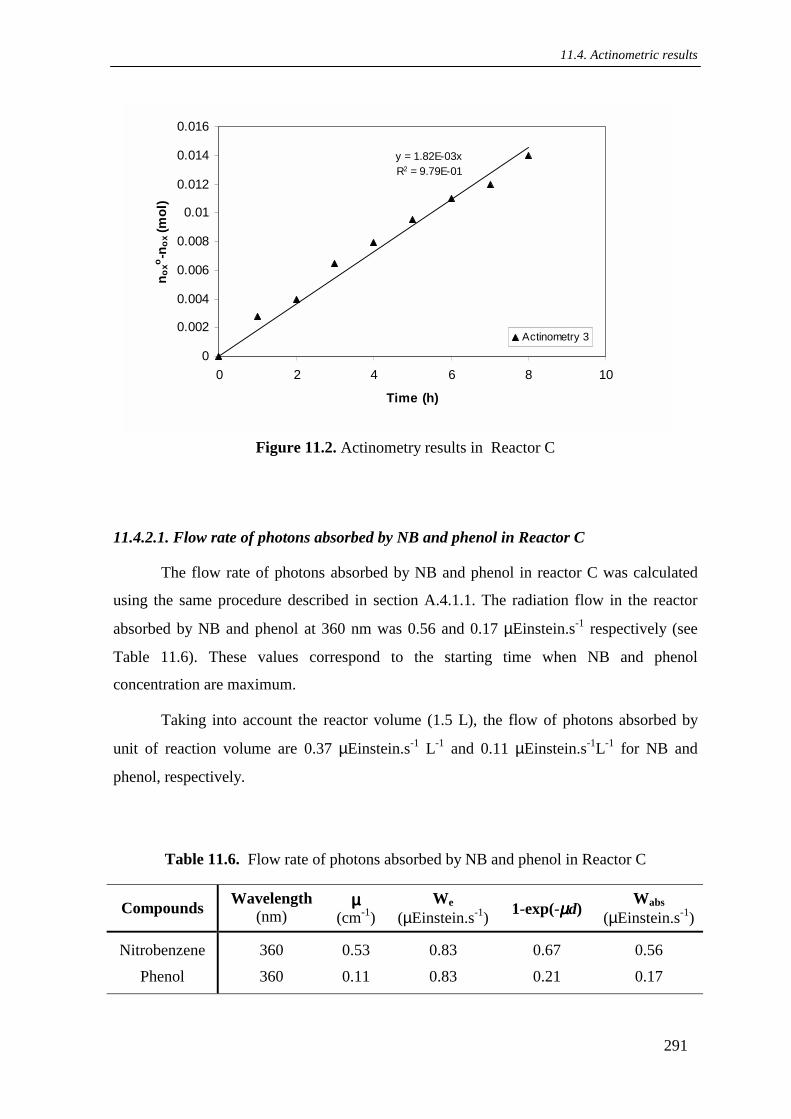
11.4. Actinometric results
291
y = 1.82E-03xR2 = 9.79E-01
0
0.002
0.004
0.006
0.008
0.01
0.012
0.014
0.016
0 2 4 6 8 10
Time (h)
n oxo -n
ox (m
ol)
Actinometry 3
Figure 11.2. Actinometry results in Reactor C
11.4.2.1. Flow rate of photons absorbed by NB and phenol in Reactor C
The flow rate of photons absorbed by NB and phenol in reactor C was calculated
using the same procedure described in section A.4.1.1. The radiation flow in the reactor
absorbed by NB and phenol at 360 nm was 0.56 and 0.17 µEinstein.s-1 respectively (see
Table 11.6). These values correspond to the starting time when NB and phenol
concentration are maximum.
Taking into account the reactor volume (1.5 L), the flow of photons absorbed by
unit of reaction volume are 0.37 µEinstein.s-1 L-1 and 0.11 µEinstein.s-1L-1 for NB and
phenol, respectively.
Table 11.6. Flow rate of photons absorbed by NB and phenol in Reactor C
Compounds Wavelength (nm)
µµµµ (cm-1)
We (µEinstein.s-1) 1-exp(-µµµµd) Wabs
(µEinstein.s-1)
Nitrobenzene
Phenol
360
360
0.53
0.11
0.83
0.83
0.67
0.21
0.56
0.17

11. Appendix
292
11.4.3. Reactor D (solarbox)
This reactor has been already described in chapter 4, section 4.4.2.3 .It is equipped
with one polichromatic lamp emitting radiation close to solar spectrum between 300-560
nm. In Table 11.7 the actinometric data obtained for this reactor are summarized.
Table 11.7 . Actinometry of the solarbox (Reactor D)
Time (h) nH2C2O4 (mol) no H2C2O4 - nH2C2O4 (mol)
0
5
10
15
20
25
30
35
40
45
50
55
60
0.072
0.0697
0.0678
0.0675
0.066
0.0648
0.0637
0.063
0.061
0.0603
0.06
0.0585
0.0573
0
0.0023
0.0042
0.0045
0.006
0.0072
0.0083
0.009
0.011
0.0117
0.012
0.0135
0.0147
Results of the actinometry are presented in Fig 11.3, where the pertinent linear
fitting has been performed.

11.4. Actinometric results
293
y = 2.57E-04xR2 = 9.67E-01
0
0.002
0.004
0.006
0.008
0.01
0.012
0.014
0.016
0.018
0 10 20 30 40 50 60 70
Time (min)
n oxo -n
ox (m
ol)
Actinometry 4
Figure 11.3. Actinometry results in Reactor D
From eq. 11.3 and taking into account the spectrum emission for this polychromatic
lamp between (300 and 400), the photon flux entering the reactor (which has been
measured by the actinometry) has been calculated using Microsoft Excel spreadsheet and
its value was 2.17 x10⁻⁶ Einstein s-1. This value corresponds to the total absorbed radiation
by the actinometer and therefore it will be used to estimate the absorbed radiation by the
reaction medium. Assuming Fe3+ as the main absorbing specie in the photo-Fenton reaction
medium, the photon flux absorbed has been estimated according to eq. 11.6 for each
wavelength.
[ ]abs, total absorbed by actinometerW = W F 1 exp( )dλ λ λµ− −∑ (11.6) being,
Fλ = source of photons factor (lamp factor)
µ = absorbance for Fe3+ (cm-1)
d = reactor diameter (cm)
In Table 11.8 some values are shown as example of absorbing photon flow for both
actinometer and treated solutions.

11. Appendix
294
Table 11.8. Flow of photons absorbed by uranyl and Fe3+ in reactor D
λλλλ (nm)
Lamp Factor
Fλλλλ
µµµµ Uranyl (cm-1)
Wabs,λλλλ actinomet
(Einstein.s-1)
µµµµ Fe3+
(cm-1)
Wabs,λλλλ
Fe3+
(Einstein.s-1)
300
310
320
330
340
350
360
370
380
390
400
0
1.12E-4
4.93E-4
1.11E-3
1.26E-3
1.44E-3
1.59E-3
2.09E-3
2.30E-3
2.39E-3
3.45E-3
18.48
11.99
7.68
4.45
2.09
0.98
0.54
0.32
0.21
0.20
0.27
0
6.14E-5
2.71E-4
6.10E-4
6.84E-4
6.92E-4
5.98E-4
5.71E-4
4.48E-4
4.64E-4
8.16E-4
11.30
10.71
9.53
8.35
7.76
6.58
5.41
4.82
3.64
2.56
2.21
0
2.43E-10
1.07E-9
2.41E-9
2.74E-9
3.14E-9
3.47E-9
4.57E-9
5.01E-9
5.18E-9
7.44E-9
Thus, the photon flux absorbed by the reaction medium in the photo-Fenton process
was 3.16 x 10⁻⁷ Einstein s-1. With this value the intrinsic kinetic constant for photo-Fenton
process carried out in reactor D can be estimated (see chapter 4, section 4.6.4.3)
11.5. Reactor G (CPC-Almería)
This reactor has been also described in chapter 4, section 4.4.2.6. In this case, for
the calculation of the radiation entering the reactor, actinometry data are not available. For
this reason, and provided information of the radiation captured by the radiometer, the solar
useful photonic flux entering the reactor was estimated by using the radiometer measuring
range between 300- 400 nm. As it has been commented in chapter 4 (section 4.6.4.3), for a
photo-Fenton reaction Fe3+ has been assumed to be the main absorbing species between
300-400 nm. Therefore, in the desired range the photon flux entering the reactor Wt can be
estimated as follow:
t radiometerW = W 0.83 S⋅ ⋅ (11.7)

11.5. Reactor G (CPC-Almería)
295
being,
Wt = total photon flux entering the reactor, Einstein.s-1 m-2
Wriadometer = radiometer measurement, W m-2
S = Total collector surface, m2
0.83 = Lost radiation factor (assumed equal to the aluminum reflectivity).
The conversion of Wradiometer in W m-2 in the 300-400 nm-range can be transformed
in Einstein s-1 m-2 by using the following equation (Malato, 1999):
IG, 300-400 nm = 3.403 x10⁻⁶ UVG (11.8) being UVG the global radiometer measurement in W m-2. This equation was developed in
the Plataforma Solar de Almería by means of spectrophotometer measurements to calculate
the spectral distribution of each of the punctual data. For the experiment used as reference
(Ph64), the UVG average was 11.62 W m-2, meaning a photon flux of 3.95x10⁻⁵ Einstein
s-1m-2 (according to eq. 11.8). Besides this, they found that solar spectra measured at
different times in the PSA were very closed to those given by the ASTM standard, which
allows the estimation of the photon flux for each wavelength in the range (300-400 nm).
By substituting the respective values in eq.11.7:
-5 -1 -2 -2 -4 -1
tW = 3.95 x10 Einstein s m 0.83 5.93 m = 1.94 x10 Einstein.s
⋅ ⋅
With this value and taking into account its contribution for each wavelength
(300-400 nm) in and using Microsoft Excel program, the photon flux absorbed by Fe3+ in
the CPC can be calculated.
Finally, the absorbed radiation can be calculated according to eq. 11.6
,
,
W 1 exp( )
W
abs
e
dλλ
λ
µ= − −
where We,λ = Fλ Wt,
Therefore,
[ ]abs tW = W F 1 exp( )dλ λµ− −∑

11. Appendix
296
being, Fλ the fraction of photons entering the reactor for each wavelength using, as
mentioned before, the ASTM standard spectrum. In Table 11.9, some values of photons
flux absorbed by the reaction medium are summarized.
Table 11.9. Photons flux absorbed by Fe3+ in Reactor G (CPC)
λλλλ (nm)
J. Einstein-1 Fλλλλ
We(FλλλλWt) (Einstein.s-1)
µµµµ (Fe3+cm-1) 1-exp(-µµµµd) Wabs
(Einstein.s-1)
300
310
320
330
340
350
360
370
380
390
400
398619.28
385760.59
373705.57
322381.16
351722.89
341673.67
332182.73
323204.82
314699.43
306630.21
298964.46
0
1.36E-4
6.03E-4
1.35E-3
1.53E-3
1.76E-3
1.94E-3
2.56E-3
2.82E-3
2.92E-3
4.20E-3
0
2.64E-8
6.57E-7
2.63E-7
1.68E-6
3.42E-7
1.12E-6
4.97E-7
3.07E-6
5.67E-7
4.58E-6
11.30
10.71
9.53
8.35
7.76
6.58
5.40
4.81
3.63
2.55
2.21
1
1
1
1
1
1
1
1
0.99
0.99
0.99
0
2.64E-8
6.57E-7
2.63E-7
1.67E-6
3.42E-7
2.12E-6
4.97E-7
3.07E-6
5.67E-7
4.58E-6
Thus, the total photon flux absorbed by the CPC was 3.44 x10⁻⁵ Einstein.s-1. With
this value the intrinsic kinetic constant for photo-Fenton process can be estimated (see
chapter 4, section 4.6.4.3).

Resumen

Resumen

Resumen
I
1. Introducción
Una de las características que mejor define la sociedad actual en lo que se entiende
por países desarrollados es la producción de residuos. Prácticamente no hay actividad
humana alguna que no genere residuos existiendo además una relación directa entre el
nivel de vida de una sociedad o país y la cantidad de residuos generados. Existen
actualmente registradas unos cinco millones de sustancias conocidas de las que
aproximadamente 70.000 usadas son ampliamente en todo el mundo, estimándose en unas
1.000 las nuevas sustancias químicas que cada año son incorporadas a la lista.
Hasta hace relativamente pocos años, el vertido de residuos en la naturaleza ha sido
el medio de eliminarlos, hasta que la capacidad auto-depuradora del medio ambiente ha
dejado de ser suficiente. Éstos han sobrepasado con creces los niveles permitidos,
provocando una contaminación del medio ambiente que hace inservibles nuestros recursos
naturales para determinados usos y alteran sus características. El principal problema lo
constituyen los vertidos procedentes de la industria y la agricultura, aunque la población
también juega un papel destacado en la contaminación del medio ambiente. Plaguicidas,
fertilizantes, detergentes, fenoles y otros productos químicos se vierten sin tratamiento
directamente a la naturaleza, a través de vertederos, controlados o incontrolados y situados
sin una estrategia de tratamiento.
Una gran parte de este tipo de residuos se generan en solución acuosa y, debido a
su propia naturaleza de no biodegradabilidad, los procesos de tratamiento biológico (los
más comúnmente utilizados) no tienen ninguna acción sobre ellos por lo que, si no hay
ningún tratamiento específico adicional, acaban vertidos sobre el medio ambiente. Este
hecho y la creciente escasez de agua potable, hacen cada vez más importante la necesidad
de reciclar las aguas para nuevos usos, por lo que se hace prácticamente imprescindible el
tratamiento de las aguas residuales para recuperarlas y reusarlas dependiendo del grado de
calidad obtenido y del destino final que se le quiera dar.
En este marco general, se han seleccionado compuestos nitroaromáticos
(nitrobenceno), fenólicos (fenol), éteres clorados (diclorodietil éter), y aguas textiles,
introducidos en el medio ambiente como consecuencia de la actividad industrial, para
estudiar la efectividad de tratamientos químicos, mas concretamente los Procesos de
Oxidación Avanzada (POAs), en su degradación, mineralización y por otro lado en el
aumento de su biodegradabilidad. Varios compuestos de estas familias, se encuentran

Resumen
II
incluidos entre los contaminantes prioritarios seleccionados por la Unión Europea (ver
Tabla 1.1) y han sido listados entre los 130 contaminantes prioritarios dados por la US
EPA, por ejemplo, NB y fenol.
La degradación de estos compuestos mediante POAs basados en la radiación (UV-
visible) y en el uso de peróxido de hidrógeno, ha sido muy estudiada en el caso del fenol,
pero muy poco en el caso de NB y del diclorodietil eter (DCDE); por lo tanto ésta ha sido
una de las razones para la selección de estos compuestos. El fenol sin embargo ha sido
seleccionado como compuesto modelo. En cuanto a las aguas textiles, es sabido que se
trata de una de las fuentes principales de vertidos líquidos y es por otro lado una de las
actividades industriales con mayor consumo de agua, razón por la cual siempre representa
un tema de mucho interés el buscar soluciones adecuadas para el tratamiento de este tipo
de efluentes. Es de destacar, que en el caso del DCDE y las aguas textiles, han formado
parte de proyectos de cooperación realizados con la Universidad de San Diego, (CA, USA)
y la Ecole Politecnique Federale de Lausanne (Suiza) respectivamente.
En el primer capítulo de esta tesis (Introduction) se han descrito las características
principales de los compuestos estudiados, así como las fuentes y su localización en algunas
aguas. Con la excepción del fenol, tanto las aguas textiles como el DCDE y el NB,
presentan una baja biodegradabilidad, lo que hace necesario el empleo de métodos de
tratamiento alternativos (POAs) a los procesos biológicos convencionales.
Los POAs se definen como aquellos procesos que producen radicales altamente
reactivos (especialmente radicales HO•) capaces de oxidar compuestos orgánicos
principalmente por abstracción de hidrógeno (eq.3.1). La característica más positiva de
estos radicales es que poseen una reactividad no selectiva con una inmensa mayoría de
compuestos orgánicos, hecho que los hace muy atractivos para el tratamiento de aguas.
Existen sin embargo, algunos compuestos orgánicos de cadena sencilla como los ácidos
acético, maléico y oxálico, acetona o cloroformo que no son atacados por estos radicales.
La versatilidad de los POAs se ve aumentada por el hecho de que estos radicales se pueden
formar por medio de distintos procesos. En la sección 1.3.8 se presentan los principales
POAs y las reacciones por las que se generan estos radicales. De todos ellos, los que se han
utilizado en este trabajo son los basados en el uso de la radiación ultravioleta (UV) y en el
peróxido de hidrógeno: Fe2+/H2O2 (proceso Fenton), Fe3+ /H2O2/UV (foto-Fenton),
H2O2/UV y Fe3+/UV.

Resumen
III
El principal inconveniente de los POAs es su elevado coste por el uso de reactivos
caros (por ejemplo, H2O2) y/o el elevado consumo energético (lámparas para generar
radiación UV) y es obvio que nunca deben utilizarse como alternativa a tratamientos más
económicos, como lo es el tratamiento biológico. De allí que una solución potencial para
su uso sería la combinación de estos procesos con el tratamiento biológico, por lo que los
POAs se utilizarían como pretratamiento para aumentar la biodegradabilidad del efluente o
eliminar la toxicidad del mismo. Por otro lado, el uso de la radiación solar como fuente de
energía en los procesos fotoquímicos a estudiar representa una alternativa mucho más
económica y por lo tanto también potencia el uso de estos métodos de tratamiento.
Los objetivos de este trabajo están centrados, por lo tanto, en la aplicación de los
POAs en el tratamiento del NB, fenol, DCDE y de aguas provenientes de la industria textil
y su efecto en la biodegradabilidad de algunas de estas soluciones. La consecución de este
objetivo general se logra mediante los siguientes objetivos particulares:
- Estudio del efecto del proceso Fenton en la degradación de NB y fenol. Se
persigue además en este apartado el estudio de los parámetros principales que
tienen un efecto importante en este proceso (H2O2, Fe3+, O2, temperatura y
concentración del compuesto), y de esta forma proponer un modelo cinético
que permita conocer la degradación de estos compuestos en un amplio rango de
condiciones experimentales.
- Estudio del efecto que tienen diferentes fuentes de radiación en la
mineralización de NB y fenol en los distintos procesos aplicados basados en el
uso de la luz (foto-Fenton, H2O2/UV y Fe3+/UV), haciendo especial énfasis en
el uso de la energía solar como fuente de radiación. Se persigue además en este
apartado, la determinación de constantes cinéticas intrínsecas en el proceso
foto-Fenton, que puedan ser utilizadas en el escalado de reactores usados para
tal fin.
- Estudio de la biodegradabilidad de soluciones acuosas de DCDE después de
ser tratadas mediante el proceso H2O2/UV.
- Aplicación de una estrategia conducente a la aplicación de un sistema acoplado
químico-biológico que permita abordar el tratamiento de aguas residuales de la

Resumen
IV
manera más adecuada. Para tal fin se escogieron aguas residuales procedentes
de la industria textil y el proceso de tratamiento ha sido el foto-Fenton para
estudiar su efecto en la biodegradabilidad de estas aguas.
Para ello, se han puesto a punto las siguientes técnicas analíticas: HPLC para
determinar la concentración de los compuestos estudiados; TOC, DQO, DBO y análisis de
H2O2 (ver sección de la parte experimental en cada capítulo). En cuanto a la instalación
experimental utilizada, es de destacar que para cada objetivo específico se usó una
instalación y las mismas están ampliamente descritas en cada sección experimental.Una
breve descripción de las instalaciones utilizadas en el trabajo experimental se presenta a
continuación:
• Reactor A: reactor tanque agitado para el estudio de la degradación de NB y fenol
de volumen 1L (sección 3.3.2).
• Reactores B, C, D, E, F y G, foto-reactores para el estudio de la mineralización de
NB y fenol cuyas principales características son:
• Reactor B: foto-reactor tubular, en el que se encuentran instaladas 4 lámparas
(15W) de mercurio de baja presión (λ=253.7 nm) siendo el volumen de muestra
tratada 2.5 L. Se operó a recirculación total con un caudal de 100 L.h-1 (sección
4.4.2.1).
• Reactor C: reactor anular en el que se encuentra una lámpara negra (4W)
(λ=300-400 nm), y en el que se trataron 1.5 L de muestra (sección 4.4.2.2).
• Reactor D: solarbox (simulador solar) con una lámpara de 150W (λ=300-560 nm).
Dentro de la caja solar, hay un reactor tubular de volumen 100 cm3 por donde
circulaba la solución tratada a 100 L.h-1. El volumen total tratado fué de 1.5 L
(sección 4.4.2.3).
• Reactor E: es un prototipo de reactor solar parabólico construido en el laboratorio
para desarrollar la fase preliminar de experimentos con uso de luz solar (sección

Resumen
V
4.4.2.4). El volumen tratado fué de 1.5 L, sus características son similares a la caja
solar (reactor D).
• Reactores F y G: reactores tipo CPC a escala planta piloto, con volúmenes de 100
y 190 L e instalados en la Escuela Politécnica Federal de Lausanne (Suiza) y en la
Plataforma solar de Almería (España), respectivamente (secciones 4.4.2.5 y
4.4.2.6).
• Reactor H: es un foto-reactor tanque agitado utilizado para estudiar la efectividad
del proceso H2O2/UV en el aumento de la biodegradabilidad del DCDE. En él se
tienen instaladas 8 lámparas de mercurio de baja presión y que emiten radiación a
253,7 nm (sección 5.2.2).
• Reactor I: simulador solar descrito en la sección 6.3.2.1.
• Reactor J: se trata de un prototipo de reactor acoplado para tratamiento químico y
biológico en continuo. Consta de un foto-reactor con sistema de enfriamiento que
tiene instalada una lámpara de mercurio de baja presión con una potencia nominal
de 400 W y que emite principalmente a 360 nm. La parte biológica la conforma
una columna con relleno en el que se encuentra adherida la biomasa. El sistema
acoplado cuenta con un sistema de control para regulación de caudales y del pH
(secciones 6.3.2.2 y 6.3.2.3).
Es de hacer notar que en la mayoría de los foto-reactores usados se hizo
previamente una actinometría para determinar el flujo de fotones emitidos por las distintas
fuentes de radiación utilizadas.
2. Resultados y discusión
2.1. Degradación de NB y fenol por el proceso Fenton. Estudio cinético
Tomando como referencia el mecanismo propuesto por Haber-Weiss para el
proceso Fenton (ver sección 3.1), y habiendo identificado y cuantificado tres intermedios
de reacción de la degradación del NB como son el orto, meta y para nitrofenoles (ver

Resumen
VI
figura 3.6) y comparando las relaciones molares de estos isómeros con las obtenidas en
diferentes sistemas químicos (ver tabla 3.4), se asume el radical hidroxilo como el
principal agente oxidante en el proceso Fenton. De esta forma, se determinaron las
condiciones iniciales para favorecer la reacción de estos radicales con el compuesto
orgánico a tratar. Dichas relaciones son: [compuesto]o/[H2O2]o > 0.016,
[compuesto]o/[Fe2+]o > 0.17 y [H2O2]o/[Fe2+]o > 11.
Tomando estas relaciones molares como punto de partida, se optimizaron las
concentraciones del H2O2, Fe2+, O2, y de los compuestos estudiados, así como de la
temperatura, para conocer su efecto en la degradación de NB y fenol. Como se puede
observar en las figuras 3.7 y 3.19, la degradación del NB y del fenol siguen una cinética de
primer orden, de tal forma que la velocidad de degradación se calcula por medio de la
ecuación 3.4 y 3.14 para el NB y el fenol respectivamente. Los resultados de la velocidad
de degradación para ambos compuestos calculados mediante estas ecuaciones, asi como
los valores de las constantes cinéticas (kobs) se muestran en las tablas 3.2 y 3.3.
Con el objeto de comparar los valores obtenidos para la velocidad de degradación
de NB y el fenol, se obtuvo una ecuación empírica tomando como base la ecuación de
Arrhenius que se muestra a continuación:
a 2+ b c d (-Ea/RT)D 2 2 o o 2 oo
R = A [H O ] [Fe ] [NB] [O ] e
Los coeficientes a, b, c y d, se obtienen como se explica por ejemplo en la sección
3.3.5 para el caso del H2O2 en la degradación de NB. El coeficiente A se calcula a la
temperatura determinada para las concentraciones iniciales de H2O2, Fe2+ y NB, y el
mismo es un valor promedio de todos los experimentos realizados para cada compuesto
(ver tabla 3.2 y 3.3). De la ecuación 3.11 se obtiene la energía de activación Ea graficando
Lg (RD) vs 1/T. Se obtienen entonces valores para la velocidad de degradación del NB y
del fenol mediante la ecuación empírica mostrada ( 3.12 y 3.13) y se presentan en las tablas
3.2 y 3.3. Como puede observarse tanto en las figuras 3.18 y 3.25, así como en las tablas
antes mencionadas, los valores calculados y los obtenidos experimentalmente por la
ecuación empírica, son bastante concordantes para ambos compuestos. Esto permite decir
que la misma puede ser usada para predecir la velocidad de degradación de los compuestos
estudiados con bastante precisión.
Resumen
VII
2.2. Mineralización del NB y del fenol por medio de procesos basados en el uso de la
luz. Foto-Fenton, UV/H2O2, y Fe3+/UV
En este apartado se hace un estudio de la influencia de diferentes fuentes de
radiación en los procesos antes mencionados para la mineralización del NB y el fenol. En
primer lugar, por tratarse de procesos en los que está involucrada la radiación, se realizaron
experimentos para estudiar el efecto de la fotólisis directa de los distintos tipos de
radiación en la mineralización de los compuestos estudiados. Los resultados obtenidos para
el fenol se muestran en la figura 4.21 y en la tabla 4.7. De estos resultados se desprende
que la fuente de radiación más efectiva es la de longitud de onda de 253.7 nm emitida por
las lámparas instaladas en el reactor B. En el resto de los casos, la lámpara negra (300-400
nm, reactor C), la lámpara de xenón (300-560 nm, reactor D) y la radiación solar directa
utilizada en el reactor E, el porcentaje de mineralización es muy bajo por lo cual se puede
decir que la fotólisis directa no es una vía efectiva para la mineralización del fenol. Como
contraparte se tiene, sin embargo, que en el caso del NB, la fotólisis directa es un medio
bastante efectivo para su mineralización como puede verse en los resultados mostrados en
la figura 4.47 y en la tabla 4.9. En este caso, los mejores resultados se alcanzaron con la
radiación solar, seguidos por la lámpara de xenón y las lámparas germicidas. Esto es un
buen ejemplo para entender cómo puede influir la naturaleza del compuesto estudiado en el
tratamiento aplicado.
Conocido el efecto de la fotólisis directa, se cosideró entonces la efectividad del
proceso foto-Fenton, H2O2/UV-vis y Fe3+/UV-vis. Para ello se estudiaron en los siguientes
parámetros en los diferentes procesos:
- Foto-Fenton: Efecto de la luz incidente, [H2O2], [Fe3+], [Fe2+], [O2]
- H2O2/UV: Efecto de la luz incidente , [H2O2]
- Fe3+/UV: Efecto de la luz incidente, [Fe3+]
En el caso de foto-Fenton, se observó que el proceso es muy efectivo en el
tratamiento de NB y fenol, obteniéndose siempre un alto grado de mineralización (ver
figuras 4.12, 4.19 , 4.26 , 4.29 y tablas 4.8, 4.10). Se obtuvo además que el uso de la luz
solar representa una buena alternativa como fuente de radiación. En cuanto al análisis de
las variables estudiadas, se observó que la concentración de H2O2 es el reactivo limitante
del proceso y que cantidades en exceso no contribuyen a una mayor mineralización. Un

Resumen
VIII
parámetro interesante estudiado ha sido el contenido de oxígeno en la solución tratada. De
los resultados se desprende que la concentración de oxígeno es importante cuando se tratan
soluciones concentradas de NB, como se puede apreciar en la figura 4.26. En cuanto a la
comparación de los resultados obtenidos para ambos compuestos tratados por foto-Fenton
(ver figura 4.55), se encuentra que, para las mismas condiciones de operación, la cinética
de mineralización para el fenol es más rápida que para el NB, jugando una vez más un
papel importante la naturaleza de los compuestos, como se explica en el apartado 4.8.2.
Los resultados obtenidos en el caso del proceso H2O2/UV-vis para ambos
compuestos, demuestran que este sistema es también eficiente en la mineralización del NB
y del fenol (ver figura 4.40 y 4.50). Sorprende sin embargo la mineralización alcanzada en
presencia de la radiación solar si se tiene en cuenta que el H2O2 absorbe muy débilmente a
estas longitud de onda. Sin embargo por los resultados obtenidos, la radiación absorbida es
suficiente para producir un alto grado de mineralización. Estos resultados se ven mejorados
porque el reactor utilizado es de cuarzo, lo que por supuesto permite el paso de la radiación
por debajo de 350 nm. Para aplicaciones prácticas, el proceso es bastante mas lento que el
proceso Fenton y no se recomiendada el uso de tubos de cuarzo.
Finalmente, se ha utilizado el proceso Fe3+/UV propuesto como alternativa de
tratamiento frente al proceso foto-Fenton, que emplea H2O2. A la luz de los resultados
obtenidos, es bastante claro que no es recomendable como método de tratamiento que
tenga como objetivo la mineralización de soluciones acousas de fenol, ya que la
mineralización obtenida es muy baja en algunos casos y prácticamente despreciable en
otros (ver figuras 4.43 y 4.45). Se puede pensar, sin embargo, en su utilización como pre-
tratamiento si el objetivo es por ejemplo la eliminación del fenol. Caso distinto es el del
NB, siendo este proceso bastante más efectivo (ver figuras 4.52 y 4.53). Sin embargo, todo
apunta a que la efectividad más importante viene del efecto de la fotólisis directa del
compuesto, como ha sido mostrado anteriormente, y no por la presencia del Fe3+.
En este apartado se presenta además un modelo que permite la estimación de las
constantes intrínsecas del proceso foto-Fenton asumiendo una cinética de primer orden,
con lo cual se busca poder estimar la contribución individual de las etapas (oscura e
iluminada) que puedan ser utilizadas en el escalado del diseño de reactores. Como se
desprende de los resultados, el valor de las constantes intrínsecas obtenidas (etapa
iluminada) para el reactor D (solarbox) y el reactor G (CPC-Almería) son muy cercanos,
de allí que las mismas pueden ser efectivamente utilizadas para el diseño de este tipo de

Resumen
IX
reactores. Se comprueba además, que las constantes así estimadas, no dependen de la
fuente de radiación ni de la geometría del reactor (ver sección 4.6.4.3). Es necesario sin
embargo, realizar un mayor número de experimentos a fin de corroborar la efectividad y
posible aplicabilidad del modelo propuesto.
2.3. Aumento de la biodegradabilidad del DCDE por medio de H2O2/UV process
En este capítulo se hace un estudio del efecto del proceso H2O2/UV en la
biodegradabilidad del DCDE, compuesto no biodegradable ampliamente usado como
disolvente y que ha sido regulado en los Estados Unidos como un contaminante prioritario
debido a su carácter mutagénico y probablemente carcinogénico. El estudio se llevó a cabo
en dos etapas. En primer lugar se determinaron las condiciones de operación apropiadas
para el tratamiento químico y posteriormente se realizaron los distintos métodos de
biodegradabilidad para determinar la biocompatibilidad de la solución tratada. El objetivo
entonces, no es lograr la mineralización de la solución, sino el conseguir las condiciones de
tratamiento donde la solución tratada sea biológicamente compatible. Se determinaron
entonces las condiciones de tratamiento para obtener degradaciones de 25, 50, 75 y 100%
de DCDE, encontrándose que la forma mas adecuada fué agregando el H2O2 por etapas,
haciendo el proceso más lento ( ver figura 5.11).
Se realizó un test para determinar la inhibición causada a una biomasa de lodos
activos a concentraciones de 25, 50, 75 y 100 mg.L-1 de DCDE. En los resultados
mostrados en la figura 5.13, se observa que, en el rango de concentración estudiada, el
DCDE produce inhibición a concentraciones mayores de 50 mg.L-1. Aunque la inhibición
observada es pequeña, se utiliza el proceso H2O2/UV como pre-tratamiento para conocer el
efecto de los intermedios de degradación en un sistema de lodos activos con la biomasa
aclimatada y no aclimatada.
Como métodos de determinación de biodegradabilidad se han usado los siguientes:
- “Short-term test”
- “ Long-term test”
- “ Mid-term test”
Los dos primeros (métodos respirométricos) están basados en el consumo de
oxígeno por parte de la biomasa utilizada y el “mid-term test” en la evolución del carbono
orgánico total (TOC). Todos estos métodos se describen ampliamente en las secciones

Resumen
X
5.6.1.,5.6.2 y 5.6.3. En las figuras 5.16 y 5.17 se ilustran los resultados obtenidos en
términos de la respiración de la biomasa aclimatada y no aclimatada en función de la
concentración de DCDE para el método “short-term”. De ellos se desprende que a mayor
porcentaje de oxidación del DCDE, mayor es la tasa de respiración de la biomasa. Se
observa también que para un alto porcentaje de oxidación (mayor de 50%) no es necesario
la aclimatación de la biomasa para incrementar la biodegradabilidad. Se hizo un estudio
cinético tomando como referencia la ecuación de Monod y los resultados se presentan en
las tablas 5.5 y 5.6. Una ventaja importante que tiene este método es el hecho de generar
un resultado en 30 minutos. Al igual que en el “short-term”, en el caso de “long-term” la
respiración exógena fue menor que la endógena para el caso de soluciones no oxidadas de
DCDE y las de un 25 % de oxidación. Esto significa claramente que la toxicidad del
DCDE afecta a la biomasa en tiempos de exposición largos. Sin embargo, el consumo de
oxígeno aumenta en función del nivel de oxidación, resultados que son confirmados por la
producción de CO2 (ver figuras 5.18 y 5.19 para el caso de biomasa aclimatada). Para el
caso de la biomasa no aclimatada se obtuvieron resultados muy similares (ver figuras5.20 y
5.21).
Finalmente se realizaron pruebas de biodegradabilidad con el método “mid-term” y
cuyos resultados se presentan en las tablas 5.9 y 5.10 para biomasa aclimatada y no
aclimatada, respectivamente. Una vez más se observa que a mayor grado de oxidación
(100%) existe una mayor producción de compuestos intermedios que son mas fácilmente
biodegradables, por lo que queda demostrado que el proceso H2O2/UV es adecuado para el
pre-tratamiento de soluciones acuosas de DCDE. “El mid-term” es un método que tiene la
ventaja de tener una experimental muy sencilla y por otro lado tiene la ventaja de que en la
práctica puede ser de mayor utilidad al tener que seguir solamente la evolución del
contenido de carbono en la solución estudiada.
2.4. Sistema acoplado químico y biológico para el tratamiento de aguas producidas en
actividades textiles
En el capítulo 6, el objetivo fué desarrollar una estrategia que permitiese obtener
una visión general cuando se está frente a un problema de aguas residuales industriales que
deben ser tratadas con el objeto de cumplir con la regulación antes de su descarga a la red
municipal de aguas. En tal sentido se propone un esquema (ver figura 6.2) en el que se

Resumen
XI
distinguen claramente tres direcciones a seguir una vez se conozca el grado de
biodegradabilidad del efluente estudiado. Si las aguas son biodegradables, sencillamente
deben ser descargadas a una planta de tratamiento, ya que es la forma más económica
posible que existe actualmente de tratamiento. En tal caso, se sigue la línea verde señalada
en el esquema. Si por el contrario se trata de un agua no biodegradable, se propone seguir
la línea coloreada con rojo, en la cual se sugiere un tratamiento químico como pre-
tratamiento, para luego finalizar la oxidación completa por vía biológica. Una tercera
posibilidad, es que las aguas sean parcialmente biodegradables, por lo que en ese caso se
sugiere seguir lo indicado por el color azul, donde el tratamiento químico puede emplearse
alternativamente después del tratamiento biológico, como post-tratamiento.
Para el desarrollo de esta estrategia, se seleccionaron aguas procedentes de la
industria textil, específicamente de una indistria textil del sur de Francia. Se identifican tres
tipos de efluentes a tratar:
- Efluente 1, procedente de la salida de un autoclave
- Efluente 2, es una mezcla de los distintos tipos de efluentes producidos en
dicha industria
- Efluente 3, se trata de un efluente que provenie de la planta de tratamiento
biológico instalada en la planta.
Se empieza por caracterizar los efluentes a estudiar a través de parámetros globales
como lo son la DQO, la DBO y el contenido de carbono total, (TOC) entre otros. Esto se
hace, debido a la dificultad que significa el poder determinar y cuantificar los
constituyentes individuales de las aguas residuales en general y de las aguas textiles en
particular. Como se comentó anteriormente, de lo que se trata es conocer que tipo de
efluente se tiene. En el caso estudiado, después de realizar el ensayo de biodegradabilidad
(Zahn-Wellens) descrito en la sección 6.3.3.5, se observó que en el efluente 1 el contenido
de materia orgánica es mayoritariamente no biodegradable a las condiciones de trabajo,
utilizando biomasa no aclimatada proveniente de una planta de tratamiento biológico de
aguas. Solo se eliminó el 30% del contenido de carbono en 25 días (ver figura 6.12). De
igual forma se procedió con el efluente 2 y se observó que el mismo es parcialmente
biodegradable (ver figura 6.13), ya que un 50 y un 75% del contenido de carbono orgánico
se eliminó en un periodo de 2 y 5 días, respectivamente. En el mismo se encontró una
cantidad de carbono que no se eliminó incluso después de 25 días, por lo que se considera
Resumen
XII
biorecalcitrante. En el caso del efluente 3, se observó que la mayor parte de la materia
orgánica es biorefractaria, ya que después de 25 días, sólo se elimina un 40%.
A la vista de estos resultados, se decidió usar el proceso Fenton como método de
pre-tratamiento del efluente 1 que sale del autoclave (ver sección 6.4.3), y como pos-
tratamiento para el caso del efluente 3 que proviene del tratamiento biológico (ver sección
6.4.4). Realizado el ensayo de biodegradabilidad del efluente 1 a diferentes niveles de
mineralización (40 y 70%) se observó que la materia orgánica remanente del pre-
tratamiento es biorecalcitrante ya que solo el 50% del contenido de carbono fue eliminado
en 28 días (ver figura 6.21). Estos resultados fueron comparados con los obtenidos para el
dietilenglicol, que muestran que en sólo 6 días se elimina el 95% del contenido orgánico de
una solución de este compuesto. Esto además confirma la actividad de la biomasa utilizada
para la realización del ensayo. Por otro lado, se utilizó glucosa como co-sustrato para
determinar la actividad de la biomasa después de estar en contacto con el efluente 1 y de
los resultados obtenidos se puede deducir que la biorecalcitrancia de este efluente pudiera
estar relacionada con la ausencia de enzimas en la biomasa capaces de degradarlo y no a un
posible efecto tóxico del mismo. Las causas de esta biorecalcitrancia también han sido
tema de estudio, llegándose a la conclusión de que el método de tratamiento usado (foto-
Fenton), no es lo suficientemente efectivo para transformar el contenido de materia
orgánica en fácilmente biodegradable (ver figura 6.24)
En el caso del proceso Fenton usado como post-tratamiento, se ha conseguido que
las soluciones tratadas del efluente 3 puedan ser mineralizadas hasta un 90%. Además,
estos experimentos se realizaron utilizando como fuente de radiación un simulador solar,
por lo que hace más atractivo el método propuesto. Las concentraciones de reactivos son
bastantes bajas y en concreto la del Fe3+ permitiría que el efluente una vez tratado pudiera
ser vertido directamente sin ningún otro tipo de tratamiento. Esto significa que, ante el
problema global planteado, la solución más adecuada nos lleva a pensar en aplicar el
proceso foto-Fenton como post-tratamiento del efluente 3 y no como pre-tratamiento del
efluente 1, donde por supuesto las cantidades requeridas de reactivo son bastante grandes,
encareciendo la posibilidad de aplicación del tratamiento químico.

Resumen
XIII
3. Conclusiones
Los resultados obtenidos conducen a las siguientes conclusiones:
(1) Los proceso Fenton, foto-Fenton y H2O2/UV han demostrado ser un método
apropiado en la efectiva degradación de nitrobenceno y fenol en solución
acuosa.
(2) La velocidad de degradación del NB y el fenol por medio del proceso Fenton,
sigue con una cinética de primer orden con respecto a sus concentraciones.
Las ralaciones molares iniciales de operación de los reactantes son las
siguientes:[Compuesto]o/[H2O2]>0.016, [Compuesto]o/[Fe3+]o>0.17 and
[H2O2]o/[Fe2+]o> 11.
Se ha comprobado que la velocidad de reacción no es sensible a
concentraciones de H2O2, cuando la relación molar (compuesto/H2O2) es
aproximadamente mayor de 16 y 5 para NB y fenol, respectivamente.
(3) Aunque en la química del proceso Fenton está implicado un mecanismo muy
complejo, se intentó partiendo de un modelo cinético muy simple obtener una
ecuación empírica para así predecir cuantitativamente la velocidad de
degradación del NB y el fenol. La misma ha sido establecida para un amplio
rango de condiciones experimentales y su comparacion con la velocidad de
degradación calculada experimentalmente la ecuacion permite decir que la
misma se obtiene con bastante precisión.
(4) La identificación y cuantificación de los distintos isómeros de nitrofenoles
como intermedios de reacción en el tratamiento del NB mediante el proceso
Fenton, sugeriría que su degradación se da por la presencia de radicales
hidroxilos (HO•) como principal especie oxidante. Los resultados cinéticos y
la comparación de las relaciones molares iniciales con otros POAs en un

Resumen
XIV
amplio rango de condiciones experimentales, refuerzan la presencia de estos
radicales en este proceso.
(5) La fotólisis directa del NB a las condiciones estudiadas representa una buena
alternativa en el tratamiento de este compuesto, ya que se obtuvo un 73% de
mineralización en dos horas cuando se utilizó luz solar como fuente de
radiación. Por el contrario, no se recomienda la fotólisis directa para el
tratamiento de soluciones acuosas de fenol, ya que el porcentaje de
mineralización obtenida fué muy bajo en la mayoría de los casos. Este
comportamiento diferente en los compuestos estudiados está relacionado a
sus propiedades de absorción de la luz.
(6) El proceso foto-Fenton ha sido el más efectivo en el tratamiento de fenol y
NB en solución acuosa. La velocidad de mineralización fue más rápida para
el fenol debido probablemente a la presencia de un grupo donador de
electrones como es el OH , que favorece las sustituciones electrofilicas del
radical HO•. Por otro lado, se demostroó que el uso de sales de hierro Fe2+ o
Fe3+ produce el mismo grado de mineralización.
(7) El uso de la radiación solar en el proceso foto-Fenton es una buena alternativa
en el tratamiento de soluciones acuosas de fenol. Mediante este proceso se
obtiene una total mineralización de estas soluciones. Por otro lado, la
estimación de constantes cinéticas intrínsecas para este proceso, representa
un avance significativo para entender mejor este proceso y la contribución de
la luz. Como era de esperar, los valores para las constantes obtenidas en los
dos reactores seleccionados para su estimación (reactores D y G) son
prácticamente iguales, ya que las mismas no dependen de la fuente de
radiación ni de la geometría del reactor. Por lo tanto, para el escalado se
podrían usar los datos obtenidos a escala de laboratorio.
Resumen
XV
(8) El proceso H2O2/UV ha mostrado ser también un buen método para la
mineralización del fenol y el NB. La fuente de radiación usada influye de
manera importante en el proceso. En este sentido, la radiación UV (254 nm)
es más eficiente en comparación con la radiación de la lámpara negra (300-
400 nm) y la lámpara de xenon (300-560 nm). Se obtuvieron unos resultados
muy interesantes mediante el uso de la luz solar. Así por ejemplo para fenol,
se alcanzó un 90 % de mineralización en dos horas en el reactor E. A pesar de
estos resultados, este método no se recomienda en presencia de la luz solar.
(9) Con respecto al sistema Fe3+/UV-vis, aunque este proceso ha sido presentado
por algunos autores como un método alternativo para el tratamiento de
compuestos orgánicos, no ha demostrado ser eficaz en la mineralización de
soluciones de fenol y NB a las condiciones de trabajo. Sin embargo, si el
objeto fuese la degradación de los compuestos estudiados, este proceso
pudiera ser usado como pre-tratamiento, combinado por ejemplo con un
tratamiento biológico.
(10) El tercer compuesto estudiado, el DCDE, ha sido caracterizado como un
compuesto no biodegradable. La aclimatación de la biomasa al DCDE no
mejora sustancialmente su biodegradabilidad. Además de esto, se comprobó
que a concentraciones de DCDE menores de 50 mg.L-1, no se observa una
inhibición de la biomasa en términos de respiración exógena.
(11) Los intermedios del DCDE producidos al ser tratado mediante el proceso
H2O2/UV mostraron ser significativamente más biodegradables que el mismo
DCDE, tanto para el caso de la biomasa aclimatada como no aclimatada
quedando demostrando así la eficiencia de de este proceso como pre-
tratamiento.
(12) Con respecto a los datos obtenidos por los diferentes ensayos de
biodegradabilidad, los resultados del “mid-term” test son probablemente los
Resumen
XVI
que más pueden ser aprovechados en una aplicación práctica de un sistema
acoplado, ya que permite saber la cantidad de materia orgánica que puede ser
eliminada. Por otro lado, el “long-term” ensayo permite predecir la toxicidad
de los productos intermedios sobre la biomasa utilizada en periodos de
exposición largos. En cuanto al “short-term” test, resulta ser un método
bastante rápido, alternativo al método de biodegradabilidad usado
convencionalmente como es el de la BOD5 .
(13) Se ha aplicado una estrategia general para el uso de un sistema acoplado
químico y biológico a tres efluentes procedentes de la industria textil. Dicha
estrategia es considerada una herramienta de mucha utilidad que debe ser
tomada en cuenta en este tipo de tratamientos, ya que ofrece una visión
general del problema y las posibles vías para solucionarlo. Debido a que dos
de los efluentes estudiados resultaron ser no biodegradables, se utilizó el
proceso foto-Fenton como pre-tratamiento del efluente 1 y como post-
tratamiento para el efluente 3.
(13.1) En el caso del efluente 1, su carácter biorecalcitrante se mantuvo
incluso después del pre-tratamiento por medio del proceso foto-Fenton. Este
hecho ha sido atribuido a la ausencia de enzimas capaces de degradar la
materia orgánica y no a la toxicidad de ésta, quedando en evidencia que no
siempre es posible aplicar con éxito un sistema acoplado químico-biológico.
(13.2) En el caso del post-tratamiento aplicado al efluente 3 por medio del
proceso foto-Fenton, los resultados muestran que el mismo es una buena
alternativa de tratamiento antes de descargar este efluente.