Embed Size (px)
Citation preview

Female Labor in Jordan: A Systematic
Approach to the Exclusion Puzzle
Semiray Kasoolu, Ricardo Hausmann, Tim O’Brien,
and Miguel Angel Santos
CID Faculty Working Paper No. 365
October 2019
© Copyright 2019 Kasoolu, Semiray; Hausmann, Ricardo; O’Brien,
Tim; Santos, Miguel Angel; and the President and Fellows of Harvard
College
at Harvard University Center for International Development
Working Papers

Female Labor in Jordan:
A Systematic Approach to the Exclusion Puzzle
Women in Jordan are excluded from labor market opportunities at among the highest
rates in the world. Previous efforts to explain this outcome have focused on specific,
isolated aspects of the problem and have not exploited available datasets to test across
causal explanations. We develop a comprehensive framework to analyze the drivers of
low female employment rates in Jordan and systematically test their validity, using
micro-level data from Employment and Unemployment Surveys (2008-2018) and the
Jordanian Labor Market Panel Survey (2010-2016). We find that the nature of low
female inclusion in Jordan’s labor market varies significantly with educational
attainment, and identify evidence for different factors affecting different educational
groups. Among women with high school education or less, we observe extremely low
participation levels and find the strongest evidence for this phenomenon tracing to
traditional social norms and poor public transportation. On the higher end of the
education spectrum – university graduates and above – we find that the problem is not
one of participation, but rather of unemployment, which we attribute to a small and
undiversified private sector that is unable to accommodate women’s needs for work and
work-family balance.
Semiray Kasoolu, Ricardo Hausmann, Tim O’Brien, and Miguel Angel Santos
Harvard CID Working Paper
September 2019
©Copyright 2019 Kasoolu, Semiray; Hausmann, Ricardo; O’Brien, Tim; Santos, Miguel Angel;
and the President and Fellows of Harvard College

1| Female Labor in Jordan: A Systematic Approach to the Exclusion Puzzle
The authors would like to express their great appreciation to Johanna Ramos for sourcing critical
data for this study and for providing thoughtful advice on empirical methods. We would also like
to thank Ljubica Nedelkoska, Nikita Taniparti and Ana Grisanti for their thoughtful comments
and research assistance. Finally, we would also like to thank the Growth Lab Jordan team and
our counterparts in Jordan. The opinions expressed here do not necessarily reflect those of the
Executive Directory, or the countries represented. The usual disclaimers apply.

2| Female Labor in Jordan: A Systematic Approach to the Exclusion Puzzle
Table of Contents
1 Introduction ................................................................................................................................4
2 Stylized Facts and Analytical Framework .................................................................................8
3 Data and Empirical Strategies ..................................................................................................14
3.1 Data ............................................................................................................................... 14
3.2 Empirical Strategies ...................................................................................................... 16
4 Drivers of Low Female Labor Market Participation...................................................................19
3.3 Culture........................................................................................................................... 19
3.4 Transportation ............................................................................................................... 25
3.5 Cost of Child Care ........................................................................................................ 28
3.6 Conclusions on Low Female Labor Force Participation............................................... 32
4 Drivers of Low Female Labor Market Participation................................................................33
4.1 Supply Factors .............................................................................................................. 35
4.1.1 High Wage Expectations........................................................................................... 35
4.1.2 Cultural Beliefs ......................................................................................................... 37
4.2 Demand Factors ............................................................................................................ 39
4.2.1 Discrimination........................................................................................................... 40
4.2.2 Competition from Foreign Labor .............................................................................. 42
5 Conclusions and Policy Implications .......................................................................................45
6 References ................................................................................................................................52
7 Data Sources ............................................................................................................................55
8 Technical Appendices ..............................................................................................................58

3| Female Labor in Jordan: A Systematic Approach to the Exclusion Puzzle
List of Figures and Tables
Figure 1: Female Employment Rate vs. Income per capita (2018)................................................................................ 8 Figure 2: Jordanian Labor Force Participation Rates by Gender and Education (2018) ............................................. 10 Figure 3: Unemployment Rates of Jordanians by Gender and Education Level (2018) ............................................. 10 Figure 4: Analytical Framework .................................................................................................................................. 13 Figure 5: Difference in Participation Rates Between Single and Married Women’s Participation ............................. 21 Figure 6: Drop in Participation with Marriage by Governorate ................................................................................... 22 Figure 7: Female Labor Force Participation in U.S. by Education Level and Place of Birth (2017) ......................... 24 Figure 8: Distribution of Jordanian Women's Mode of Transportation to Work ......................................................... 25 Figure 9: Correlation between Female Labor Force Participation and Commute Times at the District Level .......... 27 Figure 10: Primary Caregiver while at Work (2010 vs. 2016) .................................................................................... 29 Figure 11: Labor Force Participation by Birth Cohorts: .............................................................................................. 31 Figure 12: Tertiary Enrollment Rates in Jordan ........................................................................................................... 33 Figure 13: Learning-Adjusted Years of Schooling (Female, 2017) ............................................................................. 34 Figure 14: Reservation Wages of Unemployed and Wages of Employed Jordanians ................................................. 36 Figure 15: Highly-Educated Jordanian Women’s Employment by Industry ............................................................... 38 Figure 16: Blinder-Oaxaca Decomposition of the Gender Gap in Private Sector Wages ........................................... 40 Figure 17: Employment of Jordanian and Non-Jordanians by Sector ......................................................................... 42 Figure 18: Wages of Foreigners Employed by Households and Reservation Wages of Jordanian Women ............... 44 Figure 19: Jordanian and Non-Jordanian Women Employed by Households ............................................................. 45 Figure 20: Skill-Intensive Sectors that Employ Relatively More Women in Jordan ................................................... 50 Figure 21: Participation by cohort for university degree educated women ................................................................. 64 Figure 22: Reservation wages and wages of the employed (university educated Jordanians, for private sector) ....... 64 Figure 23: Public sector wage premiums ..................................................................................................................... 65 Table 1: Labor Market Indicators by Educational Attainment in 2016 ....................................................................... 12 Table 2: Selected Descriptive Statistics by Gender ..................................................................................................... 15 Table 3: Bivariate Probit Model Results ...................................................................................................................... 58 Table 4: Probit Model Results...................................................................................................................................... 60 Table 5: Logit model with individual fixed effects ...................................................................................................... 61 Table 6: Reservation wages of unemployed and actual wages of the employed ......................................................... 62 Table 7: OLS Regression Results for Public Premium ................................................................................................ 62 Table 8: Blinder-Oaxaca decomposition of gender wage gap in the private sector ..................................................... 63

4| Female Labor in Jordan: A Systematic Approach to the Exclusion Puzzle
1 Introduction
From every perspective, labor market inclusion for Jordanian women is amongst the lowest in
the world. The national estimate of unemployment for Jordanian women stood at 26.9% in 2018
(EUS, 2018). Comparing to data compiled by the World Bank as of 2018, this was the 5th highest
female unemployment rate among 188 countries with data reported (WDI). But this is only part
of the story. The female labor force participation rate in Jordan (15.0%) is also the 4th lowest in
the world. Only women in Iraq (13.0%), Syria (12.9%), and Yemen (6.2%) are participating at a
lower rate. As a result, Jordan’s female employment rate (10.9%) – defined as the number of
employed women divided by the number of working age women – was also the 5th lowest in the
world in 2018, only above that of Iraq (10.8%), West Bank and Gaza (9.5%), Syria (9.5%), and
Yemen (4.6%) (WDI).
This exceptionally low female inclusion has been remarkably non-responsive to Jordan’s
expansionary and recessionary cycles over the previous thirty years. During a period of moderate
economic growth in the 1990s, the female employment rate was stagnant, averaging 8.6%.
Subsequently, the strong economic growth registered between 2000 and 2008 was accompanied
by a female employment rate that fell over the first half of the period (from 9.7% to 8.9%
between 2000 and 2004) and rose in the second (from 8.9% to 11.3%, 2004 to 2008). Female
employment outcomes were also uncorrelated with the growth slowdown that Jordan has faced
since 2008. Unemployment among women actually declined as the economy stagnated between
2008 and 2012, before increasing again (from 20.9% to 25.6% over 2012 to 2016). This increase
in unemployment since 2012 was accompanied by a decline in participation rates (from 15.8% to
14.8%), which kept employment rates roughly constant (averaging 11% over the same period).
Jordan’s level of female labor market inclusion is low even by Arab World standards. As of
2018, out of the 20 countries with the lowest female employment rates in the world, 14 were
Arab countries, as defined by the World Bank. And yet, looking at labor market indicators for
Jordanian women in particular,1 we notice that on average they displayed much worse labor
market outcomes than their Arab counterparts: a 32% lower employment rate (11.3% vs. 16.7%,
respectively), a 30% lower participation rate (15.4% vs. 21.9%), and a 44% higher
unemployment rate (26.9% vs. 18.7%) (EUS, 2018 and WDI). This poor record, in terms of
labor market inclusion, is in stark contrast with Jordan’s much higher education outcomes – the
female gross tertiary-education enrollment rate is 45.5% against 28.8% in the rest of the Arab
World.2
1 As opposed to labor market indicators for all women in Jordan, regardless of citizenship. All World Development
Indicators presented do not differentiate by citizenship.
2 Gross enrollment rate from the World Banks’s World Development Indicators, sourced from UNESCO Institute for
Statistics, reflects the total enrollment (of females), regardless of age, divided by the population (of females) in the

5| Female Labor in Jordan: A Systematic Approach to the Exclusion Puzzle
The persistent pattern of low female labor market inclusion, in spite of a substantial
improvement in educational attainment and independent of economic swings, is puzzling and
begs a rigorous explanation. A thorough, evidence-based analysis of this puzzle is not only
essential in order to expand opportunities for women in Jordan but is also critical to promoting
growth and structural transformation of the country’s economy. That is the central purpose of
this paper: To propose a comprehensive framework to rethink the issue of low female
employment, and to systematically test alternative drivers – and their corresponding interactions
– to inform the design of public policy aimed at increasing employment opportunities and labor
market inclusion of women in Jordan.
There is a substantial body of literature documenting potential causes of female labor market
exclusion in Jordan. We think of these studies as identifying factors in a continuum, ranging
from social norms at one extreme and more policy-related factors at the other. Furthermore,
factors along the continuum tend to reinforce one another in ways that are difficult to
disentangle, so for analytical purposes it is worth considering them as separate categories of
potential explanations.
At one end, we find cultural factors regarding women’s roles in households and society that
might be constraining their professional pursuits. These social norms and expectations are
complex and can manifest in several ways: decisions made by women themselves about whether
to work; household-level decisions influenced by husbands and other family members; and
cultural beliefs held by employers that can lead to significant discrimination against women in
hiring. Among these, Peebles, et al. (2005) argue that there is considerable discrimination against
women in the private sector, as employers believe that women are relatively less committed
employees due to family duties. These findings are further suggested by a survey of 2,000 firms
in Amman carried by the World Bank (2012a), where 30% of firms reported a preference for
hiring men and 21% of them strongly agreed that mixing men and women at the workplace was
inappropriate. A more recent study by the World Bank (2018) focusing on social norms and
beliefs suggests that a binding constraint to female employment is male preferences about
women’s work, which include strong disapproval from husbands (70% of respondents) towards
women returning home after 5:00 pm, attitudes against the mixing of men and women in the
workplace, general discouragement from husbands to work, and male relatives’ occupational
preferences for the women in the family.
At the more policy-related end of the spectrum, there are studies that explore labor market
regulations that determine the professional opportunity set for women. This perspective is
agnostic to potential social norms that go into their employment decisions. Of course, the process
of defining labor market rules is inevitably mediated by social norms. Nevertheless, studying the
age group typically corresponding to tertiary education. Jordan’s figures are from 2012, before the Syrian refugee
crisis.

6| Female Labor in Jordan: A Systematic Approach to the Exclusion Puzzle
direct impacts of labor market regulations on employment outcomes is still illuminating. Among
these studies, Kalimat & Al Talafha (2011) focus on regulatory rules that create differential
treatment of men and women in the private sector. Their report explores the implications of
Article 72 of the Jordanian Labor Law, which demands that employers provide a nursery and
qualified childcare workers for workplaces with a minimum of twenty married women and ten
children under the age of four years. The authors conclude that this fixed cost, at an arbitrarily
defined threshold, incentivizes employers to discriminate against hiring women. Another
mechanism of potential employer discrimination against women that they identify is the
relatively earlier retirement age imposed on women – women have to retire by age 55, five years
earlier than men. Finally, they also highlight policies that prohibit night work (between 7:00 PM
and 6:00 AM) for women, which could limit women’s professional advancement and the set of
feasible occupations that they ultimately pursue. The negative impacts of enforcing Article 72 of
the Labor Law are also explored by Shomali (2016), who documents the strong incentives it
provides for private companies in the telecommunication sector not to hire women. Assaad,
Hendy, Lassassi & Yassin (2018) attribute the stagnant female labor participation rates in four
MENA countries – Algeria, Egypt, Jordan and Tunisia – to the inability of the private sector to
make up for the contraction in public sector employment opportunities for women.
In the middle of this culture-policy continuum, there are several studies that highlight a
combination of these factors and – at least from an argumentative standpoint – emphasize ways
in which they reinforce each other. Among these studies, Miles (2002) uses data from focus
groups in Jordan to highlight the role of cultural limitations on female mobility (transportation).
This study also emphasizes the effects of a shrinking public sector on women’s employment
opportunities, together with the persistence of substantial discrimination in the private sector.
Echoing these conclusions, a study published by the World Bank (2012b) provides evidence
suggesting that Jordanian society puts a lot of pressure on women to stay at home, particularly
after marriage; however, it also stresses that women are queuing up to work in the public sector.
On the one hand, the literature on the policy-related factors illustrates the regulatory environment
and legislative changes that have an effect on female employment and participation. They do not,
however, explain the largely flat female participation rate across time. On the other hand,
research that focuses primarily on social norms deepens the puzzle of why the culture
surrounding women’s education seems to have changed dramatically, while labor market
outcomes have not. The expansive body of research on female labor exclusion provides insights
into the many drivers of the problem but has yet to systematically test these drivers in a way that
can facilitate policy decisions that aim to improve labor market opportunities for women in
Jordan.
In order to bridge this gap, we propose an integrated framework to think about the levers of
female labor market exclusion in Jordan, and we methodically asses the explanatory power of
each potential driver. Our analysis primarily uses microdata from Jordan’s Employment and

7| Female Labor in Jordan: A Systematic Approach to the Exclusion Puzzle
Unemployment Surveys (2008-2018) and panel data from the Jordanian Labor Market Panel
Survey (2010 and 2016), while also drawing upon other international data sources, including the
American Community Survey, World Values Survey, and the World Development Indicators as
needed.
Our results depart from those reported in previous studies in a number of ways, starting with the
problem definition itself. We find that the drivers of low female employment rates in Jordan
differ greatly along the dimension of educational attainment. For women who have completed
high school or less, labor market exclusion is predominantly a phenomenon of extremely low
labor force participation. Within this segment, we identify evidence that cultural beliefs
regarding the role of women in society and public transportation are the two most important
causes of low participation. Meanwhile, labor market participation among women with a
university degree or higher is not significantly different from that of men with similar
qualifications. Within this more educated group of women, we observe that low employment
rates are driven by high rates of unemployment in comparison to men. We trace this outcome to
the central problem of a small and undiversified private sector that is unable to accommodate
women’s need for work and family balance.
In the process of evaluating alternative hypotheses for what is driving female exclusion in
Jordan, the potential causes that we reject based on the evidence are as important to understand
from a policy perspective as those that we fail to reject. Two particular cases are noteworthy.
First, we do not find evidence supporting the hypothesis that Jordanian women with high
educational attainment experience high unemployment rates due to unreasonably high wage
expectations. Second, we reject the hypothesis that low female employment rates are driven by
the presence of foreign workers in the Jordanian labor market.
The remainder of the paper is organized as follows. Section 2 presents several stylized facts on
the female labor force in Jordan and introduces our analytical framework. Section 3 is devoted to
describing our data sources and defining the empirical strategy followed in testing alternative
hypotheses. Section 4 presents our findings on the potential drivers of low participation (left-
hand side of our framework tree), while Section 5 contains our findings on the potential drivers
of unemployment (right-hand side of our framework tree). Our main conclusions, areas for future
research, and policy implications are discussed in Section 6.

8| Female Labor in Jordan: A Systematic Approach to the Exclusion Puzzle
2 Stylized Facts and Analytical Framework
Jordan occupies an interesting place in a well-documented U-shaped relationship between
women’s labor force participation and the level of income per capita (Goldin, 1995). The
relationship shows that at low levels of income per capita, women participate in the labor force at
high rates, doing mostly unpaid work on family farms. As industrialization takes hold and
incomes per capita rise, female participation falls due to a combination of an income effect and
lower demand for female labor in agriculture. Goldin (1995) notes that the movement of female
labor to industrial jobs tends to be slower than that of males because of cultural barriers and
higher sensitivity to travel costs. These effects account for the downward slope of the curve at
lower levels of income. As per capita incomes continue to rise, educational outcomes tend to
improve for women, which eventually lead to greater participation in the labor force across all
sectors of the economy – accounting for the upward slope of the curve at higher levels of
income. As shown in Figure 1, that general logic can also be extended to employment rates,
which is a more complete measure of overall labor market conditions, as it provides insights into
both unemployment and participation issues.
Figure 1: Female Employment Rate vs. Income per capita (2018)
Source: WDI
Note: Regional comparators designated in orange

9| Female Labor in Jordan: A Systematic Approach to the Exclusion Puzzle
The relationship shows that there is significant variation in employment rates across countries of
similar incomes, but that a noteworthy U-shape remains. As of 2018, Jordan’s level of GDP per
capita positions it at the low point of the U-shaped relationship, while the particular context of
Jordan places its female employment rate well below many countries at a similar level of
income. One interpretation of Jordan’s location is that the country is at a point of transitioning to
a level of higher female labor market participation and employment rates, but it is also evident
that something about the Jordanian context is pushing Jordan’s female labor inclusion to the
bottom of the cross-country distribution. For example, at the same level of per capita income,
Guatemala’s female employment rate (4 times that of Jordan’s) is more typical, while Angola’s
female employment rate is 7 times that of Jordan.
Given this relationship, we should expect to see higher rates of female labor force participation
and employment in the future – provided that economic growth continues – as their educational
attainment and employment tend to rise together. However, the magnitude of the expected
increases is far from obvious, especially with the clear divergence in these two trends over time
in Jordan. The theory encapsulated in the U-shaped curve emphasizes the importance of
disaggregating labor market indicators by education levels in order to get a better understanding
of the link between female educational attainment and employment outcomes in Jordan, and
therefore to better understand the long-term trends that are at play.
As it turns out, employment indicators in Jordan display sharp variation by levels of education.
We look first at labor force participation rates (Figure 2) and then at unemployent rates (Figure
3). Jordanian women with high school diploma or less have dismal low labor force participation
rates (4.2% and 3.5% respectively). They participate at rates that are at least 13 times less than
that of women with university degree (55.3%). Meanwhile, the participation rate for men with
similar educational attainment is 15 times higher than that of women with less than a high school
education, and more than 9 times higher than that of women who attended high school.3
There are at least two other noteworthy features in Figure 2. First, unlike the sharp differences
that we observe in female labor force participation rates across educational attainment, the
participation rate of Jordanian men is flatter across these levels. The highest participation rate
among men (those with university degrees) is roughly twice the lowest participation rate (those
who attended high school only), while for women the corresponding ratio is 20 times – a
staggering difference. Second, the gap between female and male labor force participation rates
steadily narrows as one moves up the education system in Jordan. While a male with less than a
high school education is 15 times more likely to participate than a woman with the same level of
education, there is virtually no difference in labor force participation rates between the genders at
the postgraduate level. It is clear from these patterns that low female labor force participation is
driven by extremely low participation rates among women with low levels of education.
3 Estimates based on Jordan’s 2018 Employment and Unemployment Survey, including formal and informal work.

10| Female Labor in Jordan: A Systematic Approach to the Exclusion Puzzle
Figure 2: Jordanian Labor Force Participation Rates by Gender and Education (2018)
Source: EUS, 2018
Turning to unemployment patterns, Figure 3 illustrates that whereas low female labor
participation is particularly prevalent among women with lower educational attainment,
unemployment is the defining problem faced by women at higher levels of education. Despite an
increase in participation rates of women as one moves up the educational system, the
unemployment rate initially increases (reaching over 30% for university graduates), before
falling for women with postgraduate degrees (to just over 19%). With the exception of those with
less than a high school education (a group in which extremely few women participate to begin
with), unemployment rates are significantly higher for women than men at each level of
education.
Figure 3: Unemployment Rates of Jordanians by Gender and Education Level (2018)
17.2
10.5
13.1
19.3
6.1
16.4
11.4
16.7
23.5
32.0
19.6
26.9
0
5
10
15
20
25
30
35
Less than high school High school Intermediate diploma/
Associate degree
University Graduate Degree and
Phd
Aggregate
Unemployment by education for Jordanian men and women 2018
Men Women
Sources: EUS, 2018

11| Female Labor in Jordan: A Systematic Approach to the Exclusion Puzzle
It is worth noting that a year earlier, in 2017, unemployment rates among women with lower
levels of education (all those below university) were much higher – each above 30% – and the
aggregate unemployment rate for women was also higher (33.1%, vs. 26.9% in 2018) (EUS,
2017). This should not mistakenly be interpreted as an improvement in female labor market
inclusion. The significant drop in female unemployment was almost entirely due to a drop in the
labor force participation rates of less educated women. Jordanian women with less than a high
school degree participated at a rate of 5.5% in 2017, but only at 3.5% in 2018, while women with
a high school degree saw a drop in their participation rates from 6.9% to 4.2%. This translates
into the relatively low unemployment rates we see for the first two groups in Figure 3 and the
reduction in aggregate female unemployment from 2017 to 2018. Moreover, because this came
from a change in labor force participation (fewer women looking for work) rather than from
more women finding work, the aggregate employment rate for women actually fell slightly (from
11.5% for Jordanian women in 2017 to 10.9% in 2018).
The defining problem for Jordanian women with high levels of education is unemployment:
there are insufficient jobs for those who want them. Meanwhile, the defining problem for
Jordanian women with a low level of education is that they do not participate in the labor force to
begin with – they do not look for work. This descriptive finding is critical for any analysis that
seeks to disentangle the causes of poor labor market outcomes for women in Jordan. It strongly
suggests that the constraints faced by women with low levels of education are necessarily
different from those faced by highly educated women. One implication of this descriptive pattern
is that highly educated women (with a university degree and above) make up nearly 60% of the
female labor force (i.e. those working or looking for work). Since the unemployment rate is
highest for highly educated women, it follows that highly educated women represent over 60%
of unemployed women in in Jordan.4
Table 1 summarizes these patterns by providing the estimated size of various population and
labor market segments based on the 2016 Jordan Labor Market Panel Survey. Although working
age men and women have a similar education profile, the educational profile of the female labor
force differs. This pattern carries through to the distributions of employed and unemployed
women.
4 This statistic is sometimes misinterpreted in Jordan. The observation stated in this paper is that over 60% of
unemployed women have a university degree, and not that over 60% of Jordanian women with a university degree
are unemployed (that figure was actually 32% in 2018).

12| Female Labor in Jordan: A Systematic Approach to the Exclusion Puzzle
Table 1: Labor Market Indicators by Educational Attainment in 2016
Panel A: Jordanian women
Panel B: Jordanian men
Education groupWorking age
populationLabor force Employed Unemployed
Less than high school 1,083,153 64,342 46,214 18,128
High school 618,371 95,569 66,685 28,884
University and above 347,455 192,133 124,843 67,290
Total 2,048,979 352,044 237,742 114,302
Education groupWorking age
populationLabor force Employed Unemployed
Less than high school 1,160,281 687,747 600,365 87,382
High school 514,655 310,005 284,040 25,965
University and above 328,076 251,748 218,077 32,578
Total 2,003,012 1,249,500 1,102,482 145,925
Source: JLMPS 2016
Analytical Framework
In order to systematically explore the causes behind low female labor market inclusion, and
ultimately low female employment, we apply a framework that allows us to decompose our
analysis into the two defining problems as described above: participation and unemployment.
The statistical indicators used to measure employment, unemployment and labor force
participation are linked through equation (1). On the left-hand side is the employment rate,
defined as total number women employed in the economy divided by the population of working
age women (aged 15-64). This is the product of two terms on the right-hand side of the equation.
The first term is the female labor force participation rate (defined as the number women either
working or actively looking for work as a share of the working age population). The second term
captures the share of those women who are working, expressed as 1 minus the unemployment
rate.
𝑇𝑜𝑡𝑎𝑙 𝑤𝑜𝑚𝑒𝑛 𝑒𝑚𝑝𝑙𝑜𝑦𝑒𝑑
𝑊𝑜𝑚𝑒𝑛 𝑎𝑔𝑒𝑑 15−64=
𝑊𝑜𝑚𝑒𝑛 𝑖𝑛 𝑙𝑎𝑏𝑜𝑟 𝑓𝑜𝑟𝑐𝑒
𝑊𝑜𝑚𝑒𝑛 𝑎𝑔𝑒𝑑 15−64∗ (1 −
𝑊𝑜𝑚𝑒𝑛 𝑢𝑛𝑒𝑚𝑝𝑙𝑜𝑦𝑒𝑑
𝑊𝑜𝑚𝑒𝑛 𝑖𝑛 𝑙𝑎𝑏𝑜𝑟 𝑓𝑜𝑟𝑐𝑒) (1)
This equation guides our analytical approach, which we can visualize as a diagnostic tree (Figure
4). The ultimate goal of policymakers and other actors is to increase the employment rate of
women (especially Jordanian women) in Jordan. In order to do this, actors require a theory of
change guided by an understanding of what is causing low employment. As equation (1)
captures, low employment rates can be explained by either low labor force participation rates,

13| Female Labor in Jordan: A Systematic Approach to the Exclusion Puzzle
high unemployment rates, or a combination of both. As discussed above, both of these problems
are at play in Jordan; though they apply differentially for different groups of women by
education level. Accordingly, the remainder of this working paper seeks to test the causes of
each problem separately. Guided by previous literature and interviews with businesses and
government officials, we selected a number of potential causes on each side of the diagnostic tree
to explore through rigorous hypothesis testing using a variety of empirical methods.
Figure 5: Analytical Framework
On one side of the tree, we test for three potential drivers of low labor force participation among
women with low levels of education. From this point forward, for simplicity, we will use the
language of “low-skilled” as synonymous with “low education” – though we recognize that these
terms are imperfect substitutes. We explore three distinct drivers of low participation: cultural
barriers, mobility constraints associated with transportation, and problems stemming from the
childcare market. Though these are presented as distinct categories here, there are of course
numerous interactions between these drivers. When we find such interactions, we attempt to map
out vicious cycles and break down the interactions analytically to elucidate which factors
predominate and underlie these cycles.
On the other side of the tree, we explore potential drivers of high unemployment rates, which are
more prevalent among women with high levels of education. As this side of the tree frames the
issue within the context of a market (the labor market), causal factors can be broadly separated
into supply-side issues (problems stemming from specific characteristics of Jordanian women)
and demand-side constraints (problems coming from firms). We analyze several possible
constraints to either supply or demand. We also account for the possible avenues by which
problems on this side of the tree can factor into participation decisions in the other side.

14| Female Labor in Jordan: A Systematic Approach to the Exclusion Puzzle
3 Data and Empirical Strategies
For each factor in the diagnostic tree, we conduct hypothesis testing using a variety of empirical
methods and drawing upon a number of data sources as applicable. Hypothesis testing starts with
a theory-based statement of the form, “If this factor is critical to the outcome, or ‘binding’, we
would expect to observe the following evidence that is consistent with economic theory.” We
then identify data sources that allow us to rigorously check for such evidence. If we construct
tests that are able to distinguish a signal from noise, and we fail to find such consistent evidence
as theory would predict, then we reject the hypothesis that the factor in question is critical to the
outcome. On the other hand, if we find consistent evidence, then we do not reject the hypothesis,
and proceed to compare the strength of the evidence with other potential causes.
3.1 Data
This paper primarily uses micro-level data from Jordan’s Employment and Unemployment
Surveys (EUS), covering the period 2006 to 2018, and the Jordanian Labor Market Panel Survey
(JLMPS) for 2010 and 2016. Both surveys are representative of Jordanian citizens, while the
EUS for 2017 and 2018 are also representative of the non-Jordanian population, and both utilize
standard international classifications of occupational and sector categories that are harmonized
across the years. Each survey is representative of total employment, both formal and informal.
The EUS have sample sizes consistently above 200,000 observations for all years, which
provides statistical power for a number of analytical tests, along with the most recent data for
2018. Meanwhile, the JLMPS 2016 has only 33,450 observations, but it is richer than the EUS as
it includes a finer level of geographic detail and captures a wider array of characteristics such as
commute times to work, transportation methods, and self-reported reservation wages of the
unemployed (for public and private sector jobs). Moreover, the JLMPS follows the same
individuals in 2010 and 2016, which allows for more rigorous specifications in several empirical
tests. Where relevant, we cross-check the representativeness of JLMPS with the EUS.
We supplement these datasets with others coming from Jordan’s Ministry of Education, and
benchmark Jordan on certain indicators with comparable countries using the World Bank’s
World Development Indicators (WDI), the World Bank’s Doing Business Indicators, the World
Values Survey (WVS), and the American Community Survey (ACS) for 2017 provided by the
Integrated Public Use Microdata Series (IPUMS). For international benchmarks related to
occupation-specific measures, we use U.S. Bureau of Labor Statistics data.
Table 2 summarizes descriptive statistics from the 2017 EUS and 2016 JLMPS. There a number
of noteworthy differences between men and women in addition to the labor force participation
and unemployment patterns described above. First, women are on average more educated than
men – 45% of working age Jordanian women have high school and above education, compared
to 39% of men. When we look at employment indicators, we see a large concentration of women

15| Female Labor in Jordan: A Systematic Approach to the Exclusion Puzzle
in education – 41% of employed women work in this sector, compared to only 6% of men. The
share of women working in the public sector is also higher – 46% of employed women work in
the public sector compared to 38 % of employed men. Additionally, on average women earn
8.7% less, work 12.7% fewer hours per week, and have commutes times to work that are 38.7%
shorter.
Table 2: Selected Descriptive Statistics by Gender
Men Women p-value
Number of observations (EUS) 76,782 75,468
Education
Less than high school 0.61 0.54 0.00
Vocational school 0.01 0.00 0.00
High school 0.21 0.27 0.00
University 0.16 0.17 0.00
Graduate and above 0.02 0.01 0.00
Socio-demographic characteristics
Age 33.6 34.5 0.00
Married 0.51 0.57 0.00
Labor market indicators
Participation 0.65 0.19 0.00
Unemployment 0.15 0.33 0.00
Industry of employment
Education 0.06 0.41 0.00
Human health and social work activities 0.03 0.14 0.00
Financial and insurance activities 0.02 0.03 0.00
Information and communication 0.01 0.02 0.00
Manufacturing 0.11 0.07 0.00
Sector of Employment
Public sector 0.38 0.46 0.00
Other
Salary (in JOD) 403.5 368.3 0.00
Weekly work hours 46.2 40.3 0.00
Commute time to work (in minutes) * 40.5 24.8 0.00
Reservation wage for public sector (JOD) * 328.4 297.0 0.01
Reservation wage for private sector (JOD) * 342.5 304.7 0.00
Note: All numbers are shares unless indicated otherwise. p-Values are based on t-tests on mean
equality. * Variables sourced from the JLMPS 2016 (sample size 33,450)
Source: EUS 2017, JLMPS 2016

16| Female Labor in Jordan: A Systematic Approach to the Exclusion Puzzle
3.2 Empirical Strategies
For each branch of the tree shown in Figure 5, we use varying empirical methods in order to
assess the significance of the issue in explaining low female inclusion outcomes. We employ a
variety of quantitative and qualitative methods in order to test different hypotheses depending on
data availability. Here, we summarize several econometric strategies utilized, which we detail
further in each section of the analysis. Where the data allows for the utilization of these methods,
we are able to draw the strongest conclusions.
For the left-hand side of the tree, we make extensive use of probit regression models. These
models have a binary dependent variable, taking a value of 1 to indicate participation in the labor
force (and 0 otherwise). We use this model to investigate the differential effect of various factors
on the participation of women with different educational levels. Equation (2) shows the general
specification applied, where Y is a binary variable denoting participation, X is a vector of
characteristics, and Φ is the cumulative distribution function of the standard normal distribution.
Pr(𝑌 = 1 | 𝑋) = Φ(𝛽0 + 𝛽1𝑋) (2)
In some cases, we also use a bivariate probit model to estimate the joint probability of two binary
outcomes. For example, to test the potential effect of a husband’s influence on a woman’s labor
force participation, we use a bivariate model to predict the joint probability of the two binary
outcomes of participating in the labor force and being married. Equation (3) shows the general
equation used in such cases. In the example case, 𝑌1 is a binary variable denoting participation
and 𝑌2 is a binary variable denoting being married, while X is a vector of characteristics and Φ is
the cumulative distribution function of the standard normal distribution.
Pr(𝑌1 = 1, 𝑌2 = 1 | 𝑋) = Φ(𝛽0 + 𝛽1𝑋) (3)
To enhance the robustness of the results obtained using the bivariate probit specification, we use
a logit model with individual-level fixed effects, which allows us to control for unobservable,
time-invariant, individual-specific characteristics. Since we are able to follow the same
individual from 2010 to 2016 with JLMPS data, we can control for unobservable characteristics
at the individual level that may affect participation.5 In equation (4) below, Y is again a binary
variable denoting participation in 2010 and 2016 of individual i at year t, X is a vector of
characteristics, ⋀ is the cumulative distribution function of a standard logistic variable, 𝜂𝑖 is the
sum of all unobservable time-invariant characteristics of individual i, or the fixed effect, and 𝜀𝑖𝑡
is the logistically distributed error term.
5 There are 3,318 observations in the JLMPS sample that were surveyed in both years, representing a population of
694,681 working age women.

17| Female Labor in Jordan: A Systematic Approach to the Exclusion Puzzle
Pr(𝑌𝑖𝑡 = 1 |𝑋𝑖𝑡, 𝜂𝑖 , 𝛽 ) = ⋀(𝑋𝑖𝑡′𝛽 + 𝜂𝑖 + 𝜀𝑖𝑡) (4)
For the right-hand side of the tree, we utilize two different econometric techniques: (1) a
Heckman correction model for estimating wage determinants (based on Heckman, 1979), and (2)
the Blinder-Oxaca technique (based on Jann, 2008) to decompose mean difference in wages
between Jordanian men and women. Since wages are the critical price mechanism mediating the
labor market, these techniques allow us to disentangle potential supply and demand factors on
the right-hand side of the diagnostic tree. We explain the motivation and general mechanics of
each of these techniques here in the relevant sections of the analysis.
When analyzing wage determinants in order to understand how different sectors (for instance,
public and private) reward productive characteristics of men and women in the country, one can
employ wage regressions. However, we face a challenge in using simple wage regressions
toward this end. Any estimate using data only on the employed population, which is a small
fraction of working age Jordanian women, will be biased because the population that is out of the
labor force differs along many important dimensions. In particular, women who would have low
wages are unlikely to work, and thus excluding them from the estimation would introduce an
upward bias (in estimating the returns to education, for example). To address this, we use a
Heckman correction model, which corrects for sample selection bias by also including the
population that is not working in the estimation through estimated omitted variables. In technical
terms, this methodology is a two-stage estimation as follows.
Pr(𝑌 = 1 | 𝑍) = Φ(𝑍𝛾) (5)
E(𝑤 | 𝑌 = 1) = 𝑋𝛽 + 𝜌𝜎𝑢𝜆(𝑍𝛾) (6)
Equation (5) – the selection equation – is an estimation of a probabilistic model of working,
where Z is a vector of explanatory variables and 𝛾 is a vector of unknown parameters. We use a
transformation from this equation to include in the wage equation as an additional explanatory
variable to account for the ommitted variable bias. Equation (6) – the wage equation – estimates
the corrected wage given that a person works (Y=1), were w is the natural log of wages and X is
a vector of characteristics. The last term is the transformation of the probability of working from
equation (5), where 𝜌 is the correlation between unobserved determinants of the propensity to
work and unobserved determinants of wage offers u (error terms from selection and the
regression equation), 𝜎𝑢 is the standard deviation of u, and 𝜆 is the inverse Mill’s ratio, which is
the ratio of the probability density function over the cumulative distribution function of a
distribution, calculated for 𝑍𝛾.
Additionally, we apply the Blinder-Oaxaca technique to decompose mean differences between
Jordanian men and women in wages that are based on regression models in a counterfactual
manner. The methodology divides the wage gap into an explained part, which consists of

18| Female Labor in Jordan: A Systematic Approach to the Exclusion Puzzle
differences in productive characteristics, such as education or industry of employment, and an
unexplained part, which is a residual that cannot be explained by observable characteristics. This
methodology is helpful in order to test hypotheses related to fair pay betweeen Jordanian men
and women and gain insight into the drivers of women’s private sector employment outcomes.
The methodology estimates linear wage regressions for men and women and decomposes the gap
in the following fashion:
𝑌𝑤 = 𝑋𝑤𝛽𝑤 + 𝜇𝑤 (7)
𝑌𝑚 = 𝑋𝑚𝛽𝑚 + 𝜇𝑚 (8)
Where 𝑌𝑤 is the natural log of women’s wages and 𝑌𝑚 is the natural log of men’s wages, and X is
a vector of individual characteristics. The gap 𝑌𝑚 − 𝑌𝑤 can be decomposed into three additive
effects: difference in endowments, difference in coefficients, and an interaction term:
𝑌𝑚 − 𝑌𝑤 = [𝐸(𝑋𝑚) − 𝐸(𝑋𝑤)]′𝛽𝑤 + 𝐸(𝑋𝑤)′(𝛽𝑚 − 𝛽𝑤) + [𝐸(𝑋𝑚) − 𝐸(𝑋𝑤)]′(𝛽𝑚 − 𝛽𝑤) (9)
We use a two-fold model, which is prominent in the discrimination literature. It is a pooled
model with data of both groups used as a reference model to produce some nondiscriminatory
coefficients vector 𝛽∗. A two-fold model decomposes the gap into just two parts – the explained
part, which corresponds to the first term in equation (10), and the unexplained part – the second
term in equation (10). The explained part is approximately equal to the endowment effect plus
the interaction term from equation (9), while the unexplained part approximates the difference in
coefficients.
𝑌𝑚 − 𝑌𝑤 = [𝐸(𝑋𝑚) − 𝐸(𝑋𝑤)]′𝛽∗ + [𝐸(𝑋𝑚)′(𝛽𝑚 − 𝛽∗) + 𝐸(𝑋𝑤)′(𝛽∗ − 𝛽𝑤)] (10)

19| Female Labor in Jordan: A Systematic Approach to the Exclusion Puzzle
3 Drivers of Low Female Labor Market Participation
In this section we present the results of our empirical analyses on the three potential factors
preventing Jordanian women from participating in the labor market – that is, from actively
looking for a job (left-hand side of analytical framework in Figure 5). These three hypotheses
were selected for testing after a careful review of the available literature and several rounds of
key stakeholder interviews in Jordan.
3.3 Culture
The first factor potentially constraining female labor force participation is cultural beliefs related
to gender roles in society and in the work place. If this constraint is binding, we would expect to
find consistent culturally grounded messages across international survey evidence that affect
women’s decisions to seek work. In this case, we would then expect to see women who are more
likely to be affected by those aspects of Jordanian culture – for instance, those based on region or
based in marriage – to participate less. Given that highly educated women participate in the labor
force at rates similar to men (and at rates higher than the participation rates of less educated
women), we also expect to see evidence that the effect of these cultural factors weaken among
more highly educated women. Finally, we also explore the labor market outcomes for Jordanian
women who leave the country to work elsewhere, exploiting the plausible effect of a different
labor market environment on their likelihood of working. This approach recognizes that
Jordanian women abroad retain varying degrees of cultural worldviews as they adapt and
assimilate to different cultural environments.
According to one recent survey (ILO & Gallup, 2017), Jordanian women ranked work and
family balance as their biggest challenge to labor market participation, and expectations on
women in the family and home were reflected in responses to other questions by both women
and men. In response to the question, “Do you prefer [that] women work paid jobs, care for their
families and homes, or do both?”, 31% of female respondents and 42% of male respondents
selected caring for their family and homes. The share of Jordanian women who responded this
way was comparable to the high share of such responses by women in Saudi Arabia and Lebanon
(both 30%). Similarly, Jordanian men selected this response at the same rate as men in Saudi
Arabia (42%).6 Other surveys also provide evidence that Jordanians hold highly traditional views
when it comes to gender roles. According to the World Values Survey (WVS, 2014), 57% of
surveyed Jordanians agree that children of working mothers suffer, which is the highest rate
among the 59 countries in the survey, and far above the second highest country, Qatar (44%).
6 Interpreting surveys such as these necessitates acknowledging sources of response bias. We recognize that social
desirability bias and other systematic biases in responses might over- or underestimate the true beliefs held by
survey respondents. These potential biases highlight the importance of cross-country comparisons, and that is where
Jordan stands out.

20| Female Labor in Jordan: A Systematic Approach to the Exclusion Puzzle
These attitudes seem to persist over time and are getting even stronger. In the 2000-2004 wave of
the WVS, 80% of Jordanians agreed with the statement, “When jobs are scarce, men should have
more right to a job than women.” That number jumped to 88% in the next wave (2005-09) and
further rose to 93% in the most recent data (2010-2013). The latest wave, of course, corresponds
to a time in Jordan when jobs had become increasingly scarce.
Each of these surveys report only averages, with no disaggregation of trends by educational
level. They cannot, therefore, help us disentangle why women with high educational attainment
display participation rates that are significantly higher than those of women with a high school
education or less, despite both groups facing the same set of national cultural values (Figure 2).
To explore how the probability of labor force participation changes with different levels of
educational attainment, we use marriage as a proxy for the intensity of cultural influences. In
order to explore how marriage/cultural influence, educational attainment and labor force
participation relate to one another in Jordan, we employ a bivariate probit model. This model is
used to estimate the joint probability of two binary outcomes – participating in the labor force
(yes/no) and being married (yes/no) – while controlling for age, age squared, schooling, rural
residence and governorate. We use the EUS 2017 as it has a higher number of observations than
the JLMPS (a sample of 69,124 observations) and all the necessary variables for this
specification. The full results are provided in Table 3 in the Appendix and some key findings are
highlighted in the figures that follow.
Several noteworthy findings emerge. First, at low levels of education (less than high school) –
representing the largest standalone segment of the working age population by far (61%) – there
is a 50% reduction in participation after marriage. This suggests that attitudes of the husband and
husband’s family are directly binding on the woman’s participation. But the participation rate of
single women at this level of education is still only 9% (versus 4.5% for married women), which
indicates that it is not only cultural aspects within marriage that impact women’s decision to
work. Interestingly, as the level of education increases, the drop in participation rates associated
with marriage reduces steadily to 13% at the postgraduate level.

21| Female Labor in Jordan: A Systematic Approach to the Exclusion Puzzle
Figure 6: Difference in Participation Rates Between Single and Married Women’s
Participation
49.5%46%
31%
22%
13%
0.0%
10.0%
20.0%
30.0%
40.0%
50.0%
60.0%
Less than highschool
High school Intermediatediploma/ Associate
degree
University Graduate Degreeand Phd
Difference between single and married women's participation
Source: Estimated using a bivariate probit regression model for participating in the labor market and being married
or single controlling for potential work experience, schooling, rural and governorate using the EUS (2017).
We next try to tease out cultural influences by looking at differences across governorates. If
cultural beliefs were the binding constraint to female participation, we would expect to observe
that women in less metropolitan and supposedly more traditional areas participate at a lower rate.
Here we see another surprising pattern: women in governorates that are less metropolitan have a
lower drop in their labor force participation rates after marriage than those in Amman. Jordanian
women in Al Tafela, Karak, Mafraq, Jerash and Ma’an, across all education groups, actually
have a lower drop in participation after marriage than their counterparts in Amman. This is
contrary to what we would suspect if culture was the binding constraint to participation. Figure 7
shows the fall in participation after marriage for each governorate for women with a high school
education or less, and with more than a high school education.

22| Female Labor in Jordan: A Systematic Approach to the Exclusion Puzzle
Figure 7: Drop in Participation with Marriage by Governorate
55% 54% 53% 53% 51% 51% 51% 50% 49% 48% 47%
43%
31%
37%
30% 30% 30%28%
25%23% 23%
32%
25%
18%
0%
10%
20%
30%
40%
50%
Irbid Al Zarqa Amman Ajlun Madaba Al Balqa Jerash Ma'an Al
Mafraq
Al
Aqaba
Al
Karak
Al
Tafela
High school and below Above high school
The same analysis is indicative of other causes impacting the decision to participate in the labor
force. The patterns reinforce the view that women decide to participate purely based on
economic opportunity costs. Since the median wage for a woman with a university degree is 170
JOD higher than that of a woman with less than high school education (EUS, 2017), not looking
for a job poses a higher opportunity cost for the household of a highly educated woman. This
logic extends to the family, such that married couples with a highly educated women will have
an economic incentive for the women to look for work. Consistently, the gap in participation
between married and single women who are highly educated (Figure 7) is higher in governorates
that have higher poverty rates compared to the national average (based on DOS poverty rates).
Meanwhile, in less urbanized governorates, the share of women employed in the public sector is
more than twice that in Amman (Al Tafela 73%, Ma’an 86%, Mafraq 67%, Jerash 68%, as
compared to Amman 31%) (EUS, 2017). This, along with shorter commute times to work than in
metropolitan Amman, could be playing a role in incentivizing higher participation. Both of these
factors are explored in later sections.
We also run a more rigorous test to estimate the impacts of marriage on the probability of
participating in the labor force, taking advantage of the panel structure of the JLMPS (2010-
2016). For this, we use a logit model with individual fixed effects, which controls for time-
invariant, individual-specific characteristics.7 This is a more robust specification because we are
able to follow individuals over the course of six years and determine the effect of marriage on
participation at the individual level. By doing this, we also capture unobservable characteristics
that may affect participation – such as being a career-oriented or a more family-oriented person.
Our results indicate that marriage is associated with a significant average reduction of 30% in the
7 The results are reported in Table 5 of the Appendix.

23| Female Labor in Jordan: A Systematic Approach to the Exclusion Puzzle
probability of participating in the labor force (estimated with marginal effects evaluated at the
means). That number is higher than the unadjusted average registered in the United States, which
is 10% (Bureau of Labor Statistics, 2018), but similar to the average observed in Turkey (33%)
(Dayioglu, 2010). This regression does not provide the same level of disaggregation across
education level and governorate as applied above to explore culture as a cause of low female
labor force participation, but it does verify that marriage itself significantly impacts participation
overall.
An additional way to test the influence of cultural beliefs on labor force participation is to look at
Jordanian women living and working outside of Jordan and their patterns of participation. The
best quality data that we have to explore this is data on Jordanian immigrants in the United
States. Jordanian women in the U.S. will tend to retain cultural values from Jordan, but will face
a very different economic environment, as well as a different immediate cultural environment.
Therefore, by comparing the participation rates of Jordanian women living in the U.S. with the
participation rates of women from other countries living in the U.S. (who therefore face the same
economic and cultural environment in the host country), we can partially explore the importance
of Jordanian culture. We can also compare the participation of Jordanian women in the U.S. to
that of Jordanian women at home. However, within this analysis we must acknowledge that
immigrants are highly self-selected individuals, who might differ along many dimensions
compared to people who do not emmigrate, and thus might face structurally different barriers to
labor force participation.
We compare the participation rates of women in the United States by educational attainment and
birth place in Figure 8. Jordan shows the second lowest aggregate female participation among
regional comparator nationalities, after only Saudi Arabia. Aggregate female labor force
participation among these regional comparators ranges from roughly 40%, as in the case of
Jordanian women, to around 60%, which is still 10 percentage points below the U.S. average
female labor force participation rate. With the exception of women from Saudi Arabia, women
from all of these comparator countries participate at very different rates by educational level. A
notable similarity among the regional comparators is that none of their female participation rates
for high school and less than high school educated women get close the US averages for these
groups. Jordanian women participate at fairly average rates among the group for the highest and
lowest education levels, while they participate at a slightly lower than average rate among
women with high school only.

24| Female Labor in Jordan: A Systematic Approach to the Exclusion Puzzle
Figure 8: Female Labor Force Participation in U.S. by Education Level and
Place of Birth (2017)
0%
10%
20%
30%
40%
50%
60%
70%
80%
Average US Turkey Morocco Egypt Lebanon Kuwait Syria Saudi Arabia Jordan
All women College and aboe High school Less than high school
Source: American Community Survey 2017, IPUMS
Because Jordanian immigrants in the U.S. inherently represent some degree of self-selection, it
makes little sense to compare the aggregate labor force participation rate of this group in the U.S.
to the participation rate at home in Jordan. However, making the comparison by education level
can add value. Jordanian women with less than a high school education participate at a rate of
nearly 20% in the U.S. – more than five times the rate in Jordan. High school graduates’
participation rate in the U.S. is 40% – ten times that in Jordan and twice that of similarly
educated Jordanian women in the U.S. Meanwhile, the participation rate in the U.S. for
Jordanian women with a college education and above is roughly the same as it is for college-
educated women in Jordan. This striking pattern is informative. It suggests that while Jordanian
culture (as carried by the woman) may play a role by resulting in lower than average
participation rates in the U.S. for women with less than a high school education, there are much
bigger differences in the overall U.S. environment and labor market – including its culture – that
are driving women with less education to participate much more than at home in Jordan.
Interestingly, these labor market factors do not appear to be very different in influencing highly
educated women’s decision to participate.
Across the lines of evidence, there is a mixed picture on the influence of culture on low labor
force participation of women with low levels of education in Jordan. We have uncovered strong
evidence suggesting that aspects of Jordanian culture work against female participation to a
greater degree than in other countries, including those in the Arab World. At the same time, there
is substantial evidence to assert that culture alone fails to explain the labor force participation
patterns that we observe in Jordan. Culture cannot explain the patterns that we see in
participation rates across regions of the country or when exploring marriage as a proxy for
cultural values. Therefore, albeit playing a role in understanding labor market exclusion, social
norms are definitely not the only factor at play. Also, the exact mechanisms through which

25| Female Labor in Jordan: A Systematic Approach to the Exclusion Puzzle
culture affects the decision to enter the labor force are far from clear. Therefore, policymakers
should proceed with caution when focusing on changing culture to address low female labor
participation and, more broadly, low female employment.
3.4 Transportation
Based on a literature review and stakeholder interactions, we next test transportation as a binding
constraint for female labor force participation, which is the second hypothesis we explore on the
left-hand side of the framework tree. Since the problem we are seeking to explain in this section
is why labor force participation is so low among women with low levels of education –
compared to highly educated women and to men – the problem underlying this constraint must
impact this group of women more intensively. For that, we reject any hypothesis that focuses
only on transportation infrastructure, or the “hardware” of transportation, which is constant and
applicable across all men and women and focus instead on the “software” of transportation. This
includes the availability and efficiency of public transportation and the rules and norms that
structure the provision of public transportation. In the available data, these are best represented
by variables such as the mode of transportation to work and commute times. One significant
difference between high-skilled and low-skilled female workers is their mode of transportation to
work. As shown in Figure 9, 47.0% of women with less than a high school education use public
transportation to get to work, as compared to 29.0% of women with university degrees, and 36%
of Jordanian men with less than a high school education (JLMPS, 2016) .
Figure 9: Distribution of Jordanian Women's Mode of Transportation to Work
Less than high school degree holders University degree holders
Source: Jordanian Labor Market Panel Survey (2010-2016)
26| Female Labor in Jordan: A Systematic Approach to the Exclusion Puzzle
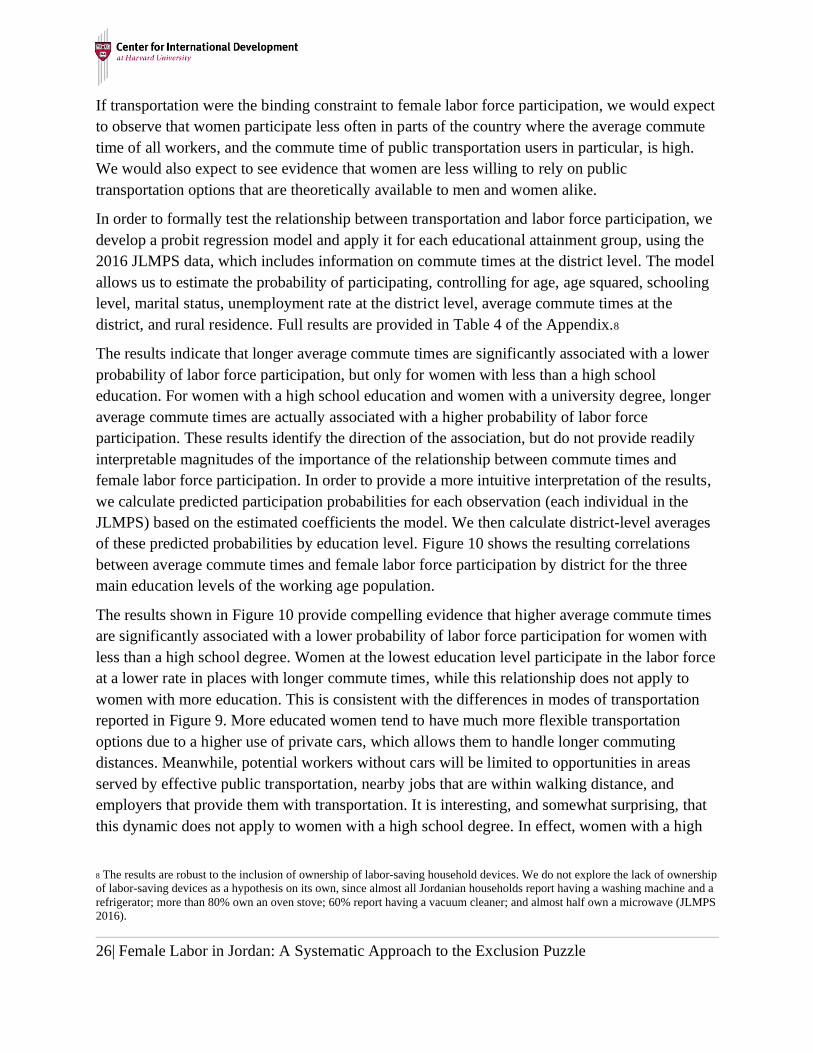
If transportation were the binding constraint to female labor force participation, we would expect
to observe that women participate less often in parts of the country where the average commute
time of all workers, and the commute time of public transportation users in particular, is high.
We would also expect to see evidence that women are less willing to rely on public
transportation options that are theoretically available to men and women alike.
In order to formally test the relationship between transportation and labor force participation, we
develop a probit regression model and apply it for each educational attainment group, using the
2016 JLMPS data, which includes information on commute times at the district level. The model
allows us to estimate the probability of participating, controlling for age, age squared, schooling
level, marital status, unemployment rate at the district level, average commute times at the
district, and rural residence. Full results are provided in Table 4 of the Appendix.8
The results indicate that longer average commute times are significantly associated with a lower
probability of labor force participation, but only for women with less than a high school
education. For women with a high school education and women with a university degree, longer
average commute times are actually associated with a higher probability of labor force
participation. These results identify the direction of the association, but do not provide readily
interpretable magnitudes of the importance of the relationship between commute times and
female labor force participation. In order to provide a more intuitive interpretation of the results,
we calculate predicted participation probabilities for each observation (each individual in the
JLMPS) based on the estimated coefficients the model. We then calculate district-level averages
of these predicted probabilities by education level. Figure 10 shows the resulting correlations
between average commute times and female labor force participation by district for the three
main education levels of the working age population.
The results shown in Figure 10 provide compelling evidence that higher average commute times
are significantly associated with a lower probability of labor force participation for women with
less than a high school degree. Women at the lowest education level participate in the labor force
at a lower rate in places with longer commute times, while this relationship does not apply to
women with more education. This is consistent with the differences in modes of transportation
reported in Figure 9. More educated women tend to have much more flexible transportation
options due to a higher use of private cars, which allows them to handle longer commuting
distances. Meanwhile, potential workers without cars will be limited to opportunities in areas
served by effective public transportation, nearby jobs that are within walking distance, and
employers that provide them with transportation. It is interesting, and somewhat surprising, that
this dynamic does not apply to women with a high school degree. In effect, women with a high
8 The results are robust to the inclusion of ownership of labor-saving household devices. We do not explore the lack of ownership
of labor-saving devices as a hypothesis on its own, since almost all Jordanian households report having a washing machine and a
refrigerator; more than 80% own an oven stove; 60% report having a vacuum cleaner; and almost half own a microwave (JLMPS
2016).

27| Female Labor in Jordan: A Systematic Approach to the Exclusion Puzzle
school education are more similar to women with a university degree than women without a high
school degree when it comes to transportation as a constraint to participation.
Figure 10: Correlation between Female Labor Force Participation
and Commute Times at the District Level
Source: Own calculations using 2016 JLMPS
It is also clear that men, on average, have longer commute times, and here it becomes useful to
differentiate between married and single workers. In both cases, men’s commute time is
significantly longer. Single men’s average commute time is 45 minutes while single women’s
average commute time is 29 minutes (a 55% difference). A plausible reason for the limited range
of commute for single women is the prevalence of safety concerns. Married men’s average
commute time is 35 minutes and married women average 21 minutes (a 67% difference).
Therefore, the opportunity set for women is significantly smaller and narrows even further in
comparison to married men. Moreover, men with less than a high school education have higher
use of a private car – 28% compared to 15% of women in this education group (JLMPS, 2016). It
is not surprising that transportation is more of a constraint for married women and women with
children, who tend to face significantly more demands on their time at home.
These observations provide simple but strong evidence that transportation – specifically the
quality of public transportation – is a binding constraint to labor force participation among
women with very low levels of education. However, the evidence suggests that transportation is
not as important a constraint for women with a high school education. The results also highlight
a critical interaction between transportation and culture, since men with low levels of education
are affected by the transportation constraint in the same way. Men do not face the same safety
concerns that women have related to harassment in public transportation, and, due to fewer
household responsibilities, can afford to have longer commuting times in public transportation.
28| Female Labor in Jordan: A Systematic Approach to the Exclusion Puzzle
Additionally, men could also be benefiting from better access to private cars and transportation
subsidies, stemming from cultural attitudes emphasizing their role as primary breadwinners.
3.5 Cost of Child Care
The lack of affordable childcare is the second biggest contributor to low participation rates in the
Arab States and North Africa (ILO, 2017) and was one of the factors most often mentioned in
interviews with stakeholders in Jordan. Therefore, we next explore evidence that may signal if
childcare costs and access are binding on female labor force participation. If they are, we expect
that the cost of childcare would be high (including both direct and indirect costs) in comparison
to the anticipated wages of women with low levels of education. We would also expect to see
limited alternative options for women who cannot afford childcare. Finally, we would expect to
see low-skilled women dropping out of the labor force when they have children.
According to the JLMPS (2016), 22.6% of Jordanian women rely on nurseries as the primary
form of caregiving; a small reduction from 26.2% in 2010 (
Figure 11). JLMPS data show a significant drop in children spending the day outside of the home
(nurseries and in school combined) and an increase in the prevalence of family members as
caregivers (mother, mother-in-law, husband and other relatives) between the two years. Nannies
represented a small share of caregivers in 2010 and an even smaller share in 2016, while other
means of childcare also increased. These changes largely coincide with the period of economic
downturn, which meant that more family members were out of work and nurseries became less
affordable. However, the significant reduction of “in school” as an answer gives us some pause,
since we are unaware of any reason why school attendence should have declined.

29| Female Labor in Jordan: A Systematic Approach to the Exclusion Puzzle
Figure 11: Primary Caregiver while at Work (2010 vs. 2016)
Source: JLMPS 2010, 2016
At first glance, the relatively small drop in the prevalence of nurseries in comparison to the large
changes in family-provided childcare over the period of economic downturn suggests that cost
considerations are not driving the change. But, given the potential for selection bias and other
possible issues with the JLMPS data, we use alternate sources to complement our analysis,
including a survey on nurseries conducted by the Queen Rania Foundation (Ghawi, 2018), the
Household Income and Expenditure Surveys, Employment and Unemployment Surveys, and
Jordan Population and Family Health Surveys (2017, 2018).
If nurseries were in short supply, we expect their reported cost relative to incomes to be high.
And if cost were underlying an apparent drop in the use of nurseries during the economic
downturn, we would expect to see their costs relative to salaries increase. We find that the
median monthly cost of childcare amounts to 16.6% of the median wage of a low-skilled
Jordanian woman (JLMPS, 2016).9 However, we note that Ministry of Education-based nurseries
– available only for children of school teachers – have an average cost that is 65% below that of
private-run nurseries, so it is important to take a closer look. According to Ghawi (2018), the
9 There was no data on childcare cost collected in 2010. However, we can see that the use of nurseries by low-skill
women did not change much over the time period. In 2016, 5.6% of women using nurseries had below high school
education, not very different from the reported 5.2% in 2010 JLMPS.

30| Female Labor in Jordan: A Systematic Approach to the Exclusion Puzzle
mean monthly cost of a private nursery is 69 JD, which is above the mean of 50 JD reported in
the JLMPS 2016. This represents 28% of the mean salary of a low-skilled Jordanian woman. For
comparison, in the United Kingdom childcare makes up approximately 33% of the wage of a
low-skilled woman (The Money Advice Service; Bank of England). Even if the ratio of the cost
of sending a child to nursery to parental income is not especially high for low-skill women, only
8.7% of working women with a high school degree and less use nurseries, compared to 25% of
working women with more than a high school education.
Another way to check for empirical evidence of the potential impacts of a lack of affordable
childcare is to estimate the fall in labor participation after the birth of the first child. If childcare-
related issues were constraining female labor force participation, we would expect to observe a
decrease in participation after childbirth. Unfortunately, we cannot calculate the marginal change
in participation after childbirth in the same way we calculated the marginal drop in participation
associated with marriage in section 3.1, as the available data sources do not report any
information related to the presence of children. An alternative method is to use a “synthetic”
birth cohort to link age groups over time and see how participation changes around the age at
first birth. A synthetic cohort tracks the labor force participation of the group over time without
requiring data on the same individuals. For example, women born in 1985 would be 17 years old
in 2002, 25 in 2010, and 32 in 2017. We track the labor force participation rate for cohorts of
women for each educational group over a span of 15 years using data from the 2002 Household
Income and Expenditure Survey and the 2006-2017 Employment and Unemployment Surveys.
The Jordan Population and Family Health Survey (2017-2018) provides data on median age of
first birth for each educational group. For all educational groups, the median age at first birth is
approximately two years later than the median age at marriage. Figure 12 shows the labor force
participation rates that we find for women with less than a high school education across the
various cohorts, while the results for other education groups are provided in the Appendix
(Figure 22).

31| Female Labor in Jordan: A Systematic Approach to the Exclusion Puzzle
Figure 12: Labor Force Participation by Birth Cohorts:
Jordanian Women with High School Education or Less
Vertical line denotes median age at first birth for this educational group.
Sources: HEIS (2002), EUS (2018), JPFHS (2017).
The results look noisy because of the short time span over which we have available data, but a
clear pattern emerges. The participation rates for cohorts of women within the two groups with
the lowest participation rates – high school and less than high school – increase until they reach
the age around first birth and then level off or decline. As the cohorts age, the participation rates
never increase significantly from the very low rate that is reached by age 22. This pattern is not
observed among women with university degrees, whose participation rates start decreasing well
in advance of the age of first birth – around mean age at marriage for the group – and stays at
around half the rate it was right after graduating from university; although still at a much higher
rate than less educated women. This suggests that childcare does have a larger effect on women
with less education participating in the labor force in comparison to women with higher levels of
education.
In total, the evidence regarding childcare costs as a constraint is inconclusive. The cost of
nurseries does not appear to be high in comparison to other countries, and family members
appear to be a dominant means of childcare relative to nurseries. However, the data sources used
to draw these conclusions are not perfect, and therefore leave some room for error. Additionally,
even if the cost of childcare is affordable, that does not necessarily imply that access is
widespread. Meanwhile, we report strong empirical evidence of an association between having

32| Female Labor in Jordan: A Systematic Approach to the Exclusion Puzzle
children and labor force participation, as birth cohorts of women with a high school education or
less experience a change in participation when they reach the age of first birth, in a way that
women with higher education do not. This pattern may not link directly to childcare, but could be
related to cultural constraints as well, given the increased burden of transportation times as
discussed in previous sections. Given the inconclusive evidence, this branch of the diagnostic
tree has ample scope for more research that can be conducted to understand this constraint
through direct data collection. A particularly promising approach would be to study childcare as
a market in order to understand if there are market failures in terms of access or quality, or
otherwise, that, if resolved, could increase the participation rate of women in the labor force.
3.6 Conclusions on Low Female Labor Force Participation
Comparing across potential explanations, we find the strongest evidence for cultural and
transportation-related causes underlying the extremely low labor force participation rates of
Jordanian women with low levels of education. We find that cultural values around women in the
workplace and responsibilities in the home are highly antithetical to female work in Jordan and
likely are the binding constraint for the participation of many women. However, we also find
clear evidence that culture does not explain the phenomenon of low female labor force
participation on its own based on regional differences in the country, where women with low
levels of education actually participate less in urban areas than in rural areas. Jordanian women
with low education levels who are living in the United States also participate at a much higher
rate. We find strong evidence that unreliable and ineffective public transportation is a
complementary constraint that binds for some women with low levels of education.
Transportation times explain some of the regional variation in women’s participation rates in
Jordan that culture does not. We find no strong evidence that childcare is a constraint underlying
low labor force participation. However, there are weaknesses in data availability that begets the
need for further study of the childcare market in Jordan.
All three of the causal factors explored – culture, transportation, and childcare – interact in
important ways. Women’s use of public transportation is influenced not only by quality,
available, and cost, but also importantly by culture. At the same time, long commute times serve
to intensify cultural constraints by reducing a working woman’s time to spend at home.
Decisions around childcare are also heavily influenced by cultural expectations and acceptability,
as well as by inefficient transportation options if childcare is an extra stop on a woman’s
commute to or from work. These interactions are difficult, if not impossible, to fully unpack in
the scope of this paper, but that does not undermine the main conclusions about these three
factors' effects on female labor force participation.

33| Female Labor in Jordan: A Systematic Approach to the Exclusion Puzzle
4 Drivers of Low Female Labor Market Participation
We turn our attention now to the right-hand side of the diagnostic tree (Figure 5) – the problem
of high unemployment. The Jordanian female unemployment rate (26.9%) is 1.6 times that of
Jordanian males (16.4%), and 4.3 times the rate registered by women at the global level (6.2%).
The 10.5 percentage points gender gap in unemployment rates in Jordan is in stark contrast to the
0.7 percentage points gap recorded worldwide (ILO, 2017). Among all regions in the world,
Arab states have the highest female unemployment (20.7% on average) and the largest gender
gap in unemployment rates (12.5 percentage points on average). Jordan fits well among these
regional averages.
Unemployment is the key dimension of exclusion from job opportunities among women with
higher education levels. The problem is not driven by low labor market participation rates, as this
group tends to participate as much as men (Figure 2). The fact that despite their high education
gains, women still face disproportionally high unemployment rates represents a major lost
opportunity for Jordan, as the country has invested a significant amount of resources and policy
effort in increasing school enrollment rates and improving the quality of education across the
board. As shown in Figure 13, tertiary enrollment rates for females have increased from around
20% in 1995 to 45% in 2012, largely remaining above the rate registered by men throughout that
period.10
Figure 13: Tertiary Enrollment Rates in Jordan
10 It should be noted that in the aftermath of the Syrian refugee crisis, the gross enrollment ratio for all females in
Jordan dropped. However, Jordanian women maintained a higher enrollment rate than men.

34| Female Labor in Jordan: A Systematic Approach to the Exclusion Puzzle
Increased enrollment has occurred in parallel to higher levels of learning-adjusted years of
schooling, a measure that combines quantity of schooling and learning outcomes (which are
consistent with higher levels of income per capita) (Figure 14).11 On this measure, women
perform relatively well for Jordan’s level of income. The increasing number of highly qualified
women that are emerging from the education system in Jordan and joining the labor force
appears to create both an opportunity and a challenge. On the one hand, it guarantees Jordan an
abundant supply of highly educated women, who can support a modernizing economy. But on
the other hand, the failure to develop corresponding job opportunities to absorb this increasing
number of highly educated women necessarily translates into outmigration of talent, as well as
into social pressures.
Figure 14: Learning-Adjusted Years of Schooling (Female, 2017)
To disentangle the drivers of high female unemployment, we recognize that this is a labor market
outcome, and we structure this side of the diagnostic tree accordingly. As with any market, we
can explore whether the low quantity (of female jobs in this case) is driven more by supply-side
11 Learning adjusted years of schooling are calculated by multiplying expected years of schooling by the ratio of the
most recent score on the TIMSS (Trends in International Mathematics and Science Study) test to a score that
corresponds to advanced attainment on the test.

35| Female Labor in Jordan: A Systematic Approach to the Exclusion Puzzle
issues (related to the women) or demand-side issues (related to employers). A key variable in the
study of a market is always price (wages).
4.1 Supply Factors
Based on the discussion above on schooling quantity and quality, we reject upfront the
possibility that the supply of female labor is somehow less qualified or less capable than male
labor. Based on data on educational outcomes, highly educated women are equally or better
qualified on the whole to highly educated men in Jordan. Additionally, since the unemployment
rate of highly educated women is higher than that of men, this implies that the pool of
unemployed female labor is likely to be more qualified than that of men. In theory, for a firm that
is hiring on the margin, the highest quality female applicant should have a stronger educational
background than the highest quality male applicant.
Recognizing that the problem is not coming from the quality of female labor supply, we explore
two other potential supply-side explanations. First, we explore whether highly educated women
are unwilling to accept jobs at the prevailing equilibrium wages. Then, we explore whether there
is a set of cultural beliefs held by women that limit the types of job offers that they are willing to
accept.
4.1.1 High Wage Expectations
We begin by testing the hypothesis of whether unrealistically high wage expectations are
preventing women from accepting jobs, and are therefore keeping unemployment rates elevated.
The 2016 JLMPS specifically asks unemployed Jordanians to report the minimum wage at which
they would consider accepting a job offer, and the question allows respondents to provide
different answers for jobs in the public versus the private sector. This data captures wage
expectations, which we will refer to as reservation wages.
The survey evidence suggests that high reservation wages are not driving female unemployment.
The self-reported median reservation wage for unemployed women was 300 JD per month in
2016, which was well below the median wage of employed Jordanian women (350 JD per
month). For reference, the median wage of employed Jordanian men was 380 JD and
unemployed men also reported a median reservation wage of 300 JD. In order to test the
hypothesis in a more rigorous way, we obtain the adjusted self-reported reservation wages for a
private sector and a public sector job using an OLS model that controls for age, age squared,
gender, the unemployment rate in the governorate, and rural residence. To estimate the wages of
the employed population, we correct for sample selection bias arising from different
characteristics between employed and economically inactive populations (using Heckman,
1979).

36| Female Labor in Jordan: A Systematic Approach to the Exclusion Puzzle
Our results – reported in Table 6 of the Appendix and summarized in Figure 15 – yield some
interesting insights. First, reservation wages for public sector jobs are consistently lower than
reservation wages for the private sector across educational attainment groups and gender, a
feature that might reflect other benefits and reputational effects that come through working in the
public sector. Second, reservation wages are below actual wages for both public and private
sector jobs in all cases, except for women with less than a high school education in the private
sector, where reservation wages are virtually equal to actual wages. Meanwhile, there are several
key differences between men and women and between the public and private sectors. Women’s
wages are much lower than men’s in the private sector across all educational levels. While we
also observe a gap in the public sector, it is smaller in magnitude. Likewise, women’s reservation
wages are lower than men’s in every case.
Figure 15: Reservation Wages of Unemployed and Wages of Employed Jordanians by
Education, Gender, and Sector
Panel A: Jordanian Women Panel B: Jordanian Men
What we are ultimately interested in for this diagnostic is the difference between reservation
wages and equilibrium wages for women at higher levels of education. For women, the
difference between reservation wages and the equilibrium wage in the public sector tends to be
very large, across education levels, whereas the difference for the private sector is very tight. For
men, the difference between reservation and equilibrium wages in the private sector is less tight,
especially so for those who are the most highly educated. Importantly, the reason behind the tight
difference for highly educated women but looser one for not men is not because women have
higher reservation wages – in fact, highly educated women’s reservation wages for private sector
work are 19% (75 JD) lower than men. The critical difference is rather that the private sector
pays women 31% less (148 JD) than it pays men. Even with this in mind, the data shows that, on
average, unemployed high school-educated and college-educated women are willing to accept

37| Female Labor in Jordan: A Systematic Approach to the Exclusion Puzzle
the current wages that are being paid by the private sector. However, taking the whole
distribution into account (See Figure 23 in the Technical Appendix), we see that there are more
highly educated women whose reservation wage falls below the equilibrium wage than is the
case for men.
Therefore, the unemployment problem cannot be explained by high reservation wages of women.
That is, it is not the case that women have unrealistically high wage expectations while looking
for a job. There is a part of the problem that can be traced to the narrow difference between
reservation wages and equilibrium wages in the private sector for highly educated women. But
the problem is not that women demand too much for a private sector job, rather that the private
sector pays too little. This pattern is further explored when we turn to demand-side explanations.
4.1.2 Cultural Beliefs
Another potential explanation for high female unemployment could spur from cultural beliefs
held by women regarding the types of jobs that are appropriate for them. Note that we attempt to
make a distinction here between the type of beliefs that would prevent women from participating
in the labor market (in section 3.3), and those that would prevent them from accepting job offers
(discussed here), and those that would result in discrimination by employers (in Section 5.2.1).
However, we recognize these distinctions are hard to disentangle, and that, in reality, all of these
factors belong to a wider set of beliefs regarding the role of women in Jordanian society.
If socio-cultural beliefs around gender roles were the binding constraint to women’s
employment, we would observe highly restricted employment options for women that comply
with or facilitate these role expectations. As evidence of such, we would expect to see women’s
employment cluster in just a few sectors; we would expect these sectors to exhibit features that
agree with cultural expectations; and we would expect to find evidence that a large share of
women do not seek jobs in sectors outside of this narrow group.
We find clear evidence indicating that highly educated women tend to work in just a few sectors,
and that these sectors tend to have a set of socially acceptable characteristics. As shown in Figure
16, education, health, and public administration together represent 74% of employment for
Jordanian women with a university degree. As women gain further education, we would expect
their employment options to become more diversified. This is not the case in Jordan, where the
concentration of female employment in the three sectors increases even further to 81% as they
get a graduate degree. This is an extraordinary concentration, since these three sectors represent
just 30% of overall employment in Jordan. One would expect that the high level of schooling and
skills attained by Jordanian women would open a more diverse set of occupations for them in the
labor force, but this has clearly not been the case. When looking at occupations, we find that
45% of employed Jordanian women with a university degree work as teachers. The share of
female employment in education is unusually high compared to the region. In 2017, only 23% of

38| Female Labor in Jordan: A Systematic Approach to the Exclusion Puzzle
women in Arab States were employed in education, which was itself the highest share among all
regions in the world (ILO, 2017).
Figure 16: Highly-Educated Jordanian Women’s Employment by Industry
Women with a University Degree Women with a Graduate Degree
Source: EUS, 2017
The high degree of concentration must reflect either the high desirability of these jobs or the lack
of alternative career paths for women (or a combination of both). To test the extent to which
government jobs in Jordan are more desirable, we estimated the public sector premium – how
much more a public sector job offers compared to a similar one in the private sector – and
compared that with international benchmarks (Becerra, 2017). We used an OLS model
controlling for gender, years of schooling, potential work experience, occupation, industry,
urban/rural, governorate, and a public sector dummy indicating employment in the public sector.
Our results show that Jordanian women working in the public sector earn 33% more than
observationally equivalent Jordanian women in the private sector (Figure 24, Table 7). This
premium is four times lower for men, but is significantly above international benchmarks for
both genders (Figure 24) (Becerra, 2017). It is therefore clear that working in the public sector in
Jordan is indeed more attractive for both genders, but especially so for women. It is also
noteworthy that the gender wage gap in the public sector is just 2.1%, whereas it is 17.5% in the
private sector.12 This corresponds to the pattern observed previously in Figure 15 as well, where
the private sector pays men much more than it pays women.
12 The results are directionally robust to year of the data, and the trend is also consistent using other data sources. The adjusted
gender wage gap in the public sector using JLMPS 2016 is 4.6% for the public sector and 23.4% for the private sector.

39| Female Labor in Jordan: A Systematic Approach to the Exclusion Puzzle
In addition to better wages, the concentration of female employment in these sectors is also
consistent with other job-related factors that may be appealing to women, especially the working
hours, job locations, and transportation options. Qualitative evidence suggests that the Ministry
of Education, for example, offers nurseries for the children of teachers at a heavily subsidized
rate and transportation to its workers.
It is empirically clear that highly educated women are drawn to the public sector, education, and
healthcare jobs because these sectors offer better wages, but it seems reasonable to infer that
these jobs also have become the socio-cultural norm, in part because they are more attuned with
cultural beliefs. The work environment is fully adapted to women and working hours tend to
match the expectations put on women at home. Therefore, we cannot rule out the possibility that
gendered cultural beliefs contribute to the concentration of employment in these three areas of
the economy. Unfortunately, we are not aware of any evidence that would allow us to study
whether high-skilled women are applying to jobs outside of these sectors and if this is changing
over time.
Regardless of the degree to which gendered cultural beliefs cause the concentration of their
employment in just a few sectors, it is clear that jobs in these three sectors cannot possibly keep
pace with the increasing number of women coming out of the tertiary education system in
Jordan. The female labor force with a university education is projected to increase by 43% in
five years (2017 to 2022),13 while the annual growth rate required for the traditional sectors to
provide employment for these new labor force entrants is almost 6% – three times higher than
their historical growth rate. Within a context of fiscal consolidation, this is very unlikely.
4.2 Demand Factors
We now turn to potential demand-side explanations for high unemployment of more educated
Jordanian women. The supply-side evidence is suggestive that cultural beliefs matter towards
this outcome, but the evidence is inconclusive in explaining how much of the concentration of
female employment is the result of culture, and whether workers or firms are the key mechanism
or agents for cultural influences to manifest in the labor market. The supply-side discussion also
introduces important observations on wages, the price mechanism in the labor market. This
section expands the evidence on wages.
In a market, the equilibrium quantity can be low either because of low supply or low demand. In
a market where quantities are low because of low supply, one would expect prices to be high.
Where quantities are low because of low demand, one would expect prices to be low – which is
the case in the market for highly educated female labor in Jordan, where private sector wages are
low. This suggests that the main drivers of the outcome are demand-side factors. We explore two
13 Based on projections, holding university enrollment rates and participations rates by educational attainment
constant.

40| Female Labor in Jordan: A Systematic Approach to the Exclusion Puzzle
distinct hypotheses behind low demand for highly skilled female labor: (1) private sector
discrimination against women (or cultural beliefs that are carried by the private sector), or (2)
foreign labor filling available jobs and having a substitution effect.
4.2.1 Discrimination
If unfair treatment by the private sector were driving high female unemployment, we would
observe high wage differences between observationally equivalent men and women. We would
also expect to see direct evidence of discriminatory treatment in workplaces. In the previous
section we have already shown a significant difference in Jordan in the wages that the private
sector paid to men and those paid to women, and also that this difference is much smaller in the
public sector.
In order to pin down what is driving the gender wage gap in the private sector, we apply the
Blinder-Oaxaca technique described in Section 3.2. We use data from the 2017 EUS to
decompose mean differences between Jordanian men and women’s wages in the private sector,
controlling for occupation, industry, age, education, marital status, governorate, number of
weekly work hours, and work experience. Our results, as reported in Table 8 of the Appendix
and summarized in Figure 17, provide many interesting insights on the dynamics of female
employment in the Jordanian private sector.
Figure 17: Blinder-Oaxaca Decomposition of the Gender Gap in Private Sector Wages
Once we account for all measurable sources of the difference, the unexplained part of the gap
(21%) becomes larger than the actual gap (17.5%). This surprising outcome implies that, on the
whole, observable features of the female labor force suggest that they should be paid more than

41| Female Labor in Jordan: A Systematic Approach to the Exclusion Puzzle
men. Specifically, women in the labor force have higher educational attainment than men and
work in occupations that tend to pay higher wages overall. Based on just their better education,
women should be making 9.4% more than men. Based on just the occupations they work in,
women should be making 10.1% more than men. Jordanian women are well represented in
higher-paying occupations, such as professionals (60% of female employment vs. 18% of male
employment) and managers (1.6% vs. 0.2%).14 Yet, women are paid significantly less than men.
The part of the gender gap that can be explained traces mostly to sectors in which men and
women work. If one only considers sectors of employment, holding all else constant, women
should be earning 6.6% less than men. This is primarily driven by women’s over-representation
in the education sector, which makes up 33.2% of women’s private sector employment,
compared to only 3.4% of men. Because men are better represented than women in relatively
high-paying sectors, such as financial services, mining, and IT services, this explains some of the
gender pay gap. The difference in marital status associates with 2.9 percentage points of the
wage gap. According to the 2017 EUS, 39% of the women employed in the private sector are
married, as compared to 61% of men. That is in sharp contrast to the public sector, where 75% of
women working there are married, compared to 64% of men. Along with that, age and work
experience also explain some of the wage gap: 1.2 and 2.8 percentage points, respectively. The
female workforce is younger and only 32% of women working in the private sector have more
than 5 years of experience, compared to almost half of men (EUS, 2018). Finally, another 2.7
percentage points of the gap can be explained by the number of working hours. Women in the
private sector report working 5.4 fewer hours per week than men (41.1 vs. 46.4), a number
somewhat higher than the 3.8 fewer hours per week registered in the public sector (37.2 for
women vs. 41.0 for men).
The most remarkable feature of Figure 17 is that once we account for all observable factors we
end up with an unexplained gap (21%) that is larger than the actual gap (17.5%). This implies
that the biggest causes of the gender wage gap in the private sector are non-observable factors,
including discrimination against women. Our results are aligned with previous studies that have
used similar techniques to analyze the wage gap and used the unexplained component as a proxy
for discrimination (Weichselbaumer & Winter-Ebmer, 2003). They are also consistent with the
conclusions of the 2019 edition of the World Bank Report on Women, Business and the Law,
which reports that women in Jordan do not have equal rights to men when it comes to starting a
job, and emphasizes Jordan’s lack of progress on this front since 2009. Several labor policies in
Jordan actively discriminate against women, including restrictions on women working at night.
14 The concentration in professional work is unusual, compared to global averages. According to the ILO, 9.5% of
women in emerging countries and 19.7% of women in developed countries worked as professionals (ILO, 2017).
The share of Jordanian women working as managers is close to the emerging country average, where 2.4% of
women worked as managers. However, the share of Jordanian men working as managers (0.2%) lags behind the
emerging country average of 5% (ILO, 2017).

42| Female Labor in Jordan: A Systematic Approach to the Exclusion Puzzle
While the introduction of such policies may have been justified on the grounds of protecting
women, they ended up restricting women’s labor market opportunities. According to the World
Bank Doing Business Indicators, Jordan is among only 16% of countries that do not allow
women the same rights to work during the night as men.
4.2.2 Competition from Foreign Labor
The other potential cause of low demand for Jordanian women by the private sector that is worth
testing is competition from foreign workers. If the impact of foreign workers (male and female)
on the labor market were effectively crowding out opportunities for female Jordanians and
driving up their unemployment, we would expect to see competition between Jordanians and
non-Jordanians for similar jobs and the non-Jordanian workers accepting lower wages.
On first glance, this appears not to be an issue, as Jordanian women and foreign workers have
self-segmented into very different types of jobs (Figure 18): 71% of foreign women workers are
engaged in household activities, and 50% of foreign men work in construction, wholesale and
household activities, while 68% of all Jordanian women work in health, education or public
administration. There is little overlap in the areas where Jordanian women and non-Jordanians
work. The largest overlap is in manufacturing, which is a small segment of overall employment
among each group. From this segmentation, it is evident that foreign workers are not directly
responsible for the high unemployment of highly educated Jordanian women through a
substitutionary effect.
Figure 18: Employment of Jordanian and Non-Jordanians by Sector
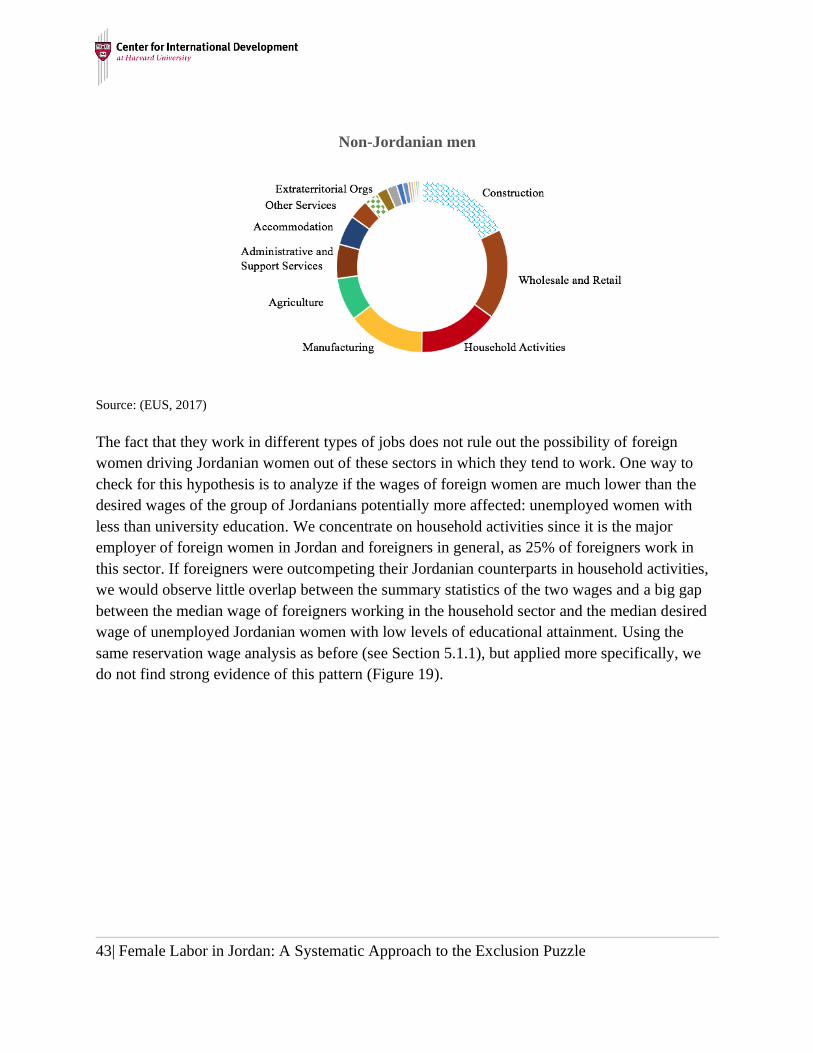
43| Female Labor in Jordan: A Systematic Approach to the Exclusion Puzzle
Non-Jordanian men
Source: (EUS, 2017)
The fact that they work in different types of jobs does not rule out the possibility of foreign
women driving Jordanian women out of these sectors in which they tend to work. One way to
check for this hypothesis is to analyze if the wages of foreign women are much lower than the
desired wages of the group of Jordanians potentially more affected: unemployed women with
less than university education. We concentrate on household activities since it is the major
employer of foreign women in Jordan and foreigners in general, as 25% of foreigners work in
this sector. If foreigners were outcompeting their Jordanian counterparts in household activities,
we would observe little overlap between the summary statistics of the two wages and a big gap
between the median wage of foreigners working in the household sector and the median desired
wage of unemployed Jordanian women with low levels of educational attainment. Using the
same reservation wage analysis as before (see Section 5.1.1), but applied more specifically, we
do not find strong evidence of this pattern (Figure 19).

44| Female Labor in Jordan: A Systematic Approach to the Exclusion Puzzle
Figure 19: Summary Statistics of Wages of Foreign Workers Employed by Households
and Reservation Wages of Unemployed Jordanian Women with High School or Less (2016)
Lower boundary of box denotes first quartile, and upper boundary denotes 3rd quartile. The vertical line going
through the box is the median. Whiskers represent adjacent values, and dots represent outliers.
Sources: JLMPS, 2016; EUS, 2017
While it is true that the median wage of a foreign domestic helper is around 10 JD lower than the
median expected wage of an unemployed, more than 50% of low-skilled Jordanian women can
meet their wage expectations by working in that sector, as represented by the overlap of the 25th
to 75th percentiles of the two groups and some of the adjacent values. Thus, a large number of
low-skilled Jordanian women would be able to meet their wage expectations by taking a job in
the household sector. In fact, many Jordanians do work in the sector: Jordanian women have
tended to fill 6%-10% of household work jobs over the years 2010-14 (Figure 20). In 2017, we
do observe a significant fall in the Jordanian share to 2.9%, but this comes in a year when non-
Jordanian jobs in the sector also fell, suggesting a cause other than an increase in foreign
competition. Overall, even in the sector where we would expect to see the most competition from
non-Jordanian workers, we do not see strong evidence that Jordanian women are not working in
the sector because of competition.

45| Female Labor in Jordan: A Systematic Approach to the Exclusion Puzzle
Figure 20: Jordanian and Non-Jordanian Women Employed by Households
Source: Manar (2017)
5 Conclusions and Policy Implications
In this paper, we have systematically explored the problem of female exclusion from the labor
market in Jordan. Our aim was to leverage existing research and perform rigorous analysis using
new data resources, through a comprehensive framework, to deconstruct the problem and
identify the binding constraints underlying this puzzling outcome. Our hope is that this research
serves to update the theories of change for policymakers and other stakeholders, who seek to
improve work opportunities for women in Jordan, and to enhance the coordination and
effectiveness of various government and non-government efforts.
Researching Jordan’s very low female employment rate yields a narrative that reflects the depth
of female exclusion from the labor market. By 2018, the number of women employed in Jordan
as a share of the total working-age population was the fifth lowest in the world (10.9%).
Women’s employment ratios have improved only marginally over time, despite significant
improvements in their educational outcomes. Our first descriptive finding is that this low
employment rate is actually the result of two distinct problems that impact different segments of
the Jordanian female population. Jordanian women with low levels of education (high school and
lower) participate in the labor force at extraordinarily low rates compared to men. Meanwhile,
Jordanian women with high levels of education (university and above) participate at rates similar
to men, but face much higher unemployment.
44,769 43,282 43,620
41,377
48,111 49,004 46,677
44,073
3,911 4,657 5,212
2,594 3,257
5,677 5,242
1,302
0.0%
2.0%
4.0%
6.0%
8.0%
10.0%
12.0%
-
10,000
20,000
30,000
40,000
50,000
60,000
2010 2011 2012 2013 2014 2015 2016 2017
Jordanian and non-Jordanian women working in households
Non-Jordanian Jordanian % Jordanian

46| Female Labor in Jordan: A Systematic Approach to the Exclusion Puzzle
For women with low levels of schooling, we find strong evidence that cultural values constrain
female labor market participation, but we also report significant evidence suggesting that social
norms alone do not explain the entire problem. Survey evidence identifies important pathways of
cultural influences on the low participation rate and on reasons for women dropping out of the
labor force, notably after marriage. However, geographical patterns of participation are
inconsistent with cultural explanations of the problem. By observing labor market participation
rates of Jordanian women in the United States, we likewise see that culture can only explain part
of the problem. As an upper bound, their participation rates suggest that women at low levels of
education could participate at rates 5-10 times higher than they currently are, while holding
culture largely constant. We also find strong evidence that poor quality and availability of
transportation constrains female labor force participation, but only for those with low levels of
education (less than high school). This segment of the population – which still represents around
half of working-age women – is most negatively impacted by their reliance on poor quality
public transportation and long commuting times, as they likely can’t afford safer, faster, and
more private modes of transport. These two factors – culture and transportation – mutually
reinforce each other, and together represent the most important causes of low labor force
participation among Jordanian women with low levels of education.
We do not find strong signals that the availability and cost of childcare is a binding constraint to
female labor force participation. However, limited data availability and quality reduce the variety
and strength of tests that can be applied to identify nuanced ways that childcare issues may affect
participation. Therefore, we recommend further study of the childcare market in Jordan. A
market study of childcare in Jordan would be a particularly promising approach to take, as it
could identify both latent opportunities for the private sector to increase the supply of childcare
services and any market failures that the GOJ could address to improve the market for high-
quality childcare services.
For women with high levels of education, we explored whether high rates of unemployment
were caused more by issues on the supply side (having to do with the female labor force) or on
the demand side (having to with employment opportunities). On the whole, we find that the
supply-side is healthy while the demand-side is significantly skewed. The resulting mismatch
between a growing pool of highly educated women and an undiversified private sector that
discriminates against women results in a pattern of highly educated women queuing for jobs in a
narrow set of sectors (health, education and the broader public sector) or emigrating for work.
These few sectors cannot possibly expand fast enough to match the rate at which highly educated
women are entering the labor force.
We find that unemployment for highly educated women is not driven by a skill differential
between women and men – women actually appear to be more skilled and more trainable based
on observable indicators, including occupations and education levels. Nor is the problem the
result of women demanding unreasonably high wages – the reservation wages of women are

47| Female Labor in Jordan: A Systematic Approach to the Exclusion Puzzle
actually well below those of men and, on average, below the wages actually paid to women with
high levels of education. We also find no evidence that the presence of low-skilled foreign
workers contributes meaningfully to high unemployment rates for women at any education level.
However, we find significant evidence of gender discrimination in the private sector, including
This discrimination problem is partially cultural and is driven more by the culture of the private
sector in Jordan than the cultural demands of potential female employees. discrimination also
reflects the limited diversification and complexity of the private sector in Jordan, such that the
management and hiring practices lag far behind what would be expected in an average middle-
income country.
These conclusions have implications for all stakeholders – including both government and non-
government actors – who are working towards increasing labor market inclusion and expanding
opportunities for women in Jordan.
Since female labor market exclusion in Jordan is the result of two separate problems, facing two
different segments of the female population, distinct and targeted policy responses are needed to
address each problem appropriately. The conclusions above imply that not all types of policy
responses can be expected to have a positive impact. In fact, several existing policies actually
serve to worsen the female labor market exclusion problem. Low-skill women are placed in a
competitive disadvantage by policies that target transportation subsidies to men, while all women
are negatively impacted by policies that restrict their working rights (including their ability to
work at night) but not those of men. Any policies that add to the costs of hiring a woman over a
man, including requirements that employers provide childcare at an arbitrarily chosen threshold
of female employees and children, also serve to worsen discrimination. As a rule of thumb to
avoid exacerbating the problem, policies aimed to provide worker protections should not be
applied differentially to men versus women.
Besides doing no harm, there are numerous opportunities for policy and non-policy-based
initiatives to address the underlying causes of low female labor force participation and high
female unemployment. Looking forward, there are strong reasons to be optimistic, as Jordan has
a large pool of human capital in its female population that, if included in economic activity,
could help to catalyze stronger and more sustainable economic growth.
To address low female labor force participation among less educated women:
• Jordan must continue to expand educational opportunities for women. This will
continue to result in a long-term shift of the composition of Jordan’s working age
population towards higher levels of education, and therefore higher likelihoods of
participation. However, the long-term benefits will do little to address the participation
challenge of women with low education levels today. Policymakers and other
stakeholders may be able to increase participation rates through targeted educational and

48| Female Labor in Jordan: A Systematic Approach to the Exclusion Puzzle
training programs for older women, which would not only introduce relevant skills but
also address cultural expectations.
• Public campaigns to address household norms could work if designed well. There
may be scope for government and non-government actions to address the cultural causes
behind low female labor market participation, but attempts should be approached
carefully, as culture is notoriously difficult to change. Public campaigns that de-
normalize the assumption that women belong in the home and that men should be
breadwinners may deliver results, but such campaigns should clearly be led by
Jordanians. Outsiders should not overestimate their abilities to understand and change
Jordanian culture.
• Improve and enforce laws that protect the safety of workers. Rather than resorting to
laws that restrict women’s ability to participate in some jobs and work the same hours as
men, the government should enforce existing laws on workplace safety overall, and might
consider introducing new laws that are standard in most developed countries, such as
laws on sexual harassment in the workplace.
• Improve the reliability, safety and overall quality of public transportation. Recent
initiatives meant to improve the reliability of public transportation through regulating the
performance of private operators and integrating modern technologies are a positive step.
Simply by getting buses to run on time, we would expect many problems with public
transportation to reduce, as this would increase ridership and change the incentive
structures of providers. This would mostly benefit women with low levels of education.
These can be complemented with increased efforts towards ensuring safety on public
transportation and a supporting public campaign to let people know that the conditions of
public transportation have improved.
To address high female unemployment, especially among more highly educated women:
• Jordan should promote gender-equitable employment in the private sector akin to
its previous push within the public sector. The country was actually able to achieve a
transition towards greater female inclusion in the public sector. There was a clear push
towards gender-conscious public employment that can be traced to the mid-1970s
through mid-1980s that was responsible for the relatively inclusive public sector hiring
practices that this paper has highlighted. Though the government does not have control
over private hiring practices in the same way, some efforts that were successful in this
push may also work today. At minimum, the government of Jordan needs to make
increasing gender-equity in the private sector an explicit priority. This goes hand-in-hand
with the removal of discriminatory laws and the enforcement and/or introduction of new
laws that directly protect safety in the workplace.

49| Female Labor in Jordan: A Systematic Approach to the Exclusion Puzzle
o Interviews with firms suggest that the removal of restrictions on working at night
would have consequences in the employment profile of numerous sectors. This
includes the business services sector, which often requires night shifts in order to
serve international clients.
o More equitable benefits for men and women will also work to incentivize gender-
equity. One important policy area is parental leave. Jordan can regulate paternity
leave as well as maternity leave, by mandating that firms provide the option for
extended unpaid parental leave for both parents.
o Positive reinforcement through sharing success stories of firms that are thriving in
Jordan because they hire women may also be a powerful tool. It was clear from
interviews with firms that the software development firms in particular have
benefited greatly from talented female labor in Jordan. Foreign firms that have
located offices in Jordan tend to be good examples because they introduce a modern
workplace culture that the domestic private sector tends to lack.
o The push can also be targeted to sectors of the economy that are expanding. The
tourism industry stands out as a sector that is growing and could grow much faster
in the future. As it expands, it should be a source of new jobs for women.
• Address the binding constraints to knowledge-intensive tradable sectors. Jordan has
an unrealized comparative advantage to expand knowledge-intensive tradable services,
especially through attracting foreign direct investment (Hausmann, et al., 2019). Figure
21 highlights several sectors in particular – including finance and insurance, information
and communications technologies, professional, scientific and technical services, and
arts, entertainment and recreation – that have a proven track record of employing
Jordanian women, but which nevertheless remain small. These sectors also tend to pay
higher than average wages and generate exports. Policies that support the growth of these
sectors will therefore work to expand and diversify employment opportunities for women
and reduce female unemployment. The most important constraints to the growth of these
sectors are the following (Hausmann, et al., 2019):
o Reforming immigration policy to attract complementary high-skill foreign labor:
Currently, high-skill foreign workers are restricted from a number of professions
across these sectors. Though this policy decision was made in hopes of protecting
high-skill jobs for Jordanians, it has had the opposite effect of dramatically
constraining the growth of these sectors and in turn reducing jobs for high-skilled
Jordanians.
o Active and targeted investment promotion to attract and facilitate investment by
strategic multinational companies: Jordan cannot afford to wait for international

50| Female Labor in Jordan: A Systematic Approach to the Exclusion Puzzle
firms to stumble upon the country’s comparative advantages in human capital and
opportunities to serve the region and the Arabic-speaking world. Fully resourcing
and modernizing investment promotion efforts to identify companies and attract
them to Jordan is a low-cost and critical step to capturing these opportunities.
Figure 21: Skill-Intensive Sectors that Employ Relatively More Women in Jordan
In addition to these policy implications, a market study of childcare services in Jordan can
identify further opportunities and constraints. Such a study may enhance the potential for the
expansion of private childcare services, which would directly expand job opportunities,
including for less education women, while increasing the availability of childcare options for all
women in Jordan.
Finally, the conclusions of this research underscore the importance of coordination across many
stakeholder groups – including government, NGOs, bilateral donors, multilateral institutions –
that all seek to improve labor market inclusion and outcomes for women in Jordan. This research
shows that there are numerous issues to address and that progress will require leveraging the
combined capabilities of different groups. Equally important, the research conclusions show that
not all efforts undertaken by stakeholders are consistent with an evidence-based theory of

51| Female Labor in Jordan: A Systematic Approach to the Exclusion Puzzle
change. The identification of different problems affecting different segments of the female
population, and the conclusions regarding which constraints are binding and which are not,
should allow all stakeholders to re-evaluate their own theories of change. Toward the goal of
achieving more coordination and collaboration, we propose that a government body such as the
Ministry of Planning and International Cooperation maintain a centralized information system of
projects that aim to improve labor market conditions for women in Jordan. Using this
information system, they could structure more interaction opportunities across projects, at the
levels of both donors and implementers. This would allow for more effective learning and
targeting of activities, as well as the full integration of lessons from this research into practice.

52| Female Labor in Jordan: A Systematic Approach to the Exclusion Puzzle
6 References
(n.d.). Retrieved from The Money Advice Service:
https://www.moneyadviceservice.org.uk/en/articles/childcare-costs
Assaad, R. H. (2014). Gender and the Jordanian Labor Market. The Jordanian Labour Market in
the New Millennium (pp. 105–143). Oxford, UK: Oxford University Press.
Assaad, R., Hendy, R., Lassassi, M., & Yassin, S. (2018). Explaining the MENA Paradox:
Rising Educational Attainment, Yet Stagnant Female Labor Force Participation. IZA.
Bank of England. (n.d.). Retrieved from https://www.bankofengland.co.uk/-
/media/boe/files/quarterly-bulletin/2016/wages-productivity-and-the-changing-
composition-of-the-uk-
workforce.pdf?la=en&hash=58CAD8A8B872D3225A667281C6104E24469BB124
Bank, W. (2018). Hashemite Kingdom of Jordan – Understanding How Gender Norms in MNA
Impact Female Employment Outcomes (English). Retrieved from
http://documents.worldbank.org/curated/en/859411541448063088/Hashemite-Kingdom-
of-Jorda
Becerra, P. G. (2017). Public Sector Earning Premiums in Developing Countries . Bonn,
Germany: IZA Workshop: Labor and Development.
Bureau of Labor Statistics. (2018). Retrieved from https://www.bls.gov/cps/cpsaat11.htm
Childcare Aware of America. (2018). The US and the High Cost of Child Care.
Dayioglu, M. K. (2010). Women's Labor Force Participation in Turkey: Factors and Trends.
Retrieved August 7, 2019, from

53| Female Labor in Jordan: A Systematic Approach to the Exclusion Puzzle
http://documents.worldbank.org/curated/en/403561468311115746/pdf/754670NWP0Box
300Participation0Women.pdf
Fogli, A., & Fernandez, R. (2009). Culture: An Empirical Investigation of Beliefs, Work, and
Fertility (Vol. 1). American Economic Journal.
Ghawi, e. a. (2018). Nurseries in Jordan: Findings from the Queen Rania Foundation National
Early Childhood Development Survey (Vol.
https://www.qrf.org/sites/default/files/QRF%20Nurseries%20Report%202015_0.pdf).
Goldin, C. (1995). The U-shaped female labor force function in economic development and
economic history (Vol. in Schultz TP investment in women's human capital and
economic development). Chicago: University of Chicago Press.
Goldin, C. (2014). A Grand Gender Convergence: Its Last Chapter. American Economic Review,
1091-1119.
Hausmann, R., Santos, M., O'Brien, T., Grisanti, A. K., Taniparti, N., Tapia, J., & and Villasmil,
R. (2019). Jordan: The elements of a growth strategy. Harvard CID Faculty Working
Paper Series No. 346.
Heckman, J. (1979). Sample selection bias as a specification error. Econometrica, 47, pp. 153-
61.
ILO. (2017). World Employment and Social Outlook: Trends for Women 2017. Retrieved May
15, 2019, from https://www.ilo.org/global/research/global-reports/weso/trends-for-
women2018/WCMS_619577/lang--en/index.htm
Jann, B. (2008). A Stata Implementation of the Blinder-Oaxaca Decomposition. ETH Zurich
Sociology Working Paper No. 5. May, 2008.

54| Female Labor in Jordan: A Systematic Approach to the Exclusion Puzzle
Kalimat, H., & Al Talafha, H. (2011). Obstacles hindering women's labor force participation in
Jordan: A report from Al-Manar project. Amman: National Center for Human Resource
Development.
Miles, R. (2002). Employment and unemployment in Jordan: The importance of the gender
system (Vol. 30). World Development.
Peebles, D., Darwazeh, N., Ghosheh, H., & Sabbagh, A. (2005). Factors affecting women's
participation in the private sector in Jordan. Amman: National Center for Human
Resource Development.
Salem, R. (2012). Trends and differentials in Jordanian marriage behavior: Marriage timing,
spousal characteristics, household structure and matrimonial expenditures. ERF working
paper No 668.
Shomali, Y. (2016). Value of daycare services at the workplace: A case study on the
telecommunication sector in Jordan. (unpublished manuscript).
Spierings, S. V. (2008). Arab women’s employment in a globalized world. A multilevel analysis
of changing participation rates and shifting influences in Egypt and Jordan .
The Al-Manar Project. (2017). Retrieved from
http://www.almanar.jo/en/documents/MOL_Foreigner_2010-2015_En.pdf Bureau of
Labor Statistics. (2018). Retrieved from https://www.bls.gov/cps/cpsaat11.htm Jordan -
Employment and Unemployment Survey, EUS 2017 Jorda
Weichselbaumer, D., & Winter-Ebmer, R. ,. (2003). A meta-analysis of the international gender
wage gap. Department of Economics (Linz-Auhof, Johannes Kepler University).

55| Female Labor in Jordan: A Systematic Approach to the Exclusion Puzzle
World Bank. (2012a). Policies for high and sustained growth for job creation: Hashemite
Kingdom of Jordan Development Policy Review. Washington DC: The World Bank
Group.
World Bank. (2012b). Soft skills or hard cash: What works for female employment in Jordan?
Washington DC: The World Bank Group.
World Bank. (2018). Understanding how gender norms in Middle East and North Africa impact
female employment outcomes. Washington DC: The World Bank Group.
World Bank Group . (2019). Women, Business and the Law 2019 : A Decade of Reform.
Washington, DC.
7 Data Sources
Bureau of Labor Statistics. (2018). Employed persons by detailed occupation, sex, race, and
Hispanic or Latino ethnicity. Retrieved August 8, 2019, from
https://www.bls.gov/cps/cpsaat11.htm
ILO, Gallup. (2017). Towards a better future for women at work: Voices of men and women.
Retrieved from https://www.ilo.org/wcmsp5/groups/public/---dgreports/---dcomm/---
publ/documents/publication/wcms_546256.pdf
Inglehart, R., C. Haerpfer, A. Moreno, C. Welzel, K. Kizilova, J. Diez-Medrano, M. Lagos, P.
Norris, E. Ponarin & B. Puranen et al. (2014). World Values Survey: Round Six.
Retrieved from www.worldvaluessurvey.org/WVSDocumentationWV6.jsp
IPUMS USA. (n.d.). Retrieved from www.ipums.org

56| Female Labor in Jordan: A Systematic Approach to the Exclusion Puzzle
Jordan: Growth & Opportunity. The London Initiative 2019. (2019). Retrieved from
https://assets.publishing.service.gov.uk/government/uploads/system/uploads/attachment_
data/file/775933/18167_BrochureDesign_v7b.pdf
Jordan Population and Family Health Survey. (2017, 2018). Department of Statistics (DOS),
The Hashemite Kingdom of Jordan.
Jordan—Employment and Unemployment Survey [Data set]. (2017). [Data set]. Department of
Statistics (DOS), The Hashemite Kingdom of Jordan.
Jordan—Employment and Unemployment Survey [Data set]. (2018). [Data set]. Department of
Statistics (DOS), The Hashemite Kingdom of Jordan.
Jordan—Employment and Unemployment Survey, EUS 2010 OAMDI, 2015. Harmonized Labor
Force Surveys (HLFS), Version 1.0 of Licensed Data Files; (2010). Retrieved from
http://erf.org.eg/data-portal/
Jordan—Employment and Unemployment Survey, OAMDI, 2015. Harmonized Labor Force
Surveys (HLFS), Version 1.0 of Licensed Data Files. (2008). Retrieved from
http://erf.org.eg/data-portal/.
Jordan—Employment and Unemployment Survey, OAMDI, 2015. Harmonized Labor Force
Surveys (HLFS), Version 1.0 of Licensed Data Files. (2012). Retrieved from
http://erf.org.eg/data-portal/
Jordan—Employment and Unemployment Survey. OAMDI, 2016. Harmonized Labor Force
Surveys (HLFS), Version 1.0 of Licensed Data Files [Data set]. (2014). [Data set].
Retrieved from http://erf.org.eg/data-portal/

57| Female Labor in Jordan: A Systematic Approach to the Exclusion Puzzle
Jordan—Employment and Unemployment Survey, OAMDI, 2017. Harmonized Labor Force
Surveys (HLFS), Version 1.0 of Licensed Data Files. (2006). Retrieved from
http://erf.org.eg/data-portal/
Jordan—Employment and Unemployment Survey, OAMDI, 2017. Harmonized Labor Force
Surveys (HLFS), Version 1.0 of Licensed Data Files [Data set]. (2016). [Data set].
Retrieved from http://erf.org.eg/data-portal/
Jordan—Household Expenditure and Income Survey, OAMDI, 2014. Harmonized Household
Income and Expenditure Surveys (HHIES), Version 2.0 of Licensed Data Files. (2002).
Retrieved from http://erf.org.eg/data-portal/
Jordan—Labor Market Panel Survey, OAMDI, 2018. Labor Market Panel Surveys, Version 3.4
of Licensed Data Files. (2010). Retrieved from http://erf.org.eg/data-portal/
Jordan—Labor Market Panel Survey, 2016 [Data set]. (2016). [Data set]. Retrieved from
http://erf.org.eg/data-portal/
Manar, A. (2017). National Center for Human Resources Development. 15.
Poverty, DOS. (n.d.). Retrieved from http://dosweb.dos.gov.jo/population/poverty/
US Census Bureau. (2017). Personal Income: PINC-03. Retrieved August 8, 2019, from
https://www.census.gov/data/tables/time-series/demo/income-poverty/cps-pinc/pinc-
03.html
World Development Indicators. (n.d.). The World Bank.

58| Female Labor in Jordan: A Systematic Approach to the Exclusion Puzzle
8 Technical Appendices
Table 3: Bivariate Probit Model Results
(1) (2) (3) (4) (5) (6)
VARIABLES lfs=1 married=1 athrho lfs=0 married=1 athrho
schooling 0.252*** 0.0666*** -0.252*** 0.0666***
(0.00265) (0.00202) (0.00265) (0.00202)
potential_workexp -0.00318*** 0.0570*** 0.00318*** 0.0570***
(0.000562) (0.000487) (0.000562) (0.000487)
Amman -0.0581 -0.314*** 0.0581 -0.314***
(0.0530) (0.0449) (0.0530) (0.0449)
Al Balqa 0.187*** -0.312*** -0.187*** -0.312***
(0.0584) (0.0499) (0.0584) (0.0499)
Al Zarqa -0.161*** -0.167*** 0.161*** -0.167***
(0.0558) (0.0466) (0.0558) (0.0466)
Madaba 0.126* -0.248*** -0.126* -0.248***
(0.0677) (0.0586) (0.0677) (0.0586)
Irbid -0.0404 -0.143*** 0.0404 -0.143***
(0.0542) (0.0457) (0.0542) (0.0457)
Al Mafraq 0.251*** -0.0744 -0.251*** -0.0744
(0.0615) (0.0525) (0.0615) (0.0525)
Jerash 0.290*** -0.108* -0.290*** -0.108*
(0.0658) (0.0576) (0.0658) (0.0576)
Ajlun 0.0639 -0.193*** -0.0639 -0.193***
(0.0674) (0.0581) (0.0674) (0.0581)
Al Karak 0.259*** -0.303*** -0.259*** -0.303***
(0.0605) (0.0527) (0.0605) (0.0527)
Al Tafela 0.596*** -0.132* -0.596*** -0.132*
(0.0739) (0.0677) (0.0739) (0.0677)
Ma'an 0.420*** -0.219*** -0.420*** -0.219***
(0.0713) (0.0620) (0.0713) (0.0620)
Al Aqaba - - - -
rural 0.0650*** 0.0763*** -0.0650*** 0.0763***
(0.0238) (0.0209) (0.0238) (0.0209)
Constant -4.038*** -1.244*** -0.208*** 4.038*** -1.244*** 0.208***
(0.0633) (0.0511) (0.00931) (0.0633) (0.0511) (0.00931)
Observations 70,918 70,918 70,918 70,918 70,918 70,918
Standard errors in parentheses Standard errors in parentheses
*** p<0.01, ** p<0.05, * p<0.1 *** p<0.01, ** p<0.05, * p<0.1

59| Female Labor in Jordan: A Systematic Approach to the Exclusion Puzzle
(7) (8) (9) (10) (11) (12)
VARIABLES lfs=1 married=0 athrho lfs=0 married=0 athrho
schooling 0.253*** -0.0541*** -0.253*** -0.0541***
(0.00265) (0.00229) (0.00265) (0.00229)
potential_workexp -0.00385***-0.0907*** 0.00385***-0.0907***
(0.000567) (0.000672) (0.000567) (0.000672)
Amman -0.0596 0.349*** 0.0596 0.349***
(0.0530) (0.0499) (0.0530) (0.0499)
Al Balqa 0.186*** 0.358*** -0.186*** 0.358***
(0.0584) (0.0555) (0.0584) (0.0555)
Al Zarqa -0.164*** 0.159*** 0.164*** 0.159***
(0.0558) (0.0519) (0.0558) (0.0519)
Madaba 0.126* 0.286*** -0.126* 0.286***
(0.0677) (0.0653) (0.0677) (0.0653)
Irbid -0.0438 0.162*** 0.0438 0.162***
(0.0541) (0.0508) (0.0541) (0.0508)
Al Mafraq 0.251*** 0.0769 -0.251*** 0.0769
(0.0615) (0.0581) (0.0615) (0.0581)
Jerash 0.287*** 0.123* -0.287*** 0.123*
(0.0658) (0.0638) (0.0658) (0.0638)
Ajlun 0.0619 0.204*** -0.0619 0.204***
(0.0674) (0.0643) (0.0674) (0.0643)
Al Karak 0.257*** 0.352*** -0.257*** 0.352***
(0.0605) (0.0582) (0.0605) (0.0582)
Al Tafela 0.594*** 0.161** -0.594*** 0.161**
(0.0739) (0.0746) (0.0739) (0.0746)
Ma'an 0.417*** 0.194*** -0.417*** 0.194***
(0.0712) (0.0686) (0.0712) (0.0686)
Al Aqaba - - - -
rural 0.0668*** -0.0356 -0.0668*** -0.0356
(0.0238) (0.0230) (0.0238) (0.0230)
Constant -4.044*** 1.270*** 0.241*** 4.044*** 1.270*** -0.241***
(0.0633) (0.0568) (0.00988) (0.0633) (0.0568) (0.00988)
Observations 70,918 70,918 70,918 70,918 70,918 70,918
Standard errors in parentheses Standard errors in parentheses
*** p<0.01, ** p<0.05, * p<0.1 *** p<0.01, ** p<0.05, * p<0.1

60| Female Labor in Jordan: A Systematic Approach to the Exclusion Puzzle
Table 4: Probit Model Results
Depvar: in labor
force Coeff. SE z P>|z| Coeff. SE z P>|z| Coeff. SE z P>|z|
Independent
variables
age 0.22 0.00 179.80 0.00 0.22 0.22 0.33 0.00 195.84 0.00 0.33 0.33 0.30 0.00 157.42 0.00 0.30 0.31
age^2 (0.00) 0.00 (165.70) 0.00 (0.00) (0.00) (0.00) 0.00 (187.24) 0.00 (0.00) (0.00) (0.00) 0.00 (157.84) 0.00 (0.00) (0.00)
log of average
commute time at
district level in
minutes (0.14) 0.01 (15.69) 0.00 (0.16) (0.12) 0.29 0.01 31.42 0.00 0.27 0.31 0.15 0.01 16.05 0.00 0.13 0.17
log of
unemployment rate
at district level 0.24 0.01 34.77 0.00 0.22 0.25 0.45 0.01 56.36 0.00 0.44 0.47 0.25 0.01 34.03 0.00 0.23 0.26
Illiterate (0.29) 0.01 (34.84) 0.00 (0.30) (0.27)
Read & Write (0.26) 0.01 (50.08) 0.00 (0.27) (0.25)
Rural (0.05) 0.01 (6.92) 0.00 (0.06) (0.04) (0.39) 0.01 (47.34) 0.00 (0.40) (0.37) (0.04) 0.01 (5.94) 0.00 (0.06) (0.03)
Single 0.75 0.02 46.31 0.00 0.72 0.78 0.06 0.02 4.03 0.00 0.03 0.09 1.62 0.03 56.41 0.00 1.56 1.67
Married (0.11) 0.02 (6.74) 0.00 (0.14) (0.07) (0.71) 0.01 (47.85) 0.00 (0.74) (0.69) 0.91 0.03 32.60 0.00 0.86 0.97
Divorced/Separated 1.00 0.02 55.70 0.00 0.96 1.04 0.08 0.02 4.11 0.00 0.04 0.12 1.51 0.04 42.41 0.00 1.44 1.58
Amman (0.21) 0.02 (14.27) 0.00 (0.24) (0.18) (0.73) 0.01 (51.89) 0.00 (0.76) (0.71) (0.06) 0.02 (2.86) 0.00 (0.10) (0.02)
Al Balqa 0.13 0.02 7.74 0.00 0.10 0.16 (0.81) 0.02 (49.06) 0.00 (0.85) (0.78) 0.04 0.02 1.71 0.09 (0.01) 0.08
Al Zarqa (0.18) 0.02 (10.95) 0.00 (0.21) (0.15) (1.17) 0.02 (74.14) 0.00 (1.20) (1.14) (0.24) 0.02 (10.56) 0.00 (0.28) (0.19)
Madaba (0.44) 0.03 (16.05) 0.00 (0.50) (0.39) (0.95) 0.02 (43.26) 0.00 (0.99) (0.90) (0.27) 0.02 (11.00) 0.00 (0.31) (0.22)
Irbid (0.05) 0.02 (3.23) 0.00 (0.08) (0.02) (0.83) 0.02 (55.33) 0.00 (0.86) (0.80) 0.30 0.02 13.59 0.00 0.26 0.34
Al Mafraq 0.11 0.02 5.81 0.00 0.07 0.15 (0.82) 0.02 (39.43) 0.00 (0.86) (0.77) 0.37 0.03 14.20 0.00 0.32 0.42
Jerash 0.03 0.02 1.37 0.17 (0.01) 0.06 (0.83) 0.02 (39.10) 0.00 (0.87) (0.79) 0.30 0.03 11.60 0.00 0.25 0.35
Aljun (0.16) 0.02 (6.76) 0.00 (0.20) (0.11) (0.14) 0.02 (6.57) 0.00 (0.18) (0.10) 0.41 0.03 15.39 0.00 0.36 0.47
Al Karak 0.38 0.02 23.46 0.00 0.35 0.41 (0.34) 0.02 (20.03) 0.00 (0.37) (0.31) 0.23 0.02 10.14 0.00 0.19 0.28
Al Tafiela 0.23 0.02 11.02 0.00 0.19 0.27 (0.63) 0.02 (29.04) 0.00 (0.68) (0.59) 0.37 0.03 12.93 0.00 0.32 0.43
Ma'an 0.15 0.02 8.63 0.00 0.12 0.19 (0.30) 0.02 (14.07) 0.00 (0.34) (0.26) 0.52 0.03 19.15 0.00 0.47 0.57
Al Aqaba 0 (omitted) 0 (omitted) 0 (omitted)
Cons (4.43) 0.04 (121.25) 0.00 (4.50) (4.36) (5.59) 0.04 (135.17) 0.00 (5.67) (5.51) (6.35) 0.06 (114.30) 0.00 (6.46) (6.25)
N 1,247,366 616,329 346,794
Jordanian women with university education and above
95% CI
Probit Model for Labor Force Participation
95% CI
Jordanian women with less than high school education Jordanian women with high school education
95% CI

61| Female Labor in Jordan: A Systematic Approach to the Exclusion Puzzle
Table 5: Logit model with individual fixed effects

62| Female Labor in Jordan: A Systematic Approach to the Exclusion Puzzle
Table 6: Reservation wages of unemployed and actual wages of the employed
Amount (in JOD) Amount (in JOD)
Private sector reservation wage 291.0 290.7 291.2 239.7 239.3 240.1
Wages of private sector employees 306.8 306.5 307.0 239.7 238.9 240.4
Public sector reservation wage 286.4 286.2 286.7 237.1 236.7 237.4
Wages of public sector employees 362.6 362.4 362.9 304.2 303.2 305.2
Private sector reservation wage 359.4 358.9 360.0 283.0 282.6 283.3
Wages of private sector employees 373.6 373.2 374.1 289.3 288.6 290.0
Public sector reservation wage 343.7 343.3 344.2 275.0 274.7 275.3
Wages of public sector employees 415.6 415.3 416.0 374.0 373.2 374.8
Private sector reservation wage 390.5 390.0 390.9 315.0 314.8 315.2
Wages of private sector employees 478.1 477.5 478.7 330.4 329.6 331.2
Public sector reservation wage 373.1 372.7 373.5 303.8 303.6 304.0
Wages of public sector employees 504.3 503.8 504.8 406.1 405.7 406.6
HS diploma
College or more
Wage typeEducational attainment
95% confidence interval
Jordanian men Jordanian women
95% confidence interval
Less than HS
Table 7: OLS Regression Results for Public Premium
Jordanian men Jordanian women
VARIABLES lnsalary lnsalary
Public Sector 0.0745*** 0.331***
(0.0136) (0.0143)
Potential Work Experience 0.00976*** 0.0105***
(0.000294) (0.000727)
Schooling (years) 0.0446*** 0.0728***
(0.00148) (0.00449)
Rural -0.0150*** -0.00736
(0.00513) (0.0103)
Constant 5.120*** 4.637***
(0.0250) (0.0941)
Occupation fixed effects yes yes
Industry fixed effects yes yes
Governorate fixed effects yes yes
Observations 34,412 8,839
R-squared 0.292 0.362
Robust standard errors in parentheses
*** p<0.01, ** p<0.05, * p<0.1

63| Female Labor in Jordan: A Systematic Approach to the Exclusion Puzzle
Table 8: Blinder-Oaxaca decomposition of gender wage gap in the private sector
(1) (2) (3)
VARIABLES overall explained unexplained
Industry 1.0660*** 1.0506***
(0.0068) (0.0198)
Occupation 0.8991*** 1.0179
(0.0081) (0.0364)
Education 0.9062*** 1.0014
(0.0071) (0.0118)
Work experience 1.0275*** 0.9711***
(0.0025) (0.0086)
Marital status 1.0286*** 0.9864
(0.0029) (0.0809)
Governorate 0.9974 0.9618***
(0.0019) (0.0121)
Weekly work hours (log) 1.0269*** 0.7001*
(0.0027) (0.1347)
age 1.0127*** 0.97404
(0.0016) (0.04418)
Men 329.19***
(1.6718)
Women 280.24***
(2.8858)
Difference 1.17***
(0.0134)
Explained 0.95***
(0.0088)
Unexplained 1.23***
(0.0144)
Constant 1.8332***
(0.3890)
Observations 27,926 27,926 27,926
Robust standard errors in parentheses
*** p<0.01, ** p<0.05, * p<0.1

64| Female Labor in Jordan: A Systematic Approach to the Exclusion Puzzle
Figure 22: Participation by cohort for university degree educated women
Figure 23: Reservation wages and wages of the employed (university educated Jordanians,
for private sector)

65| Female Labor in Jordan: A Systematic Approach to the Exclusion Puzzle
Figure 24: Public sector wage premiums
A: Jordan B: International Benchmark (Becerra 2017)